
Abstract
Amid rising concerns over the urban-rural divide, taxation equity, revenue generation, and local tax leakage, several states are contemplating measures to support jurisdictions perceived as bearing the brunt of evolving economic landscapes. In 2015, North Carolina introduced a system for local sales tax revenue sharing, wherein each county contributed to a pool of local sales tax revenue, subsequently redistributed among 79 of the 100 counties. This policy aimed to address tax leakage by ensuring that half of the base local sales tax remained at the point of sale, with the other half distributed on a per capita basis. In this analysis, we evaluate the policy’s effectiveness in achieving this equilibrium and identify limitations and shortcomings.
Introduction
Local sales taxes (LSTs) are a crucial source of revenue for local governments, second only to property taxes (PEW 2021; Tax Policy Center 2022). In 1977, general sales taxes accounted for 7% of total tax revenues for local governments, generating around $5.4 billion nationwide. By 1993, this proportion had risen to 10% and $24 billion. During the period between 2015 and 2020, which is most relevant to our analysis, general sales taxes represented 8% of all own revenue sources and 13% of all tax revenues for local governments, with collections of $82 billion in 2015 and $103 billion in 2020 (Brunori 2020; U.S. Census 2023). Despite their importance, LSTs are only permitted in 38 states, with varying eligibility and discretionary authority granted to local jurisdictions. 1
There are many reasons for the growth in popularity of LSTs. First, LSTs provide local governments with a mechanism to increase revenues and provide additional services to citizens (Luna 2004; Luna, Bruce, and Hawkins 2007; Rork 2003; Sjoquist, Walker, and Wallace 2005). Second, LSTs are frequently designed to provide property tax relief (Afonso 2013, 2014; Sjoquist, Walker, and Wallace 2005; Sjoquist et al. 2007). Third, LSTs are less visible and more accepted by the public relative to the property tax (Brunori 2020; Kincaid and Cole 2001; McGuire and Papke 2012; Self and Oldendick 2007). Fourth, LSTs allow local governments to diversify their tax bases, which is believed to enhance the variability and reliability of revenue sources by overcoming limits placed on property taxes and reliance on transfers from higher level governments (Afonso 2014; Brunori 2020; Carroll 2009; Luna, Bruce, and Hawkins 2007; Sjoquist and Stoycheva 2012). Finally, LSTs enable local governments to transfer tax burden onto non-residents (Afonso 2016; Artz and Stone 2003; Burge and Piper 2012; Zhao and Hou 2008).
The final reason for the growth in popularity and reliance on LSTs is the focus of this analysis. More specifically, we are interested in state policies aimed at addressing sales tax exportation and leakage. Tax exportation occurs when the incidence of a tax levied by one jurisdiction is shifted toward citizens in another jurisdiction (Burge and Piper 2012). Conversely, losing tax dollars to other jurisdictions is often referred to as tax leakage (Burge and Piper 2012; Burge and Rogers 2011; Rogers 2004; Zhao and Hou 2008). Both phenomena, which are inherently interconnected, have been found to create inequities in sales tax revenues between retail-rich and retail-poor communities, as measured by total dollars collected and LST revenues per capita (Burge and Piper 2012; Burge and Rogers 2011; Lewis Young Robertson and Burningham Inc. 2011; Lozano-Rojas and Lofton 2023; Rogers 2004; Zhao and Hou 2008). Despite these findings, only a few states have addressed tax exportation and tax leakage, with North Carolina being one of them.
In fiscal year 2017, North Carolina implemented a policy that pooled a portion of county LST revenues at the state level and subsequently redistributed these funds back to counties, intending to reduce perceived tax leakage in sales tax between urban and rural communities. Senate Majority Leader Harry Brown was the most outspoken advocate of these reforms and pointed to the two North Carolinas where one is rich and one is poor and stated “Reforming our state’s sales tax system will help ensure that all North Carolina counties benefit from tax dollars their own citizens pay [emphasis added] so they have the local resources necessary to strengthen public education, attract new jobs and contribute to our state’s economy” (as quoted in Fitzsimon 2015). The effectiveness of this policy has not been evaluated yet, and the existing literature concerning the gap between urban and rural tax capacity yields mixed and inconclusive findings (Afonso 2016). For example, DeBoer (2020) examined homestead exemptions, property assessments, and income taxes in Indiana, arguing that state-level policies that focus on the collection of local taxes results in greater tax effort in urban counties than in rural counties. In contrast, Phiel (2022) found that Washington state’s transition from origin-based to destination-based collection of sales taxes helped rural counties combat tax leakage arising from the growth of online shopping.
This study begins by explaining the conceptual relationship between tax leakage and LST collection. Then we provide a more detailed description of LSTs in North Carolina. Building on this description, we explain the policy that created a state redistribution pool, including its emergence, goals, and how the revenues populate and are distributed. The next section analyzes the impact of the redistribution pool on sales tax revenue, with specific focus on rural and urban counties, as lawmakers intended to reduce perceived inequities in sales tax bases between these two types of counties. We further compare the empirical changes under the policy to the intended distribution formulated by the state legislature. The last part of the study concludes our findings and recommends changes to the current redistribution policy.
To our knowledge, we are the first to evaluate a policy designed to address intergovernmental inequities arising from LSTs. Our descriptive analysis of North Carolina’s redistribution policy finds a decline in revenue disparity between counties following its implementation in FY2017. Overall, the redistribution is progressive with respect to counties’ own LST revenue per capita and generates relatively large gains for many LST-poor counties. However, we find that the policy did not fully meet its intended redistribution target and a somewhat weak relationship between net revenues and urban-rural designations.
Tax Leakage and Local Sales Taxes
When it comes to LST revenues, there are jurisdictions that import sales tax dollars and jurisdictions that export sales tax dollars. Those jurisdictions that export sales tax dollars experience tax leakage (Afonso 2016; Artz and Stone 2003). A classic example of LST tax leakage is when consumers cross the border of their jurisdiction to a neighboring jurisdiction to do their shopping and to spend their money. Consumers are especially likely to do this when the neighboring jurisdiction has retail agglomerations and consumers do not have to drive too far (Burge and Rogers 2011). It is presumed that urban areas are net importers of LST dollars and rural areas are exporters and there is evidence to support this (Afonso 2016; Burge and Piper 2012; Burge and Rogers 2011; Cornia et al. 2010; Zhao and Hou 2008). In other words, it is not uncommon that residents of rural areas go to urban areas to do their shopping which means that those consumers are contributing to the urban or retail rich communities sales tax coffers rather than their own communities’.
While cross border shopping is a common example of sales tax exportation and leakage, there are other examples as well. For example, if the jurisdiction has a robust tourism sector, they are likely to have more non-residents making purchases and contributing to their LST base or if there are a large number of in-commuters (Afonso 2016; Afonso and Moulton 2024; Rohlin and Thompson 2018). While tax leakage is not inherently an urban-rural issue, it is clear that in many examples of which counties import LSTs and which counties export LSTs, that very often urban counties are importers and rural counties are exporters. 2 Afonso (2016) considers LST revenue raising capacity and clusters them by urban, suburban, rural, and non-urban tourism rich. She finds that a 1% local sales tax is able to generate almost $90 per capita in the average urban and suburban county, just over $100 in a non-urban tourism rich county, and just over $64 in a rural county. While the full difference between the revenue raising capacity in these four types of counties is not solely due to tax leakage (there are other factors such as income of the residents), it does demonstrate the dramatic difference between the jurisdictions. 3 These estimates are even more startling when considered in total dollars rather than per capita measures, where urban counties’ LST base is five times larger than non-tourism rich rural counties. Given these stark differences, it is perhaps not surprising that some states, like North Carolina, are considering policies to support jurisdictions that experience tax leakage.
North Carolina Local Sales Tax Structure
This section begins by describing the collection of LSTs in North Carolina and then explores the state’s initiative to address the perceived inequities arising from this revenue source.
Local Sales Taxes in North Carolina
The state of North Carolina levies a sales tax rate of 4.75%, however counties may levy additional LSTs. The state collects both the state and LSTs, deducts an administrative cost to cover the cost of collection and distribution, and then distributes the revenues to the 100 counties based on somewhat complicated formulas. 4 The LST instruments are authorized in articles within Chapter 105 of the General Statutes and are referred to by the authorizing article within the state. There are five different articles available to county governments in North Carolina: Articles 39, 40, 42, 43, and 46. See Table 1. Currently all 100 counties levy Articles 39, 40, and 42 for a combined rate of 2%.
Local Sales Taxes Currently Authorized in North Carolina.
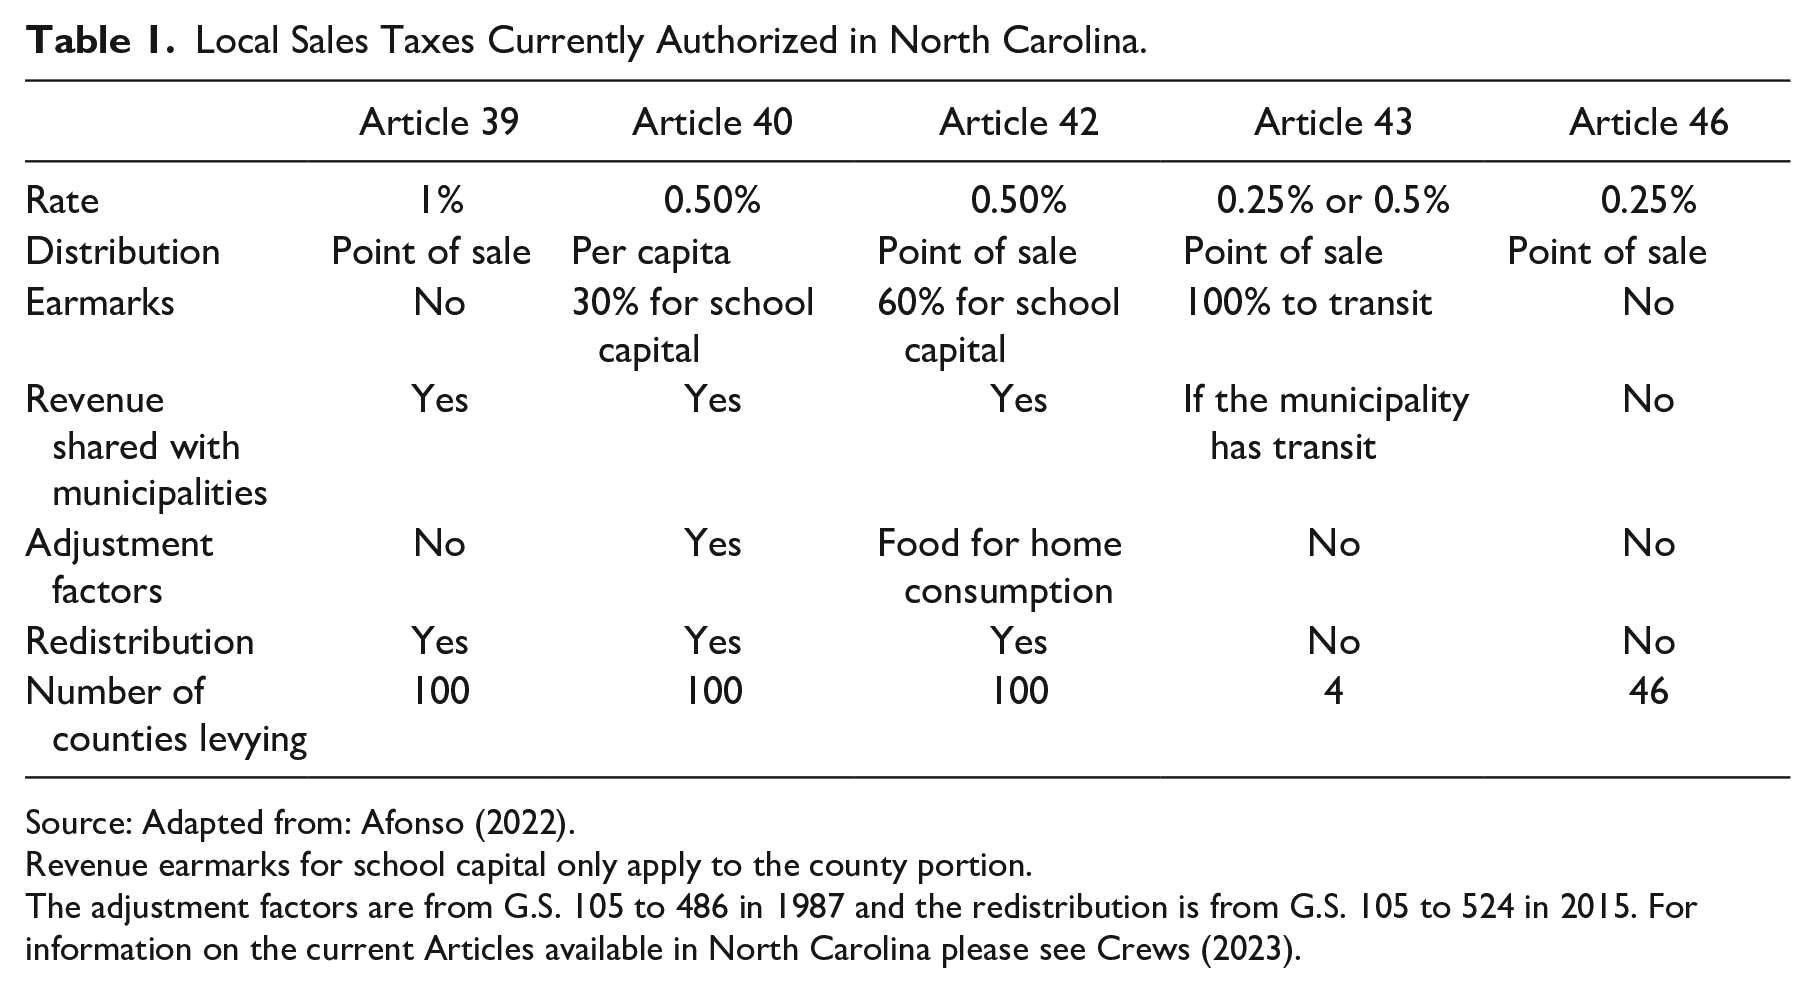
Source: Adapted from: Afonso (2022).
Revenue earmarks for school capital only apply to the county portion.
The adjustment factors are from G.S. 105 to 486 in 1987 and the redistribution is from G.S. 105 to 524 in 2015. For information on the current Articles available in North Carolina please see Crews (2023).
Article 39, the first LST levied in North Carolina, became effective in 1971 and has a rate of 1%. It is distributed on a point-of-sale basis. 5 Article 39 was followed by Articles 40 and 42, which were enacted in response to a state reduction in funding for primary and secondary education capital funding in the counties. As such, they are partially earmarked for capital spending on education. They each have a rate of 0.5% and are unusual on two fronts: they were originally distributed to counties on a weighted per-capita basis, not point-of-sale, and they were both partially earmarked. Article 42 switched from per capita to point-of-sale distribution on October 1, 2008. Thirty percent of the revenue generated by Article 40 must be used on capital for education, and 60% of Article 42 is earmarked for the same purpose. Articles 39, 40, and 42 all share the same tax base which includes non-prepared food or groceries, unlike the state sales tax and Articles 43 and 46. Articles 39, 40, and 42 are the only LSTs involved in North Carolina’s revenue redistribution policy and are the focus of this study as a result. Table 1 provides an overview of all LSTs in North Carolina.
After property taxes, LSTs are the second-largest revenue source levied by counties in North Carolina. Over the past two decades, state legislators have expressed concerns that cross-border shopping leads to tax exportation in urban counties and tax leakages in rural counties, causing disparities in revenue-raising capacities between these two types of counties (Dalesio 2015). As Senate Majority Leader Harry Brown stated in 2015: “These inequities lead to a vicious cycle that forces rural counties to fund their public schools and basic infrastructure needs through sky-high property taxes, sky-high property taxes in much of rural North Carolina create another major obstacle to new industry locating and creating jobs there.” (as quoted in Dalesio 2015).
Similar concerns have been raised in other states following the implementation of LSTs (Craft 2002; McFarland 2018; Zhao and Hou 2008), but North Carolina stands out as one of the few states actively addressing this issue.
North Carolina Local Sales Tax Revenue Sharing
Starting in FY2017, the North Carolina legislature implemented a policy “to address sales tax leakage that results from the different revenue-raising capacity of local option sales taxes in each taxing jurisdiction” (SECTION 32.19.(b) § 105-524 Session Law 2015-241). 6 The initiative was led by state legislators, who perceived the existing LST distribution as inequitable, particularly between urban and rural counties. Under the new policy, the state withholds a share of each county’s sales tax revenue and then redistributes revenues to each county according to a fixed percentage share dictated in the statute. The revenue redistributed to the counties is earmarked for economic development, public education, and/or community colleges. The legislature determined the redistribution pool to be $84.8 million in the first year of implementation. Moving forward, the law required adjustments to this pool based on the percentage change in the collection of total revenues from Articles 39, 40, and 42, so that the size of the pool reflected the growth in sales tax revenues and would not decline due to inflation.
To aid understanding, we describe the redistribution policy using Figure 1 and Table 2. As sales occur, the state collects all sales taxes (see Figure 1). Since only Articles 39, 40, and 42 are relevant for redistribution, all other sales taxes are returned to the county where they were originally collected. For redistributed sales taxes, the state calculates each county’s percentage share based on the total amount of sales taxes levied by all counties in the state. A county’s withholding for the pool equals its percentage share of total state sales tax collection. Table 2 gives an example for Alamance and Alexander counties in FY2017. Alamance County collected approximately $50 million in revenue (Column C). The total amount of revenue collected by all counties was roughly $2.6 billion, resulting in a percentage share of 1.93 for Alamance County (Column D). Multiplying this share by the size of the redistribution pool, which was $84.8 million (Column B), the revenue withheld from Alamance County for the pool amounted to about $1.6 million. This same process is applied to each county, resulting in different withholdings for the pool, as shown by the case of Alexander County.
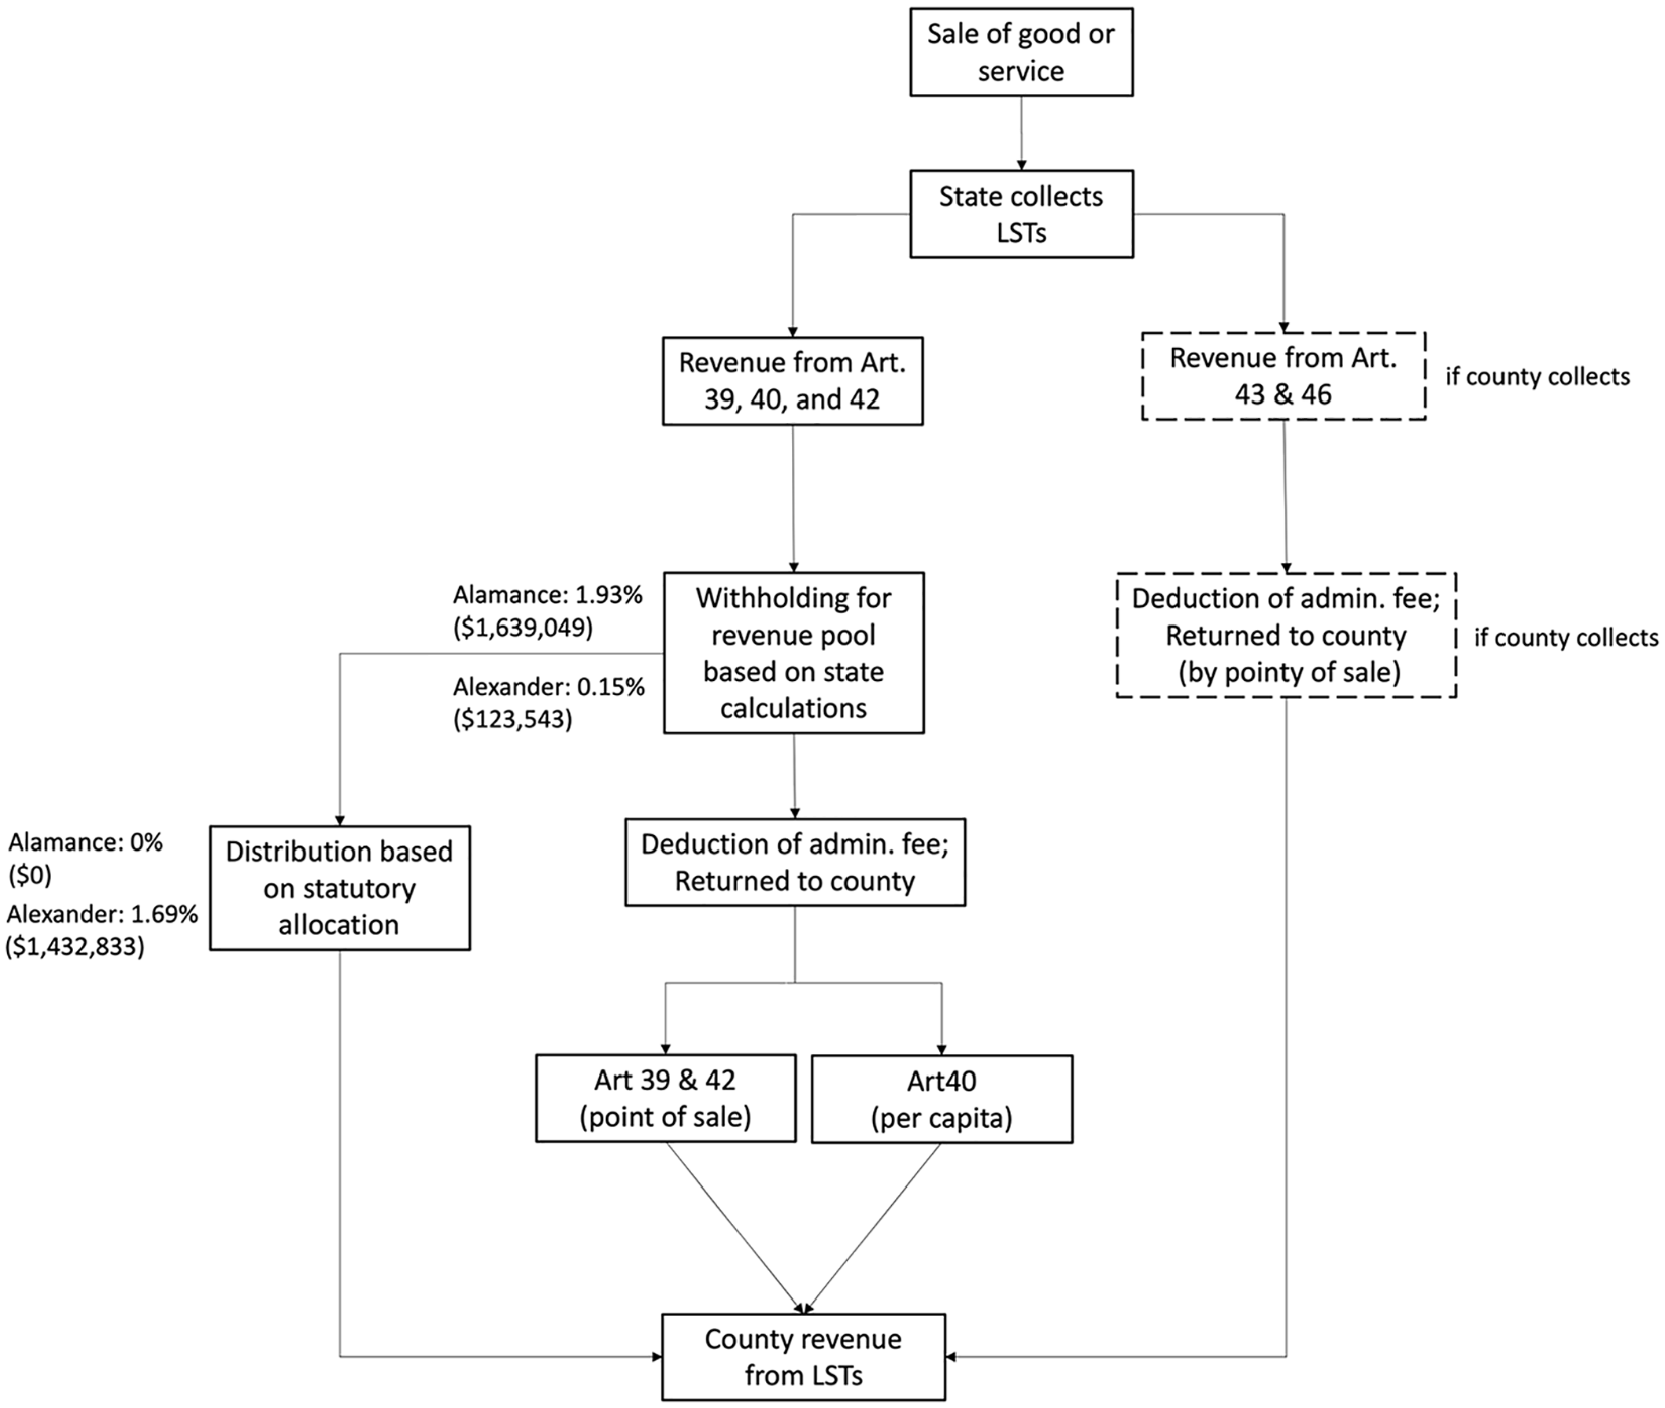
Flow chart for sales tax in and outflows under the redistribution policy.
Examples of Revenues In and Out of the Revenue Sharing Pool, FY2017.
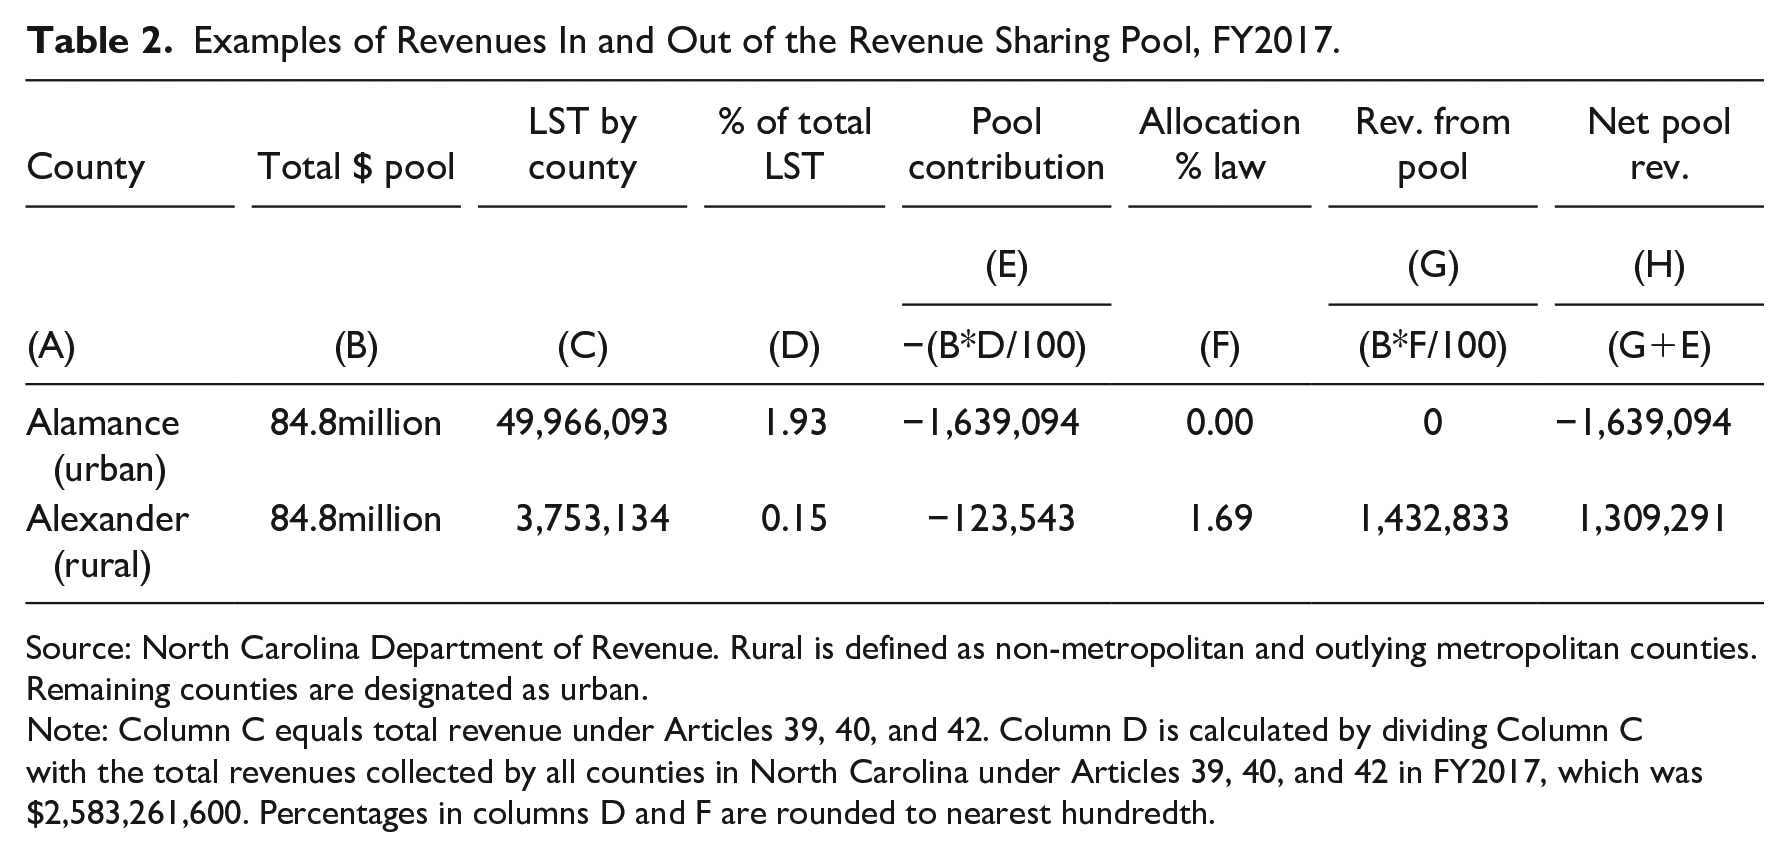
Source: North Carolina Department of Revenue. Rural is defined as non-metropolitan and outlying metropolitan counties. Remaining counties are designated as urban.
Note: Column C equals total revenue under Articles 39, 40, and 42. Column D is calculated by dividing Column C with the total revenues collected by all counties in North Carolina under Articles 39, 40, and 42 in FY2017, which was $2,583,261,600. Percentages in columns D and F are rounded to nearest hundredth.
The allocations from the pool to the county are calculated by multiplying the total size of the pool by the allocation percentage determined by the state legislature and included in the law to address tax leakages (see Figure 1). Allocation percentages were determined by calculating the amount of revenues a county would have received if the state distributed Article 39, 40, and 42 revenues with a 50–50 split between point-of sale and per capita (Canada 2023). 7 Revenue not involved in the redistribution is allocated on the basis of a 75–25 split between point-of-sale and per capita with Articles 39 and 42 (point-of-sale) summing to a 1.5% sales tax and Article 40 (per capita) amounting to a 0.5% sales tax. Allocation percentages do not automatically adjust over time and were calculated based on projected sales tax revenues in 2015 (Canada 2023). As of 2023, the legislature has not chosen to adjust the allocation percentages that any county receives from the pool. Returning to Table 2, Alamance County did not receive any money out of the pool (Column G), as its allocation percentage was zero (Column F), while Alexander County received almost $1.5 million (Column G) given its allocation percentage of 1.69 (Column F). It is important to also highlight that Alexander contributed over $123,500 to the pool under the law. 8 Every county has revenue withheld for the pool regardless of its allocation percentage.
The difference in withheld revenues into the pool and the allocations out of the pool creates net winners and losers. If the goal of the redistribution policy was to reduce perceived inequities due to tax leakage, especially between rural and urban counties, then we would expect to see rural counties as net winners and urban counties as net losers. This is indeed the case for the two counties in Table 2 (Column H).
The Impact of the Revenue Sharing Pool on Local Sales Tax Revenues
This section investigates the effectiveness of the redistribution policy. Financial information for our analyses is taken from the North Carolina Department of Revenue. 9 Given the concern over tax leakage between urban and rural counties that motivated the redistribution policy, we employ urban and rural designations based on categories established by the North Carolina Department of Health and Human Services based on the U.S. Census. 10 Rural is defined as non-metropolitan and outlying metropolitan counties. North Carolina has 70 rural counties based on this definition. The remaining 30 counties are defined as urban.
Winners and Losers of the Redistribution Policy
Based on the design of the policy, a county experiences a net positive (negative) redistribution if own-LST revenue as a share of statewide LST revenue is greater (less) than its pool allocation share. We consider first the relationship between these two policy parameters and the resulting composition of net winners and losers between urban and rural counties. Figure 2 plots the percent share of statewide LST revenues and pool allocation percentages for the first year of the policy, FY2017. 11 Rural counties are shown in red and urban counties in blue. Percent share of statewide LST revenues on the x-axis is equal to the percentage of the pool total ($84.8 million in 2017) withheld from a county’s own LST revenue. The dashed diagonal line shows equivalence between the two axes. Counties above the line are net winners, as the percentage of the pool they receive is greater than the percentage they withheld, and counties below the line are net losers.
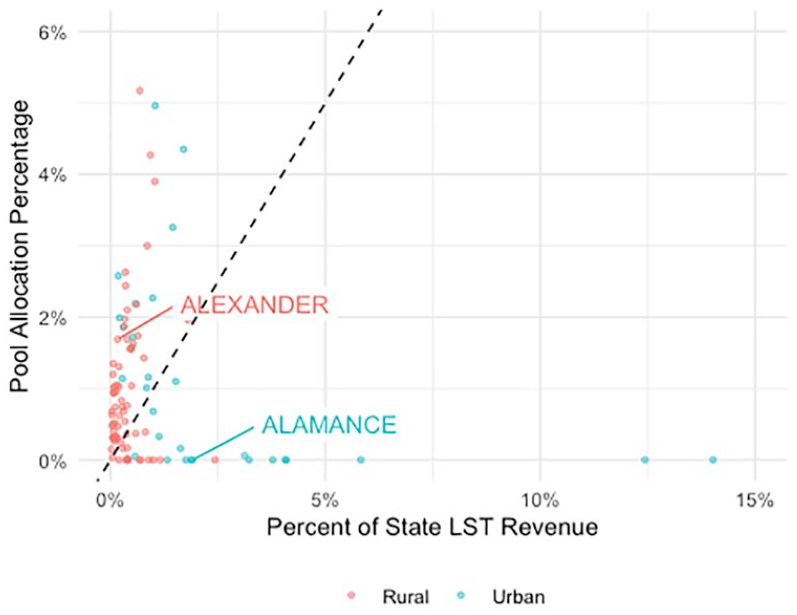
The percentage of local sales tax revenue generated and the allocation of local sales taxes from the revenue sharing pool.
Given the policy’s motivation and goals, we expect rural counties to have small and urban counties to have large tax bases. Allocations should create gains for rural counties and losses for urban counties. These expectations would lead to rural counties clustering in the upper left and urban counties clustering in the lower right area of the coordinate system.
In contrast to these predictions, we see multiple rural counties with high tax bases and several urban counties with low tax bases. Furthermore, both urban and rural counties experience net gains and net losses from the policy. Nearly 50% of urban counties and 75% of rural counties are net winners. Most counties are situated close to the origin of the coordinate system and there is no clear relationship between relative tax base and pool allocation. The deviation of these findings from the arguments put forward for the implementation of the redistribution policy is likely twofold. First, rural and urban counties are imperfectly aligned with small and large tax bases. 12 Second, percent shares into the pool are not aligned with allocation shares out of the pool, with the first being determined by a county’s tax base relative to all other counties and the latter being a fixed policy parameter determined by a projected 50–50 split between point-of-sale and per capita distribution on LSTs calculated in late 2015.
Compounding the deviation between policy expectations and findings in Figure 2 is the fact that “the allocation math does not take into account contributions to the pool” (Canada 2023). Among the 33 counties with net negative revenue in 2017, 21 counties (11 urban and 10 rural) received an allocation share equal to zero. These counties located on the x-axis are net losers by design, as they were assigned a zero percent pool allocation due to perceived tax exportation. State legislators anticipated the remaining 12 counties (6 urban and 6 rural) above the x-axis but below the dotted line would be net winners. 13 Instead, they are net losers because their percentage share of state LST revenues happens to exceed the allocation percentage set by the state. Two rural counties have switched from net gain to net loss since FY2017 due to growing percentage shares of state revenue.
Next, we examine the progressivity and magnitude of the redistribution relative to counties’ own-LST revenue per capita. LST revenue per capita takes into account the number of residents contributing to a county’s sales tax capacity, as opposed to capacity as total dollars relative to other counties used in the redistribution. Figure 3 plots county own-LST revenue per capita before redistribution on the x-axis. The y-axis displays net revenue lost or gained by the LST redistribution divided by LST revenue per capita as a percentage. LST revenue per capita represents an absolute measure of sales tax capacity, as opposed to capacity relative to other counties used in the redistribution policy. Counties above the dashed line are net winners, and counties below the dashed line are net losers. Again, rural counties are shown in red and urban counties in blue. In line with the motivation and goals of the redistribution policy, we expect rural counties with low LST revenues per capita to locate above and urban counties with high LST revenues per capita to locate below the dashed line.
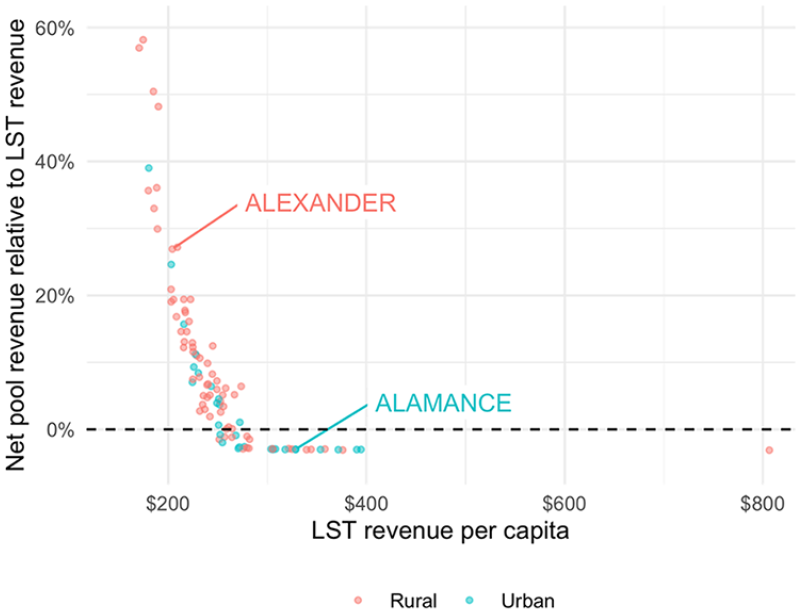
Local sales tax capacity versus revenue from state pool.
As predicted, urban counties with high LST revenue capacity, such as Alamance, experience a net loss in revenue. Rural counties with low LST revenue capacity, such as Alexander, experience a net gain in revenue. Again, rural and urban counties are imperfectly aligned with varying tax bases per capita. Though there is notable variation in net pool revenue as a function of own-LST revenue per capita, using share of statewide LST revenue and a reallocation share targeting a 50–50 split between point-of-sale and per capita distributions to determine net pool revenue results in a considerably progressive redistribution with respect to this measure of sales tax capacity. The redistribution also generates sizeable gains for net winners from arguably small losses for net losers relative to own-LST revenue per capita. Among net winners, the median and maximum gains equal 10% and 58% of own-LST revenue per capita, respectively. Among net losers, median and maximum losses are nearly the same at 2.9% and 3.1%, respectively. 14
Results Using the 50–50 Target as a Comparison Metric
To determine the allocation shares for pool revenues, state legislators calculated LST transfers based on a 50–50 split between point-of-sale and per capita distributions for all revenues collected under Articles 39, 40, and 42 in 2015, using projected revenues for FY2017. Since this split reflects the policymakers’ desired distribution of sales taxes, we can use the 50–50 metric for comparisons between the actual and an intended sales tax distribution. If the difference between actual and hypothetical 50–50 revenues for a county is zero, then LST revenues are distributed as intended by the state legislature. In contrast, negative or positive differences represent actual revenues that are either too small or too large, respectively, for the intended distribution of LSTs.
Figure 4 presents the distribution of differences between counties’ actual revenues and 50–50 target revenues per capita for fiscal years before and after the redistribution policy. In years prior to the policy, actual revenues were less than the 50–50 target for most counties. However, the distribution shows several outliers to the right with counties receiving more revenue than their targeted share. Beginning in FY2017, actual revenues matched more closely with 50–50 target revenues and the spread of the distribution became notably smaller. These results align with the policy’s goals.
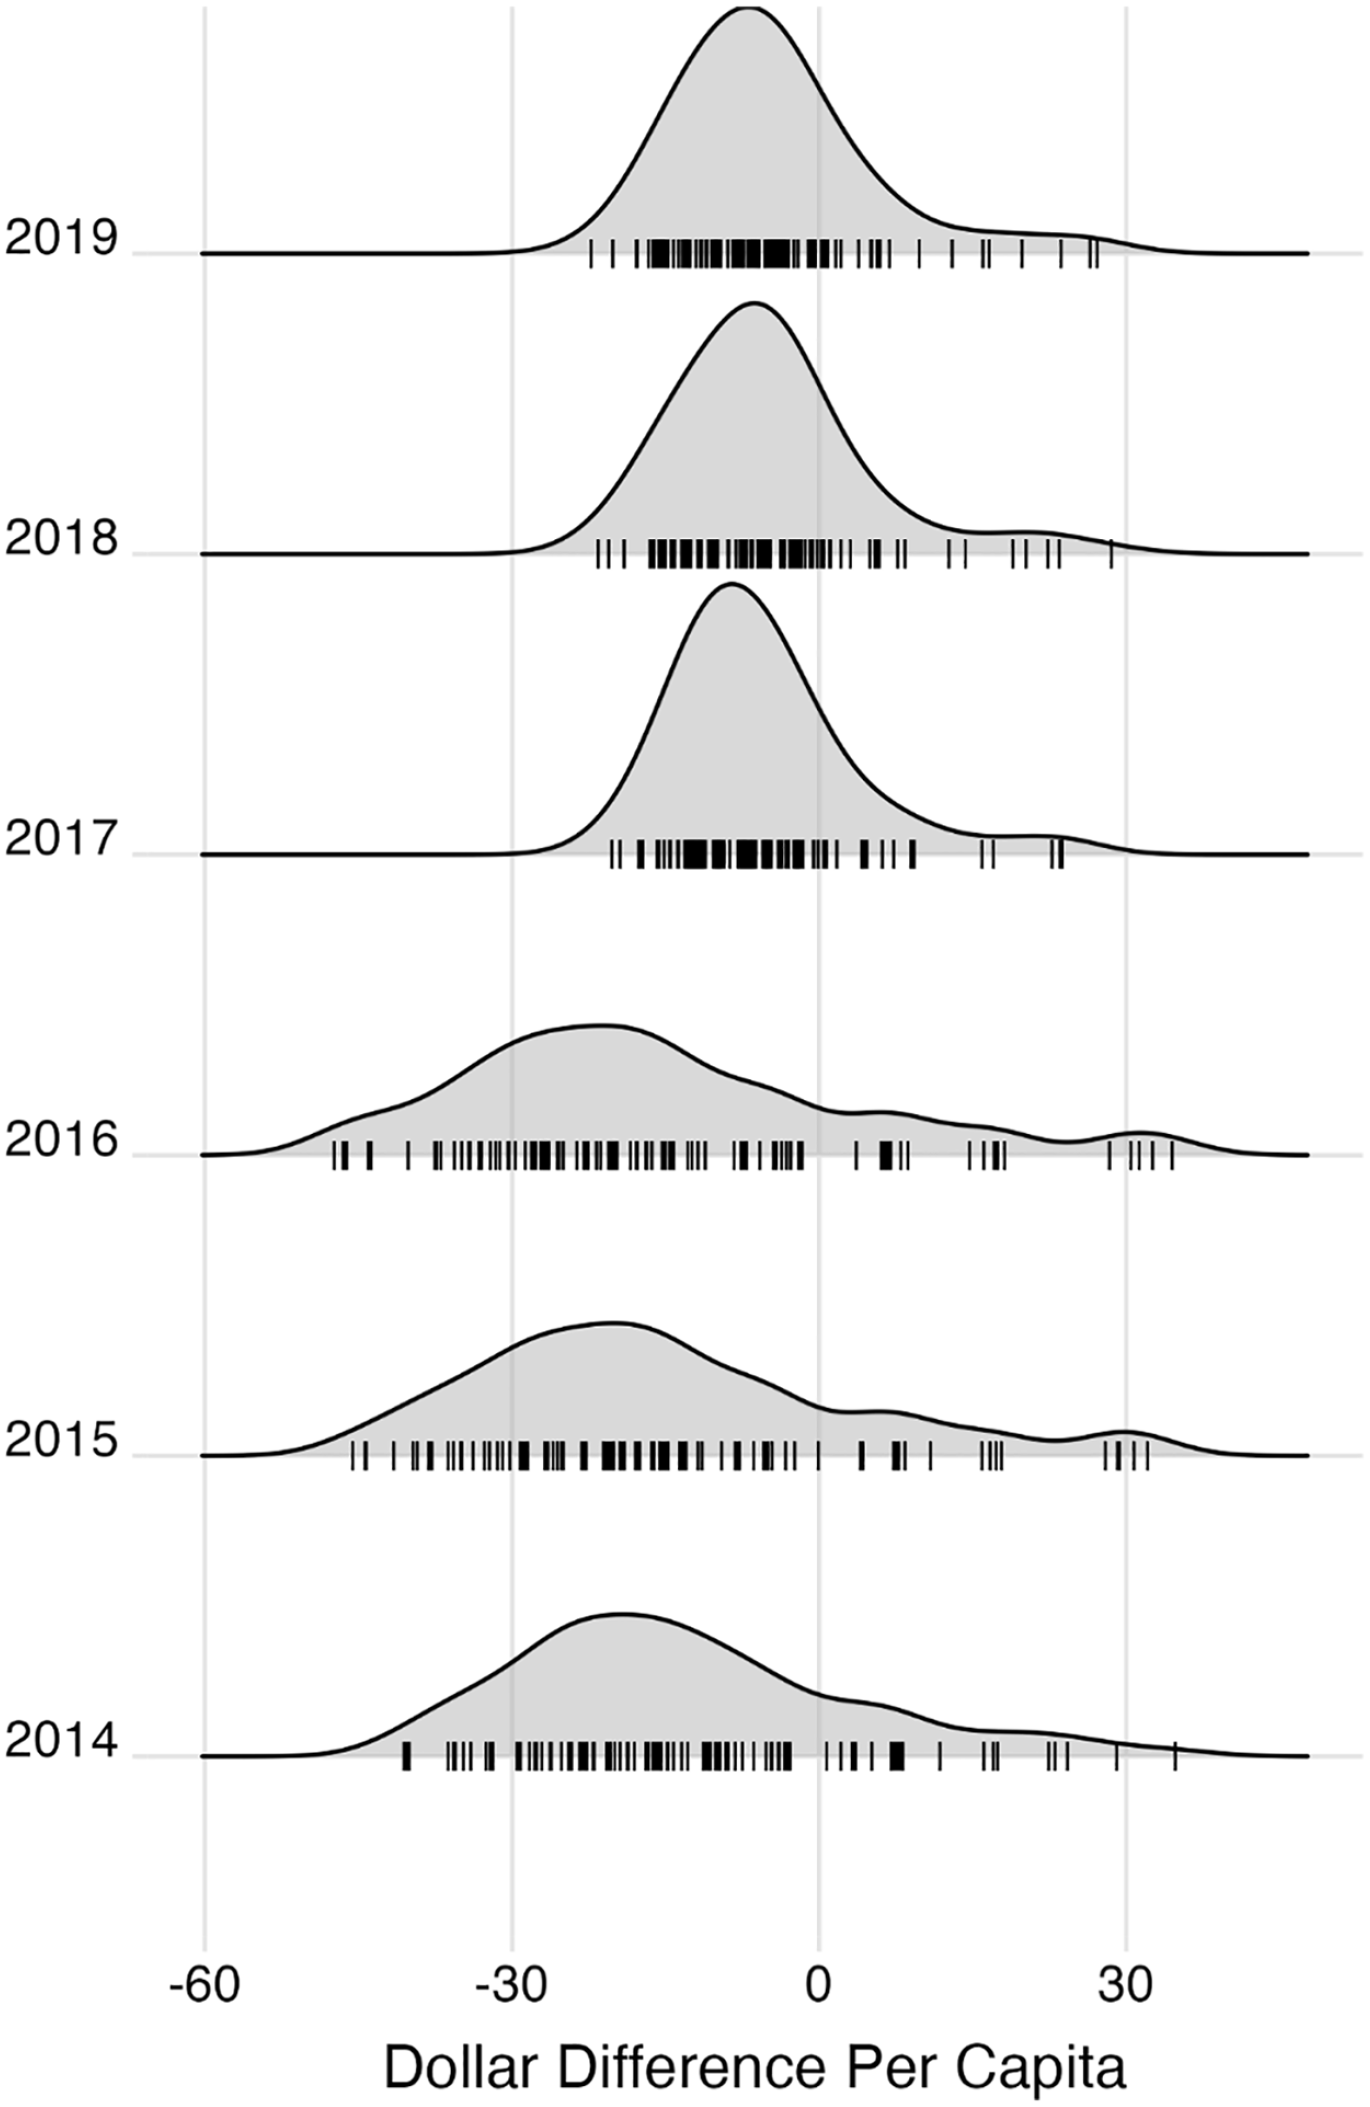
Actual revenue less 50–50 target revenue per capita by fiscal year.
Figure 5 breaks down the distribution for subgroups of urban and rural counties. Urban counties are shown in blue, and rural counties are shown in red. For urban counties pre-policy, the distribution is about evenly split among positive and negative differences. By contrast, almost all rural counties received actual revenues lower than the 50–50 target revenue. This pattern changed drastically with the implementation of the policy in 2017. More urban counties began receiving less revenue than the intended target, while actual revenues for most rural counties became closer to the target. Overall, though most counties continue to receive less revenue than the intended target, the differences became smaller after the policy, and the distributions between urban and rural counties became much more similar.
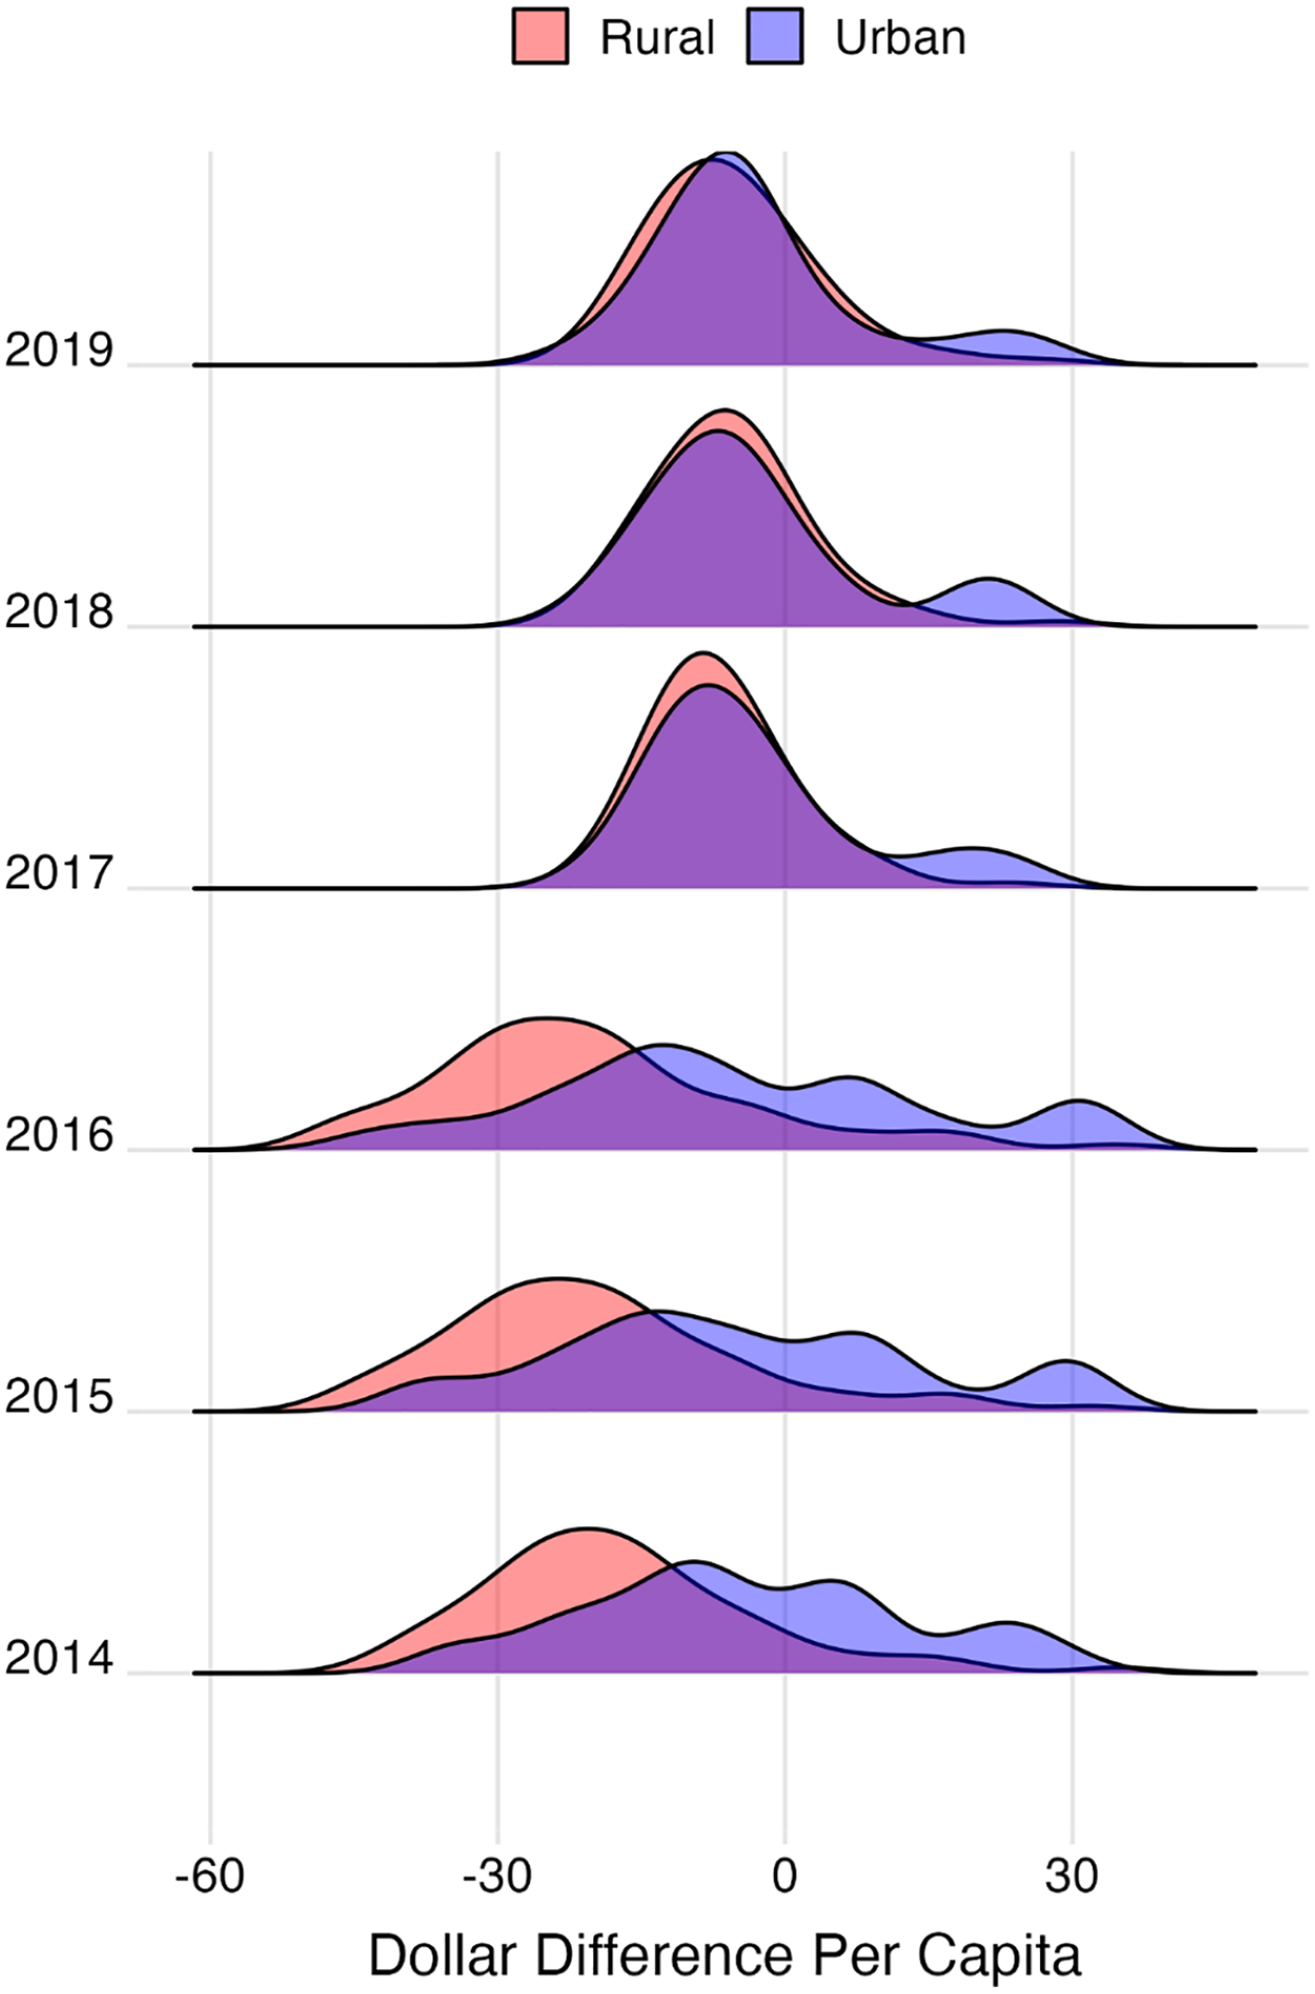
Actual revenue less 50–50 target revenue by locale and fiscal year.
Variance Between Counties in Revenue Raising Capacity Over Time
The main goal behind the implementation of the revenue pool was, as expressed by state legislators, a reduction in the perceived inequities created by perceived tax leakage of LSTs among counties. Figure 6 plots the distribution of total LST revenue per capita under Articles 39, 40, and 42 for fiscal years 2014 to 2022. If the policy was successful, the distribution of LST revenues per capita should become more normal and show less variance after 2017. However, the policy should not be expected to eliminate all variation between counties, just reduce it since 50% of the revenue remains point-of-sale.
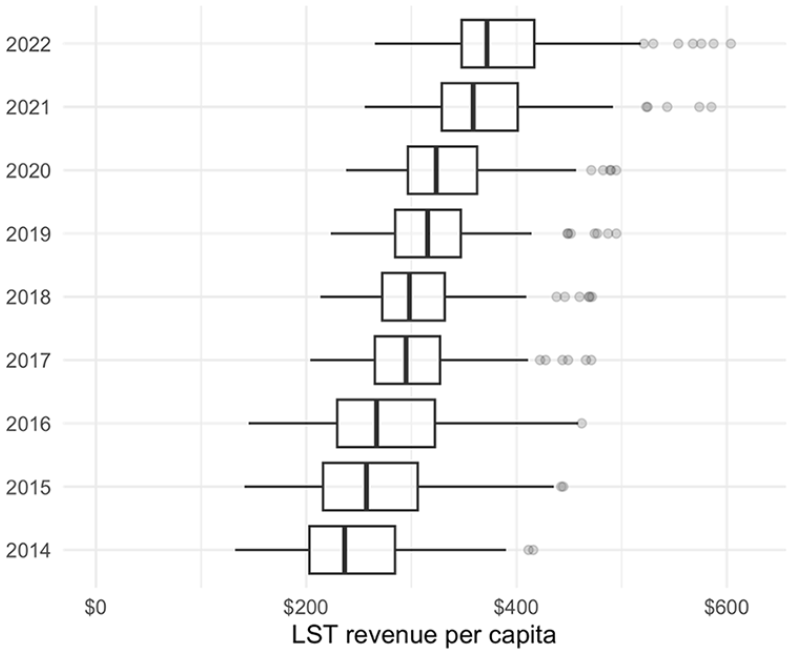
Per capita county local sales tax revenue by fiscal year (in 2022 dollars).
Indeed, looking at Figure 6, the distribution of LST revenues per capita shows a clear decrease in variance between fiscal years 2016 and 2017. This pattern reflects the intentions of the policy. However, over time, the number of outliers—counties with significantly higher per capita LST revenues than most—increases, thereby skewing the distribution to the right. Also, overall variance has increased compared to 2017 potentially due to greater growth in tax bases in counties with large tax bases relative to those with small tax bases.
Conclusion
Local governments provide critical services such as education, public safety, and public transportation. Therefore, the concern over the inequity of revenue raising capacity between jurisdictions is a growing concern for state policymakers who are committed to the entire state thriving. North Carolina policymakers took aim at what was perceived by some lawmakers as an inequitable revenue raising capacity and tax leakage in 2015 and created a LST revenue sharing pool that all counties would contribute to and only those calculated to have net tax leakage would benefit from. This analysis lays out the policy adopted in North Carolina and considers its successes and failures.
Ultimately, it appears that in most cases that the LST revenue sharing pool did benefit the counties with lower per capita LST revenue—though it did not achieve the intended allocations. This is due to the fact that when these percentage allocations were created, the General Assembly did not factor in the contributions that counties made to the revenue sharing pool. These deviations from the intended 50–50 split (where 50% of the LST base would be distributed by point-of-sale and 50% would be distributed on a per capita basis) have only worsened over time.
It is also important to note that the goal of GS 105–524 was to compensate for tax leakage and subsequently spur growth and the economic engines of North Carolina’s rural counties. The General Assembly did not include language to allow for automatic adjustments to the allocation percentages to be made in the same way that the size of the revenue sharing pool is automatically adjusted each fiscal year. This means that if these funds do help spur growth, the allocations from the revenue sharing pool will remain unchanged and not correct for what had been the identified inequity and may worsen inequity.
In summary, given the intention of GS 105–524 to create a 50% per capita-50% point-of sales distribution of LSTs amongst counties there were adjustments that the General Assembly could have made to the policy to make it more successful. First, as noted, the state should have considered the withholding of LST revenue from each county that made up the revenue sharing pool. This omission has led to lower net revenues for recipient counties than intended. Second, the state included language to update the size of the revenue sharing pool annually, but failed to include any language about how to update the allocation percentages that are dictated in the statute. As counties contract and grow and their LST bases do as well, these allocation percentages will continue to become less successful in achieving the desired 50–50 split. Third, in earlier versions of this policy there had been both a contribution to the pool by the state and an increase in the services subject to the LSTs. These changes would have more successfully offset the harm to those counties that do not receive any revenue from the pool and would have led to larger allocations to the recipients of revenue from the pool.
Lastly, the state could have considered alternative ways to support local governments in the state that had lower revenue raising capacity. For example, the state could have considered more holistic measures of revenue raising capacity that included not only LSTs, but also property taxes, lodging taxes, and fees to better understand actual differences in capacity—rather than for just one instrument. 15 Also, the state could have, rather than redistributing funds across counties, used state funds to redistribute revenues to counties with tax leakage or lower revenue raising capacity—whether this was from existing state tax instruments or through the addition of an increase in an existing tax such as the sales tax. While the majority of state revenue is also generated in the counties that do not receive revenues from the revenue sharing pool, it would not create the additional burden and harm for these governments—just their residents. In short, there is no one correct policy solution or answer and these efforts require careful consideration and a weighing of the costs and benefits.
While the policy being analyzed is specific to North Carolina it has many important lessons for policymakers in other contexts. For example, as states continue to contend with a widening rural-urban economic divide (McFarland 2018), this policy highlights how critical it is to carefully construct policies intended to address these inequities and to consider the ramifications of the policy on the underlying economy whether that is economic growth spurred by increased revenues or economic harm caused by reallocation of revenues. Including recognizing that not all urban and rural jurisdictions conform to thriving and failing expectations. It is also important that in future work, for the North Carolina context and others, the impacts of the program are measured beyond just the stated policy goals. In this analysis we examine how close North Carolina got to the intended 50–50 LST distribution. However, we did not consider how that distribution aligns with other measures such as economic health or distress and the capacity of other revenue instruments.
Footnotes
Declaration of Conflicting Interests
The author(s) declared no potential conflicts of interest with respect to the research, authorship, and/or publication of this article.
Funding
The author(s) received no financial support for the research, authorship, and/or publication of this article.