
Abstract
In this paper, we examine whether a political budget cycle exists in municipal governments that fall under tight financial and institutional regulation by senior orders of government. For other levels of government, there is evidence that politicians initiate popular programs in election years and delay the unpopular tax increases after the election. Using a sample of 444 Ontario municipalities, with few exceptions, no such evidence was found. The results are the same regardless of the length of the term (three or four year), municipal size (small, medium, or large), and the governance system (one or two-tier). The paper concludes with possible explanations as to why there are no opportunistic manipulations of municipal budgets.
Introduction
The term “political budget cycle” refers to incumbent political parties manipulating budgets to stimulate the economy just before an election year and raising taxes after the election year in the hopes of maximizing their electoral prospects. In this sense, by exercising the policy levers at their disposal, politicians aim to provide good news to the electorate prior to election time and delay necessary financial hardship until after they secured a renewed mandate. There is substantial evidence that political budget manipulation occurs at the national level (see Alesini 1992; Brender and Drazen 2005; Klomp and De Haan 2013; Shi and Svensson 2006), as does the politically influenced allocation of grants and other government resources (Ali 2017; Gamkhar and Ali 2008). Those who take part in practice at this level of government have substantial access to the levers of political and resource power in their jurisdictions. These decision makers usually represent political parties and, therefore, have much tighter connection to fellow decision-makers.
The purpose of this paper is to examine whether a political budget cycle exists in municipal governments and, specifically, whether local government leaders strategically set budgets to enhance their electoral success. Many of the levers of power employed by those at other orders of government to politically manipulate budgeting do not exist in local government, making this setting ideal to further test the presence and impact of political budgeting.
Political budgets take on many forms, such as reducing taxes in an election year, or increasing expenditures in an election year, or by keeping total expenditures constant but changing the composition of expenditures from less visible to more visible services in an election year. 1 We examine these phenomena in a unique institutional setting in comparison to other studies on this topic. Municipalities in the Province of Ontario have much tighter controls imposed upon them from senior orders of government and operate without political parties, presenting a much more controlled environment in which to test the impact of political budget manipulation. 2 To do so, we analyze financial information on taxation and expenditures from every municipality in the Province between the 2003 election cycle and the last election in 2018. This large data set allows us to also control for electoral timing and governance structure over multiple elected terms. Ultimately, we find that taxes decrease in election years, but expenditures do not increase, regardless of the length of the electoral term (three or four year) or size of the municipality (small medium or large).
This paper proceeds in four sections. First, we introduce readers to the notion of the political budget cycle and survey existing literature on this topic at the national, state/provincial, and local levels. We then present our data and methodology, while also providing more information on the structure and governance of municipalities in the Province of Ontario. We then present our results. The final section concludes the study.
The Political Budget Cycle
Empirical work on this topic at the national level is substantial but very limited at the municipal level. For senior orders of governments, be they federal or provincial or state, there is evidence that governments initiate popular programs in election years and delay unpopular tax increases until after an election.
Municipal decision makers in general, however, face a much more constrained decision-making environment, making the types of choices available to aspiring political budgeters much different than those at national or state level. For example, Pagano and Hoene (2018) introduced the Fiscal Policy Space (FPS) framework, which argues that the confined decision space of local policymakers typically transcends periods of change in the business cycle, limiting options available to politicians in periods of economic growth and decline. The authors argue that the FPS framework has three distinct attributes: the intergovernmental context, which includes both state and local rules around taxation and expenditures, the fiscal base, namely the local economic environment, and the political demands of the public, which establishes service expectations and norms (Pagano and Hoene 2018). The constrained decision-making space may in part explain why there is limited research on municipal political budgeting.
We now review the empirical work on municipal political budgeting. Bee and Moulton (2015), using a panel of 268 U.S. municipalities for the 1970–2004 period, tested the political budget cycle hypothesis using data on taxes, employment, and spending. They found no evidence of altered expenditures or taxes but found a small increase in employment in policing, education, and sanitation. However, in an earlier study, Strate, Wolman, and Melchior (1993) using data from medium-and large-sized U.S. cities from 1978 through 1985, found that in many municipalities, politicians avoided tax increases in fiscal years when an election was imminent (p. 462).
Similarly, although not for an elected system, Gou (2009) argues that in an authoritarian system such as China where local officials are appointed by the central party for a five-year term, a local official’s career advancement is dependent on their economic performance as measured by large scale development projects and that the timing of projects should be as close to the end of their tenure and promotion review. Based on a sample of 6,370 county leaders, Guo (2009) found that the highest growth in government expenditures occurs in the third and fourth year in office.
A variant of the election budget cycle regarding the timing of expenditures and tax increases is the timing of the composition of expenditures. Using data from municipal government in Columbia, Drazen and Eslava (2010) found that incumbents change the composition of government spending by increasing the types of spending voters favor in pre-election years combined with a contraction of less popular types of expenditures.
Similarly, Veiga and Veiga (2007) using a data set of all Portugal’s 278 municipalities for the 1979–2000 period, found opportunistic behaviour by mayors as evidenced by pre-election increases in expenditure items highly visible to the electorate, such as investment in physical infrastructure. Likewise, Foucault, Madies, and Paty (2008) using a panel data set from 1983 to 2002 for French cities over 50,000 residents also found opportunistic behavior by local governments with an increase in all categories of public spending in pre-electoral periods. Using a different approach, Klein (2010) found that mayors in Brazil who are re-elected spend close to 3% more in election years than those who are not re-elected.
Another avenue of research focuses on examining the determinants of the electoral cycle. For example, Vincent, Benito, and Bastida (2013) examined the impact of the financial transparency of Spanish municipalities on the political budget cycle. Using a panel of the largest Spanish municipalities for the period 1999–2009, they found that consistent with other studies, the electoral cycle in total spending depends on the financial transparency of the municipality: the lesser the transparency, the greater the spending in election years. Even if transparency is high, politicians may still use other fiscal measures to increase voter support. Consistent with transparency results, Brender and Drazen (2005) found that the political budget cycle is stronger in new or weak democracies compared to those that are well established. Likewise, Akhmedov and Zhuravskaya (2004) found that after the transition to democracy in Russia, the magnitude of the cycle decreased with successive elections due to more government transparency, media freedom, and voter awareness. Chortareas, Logothetis, and Papandreou (2016) examined political budget cycles and re-election prospects of mayors in Greece’s municipalities, concluding that opportunistic budgets are not only electorally rewarding but are impervious to municipal reform attempts. Using time series data from 1970 to 2014 for 99 developing countries and 34 Organization for Economic Cooperation and Development Countries, Herzog (2017) finds that as transparency improves, the political budget cycles become smaller. In addition, the mitigation effect on the political budget cycle is greater for advanced than developing countries (Herzog 2017, 683).
Another determinant of the political budget cycle studied is the impact of the type of election on the cycle. Köthenbürger, Egger, and Smart (2014) found that in Germany, changing from a council-manager system to a mayor-council system, elected under first-past-the-post rules, results in a significant increase in local government expenditure, particularly in redistributive spending categories. Corvalan, Cox, and Osorio (2018) using a panel of 345 municipalities and 13 years find evidence of a political budget cycle because the central government uses intergovernmental transfers to favour political aligned mayors during election years.
Unfortunately, unlike other countries, there are no municipal studies of the political budget cycle in Canada, which would explore the unique regulatory structure of Canadian local government. However, there are studies at the provincial and federal levels providing some Canadian evidence we can use to inform this study. For example, Kneebone and McKenzie (2001) found evidence that during election years provincial governments minimized taxes but increased spending in highly visible areas such as schools and roads. Their results are consistent with an earlier study by Reid (1998), Blais and Nadeau (1992), who, using data from 1951 to 1984, find that total spending was increased regardless of the ideological persuasions of the government during an election year. Both results are also consistent with a survey by Hartle (1989) which found that 80% of federal and provincial bureaucrats and politicians felt that taxation and expenditures were manipulated for political reasons.
Given the state of the literature on political budget cycles, our paper is unique for several reasons. First, unlike most other studies that examine only large cities, we compare the results for large, medium, and small municipalities. Second, because of an election change in 2004 which changed three-year terms to four years, we can consider the impact of the length of the term on the political budget. Third, our study is advantageous in that all Ontario municipalities have fixed election dates and the same governance structure, unlike the U.S. where there are variations, such as strong mayor and mayor-council systems of governance. Fourth, unlike many studies which use survey data (e.g., Bee and Moulton 2015) our data set captures the entire population of municipalities which eliminates problems associated with survey data. Fifth, the financial data that are used is standardized because of the province’s stringent reporting structures.
Data and Methodology
Municipalities are a responsibility assigned to provincial governments in Canada under the Constitution Act, 1867, meaning that each provincial government establishes their power, authority, responsibilities, and very existence. Each province has at least one piece of legislation that outlines the scope, scale, and servicing responsibility of municipalities with their jurisdiction (Sancton 2020). In Ontario, that statute is the Municipal Act, 2001, which consolidated much of the province’s past legislation addressing municipalities and now governs the extent of powers and duties, internal organization, and structure of municipal government in Ontario, much like how similar statutes accomplish the same across the country (Spicer, Lyons, and Graham 2019). Specifically, the Act establishes the framework for how municipalities operate, the composition of council, the officer roles required, such as a clerk or building official, the process for passing bylaws, conducting council meetings, fiscal and budgetary requirements, parameters for making decisions about local improvements, community grant and financial investments, and enforcement of bylaws (Spicer, Lyons, and Graham 2019). This creates a greatly reduced decision space for local policy-makers, restricting much of their ability to greatly alter the intergovernmental fiscal rules or change the local economic base (see Pagano and Hoene 2018).
About 40% of municipalities in Ontario are single-tier units, meaning that they are solely responsible for the provision of services within their geographic area (Spicer 2022). However, most municipalities in Ontario are in a two-tier structure, be it regional or county governments. Service delivery in two-tier governments is divided between the lower and upper tier governments. The responsibility between each tier varies, but the system is designed to balance regional interests with economies of scale, meaning that services best delivered locally, such as fire protection or recreation, would be normally delivered by lower-tier municipalities, and those best delivered on a regional scale, such as public transportation or atrial roads, would be handled by the upper-tier (Spicer 2022). A Mayor is generally elected at-large in each municipality and, together with a council that is typically elected in various local wards, makes decisions about local servicing and finances congruent with their authority granted under provincial legislation (Sancton 2020).
The financial data that are used were obtained from the Ontario Ministry of Municipal Affairs’ Municipal Financial Information Returns (FIRs). There are 444 municipalities in Ontario. 3 The Ministry requires all municipalities to submit their consolidated financial operations that must correspond to both their financial records and audited financial statements. Municipalities that do not submit data yearly to the Ministry face a substantial penalty, meaning that compliance is very high, creating a unique and robust data set for our purposes.
The Ontario provincial government tightly controls the finances of municipalities, of which yearly submission to the FIR is only one requirement. The province also establishes strict rules on how municipalities can raise revenues, how they levy taxes, how they spend, and how they can borrow to meet capital requirements (Bird, Slack, and Tassonyi 2012). The main revenue sources available for municipalities in Ontario are the property tax, user fees, development charges, some licensing fees, and fines from bylaw infractions. The Municipal Act prohibits municipalities from imposing income taxes, poll taxes, sales taxes, fuel taxes, and resource extraction taxes. The provincial government also restricts the ability of municipalities to incur deficits in their operating budgets (Bird, Slack, and Tassonyi 2012). The tools available for local politicians to manipulate budgets prior to or after elections are, therefore, limited. Provincial FIR data, however, captures the entirety of the financial activity of each municipality, allowing us to evaluate political budgeting dynamics in the face of such strict regulation.
Until 2006, the province of Ontario had three-year terms which were changed to four-year terms in 2007. In this paper, tax increases for both the 2016–2019 four-year term and the previous 2004–2006 three-year term were examined. Doing so enabled us to determine whether the political budget cycle is more pronounced in the four-year or three-year term. If so, the results add credence to those who for other reasons advocate for shorter terms or vice versa.
To test the hypothesis that municipal governments initiate popular programs in election years and delay the unpopular tax increases after the election, the budgetary cycle using both per-household taxes and expenditures was examined which is commonly used in other studies. 4 Although not a perfect proxy for taxes, per-household expenditure and taxes are positively correlated and therefore one would expect that the results would be dependent on the variable used. 5 Thus the existence of both a tax cycle and expenditure cycle were examined. Using both allows us to test for robustness of the results.
Regression Specification and Results
To determine whether political budgets exist at the municipal level, data were combined for both three-year (2004 to 2006 with elections in 2003 and 2006) and four-year terms (with elections in 2014 and 2018) to determine changes in per-household taxes and expenditures in election and non-election years. With few exceptions, all 444 municipalities in the province are included.
As previously discussed, we use both taxes per-household and expenditures per-household as the dependent variable. The explanatory variables are the same for both. To estimate the impact of the timing of elections as well as the size and types of municipalities, we use a micro panel consisting of 444 Ontario municipalities for the 2003–2007 calendar years as well as the longer 2014–2018 period.
Following the practice in the literature (e.g., Baltagi 2008; Hansen 2022), our empirical analysis based on the following general panel regression specification:
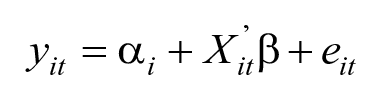
For this specification, the index i tracks municipalities (i = 1,. . .,N) while the index t tracks years (t = 1,. . .,T);
As is well known in the panel data analysis literature (e.g., Baltagi 2008), the empirical benefits associated with the panel regression specified above include the ability to capture municipal-specific heterogeneity, less omitted variable bias concerns, reduced multicollinearity, and more efficient estimation owing to the increased number of observations, among others.
With respect to the omitted variable benefits, we note that although there are many factors (e.g., economic, socioeconomic, demographic, and institutional) that could potentially affect budgetary outcomes, our panel regression specification enables us to control for the variables that are time invariant (or vary very little) during the timeframe covered by the data even though we may not necessarily have data on those variables. Considering the short time dimensions covered by our panel datasets (i.e., 2004–2007 or 2014–2018), we would not expect much variation in many of the potential socioeconomic, demographic, and institutional variables.
The time invariant variables used in our estimation of our panel regression included those related to municipality size (Small and Medium) whereas the time variant variables included the election variables (Elec) and pre-election year related variables (Pre). More specifically, Smalli and Mediumi are 1/0 dummy variables representing the size of municipality i which is constant over the years (benchmark would be a large municipality); Electit is a 1/0 dummy variable taking a 1 if we have an election for municipality i in period t (benchmark would be no election that year); Preit is a 1/0 dummy variable a 1 if we are in a pre-election year for municipality i in period t (benchmark would be post-election for that year).
Within the one-way error components framework entailed in the panel regression specified above, we considered three alternative models, namely the pooled model (under the assumption that
One shortfall of the fixed effects model is that all time invariant regressors are removed from the model specification. Using a fixed effect strategy would prevent us in using municipality size variables as standalone regressors unless we interact them with time varying regressors. Such interactions were attempted but none were found to be statistically significant.
Empirical Estimates
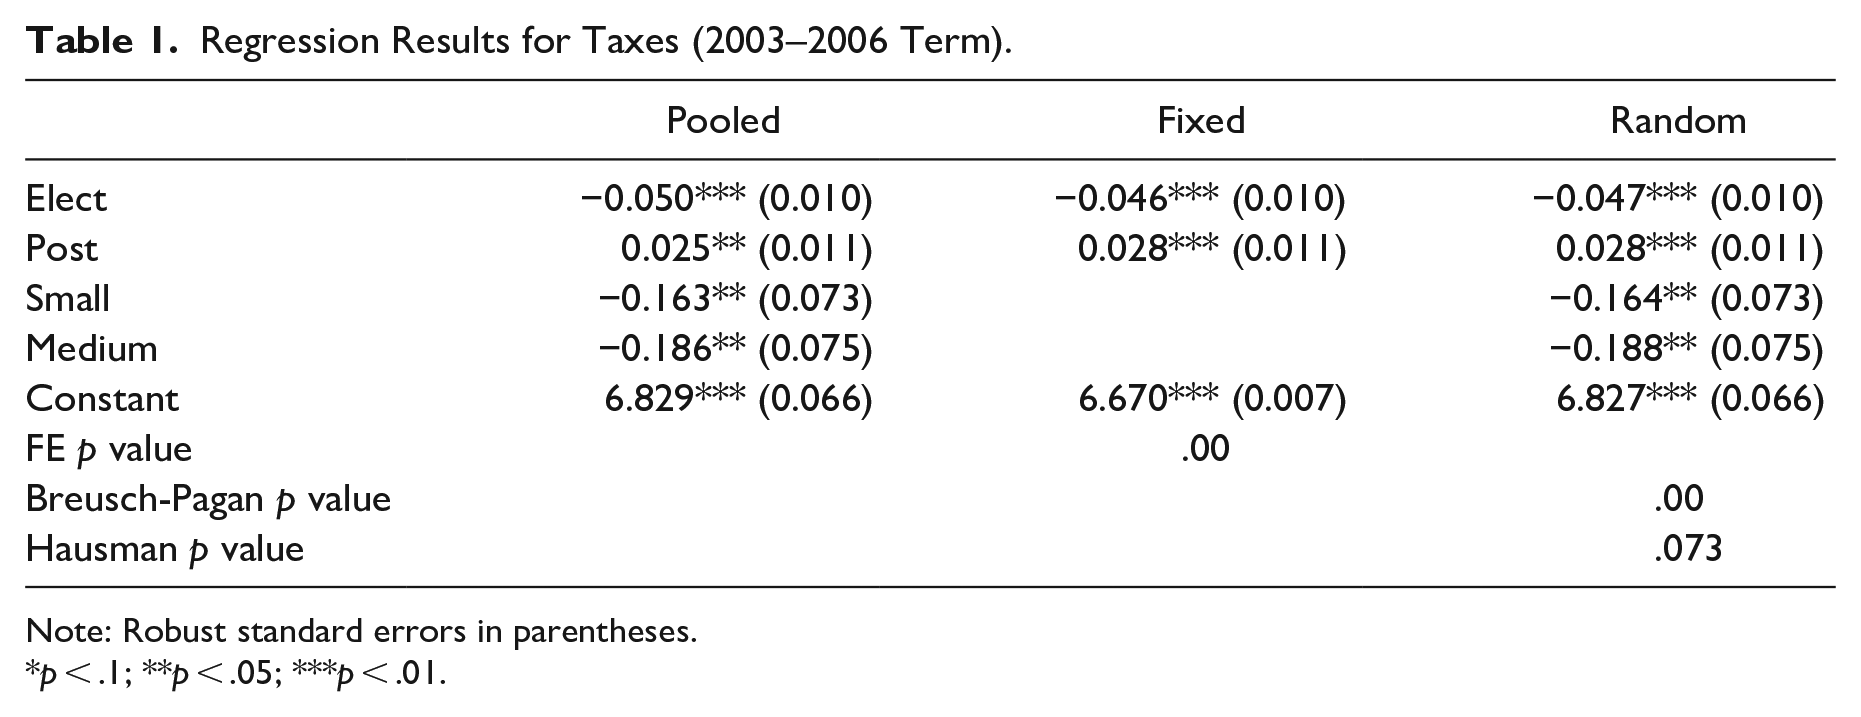
The tax results for the 2003–2006 and 2014–2018 terms are shown in Tables 1 and 2 (robust standard errors are shown in parentheses). The levels of significance are shown at the 1%, 5%, and 10% levels. It is clear from those tables that the point estimates do not vary much across specifications showing support for the pooled (and random effects assumption). In both samples, the Breusch-Pagan tests provide statistical evidence toward the random effect (as compared to the pooled model) while the Hausman tests favor the random effect model for both the 2014–2018 and for the 2003–2006 terms. In what follows, we focus on statistically significant point estimates obtained via the random effects model.
Regression Results for Taxes (2003–2006 Term).
Note: Robust standard errors in parentheses.
p < .1; **p < .05; ***p < .01.
Regression Results for Taxes (2014–2018 Term).

Note: Robust standard errors in parentheses.
p < .1; **p < .05; ***p < .01.
As Table 1 indicates, for the shorter 2003–2006 term, taxes decrease during an election year and increase in the following year. They also decrease for small and medium size municipalities. For the longer 2014–2018 term (Table 2) taxes decrease during the election year but not to the same extent. These tax decreases in election years are consistent with the political budgeting cycle.
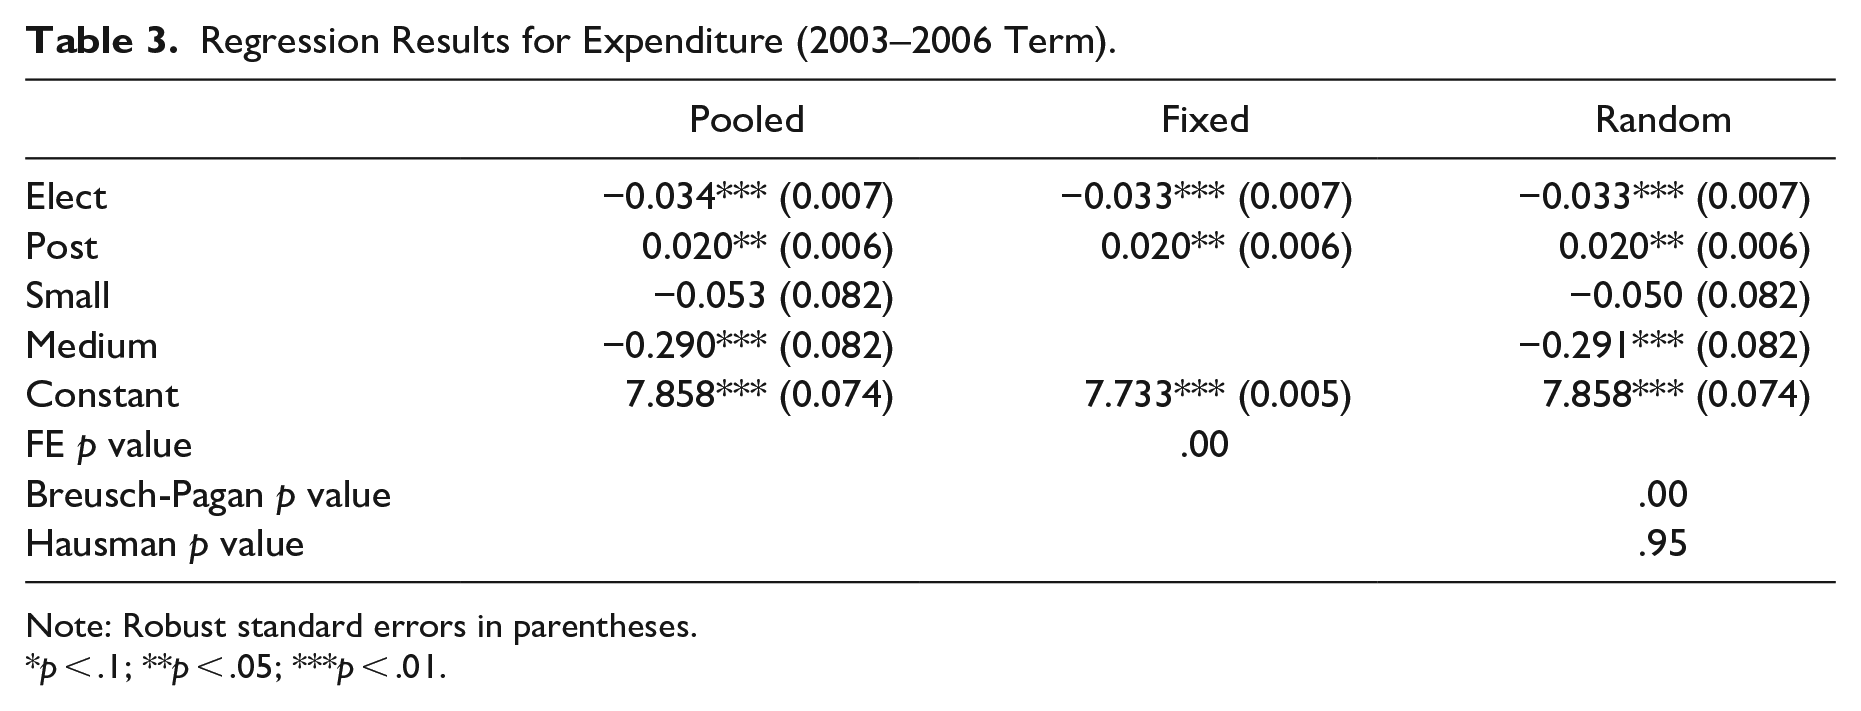
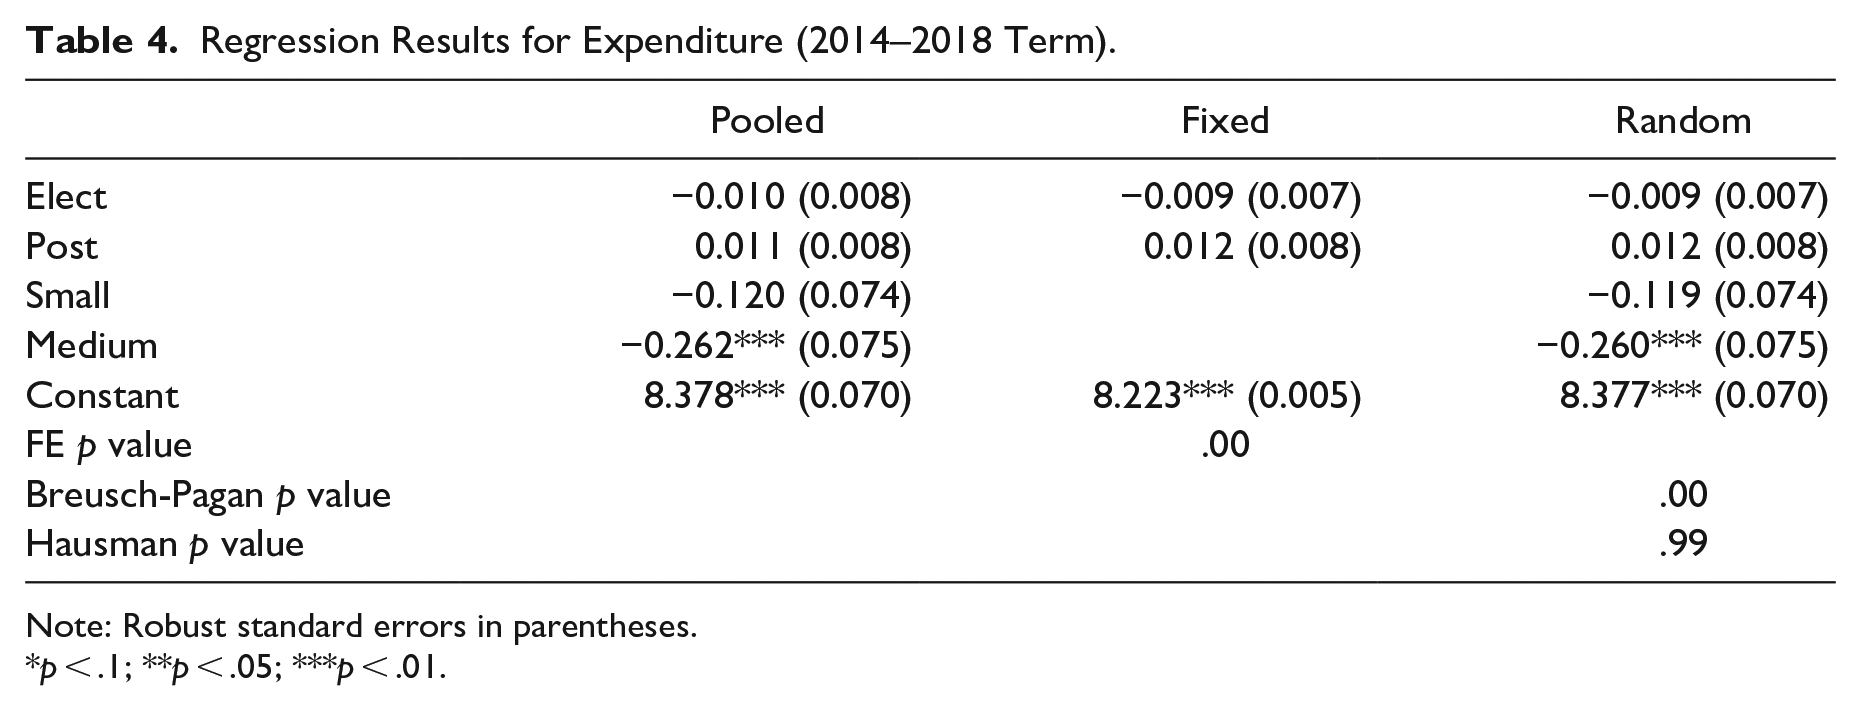
The expenditure results for the 2003–2006 and 2014–2018 terms are shown in Tables 3 and 4 (robust standard errors are shown in parentheses). Like the tax results, the point estimates do not vary much across specifications showing support for the pooled model. (and random effects assumption). In both terms, the Breusch-Pagan tests provide statistical evidence toward the random effect (as compared to the pooled model) while the Hausman tests strongly favor the random effect model for both terms. Once again, we focus on the statistically significant point estimates obtained via the random effects model.
Regression Results for Expenditure (2003–2006 Term).
Note: Robust standard errors in parentheses.
p < .1; **p < .05; ***p < .01.
Regression Results for Expenditure (2014–2018 Term).
Note: Robust standard errors in parentheses.
p < .1; **p < .05; ***p < .01.
As Table 3 indicates, for the shorter 2003–2006 term, per household expenditures decrease in the election year and increase in the year after. These results are similar to the tax results. In terms of size, expenditures decrease but are statistically significant only for medium size municipalities. For the longer 2014–2018 term (Table 4), the results are similar to those for the shorter term.
In summary, both for taxes and expenditures, the election year has the biggest effect, a reduction of both taxes and expenditures. Comparing the tax and expenditure results, the statistically significant decrease in taxes in the election year is consistent with the political budget cycle whereas the statistically significant decrease in expenditures is not consistent with the political budget cycle.
Unfortunately, there are no other municipal studies in Canada with which to compare our results. There are, however, studies of municipalities in other countries. In the United States, Bee and Moulton (2015), using a panel of 268 U.S. municipalities for the 1970–2004 period, found no evidence of altered expenditures or taxes whereas in an earlier study, John, Wolman, and Melchior (1993) found that municipal politicians avoided tax increases in election years. Similarly for Portugal, Veiga and Veiga (2007) found opportunistic behaviour by mayors in terms of pre-election increases of highly visible expenditures on investment in physical infrastructure as did Foucault, Madies, and Paty (2008) for France, and Klein (2010) for Brazil, and Drazen and Eslava (2010) for Columbia.
Thus, our results for reduced taxes in election years are similar to results for other levels of government and municipalities in other countries which reduce taxes in election years. However, our expenditure results are not in agreement with the political budget cycle whereby expenditure increases take place in election years.
There are several possible explanations as to why our results differ from those elsewhere. First, municipalities in Ontario are “creatures of the province” and are highly regulated by the province. Municipalities are not allowed to run deficits and therefore it would be impossible to reduce taxes and increase expenditures in the same year, which is not the case for higher levels of government which can deficit finance. Furthermore, property taxpayers appear to be more sensitive to increases in property taxes then higher levels of government which can increase less transparent taxes such as income and gas taxes. Therefore, it is not surprising that property taxes are not increased in election years to finance expenditures. Furthermore, upper levels of government have more visible expenditures compared to municipalities which have less visible assets such as underground sewer and water line replacements which do not result in the same political credit. In terms of future research, individual expenditure categories could be examined to determine if there are any expenditure categories, which are manipulated in terms of the electoral budget. Based on previous research elsewhere (Drazen and Eslava, 2010; Eslava, 2005; Philips 2016), one would expect the highly visible expenditures such as transportation to be the most manipulated compared to non-visible services such as general government and underground infrastructure.
Summary and Conclusions
Unlike federal and provincial and levels of government in other countries which are characterized by tax decreases and expenditure increases in election years, our results for Ontario municipalities are mixed. Specifically, we find that taxes decrease in election years, but expenditures do not increase, regardless of the length of the electoral term (three or four year) or size of the municipality (small medium or large). A possible reason for expenditures not being increased in election years is that the prohibition of deficit financing would require taxes to be increased in the election year, politically an unpopular option.
These results add to the growing body of literature on political budget cycles, speaking to the importance of provincial rules put in place in Ontario, which control the spending, budgeting, and raising of revenues by municipalities. Most existing studies examine jurisdictions where such strict external controls do not exist. The presence of these controls, however, does alter the dynamics of political budgeting. While certainly present to a degree in Ontario, political budgeting in municipalities is far more muted by necessity. Local politicians do not have access to the complete set of policy and resource levers that their counterparts at other orders of government have, thus limiting the amount of political budgeting activity in which they can take part. This important finding ought to be considered in future studies and future policy design.
With respect to expenditures, future research could also include a breakdown of expenditures to determine if highly visible expenditures are increased and less visible services are decreased as they are in municipalities in other countries. This may provide additional insight into how political budgeting dynamics are altered by policy or service area. Additional testing could be completed outside of Ontario in other Canadian provinces, which would allow researchers to consider certain legislative aspects in provincial municipal policy, as slight variations in policy and resource control exist in other jurisdictions in Canada.
Footnotes
Acknowledgements
We wish to acknowledge Jim Bradley, the former Minister of Municipal Affairs and Housing for the Province of Ontario, and his staff from the Ministry and in particular, Susan Martin, for their data assistance. A special thanks to David Siegel for his detailed critique of the research.
Declaration of Conflicting Interests
The author(s) declared no potential conflicts of interest with respect to the research, authorship, and/or publication of this article.
Funding
The author(s) received no financial support for the research, authorship, and/or publication of this article.
Notes
Author Biographies
His refereed publications have appeared in the following journals, of which several are in the area of local government: Advances in Industrial and Labor Relation, Antitrust Bulletin, Applied Economics Letters, AREUEA Journal, Atlantic Economic Journal, Canadian Business Economics, Canadian Journal of Administrative Sciences, Canadian Journal of Agriculture Economics, Canadian Journal of Economics, Canadian Journal of Political Science, Canadian Journal of Public Health, Canadian Journal of Urban Research, Canadian Public Administration / Administration Publique du Canada, Canadian Public Policy, Canadian Water Resources Journal, Cost and Management, Dalhousie Review, Engineering Economist, Health Services Research, International Business and Economics Research Journal, International Journal of Wine Business Research, Science Forum, Journal of the Midwest Finance Association, Journal of Wine Economics, Municipal Finance Journal, National Tax Journal, Quarterly Journal of Business and Economics, Review of Financial Economics, Utilities Policy. He is also published numerous articles in Municipal World, a popular magazine for municipal officials and municipal politicians.