
Abstract
The recent global pandemic renewed the importance of telecommunication infrastructure, as many COVID responses (e.g., working from home, home-schooling, e-commerce) were challenged by the inequity of access to broadband services and its underlying network. This paper examines the geospatial footprint of the National Broadband Network (NBN) in relation to the demographics of Australia’s cities and regions. Through data made available by the NBN, which describes the technologies used in its multi-technology mix platform, and published demographic data available via the Australian Bureau of Statistics (ABS), we explore the equity of access to broadband technologies across the nation. The results show a persistent urban-regional divide in the NBN. The paper also offers a brief assessment of the complex and contradictory ways policy responses attempt to mitigate the digital divide, including updates to the national infrastructure project plans.
Introduction
The recent global pandemic renewed the significance of telecommunication as a critical infrastructure worldwide, as many COVID responses such as working from home, home-schooling, and e-commerce require quality access to the Internet. However, in reality, COVID exposed significant inequities and inequalities of access to telecommunication at transnational and transregional scales – even within cities and towns (Fisher and Magin 2021; Tienken 2020). With this in mind, it is interesting to note that in 1995, 25 years prior to COVID, Australia’s Prime Minister Paul Keating declared that "… access to the national information infrastructure will be no less a general right than access to water, or public transport or electricity” (Keating 1995). However, before any initiatives commenced he was replaced by a conservative Coalition government in 1996, which marked the beginning of an 11-year national broadband strategy that prioritized subsidies to support market-led network development in regional and remote areas (Schram et al. 2018).
The federal election in November 2007 saw a return of a Labor government in Australia, promoting a policy platform that promised a National Broadband Network (NBN). In 2009 the NBN Co. was formed to provide terrestrial fibre network coverage for 93% of Australian premises by 2020. Fixed wireless and satellite coverage would serve the remaining 7%. Following a testing period (i.e., early NBN rollout), in March 2012, NBN Co. announced plans for the first stage of the large-scale rollout to connect 3.5 million premises by mid-2015. However, the early NBN rollout experienced substantial delays and attracted a great deal of “overwhelmingly negative” media coverage (Saarinen 2014). Research also argues that the early NBN rollout was perhaps politically motivated (Alizadeh and Farid 2017) and socioeconomically biased (Alizadeh 2015) as the Coalition-held safe seats had the least likelihood of receiving the early NBN under the Labor government.
A turning point for the NBN was the 2013 election. The elected Coalition government suspended the first stage of the large-scale fibre to the premises (FTTP) rollout in Australia to reassess the scale of the national project. As a result, the multi-technology mix (MTM), also known as the Coalition’s NBN, emerged. The MTM includes fibre to the premises (FTTP), fibre to the node (FTTN), fibre to the building (FTTB), hybrid fibre coaxial (HFC), wireless, and satellite broadband services. NBN Co. explained these technologies, saying, “the difference between each type of connection comes down to how we use existing network technology in connecting the nearest available fibre node to a specific premise” (NBN Co. Ltd. 2021b). However, a feature (and weakness) concerning households connected via HFC and FTTN technologies is that end-user speeds are dependent on their distance from the node. Specifically, the further a premise is from the node, the more opportunities for ambient environmental interference and slower service speeds over longer copper lines (Grubesic et al. 2011). Even though the use of loop extenders or similar technologies could potentially mitigate these challenges, this presupposes the copper lines are high quality and already have signal strength (e.g., 110%) capable of supporting the target/promised rate for a household – a rarity for regional and remote customers (Grubesic and Mack 2015).
The purpose of this paper is to examine the geospatial footprint of the NBN. We are particularly interested in the interplay of the NBN and the demographics of Australia’s cities and regions and the implications of recent policy efforts concerning network upgrades. At first glance, these aims may seem modest, but the data required to understand (let alone examine) the footprint of the NBN only became available in 2020 – more than a decade after the initial NBN rollout. Given this context, the proposed analysis is a first step in shedding light on a national infrastructure project that has been criticised, since its inception, for a lack of transparency. However, we acknowledge that the complexities around the definition of telecommunication equity in Australia and beyond (briefly reviewed below) limit our analysis of NBN equity. Further, there are persistent data issues with the NBN, including their refusal to release data concerning final end-user speeds. That said, our findings provide evidence-based support for the ongoing discussions around the different quality of service across the nation (documented by consumer advocacy groups (ACCC 2019a, 2022)); and contribute to the broader discourse focused on telecommunication equity. Additionally, the review of recent policy responses – in the form of updated plans for the national infrastructure project – sheds light on the complexity of telecommunication policy and the roles that the government plays in addressing or exacerbating telecommunication disparities.
In terms of the paper’s structure, we begin by briefly reviewing the complex political and policy landscape for broadband in Australia, focusing on the NBN. Next, we review telecommunication data challenges and how they impact telecommunication policy research and practices. We follow this with additional details concerning our empirical research using recent data from the NBN and the technologies pervasive in its multi-technology mix (MTM) platform. Next, we combine these data with demographic information from the Australian Bureau of Statistics (ABS) to evaluate the equity of access to broadband technologies across Australia using spatially lagged regressions. Finally, the paper concludes with a review of the recent policy responses and updated plans for the national infrastructure to shed light on how government policies may alleviate or further exacerbate the urban-regional divide.
We believe that our analysis is relevant to many countries around the world struggling to achieve telecommunication equity. If anything, COVID exposed gaps in telecommunication infrastructure and pushed many governments to increase their telecommunication expenditure in the middle of the health crisis and as part of their response to the pandemic-hit economies (Ren 2020; James et al. 2020). In a sense, this paper encourages further research on the hidden implications (e. g., urban/regional divide) of telecommunication infrastructure decisions at times of crisis.
Broadband Policy, Politics, and Equity in Australia
As alluded to in the introduction, regardless of which side of the NBN politics one sits on, the reality is that public scrutiny continued throughout the mixed-technology NBN rollout (The Eco 2016; Tucker 2015, 2016). Over the years, public complaints resulted in a range of abrupt decisions, including the announcement to compensate NBN customers for poor service (ACCC 2017); to suddenly halt the installation of one of the less reliable technology options (HFC) in the mixed-technology model (Mason 2017); and to add fibre to the curb (FTTC) to the technology mix, half-way through the national rollout (Sas 2018). These outcomes reflect the dynamic environment in which the NBN Co. has been operating, highlighting the intensity of telecommunication politics in Australia.
Politics of telecommunications are by no means an Australia-exclusive phenomenon and have encouraged several international telecommunication studies (Belloc et al. 2013; Healy et al. 2022) to apply a path dependence framework to explain how economically inefficient technologies may persist due to historical conditions and regulatory interventions (Bourreau et al. 2017; Knieps and Zenhäusern 2016). A full path dependency analysis is beyond the scope of this paper. Yet it is essential to note that evidence suggests that in the case of the NBN, major financial and time savings which prompted the Coalition’s switch from FTTP to MTM never appeared (Gregory 2019). Indeed, the MTM took nearly as long as the predicted FTTP rollout (June 2021) – just 1 year quicker. The initial target for the Coalition’s NBN was to be complete by 2016 (Coalition 2013). Throughout this, however, the Coalition continues to argue that the MTM was 6–8 years faster to roll out than full FTTP (Ferrers 2016); and Australia was in a better position to weather the COVID pandemic due to the switch. Nevertheless, the ongoing dilemma regarding the impacts of regulatory interventions on telecommunication development in Australia intensifies the need to answer critical questions of equity and equality, determining who benefits from the NBN and who is left behind.
Previous warnings that equity issues were prevalent for the NBN (Alizadeh 2013, 2015; ACCC 2019b) went largely unheeded. Specifically, the early rollout was not structured to benefit the least well-off in society; instead, it was likely politically motivated and could potentially exacerbate social inequities and divisions already in place (Alizadeh and Farid 2017). Researchers continue to scrutinize the equity implications of the NBN rollout in major metropolitan cities of Australia (Alizadeh et al. 2020). There are, however, a few considerations that complicate research focused on the equity of telecommunication. The first complication comes from the basic fact that ‘equity’ could be defined and operationalised differently across different localities at different times. In the case of Australia, for example, the equity of access in the original NBN was safeguarded by providing ‘equal and ubiquitous access to FTTP’ (to 93% of premises nationwide). The Coalition’s NBN, however, pivoted from this definition of equity by adopting the MTM platform. For over a decade, advocates of the MTM argued that it provided a need-based ‘quality’ connection that could be considered ‘equitable’ on its own terms. Nevertheless, multiple independent reports (ACCC 2020; 2019a, 2019b) argue that despite the technological advances and several rounds of updates, Internet pricing in Australia is not competitive, and the quality (speed and reliability) of access is vastly different across the nation with potential implications for people’s livelihoods and wellbeing.
Related to this first challenge elaborated above, the second major challenge for telecommunication equity research is data availability. For example, in Australia, previous studies were never comprehensive enough to make a solid judgment on the equity implications of the NBN. The lack of meaningful data from the NBN was at the core of these evaluative shortcomings. Indeed, the only national analysis of the socio-economic patterns of the NBN rollout (Schram et al. 2018) relied on a dataset released in Dec 2016, which did not capture the complexity of the mixed-technology NBN, as no details concerning the full range of technological options for broadband provision were available at the time. Moreover, as we will elaborate on further (later in the paper), the data issues around the NBN are persistent regarding the final speed data. This blind spot means that the earlier bifurcated approach concerning the definition of ‘equity’ in the telecommunication domain in Australia remains unresolved.
It is essential to note that Australia is not the only place where a broadband rollout faces challenges. For example, in New Zealand, the federal government invested $1.35 billion (NZD) to roll out FTTP services (ultrafast broadband) in cities and towns with more than 10,000 residents to connect ∼80% of New Zealanders by 2019 (Beltrán 2012; Milner 2020). An additional $400 million (NZD) was invested in the Rural Broadband Initiative (RBI) to improve cellular coverage and xDSL throughout the country. However, even with these substantial national investments, broadband connectivity continues to lag throughout marginalized communities in New Zealand compared to their more urban counterparts. Nevertheless, the benefits of bringing broadband to underserved communities are clear – there is more economic activity, less inequality, and more productivity (Mack and Faggian 2013).
In the United States, similar conditions persist. Unlike Australia or New Zealand, the U.S. does not have a formal, national broadband network. Instead, the U.S. largely relies on private firms to invest, develop, and roll out broadband infrastructure (Ali 2021; Landgraf 2020; Mack and Grubesic 2014; Skiti 2020). There is also growing interest and activity in developing municipal and/or multistakeholder systems for communities – especially for locales with limited or poorly performing private broadband providers (Koch 2018; Whitacre and Gallardo 2020; Whitacre and Mills 2016). However, even with providers investing $78.1 billion (USD) in 2019, the urban-rural divide perseveres in the United States (Mack et al. 2021; Saperstein 2019). Rural areas with poor broadband availability and service see slower business growth, lower housing prices, and more inequality between business owners (Conroy and Low 2021; Conley and Whitacre 2020).
Telecommunication Data Challenges
A rapidly growing literature (Grubesic and Alizadeh 2019) focuses on global telecommunication data challenges. Specifically, pricing and quality-of-service measures are not publicly available in most markets worldwide. Worse, many of the available data (e.g., the fixed broadband deployment data provided by the Federal Communications Commission (FCC) in the United States) are highly uncertain, suffering from poor collection practices, spatial error and/or a lack of provider participation (Grubesic and Helderop 2022). The underlying issues concerning data uncertainty prohibit meaningful telecommunication planning research from supporting evidence-based policies and practices in a fast-changing world (Mack 2019).
More specifically, in the case of the NBN, previous research has pointed out that the secrecy around the rollout made it challenging to assess the progress of the national infrastructure project (Helderop et al. 2019; Pinnell 2017). Indeed, repeated freedom of information requests to release a handful of NBN-relevant internal reports to the public were denied (Schram et al. 2018). That said, the NBN Co. does provide some data. For example, they provided weekly rollout figures by technology at the state level in recent years, showing the progress of adoption (and coverage) of satellite, wireless, and aggregates for brownfield technologies (FTTN, FTTB, FTTC, HFC). The NBN Co. also provides financial updates every 6 months, annual reports, and annual 3-year corporate plans, like other government-owned agencies (e.g., Australia Post). In addition, in July 2020, for the first time, the NBN network map was released at data. gov.au (Australian Government 2020b) – providing the geospatial data required for analysis in this paper. However, the NBN Co. fails to provide information concerning customer satisfaction by the NBN technologies (though they collect this information), performance and/or speed test information per NBN technology and location, nor do they provide detailed information concerning their locational plans for network upgrades - only the suburb names of the proposed upgrade sites are released.
There are alternate sources for network performance information, such as Ookla’s Speedtest (Ookla 2021) – which provides broadband users a free service to test their network connection speed and makes this data available for researchers after it is aggregated and anonymized to a 600 sqm block of tiles (See, for example, Speedtest data at Ferrers (2022). Interestingly, per Ookla’s Speedtest, Australia ranks around 60th worldwide for Internet speeds.
The Australian government argues Speedtest data are not useful measures of broadband quality of service. More specifically, the NBN Co. relies on an Economics report (AlphaBeta 2019) to discredit Ookla Speedtest data. AlphaBeta (2019) suggests Speedtest data does not use subscription data, fails to account for the level of households with broadband access, nor does it account for population or geography. In short, the NBN Co. argues that one should not measure the NBN with a single metric, such as the average of all speedtests for the entire country. AlphaBeta says, "[their 13th place ranking] takes into account all broadband users, as well as broadband availability which are significant considerations in ensuring fair, equitable Internet access to all Australians” (p.17). Thus, the NBN Co., prefers to rank its performance on a weighted average of expected subscriptions (13th out of 37 countries) or the “current speeds available to the average person in each country” (AlphaBeta 2019, p.17) (17th out of 37 countries). This approach more favourably represents Australia’s approach to make NBN available to every premise, rather than as with the earlier HFC rollout made available only to more favourable demographic areas.
Regardless of how one reads into the details of the Australian Government’s claims against the Speedtest results and the counter-arguments (BCARR 2020), it is fair to say that the data challenges around the NBN continue to limit the scope of evidence-based research on the subject. In this paper, we rely on the recently released (in July 2020) data on the mixed-technology footprint of the NBN (Australian Government 2020b). We openly acknowledge that these data may not represent a clear indication of final speed. Further, given the limitations associated with Ookla’s dataset and the open disagreement of the Australian government concerning its utility as a measure of broadband quality, we have elected not to include the Speedtest data in this paper. That said, we are hopeful that the NBN’s recent release of their technology footprint data will expand in the future to include data concerning the realized broadband speeds of end-users.
Data and Methods
With the recent release of official NBN datasets detailing the spatial footprint of broadband technology across the nation (Australian Government 2020b), we focus our work on the entire country of Australia. We employed three datasets to explore the relationship between broadband technology, the socio-economic status of an area, and its relative regionality/remoteness: 1) The NBN spatial footprint data: The Department of Communications and the Arts (now called the Department of Infrastructure, Transport, Regional Development, Communications, and the Arts) publishes these data. They contain the spatial coverage of each of the NBN’s broadband technology types throughout Australia (NBN Co. Ltd. 2020). 2) The Accessibility and Remoteness Index of Australia (ARIA) dataset: These data divide Australia into one of five remoteness classes (major city, inner regional, outer regional, remote, and very remote) (ABS 2016c). These categories are assigned based on the area’s relative access to goods, services, and social interaction. 3) Socio-Economic Indexes for Areas (SEIFA) data: These data are produced by the Australia Bureau of Statistics and provide a relative metric of socio-economic advantage and disadvantage (ABS 2016b). There are four unique indexes, but we used only the Index of Relative Socio-Economic Advantage and Disadvantage (IRSAD), considered the most comprehensive index (the others each focus on education and occupation, economic resources, or disadvantage factors only).
In addition to these substantive datasets, we use a nationwide shapefile of Australia’s Statistical Areas Level 1 (SA1) polygons from the Australian Bureau of Statistics (ABS 2016a). For context, there are about 62,000 SA1 polygons in Australia, and each SA1 has a population of 400 people on average. While most SA1 have a population between 200–800 people, there are SA1 polygons with no permanent population (e.g., an airport) (ABS 2021). We use these SA1 polygons as the units of analysis, with the SEIFA data already corresponding to SA1 polygons. We assign each SA1 unit an ARIA remoteness value based on the majority ARIA coverage for that polygon. In most cases, a single ARIA type engulfed a given SA1 polygon. When that was not the case, we used the majority share rule for ARIA coverages.
The NBN data also does not map perfectly onto SA1 polygons. We use an apportioning method to assign the broadband data in these instances. For example, if a given SA1 polygon was 50% covered by FTTP and 50% covered by FTTN, we assigned that polygon values of 0.5 for each of those technologies and 0 for the other five types. We performed this process with a custom Python script that calculated the total intersection of each NBN technology type for each SA1 polygon. It is important to note that for a given SA1 polygon, the technology type coverages do not necessarily sum to 1. This outcome stems from occasional overlaps between technology types and some areas lacking any NBN coverage. Please note, however, that given the nature of satellite Internet coverage in Australia, this is unlikely to be the actual condition for any area. See Figure 1 for an example of this process. Most SA1 polygons do not have overlapping NBN technology coverage or gaps in coverage (as in Figure 1a, from Gold Coast). However, some SA1 polygons (usually towns surrounded by uninhabited rural areas) have coverage totals greater than 100%. Figure 1b, displaying an SA1 polygon from Maldon, has complete satellite and partial FTTN coverage. Meanwhile, Figure 1c, from West Ballina, has less than 100% coverage, likely because it contains extensive wooded areas.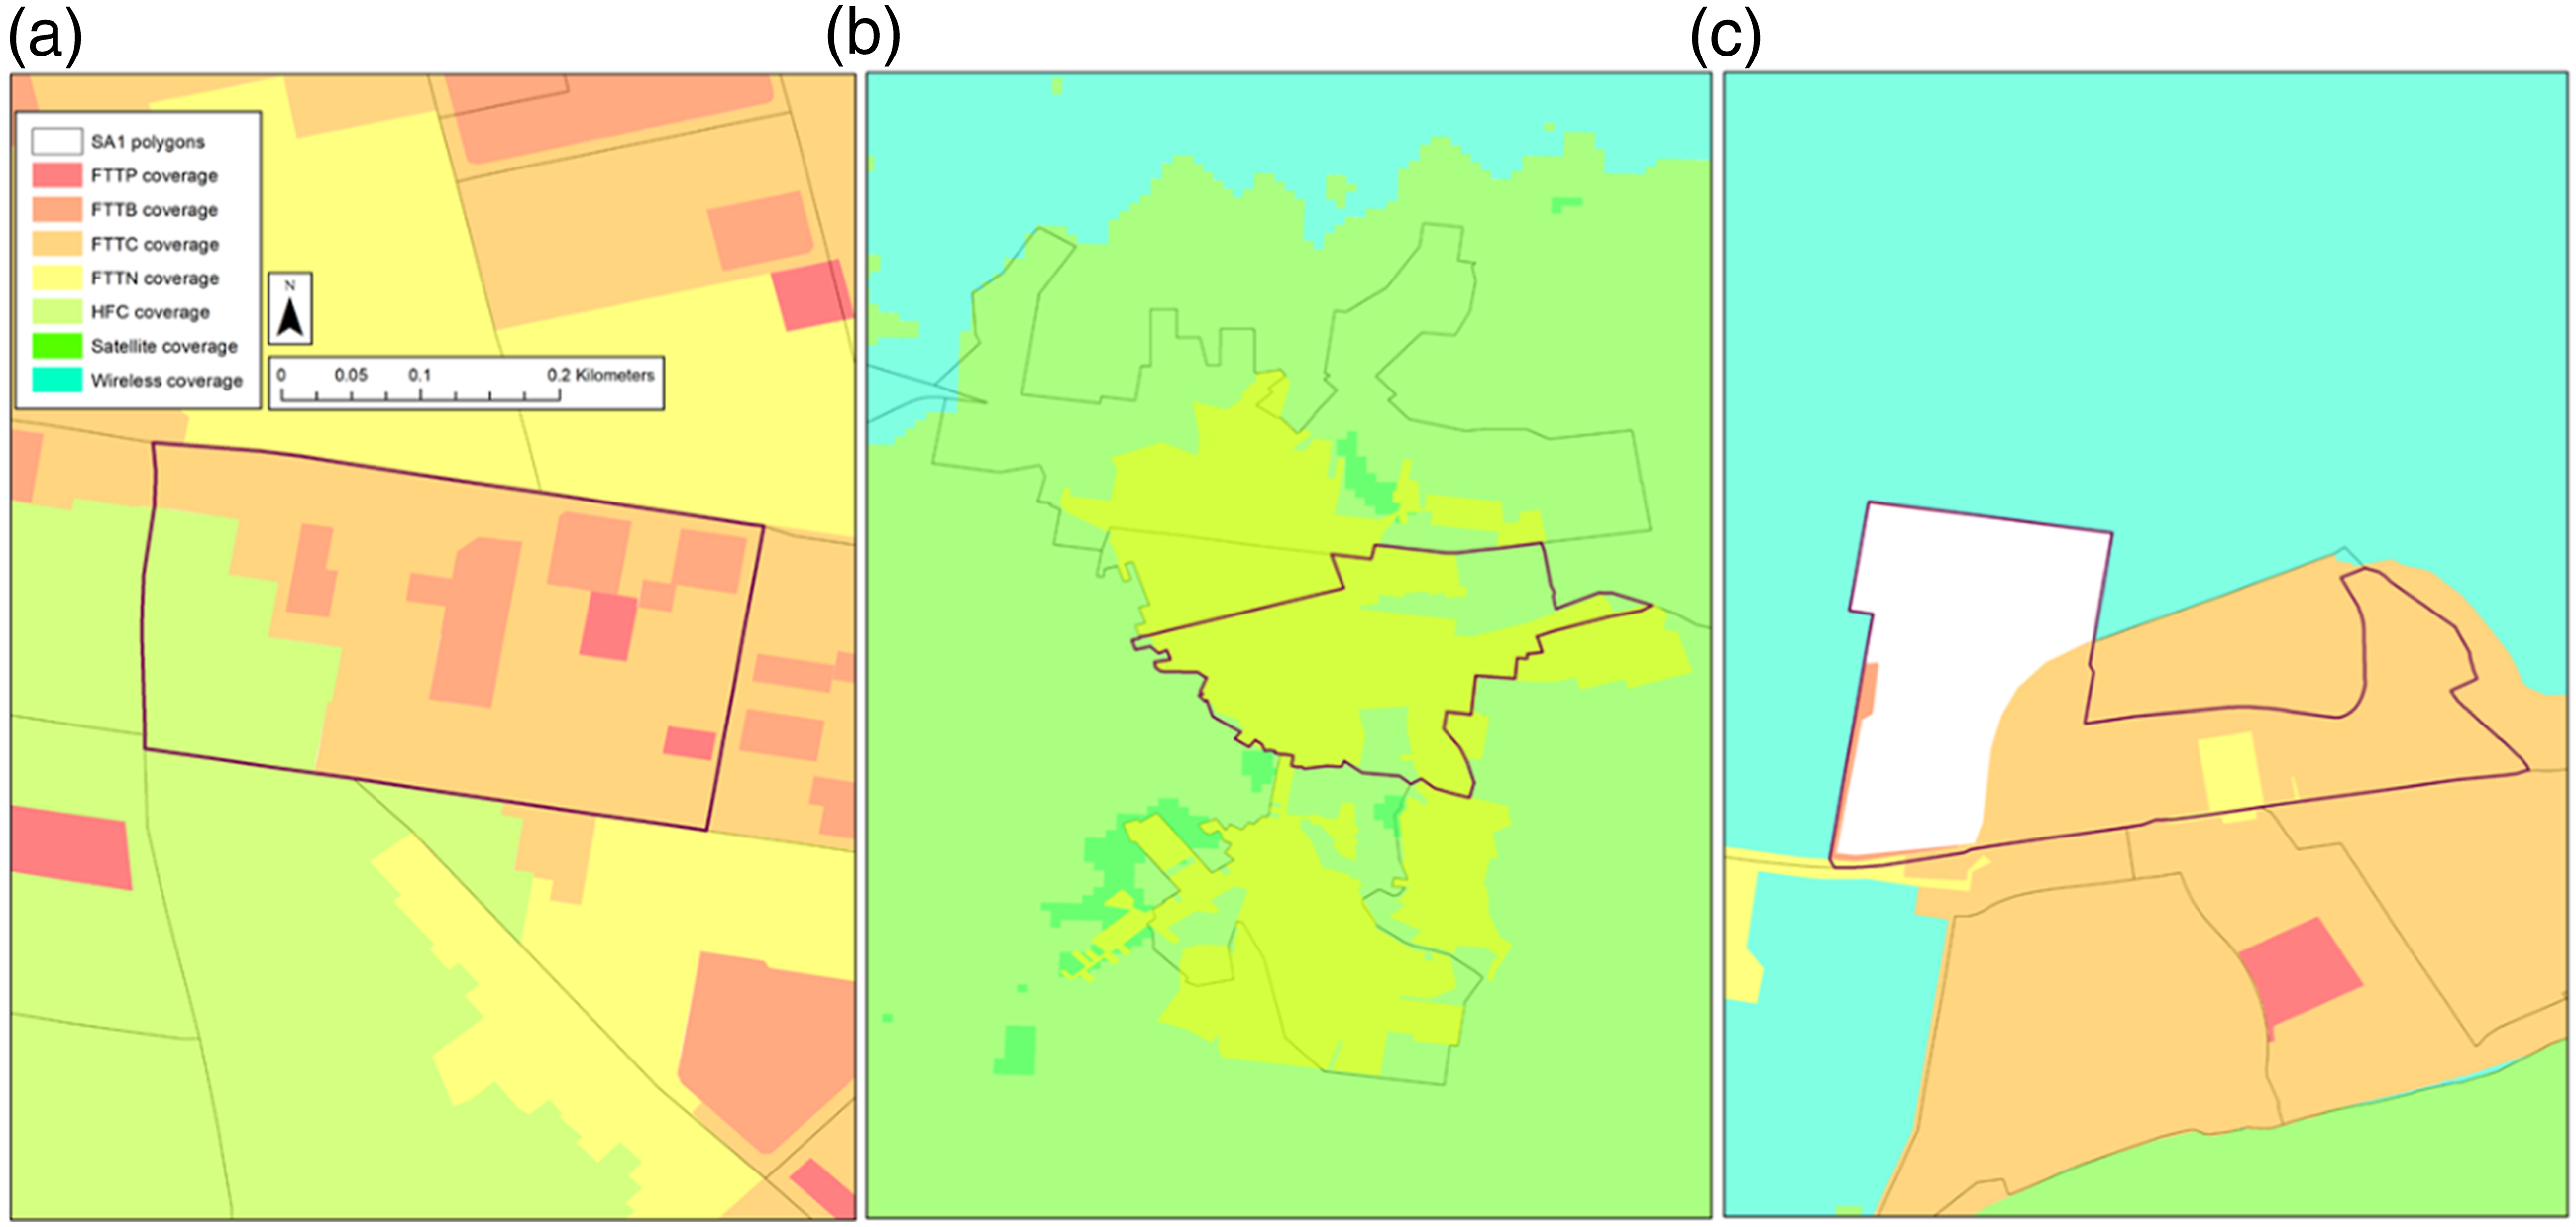
These datasets allowed us to generate basic summary statistics for NBN coverage across Australia. Although these details seem rudimentary, such metrics were impossible until the NBN released its footprint data in July 2020. We also use descriptive statistics for the ARIA classifications for each regionality/remoteness category. This combination of data allowed us to pursue more rigorous statistical testing that examines the relationship between an area’s relative advantage and the availability of different NBN technology types.
We accomplish this by building several spatially lagged regressions using the SEIFA relative advantage decile as an independent variable and the percent coverage of each NBN technology type as the dependent variables. In addition to exploring this relationship with each technology type individually, we built a separate model that grouped several of the ‘best’ NBN technologies (FTTP, FTTC, and FTTB) as a single FTTx category and used this as the dependent variable in the model. This strategy results in eight different regressions (one with each of the seven NBN technologies as the dependent variable and one with FTTx as the dependent variable). Basic ordinary least squares models showed significant spatial autocorrelation in the dependent variables, so we include a spatial lag variable to correct this autocorrelation. This type of spatial autocorrelation is not surprising – broadband technology is essentially always deployed to a contiguous area. Not finding spatial autocorrelation here would be a surprise, as it would essentially mean that the technology type available to a given household was entirely random (i.e., adjacent neighbours could have completely different broadband technologies). The spatially lagged variable corrects for this type of autocorrelation by accounting for the fact that neighbouring areas are likelier to share technology types. We use queen contiguity to generate the spatial weights matrix, and these regressions were all performed using the software package GeoDa.
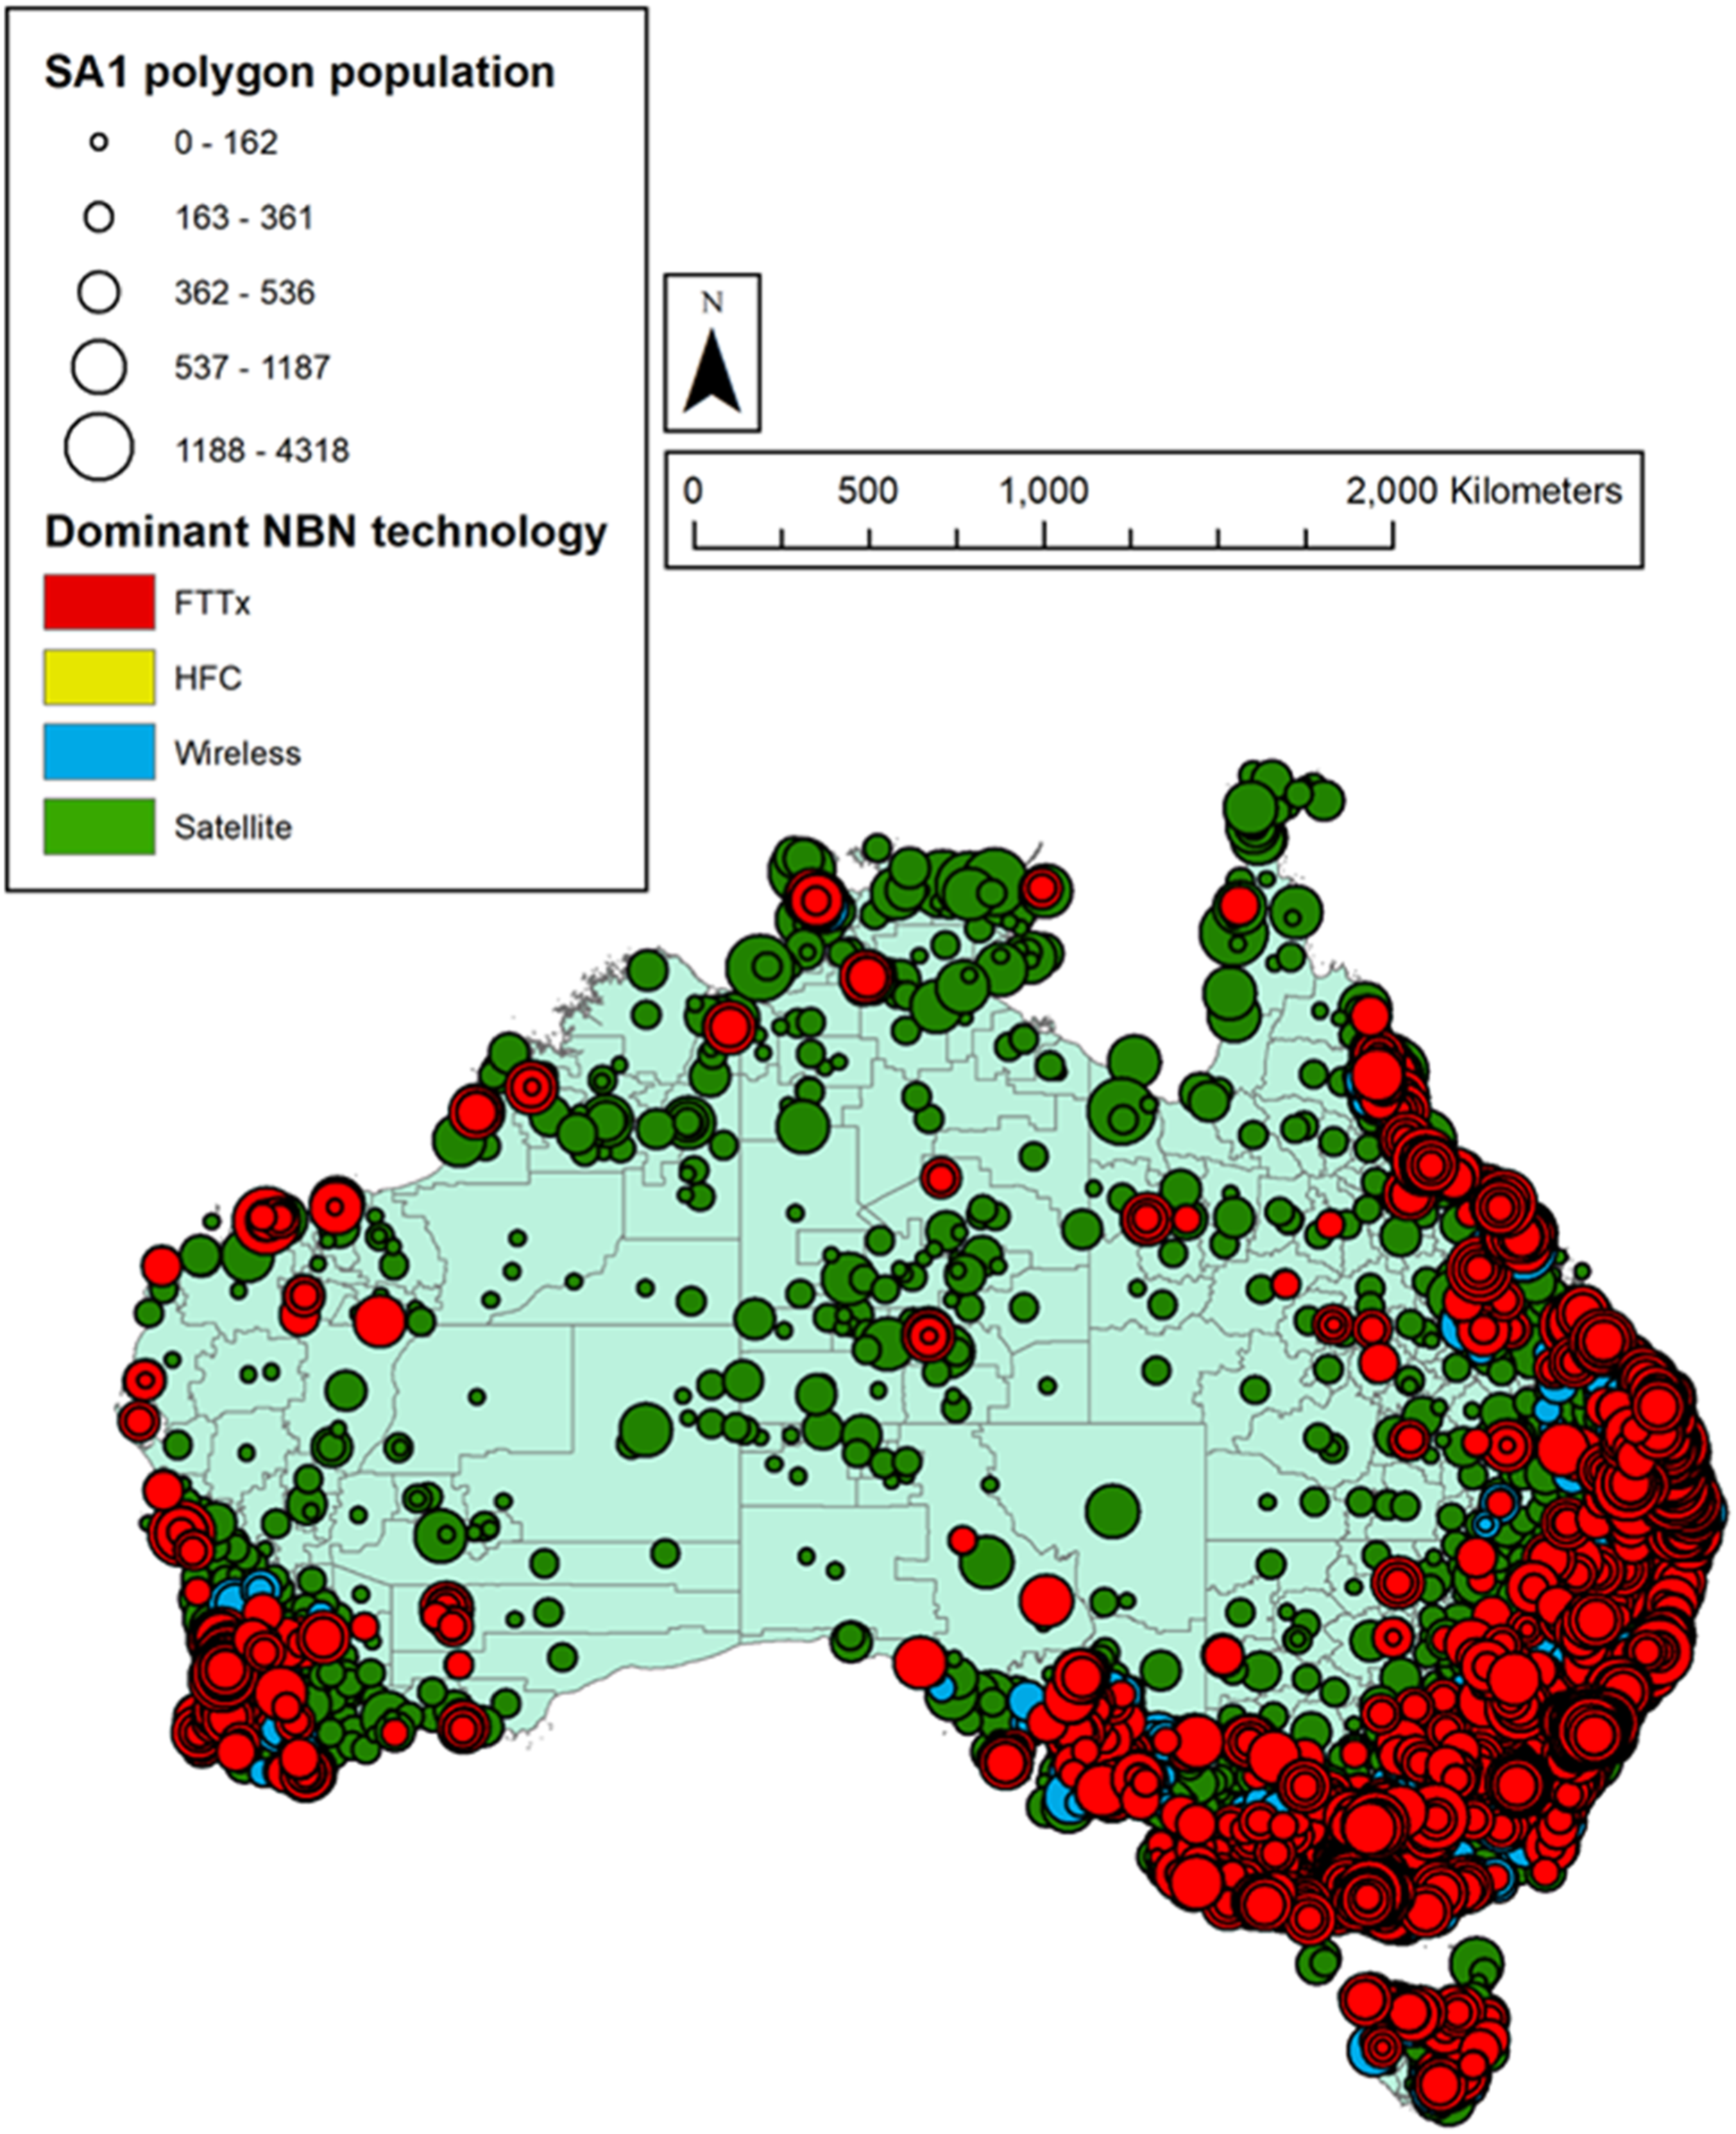
Readers should note that we base our analysis on the average NBN technology coverage for each SA1 polygon. This approach is different from an analysis that might examine the total areal coverage of each technology type. This choice is important because substantial swathes of Australia’s land are mainly uninhabited, lacking households, and the areal coverage from satellites is much larger in these areas than other NBN technology types. Ultimately, although it adds a layer of data complexity, it is important to generate broadband metrics on a per-household or per-capita basis, rather than by area. For a study such as this one, that encompasses densely populated, urban areas and sparsely populated rural regions, this distinction is particularly important.
For example, consider a situation where only two SA1 polygons exist in the study area. Polygon A occupies 100 square kilometres and has complete satellite coverage, with no other NBN technologies present. Polygon B occupies 1 square kilometre and has complete FTTP coverage, with no other NBN technologies present. From an areal standpoint, we would say that this study area (consisting of both polygons) is >99% satellite and <1% FTTP. However, by reporting the results as the average coverage per SA1 polygon, the results reveal a composition of 50% satellite and 50% FTTP. While this does not accurately represent areal coverage, it provides a higher fidelity estimate of the total population covered by each technology type since SA1 polygons contain roughly the same number of households/people overall (∼400 people). Thus, approximately half of the households have satellite access in this fictitious study area, while the other half have FTTP access. Overall, with most of Australia’s population living in dense, urban areas (as with virtually any country), reporting technology coverage as their average SA1 polygons results made more sense than reporting total areal coverage of those same technologies.
Again, this approach differs from some earlier work investigating NBN footprints – including efforts focusing exclusively on major Australian metropolitan areas (Alizadeh et al. 2020). While the earlier work mainly focused on highly-populated major cities, the current paper offers the first attempt at understanding the socio-spatial patterns of the NBN footprints across the entire nation. As a result, this analysis adopts alternative methods to capture how people – rather than land – have access to broadband infrastructure. In an ideal world, analysis would be performed using technology coverage at the individual household level. However, for this first study performed for the full country, this level of resolution was not required. Furthermore, it would require a full database of households and population for the entire country, and more importantly, a sufficiently spatially resolute database of NBN technology coverage. Without details on the spatial resolution of the recently released NBN footprint dataset, this level of detailed analysis was not possible.
Results: The NBN Footprint Across Australia
NBN Tech Footprint Across Australia.
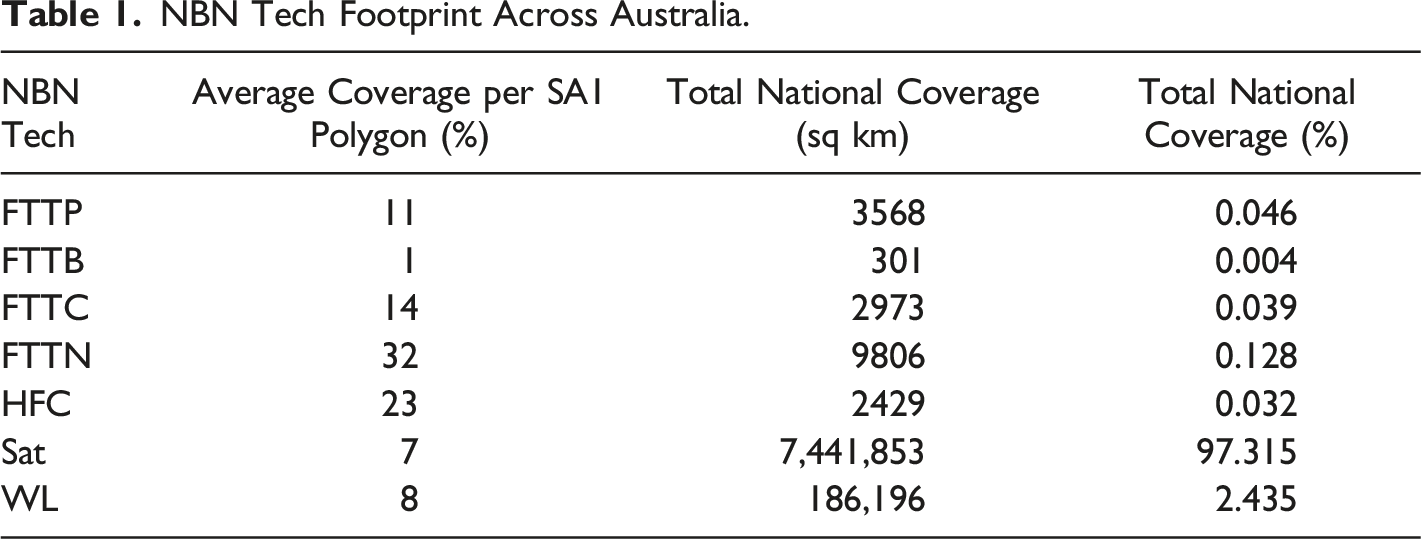
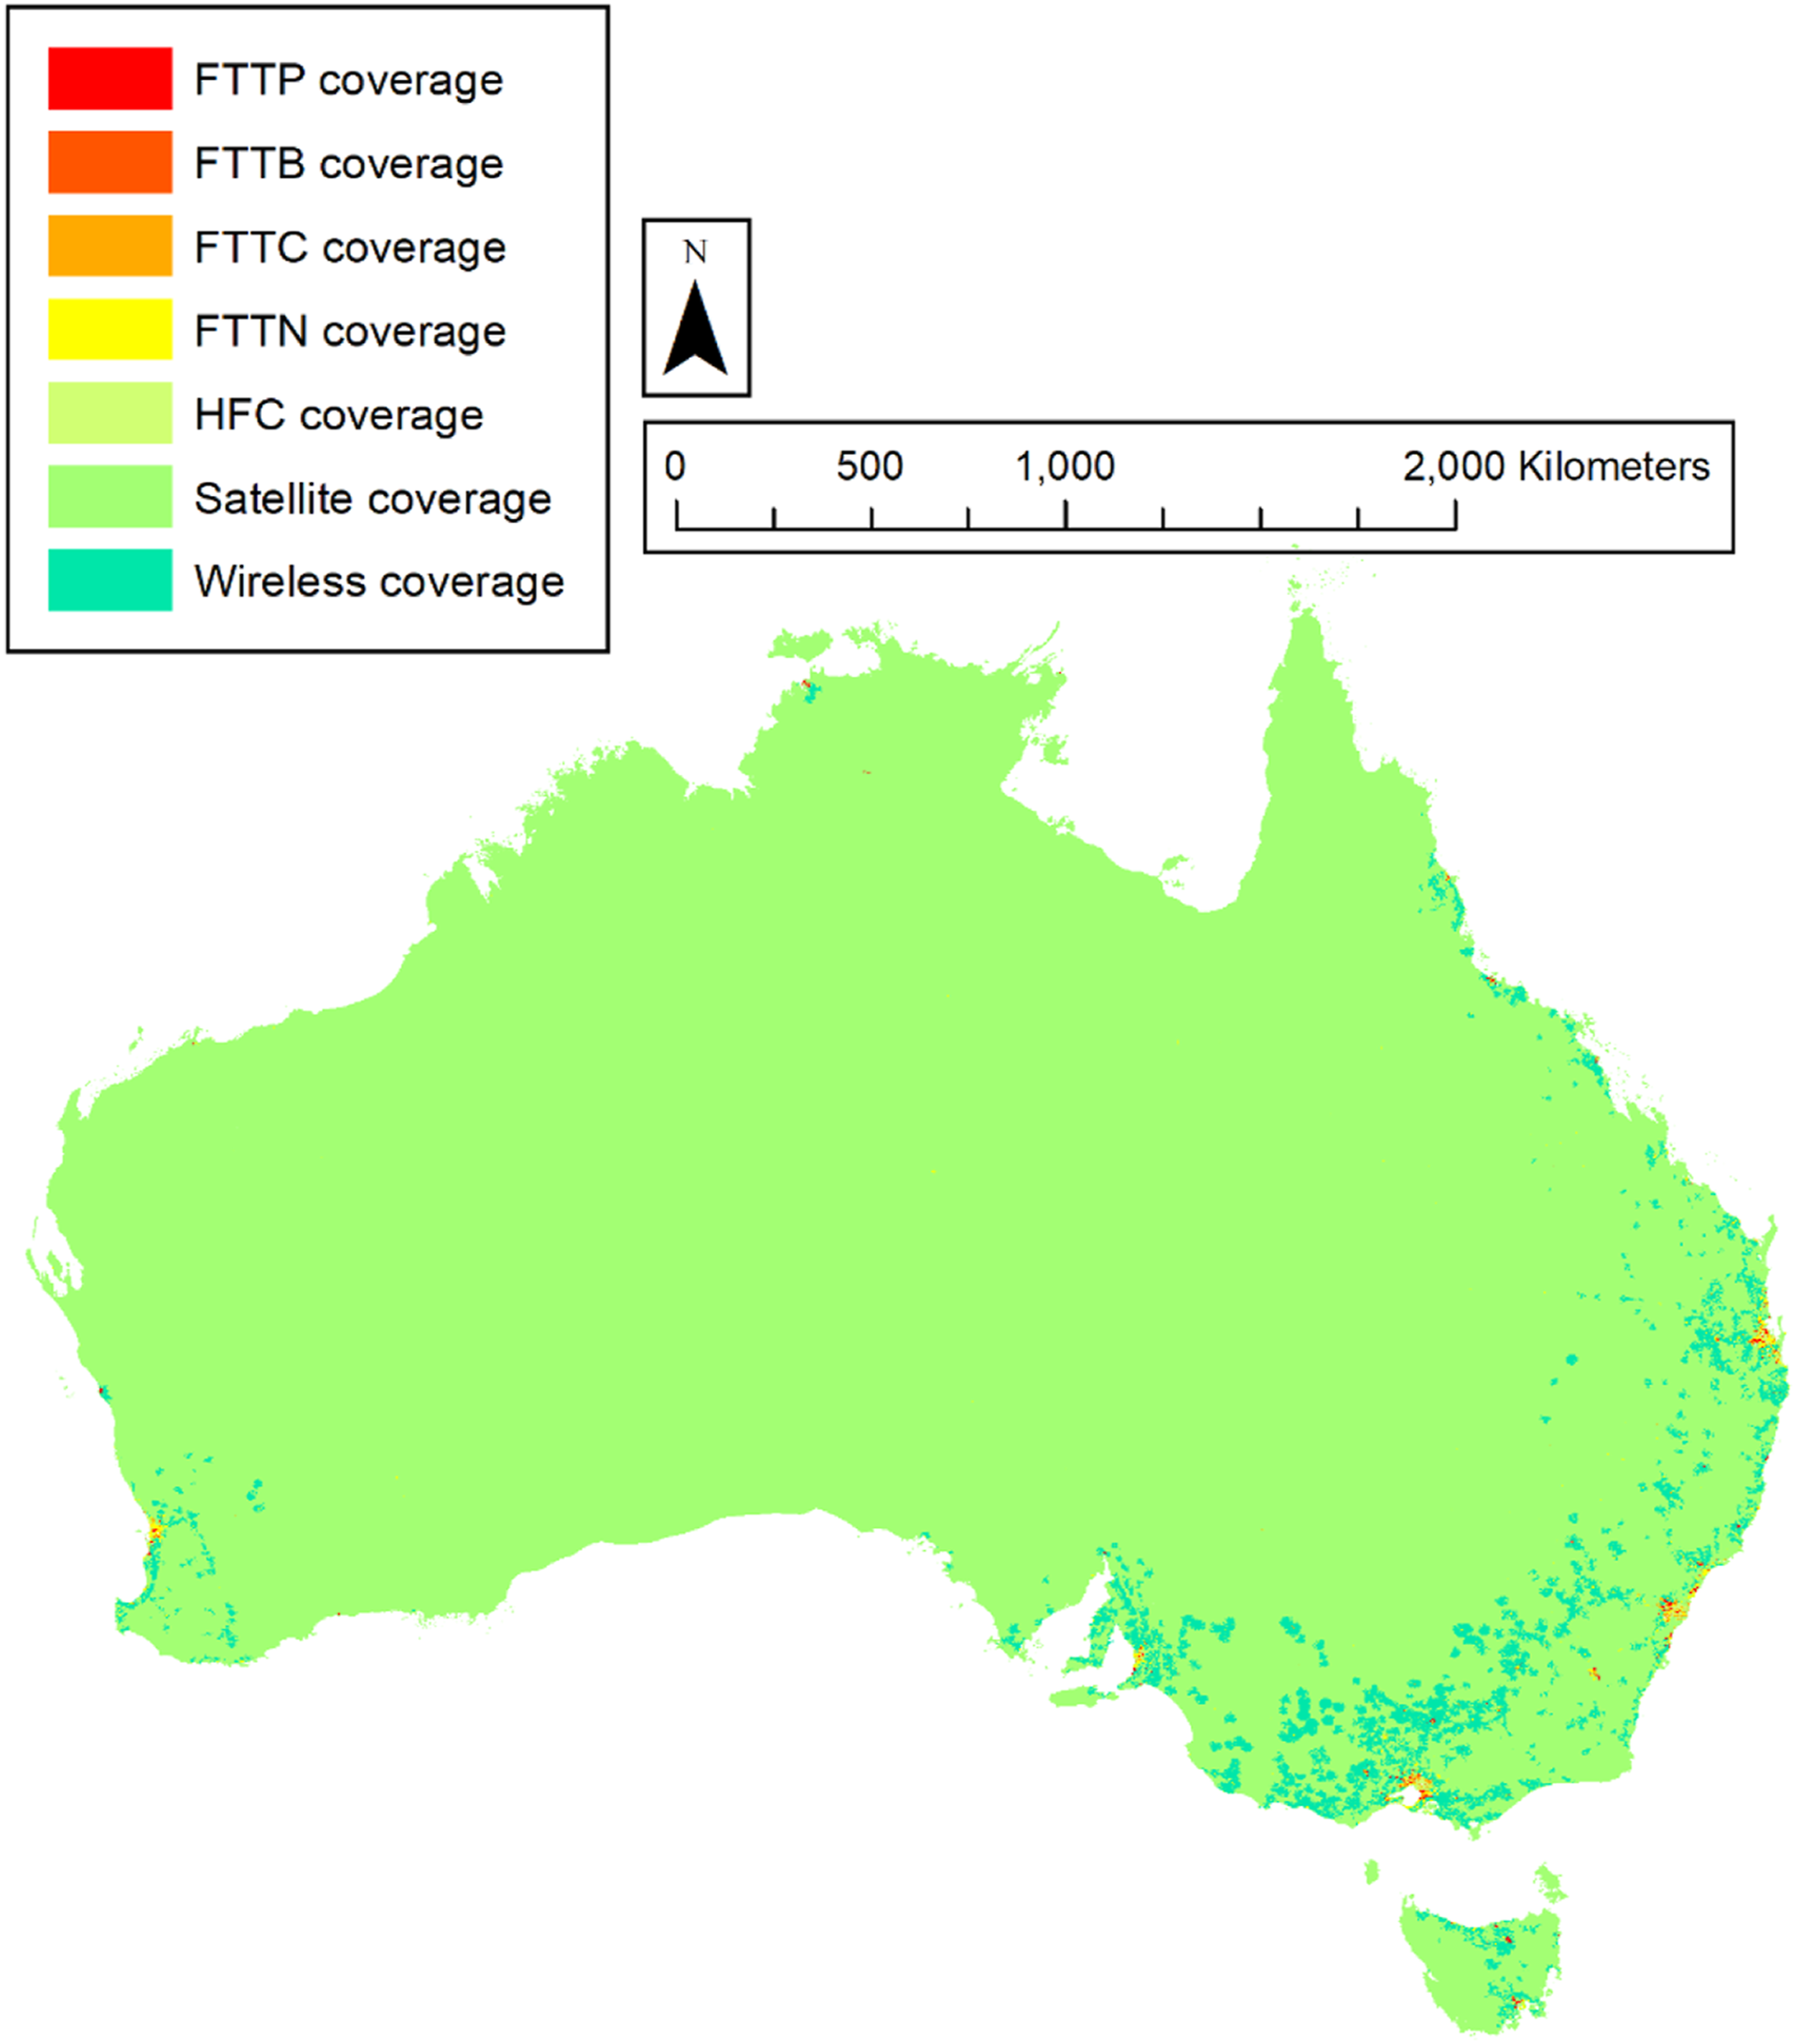
Total areal coverage of each NBN technology for Australia. Note the dominance of satellite coverage, with occasional pockets of FTTx and HFC denoting urban areas.
Total coverage of FTTx, HFC, wireless, and satellite NBN technologies in Australia. Note the coverage of FTTx in the highly populated urban areas versus the dominance of satellite broadband in the less dense regions.
FTTN and HFC cover 32% and 23% of the national network (average coverage per SA1 polygon). FTTP, which was supposed to provide access to 93% of the premises (nationally) in the original NBN plan, has been reduced to offer only about 11% average coverage per SA1 polygon. Finally, the NBN uses satellite and wireless platforms to cover 15% of the national network, more than twice the initial 7% estimate in the original NBN plan from a decade ago.
Furthermore, the coverage of FTTC is quite interesting – considering that this specific technological platform was only adopted mid-way through the NBN construction and mostly in response to the growing rate of customer complaints about HFC (Sas 2018). In other words, if it were not for the late adoption of FTTC into the mix, HFC would have been the most prevalent platform in the mixed-technology NBN, providing up to 37% of the network coverage for the Australian population.
Table 1 clearly shows a reduction in fiber delivery for the mixed-technology NBN compared to the original NBN plan. The use of inferior platforms (e.g., not FTTP) is a concern, especially when telecommunication infrastructure is essential for mission-critical activities. More importantly, delivering this mixed network at a blown-up cost to the public fund (Lane 2019a, 2019b) is also a concern. In this line of critical inquiries, it is not just the overall footprint of the NBN that is up for questioning. There are also concerns regarding equity, equality, and the underlying distribution of the NBN to varying socio-economic groups within the national network.
Urban-Regional Divide in the NBN
NBN Tech Coverage by ARIA Remoteness Categories at SA1 Level (%).
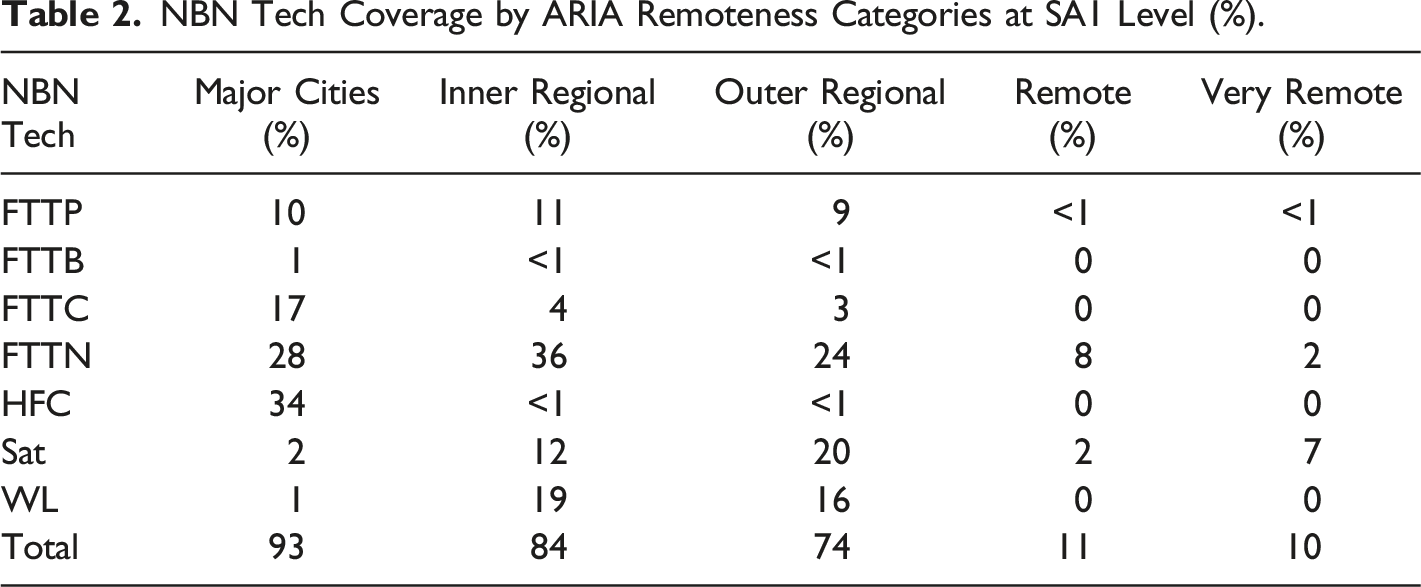
On the other hand, FTTP seems to have a similar (∼10%) coverage in major cities and inner and outer regionals. While the 10% coverage of FTTP is minimal and far from the best practice examples worldwide (Milner 2020), its mere existence suggests that the FTTP NBN may have provided new opportunities for a limited number of regional communities (both inner and outer).
Another clear indication of the urban-regional divide in the NBN footprint is the dominance of HFC in major cities only. Earlier studies (Alizadeh et al. 2020) show that 50% of the total area in the three capital cities of Sydney, Melbourne, and Brisbane relies on HFC. See Figure 4 for two examples of how the NBN technology footprint compares between urban areas. Again, while satellite dominates Australia from an areal perspective, we see significantly more variety in the NBN technology footprints present in urban areas. While the specific mix of technologies varies between cities, FTTC, FTTN, and HFC dominate most urban locations. Unfortunately, HFC is not the most reliable part of the mixed-technology NBN. Reporting from the Australian media supports this characterization, highlighting the challenging experiences of the HFC customers over the years (Kiernan 2017; Pearce 2019; Rowland 2021). NBN technology footprint in Perth and Melbourne. Urban areas in Australia contain a mixture of technology, including extensive FTTC, FTTN, and HFC. Many of the urban cores are where one finds near-universal FTTP coverage as well.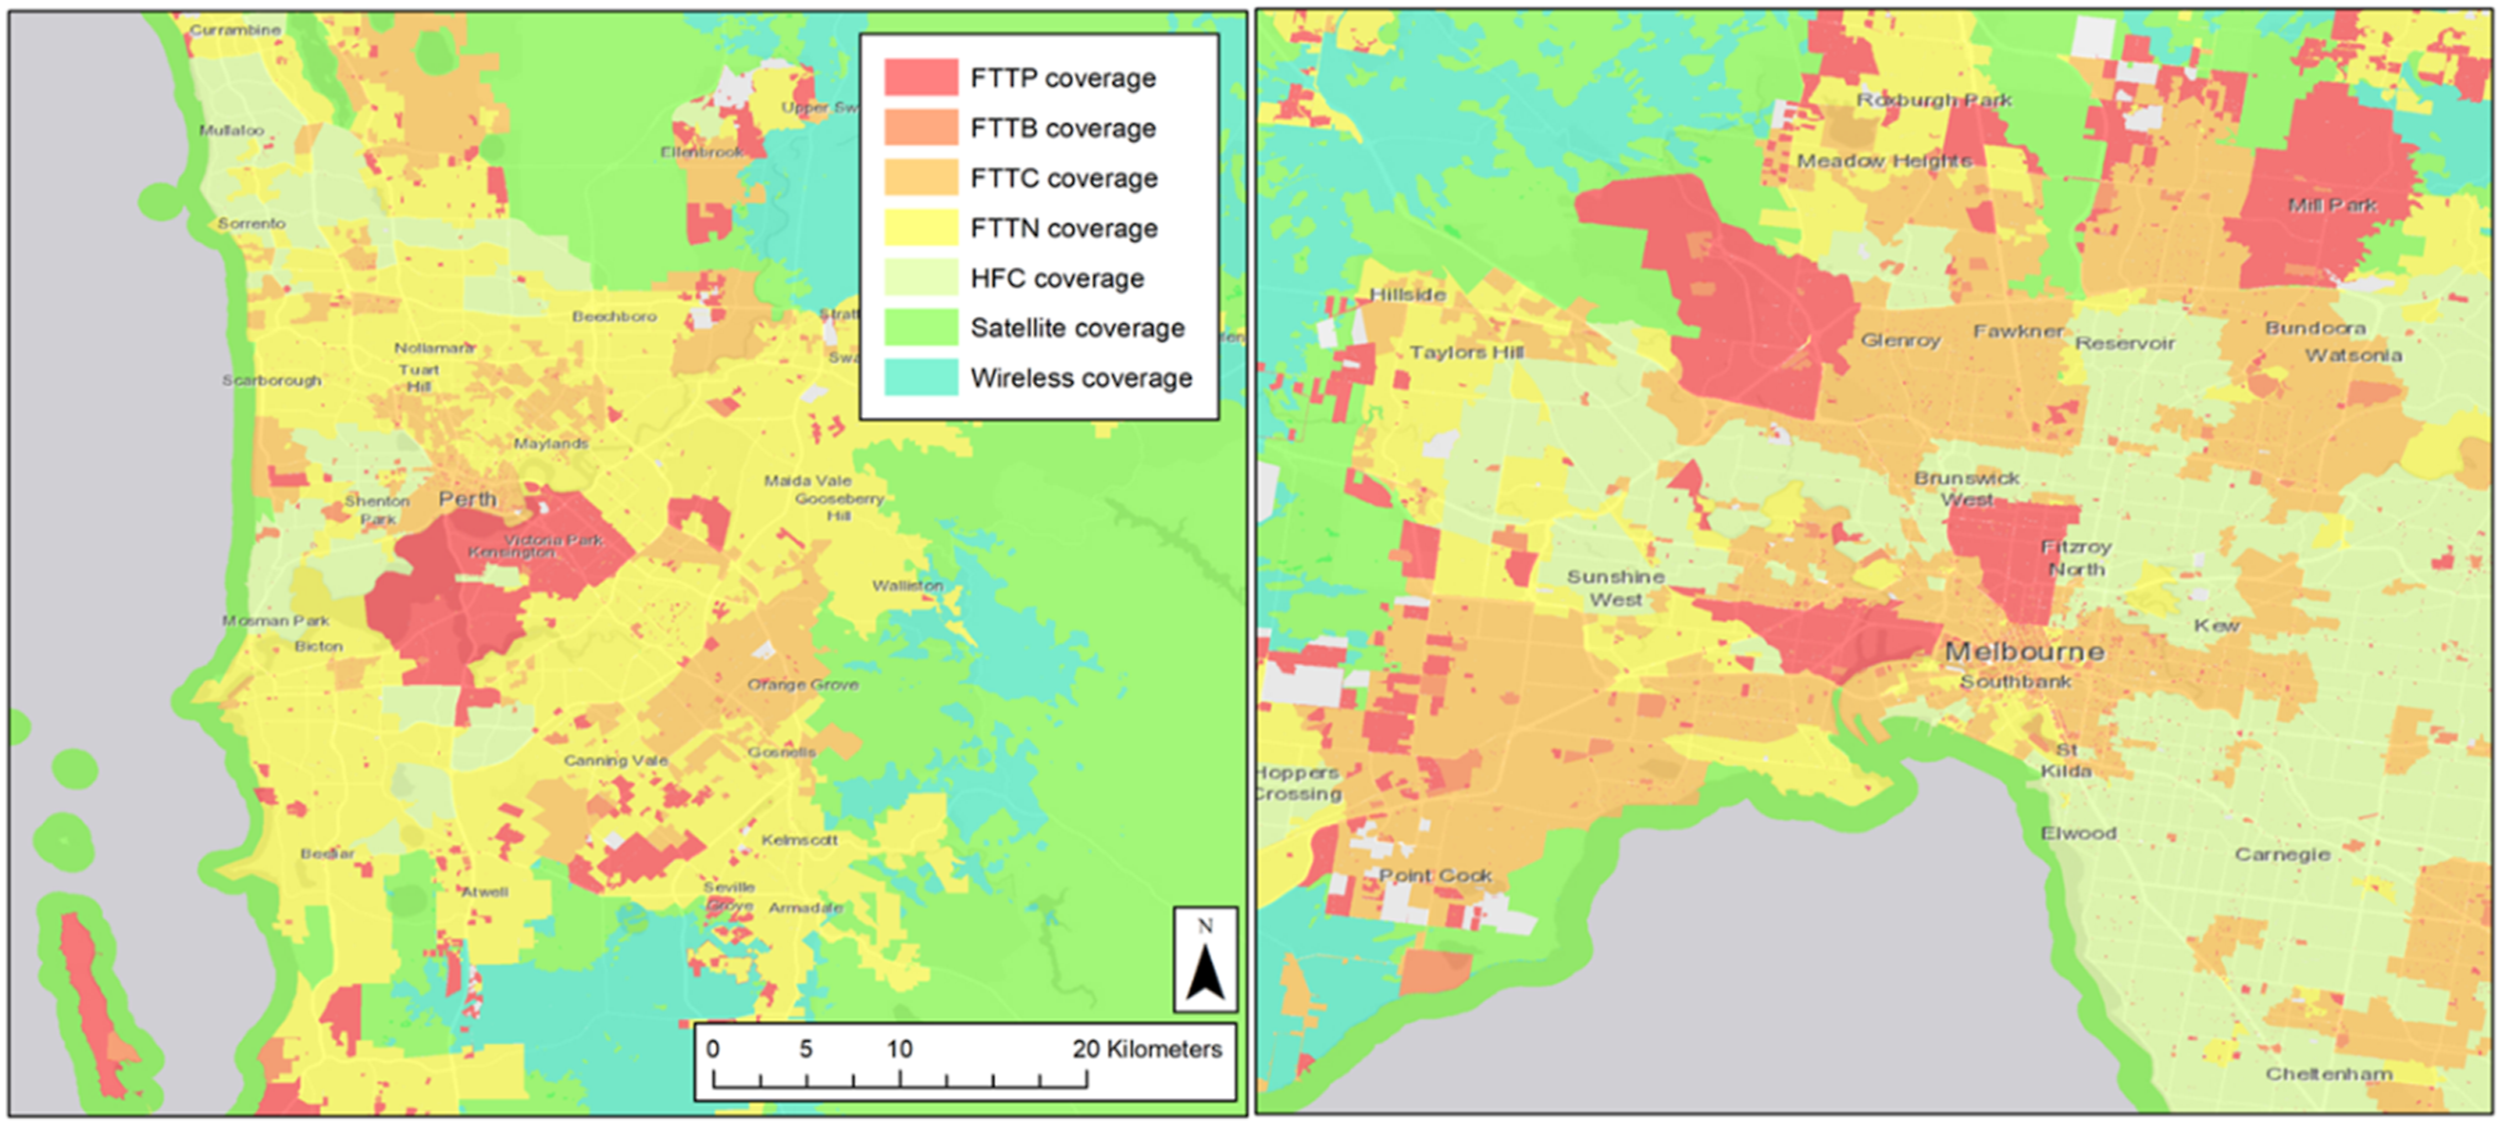
Table 2 suggests a bifurcated pattern of HFC versus FTTN at the core of the urban-regional divide in the NBN footprint across the nation. Later in the paper, we will focus on the policy responses to the bifurcated technological base of the NBN in urban versus regional Australia, which could potentially exacerbate or ease the broader urban-regional divide across the nation.
Socio-Spatial Patterns of the Urban-Regional Divide
NBN Tech Type by SEIFA Relative Advantage.
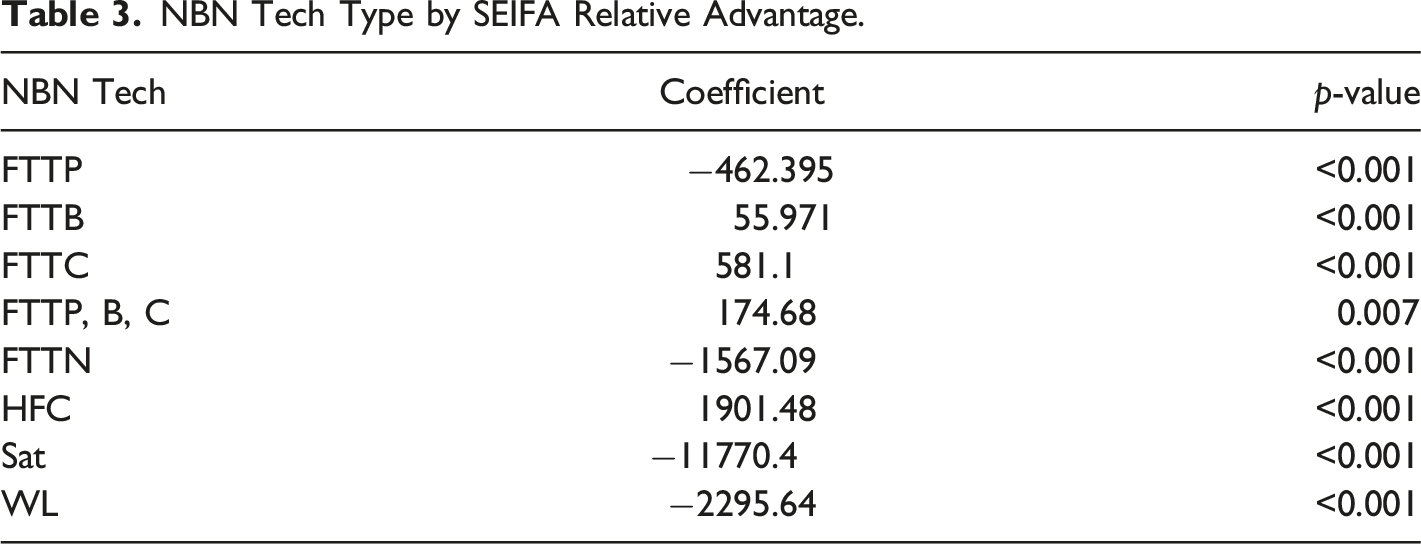
Conversely, satellite and wireless coverage dominate the lowest ranking areas in the SEIFA index of relative advantage and disadvantage, reflecting the broader socio-economic divide in urban-regional Australia. It is also concerning to see that FTTN, the most prevalent technology in the NBN outside the major cities, is negatively associated with relative advantages in SEIFA. This result contrasts with the socio-economic patterns of HFC, as the most prevalent technology available for the NBN in major cities.
The negative coefficient for the areas with higher FTTP coverage is perhaps more complex to interpret and may reflect the relatively equal distribution of this technology in major cities, inner regionals, and outer regionals (see Table 2). Nevertheless, when the three highest-performing technologies in the NBN (FTTP, FTTB, and FTTC) are combined, a positive coefficient suggests that quality telecommunication infrastructure across the nation skews towards advantaged communities. The rural-urban split reflects the physical realities of broadband deployment (that there are fixed infrastructure costs regardless of the number of households being connected) and so it is more economical to use wireless or satellite coverage in areas with lower population densities. Additionally, as knowledge work has come to dominate the economic sectors of most developed countries, including Australia, those same rural areas end up poorer. However, the ability to explain the correlation between broadband infrastructure and socioeconomic advantage within cities (i.e., when comparing areas of roughly similar density) is much more challenging, and largely not possible from this type of analysis. Many factors influence broadband deployment, and many of them are very local – local politics (Clark et al. 2003), the presence and type of existing infrastructure (Asgarirad and Jahromi 2020), and even the material that the local roads are made of (Verbrugge et al. 2015), among many others. Without similar ancillary datasets for Australian cities, it is irresponsible to speculate on the motivations behind the deployment decisions made by the NBN. Nevertheless, despite the relative simplicity of these models, this type of exploratory analysis can demonstrate that patterns do exist, even if the specific causes behind them are as yet unknown.
Recent NBN Upgrades – Policy Implication
Critiques of the NBN’s shortcomings, especially its MTM approach, have usually been met with an official line of response from the Australian Government, which acknowledges the need for ongoing upgrades. Accordingly, the promises of NBN upgrades are mostly welcome. However, questions remain about the scale of upgrades needed, their geospatial patterns, and socio-political implications. More specifically, this paper focuses on the latest three rounds of upgrades announced in September 2020, August 2021, and May 2022 (partially in response to COVID) to evaluate their implications for the urban-regional divide elaborated earlier in the discussions.
First, in September 2020, a joint media release by Minister for Finance and Minister for Communications, Cyber Safety, and the Arts announced an additional $4.5 billion NBN investment to bring ultra-fast broadband to millions of families and businesses and create 25,000 jobs (Australian Government 2020a). The announcement indicated that the $4.5 billion network investment plan would give up to 75% of fixed-line premises “across regional and metropolitan Australia” access to ultra-fast broadband – up to 1 Gigabit per second (Gbps) – by 2023. The creation of 25,000 jobs was particularly celebrated as a substantial “contribution to Australia’s COVID-19 economic recovery”. Details of the announced NBN upgrade include a) capacity upgrades on the HFC network to support the availability of up to 1 Gbps speeds to all customers on this technology and b) taking fibre deeper into neighbourhoods serviced by FTTN technology, enabling ‘on-demand’ fibre upgrades and speeds of up to 1 Gbps.
Second, in Aug 2021, a new media statement was released indicating that 300,000 more homes and businesses – in selected suburbs and towns – became eligible for the NBN fibre upgrade (NBN Co. Ltd. 2021a). While the NBN’s intention to extend fibre deeper into the communities seems positive, this is entirely in line with the Sept 2020 announcement (above), as premises currently served by the FTTN become eligible for ‘on-demand’ FTTP upgrades and wholesale download speeds close to 1 Gbps. These latest announcements take the total number of those eligible for ‘on-demand’ upgrade to 1.4 million premises across the nation. It was also announced that the FTTN to FTTP network upgrade program aims to enable up to 2 million premises to access Home Ultrafast (up to) gigabit speeds (FTTP). The media statement (NBN Co. Ltd. 2021a) acknowledges that NBN Co’s area selection criteria for the FTTN to FTTP upgrade program focus on areas where the company anticipates strong demand for higher speeds.
The above two NBN upgrades make clear and quite ambitious promises in terms of the HFC network - ‘all’ on this technology - and yet only ‘some’ on the FTTN can access ‘on-demand upgrades'. This constraint, combined with the geospatial footprint of HFC and FTTN across the nation, is cause for concern. As illustrated earlier in the paper, HFC is primarily limited to the major cities whose residents have been promised ultra-fast broadband in the above two NBN upgrade announcements. However, FTTN recipients, scattered across the nation but mostly outside the major cities, have been offered an ‘on-demand’ upgrade option in the areas where the NBN Co. acknowledges that higher-speed and reliable broadband is needed. The upgrade announcements and information provided via the NBN Co. website are still ambiguous regarding the potential cost involved. Early estimations suggest pricing could vary based on the upgrade complexity in each location and the proximity to existing NBN infrastructure. There have been reports of close to $28,000 for a single on-demand FTTN to FTTP upgrade (Wiwatowska 2021). Other reports indicate the possibility of free fibre upgrade for eligible FTTN users if they sign up to access the highest-speed service, with relatively modest financial penalties for those who downgrade within the first 12 months (Crozier 2021a). Most importantly, not everyone on the FTTN is eligible for the upgrade (only two million households of the total 4.7 M FTTN households); there are already concerns raised that eligibility criteria for on-demand upgrades are unclear (Crozier 2021b).
This bifurcated approach in the two above NBN upgrade promises has the potential to improve service quality for many metropolitan cities yet leaves the regions with an on-demand upgrade option. However, this gap could only exacerbate the existing urban-regional divide across the nation. It also runs counter to the original promise of the NBN, which was supposed to bring more opportunities to isolated communities.
Last but not least, the 2022 Federal Election (21 May 2022) was the latest opportunity for the two sides of Australian politics to showcase their approach to broadband equity. The ruling Coalition government plan focused on (1) delivering the promise for 75% of fixed-line premises to access gigabit speeds, including 2M FTTN premises, and (2) pointed to further funding from the Regional Telecommunications Review to improve black-spot mobile funding and improve wireless NBN through use of 5G technology (Liberal 2022; NBN Co. Ltd. 2022). The opposition Australian Labor Party shadowed many Liberal policies, including the recommended improvements of the Regional Telecommunications Review, but they went further with investing in upgrading more FTTN premises, a plan entitled “Fixing the NBN” (Labor 2022a). Labor promises an additional 1.5 M FTTN premises will be upgraded on-demand to FTTP, lifting to 90% the proportion of the 4.7 M FTTN premises able to upgrade to FTTP on-demand. They also note that 660,000 of these premises will be in the regions (Labor 2022b). It is unclear how many of these regional premises are in excess of premises that the Coalition plan would upgrade. The Coalition’s approach is a cost-cautious strategy to upgrade the NBN, leaving 25% of premises unable to access the fastest NBN speeds. Labor, in contrast, is prepared to spend an extra 25% to reach far more FTTN premises (90%) but leaves the most expensive 10% for a later solution. Labor matches the regional upgrades recommended in the Regional Telecommunications Review, showing a commitment not to alienate regional voters, who are not Labor’s traditional constituency. Despite the ongoing politicization of telecommunication debates in Australia, we welcome the shift in the policy towards regional upgrades which could potentially ameliorate the existing urban-regional divide across the nation.
Conclusion
Our analysis sheds light on the urban-regional divide in telecommunication infrastructure across Australia. Interestingly, this divide is not just about access and quality of service. The divide also manifests in variations between technological platforms and their availability in different parts of Australia. Specifically, there is a bifurcated pattern of HFC versus FTTN in urban versus regional locales. As a result, statistical testing of the socio-economic patterns of the NBN technologies across the nation returns mixed outcomes. However, the results confirm that the highest quality telecommunication infrastructure – available via fibre-heavy FTTP, FTTC, FTTB platforms – skews toward more advantaged communities.
Most importantly, the results of this paper critique or assess the implications of the policy responses in recent times – in the form of updated plans for the national infrastructure project. While two of the three latest NBN updates heavily skew in favour of HFC recipients in the major cities, we welcome the latest shift in telecommunication policy towards a regional upgrade. Hopefully, the recently elected Labor Federal Government will follow through with their telecommunication policy announcement to alleviate the persistent urban-regional divide in telecommunication across Australia.
More broadly, the discussions offered in this paper are relevant to many cities/countries worldwide struggling to achieve telecommunication equity. COVID exposed gaps in telecommunication infrastructure and pushed many governments to increase their telecommunication expenditure in response to the crisis. We hope this paper encourages further research on the hidden implications (e.g., urban/regional divide) of telecommunication infrastructure decisions during times of crisis.
Footnotes
Declaration of Conflicting Interests
The author(s) declared no potential conflicts of interest with respect to the research, authorship, and/or publication of this article.
Funding
The author(s) received no financial support for the research, authorship, and/or publication of this article.