
Abstract
Using the instrumental stakeholder theory lens, we examine how generic competitive strategies influence the link between stakeholder management (SM) and firm financial performance. We develop a framework that highlights the synergistic effects of a differentiation strategy on SM but also the trade-offs between a cost leadership strategy and SM in their consequences for financial performance. We test our theoretical mechanism further by distinguishing between primary and secondary stakeholders, who differ in their degree of firm specificity and instrumentality. We propose that for firms pursuing a low-cost competitive advantage, secondary SM intensifies the trade-offs between SM and financial performance when compared with primary SM, whereas both primary and secondary SM are likely to improve financial performance for differentiators. Empirical analyses using a panel data set of S&P 500 firms over a 15-year period (2005–2019) and a series of robustness tests support our predictions. Our findings highlight important boundary conditions for SM's impact on firms’ financial performance and highlight not only “when SM pays” but also “when SM may not pay.”
Keywords
The fall from favour of Danone's purpose-driven chief. Ousting of Emmanuel Faber underlines the challenge of pursuing profits and ESG goals.
—Financial Times, March 16, 2021
The past decade with its unprecedented challenges has brought into sharp focus the tension between achieving social and financial ends for businesses (Financial Times, 2021; Lynn, 2021). Adam Smith's observation that “the candidates for fortune too frequently abandon the paths of virtue; for unhappily, the road which leads to the one, and that which leads to the other, lie some times in very opposite directions” (Smith, 1759/1976: 63) rings true to this day. There is a renewed scholarly interest to move beyond “inductive moral empiricism” and a futile search for “universally applicable findings” (Lynn, 2021: 521–523; Margolis & Walsh, 2003; Wang, Dou, & Jia, 2016) and examine contingencies to better understand “when does it (not) pay to be good.” The recent ouster of Danone CEO Emmanuel Faber (Financial Times, 2021) highlights the need and urgency for research that underlines the potential trade-offs (Vogel, 2005).
Stakeholder theory has been quite valuable in providing a theoretical basis for this inquiry (see reviews by Laplume, Sonpar, & Litz, 2008; Parmar, Freeman, Harrison, Wicks, Purnell, & De Colle, 2010; Wang, Gibson, & Zander, 2020). Within stakeholder theory, an instrumental variation (Donaldson & Preston, 1995; Jensen, 2002; Jones, 1995) has identified a number of boundary conditions for stakeholder management (hereafter SM) to be associated with higher financial performance and shareholder value (Dixon-Fowler, Slater, Johnson, Ellstrand, & Romi, 2013; Garcia-Castro & Francoeur, 2016; Kim, Kim, & Qian, 2018; Russo & Fouts, 1997; Sharma & Starik, 2002; Wang & Choi, 2013). 1 Within this stream, there is a growing interest in understanding how the competitive strategies pursued by firms influence the financial consequences of SM (Barney, 2018; Zollo, Minoja, & Coda, 2018). Berman, Wicks, Kotha, and Jones’s (1999) study is one of the earliest to explore the interaction effects of competitive strategies and SM, using data from 81 U.S. firms. Asking whether stakeholder commitment is intrinsic or instrumental, their study reports evidence for some significant interaction effects between different types of strategies and stakeholder relationships. More recent work (Barney, 2018; Zollo et al., 2018) has theorized why certain combinations of competitive, growth and SM strategies have the potential for creating higher financial value, though these arguments have not been empirically tested yet. Our article adds to this line of inquiry by theorizing and testing how a firm's generic competitive strategies—low cost and differentiation—influence the financial value addition potential of SM. Our goal is to examine not only when the interaction effects between competitive strategies and SM are likely to be positive but also when they could be negative. In addition, building on research that highlights stakeholder heterogeneity (Garcia-Castro & Francoeur, 2016; Hillman & Keim, 2001), we explore how such heterogeneity influences the interaction between SM and competitive strategies. Specifically, we address (a) when SM is likely to be synergistic with competitive strategy and when it is likely to involve trade-offs or negative synergies and (b) how these effects differ between primary and secondary stakeholders, and we provide rigorous empirical evidence for these effects.
Building on instrumental stakeholder theory (Donaldson & Preston, 1995; Jones, 1995), we theorize that there are indeed trade-offs between SM and a firm's financial performance when firms pursue competitive advantages based on a low-cost strategy, whereas SM offers synergies and strengthens financial performance when firms pursue a differentiation strategy. SM involves higher costs (Garcia-Castro & Francoeur, 2016; Jones, Harrison, & Felps, 2018), and the inherent logic of a low-cost-based competitive advantage (translated into low prices) makes it difficult to pass them on to the customers. Hence, a simultaneous pursuit of SM and a cost-based competitive advantage is likely to weaken financial performance. On the other hand, a differentiation advantage, with its focus on fulfilling the unique needs of customers, brand building, and eliciting a higher willingness to pay from customers (and a premium pricing strategy), has a synergistic effect on SM and improves financial performance. Further, we disaggregate SM into two components based on its focus on primary and secondary stakeholders, who differ in their degree of instrumentality for financial value addition (Clarkson, 1995; Garcia-Castro & Francoeur, 2016; Jones, 1995). 2 We propose that secondary SM intensifies the trade-offs between SM and financial performance when compared with primary SM for firms with cost-based competitive advantage. However, firms with a differentiation advantage are able to derive synergistic benefits from both primary and secondary SM as they are able to recover the higher costs of secondary SM through their ability to command premium prices.
We test our predictions using a longitudinal panel data set of S&P 500 firms from 2005 to 2019 (15 years) with 5,032 firm-year observations. 3 Our findings indicate that SM combined with a differentiation advantage boosts financial performance both directly and in the case of primary and secondary SM. For cost leaders, we do not find evidence for a direct negative effect of SM on financial performance. However, we find that a combination of secondary SM and cost-based competitive advantage negatively affects financial performance, whereas primary SM has a positive effect. This finding indicates that, for cost leaders, the negative effect of secondary SM could be canceling the positive effect of primary SM, thereby resulting in an overall insignificant effect. We perform several robustness checks, as well as Heckman-2SLS models that combine two-stage Heckman selection method with the two-stage least squares instrumental variable (2SLS IV) models (Liu, Shao, De Sisto, & Li, 2021), to corroborate our results.
Our article makes important theoretical and empirical contributions to the stakeholder literature with instrumental focus. We theorize the critical influence of generic competitive strategies on how stakeholder management impacts financial performance and, further, based on whether it is focused on primary or secondary stakeholders. Put together, our theory highlights not only “when SM pays” but also “when SM may not pay.” We extend prior works on the interaction between stakeholder and competitive strategies (e.g., Berman et al., 1999) by examining not only when the interaction effects are positive but also when they are negative and, further, by disentangling the distinct performance effects of primary and secondary SM. Our study thus adds to the literature on the “contingencies” of the SM-performance link (e.g., Garcia-Castro & Francoeur, 2016) by examining the contingent role of competitive strategies and their differential effects on primary and secondary SM. While SM may create overall value for stakeholders, understanding when it may have negative financial consequences is also important, as CEOs and the top management teams are primarily held accountable for a firm's financial performance. 4 Empirically, our study offers rigorous, large-sample evidence using 15-year longitudinal data and addresses the multiple sources of endogeneity that afflict many stakeholder studies (Barnett & Salomon, 2012; Liu et al., 2021).
In the next section, we describe our theory and develop the hypotheses. We then describe our data and methods and report our empirical findings. We conclude by discussing our results and by highlighting the key implications and limitations of our research.
Theory and Hypotheses
Strategy and Stakeholder Management
Quest for sources of sustainable competitive advantage and performance variance among organizations defines the field of strategic management (Rumelt, Schendel, & Teece, 1991). This search for the determinants of sustainable superior performance has generated a large body of research over the years that emphasizes the importance of generic competitive strategies and valuable resources, routines, and capabilities (Barney, 1991; Miller, 1988; Porter, 1980, 1985; Rivard, Raymond, & Verreault, 2006; Spanos & Lioukas, 2001). Developing and sustaining a distinct competitive advantage stemming from low cost or differentiation results in superior rents and financial performance (Dess & Davis, 1984). Such competitive advantages are generated and sustained by valuable and inimitable resources and capabilities (known as resource-based view), which also serve as sources of growth for firms (Barney, 1991; Penrose, 1959).
Though the stakeholder concept has its origins earlier (Carroll, 1979; Markley & Harman, 1982; Rhenman & Stymne, 1965), Freeman (1984) is arguably the first to fully articulate a stakeholder theory and its relevance to strategic management. Despite the original strategic focus, a section of stakeholder research subsequently has argued for stakeholders to be viewed as ends in themselves and not as means to an end (Goodpaster, 1991; Laplume et al., 2008; Weitzner & Deutsch, 2019). An instrumental approach (Donaldson & Preston, 1995; Jones, 1995) forms the foundation for most strategy research given the field's core focus on achieving superior firm performance (Barney, 2018; Bridoux & Stoelhorst, 2016; Freeman, Harrison, Wicks, Parmar, & De Colle, 2010; Harrison, Bosse, & Phillips, 2010; Jones et al., 2018). Effective SM, which refers to “management practices that reflect awareness of and response to the legitimate concerns of the multiple constituencies of the corporation” (Post, Preston, & Sauter-Sachs, 2002: 20), is likely to generate competitive advantages and hence superior financial performance (Choi & Wang, 2009; Harrison et al., 2010; Hart & Ahuja, 1996; Hillman & Keim, 2001; Luo & Bhattacharya, 2006; Porter & Kramer, 2006; Richard, 2000; Russo & Fouts, 1997).
Prior research has suggested a number of pathways by which SM generates value for all stakeholders, including shareholders (Hillman & Keim, 2001; Laplume et al., 2008). Good stakeholder relationships are a valuable resource that can help firms achieve and sustain a performance advantage (Choi & Wang, 2009) and enhance a firm's capacity to generate shareholder wealth over time (Post et al., 2002). By avoiding opportunistic relationships and building trust with stakeholders (Heugens, Van Den Bosch, & Van Riel, 2002), a firm is able to gain stakeholder loyalty, positive reciprocation and key information and knowledge held by stakeholders (Harrison et al., 2010; Jones et al., 2018). Improved stakeholder relations also help firms reduce firm risks and transaction costs (Jones et al., 2018; Ortiz-de-Mandojana & Bansal, 2016; Post et al., 2002). Among the stakeholders, primary stakeholders (such as employees, suppliers, customers, and shareholders), characterized by more firm-specific relationships, are likely to generate more value and are associated with superior financial performance when compared with more widely defined stakeholder groups (i.e., secondary stakeholders) (Garcia-Castro & Francoeur, 2016; Hillman & Keim, 2001). For multinational firms, stakeholder-based strategies are likely to mitigate the liabilities of distance and foreignness when expanding internationally (Marano, Tashman, & Kostova, 2017). Put together, this body of work has been able to highlight the critical role of stakeholders in the various stages of the value creation process and the likelihood of SM to be associated with an improved financial performance, though the empirical evidence on this link has been mixed (Laplume et al., 2008).
Costs of SM and the Contingent Effect of Competitive Strategies
Recent SM research has underlined its costs and the specific “contexts” (Jones et al., 2018: 380) and “contingencies” (Garcia-Castro & Francoeur, 2016: 410; Lynn, 2021) when the costs of SM could outweigh the benefits. Highlighting a “sunny-side bias” displayed by the field (Jones et al., 2018: 372), this work stresses the need to pay more attention to the costs of developing stakeholder relationships along with their benefits (Barnett & Salomon, 2006; Garcia-Castro & Francoeur, 2016; Harrison & Bosse, 2013). Some key contingencies and boundary conditions identified by prior research include geographic and institutional context (Gupta, Crilly, & Greckhamer, 2020; Marano et al., 2017; Wang & Qian, 2011), industry factors (Baird, Geylani, & Roberts, 2012; Garcia-Castro & Francoeur, 2016; Russo & Fouts, 1997), firm innovation (Garcia-Castro & Francoeur, 2016; Hull & Rothenberg, 2008), type of stakeholder relationships (Barnett, 2007; Bridoux & Stoelhorst, 2014; Jones et al., 2018; Jones, Felps, & Bigley, 2007), and stakeholder synergies (Tantalo & Priem, 2016).
The generic competitive strategies pursued by a firm constitute one such important contingency determining SM's effect on financial performance (Berman et al., 1999; Zollo et al., 2018). 5 Competitive strategies pursued by different firms can be captured parsimoniously by the two generic strategy categories: differentiation and cost leadership (Porter, 1980, 1985). A differentiation strategy involves creating a competitive advantage by providing unique and distinctive products or services for customers, thus creating demand inelasticity and a higher willingness to pay, whereas a cost leadership strategy aims to achieve the lowest cost position in the industry through cost efficiencies and create an advantage for customers through low prices (Brandenburger & Stuart, 1996; Miller, 1988). Given that the value-creation-and-capture process is distinct for different competitive strategies, the financial consequences of high stakeholder management would be different for firms pursuing different competitive strategies.
Berman et al. (1999) was one of the first studies to present empirical evidence on these arguments even though the focus of this study was on testing the instrumental versus normative models of stakeholder orientation. Using data from 81 U.S. firms, this study reports some significant interaction effects between various stakeholder relationships and competitive strategies without delving into possible trade-offs. In a recent conceptual paper, Zollo et al. (2018) identify bundles of competitive, growth, and stakeholder strategies that are likely to create higher value for all stakeholders. Specifically, they argue that a combination of integrated stakeholder strategy with differentiation advantage and arm’s-length stakeholder strategy with low-cost advantage creates higher value. In another conceptual paper, Barney (2018) underlines the critical link between all stakeholders by arguing that without nonshareholder stakeholders providing the resources needed to generate economic profits, there will be no superior rents for shareholders.
Our article seeks to integrate this prior work on the joint effects of competitive and stakeholder strategies with a focus on both positive as well as negative synergies and provide rigorous empirical evidence for these effects. Specifically, we examine when competitive strategy is likely to have a synergistic effect with SM to improve financial performance (as in the case of differentiation strategy) and when it is likely to result in trade-offs, thereby undermining financial performance (as in the case of cost leadership strategy). We also add further nuance by distinguishing these effects between primary and secondary stakeholders. While prior work has highlighted the heterogeneity between primary and secondary stakeholders (Clarkson, 1995; Garcia-Castro & Francoeur, 2016; Hillman & Keim, 2001), few studies examine how the financial consequences of competitive strategies vary between different types of stakeholders.
Synergistic Effects of a Differentiation Strategy and SM
Synergy is the ability of two or more activities or entities to generate greater value together than apart (Goold & Campbell, 1998). We expect at least three types of synergies between SM and a differentiation strategy (each enhancing the other) that will strengthen the positive association between SM and financial performance for firms with a differentiation advantage. First, in addition to the existing sources of differentiation advantage for a firm, such as unique industrial design, technology, innovation, identifying and serving the unique needs of customers, and so on, SM serves as an additional lever of differentiation. A differentiation strategy typically leads to higher costs compared with an average player in the industry but still yields superior margins due to higher product prices the customer is willing to pay (think Whole Foods). Using the same underlying logic, firms pursuing a differentiation advantage are likely to derive a higher customer value from SM so that any additional costs of SM may be more than offset through premium pricing (Zollo et al., 2018). Take for example the Body Shop, a well-known beauty products company. The main source of differentiation for the Body Shop traditionally valued by its customers is that its products are manufactured using skin-friendly, natural ingredients, but the company's stakeholder-oriented policies and its decision to source only cruelty-free, fair-trade raw materials further enhance its differentiation advantage and premium pricing ability (www.thebodyshop.com). Due to innate logic and the ability to recover higher costs through premium pricing, a differentiation strategy enables SM and vice versa.
Second, stakeholder management strengthens the various sources of advantage for a firm pursuing a differentiation strategy and its ability to implement it. A firm's ability to generate a differentiation advantage relies on critical resources provided by stakeholders (Barney, 2018). SM leads to a “close relationship capability” with stakeholders, which in turn leads to reciprocation, commitment, and support by stakeholders for effective implementation of the differentiation strategy (Harrison et al., 2010; Jones et al., 2018: 373). As Wang and Qian (2011: 1175) point out, “Stakeholders will respond more positively when they are aware of such activities, so firms with more visibility, such as those advertising heavily . . . have the most to gain.” Strong and trustworthy relations with employees and suppliers may prompt them to willingly share knowledge and bring in innovations that strengthen the differentiation advantage (Choi & Wang, 2009; Harrison et al., 2010; Heugens et al., 2002). For example, Steinway & Sons is committed to making craft pianos (as opposed to mass-produced ones) aimed at satisfying the needs of virtuoso piano performers. It nurtures long-term relationships with the virtuoso pianists and artists, who provide advice and feedback for the firm to improve its technology and quality. This helps the firm to develop its unique capability and identity as an innovative craft piano maker, which forms a virtuous cycle and serves as the heart of its differentiation advantage (Cattani, Dunbar, & Shapira, 2017).
Finally, the likelihood of stakeholder synergies and complementarities is higher when firms pursue a differentiation advantage (Garcia-Castro & Francoeur, 2016; Tantalo & Priem, 2016). Firms are motivated to “manage for stakeholders” (Harrison et al., 2010: 60) in the presence of stakeholder synergies—when a strategic action can create value for multiple stakeholders simultaneously, thereby satisfying different stakeholder groups without trade-offs (Garcia-Castro & Francoeur, 2016; Tantalo & Priem, 2016). For example, caring for employees could lead to more motivated workforce, which in turn would give rise to better-designed and higher-quality products, thus generating a higher perceived value in the minds of the customers. A similar value creation logic could motivate firms to invest in supplier capabilities, which could help improve the quality of inputs and raw materials and ultimately product quality and customer satisfaction that can result in higher product prices, superior financial performance, and better returns to shareholders. British-Dutch multinational Unilever's philosophy of environmental protection and sustainable development appeals to environmentally sensitive stakeholders, which in turn helps the company win new customers, brand loyalty, and community support. Further, innovations resulting from stakeholder management will facilitate product differentiation, which together provide new sources of value creation and strengthen firm performance (Vishwanathan, van Oosterhout, Heugens, Duran, & Van Essen, 2020). For all these reasons, we expect the joint effects of a differentiation strategy and SM to be synergistic and positive on firm performance. Hypothesis 1: A differentiation-based competitive advantage has a positive influence on the relationship between SM and firm financial performance.
Trade-Offs Between Cost Leadership Strategy and SM
Trade-offs exist when there are negative synergies between two or more activities or entities. We posit that negative synergies exist between a cost leadership strategy and SM such that their joint effect is likely to be negative on firm financial performance. The first and foremost reason for this stems from the very foundational logic upon which a low-cost competitive advantage is built. A cost leadership strategy enables the firm to charge very low prices and still enjoy superior profits due to its lower costs compared with the rest of the industry (think McDonald's). The core value proposition for customers in the case of low-cost strategy is a low price, which necessitates achieving the lowest cost position in the industry (Porter, 1985). While pursuing this strategy, firms need to be the absolute cost leaders, and those that do not have the lowest cost position are vulnerable to price competition (Brandenburger & Stuart, 1996). Therefore, “cost leadership strategy does not, by definition, allow for recovery of stakeholder integration efforts through increasing price levels” (Zollo et al., 2018: 1763). When a firm pursues SM and a low-cost strategy simultaneously, most of the value created by the firm accrues to nonshareholder stakeholders, including customers (who get a low price), leaving less for shareholders as captured by financial performance measures (Coff, 1999; Garcia-Castro & Aguilera, 2015).
We now outline a number of trade-offs between SM and cost leadership strategy, which together underscore our core argument that a simultaneous pursuit of the two is likely to negatively impact financial performance. The pursuit of a cost leadership strategy leads to more constraints on SM than a differentiation strategy in that it allows only those practices to be deployed that improve productivity and lower costs. But the costs of many SM activities are not offset by productivity gains: “If investing in stakeholders had no attached costs to the firm, then all firms would do so” (Garcia-Castro & Francoeur, 2016: 409; Harrison et al., 2010). Such costs involve direct economic resources as well as indirect ones, such as the time required to interact with and prioritize stakeholders (Bettinazzi & Zollo, 2017). Such constraints may at best lead to an arm’s-length relationship with stakeholders (Zollo et al., 2018). On the other hand, developing a close relationship capability requires continuous and significant investments in integrating various stakeholder interests into strategic decisions, which runs counter to the goal of achieving a low-cost position. For example, cost-focused firms are less likely to adopt industry-leading practices for environmental protection, employee compensation, or payments to suppliers as they may increase costs and jeopardize their core value proposition to their customers.
It is hard for firms to balance between high stakeholder investments and the goal of achieving cost leadership because the pursuit of one weakens the other, thereby affecting the overall firm performance. These potential conflicts between the goals of maximizing SM and achieving a low-cost advantage lead to the conclusion that their simultaneous pursuit is negatively associated with financial performance. Hypothesis 2: A low-cost-based competitive advantage has a negative influence on the relationship between SM and firm financial performance.
Distinguishing the Effects of Primary and Secondary SM
The heterogeneity among stakeholders in terms of their salience or degree of instrumentality has been highlighted in multiple ways: internal and external stakeholders (Freeman, 1984; Hawn & Ioannou, 2016), primary and secondary stakeholders (Clarkson, 1995), and stakeholders’ capacity for power, legitimacy, and urgency (Mitchell, Agle, & Wood, 1997). While it is not easy to delineate “the boundaries of legitimate stakeholders . . . nor (determine) the weights to be attached to the interests of each stakeholder” (Bird, Hall, Momentè, & Reggiani, 2007: 190), Jones (1995) and Clarkson (1995) provide the rationale for distinguishing primary and secondary stakeholders based on contract and transaction cost theories. Primary stakeholders are those “without whose continuing participation the corporation cannot survive as a going concern” (Clarkson, 1995) and are contractually more bound to the firm (Jones, 1995). SM studies have typically considered shareholders, employees, customers, and suppliers as primary and examined the financial performance consequences of SM using primary stakeholders (for example, Barney, 2018; Bridoux & Stoelhorst, 2014; Choi & Wang, 2009; Coombs & Gilley, 2005; Garcia-Castro & Francoeur, 2016; Hillman & Keim, 2001). On the other hand, firms have weak contractual obligations with secondary stakeholders (Jones, 1995), and their transactional engagements are also not very deep (Clarkson, 1995). From an instrumental stakeholder point of view, they consist of a wider group of stakeholders who are not primary (Hillman & Keim, 2001). Primary stakeholders serve more of an “enlightened self-interest” when compared with secondary stakeholders (Jones et al., 2007: 145). Resources and capabilities that are more firm specific are likely to create more financial value (Barney, 2018; Coff, 1999), and primary stakeholders can be considered to be more firm specific than other stakeholders (Garcia-Castro & Francoeur, 2016). There is considerable empirical evidence in support of this view that investments related to primary stakeholders as against secondary stakeholders lead to increased financial performance (Berman et al., 1999; Garcia-Castro & Francoeur, 2016; Hillman & Keim, 2001).
We further decompose SM into primary and secondary SM and examine their consequences depending on the generic competitive strategies pursued by a firm. We have argued earlier that SM, in general, has negative performance implications for firms pursuing a cost leadership strategy, due to its inherent logic of low-price-driven competition and due to the presence of trade-offs between the two. Extending this logic, a secondary SM is likely to hurt cost leaders even more than a primary SM approach. This is because firms’ practices and activities seeking to address secondary stakeholder issues may not carry immediate instrumental benefits and cost the cost leaders even more, thereby magnifying the potential trade-offs. For example, activities such as support for community development and protection of human rights and the environment result in additional costs, which cannot be passed on to the customers by cost leaders due to their competitive logic of low-price advantage.
Firms respond to pressures from their most salient stakeholders (Mitchell et al., 1997). Cost-leader firms are under greater pressures from investors and financiers to reduce additional costs, particularly arising from investments in secondary stakeholders, such as addressing social issues. On the other hand, investing in primary stakeholders, such as employees, suppliers, and customers, may result in some economic benefits, which may include higher productivity, lower procurement costs, and higher sales, which may offset some of the costs and reduce the negative impact on financial performance for low-cost-strategy firms. Firms also tend to prioritize the needs and expectations of stakeholders on which they depend for critical resources and survival (Ashforth & Gibbs, 1990). Thus, firms that pursue a low-cost strategy are more inclined to invest in and benefit from the primary stakeholders as compared with secondary stakeholders.
Now consider firms pursuing a differentiation advantage, which results in a higher willingness to pay on the part of their customers and premium prices for their products. For such firms, too, secondary SM may not result in direct or immediate economic benefits through higher productivity as in the case of primary SM. In fact, secondary SM may lead to a net increase in costs. However, a differentiation strategy's underlying principle of premium pricing ability allows it to recover the higher costs of secondary SM. In addition, the stakeholder synergies and complementarities associated with a differentiation strategy—activities that concurrently create value for multiple stakeholders—arise mostly from secondary SM. For example, a firm's community and environmental investments will likely generate positive spillovers in attracting and retaining better manpower and in improving customer brand perception. Investing in secondary SM enhances a firm's “close relationship capability” with both primary and secondary stakeholders (Jones et al., 2018: 373). Last, it is possible for differentiators to leverage the investments in secondary SM as additional factors for differentiation and thereby command higher prices or acquire a larger customer share (consider, for example, firms making social investments, such as Unilever and Patagonia). In other words, both primary and secondary SM are likely to improve financial performance for differentiators. Hypothesis 3a: For firms pursuing a differentiation advantage, both primary and secondary SM are likely to be positively related to firm financial performance.
Hypothesis 3b: For firms pursuing a low-cost advantage, secondary SM is likely to be more negatively related to firm financial performance when compared with primary SM.
Method
Data and Sample
Smaller sample sizes and inadequate longitudinal panel data are two of the core concerns associated with most of the extant empirical studies on the relationship between investing in stakeholders and financial performance (Laplume et al., 2008). Data disclosure by companies on environmental, social, and governance (ESG) parameters has improved over the past 10 years thanks to initiatives such as the Global Reporting Initiative and due to the efforts of the Global Sustainability Standards Board (Sustainability Reporting Guidelines, 2013). Investment recommendations by analysts have begun to consider not only financial performance data but also a company's track record in ESG dimensions, which is giving a further boost to sustainability reporting by firms. Thanks to these trends, the timing is now right to examine empirical evidence using longitudinal panel data on the direct as well as moderating effects of the link between SM and financial performance.
We use data from Thomson Reuters Eikon database, one of the most comprehensive secondary data sources for ESG data currently available. Eikon tracks more than 400 ESG metrics to measure and report a company's relative ESG commitment across 10 major themes (such as emissions, environmental product innovation, human rights, and so on) based on data sources including company reports, filings to stock exchanges, nongovernmental organization websites, news reports, and so on. Thomson Reuters ESG scores enhance and replace ASSET4 ESG ratings, often used by prior studies to measure SM performance. Even though Thomson Reuters claims to cover over 8,000 companies, availability of longitudinal data for more than 5 years is limited to only large firms. Hence we choose S&P 500 firms (as of financial year 2019) as our sample and put together data on ESG and other financial variables for 15 years (financial years 2005 to 2019). Firm attributes and financial variables have been collated from the Compustat database after matching company codes. 6 Due to missing data for some of the measures, our final data set consists of 5,032 firm-year observations for models with market value (Tobin's Q) and 5,037 firm-year observations for models with return on assets (ROA) over a 15-year period.
Variables and Measures
Dependent variable: Firm financial performance. We choose the most commonly used market-based financial measure of firm performance for listed firms, namely, Tobin's Q. In line with prior studies (e.g., Gompers, Ishii, & Metrick, 2003), we measure Tobin's Q as the ratio of market value of assets to book value of assets. 7 Accounting-based performance measures such as ROA have their limitations, as they capture historical performance and are liable for accounting adjustments by managers from time to time. On the other hand, market-based measures such as Tobin's Q are likely to weigh in and capture all available information on the company (Hillman & Keim, 2001; Wang & Choi, 2013). Market value as captured by Tobin's Q is more likely to incorporate the information value of social practices and SM of a firm. Due to its wide usage, we also use ROA as an alternative measure of firm financial performance, measured as net income divided by total assets (Berman et al., 1999; Choi & Wang, 2009).
Independent variables. Our independent variables measure firms’ stakeholder management and generic competitive strategies namely cost leadership and differentiation.
Stakeholder management. Following previous SM studies (Berman et al., 1999; Choi & Wang, 2009; Coombs & Gilley, 2005; Hillman & Keim, 2001; Laplume, Walker, Zhang, & Yu, 2021), we examine firms’ SM performance and operationalize it based on “firm behavior rather than beliefs” (Hillman & Keim, 2001: 130). The overall SM performance of a company is reflected in the ESG parameters and includes the effects on a comprehensive set of stakeholders, such as employees, customers, suppliers, community, and so on. “The most popular operationalization of SM is a multifaceted measure . . . which includes (metrics such as) . . . community relations, workplace diversity, labor relations, environmental impact and product safety” (Laplume et al., 2008: 1167). Though it is debatable whether the natural environment should be considered as a stakeholder (Phillips, Freeman, & Wicks, 2003), we included the environmental dimensions following prior works on SM (e.g., Berman et al., 1999; Hillman & Keim, 2001; Laplume et al., 2021). The environmental score reflects the management practices promoting eco-efficiency technology and environmental innovation, which in turn have an impact on all other stakeholders. We also prefer a broader operationalization of SM as our theorization requires splitting it further into primary and secondary SM. To account for all the factors and practices that determine the SM-related behavior of a company, we rely on the overall ESG scores calculated by Thomson Reuters Eikon database to measure SM. Thomson Reuters uses a comprehensive set of 178 comparable measures collected from the company's reports and other data sources for its ESG scoring (Thomson Reuters ESG Scores, 2018). The overall ESG scores take a value ranging between 0 and 100, where a higher ESG score for a firm implies a greater level of SM (Hillman & Keim, 2001).
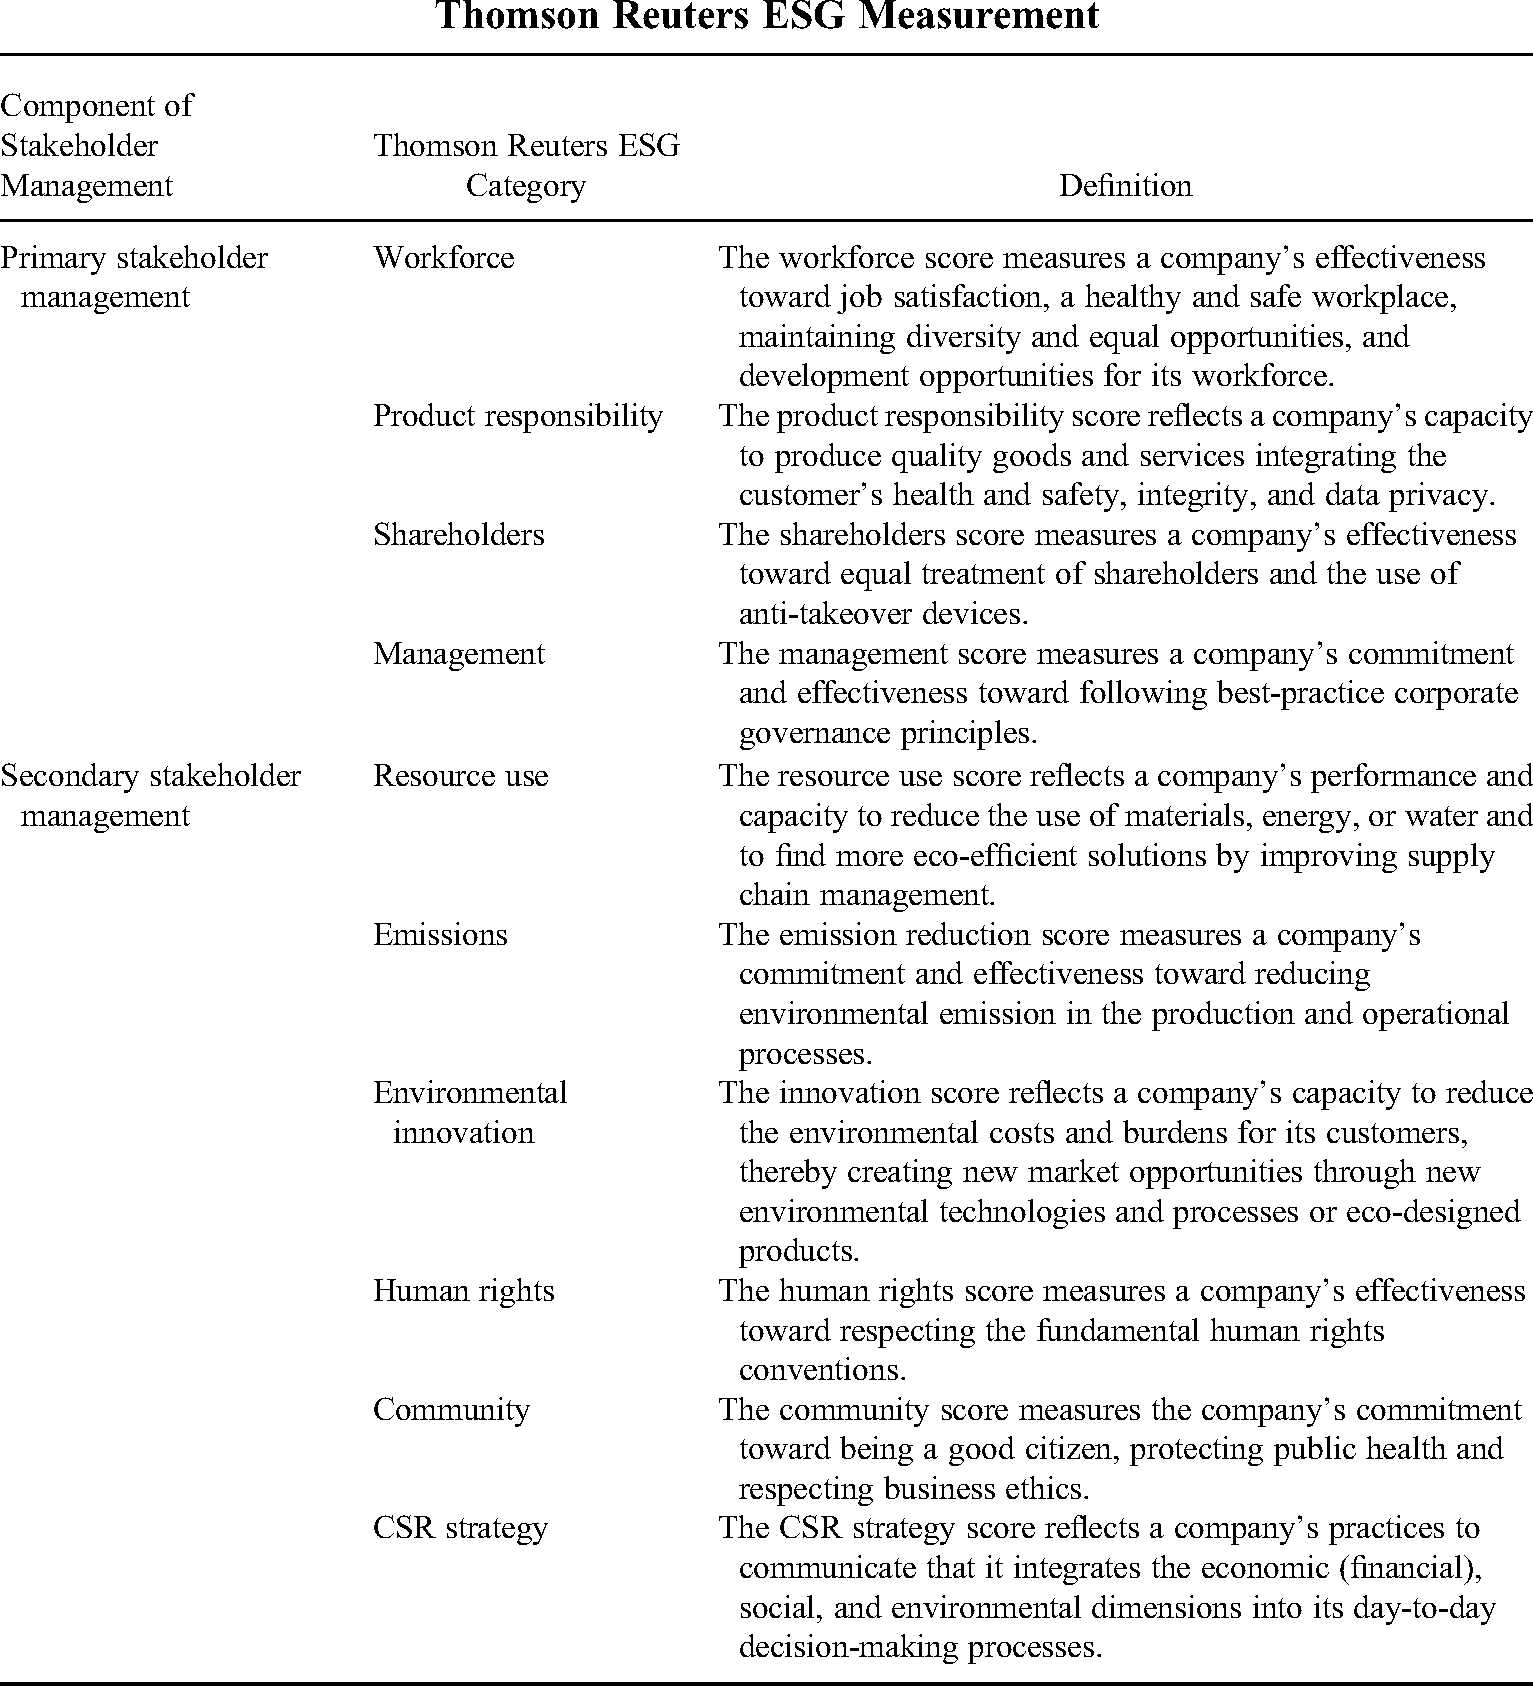
We create two separate variables to distinguish between primary and secondary SM, based on the 10 areas of SM performance available in Thomson Reuters Eikon database. The primary SM variable includes four areas that capture activities related to key stakeholders that have direct and formal contractual relationships with the firm: workforce (employee relations), product responsibility (customers), management, and shareholders. The management dimension differs from the shareholder dimension, as the latter involves corporate practices for merely one stakeholder group: the investors. The management dimension, on the other hand, reflects the degree by which the managers act in the interest of all stakeholders (including shareholders, employees, customers, suppliers, etc.).
The secondary SM is comprised of six broader stakeholder areas that represent activities that are not directly related to transactions with the contractual or primary stakeholders: resource use, emissions, environmental innovation, human rights, community, and corporate social responsibility (CSR) practices. The community dimension measures the company's commitment toward good citizenship and protecting public interests, whereas the CSR dimension measures its practices to communicate and integrate economic, social, and environmental impacts into day-to-day decision-making. We provide descriptions of all the 10 individual metrics that make up primary and secondary SM in Appendix C. We scaled the SM variables (divided by 100) to avoid small coefficients.
Low-cost advantage. In line with prior studies, we measure a firm's cost leadership strategy through its degree of cost advantage as reflected in cost efficiency (e.g., Berman et al., 1999). Specifically, we measure cost efficiency as the ratio of the total operating expenses directly related to cost of goods sold and services provided to net sales. We subtract this ratio from 1 to measure the degree of low-cost advantage of the company.
Differentiation advantage. A differentiation strategy aims to create brand equity and a higher willingness to pay by the customer. This involves a relatively higher level of spend on selling, advertising, and administrative expenses. As operationalized by prior studies, we measure the differentiation advantage of a company using a ratio of selling, general, and administrative expenses to net sales (e.g., Berman et al., 1999; Wang & Qian, 2011).
We use industry-adjusted competitive strategy variables for all our estimations computed by subtracting from the firm values the average value of all firms with the same two-digit Standard Industrial Classification (SIC) code, excluding the focal firm. To mitigate the impact of outliers, we winsorize the moderator variables at the 1% level. Our results are also robust to winsorizing at the 2% level and to trimming at the 1% and 2% levels.
Control variables. We first control for key firm-level variables that are likely to have an impact on a firm's performance. Firm size, measured as the natural logarithm of the net sales of a firm in each year, is used to account for the size of resources and scale effects on firm performance. The age of each firm since its listing, in years, is used as a measure of its experience. The financial leverage of a firm has an effect on its performance, which we control using a firm's debt ratio, measured by the ratio of long-term debt to total assets. To control for the level of industry competition, we use the Herfindahl index of concentration (Spanos, Zaralis, & Lioukas, 2004), calculated by summing the squared market shares of firms in each industry each year. We define industry using the two-digit SIC codes and use firms’ sales to compute market shares. The Herfindahl index measures industry concentration; thus higher values indicate lower industry competition. We control for firm fixed effects to account for all time-invariant firm-level omitted variables. 8 Finally, we include year dummies in all our models to account for time effects.
Model Specification and Data Analysis
We estimate our models using fixed-effects panel regression procedures. A Hausman test rejects the hypothesis of random effects in our data, so we focus on fixed-effects estimates for our results (Greene, 1997; Hausman, 1978). The panel design offers some important advantages. First, since it includes both cross-sectional and time series data, it increases the available degrees of freedom so as to improve estimation efficiency. Second, panel estimation procedures allow us to control for unobserved heterogeneity (the possibility that estimated results are due to unobserved factors or omitted variables) and thereby reduce the possibility of biased parameter estimates and spurious results (Greene, 1997). Third, as panel data measure the variables of interest over a period of time, lagged effects can be observed to help rule out reverse causality.
In all our regression models, we use heteroscedasticity-consistent robust standard errors clustered by firm. We lag all independent variables and control variables by 1 year as the effect of strategies on firm performance is reflected over a period of time and also to address the possibility of reverse causality. In estimating the effects of SM on firm financial performance, we acknowledge the potential problem of endogeneity. As a robustness check, we adopt the Heckman-2SLS approach, which combines a two-stage Heckman selection model to overcome sample selection bias (Heckman, 1979) and a two-stage least squares instrumental variable (2SLS IV) model (Wooldridge, 2010), to address the concerns associated with endogeneity, reverse causality, and unobserved heterogeneity. To further check the robustness of our results, we rerun the models using alternative specifications and alternative measures of the key variables.
Results
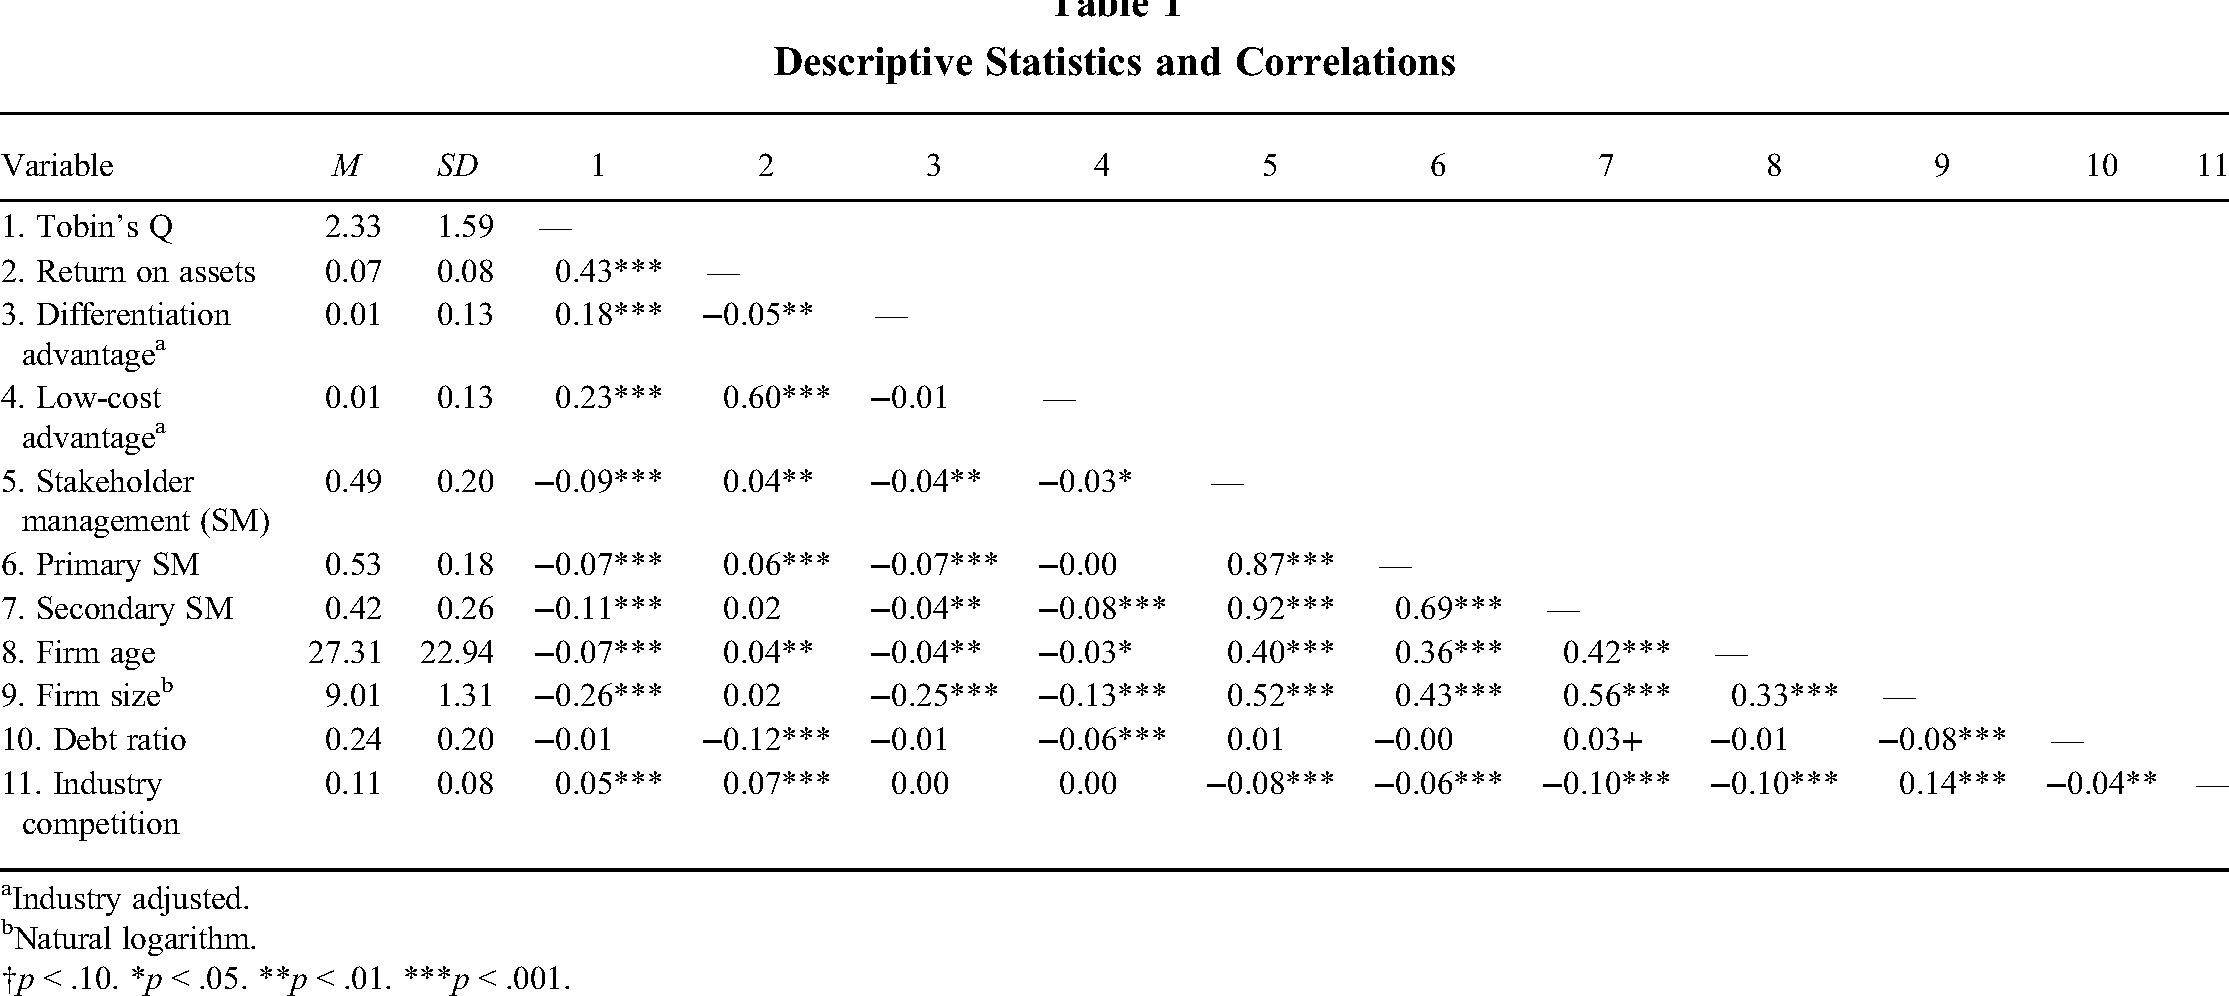
We check the data for normality of the residuals, heteroscedasticity, and existence of collinearity, if any. Multicollinearity is not found to be an issue, and the variance inflation factor values are within the accepted levels. Table 1 reports the descriptive statistics and Pearson correlations for all the variables. The average Tobin's Q is relatively high at 2.33, given that our sample consists of S&P 500 firms. Adequate variance across firms is observed for the measures for competitive strategies and stakeholder management. The mean age of our sample firm is over 27 years, and the mean debt ratio, about 0.24. The average net sales of a firm in our sample stands at US$8,201 million. The pairwise correlations between all the variables are along expected lines.
Descriptive Statistics and Correlations
Industry adjusted.
Natural logarithm.
†p < .10. *p < .05. **p < .01. ***p < .001.
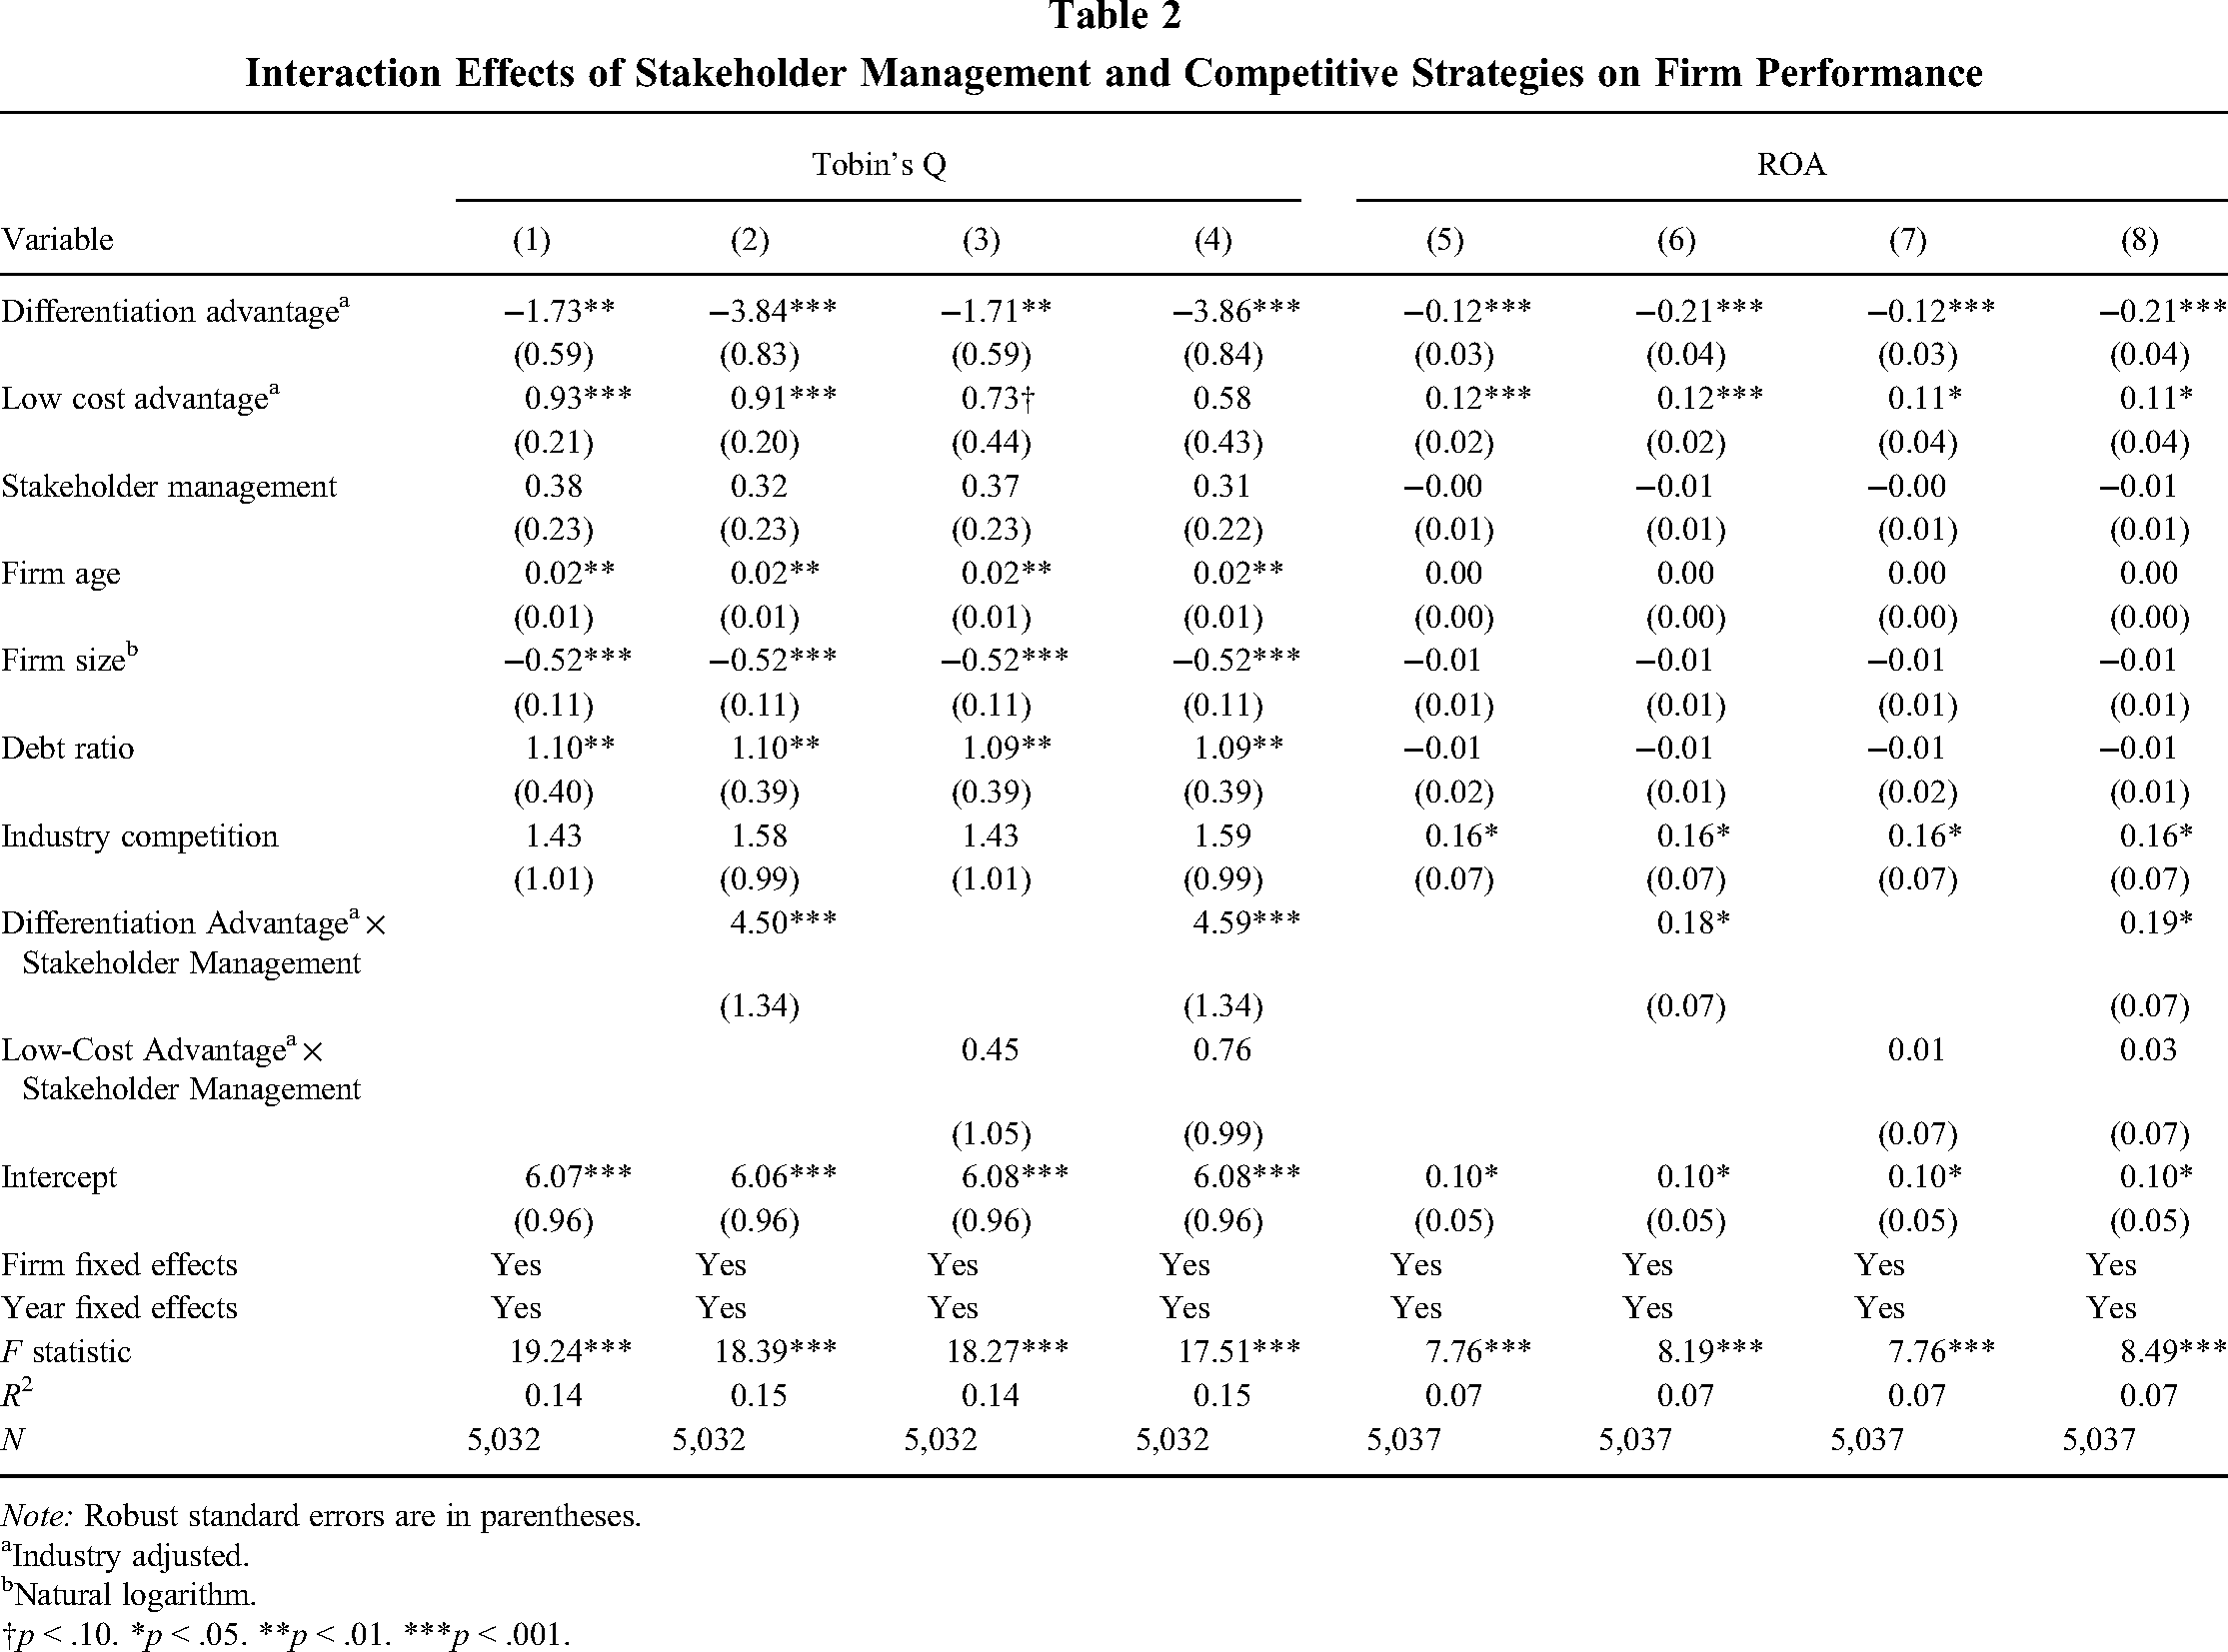
The panel regression results for the effect of the main explanatory and control variables on Tobin's Q are provided in Models 1 to 4 of Table 2. Model 1 is the baseline model with all independent and control variables. Hypothesis 1 predicts that differentiation advantage and SM have synergistic effects on firm performance. Hypothesis 1 is tested by adding the interaction term, Differentiation Advantage × SM, to Model 1 (results in Model 2). The coefficient of the interaction term in Model 2 is positive and statistically significant (β = 4.50, p < .001), supporting our Hypothesis 1 that a differentiation advantage and SM reinforce each other to strengthen firm performance. Hypothesis 2 states that there is a partial trade-off between cost leadership and SM in the prediction of firm performance. We test Hypothesis 2 by introducing an interaction term, Low-Cost Advantage × SM, in Model 3 in addition to the baseline and control variables. We do not find support for Hypothesis 2 as the coefficient of the interaction term is found to be statistically insignificant (β = 0.45, p > .10). The results of Model 3 indicate that the positive association between SM and firm financial performance is not weakened for cost leaders. We obtain similar results from the models using ROA as an alternative measure of the dependent variable, in which the interaction term between differentiation advantage and SM is positive and significant (β = 0.18, p < .05) and the interaction term between cost advantage and SM is not statistically significant (β = 0.01, p > .10). The null result of Hypothesis 2 points to a possibility that the effects of primary and secondary SM for cost leaders could run in opposite directions, thus leading to an overall insignificant effect.
Interaction Effects of Stakeholder Management and Competitive Strategies on Firm Performance
Note: Robust standard errors are in parentheses.
Industry adjusted.
Natural logarithm.
†p < .10. *p < .05. **p < .01. ***p < .001.
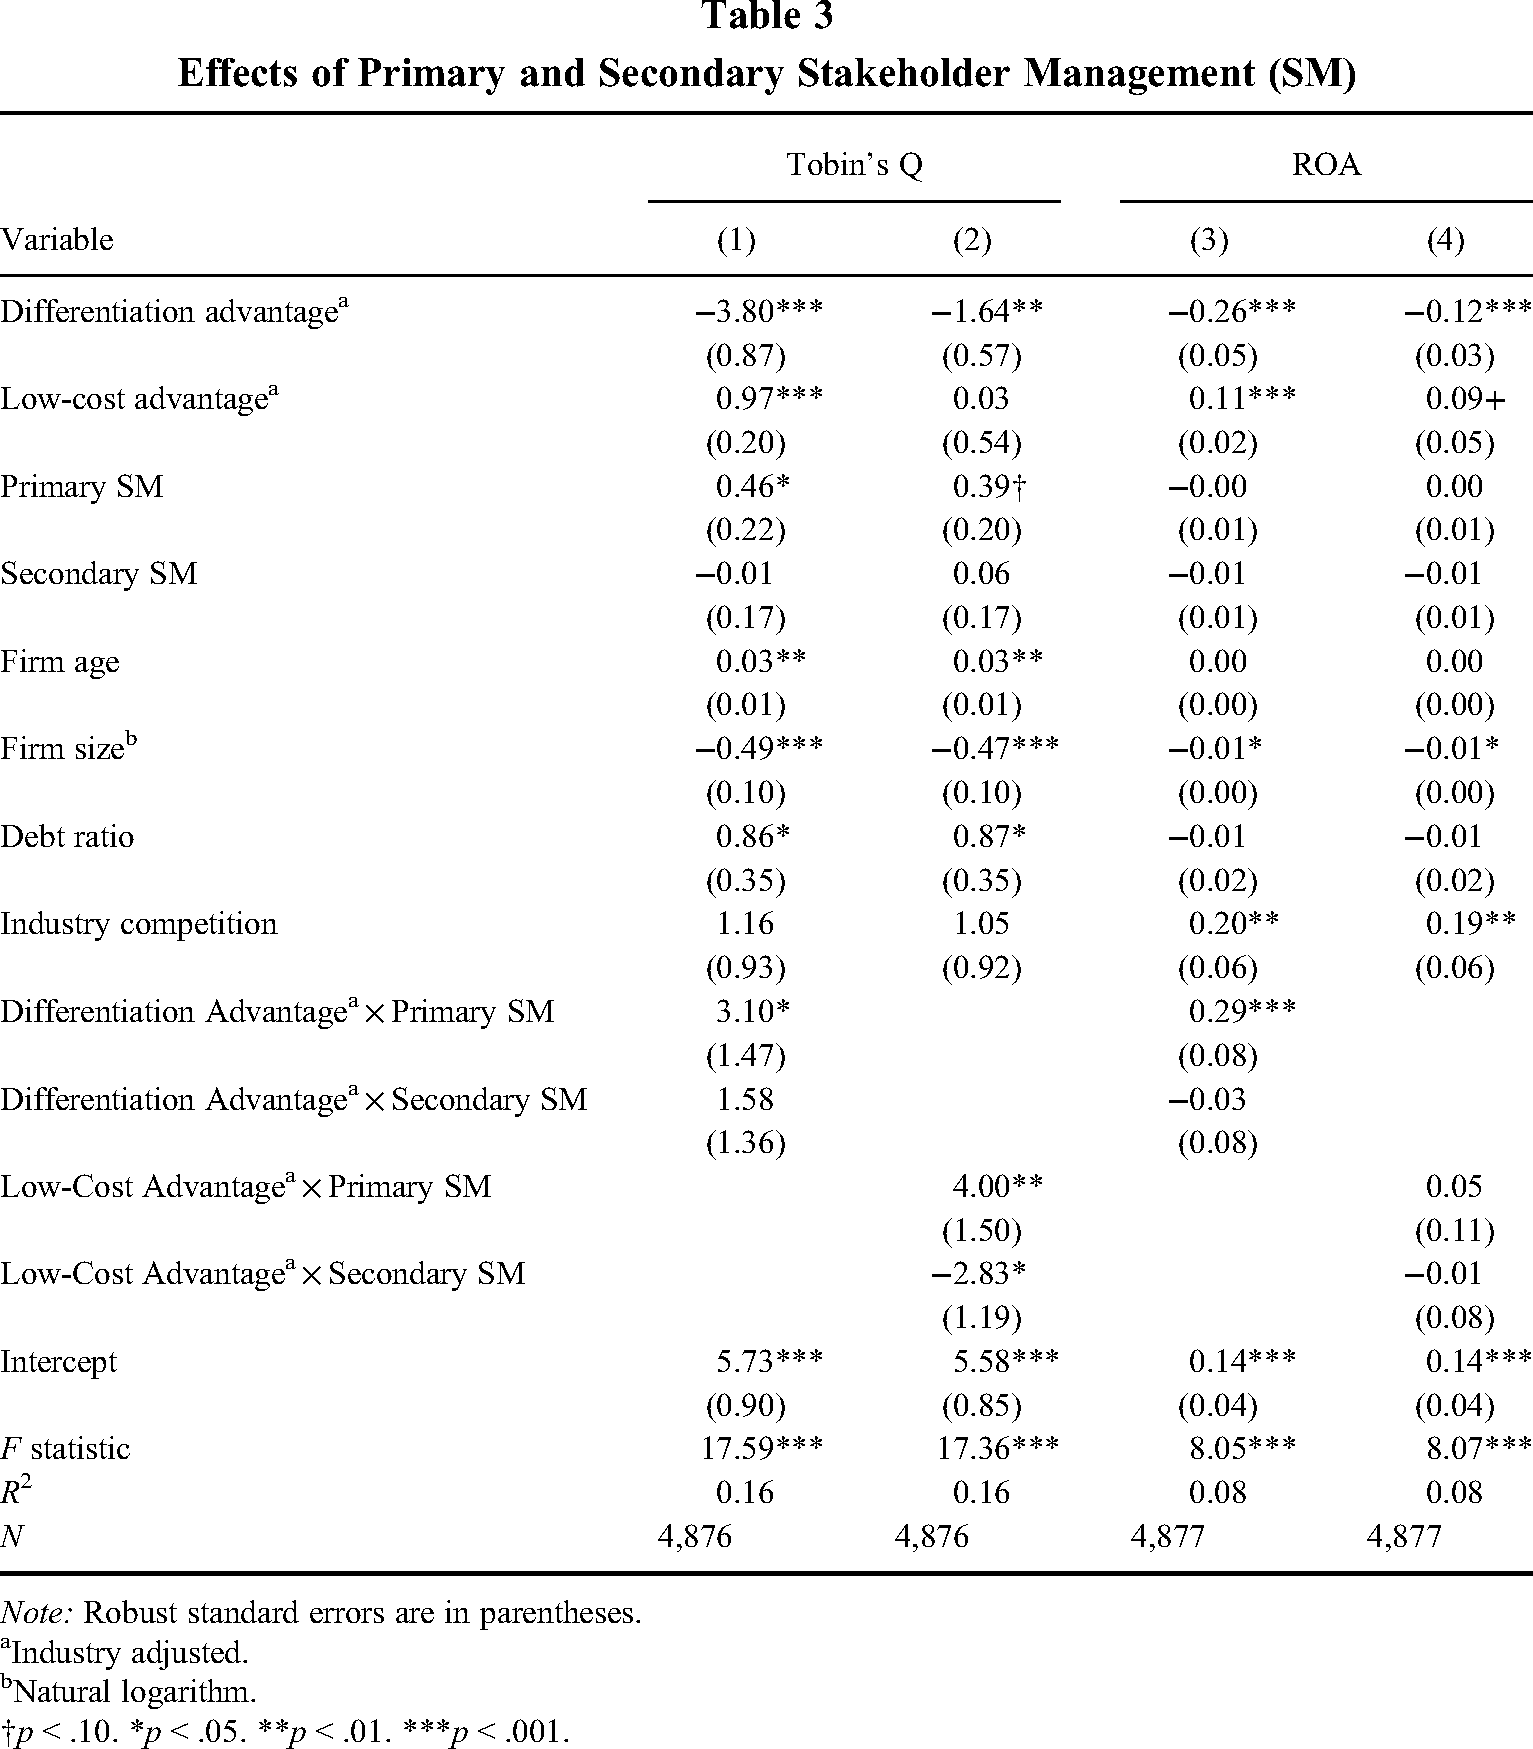
Table 3 presents the results of analyses testing the distinct effects of primary and secondary SM on Tobin's Q (in Models 1 and 2) and ROA (in Models 3 and 4). As reported in Model 1 in Table 3, the interaction term between primary SM and differentiation advantage (β = 3.10, p < .05) is positive and significant, whereas the interaction term between secondary SM and differentiation advantage (β = 1.58, p > .01) is positive yet insignificant. A Chow test shows that the difference between the two interaction terms is not statistically significant (p > .10). It suggests that both primary and secondary SM help boost financial performance for differentiators, supporting Hypothesis 3a. In Model 2 of Table 3, the coefficient for the interaction term between primary SM and cost advantage (β = 4.00, p < .01) is positive and significant, whereas the interaction between secondary SM and cost advantage (β = –2.83, p < .05) is negative and significant. Only secondary SM has a negative effect on financial performance for cost leaders. A Chow test shows that the difference between the two interaction terms is statistically significant (p < .01). Therefore, it confirms that secondary SM hurts firm financial performance for cost leaders more than primary SM, which supports the predictions of Hypothesis 3b. These results further suggest that Hypothesis 2 on the trade-offs between SM and low-cost strategy is not valid across all stakeholders. We address the implications of the heterogeneous (opposite) effects of primary and secondary SM for cost leaders in the Discussion section.
Effects of Primary and Secondary Stakeholder Management (SM)
Note: Robust standard errors are in parentheses.
Industry adjusted.
Natural logarithm.
†p < .10. *p < .05. **p < .01. ***p < .001.
Robustness Checks
We conduct several supplementary analyses to test the sensitivity of our results. Specifically, we rerun our main analysis using Heckman-2SLS models, alternative specifications, and alternative measures of the key variables.
Addressing endogeneity. We employ Heckman-2SLS models to address sample selection and endogeneity concerns while examining the relationship between SM and firm performance (Liu et al., 2021). We first estimate the Heckman's first-stage model and then perform instrumental variable regressions for the second-stage Heckman model. In the first-stage Heckman model, we use probit analysis where the dependent variable is a dummy indicator for whether or not a firm engages in SM in a given year, thereby estimating the probability of engaging in SM in the full sample of firms. We then compute the inverse Mills ratio to control for the potential sample selection bias in the second-stage regression. To predict the probability of a firm pursuing SM, we regress the dummy variable of SM on a set of firm attributes that may affect the probability of investing in stakeholders: firm age, firm size, industry competition, the number of analysts following, and industry and year fixed effects. 9 Our choice of variables for this model was guided by data availability and our objective to maximize the number of observations. We use the number of analysts following the focal firm as the exclusion restriction variable, since at least one variable in the Heckman first stage should not be included in the second stage (Certo, Busenbark, Woo, & Semadeni, 2016). SM and sustainability activities of a firm are positively related to the number of financial analysts following it (Harjoto & Jo, 2011), thus making the latter a suitable exclusion restriction.
In our 2SLS IV regressions, we select the instruments from the following exogenous variables and the lagged variables of them (Kennedy, 2008): board gender diversity score, assessing the percentage of females on the board (board gender diversity percent score); executive gender diversity score, assessing the percentage of female executive members (executive members gender diversity percent score); the proportion of firms in an industry that received corporate responsibility (CR) awards per year (industry-year CR awards); and the cumulative number of years that a firm had been an active member of the United Nations Global Compact program (years as UNGC signatory). We derive the data for all the instruments from the Thomson Reuters Eikon database. A valid instrument must satisfy two criteria (Wooldridge, 2012): be uncorrelated with the error term (exogeneity criterion) and be correlated with the concerned endogenous variable (relevance criterion). Previous studies demonstrate that presence of female and minority directors on the board (Cornett, Erhemjamts, & Tehranian, 2016) and the proportion of firms in an industry that are known for responsible practices (Cuypers, Koh, & Wang, 2016) are effective instruments for SM. Research also suggests that UNGC membership is correlated with SM (Schembera, 2018) but does not have a direct influence on a firm's financial performance. The number and final choice of the instruments for each estimation model was guided by postanalysis diagnostics that ensure the validity of the instruments (Baum, Schaffer, & Stillman, 2007; Cameron & Trivedi, 2005). We perform and report detailed diagnostics on the validity and relevance of the instruments.
In testing Hypotheses 1 and 2, the endogenous variable (SM) is estimated based on two instruments (i.e., industry-year CR awards and years as UNGC signatory) in the first-stage 2SLS model. In testing Hypotheses 3a and 3b, the first-stage 2SLS model estimates the endogenous variables (i.e., primary and secondary SM) based on the instruments board gender diversity percent score, executive members gender diversity percent score, years as UNGC signatory, and the lagged variable of years as UNGC signatory. 10 As we also examine the interaction effects of SM and competitive strategies, we generate the interaction terms between the instruments and the moderators in the instrumental variable estimation. Specifically, in the first stage of the 2SLS models, we regress the endogenous variable(s) on the instruments, differentiation and cost leadership advantages, the interaction terms, all the control variables, and firm and year fixed effects. In the 2SLS second-stage model, we use the fitted values obtained from the first-stage regressions (instead of the endogenous variable) as a regressor (Wooldridge, 2012) to predict the effects of SM and competitive strategies on firm financial performance along with all other control variables used in the first stage.
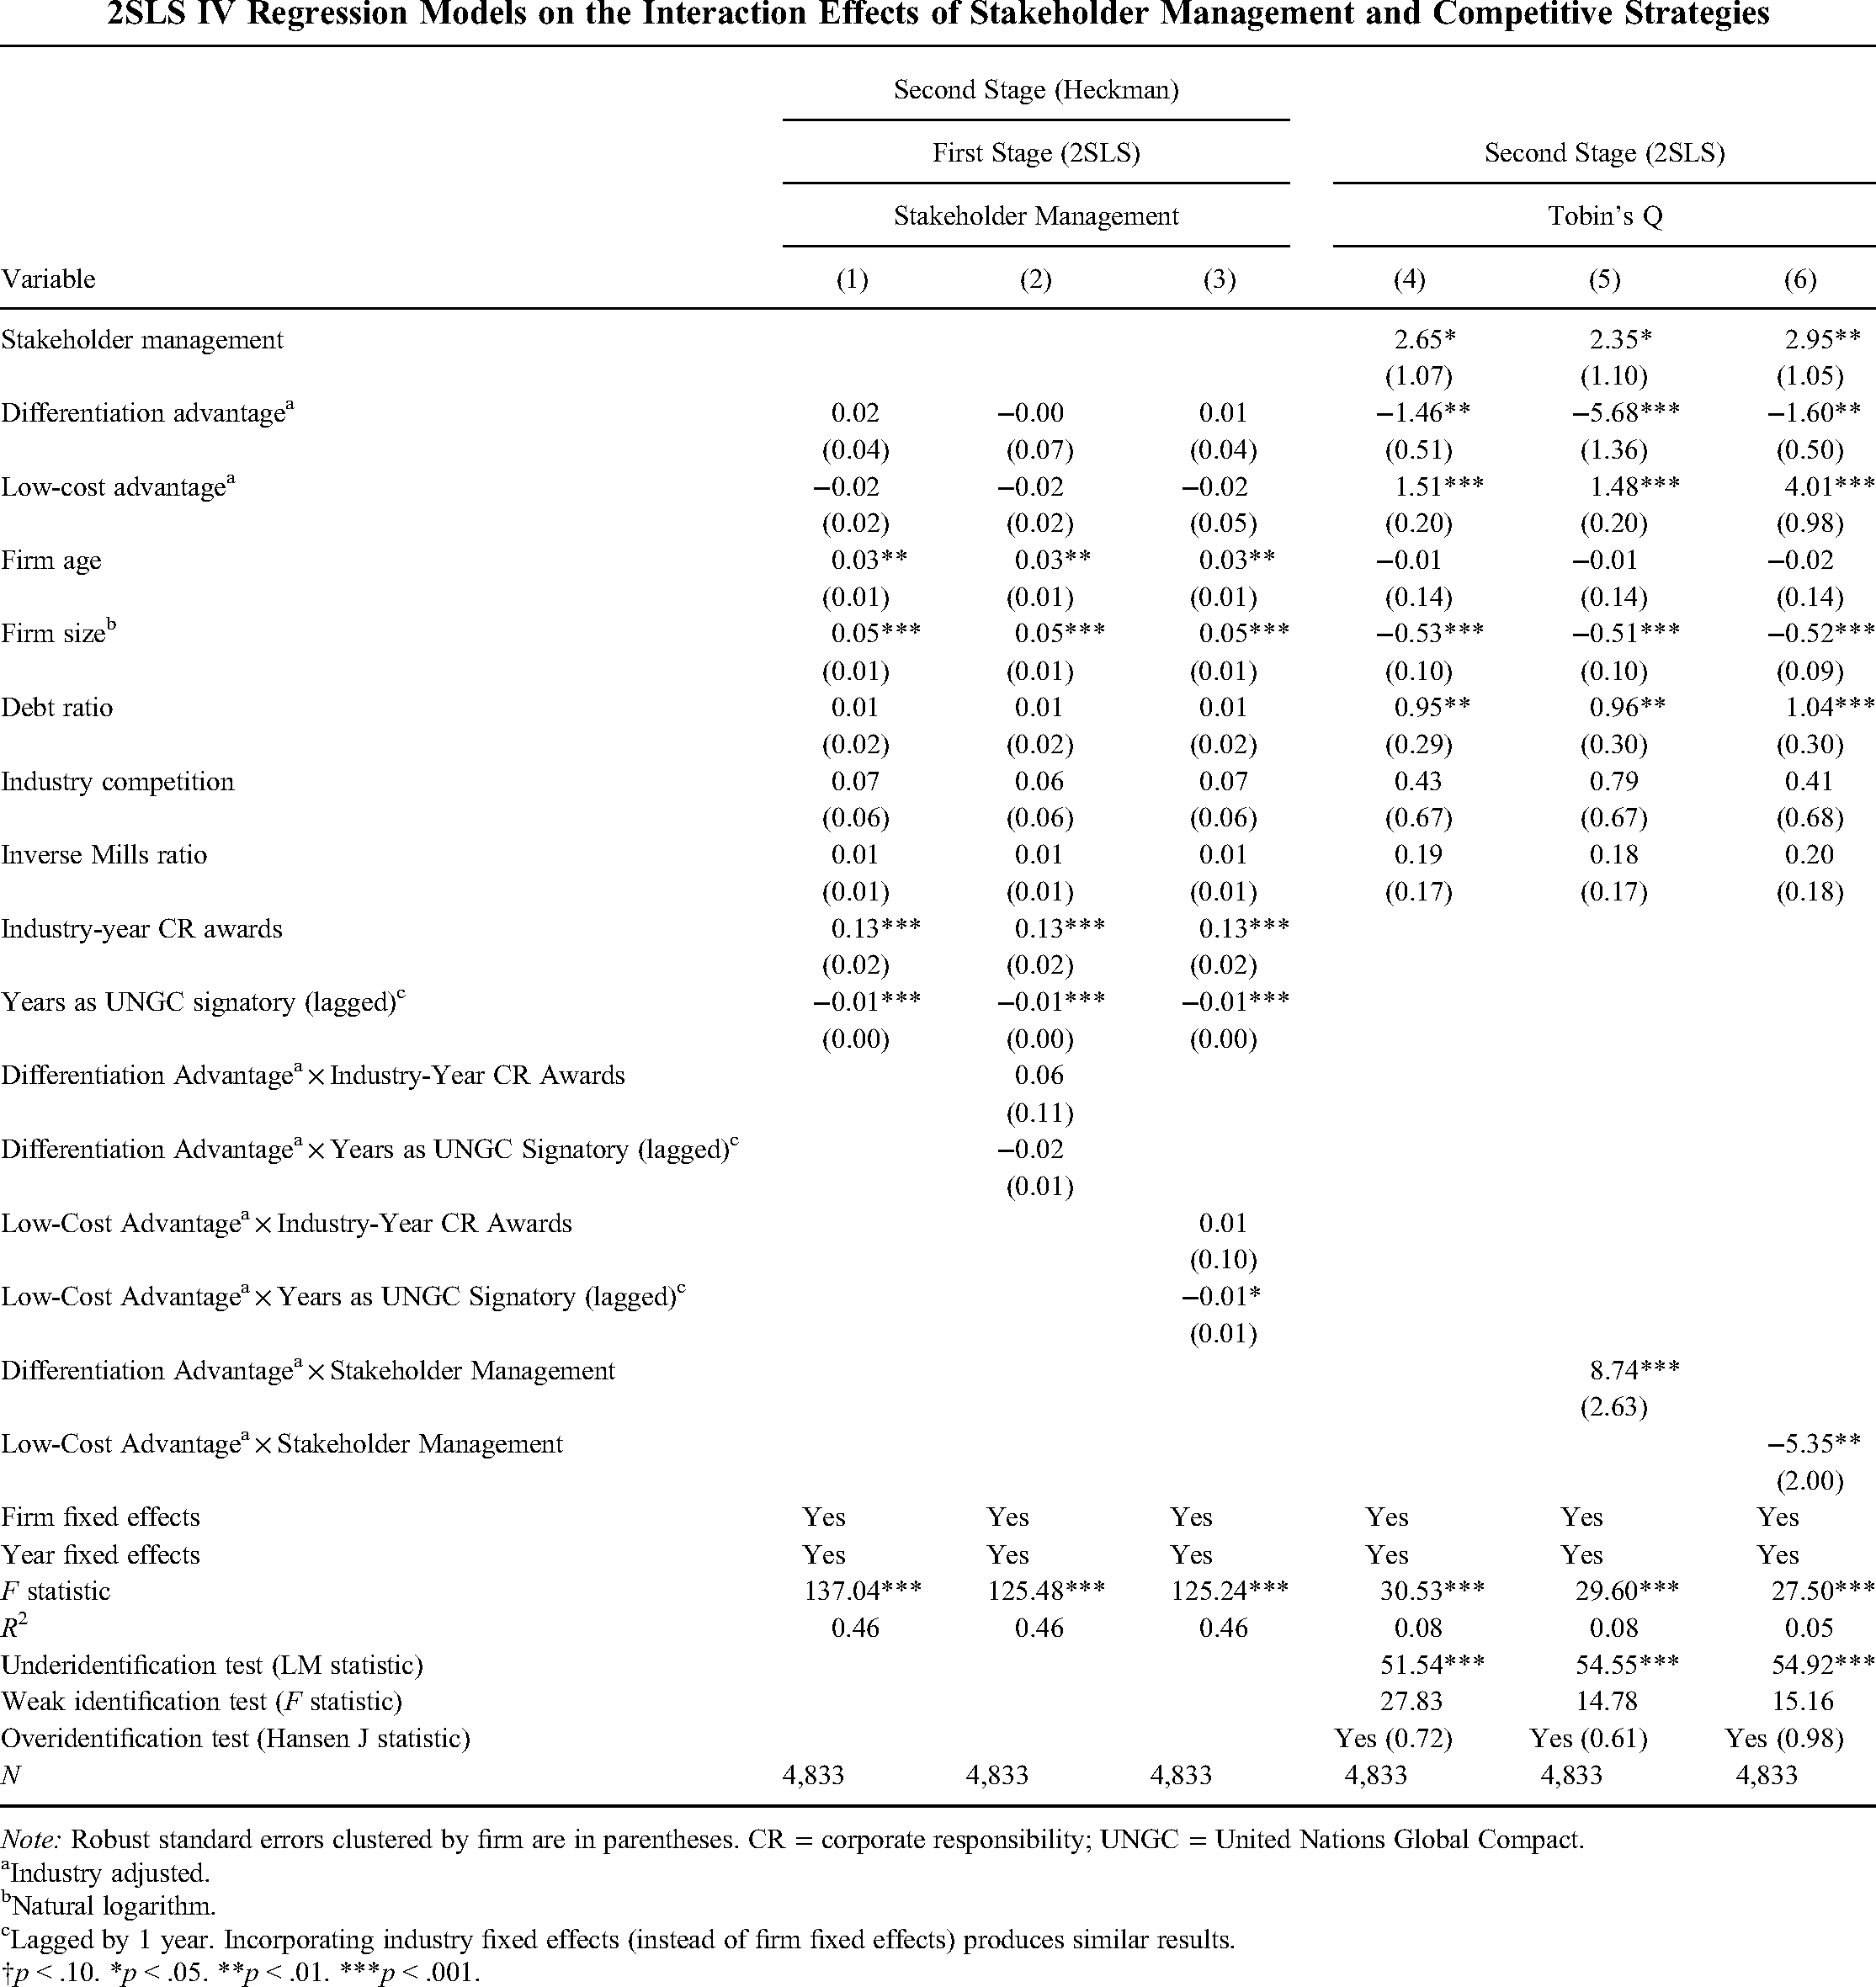
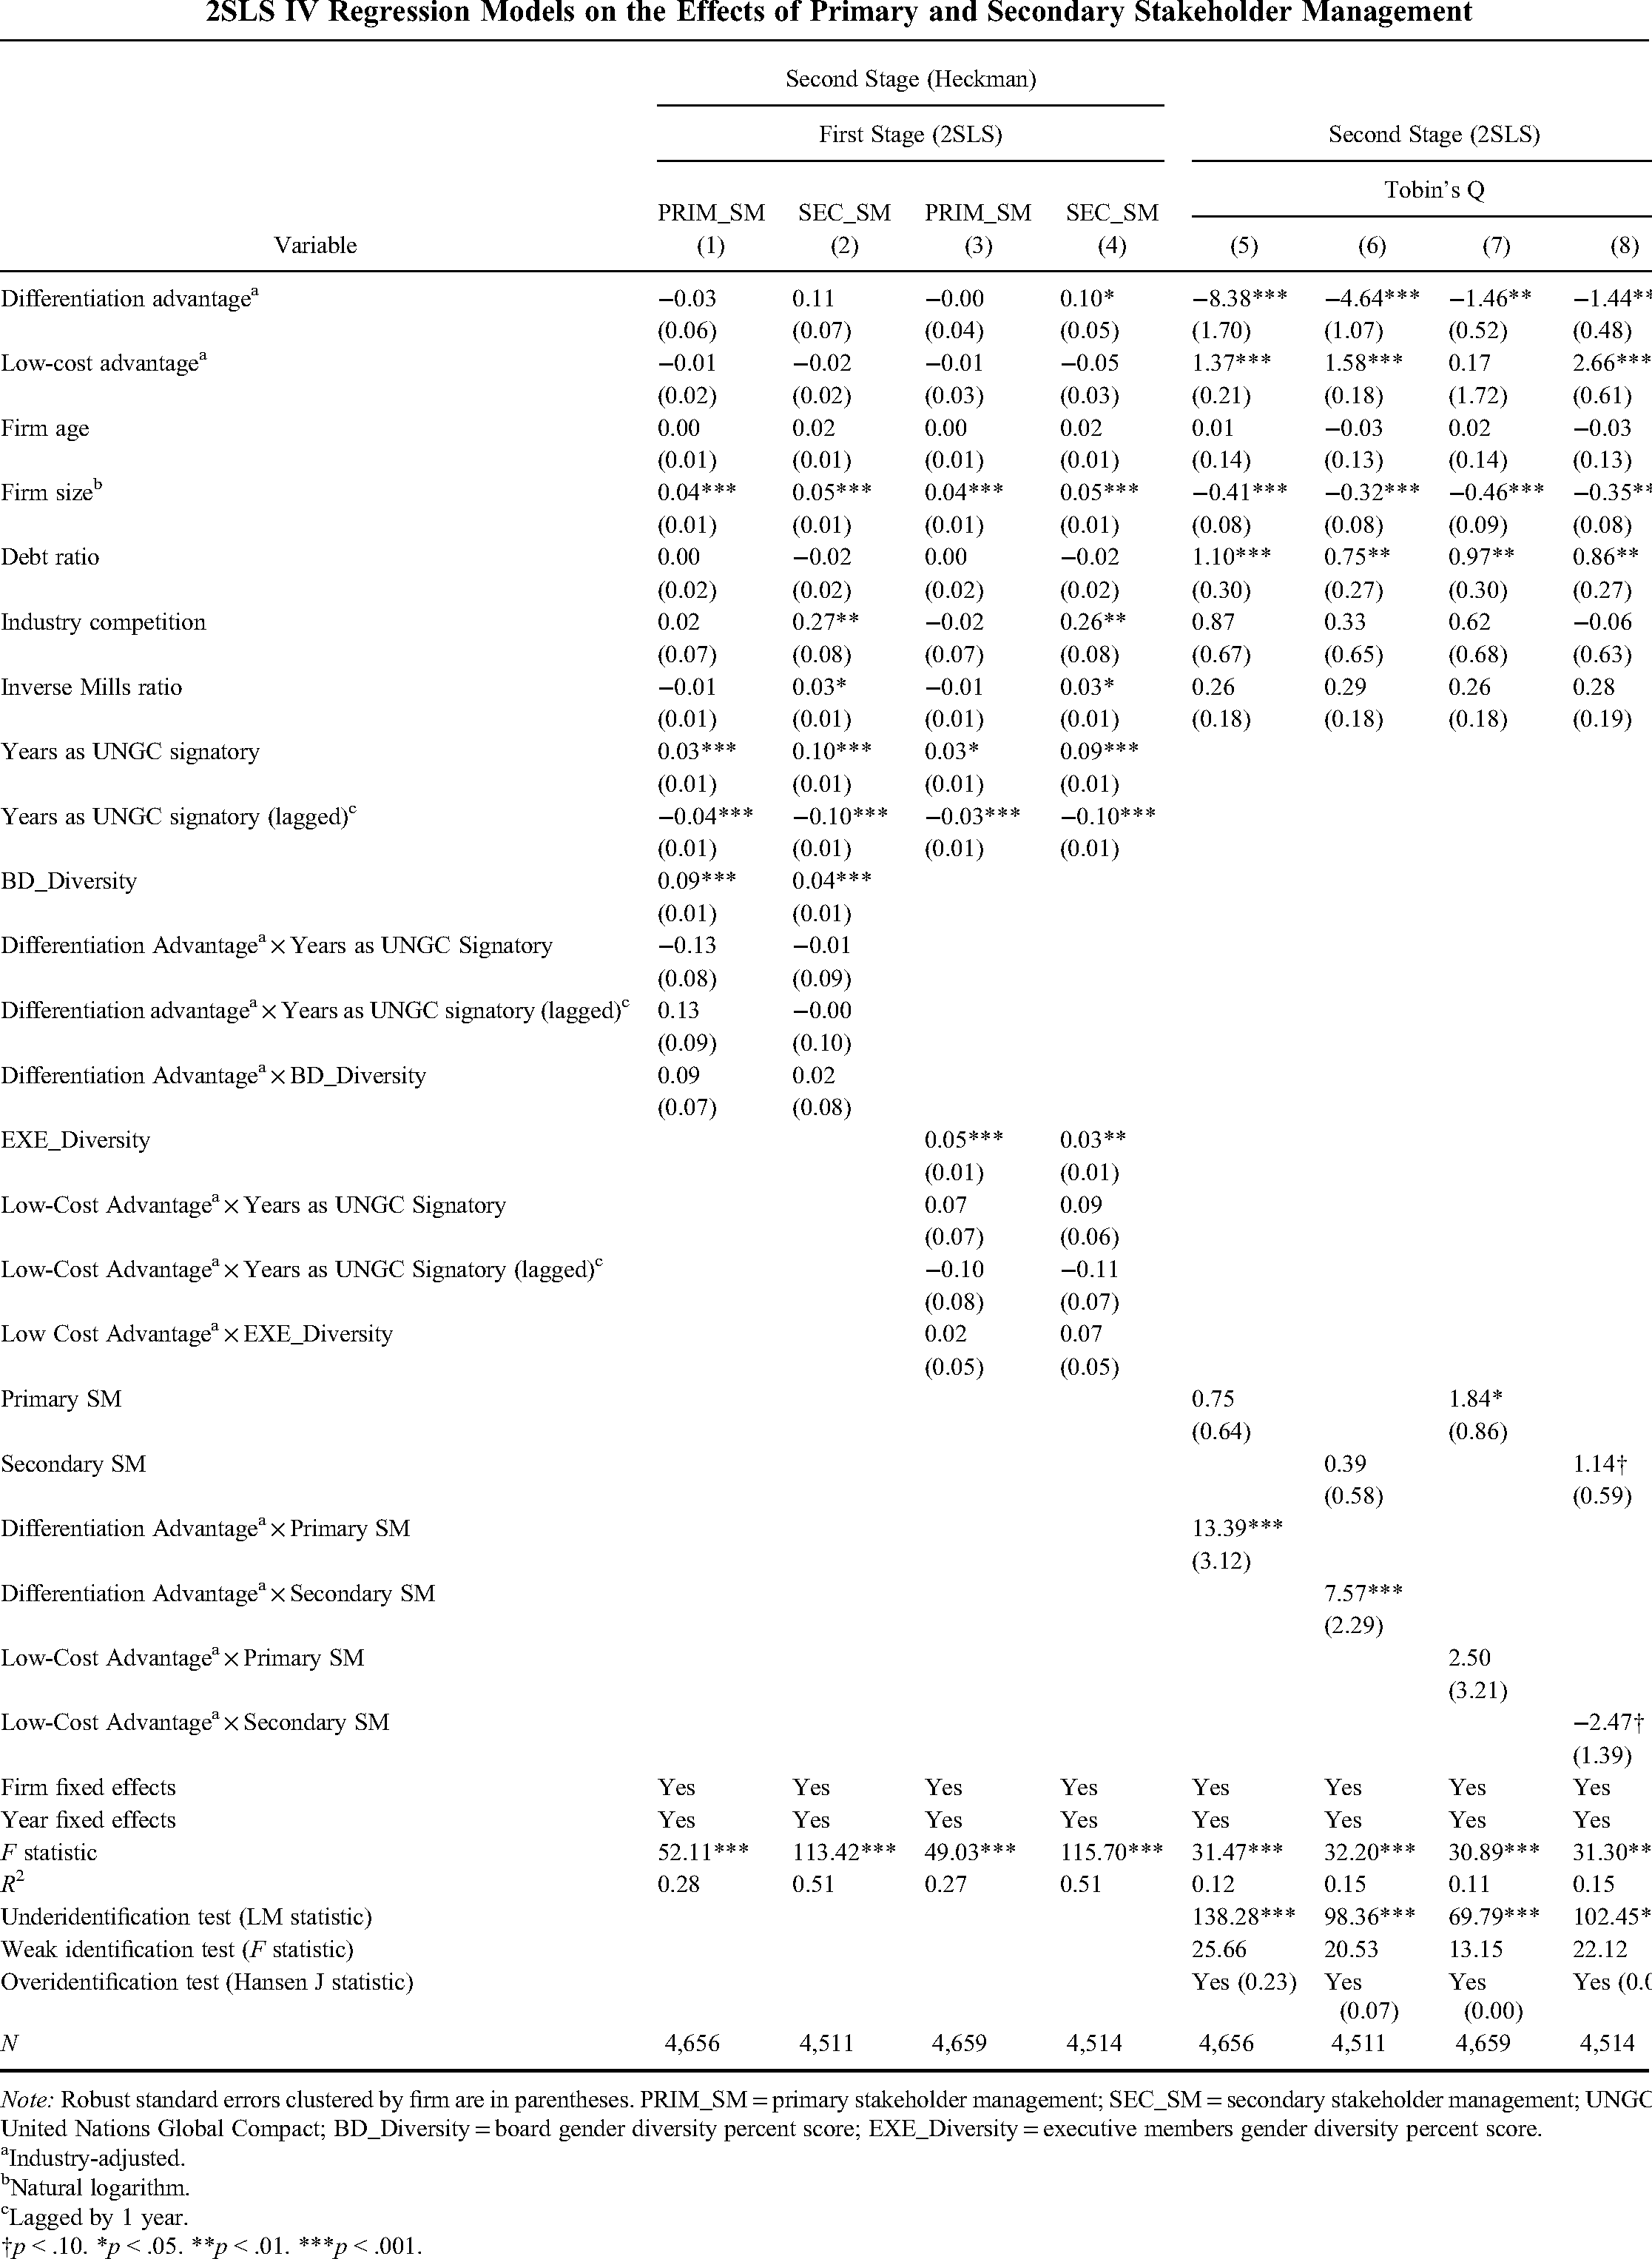
We report all the Heckman-2SLS results in Appendices A and B. Hypothesis 1 is tested by using the interaction term Differentiation Advantage × SM in Model 5 of Appendix A, the coefficient of which is positive and statistically significant (β = 8.74, p < .001), supporting Hypothesis 1. Similarly, we test Hypothesis 2 with the interaction term Low-Cost Advantage × SM in Model 6 of Appendix A, the coefficient of which is negative and statistically significant (β = -5.35, p < .01), supporting Hypothesis 2. Appendix B presents the results for the 2SLS IV regression analyses testing the distinct effects of primary and secondary SM on Tobin's Q. As reported in Models 5 and 6 in Appendix B, the interaction term between primary SM and differentiation advantage (β = 13.39, p < .001) and the interaction term between secondary SM and differentiation advantage (β = 7.57, p < .001) are positive and significant. On the other hand, in Models 7 and 8, the coefficient for the interaction term between primary SM and cost advantage is not significant (β = 2.50, p > .10), but the interaction between secondary SM and cost advantage (β = –2.47, p < .10) is negative and significant. Thus we find broad support for Hypotheses 3a and 3b.
Alternative specifications and measures. We test the robustness of our findings using alternative model specifications incorporating industry fixed-effects instead of firm fixed-effects models. Industry dummy variables are defined based on two-digit SIC codes. We replicate the analysis reported in Tables 2 and 3 by specifying the models with industry and year fixed effects. Using alternative specifications controlling for industry fixed effects produces results that are qualitatively the same as our primary findings.
We reestimate the main models using alternative measures for the key variables. We first create an indicator variable (instead of a continuous variable) as the measure of SM. We measure a firm with high level of SM using a dummy variable equal to 1 if a firm's ESG score is above the industry median level in a given year and 0 otherwise. Using the SM indicator variable, we find that the interaction of differentiation advantage and SM indicator is positive and significant (Tobin's Q, β = 0.89, p < .05; ROA, β = 0.08, p < .001), whereas the interaction between cost advantage and SM indicator variable is statistically insignificant (Tobin's Q, β = 0.25, p > .10; ROA, β = 0.01, p > .10). These results are in line with our main findings.
Following previous studies (Berman et al., 1999; Spanos et al., 2004), we use asset parsimony as alternative proxy for firms’ low-cost orientation and advertising intensity as alternative measure of firms’ differentiation. Asset parsimony is calculated as the ratio of total assets to total number of employees. Advertising intensity is operationalized as a ratio of advertising expenditures to net sales. Advertising expenses are a finer measure of marketing spend specifically aimed at brand building, which is a core aspect of differentiation. We do not use advertising intensity as a measure of differentiation for our main analysis as there are missing values for advertising expenditures for some firms in some years in our data set. 11 We follow prior research (Wang & Choi, 2013) and replace the missing values of advertising intensity by zero for the robustness tests. When we rerun the models using the alternative measures of differentiation and cost advantage, respectively, we obtain results that are highly consistent with our main findings. 12
We use an alternative measure of firm performance, namely, market-to-book ratio. Market-to-book ratio is calculated as the market value of a firm divided by the book value of assets (Martínez-Sola, García-Teruel, & Martínez-Solano, 2013), which is commonly used to approximate Tobin's Q (Chung & Pruitt, 1994). Using the market-to-book ratio, we obtain results similar to the main findings reported in the article with Tobin's Q as the dependent variable, which all corroborate our major findings. We finally run all our models using 2-year lags of the independent variables and obtain similar results. Thus, the sensitivity tests suggest that our empirical evidence is robust.
Discussion
Contributions and Implications
SM studies have identified a number of factors that influence the positive relationship between SM and financial performance: industry factors, geographic and institutional contexts, and firm attributes, such as innovation, nature of stakeholder relationships, and so on (Garcia-Castro & Francoeur, 2016; Harrison et al., 2010; Jones et al., 2018; Laplume et al., 2008; Wang & Choi, 2013; Wang & Qian, 2011). Despite the significant progress made by SM research, our understanding of the many trade-offs managers face while engaging in SM is still limited (Financial Times, 2021; Laplume et al., 2008; Wang et al., 2020). Extending the work on contingencies (Garcia-Castro & Francoeur, 2016), our article highlights the role of generic competitive strategies and stakeholder heterogeneity in determining when SM is likely to be associated with higher financial performance and when it may not. Our findings about the positive moderating role of differentiation strategy and the negative moderating role of cost leadership strategy on the relationship between SM and financial performance have important implications for both SM theory and practice. Our study extends prior research by addressing not only the question “When does SM pay?” but also “When does SM not pay?” and helps account for some of the mixed and inconclusive findings in the literature on the financial performance implications of SM (Laplume et al., 2008; Margolis & Walsh, 2003).
Our article contributes to the work that seeks a more direct integration of stakeholder theory with competitive strategies (Barney, 2018; Berman et al., 1999; Coff, 1999; Jones et al., 2018; Zollo et al., 2018). While theorizing about the financial performance consequences of SM, Berman et al. (1999: 502) were one of the first to report “interdependence between strategy and stakeholder relationships.” Jones et al. (2018: 372) underline the type of stakeholder strategies that are likely to generate a sustainable competitive advantage, calling it a “communal sharing relational ethics” strategy. Barney (2018) and Zollo et al. (2018) focus on the combination of competitive strategies that are likely to align well with stakeholder strategies in creating overall value to stakeholders. Coff (1999) and to some extent Barney (2018) are among the few that conceptually highlight the trade-offs between SM and shareholder value. We add to this body of work (a) by examining not only when the interaction effects are positive but also when they are negative, (b) by disentangling the distinct performance effects of primary and secondary SM, and (c) by providing more comprehensive and rigorous empirical evidence.
Our study also contributes to the work underlining stakeholder heterogeneity. Our study extends the core thesis that primary stakeholders may contribute more firm-specific and financially relevant resources and capabilities (Garcia-Castro & Francoeur, 2016; Hillman & Keim, 2001) to the specific context of the generic competitive strategies pursued by a firm. We find that both primary and secondary SM have a positive effect on financial performance in firms pursuing a differentiation advantage and that in firms with a low-cost advantage, secondary SM negatively affects financial performance whereas primary SM seems to benefit financial performance. These different, and opposite, effects of primary and secondary SM for cost leaders suggest that the stakeholder categories to focus on is an important element of stakeholder strategy for low-cost firms.
Our article has important implications for practitioners by shedding additional light on the long-standing question of “how to do good and do well” and by accentuating the challenges of implementing SM in practice. We add boundary conditions to the claim that the benefits of improved stakeholder relations can offset the related costs of SM (Barnett & Salomon, 2012). Our findings point out that firms with a differentiation advantage have better prospects of balancing the twin goals of “doing well” and “doing good” when compared with firms competing purely based on low costs/prices. Due to the higher trade-offs involved with stakeholder orientation, it would be sensible for managers of low-cost-focused firms to combine the strategy with some degree of differentiation. For example, though the core value proposition of firms like Zara or Southwest Airlines is a low price through a low-cost advantage, they combine it with other distinctive factors valued by their customers and enjoy some differentiation. However, an important caveat to our study's findings is worth highlighting: They reflect only the average effects and do not rule out individual firms successfully managing this balance.
Limitations and Future Research Directions
Our study has limitations that also offer pointers for future research. First, the empirical evidence for our predictions is more indicative of an association rather than causality. We acknowledge that we have not been able to convincingly establish causality for the relationships under investigation, and this presents more opportunities for future work.
Second, we use traditional measures of firm performance, such as Tobin's Q and ROA, in conformity with prior studies for evaluating the consequences of SM. However, there has been a welcome movement among investors to employ broader measures of firm performance, which include ESG parameters. Stakeholder theorists have always questioned the logic of measuring firm performance from the point of view of only one set of stakeholders, namely, shareholders (Barney, 2018; Harrison et al., 2010). Third, there is a need to capture the value creation and appropriation by multiple stakeholders and not just shareholders (Harrison & Wicks, 2013; Jones & Felps, 2013; Weitzner & Deutsch, 2019). While this task appears as “a Gordian knot,” recent work in strategy has proposed new methods for untangling value creation and value appropriation by different stakeholders (Lieberman, Garcia-Castro, & Balasubramanian, 2017: 1194). Although our study does not measure how value is distributed among multiple stakeholders, our finding of the heterogeneous effects of primary and secondary SM among cost leaders implies that value gains may be unevenly distributed among stakeholders. Future studies could investigate how exactly value is appropriated by different groups of stakeholders and how this would differ between firms pursuing different competitive strategies.
Conclusion
SM research has arguably shown a “sunny-side bias” (Jones et al., 2018: 372). The ouster of Emmanuel Faber underlines the growing difficulty of balancing profits and ESG goals and the challenges of creating value for all stakeholders. We believe that our research represents an important step in highlighting these challenges and trade-offs associated with SM. While our study makes a beginning, more inquiry is needed to understand the specific trade-offs that arise while jointly pursuing SM and a cost leadership strategy. Are there productivity and scale benefits that some cost leaders can derive even while meeting the needs of stakeholders? For example, Southwest Airlines is able to reward its employees well but still has low per-unit employee costs due to the high productivity of its employees and its processes. Second, is it possible that firms self-select themselves into different competitive and stakeholder strategies? For example, stakeholders may differ in their motives and may self-select to be associated with firms based on their competitive strategies (Bridoux & Stoelhorst, 2014). Similarly, highly stakeholder-focused firms may strive for differentiation advantages over time instead of focusing purely on cost efficiencies. While the focus of a single study like ours can only be limited, these questions point to a rich future research agenda at the intersection of competitive strategies and stakeholder strategies and throw open a fertile area for theory building.
Footnotes
Appendix A
2SLS IV Regression Models on the Interaction Effects of Stakeholder Management and Competitive Strategies
| Second Stage (Heckman) | ||||||
|---|---|---|---|---|---|---|
| First Stage (2SLS) | Second Stage (2SLS) | |||||
| Stakeholder Management | Tobin's Q | |||||
| Variable | (1) | (2) | (3) | (4) | (5) | (6) |
| Stakeholder management | 2.65* | 2.35* | 2.95** | |||
| (1.07) | (1.10) | (1.05) | ||||
| Differentiation advantage a | 0.02 | −0.00 | 0.01 | −1.46** | −5.68*** | −1.60** |
| (0.04) | (0.07) | (0.04) | (0.51) | (1.36) | (0.50) | |
| Low-cost advantage a | −0.02 | −0.02 | −0.02 | 1.51*** | 1.48*** | 4.01*** |
| (0.02) | (0.02) | (0.05) | (0.20) | (0.20) | (0.98) | |
| Firm age | 0.03** | 0.03** | 0.03** | −0.01 | −0.01 | −0.02 |
| (0.01) | (0.01) | (0.01) | (0.14) | (0.14) | (0.14) | |
| Firm size b | 0.05*** | 0.05*** | 0.05*** | −0.53*** | −0.51*** | −0.52*** |
| (0.01) | (0.01) | (0.01) | (0.10) | (0.10) | (0.09) | |
| Debt ratio | 0.01 | 0.01 | 0.01 | 0.95** | 0.96** | 1.04*** |
| (0.02) | (0.02) | (0.02) | (0.29) | (0.30) | (0.30) | |
| Industry competition | 0.07 | 0.06 | 0.07 | 0.43 | 0.79 | 0.41 |
| (0.06) | (0.06) | (0.06) | (0.67) | (0.67) | (0.68) | |
| Inverse Mills ratio | 0.01 | 0.01 | 0.01 | 0.19 | 0.18 | 0.20 |
| (0.01) | (0.01) | (0.01) | (0.17) | (0.17) | (0.18) | |
| Industry-year CR awards | 0.13*** | 0.13*** | 0.13*** | |||
| (0.02) | (0.02) | (0.02) | ||||
| Years as UNGC signatory (lagged) c | −0.01*** | −0.01*** | −0.01*** | |||
| (0.00) | (0.00) | (0.00) | ||||
| Differentiation Advantage a × Industry-Year CR Awards | 0.06 | |||||
| (0.11) | ||||||
| Differentiation Advantage a × Years as UNGC Signatory (lagged) c | −0.02 | |||||
| (0.01) | ||||||
| Low-Cost Advantage a × Industry-Year CR Awards | 0.01 | |||||
| (0.10) | ||||||
| Low-Cost Advantage a × Years as UNGC Signatory (lagged) c | −0.01* | |||||
| (0.01) | ||||||
| Differentiation Advantage a × Stakeholder Management | 8.74*** | |||||
| (2.63) | ||||||
| Low-Cost Advantage a × Stakeholder Management | −5.35** | |||||
| (2.00) | ||||||
| Firm fixed effects | Yes | Yes | Yes | Yes | Yes | Yes |
| Year fixed effects | Yes | Yes | Yes | Yes | Yes | Yes |
| F statistic | 137.04*** | 125.48*** | 125.24*** | 30.53*** | 29.60*** | 27.50*** |
| R 2 | 0.46 | 0.46 | 0.46 | 0.08 | 0.08 | 0.05 |
| Underidentification test (LM statistic) | 51.54*** | 54.55*** | 54.92*** | |||
| Weak identification test (F statistic) | 27.83 | 14.78 | 15.16 | |||
| Overidentification test (Hansen J statistic) | Yes (0.72) | Yes (0.61) | Yes (0.98) | |||
| N | 4,833 | 4,833 | 4,833 | 4,833 | 4,833 | 4,833 |
Note: Robust standard errors clustered by firm are in parentheses. CR = corporate responsibility; UNGC = United Nations Global Compact.
Industry adjusted.
Natural logarithm.
Lagged by 1 year. Incorporating industry fixed effects (instead of firm fixed effects) produces similar results.
†p < .10. *p < .05. **p < .01. ***p < .001.
Appendix B
2SLS IV Regression Models on the Effects of Primary and Secondary Stakeholder Management
| Second Stage (Heckman) | ||||||||
|---|---|---|---|---|---|---|---|---|
| First Stage (2SLS) | Second Stage (2SLS) | |||||||
| PRIM_SM | SEC_SM | PRIM_SM | SEC_SM | Tobin's Q | ||||
| Variable | (1) | (2) | (3) | (4) | (5) | (6) | (7) | (8) |
| Differentiation advantage a | −0.03 | 0.11 | −0.00 | 0.10* | −8.38*** | −4.64*** | −1.46** | −1.44** |
| (0.06) | (0.07) | (0.04) | (0.05) | (1.70) | (1.07) | (0.52) | (0.48) | |
| Low-cost advantage a | −0.01 | −0.02 | −0.01 | −0.05 | 1.37*** | 1.58*** | 0.17 | 2.66*** |
| (0.02) | (0.02) | (0.03) | (0.03) | (0.21) | (0.18) | (1.72) | (0.61) | |
| Firm age | 0.00 | 0.02 | 0.00 | 0.02 | 0.01 | −0.03 | 0.02 | −0.03 |
| (0.01) | (0.01) | (0.01) | (0.01) | (0.14) | (0.13) | (0.14) | (0.13) | |
| Firm size b | 0.04*** | 0.05*** | 0.04*** | 0.05*** | −0.41*** | −0.32*** | −0.46*** | −0.35*** |
| (0.01) | (0.01) | (0.01) | (0.01) | (0.08) | (0.08) | (0.09) | (0.08) | |
| Debt ratio | 0.00 | −0.02 | 0.00 | −0.02 | 1.10*** | 0.75** | 0.97** | 0.86** |
| (0.02) | (0.02) | (0.02) | (0.02) | (0.30) | (0.27) | (0.30) | (0.27) | |
| Industry competition | 0.02 | 0.27** | −0.02 | 0.26** | 0.87 | 0.33 | 0.62 | −0.06 |
| (0.07) | (0.08) | (0.07) | (0.08) | (0.67) | (0.65) | (0.68) | (0.63) | |
| Inverse Mills ratio | −0.01 | 0.03* | −0.01 | 0.03* | 0.26 | 0.29 | 0.26 | 0.28 |
| (0.01) | (0.01) | (0.01) | (0.01) | (0.18) | (0.18) | (0.18) | (0.19) | |
| Years as UNGC signatory | 0.03*** | 0.10*** | 0.03* | 0.09*** | ||||
| (0.01) | (0.01) | (0.01) | (0.01) | |||||
| Years as UNGC signatory (lagged) c | −0.04*** | −0.10*** | −0.03*** | −0.10*** | ||||
| (0.01) | (0.01) | (0.01) | (0.01) | |||||
| BD_Diversity | 0.09*** | 0.04*** | ||||||
| (0.01) | (0.01) | |||||||
| Differentiation Advantage a × Years as UNGC Signatory | −0.13 | −0.01 | ||||||
| (0.08) | (0.09) | |||||||
| Differentiation advantage a × Years as UNGC signatory (lagged) c | 0.13 | −0.00 | ||||||
| (0.09) | (0.10) | |||||||
| Differentiation Advantage a × BD_Diversity | 0.09 | 0.02 | ||||||
| (0.07) | (0.08) | |||||||
| EXE_Diversity | 0.05*** | 0.03** | ||||||
| (0.01) | (0.01) | |||||||
| Low-Cost Advantage a × Years as UNGC Signatory | 0.07 | 0.09 | ||||||
| (0.07) | (0.06) | |||||||
| Low-Cost Advantage a × Years as UNGC Signatory (lagged) c | −0.10 | −0.11 | ||||||
| (0.08) | (0.07) | |||||||
| Low Cost Advantage a × EXE_Diversity | 0.02 | 0.07 | ||||||
| (0.05) | (0.05) | |||||||
| Primary SM | 0.75 | 1.84* | ||||||
| (0.64) | (0.86) | |||||||
| Secondary SM | 0.39 | 1.14† | ||||||
| (0.58) | (0.59) | |||||||
| Differentiation Advantage a × Primary SM | 13.39*** | |||||||
| (3.12) | ||||||||
| Differentiation Advantage a × Secondary SM | 7.57*** | |||||||
| (2.29) | ||||||||
| Low-Cost Advantage a × Primary SM | 2.50 | |||||||
| (3.21) | ||||||||
| Low-Cost Advantage a × Secondary SM | −2.47† | |||||||
| (1.39) | ||||||||
| Firm fixed effects | Yes | Yes | Yes | Yes | Yes | Yes | Yes | Yes |
| Year fixed effects | Yes | Yes | Yes | Yes | Yes | Yes | Yes | Yes |
| F statistic | 52.11*** | 113.42*** | 49.03*** | 115.70*** | 31.47*** | 32.20*** | 30.89*** | 31.30*** |
| R 2 | 0.28 | 0.51 | 0.27 | 0.51 | 0.12 | 0.15 | 0.11 | 0.15 |
| Underidentification test (LM statistic) | 138.28*** | 98.36*** | 69.79*** | 102.45*** | ||||
| Weak identification test (F statistic) | 25.66 | 20.53 | 13.15 | 22.12 | ||||
| Overidentification test (Hansen J statistic) | Yes (0.23) | Yes (0.07) | Yes (0.00) | Yes (0.00) | ||||
| N | 4,656 | 4,511 | 4,659 | 4,514 | 4,656 | 4,511 | 4,659 | 4,514 |
Note: Robust standard errors clustered by firm are in parentheses. PRIM_SM = primary stakeholder management; SEC_SM = secondary stakeholder management; UNGC = United Nations Global Compact; BD_Diversity = board gender diversity percent score; EXE_Diversity = executive members gender diversity percent score.
Industry-adjusted.
Natural logarithm.
Lagged by 1 year.
†p < .10. *p < .05. **p < .01. ***p < .001.
Appendix C
Thomson Reuters ESG Measurement
| Component of Stakeholder Management | Thomson Reuters ESG Category | Definition |
|---|---|---|
| Primary stakeholder management | Workforce | The workforce score measures a company's effectiveness toward job satisfaction, a healthy and safe workplace, maintaining diversity and equal opportunities, and development opportunities for its workforce. |
| Product responsibility | The product responsibility score reflects a company's capacity to produce quality goods and services integrating the customer's health and safety, integrity, and data privacy. | |
| Shareholders | The shareholders score measures a company's effectiveness toward equal treatment of shareholders and the use of anti-takeover devices. | |
| Management | The management score measures a company's commitment and effectiveness toward following best-practice corporate governance principles. | |
| Secondary stakeholder management | Resource use | The resource use score reflects a company's performance and capacity to reduce the use of materials, energy, or water and to find more eco-efficient solutions by improving supply chain management. |
| Emissions | The emission reduction score measures a company's commitment and effectiveness toward reducing environmental emission in the production and operational processes. | |
| Environmental innovation | The innovation score reflects a company's capacity to reduce the environmental costs and burdens for its customers, thereby creating new market opportunities through new environmental technologies and processes or eco-designed products. | |
| Human rights | The human rights score measures a company's effectiveness toward respecting the fundamental human rights conventions. | |
| Community | The community score measures the company's commitment toward being a good citizen, protecting public health and respecting business ethics. | |
| CSR strategy | The CSR strategy score reflects a company's practices to communicate that it integrates the economic (financial), social, and environmental dimensions into its day-to-day decision-making processes. |
Acknowledgments
We thank Philip Bromiley, Rodolphe Durand, participants at the Strategic Management Society (SMS) 2019 Minneapolis conference, the Administrative Sciences Association of Canada 2019 conference at St. Catharines, and the Stakeholders, Partnerships, and Competitive Advantage workshop at SMS Minneapolis for helpful comments and feedback on earlier versions of this manuscript. We also acknowledge the insightful and constructive comments of the editor Pursey Heugens and the anonymous reviewers. Remaining errors are our own.