
Abstract
Supplier resources are critical to the success of downstream firms. The relational view and resource dependence theory predict how supplier-specific investments and supplier dependence make the supplier more willing to allocate its best resources to the focal buyer relative to other buyers. However, these theories are ambiguous regarding the interplay between these two constructs. Specifically, the combination could either create relational synergies that benefit the focal buyer or create a situation in which the supplier reconsiders its resource allocation decisions and potentially allocates its resources to the accounts of other buyers. We investigated these competing views by building on two independent dyadic datasets. We found positive effects for both a buyer's supplier-specific investments and supplier dependence on supplier resource allocation, which is measured as the supplier's allocation of physical and innovation resources to the focal buyer relative to competing buyers. However, we also found evidence that supplier dependence negatively moderates the effect of supplier-specific investments on supplier resource allocation. Hence, the effect of supplier-specific investments weakens when the supplier is dependent on the buyer's business volume. These findings make an important empirical contribution to the literature by clarifying the dual workings of supplier-specific investments and supplier dependence as mechanisms to influence supplier resource allocation. We discuss several implications for the buyer-supplier relationship literature and the broader management literature.
Introduction
The relationships that firms have with their suppliers provide access to suppliers’ competencies and resources, which can be leveraged to improve firm-level performance (Das & Teng, 2000; Dyer & Hatch, 2006; Hunt & Davis, 2008; Kim & Choi, 2018). However, buying firms often find themselves competing for the supplier's limited resources. In practice, these resources are unequally distributed among buyers (Gulati, Nohria, & Zaheer, 2000; Mitsuhashi & Greve, 2009; Takeishi, 2002); thus, how the supplier prioritizes buyers is an important factor for the competitiveness of the buying firm (Dyer & Hatch, 2006; Wang, Tai, & Grover, 2013). As a case in point, in the first quarter of 2021, car manufacturers worldwide had to decrease production by 1.3 million cars because of a shortage of semiconductors (Keohane, Bushey, & Miller, 2021). Insufficient capacity meant suppliers had to prioritize some buyers over others. The literature identifies supplier-specific investments by the buying firm as a key factor that drives these resource allocation decisions by suppliers. Indeed, cost considerations made many car manufacturers lower their upstream investments in newer technologies, which led to the automotive industry finding itself at the back of the line for chips (Ewing & Clark, 2021; Sweney, 2021). The literature also identifies supplier dependence as one of the factors that impact supplier resource allocation. Despite expected losses in sales of over $60 billion in 2021, car manufacturers only account for a relatively small share of the overall semiconductor market, giving them little leverage compared to major players such as Apple, Samsung, HP, and Dell (King, Wu, & Pogkas, 2021; Sweney, 2021).
These recent developments where buyers suffered from a serious semiconductor supply shortage are a magnified example of how, more generally, suppliers make day-to-day allocation decisions regarding resources such as production capacity, engineers, and technological knowledge. Our study considers the effects of both supplier-specific investments and supplier dependence in explaining supplier resource allocation. Supplier-specific investments are investments made by the buying firm that are uniquely dedicated to a specific supplier and have little value outside this relationship (Bensaou & Anderson, 1999). These investments are argued to improve supplier resource allocation because they signal commitment and an intention to invest in a long-term relationship (De Vita, Tekaya, & Wang, 2011; Rokkan, Heide, & Wathne, 2003), which, in turn, incentivizes the supplier to commit to the relationship and reciprocate the buyer's investment (Bensaou & Anderson, 1999). Indeed, the relational view (Dyer & Singh, 1998) argues that relation-specific investments by partners can yield performance benefits that are not achieved by similar relationships with lower investments. This stimulates the supplier to prioritize the investing buyer over others, suggesting an overall positive effect of supplier-specific investments on supplier resource allocation. However, the relational view also hints at the potential negative effects of supplier-specific investments. Because the supplier may perceive the investments by the buyer as a barrier to exiting the relationship, supplier-specific investments could create unintended lock-in effects (Dyer, Singh, & Hesterly, 2018).
A supplier's dependence, understood as the extent to which a supplier firm relies on the business volumes of the focal buyer (Elking, Paraskevas, Grimm, Corsi, & Steven, 2017; Kim & Zhu, 2018), is another key factor that influences supplier resource allocation. According to resource dependence theory, supplier dependence is a source of uncertainty that affects the behavior of the supplier (Casciaro & Piskorski, 2005; Provan & Skinner, 1989). Specifically, for the dependent supplier, the future actions of the high-volume buyer are unknown, which leads to a situation in which the supplier's continued success is uncertain (Hillman, Withers, & Collins, 2009; Sutton, Devine, Lamont, & Holmes, 2021). To reduce this uncertainty, the supplier aims to stabilize the relationship by allocating resources to the buyer (Elking et al., 2017). However, the supplier may also seek to reduce uncertainty by cultivating relationships with alternative buyers (Casciaro & Piskorski, 2005), which could negatively affect the focal buyer.
Although the literature generally points toward an overall positive effect of supplier-specific investments and supplier dependence on supplier resource allocation, we know little about their interplay and whether they are complements or substitutes (Siggelkow, 2002). Specifically, it is unknown whether supplier dependence reduces or increases the effectiveness of supplier-specific investments by buying firms seeking to access the supplier's resources. In the relational view, Dyer and Singh (1998) argue that the greater the exchange volume between partners, the more efficiently relation-specific investments can be leveraged. This suggests a mechanism where the buyer's investments in a dependent supplier signal long-term commitment, eliminating uncertainty so that the supplier reciprocates the buyer's investments. However, building on resource dependence theory, Casciaro and Piskorski (2005) present a different view and argue that dependence weakens the effects of supplier-specific investments. In this view, the dependent supplier perceives supplier-specific investments as an exit barrier that creates a lock-in for the buyer (Rokkan et al., 2003). This reduces the need for the supplier to allocate its best resources and even opens up the possibility to allocate its resources to competing accounts without any serious repercussions from the high-volume buyer (Casciaro & Piskorski, 2005). Considering these competing rationales, the following key question arises: How does supplier dependence influence the effects of supplier-specific investments?
We address this question and test competing hypotheses that argue that supplier dependence and supplier-specific investments may be complements or substitutes in stimulating how a supplier prioritizes its buyers (i.e., relative resource allocation). Our findings exhibit a positive effect of supplier-specific investment and supplier dependence individually but reveal that these constructs are substitutes in terms of their joint effect. That is, supplier dependence negatively moderates the relation between supplier-specific investment and resource allocation, such that the benefits of supplier-specific investments decrease when supplier dependence increases. We find these results to be consistent across two studies with separate dyadic samples. While existing research has reported a positive effect of supplier-specific investments on supplier resource allocation behavior (e.g., Cheung, Myers, & Mentzer, 2011; Dyer & Hatch, 2006), we make an important empirical contribution to the literature by showing that this may critically depend on a supplier's dependence on the buyer. We highlight the implications for the management literature seeking to explain a supplier's contingent decisions (e.g., Kim & Choi, 2018; Villena, Choi, & Revilla, 2019), for the research on resource exchange in interorganizational relationships (Das & Teng, 2000; Hunt & Davis, 2008), and for the broader literature on interorganizational relationships (Barringer & Harrison, 2000; Das & Teng, 2000). Finally, we discuss the implications of this paper for signaling theory and transaction cost economics (TCE).
Supplier Resource Allocation
Naturally, the core of a buyer-supplier relationship is the exchange of goods/services for money. However, the organizational resources that the supplier allocates to the development, production, and distribution of goods together with the knowledge exchanged and created in everyday interactions determine how much value the focal buyer gains from the relationship. Such resources include engineering work on shared projects, the latest technologies, know-how, ideas, expertise, and production capacity. The allocation of these resources to interfirm collaborations is a selective process in which opportunities to form collaborations are unequally distributed among firms (Mitsuhashi & Greve, 2009). For instance, in a study among Japanese car manufacturers, Takeishi (2002: 328) observed how suppliers intentionally transfer technological and managerial knowledge among manufacturers; however, they noted that some manufacturers obtained higher knowledge levels than others “although they all outsourced to the same supplier.” Henke and Zhang (2010: 43) described how automotive suppliers differentiate among buyers not only regarding physical resources (e.g., semiconductor capacity) but also regarding innovation resources where some customers “(…) are more likely to be given access—sometimes exclusive—to supplier innovations before the supplier takes the technology to other customers.” This poses particular requirements on the buyer, as illustrated by a quote from a supply manager in the information technology industry: “You always want to be a customer of choice. And to be the customer of choice, you want to have the kind of partnership where you are making your supplier work on some of your most innovative activity. And if you do that consistently and honestly, the suppliers will give [your organization] the most talented resources [it has]” (Su, Levina, & Ross, 2016: 87). Indeed, these supplier resources are an important determinant of firm-level competitive advantage (Das & Teng, 2000), as comparative advantages relative to competitors in supplier resource allocation allow the firm to more easily gain competitive advantages in its downstream market (Hunt & Davis, 2008).
Because there are limits to the resources that suppliers can dedicate to specific buyers, the prioritization of one buyer comes at the expense of another. For instance, Lavie (2007) discussed how firms deliberately differentiate among alliance partners and allocate their resources and attention accordingly. Similarly, Gulati et al. (2000: 210) noted that firms “may only have the time and resources to form and satisfy the expectations of a limited number of alliances. By making choices to ally with some partners, others are ipso facto excluded.” Indeed, insights from the marketing literature show that suppliers differentiate between buyers, treating some individual buyers or segments as preferred and others as standard (Wetzel, Hammerschmidt, & Zablah, 2014). This implies that buying firms can actively shape their supplier relationships and influence supplier resource allocation decisions (Lorenzoni & Lipparini, 1999; Mahmood, Zhu, & Zajac, 2011; McEvily & Marcus, 2005; Wang et al., 2013).
The dependent variable in our study is supplier resource allocation to the focal buyer relative to other buyers in the supplier's portfolio. We distinguish between physical (e.g., scarce materials) and innovative (e.g., key technological information) resources. The former refers to production decisions where the supplier faces capacity restrictions and has to prioritize buyers. The latter refers to knowledge-sharing decisions regarding potential new business or product and process innovations. Suppliers allocate these types of resources among competing buyers in their portfolios, and allocation choices are often not explicitly specified or contractually arranged (Gulati et al., 2000).
Hypotheses
We develop two baseline hypotheses regarding the overall effects of supplier-specific investments and supplier dependence (Hypotheses 1 [H1] and H2). This is followed by two competing hypotheses, one on the positive moderation effect of supplier dependence on supplier-specific investments and one on the negative moderation effect (H3 and H4, respectively).
Baseline: Supplier-Specific Investments
A considerable number of studies have addressed how relation-specific investments yield positive relational outcomes (De Vita et al., 2011). Underlying these studies is the notion that relationships develop over time, where relation-specific investments signal commitment and intentions to invest in a long-term relationship (De Vita et al., 2011; Lui, Wong, & Liu, 2009; Rokkan et al., 2003). The studies of Dyer (1996, 1997) and Jap (1999) documented how relation-specific investments in buyer-supplier relationships resulted in synergistic benefits. Dyer and Singh's (1998) relational view captures the essence of this understanding. Relation-specific investments are a central element in this theory, which argues that the larger the partners’ relation-specific investments, the greater the potential for synergistic profits.
Especially in industries where the success of a firm is largely dependent on its suppliers’ performance (e.g., automobile, electronics), supplier-specific investments in knowledge sharing routines or supplier development programs tailored toward individual suppliers are common practice (Dyer & Hatch, 2006; Mesquita, Anand, & Brush, 2008). Supplier-specific investments create positive expectations of continued future exchanges (Heide & John, 1990), and the buyer's investment increases the supplier's chance of reaping long-term benefits (Rokkan et al., 2003). The buyer's investments indicate potential future value for the supplier, which justifies their reciprocation of the buyer's commitment (Rokkan et al., 2003). The supplier will compare the relational value of a specific buyer with the value gained in alternative relationships (Anderson & Narus, 1990; Steensma & Lyles, 2000). Especially compared to similar noninvesting buyers, the investing buyer is a more attractive alternative to the supplier and is more likely to be the supplier's priority. Relational investments therefore provide the supplier with an incentive to prioritize the investing buyer and allocate resources accordingly. Dyer (1997) notes that buyers employing arm's-length relationships without any investments are unlikely to receive the supplier's newest technologies, ideas, or efforts, which are needed for successful collaboration.
Hence, by committing to the relationship and investing in the specific exchange, the buyer encourages the supplier to increase the resources allocated to the relationship (Dyer & Singh, 1998; Muthusamy & White, 2005). Overall, these mechanisms predict a positive effect of supplier-specific investments. Therefore, we expect the following:
Hypothesis 1a: The buying firm's supplier-specific investments are positively associated with the supplier's allocation of physical resources to the buyer's account. Hypothesis 1b: The buying firm's supplier-specific investments are positively associated with the supplier's allocation of innovation resources to the buyer's account.
Baseline: Supplier Dependence
A central proposition in resource dependence theory is that to reduce the uncertainty related to dependence on another firm's resources, a firm will try to restructure its resource dependencies with various tactics (Pfeffer & Salancik, 1978). When considering buyer-supplier exchanges, suppliers are dependent on the buying firm when they rely on the buying firm for a significant portion of their revenue stream (Elking et al., 2017; Kim & Zhu, 2018). Greater dependence is typically viewed as involving greater uncertainty, which would motivate the supplier to take action (Hillman et al., 2009). This type of uncertainty has also been referred to as state uncertainty, which relates to the uncertainty about the actions of key organizations that a firm relies on for its survival (Milliken, 1987). This uncertainty exists when the dependent firm does not know what the relationship with the high-volume firm will be like in the future (Sutton et al., 2021). Dependent suppliers therefore seek to stabilize the relationships in a way that benefits the buying firm in an attempt to tie the buyer to the relationship (Casciaro & Piskorski, 2005). In particular, the accounts of major buyers must be satisfied, since such customers would be far more difficult to replace than smaller customers (Provan & Gassenheimer, 1994). The supplier can aim to improve its position by allocating better resources and, thus, reduce the likelihood that the buyer will shift its purchase volume to competing suppliers or even exit the relationship.
In general, the supplier will be more motivated to allocate resources to a high-volume buyer to ensure relationship continuation compared to a buyer whose volumes are lower and can be more easily replaced. For example, Brito and Miguel (2017) show how suppliers generally accept dependencies on buyers and concede to fulfill the buyer's expectations, given the relevance of high-volume orders. Additionally, Villena and Craighead (2017) found that larger buyers perceive lower levels of supplier opportunism when the supplier is smaller. Therefore, we hypothesize the following:
Hypothesis 2a: The supplier's dependence is positively associated with the supplier's allocation of physical resources to the buyer's account. Hypothesis 2b: The supplier's dependence is positively associated with the supplier's allocation of innovation resources to the buyer's account.
The Moderating Effect of Supplier Dependence on Supplier-Specific Investments
The above baseline hypotheses predict an overall positive effect of supplier-specific investments and supplier dependence. This could hint at a positive moderating effect of supplier dependence on the relationship between supplier-specific investments and supplier resource allocation, as the supplier is more likely to reciprocate the buyer's investments if a higher business volume is at stake. However, both concepts have dual sides. For instance, although supplier-specific investments hold considerable potential in terms of relational benefits, they also involve considerable risk (Bensaou & Anderson, 1999). The relational view stipulates how specific investments can create a lock-in situation for the buyer (Dyer et al., 2018; Dyer & Singh, 1998). Similarly, the uncertainty created by high supplier dependence may stimulate the supplier to act more favorably toward the buyer, but it may also result in the supplier seeking to reduce uncertainty by restructuring its dependencies (Pfeffer & Salancik, 1978). One way for the supplier to do so is to bypass the high-volume buyer and invest in relationships with alternative buyers (Casciaro & Piskorski, 2005).
Below, we outline two competing hypotheses that posit an intricate relationship between supplier dependence and supplier-specific investments and detail the mechanisms of a positive and a negative moderation effect, capturing the dual nature of the constructs.
How supplier dependence strengthens the effects of supplier-specific investments
Specific investments by the buyer can be a source of the supplier's trust in the relationship (Poppo, Zhou, & Li, 2016) because the buyer assures the supplier of its commitment to these investments. Moreover, supplier-specific investments create positive expectations of continued future exchanges (Heide & John, 1990), and refraining from exploiting the buyer's investment increases the supplier's chance of reaping these long-term benefits (Rokkan et al., 2003). These buyer commitments can be expected to be especially valuable for the supplier in the case of high supplier dependence. When a supplier is dependent on the buyer's business volume, it may aim to “constrain” the buyer in the relationship (Casciaro & Piskorski, 2005). According to Bensaou and Anderson (1999), relationships work best when both sides have something to lose. The high uncertainty in a relationship caused by dependence makes the supplier want the reassurance that the buyer will not engage in opportunistic behavior or exit the relationship, which makes relational trust more important for the supplier (Das & Teng, 2001). Supplier-specific investments can therefore be expected to be more valuable for dependent suppliers because these investments make the supplier feel that the buyer will not take advantage of the supplier's dependence. Positive expectations of continued future exchanges provide the supplier with more reasons to allocate resources to the investing high-volume buyer and reduce the need to develop relations with other buyers.
Following this logic, supplier dependence is expected to strengthen the effect of supplier-specific investments on supplier resource allocation. Because the buyer's commitment in terms of supplier-specific investments reduces the supplier's uncertainty that comes from being dependent, the supplier will be more inclined to allocate its prime resources to the investing high-volume buyer. Indeed, it is through similar reasoning that Bensaou and Anderson (1999) explain their finding that buyers make more investments in business relationships that are more substantial overall. Considering the above, we expect the following:
Hypothesis 3a: The higher the supplier's dependence on the buyer's account, the larger the effect of supplier-specific investment on supplier resource allocation of physical resources will be. Hypothesis 3b: The higher the supplier's dependence on the buyer's account, the larger the effect of supplier-specific investment on supplier resource allocation of innovation resources will be.
How supplier dependence weakens the effects of supplier-specific investments
Although H1 predicts an overall positive effect of supplier-specific investments, the literature reports on occasions where the supplier refrains from deploying the necessary resources to the investing buyer (Handley & Benton, 2012). The long-term commitment by the buyer expressed by supplier-specific investments can also be interpreted as a barrier to exiting the relationship (Dyer et al., 2018). Hence, whereas H3a and H3b argued that investment by a high-volume buyer signals commitment, which motivates the supplier to prioritize the relationship, the high-volume buyer's investment also reduces the supplier's perceived risk of losing the investing buyer due to lock-in effects. If the supplier knows the buyer is at least somewhat locked into the relationship, its incentives to deliver superior performance to this buyer are reduced (Artz, 1999).
Supplier-specific investments inform the supplier that the buyer is already tied to the relationship, reducing the supplier's need to allocate resources toward the investing buyer. This can happen especially when the supplier is dependent on the buyer, as higher levels of dependence can make the supplier try and restructure its dependencies with a variety of tactics (Pfeffer & Salancik, 1978). Although the supplier will remain highly dependent on the buyer, the buyer's investments reduce the supplier's uncertainty about losing the buyer and even provide the supplier with opportunities to develop relationships with other buyers to expand business outside the relationship with the high-volume buyer (Casciaro & Piskorski, 2005). Arguably, the supplier could be reluctant to share better resources with other buyers under the threat of potential sanctions of the buyer (Provan, 1993). However, supplier-specific investments reduce the likelihood of such sanctions because the investing buyer now faces increased switching costs, thus reducing the supplier's risk that the buyer will exit the relationship.
Hence, the buyer's commitment in terms of supplier-specific investments reduces the supplier's risks of the buyer exiting the relationship, which allows the supplier to reconsider its resource allocation decisions and potentially allocate these to the accounts of other buyers. Overall, this rationale predicts that the positive benefits of supplier-specific investments are reduced in the presence of supplier dependence. Therefore, we expect the following:
Hypothesis 4a: The higher the supplier's dependence on the buyer's account, the smaller the effect of supplier-specific investments on supplier resource allocation of physical resources will be. Hypothesis 4b: The higher the supplier's dependence on the buyer's account, the smaller the effect of supplier-specific investments on supplier resource allocation of innovation resources will be.
Methodology
We test our hypotheses in two studies. The data for Study 1 were collected in April-June 2018 at a major wind turbine manufacturer. This manufacturer is a large multinational firm and the investments in its suppliers are based on formal supplier management programs. In Study 2, we test our hypotheses in a separate sample of six smaller manufacturing firms. The data for Study 2 were collected between July 2016 and January 2018. Study 1 and Study 2 are largely independent studies, and the results of Study 1 did not affect the design of Study 2 (and vice versa). Nevertheless, the data collected in Study 2 allow us to see if the findings of Study 1 hold in settings with smaller firms. Specifically, with Study 2 we show that the limitations of Study 1 do not appear to be limiting generalizability to (i) smaller manufacturers that have not implemented formal investment programs and (ii) firms that lack the reputational effects of the wind turbine manufacturer's brand (Kang, Mahoney, & Tan, 2009) and the general status advantages of multinationals (Castellucci & Ertug, 2010). In addition, Study 2 included different measures for supplier-specific investments and supplier dependence, showing the robustness of our findings for alternative measures. We provide more details on these samples in the respective sections below.
Study 1
The data for Study 1 were collected at a major wind turbine manufacturer located in Western Europe. The manufacturer is a global market leader that plays a critical role in many large energy projects worldwide. Successful supplier management is considered important at this firm. According to a senior business development manager, “the player with the best supply base will win the competition in the renewable energy market.” Consequently, the firm has implemented several advanced supplier management frameworks to increase its supplier performance. Given the importance of supplier resources to the success of the wind turbine manufacturer, this setting is considered highly suitable for testing our hypotheses.
Sample and Data Collection
Our data come from the wind turbine manufacturer and its suppliers. After signing a nondisclosure agreement, we received a list of 1,023 key contacts at 585 supplier sites. This list represents all the suppliers with which the manufacturer has spent over €100,000.00 and was retrieved from the manufacturer's information systems, where supply managers store information about their suppliers. The relationships with these suppliers are in line with Barringer and Harrison's (2000) description of alliances, which they define as loosely coupled arrangements between separate firms that have established a business exchange. More formal arrangements that could affect our dependent variables such as equity alliances, joint ventures, or interlocking directorates are not included in our data.
We sent a link to an online survey to all the contacts on the list. We arranged several meetings with senior supply managers at the buying firm to obtain feedback on our measurement items to ensure face validity. We used these insights to improve a small number of items and enhance their clarity. To reduce social desirability bias, the potential respondents were informed that their data would be anonymized and that the manufacturer would not be able to link the data to individual suppliers. In addition, we explained to the respondents that there were no “good” or “bad” answers and asked them to choose the option that would fit their firm's situation best.
We took several steps to increase the response rate. Before sending out the link to the survey, the suppliers were informed about the upcoming survey by the buying firm's purchasing executive. A week later, we sent an e-mail with the link to the survey, followed by two reminders to the nonrespondents in the weeks after. The survey was open for 1 month. This procedure resulted in 356 contacts (35.1% of the targeted supplier contacts) that completed the survey. This combined into data on 285 supplier firms (48.7% of the targeted supplier firms). We received secondary data from the wind turbine manufacturer to measure supplier-specific investments and several control variables. After combining the supplier data with the buyer data and removing all missing values, the final sample size was 237, of which 49 suppliers had two or more respondents. We used these 49 suppliers to assess interrater reliability scores by calculating the intraclass correlations (ICCs; Boyer & Verma, 2000). High ICCs indicate agreement between respondents that justifies the use of single respondents for firm-level measures and allows aggregating multiple responses. The ICC scores for our measures ranged between 0.672 and 0.887, which is above the 0.60 cutoff value for “good” agreement suggested by Boyer and Verma (2000) and similar to ICC scores reported in other research using multiple raters (e.g., Hardy, Day, & Steele, 2019). The exception is the measure for supplier resource allocation of innovation resources with an ICC score of 0.505, which is still above the 0.40 cutoff for a “fair” agreement (Cicchetti, 1994). Overall, these values indicate agreement between the respondents, which reduces the risk of respondent bias. For suppliers with multiple respondents, we used the average scores.
To assess nonresponse bias, we used two approaches. First, we compared the mean scores for the survey items of this study's latent variables of the first mailing group with those received after the two reminders. Comparative tests revealed no significant differences, with the largest t value being 0.756. Second, we conducted comparative tests using spend figures received from the manufacturer. This revealed a significant difference, with an average spend of €14.0 million for the respondents and €6.7 million for the nonrespondents. This difference is explained by 19 outliers with an average spend of €101 million. The final sample included all suppliers, but post hoc checks showed that our conclusions are not affected when removing the 19 large spend suppliers. Nevertheless, suppliers with larger spend amounts are overrepresented in the sample of Study 1. The final sample includes a mix of suppliers, with an average size of approximately 9,500 employees.
Measures
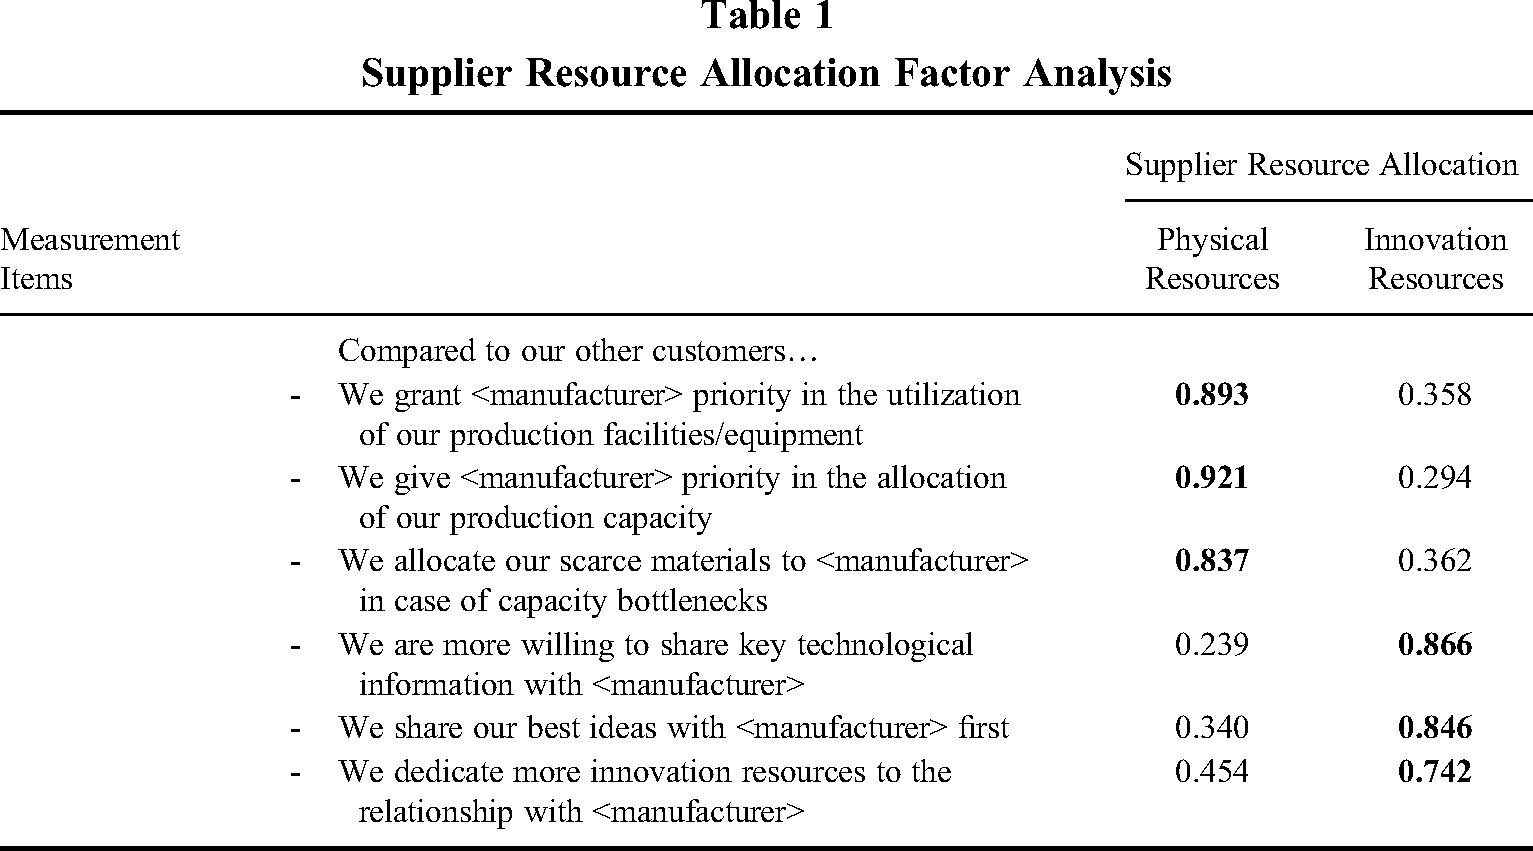
This study's dependent variable, supplier resource allocation, was measured on two dimensions: physical resources and innovation resources. This variable measured the extent to which the supplier allocates better resources to the wind turbine manufacturer compared to its competing buyers. The items were developed using the existing scales of Pulles, Veldman, Schiele, and Sierksma (2014) and were slightly adapted to fit the setting of our study. For instance, the items used to measure physical resource allocation capture equipment utilization as well as product and material fulfillment. The items were measured using a 7-point Likert-type scale, ranging from 1 (strongly disagree) to 7 (strongly agree). To ensure the discriminant validity of the supplier resource allocation items, we conducted a principal component analysis with varimax rotation. This returned a two-factor solution (see Table 1) with the items loading on the expected factor. We used the mean values of these items as our measure for the respective supplier resource allocation variables. The Cronbach's alpha for the physical resource allocation items was 0.94, and for the innovation resource allocation items, it was 0.87, indicating high reliability. The online supplement shows the items used in our surveys.
Supplier Resource Allocation Factor Analysis
For the measure of supplier-specific investments, we used data from the wind turbine manufacturer. The manufacturer introduced a supplier relationship framework in which it divides its suppliers into A, B, C, and D suppliers. A, B, and C suppliers are considered preferred and strategic suppliers. The suppliers are informed about this categorization, and the wind turbine manufacturer is committed to improving its relationships and collaborating with the A, B, and C suppliers. The categorization is not primarily based on traditional supplier segmentation dimensions such as spend but specifies the supplier-specific activities carried out by the manufacturer. The framework contains a range of activities that entail supplier-specific investments in these suppliers, such as joint product innovation, dedicated supplier account managers, performance dialogs, roadmap and strategy meetings, increased communication between top management, and dedicated cost reduction plans with increased intensity toward A-level suppliers. The D suppliers, on the contrary, are labeled transactional and receive no significant specific investments (termed “rarely” or “never” in the framework). Hence, there is a sharp distinction between C suppliers, who are subject to at least significant levels of specific investments, and D suppliers, where such investments are not made. The investments by the wind turbine manufacturer can be classified as human specificity (Dyer, 1997; Dyer & Singh, 1998) with dedicated personnel, specialized information, communication, and know-how as well as temporal specificity (Leiblein, 2003) which refers to investments in coordination between the organizations (e.g., performance dialogs, roadmap, and strategy meetings). We created a dummy variable based on the wind turbine manufacturer's differentiation of suppliers in which A, B, or C suppliers were coded 1. A robustness test with alternative coding (A = 4, B = 3, C = 2, D = 1) is provided in the online supplement and shows similar results as those presented below. In addition, we test the robustness of our findings with a different measure of supplier-specific investments in Study 2.
To measure supplier dependence, we asked the supplier to assess the wind turbine manufacturer's share in their turnover on a 0–100% scale, in which higher relative business volumes indicate higher supplier dependence. On average, the manufacturer accounts for 19.9% of the suppliers’ turnover (range: ∼0–98%, SD: 20.6). Relative business volumes are highly indicative of supplier dependence (Kim & Choi, 2018) and previous empirical studies have demonstrated the use of this measure as a proxy for the supplier's dependence (Elking et al., 2017; Kim & Zhu, 2018). In addition, in Study 2, we show how our findings are robust for alternative measures of dependence. We used the natural logarithm of the reported share in turnover for our supplier dependence measure.
Control Variables
We included several controls to capture the effects of supplier-specific attributes as well as relationship and product attributes. First, we controlled for the influence of relationship length. Previous research shows how exchange relationships develop over time (Vanneste, Puranam, & Kretschmer, 2014). For instance, suppliers might increase their preferences for certain buyers as the relationships develop and allocate resources accordingly. We asked the respondents from the supplier side to indicate the relationship length in years. We also controlled for the influence of supplier size, which could influence the dependence dynamics in a relationship (De Vita et al., 2011). We asked the respondents from the supplier side to indicate the number of employees in their firm.
For both relationship length and supplier size, we used the natural logarithm. In addition, we controlled for the type of product that was supplied. Based on the buyer's data, we created a dummy variable that distinguished between business services (e.g., transport, maintenance, installation) and components (e.g., towers, power train, blades). Both commodities are highly valuable to the manufacturer, but the nature of the exchange relationship can differ (e.g., transportation activities are often executed in projects, while components are produced continuously). Because this could influence the allocation of resources, we control for this. We also control for the supplier's comparative alternatives to the buying firm. If the supplier has many alternatives to the focal buyer, this may lower the supplier's potential switching costs and may thus influence the buyer's power position. We used three items based on Lavie, Haunschild, and Khanna's (2012) measure of indirect competition. These items measured the extent to which the supplier's other customers are from the renewable energy industry, are from the wind turbine industry, or are direct competitors of the wind turbine manufacturer. The Cronbach's alpha for these items was 0.91. Finally, we controlled for the buyer's dependence, because it may affect supplier-specific investments and supplier resource allocation. We used the natural logarithm of the wind turbine manufacturer's spending dedicated to the supplier relative to the overall spending on the suppliers in our sample supplying the same commodity.
Table 2 presents the means and standard deviations of the variables and the correlations between them.
Correlation Table Study 1a
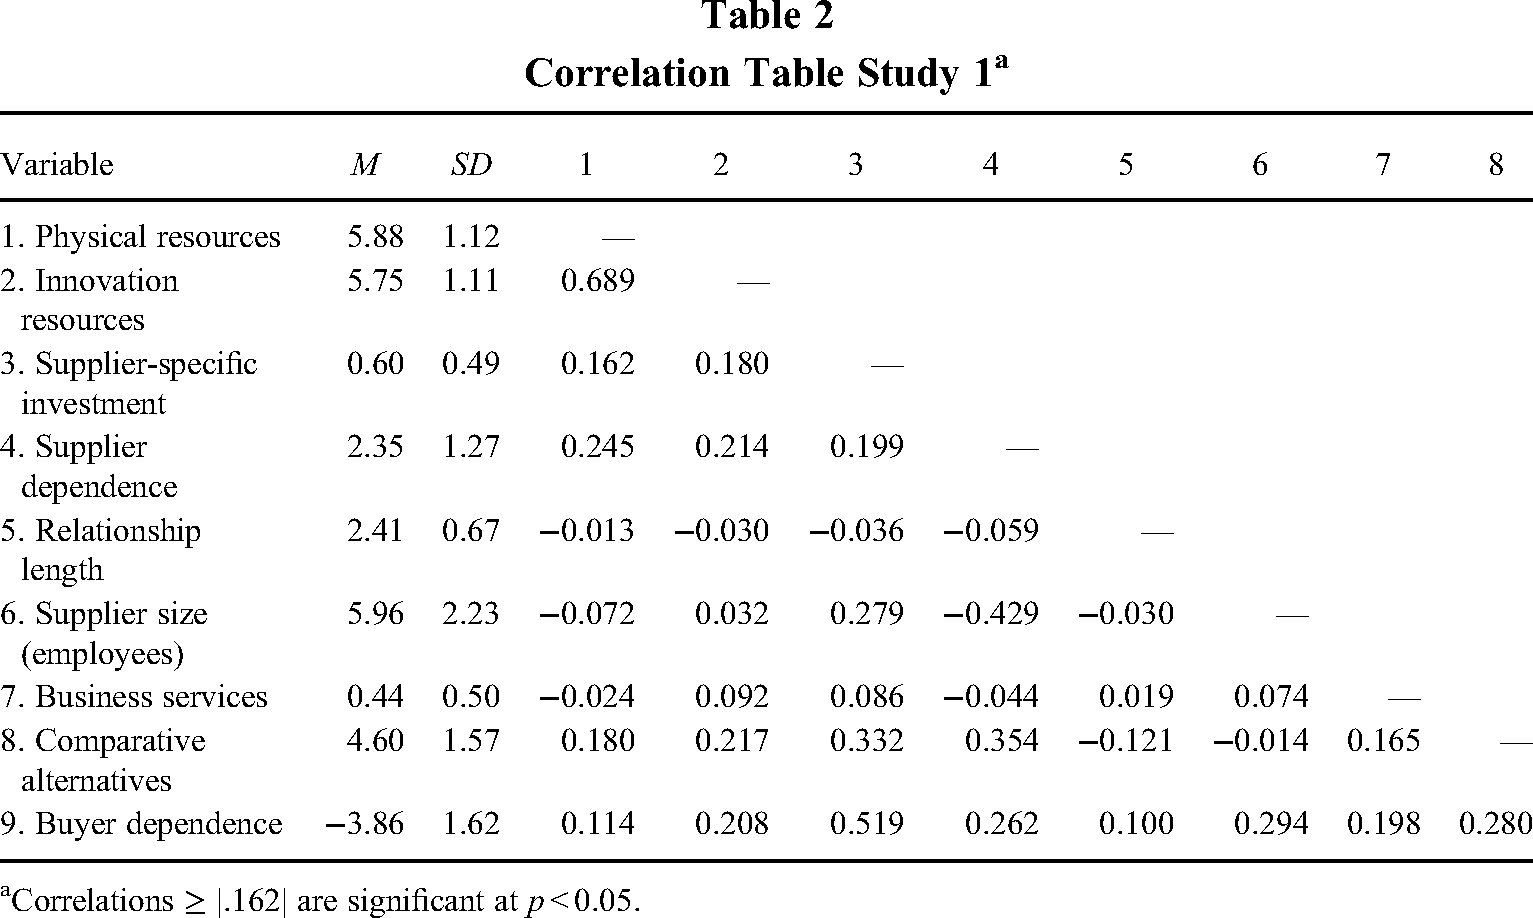
Correlations ≥ |.162| are significant at p < 0.05.
Results
Table 3 presents our ordinary least squares (OLS) analysis of how supplier-specific investments and supplier dependence affect supplier resource allocation. Baseline Models 1a and 2a present the relationships between the control variables, supplier physical resource allocation (Model 1), and supplier innovation resource allocation (Model 2). Models 1b and 2b include the direct effects of supplier-specific investments and supplier dependence, and Models 1c and 2c include their interaction term to test the moderating effect of supplier dependence on supplier-specific investments. The online supplement includes the results of a structural model with both dependent variables and shows that our results are robust using structural equation modeling.
OLS Regression Analysis for Supplier Resource Allocation Study 1a,b
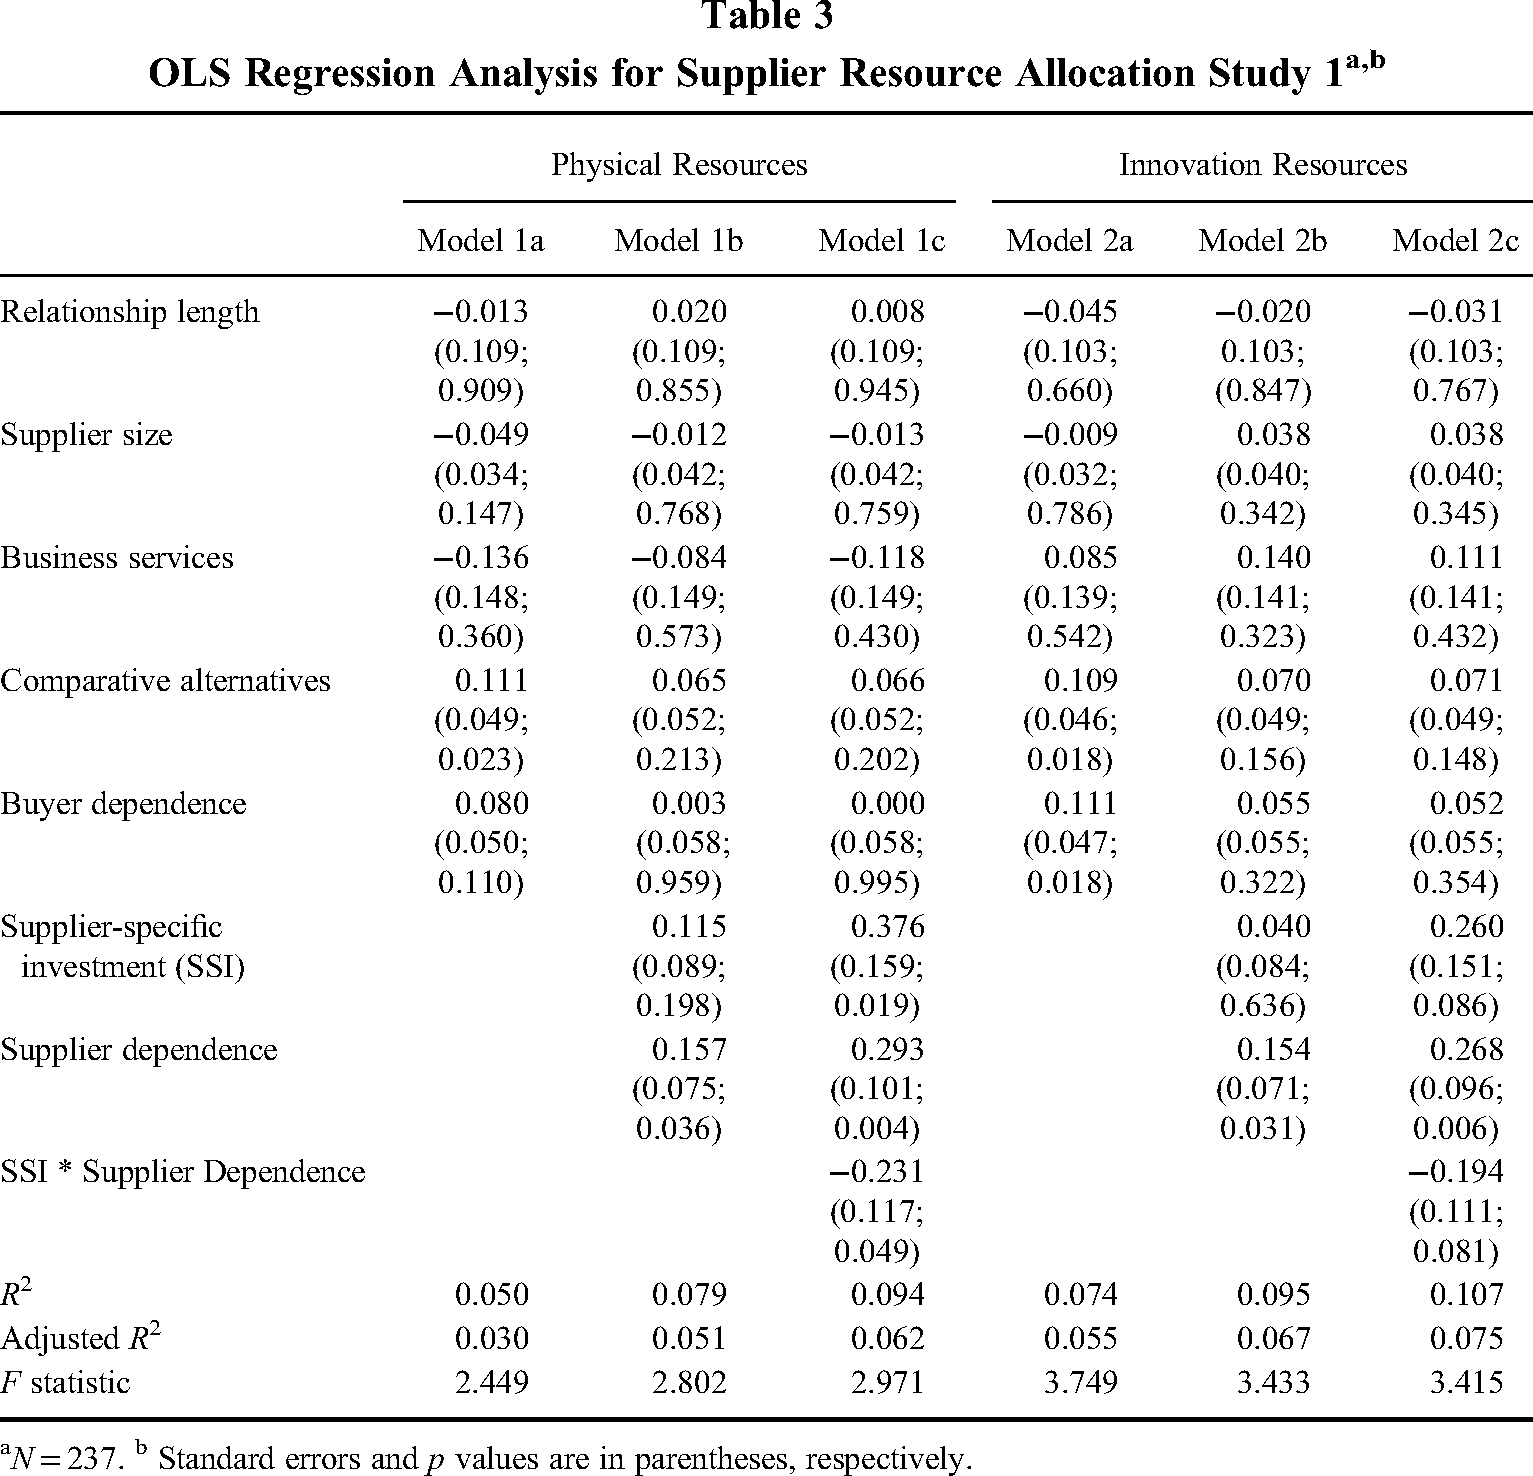
N = 237. b Standard errors and p values are in parentheses, respectively.
Both Models 1c and 2c demonstrate a positive effect of supplier-specific investments. The results provide general support for Hypotheses 1a and 1b, in that the coefficient of supplier-specific investments is positive and significant for physical resources (β = 0.376, p = 0.019) and significant at the 10% level for innovation resources (β = 0.260, p = 0.086). Consistent with our predictions, supplier-specific investments by the buying firm appear to positively relate to the supplier's allocation of resources to the buyer's account. Hypotheses 2a and 2b, which suggested a positive effect of supplier dependence on supplier resource allocation, are also supported by the results. Models 1c and 2c demonstrate a positive and significant coefficient of supplier dependence for physical resources (β = 0.293, p = 0.004) and for innovation resources (β = 0.268, p = 0.006).
Hypotheses 3 and 4 represented competing arguments on the moderation effect of supplier dependence on supplier-specific investments. The data of Study 1 supports H4a and H4b. Thus, the larger the relative dependence on the volume of the buyer's account, the smaller the effect of supplier-specific investments on supplier resource allocation. The coefficient of the interaction term is negative and significant for physical resources (β = −0.231, p = 0.049) and negative and significant at the 10% level for innovation resources (β = −0.194, p = 0.081). Figure 1 illustrates this moderation effect by plotting the suppliers’ reported resource allocation values for the suppliers that received supplier-specific investments and those that did not, while differentiating between “low” supplier dependence and “high” supplier dependence. We used a median split to generate these two groups. In the low dependence group, the suppliers reported an average 4.7% share in the turnover of the wind turbine manufacturer, while the high dependence group reported an average share of 37.9%.
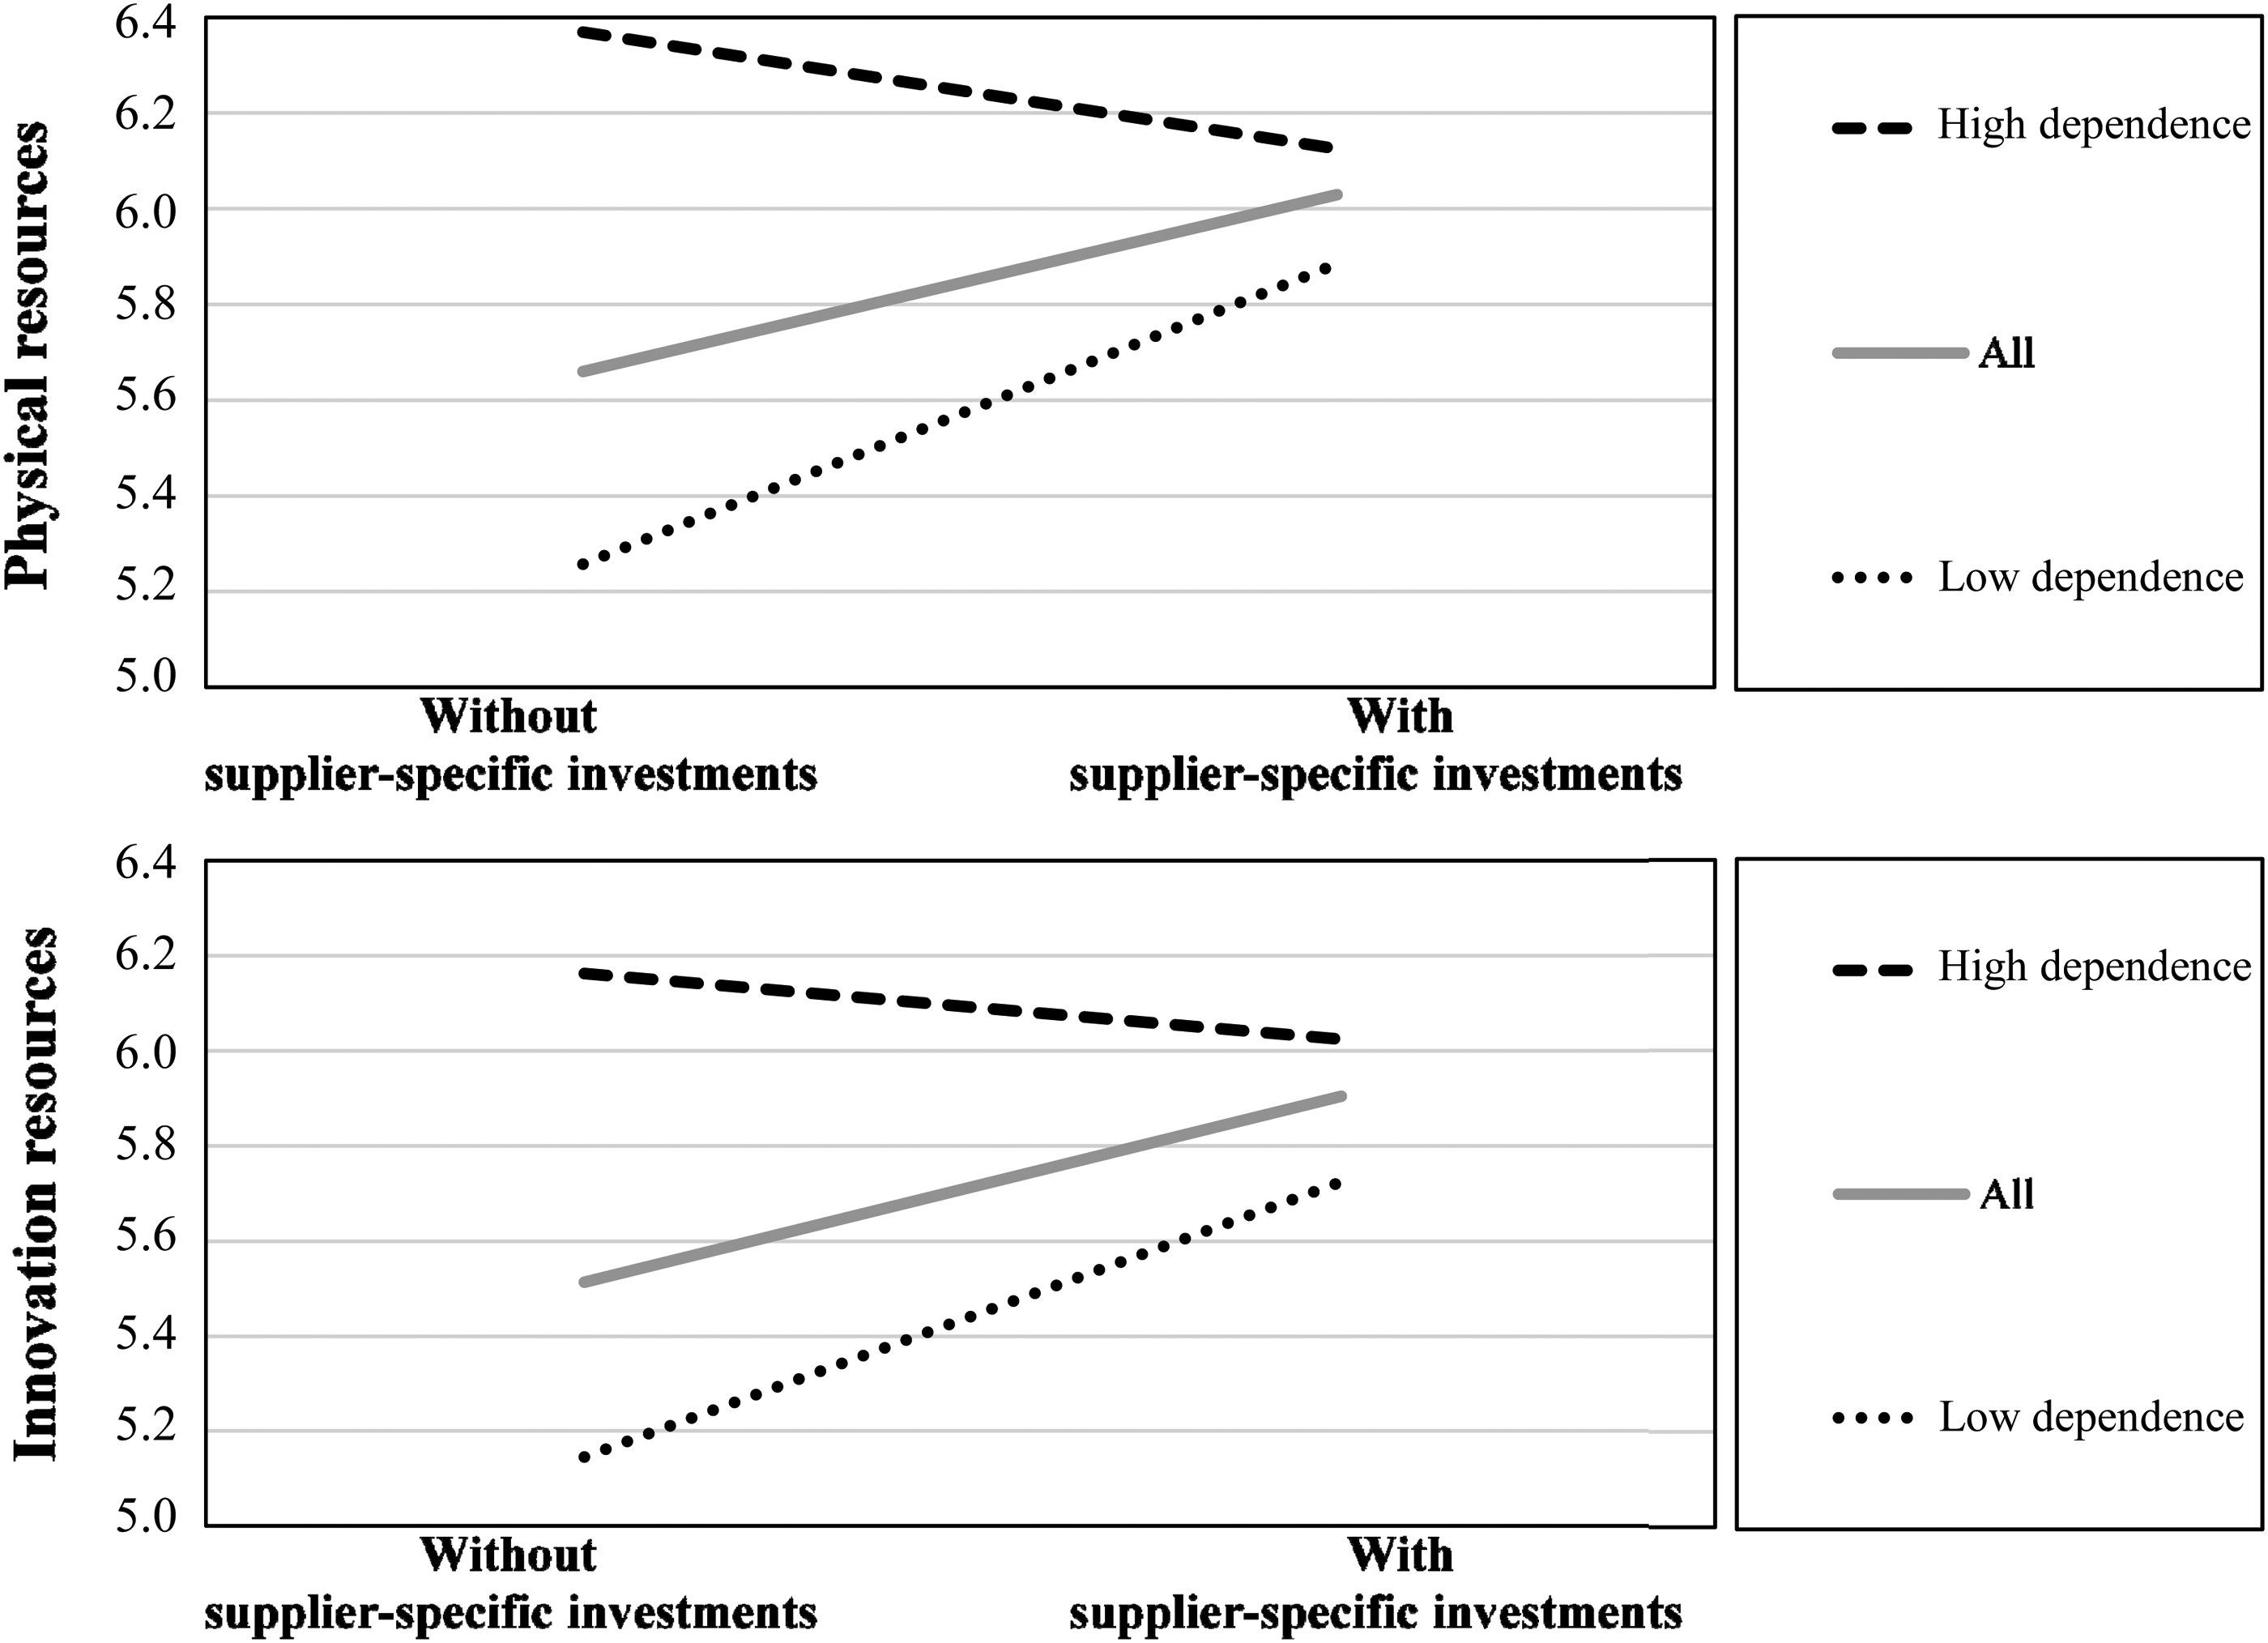
Moderation plots
We followed Aiken and West’s (1991) procedure to further examine the moderation effects and conducted simple slope tests. Using the high- and low-dependence groups, we find that supplier-specific investments positively and significantly relate to the supplier’s allocation of physical (β = 0.627, SE = 0.204, p = 0.003) and innovation resources (β = 0.580, SE = 0.189, p = 0.003) in the low supplier dependence group. However, as depicted in Figure 1, supplier-specific investments are negatively related to supplier resource allocation in the high supplier dependence group, although this effect was not significant (physical resources, β = −0.244, SE = 0.198, p = 0.219; innovation resources, β = −0.138, SE = 0.196, p = 0.481). These results suggest that supplier-specific investments yield better results when the buying firm has a low share in the supplier's turnover and that buyers with a high share in the supplier's turnover should exercise caution when making such investments.
Endogeneity
Endogeneity is a general concern for management studies. We follow Hill, Johnson, Greco, O’Boyle, and Walter (2021), who suggest assessing endogeneity concerns explicitly by addressing the four potential causes of endogeneity, which are as follows: measurement error, omitted variables, simultaneity, and sample selection. Measurement error can occur if the variables in the models are rated by the same respondent simultaneously. To reduce the likelihood of this type of endogeneity, we used different sources to collect our data. For instance, supplier-specific investments were measured with data from the wind turbine manufacturer, while the data to measure the dependent variable supplier resource allocation were gathered from the supplier firm. Although supplier dependence was measured from the supplier's side, we used a fact-based item with a different scale (assess the manufacturer's share in turnover on a 0–100% scale), which reduces the likelihood of measurement error (Chang, Van Witteloostuijn, & Eden, 2010). In addition, measurement error-driven endogeneity issues cannot be ruled out if construct reliability and discriminant validity are problematic. The measurement section describes how our multi-item constructs have high reliability (0.87 or higher) and discriminant validity, reducing the likelihood of measurement error.
Omitted variables may cause endogeneity issues when a variable is not included in the model but is related to both the independent and dependent variables. Although our controls of relationship length, supplier size, and the type of exchange (business service vs. product) reduce some of this bias, other omitted variables exist. The lack of relational trust as a control variable can especially lead to biased results, because trust is a major influence in buyer-supplier relationships (Poppo et al., 2016). We include buyer-supplier mutual trust as an additional control variable to address this issue, using two items from Doney and Cannon (1997, see online supplement). For this purpose, we included data from survey questions we asked at the wind turbine manufacturer's side. For these questions, we targeted supply managers to answer questions about the 285 suppliers who responded to our main survey. Often, the supply managers answered questions for multiple suppliers due to their responsibility for multiple relationships. We received 160 responses from the manufacturer's supply managers (response rate ∼56%). After combining these data and removing cases with missing values, the sample size for our model including mutual trust is 125. Although this sample size is relatively small, it does provide insights into how the omitted variable of mutual trust affects the coefficients in our model.
Table 4 presents the OLS analysis in which Models 1c and 2c can be considered robustness checks of our full model with a smaller sample (with reference to Models 1c and 2c in Table 3). Models 1d and 2d show how the coefficients are affected by including mutual trust. Our conclusions are unaffected with respect to the positive effect of supplier-specific investments on supplier resource allocation and the negative moderating effect of supplier dependence. That is, both hypothesized effects remain significant in Models 1d and 2d. However, the coefficient of supplier dependence appears to be less pronounced in Models 1d and 2d. Although any conclusions should be treated with care because of the relatively small sample size, it does appear that mutual trust as an omitted variable in our main sample (i.e., Table 3) influences the relationship between supplier dependence and supplier resource allocation. Other omitted variables that affect supplier resource allocations and could impact our findings are not included in our analysis. We note this as a limitation in our study.
OLS Regression Analysis Study 1 Including Mutual Trusta,b
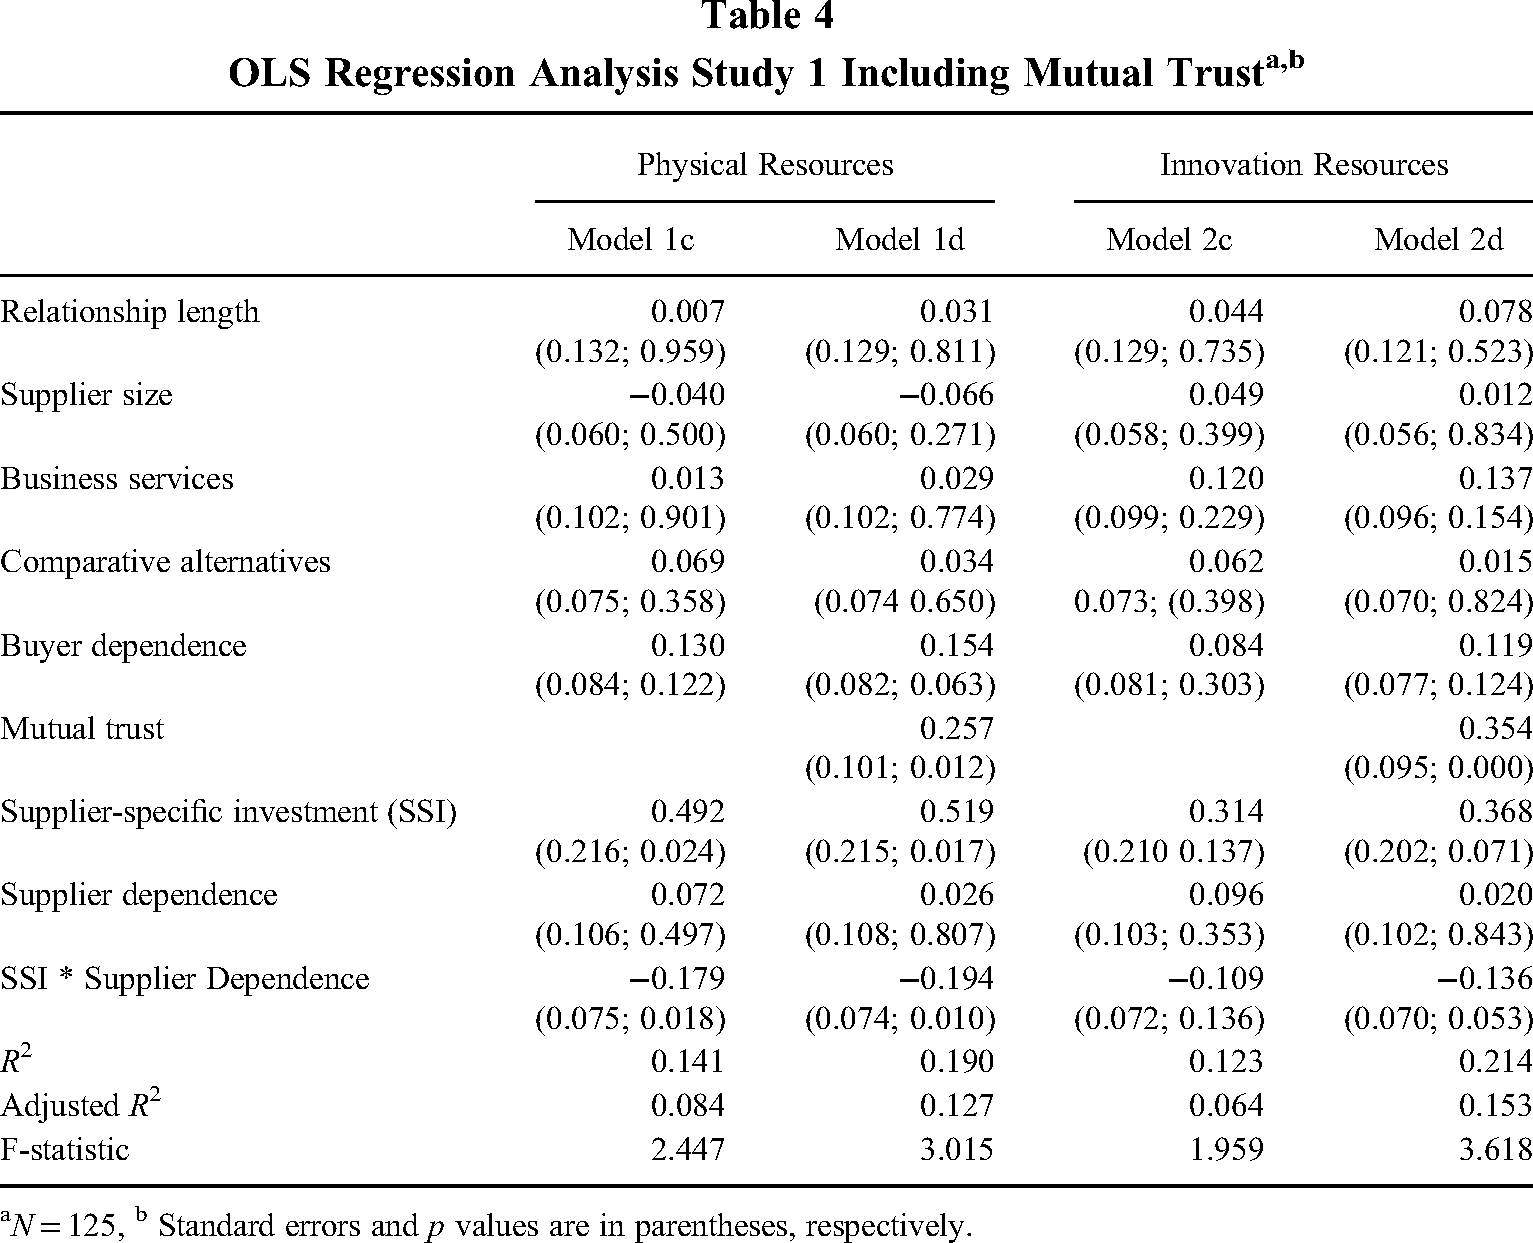
N = 125, b Standard errors and p values are in parentheses, respectively.
Simultaneity can cause endogeneity when the dependent variable can cause the independent variable (i.e., reverse causality). Although our base hypotheses draw on theoretical reasoning tested in previous studies (e.g., Brito & Miguel, 2017; Dyer & Hatch, 2006), this is a potential limitation in our analysis, because supplier resource allocation could be associated with supplier-specific investments and supplier dependence, such that suppliers that perform better for the buyer due to superior resource allocation may receive more investments and business volume in the future. A way to address this matter is by using methods that rely on instrumental variables (Hill et al., 2021). However, our data did not identify theoretically justifiable instruments related to our predictors but not supplier resource allocation. Because weak instruments produce results where the cure is worse than the disease (Semadeni, Withers, & Trevis Certo, 2014), we refrained from using this method while acknowledging that simultaneity may be a source of bias in our results.
Finally, sample selection can cause endogeneity when observations are not randomly sampled and are influenced by choices of the researcher (Hill et al., 2021). Because Study 1 only involves relationships between suppliers and a multinational manufacturer, this type of bias could be a concern in Study 1 because our findings may not generalize to a larger population. As noted, suppliers could react differently to investments from smaller manufacturers that have not implemented formal programs. We can use Study 2 to address this potential cause of endogeneity and test our hypotheses in a separate sample with smaller firms. Study 2 shows how our findings also hold in that setting, which shows that the reputation and status advantages of the wind turbine manufacturer do not appear to affect the study's results. We present these findings in the next section.
Study 2
In Study 2, we test our hypotheses with a broader sample of manufacturing firms using an alternative measurement of supplier-specific investments, drawing on the buyer's self-assessment (cf., Poppo et al., 2016). We directly contacted eight manufacturing firms from our personal network to collect dyadic data by surveying supply managers within these firms and their supplier side key contact. These manufacturing firms are all based in the Netherlands and come from a variety of industries. Similar to Villena, Revilla, and Choi (2011), we selected these firms because they consider supplier relationships fundamental to their operations and because they operate in manufacturing industries. Because of missing data, we were only able to use data from six of these firms. Although the size was not considered part of the selection criteria, all six firms are substantially smaller than the wind-turbine manufacturer in Study 1.
Similar to Study 1, the supplier-relationships we examine are loosely coupled alliances (Barringer & Harrison, 2000), involving no equity, joint ventures, interlocking directorates, or other control mechanisms. Similar to Study 1, the supplier data were collected by first sending an invitation through a supply manager at the buying firm, followed by an e-mail and reminders containing a link to an online survey. The buying firms selected appropriate suppliers and generally indicated relative spending and importance as the main selection criteria. To reduce social desirability bias, the potential respondents were guaranteed anonymity, and the respondents were told that there were no “good” or “bad” answers. The buyer data were collected via a survey targeted at respondents from the buyer side. To complete the dyads, we selected the most knowledgeable contact within the buying organization to fill out the survey for the suppliers that completed their survey. The respondents were from different hierarchical levels, ranging from the purchasing level to the CEO. Often, a respondent from the buyer side would fill out multiple surveys due to his or her responsibility for multiple relationships. Overall, this procedure resulted in a sample of 191 dyads after removing dyads with missing values. Table 5 shows the characteristics of the manufacturing firms in our sample and the response rates of the supplier survey.
Manufacturing Sample of Study 2
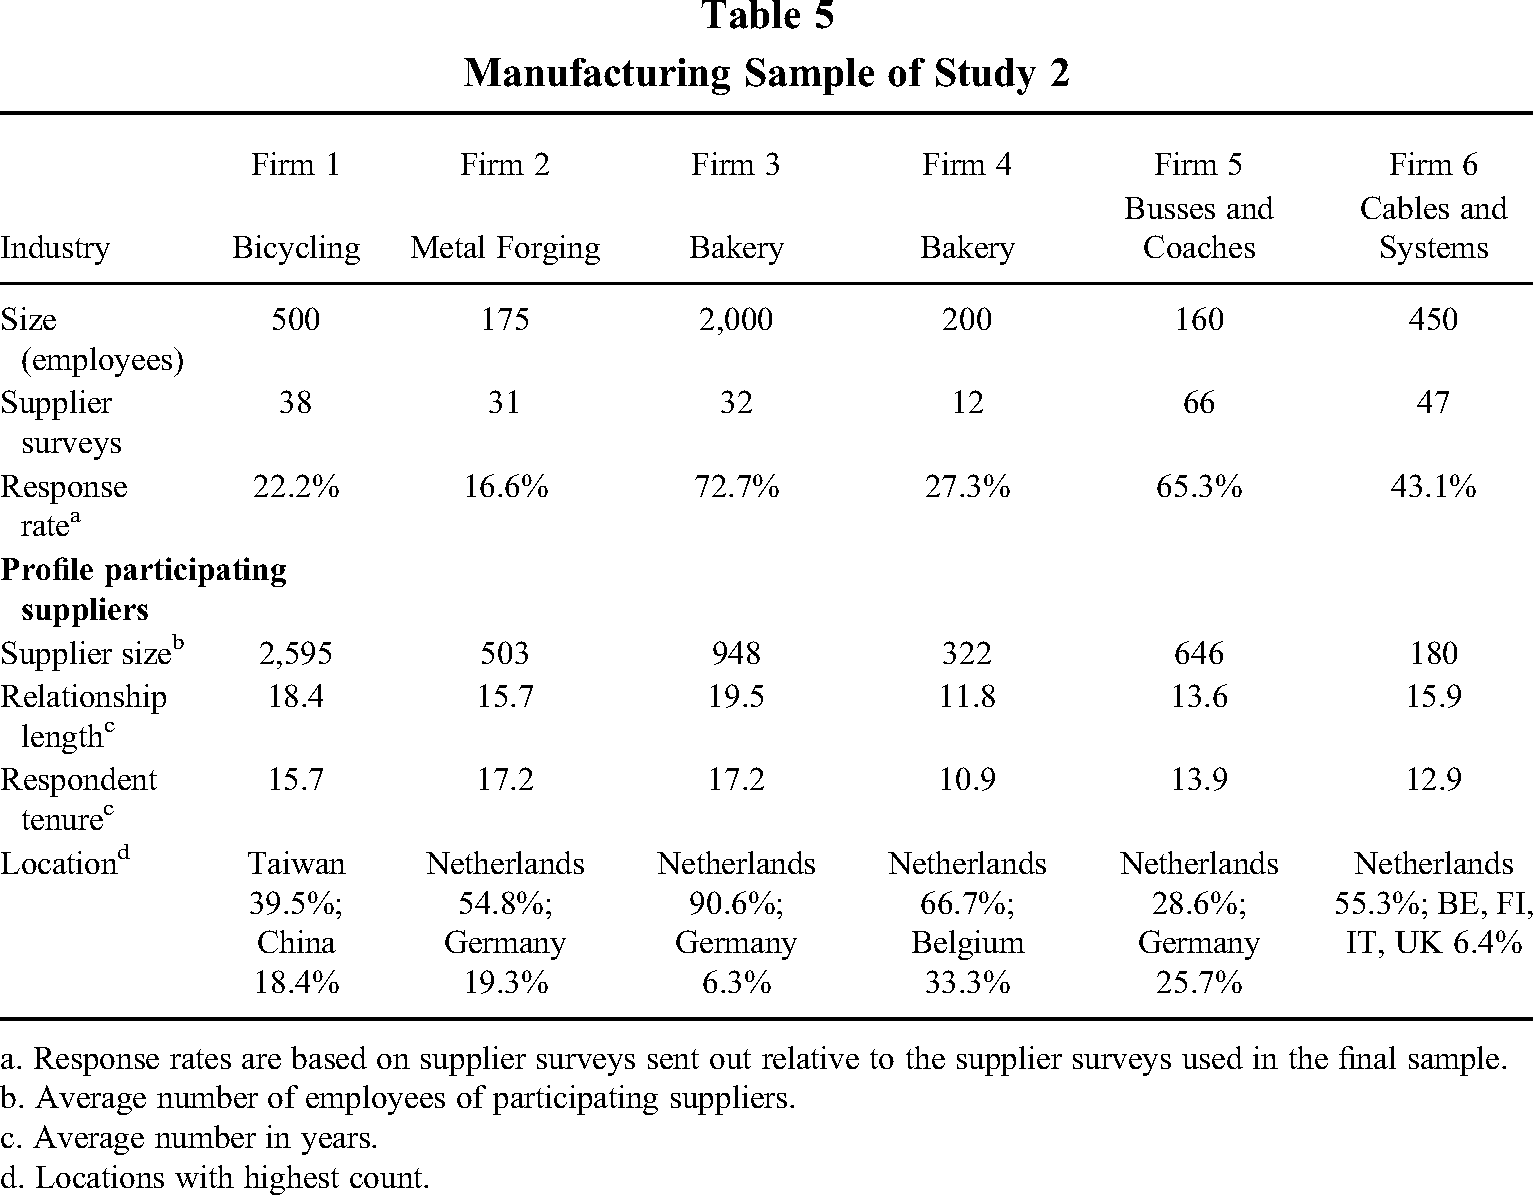
a. Response rates are based on supplier surveys sent out relative to the supplier surveys used in the final sample.
b. Average number of employees of participating suppliers.
c. Average number in years.
d. Locations with highest count.
Similar to Study 1, we assessed whether nonresponse bias was present in two ways. First, we compared the mean scores of the survey items of this study's latent variables for early versus late respondents. The comparative tests showed that the late respondents of Firm 5 significantly differed for one of the items and that the Firm 6 respondents differed significantly for two of the items. Because these tests do not reveal a clear pattern regarding the differences between early and late respondents other than normal variation, they do not indicate response bias. Second, Firms 2 and 4 provided spending data, based on which we conducted comparative tests between the respondents and nonrespondents. The respondents showed higher spending figures than the nonrespondents, but the comparative tests revealed no significant differences for the individual firms, with the largest t value being 0.950. However, because we did not capture any additional spending data from the other firms, we cannot exclude the possibility of nonresponse bias in Study 2.
Measures
Similar to Study 1, supplier resource allocation was measured from the supplier's side of the dyad using the same items as Study 1 for physical and innovation resources. The Cronbach's alpha values for the physical resource allocation items were 0.87 and 0.90 for the innovation resource allocation items. We similarly measured supplier dependence as in Study 1 by asking the respondents from the supplier side to assess the respective manufacturing firm's share in their turnover on a 0–100% scale. On average, the manufacturing firms account for 7.6% of the suppliers’ turnover (range: ∼0–80%, SD: 12.0). In addition to this measure, we included an alternative measure of dependence based on the items of Krause, Handfield, and Tyler (2007). We used the reversed scores of three items that assessed whether the supplier could easily replace the buyer (e.g., it would be relatively easy for us to find another buyer for the components we sell to this customer). These items arguably provide a more comprehensive perspective on dependence and include the supplier's switching cost, which might not be fully captured by the buyer's share in the supplier's turnover. The Cronbach's alpha for these items was 0.78. Below we show that our findings are robust for this alternative measure of dependence.
The supplier-specific investments were measured from the buyer's side. Whereas this measure in Study 1 was specific to the wind turbine manufacturer's supplier-specific investments, we adopted items from Liu, Luo, and Liu (2009) in Study 2 (e.g., “if we switch to another partner, we would lose a lot of the investment we’ve made in this relationship”). The Cronbach's alpha for these items was 0.82. All the latent variables in Study 2 were measured using a 5-point Likert-type scale, ranging from 1 (strongly disagree) to 5 (strongly agree). The online supplement shows all items used in Study 2.
Control Variables
We included several controls to capture the effects of buyer-specific attributes as well as relationship attributes. Similar to Study 1, we controlled for the relationship length and supplier size (number of employees) as assessed by the respondents from the supplier side. For these controls, we used the natural logarithm. We also controlled for the supplier's comparative alternatives to the buying firm. We asked the supplier to mention the number of customers that account for a turnover similar to that of the focal buying firm. We used the natural logarithm of this number in our models. To control for buyer dependence, we used a three-item scale adapted from Krause et al. (2007) that measured how easily the supplier could be replaced, the perceptions of supplier availability, and whether finding a new supplier would require changes to the production systems. The Cronbach's alpha for these items was 0.86. Because the data of Study 2 are collected from multiple manufacturing firms, we included firm dummy variables to control for firm effects. We did not capture data that allowed an assessment of mutual trust, which is a limitation of Study 2. Table 6 presents the means, standard deviations, and correlations among the variables in Study 2.
Correlation Table Study 2a
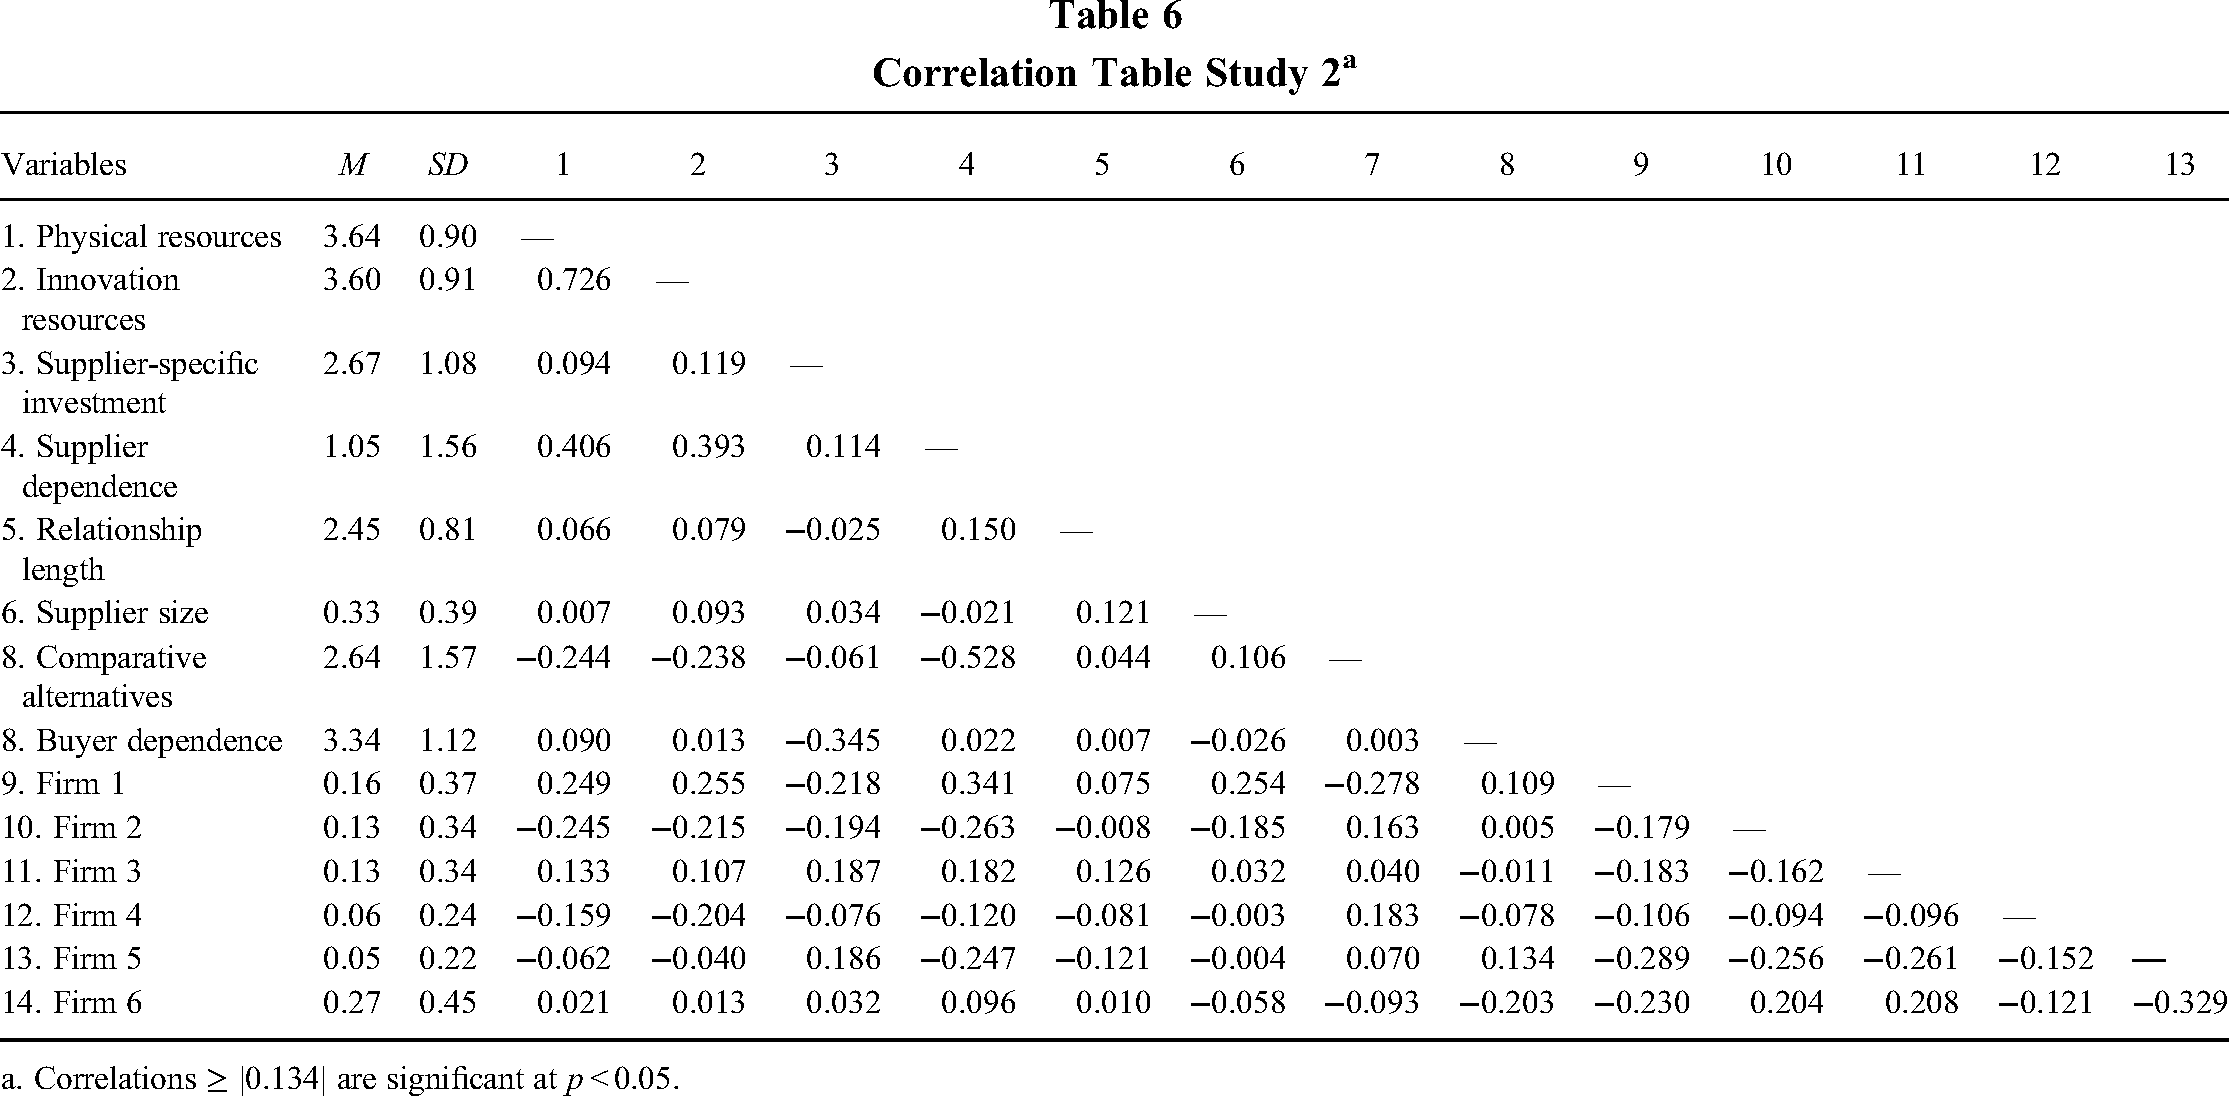
a. Correlations ≥ |0.134| are significant at p < 0.05.
Results
Table 7 presents Study 2’s OLS analysis. Similar to Study 1, the results support H1a and H1b. The coefficient of supplier-specific investments in Model 1c is positive and significant for physical resources (β = 0.265, p = 0.001) and for innovation resources (β = 0.213, p = 0.013). Similarly, the results support H2a and H2b, as the coefficient of supplier dependence is significant and positive for physical resources (β = 0.434, p < 0.001) and for innovation resources (β = 0.410, p < 0.001).
OLS Regression Analysis for Supplier Resource Allocation Study 2a,b
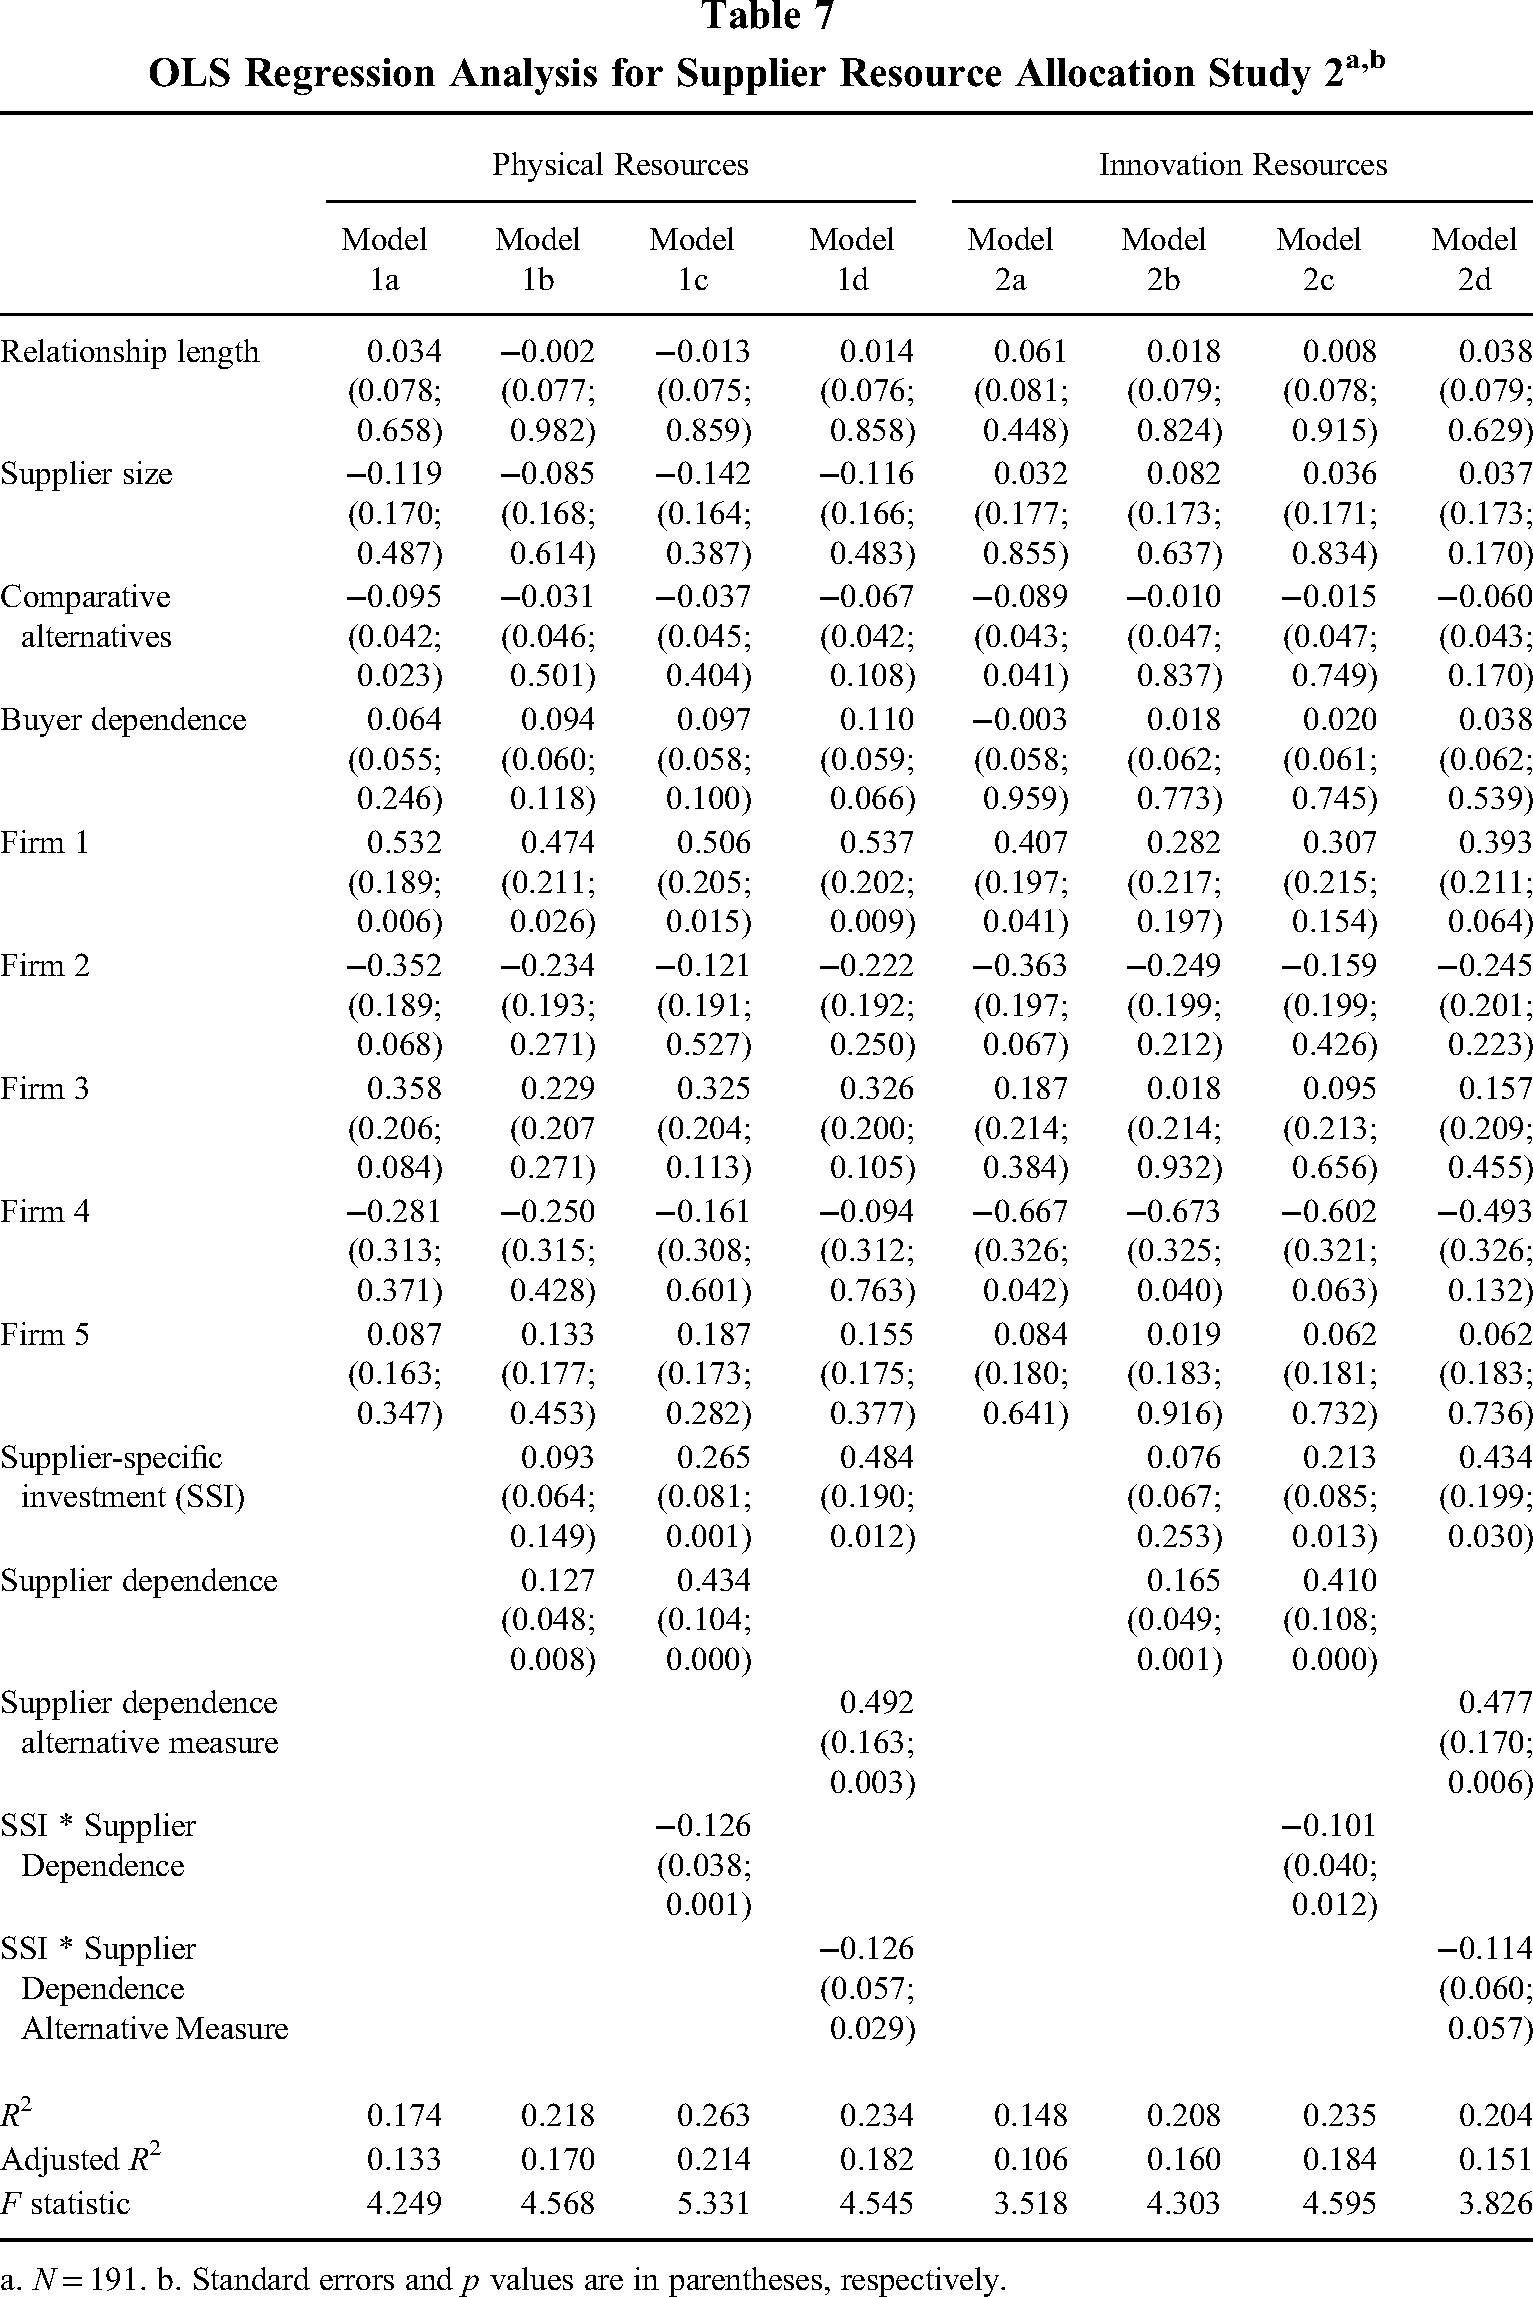
a. N = 191. b. Standard errors and p values are in parentheses, respectively.
In addition, similar to Study 1, Study 2 provides evidence supporting H4a and H4b. Hence, the results of Study 2 also show that the higher the supplier's dependence is, the lower the effect of supplier-specific investments on supplier resource allocation. The coefficient of the interaction term is negative and significant for both physical resources (β = −0.126, p = 0.001) and innovation resources (β = −0.101, p = 0.012), which indicates a negative moderation effect of supplier dependence on supplier-specific investments. The results of a structural model with both dependent variables are included in the online supplement and demonstrate that the results in Study 2 are robust using structural equation modeling. In addition, in the online supplement we show a model that includes supplier dependence relative to buyer dependence (i.e., relative dependence) as an additional control. This post hoc check shows that relative dependence does not affect the coefficients of our main variables.
Models 1d and 2d show that the results are robust for the alternative measure of dependence. The direct effect shows a similarly positive and significant effect for both physical and innovation resources. Similar to the models with the share in turnover measure, the interaction term with the alternative measure also shows a negative and significant effect for both physical and innovation resources.
Similar to Study 1, we further examined the moderation effect by conducting simple slope tests (Aiken & West, 1991). We used a high (14.7%) and low (1.4%) share in turnover groups created via median split. In the low supplier dependence group, we find that supplier-specific investments positively and significantly relate to the supplier's allocation of physical (β = 0.229, SE = 0.082, p = 0.006) and innovation resources (β = 0.186, SE = 0.083, p = 0.028). In the high supplier dependence group, supplier-specific investments are negatively related to supplier resource allocation, although not significant (physical resources, β = −0.096, SE = 0.083, p = 0.247; innovation resources, β = −0.065, SE = 0.093, p = 0.489). In support of H4a and H4b, these results imply a negative moderating effect of supplier dependence on the relationship between the manufacturing firms’ supplier-specific investments and supplier resource allocation.
Discussion
Suppliers often treat buyers differently and allocate their resources unequally among them (Mitsuhashi & Greve, 2009; Wetzel et al., 2014). Such supplier differentiation between buyers is an important predictor of the competitive advantages a buyer can gain from supplier relationships (Castellucci & Ertug, 2010; Dyer & Hatch, 2006; Mesquita et al., 2008; Takeishi, 2002). The relational view and resource dependence theory generally suggest supplier-specific investments and supplier dependence to positively influence supplier resource allocation. Intuitively, these constructs should complement each other in their interplay, and consequently, the buying firm would favor making investments in high-volume relationships (e.g., Bensaou & Anderson, 1999; Dyer & Singh, 1998). However, the literature also indicates an alternative, potentially negative interplay. Across two separate studies, we demonstrate that the positive effects of supplier-specific investments on supplier resource allocation decrease when dependence is growing. These findings make an important empirical contribution by addressing ambiguities in the literature and clarifying that supplier-specific investments and supplier dependence are substitutes in their joint effect on supplier resource allocation.
Implications for Research
Our findings help create an improved understanding of the dual nature of relation-specific investments similarly observed in previous studies (e.g., Dyer et al., 2018; Noordhoff, Kyriakopoulos, Moorman, Pauwels, & Dellaert, 2011; Rokkan et al., 2003). Specifically, our findings have implications for previous research that documented how supplier-specific investments positively influence supplier resource allocation behavior (e.g., Cheung et al., 2011; Dyer & Hatch, 2006). Our results generally support these studies (i.e., H1), and Figure 1 demonstrates an overall positive effect of supplier-specific investments. However, we also show that supplier-specific investments are not always the appropriate approach. The positive benefits of investments in supplier relationships decline when the buyer is considered a major customer, while arguably other actions would be more effective. These findings add supplier dependence as a key condition that may influence the effects of supplier-specific investments, thereby explaining why these investments do not always have their intended effects as observed in other studies (e.g., Dyer et al., 2018). Indeed, post hoc interviews with supply executives of the wind turbine manufacturer in Study 1 indicated that they had been surprised to learn that their investments in some of the high-volume key suppliers did not have their expected effect. A key question arising from our findings is how buyers can align supplier-specific investments and supplier dependence. A particular challenge for the buyer is to improve the understanding of the effects of supplier-specific investments and manage the uncertainty of the dependent supplier regarding the buyer's behavior (Sutton et al., 2021) to avoid the situation in which the supplier moves resources to competing accounts to reduce its dependence (Casciaro & Piskorski, 2005). Future research could examine whether concepts such as strategic alignment, (Gligor, Gölgeci, Newman, & Bozkurt, 2021), growth plans, or cooperative actions such as profit sharing or the sharing of cost savings (Terpend & Krause, 2015) may help to manage the supplier's uncertainty about future exchanges, making complementarity between supplier-specific investments and supplier dependence more likely.
The results in this study also suggest opportunities for future research on the management of interorganizational relationships including other types of alliances (Barringer & Harrison, 2000; Das & Teng, 1998a; Gulati & Sytch, 2007). For instance, more formal alliances such as joint ventures, equity alliances, or interlocking directorates contain relatively high levels of ownership or hierarchical control (Das & Teng, 1998b). Ownership and hierarchical controls generally reduce opportunistic behavior (Barringer & Harrison, 2000; Gulati & Singh, 1998), and they may also have a controlling effect on suppliers’ resource allocation behavior. Our study focuses on loosely coupled nonequity alliances with lower levels of formal controls, which appears to allow the supplier to reduce its resource allocation to high-volume buyers. Future research should uncover whether in more formally or hierarchically controlled relationships this effect could be attenuated and positive moderating effects of supplier dependence (i.e., H3) may be more likely.
Our findings demonstrate the dual nature of supplier-specific investments and supplier dependences and exhibit a positive effect of these constructs individually, but a substitution effect in combination, which implies that supplier-specific investments, may not always have their intended positive effect. These findings relate to studies on the dual nature of relational constructs and their “dark side” in the buyer-supplier relationship more generally (Kim & Choi, 2018; Oliveira & Lumineau, 2019; Villena et al., 2019) and can pave the way for more in-depth future studies. For example, Villena et al. (2019) argue how relationship closeness can improve relationship efficiency because of greater commitment and increased collaboration but can also have a dark side by means of dysfunctional mechanisms such as increased complacency and reluctance to seek new and more capable partners. It would be interesting to examine the interplay between supplier-specific investments and relationship closeness and see whether these constructs reduce or stimulate each other's dysfunctional effects and the situations in which such effects occur. Oliveira and Lumineau (2019) map several antecedents of the dark side of interorganizational relationships and describe moderators that might mitigate negative effects. Research into such moderating effects could uncover whether the interplay between supplier-specific investments and supplier dependence is contingent on factors such as industry characteristics, personal ties, or formal agreements.
In addition, this study relates to the research on resource exchange in interorganizational relationships (Das & Teng, 2000; Hunt & Davis, 2008) and shows that suppliers differentiate their resource allocations among different buyers. However, resource allocation decisions at the supplier's side are often difficult to observe for the buying firm (Handley & Benton, 2012). Indeed, the post hoc interviews at the wind turbine manufacturer revealed how supply managers are often unaware of whether suppliers are prioritizing their firm. For instance, a purchasing manager explained that they suspected the supplier of prioritizing competing buyers when a supplier failed to live up to its promised capacities, as the following quote exemplifies: “They come up with an explanation—that they simply don’t have the machines to produce our demand. Then, we trust that they are honest. But we don’t have the insights into what they are actually doing to manage their output.” A senior supply manager provided another example of the challenges of knowing about supplier allocation of innovation resources. Here, a key supplier of transmission systems had developed a new technology with a competing buyer, but the manager only learned they were second in line when the supplier informally tried to persuade the manufacturer to adopt the solution at a later point in time: “They send us signals. For example, saying at lunch that they may have a certain solution on the market in a year—and that we should be aware and take it back to our engineers.” Without knowing whether they are being prioritized or facing a disadvantage in the supplier's resource allocations, it is extremely difficult for the buying firm to assess the likelihood of competitive success of a supplier-oriented strategy. Future research should uncover the mechanisms (beyond those in this study) that determine how buyers increase access to supplier resources, especially since such supplier decisions are typically in the blind spot of the buying firm (Markman, Gianiodis, & Buchholtz, 2009; Oliveira & Lumineau, 2019; Yan, Choi, Kim, & Yang, 2015). Examples of one key mechanism can be found in the automotive industry where supplier satisfaction has been monitored for many years because it is argued to be an important predictor of the relative performance of competing car manufacturers (PR Newswire, 2021).
Finally, the implications of our findings could extend to other management theories. For instance, we consider how suppliers may interpret supplier-specific investments as signals of commitment. This notion is supported by signaling theory (e.g., Bergh, Ketchen, Orlandi, Heugens, & Boyd, 2019; Connelly, Certo, Ireland, & Reutzel, 2011), which argues that such costly commitments by a buyer or supplier may reveal much of the intentions (or qualities) of the actor making the investment. Our observation that dependent suppliers tend to allocate resources less favorably when investments rise suggests that a buyer's relation-specific investments alone can fall short as a signal in eliciting a supplier's favorable response. In the absence of formal mechanisms to enforce those responses from the supplier, it is worthwhile to build on signaling theory to explore what more comprehensive portfolios of signals can be useful to alter the supplier's behavior and to what extent temporal aspects (such as sequences of signals or repeated signals) play a role in effectively using this portfolio, especially since signals may lose value over time. Of similar interest is studying what signals the supplier's willingness to treat the buyer favorably. There is some theoretical and experimental evidence that relation-specific investments by the supplier can signal trustworthiness (Beer, Ahn, & Leider, 2018). As highlighted above, extending this work to settings with resource allocation across different buyers would be interesting.
In addition, our findings have potential implications for TCE, which originally proposed relation-specific assets to have negative consequences for the investing party because of lock-in effects (Williamson, 1985). Subsequent studies argued that relation-specific assets might instead create a bonding effect that creates important relational benefits, suggesting a dual nature of relationship-specific investments (Dyer & Singh, 1998; Kang et al., 2009; Rokkan et al., 2003). Several studies have proposed context variables that could change the effects from lock-in to bonding (or from bonding to lock-in), for example solidarity norms (Rokkan et al., 2003) and resource complementarity (Dyer et al., 2018). Our findings show that dependence is an additional condition that explains the dual nature of relation-specific investment and suggest that suppliers see an opportunity to reallocate their key resources to other customer accounts in the presence of this buyer exit barrier. Within TCE, opportunism is often considered to be the major concern in these locked-in exchanges (Williamson, 1985). Future research needs to disentangle opportunism from the pragmatic act of finding new business opportunities to explain such reallocation of resources.
Limitations
The data used in both studies are cross-sectional, which precludes establishing causality in our empirical model. An important next step would be to test our hypotheses using experimental or longitudinal designs. In addition, although the two studies were conducted in substantially different business settings, we cannot rule out that studies in other environments can give different results. For instance, our data were collected in manufacturing industries. Although our controls in Study 1 did not reveal any patterns in which suppliers of business services differ in resource allocation from non-service suppliers, full-service supply chains differ from manufacturing supply chains. Research suggests that strong interorganizational ties may be more important for service firms as they place more emphasis on people and knowledge in their exchange processes (Fulmer & Gelfand, 2012). In service supply chains, suppliers could therefore react differently to the uncertainty from being dependent on a buyer. Future research should examine how this affects the interplay between supplier-specific investments and supplier dependence in service supply chains. Also, previous studies have shown how buyer-supplier governance can vary in different cultures (e.g., individualist versus collectivist cultures; Cannon, Doney, Mullen, & Petersen, 2010). Considering that most of the firms in our data belong to European countries, future research should examine whether our findings are robust for different cultures.
Finally, there are several variables that are missing in our analysis but could affect supplier resource allocation. Above we mentioned the type of alliance structure, formal agreements, and growth possibilities. Other factors are also relevant such as the reputation of the buying firm (Kang et al., 2009; Schilke & Cook, 2015), supply chain interconnectedness (Kim & Zhu, 2018), contracting (Schepker, Oh, Martynov, & Poppo, 2013), or mutual trust that was found to be relevant in Study 1 but was not captured in Study 2. Future research should examine whether our findings hold when these variables are included.
Conclusions
In many industries, buyers compete for suppliers’ preferences. Supplier-specific investments are a common practice to gain access to supplier resources, and the stakes are especially high in relationships with high volumes. Combining insights from the relational view and resource dependence theory, we pointed to ambiguities in the predictions on the interplay between supplier-specific investments and supplier dependence. Our findings reveal that while both of these concepts individually have positive effects on supplier resource allocation, jointly, these two pluses, in fact, make a minus. We believe that our findings will help future studies and create a better understanding of the mechanisms driving differentiation in upstream alliances.
Supplemental Material
sj-docx-1-jom-10.1177_01492063221087643 - Supplemental material for The Interplay Between Supplier-Specific Investments and Supplier Dependence: Do Two Pluses Make a Minus?
Supplemental material, sj-docx-1-jom-10.1177_01492063221087643 for The Interplay Between Supplier-Specific Investments and Supplier Dependence: Do Two Pluses Make a Minus? by Niels J. Pulles, Chris Ellegaard, and Jasper Veldman in Journal of Management
Footnotes
Supplemental material for this article is available at http://xxx.sagepub.com/supplemental.
Declaration of Conflicting Interests
The author(s) declared no potential conflicts of interest with respect to the research, authorship, and/or publication of this article.
Funding
Jasper Veldman received financial support by the Netherlands Organisation for Scientific Research (NWO) (grant number 439.18.326).
References
Supplementary Material
Please find the following supplemental material available below.
For Open Access articles published under a Creative Commons License, all supplemental material carries the same license as the article it is associated with.
For non-Open Access articles published, all supplemental material carries a non-exclusive license, and permission requests for re-use of supplemental material or any part of supplemental material shall be sent directly to the copyright owner as specified in the copyright notice associated with the article.