
Abstract
This study investigates the importance of client size and new clients for audit partner busyness. Because auditing large and new clients requires more time and effort than auditing smaller and familiar clients, we predict that an audit partner with considerable proportions of large and new clients will be too busy to ensure high earnings quality for all clients. Moreover, because audit partners have greater incentive to focus on large clients, we expect that busy partners will be more willing to compromise the earnings quality of smaller clients to maintain high earnings quality of large clients. Using the complete client portfolios of Big 4 and non-Big 4 audit partners, we find evidence suggesting that auditing greater proportions of large and new clients decreases an audit partner’s constraint of earnings management. The negative effect on earnings quality is most prominent among smaller clients of Big 4 partners. These findings indicate that even when audit partner busyness is driven by acquisitions of large and new clients, the consequences of the busyness are more severe for smaller clients. Our results have important implications for regulators, practitioners, and investors because they provide archival evidence that the earnings quality of an audit client is affected not only by the characteristics of the client and the audit partner but also by the characteristics of the audit partner’s other clients.
Keywords
Introduction
Using the complete client portfolios of 595 first-tier Finnish audit partners from 2003 through 2014, we examine whether auditing a greater proportion of large and new clients decreases an audit partner’s constraint of earnings management. Our underlying assumption is that audit partners with greater proportions of large and new clients are busier and, thus, have less time to devote to each client, on average, leading to lower-quality audits. However, because audit partners face greater engagement risk in the audits of large clients, even busy partners have greater incentives to prioritize large clients, which shifts their focus away from smaller clients. Accordingly, in this study, we also examine whether the consequences of busyness are less severe for larger clients than for smaller ones.
Existing research on audit partner busyness examines the association between audit partners’ client portfolio size and audit quality (Burke et al., 2019; Goodwin & Wu, 2016; Lai et al., 2018; Sundgren & Svanström, 2014). In these studies, the number of audit clients proxies for audit partner busyness. According to the busyness hypothesis, busier partners are expected to provide lower-quality audits, but extant empirical results are mixed. Sundgren and Svanström (2014) and Lai et al. (2018) find a negative association between portfolio size and audit quality, but results in Goodwin and Wu (2016) and Burke et al. (2019) do not support the busyness hypothesis. The samples in these studies typically consist of publicly listed companies, which do not comprise the complete client portfolios. In addition, by focusing only on the effect of the portfolio size, these studies may exclude valuable information captured in other portfolio characteristics.
The amount of time and effort that audit partners invest in their audits varies with client characteristics (e.g., Hackenbrack & Knechel, 1997). According to previous research, audits of large, publicly listed, or new clients require more time than audits of small, privately owned, or continuing clients (Caramanis & Lennox, 2008; Deis & Giroux, 1996; Hackenbrack & Knechel, 1997; O’Keefe et al., 1994). This suggests that the workload and busyness of the two corresponding audit partners vary with the number of large and new clients. 1 Thus, we assume that, ceteris paribus, auditing a greater proportion of large clients and new clients leads to a greater workload and, in turn, greater busyness for an audit partner. To manage a relatively high number of time-consuming clients, an auditor can either work longer days or decrease the amount of time they invest in each audit. Working excessively long hours or having insufficient time to devote to a client are both expected to have a negative effect on audit quality (Persellin et al., 2019; Zerni, 2012). Therefore, we expect that an audit partner with a relatively high number of large and/or new clients will be too busy to ensure high earnings quality for every client.
However, audit partner incentives vary across different types of clients. Greater engagement risk, arising from litigation, regulation, and reputation risk, motivates audit partners to be more conservative and independent when conducting audits (S. Chen et al., 2010). Because partners face greater engagement risk when auditing large clients, we predict that busy partners will be more willing to compromise the earnings quality of smaller clients to maintain high earnings quality for large clients. Accordingly, we expect the negative association between busyness and earnings quality to be less prominent among large clients.
Lennox and Wu (2018) emphasize that accurately measuring an audit partner’s workload and busyness requires considering their complete client portfolio. Although data availability often prohibits the inclusion of private companies in audit partner research, we examine the complete client portfolios of 595 first-tier Finnish Big 4 and non-Big 4 partners. Our sample consists of 196,667 client-year observations.
The motivation for earnings management in Finland is multifaceted. Publicly listed and privately owned companies have incentives to manage earnings upward because listed companies need equity capital, and private companies need reasonably priced debt financing. Furthermore, both listed and private companies tend to manage earnings upward for dividend purposes. 2 In contrast, managers in high-tax-alignment countries such as Finland have incentives to manage earnings downward to minimize tax. Given these competing earnings management incentives, audit partners play a critical role in constraining earnings management regardless of whether it involves upward or downward adjustments.
Before testing our hypotheses, we examine the effect of audit partner busyness on earnings quality using traditional busyness measures, namely the number of listed clients and the number of all clients. We measure earnings quality with absolute, positive, and negative discretionary accruals. We find that although earnings quality is lower when a partner audits more listed clients, auditing more clients is associated with higher earnings quality. These findings emphasize the importance of using complete client portfolios in the analyses. They also support the view that client characteristics in the auditor’s full portfolio play an important role in the busyness context. To further examine these relations, we test our hypotheses and, consistent with our expectations, find evidence suggesting that auditing a greater proportion of large and new clients decreases earnings quality. This relation holds especially for smaller clients of Big 4 audit partners, indicating a moderating effect of client size. We also conduct several sensitivity tests and conclude that our findings are not driven by our methodological choices.
Our results have important implications for regulators, including the Public Company Accounting Oversight Board (PCAOB), that seek new insights about factors affecting audit partners’ ability to provide high-quality audits. In its concept release on audit quality indicators, the PCAOB has expressed concerns about audit partners’ excessive workloads, which can “distract an engagement partner from giving adequate and focused attention to an audit engagement” (Public Company Accounting Oversight Board [PCAOB], 2015). Our findings suggest that these concerns are justified and imply that regulators should consider the effects of auditors’ client portfolio characteristics when considering the relation between workload and audit quality. Also audit committees can benefit from our findings. By considering the effects of auditors’ client portfolio characteristics on audit quality, audit committees can make more informed decisions when selecting audit partners. This approach can help mitigate potential risks associated with auditors’ heavy workloads, thereby promoting the enhancement of audit quality.
Our study makes several contributions to the literature. First, we contribute to research on audit partner busyness (Burke et al., 2019; Goodwin & Wu, 2016; Lai et al., 2018; Sundgren & Svanström, 2014) by investigating two additional portfolio characteristics that we expect to be relevant. We show that the proportions of large and new clients are negatively associated with earnings quality. Second, our findings provide insight into how auditor incentives drive partner behavior. We find that the negative effect of having more large and new clients on earnings quality is significantly weaker for large clients. This suggests that even busy partners try to minimize potential future losses arising from engagement risk by focusing on the earnings quality of large clients. Finally, by studying complete client portfolios, we better capture the busyness effect. As noted by Lennox and Wu (2018), although most audit clients are private companies, only listed companies are usually included in portfolio analyses, which can distort empirical results.
The next section of the paper provides background and develops our hypotheses. The “Research Design” section describes our research design and sample selection, and the “Results” section presents the empirical results. The “Sensitivity Analyses” section provides sensitivity analyses, and the “Conclusions and Limitations” section concludes the article.
Background and Development of Hypotheses
Portfolio Composition, Auditor Busyness, and Audit Quality
The busyness hypothesis predicts that partners with more clients provide lower-quality audits (Sundgren & Svanström, 2014). Because an individual audit partner performs the audit, an increase in the number of clients is assumed to increase busyness, thereby reducing the average time devoted to each client. 3 Thus, busier partners are expected to provide lower-quality audits, on average. Sundgren and Svanström (2014) employ data from private Swedish companies to examine the association between client portfolio size and audit partners’ propensity to issue going-concern opinions prior to bankruptcies, and Lai et al. (2018) use data from publicly listed Malaysian companies to examine audit quality measured by total accruals and discretionary accruals. Both studies find support for the busyness hypothesis because they report negative associations between portfolio size and audit quality. However, in the U.S. setting, Burke et al. (2019) do not find any association between audit partner busyness and earnings quality. Furthermore, in the Australian setting, Goodwin and Wu (2016) find that the association between busyness and audit quality is affected by the presence or absence of the equilibrium condition. 4 Overall, there is no consensus regarding the effect of busyness on audit quality.
One possible reason for these mixed results may be the omission of relevant client portfolio measures from the analyses. Although existing busyness research uses the number of audit clients to measure audit partner busyness, we argue that client and engagement characteristics within a partner’s portfolio can also play an important role. For example, a partner who audits 10 large clients or several new engagements should be busier than a corresponding partner who audits 10 relatively small clients and no new engagements.
Empirical evidence supports the view that auditors do not allocate their time evenly across clients, and client characteristics explain the variation in audit hours to a great extent. First, the most significant single determinant of audit hours is client size (Hackenbrack & Knechel, 1997; O’Keefe et al., 1994). Auditors in all class of labor (i.e., partners, seniors, managers, and staff) invest more hours in the audits of large clients (O’Keefe et al., 1994). Second, auditor tenure has a significant impact on audit hours, especially in the first year of an auditor–client relationship (Bedard & Johnstone, 2010; Caramanis & Lennox, 2008; Deis & Giroux, 1996). During the initial year of an engagement, the auditor must invest time to gather information about the client and familiarize themselves with the client’s operations, practices, and business environment.
Most prior research tests the busyness hypothesis by examining the effect of portfolio size on audit quality without controlling for other aspects of portfolio composition. To our knowledge, only Sundgren and Svanström (2014) and Goodwin and Wu (2016) control for the portfolio scale effect by including portfolio aggregate sales in the analyses. In addition, in untabulated analyses, Goodwin and Wu (2016) measure busyness using the numbers of new and old clients. However, their data includes only publicly listed clients. 5 Overall, prior researchers’ inability to use complete client portfolios, together with a lack of control for portfolio composition, may at least partially explain the mixed results in previous busyness research.
We extend prior research, which focuses on portfolio size, by including two additional client portfolio characteristics. Specifically, using the complete client portfolios of Big 4 and non-Big 4 audit partners, we examine whether the proportions of large clients and new clients are associated with earnings quality. According to prior studies, auditors invest more time in the audits of large clients and in new engagements (Caramanis & Lennox, 2008; Deis & Giroux, 1996; Hackenbrack & Knechel, 1997; O’Keefe et al., 1994). This suggests that the average amount of time invested per client is greater for large and new clients, so we assume that a higher proportion of these time-consuming clients lead to greater audit partner workload and busyness. To manage a relatively high number of time-consuming clients, a partner has two options. They can either work longer hours or decrease the average time invested per client. Working longer hours can impair audit quality because it can lead to increased stress and even burnout, thus decreasing the partner’s ability to provide high-quality audits (López & Peters, 2012; Persellin et al., 2019; Sweeney & Summers, 2002). In practice, audit partners only have a limited ability to extend their working hours. If we assume that the total number of working hours remains relatively constant, with higher proportions of large and new clients, ceteris paribus, a partner will have less time to invest per client. According to the busyness hypothesis, reducing the time devoted to each client should decrease audit quality. The arguments above lead us to expect that audit partners with many large and/or new clients will be too busy to ensure high earnings quality. Thus, we state our first pair of hypotheses in the alternative, as follows:
The Moderating Effect of Client Size
The assumption underlying Hypothesis 1a is that the audit partner is too busy to ensure high earnings quality for every client if their portfolios include too many large clients. An opposing argument could be that reputation concerns drive partners with many large clients to be more conservative in their audit judgments (DeAngelo, 1981). Audit partner incentives, however, vary across clients within a client portfolio (Manry et al., 2008), and although reputation protection may be a key concern, the risk of reputation damage is negligible in micro-company audits.
The analytical bargaining model in Zhang (1999) suggests that potential future consequences drive auditor behavior. Auditors seek to maximize potential audit fees arising from future engagements and to minimize potential future losses arising from engagement risk (i.e., the risk that arises from litigation, regulation, and reputation risk). However, higher economic dependence may create a threat to audit partner independence, higher engagement risk encourages partners to be more conservative (S. Chen et al., 2010). Therefore, audit partner incentives are driven by audit fees and engagement risk.
Larger clients are more likely to pay higher fees, which poses a greater engagement risk for the audit partner (DeAngelo, 1981; DeFond & Zhang, 2014; Simunic, 1980). Although higher economic dependence may be viewed as a threat to auditors, findings by S. Chen et al. (2010) suggest that higher litigation and regulation risks mitigate the negative effect of economic dependence. Larger audit clients tend to suffer greater damage in the case of audit failures, resulting in higher expected future litigation losses for the audit partner. 6 Larger clients are also more likely to sue their auditor because they have more financial and other resources required for legal actions. In addition, suing is more cost-effective for larger clients (Carcello & Palmrose, 1994; Lys & Watts, 1994; Stice, 1991). 7 Thus, larger clients pose a higher litigation risk to the auditor, which fosters more conservative accounting choices (Boone et al., 2011; Venkataraman et al., 2008).
Regulation risk arises from the risk of regulatory intervention (DeFond & Zhang, 2014). Auditors of public interest entities (PIEs) are more often targets of quality inspections, which increase the probability that an audit failure is detected. In high-tax-alignment countries such as Finland tax authorities have high economic incentives to monitor the truthfulness and fairness of reported financial statements. Similar to quality inspections of the auditor oversight body, tax audits also increase the probability of misstatement detection, increasing an audit partner’s incentive to constrain earnings management (Karjalainen, 2011; Van Tendeloo & Vanstraelen, 2008).
The higher probability of audit failure detection increases both litigation and reputation risks (DeFond & Zhang, 2014; Van Tendeloo & Vanstraelen, 2008). The auditor’s reputation is likely to be damaged by an audit failure, especially if the auditor is sued or sanctioned (Carcello & Palmrose, 1994; DeFond & Zhang, 2014; Lys & Watts, 1994; Stice, 1991). The most probable and severe consequence of a suit or sanction is the loss of current and future clients (DeAngelo, 1981). Auditor reputation is especially important for larger audit clients because of their greater visibility and more dispersed ownership (Reynolds & Francis, 2001; Skinner & Srinivasan, 2012). Consistent with this, Weber et al. (2008) and Skinner and Srinivasan (2012) find that large clients are more likely to change auditors after an audit failure.
As discussed above, expected future losses arising from engagement risks are higher for larger clients, so audit partners have a greater incentive to ensure high-quality audits for larger clients. Consequently, we assume that even busy audit partners prioritize larger clients. Furthermore, we expect that busy partners will be more willing to compromise the earnings quality of smaller clients to ensure high earnings quality for larger clients. The arguments above lead us to the following hypotheses, stated in the alternative:
Research Design
Model Specification
We use performance-adjusted discretionary accruals to measure earnings quality. For each industry-year with at least 30 observations, we estimate the following modified Jones (1991) model (Kothari et al., 2005):

where i denotes the client and t denotes the year; TAC is total client accruals, calculated as the change in non-cash current assets minus the change in non-debt current liabilities minus depreciation (Bianchi, 2018; Caramanis & Lennox, 2008; F. Chen et al., 2011); TA is total assets; ΔREV is the change in revenues; ΔREC is the change in net accounts receivable; PPE is net property, plant, and equipment; and ROA is return on assets. Estimated discretionary accruals (DAC) are the residuals from Equation 1. We winsorize DAC at its 1st and 99th percentiles.
To examine the effects of the proportions of large and new clients on earnings quality, we estimate the following ordinary least squares (OLS) regression:

where i denotes the client, j denotes the audit partner, and t denotes the year. Earnings quality (EQ) is measured using absolute discretionary accruals (|DAC|), positive discretionary accruals (POSDAC), and negative discretionary accruals (|NEGDAC|). A higher value of the dependent variable indicates lower audit quality in all models.
To test Hypotheses 1a and 1b, we include the proportion of large clients (PROPLARGE) and the proportion of new clients (PROPNEW), respectively, in the model. A client is defined as large if its total assets are in the highest quartile of the distribution or if it is publicly listed. A client is defined as new in the initial fiscal year of the audit partner–client relationship.
Ajt and Cit in Equation 2 are vectors of audit partner-specific control variables and client-specific control variables, respectively. The number of clients in an audit partner’s client portfolio (CLIENTS) controls the effect of portfolio size on audit quality (Lai et al., 2018; Sundgren & Svanström, 2014). To control for the partner’s competence, we include audit partner gender (FEMALE), experience (EXPERIENCE), and industry specialization (INDSPEC; Cahan & Sun, 2015; H.-Y. Chi & Chin, 2011; DeFond & Zhang, 2014; Ittonen et al., 2013). 8 Because Big 4 audit partners are expected to be more independent and more competent, we add a BIG4 indicator variable. Following Goodwin and Wu (2016), Li et al. (2017), Bianchi (2018), and Kallunki et al. (2019), we control for the effect of individual client characteristics on EQ by including the following client controls: client size (lnTA), client importance (lnINFLUENCE), a negative net income indicator variable (LOSS), the Altman (1968) bankruptcy score (ZSCORE), credit rating (RISKLEVEL), 9 cash flow from operations (CFO), and sales growth (GROWTH). In addition, we include LISTEDCL and NEWCL to control for the effects of publicly listed companies and new audit engagements, respectively (Caramanis & Lennox, 2008; Kallunki et al., 2019; Lim & Tan, 2010). Following prior busyness research (Goodwin & Wu 2016; Sundgren & Svanström, 2014), we also control for the busy season effect (BUSYSEASON). Finally, we include industry and year-fixed effects in the model. T-statistics are calculated with standard errors clustered at the audit client level. All the variables and their definitions are presented in Appendix A.
To test Hypothesis 2, we interact the variables in Equation 2 with the indicator variable, LCL, which equals one if the client is large and zero otherwise. By interacting the variables of interest with LCL, we examine whether the effects of these variables differ for large and smaller clients. 10 We also allow the control variables to have a different effect on EQ between the two groups by interacting them with LCL.
Discretionary Accruals in the Finnish Setting
In our setting, publicly listed and privately owned companies have many reasons to manage their earnings (Vander Bauwhede & Willekens, 2004; Van Tendeloo & Vanstraelen, 2008). For example, managers may strive to meet or beat short-term targets, smooth earnings, or mislead stakeholders, including bankers, customers, suppliers, or investors (Healy & Wahlen, 1999; Lennox et al., 2016; Svanström, 2013; Vander Bauwhede et al., 2003). Studies conducted in Finland show that dividend-paying companies, regardless of their size or listing status, tend to manage earnings upward to be permitted to pay dividends and maintain current dividend distribution levels (Karjalainen et al., 2023; Kasanen et al., 1996; Niskanen & Keloharju, 2000). In Finland, banks provide most debt financing for private companies. Because banks rely on financial statements when making lending decisions, companies have incentives to manage their earnings upward to obtain low-cost financing and reasonable covenants (Karjalainen, 2011).
In addition to these income-increasing earnings management incentives, managers in high-tax-alignment countries such as Finland have incentives to manage earnings downward for tax purposes. Finnish companies report only one set of financial statements, and taxation is based on the reported accounting numbers. To avoid taxes, managers might seek to decrease the reported earnings. Therefore, motivations for earnings management in Finland are multifaceted and are driven by tax considerations and broader financial reporting objectives (Karjalainen et al., 2023; Kasanen et al., 1996; Niskanen & Keloharju, 2000).
DeFond and Zhang (2014, 276) define higher audit quality as “greater assurance that the financial statements faithfully reflect the firm’s underlying economics.” This implies that auditors should constrain earnings management regardless of whether earnings are managed upward or downward. Therefore, the magnitude of both income-increasing and income-decreasing discretionary accruals should reflect the auditor’s constraint of earnings management. However, there is no consensus regarding the interpretation of income-decreasing discretionary accruals. On the one hand, especially in high-tax-alignment countries, large negative discretionary accruals can reflect an auditor’s inability to constrain income-decreasing earnings management, indicating low-quality audits. On the other hand, larger negative accruals can reflect auditor conservatism, indicating higher audit quality (Lennox et al., 2016). The interpretation should depend on the research setting, that is, whether managers have an incentive to manage earnings downward (Johnson et al., 2002; Lennox et al., 2016).
Because managers in Finland have incentives to manage earnings upward and downward, we use the absolute value of discretionary accruals to measure EQ. In addition, because the incentives for income-increasing earnings management are different from those for income-decreasing earnings management, we also conduct analyses separately for positive and negative discretionary accruals.
Sample Selection
As a result of requirements to disclose the name of the signing audit partner, audit research has moved from examining audit firms and offices to examining individual audit partners. However, in many countries, this requirement concerns only audits of publicly listed companies or PIEs. In contrast, in Finland, auditors must sign audit reports with their names regardless of whether the client is a listed company, PIE, or private company. This allows us to examine all individual auditors in Finland and to examine auditors’ complete client portfolios, including those of both publicly listed and privately owned companies.
We begin our sample selection by obtaining audit partners’ personal information from the Finnish Patent and Registration Office, which is the current auditor oversight body in Finland. The initial audit partner sample includes all Finnish first-tier auditors who were active from 2003 through 2014. 11 This results in a total of 736 unique audit partners. We construct client portfolios for these partners using data provided by Suomen Asiakastieto. This data includes all Finnish companies, their financial information, and the names of the signing auditors. The initial sample consists of 62,005 individual clients and 303,506 client-year observations. When we exclude financial and insurance companies, client-years audited by more than one first-tier auditor, 12 client-years with incomplete data for estimating discretionary accruals, client-years with missing data for independent variables, and portfolios consisting of fewer than 10 clients, 13 the final sample consists of 595 audit partners, 44,735 clients, and 196,667 client-year observations. Although the final empirical analyses are conducted using the sample described above, the variables of interest are calculated using complete portfolios. 14
Results
Descriptive Statistics
Table 1, Panel A provides descriptive statistics for client portfolio and audit partner characteristics at the partner-year level. On average, 27.7% of clients are large, and 12.5% are new. The average client portfolio consists of approximately 59 clients. Slightly over a quintile (20.8%) of the partners in our sample are female, and their audit experience averages 15.3 years. Finally, 56.3% of audit partners are employed by the Big 4 firms.
Descriptive Statistics.
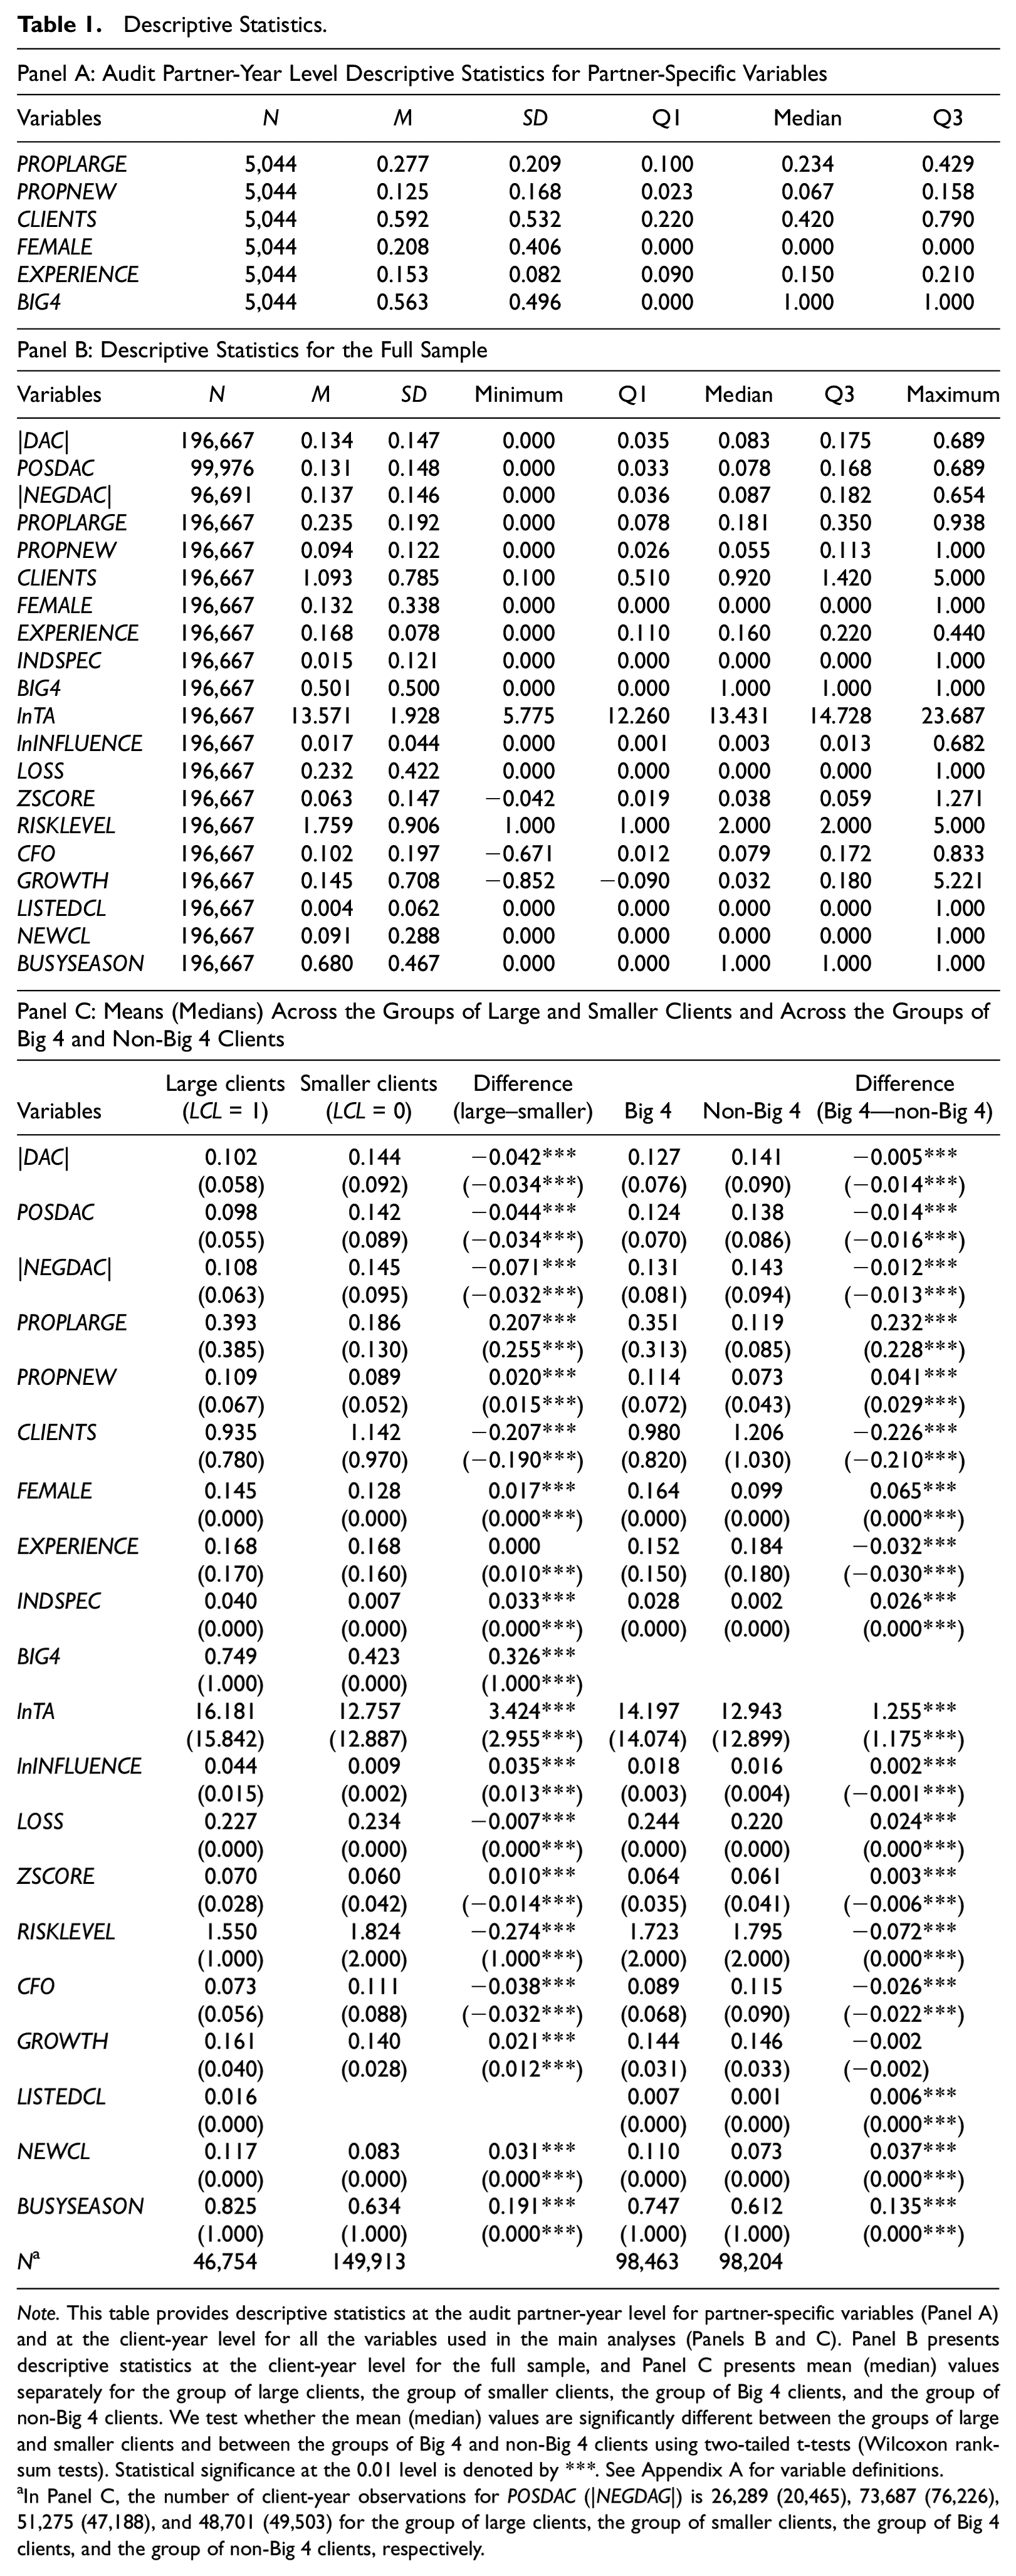
Note. This table provides descriptive statistics at the audit partner-year level for partner-specific variables (Panel A) and at the client-year level for all the variables used in the main analyses (Panels B and C). Panel B presents descriptive statistics at the client-year level for the full sample, and Panel C presents mean (median) values separately for the group of large clients, the group of smaller clients, the group of Big 4 clients, and the group of non-Big 4 clients. We test whether the mean (median) values are significantly different between the groups of large and smaller clients and between the groups of Big 4 and non-Big 4 clients using two-tailed t-tests (Wilcoxon rank-sum tests). Statistical significance at the 0.01 level is denoted by ***. See Appendix A for variable definitions.
In Panel C, the number of client-year observations for POSDAC (|NEGDAG|) is 26,289 (20,465), 73,687 (76,226), 51,275 (47,188), and 48,701 (49,503) for the group of large clients, the group of smaller clients, the group of Big 4 clients, and the group of non-Big 4 clients, respectively.
Panel B presents descriptive statistics at the client-year level for the variables included in Equation 2. The means of absolute discretionary accruals (|DAC|), POSDAC, and the absolute value of the negative discretionary accruals (|NEGDAC|) are 0.134, 0.131, and 0.137, respectively. The audit partners’ client portfolio size varies from 10 to 500 clients. Only 1.5% of financial statements are audited by an industry specialist. The mean of lnTA is 13.57. In our sample, net income is negative (LOSS = 1) for 23.2% of observations. Only 0.4% of the client-year observations are for publicly listed clients, and 68.0% are audited during the busy season.
In Panel C, we present the means and medians separately for the groups of large clients (LCL = 1), smaller clients (LCL = 0), Big 4 clients (BIG4 = 1), and non-Big 4 clients (BIG4 = 0). In the third column, we compare the means and medians of the large versus smaller clients. Most of the variables differ significantly between the two groups. The mean EQ is significantly higher for the large clients, with mean values of |DAC|, POSDAC, and |NEGDAC| of 0.102, 0.098, and 0.108, respectively, for large clients and 0.144, 0.142, and 0.145, respectively, for smaller clients. The average portfolio size for firm-year observations including large clients is approximately 94 clients, and the corresponding value for smaller clients is approximately 114 clients. 15
The last column in Panel C compares the groups of Big 4 clients and non-Big 4 clients. All variables other than growth differ significantly between the two groups. The means and medians of the three discretionary accrual measures are significantly higher for the non-Big 4 clients, indicating lower EQ. The proportions of large and new clients are significantly higher for Big 4 audit partners. On average, Big 4 clients are significantly larger and less risky.
The highest Pearson (Spearman) correlation among the independent variables (untabulated) is 0.61 (0.66) between PROPLARGE and BIG4. We perform collinearity diagnostics (untabulated) and find that the highest variance inflation factor is 2.134. However, to alleviate any remaining concerns regarding multicollinearity, we estimate Equation 2 separately for Big 4 and non-Big 4 partners.
Traditional Busyness Measures and EQ
Although our hypotheses focus on the associations between EQ and the proportions of large and new clients in a portfolio, we first examine the effect of audit partner busyness on EQ using traditional busyness measures. Following prior research, we measure audit partner busyness as the number of publicly listed clients (NLISTED; Burke et al., 2019; Goodwin & Wu, 2016; Gul et al., 2017; Lai et al., 2018) and the number of total clients in an audit partner’s portfolio (CLIENTS; Sundgren & Svanström, 2014). We conduct our analyses using a subsample of listed clients, a subsample of listed client partners, and our full sample. There are 750 client-year observations in the subsample of listed clients. The publicly listed clients are audited by 99 individual audit partners, and most (86.9%) are Big 4 partners. After including the complete client portfolios (i.e., incorporating private companies) of partners who audit at least one listed client, our subsample of listed client partners comprises 26,281 client-year observations. On average, the listed client partners audit 2.248 listed clients per year, and their complete client portfolios consist of approximately 85 clients per year. These findings are in line with previous research. 16
Table 2 reports results using traditional busyness measures, NLISTED and CLIENTS, as alternative independent variables. For the sake of brevity, we tabulate these results only for absolute discretionary accruals and the variables of interest. The control variables (untabulated) are the same as those in Equation 2. Panel A presents the results using NLISTED as the independent variable. The first three columns utilize the subsample of listed clients.
Regression Analyses Using Traditional Measures of Busyness.
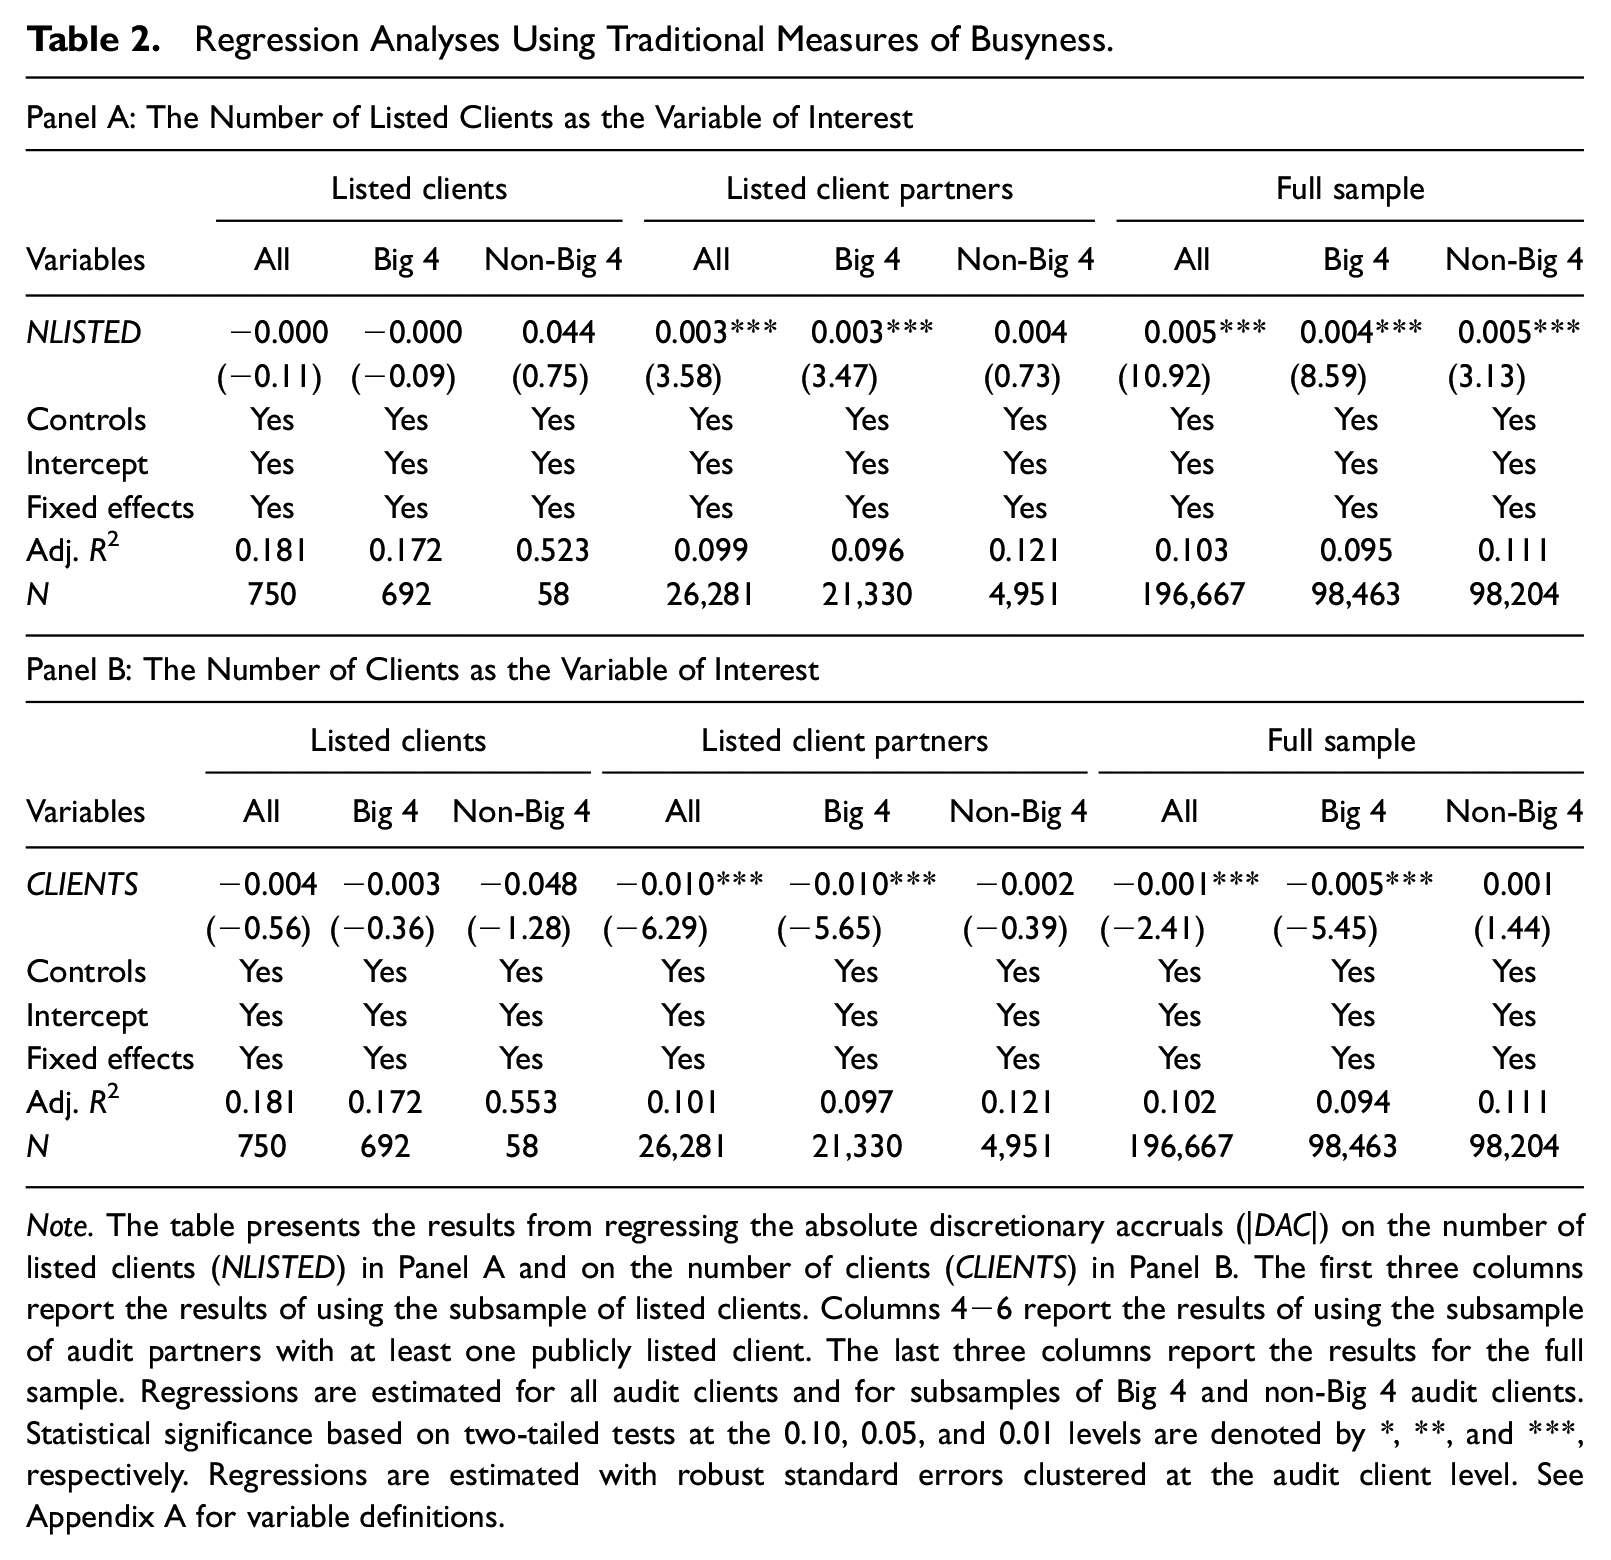
Note. The table presents the results from regressing the absolute discretionary accruals (|DAC|) on the number of listed clients (NLISTED) in Panel A and on the number of clients (CLIENTS) in Panel B. The first three columns report the results of using the subsample of listed clients. Columns 4−6 report the results of using the subsample of audit partners with at least one publicly listed client. The last three columns report the results for the full sample. Regressions are estimated for all audit clients and for subsamples of Big 4 and non-Big 4 audit clients. Statistical significance based on two-tailed tests at the 0.10, 0.05, and 0.01 levels are denoted by *, **, and ***, respectively. Regressions are estimated with robust standard errors clustered at the audit client level. See Appendix A for variable definitions.
The coefficient on NLISTED is insignificant, in line with findings in Goodwin and Wu (2016) and Burke et al. (2019), which measure partner busyness as the number of listed clients. However, using a similar research design, Gul et al. (2017) and Lai et al. (2018) find support for the busyness hypothesis. When we extend our subsample of listed clients to also include the private companies audited by these 99 listed client audit partners (in columns 4–6), other than for non-Big 4 auditors, the coefficient on NLISTED becomes significantly positive. When using our full sample (in columns 7–9) the coefficient on NLISTED is significantly positive for Big 4 auditors and non-Big 4 auditors. These results are in line with findings in Gul et al. (2017) and Lai et al. (2018).
In Panel B, following Sundgren and Svanström (2014), we measure busyness as the total number of clients in an audit partner’s client portfolio. The estimated coefficient on CLIENTS is insignificant for the subsample of listed clients but becomes significantly negative for Big 4 audit partners when we use the subsample of listed client auditors and our full sample. These findings suggest that EQ is higher when the auditor has more audit clients. This is contrary to findings in Sundgren and Svanström (2014), which document a negative association between the number of audit clients and the likelihood of issuing a going-concern opinion prior to bankruptcy. Because Sundgren and Svanström (2014) use Type II going-concern errors as a dependent variable, the authors’ sample consists only of bankrupt companies. Generally, these companies are small and financially distressed. Therefore, our contradictory results may stem from the differing dependent variables or differences in client characteristics.
Taken together, these results suggest that when private companies are included in the analyses, auditing more listed clients decreases EQ, but audit partners who audit more total clients provide higher audit quality. Considering the contradictory findings in Sundgren and Svanström (2014), we posit that the number of clients may not be the main driver of audit quality and that the effect of busyness on audit quality is at least partly attributable to client characteristics. In addition, in line with our expectations, the results in Table 2 indicate that the effect of busyness is not equal across different kinds of clients.
Testing Hypotheses 1a and 1b
Table 3 presents the results from estimating Equation 2 to test whether greater proportions of large and new clients in an audit partner’s client portfolio decrease the partner’s constraint of earnings management. We estimate the model separately for absolute discretionary accruals (|DAC|), positive discretionary accruals (POSDAC), and the absolute value of the negative discretionary accruals (|NEGDAC|). We also estimate the models separately for Big 4 and non-Big 4 audit partners. The explanatory power of the model is greater for POSDAC (22.1–23.8%) and |NEGDAC| (18.2–20.3%) than for |DAC| (9.7–11.1%). This supports the view that because income-increasing and income-decreasing discretionary accruals reflect the same phenomenon but with differing management incentives and opposing directions, they should be tested separately.
The Effect of the Proportion of Large Clients and the Proportion of New Clients on Earnings Quality.
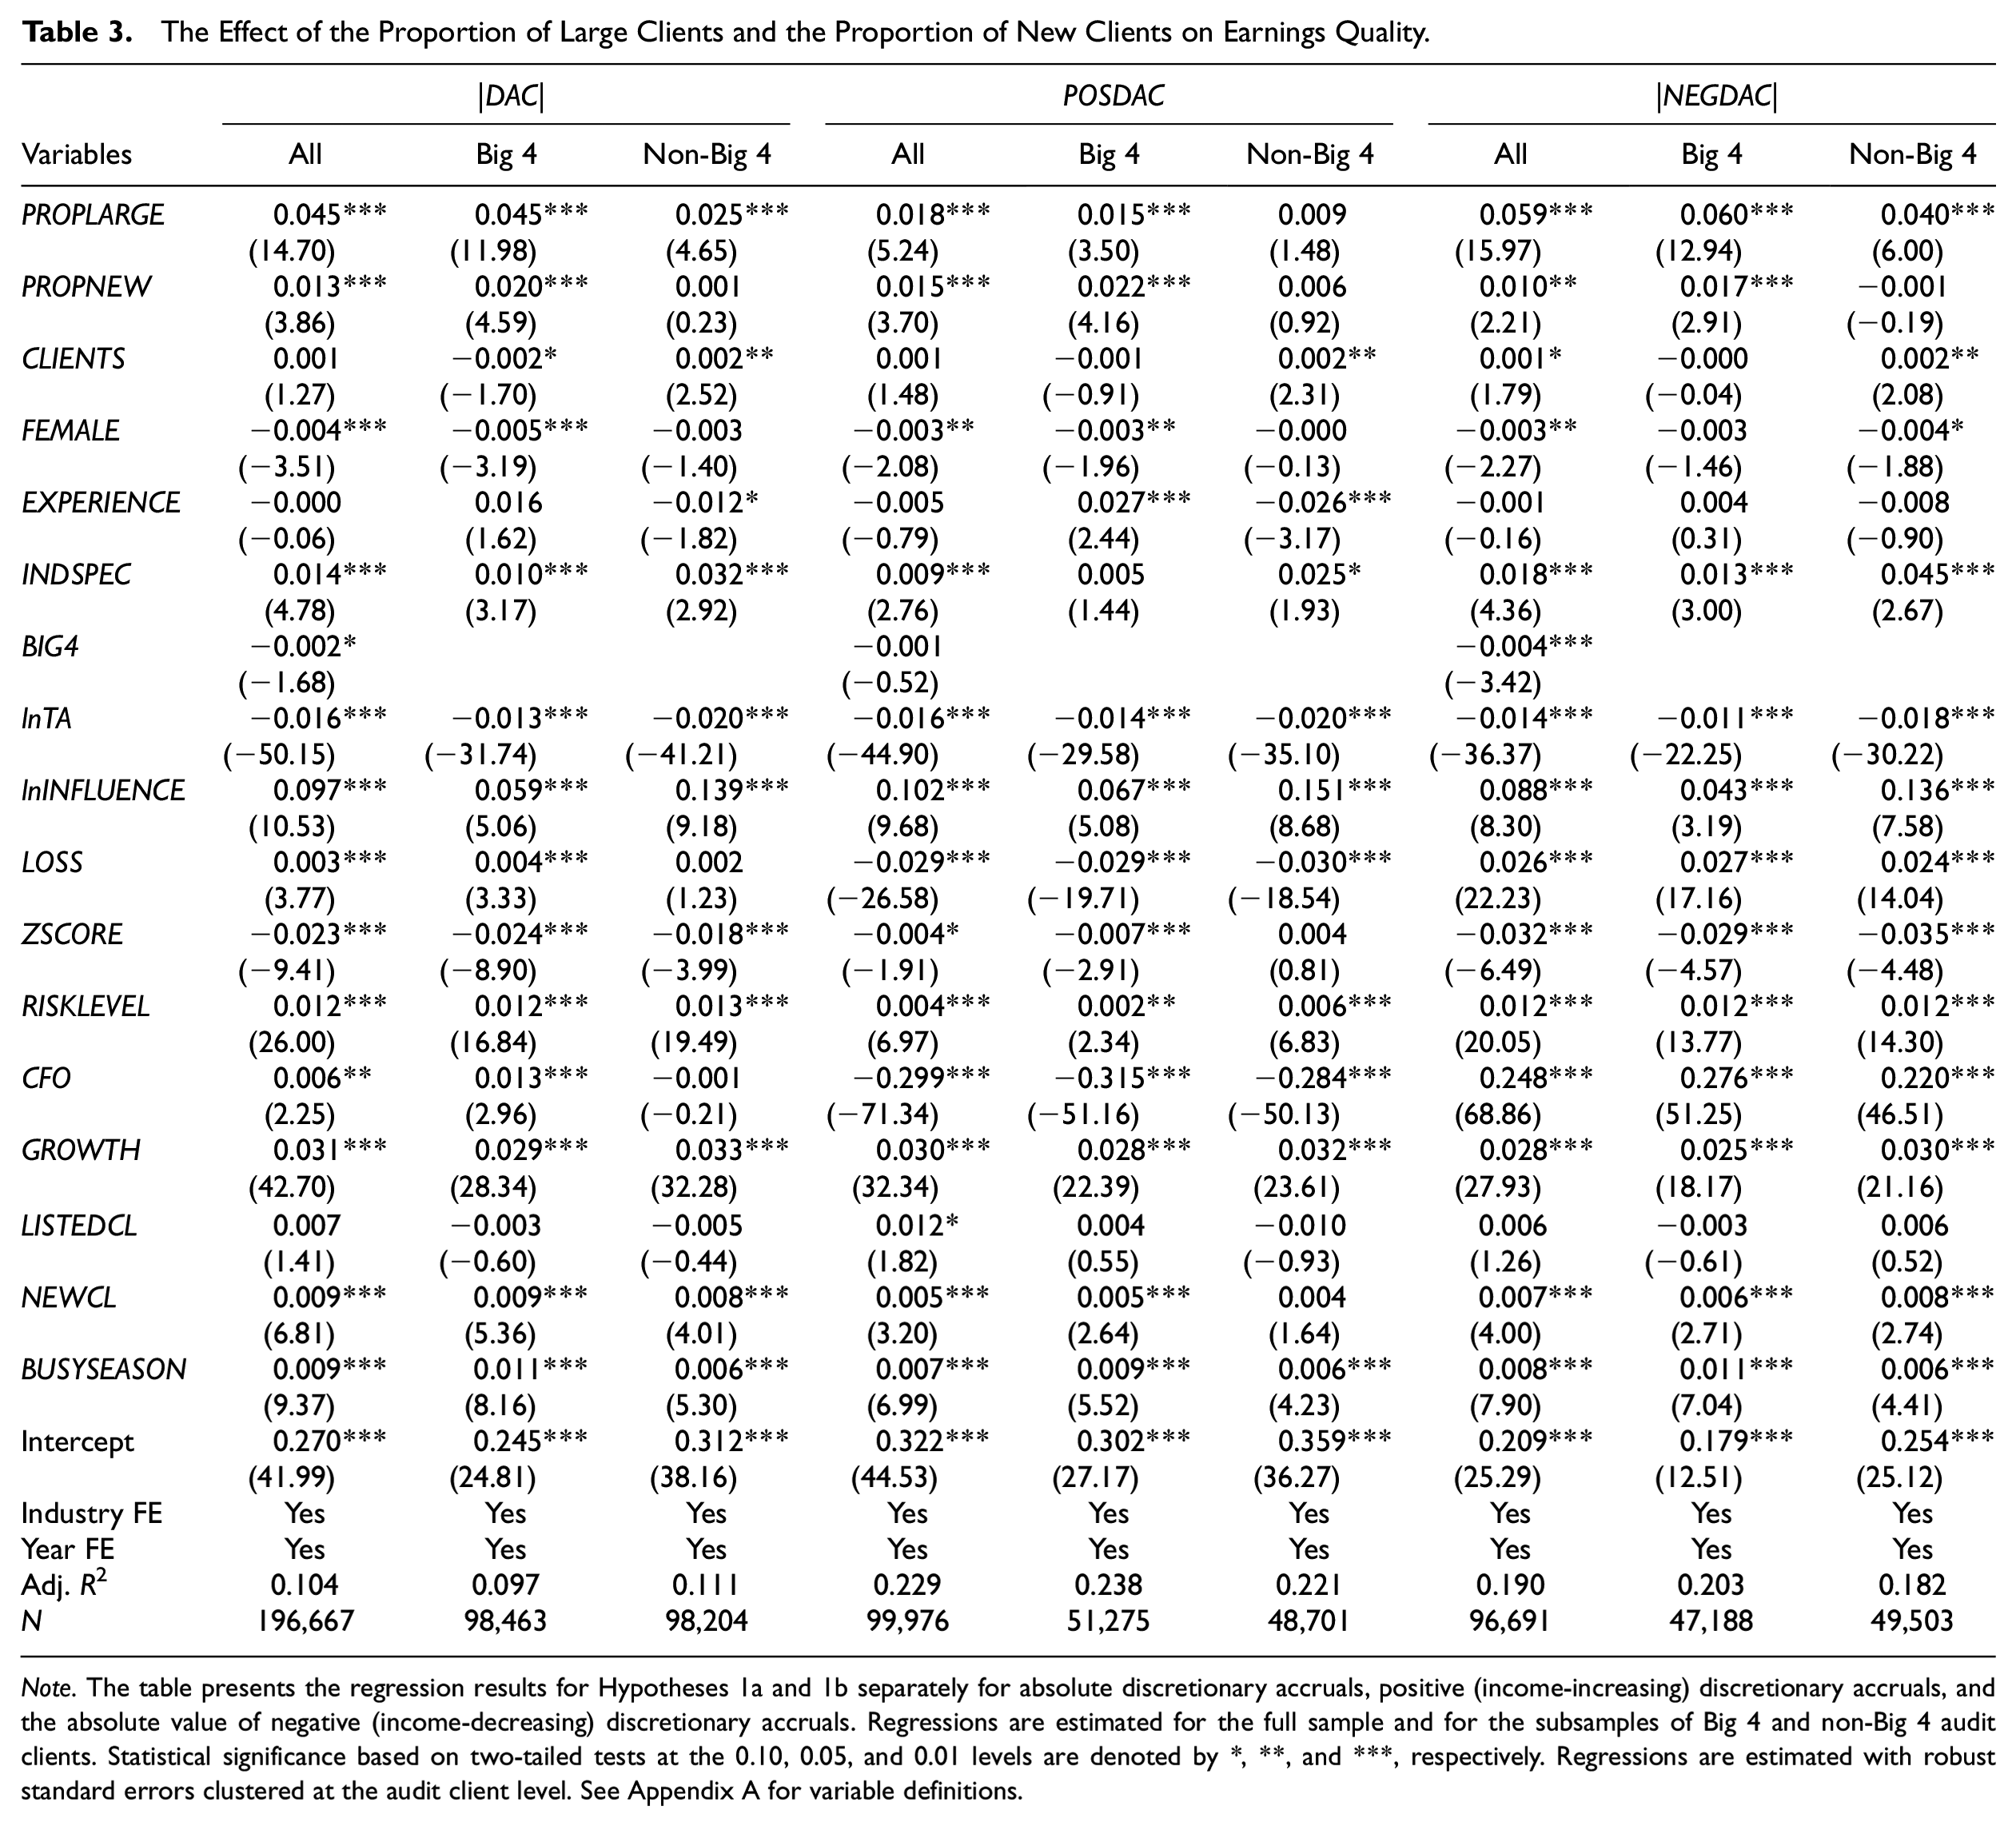
Note. The table presents the regression results for Hypotheses 1a and 1b separately for absolute discretionary accruals, positive (income-increasing) discretionary accruals, and the absolute value of negative (income-decreasing) discretionary accruals. Regressions are estimated for the full sample and for the subsamples of Big 4 and non-Big 4 audit clients. Statistical significance based on two-tailed tests at the 0.10, 0.05, and 0.01 levels are denoted by *, **, and ***, respectively. Regressions are estimated with robust standard errors clustered at the audit client level. See Appendix A for variable definitions.
The results show that the estimated coefficient on PROPLARGE is significantly positive in all models except one. Specifically, we do not find a significant association between PROPLARGE and POSDAC for non-Big 4 audit partners. The positive and significant coefficients in all the other models support Hypothesis 1a and suggest having a greater proportion of large clients decreases EQ for both Big 4 and non-Big 4 firms.
For the full audit partner sample, including both Big 4 and non-Big 4 partners, the estimated coefficient on PROPNEW is significantly positive in the |DAC| and POSDAC models. The coefficient is also positive in the |NEGDAC| model but is significant only at the 0.05 level. For Big 4 partners, the coefficient on PROPNEW is significantly positive in all discretionary accrual models, but it is insignificant in all models for non-Big 4 partners. These results indicate that both income-increasing and income-decreasing discretionary accruals are significantly larger when the proportion of new clients is higher, but only for the client portfolios of Big 4 audit partners.
Among the control variables, the coefficient on CLIENTS for Big 4 partners is negative but only marginally significant (t-statistic = −1.70) in the |DAC| model and insignificant in the POSDAC and the |NEGDAC| models. For non-Big 4 partners, the coefficient on CLIENTS is positive and significant at the 0.05 level in all models.
Overall, we find no evidence that portfolio size is associated with income-increasing or income-decreasing discretionary accruals among Big 4 partners. For non-Big 4 audit partners, we find some, albeit weak, evidence of positive associations. The significant coefficients on other control variables are mainly in line with prior research (Ittonen et al., 2013; Kallunki et al., 2019; Li et al., 2017; Lim & Tan, 2010; Liu et al., 2017).
Testing Hypothesis 2
Table 4 presents the results from estimating Equation 2 after interacting variables with the large client indicator variable LCL. We predict that client size moderates the associations between EQ and the proportions of large and new clients such that the negative association is weaker for large clients. To test Hypothesis 2, we interact PROPLARGE and PROPNEW with LCL. If the coefficients on PROPLARGE×LCL and PROPNEW×LCL are significantly negative, the results support Hypothesis 2. Because most of the control variables differ significantly between the groups of large and smaller clients (see Table 1, Panel C), we also allow the control variables to have a different effect on EQ for the two groups by interacting them with LCL as well. For brevity, we tabulate the results only for PROPLARGE, PROPNEW, and CLIENTS and their corresponding interaction terms.
Comparing the Effects on Earning Quality for the Group of Large Clients and the Group of Smaller Clients.
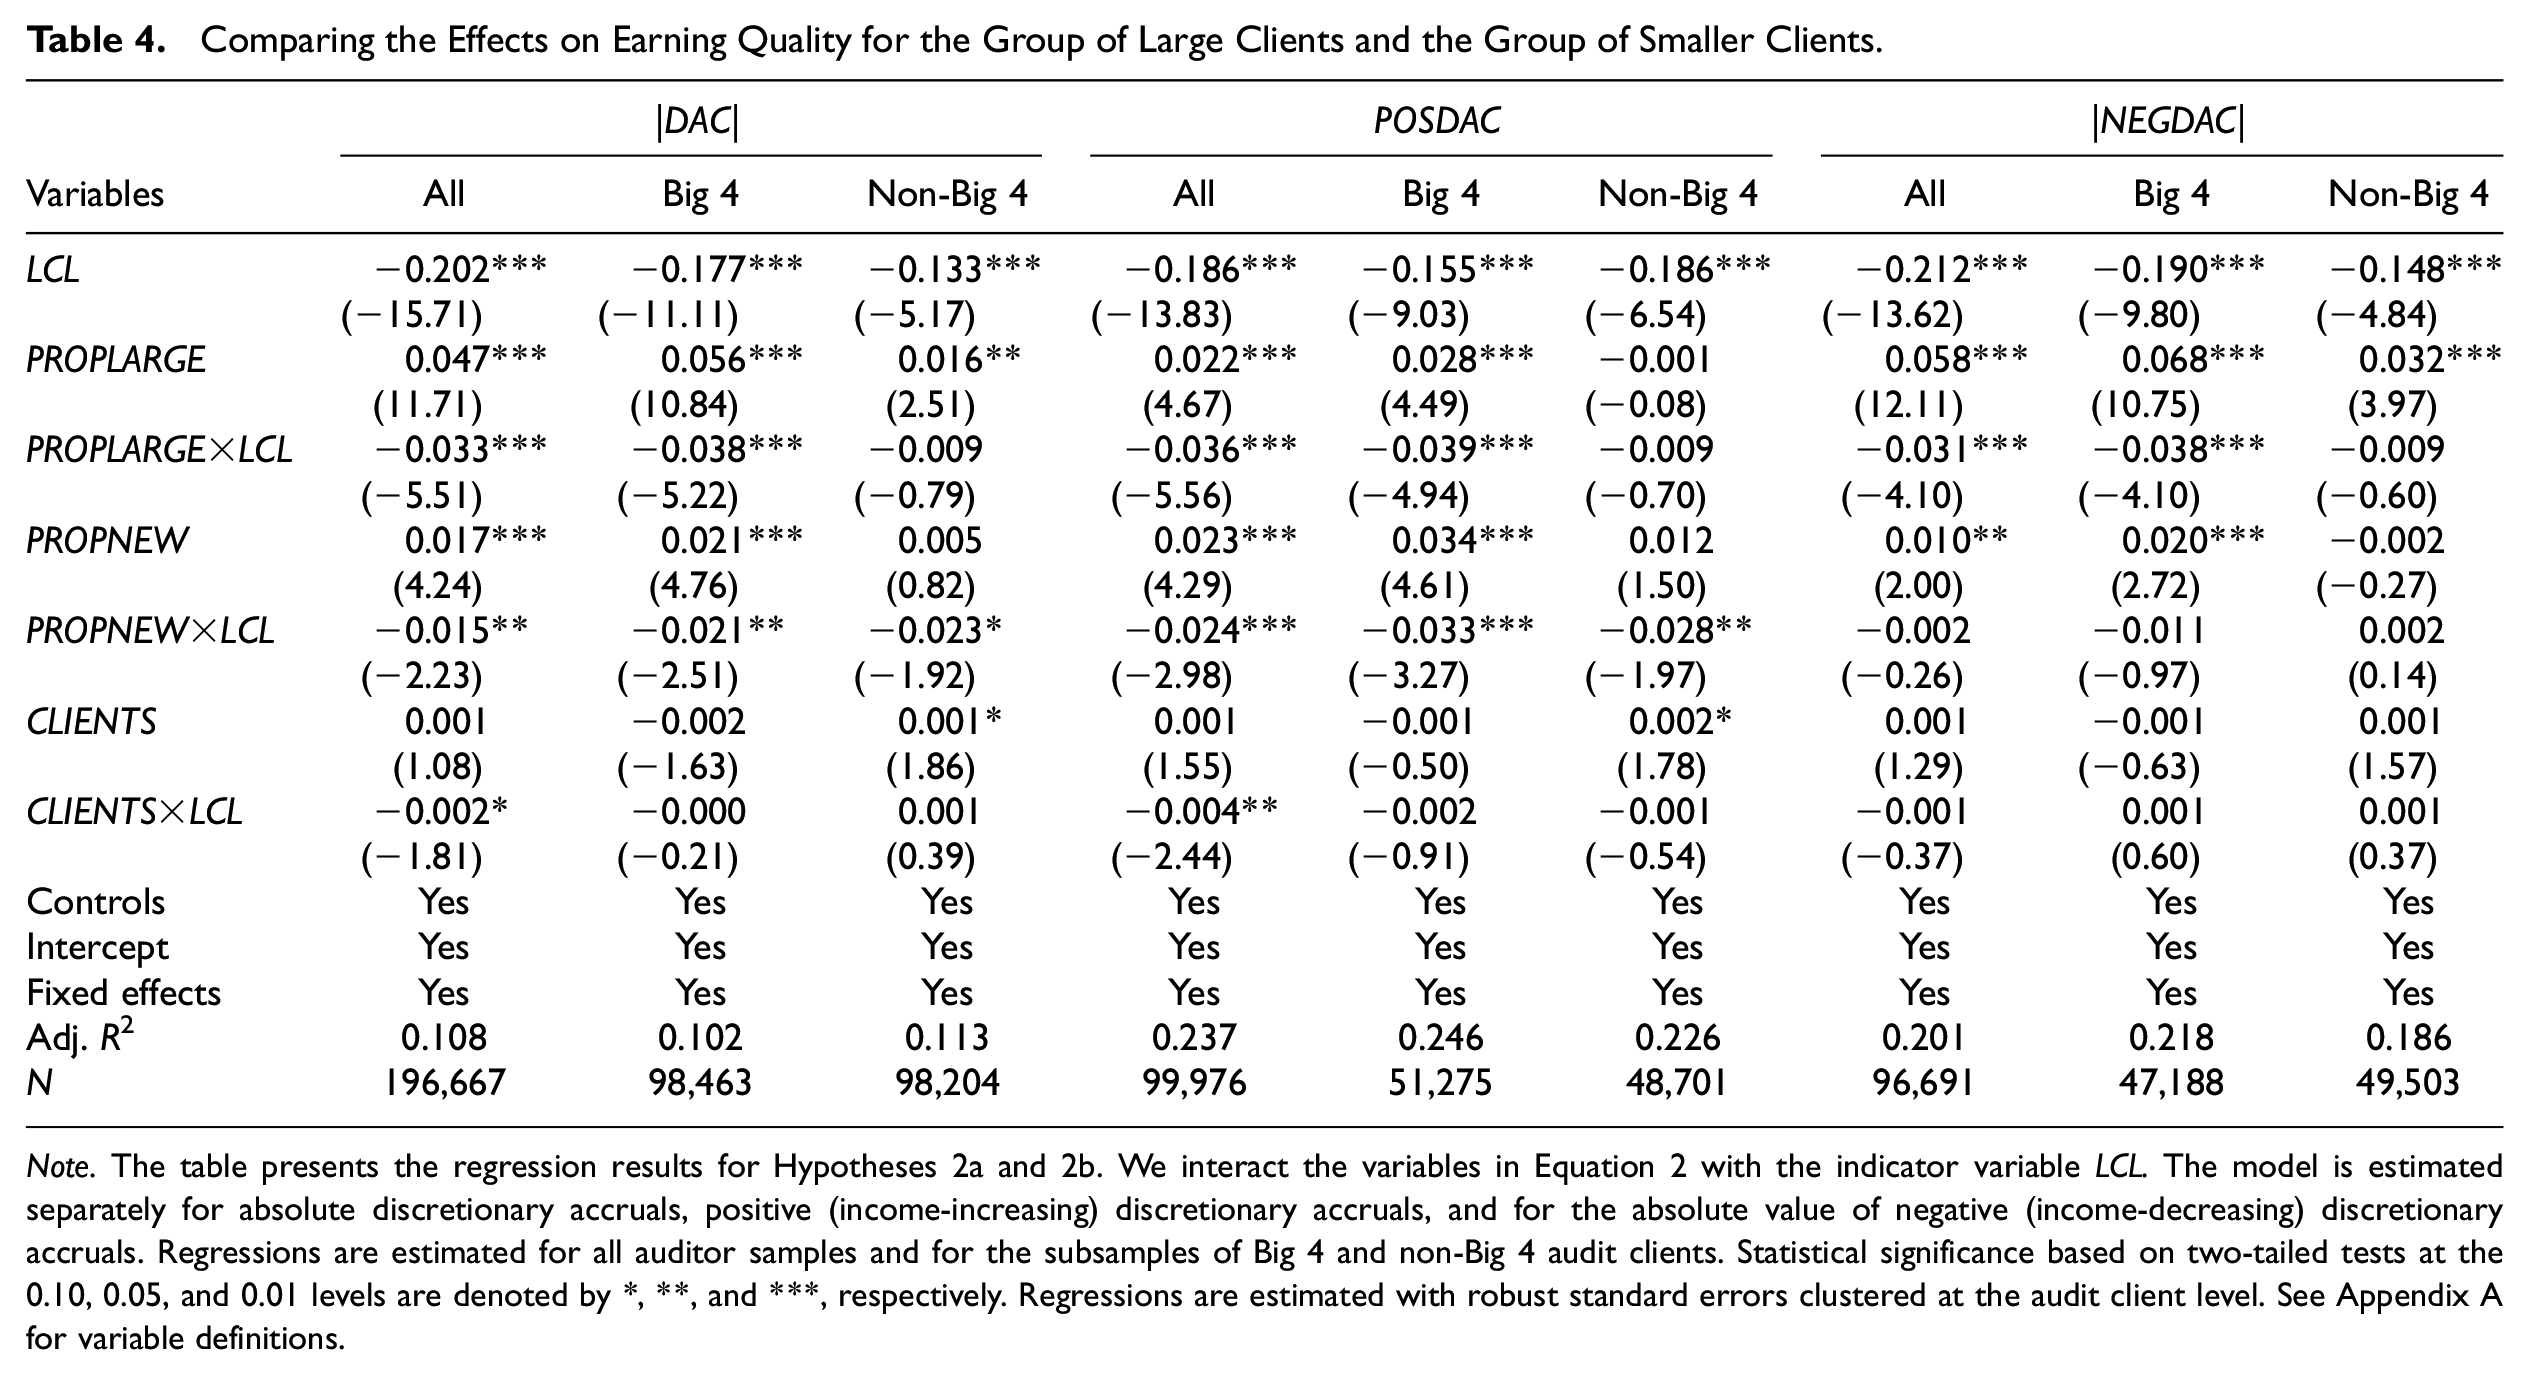
Note. The table presents the regression results for Hypotheses 2a and 2b. We interact the variables in Equation 2 with the indicator variable LCL. The model is estimated separately for absolute discretionary accruals, positive (income-increasing) discretionary accruals, and for the absolute value of negative (income-decreasing) discretionary accruals. Regressions are estimated for all auditor samples and for the subsamples of Big 4 and non-Big 4 audit clients. Statistical significance based on two-tailed tests at the 0.10, 0.05, and 0.01 levels are denoted by *, **, and ***, respectively. Regressions are estimated with robust standard errors clustered at the audit client level. See Appendix A for variable definitions.
The coefficient on PROPLARGE×LCL is significantly negative in the POSDAC and |NEGDAC| models for Big 4 audit partners but is insignificant for non-Big 4 partners. These results indicate that a greater proportion of large clients in Big 4 partners’ client portfolios has a significantly weaker impact on EQ among the group of large clients than among smaller clients. Therefore, Hypothesis 2 is supported but only for Big 4 audit partners. It seems that in non-Big 4 firms, having a greater proportion of large clients decreases a partner’s constraint of income-decreasing earnings management, but there is no significant difference in the effect between large and smaller clients, supporting H1a but not H2.
The greater engagement risk faced by Big 4 partners may explain these differing results for Big 4 and non-Big 4 partners. Specifically, Big 4 partners have greater reputational capital to lose, they face greater litigation risk due to their deep pockets, they are more visible to the public, and their regulatory risk is higher due to more frequent quality inspections (Khurana et al., 2021). Therefore, Big 4 partners have a greater incentive than non-Big 4 partners to focus on large clients. This may distract a busy Big 4 partner from other clients, especially smaller ones. For non-Big 4 partners, the negative effect of busyness could be more equal across clients, regardless of their characteristics, because reputational risk is, in general, lower for non-Big 4 partners.
The coefficient on PROPNEW×LCL is significantly negative for the Big 4 sample in the POSDAC model. This suggests that one unit increase in the proportion of new clients increases income-increasing earnings management significantly less among the large clients of Big 4 partners than among the smaller clients of these partners. In the |NEGDAC| models, the coefficient on PROPNEW×LCL is insignificant. The findings related to new clients suggest that the effect of the proportion of new clients on income-increasing discretionary accruals of the clients of Big 4 partners is weaker for large clients than for smaller ones. However, we do not find any significant differences between large and smaller clients in terms of the effect of the proportion of new clients on EQ measured using negative discretionary accruals.
In summary, our findings suggest that with higher proportions of large and new clients, a Big 4 partner’s constraint of income-increasing and income-decreasing earnings management decreases, supporting Hypotheses 1a and 1b. Consistent with our expectations, we find differences in these results between the groups of large and smaller clients. In Big 4 firms, an audit partner’s client portfolio composition seems to have a weaker effect on the EQ of large clients than on that of smaller clients, supporting Hypothesis 2. However, for non-Big 4 partners, the proportion of large clients decreases a partner’s constraint of income-decreasing earnings management, which supports Hypothesis 1a. We do not find any supporting evidence for the other hypotheses for non-Big 4 partners.
Sensitivity Analyses
Alternative EQ Measure
To ensure that our results are not sensitive to our decision to use discretionary accruals to measure EQ, we consider small profits (SP) as an alternative measure of EQ. In the case of SP, earnings may have been managed upward to avoid reporting losses (Caramanis & Lennox, 2008; Gul et al., 2013). In high-tax-alignment countries such as Finland managers also have an incentive to manage earnings downward, close to zero, to reduce taxes.
We define a company as reporting a small profit if its ROA is between 0% and 1%. Based on this definition, approximately 12.5% of the client-years in our sample report SP. The (untabulated) results of sensitivity analyses using SP as the dependent variable support Hypothesis 1a. Specifically, clients of partners who audit a relatively high number of large clients are more likely to meet or beat a zero-earnings target. This effect is weaker if the client is large, supporting Hypothesis 2. Although this result holds for both Big 4 and non-Big 4 audit partners, our main results do not support Hypothesis 2 for non-Big 4 partners.
Results regarding the proportion of new clients are in line with our main findings, supporting Hypotheses 1b and 2 for Big 4 partners. Hence, our inferences are unchanged when we measure audit quality with the likelihood of SP instead of discretionary accruals.
Estimating Discretionary Accruals Based on Size-Based Peer Groups
The audit clients in our sample vary greatly by size, suggesting significant heterogeneity among clients in our sample, even within the same industry. Therefore, in an untabulated sensitivity test, we estimate Equation 1 for size-based peer groups instead of industry-based ones. We form the size-based peer groups following Ecker et al. (2013), and consistent with our requirement of at least 30 observations for each industry-based peer group, we require 30 size-based peers when creating size-based peer groups. We find that our inferences are robust when estimating discretionary accruals based on these new peer groups.
Definition of a Large Client
In our main analyses, we define a client as large if its total assets belong to the highest quartile of the distribution or if it is publicly listed. In untabulated sensitivity analyses, we re-estimate our regressions using two alternative definitions of large clients. First, we define a client as large if its total assets belong to the highest decile of the distribution or if it is publicly listed. Second, we alternatively define a client as large if its total assets exceed 50 million euros or its revenues exceed 43 million euros. These thresholds are based on the European Union’s company size classification. 17 We find that our inferences are not sensitive to these alternative definitions of a large client, except that we do not find significant differences between large and smaller clients with regard to the association between the proportion of new clients and EQ.
Alternative Specifications of the Test Variables
It is crucial that the portfolio variables (i.e., PROPLARGE, PROPNEW, and CLIENTS) capture the clientele effect and not the effect of client characteristics. To minimize the possibility that the characteristics of a single client could drive the effect of the portfolio measure, we exclude portfolios with fewer than 10 clients from the main analyses. To alleviate any remaining concerns, we remeasure our portfolio variables by excluding client i from portfolio j in year t. The untabulated results confirm that our main inferences are robust.
Another measurement choice we make in the main analyses is using proportional rather than quantity measures. In untabulated sensitivity analyses, we use the log of the number of large clients and the log of the number of new clients as test variables. We find that our inferences are mainly robust, except that when using quantity measures, the results suggest that non-Big 4 audit partners also allow more income-increasing earnings management when they have more new clients in their client portfolios. However, consistent with our expectations, this effect is weaker for large clients than for smaller ones.
Threshold for Minimum Portfolio Size
When selecting our sample, we excluded client portfolios with fewer than 10 clients. To test whether our results are sensitive to this threshold, we use three alternative thresholds for minimum portfolio size. First, we set the threshold to 5 clients, then to 20, and finally, to 50 clients. Based on untabulated sensitivity analyses, our inferences are unchanged.
Addressing Potential Endogeneity Concerns
Potential endogeneity concerns exist in all archival partner-level audit-quality studies. Our analyses may suffer from correlated omitted variable bias if our models omit variables that affect both EQ and audit partner busyness. For example, limitations with respect to data availability preclude our use of data on audit teams. In addition, our study may suffer from simultaneity bias if the causality between the dependent variable and a test variable runs both ways. For instance, we expect that the proportion of large clients affects the EQ of a client, but it is possible that a client’s EQ affects the proportion of large clients because audit clients are not randomly assigned. Moreover, a greater proportion of large clients may indicate greater audit partner busyness, but it may also reflect a higher-quality partner (DeAngelo, 1981; Lennox & Wu, 2018). Although busyness is expected to have a negative impact on EQ, higher-quality partners are more conservative, which leads to higher-quality earnings. Clients with greater agency costs, such as large clients, also demand higher-quality audits and are thus more likely to engage higher-quality partners. Therefore, the direction of causality between PROPLARGE and |DAC| is not self-evident.
Because Big 4 partners are generally viewed as higher-quality partners, larger clients, and publicly listed companies are more often audited by Big 4 auditors. This may cause endogeneity problems in our study. To alleviate this concern, in our main analyses, we test our hypotheses separately for Big 4 and non-Big 4 partners. To address any remaining endogeneity concern, in untabulated analyses, we use two-stage least squares (2SLS) estimation.
We start by selecting a set of potential instrumental variables (IVs) and testing their appropriateness. IVs must be correlated with the test variable but uncorrelated with the model’s error term. First, we include partner age (AGE), which is a commonly used IV in audit partner-level earnings management studies (C.-Y. Chen et al., 2008; W. Chi et al., 2017). Second, we use the lagged value of the percentage change in the number of clients (LAG_CLIENTSCH). We assume that both AGE and LAG_CLIENTSCH reflect the partner’s career development stage, and thus, we expect them to correlate with our test variables. For instance, during the establishment phase, an audit partner is trying to acquire new clients but does not yet have many large clients. Third, we add the audit partner’s mean client size in the preceding year (LAG_MEANlnTA) and, finally, the number of clients audited by the partner in the preceding year (LAG_CLIENTS). PROPLARGE should be positively correlated with LAG_MEANlnTA by construction but negatively correlated with LAG_CLIENTS. We assume that partners who already have a large clientele and, thereby, a greater workload, are less likely to further increase their client base. We conduct all endogeneity analyses using the model used to test Hypothesis 2 and we also interact these IVs with LCL.
Because we have more IVs than assumed endogenous variables, we first conduct an over-identifying restrictions test. The test result rejects the appropriateness of our set of instruments and indicates that AGE is the only instrument that is significantly associated with the estimated error term in the second-stage regression. After excluding AGE and AGE×LCL, we fail to reject the exogeneity of the remaining instruments. Following Larcker and Rusticus (2010), we conduct a partial F-test and check the partial R-squared of the first-stage regression. According to the partial F-statistic and the partial R-squared, our set of instruments have high explanatory power (partial R2 varies between 15.39% and 87.80%), and there is no indication of weak instruments. Therefore, we proceed to the Hausman test using this set of instruments.
The Hausman test of endogeneity indicates the presence of endogeneity only within the subsample of Big 4 partners. Furthermore, when separating POSDAC and |NEGDAC|, the Hausman test rejects the exogeneity of our test variables (PROPLARGE and PROPNEW) when the dependent variable is POSDAC, and the sample includes only Big 4 partners. This implies that 2SLS is preferable to OLS regression with this subsample. We confirm this with Hausman’s specification test for determining between OLS and IV estimators because the test statistic for the subsample is 134.10 with a p-value of 0.034. Thus, we address this potential endogeneity problem using 2SLS estimation. The inferences from the 2SLS analyses are consistent with those reported in Table 4.
Conclusions and Limitations
In this study, we examine whether auditing greater proportions of large and new clients decreases audit partners’ constraints on earnings management. Furthermore, we explore whether this effect is weaker among large clients. Using audit partners’ complete client portfolios in the analyses, we find that clients’ EQ is negatively associated with the proportions of large and new clients. This holds especially for smaller clients of Big 4 partners. 18 Overall, after controlling for portfolio size and using the proportions of large and new clients to proxy for auditor business, our results indicate that in Big 4 firms, busier audit partners allow more earnings management, especially for smaller clients. Also, in non-Big 4 firms, having a greater proportion of large clients decreases a partner’s constraint of income-decreasing earnings management, but there is no significant difference for large and smaller clients.
We contribute additional insights into the audit-quality discussion by providing archival evidence that the EQ of an audit client is affected not only by the characteristics of the client and audit partner but also by those of the audit partner’s other clients. We extend audit partner busyness research by using our unique sample of complete client portfolios to show that the proportions of large and new clients are significant drivers of EQ. Accordingly, it is important to recognize that portfolio size alone can only partially explain the busyness effect and that client characteristics composing the portfolio play an important role in this context. Finally, we contribute to the literature on auditor incentives. Our findings of a significantly weaker busyness effect among smaller clients of Big 4 firms support the view that agency costs and engagement risk drive partner behavior.
Our results have important implications for regulators, practitioners, and academics who have concerns about audit partners having excessively heavy workloads, which can impair audit quality. Based on our findings, we conclude that these concerns are justified. Our findings indicate that the composition of an audit partner’s client portfolio should be considered when assessing their workload and busyness. In addition, because audit partner incentives drive partner behavior, even busy partners seem to focus on their large clients, and the negative consequences of their busyness are “paid” mainly by smaller clients.
High-quality earnings and fairly presented financial statements are also important for private clients (Karjalainen, 2011). Because a majority of clients worldwide are private, their contribution to the economy is considerable (Niemi & Sundgren, 2012). 19 Because banks and other financial institutions use audited financial statements when making loan decisions and in some countries, taxation is based on audited financial statements, the EQ of private companies plays a vital role in the economies of many countries.
Our study is subject to several limitations. First, findings from our Finnish setting may limit the generalizability of our findings to other settings. For example, the average number of clients may differ in Finland versus some other countries, such as the United States or United Kingdom. Sundgren and Svanström (2014) report the median number of private companies per audit partner in Sweden as 119, but according to Vandenhaute et al. (2020), the average portfolio size is approximately 46 clients in Belgium. In our Finnish study, the average yearly client portfolio consists of approximately 59 clients, which is less than that in Sweden but more than that in Belgium. Unfortunately, partner-level information about the average number of private and listed audit clients in other countries is not readily available. However, we posit that the underlying factors and consequences of partner busyness should be relevant in different settings.
Second, because audit partners are not randomly assigned to the clients, we do our best to alleviate this concern. Large clients and Big 4 partners are generally linked to higher-quality audits. Nonetheless, our results show a negative association between the proportion of large clients and EQ, especially among the smaller clients of Big 4 partners. To help alleviate endogeneity concerns, we employ a 2SLS estimation in our additional analyses, and our inferences are robust.
Third, due to data constraints, we cannot observe audit partners’ time allocation across clients. Instead, we need to rely on findings in prior research to develop expectations with regard to time allocation.
Finally, because data on audit teams are not readily available, we cannot evaluate the potential effects of audit teams on our results. Because teams are more widely used in Big 4 firms than in small audit firms, we could expect to see less pronounced negative effects of the proportions of large and new clients on EQ in Big 4 firms. However, our results show the opposite. The role that audit teams play in explaining the association between auditor busyness and audit quality is an empirical question that we leave for future research to address.
Footnotes
Appendix
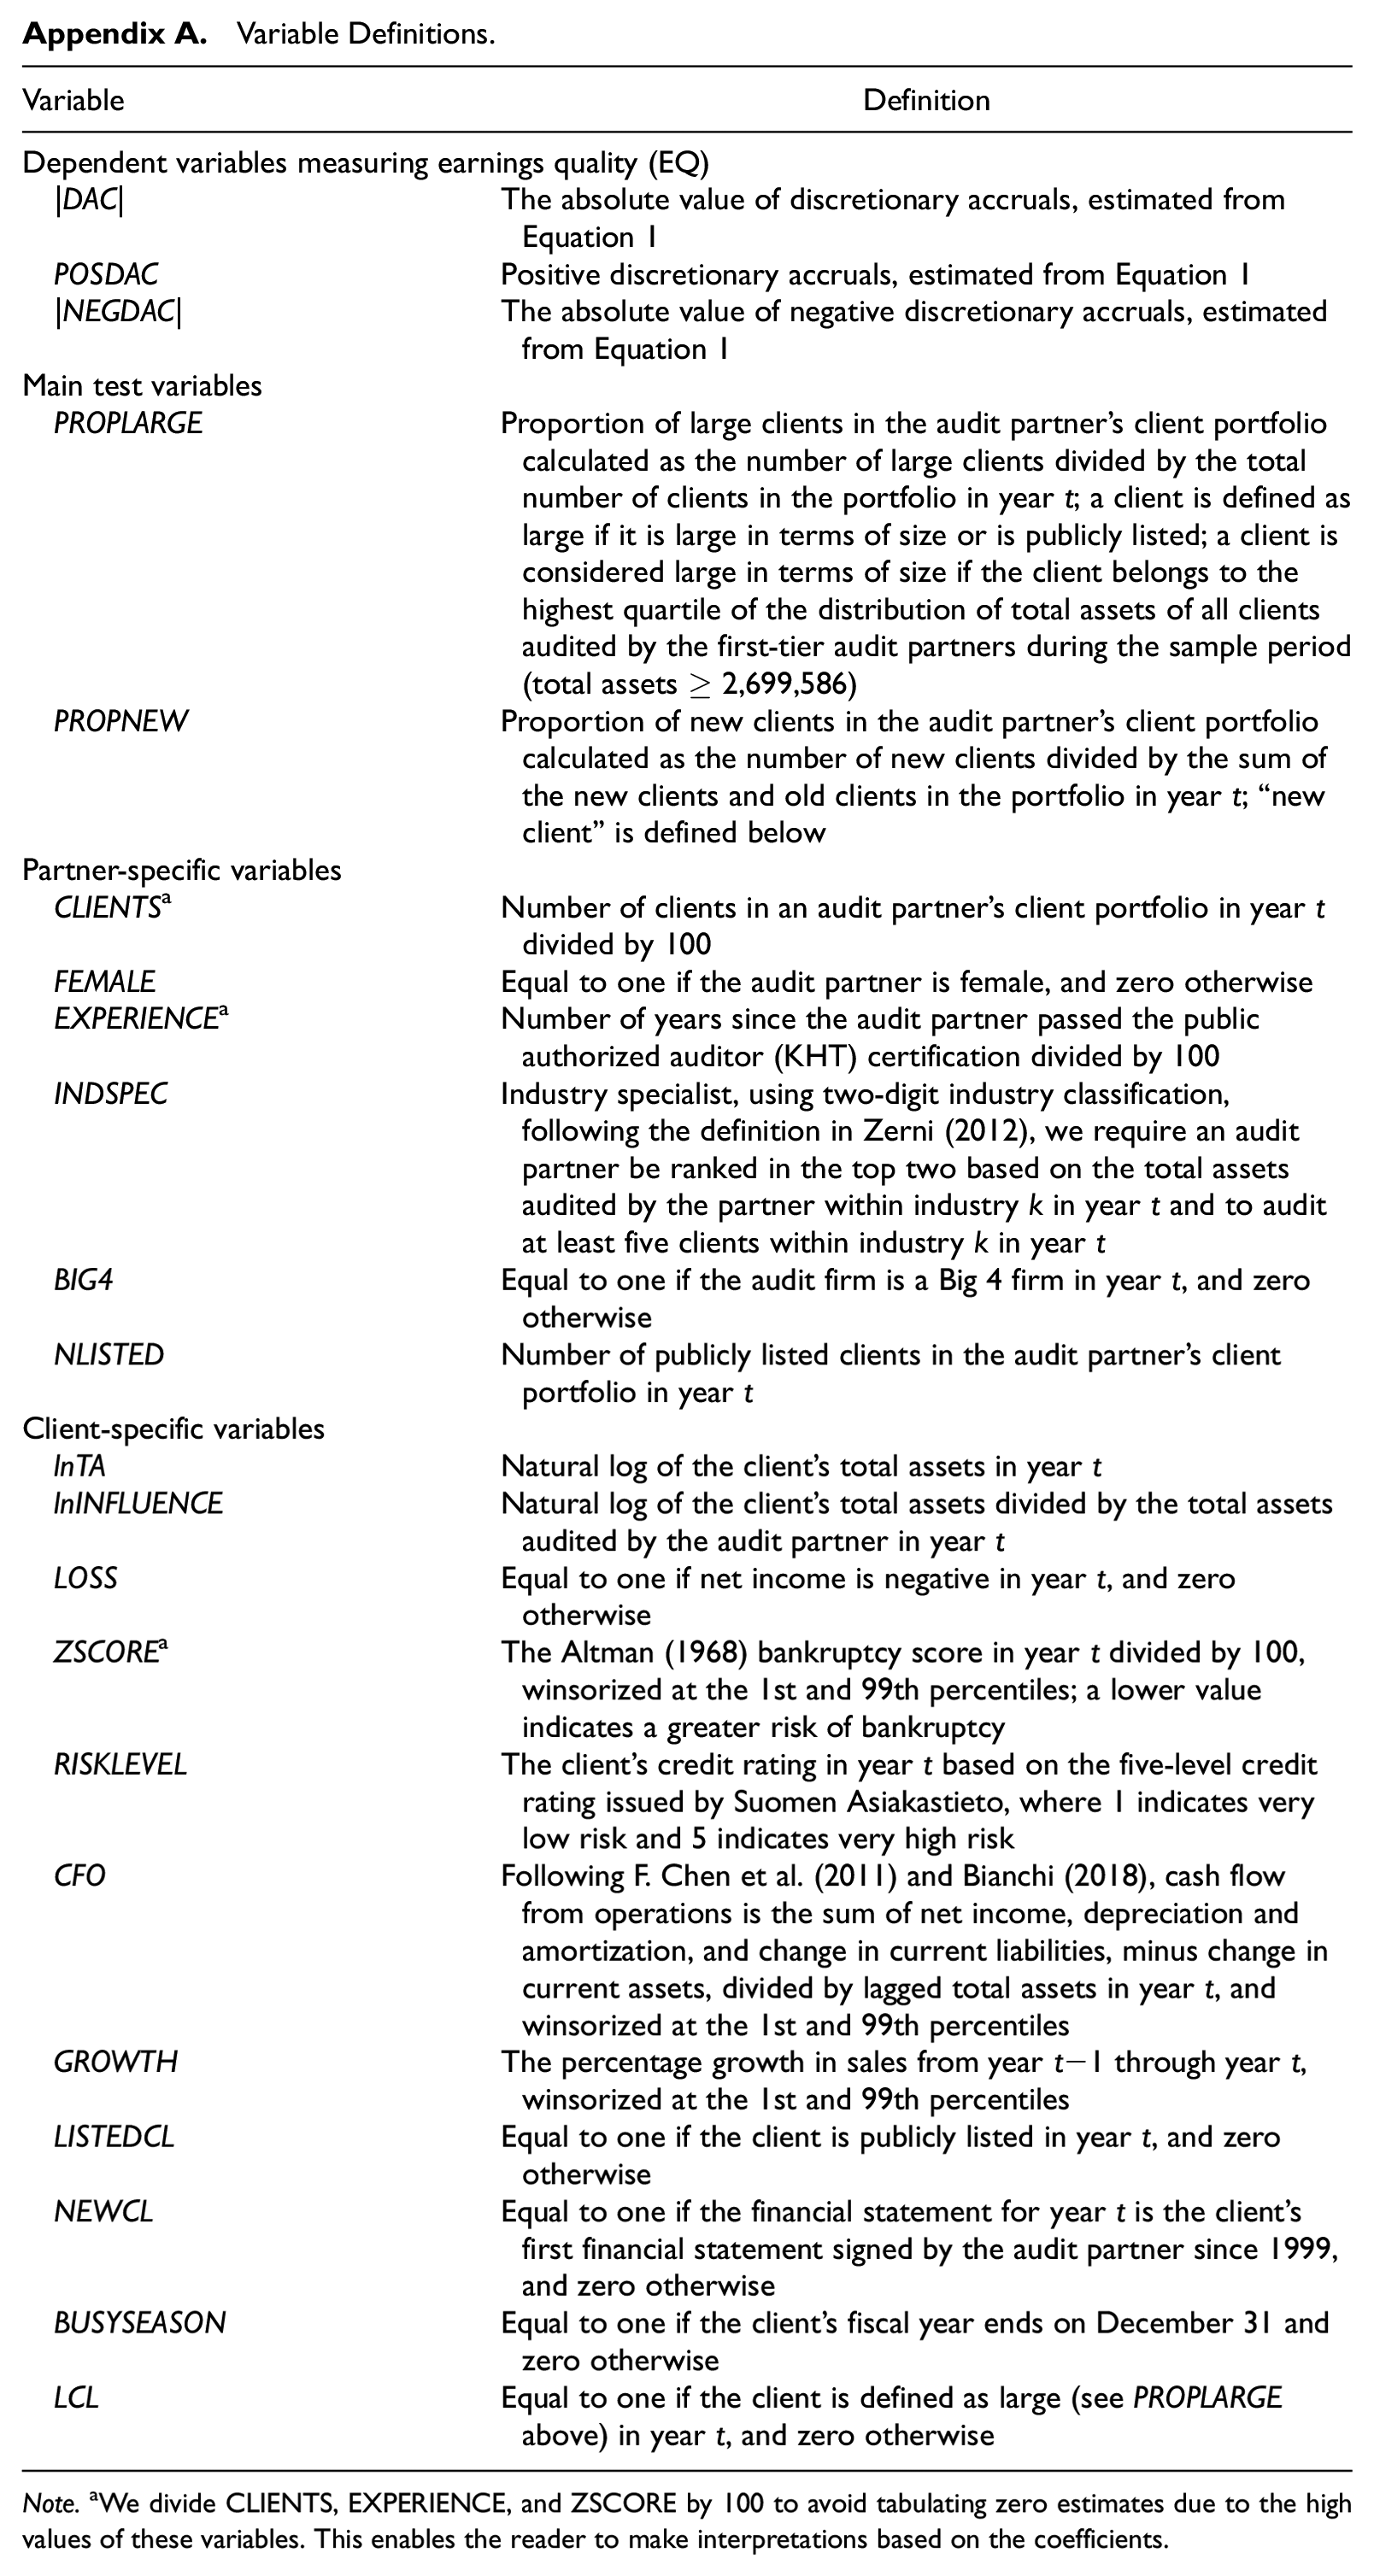
Variable Definitions.
| Variable | Definition |
|---|---|
| Dependent variables measuring earnings quality (EQ) | |
| |DAC| | The absolute value of discretionary accruals, estimated from Equation 1 |
| POSDAC | Positive discretionary accruals, estimated from Equation 1 |
| |NEGDAC| | The absolute value of negative discretionary accruals, estimated from Equation 1 |
| Main test variables | |
| PROPLARGE | Proportion of large clients in the audit partner’s client portfolio calculated as the number of large clients divided by the total number of clients in the portfolio in year t; a client is defined as large if it is large in terms of size or is publicly listed; a client is considered large in terms of size if the client belongs to the highest quartile of the distribution of total assets of all clients audited by the first-tier audit partners during the sample period (total assets ≥ 2,699,586) |
| PROPNEW | Proportion of new clients in the audit partner’s client portfolio calculated as the number of new clients divided by the sum of the new clients and old clients in the portfolio in year t; “new client” is defined below |
| Partner-specific variables | |
| CLIENTS a | Number of clients in an audit partner’s client portfolio in year t divided by 100 |
| FEMALE | Equal to one if the audit partner is female, and zero otherwise |
| EXPERIENCE a | Number of years since the audit partner passed the public authorized auditor (KHT) certification divided by 100 |
| INDSPEC | Industry specialist, using two-digit industry classification, following the definition in Zerni (2012), we require an audit partner be ranked in the top two based on the total assets audited by the partner within industry k in year t and to audit at least five clients within industry k in year t |
| BIG4 | Equal to one if the audit firm is a Big 4 firm in year t, and zero otherwise |
| NLISTED | Number of publicly listed clients in the audit partner’s client portfolio in year t |
| Client-specific variables | |
| lnTA | Natural log of the client’s total assets in year t |
| lnINFLUENCE | Natural log of the client’s total assets divided by the total assets audited by the audit partner in year t |
| LOSS | Equal to one if net income is negative in year t, and zero otherwise |
| ZSCORE a | The Altman (1968) bankruptcy score in year t divided by 100, winsorized at the 1st and 99th percentiles; a lower value indicates a greater risk of bankruptcy |
| RISKLEVEL | The client’s credit rating in year t based on the five-level credit rating issued by Suomen Asiakastieto, where 1 indicates very low risk and 5 indicates very high risk |
| CFO | Following F. Chen et al. (2011) and Bianchi (2018), cash flow from operations is the sum of net income, depreciation and amortization, and change in current liabilities, minus change in current assets, divided by lagged total assets in year t, and winsorized at the 1st and 99th percentiles |
| GROWTH | The percentage growth in sales from year t−1 through year t, winsorized at the 1st and 99th percentiles |
| LISTEDCL | Equal to one if the client is publicly listed in year t, and zero otherwise |
| NEWCL | Equal to one if the financial statement for year t is the client’s first financial statement signed by the audit partner since 1999, and zero otherwise |
| BUSYSEASON | Equal to one if the client’s fiscal year ends on December 31 and zero otherwise |
| LCL | Equal to one if the client is defined as large (see PROPLARGE above) in year t, and zero otherwise |
Note.aWe divide CLIENTS, EXPERIENCE, and ZSCORE by 100 to avoid tabulating zero estimates due to the high values of these variables. This enables the reader to make interpretations based on the coefficients.
Acknowledgements
We thank Xiao-Jun Zhang (Editor-in-Chief), Linda Myers (Associate Editor), and two anonymous reviewers for helpful comments and suggestions that have significantly improved our paper. We also thank Kris Hardies, Kim Ittonen, Juha-Pekka Kallunki, Lasse Niemi, Angela Pettinicchio (the EIASM discussant), Tobias Svanström, participants at the Journal of Accounting, Auditing, and Finance (JAAF) Conference 2023, the EAA 39th Doctoral Colloquium in Accounting, the 26th Annual International Symposium on Audit Research (ISAR), the 2022 BACC seminar, the 44th Annual Congress of the EAA, and the 8th EIASM Workshop on Audit Quality, and seminar participants at Umeå University and Oulu Business School. We are also grateful to Monika Causholli (the discussant), Jere Francis, Robert Knechel, and other participants at the 10th EARNet PhD workshop for their constructive feedback on the prior version of the paper. We thank the Finnish Patent and Registration Office for providing the requisite data.
Declaration of Conflicting Interests
The author(s) declared no potential conflicts of interest with respect to the research, authorship, and/or publication of this article.
Funding
The author(s) disclosed receipt of the following financial support for the research, authorship, and/or publication of this article: We acknowledge the OP Group Research Foundation for financial support. Jenni Jääskö gratefully acknowledges the financial support received from the Finnish Cultural Foundation, the Finnish Concordia Fund, the Edwin Sederholm Foundation, the Marcus Wallenberg Research Foundation, the Foundation for the Advancement of Finnish Securities Markets, and the Tauno Tönning Foundation.
Data Availability
All data sources are described in the paper. Data requests should be directed to the administrator of each database.