
Abstract
Using a cross-country setting, we document differences in the relation between earnings quality and the two components of trading volume around earnings announcements, one related to differential interpretation of the earnings signal and the other related to pre-event differential information precision. We find that in countries with stronger investor protection, less corrupt governments, and more liquid stock markets, a noisier earnings signal increases differential interpretation of the earnings signal but decreases investors’ incentive for information acquisition before earnings announcements, leading to lower pre-event differential information precision. However, these trading patterns flip in countries with weaker investor protection, more corrupt governments, and less liquid stock markets. We also find that institutional investors in countries with stronger institutions are likely to benefit more from their superior information processing skills, leading to more information acquisition both at and before earnings announcements. Overall, our study adds to the literature by documenting significant cross-country variations in investors’ trading volume reactions to earnings quality.
Introduction
O. Kim and Verrecchia (1997) demonstrate that trading around public announcements increases with differences in investors’ prior beliefs and their differential interpretation of the announcement, both of which are the results of information acquisition. Our study uses the O. Kim and Verrecchia (1997) model and an international setting to examine how country-level institutional factors affect the incentives for information acquisition and influence the relation between earnings quality and trading volume reactions to earnings announcements.
Many studies have examined cross-country earnings informativeness and shown that investor response to earnings information varies substantially across countries (DeFond et al., 2007; Hung, 2000; Landsman et al., 2012). This line of research has primarily focused on the question of whether investors in different countries react to earnings information differently. However, an underexplored question is how investors react to earnings information and, more importantly, whether and the extent to which country-level institutions shape trading behavior. Our study attempts to fill this void by taking advantage of the rich heterogeneity in country-level institutions to examine the implication of earnings quality for investors’ trading behavior.
A key insight of the O. Kim and Verrecchia (1997) model is that trading volume can be decomposed into event-period and preannouncement effects: differential interpretations of the news among investors (i.e., event-period disagreements or private information) and updates of investors’ preannouncement beliefs (i.e., pre-event differential informedness or differential prior precision). They demonstrate that the first component of trading volume is unrelated to stock price changes whereas the second component is a function of stock price changes. To derive a more complete view of how country-level factors affect investors’ private information acquisition and trading behavior, it is important to consider both components of trading volume.
Our sample comprises 177,264 firm-year annual earnings announcements from 23 countries between 1995 and 2014. We employ three proxies for earnings quality: the absolute value of discretionary accruals from the Jones (1991) model, Dechow and Dichev’s (2002) accruals quality measure, and earnings variability (Dechow et al., 2010). Following the prior literature, we use abnormal trading volume around earnings announcements unrelated to stock returns to measure investors’ differential interpretations of the earnings signal and trading volume related to stock returns as a proxy for investors’ differential precision of preannouncement private information (Abdel-Meguid et al., 2019; Ahmed et al., 2003; Barron et al., 2018; Hope et al., 2009). Similar to Abdel-Meguid et al. (2019), we find evidence of more announcement-period private information and less preannouncement differential belief precision for firms with lower earnings quality. 1
Our primary interest lies in the cross-country variations in the relations between the two components of trading volume reaction and earnings quality. We focus on three country-level institutional factors: investor protection, government corruption, and market liquidity. In countries with a more market-oriented legal system that establishes clear ownership rights, investors will find it more rewarding to conduct firm-level equity research (Chan & Hameed, 2006; Morck et al., 2000). Facing noisy earnings signals, investors trading in a relatively strong investor protection environment have greater incentives to rely on their own knowledge, skills, and resources to understand and interpret the earnings signals due to higher returns on private information acquisition. Opinion divergence arising from interpreting noisy earnings signals is thus more prominent in countries with stronger investor protection.
Beneish and Vargus (2002) show that insider trading can predict future earnings quality, suggesting that investors may use insider trading information in the pre-event period to unravel earnings management and interpret the earnings signal during an earnings announcement. Insider trading is more prevalent in countries with poor investor protections, more so for firms with strong incentives to manage earnings. Accordingly, investors of these firms may benefit more from preannouncement information (including insider trading information) acquisition when anticipating an earnings announcement, leading to increased differential prior precision and thus a greater trading volume reaction related to stock price changes.
La Porta et al. (1998) argue that a strong system of legal enforcement could, in principle, substitute for weak rules because an active and well-functioning court system can step in and help investors recover losses caused by management abuse. The rule of law will prevail with a strong and independent court system, which in turn depends on the extent of corruption in the government (Eleswarapu & Venkataraman, 2006). 2 Therefore, we focus on corruption in the government and study how the government’s stance toward business affects the incentive to engage in private information acquisition during the announcement period. Because economic fundamentals are further obscured by political factors (Chen et al., 2010; DiRienzo et al., 2007; Morck et al., 2000), noisy earnings signals in more corrupt countries are even more difficult to process and interpret for investors without knowledge of the context of the disclosure, leading to smaller trading volume reactions unrelated to stock price changes. Moreover, low earnings quality disincentivizes investors to uncover potential expropriation of minority shareholders, leading to larger differences in belief precision between uninformed investors and investors with political connections in more corrupt countries. Thus, we hypothesize that, in more corrupt countries, the amount of announcement-period private information for firms with noisy earnings signals is lower, whereas the pre-event differential informedness is higher.
Finally, we examine the impact of stock market liquidity. Liquid stock prices are more informative of future earnings (Kerr et al., 2020). Liquidity facilitates the price discovery process by reducing the costs of equity analysis and executing arbitrage strategies. With lower trading costs, investors can benefit more from firm-specific research and private information acquisition to better understand and interpret noisy earnings signals. Investors with different skills and analytical tools will interpret the noisy earning signals differently, creating more trading volume unrelated to stock returns. In contrast, a high level of illiquidity poses the risk of high losses for investors, such as the potential significant price volatility from a large transaction. This uncertainty may hold back investment in private information acquisition for investors who aim to balance the costs and benefits of equity research. In illiquid markets, only a small group of skillful investors can overcome the high research cost for firms with noisy earnings signals and the high trading cost. This group of skillful investors will then have more precise prior beliefs than other investors, leading to wider pre-event differential informedness for firms with low earnings quality in illiquid markets.
We find results consistent with our predictions. For announcement-period private information, we find that trading volume reactions independent of stock price changes are more negatively related to earnings quality in countries with stronger investor protection, less corrupt governments, and more liquid stock markets. We find the opposite results for the differential precision of preannouncement private information. Overall, our results indicate that country-level institutional factors are crucial in shaping investors’ private information acquisitions both before and at earnings announcements.
We shed light on a potential source of differential precision of private information by focusing on the firm’s institutional ownership, as institutional investors have more sophisticated skills and technology to process earnings signals. In the preannouncement period, institutional investors are also likely to be better informed because they are more active in monitoring the firm’s financial reporting (Chung et al., 2002; I. Kim et al., 2016). We find that only in countries with strong investor protection does the negative relation between earnings quality and trading volume reaction independent of stock price changes strengthen for firms with more institutional investors. The relation between earnings quality and trading volume reaction related to stock price changes is less positive as institutional ownership increases, but again this result holds only in countries that have stronger investor protection and less corrupt governments. Our results suggest that institutional ownership contributes to differential private beliefs among investors both before and at earnings announcements. Importantly, institutional investors’ incentive to engage in private information acquisition depends on whether they trade in a market-oriented environment with strong enforcement of law.
Our study contributes to the literature in two ways. First, prior cross-country studies document significant investor trading volume reactions to earnings quality (e.g., Bhattacharya et al., 2003; DeFond et al., 2007; Landsman et al., 2012). However, this line of research has been silent on the sources of the trading volume reactions. We decompose trading volume reaction using O. Kim and Verrecchia’s (1997) framework and provide a more complete picture of how investors across different countries behave in response to different earnings quality. 3 More importantly, we go deeper in an effort to understand the institutional forces behind the observed trading behaviors. The relation between trading volume reaction and earnings quality depends on how investors acquire information and make trading decisions, which in turn depends on factors that likely vary across countries. We find that in countries with strong institutions (such as the United States), investors who receive noisy earnings signals engage in more private information acquisition at earnings announcements, whereas in countries with weak institutions, investors who anticipate noisy earnings signals rely more on preannouncement private information acquisition in forming trading decisions. The contrasting trading patterns that we observe in countries with weak institutions suggest that caution must be exercised when generalizing the results from the United States to other countries.
Second, this study contributes to our understanding of institutional trading behavior. Our results suggest that institutional investors’ trading reactions to earnings quality are more sensitive to the country-level institutional infrastructure. As institutional investors account for a lion’s share of trading volume around the world, our study of how country-level factors affect institutional investors’ information environment and trading behavior has strong implications for policy design and regulatory oversight of trading practices in various countries.
The rest of the article is organized as follows. The next section provides the research motivation and develops the hypotheses. The section “Sample, Test Variables, and Summary Statistics” describes the sample, specifies the test variables, and reports descriptive statistics. The section “Main Results” and the section “Robustness Tests” present the main test results and robustness test results, respectively. The section “Conclusion” concludes the study.
Motivation and Hypothesis Development
A broad empirical literature suggests that trading volume around public announcements can be related to investor disagreement stemming from different interpretation of public news (Ahmed et al., 2003; Bamber & Cheon, 1995; Bamber et al., 1999; Kandel & Pearson, 1995) and the gap in prior beliefs arising from differential information precision (Atiase & Bamber, 1994; Bamber et al., 1997; Karpoff, 1986; Ziebart, 1990). 4 To attribute trading volume to different sources, researchers often examine the relationship between volume and price changes for the following reasons. First, incoming news may induce trades if investors have different interpretations of the news content, even in the absence of price changes (Kandel & Pearson, 1995; O. Kim & Verrecchia, 1994). Second, price change accompanied by news reflects a change in the average expectation in the market, implying a belief revision for an average investor. When the prior beliefs among investors are more disperse, the same unit of price change will generate more trading because there is a larger change from prior to posterior beliefs for an average investor. That is, there is more reshuffling of beliefs, and updates of beliefs are achieved by rebalancing positions. Therefore, volume related to price changes is associated with pre-event differential information precision (Karpoff, 1986; O. Kim & Verrecchia, 1991). 5 With the above reasoning, trading volume can be decomposed into two components: a component unrelated to price changes and a component related to price changes (e.g., Garfinkel & Sokobin, 2006; O. Kim & Verrecchia, 1997).
Prior volume studies usually associate investor trading behavior around earnings announcements with investor and firm characteristics. 6 Garfinkel and Sokobin (2006) use volume unexplained by price changes to support a disagreement risk explanation of post-earnings-announcement drift. Abdel-Meguid et al. (2019) find that a noisier earnings signal results in higher volume unrelated to price changes (more differential interpretation) and lower volume related to price changes (lower differential prior precision) at earnings announcement. When investors anticipate a noisy earnings signal, they are less motivated to acquire information, leading to less differential information precision before the event.
Meanwhile, the research on the impact of country-level characteristics on market response to earnings news focuses primarily on price reactions, with total trading volume as an alternative indicator of the relevance of the information (DeFond et al., 2007; Landsman et al., 2012). Although relating total volume reactions to certain institutional features is important, the results only show that investors do respond to certain information but do not address the issue of how investors respond.
In addition, investors’ incentives for information acquisition and processing are likely to differ across countries because of the cross-country heterogeneity in institutions, leading to different trading volume dynamics. In what follows, we examine three aspects of country-level factors and develop hypotheses for their impact on investors’ incentive for information acquisition and the resulting impact on different components of trading volume reaction.
First, we examine investor protection. In countries where investors enjoy stronger property rights protection, they are more incentivized to conduct firm-level equity research. In contrast, weak property rights protection discourages informed trading and prevents firm-specific information from being incorporated into stock prices (Chan & Hameed, 2006; Morck et al., 2000). Thus, in the presence of a noisy earnings signal, investors in countries with stronger investor protection have a greater incentive to use their knowledge, skills, and resources to understand and interpret the earnings signal.
Moreover, insider trading is more prevalent in countries with weaker investor protection. DeFond et al. (2007) and Griffin et al. (2011) find attenuated price responses to public announcements when insider trading is more pervasive. Beneish and Vargus (2002) show that insider trading is informative of earnings quality. Therefore, in anticipation of a noisy earnings signal, there may be more insider trading in countries with weaker investor protection. Hence, differential prior precision is more prominent in anticipation of a noisy earnings signal in countries with weaker investor protection. The above discussion leads to our first hypothesis:
Second, we argue that country-level corruption will affect the incentive for information production. Corruption creates injustice in the legal system and disincentivizes public scrutiny. Noisy earnings signals in countries with a higher level of corruption may be even more difficult to interpret because economic fundamentals are further obscured by political factors (Chen et al., 2010; DiRienzo et al., 2007; Morck et al., 2000). In other words, it might be more costly for investors to understand and interpret the earnings signal. Thus, we expect that the negative relation between differential interpretations of the earnings signals and earnings quality is weaker (i.e., less negative) for firms in more corrupt countries. Regarding pre-event differential informedness, Chen et al. (2010) find that analysts have more difficulty in predicting earnings for firms with more political connections, and this result is more significant in countries where corruption is relatively high. In more corrupt countries, it is thus more difficult to uncover expropriation of minority shareholders, resulting in larger differences in information between uninformed investors and investors with more political connections and inside information. A noisy earnings signal makes it even more difficult for investors to understand the true economic performance of the firm, thus further disincentivizing equity analysis. As a result, differential prior precision is more pronounced for firms with low earnings quality in countries with higher corruption. 7 The above discussion leads to our second hypothesis:
Third, we examine the impact of stock market liquidity. Liquid stock prices are more informative of future earnings (Kerr et al., 2020). Liquidity is likely to facilitate the price discovery process by reducing the difficulty of equity analysis and the cost of executing arbitrage strategies. When the cost of trading is lower, investors can benefit more from conducting equity research and have stronger incentives to invest in knowledge, skills, and resources to better understand earnings signals. With different tools, investors facing a noisy earnings signal are likely to interpret it differently and generate different private information at the time when it is released. Therefore, a more liquid stock market will facilitate more private information production at the announcement. However, such a momentary spike in disagreement will dissipate quickly because more liquid stock markets accelerate the convergence of prices to fundamentals (Sadka & Scherbina, 2007). However, an illiquid stock market obscures price discovery and investments in equity analysis, resulting in more mispricing and disagreement in the normal period (Sadka & Scherbina, 2007). The anticipation of a noisier signal can further discourage research for investors who cannot recover the illiquidity cost and increased research cost in analyzing a noisy signal from expected trading profits. Only a small group of investors with superior skills are willing to conduct equity research, arrive at precise prior beliefs, and take advantage of the noisy signal in the presence of illiquidity. As a result, the wedge of prior belief precisions across investors is larger. The above discussion leads to our third hypothesis:
Sample, Test Variables, and Summary Statistics
Data Description
We begin our sample selection with 302,406 firm-year observations from 25 countries between 1995 and 2014 that have sufficient information about daily stock returns, closing prices, number of shares traded, number of shares outstanding, and annual earnings announcement dates in DataStream. We only retain stocks that are the major securities with primary quotes in the sample. 8 We obtain financial data for 245,763 nonfinancial firm-years from Worldscope. We use this data to calculate the earning quality measures, requiring the number of observations within each industry-year of a specific country to be more than 10. After merging the DataStream sample and the Worldscope data, we are left with 177,264 firm-year annual earnings announcement observations.
We calculate daily turnover as the ratio of number of shares traded to shares outstanding. We define the at-announcement period (at-period) and the control period as the [–2, 2] and [–47, –8] windows, respectively, relative to the reported earnings announcement date. We divide the control period into eight subintervals, each 5 days long, and define the control period turnover as the median value of average turnovers across the subintervals. We use the control period turnover to measure trading volume arising from sources unrelated to earnings announcements. This approach to measuring expected volume is commonly adopted in the prior literature (e.g., Ahmed & Schneible, 2007; Bamber et al., 1997). The at-period abnormal turnover (At_ab_turn) is the difference between average at-period turnover and the control period turnover. To minimize the impact of extreme values and potential recording errors, we winsorize all continuous variables in our regression analyses at the 1% and 99% levels for each country-year.
Proxies for Earnings Quality
We measure earnings quality using three proxies: discretionary accruals from the Jones (1991) model (ABSDA), the Dechow and Dichev (2002) accruals quality measure (DD2002), and earnings variability (EARNVAR). We also calculate the first principal component (PC) of the three measures to capture the common underlying earnings quality.
Firms’ fundamental earnings process will inherently generate accruals. However, reported accruals may be subject to discretion, making them less useful for valuation (Xie, 2001). A higher magnitude of discretionary accruals thus represents a lower earnings quality. We use both earnings-increasing and earnings-decreasing discretionary accruals as a measure of managers’ earnings manipulations. We use the Jones (1991) model to separate total accruals into normal and discretionary accruals:
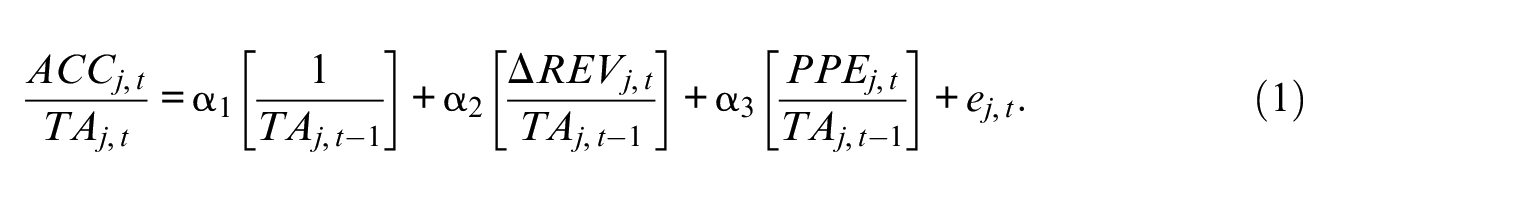
ACC is total accruals, calculated as the change in noncash working capital less total depreciation expense. TA is total assets, ΔREV is change in revenue from the previous period, and PPE is gross property, plant, and equipment. The subscripts j and t refer to firm and year, respectively. We estimate Equation 1 for each two-digit Standard Industrial Classification (SIC) industry in each country-year. ABSDA is the absolute value of the residual (ej,t). A higher value of ABSDA indicates lower earnings quality. 9
Dechow and Dichev (2002), on the contrary, focus on the change in working capital (as part of accruals) and relate it to the past, present, and future cash flow from operations:

The idea for the model is that a closer mapping between working capital and cash flow (i.e., smaller estimation error) indicates higher earnings quality. ΔWC is change in working capital, CF is cash flow from operations, and the subscripts j and t refer to firm and year, respectively. We define our second measure, DD2002, as the absolute value of the residual (ϵ j,t ) from Equation 2 estimated for each two-digit SIC industry in a country-year. A higher value of DD2002 indicates lower earnings quality.
Our third measure of earnings quality is earnings variability (EARNVAR), defined as the standard deviation of firm-level earnings divided by the standard deviation of cash flow from operations, each estimated over the past 5 years (Dechow et al., 2010). The insight from the Dechow and Dichev (2002) model is that accruals of firms with lower accruals quality map less closely with cash flow realizations. The estimation errors and subsequent corrections lead to more noise and less persistence in earnings. Therefore, more volatile earnings can indicate lower earnings quality. Empirically, there is a strong positive relation between accruals quality and earnings persistence (Dechow & Dichev 2002) and more volatile earnings present more noise to end users, resulting in larger analyst forecast errors (Dichev & Tang, 2009). 10
Control Variables
Following Abdel-Meguid et al. (2019), we use several firm-level control variables in our study. Abs_ret, the absolute return over the event-period, captures the contemporaneous impact of price movement on trading volume. Size is the decile rank of market capitalization within a country-year. Meanvol is the mean trading volume of firms in the sample during the announcement period. It controls for market-wide trading activities. Logprice is the natural logarithm of average stock price (in USD) in the control period. It controls for transaction cost.
Because the international firms in our sample have more heterogeneity, we add more control variables following DeFond et al. (2007). Nanalys is the number of analysts following from the I/B/E/S database within the 6-month period before the actual annual earnings announcement. Large20 is a dummy variable indicating one of the 20 firms with the largest market capitalization in a given country. Firms with greater analyst following or larger size have a better firm-specific information environment and may have a different volume-return relationship. UE is unexpected earnings, defined as the change in net profit scaled by price. We include unexpected earnings because the market reaction to earnings announcements depends on earnings surprise (Francis et al., 2002). Loss is a dummy variable that equals one if the reported actual earnings are less than zero. Loss controls for larger market reactions in the case of a loss. Reportlag is the number of days from the fiscal year-end to the earnings announcement date. It controls for different market reactions because longer reporting lags provide greater opportunities for managers to provide guidance and for analysts to update forecasts.
To account for unmodeled heterogeneity across countries, industries, and time, we include country, industry, and year-fixed effects in our main tests. As a sensitivity check, we use firm-fixed effects instead of country- and industry-fixed effects. Additional control variables at the country level include gross domestic product (GDP) and capital market development (TotMktSize) to account for differences in economic development and financial market development across countries, and investor protection, corruption, and market liquidity, which we describe in detail in the next subsection. In the presence of time-invariant country-level controls, we suppress the country-fixed effects.
Country-Level Factors for Hypotheses Testing
We are primarily interested in three country-level institutional factors: investor protection, corruption, and market liquidity. We measure investor protection using the legal origin of the country (Common), antidirector rights (Antidirector), and self-dealing governance (Antiselfdealing). The law and finance literatures emphasize the role of legal origin in protecting investors. Common equals one if the legal origin of a country is English common law, and zero otherwise (La Porta et al., 1998). Antidirector is an index that measures how strongly the legal system favors minority shareholders against managers or dominant shareholders on major corporate decisions (La Porta et al., 1998). The index measures shareholder rights from the standpoint of shareholders exercising their power by voting for or against directors or managers. Antiselfdealing is an index of investor protection that measures control of self-dealing (Djankov et al., 2008). It is the average of ex ante private control of self-dealing and ex post private control of self-dealing.
Besides the legal system, government is critical for the enforcement of legal protection for investors. Corruption, an indicator of government corruption (La Porta et al., 1998), reflects the governance stance toward business. While investor protection and legal enforcement are important for investors to trade on information, markets also need to be sufficiently liquid to allow investors to trade. We measure country-level stock market liquidity (Liquidity) as the aggregate country-year stock market turnover (DeFond et al., 2007; Levine & Schmukler, 2007). Table 1 reports the values of Common, Antidirector, Corruption, Antiselfdealing, and Liquidity for each country. We provide detailed variable definitions in the appendix.
Summary Statistics by Country.
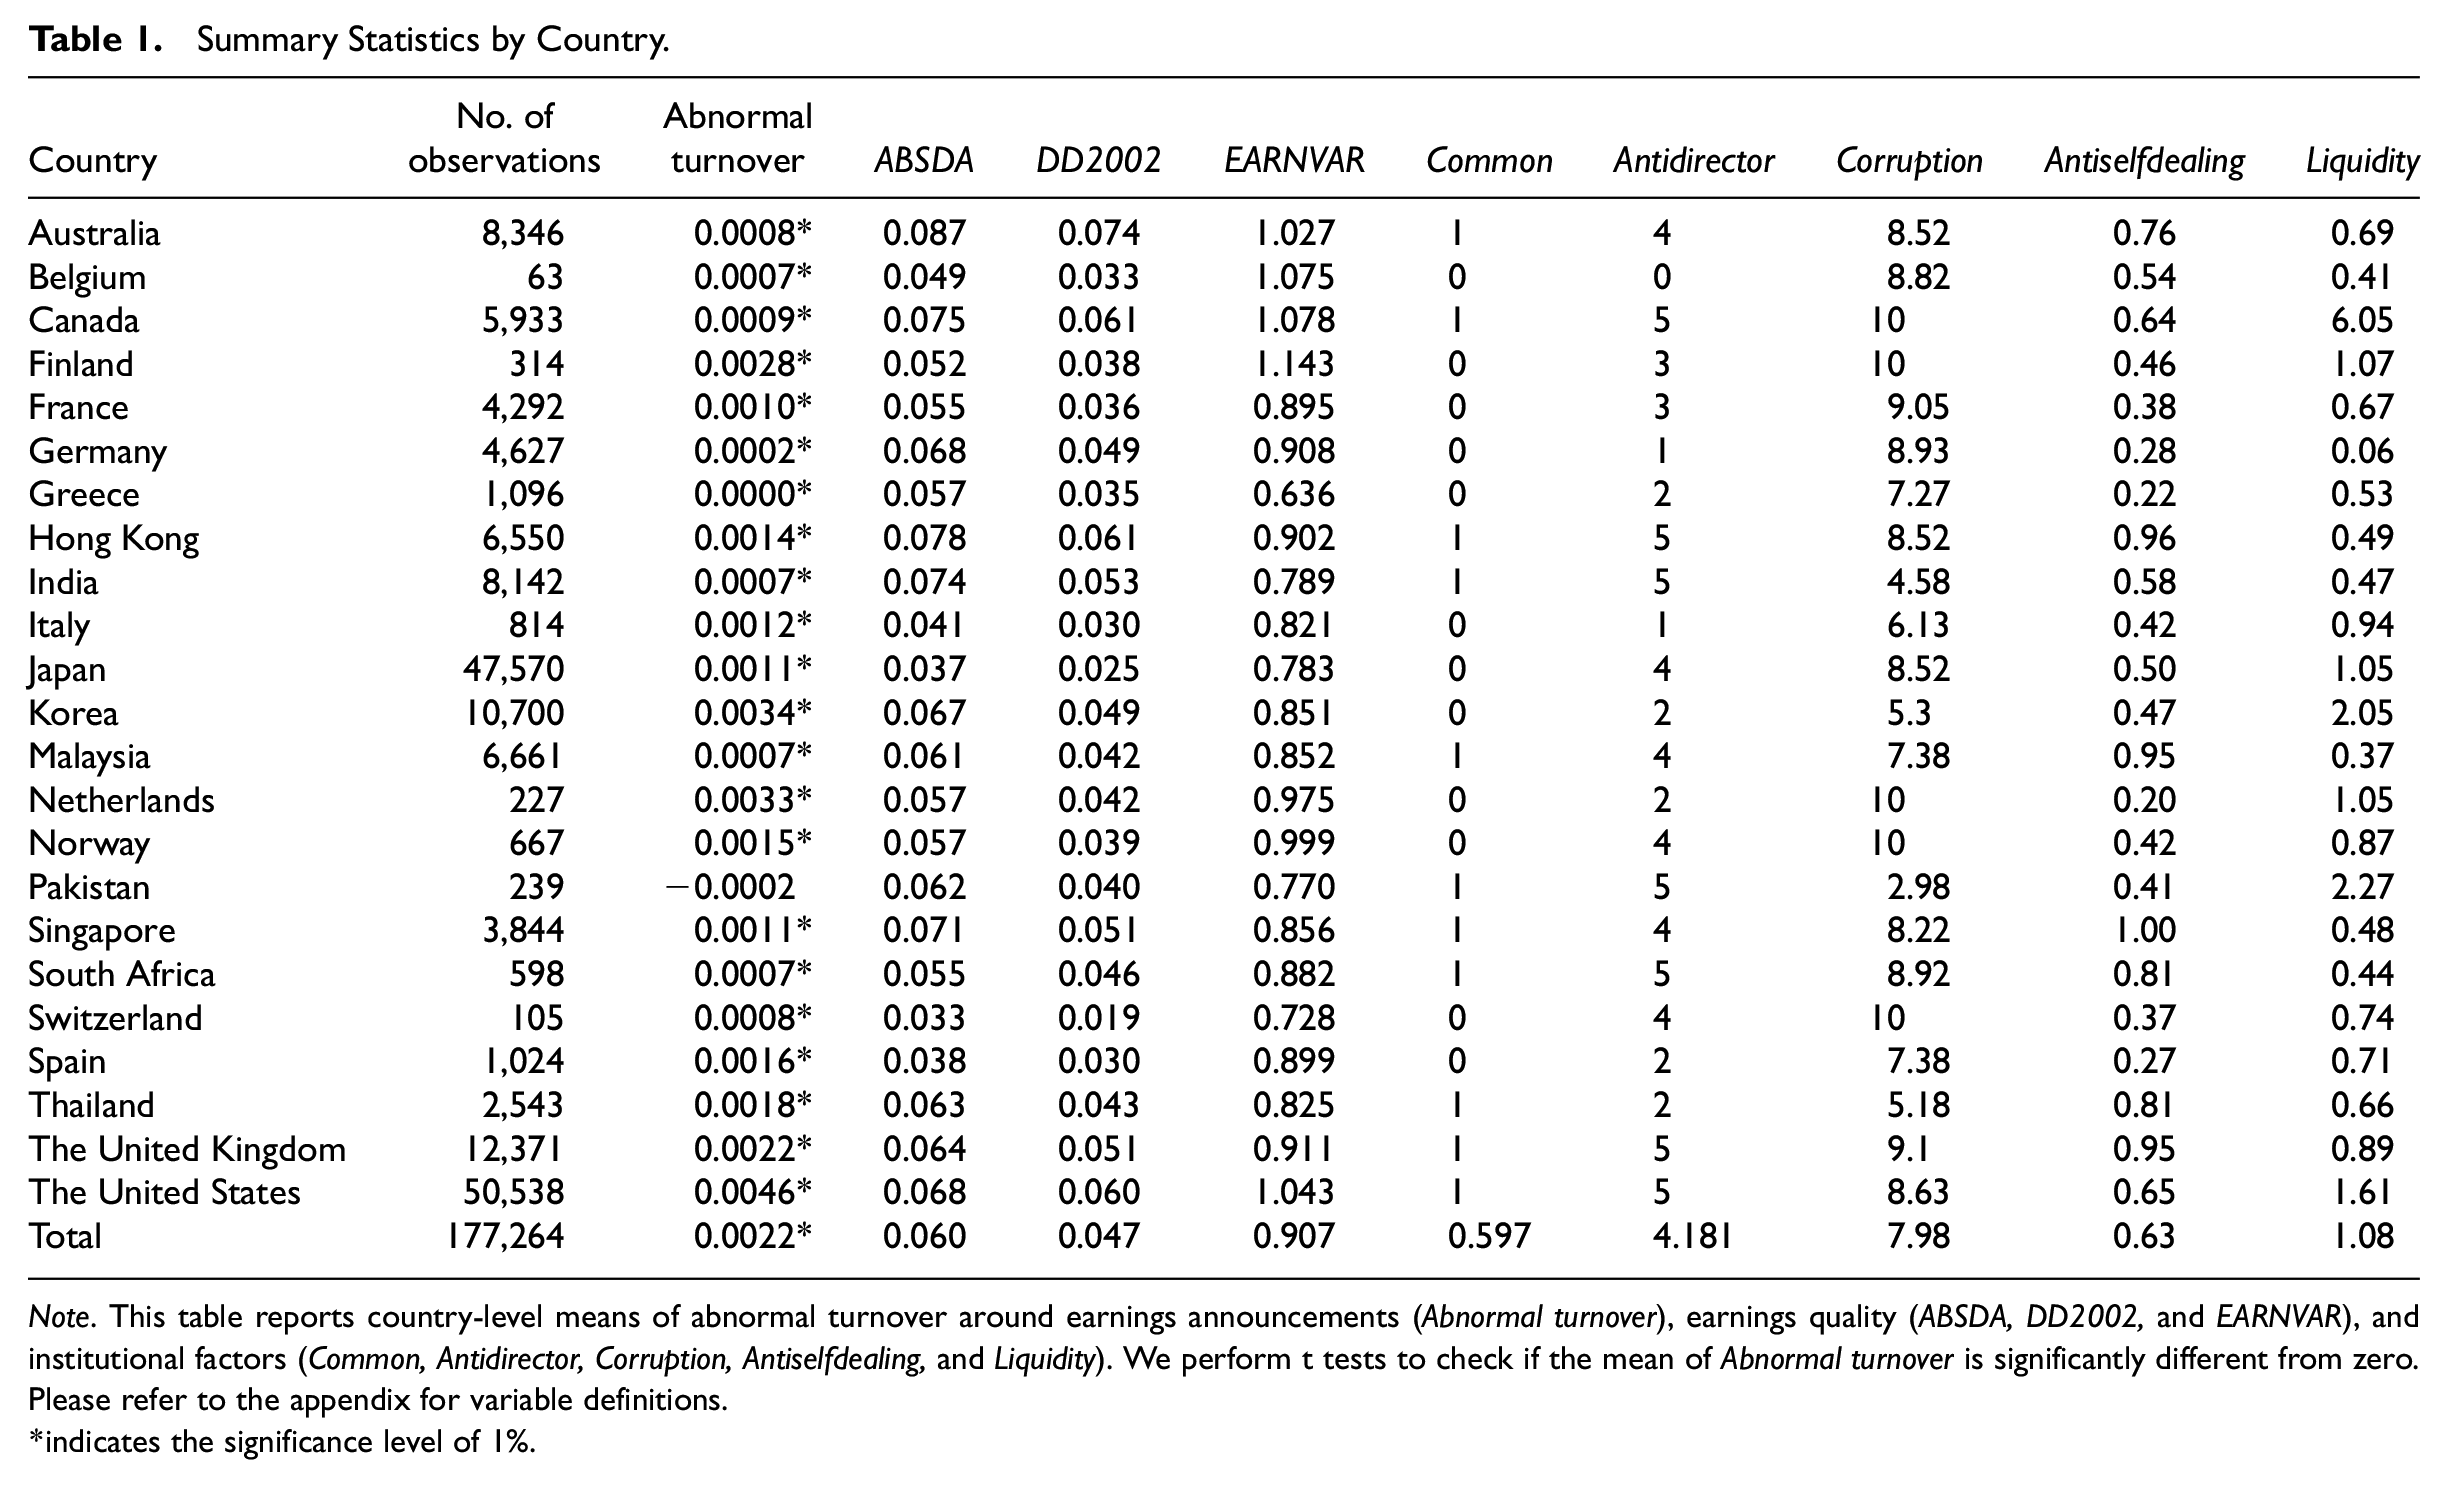
Note. This table reports country-level means of abnormal turnover around earnings announcements (Abnormal turnover), earnings quality (ABSDA, DD2002, and EARNVAR), and institutional factors (Common, Antidirector, Corruption, Antiselfdealing, and Liquidity). We perform t tests to check if the mean of Abnormal turnover is significantly different from zero. Please refer to the appendix for variable definitions.
indicates the significance level of 1%.
Summary Statistics
Table 1 presents the (mean) values of our key variables by country. We find significant variations in earnings quality across countries. The mean of ABSDA ranges from 0.033 to 0.087. The mean of DD2002 ranges from 0.019 to 0.074. The mean of EARNVAR ranges from 0.636 to 1.143. 11 About 60% of the countries in our sample have a common law system. Belgium, Germany, and Italy have the lowest Antidirector indexes, whereas Canada, Hong Kong, India, Pakistan, South Africa, the United Kingdom, and the United States have the highest Antidirector indexes (strong shareholder protection). As for law enforcement, Canada, Finland, the Netherlands, Norway, and Switzerland have the least corrupt governments. Countries that have the most corrupt governments include Pakistan, India, Thailand, and Korea. Antiselfdealing index ranges from 0.20 for the Netherlands to 1 for Singapore. Canada has the most liquid stock market, and Malaysia the least liquid stock market. Most markets have higher trading volume during the earnings announcement compared with the control period (i.e., positive at-period abnormal turnover), suggesting that earnings releases are generally informative in the international markets. The average increase in turnover is 0.22% over the announcement period across all countries.
Table 2 presents the Pearson correlations among the key variables. Most of the pair-wise correlation coefficients are statistically significant at the 1% level. Our three firm-level earnings quality measures are positively correlated with each other. They are also positively correlated with abnormal trading at announcement, suggesting more trading when earnings quality is lower. For example, the correlation between ABSDA and abnormal trading at announcement (At_ab_turn) is 0.018, significant at 1% level. As shown in Panel A, common law countries are associated with stronger investor protection, lower corruption, and higher market liquidity. Country-level variables (Common, Antidirector, Corruption, Antiselfdealing, and Liquidity) are also positively related to abnormal trading at announcement (At_ab_turn). The correlation between Common and At_ab_turn is 0.087, significant at the 1% level. The univariate results suggest that country-level institutions may play an important role in trading activities at earnings announcements. Panel B reports the correlation coefficients among the abnormal trading, earnings quality, and firm-level control variables used in the regression analysis. Most of the correlation coefficients are significant at the 1% level.
Correlation Matrix Among Main Variables.
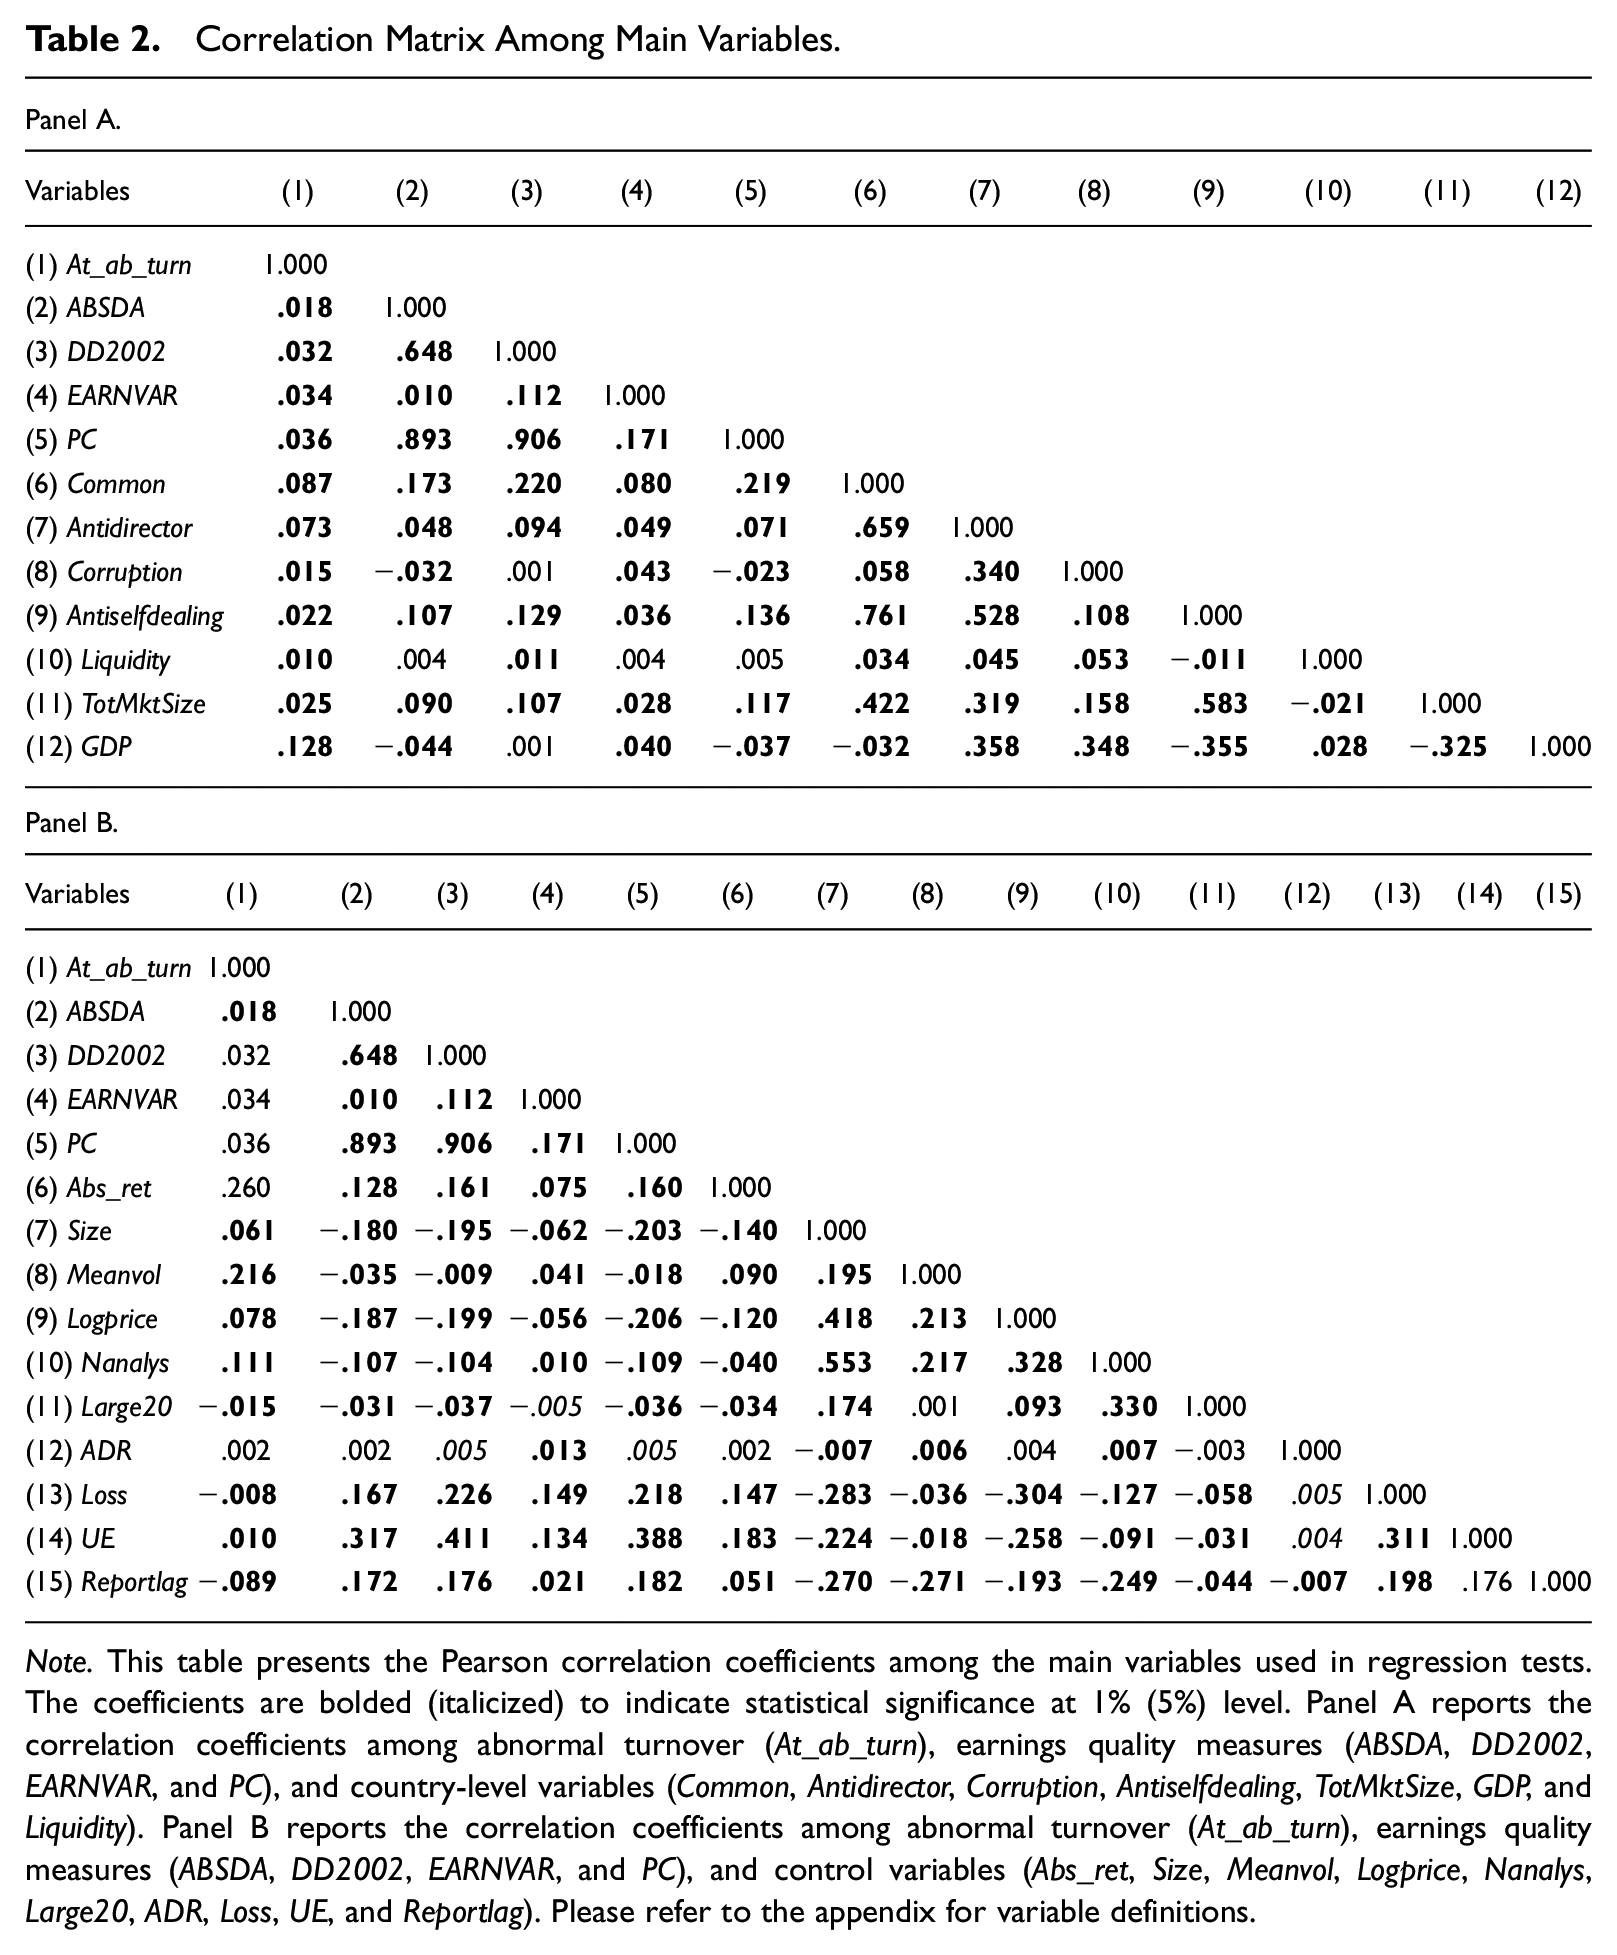
Note. This table presents the Pearson correlation coefficients among the main variables used in regression tests. The coefficients are bolded (italicized) to indicate statistical significance at 1% (5%) level. Panel A reports the correlation coefficients among abnormal turnover (At_ab_turn), earnings quality measures (ABSDA, DD2002, EARNVAR, and PC), and country-level variables (Common, Antidirector, Corruption, Antiselfdealing, TotMktSize, GDP, and Liquidity). Panel B reports the correlation coefficients among abnormal turnover (At_ab_turn), earnings quality measures (ABSDA, DD2002, EARNVAR, and PC), and control variables (Abs_ret, Size, Meanvol, Logprice, Nanalys, Large20, ADR, Loss, UE, and Reportlag). Please refer to the appendix for variable definitions.
Main Results
Earnings Quality and At-Announcement Trading
To test whether firm-level earnings quality increases or decreases trading volume around earnings announcement, we estimate the following model:

where EQ is ABSDA, DD2002, EARNVAR, or their first PC.
Equation 3 decomposes event-period trading volume into components with respect to price movement. In particular, the terms inside the bracket [β3+β4EQi, t ] are related to differential information precision before the earnings announcement. β4 captures trading volume related to earnings quality due to differential prior precision. If a decrease in earnings quality (i.e., an increase in EQ) reduces the incentive for information acquisition before earnings announcement, the associated decrease in information difference implies a negative β4. The effect of differential interpretations on trading volume is captured by the coefficient β2, the intercept β1, and country-, year-, and industry-fixed effects. A positive β2 will suggest that differential interpretations during earnings announcement decrease with earnings quality.
Table 3 presents the estimation results of Equation 3. We report standard errors in parentheses adjusted for firm and year clustering. In Columns 1 to 4, we report the estimation results of Equation 3 with country-fixed effects but without country-level control variables. In Column 1, we use ABSDA as the earnings quality measure. As expected, the coefficient of contemporaneous absolute returns (Abs_ret) is positive and significant, indicating significant investor belief revision upon receiving the earnings news. The coefficient of ABSDA is significantly positive, consistent with the prediction that differential interpretations during earning announcement decrease with earnings quality. The coefficient of the interaction term Abs_ret × ABSDA is negative, indicating that investors have less incentive to acquire information for earnings announcements with more discretionary accruals (i.e., lower earnings quality). The reduced differential information precision before the announcement therefore results in less belief revision associated with announcement price change and hence less trade. In Columns 2 and 3, we report the estimation results of Equation 3 for the other two earnings quality measures (i.e., DD2002 and EARNVAR) and observe a similar pattern as for ABSDA in Column 1. Using the first PC of ABSDA, DD2002, and EARNVAR in Column 4, we find that the coefficient on PC is significantly positive and the coefficient on the interaction term PC×Abs_ret is significantly negative.
Earnings Quality and Abnormal Trading Volume at Earnings Announcements.
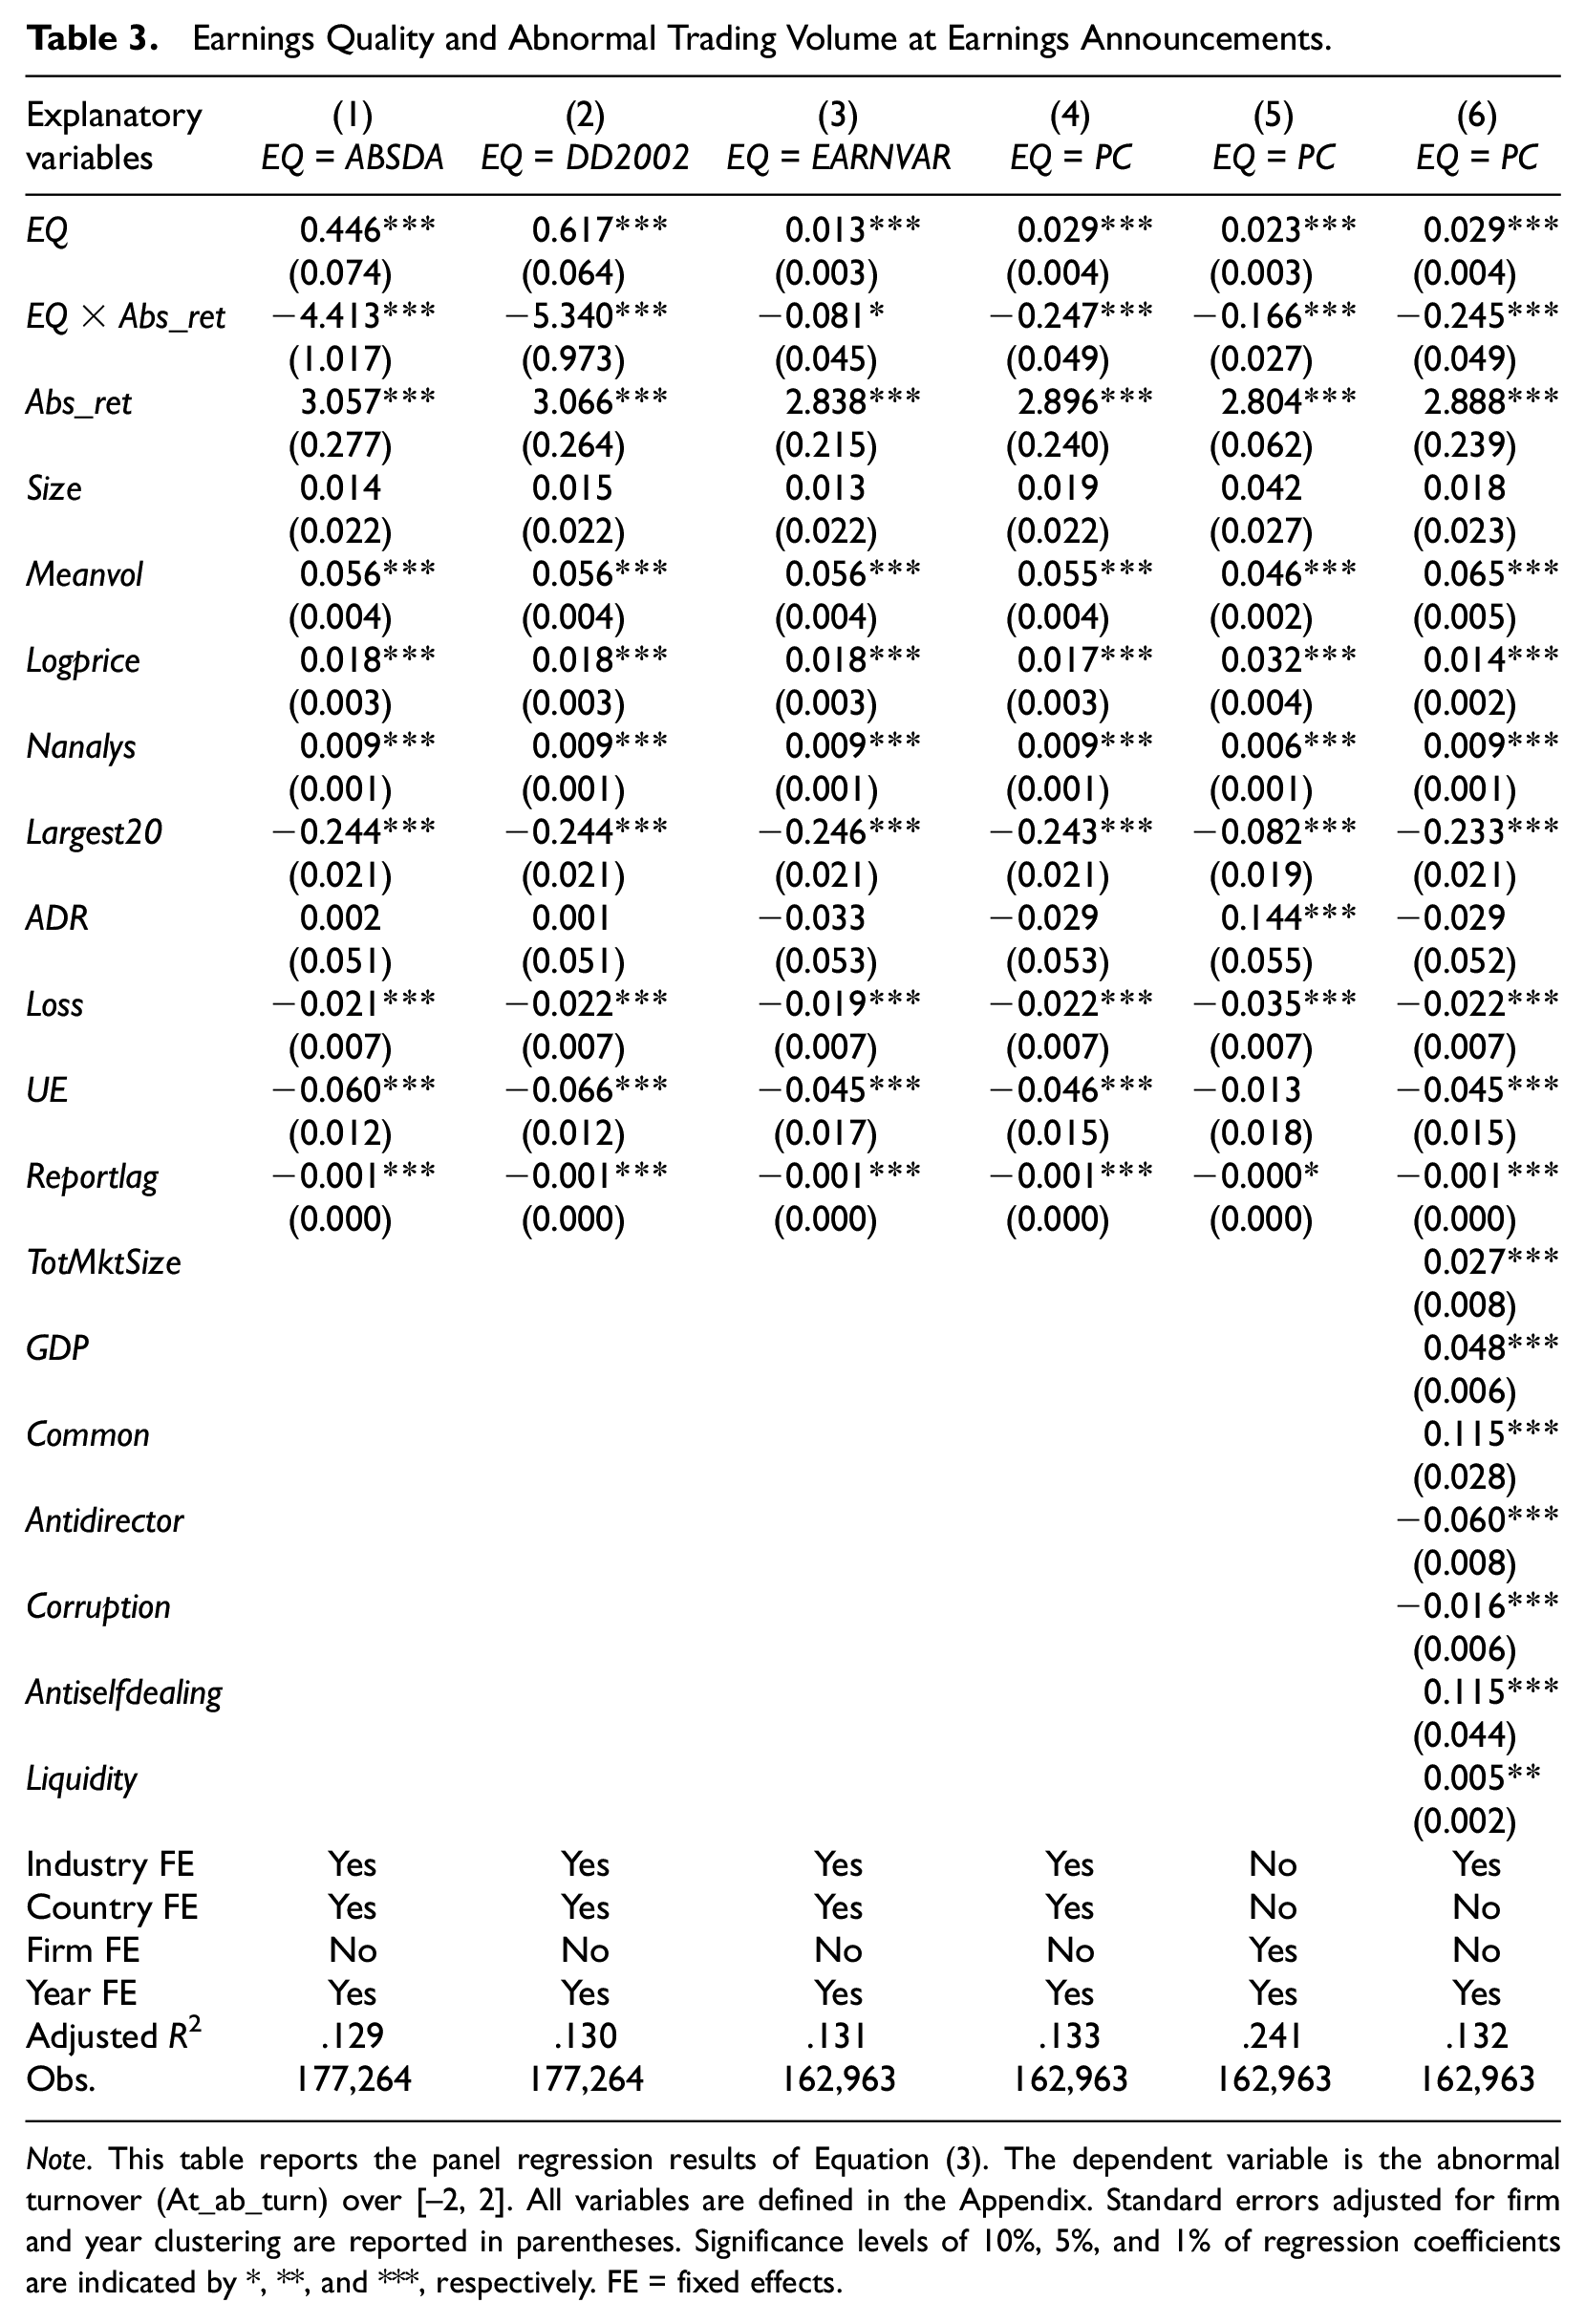
Note. This table reports the panel regression results of Equation (3). The dependent variable is the abnormal turnover (At_ab_turn) over [–2, 2]. All variables are defined in the Appendix. Standard errors adjusted for firm and year clustering are reported in parentheses. Significance levels of 10%, 5%, and 1% of regression coefficients are indicated by *, **, and ***, respectively. FE = fixed effects.
In Columns 5 and 6, we use PC as the measure of earnings quality and check the robustness of the regression results. In Column 5, we omit country- and industry-fixed effects and replace them with firm-fixed effects. Our results are robust to controlling for firm-fixed effects. In Column 6, we control for a number of country-level variables (TotMktSize, GDP, Common, Antidirector, Corruption, Antiselfdealing, and Liquidity) and omit country-fixed effects and find that the coefficients of PC and PC × Abs_ret remain statistically significant. In untabulated results, we estimate Equation 3 using only the U.S. sample and find similar results to Abdel-Meguid et al. (2019). Overall, the results in Table 3 are consistent with the prediction of a negative (positive) relation between earnings quality and differential interpretations around earnings announcements (differential prior precision).
Results of Hypotheses Testing
As we discussed in the hypothesis development, institutional factors could influence investors’ incentive to acquire and interpret the information before and at the earnings announcement when they anticipate low earnings quality. Because the primary focus of our study is on the cross-country differences in trading volume reaction to earnings announcements, we partition the sample according to different country-level measures and contrast the cross-group results along the following dimensions: investor protection (proxied by legal origin, antidirector rights, and antiselfdealing), corruption level (proxied by corruption index), and market liquidity (proxied by liquidity). We partition the sample according to the legal origin or the median value of various country-level factors and estimate regressions for each subsample. Table 4 reports the results using PC as the measure of earning quality.
Samples Partitioned Based on Country-Level Factors.
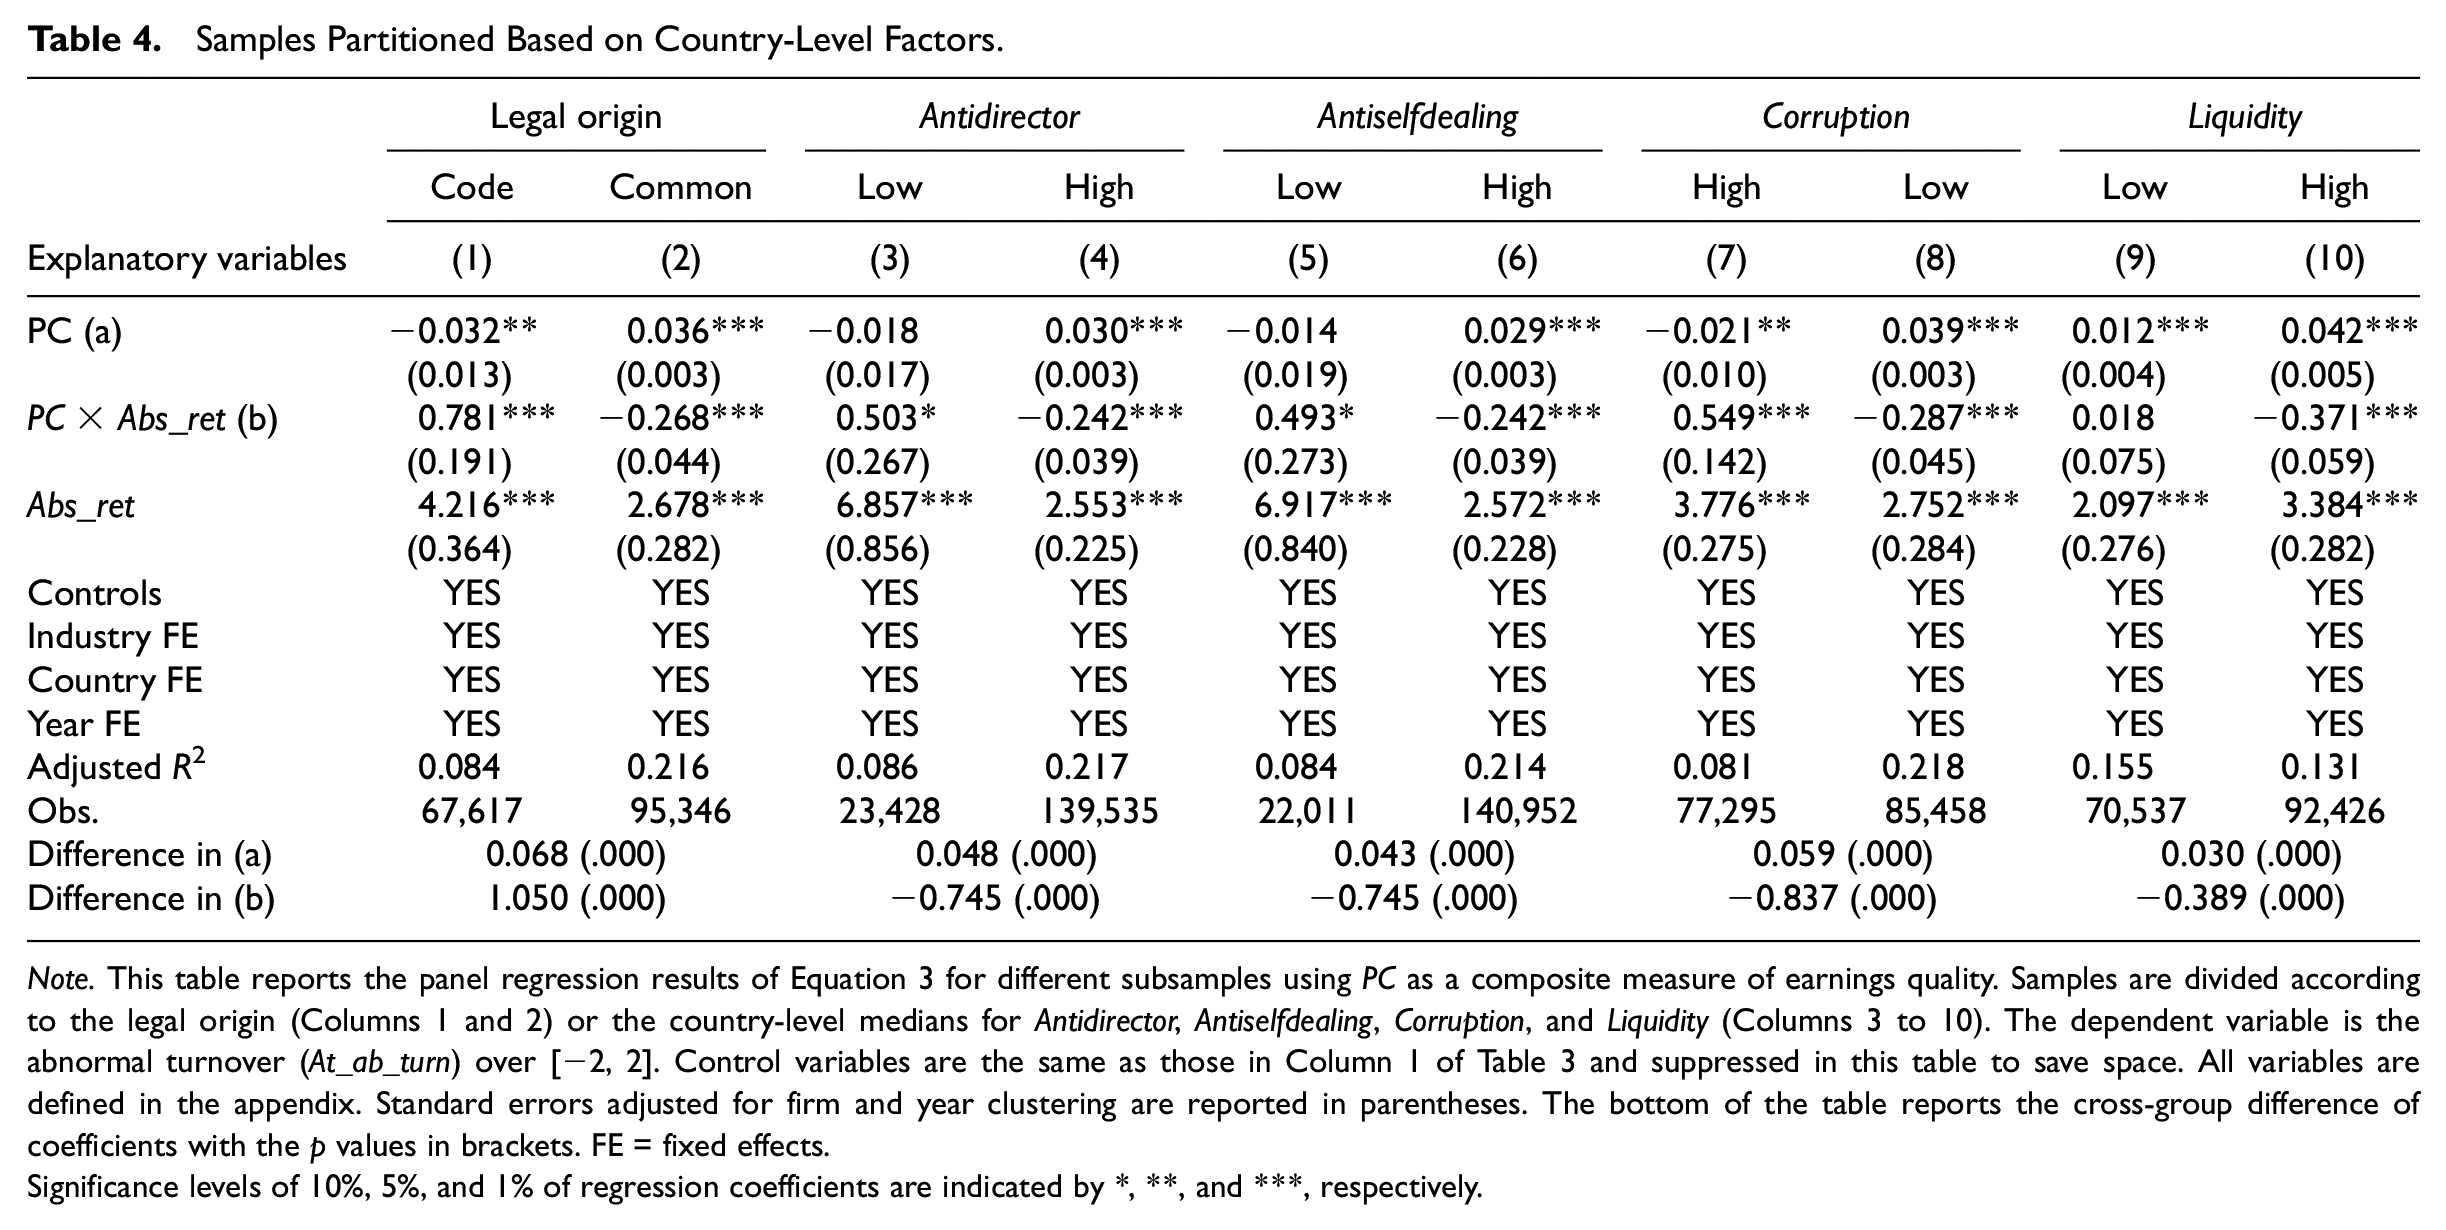
Note. This table reports the panel regression results of Equation 3 for different subsamples using PC as a composite measure of earnings quality. Samples are divided according to the legal origin (Columns 1 and 2) or the country-level medians for Antidirector, Antiselfdealing, Corruption, and Liquidity (Columns 3 to 10). The dependent variable is the abnormal turnover (At_ab_turn) over [−2, 2]. Control variables are the same as those in Column 1 of Table 3 and suppressed in this table to save space. All variables are defined in the appendix. Standard errors adjusted for firm and year clustering are reported in parentheses. The bottom of the table reports the cross-group difference of coefficients with the p values in brackets. FE = fixed effects.
Significance levels of 10%, 5%, and 1% of regression coefficients are indicated by *, **, and ***, respectively.
Regarding the investor protection dimension, Columns 1 and 2 of Table 4 show that for Common law countries PC has a significantly positive coefficient of 0.036 and PC × Abs_ret has a significantly negative coefficient of –0.268. In contrast, for Code law countries, the coefficients of PC and PC × Abs_ret are –0.032 and 0.781, respectively, both of which are statistically significant and are of the opposite sign to their counterparts in the Common law country sample. The differences in the coefficients for PC and PC × Abs_ret between Common law and Code law samples are statistically significant, as reported in the last two rows of Table 4. When we partition the sample by Antidirector or Antiselfdealing in Columns 3 to 6, we observe a positive (insignificantly negative) sign for PC and a negative (positive) sign for PC × Abs_ret for the high (low) investor protection group. These results suggest that investors in countries with stronger investor protection have more incentives for processing noisy earnings signals, leading to more differential interpretations at announcement. The greater incentives for information acquisition when anticipating a noisy earnings signal also reduce belief heterogeneity before announcement. Reported at the bottom of Table 4, the significant cross-group differences for the PC and PC × Abs_ret coefficients suggest different incentives for information processing by investors in countries with high and low investor protection.
Columns 7 to 8 report the results when we partition the sample by country-level corruption (Corruption). The results are qualitatively similar to those for the investor protection partitions. Moreover, the cross-group differences for PC and PC × Abs_ret are statistically significant. When we partition the sample by stock market liquidity, the high liquidity group (Column 10) has a positive (negative) coefficient for PC (PC × Abs_ret). Although PC also has a positive coefficient in the low liquidity group (Column 9), it is significantly smaller than that in the high liquidity group as indicated by the p value at the bottom of the table. Overall, we find results consistent with our hypotheses regarding investors’ information acquisition incentive conditional on country-level factors.
Some discussion on the coefficients of the control variables is in order. For the group with strong country-level institutions (Columns 2, 4, 6, and 8), Size and Logprice have positive coefficients. However, for samples with weak country-level institutions (Columns 1, 3, 5, and 7), the coefficients of Size and Logprice are negative. On firm size and relative informativeness of earnings, Ball and Shivakumar (2008, p. 997) argue that “one might expect information production to be a convex function of size and the relative informativeness of earnings to be a concave function of size.” Because abnormal volume reaction is a form of relative informativeness, the suggested concave relationship between abnormal volume and size implies that the Size coefficient can be positive, negative, or not different from zero, depending on the curvature of the segment on which we have observations. Using a similar logic, the coefficient of Logprice can be indeterminate because it is highly correlated with Size (correlation coefficient = .418) as shown in Table 2. Alternatively, low price stocks can be very costly to trade in normal periods so that prices only move in response to earnings announcements when the news content is sufficiently large to make trading cost beneficial, resulting in high event-period abnormal volume.
The Impact of Institutional Ownership
Institutional investors are usually perceived as informed traders because they are sophisticated and have better access to information and powerful analytical tools. In the presence of a noisy earnings signal, they should have more incentive to acquire information before the announcement and process announced earnings information because there is more room to profit when the information is noisy. However, such an incentive can be attenuated if institutional investors are in countries with poor institutions where the cost of price discovery may outweigh the benefit. To test whether institutional investors play a role in explaining the relation among country-level institutions, earnings quality, and trading volume around earnings announcement, we estimate the following augmented model:
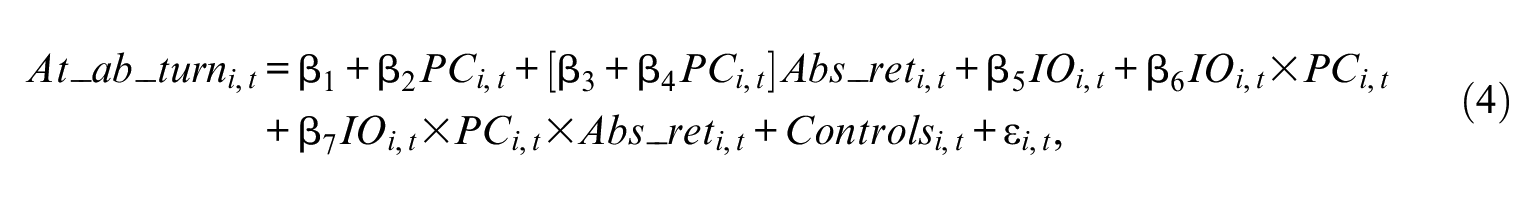
where IOi,t is the percentage of institutional holding obtained from Factset.
Table 5 reports the results of estimating Equation 4 for different subsamples. IO has significantly positive coefficients across all columns, meaning that institutional investors utilize and trade on earnings news around earnings announcements. The interaction between PC and IO captures how institutional investors process the earnings-related information in the earnings announcement period, conditional on earnings quality. When interacting with PC, IO has significantly positive coefficients in the high Antidirector, Antiselfdealing, and Liquidity groups (Columns 4, 6 and 10, respectively), and positive but insignificant coefficients in Common and low Corruption groups (Columns 2 and 8, respectively). The coefficients for these groups are significantly larger than the coefficients for their respective low groups as shown at the bottom of Table 5. The results for IO × PC support our conjecture that institutional investors prefer to use their information processing skills to interpret noisy earnings signals only when country-level institutions are strong.
Volume Reaction to Earnings Announcements of Institutional Investors.
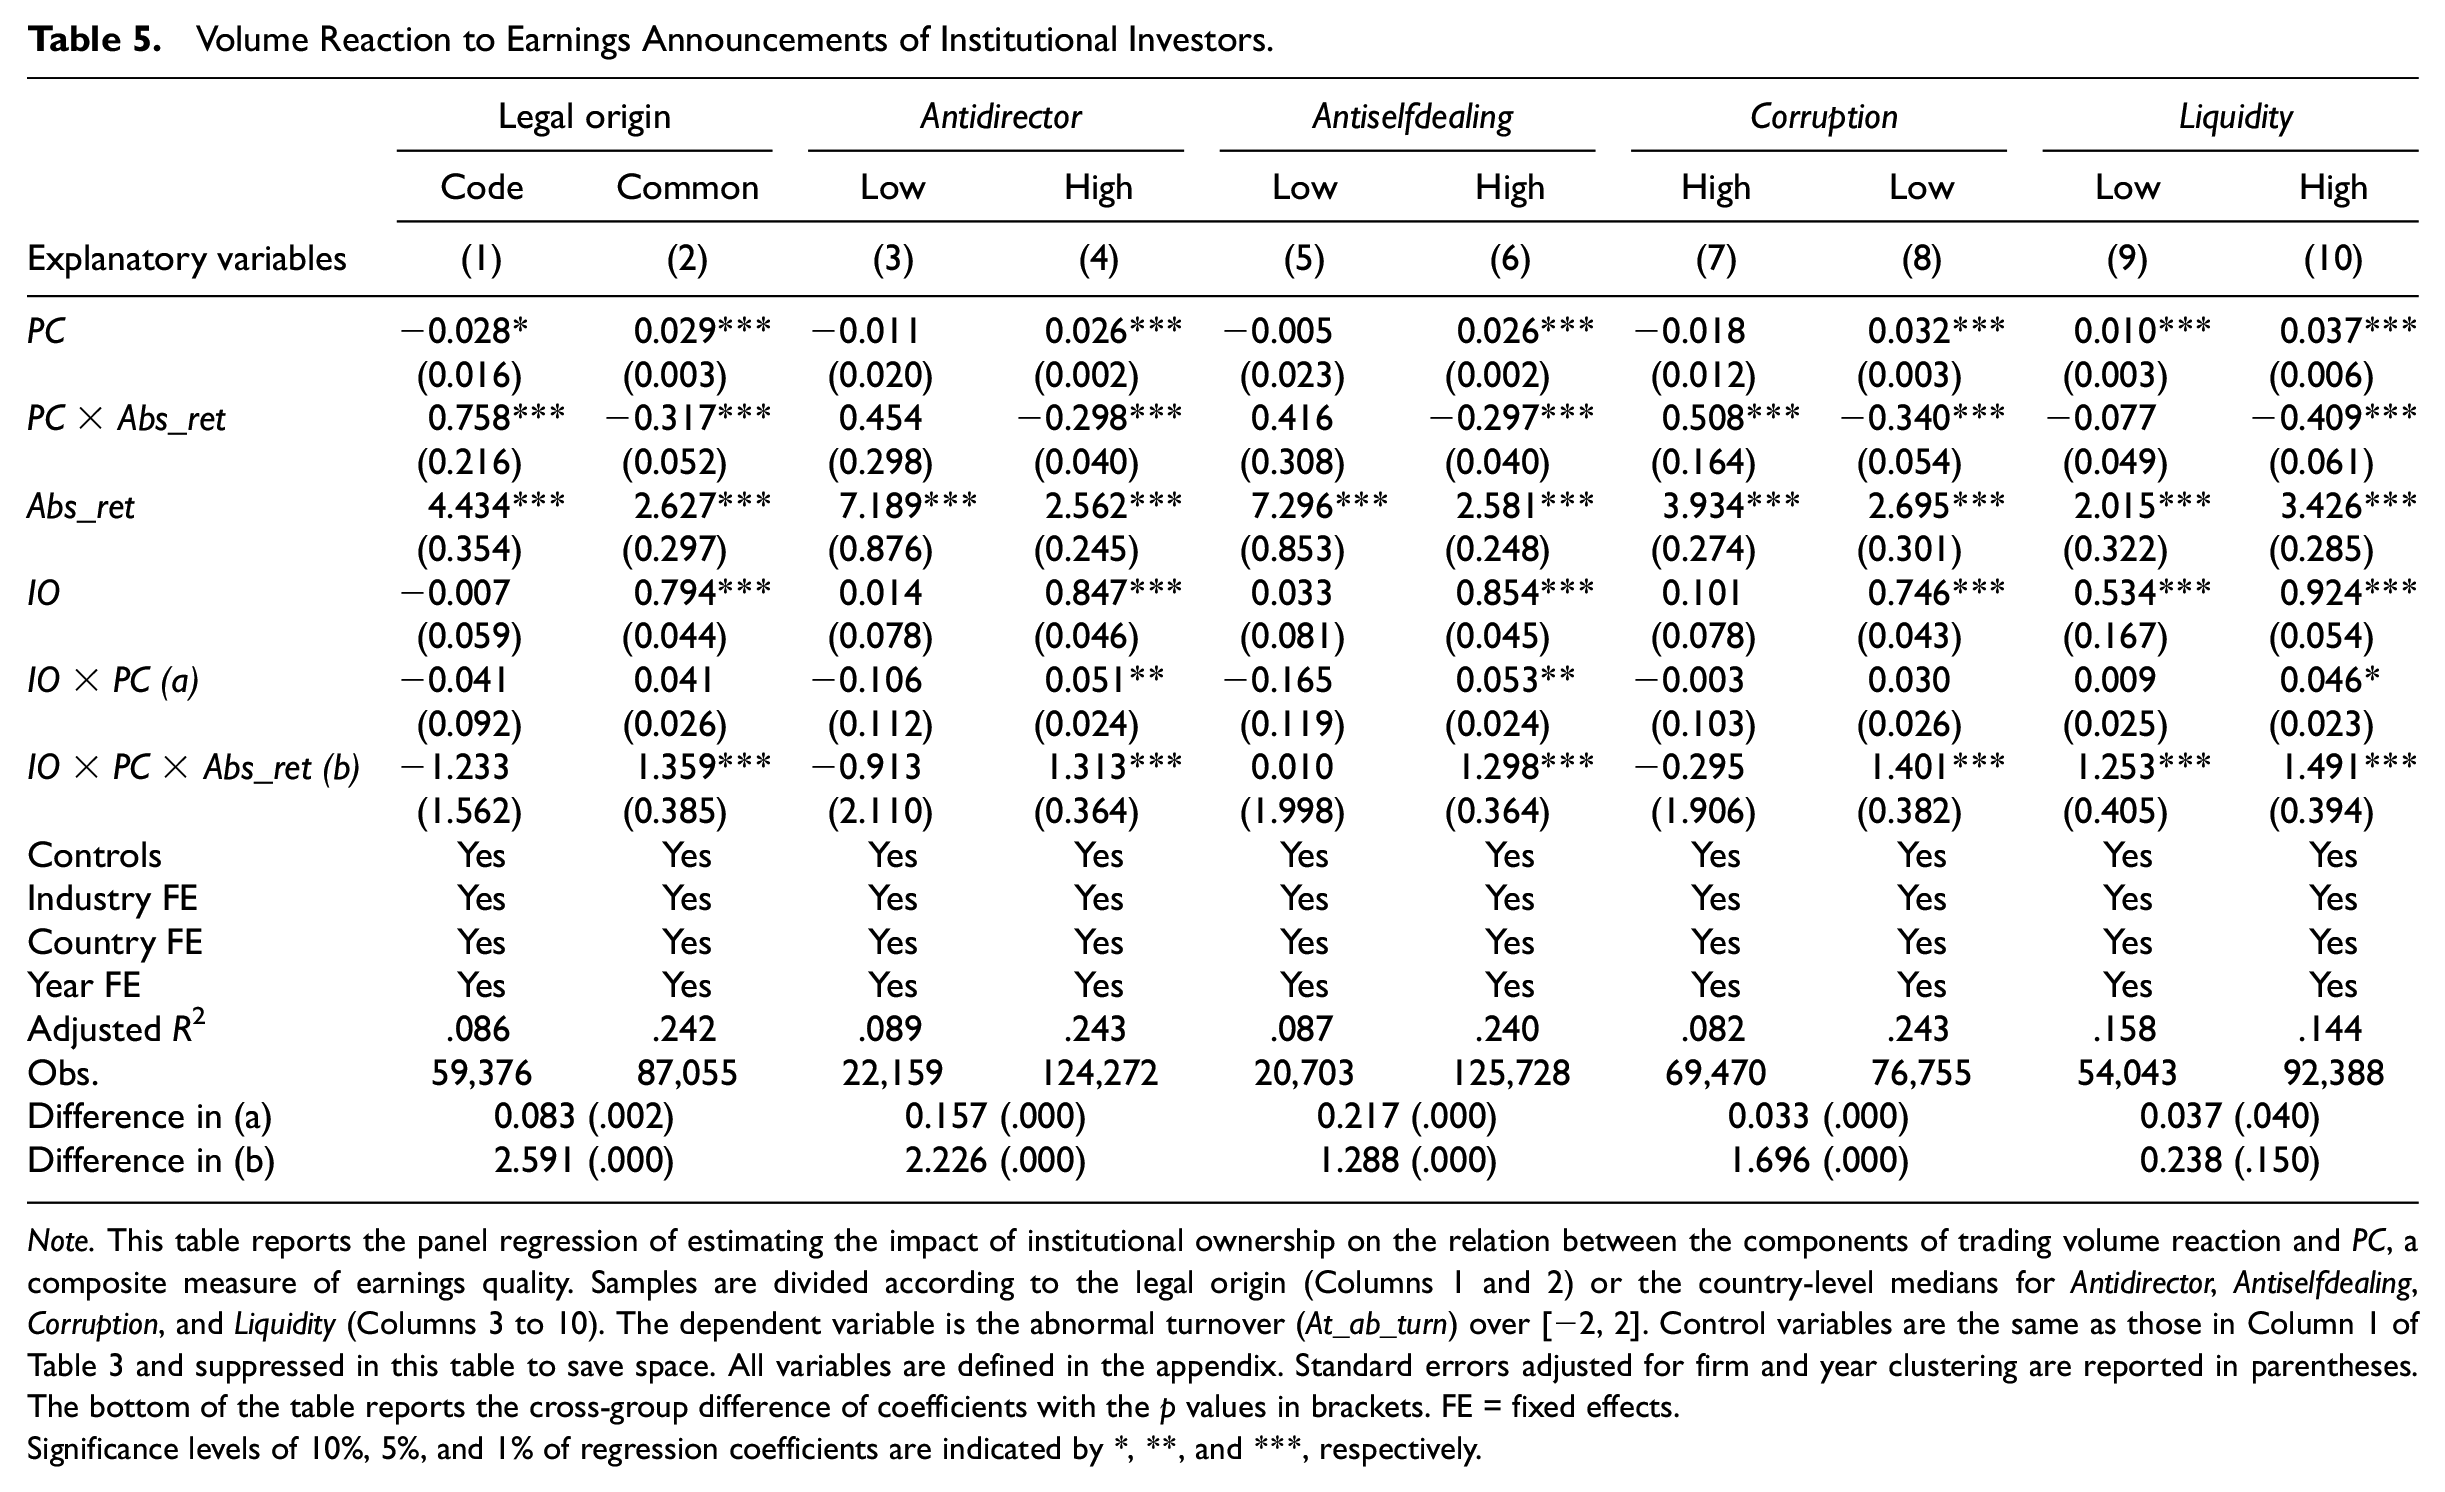
Note. This table reports the panel regression of estimating the impact of institutional ownership on the relation between the components of trading volume reaction and PC, a composite measure of earnings quality. Samples are divided according to the legal origin (Columns 1 and 2) or the country-level medians for Antidirector, Antiselfdealing, Corruption, and Liquidity (Columns 3 to 10). The dependent variable is the abnormal turnover (At_ab_turn) over [−2, 2]. Control variables are the same as those in Column 1 of Table 3 and suppressed in this table to save space. All variables are defined in the appendix. Standard errors adjusted for firm and year clustering are reported in parentheses. The bottom of the table reports the cross-group difference of coefficients with the p values in brackets. FE = fixed effects.
Significance levels of 10%, 5%, and 1% of regression coefficients are indicated by *, **, and ***, respectively.
The interaction term IO × PC × Abs_ret captures the impact of institutional investors on differential prior beliefs. When interacting with PC × Abs_ret, IO has significantly positive coefficients in the Common, high Antidirector, high Antiselfdealing, low Corruption, and high Liquidity groups (Columns 2, 4, 6, 8, and 10, respectively). That is, the coefficients of the interaction term IO × PC × Abs_ret are all significantly positive for subsamples with stronger country-level institutions. Although the coefficient of IO × PC × Abs_ret is also significantly positive for the low Liquidity group, it is smaller than, albeit insignificantly different from, that for the high Liquidity group. The results suggest that, in countries with stronger institutions, the heightened information acquisition activities of institutional investors in anticipation of poor earnings signals increase the differential information precision among investors. It should be noted that the results are insignificant for countries with weaker institutions, further supporting our argument of low information acquisition incentive in these countries.
Robustness Tests
We perform a battery of robustness tests to check whether our results are sensitive to alternative specifications. First, as discussed in the survey paper by Bamber et al. (2011), it is not clear what is the best event window to capture the volume effect. To check the sensitivity of our results to the choice of event window, we measure abnormal trading volume using an alternative event window [–1, 1]. Untabulated results based on this alternative event window are similar to those reported in Table 3.
Second, we use a different approach to measure the trading volume related to differential prior beliefs and trading volume related to differential interpretations of the earnings signal. Equation 3 is derived based on O. Kim and Verrecchia’s (1997) suggestion that trading volume can be decomposed into two components: one that is related to price changes and the other that is independent of price changes. However, Equation 3 does not exactly correspond with the model developed by O. Kim and Verrecchia (1997) because several inputs in their theoretical model are not tractable or observable in archival data. 12 To investigate whether our results still hold under a more general decomposition of volume, we follow Garfinkel and Sokobin (2006) and estimate the expected volume-return relationship using the control period sample. 13 The model is as follows:
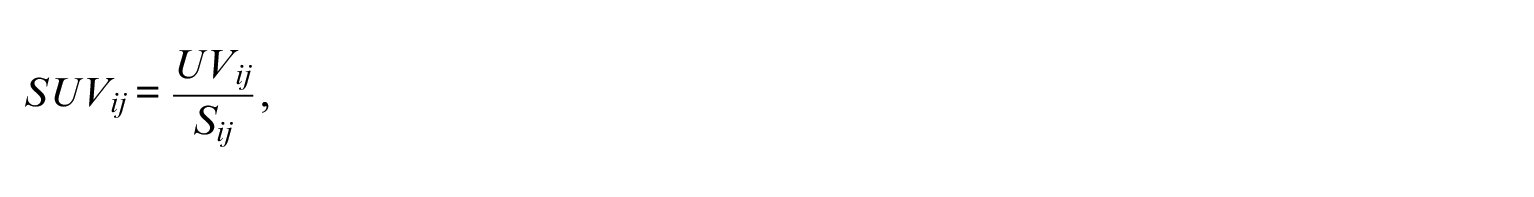


where SUV is standardized unexpected volume, and V and R are trading volume and stock return at the earnings announcement, respectively. Sij is the standard deviation of the residuals from the estimation regression for
Standardized expected volume (SEV) is calculated as follows:
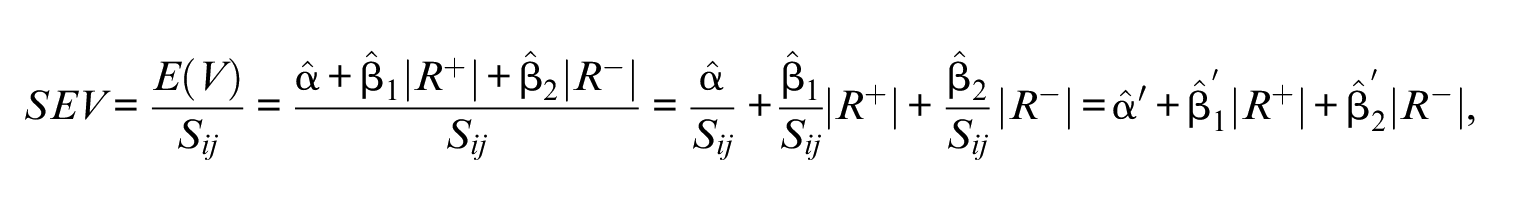
where
To test whether earnings quality affects SUV and SEV differently, we estimate the following regression:

where PCi,t is the first PC of ABSDA, DD2002, and EARNVAR. Abs_reti,t is the associated absolute return during the announcement period. Country-, year-, and industry-fixed effects are included, and standard errors are clustered by firm and year. We expect that a negative relation between earnings quality and trading volume unrelated to returns—SUV (i.e., positive β2) and a positive relation between earnings quality and trading volume related to returns—SEV (i.e., negative β2). Table 6 reports the regression estimates for Equation 5. Overall, the results are consistent with those in Table 3. The coefficient on PC is –0.007 (0.016) and is significant at the 1% level when SEV (SUV) is the dependent variable.
An Alternative Approach to Decomposing Volume Reaction.
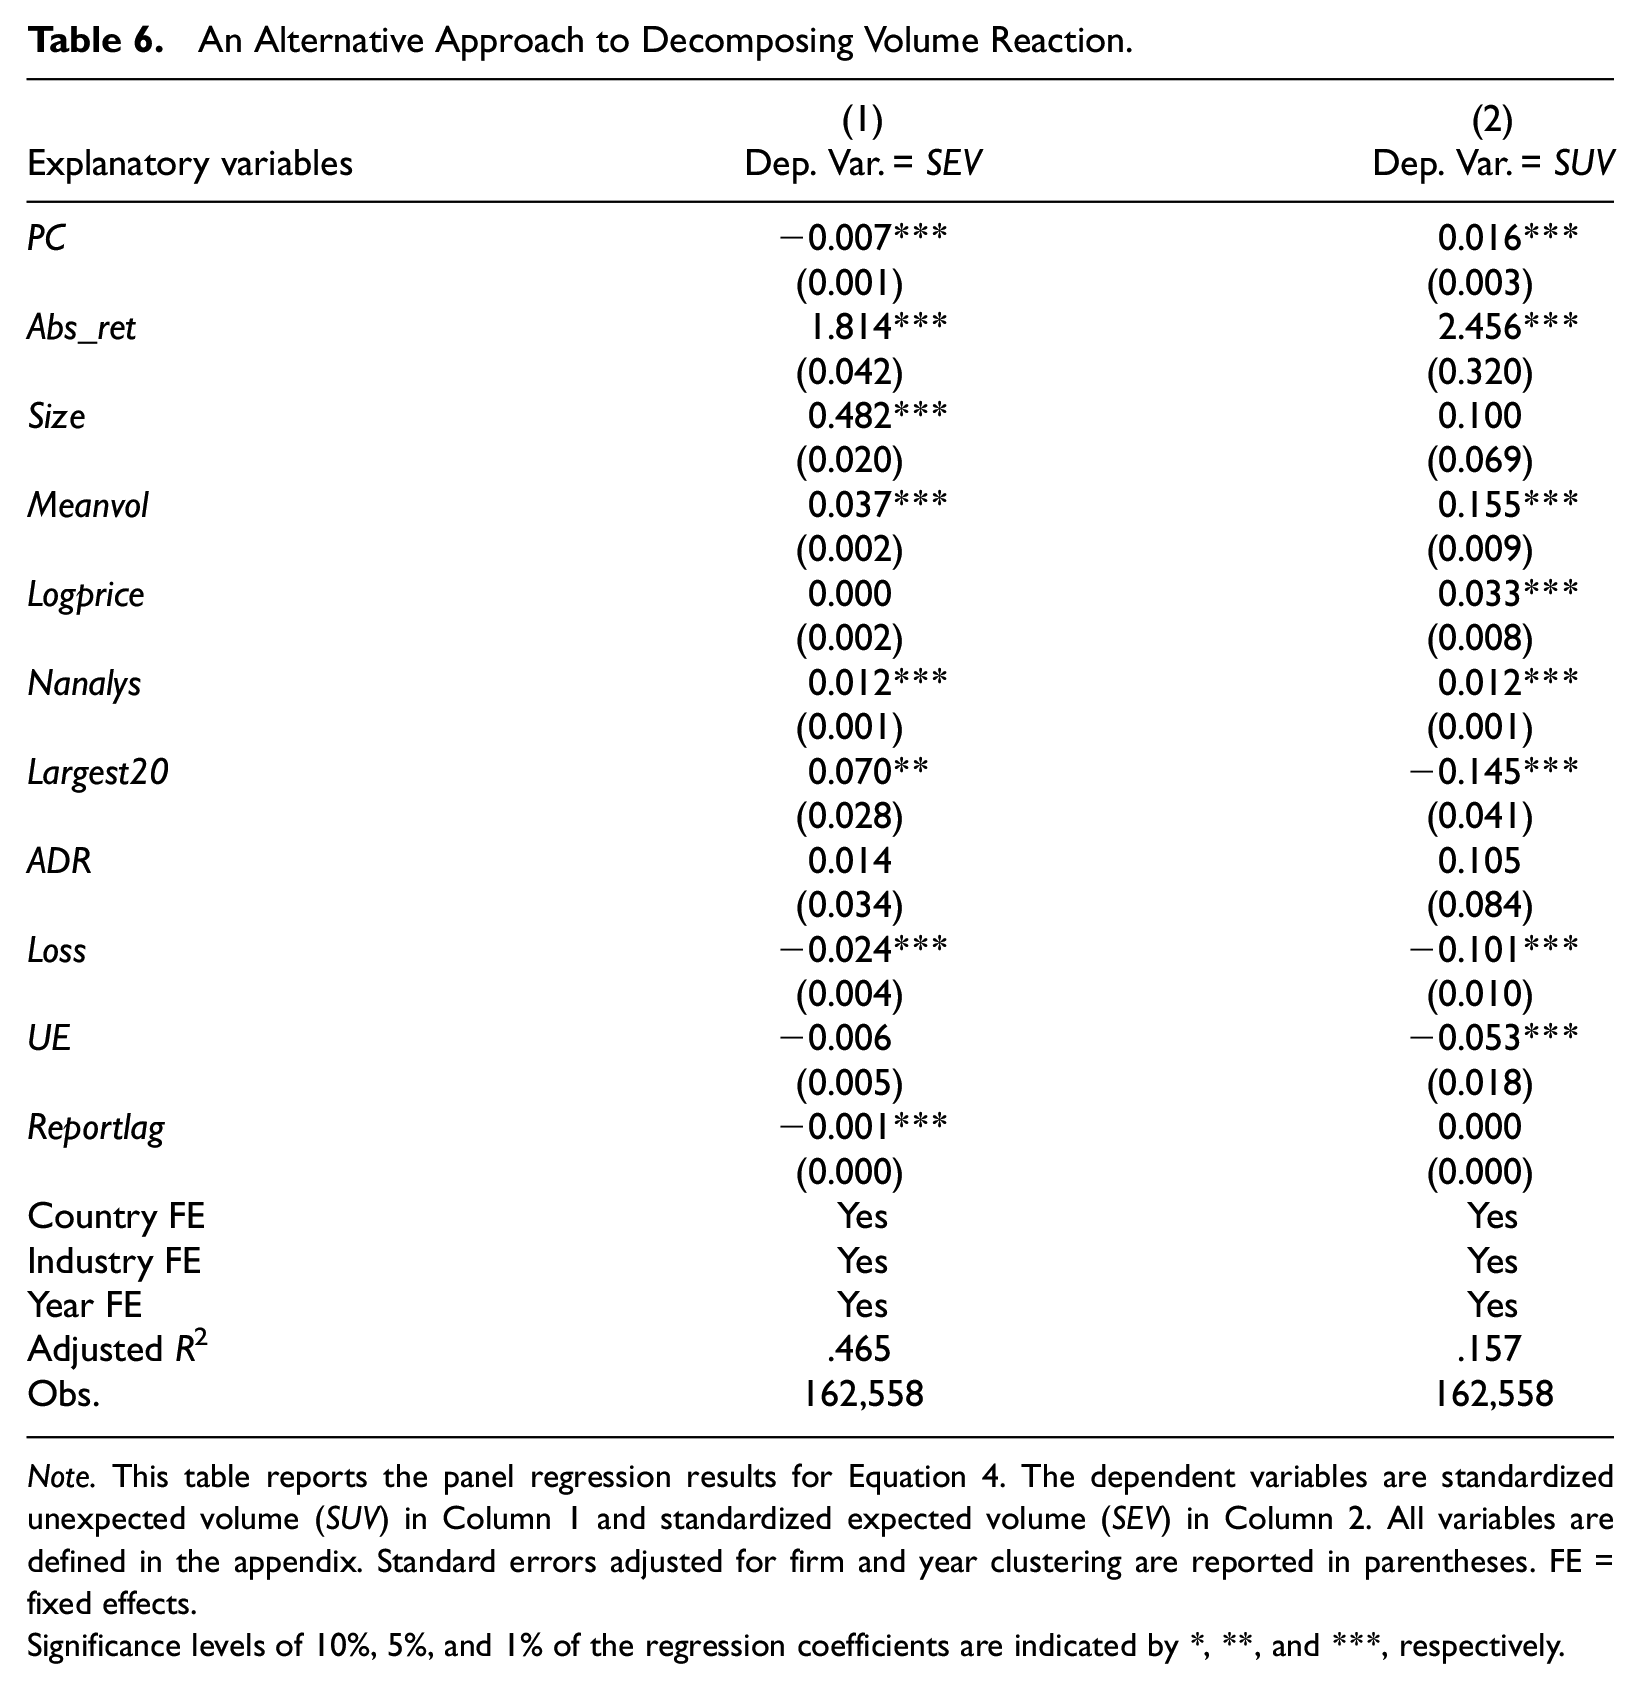
Note. This table reports the panel regression results for Equation 4. The dependent variables are standardized unexpected volume (SUV) in Column 1 and standardized expected volume (SEV) in Column 2. All variables are defined in the appendix. Standard errors adjusted for firm and year clustering are reported in parentheses. FE = fixed effects.
Significance levels of 10%, 5%, and 1% of the regression coefficients are indicated by *, **, and ***, respectively.
To retest our hypotheses using SUV and SEV, we separately estimate Equation 5 conditional on country-level institutional factors. Table 7 reports the results of estimating Equation 5 for subsamples with Common law and Code law, high and low country-level measures of Antidirector, Antiselfdealing, Corruption, and Liquidity. When we use SEV as the dependent variable (Panel A), the coefficient on PC is significantly negative only in countries with Common law, high Antidirector index, high Antiselfdealing index, low Corruption, and high market Liquidity (i.e., in the even-numbered columns). When we use SUV as the dependent variable (Panel B), the coefficient on PC is more positive in countries with strong institutions (i.e., in the even-numbered columns) than in countries with weak institutions (i.e., in the odd-numbered columns). The cross-group differences are significant in almost all cases as shown at the bottom of each panel. Overall, the results are robust to using Garfinkel and Sokobin’s (2006) decomposition approach.
An Alternative Approach to Decomposing Volume Reaction: Samples Partitioned Based on Country-Level Factors.
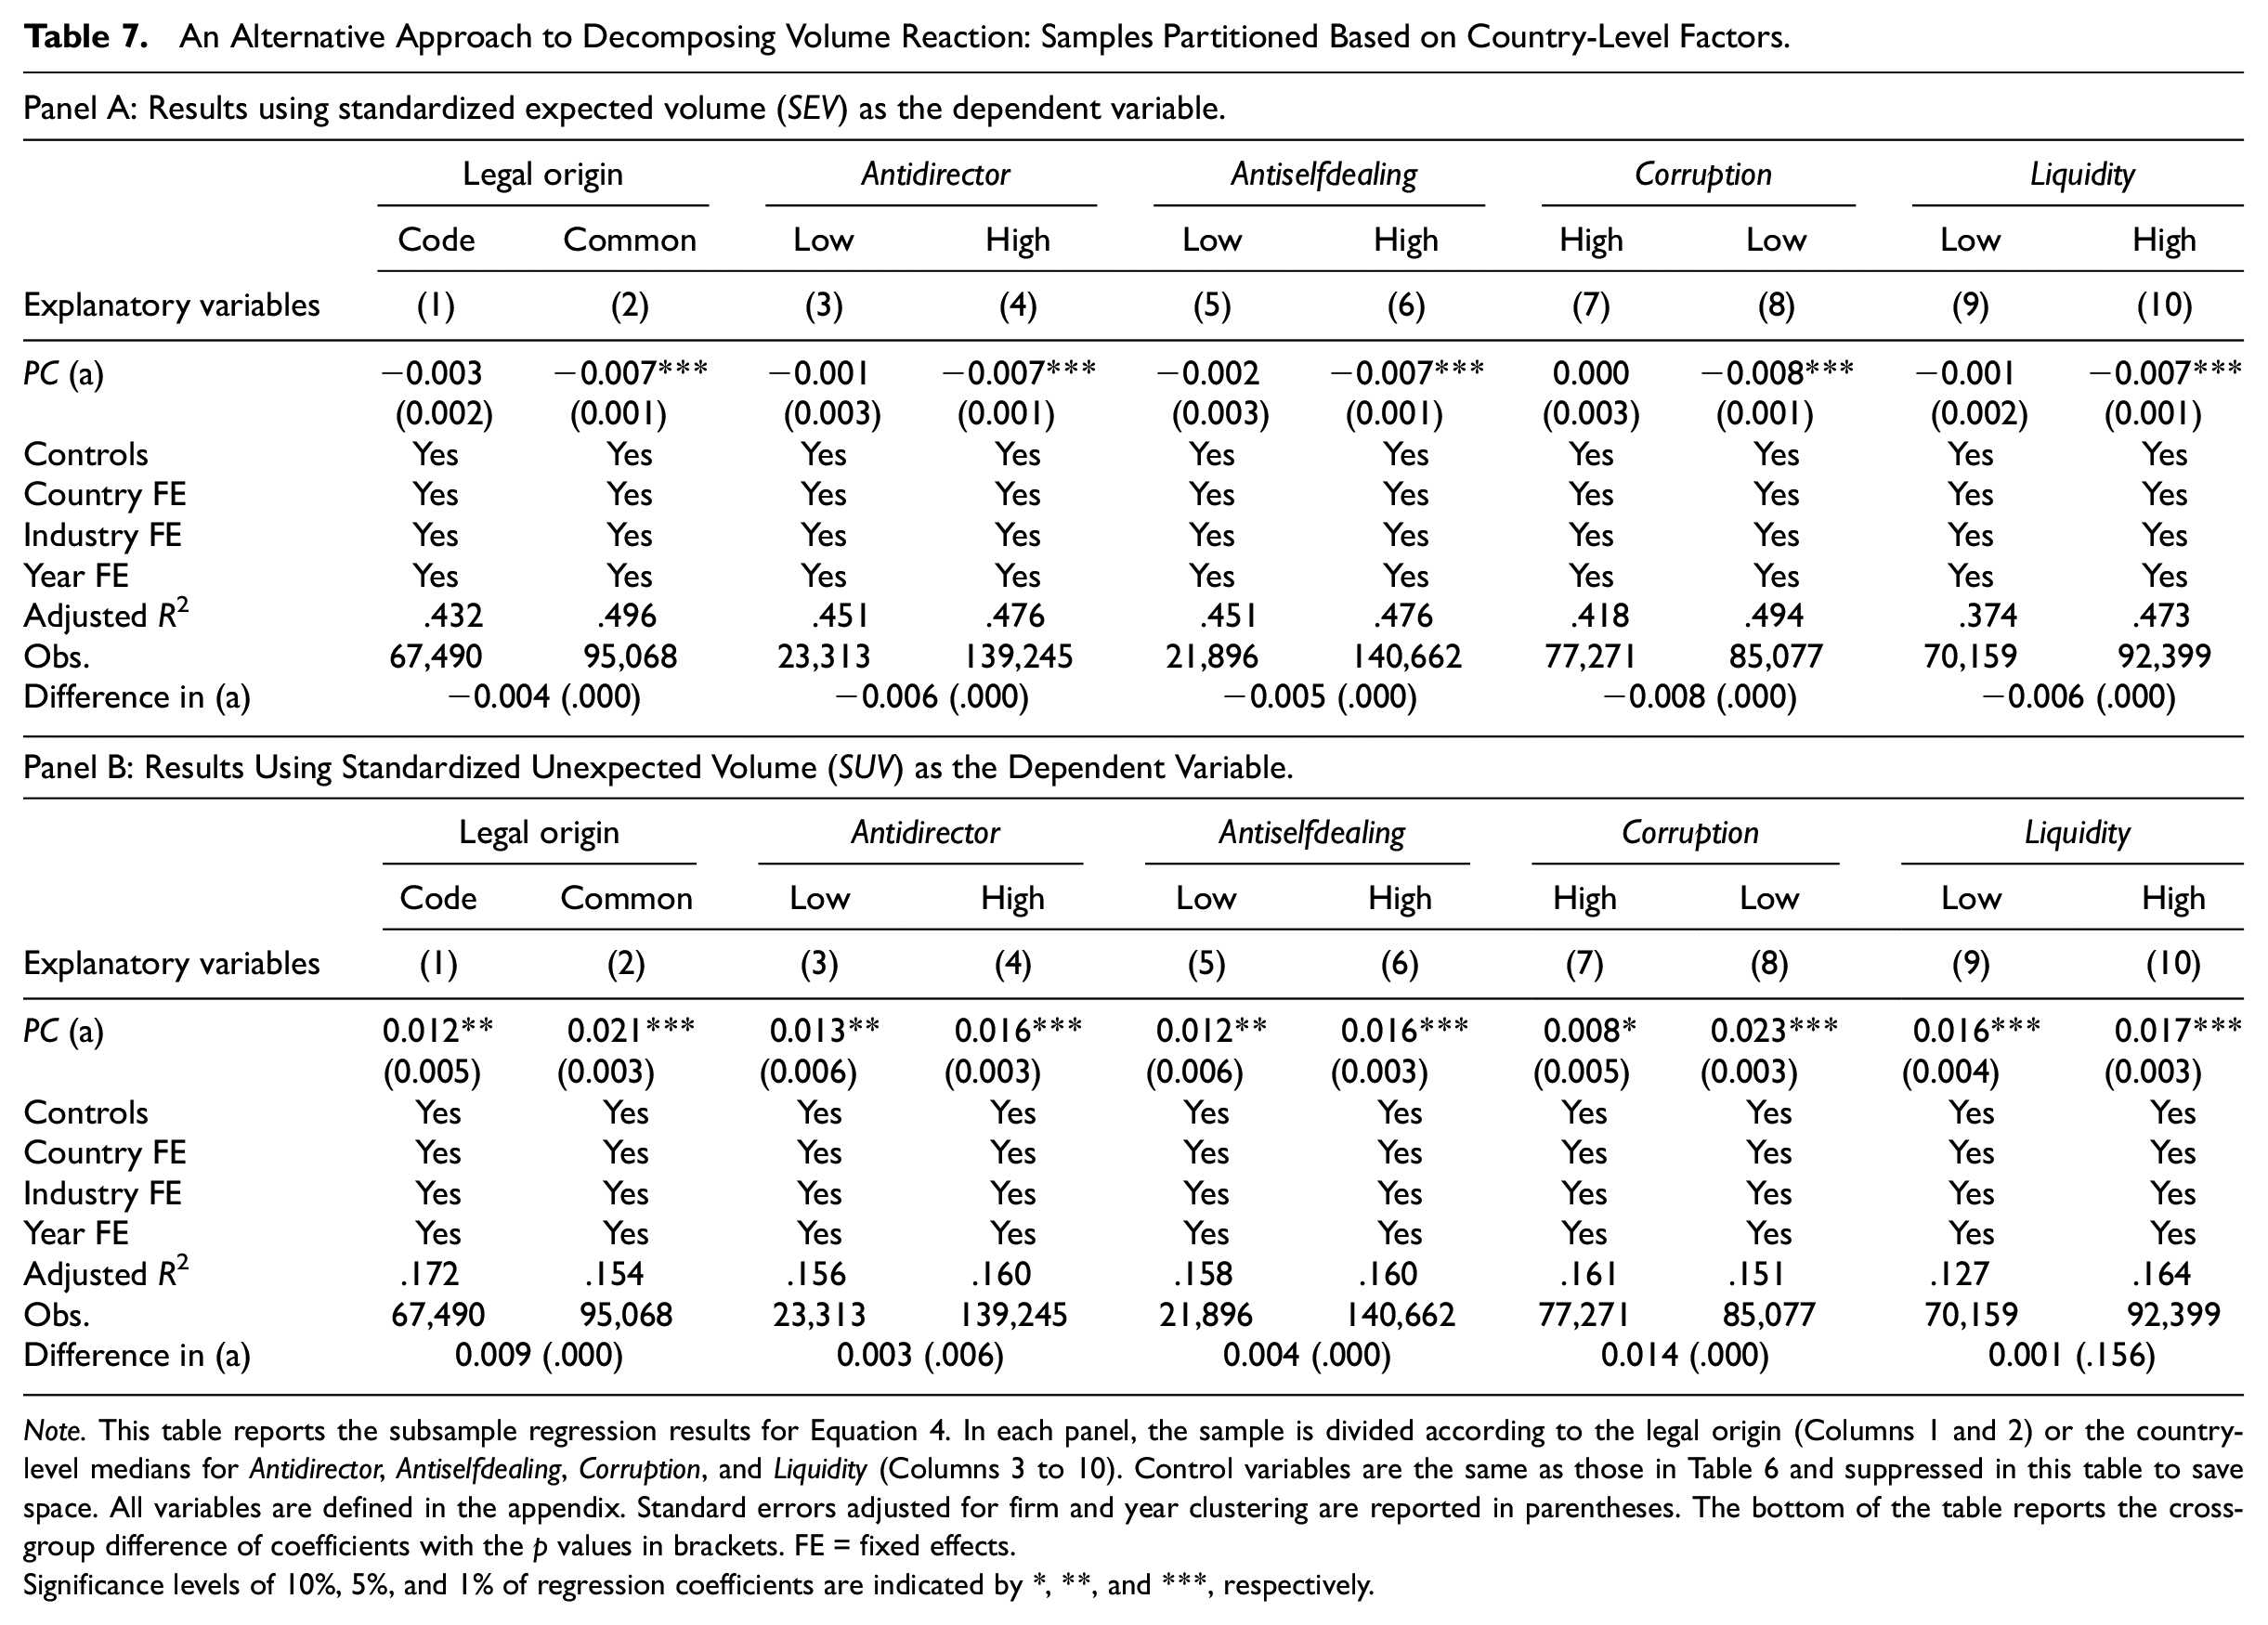
Note. This table reports the subsample regression results for Equation 4. In each panel, the sample is divided according to the legal origin (Columns 1 and 2) or the country-level medians for Antidirector, Antiselfdealing, Corruption, and Liquidity (Columns 3 to 10). Control variables are the same as those in Table 6 and suppressed in this table to save space. All variables are defined in the appendix. Standard errors adjusted for firm and year clustering are reported in parentheses. The bottom of the table reports the cross-group difference of coefficients with the p values in brackets. FE = fixed effects.
Significance levels of 10%, 5%, and 1% of regression coefficients are indicated by *, **, and ***, respectively.
Finally, we remove the United States from our international country list and retest our hypotheses to address the concern that our main results may be driven by the U.S. firms. Table 8 reports the regression results based on non-U.S. firms conditional on country-level institutions. The coefficients on PC are all significantly positive in Common law, high Antidirector, high Antiselfdealing, low Corruption, and high market Liquidity groups (i.e., in the even-numbered columns), while the coefficients on PC are significantly negative in countries with Code law and high Corruption level. Furthermore, the coefficients of PC × Abs_ret are all significantly negative in Common law, high Antidirector, high Antiselfdealing, low Corruption, and high market Liquidity groups (i.e., in the even-numbered columns). Overall, we conclude that our main results are unlikely to be driven by the U.S. firms.
Robustness Checks: Excluding the U.S. Firms.
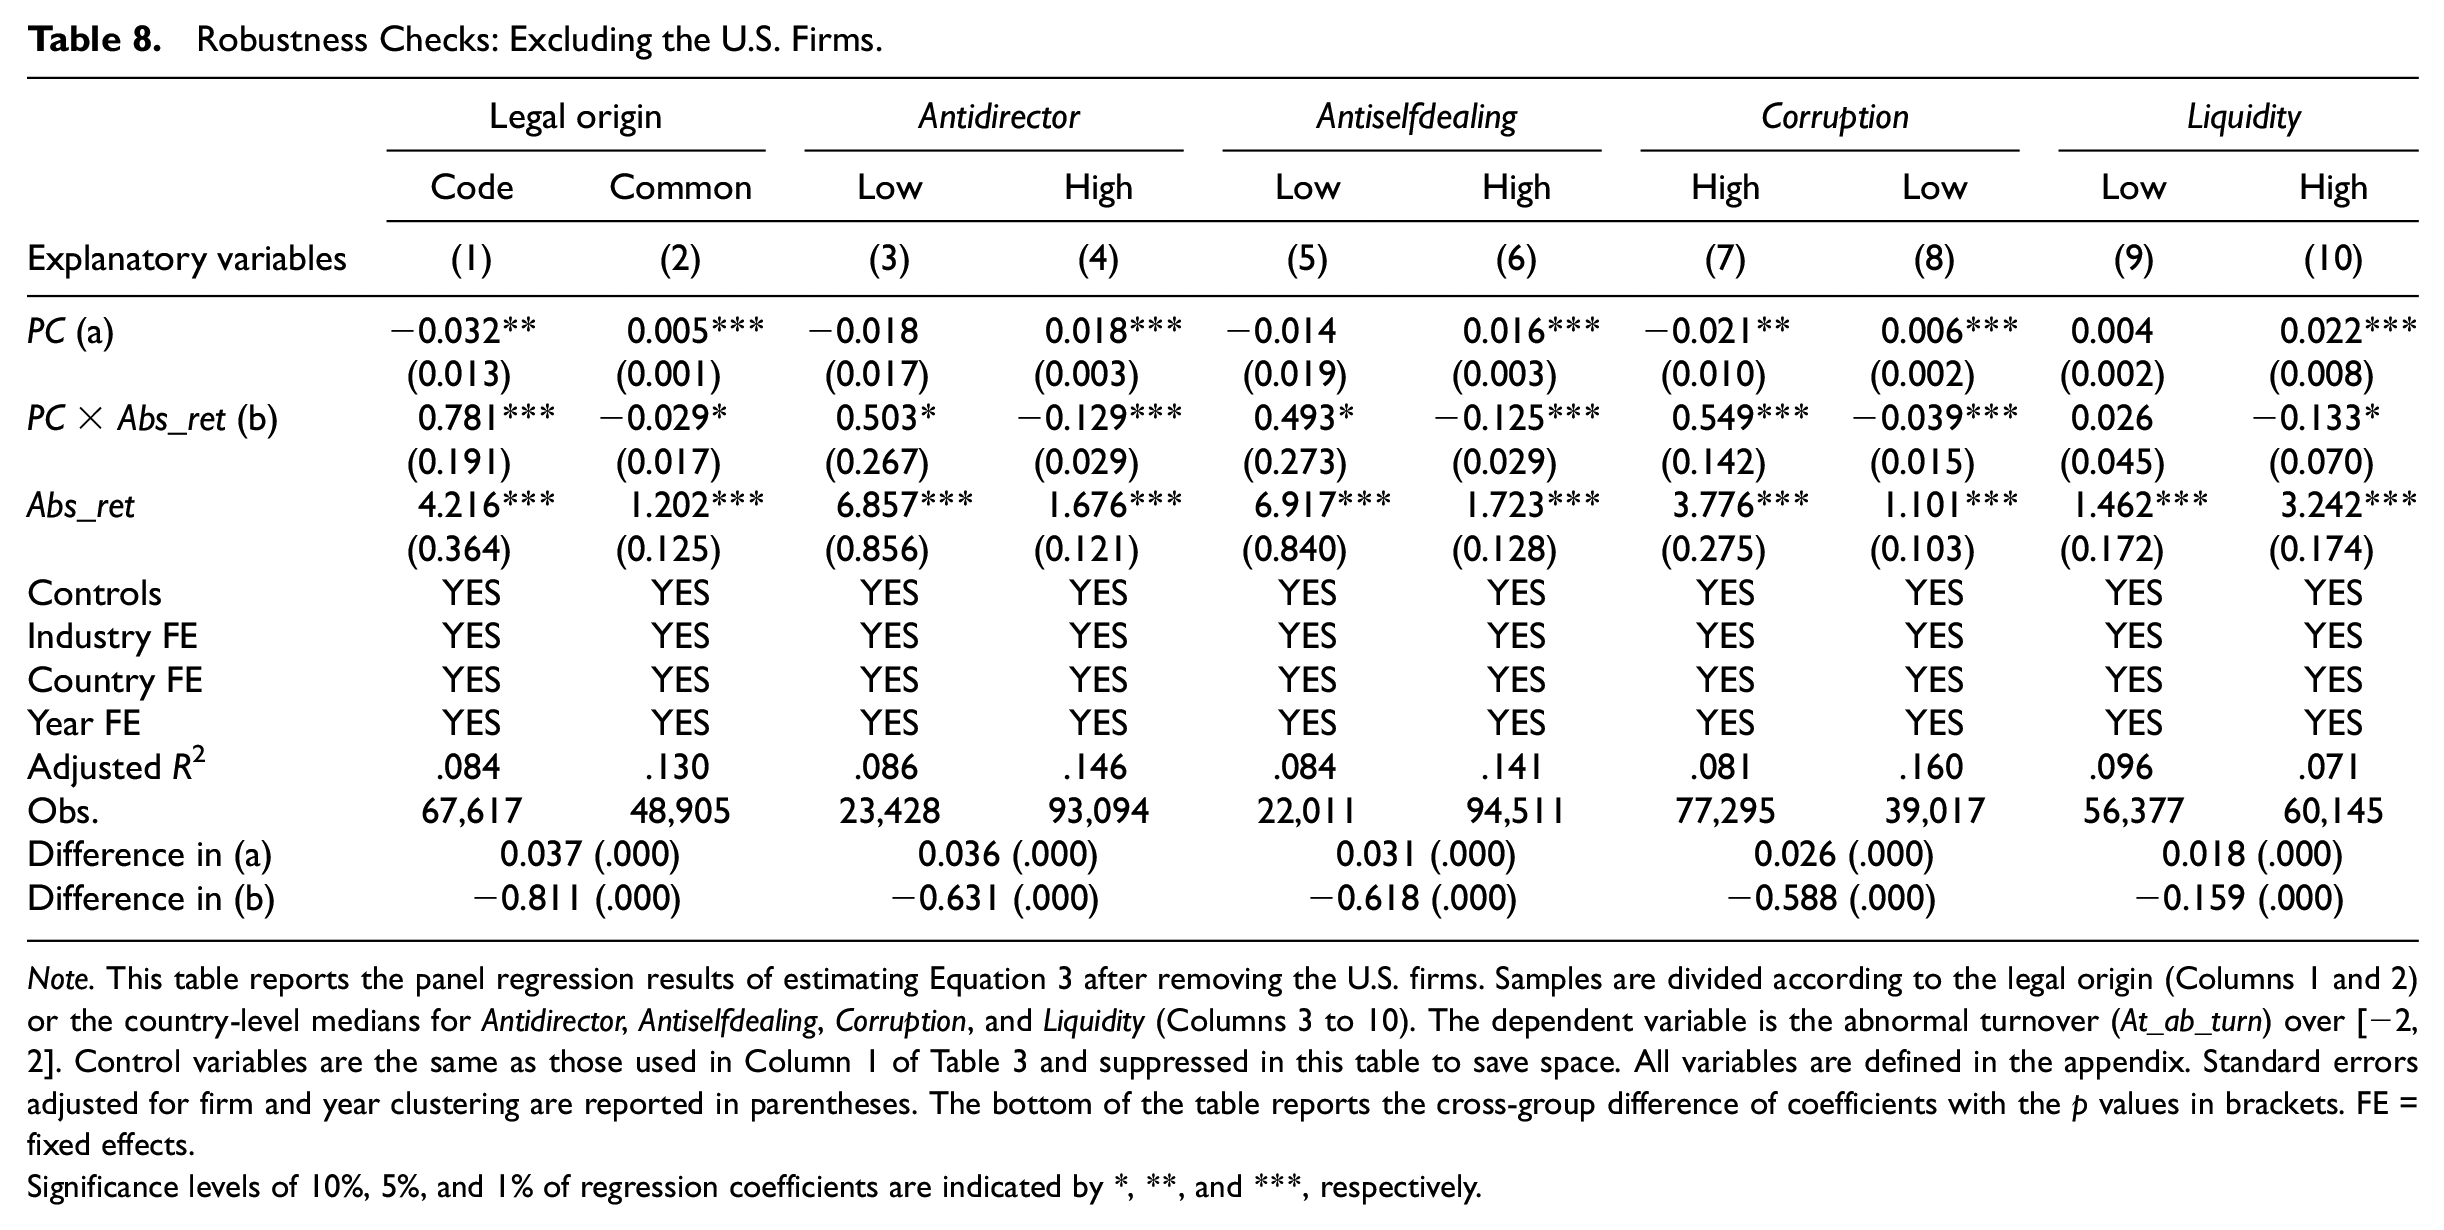
Note. This table reports the panel regression results of estimating Equation 3 after removing the U.S. firms. Samples are divided according to the legal origin (Columns 1 and 2) or the country-level medians for Antidirector, Antiselfdealing, Corruption, and Liquidity (Columns 3 to 10). The dependent variable is the abnormal turnover (At_ab_turn) over [−2, 2]. Control variables are the same as those used in Column 1 of Table 3 and suppressed in this table to save space. All variables are defined in the appendix. Standard errors adjusted for firm and year clustering are reported in parentheses. The bottom of the table reports the cross-group difference of coefficients with the p values in brackets. FE = fixed effects.
Significance levels of 10%, 5%, and 1% of regression coefficients are indicated by *, **, and ***, respectively.
Conclusion
In this study, we investigate trading volume reactions around earnings announcements in an international setting. Following the prior literature (Ahmed et al., 2003; Barron et al., 2018; Hope et al., 2009; O. Kim & Verrecchia, 1997), we decompose trading volume around an earnings announcement into a price-related component and a non-price related component. We show that, on average, a noisier earnings signal increases trading by stimulating differential interpretations, and decreases trading by narrowing the pre-event period information gap among investors. More importantly, when we partition the sample according to measures of investor protection, government corruption, and market liquidity, we find that the above results hold only for countries with strong institutions and are significantly weaker or even flip for countries with weak institutions. Although existing studies also relate total volume reaction to institutions (DeFond et al., 2007; Landsman et al., 2012), our results speak to how country-level factors affect differential information production and precision among investors both at and before earnings announcements. Our findings thus suggest that country-level factors are important determinants of the volume reaction around earnings announcements and contribute to the sparse literature on the trading response to corporate announcements in an international setting.
Footnotes
Appendix
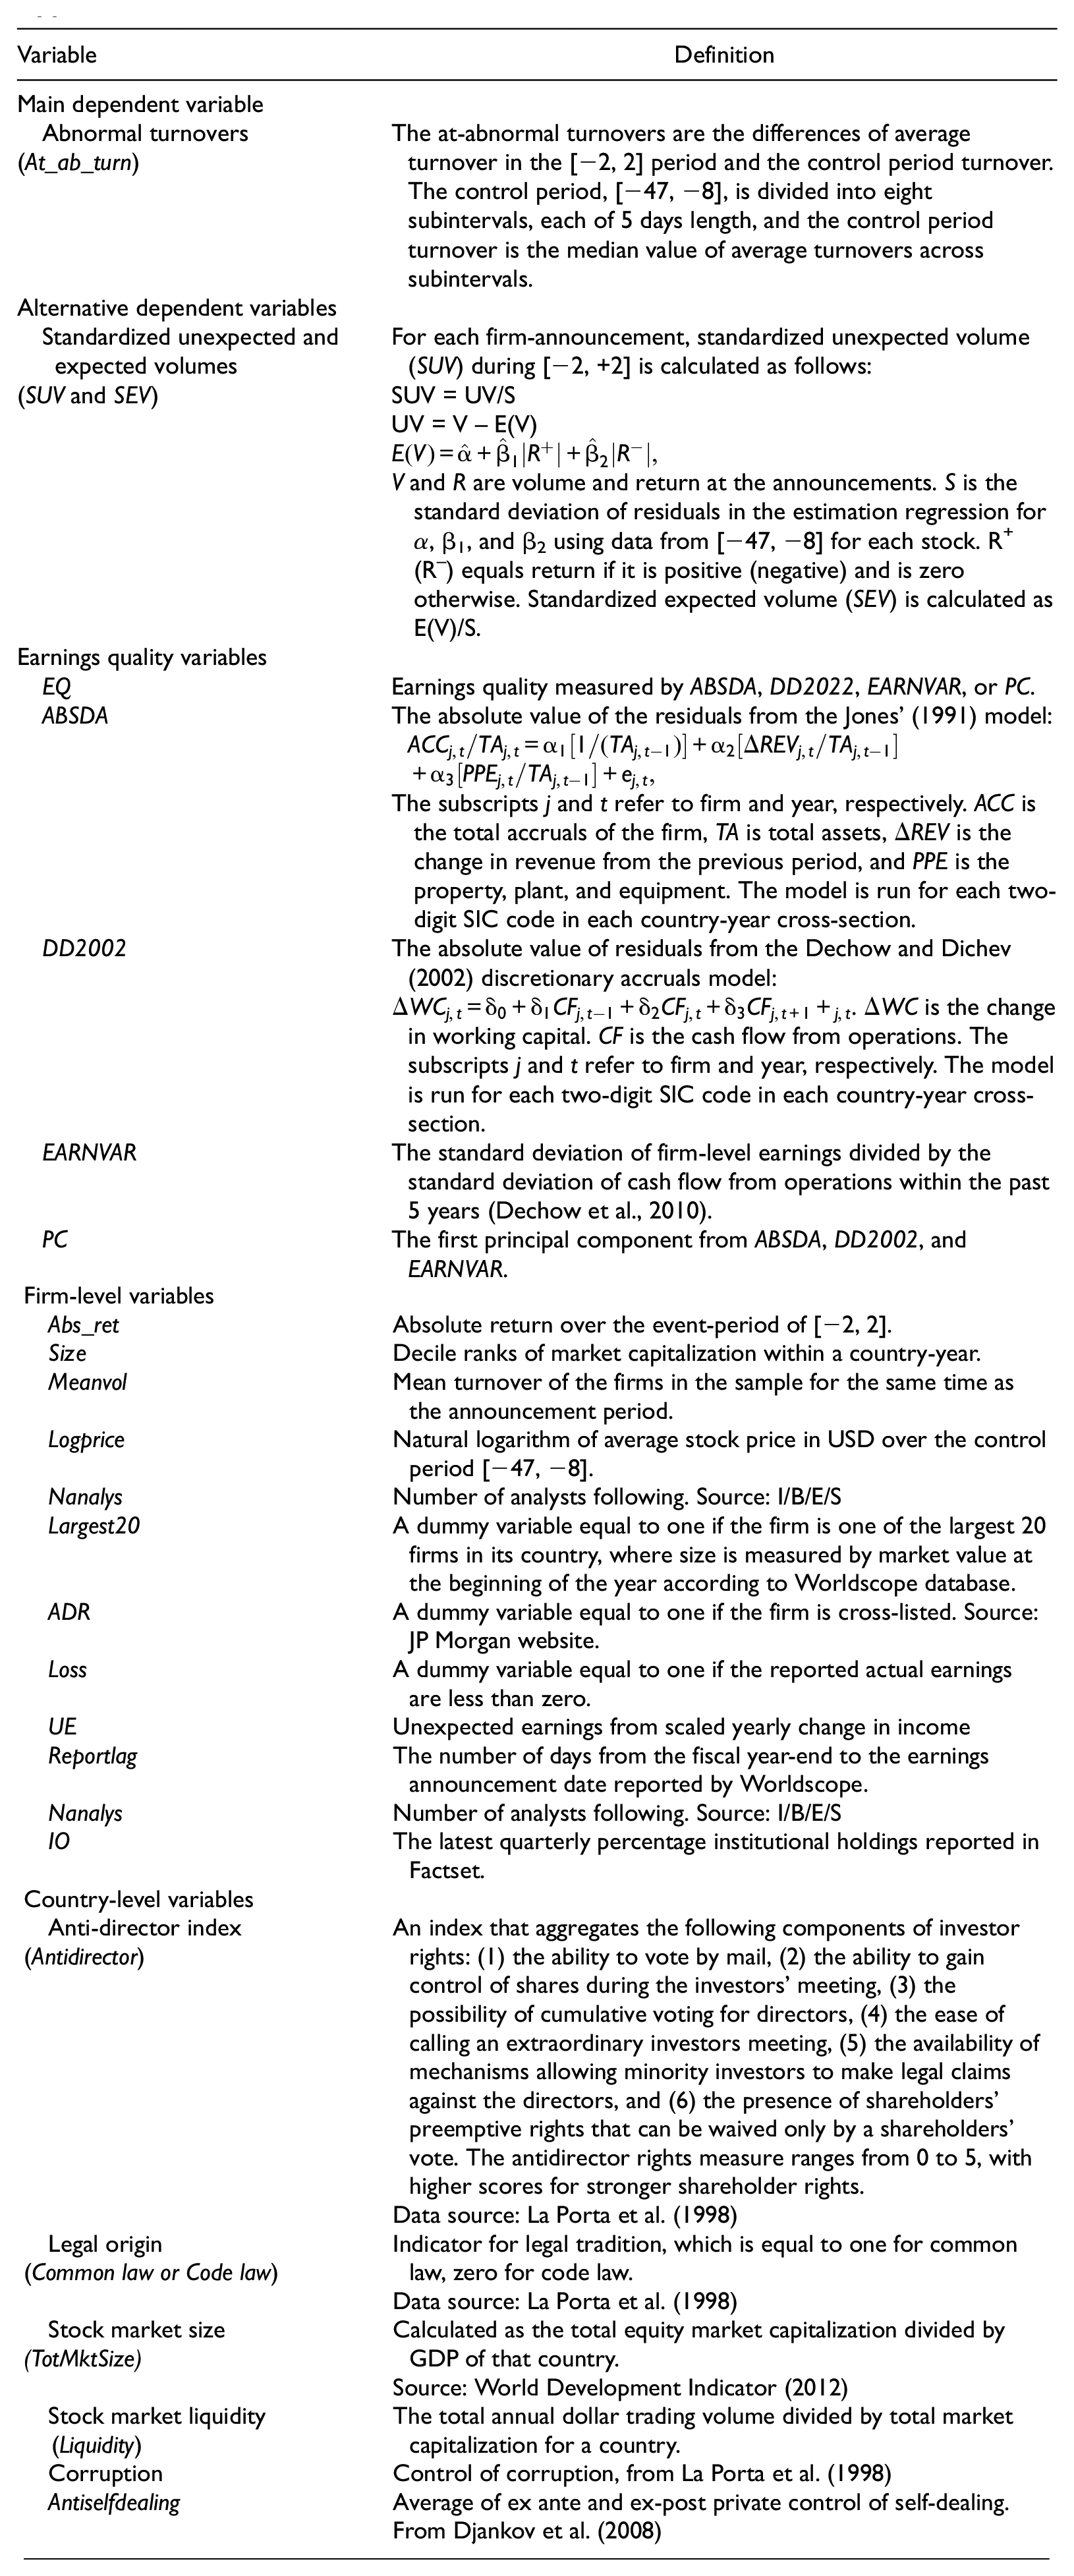
Variable Definitions.
| Variable | Definition |
|---|---|
| Main dependent variable | |
| Abnormal turnovers (At_ab_turn) |
The at-abnormal turnovers are the differences of average turnover in the [−2, 2] period and the control period turnover. The control period, [−47, −8], is divided into eight subintervals, each of 5 days length, and the control period turnover is the median value of average turnovers across subintervals. |
| Alternative dependent variables | |
| Standardized unexpected and expected volumes (SUV and SEV) |
For each firm-announcement, standardized unexpected volume (SUV) during [−2, +2] is calculated as follows: SUV = UV/S UV = V – E(V) V and R are volume and return at the announcements. S is the standard deviation of residuals in the estimation regression for α, β1, and β2 using data from [−47, −8] for each stock. R+ (R–) equals return if it is positive (negative) and is zero otherwise. Standardized expected volume (SEV) is calculated as E(V)/S. |
| Earnings quality variables | |
| EQ | Earnings quality measured by ABSDA, DD2022, EARNVAR, or PC. |
| ABSDA | The absolute value of the residuals from the Jones’ (1991) model:
The subscripts j and t refer to firm and year, respectively. ACC is the total accruals of the firm, TA is total assets, ΔREV is the change in revenue from the previous period, and PPE is the property, plant, and equipment. The model is run for each two-digit SIC code in each country-year cross-section. |
| DD2002 | The absolute value of residuals from the Dechow and Dichev (2002) discretionary accruals model: . ΔWC is the change in working capital. CF is the cash flow from operations. The subscripts j and t refer to firm and year, respectively. The model is run for each two-digit SIC code in each country-year cross-section. |
| EARNVAR | The standard deviation of firm-level earnings divided by the standard deviation of cash flow from operations within the past 5 years (Dechow et al., 2010). |
| PC | The first principal component from ABSDA, DD2002, and EARNVAR. |
| Firm-level variables | |
| Abs_ret | Absolute return over the event-period of [−2, 2]. |
| Size | Decile ranks of market capitalization within a country-year. |
| Meanvol | Mean turnover of the firms in the sample for the same time as the announcement period. |
| Logprice | Natural logarithm of average stock price in USD over the control period [−47, −8]. |
| Nanalys | Number of analysts following. Source: I/B/E/S |
| Largest20 | A dummy variable equal to one if the firm is one of the largest 20 firms in its country, where size is measured by market value at the beginning of the year according to Worldscope database. |
| ADR | A dummy variable equal to one if the firm is cross-listed. Source: JP Morgan website. |
| Loss | A dummy variable equal to one if the reported actual earnings are less than zero. |
| UE | Unexpected earnings from scaled yearly change in income |
| Reportlag | The number of days from the fiscal year-end to the earnings announcement date reported by Worldscope. |
| Nanalys | Number of analysts following. Source: I/B/E/S |
| IO | The latest quarterly percentage institutional holdings reported in Factset. |
| Country-level variables | |
| Anti-director index (Antidirector) |
An index that aggregates the following components of investor rights: (1) the ability to vote by mail, (2) the ability to gain control of shares during the investors’ meeting, (3) the possibility of cumulative voting for directors, (4) the ease of calling an extraordinary investors meeting, (5) the availability of mechanisms allowing minority investors to make legal claims against the directors, and (6) the presence of shareholders’ preemptive rights that can be waived only by a shareholders’ vote. The antidirector rights measure ranges from 0 to 5, with higher scores for stronger shareholder rights. Data source: La Porta et al. (1998) |
| Legal origin (Common law or Code law) |
Indicator for legal tradition, which is equal to one for common law, zero for code law. Data source: La Porta et al. (1998) |
| Stock market size (TotMktSize) |
Calculated as the total equity market capitalization divided by GDP of that country. Source: World Development Indicator (2012) |
| Stock market liquidity (Liquidity) |
The total annual dollar trading volume divided by total market capitalization for a country. |
| Corruption | Control of corruption, from La Porta et al. (1998) |
| Antiselfdealing | Average of ex ante and ex-post private control of self-dealing. From Djankov et al. (2008) |
Acknowledgements
The authors appreciate helpful comments from Stan Markov (associate editor), an anonymous reviewer, Dana Zhang, and seminar participants of King’s Business School.
Declaration of Conflicting Interests
The author(s) declared no potential conflicts of interest with respect to the research, authorship, and/or publication of this article.
Funding
The author(s) disclosed receipt of the following financial support for the research, authorship, and/or publication of this article: Zheng gratefully acknowledges the financial support provided by the National Natural Science Foundation of China (Grant No. U1811462, 72072190).