
Abstract
This paper examines how rank-order tournament incentives in the top management team (TMT) influence the quality of management earnings forecasts (MEFs). Instead of breeding feelings of inequality and fostering peer sabotage, the large pay gap between the CEO and subordinates may motivate top executives to issue more accurate and precise forecasts to win the prize of promotion. The positive tournament effect on the quality of MEFs is weakened (strengthened) when the perceived probability of promotion for candidates is low (high). We find that firms with higher tournament incentives are more likely to issue supplementary forecasts to increase the credibility of MEFs. By examining the tournament effect at each subordinate manager level, we find that CFOs are the driving force in controlling the frequency and quality of management forecasts and chief marketing officers (CMOs) may also contribute to the quality of management forecasts. The results are robust to multiple measures of tournament incentives and multiple research designs.
Introduction
As a key information channel, management earnings forecasts (MEFs) bridge the gap between top managers’ and investors’ expectations through a collection of predictions, estimates, and personal judgments from the top management team (TMT) (e.g., Seybert & Yang, 2012). A growing body of literature has examined various antecedents and consequences of the issuance of MEFs, but the preparation of MEFs from a teamwork viewpoint is still a black box. Although prior literature has investigated the roles of CEOs and CFOs in determining the quality of MEFs (Baik et al., 2011; Bamber et al., 2010; Brochet et al., 2019; Hribar & Yang, 2016), the question of how other top executives (chief marketing officers [CMOs], and chief operating officers [COOs]) influence the quality of MEFs is still open. 1
This paper links the managerial incentives motivated by the presence of pay gaps to the MEFs in both economic and behavioral ways. According to the tournament theory, the best performer in a firm’s rank-order tournament receives preference over others for promotion to the next higher rank (Lazear & Rosen, 1981). The firm-specific internal tournament incentivizes managers to work harder to win the prize of promotion to the next higher level, which improves the firm’s overall performance (Kale et al., 2009). To accomplish achievable management goals and to improve efficiency, subordinate managers are more likely to use management control systems, such as accurate budget plans and detailed internal accounting reports (Fisher et al., 2002; Merchant & Otley, 2006). By reviewing budget plans and monitoring internal reports, managers can make more accurate forecasts (Cassar & Gibson, 2008).
Given that CEOs who have won the prize in prior competitions have strong incentives to continue striving rather than rest on their laurels (Henderson & Fredrickson, 2001), they are more likely to demonstrate their abilities to directors and investors. Since the quality of MEFs is used as an indicator for evaluating a CEO’s ability to anticipate future events, CEO forced turnover is positively related to the magnitude of MEF errors (Lee et al., 2012). Therefore, under the potential threats of forced turnover from tournament competition, CEOs become more likely to provide MEFs with smaller errors.
However, the presence of large pay gaps may impose costs on the firm. A large pay gap between the CEO and subordinates may indicate stronger CEO power over other managers (Bebchuk et al., 2011). As CEOs become more central to the firm, they are less likely to be fired or feel career threats from subordinates (Mande & Son, 2012). As a result, powerful CEOs may be less motivated to show their abilities to shareholders and gain their trust by improving earnings forecasts quality. In addition, studies show that large pay gaps may lead to excessive risk-taking (Kini & Williams, 2012), managers’ misbehaviors (Haß et al., 2015), and sabotage of competitors (Harbring & Irlenbusch, 2011). These findings are consistent with the behavioral concept of relative deprivation theory. Behaviorists believe that large pay gaps between CEOs and subordinates may undermine team coordination by creating feelings of relative deprivation (Cowherd & Levine, 1992). The negative working attitude fostered by high expectations and subsequent disillusionment in the workplace may lead to higher levels of cynicism and less incentive to perform ethical and effective management controls (Andersson & Bateman, 1997), which eventually reduces the quality of MEFs.
In addition, top managers may choose to play corporate politics in a hostile competitive environment. In this environment, subordinate managers are more likely to be distracted from operating issues (Finkelstein & Hambrick, 1988; Milgrom & Roberts, 1988), and the competitive environment of mistrust may lead to less effective internal governance and give rise to inaccurate MEFs (Cheng et al., 2016; Gong et al., 2009).
Using a sample consisting of 20,471 forecast-year observations from 2002 to 2015, we find a positive association between the presence of large pay gaps and the precision and accuracy of MEFs. To further consolidate the economic link between tournament incentives and the quality of MEFs, we provide a cross-sectional test to investigate how the perceived probability of promotion moderates this positive association. We find that the tournament effect on the quality of MEFs is strengthened during the period shortly before a CEO turnover and when the perceived probability of promotion is high.
Supplementary forecasts may contain incremental information beyond what is provided in MEFs (Han & Wild, 1991). For example, sales forecasts provide a clearer signal about a firm’s pricing strategy and estimates of demand, so they can be used to inform investors about the firm’s competitive position within its industry (Acito et al., 2021). In addition, capital expenditure forecasts provide detailed annual capital expenditure decisions and are used by managers to elicit market feedback (Jayaraman & Shuang Wu, 2020). Given that many firms issue supplementary forecasts, we also explore the tournament effect on supplementary forecasts. We find that managers with higher tournament incentives are more likely to issue supplementary forecasts. In addition, managers are energized to improve the quality of supplementary forecasts only when the earnings news is bad. Similarly, we provide strong evidence that managers who are motivated by stronger tournament incentives are more likely to issue earnings forecasts to show their forecasting abilities and to adjust market expectations.
Considering the diversified responsibilities of each subordinate manager, we examine how subordinate tournament incentives influence the issuance and quality of management forecasts. We find that CFOs with larger pay gaps are more likely to issue both earnings and supplementary forecasts. Although CMOs are not able to exert significant influence on the issuance of management forecasts, we find evidence that CMOs may contribute to the quality of management forecasts by providing more accurate sales estimations and other vital strategic marketing information. In addition, we find no significant tournament effect on management forecasts for COOs, perhaps because their focus is more on long-term operational performance than on short-lived forecasts.
In additional analyses, we examine investors’ and analysts’ responses to MEFs because they are likely to act as ex-post indicators of forecast credibility. We find that investors and analysts are informed about the higher quality of MEFs issued by firms with higher tournament incentives. Our results are robust to the inclusion of CEO-fixed effects and alternative tournament incentives.
This paper contributes to the accounting literature in several ways. From a theoretical viewpoint, it supports the validity of tournament theory in explaining the effect of large pay gaps on the quality of MEFs. This paper provides empirical evidence in response to the debate on explaining the influence of large pay gaps on top executives’ cooperation (Henderson & Fredrickson, 2001). This study also sheds light on the importance of other top executives in determining the quality of MEFs. We provide evidence that CMOs tend to contribute to the quality of MEFs, especially the quality of sales forecasts. In addition, this paper depicts a fresh view of supplementary forecasts that have received limited attention in prior literature. We advance this stream of literature by showing that tournament incentives (TMT vs. subordinate tournament effects) may affect the issuance and quality of supplementary forecasts. Furthermore, this paper provides an innovative answer to the management accounting research question of how internal competition can be used as a motivating device without turning employees against each other (Luft, 2016). We find strong evidence that the presence of pay gaps may serve as an effective governance tool to reduce information asymmetries by providing higher quality MEFs. We also provide a new avenue for future studies to use more TMT-related theories to advance the MEF literature. Finally, this study offers a practical insight by encouraging investors, analysts, and regulators to recognize the benefits of rank-based compensation contracting to improve the quality of MEFs.
Literature Review and Hypothesis Development
This paper is embedded in the stream of literature that investigates the determinants of the quality of MEFs (Ajinkya et al., 2005; Baginski et al., 2004). Apart from the firm and industry characteristics, prior literature documents that the TMT is responsible for the preparation of MEFs, so it can significantly affect their quality (Bamber et al., 2010; Cheng et al., 2013).
However, most of these studies focus on the roles of CEOs and CFOs, but do not pay much attention to the importance of other top executives in determining the quality of MEFs (Brochet et al., 2011). Given that subordinate managers who take charge of functional responsibilities determine the quality of information inputs during the preparation of MEFs, this paper investigates how other top executives may influence the cooperation within the TMT and further affect the quality of MEFs. By introducing the tournament theory, this paper explains how rank-order compensation contracting may shape managerial incentives for the entire management team, and how such tournament incentives may affect the quality of MEFs.
The tournament theory was first proposed by Rosenbaum (1979) and Lazear and Rosen (1981). They suggest that a relative performance evaluation scheme to induce efforts from agents through monitoring is difficult when agents are risk-averse or when the cost to measure performance is prohibitive. This problem has led firms to develop competitive tournaments. In a traditional rank-order tournament, the best performer is promoted to the next level in the firm’s hierarchy, passing over other contenders. This provides a powerful incentive for the tournament participants to perform well to increase their chance to win the promotion prize.
The findings on rank-order tournaments document that the internal tournament improves corporate performance (Kale et al., 2009) and firm innovation (Jia et al., 2016) but can impair firm’s corporate social responsibility (CSR) performance (Zhao et al., 2021). Presumably, the pay gap would encourage subordinates to work harder to improve their performance based on their separate responsibilities. To accomplish achievable management goals and to improve operational efficiency, subordinate managers are likely to use more reliable and efficient management control systems, such as accurate budget plans and detailed internal accounting reports (Fisher et al., 2002; Merchant & Otley, 2006). The access to accounting information from reviewing budget plans and monitoring the quality of internal accounting reports gives managers sufficient and comprehensive information to make more accurate forecasts (Cassar & Gibson, 2008).
Given that agents who have won the prize in prior competitions have strong incentives to continue striving rather than rest on their laurels (Henderson & Fredrickson, 2001), CEOs are more likely to take chances to show their capabilities in firm operations and to align their interests with shareholders by reducing information asymmetries. 2 CEOs with higher abilities tend to issue MEFs with higher quality (Baik et al., 2011). Since management forecast accuracy is treated as a signal indicating a CEO’s ability to anticipate future events, the magnitude of MEF errors is positively related to a forced CEO turnover (Lee et al., 2012). Therefore, under the potential threat of forced turnovers from tournament competition, CEOs become more likely to provide MEFs with smaller errors. Therefore, we conjecture that the presence of higher tournament incentives may lead to more accurate MEFs.
However, there are several reasons that large pay gaps may lead to lower quality of earnings forecasts. The presence of large pay gaps between the CEO and subordinates may indicate stronger CEO power over others (Bebchuk et al., 2011). As CEOs become more central to the firm, they are less likely to be fired or feel career threats from subordinates (Mande & Son, 2012). As a result, powerful CEOs are less motivated to show their abilities to shareholders and gain their trust by improving earnings forecasts quality. The dark side of tournament incentives documented in prior literature may also foster lower quality of earnings forecasts. In particular, Kini and Williams (2012) show that, to increase the chance of becoming the CEO, managers are incentivized to take excessive firm risks. Haß et al. (2015) also find that tournament incentives encourage managers to commit fraudulent acts.
From a more behavioral viewpoint, tournament incentives to win the prize reduce the cooperative efforts within the management team (Drago & Garvey, 1998) and increase sabotage activities (Harbring & Irlenbusch, 2011) when the pay gaps among top executives increase. Moreover, the large pay gaps between CEOs and subordinates may foster the sense of distributive injustice and relative deprivation (Cowherd & Levine, 1992). According to the consequences of relative deprivation, the feeling that they have received less than they deserve may motivate subordinate managers to express their dissatisfaction by taking adverse actions, such as absenteeism or strikes, that undermine team coordination (Henderson & Fredrickson, 2001). Suffering the perception of disutility, subordinates become less committed to organizational goals and team cooperation (Deutsch, 1985, 1986). Since the generation of MEFs needs the coordination of the entire management team (Xing et al., 2019), the presence of large pay gaps may discourage subordinate managers from improving their performance in their areas of responsibility. In a related study, Andersson and Bateman (1997) document that the psychological gap fostered by high expectations and subsequent disillusionment in the workplace may lead to higher levels of cynicism and less motivation to perform ethical and effective management controls. The increasing probability of managers’ unethical behaviors (i.e., misreporting) and the less effective management controls over financial reporting will eventually reduce the accuracy of inputs needed to generate MEFs.
Another reason that large pay gaps among top executive managers may lower the quality of MEFs is in line with the prior studies on political economics. Employees may choose to play corporate politics by making themselves look good and their peers look bad when rank-order compensation contracts are used (Dye, 1984; Milgrom & Roberts, 1988). The large pay gaps increase the likelihood of political sabotage among executives (Harbring & Irlenbusch, 2011). Specifically, in firms with large pay gaps, subordinate managers may attempt to withhold vital information from peers, damage the reputation of rivals, and polish their own reputations by manipulating accounting numbers (Finkelstein & Hambrick, 1988; Milgrom & Roberts, 1988). This vicious competitive atmosphere distracts subordinate managers from operating issues and fosters a corporate culture filled with mistrust and peer sabotage, resulting in less effective internal governance, which can lead to more earnings manipulation and less accurate MEFs (Cheng et al., 2016; Gong et al., 2009). Overall, the effect of pay gaps between top executives and other managers on the quality of MEFs is unclear. Therefore, we state our first hypothesis in null form:
As documented by Kale et al. (2009), when the CEO is about to leave a company, the perceived probability of promotion rises because the succession is available to each subordinate manager and the winner of the tournament will be promoted soon. Thus, participants have stronger tournament incentives to show their abilities during the period right before a CEO turnover. By contrast, the appointment of a new CEO reduces the perceived probability of promotion to the rank of CEO. The appointment of a new CEO terminates the current promotion tournament, which would only start again when there is an expected vacancy for this position. Thus, during the period shortly after a CEO turnover, the tournament effect is weakened.
Any other factors that might change the perceived probability of promotion will moderate the magnitude of tournament effects. As the perceived probability of promotion increases, the magnitude of tournament incentives grows. Consequently, the effect of tournament incentives on the quality of MEFs is more pronounced. However, as the perceived probability of promotion decreases, the association between tournament incentives and the quality of MEFs is weakened. Thus, we hypothesize that:
Methodology
Sample Selection
Management annual earnings forecast data and top executive compensation data are collected from I/B/E/S Guidance and EXECUCOMP for 2002 to 2015. Financial data and institutional holding data are obtained from COMPUSTAT and Thomson Reuters 13-F database. Stock return data are extracted from CRSP. The board- and governance-related information is accessed from BoardEx. Utilities and financial firms (SIC code: 4900-4999 and 6000-6999, respectively) are excluded because firms in these regulated industries have different financial reporting incentives from firms in other industries. The final sample consists of 20,471 forecast-year observations for further analyses. The sample selection procedure and an explanation of the variations in sample size can be found in Appendix B.
Tournament Incentives Measures
Following Kale et al. (2009), the first tournament measure, Log(Gap), is defined as the natural logarithm of the difference between the CEO’s total compensation package (EXECUCOMP variable TDC1) and the median subordinate managers’ total compensation packages. We define a CEO as the person who is identified as the CEO of the firm in EXECUCOMP (data item CEOANN = CEO) and classify all other executives as subordinate managers/VPs. 3 To compute Log(Gap), we require each firm to have at least three VPs in addition to the CEO. 4 The second measure of tournament incentives, Log(Diff), is defined as the natural logarithm of the difference between the CEO’s total compensation and the highest-paid VP’s compensation. It captures the minimum increase in compensation for the VP if he or she is promoted to CEO, which is a more conservative estimate of the tournament trophy’s value. 5
Model Specification
Regression model to test H1
We first investigate the association between tournament incentives and the quality of MEFs proxied by the precision and accuracy of MEFs. The following ordinary least squares (OLS) regression model is used to test H1:
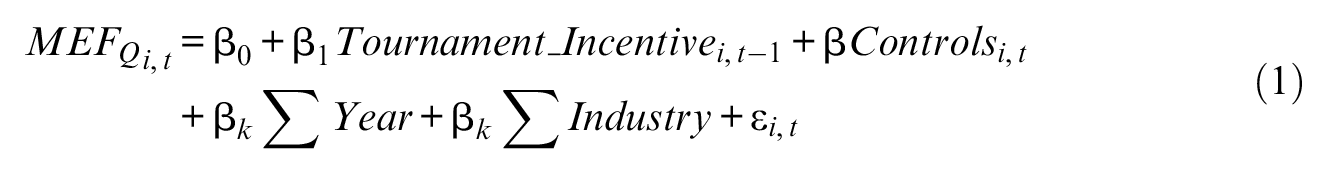
where i indexes the firm, t labels the year, and MEF stands for the quality of MEFs. We use two proxies for the quality of MEFs: the precision of forecasts (Precision) and the accuracy of forecasts (Accuracy). Following Rogers and Stocken (2005), Precision is defined as the difference between the forecast’s upper and lower bounds, deflated by the beginning stock price, and multiplied by 100. It takes a value of 0 if a point forecast is given. 6 Accuracy is defined as the absolute difference between the forecast earnings per share (EPS) and the actual reported number, deflated by the beginning stock price, and multiplied by 100. 7 We multiply both Precision and Accuracy by −1 to make them positively correlated with the quality of MEFs. Tournament_Incentive represents one of the two pay gap measures (Log[Gap] or Log[Diff]), and we use the lagged value of the executive pay gap to alleviate possible endogeneity concerns.
We first control for several firm fundamental characteristics that may influence voluntary disclosure decisions, including firm size, firm performance, firm innovation, institutional ownership, and litigation. We control earnings volatility since firms with more volatile earnings are less likely to issue high-quality forecasts (S. Chen et al., 2011). We control for financial reporting quality measured by internal control effectiveness and discretionary accruals. In addition, we control for industry concentration and forecast attributes, such as forecast horizon and forecast news content. We also control for CEOs’ and subordinate executives’ compensation and characteristics, including their equity compensation, tenure, and social connections measured by the existence of professional or education overlaps (Ke et al., 2019). CEO ability, which is estimated by the data envelopment analysis (DEA) approach (Demerjian et al., 2012), is included in the model as well (Baik et al., 2011). Finally, we control for corporate governance factors, including board size, board independence, and CEO power because Ajinkya et al. (2005) find that firms with effective governance mechanisms are more likely to provide management forecasts, and their forecasts are more precise. Industry- and year-fixed effects are included to control unobservable industry and time variations, and standard errors are clustered by firm.
Regression model to test H2
In this section, we test the moderating effect of promotion probability on the association between tournament incentives and the quality of MEFs. We modify Model 1 by adding the interaction term Tournament_Incentive*Pre_Turnover (Post_Turnover). Pre_Turnover is a dummy variable that indicates the period shortly before a CEO turnover. We only include voluntary CEO turnovers for the pre-turnover test. 8 Given that year t is the year when the CEO leaves the company, Pre_Turnover equals 1 for year t− 1 and year t− 2, and 0 for other years. 9 Similarly, we define Post_Turnover as a dummy variable that proxies for the period right after a CEO turnover. It equals 1 for year t and year t+ 1, and 0 for other years, where year t is the year that a new CEO joins the company. We remove the restriction on the types of CEO turnovers for the post-turnover test because we expect tournament incentives to be weakened right after the appointment of a new CEO regardless of whether the turnover is voluntary or forced. 10 To avoid frequent CEO turnovers, we further exclude firm-year observations when the consecutive CEO turnover is less than 4 years.
The tournament effect does not only exist around CEO turnover periods. To examine the moderating effect of the internal promotion probability in a more general setting, we first follow Mobbs and Raheja (2012) to generate a propensity score for the likelihood of each executive becoming the firm’s next CEO using an ordered logit prediction model. 11 Then, we compute Pro_Range as the difference between the highest and lowest scores among all subordinate executives. Pro_Range captures the level of competition within each firm since a high value for Pro_Range would suggest that the executive with the highest score is so likely to become the next CEO that others have little chance to compete with him or her. Therefore, the perceived probability of promotion in firms with high values of Pro_Range is expected to be low. We modify Model 1 and add the interaction term Tournament Incentive*Pro_Range. 12
Empirical Results
Summary Statistics
In Table 1, we report the summary statistics for the sample. Distributions for the two measures of tournament incentives are similar. The mean value of Log(Gap) is 1.165 (US$3.206 million), which is comparable to the statistics reported by Kale et al. (2009). The mean value of Log(Diff) is 0.823 (US$2.277 million) and is relatively smaller than Log(Gap), as expected. On average, the mean value of the forecast range is 0.363% of the share price. The mean value of the forecast error is 0.755, indicating that forecasts deviate from actual EPS by 0.755% of the share price on average. The distributions of the control variables are generally consistent with prior literature.
Descriptive Statistics.
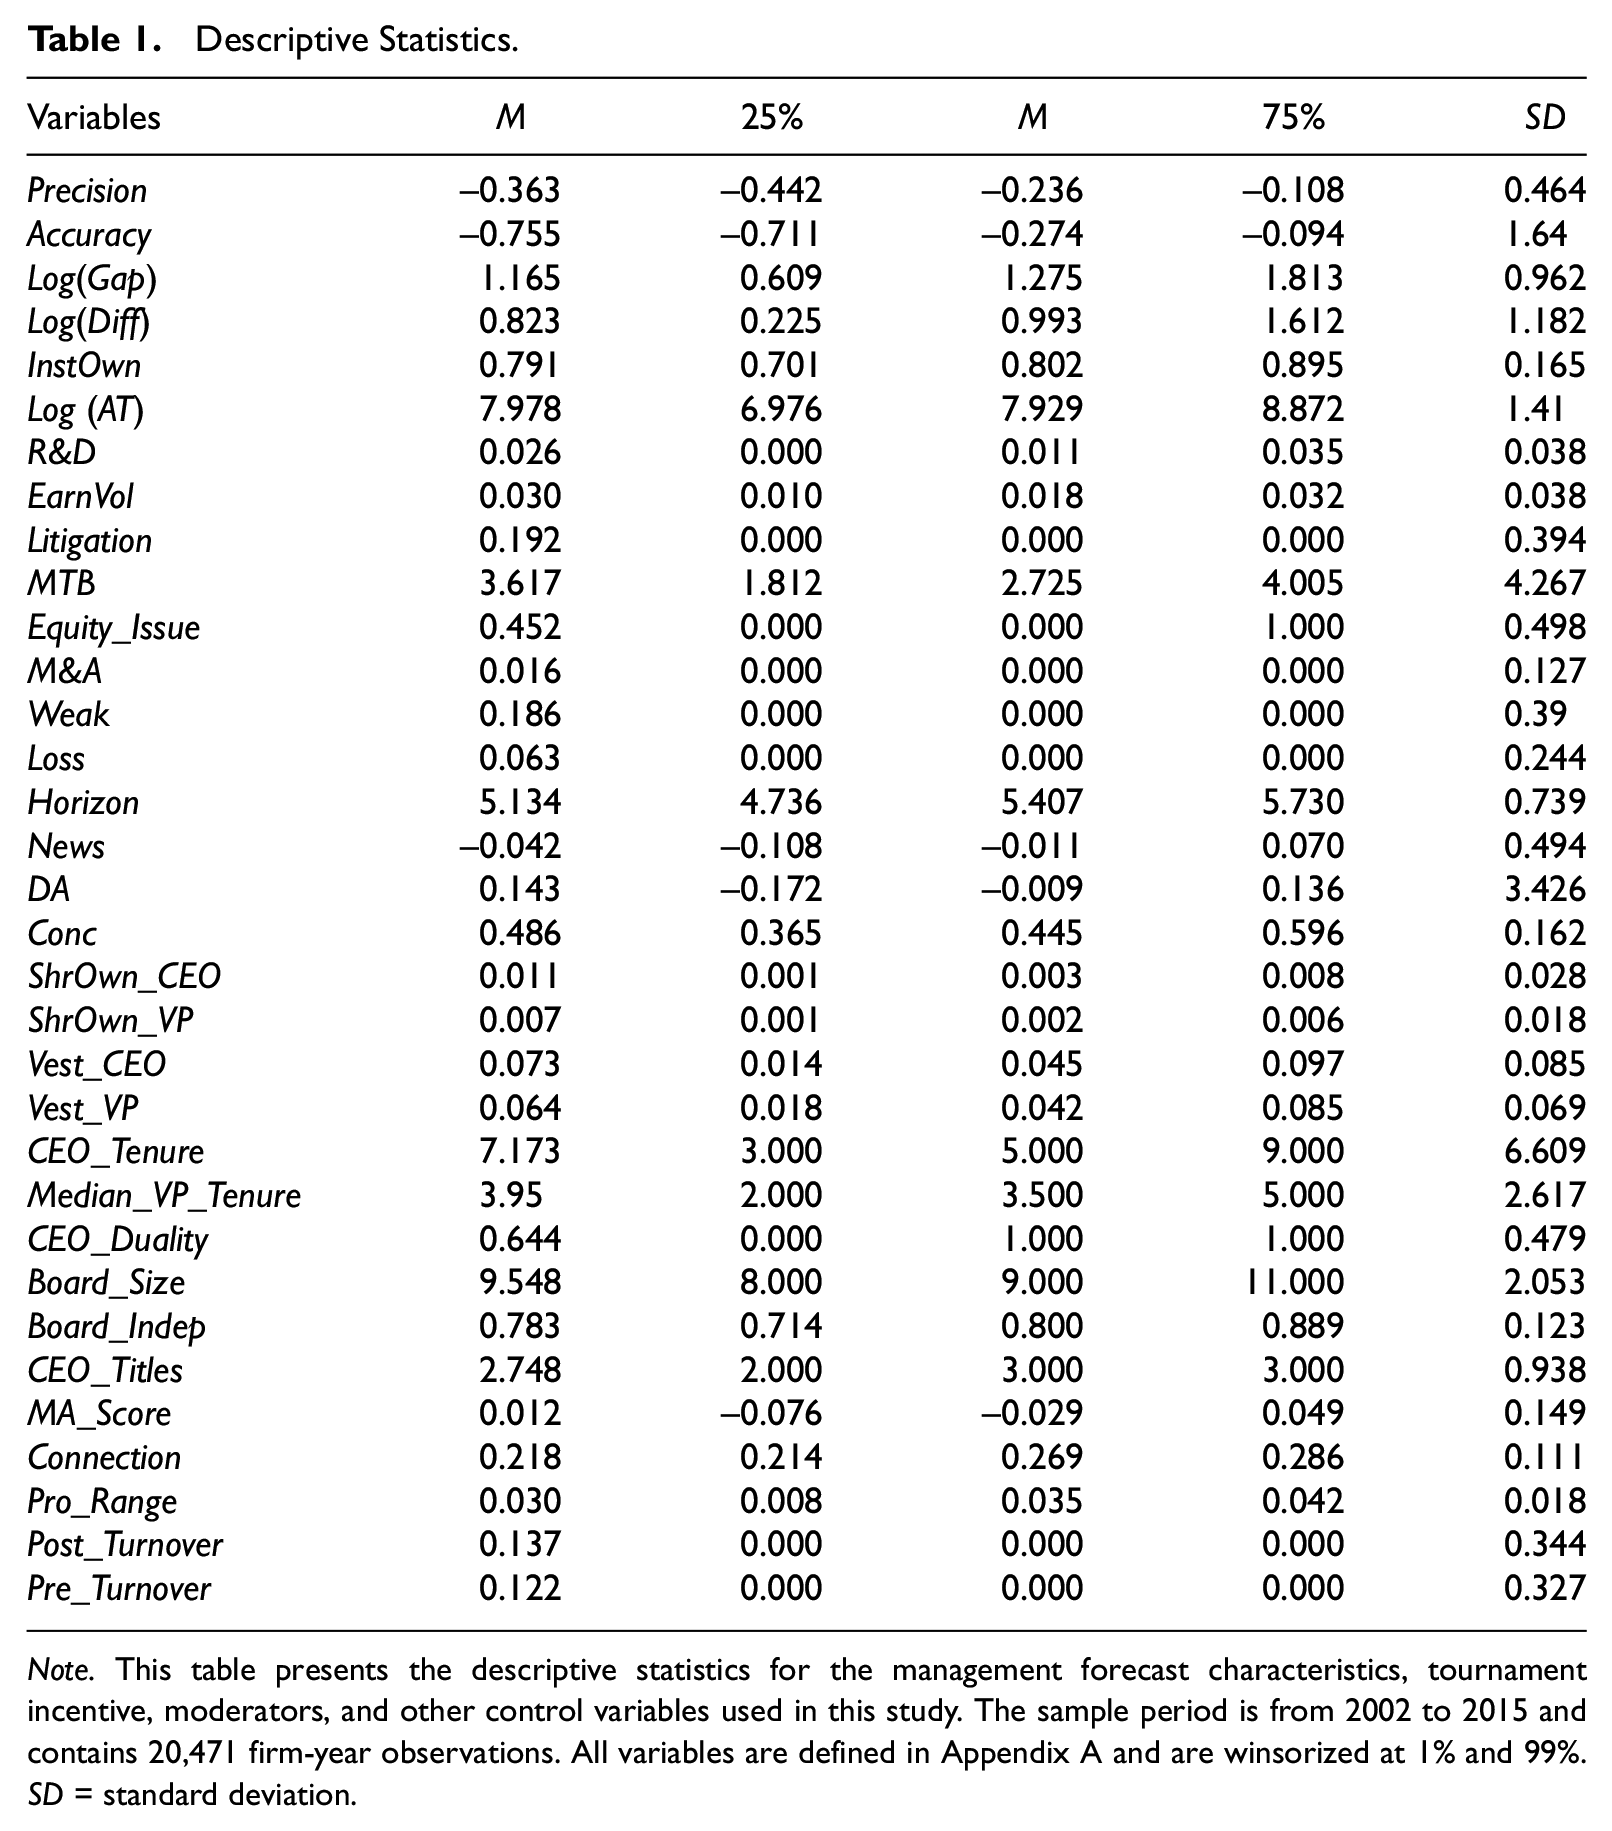
Note. This table presents the descriptive statistics for the management forecast characteristics, tournament incentive, moderators, and other control variables used in this study. The sample period is from 2002 to 2015 and contains 20,471 firm-year observations. All variables are defined in Appendix A and are winsorized at 1% and 99%. SD = standard deviation.
For variables used in the cross-sectional tests, the mean value of Pro_Range is 0.030, 13 indicating that the difference in the perceived probability of promotion between top executives with the highest and lowest propensity scores in a given company is about 3.00% on average. The mean value of Post_Turnover is 0.137, suggesting that 13.70% of firm-year observations are associated with the period after the appointment of a new CEO. The mean value of Pre_Turnover is 0.122, indicating that 12.20% of firm-year observations are associated with the period shortly before a CEO turnover.
Baseline Results
The empirical results for the baseline model are reported in Table 2. We estimate the model specified in Equation 1 using both the precision and accuracy of MEFs as the dependent variables and two measures of tournament incentives, Log(Gap) and Log(Diff). In particular, Columns 1 to 4 report the estimates using Precision as the dependent variable (precision test), and Columns 5 to 8 present the results using Accuracy as the dependent variable (accuracy test).
The Tournament Effects on the Quality of MEFs.
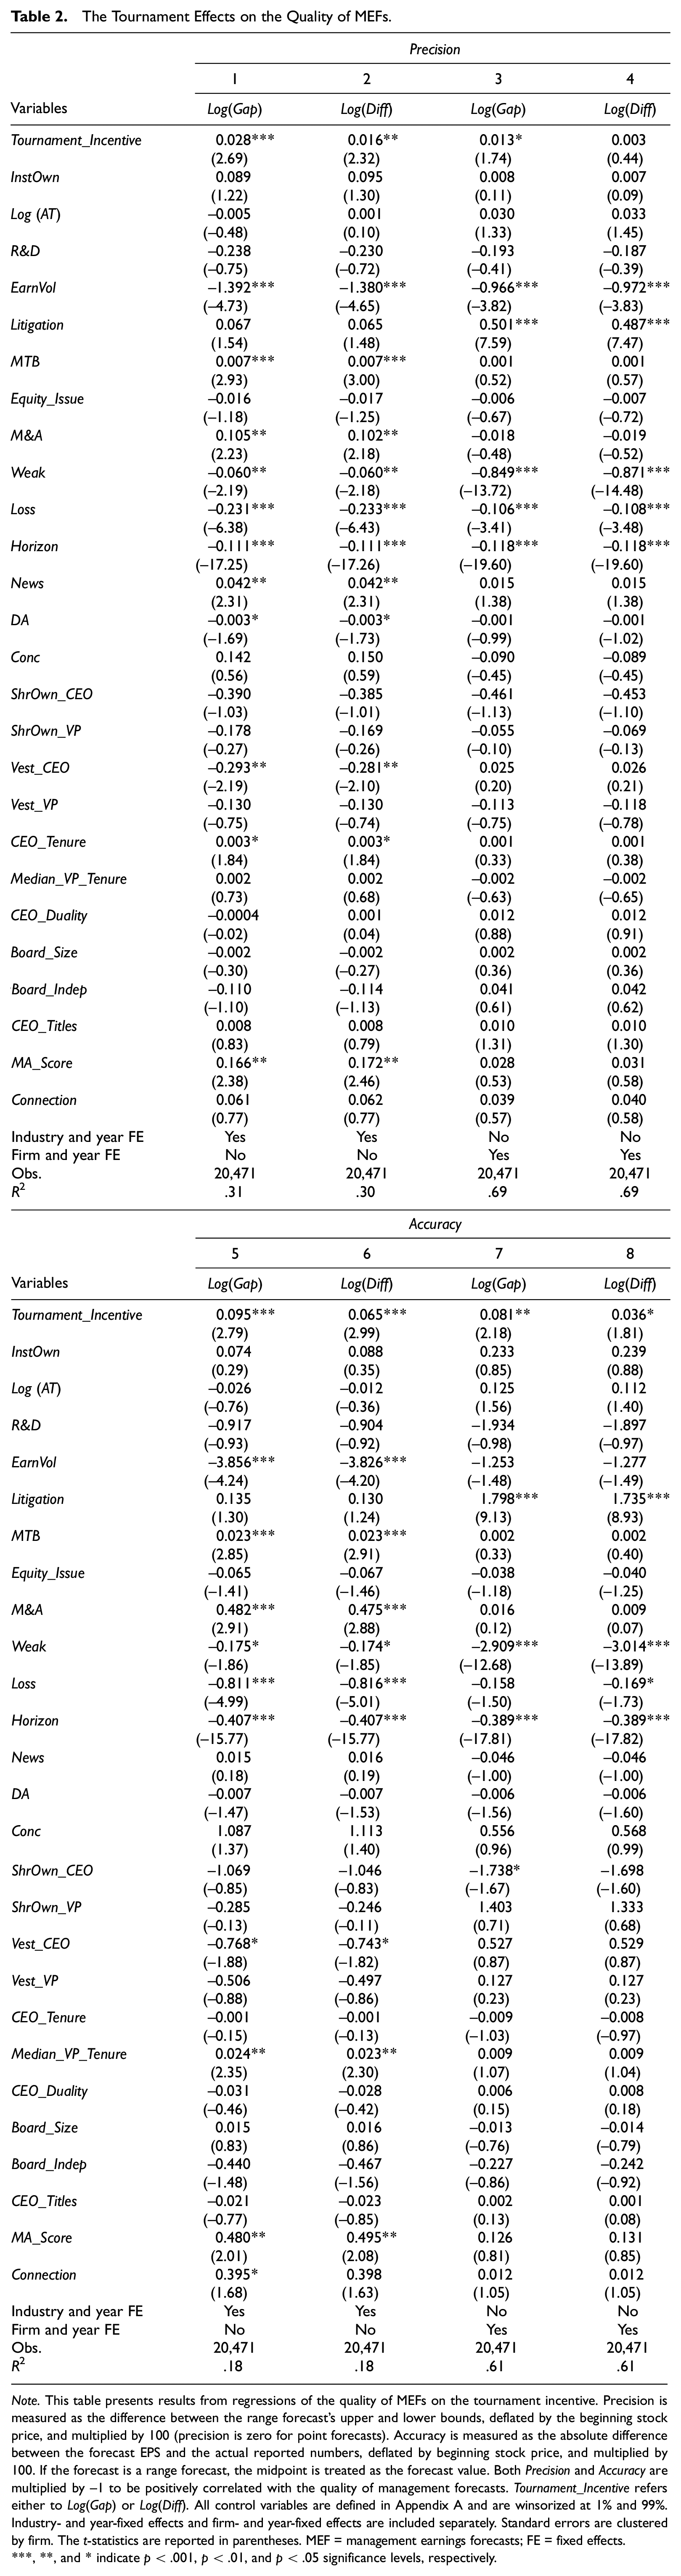
Note. This table presents results from regressions of the quality of MEFs on the tournament incentive. Precision is measured as the difference between the range forecast’s upper and lower bounds, deflated by the beginning stock price, and multiplied by 100 (precision is zero for point forecasts). Accuracy is measured as the absolute difference between the forecast EPS and the actual reported numbers, deflated by beginning stock price, and multiplied by 100. If the forecast is a range forecast, the midpoint is treated as the forecast value. Both Precision and Accuracy are multiplied by −1 to be positively correlated with the quality of management forecasts. Tournament_Incentive refers either to Log(Gap) or Log(Diff). All control variables are defined in Appendix A and are winsorized at 1% and 99%. Industry- and year-fixed effects and firm- and year-fixed effects are included separately. Standard errors are clustered by firm. The t-statistics are reported in parentheses. MEF = management earnings forecasts; FE = fixed effects.
, **, and * indicate p < .001, p < .01, and p < .05 significance levels, respectively.
In Column 1, the estimate of the coefficient on Tournament_Incentive is 0.028 (p < .01), when Log(Gap) is used to measure tournament incentives and estimate the model with industry- and year-fixed effects. After replacing Log(Gap) with Log(Diff) in Column 2, the estimate of the coefficient on Tournament_Incentive is 0.016 (p < .05). These results suggest that tournament incentives exert a positive influence on the precision of MEFs. In terms of economic magnitude, an increase in one standard deviation in Log(Gap) (Log[Diff]) is associated with a 7.42% (5.20%) increase in forecast precision. To explore the robustness of the model specification, we use firm-fixed effects instead of industry-fixed effects and find similar results, as reported in Columns 3 and 4.
In the accuracy tests, the estimate of the coefficient on Tournament_Incentive is 0.095 (p < .01) using Log(Gap) in Column 5 and 0.065 (p < .01) using Log(Diff) in Column 6. These results suggest that tournament incentives also exert a positive influence on the accuracy of MEFs. In terms of economic magnitude, an increase in one standard deviation in Log(Gap) (Log[Diff]) is associated with a 12.10% (10.18%) increase in forecast accuracy. Alternatively, using firm-fixed effects, we find that the estimate of the coefficient on Tournament_Incentive is 0.081 (p < .05) using Log(Gap) in Column 7 and 0.036 (p < .10) using Log(Diff) in Column 8. Overall, these results show that firms with higher tournament incentives are associated with higher quality MEFs and support the rejection of the null hypothesis H1. The coefficients of the control variables are generally consistent with prior literature. Specifically, the coefficient for social connection is positive, although statistically insignificant, implying that greater social connections among top executives may improve the quality of MEFs. 14
Cross-Sectional Results
Table 3 reports the cross-sectional estimation results for both precision (Columns 1 and 2) and accuracy tests (Columns 3 and 4). Panels A, B, and C display the results for three moderators: Pre_Turnover, Post_Turnover, and Pro_Range, respectively. The estimates of the coefficients on Tournament_Incentive remain positive and statistically significant in all models.
The Moderating Effect of Promotion Probability on the Association Between Tournament Incentives and the Quality of MEFs.
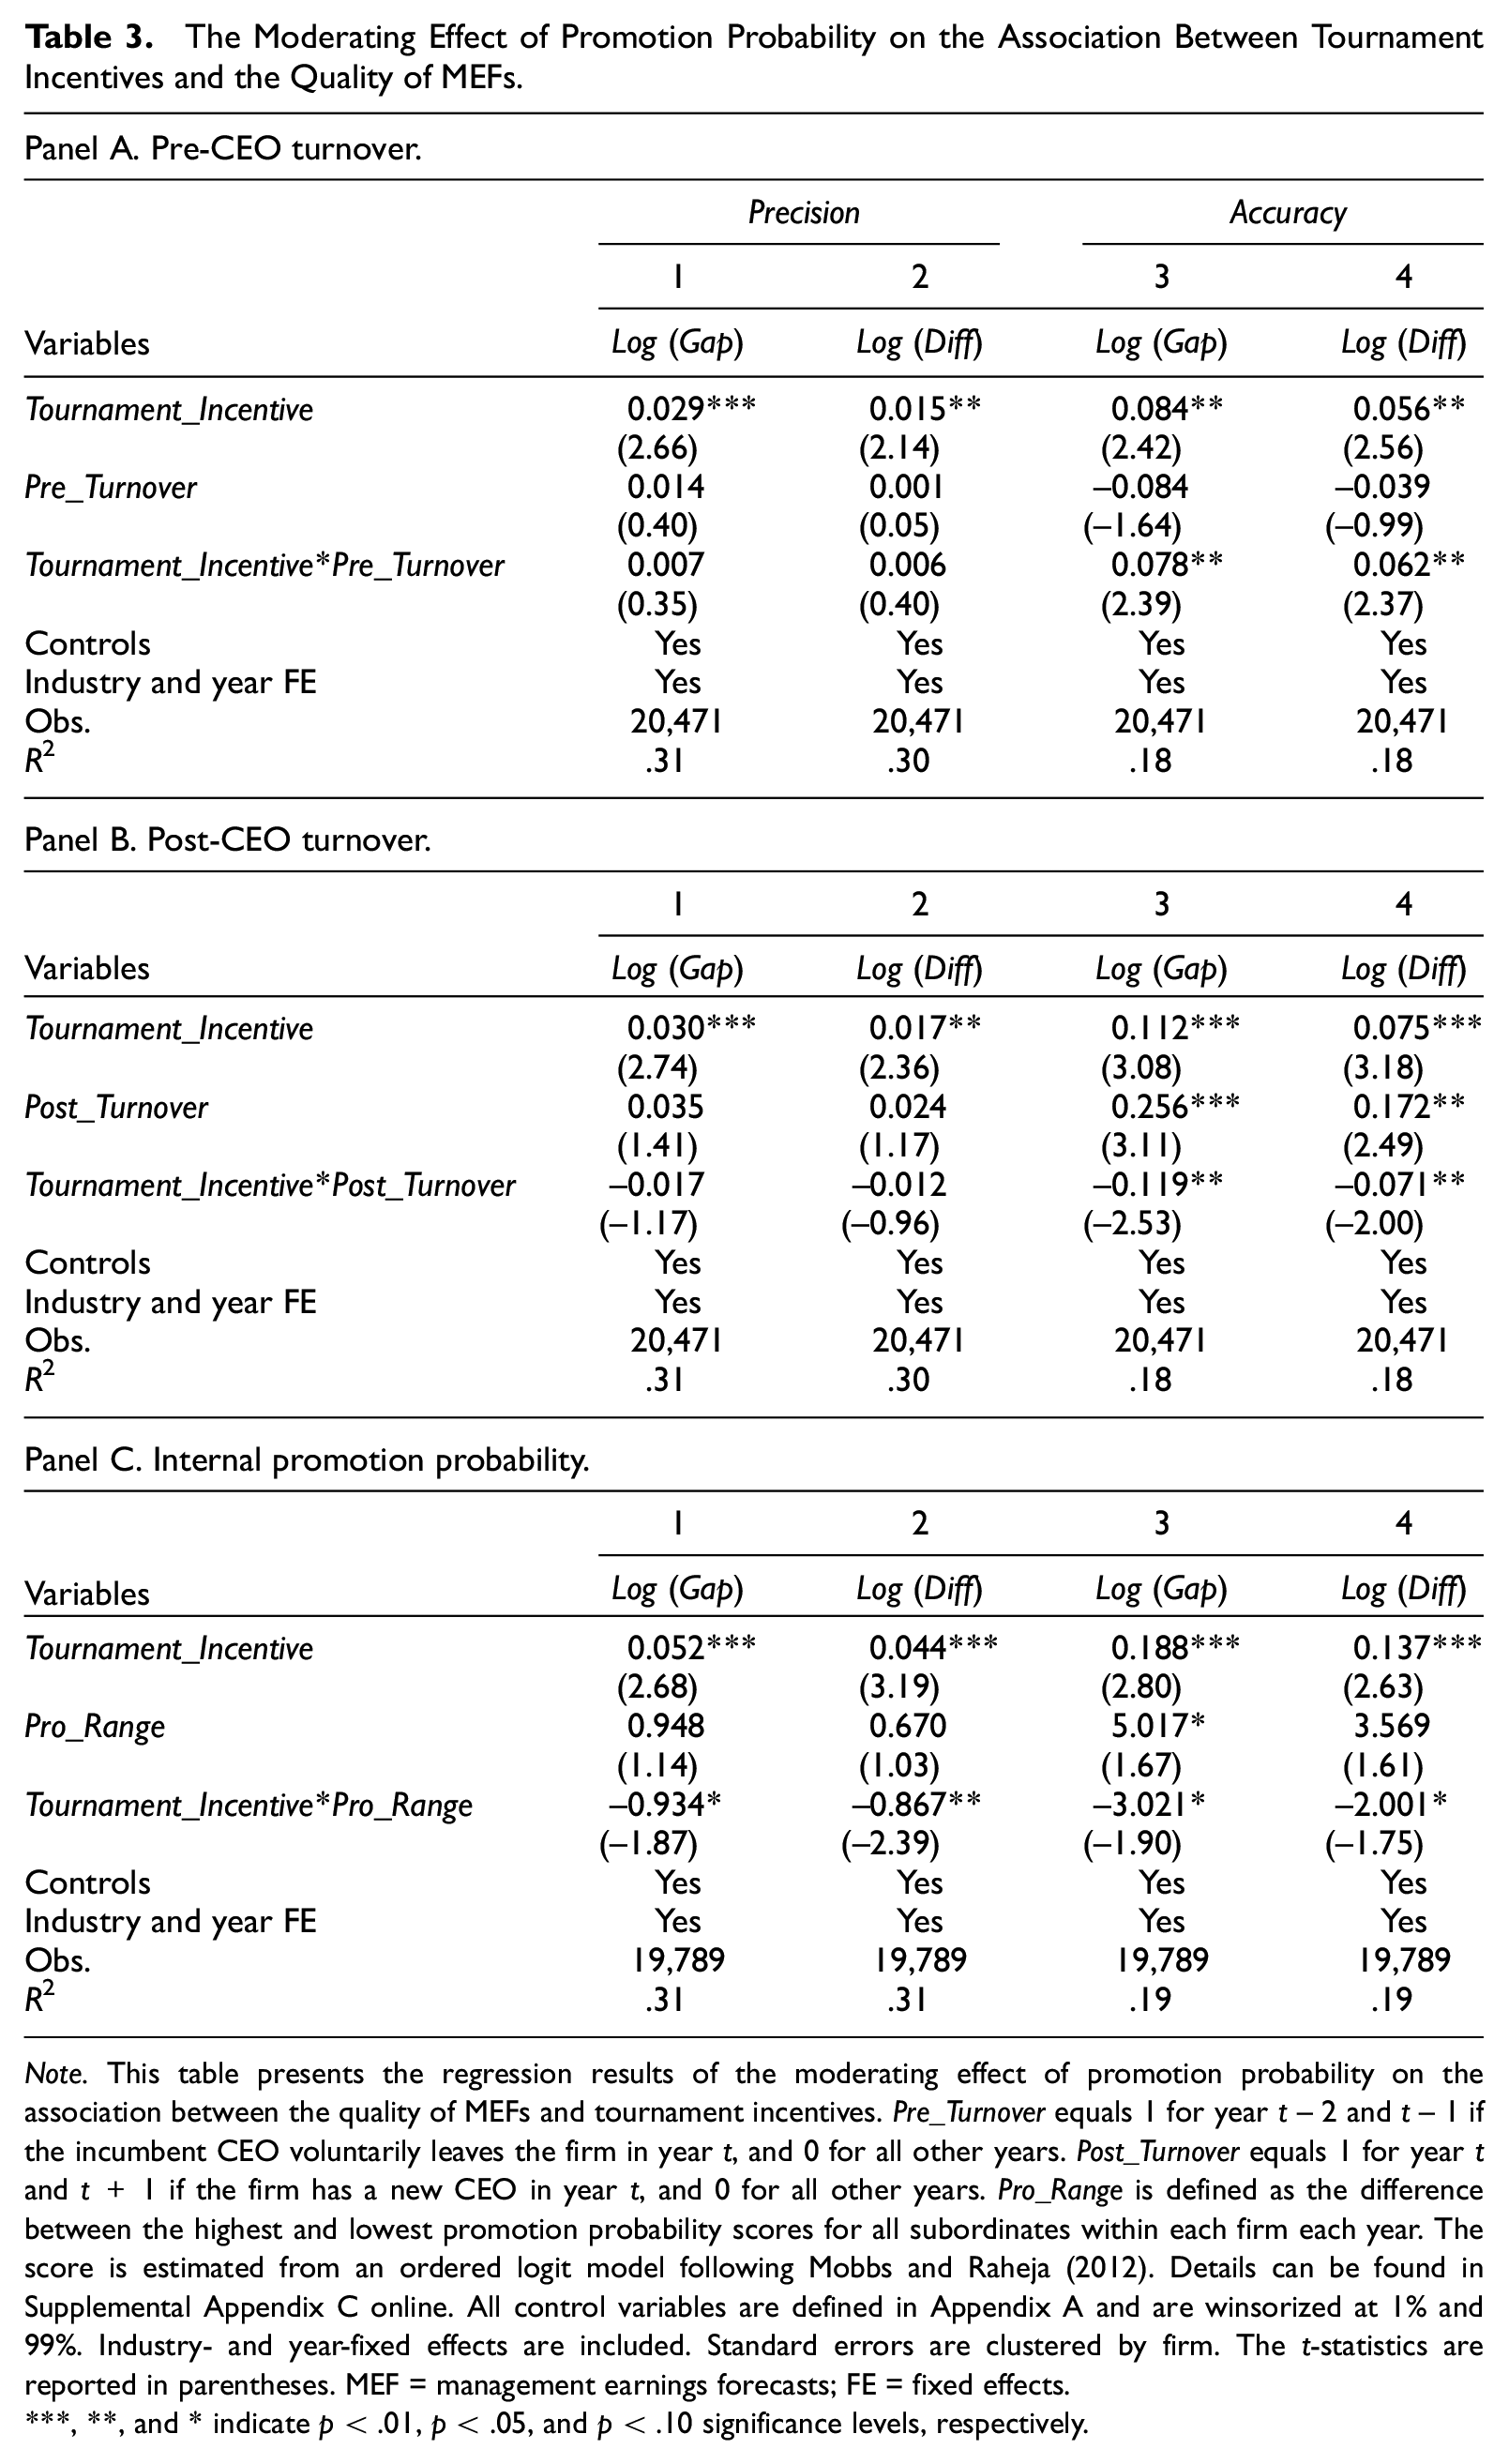
Note. This table presents the regression results of the moderating effect of promotion probability on the association between the quality of MEFs and tournament incentives. Pre_Turnover equals 1 for year t− 2 and t− 1 if the incumbent CEO voluntarily leaves the firm in year t, and 0 for all other years. Post_Turnover equals 1 for year t and t+ 1 if the firm has a new CEO in year t, and 0 for all other years. Pro_Range is defined as the difference between the highest and lowest promotion probability scores for all subordinates within each firm each year. The score is estimated from an ordered logit model following Mobbs and Raheja (2012). Details can be found in Supplemental Appendix C online. All control variables are defined in Appendix A and are winsorized at 1% and 99%. Industry- and year-fixed effects are included. Standard errors are clustered by firm. The t-statistics are reported in parentheses. MEF = management earnings forecasts; FE = fixed effects.
, **, and * indicate p < .01, p < .05, and p < .10 significance levels, respectively.
In Panel A, we only find significant results in the accuracy tests. The estimate of the coefficient on the interaction term Tournament_Incentive*Pre_Turnover is 0.078 (p < .05) for Log(Gap) in Column 3 and 0.062 (p < .05) for Log(Diff) in Column 4. These findings suggest that the positive effect of tournament incentives on the accuracy of MEFs becomes more pronounced as the perceived probability of promotion increases during the periods shortly before CEO turnovers.
Similarly, in Panel B, we find significant results only for the accuracy tests in Columns 3 and 4. The estimated coefficient of Tournament_Incentive*Post_Turnover is −0.119 (p < .05) for Log(Gap) and −0.071 (p < .05) for Log(Diff). Although the coefficients of the interaction terms are not significant for the precision tests, the negative signs of these coefficients are as expected. These findings suggest that the positive association between tournament incentives and the quality of MEFs is weakened following CEO turnovers.
Moreover, in Panel C, the estimated coefficients of Tournament_Incentive*Pro_Range are negative and statistically significant, β = −.934, p < .10 using Log(Gap); β = −.867, p < .05 using Log(Diff), for precision tests, as shown in Columns 1 and 2. In Columns 3 and 4, the estimates of the coefficients on the interaction terms are also negative and statistically significant, β = −3.021, p < .10 using Log(Gap); β = −2.001, p < .10 using Log(Diff), for the accuracy tests, suggesting that the positive tournament effect on the quality of MEFs is weakened by the low perceived probability of internal promotion.
These results support H2 that the association between tournament incentives and the quality of MEFs, proxied by the precision and accuracy of MEFs, is moderated by the perceived probability of promotion.
Tournament Incentives and Supplementary Forecasts
Taking a closer look at our sample, we find that there are 4,494 (41.16%) firm-year observations associated with at least one sales forecast and 5,496 (52.99%) firm-year observations associated with at least one capital expenditure forecast. In total, more than 85.23% of firms have issued at least one supplementary forecast from 2002 to 2015. This number motivates us to further explore the possible economic links between tournament incentives and these supplementary forecasts. In this study, we focus on two popular supplementary forecasts, that is, sales and capital expenditure forecasts, which are often discussed in prior literature (Ali et al., 2020; Keung, 2010).
TMT Tournament Incentives and the Issuance of Supplementary Forecasts
As documented in prior literature, managers provide detailed forecasts to enhance the credibility of their MEFs (Hirst et al., 2007; Keung, 2010; Merkley et al., 2013). This enhanced credibility of MEFs may improve a manager’s reputation for issuing accurate forecasts, increasing the likelihood of being promoted, or decreasing the likelihood of being replaced (Cao et al., 2017; Feng et al., 2009; Graham et al., 2005; Lee et al., 2012). Therefore, within firms with higher tournament incentives, managers are more likely to issue supplementary forecasts to retain their seats and earn credit for future promotions.
We regress the issuance of supplementary forecasts on tournament incentives using a probit model. 15 Table 4 reports the results. Panel A shows that the estimates of the coefficients on Tournament_Incentive are 0.061 (p < .05) using Log(Gap) and 0.041 (p < .05) using Log(Diff) for sales forecasts and 0.039 (p < .05) using Log(Gap) and 0.041 (p < .05) using Log(Diff) for capital expenditure forecasts, which indicates that firms with higher tournament incentives are more likely to issue supplementary sales and capital expenditure forecasts. 16 This finding also implies that, in addition to the CEO, other chief executives who are affected by tournament incentives may contribute to the preparation of management forecasts.
TMT Tournament Incentives and Supplementary Forecasts.
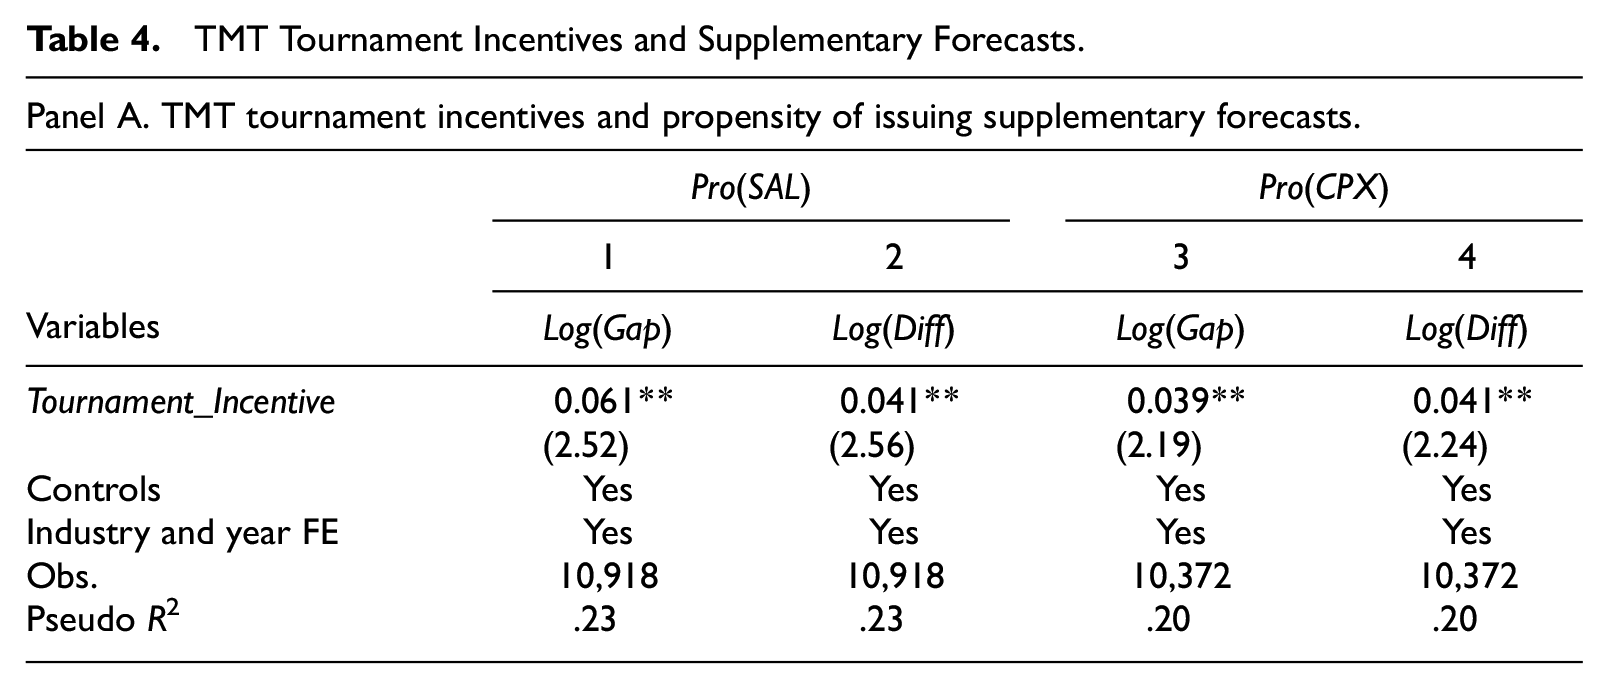
Note. This table presents results from regressions of the issuance and quality of supplementary forecasts on TMT level tournament incentives. Panel A shows the results from regressions of the propensity of issuing supplementary forecasts on TMT tournament incentives. Specifically, we have 10,918 firm-year observations associated with at least one sales forecast and 10,372 firm-year observations with at least one capital expenditure forecast. Panel B shows the results from regressions of the quality of supplementary forecasts on TMT tournament incentives. The observations are larger than those in Panel A because a firm may issue multiple forecasts in a given year. Panel C shows the results from regressions of the quality of supplementary forecasts on TMT tournament incentive in subsamples split by the direction of the forecast earnings news. Pro(SAL) is an indicator variable that equals 1 if the firm issues at least one sales forecast during the year, and 0 otherwise. Pro(CPX) is an indicator variable that equals 1 if the firm issues at least one capital expenditure forecast during the year, and 0 otherwise. Precision is measured as the difference between the range sales/capital expenditure forecast’s upper and lower bounds, deflated by the beginning stock price, and multiplied by 100 (Precision is zero for point forecasts). Accuracy is measured as the absolute difference between the forecast sales/capital expenditure and the actual reported numbers, deflated by beginning stock price, and multiplied by 100. If the forecast is a range forecast, the midpoint is treated as the forecast value. Both Precision and Accuracy are multiplied by −1 to be positively correlated with the quality of management forecasts. Tournament_Incentive refers to either Log(Gap) or Log(Diff). Log(Gap) is the natural logarithm of the difference between the CEO’s total compensation (EXECUCOMP data item TDC1) and the median of VPs’ compensation. Log(Diff) is the natural logarithm of the compensation gap between CEO and highest-paid VP. All control variables are defined in Appendix A and are winsorized at 1% and 99%. Industry- and year-fixed effects are included. Standard errors are clustered by firm. The t-statistics are reported in parentheses. TMT = top management team.
, **, and * indicate p < .01, p < .05, and p < .10 significance levels, respectively.
TMT Tournament Incentives and the Quality of Supplementary Forecasts
Besides examining the tournament’s effect on the issuance of supplementary forecasts, we also examine how team tournament incentives influence the quality of these forecasts. Supplementary forecasts for specific income statement line items always contain incremental information and are commonly used to explain earnings targets or increase the credibility of earnings forecasts (Han & Wild, 1991; Merkley et al., 2013). For example, firms with high market power are inclined to issue more sales forecasts to inform the market of their high-rank position in the industry. (Acito et al., 2021). In addition, capital expenditure forecasts are used by managers to elicit market feedback and make future adjustments (Jayaraman & Shuang Wu, 2020). Given the secondary importance of supplementary forecasts, few studies discuss the quality of supplementary forecasts themselves. In general, the quality of supplementary forecasts is lower compared to MEFs (C. X. Chen et al., 2008). A more accurate supplementary forecast may leave hints about errors in the earnings forecast. Thus, we expect that top executives are less likely to be motivated by tournament incentives to improve the quality of supplementary forecasts because the benefits from doing so may not compensate for the potential costs.
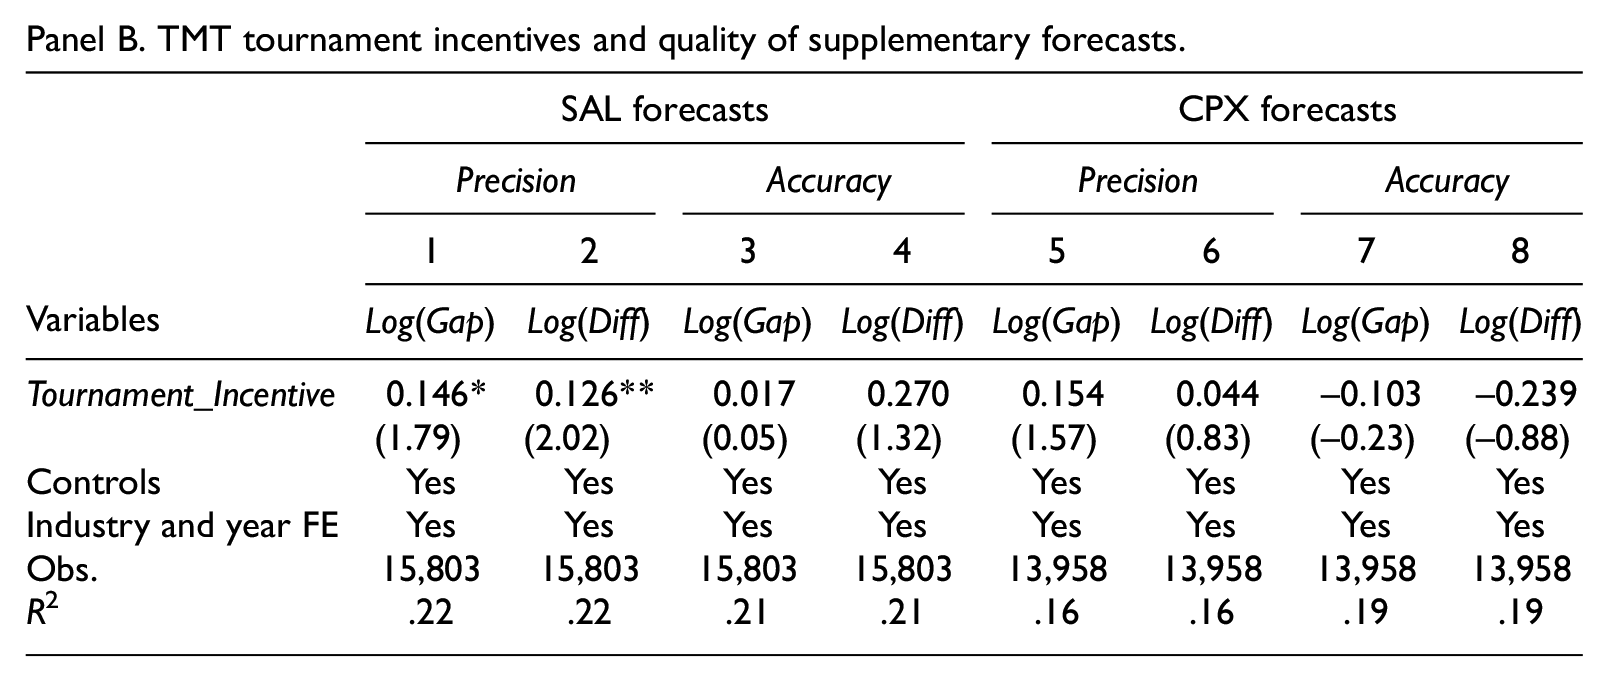
By regressing the quality of sales and capital expenditure forecasts (i.e., precision and accuracy) 17 on TMT tournament incentives, we find that the estimates of the coefficients on Tournament_Incentive are positive and statistically significant (β = .146, p < .10 using Log[Gap]; β = .126, p < .05 using Log[Diff]) only for the sales forecast precision tests in Columns 1 and 2, as reported in Panel B of Table 4. In the other models, we find no significant results, indicating that the team tournament effects may not affect the accuracy of supplementary forecasts.
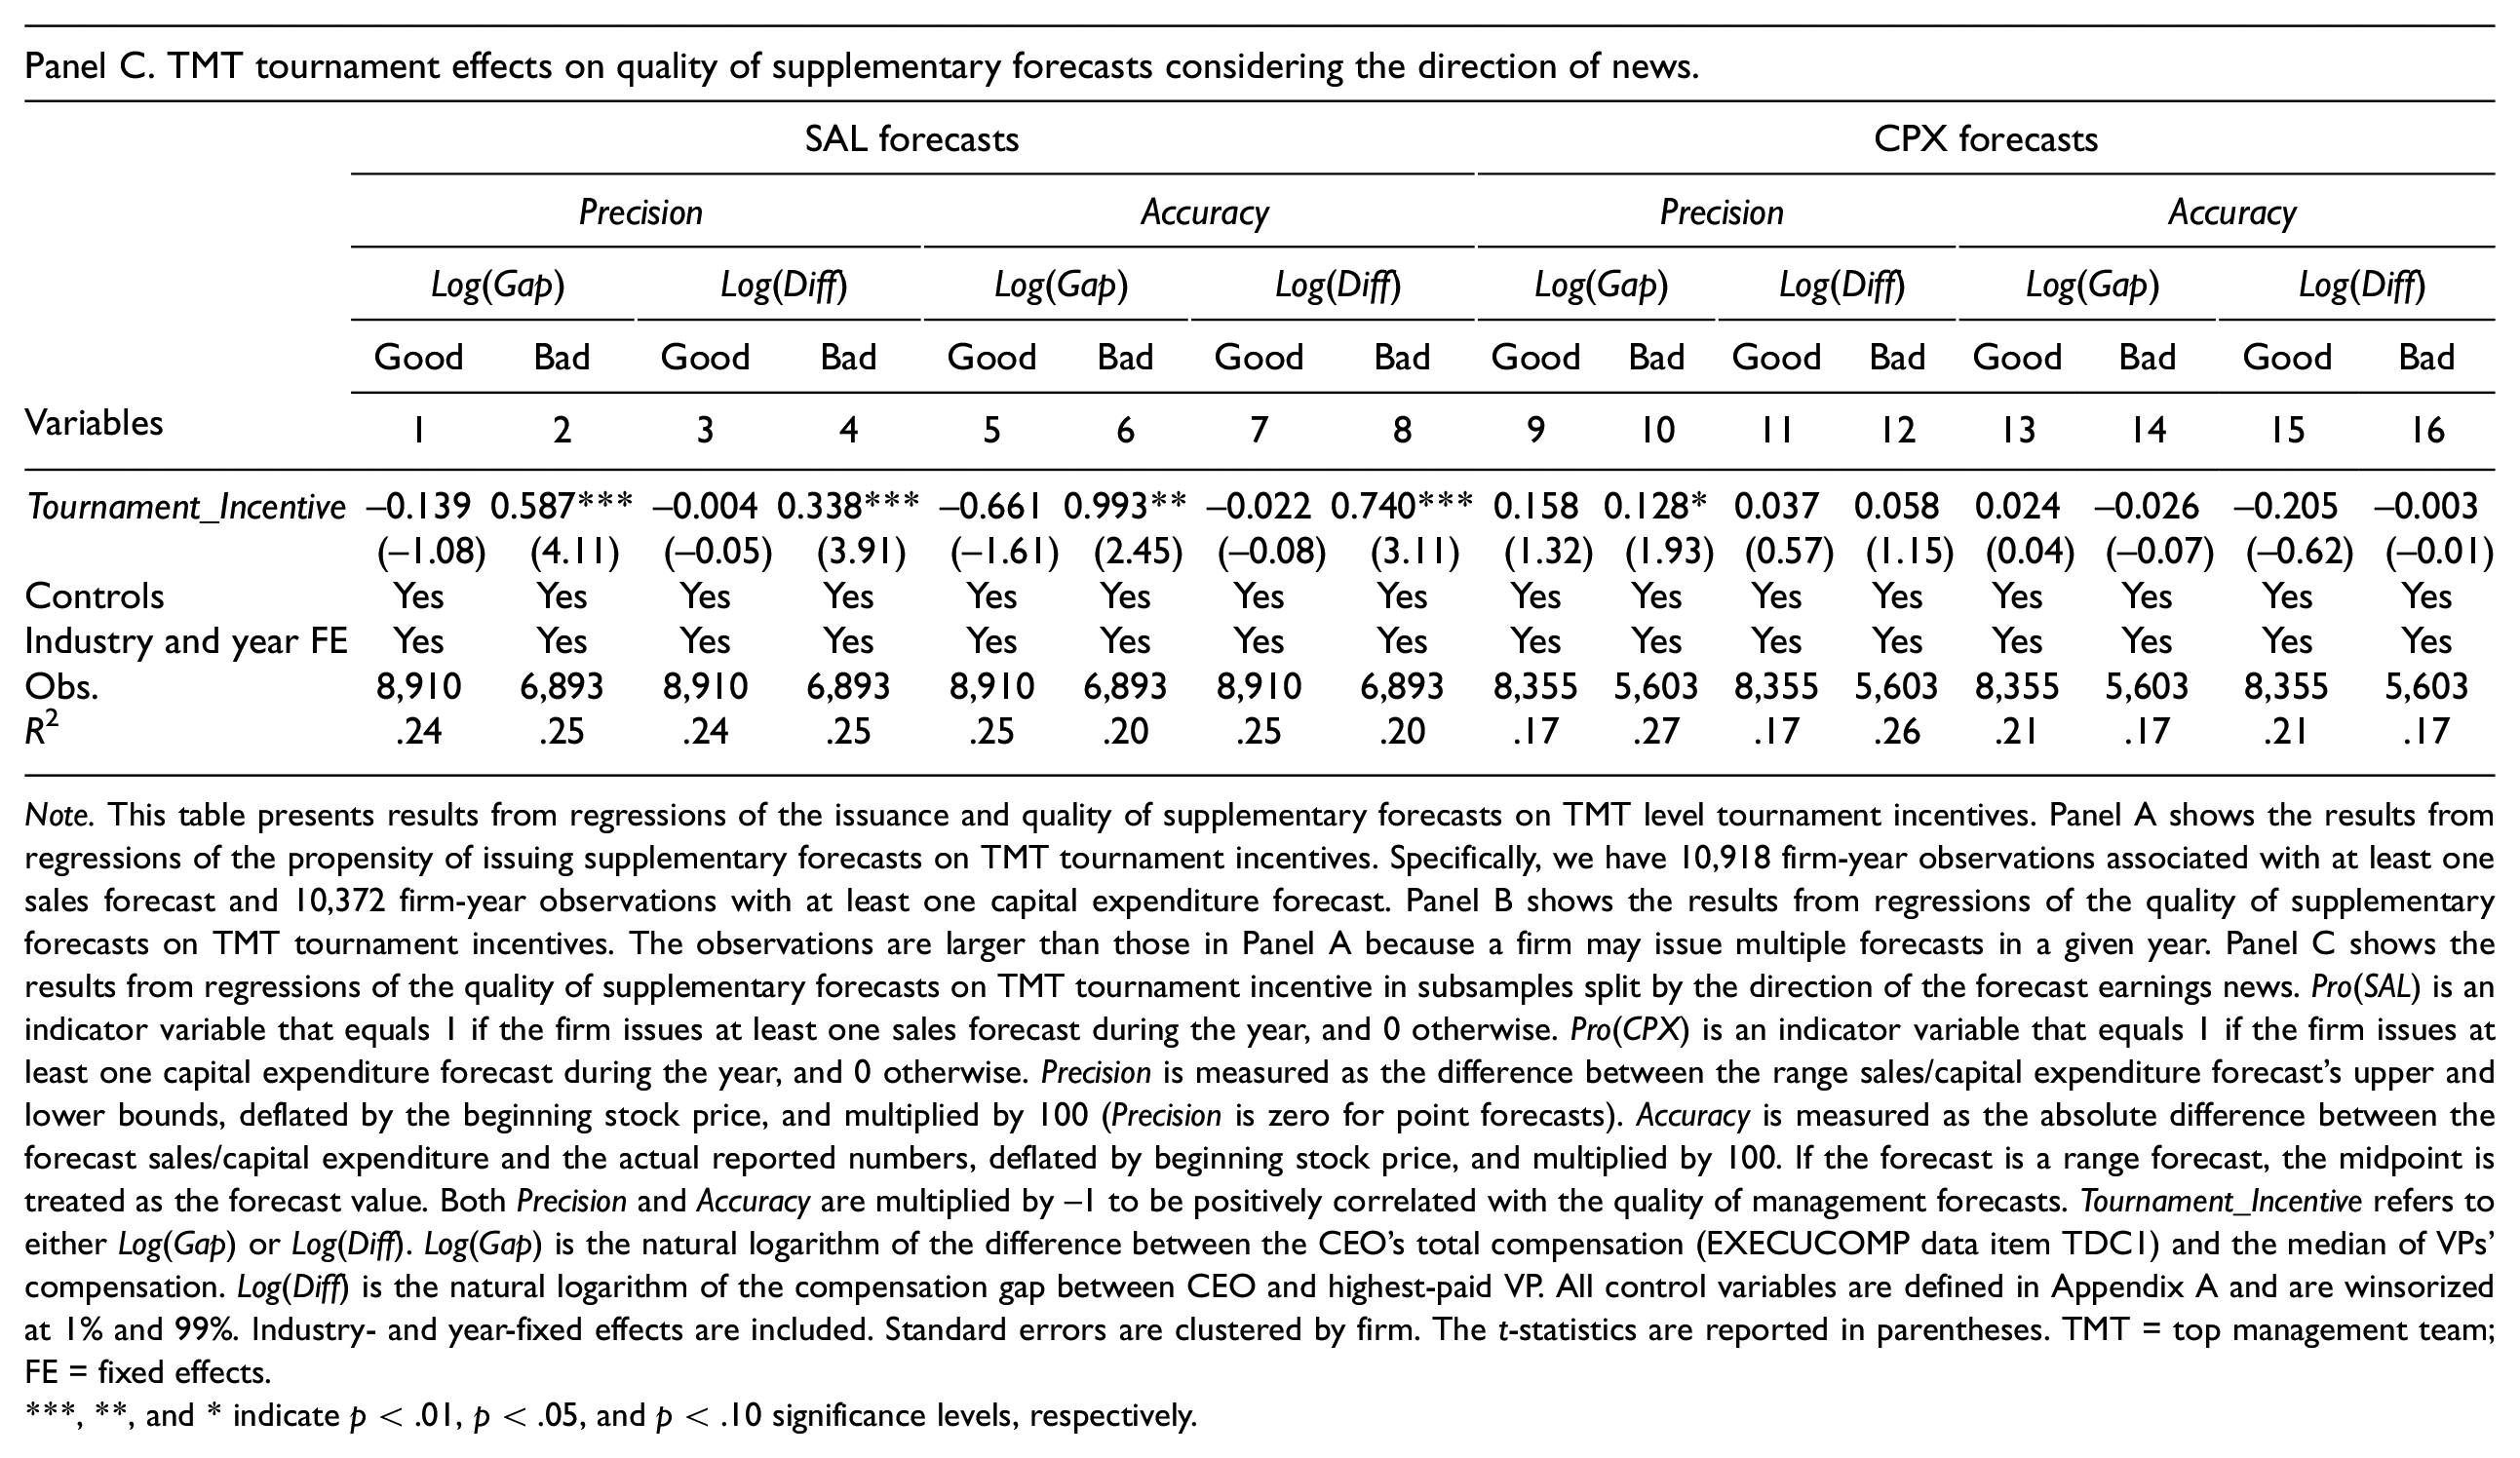
This weak relationship between TMT tournament incentives and the quality of supplementary forecasts can be further explained by the direction of earnings news (good vs. bad news). The asymmetry in the market’s response to good versus bad news may update managers’ beliefs about the benefits of controlling the quality of supplementary forecasts. The stronger market reaction increases market attention on supplementary forecasts. Thus, we expect that the fear of losing the tournament prize may incentivize managers to care more about the quality of supplementary forecasts when the news is bad. To support this prediction, we split the sample based on the direction of earnings news. 18 In particular, the observations between good and bad news are balanced for the precision and accuracy tests. Panel C shows that the estimates of the coefficients on Tournament_Incentive are positive and significant only in the bad news subgroup, β = .587, p < .01 using Log(Gap); β = .338, p < .01 using Log(Diff), for sales forecast precision tests in Columns 1 to 4. In Columns 5 to 8, similar results are found for sales forecasts accuracy tests, β = .993, p < .05 using Log(Gap); β = .740, p < .01 using Log(Diff). However, in analyses for capital expenditure forecasts, a significant result (β = .128, p < .10) is only found for Log(Gap) in Column 10.
Taken together, these results show that top executives with higher tournament incentives tend to issue more accurate supplementary forecasts for bad news, implying that the direction of news is a boundary condition in determining the effect of tournament incentives on the quality of supplementary forecasts.
Subordinate Tournament Incentives and Management Forecasts
So far, we have only focused on the tournament effect at the TMT level. However, subordinate managers may be motivated by different levels of tournament incentives based on their separate responsibilities in the firm (Friedman, 2014). Thus, we take a closer look at the tournament incentives for each subordinate manager and examine how specific subordinate incentives affect the propensity to issue management forecasts and their quality. 19 To be consistent, we measure the tournament incentives for each subordinate by calculating the pay gaps between the CEO and each type of subordinate with separate responsibilities for firm operations. 20
CFOs, who are typically responsible for planning and controlling forecasts, are the driving force in preparing management forecasts (Biggerstaff et al., 2021; Hribar & Yang, 2016; Hui & Matsunaga, 2015). Apparently, the issuance and quality of management forecasts are the major key performance indicators (KPIs) in evaluating CFOs’ performance. Motivated by the CEO-CFO tournament incentives, CFOs are more likely to issue specific and detailed forecasts with high quality. Since CFOs have the most discretion in preparing forecasts, and CEOs will make the final decisions (Hribar & Yang, 2016), CMOs are less likely to influence the issuance of management forecasts. However, CMOs may improve the quality of management forecasts by providing more accurate sales estimates (Koo & Lee, 2018) and information vital to making accurate management forecasts (Nath & Mahajan, 2008). Therefore, the CEO-CMO tournament incentives may motivate CMOs to exert a positive influence on the quality of management forecasts. Based on their responsibilities, COOs are typically evaluated on their ability to manage operations (Zhang, 2006). Instead of focusing on short-term management forecasts, COOs are more concerned with long-term operational performance. Although the presence of COOs may reduce their firms’ likelihood of real earning management (Cassell et al., 2019), they are less likely to be motivated by the tournament effects and to put additional effort into the issuance or quality of management forecasts. Therefore, it is plausible to expect the CEO-COO tournament incentives to have no effect on the issuance or the quality of management forecasts.
We construct measures for Subordinate_Tournament_Incentive by taking the natural logarithm of the pay gap between the CEO and CFO (CMO; COO). A probit model 21 is used to check subordinate tournament effects on the issuance of earnings and supplementary forecasts. Table 5 reports the results. Panel A shows that the estimates of the coefficients on Subordinate_Tournament_Incentive are positive and statistically significant for CFOs in all types of forecasts tests (β = .092, p < .01 for EPS forecasts; β = .061, p < .05 for sales forecasts; and β = .050, p < .10 for capital expenditure forecasts), as presented in Columns 1, 4, and 7, suggesting that CFOs are likely to be motivated by the tournament incentives to issue more earnings, sales, and capital expenditure forecasts.
Subordinate Tournament Incentives and Management Forecasts.
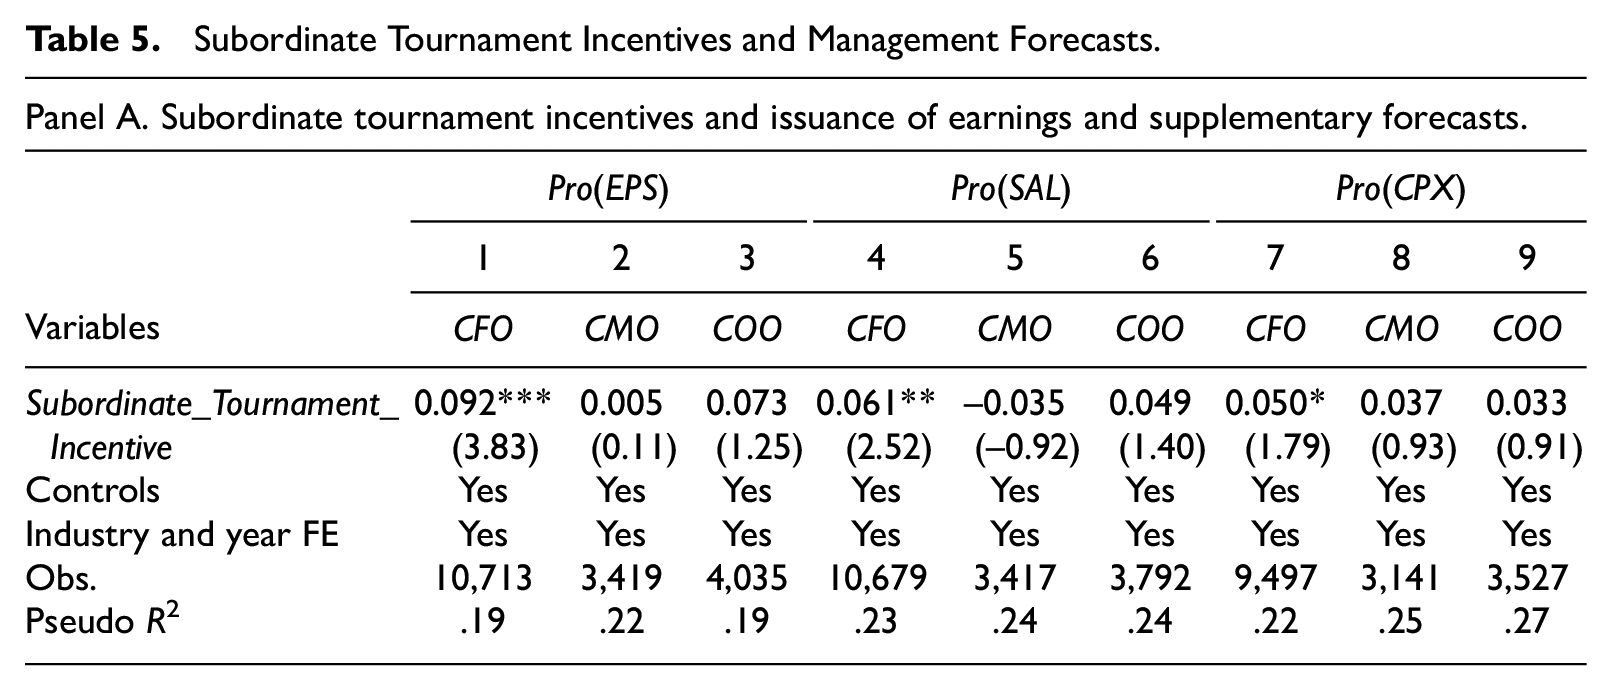
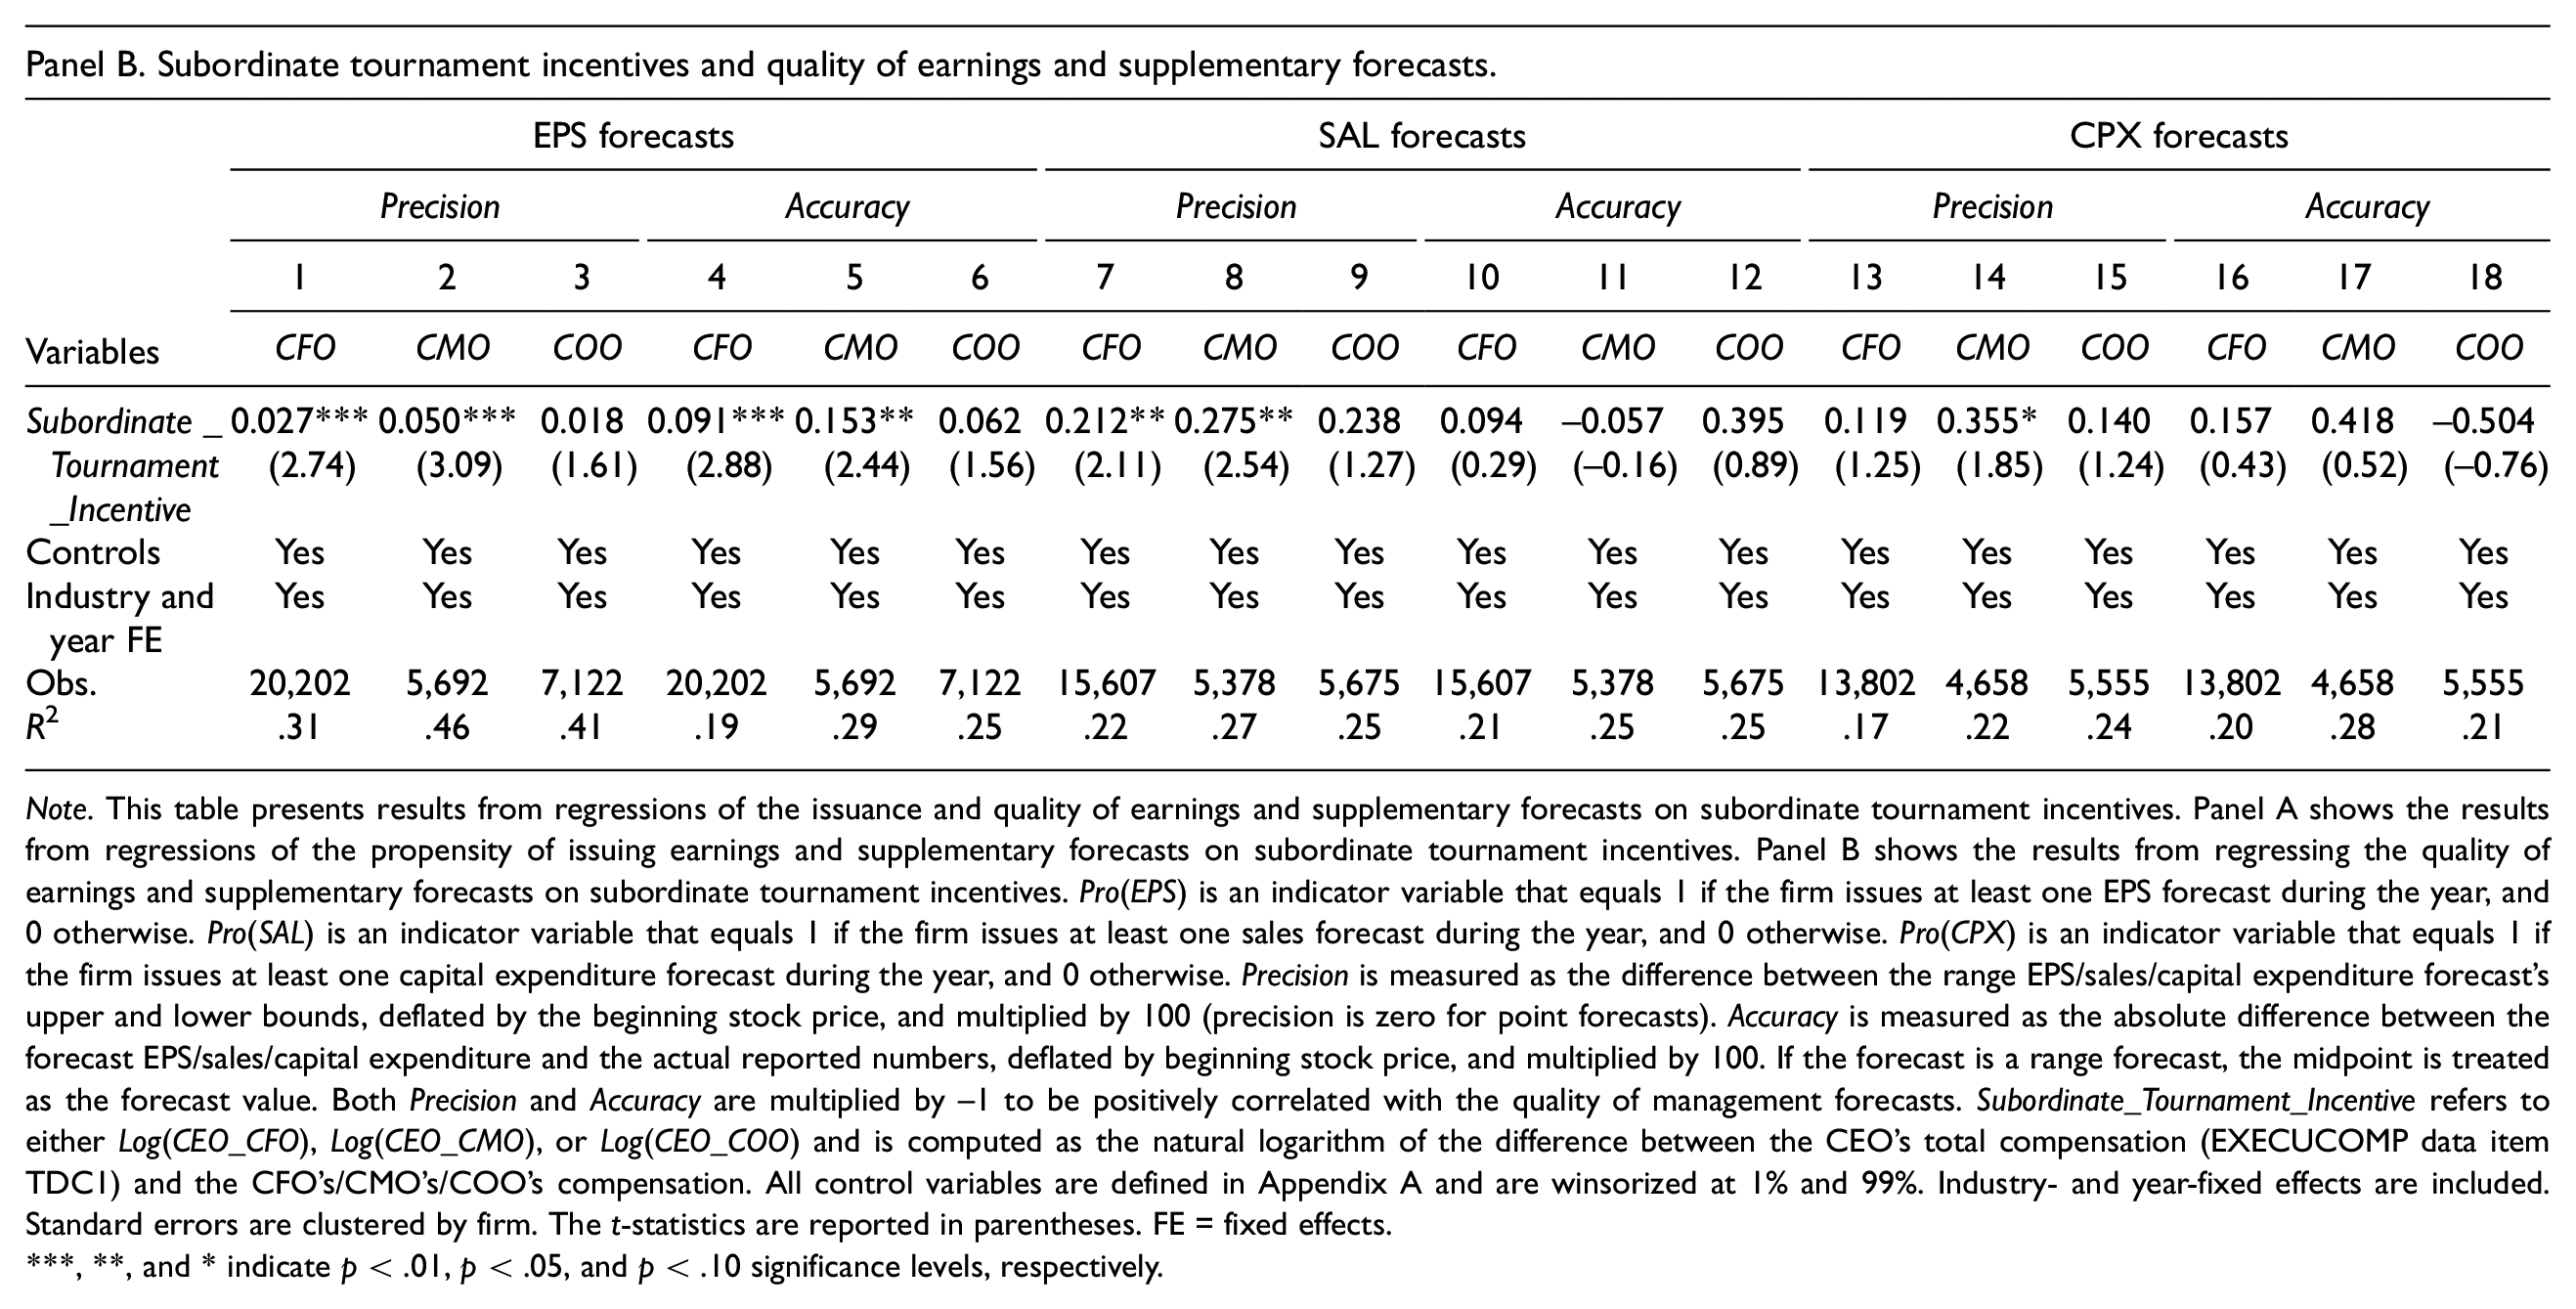
Note. This table presents results from regressions of the issuance and quality of earnings and supplementary forecasts on subordinate tournament incentives. Panel A shows the results from regressions of the propensity of issuing earnings and supplementary forecasts on subordinate tournament incentives. Panel B shows the results from regressing the quality of earnings and supplementary forecasts on subordinate tournament incentives. Pro(EPS) is an indicator variable that equals 1 if the firm issues at least one EPS forecast during the year, and 0 otherwise. Pro(SAL) is an indicator variable that equals 1 if the firm issues at least one sales forecast during the year, and 0 otherwise. Pro(CPX) is an indicator variable that equals 1 if the firm issues at least one capital expenditure forecast during the year, and 0 otherwise. Precision is measured as the difference between the range EPS/sales/capital expenditure forecast’s upper and lower bounds, deflated by the beginning stock price, and multiplied by 100 (precision is zero for point forecasts). Accuracy is measured as the absolute difference between the forecast EPS/sales/capital expenditure and the actual reported numbers, deflated by beginning stock price, and multiplied by 100. If the forecast is a range forecast, the midpoint is treated as the forecast value. Both Precision and Accuracy are multiplied by −1 to be positively correlated with the quality of management forecasts. Subordinate_Tournament_Incentive refers to either Log(CEO_CFO), Log(CEO_CMO), or Log(CEO_COO) and is computed as the natural logarithm of the difference between the CEO’s total compensation (EXECUCOMP data item TDC1) and the CFO’s/CMO’s/COO’s compensation. All control variables are defined in Appendix A and are winsorized at 1% and 99%. Industry- and year-fixed effects are included. Standard errors are clustered by firm. The t-statistics are reported in parentheses.
, **, and * indicate p < .01, p < .05, and p < .10 significance levels, respectively.
Next, we examine the effect of subordinate tournament incentives on the quality of earnings and supplementary forecasts. In Panel B, using the quality of earnings forecasts as the dependent variable, the estimates of the coefficients on Subordinate_Tournament_Incentive are 0.027 (p < .01) for CFOs and 0.050 (p < .01) for CMOs in precision tests in Columns 1 and 2, and 0.091 (p < .01) for CFOs and 0.153 (p < .05) for CMOs in accuracy tests in Columns 4 and 5. No significant results are found for COOs. These findings indicate that the subordinate tournament effects for CFOs and CMOs may exert a positive influence on the quality of MEFs.
Finally, using supplementary forecasts quality as the dependent variable, significant results are found only for CFOs and CMOs in the sales forecast precision tests (β = .212, p < .05 for CFOs; β = .275, p < .05 for CMOs), as shown in Columns 7 and 8. No significant results are found for the other models. This finding is not surprising. As discussed in the previous section, the quality of supplementary forecasts receives less attention from the market, and the benefits from improving supplementary forecast quality may be marginal. In addition, capital expenditure supplementary forecasts tend to be persistent, and they are more relevant to debt holders than shareholders because they may signal opportunistic investment activities (Ali et al., 2020). Therefore, additional forecasts on capital expenditures cannot bring many benefits for subordinates to win the tournament prize.
Robustness Checks
CEO-Fixed Effects
Although several CEO characteristics were controlled in the previous regressions, other unobservable CEO characteristics, such as managers’ personalities, management styles, and prior experiences, may also affect their firms’ voluntary disclosure policies (Bamber et al., 2010; Hribar & Yang, 2016). To control for these unobservable factors, we include CEO-fixed effects in a subsample that consists of firms with CEOs who have worked for two or more firms. In our sample, 402 (17.03%) CEOs have worked for at least two firms from 2002 to 2015. Using 4,087 firm-year observations with non-missing data on MEFs, we perform the baseline regression with CEO-fixed effects. In untabulated results, we find that the estimates of the coefficients on Tournament_Incentive are positive and statistically significant in both precision and accuracy tests using Log(Gap) (β = .034, p < .10 in the precision test; β = .043, p < .10 in the accuracy test), supporting that our main results are robust to the inclusion of CEO-fixed effects.
Alternative Tournament Incentives Proxy
To alleviate a concern that subordinate managers may care more about the relative increase in their salaries than the ultimate tournament prize, we use an alternative tournament incentives proxy to re-estimate the main findings. Following Cheng et al. (2016), we use the natural logarithm of the ratio of CEO compensation to the median VP’s compensation −1 to capture the percentage increase in compensation if the VP is promoted. In untabulated results, the estimates of alternative measures for tournament incentives are 0.004 (p < .05) for precision tests and 0.070 (p < .10) for accuracy tests. These results are consistent with the main findings.
Additional Analyses
Investors’ and Analysts’ Reactions
To further validate the main findings, we examine the tournament effects on investors’ and analysts’ reactions to MEFs since the market reactions to MEFs are an ex-post indicator for their credibility (Rogers & Stocken, 2005). If investors and analysts believe that firms with higher tournament incentives tend to issue higher quality MEFs, then their reactions to MEFs issued by firms with higher tournament incentives will be stronger.
We first examine the tournament effects on investor’s reactions. The reaction to MEFs is measured using cumulative abnormal returns (CAR) and abnormal trading volume (AbnVol) around the disclosure date of the MEF (Ng et al., 2013). 22 News captures the forecast news content, defined as the difference between management’s forecast EPS and the median analyst consensus forecast before the management forecast, deflated by beginning stock price and multiplied by 100. The interaction term Tournament_Incentive*News evaluates how investors react to the news contained in MEFs issued by firms with higher tournament incentives. After controlling for other factors 23 that may affect investors’ reactions, untabulated results show that the estimates of the coefficients on the interaction term Tournament_Incentive*News are positive and statistically significant for both tournament measures, β = .002, p < .10 for Log(Gap); β = .002, p < .05 for Log(Diff), using CAR as the dependent variable. Moreover, similar results are found for the AbnVol. Because the AbnVol is associated with the informativeness of news instead of the direction of news, the absolute value of the variable AbsNews is used to capture the informativeness of news. The estimates of the coefficients on the interaction term Tournament_Incentive*AbsNews are both positive and statistically significant, β = .082, p < .01 for Log(Gap); β = .051, p < .05 for Log(Diff). Overall, these findings provide strong evidence that investors tend to have stronger reactions to MEFs that are issued by firms with higher tournament incentives.
Next, we examine how analysts assess the quality of MEFs issued by firms with different levels of tournament incentives. We expect that analysts are more likely to revise their forecasts or revise their forecasts in a more timely way (a shorter window between the forecast revision date and the issuance date of the MEF) if the forecasts are issued by firms with higher tournament incentives because analysts believe these MEFs to be more informative. 24 Following Kross and Suk (2012), we develop two measures: Fraction and Log(Days). 25 Untabulated results show that analysts are more likely to revise their forecasts for firms with higher tournament incentives right after they have access to MEFs, β = .010, p < .10 for Log(Gap)*AbsNews; β = .007, p < .05 for Log(Diff)*AbsNews. In addition, analysts are inclined to make more timely revisions for firms with higher tournament incentives, β = −.041, p < .10 for Log(Gap)*AbsNews; β = −.040, p < .05 for Log(Diff)*AbsNews. These results suggest that investors and analysts can see through the value of tournament incentives in their assessment of the quality of MEFs.
Conclusion
Using a sample from 2002 to 2015, this paper examines how competitive rank-order tournament incentives influence the quality of MEFs. The results show that MEFs issued by firms with stronger tournament incentives have higher quality MEFs. However, the positive association between the quality of MEFs and tournament incentives is weakened by a low perceived probability of promotion within the firm. These findings are robust to using different tournament measures and controlling for other known determinants of the characteristics of MEFs.
Motivated by the fact that many firms issue supplementary forecasts, we perform a series of analyses to investigate how tournament incentives influence the issuance and quality of supplementary forecasts. We find that managers with higher tournament incentives tend to issue more supplementary sales and capital expenditure forecasts to gain career benefits but are not interested in improving the quality of supplementary forecasts. Through a closer look at the tournament incentives for each subordinate manager, we find strong CFO tournament effects on the issuance and quality of management forecasts and CMO influence on the quality of management forecasts.
In additional analyses, we examine the tournament effects on the investors’ and analysts’ responses to MEFs. Results show that information users believe that MEFs provided by firms with higher tournament incentives are more informative, so they have stronger reactions to those MEFs.
This paper validates the tournament theory in explaining the influence of large pay gaps among top executives on the quality of MEFs and explains how other chief executives may help in the preparation of MEFs. This paper also responds to the debate on “overpaid” CEOs by pointing out the benefits of rank-order compensation contracting in improving voluntary disclosure quality and reducing information asymmetries. In addition, it opens avenues for future research to introduce TMT-related theory to the MEF literature and to advance the understanding of the MEF preparation process.
Supplemental Material
sj-docx-1-jaf-10.1177_0148558X211055883 – Supplemental material for Impact of Tournament Incentives on Management Earnings Forecasts
Supplemental material, sj-docx-1-jaf-10.1177_0148558X211055883 for Impact of Tournament Incentives on Management Earnings Forecasts by Xin Cheng, Dan Palmon, Yinan Yang and Cheng Yin in Journal of Accounting, Auditing & Finance
Footnotes
Appendix A
Appendix B
Acknowledgements
The authors thank Ann Medinets and the anonymous reviewer for their valuable comments.
Declaration of Conflicting Interests
The author(s) declared no potential conflicts of interest with respect to the research, authorship, and/or publication of this article.
Funding
The author(s) received no financial support for the research, authorship, and/or publication of this article.
Supplemental Material
Supplemental material for this article is available online.
Notes
References
Supplementary Material
Please find the following supplemental material available below.
For Open Access articles published under a Creative Commons License, all supplemental material carries the same license as the article it is associated with.
For non-Open Access articles published, all supplemental material carries a non-exclusive license, and permission requests for re-use of supplemental material or any part of supplemental material shall be sent directly to the copyright owner as specified in the copyright notice associated with the article.