
Abstract
Tax haven leaks have attracted negative public attention in recent years, prompting scrutiny of corporate behavior in leaked jurisdictions. We investigate whether U.S. companies with subsidiaries in implicated tax havens change their disclosure behavior after a leak. The Offshore Leaks, Panama Papers, Bahamas Leaks, and Paradise Papers are included in this study. We analyze the leaks as separate exogenous shocks to the affected firms’ behavior using a difference-in-differences approach. First, we focus on the readability of tax footnotes in annual reports. Our results suggest that tax footnotes are less readable after a firm’s tax haven is implicated in a leak. This finding suggests that implicated firms try to obfuscate information and hide unethical conduct. Second, we investigate firms’ disclosures of tax expenses using GAAP effective tax rates and find that companies report higher tax expenses after a leak. These changes in behavior could indicate that firms are concerned about the increasingly critical public attitude toward doing business in leaked low-tax jurisdictions and that they are taking measures to counteract possible negative reputational consequences.
Introduction
Several tax haven leaks have attracted attention in recent years. The Offshore Leaks were published in June 2013, followed by the Luxembourg Leaks in November 2014, and the Swiss Leaks in February 2015. The media coverage of tax havens further expanded when the Panama Papers were leaked in April 2016 and the Bahamas Leaks became public that September. The publication of the Paradise Papers once again prompted public discussion in November 2017. The affected jurisdictions have been critically monitored by the media ever since. Many critical reports have stimulated debates about tax avoidance. The media has also questioned whether these strategies are illegal or legitimate. We investigate whether public attention following a tax haven leak changes firm behavior, even if the firms are not explicitly named in a leak. More specifically, we explore whether firms change their tax footnotes and reported tax expenses if they operate in a leaked tax haven.
We examine the leaks from “dot havens,” which are small jurisdictions with small economies, because these are the most likely to be used solely for tax planning purposes (Dyreng et al., 2018). We do not include the Luxembourg and Swiss Leaks in our main analysis because of the high possibility that subsidiaries in these countries are also used for economic value creation. We thus focus on the Offshore Leaks (2013), the Panama Papers and the Bahamas Leaks (both 2016), and the Paradise Papers (2017). We analyze the leaks as separate exogenous shocks to the affected firms’ behavior using the difference-in-differences method. We aim to detect potential consequences of the leaks by investigating whether firms change their behavior after a tax haven in which they have a presence is put in the spotlight.
In the first part of the article, we focus on the readability of the firms’ tax footnotes in their annual reports. Through textual analysis, we find that firms provide less readable tax footnotes after a country in which they operate is named in a leak. In the second part, we investigate reported tax expenses and find that firms report higher GAAP effective tax rates (ETRs) after being affected by a leak. In contrast to the disclosure of higher GAAP ETRs, there is no real change in cash ETRs. This changed disclosure behavior could suggest that managers take precautionary actions in response to the increased scrutiny on their tax haven subsidiaries without changing their cash taxes. Firms may respond more strongly if they are repeatedly affected by leaks because this could intensify reputational concerns and external scrutiny. Accordingly, prior leaks could increase the power of subsequent tests. In additional analyses, we indeed find stronger reactions.
We contribute to the existing literature in four areas. First, we analyze the potential consequences of tax haven leaks in relation to the readability of tax footnotes and GAAP ETRs. The importance of this topic is indicated by the fines and back tax payments of $1.2 billion that were collected to date as a result of the Panama Papers (International Consortium of Investigative Journalists [ICIJ], 2019). To the best of our knowledge, the empirical literature dealing with tax haven leaks is very limited, especially concerning textual attributes. Two studies investigate the Luxembourg Leaks. Nesbitt et al. (2017) analyze stock prices after a firm’s exposure in the Luxembourg Leaks and find positive reactions by the investors. Huesecken et al. (2018) find that firms had positive abnormal returns after being named in the Luxembourg Leaks. However, in contrast to our study, these authors focus on firm value and capital market reactions. Furthermore, the Luxembourg Leaks deal with advance tax rulings that provide tax certainty, which is not the case for the leaks we investigate. Our study is closer to that of O’Donovan et al. (2019), who find lower sales and less tax avoidance after the Panama Papers were published. However, O’Donovan et al. (2019) do not consider tax footnote readability. Moreover, we aim to provide a more comprehensive picture by examining several leaks.
Second, we contribute to the research area of textual analysis. By extracting data from Exhibit-21 included in the 10-K annual reports, we create a dynamic, year-specific list of the firms’ tax haven subsidiaries. The list extends Dyreng’s database, which only covers certain years (first used and explained by Dyreng & Lindsey, 2009). Moreover, we provide additional evidence on using tax footnotes as a basis for tax-related research. Because most prior studies use full 10-K financial statements (e.g., Law & Mills, 2015), our research is closer to the study by Inger et al. (2018), who assess the relationship between tax footnote readability and tax avoidance, documenting that tax footnotes exhibit unique textual attributes.
Third, a few studies document mixed evidence concerning the usage of financial report readability as a strategic instrument for communicating with stakeholders. Beuselinck et al. (2018) find higher readability after Internal Revenue Service (IRS) attention has increased. On the other hand, Li (2008) suggests that managers might opportunistically choose the level of readability and obfuscate information to hide certain content. Accordingly, less readable tax footnotes could be intended to divert readers’ attention from operations in critical tax havens. We contribute to this stream of literature by investigating readability in the context of tax haven leaks. This is important because tax havens are often linked to secrecy.
Fourth, we indirectly provide indications of underlying reputational concerns if firms respond to the leaks and the corresponding media coverage. Thus, we do not approximate reputational costs (a specific dollar amount) but reputational concerns, such as managers’ anxieties about possible reputational costs. Jurisdictions such as Panama and the Bahamas are associated with tax avoidance or, worse, evasion. Firms that own subsidiaries in these states might be under greater general suspicion due to the increased negative media coverage. Prior literature presents mixed evidence related to reputational concerns. Some studies suggest that reputational costs are a factor that limits tax avoidance (e.g., Graham et al., 2014; Hanlon & Slemrod, 2009). Companies seem to attach importance to being viewed as good corporate citizens paying their fair share of taxes (e.g., Graham et al., 2014). Dyreng et al. (2016) investigate how U.K. firms react to public accusations of noncompliant subsidiary disclosures by an activist group. The study shows that public scrutiny is associated with greater subsidiary disclosures, less tax avoidance, and fewer operations in tax havens. In contrast to the study by Dyreng et al. (2016) that investigates noncompliance, we focus on tax avoidance via tax havens in general, which does not necessarily represent misconduct by the firms. Moreover, the firms in our sample are not specifically confronted with negative media attention but only operate in a jurisdiction that might be publicly scrutinized. Our focus on disclosures, and particularly on readability, further distinguishes our study from Dyreng et al. (2016).
However, some analyses suggest that tax sheltering is not associated with reputational effects (e.g., Gallemore et al., 2014). Chen et al. (2019) investigate the likelihood of media tax coverage, its negative tone, and its association with tax planning behavior. They do not find changes in tax avoidance behavior after a firm experiences negative media attention. Unlike Chen et al. (2019), we do not study the coverage of specific companies in the media, as we are mainly interested in the impact of tax haven leaks. Wilde and Wilson (2018) show that the association between tax avoidance and reputational costs is not clear yet. In particular, we are not aware of any study analyzing reputational concerns in connection with tax haven leaks using textual analysis.
We reconcile these four research areas by investigating whether a firm that operates a subsidiary in a tax haven changes its disclosure after the respective jurisdiction is subject to a tax haven leak. The article proceeds as follows. In the next section, we provide a theoretical background and develop our hypotheses. We then outline the sample selection process and research design. We present the empirical results in the following section and conclude in the final section.
Theoretical Background
Tax Haven Subsidiaries and Tax Haven Leaks
Multinational firms shift billions of income into tax havens to decrease their taxes. Through the use of transfer pricing and tax-optimizing transactions such as intrafirm debt and royalty payments, firms reduce their tax payments (Desai et al., 2006). Using tax havens can be legal. However, financial statement users are concerned that tax havens enable firms to obfuscate information (Lewellen, 2018). Tax havens are often related to secretive tax planning schemes because these states often lack transparency and information exchange. In particular, small dot havens, which we focus on in this study, rarely serve the purpose of providing a convenient production site and are often largely used for tax planning (Dyreng et al., 2018).
In recent years, several tax haven leaks 1 have become public and have prompted extensive media coverage. As previously mentioned, we concentrate on the Offshore Leaks (2013), the Panama Papers and the Bahamas Leaks (both 2016), and the Paradise Papers (2017). In June 2013, the International Consortium of Investigative Journalists (ICIJ) published the Offshore Leaks. The British Virgin Islands, Cayman Islands, Cook Islands, Hong Kong, Malaysia, Mauritius, Samoa, Seychelles, and Singapore are mentioned. A total of 2.5 million leaked files reveal the tax haven operations of more than 100,000 companies, trusts, and funds (Quinn, 2013). The leaks caused intense political discussions at the 2013 G8 summit and official investigations in many states (Quinn, 2013). In April 2016, the leak of 11.5 million confidential documents from the Panamanian law firm Mossack Fonseca sparked renewed questions about the widespread use of tax havens. The leak mainly revealed data about subsidiaries in the Bahamas, the British Virgin Islands, Panama, and Seychelles. The Panama Papers were leaked to the Süddeutsche Zeitung (a German newspaper), which analyzed the documents in cooperation with the ICIJ. Among many other news outlets, the New York Times doubted the legality of offshore companies (Stack et al., 2016). The Washington Post referred to the Panama Papers as an “unparalleled view into a notoriously shadowy industry that shuttles secret wealth around the globe” (Swanson, 2017). In addition, Google Trends clearly shows increased attention given to the term “Panama tax haven” in 2016. 2 In the same year, the Süddeutsche Zeitung received another data set and again shared it with the ICIJ. The 1.3 million files it contained originated from the official company register of the Bahamas. The Bahamas Leaks were made public in September 2016. According to Garside (2016), the leak contains information about 176,000 shell companies, trusts, and foundations. Some articles brand the Bahamas as the new number one tax haven (e.g., Garside, 2016). Because the Bahamas are one of the jurisdictions included in the Panama Papers and both leaks occurred in the same year, we consolidate them and only refer to the Panama Papers hereafter.
Finally, the Paradise Papers were published in November 2017. The leak comprises more than 13.4 million documents (Noack, 2017). Numerous articles shine a light on the tax planning and obfuscation strategies centered around the Bermudan law firm Appleby (Forsythe, 2017).
The public wonders whether these tax haven practices are illegal or legitimate. The leaks drew substantial public attention and scrutiny toward the named tax havens. In each leak, it is very difficult to identify individual parent companies that have or had ownership over entities named in the respective leaks. Because the disclosed names are not reliably assignable to parent companies nor are identifier variables provided, there is a great risk of incorrect data mergers. To conduct a large-scale study, we refrain from an individual assessment of named entities.
Tax Avoidance and Financial Report Readability
To date, the textual information in annual reports has mainly been explored by finance studies and in the general accounting literature. However, evidence relating to the association between tax avoidance and financial report readability is still limited and partially contradictory.
Li (2008) examines annual report readability without a relation to corporate taxation. Instead, the study investigates the relationship between readability and both current earnings and earnings persistence. Low and less persistent earnings are associated with lower readability, which is measured by the Fog index and the document length. Li (2008) concludes that managers try to hide bad performance or unfavorable information from stakeholders.
Investigating qualitative disclosures in conjunction with tax aggressiveness, Law and Mills (2015) focus on financial constraints. They analyze the use of negative words in annual reports. Linguistic cues in 10-Ks are associated with aggressive tax planning and provide incremental information beyond quantitative variables (Law & Mills, 2015). However, their findings reveal that tax aggressiveness is not significantly associated with readability. Whereas linguistic cues are based on a bag-of-words approach counting the frequency of specific keywords, readability proxies for overall text complexity by evaluating a text’s sentence length and word complexity.
In contrast, Beuselinck et al. (2018) find that tax aggressiveness is negatively associated with financial report readability. The authors interpret that complex disclosure language is used to cover aggressive tax avoidance, which suggests a strategic obfuscation of information.
Inger et al. (2018) investigate the association between tax avoidance and the readability of tax footnotes, rather than the full annual report. Their results suggest that tax footnotes are less readable when firms realize a high level of tax avoidance. Inger et al. (2018) state that moderate tax savings are emphasized by forthright disclosures, whereas tax aggressiveness is hidden. We also analyze tax footnotes to measure tax-related reputational concerns more targeted.
Hypotheses Development
Managers will probably have reputational concerns after they are affected by a leak. Even if the firms are not explicitly mentioned in the leaks, subsidiaries in the named states may be exposed to increased scrutiny because tax authorities and the public will be especially sensitive toward these. Changed behavior could suggest concerns about the additional skepticism.
For shareholders, as the most critical and influential stakeholders of a firm, reputational damage might manifest in the loss of economic value because of declining stock prices. The publication of a tax leak constitutes an exogenous shock and is often accompanied by extensive media coverage. Prior literature finds that news about aggressive tax strategies is associated with stock price declines (Hanlon & Slemrod, 2009). Mixed evidence is provided by Gallemore et al. (2014), who find short-term stock price declines following a tax shelter revelation. On the lender side, Hasan et al. (2014) find firms that are mentioned in news events about tax shelter involvement (e.g., by using tax havens) exhibit increases in loan spreads.
Operating in dot havens might be perceived as aggressive tax planning. Consistently, O’Donovan et al. (2019) suggest that the stock market value of firms decreased after they were implicated in the Panama Papers. It seems likely that these results can extend to other tax leaks.
Some studies indicate that companies attach importance to the reputational consequences of tax avoidance. Graham et al.’s (2014) survey analysis suggests that reputational costs matter to managers when they make tax planning decisions. This could be because aggressive tax avoiders might be considered “poor corporate citizens” (Bankman, 2004).
Nongovernmental organizations often influence public debates by publishing documents condemning tax avoidance. Choy et al. (2017) document abnormal stock price declines after the publication of a report that listed U.K. firms with tax haven subsidiaries. Investigating a similar setting, Dyreng et al. (2016) find that firms react to such reputational risks and public pressure by disclosing more subsidiaries, avoiding fewer taxes, and reducing their operations in tax havens. In particular, firms with valuable consumer brands exhibit higher ETRs, suggesting that firms at higher risk for reputational damage engage in less tax planning (Austin & Wilson, 2017). In contrast, Gallemore et al. (2014) do not find a reputational effect of tax sheltering. Chen et al. (2019) also suggest that firms do not react to negative media tax coverage. Hoopes et al. (2012) find that taxes are avoided less aggressively if the IRS closely monitors the firm. Because tax havens are under enhanced scrutiny by tax authorities, we assume that managers have reputational concerns. We expect affected firms to react to a leak, which we address qualitatively and quantitatively.
In the first part of our study, we investigate whether the tax footnote readability of firms with subsidiaries in named tax havens changes after the publication of a leak. Management could either be especially forthright or try to further obfuscate its tax strategies. On one hand, disclosures with better readability might become more important for a firm to present itself as a good corporate citizen. This is consistent with Beuselinck et al. (2018), who find higher readability of financial statements after IRS attention has increased. Furthermore, Rennekamp (2012) indicates that investors perceive more readable reports as more reliable. Lewellen (2018) states that firms may earn stakeholders’ trust through reputational bonding if they report more openly. Accordingly, more readable disclosures might counter an unfavorable reputation, maintain the trust of stakeholders, and avoid political costs. On the other hand, managers could strategically obfuscate information about their tax planning strategies by reducing disclosure readability. Poor readability leads to lower transparency because users must spend more time and effort to understand the information. This might make it harder for stakeholders to identify risky or aggressive tax strategies. Several studies show that tax aggressive firms are characterized by less transparent annual reports (Beuselinck et al., 2018; Inger et al., 2018). Balakrishnan et al. (2019) strengthen this finding by investigating transparency in terms of a firm’s information environment, which comprises asymmetric information, analysts’ forecast errors, and earnings quality. Lower transparency is often used by firms that engage in named tax havens, consistent with the theory of managers hiding unfavorable information in their disclosures (Inger et al., 2018; Li, 2008).
We focus on tax footnote readability and expect a significant change for affected firms after a leak. The direction of the change remains an empirical question. Thus, we hypothesize the following:
In the second part of our study, we analyze whether firms with subsidiaries in named tax havens change their reported ETRs after the publication of a leak. Generally, firms with tax haven operations avoid more taxes than those not operating in a tax haven (e.g., Dyreng & Lindsey, 2009; Rego, 2003). Tax havens facilitate tax avoidance (Desai et al., 2006). Furthermore, ETRs should be expected to decline over time. This is suggested by Markle and Shackelford (2012), who find that the firms’ ETRs decreased between 1988 and 2009. Dyreng et al. (2017) also find significant reductions in ETRs in recent decades.
However, contrary to the general expectations relating to firms with tax havens and the declining trend of ETRs, we anticipate that the leaks make a difference in a firm’s tax disclosures. According to O’Donovan et al. (2019), firms that were exposed in the Panama Papers avoided fewer taxes afterward. However, we do not investigate firms that are explicitly mentioned in a leak but those that are present in a named jurisdiction. Nevertheless, we expect the increased attention on these tax havens to be associated with the disclosure of less tax avoidance. This would also be in line with Dyreng et al.’s (2016) finding that noncompliant firms reduce their tax avoidance after they are publicly shamed for their failure to disclose tax haven activities. In contrast to the noncompliant conduct studied by Dyreng et al. (2016), it is possible that the companies we investigate operate legally. Nevertheless, we expect a similar result in our analysis because the firms might try to avoid being seen as aggressive tax avoiders in times of increased skepticism. Accordingly, we hypothesize the following:
Sample Selection and Research Design
Sample Selection and Composition
Table 1 presents the sample selection process. We use firm data compiled by Compustat North America. Our initial sample consists of 102,083 firm-years between 2010 and 2018. The period begins in 2010 so that distortions due to the financial crisis in 2008 are minimized. We require sample firms to be headquartered in the United States to ensure the comparability of applicable tax laws. Moreover, finance and insurance companies are excluded because different rules might apply to them. We download the available 10-K annual reports for the remaining firm-years on the SEC’s EDGAR website. 3 We remove firm-years without EDGAR data because these data are necessary to generate readability measures and obtain information about the affiliates’ locations. We also collect information about each corporate group’s geographic structure from Exhibit-21s that are included in their 10-K annual reports. 4 The data are automatically extracted on a yearly basis using Python. Firm-year observations are excluded if there are missing values for any variable. We thus extend Dyreng’s database, which only lists foreign material subsidiaries for certain years (first used and explained by Dyreng & Lindsey, 2009).
Sample Selection.
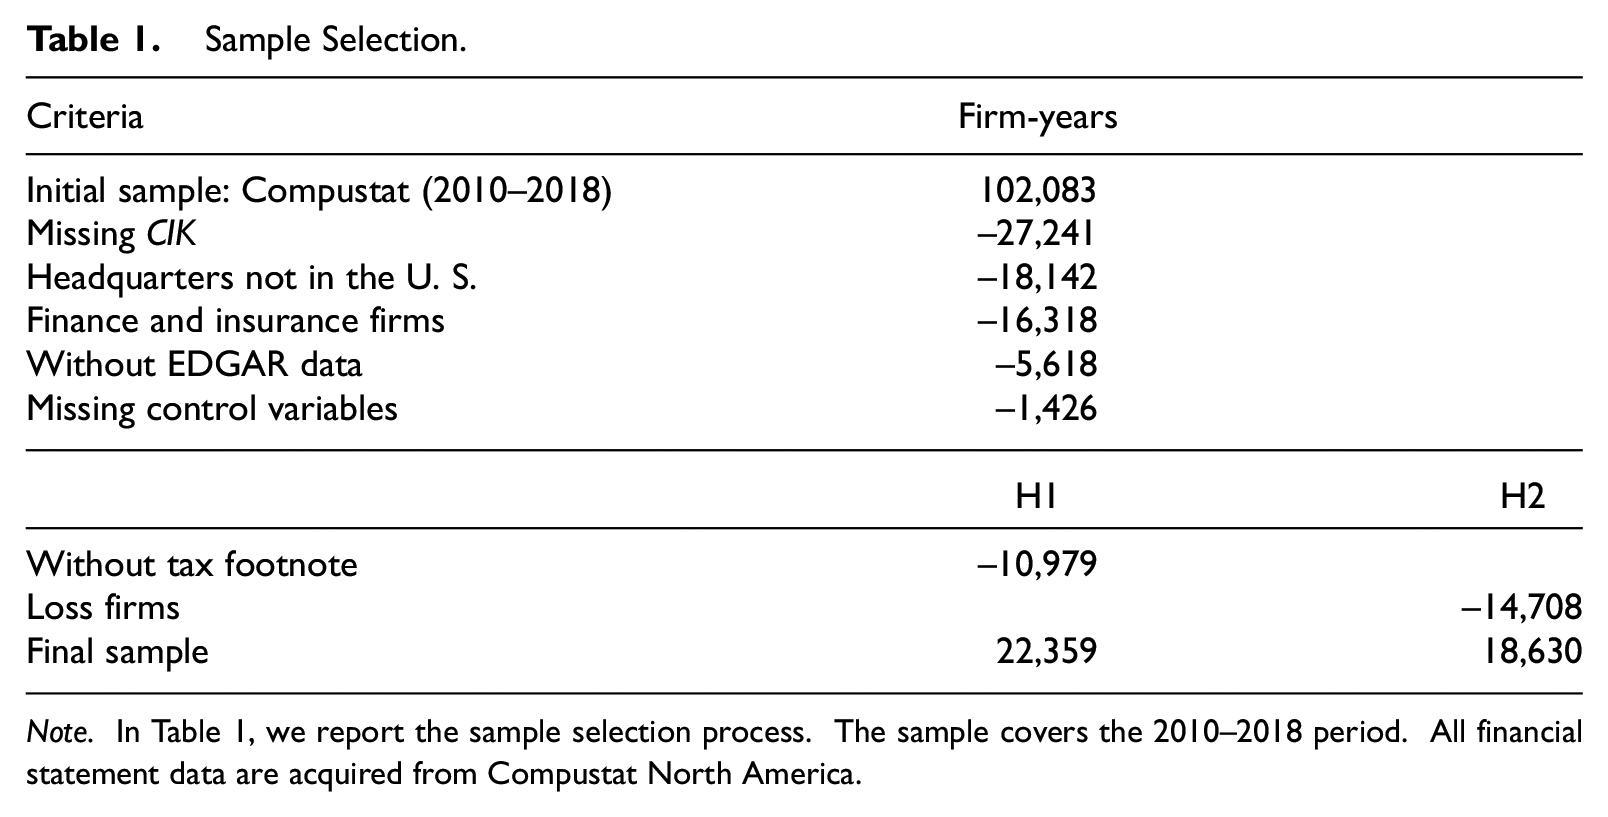
Note. In Table 1, we report the sample selection process. The sample covers the 2010–2018 period. All financial statement data are acquired from Compustat North America.
For our investigation of the first hypothesis, we also delete observations for which we cannot extract the tax footnote. We are able to extract the tax footnotes for 64% of the annual reports. 5 After these adjustments, our sample for H1 comprises 22,359 firm-years. To analyze our second hypothesis, data on tax footnotes are not required. We thus include observations even if they lack this information. However, to facilitate the interpretation of ETRs, we remove firm-years with negative pretax income (see also Armstrong et al., 2012; Dyreng et al., 2010). This leaves 18,630 firm-years in our H2 sample.
Readability Data
We strip all HTML formatting and other nontextual exhibits from the 10-K annual reports, mainly replicating the parsing process described by Bodnaruk et al. (2015) and the subsequent updates on McDonald’s website. 6 In addition, we follow Inger et al. (2018) and delete words longer than 50 characters, which are likely caused by formatting errors. We also remove lines if they contain less than 20 characters. After transforming all 10-Ks into plain text, we calculate the readability measures. In addition, we store the file size of each parsed report in our database. For footnote extraction, we use Python to identify the beginning and end of a tax footnote, primarily by applying regular expressions.
Research Design
We use difference-in-differences approaches to test our hypotheses. A critical assumption for the validity of this design is the parallel trends assumption, which we inspect visually. 7 We find that the treatment and the control group exhibit similar trends in the pre-treatment period for the Fog index and the Offshore Leaks. As of 2013, when the Offshore Leaks were published, the Fog index for firms with subsidiaries in the affected countries increases more than for the control firms. We observe comparable patterns for the other variables and leaks.
We examine whether tax footnote readability, that is, the complexity of wording and length, changes after a leak by comparing affected and unaffected firms. The following regression equation tests the association between tax footnote readability and the interaction between the respective LEAK dummy that equals 1 for our treated firms (OFFSHORE, PANAMA, or PARADISE) with the corresponding POST period (POST_2013, POST_2016, or POST_2017):

The dependent variable represents the READABILITY of the tax footnotes, which is measured by four proxies: the Fog index (FOG), the Flesch-Kincaid index (FLESCHK), the Flesch Reading Ease index (FLESCH), and the tax footnote document file size (FILESIZE).
First, following most computational linguistics literature (e.g., Beuselinck et al., 2018; Inger et al., 2018; Law & Mills, 2015; Li, 2008), we use the Fog index as computed in Equation 2. It measures readability as a function of average words per sentence and the percentage of complex words (words with at least three syllables). FOG proxies for the years of formal education that a reader of average intelligence needs to understand a text on first reading. Accordingly, the higher the Fog index is, the more complex and difficult the document is to read. A value of 18 or higher is considered to imply unreadability, and a Fog index in the range of 12 to 14 is judged to be ideal (Inger et al., 2018). However, annual reports are inherently more complex than most nonfinancial documents.

Second, we include the Flesch-Kincaid index (FLESCHK) in our analyses (see also Law & Mills, 2015; Li, 2008). Similar to the Fog index, the Flesch-Kincaid index measures the number of years of education generally required to understand a text. It is defined as follows:

Third, we measure readability using the Flesch Reading Ease index (FLESCH). Contrary to the Fog and Flesch-Kincaid indices, this index is lower when a text is harder to read. In line with Li (2008) and Law and Mills (2015), we calculate the measure as follows:

Fourth, as there has been criticism of the Fog index, we employ FILESIZE as suggested by Loughran and McDonald (2014). Similar to their study, we define FILESIZE as the natural logarithm of the parsed file size of the tax footnotes in bytes. In line with Inger et al. (2018), we apply these four measures to the extracted tax footnotes.
For the Offshore Leaks, the independent variable of interest in Regression Equation (1) is the interaction between the indicator variables OFFSHORE and POST_2013. OFFSHORE is equal to 1 if a firm owns an affiliate in a jurisdiction named in the Offshore Leaks in 2013, and 0 otherwise. POST_2013 is equal to 1 in years starting 2013, and 0 otherwise. Correspondingly, we investigate the interaction between PANAMA and POST_2016 and between PARADISE and POST_2017. We expect the readability to be significantly different for affected firms in the period after the leak but, consistent with H1, do not predict signs for β3.
To test our second hypothesis, we apply another difference-in-differences model, analyzing the disclosures of tax planning by affected firms after a leak. Thus, we investigate the association between a company’s GAAP ETR (GAAPETR) and the interaction of a LEAK indicator (OFFSHORE, PANAMA, or PARADISE) with the related POST indicator (POST_2013, POST_2016, or POST_2017). The following regression equation is estimated:

Prior studies use various measures of tax avoidance, including cash ETRs (e.g., Dyreng et al., 2010), book-tax differences (e.g., Armstrong et al., 2012), unrecognized tax benefits (e.g., Law & Mills, 2015), and the market value of assets (Henry & Sansing, 2018). However, we choose GAAPETR as our tax planning measure because it is the number reported by firms and is thus the main tax-related measure that is communicated to stakeholders. 8 GAAPETR is the ratio of total tax expenses divided by pretax income (see also Markle & Shackelford, 2014). It is then censored (i.e., reset) to fall between 0 and 1 (see also Armstrong et al., 2012).
The independent variable of interest for H2 is again the interaction between the respective leak indicator and the corresponding post-period indicator (β3), which we expect to be positive.
We use several control variables and industry fixed effects to cover the influence of other factors. The readability of footnotes in an annual report is correlated with the readability of the full 10-K annual reports (Li, 2008). Therefore, we control for READABILITY_10K (see also Inger et al., 2018). We use the corresponding measure related to the entire annual report as the dependent variable related to the tax footnote. For example, we control for FOG_10K if FOG is the dependent variable. Moreover, short tax footnotes might not be informative (Inger et al., 2018). SHORT is an indicator variable that is equal to 1 if a tax footnote’s number of words is in the bottom quartile by industry and year, and 0 otherwise.
Large firms are complex, which can decrease disclosure readability (Li, 2008). Furthermore, large firms often operate in tax havens (Lisowsky, 2010) and have various options for tax planning (Rego, 2003). SIZE is the natural logarithm of total assets. Moreover, a firm’s economic performance might influence the complexity of its disclosures (Armstrong et al., 2012; Inger et al., 2018). Highly profitable firms also have more incentives and resources to participate in cross-border tax avoidance (Rego, 2003). ROA is the ratio of net income to total assets. Furthermore, a firm’s capital structure can affect its information environment (Balakrishnan et al., 2019). Leverage is also negatively associated with tax avoidance (Richardson & Lanis, 2007). LEV is calculated as the ratio of long-term debt to total assets.
In line with Gallemore et al. (2014), we control for companies in industries that are likely to be especially sensitive to reputational concerns. SENS_IND is equal to 1 for firms in the food, health care, retail, and finance sector, and 0 otherwise. 9 Also following Gallemore et al. (2014), we further control for ADMIRED, which is an indicator equal to 1 if an enterprise is on the Fortune magazine’s “Most Admired Companies” list 10 in a given year, and 0 otherwise.
Furthermore, firms with many intangibles have a greater scope to shift profits into tax havens because intangible assets are easy to reallocate (Gravelle, 2009). INTAN is measured as a company’s intangible assets in proportion to their total assets. In addition, investments in fixed assets provide greater opportunities for tax planning (Gaertner, 2014). PPE is net property, plant, and equipment in proportion to total assets. Moreover, firms with operations in multiple jurisdictions can exploit a variety of diverging tax laws (Rego, 2003). This may also influence the extent of their financial disclosures. NCOUNTRIES is defined as the natural log of the number of countries a company has subsidiaries in according to its Exhibit-21.
Deferred revenue can cause book-tax differences that might reduce readability (Inger et al., 2018). Book-tax differences are also associated with a firm’s tax avoidance (Blaylock et al., 2012). DEF_REV is an indicator variable equal to 1 if the deferred revenue is nonzero, and 0 otherwise. Moreover, tax aggressive firms provide less readable annual reports (Beuselinck et al., 2018). GAAPETR is the total tax expenses divided by pretax income.
Loss firms often need to explain more to their shareholders, which might reduce readability (Li, 2008). LOSS is equal to 1 if pretax income is negative, and 0 otherwise.
Finally, we include industry fixed effects to control for systematic differences across sector types. Industries are defined following the Fama-French 30 classifications. All continuous variables are winsorized at 1% and 99% to mitigate outliers. When analyzing H2 with the ETR as the dependent variable and using a sample without loss firms, we do not control for GAAPETR, LOSS, the readability measures, and SHORT.
Empirical Results
Descriptive Statistics
Our summary statistics in Table 2 relate to the H1 sample. Of the sample firms, 25.86% are present in a state named in the Offshore Leaks, 5.68% in a state named in the Panama Papers, and 14.42% in a state named in the Paradise Papers. Because of this striking difference in the number of observations, we expect weaker results analyzing PANAMA and PARADISE. This expectation is reinforced by the lower number of post-leak observations for these leaks due to the shorter period between the leaks’ publication and the end of our sample period.
Descriptive Statistics.
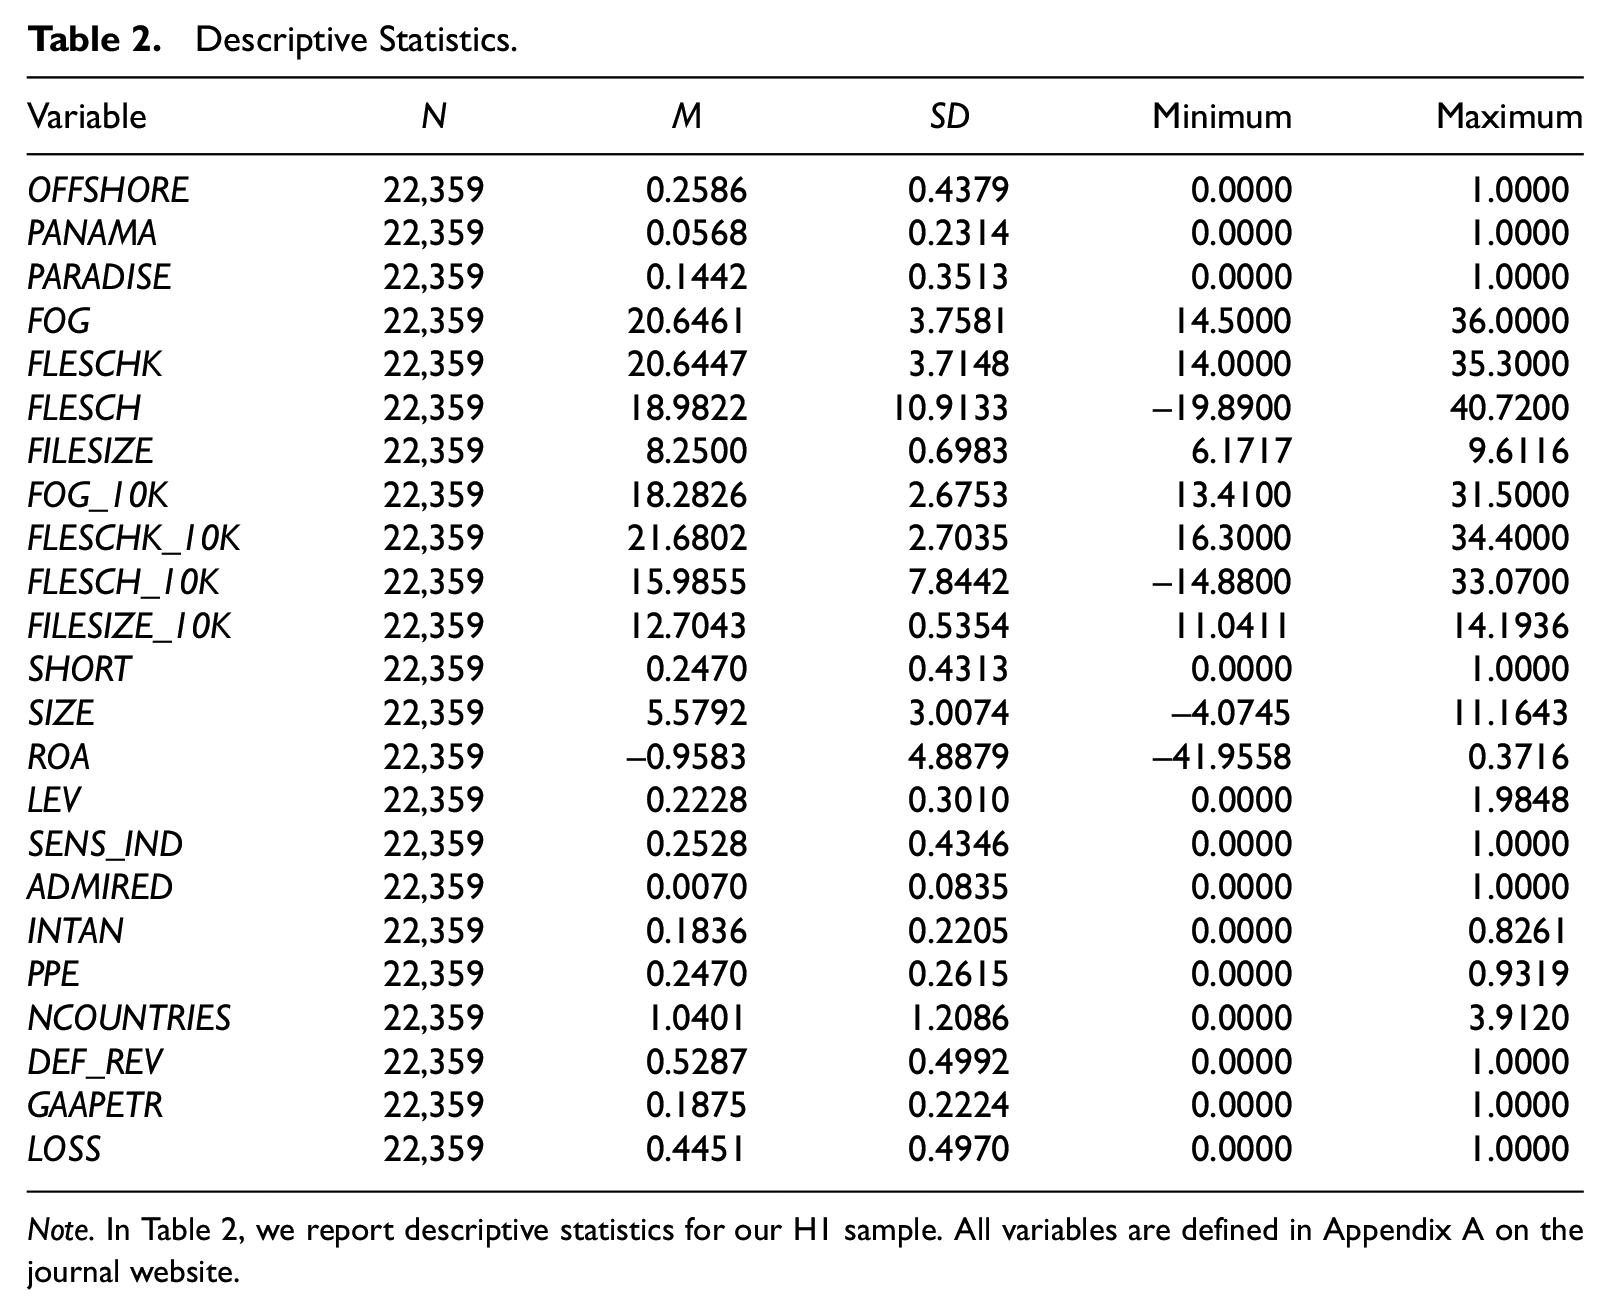
Note. In Table 2, we report descriptive statistics for our H1 sample. All variables are defined in Appendix A on the journal website.
We find relatively high readability values. FOG and FLESCHK average approximately 21, indicating that tax footnotes are rather complex. These values are comparable to the findings of prior studies that investigate full 10-Ks (e.g., Law & Mills, 2015). The standard deviations of FOG and FLESCHK demonstrate a moderate level of dispersion despite winsorizing the data, which suggests that firms communicate differently with stakeholders. FLESCH has a mean value of 18.9822. According to Law and Mills (2015), whole annual reports are characterized by a similar readability level. Our length measure FILESIZE averages 8.2500. Without taking the logarithm, the mean file size of a tax footnote is approximately 4,000 bytes. As almost all alphanumerical characters used in the English language consume 1 byte in a UTF8 encoded text, this equals an average text length of close to 4,000 characters.
The mean GAAPETR of 18.75% seems to be quite low. A reason could be that loss firms are included in the sample for H1, and ETRs are censored to 0. However, in our H2 sample, which does not include loss firms, the mean is 27.42% (untabulated). This is in line with prior literature (e.g., Armstrong et al., 2012) and is crucial for our analysis because we use this sample to analyze firms’ changes in tax planning behavior.
Regression Results
Tests of H1
To test H1, we regress readability measures on the interaction of a leak indicator with its corresponding post-period indicator. First, we investigate the Offshore Leaks in Table 3.
Regression Results of H1: Offshore Leaks.
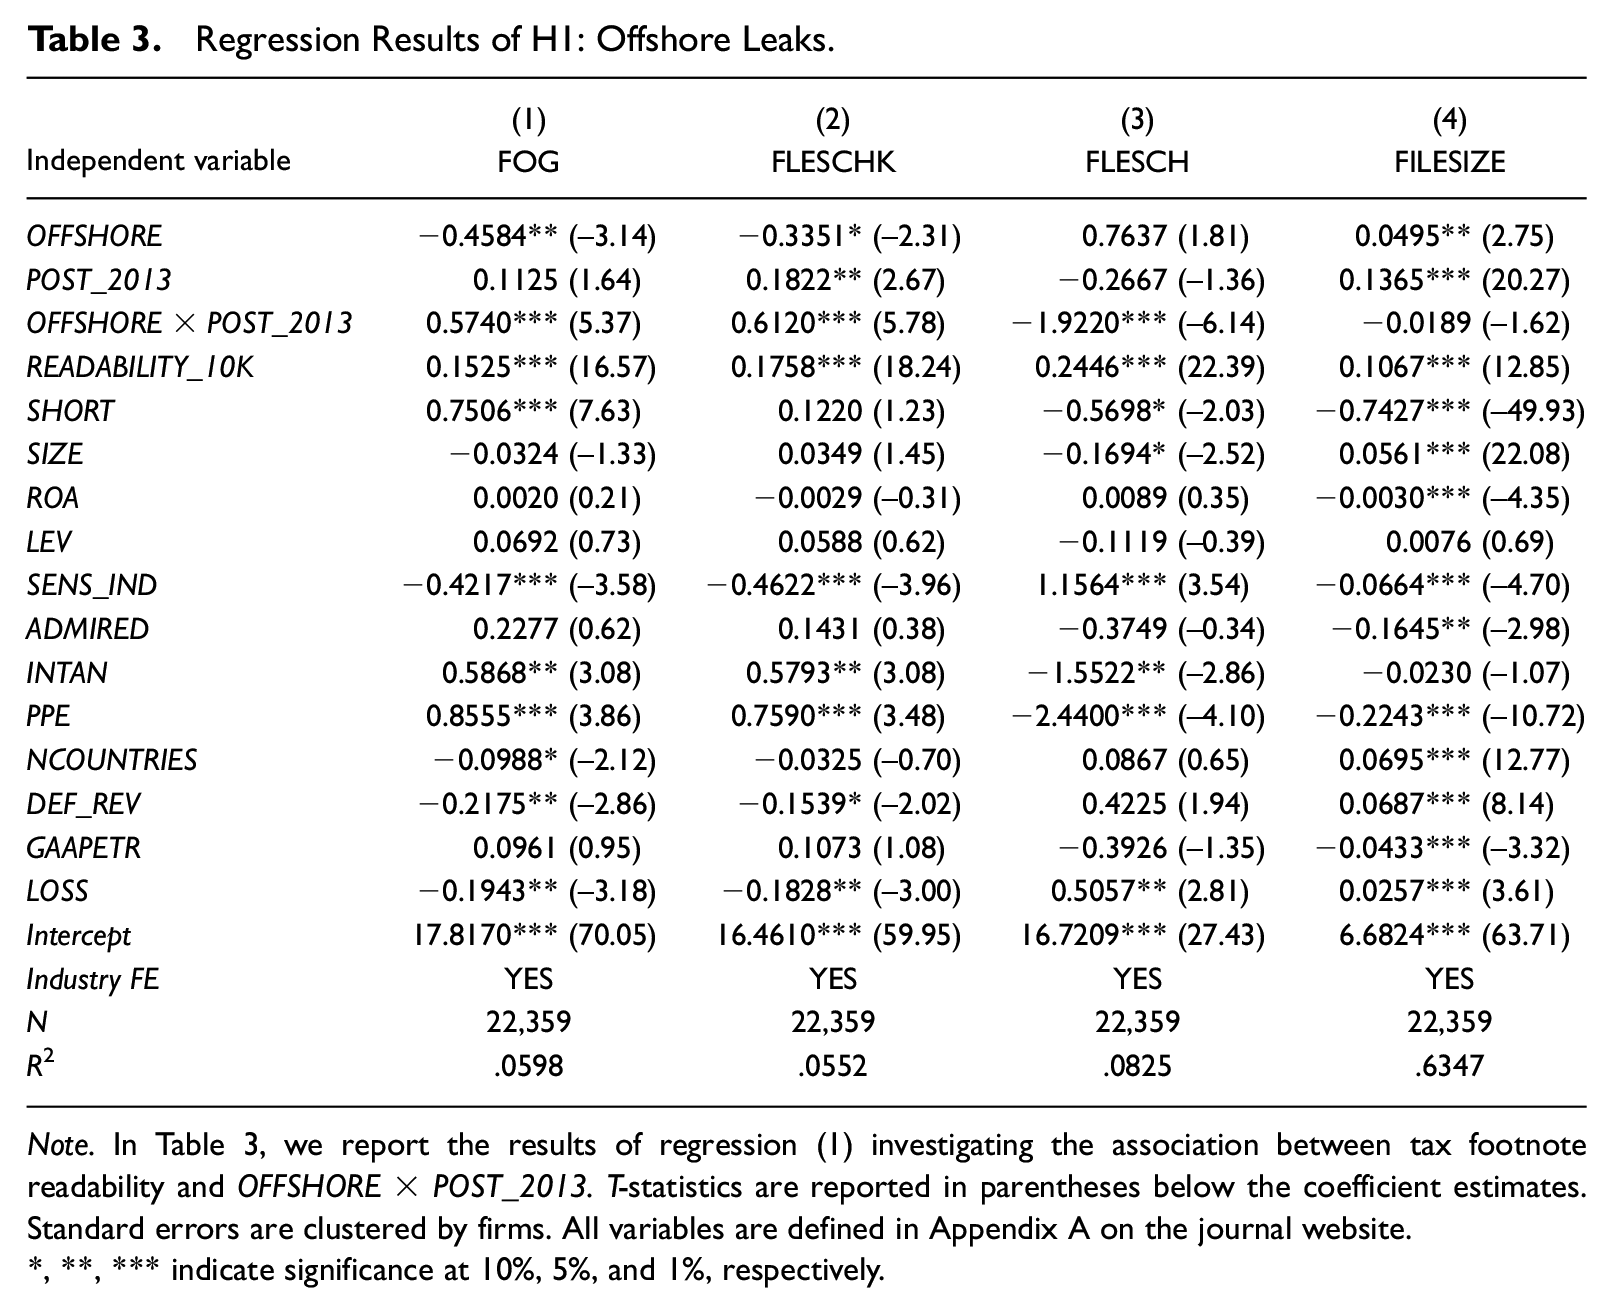
Note. In Table 3, we report the results of regression (1) investigating the association between tax footnote readability and OFFSHORE×POST_2013. T-statistics are reported in parentheses below the coefficient estimates. Standard errors are clustered by firms. All variables are defined in Appendix A on the journal website.
, **, *** indicate significance at 10%, 5%, and 1%, respectively.
The significant coefficients of OFFSHORE indicate that firms operating in at least one of the named jurisdictions in the year of the leak generally provided more readable and longer tax footnotes than the control firms before the leak occurred. This result is consistent with the finding by Lewellen (2018) that tax haven usage sometimes promotes high reporting transparency. The partially significant associations between
Accordingly, our findings of decreased readability hint at obfuscated information in the tax footnotes after the tax havens the firms operate in received negative public attention. The results are in line with prior studies that suggest that firms hide unfavorable content in their disclosures (Beuselinck et al., 2018; Inger et al., 2018; Li, 2008). The change in behavior might indicate that firms are concerned about their reputation. Accordingly, our results are also in line with managers’ statements that reputational concerns matter
Second, we analyze the Panama Papers. The regression results are shown in Table 4. As far as the indicator variable PANAMA is concerned, the associations with our readability measures are not significant, suggesting that prior to the Panama Papers, no differences in the tax footnote readability existed between leak and nonleak firms. However, the significant coefficients of POST_2016 suggest that the tax footnotes of the control firms generally exhibit lower readability and are longer in post-leak years. Again, we are primarily interested in the interaction term PANAMA × POST_2016 to assess if there are statistically significant differences in the readability between leak and nonleak firms after the leak occurred. The results strengthen our findings for the Offshore Leaks. As before, the significant coefficients of FOG (0.5560), FLESCHK (0.6301), and FLESCH (−1.9862) suggest that firms lowered the readability of their tax footnotes after the Panama Papers drew attention to a tax haven that they were present in. In contrast, the association with FILESIZE is insignificant, which hints at a constant information volume despite increased complexity. Thus, we can further support that companies with subsidiaries in a state named in a leak tried to disguise information after the leak occurred.
Regression Results of H1: Panama Papers.
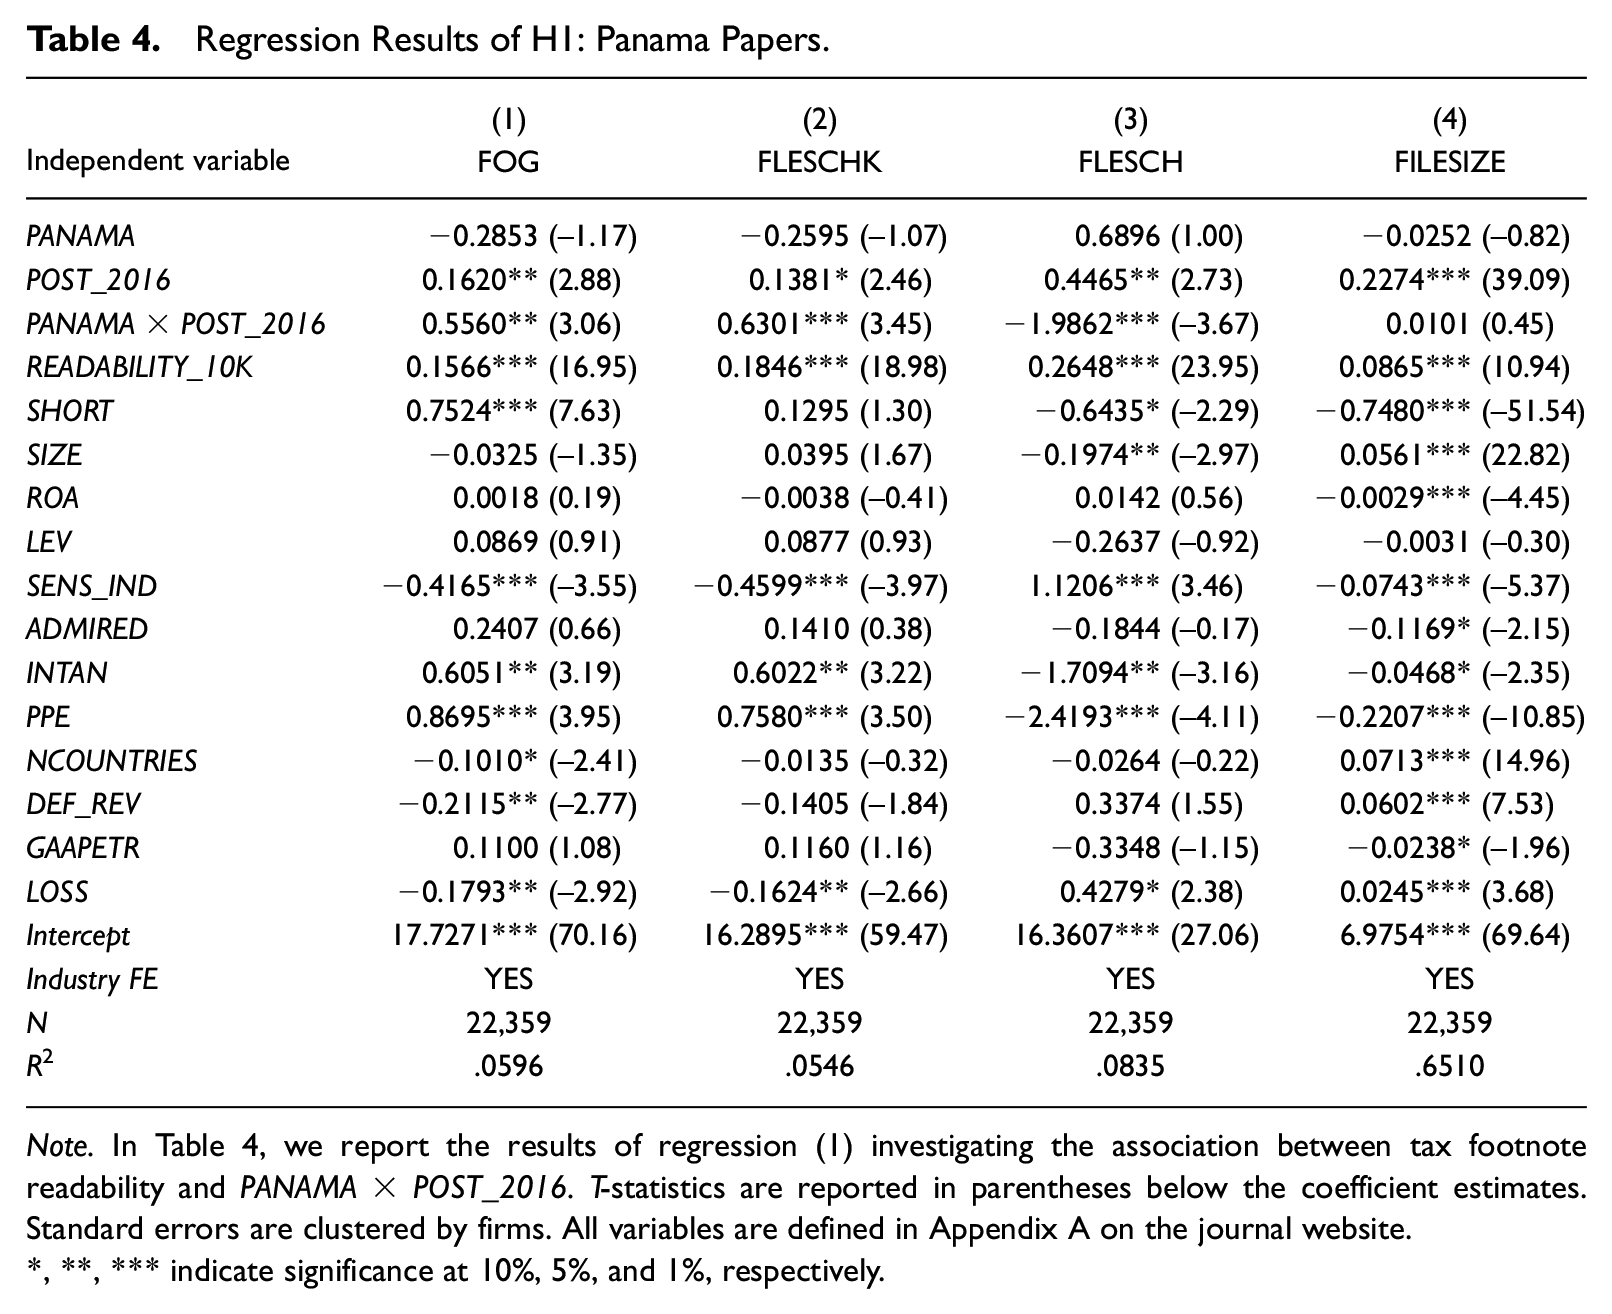
Note. In Table 4, we report the results of regression (1) investigating the association between tax footnote readability and PANAMA×POST_2016. T-statistics are reported in parentheses below the coefficient estimates. Standard errors are clustered by firms. All variables are defined in Appendix A on the journal website.
, **, *** indicate significance at 10%, 5%, and 1%, respectively.
Third, the Paradise Papers are investigated in Table 5. The insignificant association between PARADISE and readability indicates that firms with operations in tax havens named in the Paradise Papers in 2017 did not usually have less readable tax footnotes before the leak occurred. However, FLESCH is higher (indicating less complexity) and the tax disclosures are longer in 2017 and 2018 in general. The interaction term PARADISE × POST_2017 again supports our previous findings. The significant coefficients of FOG (0.4247), FLESCHK (0.4388), and FLESCH (1.3895) suggest lower readability compared with nonleak firms. However, the file sizes do not seem to be different after the leak.
Regression Results of H1: Paradise Papers.
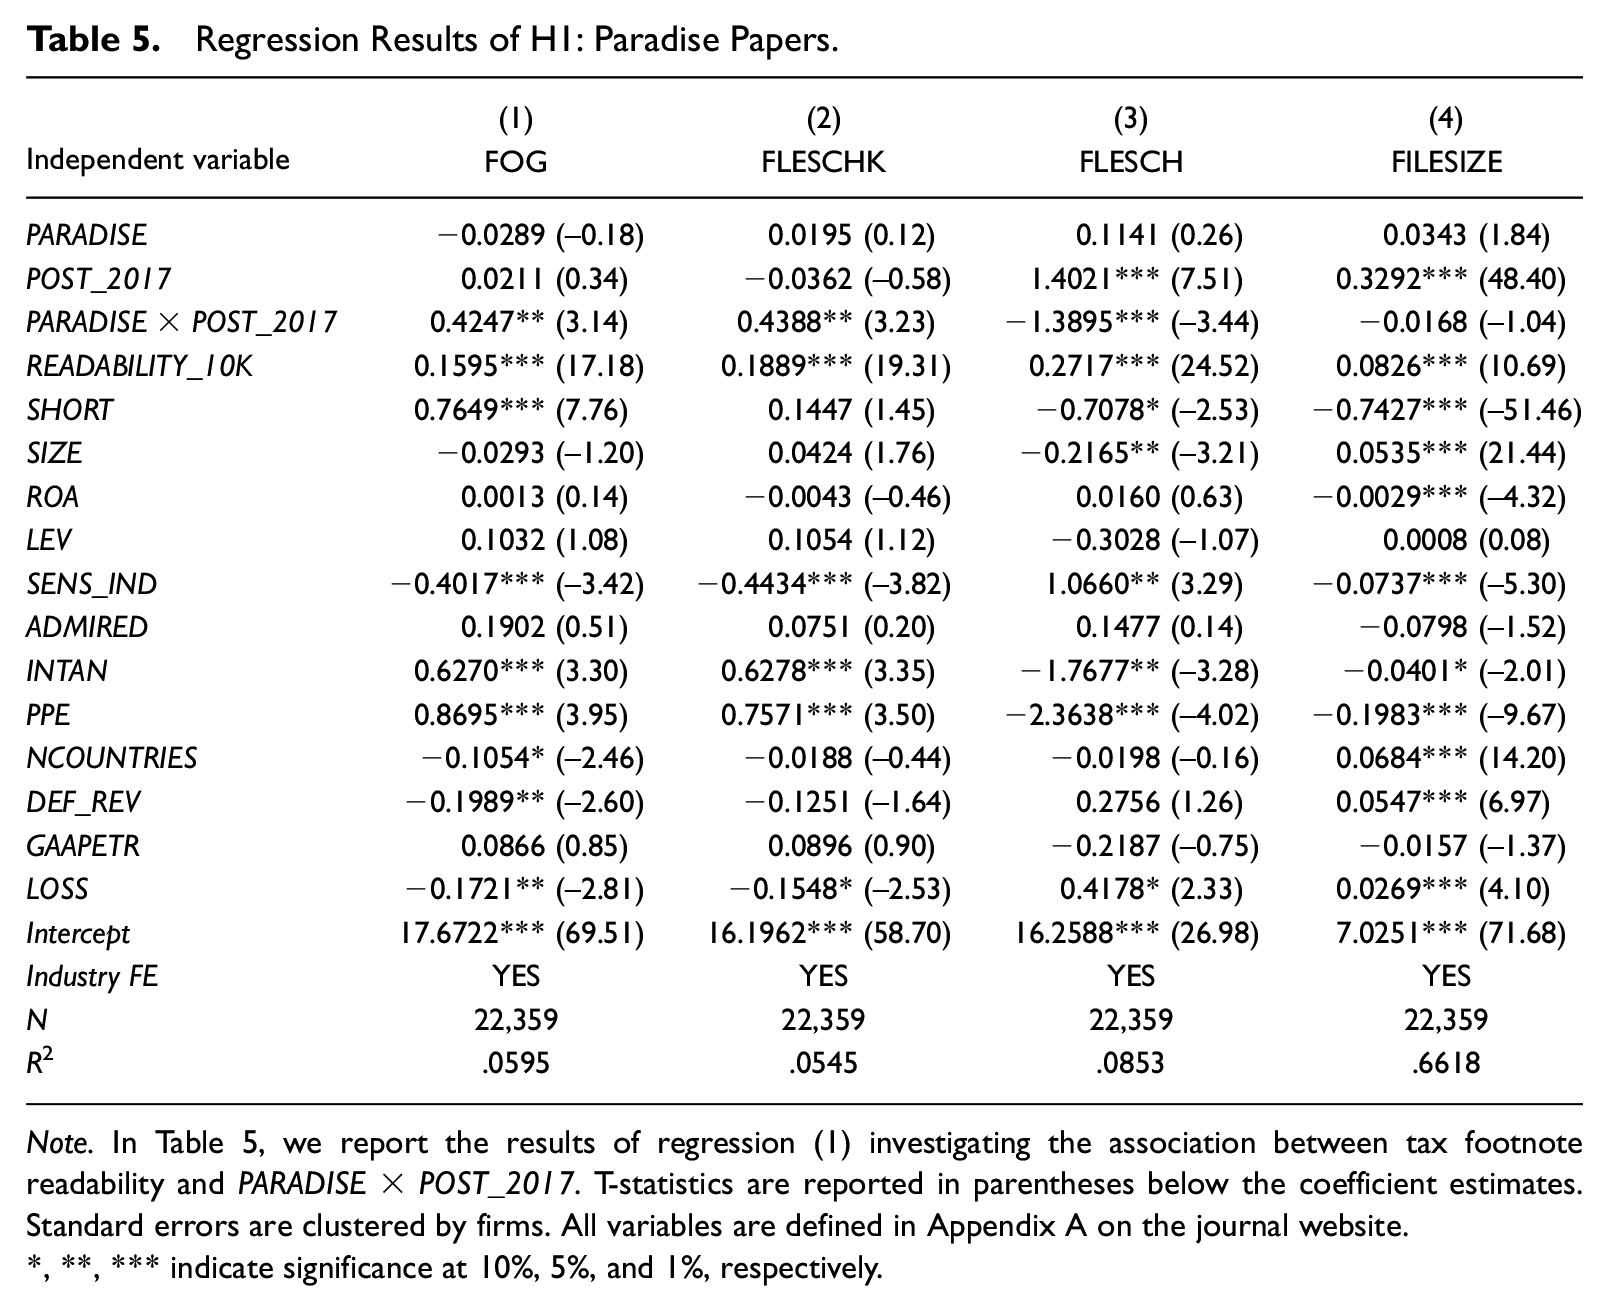
Note. In Table 5, we report the results of regression (1) investigating the association between tax footnote readability and PARADISE×POST_2017. T-statistics are reported in parentheses below the coefficient estimates. Standard errors are clustered by firms. All variables are defined in Appendix A on the journal website.
, **, *** indicate significance at 10%, 5%, and 1%, respectively.
Overall, the regression results support H1. All measures except FILESIZE are significant and hint at lower readability. Although our results indicate that tax footnotes are more complex after a firm is affected by a leak, they do not seem to disclose more information. We carefully interpret these results as a reaction to reputational risks due to increased scrutiny toward the implicated tax havens. Firms may use lower readability as a strategic instrument to obfuscate information about tax strategies in named jurisdictions.
Tests of H2
To test H2, we regress GAAPETR on the interaction between OFFSHORE and POST_2013, PANAMA and POST_2016, and PARADISE and POST_2017. The results are presented in Table 6. First, the Offshore Leaks results are shown in column (1). The coefficient of OFFSHORE is not significant, suggesting that prior to the disclosure of the Offshore Leaks, there were no statistically significant differences between the GAAP ETRs of treated and nontreated firms. However, the observations of nonleak firms generally exhibit lower tax rates after 2013, which is indicated by the highly significant POST_2013 coefficient of −0.0247. This supports the previously documented trend of decreasing ETRs (e.g., Dyreng et al., 2017; Markle & Shackelford, 2012). Again, we are most interested in OFFSHORE × POST_2013. The interaction is highly significant and positively associated with GAAPETR (0.0256). This result is consistent with our second hypothesis and hints at firms pursuing less tax aggressive behavior after a tax haven they operate in was affected by the Offshore Leaks. It might be possible that affected firms try to counteract public allegations of being an aggressive tax avoider in times of increased scrutiny because of reputational concerns.
Regression Results of H2.
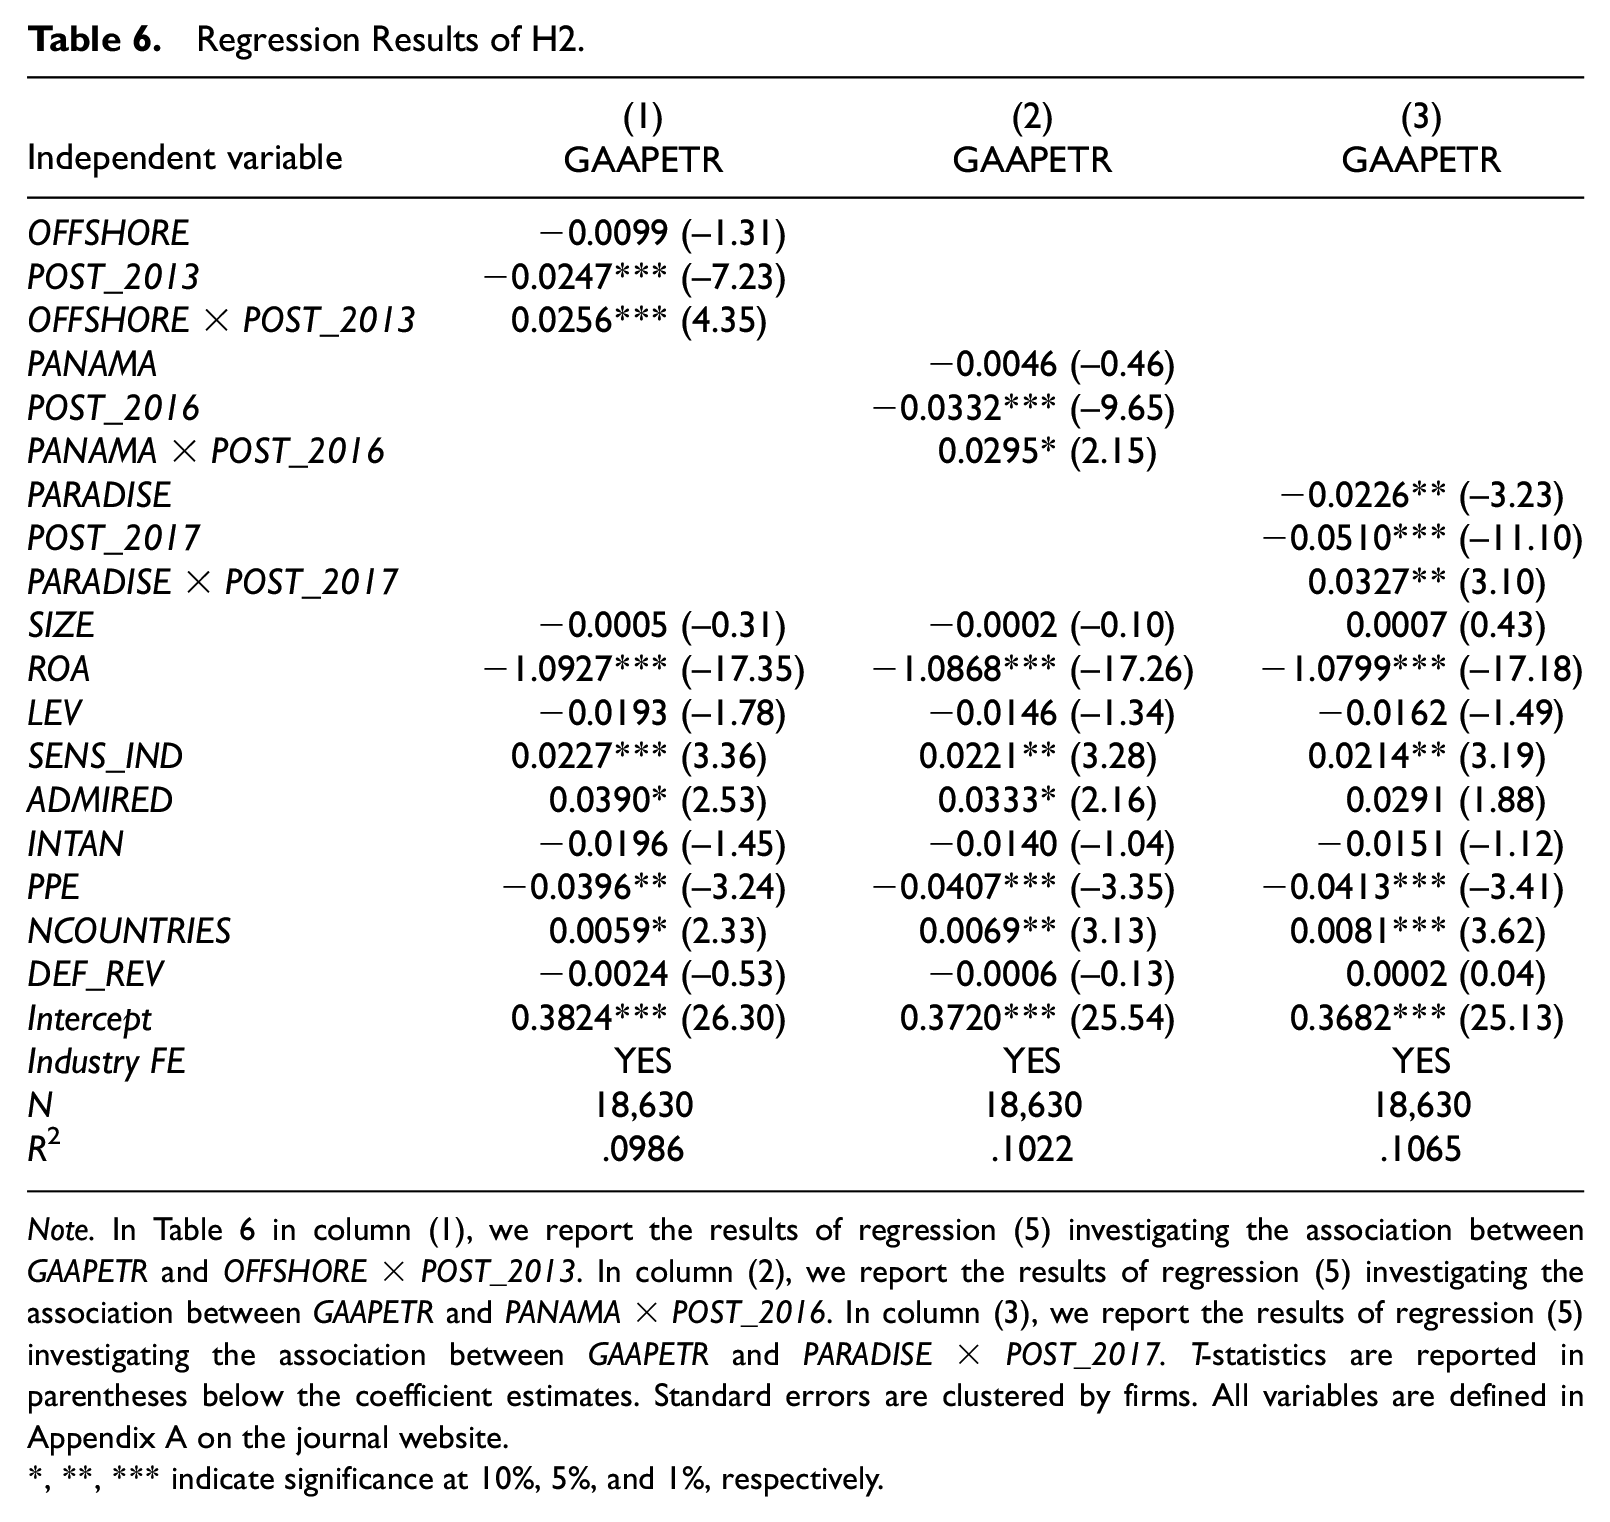
Note. In Table 6 in column (1), we report the results of regression (5) investigating the association between GAAPETR and OFFSHORE × POST_2013. In column (2), we report the results of regression (5) investigating the association between GAAPETR and PANAMA × POST_2016. In column (3), we report the results of regression (5) investigating the association between GAAPETR and PARADISE × POST_2017. T-statistics are reported in parentheses below the coefficient estimates. Standard errors are clustered by firms. All variables are defined in Appendix A on the journal website.
, **, *** indicate significance at 10%, 5%, and 1%, respectively.
Second, we analyze the Panama Papers in column (2) of Table 6. We do not find evidence of generally lower tax rates for firms operating in a state named in the Panama Papers, but we do find a significant decrease in the years starting with 2016 for our control group (−0.0332). Moreover, the association between GAAPETR and PANAMA × POST_2016 is significant at the 10% level. This supports H2 and our previous results. The slight decrease in significance might be attributable to fewer observations affected by the Panama Papers or to a moderating effect of the preceding leak.
Third, the results concerning the Paradise Papers are shown in the last column of Table 6. The significant coefficient of PARADISE is −0.0226. This means that before the leak occurred, firms present in at least one of the jurisdictions named in the Paradise Papers in 2017 were generally characterized by a lower GAAPETR compared with firms with no subsidiary in a jurisdiction comprised in the Paradise Papers. This finding is in line with prior literature, suggesting that firms with tax haven operations avoid more taxes (e.g., Rego, 2003). Furthermore, we support a decreasing time trend of control firms’ ETRs with a highly significant coefficient of POST_2017 (−0.0510). Finally, the interaction term PARADISE × POST_2017 is significantly and positively associated with GAAPETR (0.0327), indicating that the GAAP ETR of treated firms decreased to a lesser extent than for the nontreated firms in our sample. The results confirm our previous findings.
Altogether, the results are consistent with our second hypothesis. It seems that firms with affiliates in a leaked tax haven report more taxes in the post-leak period. Our findings might suggest that firms try to present themselves as “better taxpayers” in times of increased attention and criticism toward their tax haven affiliates.
Robustness Tests
We provide further tests to validate our results. First, we apply a stricter definition for dot havens because these are most likely used for tax planning instead of economic activities (Dyreng et al., 2018). In an untabulated analysis, we exclude Hong Kong, Malaysia, and Singapore from the Offshore Leaks countries because these states might exhibit a higher level of economic activity than the usual dot havens. The results are similar as for our main analyses. It seems, however, that our results are valid for more than leaks of dot havens. We replicate our analyses for the Luxembourg Leaks in 2014 and the Swiss Leaks in 2015 and find similar (untabulated) results. Accordingly, these leaks seem to have a comparable effect on the firms.
Second, we control for potential spill-over effects of prior leaks. Firms might react stronger if they were already affected by an earlier leak. To test whether they find it more important to change their behavior, we focus our analysis on the Paradise Papers as the last leak in our study. We only include firms with subsidiaries in tax havens that are implicated in this disclosure and compare firms that were already affected by a prior leak to firms that are affected by a leak for the first time with the Paradise Papers. The independent variable PARADISE in Regression Equation 1 is replaced by MULTI_LEAKS, which is an indicator variable equal to 1 if the firm was already affected by the Offshore Leaks and/or the Panama Papers, and 0 otherwise. The interaction term MULTI_LEAKS×POST_2017 is positively associated with FOG and FLESCH_K and negatively associated with FLESCH. 11 This finding indicates that firms with subsidiaries in tax havens named in the Paradise Papers are publishing harder-to-read reports after 2017 if they have already been affected by at least one prior leak. Untabulated results suggest that these firms also increase their GAAPETR to a greater extent.
Third, we replace GAAPETR by CASHETR in Equation 5. Although external parties are likely to focus on GAAPETR, sophisticated users of financial statements might also calculate the cash ETR. This is measured as the ratio of cash taxes paid against pretax income adjusted for special items (see also Austin & Wilson, 2017; Gallemore et al., 2014) and censored at 0 and 1. The associations between CASHETR and each OFFSHORE × POST_2013, PANAMA×POST_2016, and PARADISE×POST_2017 are not significant. 12 Firms only seem to report a higher GAAP ETR, whereas their actual tax avoidance behavior (i.e., their cash ETR) remains unchanged. It seems probable that firms manage their GAAP ETRs by accruals, whereas there is no real change in cash taxes. This result strengthens the conclusion that affected firms attach particular importance to a good presentation to their stakeholders.
Fourth, we investigate whether affected firms with low GAAP ETRs before a leak have greater incentives to increase their reported tax rates. Therefore, we only investigate firms that are affected by a leak and replace LEAK in Regression Equation (5) by LOW_ETR, which is equal to 1 if a firm’s GAAPETR is in the lowest industry-year tertile of GAAPETR in the year prior to a leak, and 0 otherwise. Firms with lower ETRs show greater increases in GAAPETR after being affected by a leak. 13 These firms might have a greater incentive to present themselves as “better taxpayers” in times of increased public scrutiny than firms that exhibited comparatively higher tax rates before the publication of a tax haven leak. However, the tax footnote readability of highly tax-avoiding firms is not different (untabulated).
Fifth, we replace FILESIZE with the number of words per annual report to validate our measure for the amount of information provided. Untabulated results show that this measure is not significantly associated with a firm being affected by a leak.
Sixth, we test whether the leaks increase the focus on tax havens in general. Any jurisdiction defined as a tax haven could be discredited after a leak because offshore tax avoidance by companies generally attracts public attention. External parties might not differentiate between the jurisdictions actually named in a leak and other tax havens. Therefore, we investigate whether firms with subsidiaries in any nonnamed tax haven show a change in behavior after a leak. Tax havens are defined according to the classification of Hines and Rice (1994). We find that firms with operations in any nonnamed tax haven also reduce the readability of their tax footnotes and increase their GAAPETR after each leak. 14 Untabulated results show that the findings on readability are reinforced when investigating the post-2016 and post-2017 periods. Overall, our findings suggest that the leaks might have a far-reaching impact because firms with tax haven affiliates not implicated in a leak also exhibit changes in their behavior after public scrutiny has increased. Thus, the appeal of tax havens in general might be reduced.
The findings indicate that some firms in the control group of our primary difference-in-differences tests could be subject to some kind of treatment due to spill-over effects on other tax havens. Nevertheless, our initial results are significant, which suggests that the tax havens implicated in the leaks make a particular difference. To address this issue, we control for affiliates in nonnamed tax havens. These untabulated tests do not change our prior findings.
Conclusion
We find that the readability of tax disclosures decreases in the post-leak period for firms (indirectly) affected by the public attention from a tax haven leak. This suggests that firms report in a more obfuscating manner on tax issues in times of increased scrutiny toward their tax haven affiliates. We assume that this change in reporting behavior is caused by reputational concerns. Our results hold using data from the Offshore Leaks in 2013, the Panama Papers and Bahamas Leaks in 2016, and the Paradise Papers in 2017. In our investigation of changes in the disclosure of tax planning behavior by companies operating in a leaked tax haven, we find that affected firms report higher tax expenses in the period after the leak. This might indicate that managers try to counteract public allegations of being an aggressive tax avoider. However, firms only seem to report higher GAAP ETRs, whereas their cash ETRs remain unchanged.
It should be noted that our study has some caveats. First, association studies cannot provide insights into causal relationships. Second, firms have some discretion in choosing which subsidiaries they disclose in their Exhibit-21. This could mitigate our results. Third, some treatment firms have already been affected by a prior leak in the pre-period of a later leak. Because of this occasional overlapping of the pre- and post-periods of two leaks, our results might be weakened. The fact that our findings are still significant suggests that being affected by another leak makes a difference, which we also show in a robustness test.
In summary, we find indications that affected firms change their tax disclosure behavior after a leak. This is consistent with the possibility that increased media attention might cause reputational concerns for firms operating in the named states. Accordingly, the increased scrutiny might reduce the appeal to use these jurisdictions as a vehicle for tax planning.
Supplemental Material
sj-pdf-1-jaf-10.1177_0148558X20986348 – Supplemental material for Trouble in Paradise?
Supplemental material, sj-pdf-1-jaf-10.1177_0148558X20986348 for Trouble in Paradise? by Fabian Schmal, Katharina Schulte Sasse and Christoph Watrin in Journal of Accounting, Auditing & Finance
Footnotes
Acknowledgements
We gratefully acknowledge the helpful comments and suggestions from Jaron Wilde (discussant), Skrålan Vergauwe (discussant), Belinda Henderson (discussant), Barath Sarath (editor), and an anonymous reviewer. We also appreciate the comments and suggestions from participants at the 2019 Annual Congress of the EAA in Paphos, the 2019 VHB Annual Conference in Rostock, the 2019 AAA Annual Meeting in San Francisco, and the 2019 NTA Annual Conference on Taxation in Tampa.
Declaration of Conflicting Interests
The author(s) declared no potential conflicts of interest with respect to the research, authorship, and/or publication of this article.
Funding
The author(s) received no financial support for the research, authorship, and/or publication of this article.
Supplemental Material
Supplemental material for this article is available online.
Notes
References
Supplementary Material
Please find the following supplemental material available below.
For Open Access articles published under a Creative Commons License, all supplemental material carries the same license as the article it is associated with.
For non-Open Access articles published, all supplemental material carries a non-exclusive license, and permission requests for re-use of supplemental material or any part of supplemental material shall be sent directly to the copyright owner as specified in the copyright notice associated with the article.