
Abstract
The main concern of the public is the risk of low dose rate radiation. While we recognise that we are continuously exposed to natural radiation as long as we live on this planet, it is natural to worry that the effects of additional exposure to man-made radiation will accumulate over our lifetimes and affect our children and grandchildren. According to the LNT/LQM on which radiation protection regulations are based, the risk of mutation is determined by the total cumulative exposure dose. The question is whether the risk accumulates. The latest data on genomic variation in low dose radiation exposure were reported by Gondo at the ICRP2023 conference. These groundbreaking data suggest changes in the formula that allow only mutant cells to accumulate. This report focuses on this and provides clear answers to the above questions by introducing a whack-a-mole (WAM) model that incorporates the organism's inherent ability to eliminate mutant cells.
INTRODUCTION
The latest data on genomic variation at low dose rates were presented at ICRP 2023 (Gondo, 2023). This landmark report provides clear evidence that radiation experiments at very low dose rates of the order of 1 mGy day−1 hardly alter genomic variation (SNV), even when the total dose is as high as 100 mGy. This provided an important experimental fact showing that at low dose rates, even in regions where the total dose is much higher, very little mutation is seen. What is revolutionary about this experiment? It has to do with the shock caused by Russell's first report of the mega-mouse experiment (Russell et al., 1958). The opening address of the Leiden International Conference, held immediately after this report, noted ‘The early concept of the mechanism of radiation effects, which was based on a simple, physical interpretation of radiation damage, i.e. the effect on the biological entity is direct, it is immediate, irreversible and unavoidable, has been replaced in the last twenty years by a more biological, or better biochemical, interpretation’ (Sobels, 1963). If we look at the records of the Leiden conference, we can see the thoughts of the scientists as to whether or not mutations really accumulate in living organisms. Unfortunately, this interpretation was not pursued, and LNT/LQM has been long established over the last 100 years. This report explains that the recent new experimental results reported by Gondo (2023) can verify the insights of scientists from 1960 and that old concepts about the mechanisms of radiation effects should be replaced by a more radiobiological principle.
THE WHACK-A-MOLE MODEL
The whack-a-mole (WAM) model (Bando et al., 2019) incorporates the property that the ability to reduce mutations keeps life in balance. Although cells undergo mutations due to external stimuli, the stability of living organisms is maintained by defence functions. This struggle is the essence of life. An organism's response to internal mutations is a race against time, and the time course of mutation frequency is important to explain this competition because mutation frequency must be a function of time. Therefore, the mutation frequency F follows a differential equation with respect to time (Fig. 1). A represents the sum of mutation rates caused by endogenous a0 and external radiation exposure a1d with dose rate d, and B represents the rate at which mutated cells are eliminated in response to these stimuli.
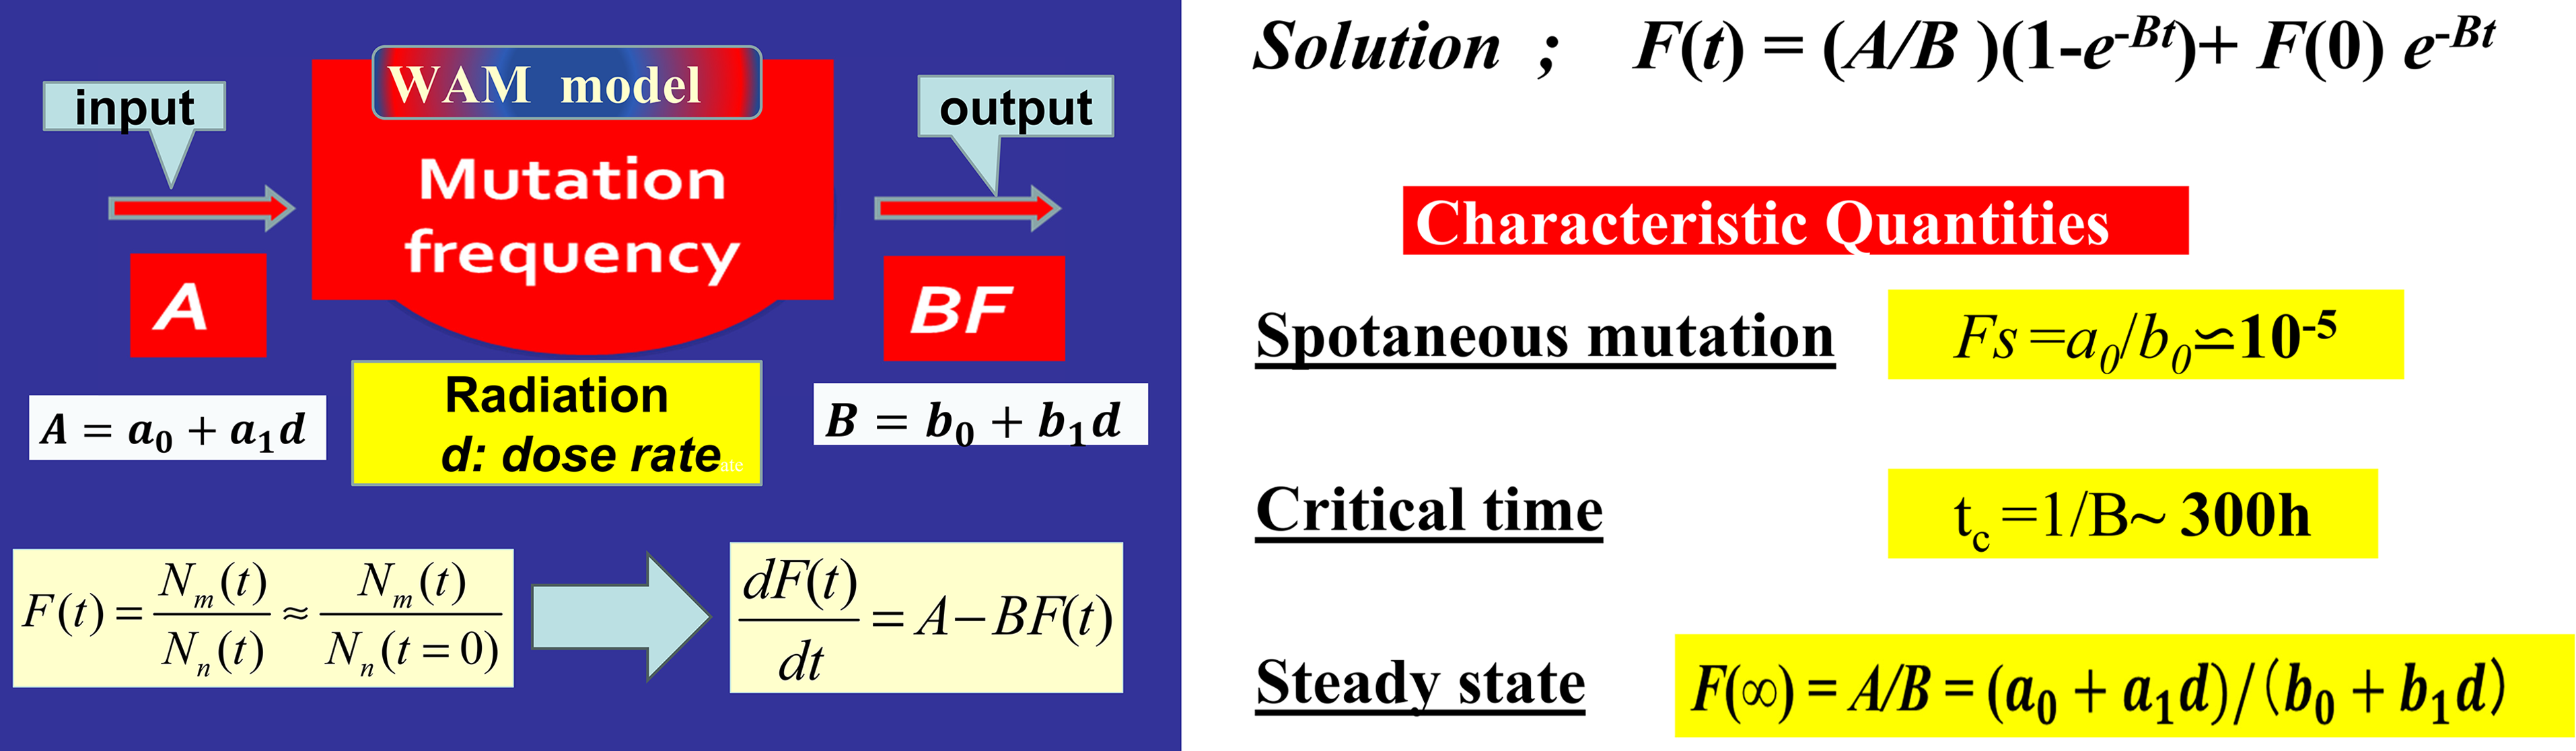
The mutation frequency F(t), where A and B represent the input and output reaction rates, respectively. Denoting the number of normal cells in a system as Nn and the number of mutant cells as Nm, the mutation frequency F(t) is defined as the ratio of the number of mutant cells to the total. Here, Nm is approximately one in 100,000 per gene, so we just approximate as F(t) = Nm/(Nn + Nm) ⋍ Nm/Nn.
Note that not only does F increase (term A), but it also includes the effect of the decrease due to the presence of term B. The right figure represents the solution for the case where the irradiation starts at time t = 0 and with a constant dose rate d, by taking the initial mutation frequency F (t = 0) together with several examples of the figures with different dose rates. Using this simple model, we analysed data from flies and mice. What was surprising about the results was that we were able to reproduce the data of flies and mice using just four common parameters, which we shall take in calculating various cases. The common four WAM parameters determined from mouse and fly data.


The fact that the same mechanism is exhibited across species at the cellular level encouraged us to confirm that a unified description can operate at the cellular level. The set of four WAM parameters common to flies and mice, thus determined, gives a powerful basis for our analysis. To better understand the characteristics of mutation frequency F derived from the WAM model, let us introduce four characteristic indices, F (∞) (Fs as well), Tc, and deff.
Steady states F (∞) and control value Fs: Fig. 2 shows F (D) for the case where radiation exposure starts at t = 0 with constant dose rate d with total dose D = dt. The mutation frequency F (see Fig. 1) tends to steady state with its value depending on d. Especially Fs corresponds to the steady state for the case d = 0, the value of which is directly calculated from a0 and b0; Fs≈10−5, which is named as ‘magic number’. Fig. 2 shows the D dependence of mutation frequency, tending to steady state with its value depending on d. Such dynamical steady state is the very result of preventing mechanism.
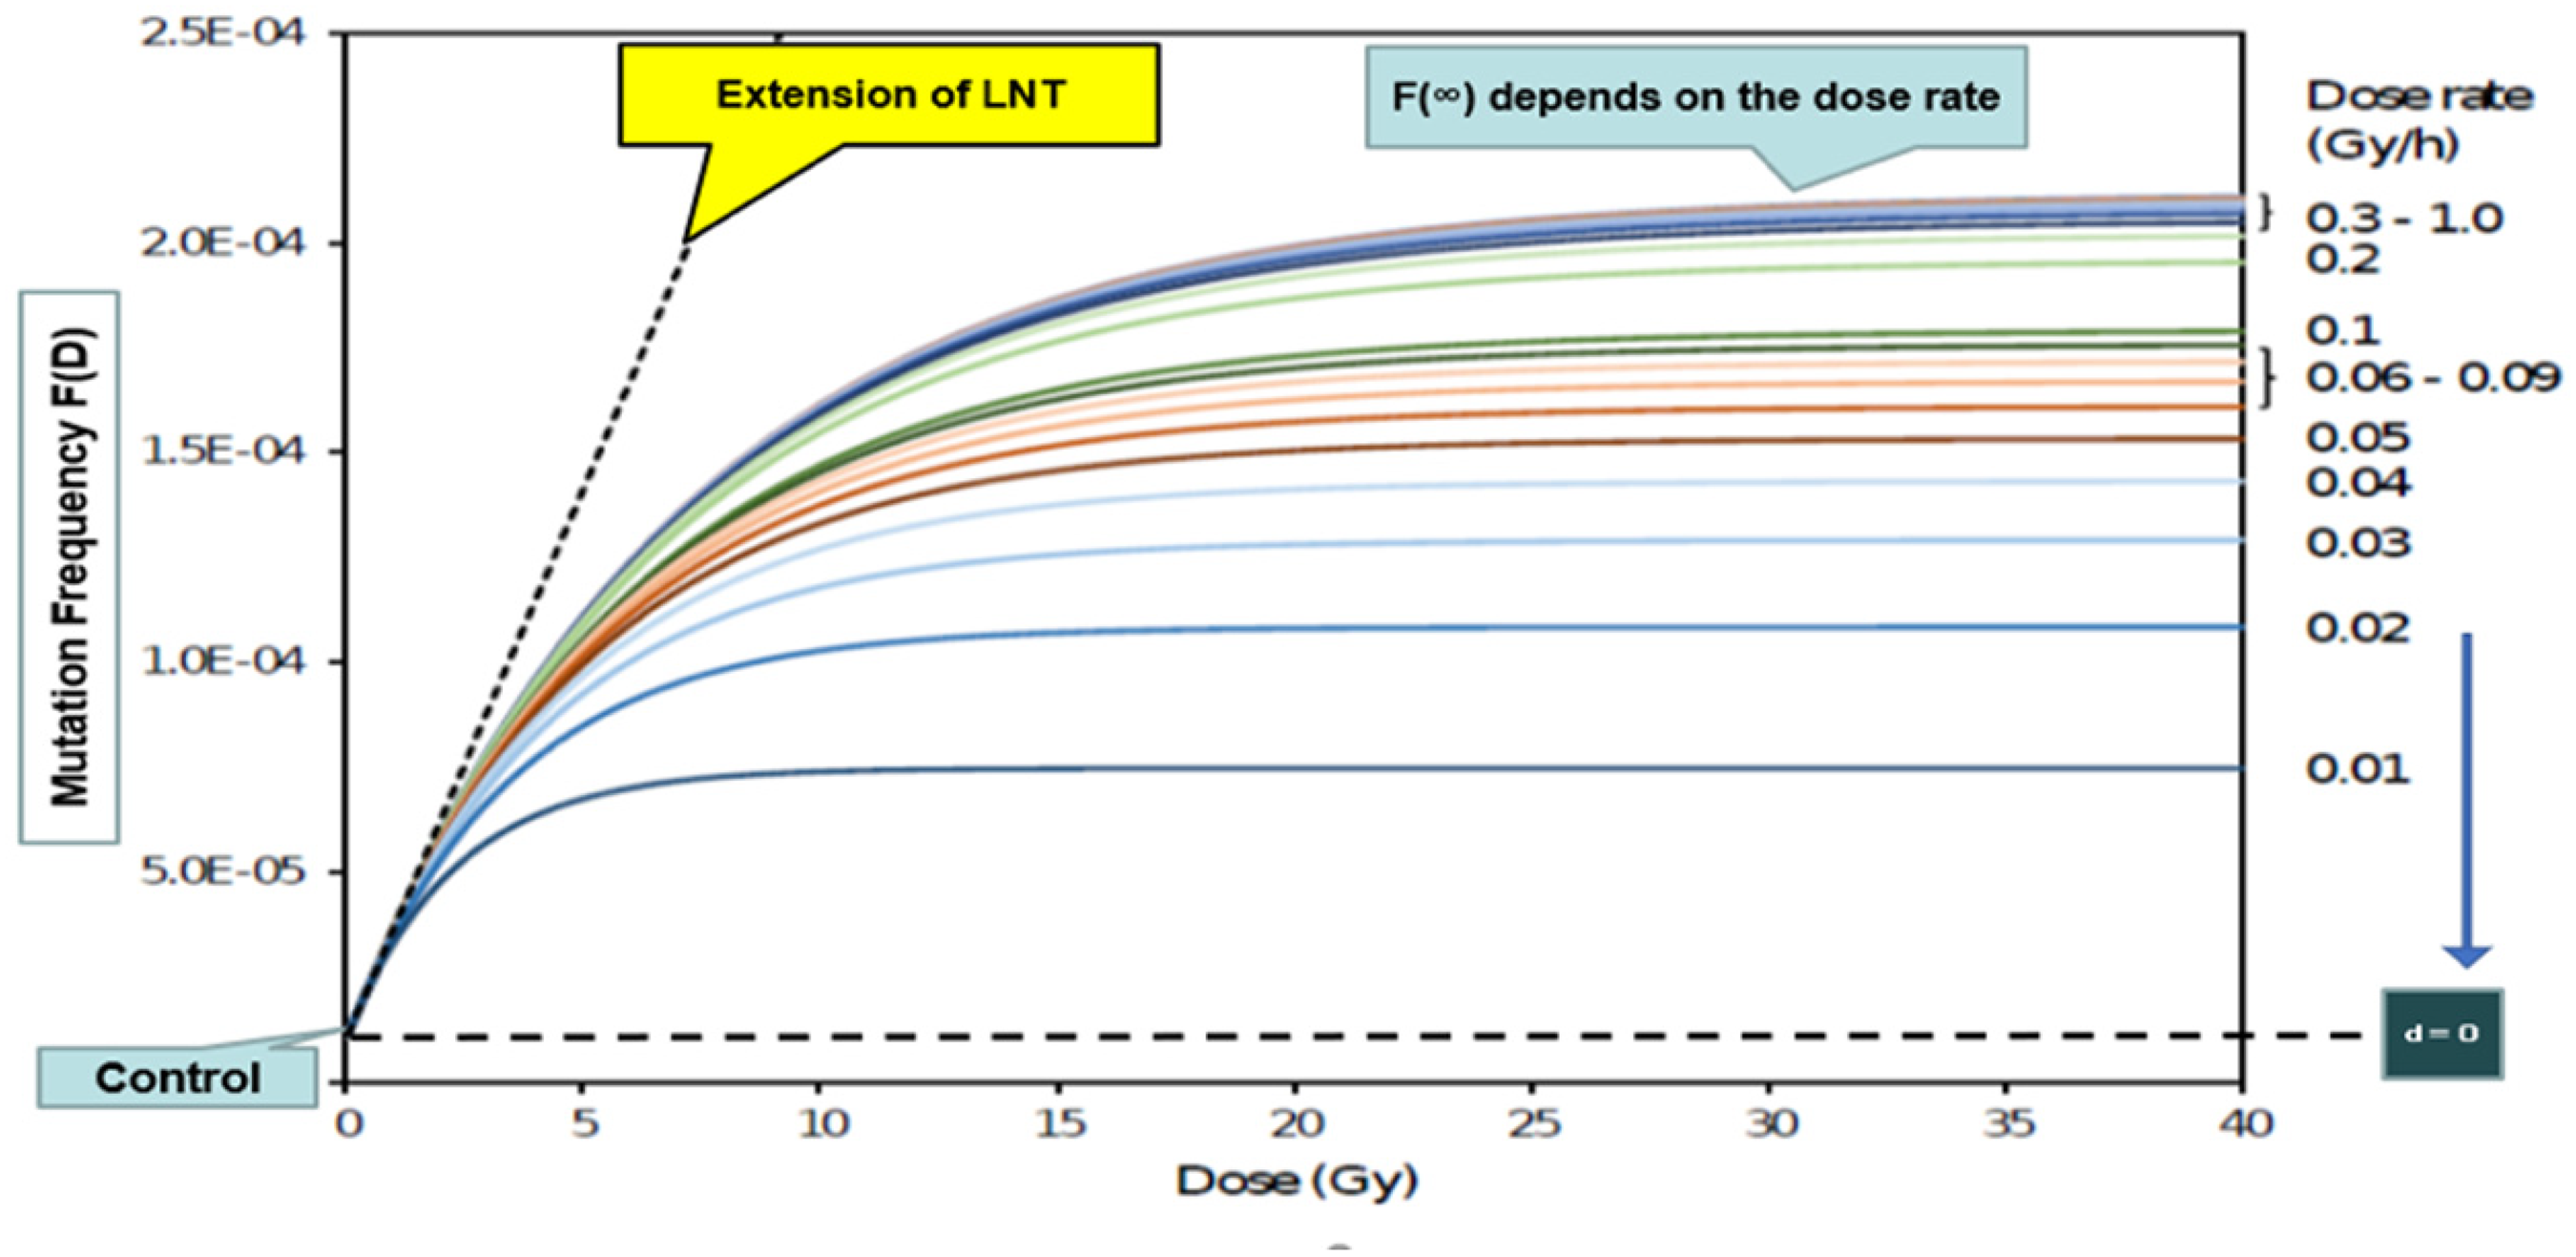
D dependence of F(D) approaching the dynamical steady state with its value depending on d.
Critical time Tc: From F(t) in Fig. 1, the time dependence comes from the term, e−Bt, which indicates the temporal evolution of F(t). For the usual case where the radiation exposure starts at t = 0, F(0) = Fs, then for
Before the Muller and Russell experiments (Russell et al., 1958), no data had been found to inform the dose rate dependence of mutation frequency over the past half century, and unfortunately, we have long lacked conclusive data to validate our WAM model because it requires the information of the data of dose rate as well as the time dependence of the mutation frequency. Indeed, the fly data had confirmed the LNT by a number of follow-up studies with a slope of almost constant dose rate. Furthermore, Lea’s (1955) hit theory gave theoretical support based on the famous hit theory. Therefore, almost all the subsequent data have been concerned only with the total dose and have never interested in the time variation or dose rate dependence. While in a book written by a historian of science, Jorgensen (2016), ‘After irradiation, when male rats were allowed to mate for a period of time, the mutation rate decreased dramatically. The longer this period lasted, the greater the decline. It goes down sharply in a few days, but continues to go down for about two months’. We tried to find such a description in Russell's articles, but we did not find any, and we have had no conclusive evidence up to now.
Effective dose rate which means ‘equivalent to cause endogenous mutation’ deff: The cell mutations that occur within a living organism are, in a sense, compensation for acquiring the energy necessary to maintain its activities. This is represented by a0 in a WAM model. Note that this effect amounts to almost 10,000 times that caused by natural radiation, as already pointed out by Muller and Smith (1930), and turns out to be common to both flies and mice. If we convert this value into the radiation dose rate that causes an equivalent mutation, how large will it be? Here we rewrite A = a0 + a1 = a1 (deff + d), and get deff ≂ 1 mGy h−1 which is to be compared with the average natural radiation dose rate about dn = 1 μGy day−1. We shall use this scale unit, natural radiation units ‘NDR’ in proposing a new standard description of biological effect caused by radiation.
While large-scale experiments as the mega-mouse project will never be possible again, recent whole-genome analysis has proved that with a single cell having almost a billion base pairs, just a few mice’s data can be comparable with the mega-mouse data! The Gondo experiment carried out at the Institute for Environmental Sciences (IES) was a daring challenge based on the advances in modern genome analysis and has given an ultra-low dose rate experimental result for the first time (Gondo, 2023). Here, the three data will be referred to as ‘MRG (Mueller–Russel–Gondo) data’. Since we have already described the characteristic features of the WAM model, the reader may guess the answer to the question, ‘Why do the mouse and fly data show quite different behaviour?’. Yes, the difference in lifespan between flies and mice was important. In the short-lived flies, experimental results from short-term irradiation at high dose rates, and in the mice, long-term irradiation experiments at relatively low dose rates by the trading company provided data in areas where the LNT approximation could not be applied, and Gondo's data finally confirmed results in the dynamic steady-state regime from long-term irradiation at extremely low dose rates.
The data of Gondo finally showed results in the dynamic steady state region due to long-term irradiation at extremely low dose rates (Toki et al., 2023). This situation is illustrated in the left-hand diagram of Fig. 3, where the MRG data belonged to the red, white (transition region), and equilibrium (blue) state regions, respectively. It is important to note the time-dependent changes in mutation frequency (Fig. 4). For the first time, Gondo's data revealed a deviation from the LNT, and Fig. 5 shows that the mutation does not increase even after long-term irradiation. Importantly, the organism's stamina lies in the presence of the organism's robust resilience, rather than in the presence or absence of a threshold.
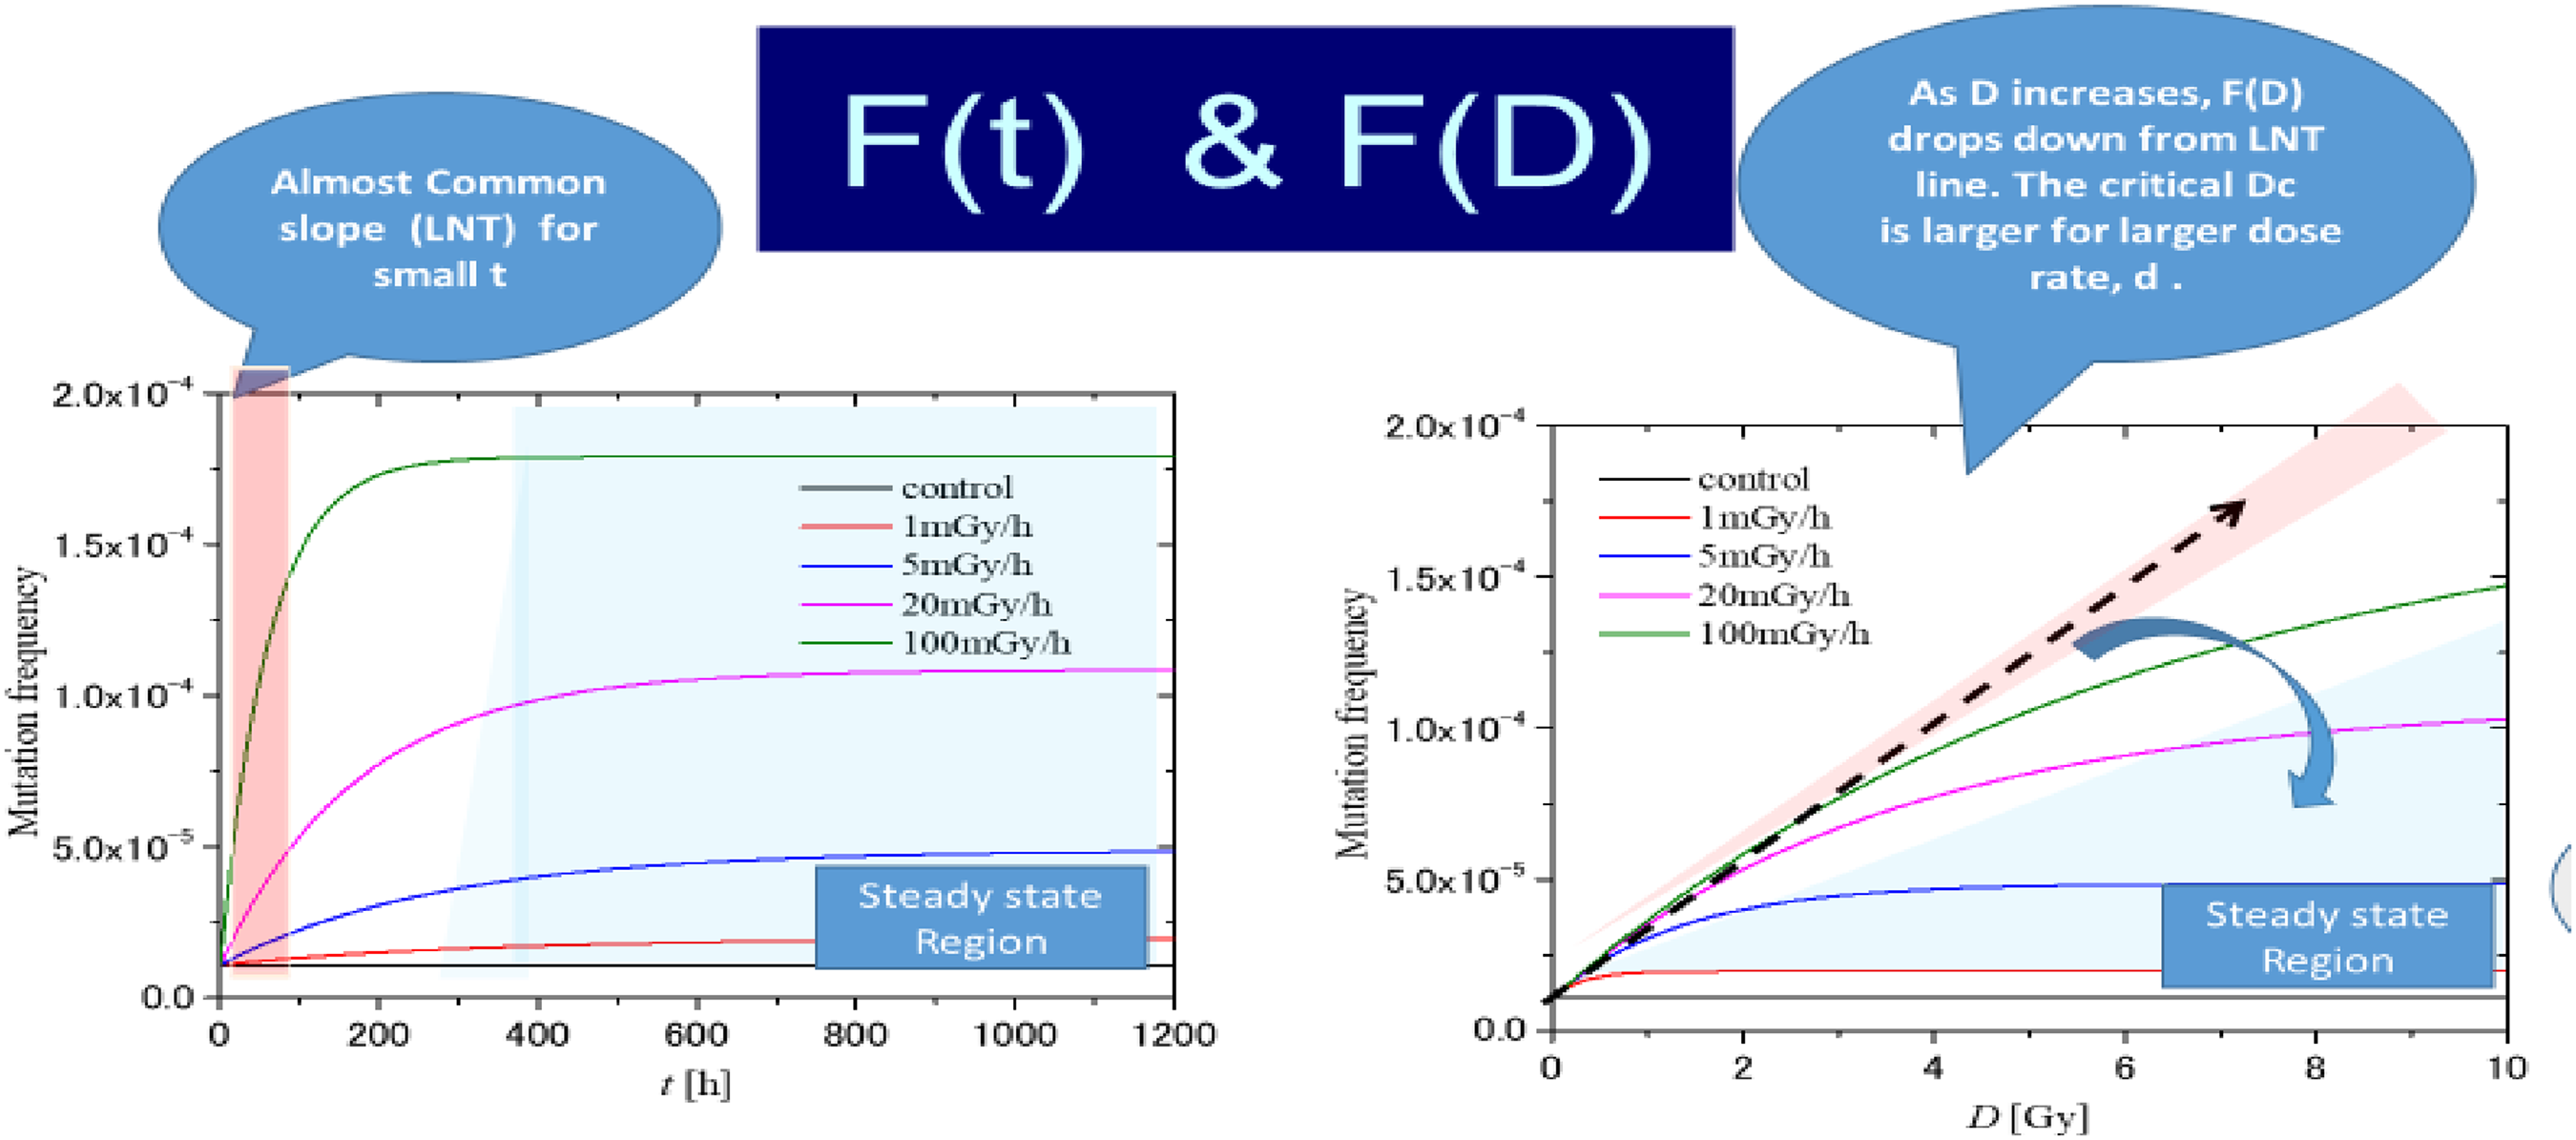
Mutation frequency F(t) vs F(D). The red, white, and blue regions in the graph are the LNT approximal region, the transition region, and the steady-state region, respectively.
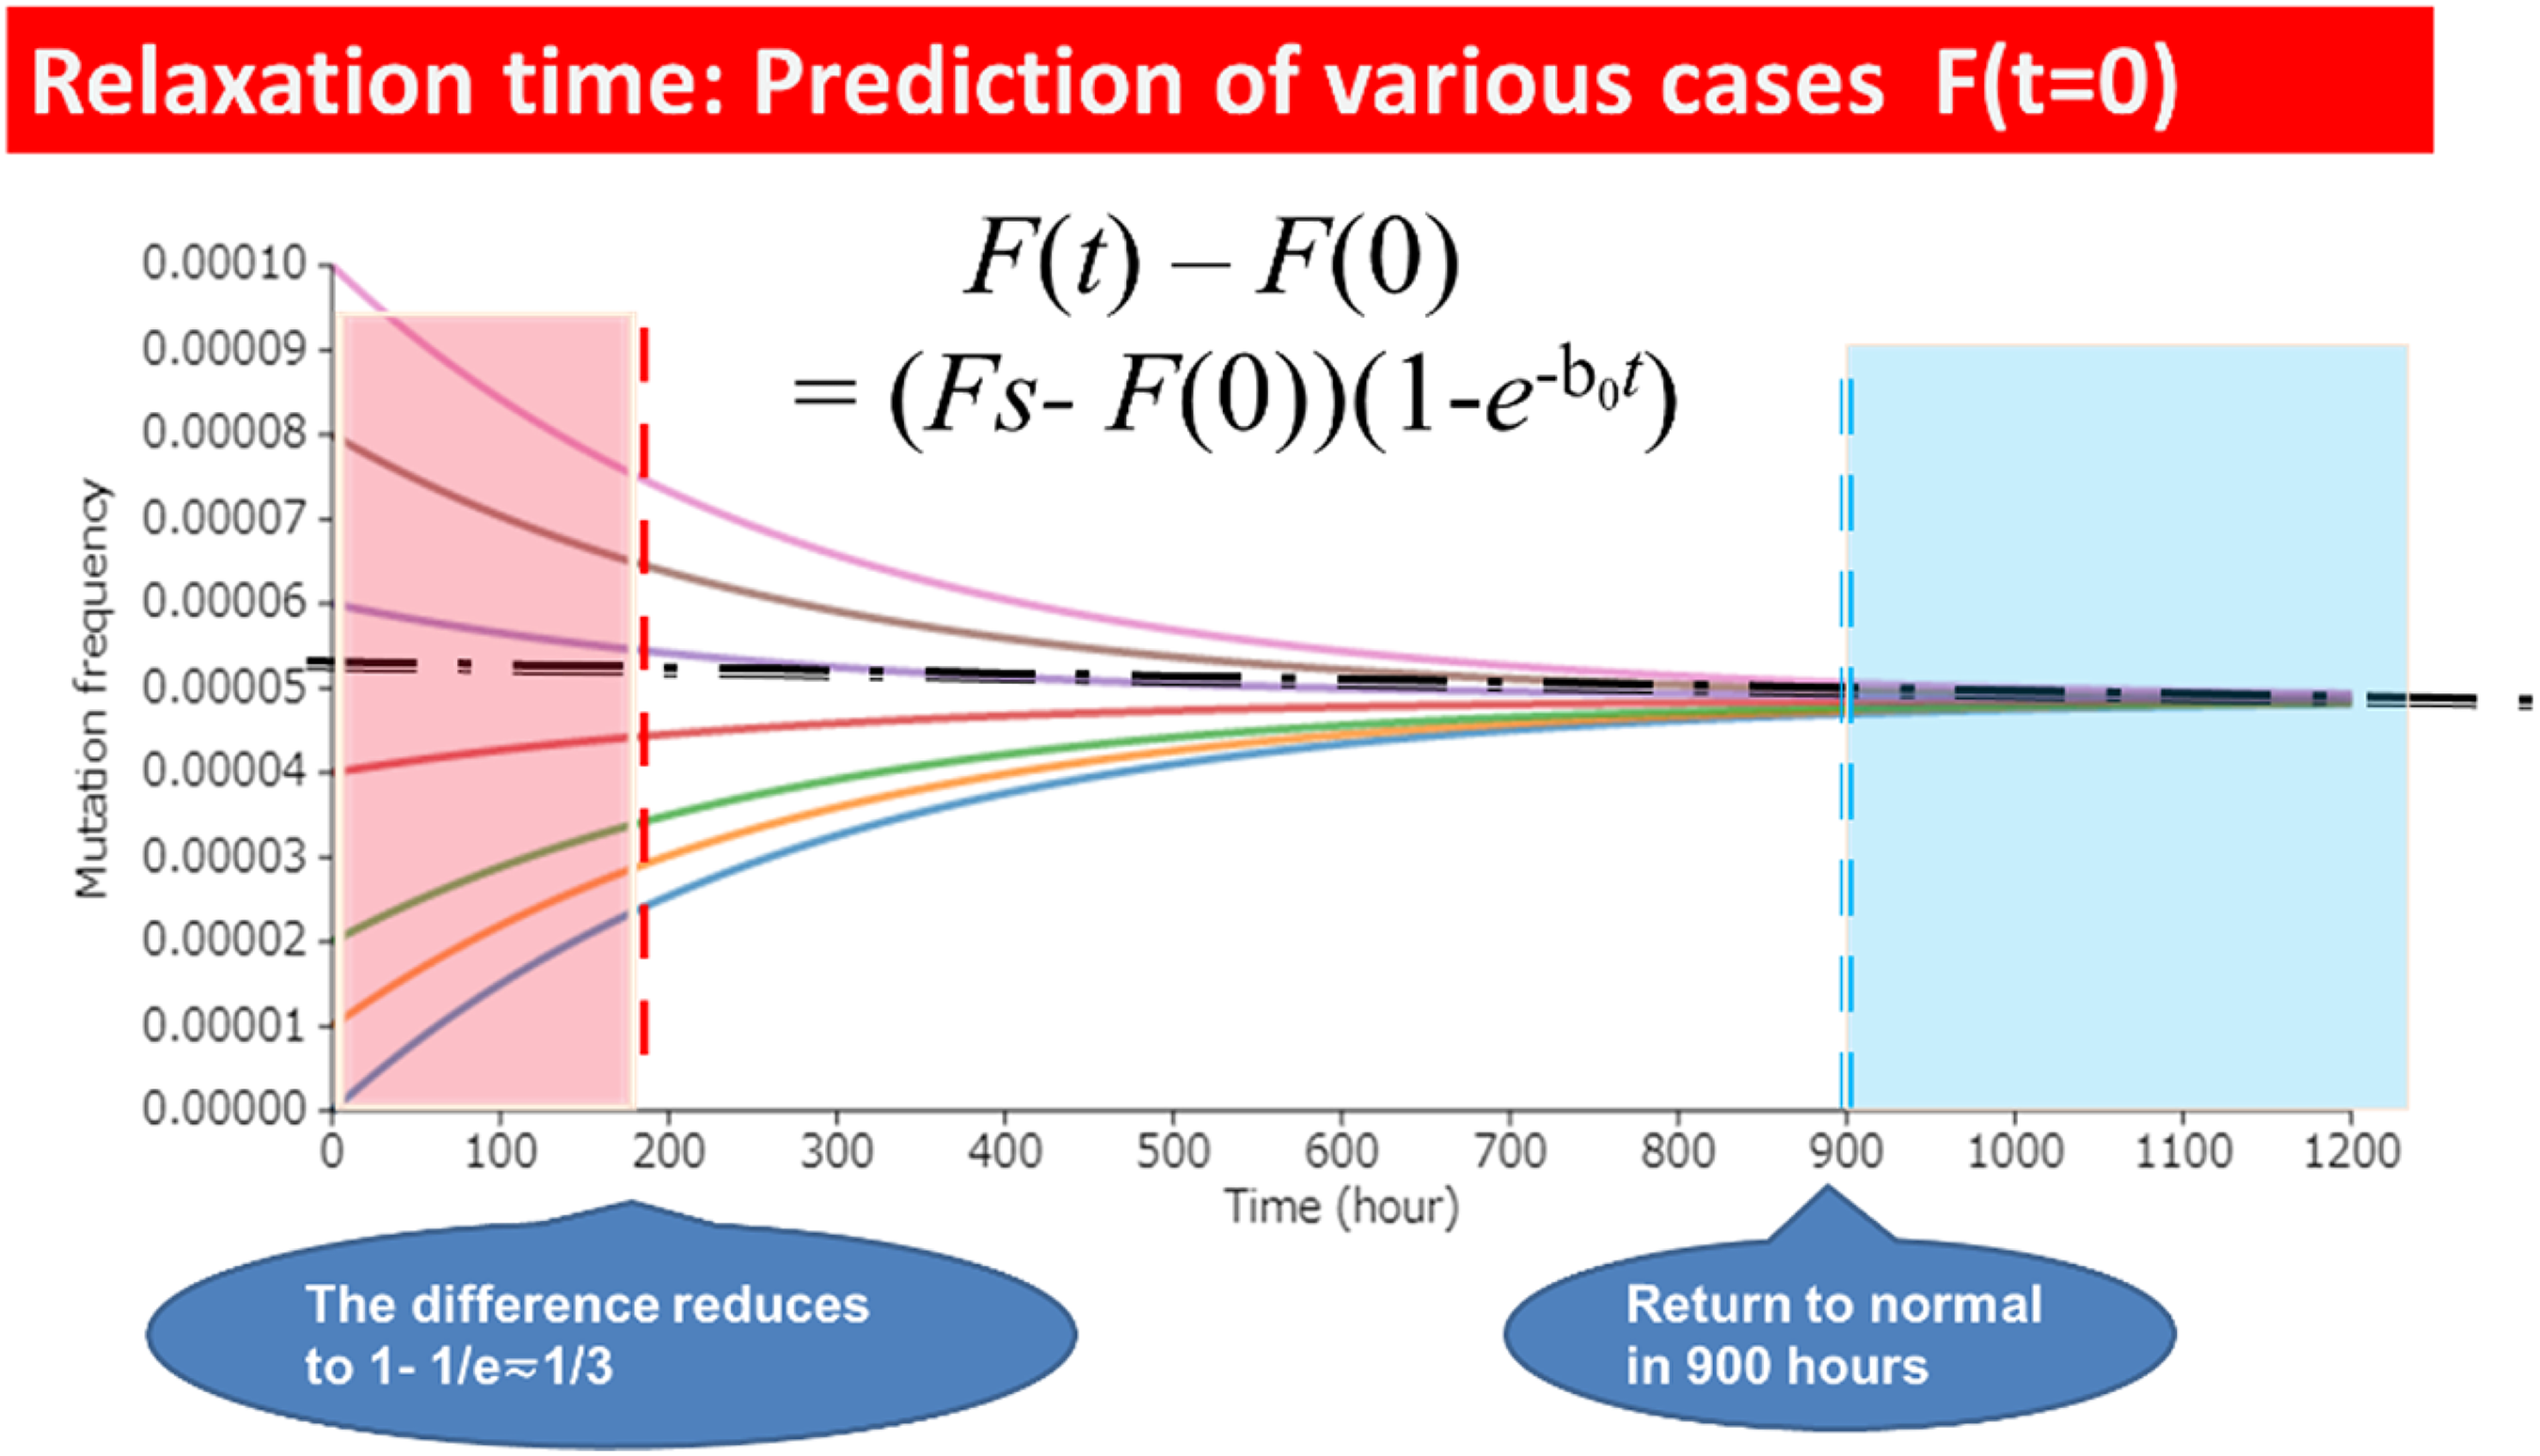
The behaviour of the mutation frequency F(t) under various values of the initial condition F(0).
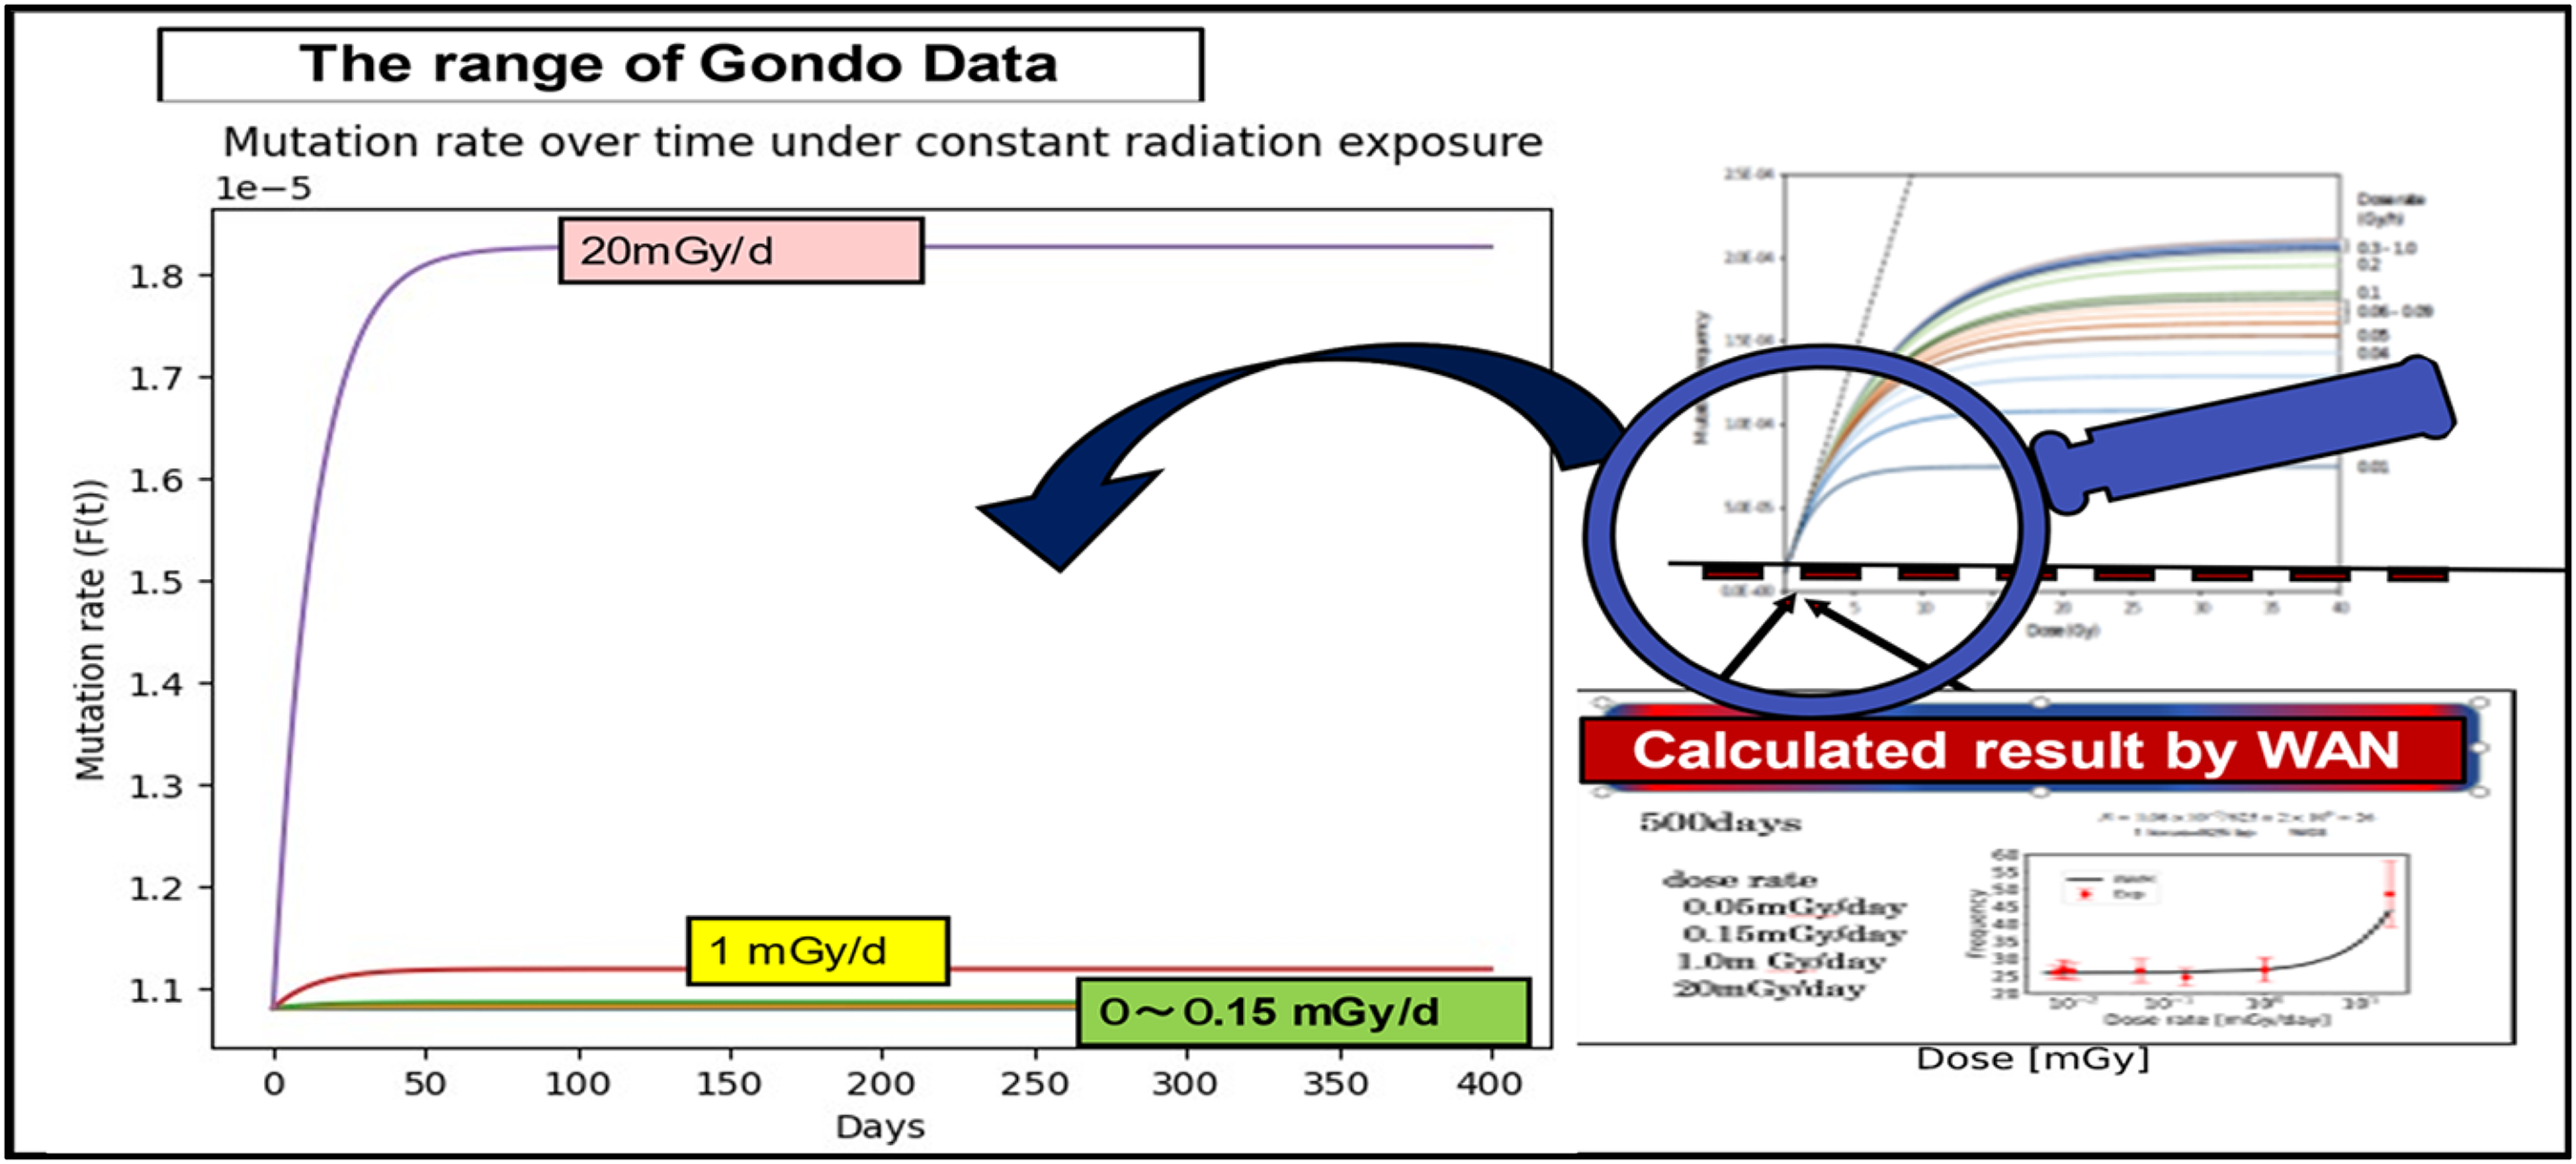
The calculated results of Gondo data cover the region of a relatively total high-dose region even with a very low dose rate by taking a long-term irradiation interval. We focus on such regions by magnifying the figures of the results.
Because dose rates have a greater impact on mutations than total doses, we would like to propose a new criterion for dose assessment. This is from the viewpoint that risk assessment should be based on the natural radiation doses we receive daily. We believe that this is easier for the public to understand quantitatively in our daily lives as shown in Fig. 6. We would like to ask for your criticism of the radiation map we have drawn up, which describes how the natural radiation units (NDR) should be used. Indeed, the WAM enabled a unified understanding of control and external stimuli.
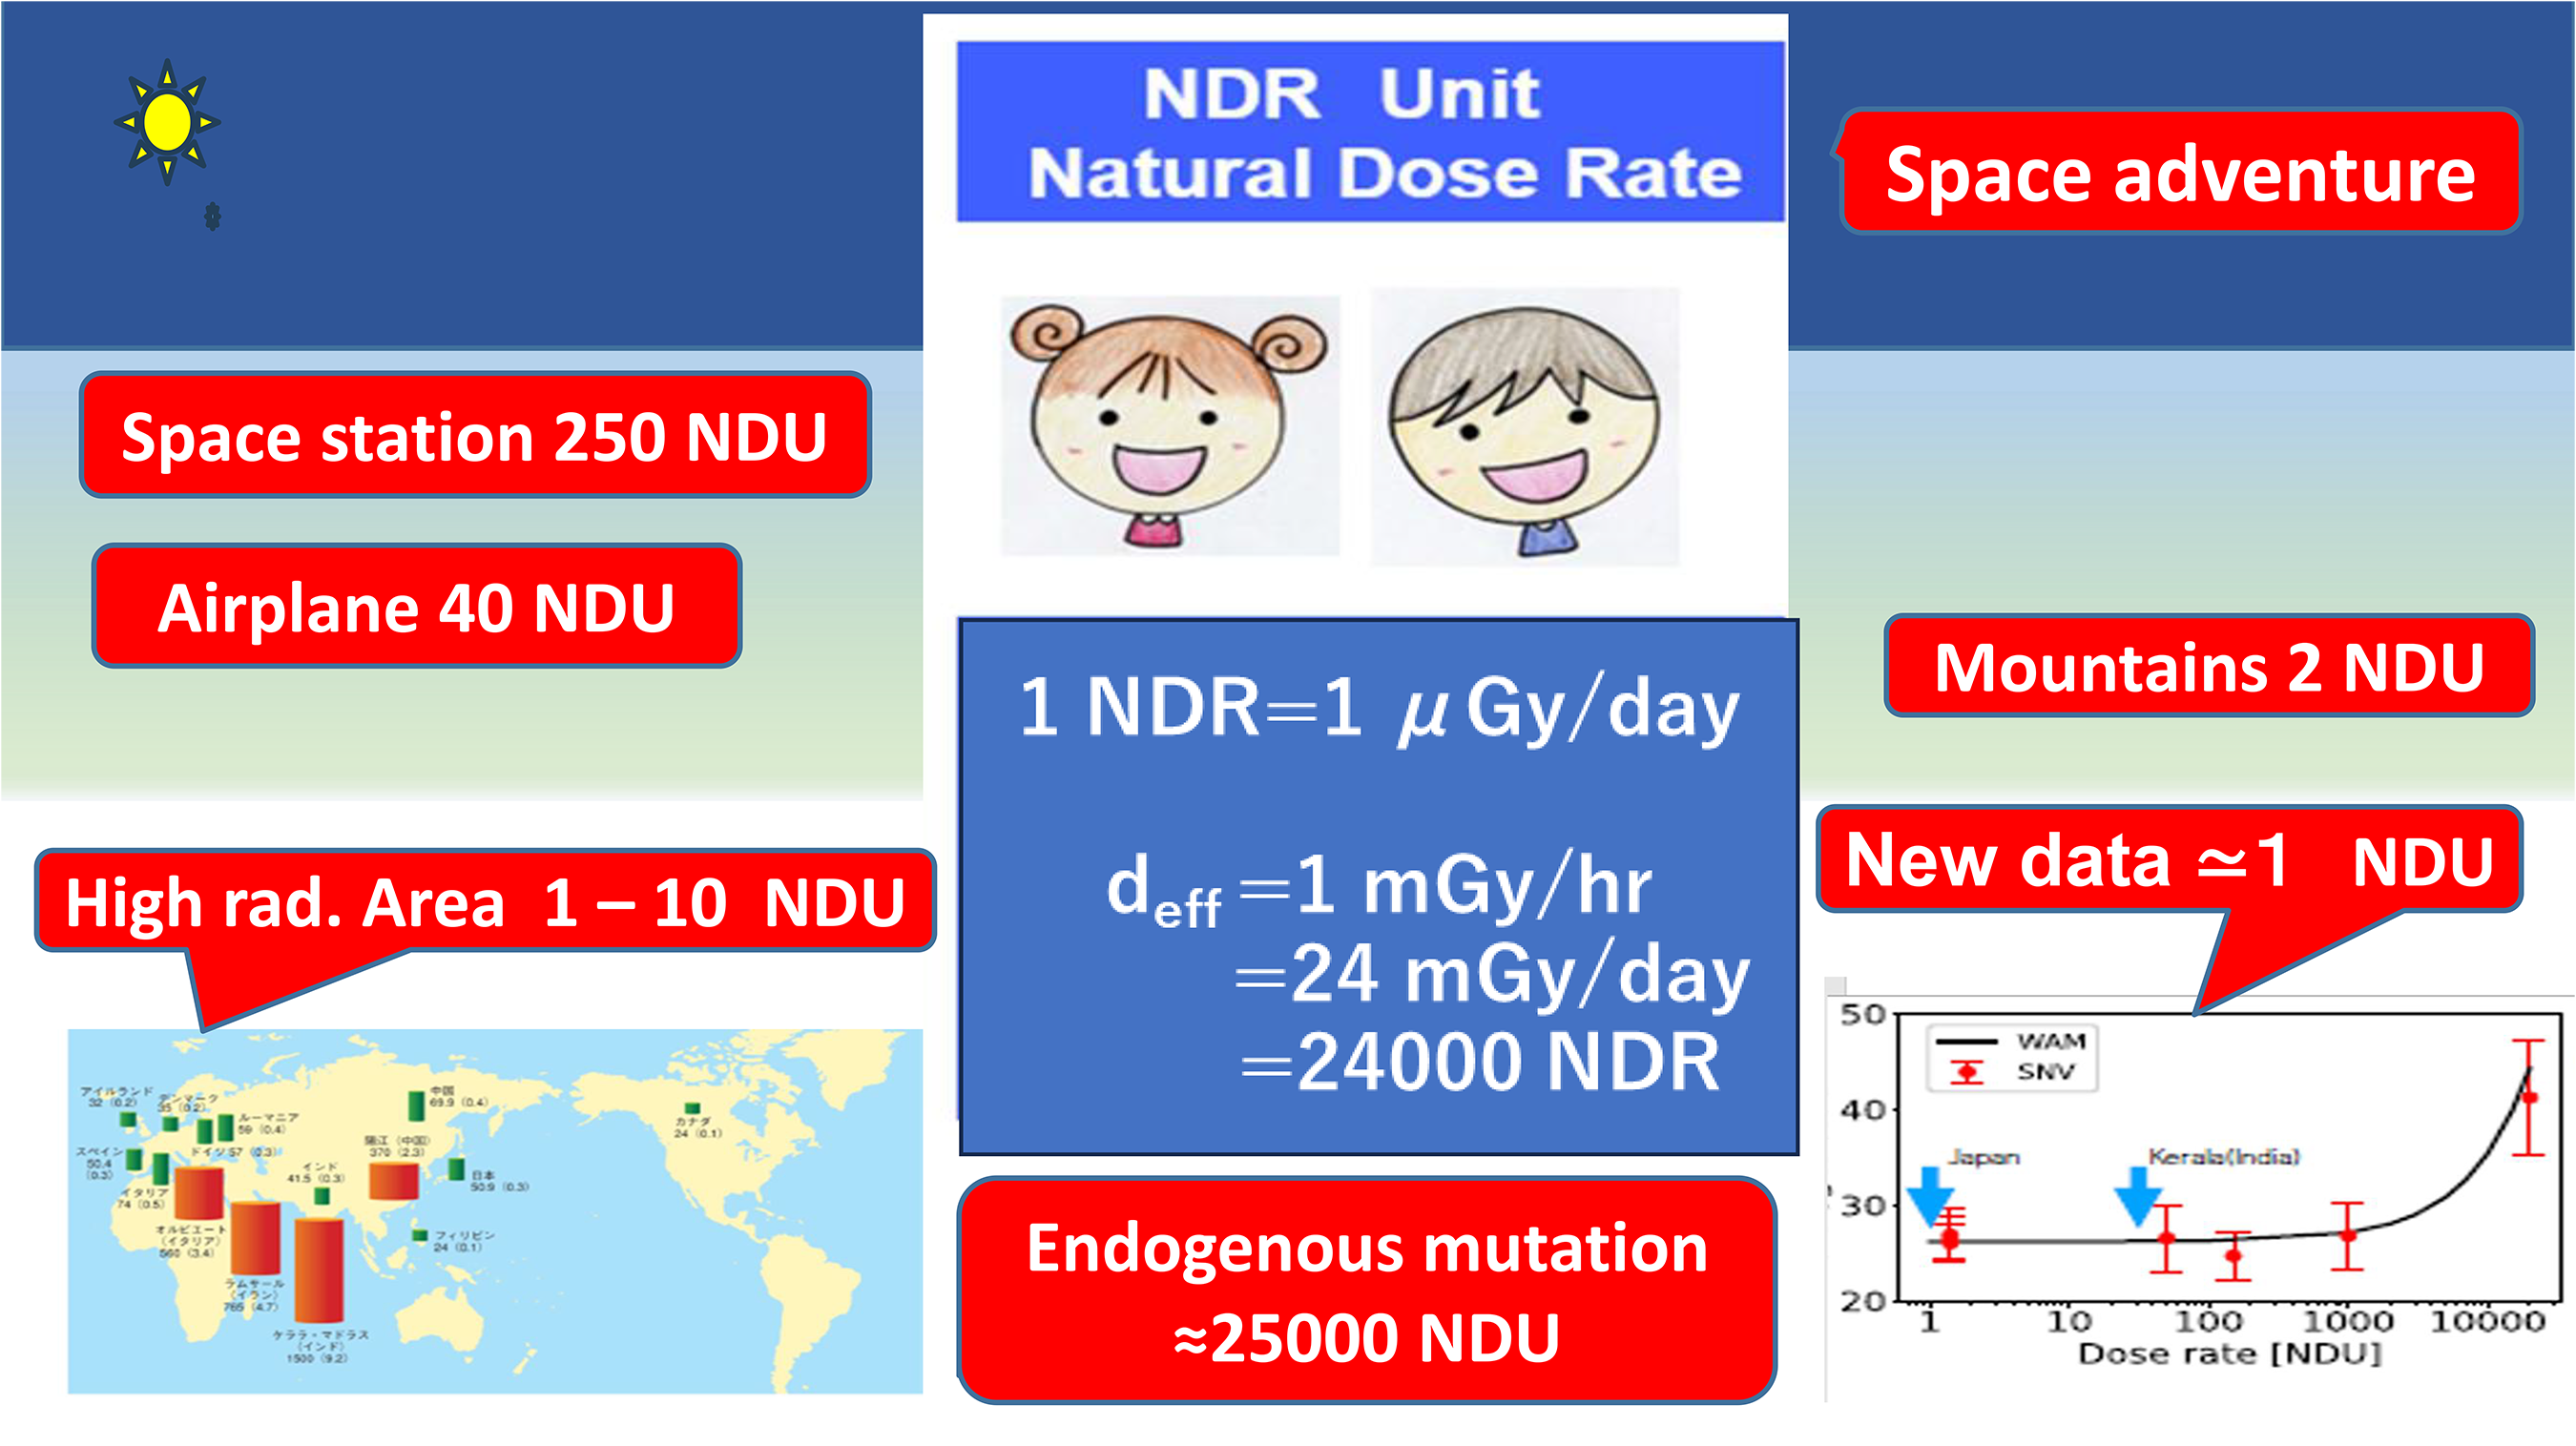
Proposal of radiation map referring to radiation dose rate, expressing NDR units.
We are now in an era where the entire genome can be read. MRG data teach us, ‘Life activities such as cell proliferation that take place in living organisms constantly generate and consume energy, but in return, they cause cell mutations’. It is the fate of living organisms to tolerate mutations as long as they are alive and active. The day will soon come when mankind will learn how to overcome this obstacle and will be able to fly out into space with a radiation map in hand.
Footnotes
ACKNOWLEDGEMENTS
This work was supported by the Research Project on the Health Effects of Radiation organised by the Ministry of the Environment, Japan.