
Abstract
This retrospective study explored the impact of patient size, as characterised by body mass index (BMI), on CT dose indices [CTDIvol and dose–length product (DLP)] across five clinical indications. Analysing 1743 CT scan exams within five BMI categories defined by the Qatar obesity guidelines and covering five clinical indications, data were collected from two CT models of the same manufacturer. The results consistently demonstrated a proportional increase in CTDIvol values with rising BMI: ∼140% for overweight individuals, ∼180% for obese class I, ∼240% for obese class II, and ∼310% for obese class III. Notably, grossly overweight patients received approximately 140% more dose than that of those with normal weight, and obese class I patients required twice the standard dose. These findings underscore the influence of BMI, clinical indication, and machine model on CT scan radiation, highlighting the crucial need for personalised dose considerations. It contributes valuable insights into the nuanced correlation between BMI and radiation dose, guiding the development of a tailored facility dose reference level to improve optimisation process within the RDM software. It identifies factors in high-alert cases beyond obesity or multiple scans, facilitating the monitoring and comparison of doses across healthcare facilities, and support implementation of new scanning protocols.
Keywords
INTRODUCTION
Over the past 10 years, there have been significant technological advancements in the field of computed tomography (CT) scanning, resulting in rapid and precise diagnostics for physicians (Brenner and Hall, 2007; iData Research, 2022). Consequently, healthcare professionals are keen on upholding best practices by enhancing imaging methods, optimising patient radiation exposure, and ensuring the ongoing safety of radiation usage (ICRP 31/2001) (Thrall, 2012; ICRP, 2022). They track individual doses for ionising radiation procedures and comply with the new European basic standards (BSS) and the International Atomic Energy Agency (IAEA) (EU-OSHA, 2013), mandating dose reference levels (DRLs) in all medical imaging sites (SoR, 2020; IAEA, 2022). Introduced in early 2018, radiation dose monitoring became mandatory following IAEA; it plays a key role by tracking data from different modalities, offering a colour-coded overview of patient dose (Medsquare, 2022). It was defined as quality assurance and quality improvement tools for controlling radiation dose based on the DRLs which offer guidance in the process of reducing the dose under typical conditions for standard patient size (70–90 kg). First introduced for diagnostic radiology examinations as it is indicated by the publication (Vassileva and Rehani, 2014; IAEA, 2022), the DRLs are derived from data collected for standard examinations performed on standard-sized patients or phantoms and have been introduced by many professional and regulatory organisations, such as the International Commission on Radiological Protection, the American College of Radiology (ACR), the American Association of Physicists in Medicine, the UK Health Protection Agency, IAEA, and the European Commission as a practical tool that promotes dose optimisation and enhances awareness of radiation dose delivered to the patient. However, this level can be exceeded for some reasons, as indicated by the red colour notice in radiation dose management (RDM) software, and it is important to initiate an investigation to justify the matter. To enhance the effectiveness of the RDM software, it is advisable to optimise and establish facility DRLs involving all the variations that affect the CT doses [protocols, body mass index (BMI), CT models] (O’Neill et al., 2018; AlNaemi et al., 2020). This stratification, addressing the variations in CT protocols, allowing the identification of technical-related factors, and creating specific DRLs for obese cases, ensures that higher doses are administered when necessary for accurate imaging in these patients, contributing to optimised image quality and reduced risk of future repeats or additional scans.
MATERIALS AND METHODS
Ethical approval for the study was granted by the Hamad Medical Corporation (HMC) Medical Research Center. At HMC all CT examination protocols are determined and justified by clinical imaging radiologists based on the patient’s clinical indication. While most cases adhere to these protocols, adjustment may occur for incidental findings, ensuring accurate reports. Considering factors influencing radiation dose in computed tomography [protocols, scanner model, patient-specific variations (BMI)] (Shohji et al., 2018), a personalised approach recognises the impact of BMI variations (ICRP, 2017; Moghadam et al., 2021), acknowledging that different BMI levels may require adjustments in radiation exposure for optimal imaging.
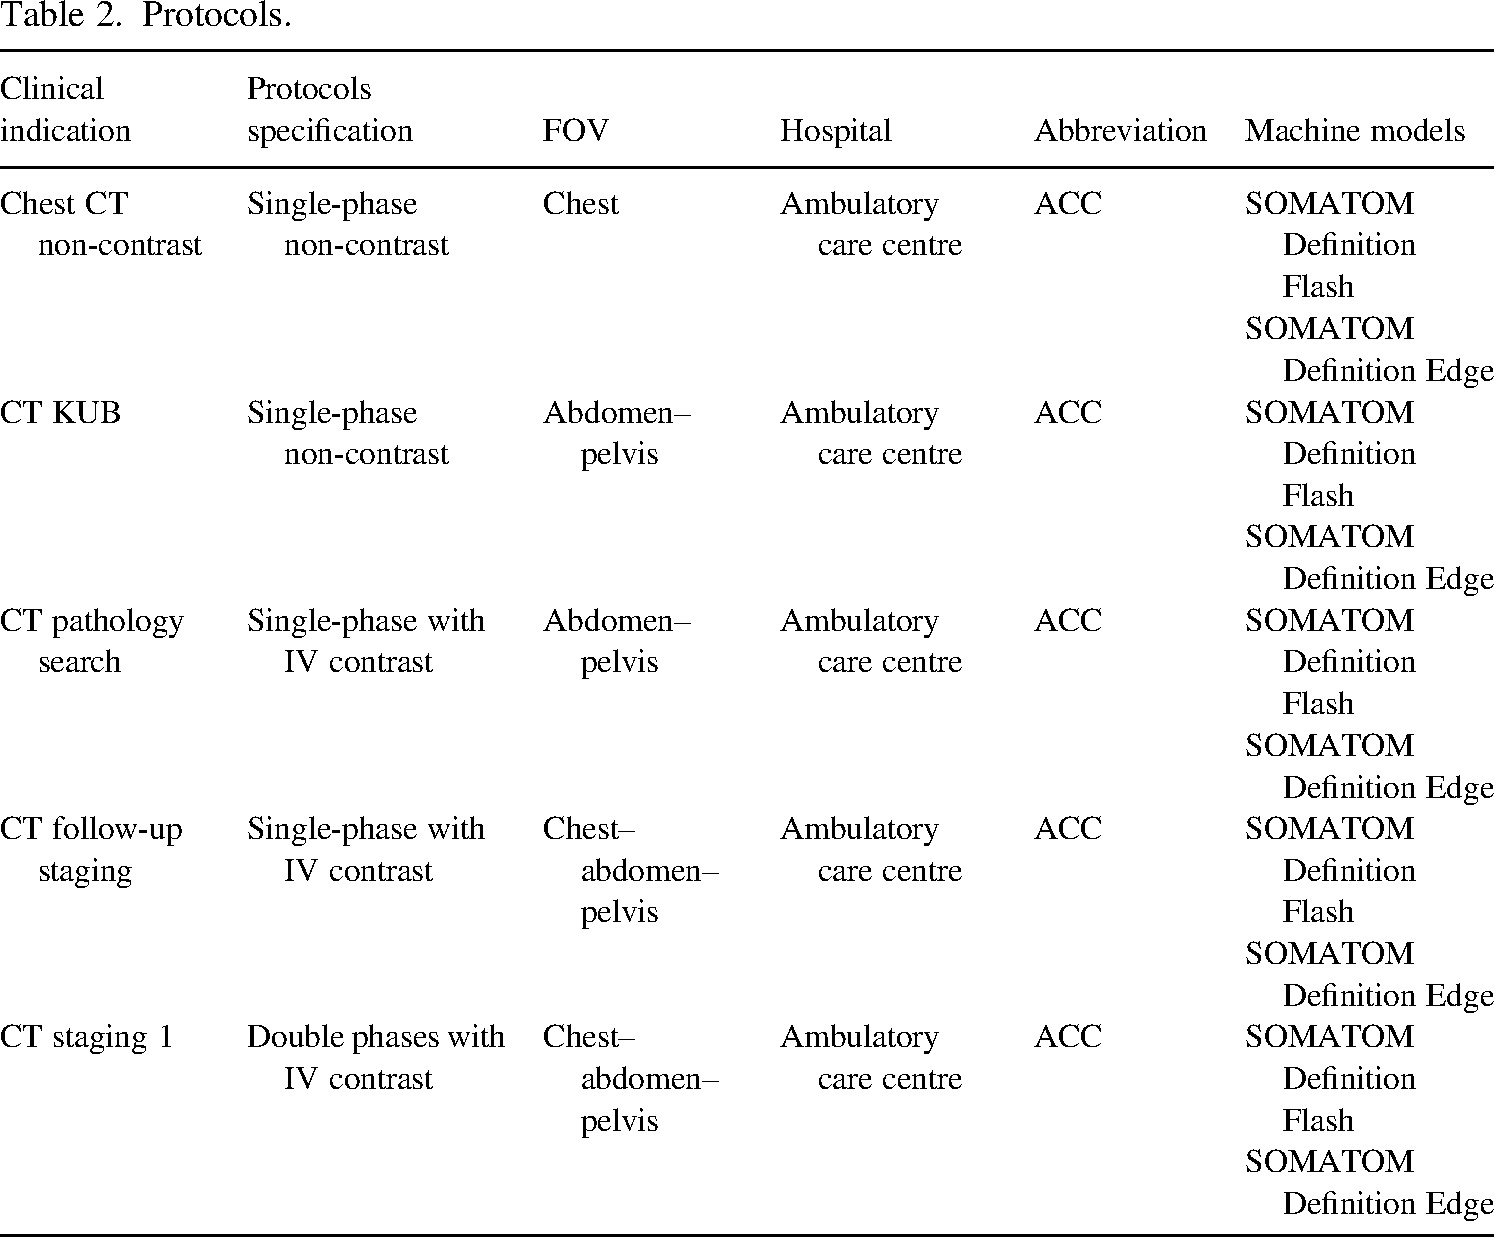
For comprehensive stratification, assessment, and comparison of CT doses, we adopted a two-pronged strategy. Firstly, we employ the accurate nomenclature (protocol’s name); secondly, the RDM software incorporates five BMI categories aligning with Qatar national guidelines (Tables 1 and 2). In the third step, the technical staff underwent education and training to ensure the use of accurate nomenclature. Moving to the fourth step, the data were collected retrospectively from the RDM software involved in two different machine models, encompassing essential parameters such as patient age, weight, height, BMI, kV, mAs, number of phases, machine models, CT dose index (CTDIvol), dose–length product (DLP), in an Excel sheet. The study involves all adult outpatients from the Ambulatory Care Center (ACC) Clinical Imaging Department CT scan section, spanning various BMI categories and undergoing a range of CT scan examinations. The image was individually reviewed to eliminate any technical defects [e.g. centring, position, and large field of view (FOV)] or artefact that could impact image quality.
The Qatar guidelines for obesity classification.
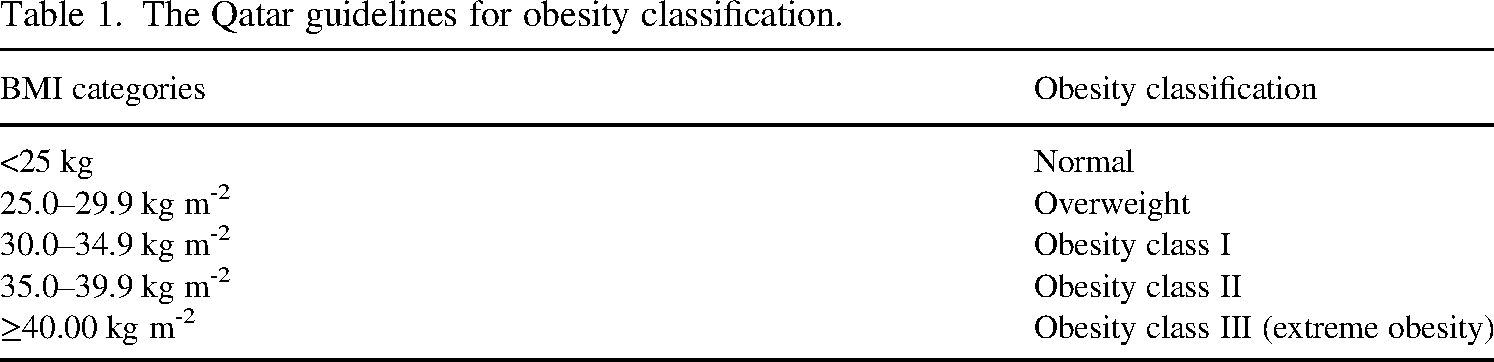
The Qatar guidelines for obesity classification.
Protocols.
The study conducts a retrospective analysis of data adhering to ICRP Publication 135 guidelines, which recommends setting facility DRLs at 50th percentiles of CTDIvol and DLP medians within a specific group, comparing them with national DRLs per procedure.
The procedural steps were as follows:
Median calculation: Estimate the median for each clinical indication and BMI category. 75th percentile determination: Determine the 75th percentile for all medians across each clinical indication and BMI category. Facility DRLs (50th percentile): Designate the 50th percentile as the facility-specific DRLs.
Analysis of 1743 CT scan exams, ∼20 per clinical indication, per BMI, and per CT models, revealed that higher BMI correlated with increased CTDIvol values compared to the reference dose for normal BMI individuals (set at 100%): Overweight patients required approximately 140% of the reference dose, obese class I patients required about 180%, obese class II patients necessitated around 240%, and obese class III patients demanded approximately 310% (Figs. 1–5).
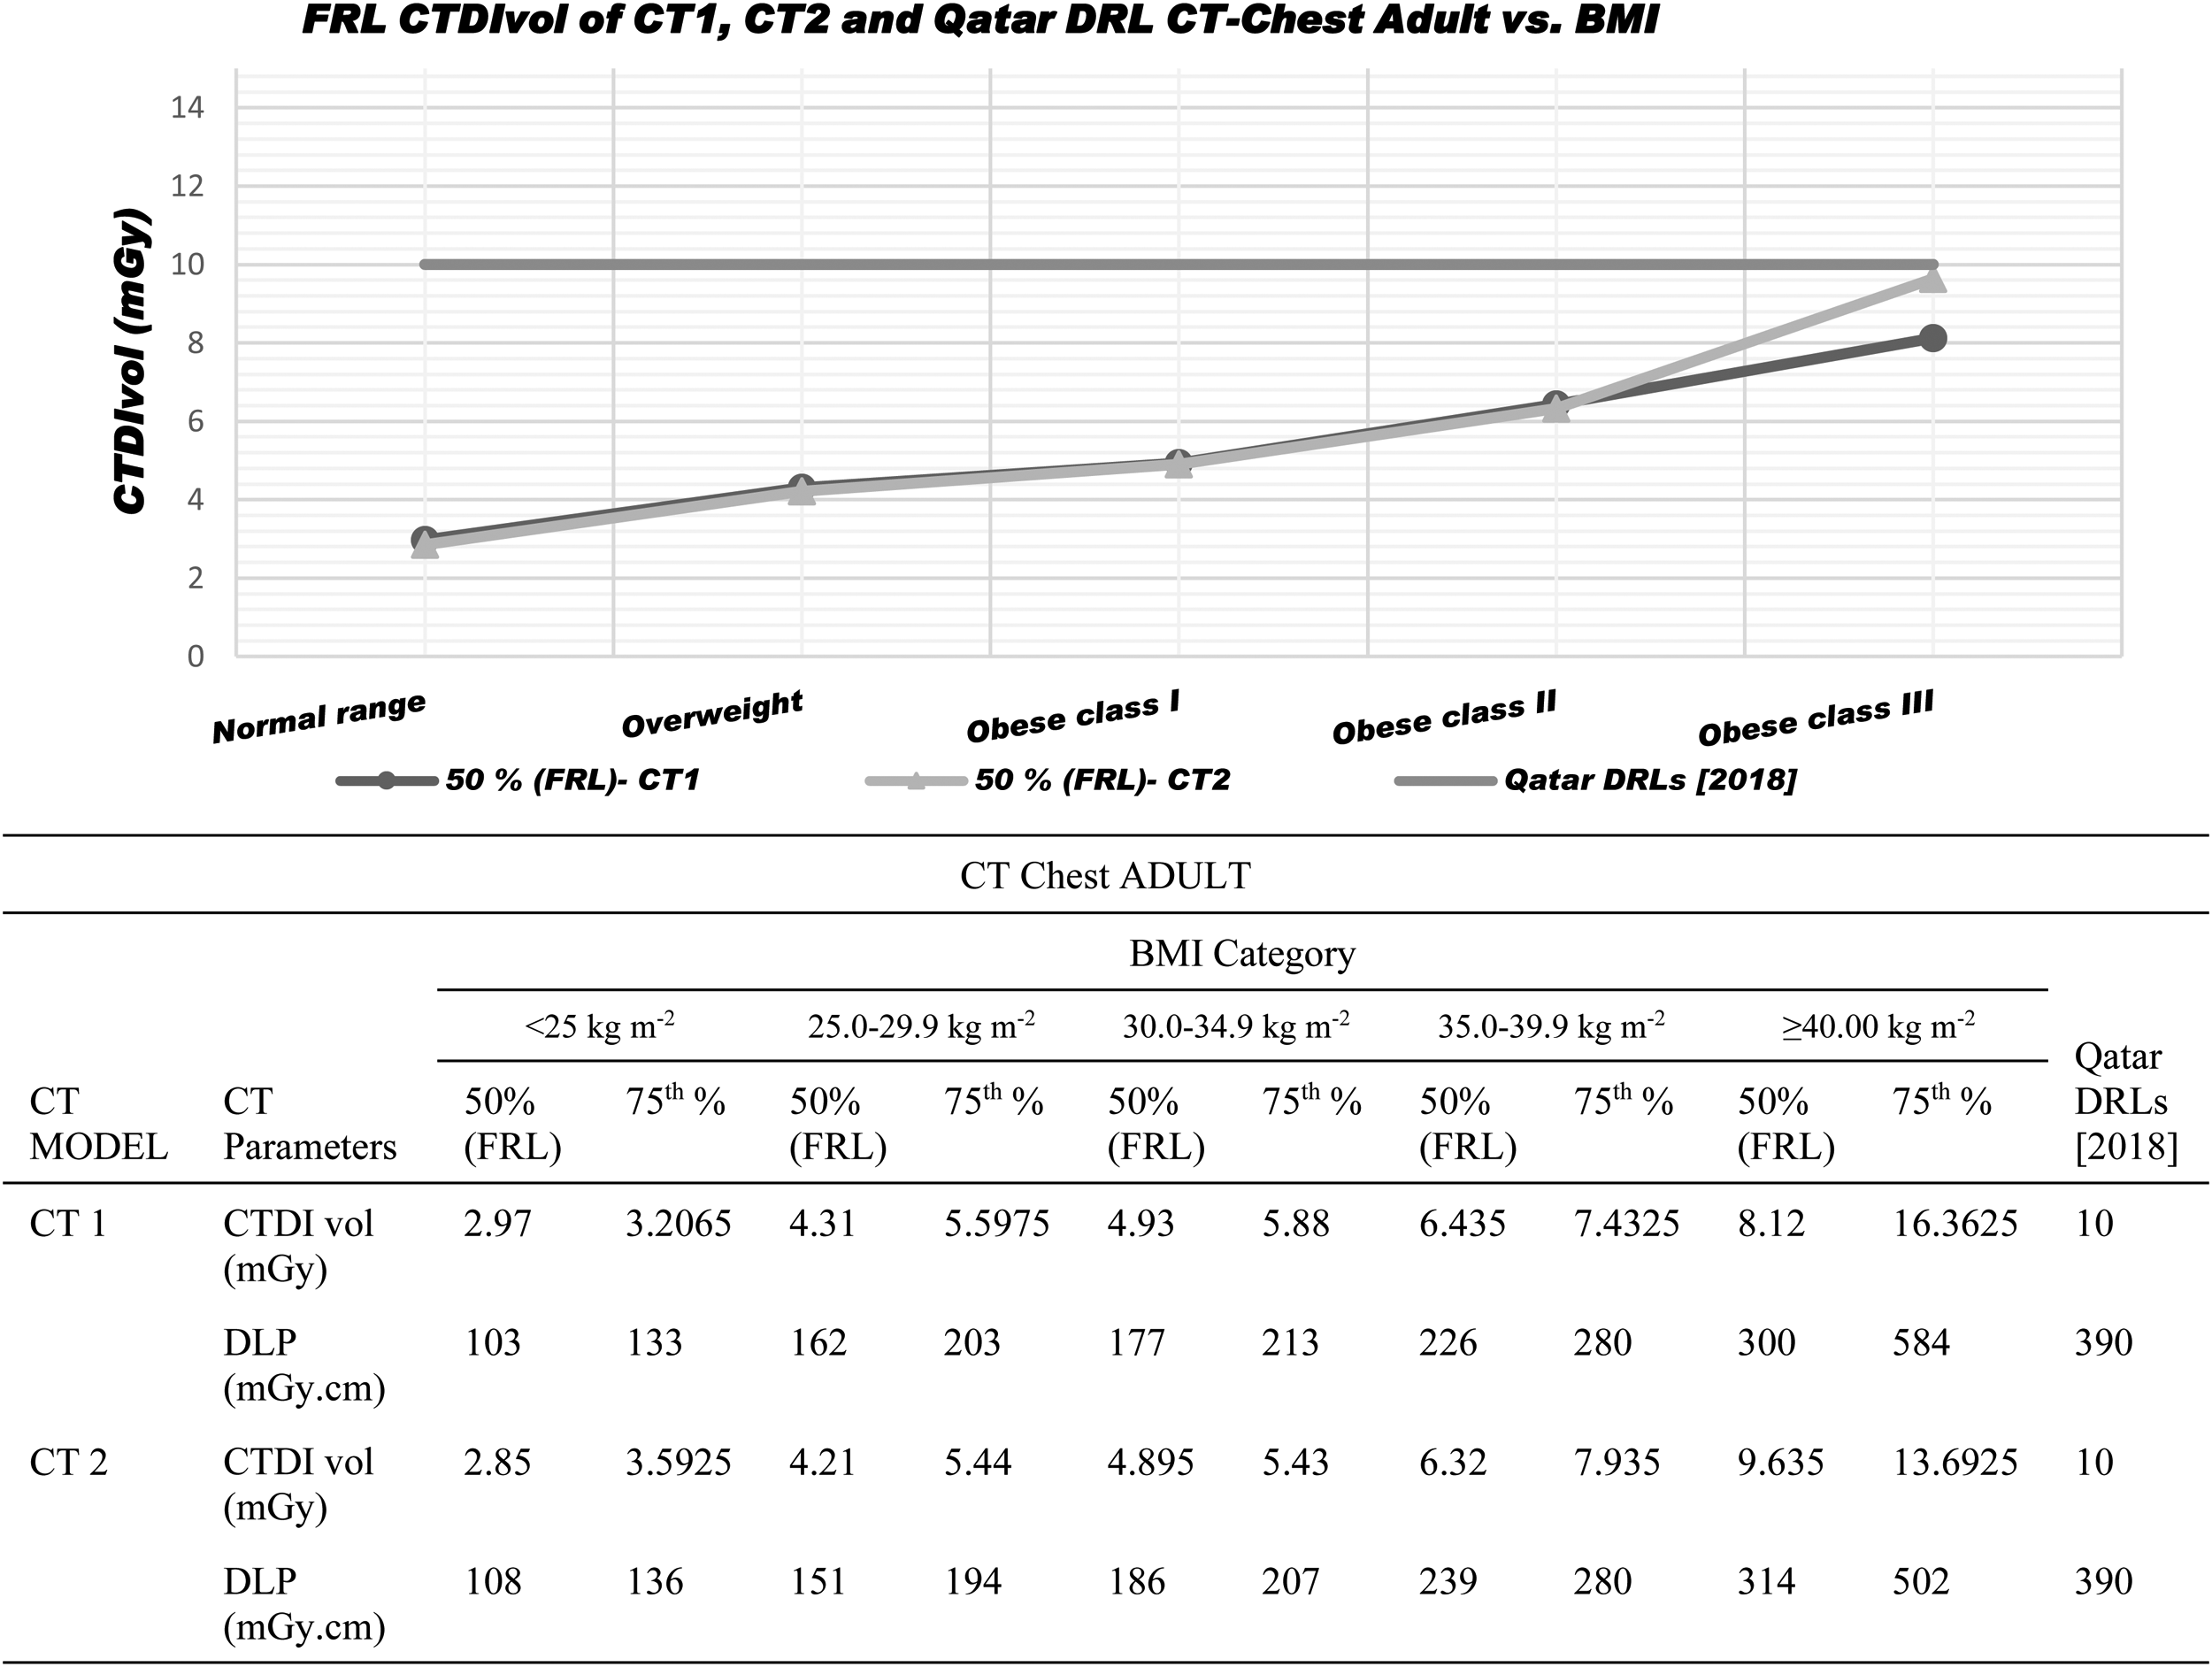
For CT chest non-contrast study: The graph presents a variation in dose metric between both machines, and the dose shows an increase as BMI increases. The table illustrates the same result in both doses, metrics CTDIvol and DLP. Facility DRLs is a dose reference value established for a single hospital. It is used to compare local dose levels with the national reference levels and to highlight that the radiation dose may increase as the patient’s BMI rises.
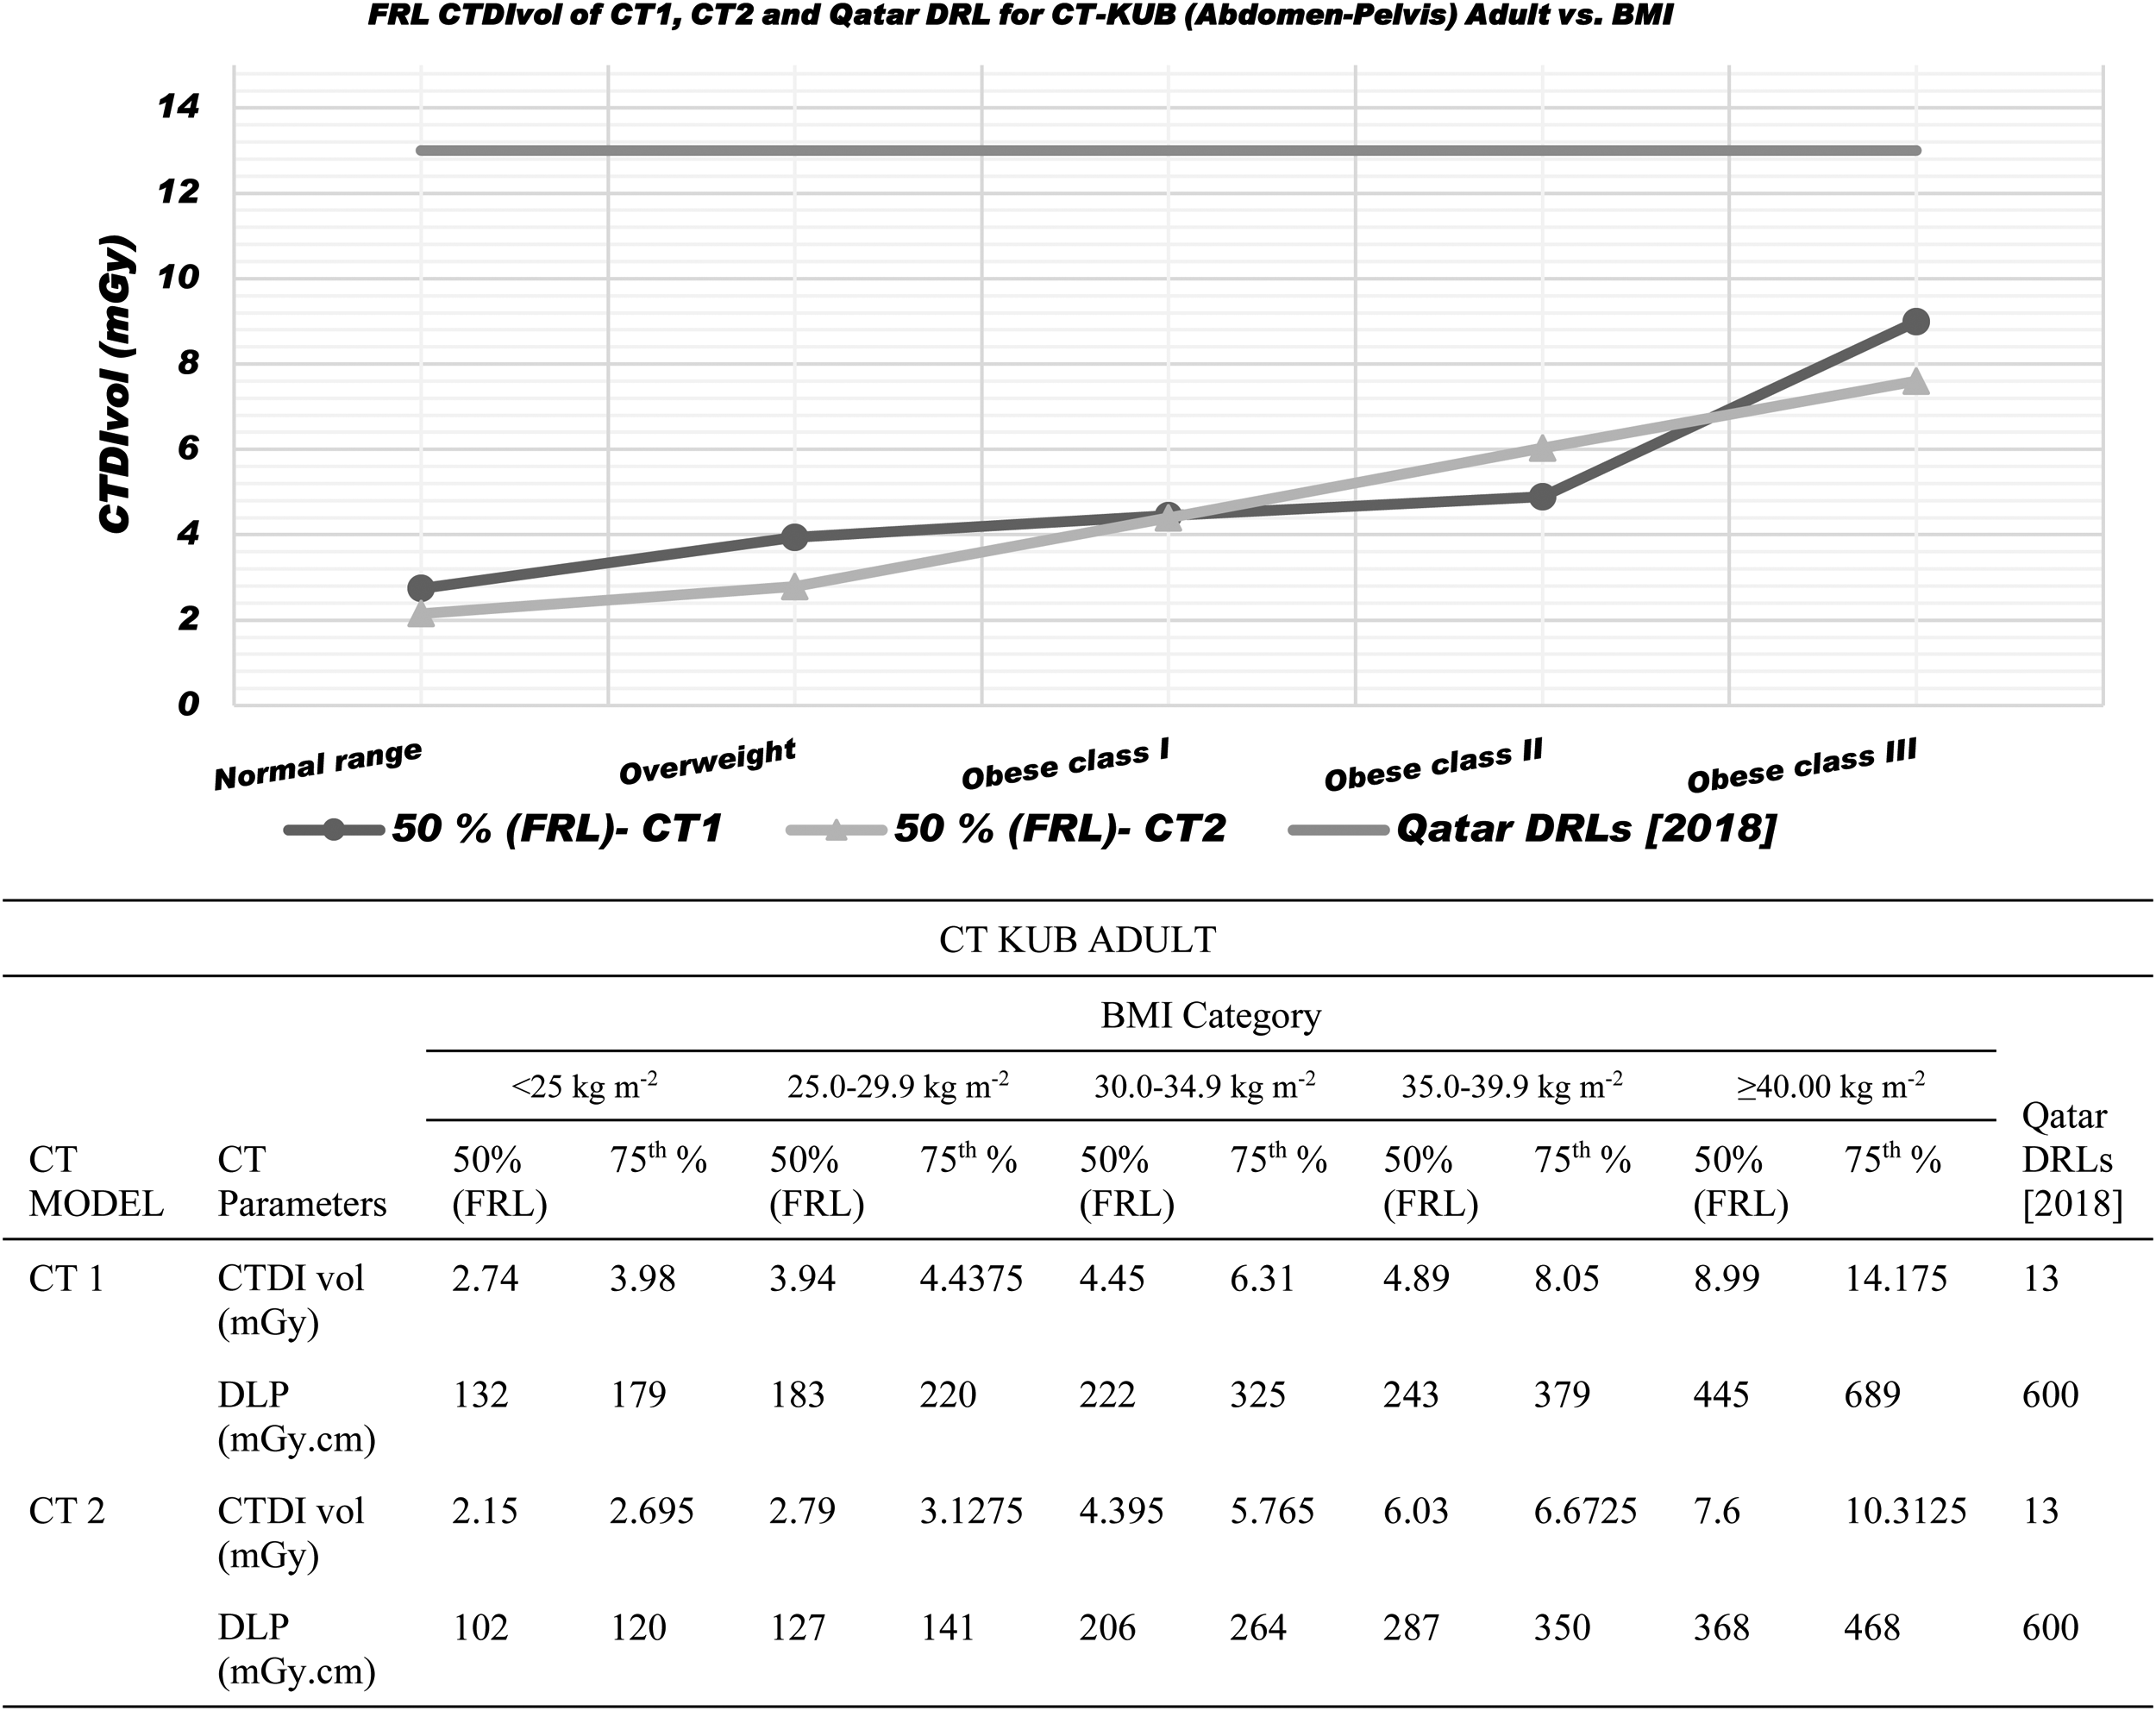
CT KUB. There was a significant difference in the dose metric between both machines; the dose was increasing as per BMI. The table also shows that the 75th percentile exceeded the Qatar national dose reference when the BMI was higher, which would lead to a red alert in RDM. Facility DRLs are a dose reference value established for a single hospital. It is used to compare local dose levels with the national reference levels and to highlight that the radiation dose may increase as the patient’s BMI rises.
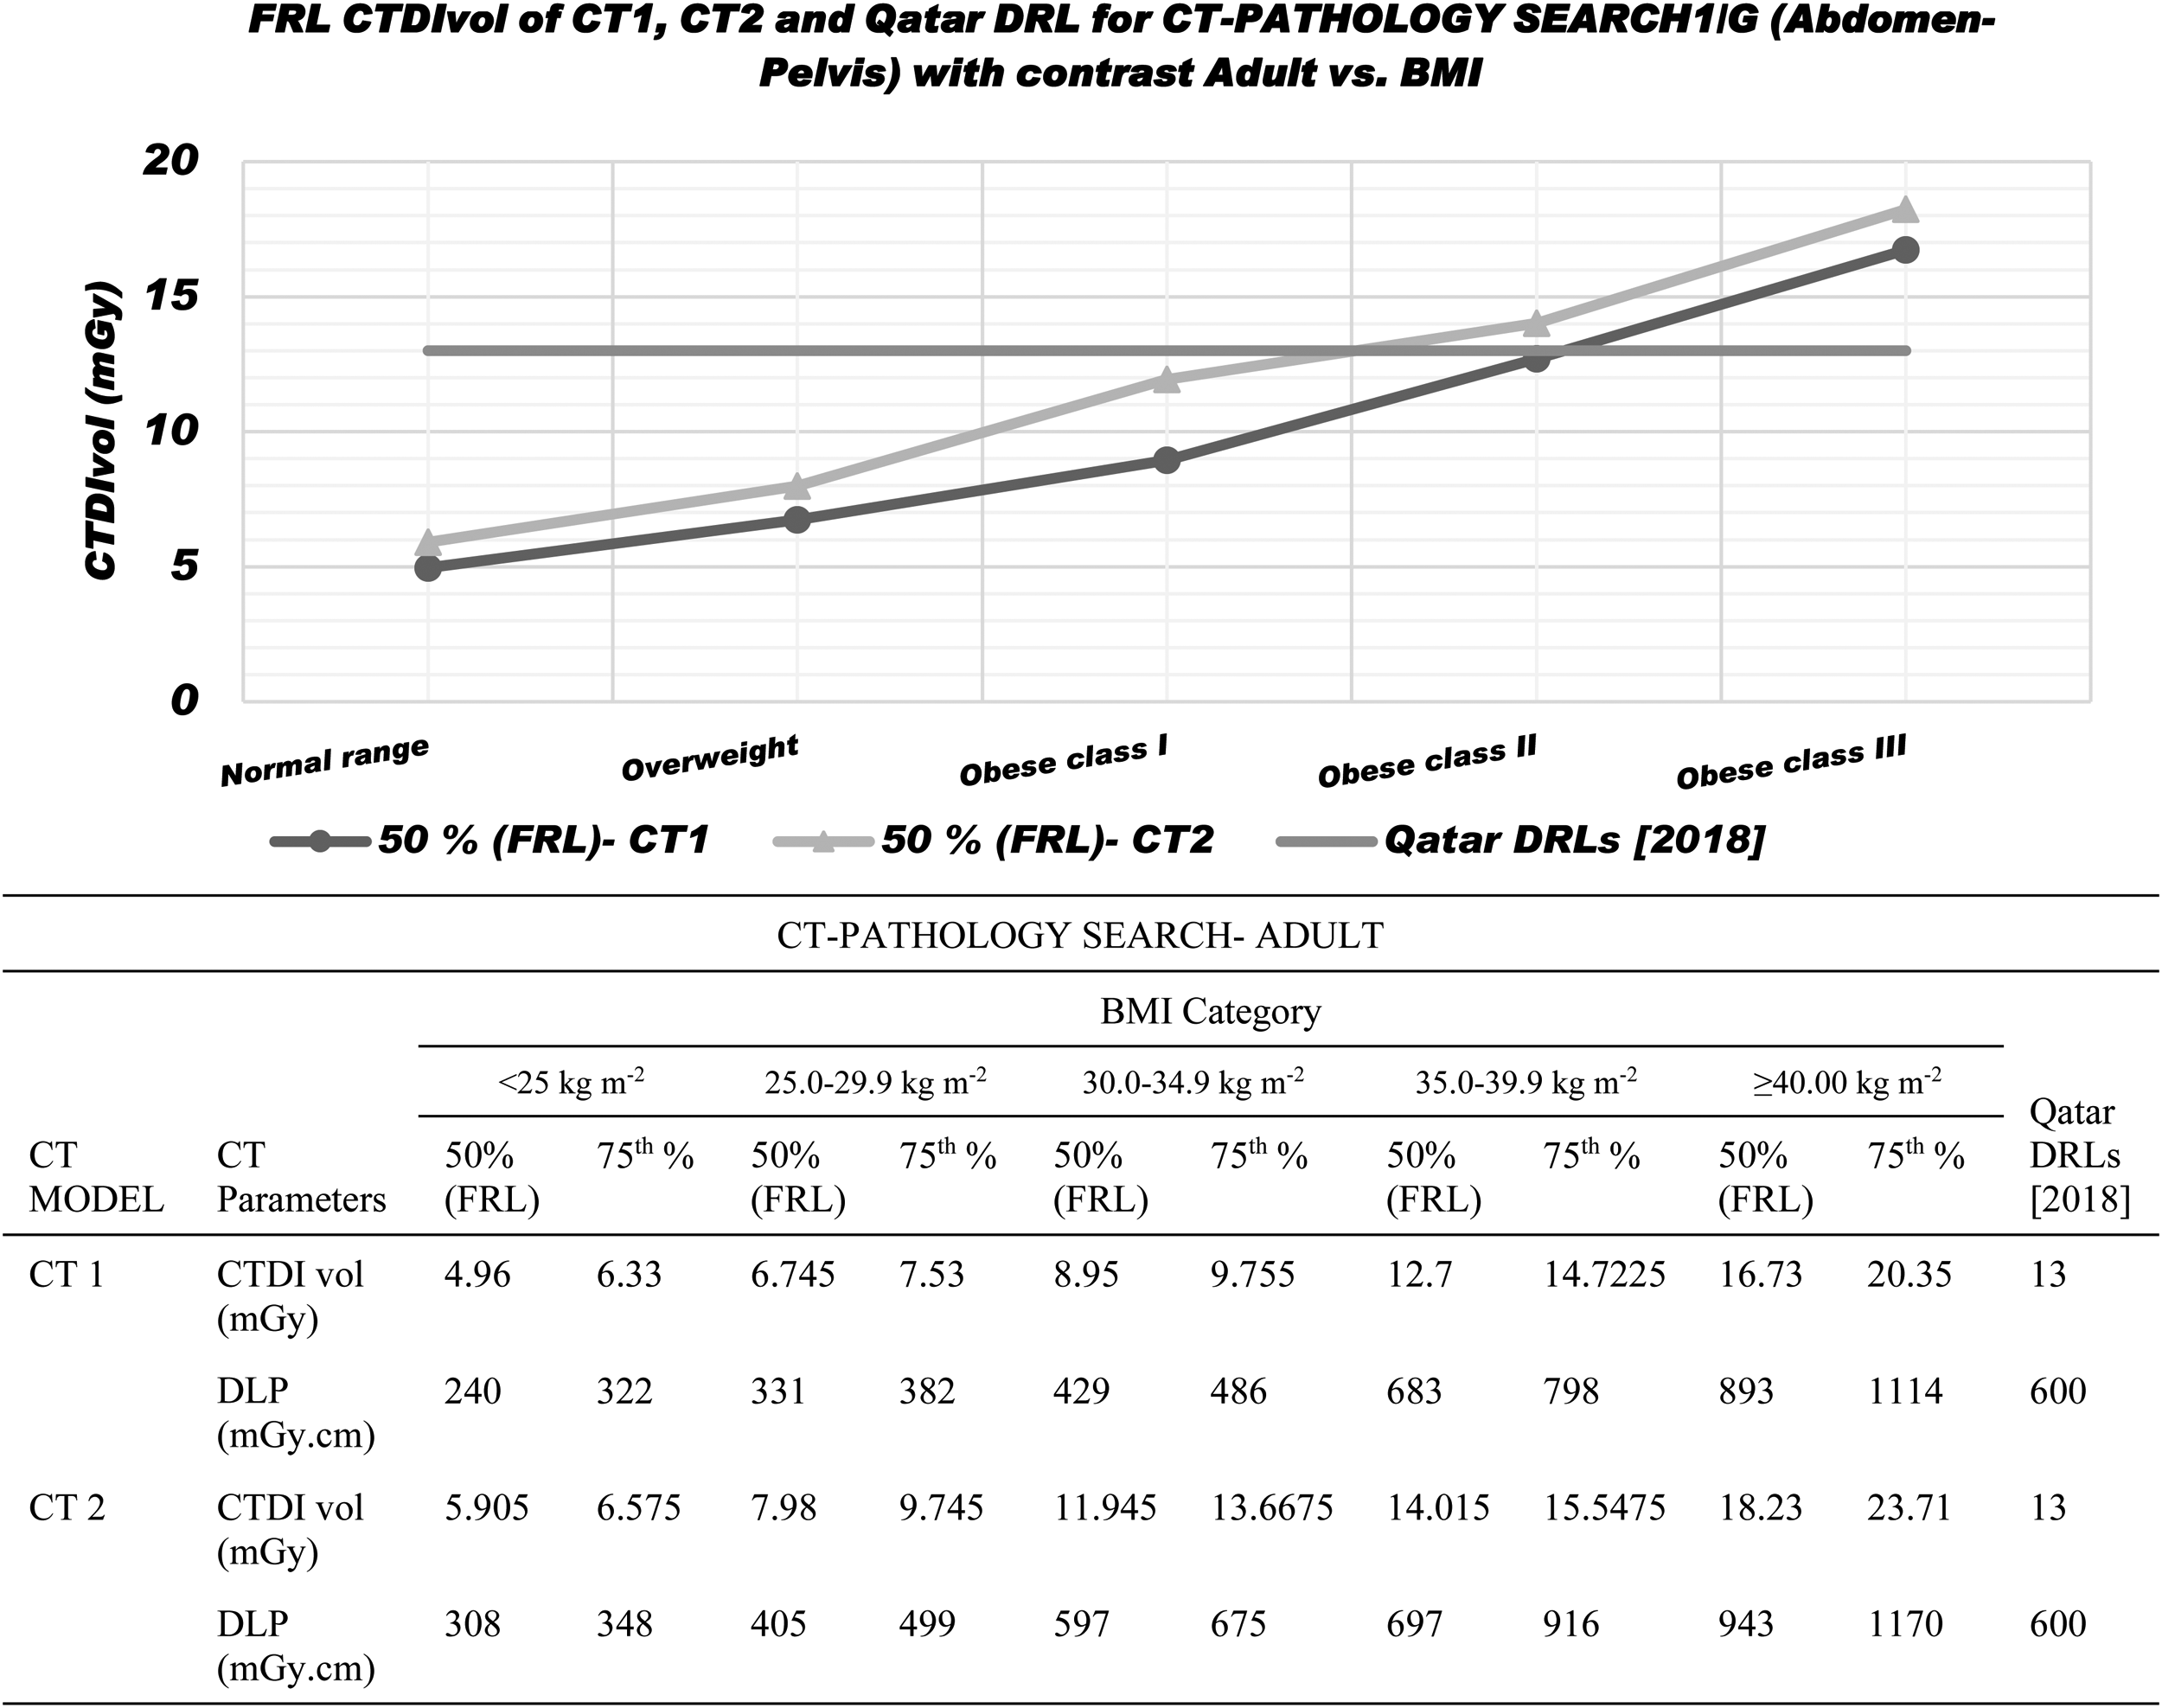
CT Abdomen with contrast media for pathology search. The graph shows the difference in dose metric between both machines, the dose is increasing as per BMI, and the table indicates that the 75th percentile exceeds the Qatar national dose reference when the BMI is higher witch led to a red alert in RDM. Facility DRLs are a dose reference value established for a single hospital. It is used to compare local dose levels with the national reference levels and to highlight that the radiation dose may increase as the patient’s BMI rises.

CT chest–abdomen–pelvis with contrast media, performed for staging protocols, involves imaging the chest, abdomen, and pelvis in both arterial and venous phases. This protocol includes two phases—arterial and venous—and an extended field of view that covers both the chest and abdomen. Consequently, the radiation dose is higher due to the multiple phases and larger anatomical coverage compared to other protocols limited to a single area and phase. The graph illustrates the variation in dose metrics between the two machines, showing an increase in dose corresponding to higher BMI, number of scans, and the extent of body coverage. The table further indicates that the 75th percentile exceeds the Qatar national dose reference level when BMI is elevated, triggering a red alert in the RDM system. The facility DRL represents a benchmark dose value specific to one hospital. It is used to compare local dose levels with national reference levels and to emphasise that radiation dose tends to rise with increasing patient BMI.

CT chest–abdomen–pelvis with contrast media, performed for follow-up staging, shows variations in dose metrics between the two machines. Radiation increases with higher BMI and as the field of view (FOV) expands. The table indicates that the 75th percentile exceeds the Qatar national dose reference level when BMI is elevated, triggering a red alert in the RDM system. The facility DRL represents a benchmark dose value specific to one hospital. It is used to compare local dose levels with national reference levels and to emphasise that radiation dose tends to rise with increasing patient BMI.
In summary the results indicate that overweight patients required roughly 40% more radiation dose than that of normal-weight patients, while obese class I and II patients required approximately twice the dose. This classification ensures precise dose reference levels for each class and introduces specific reference for the obese category, departing from the previous sole comparison against the normal range reference. Furthermore, this strategy not only articulates the precision of delivered doses for each machine type but also establishes a foundation for future comparisons. It provides recommendations for the preferred utilisation of specific machines in examination based on observed accuracies.
In our investigation, we’ve noted that red alerts in the RDM software during CT scan are frequently linked to either obese patients or multiple examinations; these alerts are typically based on DRLs established for standard patient size (70–90 kg). Recognising that effective imaging for obese patients often require higher radiation doses, our study took a proactive approach by initially aiming to establish DRLs tailored to this population to enhance the optimisation process for studies flagged with red alerts. Furthermore, our research acknowledges that CT examination protocols can vary based on clinical indication and may require more than a single phase, additionally the parameters of any CT machine models can vary due to distinct features. As a result, the introduction of facility DRLs, based on clinical indication and BMI, serves as a crucial benchmark for dose management. The facility DRLs become a corner-stone for several critical applications:
Monitoring local facility doses: By continuously tracking doses for common procedures, the facility DRLs ensure that our local practices align with established benchmarks. This ongoing monitoring guarantees that patients receive the appropriate level of radiation while maintaining image quality. Comparing doses between similar protocols: The facility DRLs facilitate meaningful dose comparisons between protocols with similar clinical indications. This analysis aids in optimising radiation exposures, ensuring that protocols are aligned with the established benchmarks, and minimising unnecessary variation in dose. Assessing dose impact of new protocols: When introducing new imaging protocols, the facility DRLs serve as a valuable reference point for assessing the dose impact. This proactive approach allows us to evaluate and fine-tune new protocols to ensure they meet the predefined benchmarks, fostering a culture of continuous improvement in dose management. Comparing doses between facilities: The ability to compare doses with other facilities becomes crucial for benchmarking and adopting best practices. This cross-facility comparison encourages a shared commitment to maintaining optimal radiation doses and enhances the overall quality of radiological practices. Comparing with regional or national DRLs: Aligning local practices with regional or national DRLs ensures that our facility adheres to broader standards and guidelines. This comprehensive analysis provides valuable insights into the effectiveness of our radiation management protocols within the broader healthcare landscape.
Summarising the establishment of facility DRLs based on clinical indication and BMI for CT scan body examination not only addresses the specific needs of obese patients but also creates a robust framework for continuous quality improvement, standardisation, and alignment with broader industry standards ultimately enhancing patient safety and the overall quality of radiological procedures.
CONCLUSION
The new classification system, integrating BMI, clinical indications, and CT scan models, introduces an innovative way to uncover differences in dose metrics among patients of different sizes during CT body examinations. This system holds significant promise in establishing tailored dose guidelines for each BMI category aligning with specific clinical indications. It facilitates streamlined monitoring and comparison of dose levels across various healthcare facilities. Moreover, it will contribute to a more nuanced evaluation of the impact of emerging protocols. It goes beyond conventional consideration such as obesity or multiple scans, enabling a comprehensive assessment of factors in high-alert cases. This expanded perspective enhances the sensitivity of radiation dose monitoring software, thereby improving its capacity to identify and address potential issues related to dose levels. Overall, the introduction of this classification system marks a substantial leap forward in optimising patient-specific dose management and refining the overall quality of CT examinations.
Footnotes
ACKNOWLEDGEMENTS
The authors would like to sincerely acknowledge the Clinical Imaging Department and Occupational Health and Safety Department, HMC Medical Research Center.