
Abstract

ICRP PUBLICATION 151
Approved by the Commission in April 2021
Dosimetric data provided in the printed publications of the series include tables of committed effective dose per intake (Sv per Bq intake) for inhalation and ingestion, tables of committed effective dose per content (Sv per Bq measurement) for inhalation, and graphs of retention and excretion data per Bq intake for inhalation. These data are provided for all absorption types and for the most common isotope(s) of each element.
The online electronic files that accompany the OIR series of publications contain a comprehensive set of committed effective and equivalent dose coefficients, committed effective dose per content functions, and reference bioassay functions. Data are provided for inhalation, ingestion, and direct input to blood.
This publication provides the above data for the following elements: beryllium, fluorine, sodium, magnesium, aluminium, silicon, chlorine, potassium, scandium, titanium, vanadium, chromium, manganese, nickel, copper, gallium, germanium, arsenic, selenium, bromine, rubidium, rhodium, palladium, silver, cadmium, indium, tin, hafnium, tantalum, tungsten, rhenium, osmium, platinum, gold, mercury, thallium, astatine, and francium. Additional dosimetric data for exposure from submersion in a cloud of gas are given in Annex A for the noble gases neon, argon, krypton, and xenon.
© 2022 ICRP. Published by SAGE.
Occupational exposure; Internal dose assessment; Biokinetic and dosimetric models; Bioassay interpretation
MAIN POINTS
1. INTRODUCTION
(1) This publication is the fifth part of a series which provides revised dose coefficients for occupational intakes of radionuclides (OIR) by inhalation and ingestion. It also presents radionuclide-specific information for the design and planning of monitoring programmes, and retrospective assessment of occupational internal doses. (2) The OIR series replaces the Publication 30 series (ICRP, 1979a,b, 1980, 1981, 1988) and Publications 54, 68, and 78 (ICRP, 1989, 1994a, 1997). The revised dose coefficients, dose per content values, and reference bioassay functions have been calculated using the Publication 100 Human Alimentary Tract Model (ICRP, 2006) and a revision of the Publication 66 Human Respiratory Tract Model (HRTM) (ICRP, 1994b) which takes account of more recent data. The revisions made to the HRTM are described in OIR Part 1 (ICRP, 2015). Revisions have also been made to many models for the systemic biokinetics of radionuclides, making them more physiologically realistic representations of uptake and retention in organs and tissues, and excretion. (3) OIR Parts 2–4 (ICRP, 2016, 2017, 2019) gave data for those elements for which intakes of radionuclides were considered to be of most importance for radiological protection of workers. In OIR Part 4 (ICRP, 2019), all lanthanides were included because of the similarity in behaviour of the elements in that series. In OIR Part 5, data are given for the remaining elements that were considered in the Publication 30 series (ICRP, 1979a,b, 1980, 1981, 1988). Data for noble gases are given in Annex A for exposure by submersion.
1.1. Methodology used in the OIR series
(4) The general methodology for producing the biokinetic and dosimetric models is given in OIR Part 1 (ICRP, 2015). For each element, detailed reviews of the literature were carried out to identify experimental studies and human contamination cases that provide information to quantify absorption to blood from the respiratory and alimentary tracts, and the biokinetics following systemic uptake. These reviews, and the analyses of the data obtained from them, are summarised in each element section. (5) In the case of inhalation, reviews were not carried out in OIR Part 5 for most elements: default parameter values for Type F, M, and S particulate materials were usually adopted. Reviews were conducted for seven elements (Al, Ni, Se, Ag, Cd, Hg, and Au) for which it was considered there was probably sufficient evidence to support the provision of guidance to augment the use of default parameter values. For these elements, chemical forms are usually addressed in order of decreasing solubility in the lungs. Where information was available, HRTM absorption parameter values were derived from experimental data from both in-vivo and in-vitro studies. For in-vitro studies, estimation of the dissolution parameter values [rapidly dissolved fraction (fr), rapid and slow dissolution rates (sr and ss)] was usually straightforward. For in-vivo studies, however, simulation modelling was often needed to derive them from the data available, typically retention in organs and excretion in urine and faeces [for further information, see Supporting Guidance 3 (ICRP, 2002b)]. (6) In some recent publications, the authors derived HRTM parameter values; if so, they are reported. In most cases, parameter values were derived by the ICRP Task Group (Task Group 21 on Internal Dosimetry and Task Group 95 on Internal Dose Coefficients) members and their colleagues. This is indicated in the text by wording such as ‘analysis carried out here …’; the first such occurrence for each element is given as ‘analysis carried out here (i.e. by the Task Group) …’. (7) Material-specific rates of absorption have been adopted (and dose coefficients and bioassay functions provided for them in the accompanying online electronic files on the ICRP website) for a limited number of selected materials, i.e. those for which:
there are in-vivo data from which specific parameter values can be derived; results from different studies are consistent; it was considered that occupational exposure to the material is likely; and the specific parameter values are sufficiently different from default Type F, M, or S parameter values to justify providing additional specific dose coefficients and bioassay functions. (8) Other materials were assigned to default HRTM absorption types, using the criteria described in Publication 71 (ICRP, 1995b) and Supporting Guidance 3 (ICRP, 2002b) for making such assignments using experimental data. Type M is assumed for particulate forms of most elements ‘by default’ (i.e. in the absence of such information). A material is assigned to Type F if the amount absorbed into blood by 30 d after intake is greater than the amount absorbed over the same period from a hypothetical material with a constant absorption rate corresponding to a half-time of 10 d under identical conditions. Similarly, a material is assigned to Type S if the amount absorbed into blood by 180 d is less than the amount absorbed over the same period from a hypothetical material with a constant rate of absorption to blood of 0.001 d−1 (extrapolation was used in some cases, as indicated in the text). For studies where it was possible to apply the criteria, a statement is made to the effect that results ‘are consistent with’ (or ‘give’) assignment to Type F (M or S). For studies where the results point towards a particular type, but there was insufficient information to apply the criteria, a statement is made to the effect that the results ‘indicate’ or ‘suggest’ Type F (M or S) behaviour. (9) Assignments are not made here on the basis of the known solubility of chemical forms in aqueous media, because this is not considered to be a reliable guide to absorption from the respiratory tract [Section E.2.2.1 in Publication 66 (ICRP, 1994b)]. If it is considered appropriate in a particular situation, it would need to be carried out with caution. In practice, it might well be possible to assign a radionuclide to which workers have been exposed to an absorption type without knowing its chemical form (e.g. from environmental and/or bioassay measurements). These could include in-vitro dissolution tests on air filters or swabs; in-vivo measurements (chest compared with whole body); or excretion measurements (urine compared with faeces). Nevertheless, for each element, a default absorption type is recommended for use in the absence of information on which the exposure material can be assigned to Type F, M, or S. For most elements, Type M is recommended by default, including all of those in OIR Part 5 except the halogens (Type F) and aluminium (Type S). (10) For soluble (Type F) forms of each element, estimates are made of the overall rate of absorption from the respiratory tract to blood, where information is available. In general, this results from dissolution of the deposited material, and also transfer through lining fluids and epithelium into blood. Nevertheless, for simplicity, this is usually represented by the rapid dissolution rate, sr [see Section 3.2.3 in OIR Part 1 (ICRP, 2015)]. Due to the wide range of estimated values of sr, element-specific values are adopted in the OIR series for those elements for which estimates could be made, and which were markedly different from the default value of 30 d−1: Ag and Ni in OIR Part 5. Justification of the value chosen for an element is given in the subsection headed ‘Rapid dissolution rate for element’. (11) For some elements, a significant fraction of the dissolved material is absorbed slowly. In some cases, this can be represented by formation of particulate material (which is subject to clearance by particle transport). In others, some dissolved material appears to be attached to lung structural components, and removed only by absorption to blood. To represent the latter type of time-dependent uptake, it is assumed that a fraction, fb, of the dissolved material is retained in the ‘bound’ state, from which it goes into blood at a rate sb. Evidence for retention in the bound state, rather than by transformation into particulate material, may be in one or more forms (e.g. systemic uptake rather than faecal clearance of the retained material; slower clearance than for insoluble particles deposited in the same region of the respiratory tract; or autoradiography showing diffuse rather than focal retention of activity). (12) The bound state was included in the HRTM mainly to take account of slow clearance of dissolved materials from the alveolar-interstitial (AI) region. Applying the same bound-state parameter values in all regions could lead, unintentionally, to high calculated doses to the bronchial (BB) and bronchiolar (bb) regions. Hence, in the OIR series, it is assumed that for those elements for which a bound state is adopted ( fb > 0), it is applied in the AI region by default, and in the conducting airways [posterior nasal passage, pharynx, and larynx (ET2); BB; and bb regions] only if there is supporting experimental evidence. Justification of the values chosen for an element is given in the subsection headed ‘Extent of binding of element to the respiratory tract’. In OIR Part 5, a bound state is adopted for mercury alone.
In OIR Part 5, material-specific rates of absorption are adopted for one material alone: elemental mercury vapour.
1.2. Data presented in the OIR series
(13) Data presented in the OIR series are in a standard format for each element and its radioisotopes. Each element section provides information on principal radioisotopes, their physical half-lives, and decay modes; reviews of data on inhalation (for some elements), ingestion, and systemic biokinetics; the structure and parameter values for the systemic biokinetic model; and monitoring techniques and detection limits typically achieved in a practical monitoring programme. The detection limits presented in this publication were derived from a compilation of data from laboratories in Europe, Asia, North America, and South America that perform routine monitoring of the specified radionuclide. The sensitivity of the measurements depends on the technique, the counting time, and other factors. For example, in-vivo detection limits depend on the detection system (type, quality, and number of detectors), counting geometry, and shielding and design of the installation. Those details are outside the scope of this publication. (14) Dosimetric data are provided in the printed publications of the OIR series and in the online electronic files. The methodology for dose calculation is described in OIR Part 1 (ICRP, 2015). Due to the amount of data to be provided, the printed publications provide tables and graphs restricted to tables of committed effective dose per intake (Sv Bq−1) for inhalation and ingestion, tables of committed effective dose per content (Sv Bq−1) for inhalation, and graphs of retention and excretion data per Bq intake for inhalation. (15) Data in the printed publications are provided for all absorption types of the most common isotope(s) and for an activity median aerodynamic diameter (AMAD) of 5 µm. In cases for which sufficient information is available (principally for actinide elements, and gas and vapour forms of other elements), lung absorption is specified for different chemical forms and dose coefficients, and bioassay data are calculated accordingly. The dose coefficients and dose per content values presented in the OIR series are given for a reference worker at light work (ICRP, 2015). (16) The online electronic files that accompany the OIR series contain a comprehensive set of committed effective and equivalent dose coefficients, dose per content functions, and reference bioassay functions for almost all radionuclides included in Publication 107 (ICRP, 2008) that have half-lives ≥10 min, and for other selected radionuclides. Data are provided for a range of physicochemical forms and for aerosols with median sizes ranging from an activity median thermodynamic diameter of 0.001 µm to an AMAD of 20 µm. Data for ingestion and injection (i.e. direct entry to the blood) are provided to allow the interpretation of bioassay data for cases of inadvertent ingestion (e.g. of material on contaminated skin) or rapid absorption through intact or damaged skin (injection). (17) The dose coefficients and other radionuclide-specific data are provided as a set of data files which may be accessed by the user directly or by using the accompanying Data Viewer. The Data Viewer permits rapid navigation of the dataset and visualisation of the data in tabulated and graphical formats, such as graphs of the time series of dose per content coefficients or predicted activity content per unit dose (Bq Sv−1) as a function of time after intake. Graphical presentations of decay chains and nuclear decay data from Publication 107 (ICRP, 2008) are also included. (18) OIR Part 2 (ICRP, 2016) provided the data above on: hydrogen (H), carbon (C), phosphorus (P), sulphur (S), calcium (Ca), iron (Fe), cobalt (Co), zinc (Zn), strontium (Sr), yttrium (Y), zirconium (Zr), niobium (Nb), molybdenum (Mo), and technetium (Tc). (19) OIR Part 3 (ICRP, 2017) provided the data above on: ruthenium (Ru), antimony (Sb), tellurium (Te), iodine (I), caesium (Cs), barium (Ba), iridium (Ir), lead (Pb), bismuth (Bi), polonium (Po), radon (Rn), radium (Ra), thorium (Th), and uranium (U). (20) OIR Part 4 (ICRP, 2019) provided data on the actinides and lanthanides series [please note that thorium and uranium data are given in OIR Part 3 (ICRP, 2017)]. The elements included are: lanthanum (La), cerium (Ce), praseodymium (Pr), neodymium (Nd), promethium (Pm), samarium (Sm), europium (Eu), gadolinium (Gd), terbium (Tb), dysprosium (Dy), holmium (Ho), erbium (Er), thulium (Tm), ytterbium (Yb), lutetium (Lu), actinium (Ac), protactinium (Pa), neptunium (Np), plutonium (Pu), americium (Am), curium (Cm), berkelium (Bk), californium (Cf), einsteinium (Es), and fermium (Fm). Due to the similarities between the elements in a series, generic biokinetic models are provided for the lanthanides and actinides. Specific individual data are given, when relevant, in the element sections. (21) OIR Part 5 provides data for most of the remaining elements. An analysis of the data shows that for inhalation of reference forms of radionuclides (aerosols of 5 µm; Type F, M, or S) and for ingestion, the vast majority of new dose coefficients are lower (generally within a factor of 2–3) than those published in the Publication 30 series (ICRP, 1979a, 1980, 1981, 1988) and revised in Publication 68 (ICRP, 1994a). For ingestion of 59Ni as metal and 107Pd, the dose coefficient is 20 and 50 times lower, respectively, than in Publication 68 (ICRP, 1994a). In some very rare cases (inhalation of 10Be Type S; inhalation of 32Si Type S; inhalation of 44Ti Types F, M, and S; inhalation of 68Ge, Type F; ingestion of 68Ge), the coefficients have increased by a factor of 1.5–5 because of the revision of the biokinetic models, and a better description of radionuclide retention and distribution in tissues.
2. Beryllium (Z = 4)
2.1. Isotopes
2.2. Routes of intake
2.2.1. Inhalation
(22) For beryllium, default parameter values were adopted on absorption to blood from the respiratory tract (ICRP, 2015). Absorption parameter values and types, and associated fA values for particulate forms of beryllium are given in Table 2.2. Isotopes of beryllium addressed in this publication. EC, electron-capture decay; B–, beta-minus decay. Dose coefficients and bioassay data for this radionuclide are given in the printed copy of this publication. Data for other radionuclides listed in this table are given in the online electronic files on the ICRP website. Absorption parameter values for inhaled and ingested beryllium. It is assumed that the bound state can be neglected for beryllium (i.e. fb = 0). The values of sr for Type F, M, and S forms of beryllium (30, 3, and 3 d−1, respectively) are the general default values. For inhaled material deposited in the respiratory tract and subsequently cleared by particle transport to the alimentary tract, the default fA values for inhaled materials are applied [i.e. the product of fr for the absorption type and the fA value for ingested soluble forms of beryllium (0.005)]. Default Type M is recommended for use in the absence of specific information on which the exposure material can be assigned to an absorption type (e.g. if the form is unknown, or if the form is known but there is no information available on the absorption of that form from the respiratory tract). For guidance on the use of specific information, see Section 1.1. Activity transferred from systemic compartments into segments of the alimentary tract is assumed to be subject to reabsorption to blood. The default absorption fraction fA for the secreted activity is the highest value for any form of the radionuclide (fA = 0.005).


2.2.2. Ingestion
(23) Beryllium absorption studies were reviewed by the World Health Organization (WHO, 1990) and by the US Agency for Toxic Substances and Disease Registry (ATSDR, 1988, 2002). The mean fractional absorption of beryllium, administered as the chloride, from the gastrointestinal tract of four different mammalian species has been estimated as 0.006 (Furchner et al., 1973). In experiments on rats, Bugryshev et al. (1974) have estimated the fractional gastrointestinal absorption of the element, again administered as the chloride, to be between 0.0014 and 0.0021, and a similar value is indicated from experiments on dairy cows (Mullen et al., 1972). (24) The fractional absorption of beryllium, administered as the sulphate, from the gastrointestinal tract of rats is also typically ≤0.01, with oral absorption potentially reduced by the formation of beryllium phosphate precipitates in the alkaline environment of the intestine (Reeves, 1965). Bugryshev et al. (1984), as cited by ATSDR (1988), found that beryllium oxide was absorbed more readily in rats than the hydroxide, and beryllium fluoride was absorbed more readily than the chloride, sulphate, nitrate, or hydroxide. Watanabe et al. (1985), as cited by ATSDR (1988), observed better intestinal absorption of soluble beryllium sulphate than insoluble beryllium oxide and beryllium metal. After intragastric administration of soluble beryllium chloride and 7Be-labelled carbon particles to mice, LeFevre and Joel (1986) found <0.1% of beryllium in tissues other than intestinal. (25) In Publications 30 and 68 (ICRP, 1981, 1994a), a fractional absorption of 0.005 was adopted. The same value of fA (0.005) is used in this publication for all forms of beryllium.
2.2.3. Systemic distribution, retention, and excretion of beryllium
2.2.3.1 Biokinetic data
(26) Due to its light weight, strength, electrical conductivity, high melting point, and corrosion resistance, beryllium is used in many industries (Kolanz, 2001). Its small neutron cross-section makes it useful in the production of nuclear weapons and sealed neutron sources (Taylor et al., 2002). Beryllium is also used in plasma-facing components in experimental and future commercial fusion reactors with radiation safety concerns due to neutron-activated beryllium and tritiated beryllium (Scaffidi-Argentina et al., 2000). (27) Prolonged inhalation of beryllium can result in the frequently fatal lung disease, berylliosis. Beryllium is also classified as a carcinogen (Taylor et al., 2002; Kreiss et al., 2007). Acute inhalation of high levels of beryllium can result in a non-specific, potentially lethal chemical pneumonitis within hours or days, and sometimes in specific lung damage appearing years later (Stiefel et al., 1980). (28) Zhu et al. (2010) measured concentrations of beryllium in 17 tissues obtained from autopsies of up to 68 Chinese men from four areas of China. The subjects were considered healthy until the time of sudden accidental death. The beryllium concentration was also measured in blood of living subjects from the same areas. Based on median beryllium concentrations in tissues and reference tissue masses, ∼36% of systemic beryllium (defined here as total-body beryllium minus beryllium in the lungs) was contained in bone, 30% in skeletal muscle, 17% in fat, 8% in blood, 3% in skin, 1.5% in the liver, and 0.05% in the kidneys. As a central estimate, the mass of beryllium in the total body was ∼20 µg, including ∼1 µg in the lungs. (29) Studies on rodents indicate that the systemic distribution of beryllium depends on the dosage, chemical form, and route of entry (Vacher and Stoner, 1968). The fractions of systemic beryllium retained in bone and excreted in urine tended to increase with decreasing mass of administered beryllium. Beryllium accumulated to a large extent in the liver when administered intravenously as the sulphate or chloride, but not when administered intravenously as the citrate (Van Cleave and Kaylor, 1953). Following intratracheal installation, the skeleton was the main repository for all forms of administered beryllium (Van Cleave and Kaylor, 1955). Following oral intake of beryllium sulphate by rats, the skeleton contained >75% of the systemic content (Reeves, 1965). (30) Scott et al. (1950) examined the effect of added carrier (beryllium sulphate) on the distribution and excretion of intravenously administered 7Be in rabbits and rats. In all cases, the preponderance of excretion of 7Be over the 7-d observation period was in urine and occurred during the first 24 h. The cumulative urinary:faecal excretion ratio over 7 d was 2.1 and 6.8, in rats injected with 7Be with and without carrier, respectively, and 11 and 14 in rabbits injected with 7Be with and without carrier, respectively. Activity was removed from blood more rapidly in animals injected with 7Be without carrier than in animals injected with 7Be with carrier. At 7 d, the animals injected with 7Be without carrier showed higher uptake by the skeleton and greater loss in urine than the animals injected with 7Be with carrier. The most pronounced effect of the added carrier was increased accumulation of activity in the liver. (31) Vacher and Stoner (1968) studied the disappearance of beryllium from blood in rats following its injection as carrier-free 7Be or beryllium sulphate (BeSO4) labelled with 7Be. Carrier-free 7Be cleared rapidly from blood, with only a few percent retained after 2 h. Beryllium cleared much more slowly from blood when injected as BeSO4 because only a small portion of the injected material remained in diffusible form. The residence time in blood increased with the mass of injected BeSO4. (32) Furchner et al. (1973) compared the biokinetics of 7Be (half-life 53.2 d) in mice, rats, monkeys, and dogs after oral or parenteral administration over observation periods up to 380 d. Cumulative urinary plus faecal excretion of 7Be measured over the first week (6 d for dogs and monkeys) was ∼51% of the administered amount for mice, 45% for rats, 55% for dogs, and 29% for monkeys. Urinary:faecal excretion ratios were 2.9 for mice, 9.7 for rats, 1.7 for monkeys, and 10.2 for dogs. For each of the four animal types, total-body retention following intravenous injection could be described as a sum of three exponential terms. The long-term component of retention represented ∼40% of the injected amount for dogs, 46% for mice, 50% for rats, and 59% for monkeys. Assuming a physical half-life of 52 d for 7Be, the investigators derived biological half-times (Tb) of 1210 d for mice, 890 d for rats, 1270 d for dogs, and 1770 d for monkeys. The more recently estimated half-life of 53.22 d for 7Be (ICRP, 2008) would yield higher estimated Tb, up to ∼3900 for monkeys, due to the small difference between the effective long-term half-time in the animals and the physical half-life of 7Be. The systemic distribution of 7Be was determined for rats at 0.25–71 d after intraperitoneal injection. Bone was the dominant repository at all measurement times, containing ∼64% of the retained activity at 1 d, 81% at 10 d, and 93% at 71 d. The liver contained ∼8% of retained 7Be at 1 d, 3% at 10 d, and 0.7% at 71 d. The kidneys contained ∼6% at 1 d, 1% at 10 d, and 0.6% at 71 d. (33) Finch et al. (1990) investigated the behaviour of inhaled 7Be in dogs after inhalation of 7BeO particles calcined at either 500℃ or 1000℃. Faecal excretion was the dominant mode of excretion at early times after exposure, but urinary excretion dominated at later times. The distribution of activity in the body was determined at 8, 32, 64, and 180 d post exposure. Lung retention at 180 d was much higher for beryllium oxide (BeO) calcined at 1000℃ (62% of initial lung burden) than for BeO calcined at 500℃ (14% of initial lung burden). Most of the activity cleared from the lungs but not excreted was contained in the lymph nodes, skeleton, liver, and blood. On average, the skeleton contained approximately eight times as much activity as the liver.
2.2.3.2. Biokinetic model for systemic beryllium
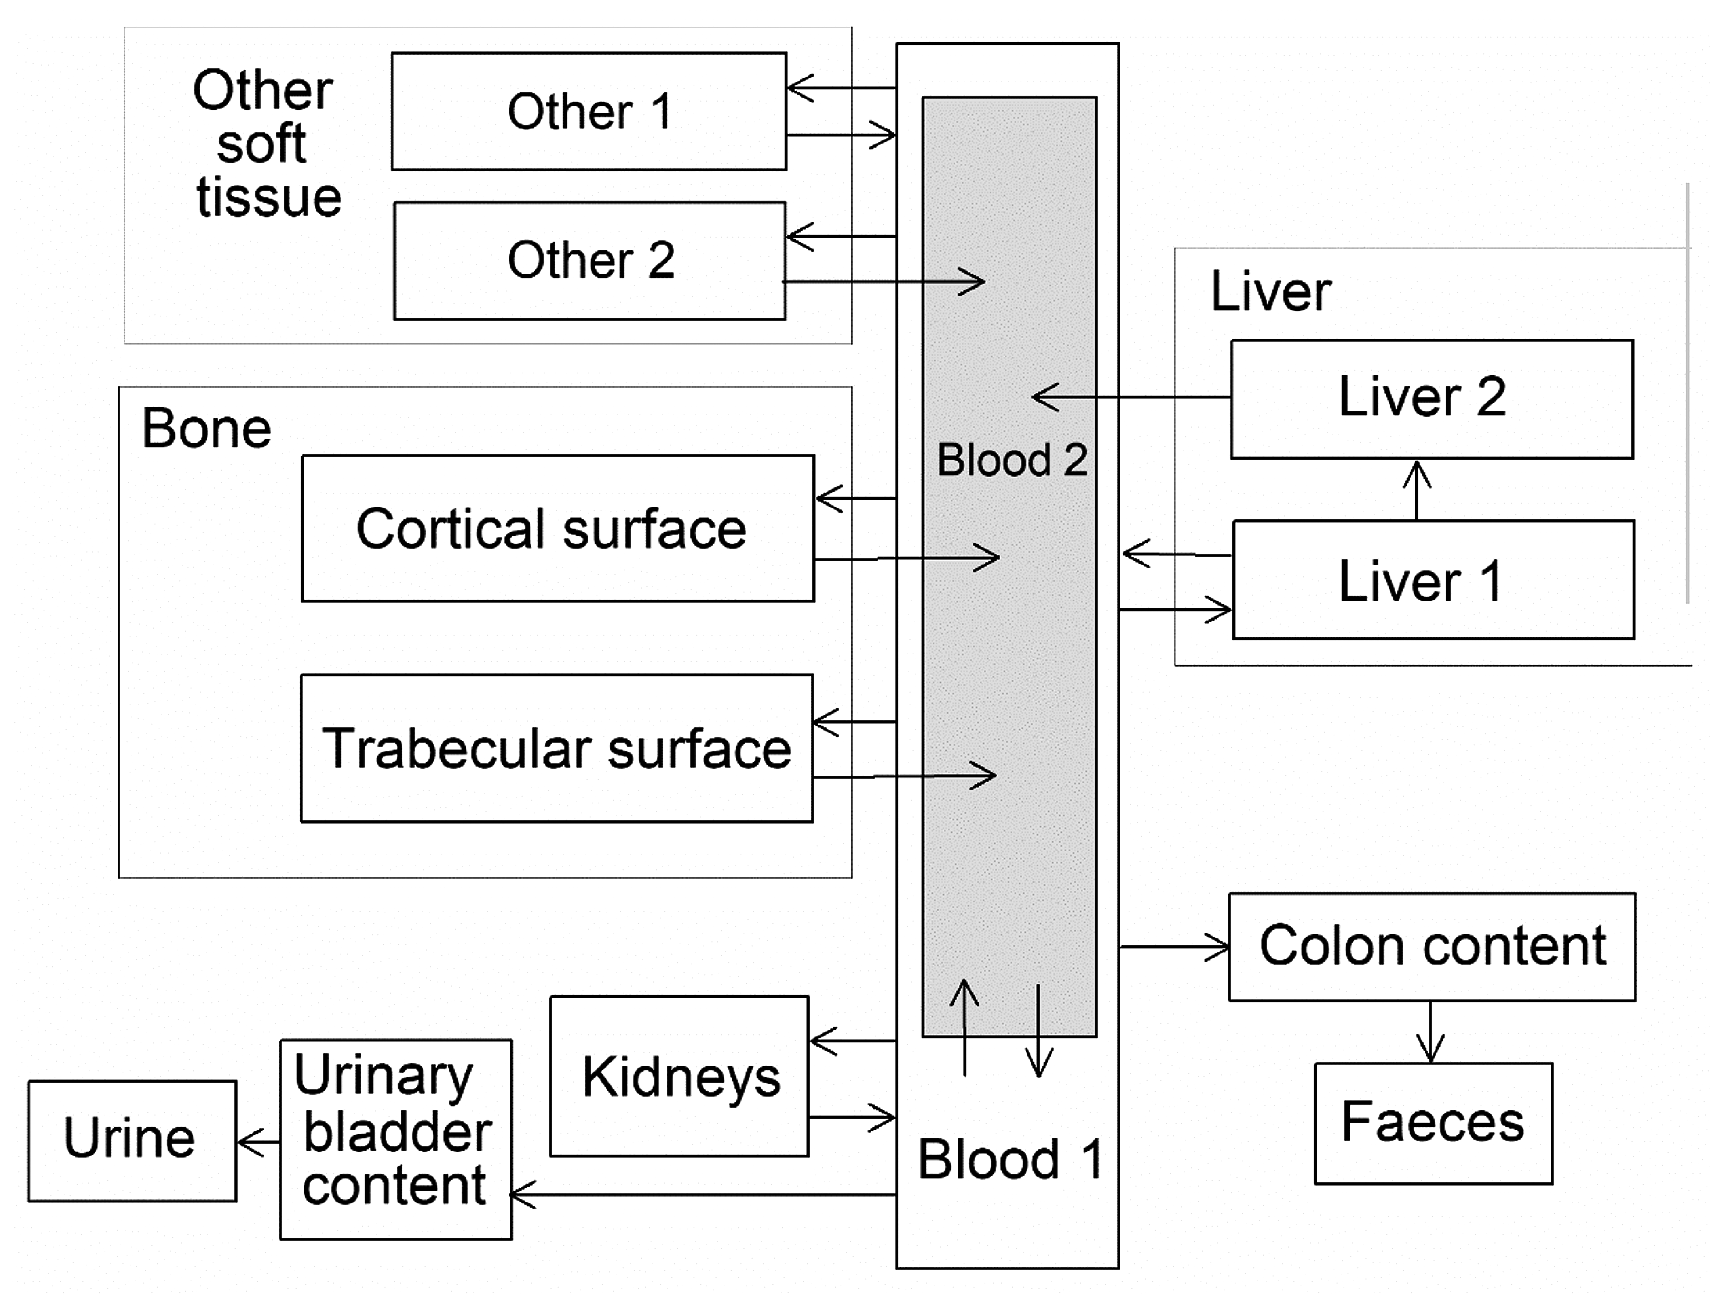
(34) The structure of the biokinetic model for systemic beryllium applied in this publication is shown in Fig. 2.1. Transfer coefficients are listed in Table 2.3. Activity absorbed to blood from the respiratory or alimentary tract is assigned to Blood 1. The transfer coefficients describing the short- and intermediate-term kinetics of beryllium were selected to yield reasonable reproductions of the distribution, retention, and excretion of beryllium observed over the first ∼1 y in laboratory animals administered low masses of soluble forms of beryllium. The transfer coefficients describing the long-term behaviour were selected to approximate the long-term distribution of beryllium indicated by human autopsy data. The return of beryllium from compartments with extended retention to a second blood compartment with relatively slow loss was a convenient way to model both the rapid blood clearance at early times after administration of beryllium to animals, and the relatively large estimated portion of total-body beryllium in blood (8%) in environmentally exposed persons. Transfer coefficients in the biokinetic model for systemic beryllium. Structure of the biokinetic model for systemic beryllium.

2.3. Individual monitoring
2.3.1. 7Be
(35) Measurements of 7Be may be performed by in-vivo whole-body measurement technique and by gamma measurement in urine.
2.4. Dosimetric data for beryllium
3. Fluorine (Z = 9)
3.1. Isotopes
3.2. Routes of intake
3.2.1. Inhalation
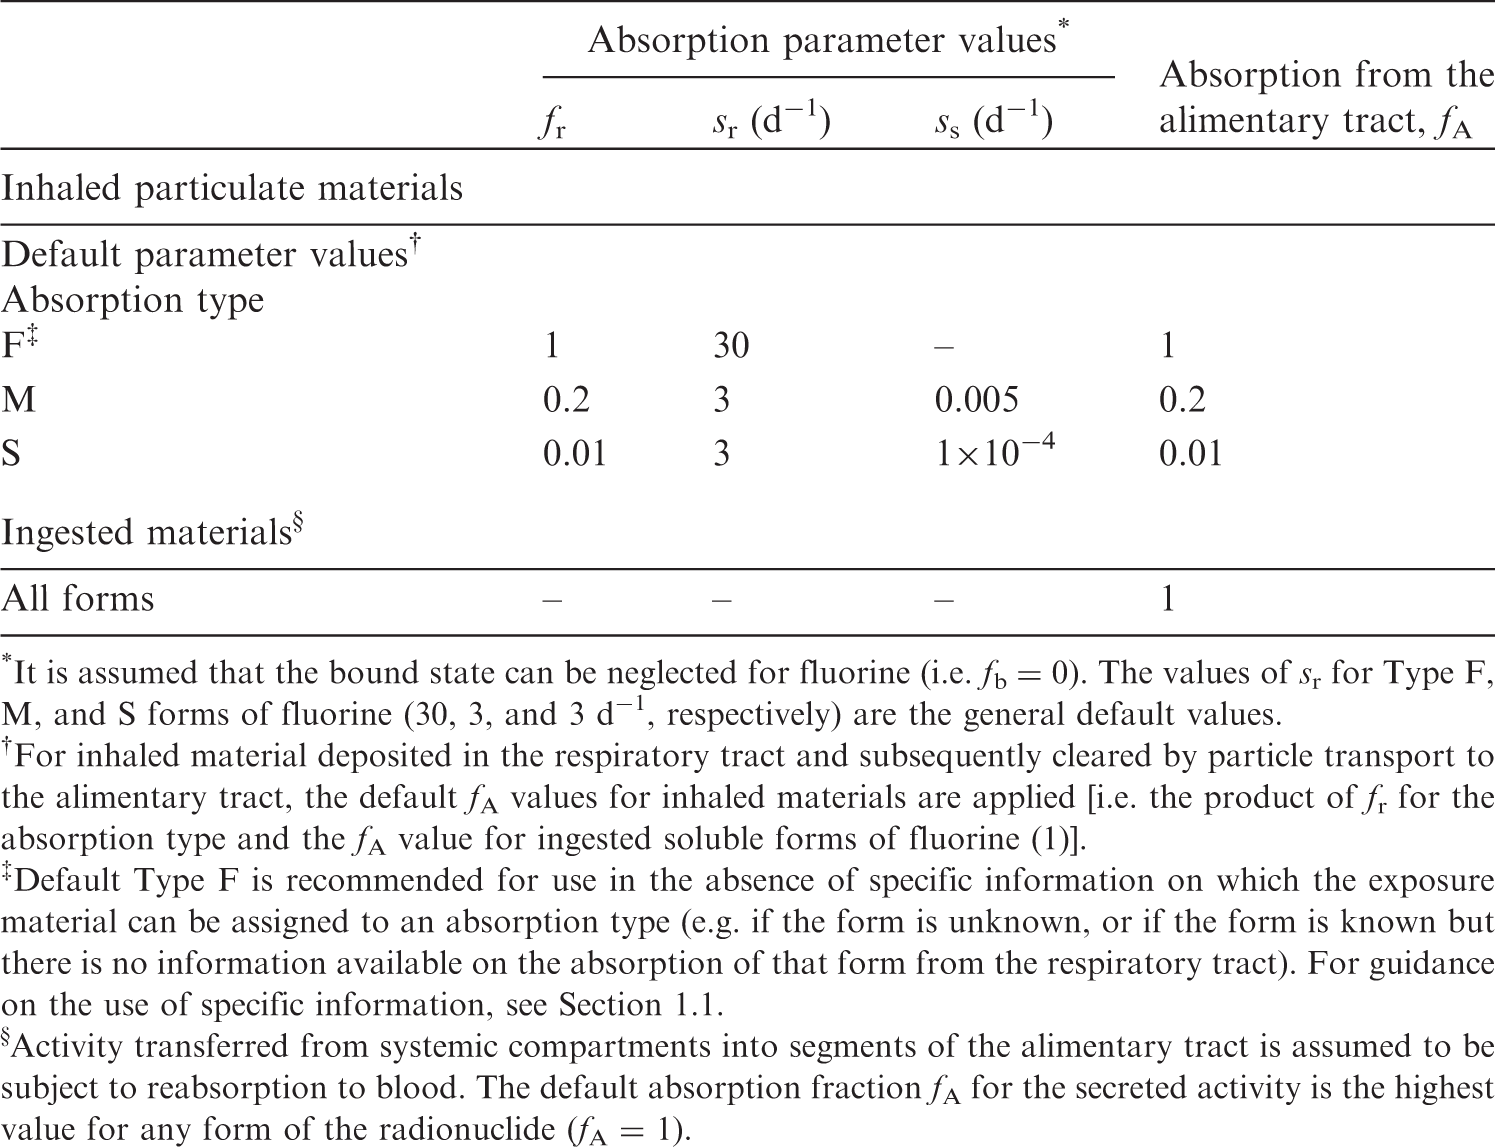
(36) For fluorine, default parameter values were adopted for absorption to blood from the respiratory tract (ICRP, 2015). For fluorine and the other halogens, intakes could be in both particulate and gas and vapour forms, and it is therefore assumed that inhaled fluorine is 50% particulate and 50% gas/vapour in the absence of information (ICRP, 2002b). Absorption parameter values and types, and associated fA values for gas and vapour forms of fluorine are given in Table 3.2 and for particulate forms in Table 3.3. By analogy with the halogen iodine, considered in detail in Publication 137 (OIR Part 3) (ICRP, 2017), default Type F is recommended for particulate forms in the absence of specific information on which the exposure material can be assigned to an absorption type. Monitoring techniques for 7Be. Measurement system comprised of germanium detectors. Counting time of 20 min. Committed effective dose coefficients (Sv Bq−1) for the inhalation or ingestion of 7Be compounds. AMAD, activity median aerodynamic diameter Dose per activity content of 7Be in total body and in daily excretion of urine (Sv Bq−1); 5 μm activity median aerodynamic diameter aerosols inhaled by a reference worker at light work. Isotopes of fluorine addressed in this publication. EC, electron-capture decay; B+, beta-plus decay. Dose coefficients and bioassay data for this radionuclide are given in the printed copy of this publication. Deposition and absorption for gas and vapour compounds of fluorine. ET1, anterior nasal passage; ET2, posterior nasal passage, pharynx, and larynx; BB, bronchial; bb, bronchiolar; AI, alveolar-interstitial. Percentage deposited refers to how much of the material in the inhaled air remains in the body after exhalation. Almost all inhaled gas molecules contact airway surfaces, but usually return to the air unless they dissolve in, or react with, the surface lining. The default distribution between regions is assumed: 20% ET2, 10% BB, 20% bb, and 50% AI. It is assumed that the bound state can be neglected for fluorine (i.e. fb = 0). For inhaled material deposited in the respiratory tract and subsequently cleared by particle transport to the alimentary tract, the default fA values for inhaled materials are applied [i.e. the product of fr for the absorption type (or specific value where given) and the fA value for ingested soluble forms of fluorine (1)]. Absorption parameter values for inhaled and ingested fluorine. It is assumed that the bound state can be neglected for fluorine (i.e. fb = 0). The values of sr for Type F, M, and S forms of fluorine (30, 3, and 3 d−1, respectively) are the general default values. For inhaled material deposited in the respiratory tract and subsequently cleared by particle transport to the alimentary tract, the default fA values for inhaled materials are applied [i.e. the product of fr for the absorption type and the fA value for ingested soluble forms of fluorine (1)]. Default Type F is recommended for use in the absence of specific information on which the exposure material can be assigned to an absorption type (e.g. if the form is unknown, or if the form is known but there is no information available on the absorption of that form from the respiratory tract). For guidance on the use of specific information, see Section 1.1. Activity transferred from systemic compartments into segments of the alimentary tract is assumed to be subject to reabsorption to blood. The default absorption fraction fA for the secreted activity is the highest value for any form of the radionuclide (fA = 1).


3.2.2. Ingestion
(37) The gastrointestinal absorption of fluoride is rapid and extensive (ICRP, 1975; Underwood, 1977; Patten et al., 1978). Exposure of the population to fluoride through the use of fluoridated toothpastes, mouthwashes, and topical gels is increasing. It has been shown that fluoride is absorbed readily from the mouth. However, the diffusible fluoride concentration within the mouth probably declines rapidly after ingestion due to binding by teeth, plaque, and micro-organisms (Patten et al., 1978). Absorption of carrier-free 18F from the mouth has been investigated using rats; radiofluoride absorption was 6.8% after 2.5 h (Gabler, 1968; Patten et al., 1978). Wagner (1962) showed that 50% of a 29-µg dose of fluoride was absorbed from the ligated rat stomach within 1 h, and only 16% remained after 5 h. (38) In Publications 30 and 68 (ICRP, 1980, 1994a), f1 was taken to be 1 for all compounds of fluorine. In the present publication, the value fA = 1 is used for all chemical forms of fluorine.
3.2.3. Systemic distribution, retention, and excretion of fluorine
3.2.3.1. Biokinetic data
(39) 18F has been widely used for skeletal imaging. Its systemic biokinetics has been studied in human subjects and laboratory animals (Suttie and Phillips, 1959; Costeas et al., 1970; Wootton, 1974; Hall et al., 1977; Charkes et al., 1978; Hawkins et al., 1992; Whitford, 1994; Schiepers et al., 1997). (40) The fluoride ion is the most bioavailable form of fluorine. Fluoride entering blood deposits primarily in bone. Uptake by bone is rapid and thought to occur mainly by adsorption on to hydroxyapatite crystals, followed by exchange with hydroxyl groups in the hydroxyapatite. Uptake by bone marrow is negligible. Uptake by bone is correlated with calcium influx. The highest concentrations of fluoride in bone occur at sites of bone growth or remodelling (Neuman and Neuman, 1958; Whitford, 1994; Schiepers et al., 1997). (41) Charkes et al. (1978) developed a biokinetic model for systemic fluoride (Fig. 3.1) based on results of several studies of the kinetics of 18F in human subjects. Two compartments were used to describe the kinetics of fluoride in bone: a ‘buffer’ compartment between blood and mineral bone, assumed to represent an extracellular fluid space of bone; and a compartment representing mineral bone. A portion of fluoride entering the buffer pool was assumed to return rapidly to blood. The remainder was assumed to enter a mineral bone compartment that returns fluoride to the buffer pool. Daily excretion of 7Be following inhalation of 1 Bq Type F. Daily excretion of 7Be following inhalation of 1 Bq Type M. Daily excretion of 7Be following inhalation of 1 Bq Type S. Daily excretion of 10Be following inhalation of 1 Bq Type F. Daily excretion of 10Be following inhalation of 1 Bq Type M. Daily excretion of 10Be following inhalation of 1 Bq Type S. Biokinetic model of Charkes et al. (1978) for systemic fluoride. Numbers next to arrows are transfer coefficients (min−1). ECF, extracellular fluids.


3.2.3.2. Biokinetics of systemic fluorine
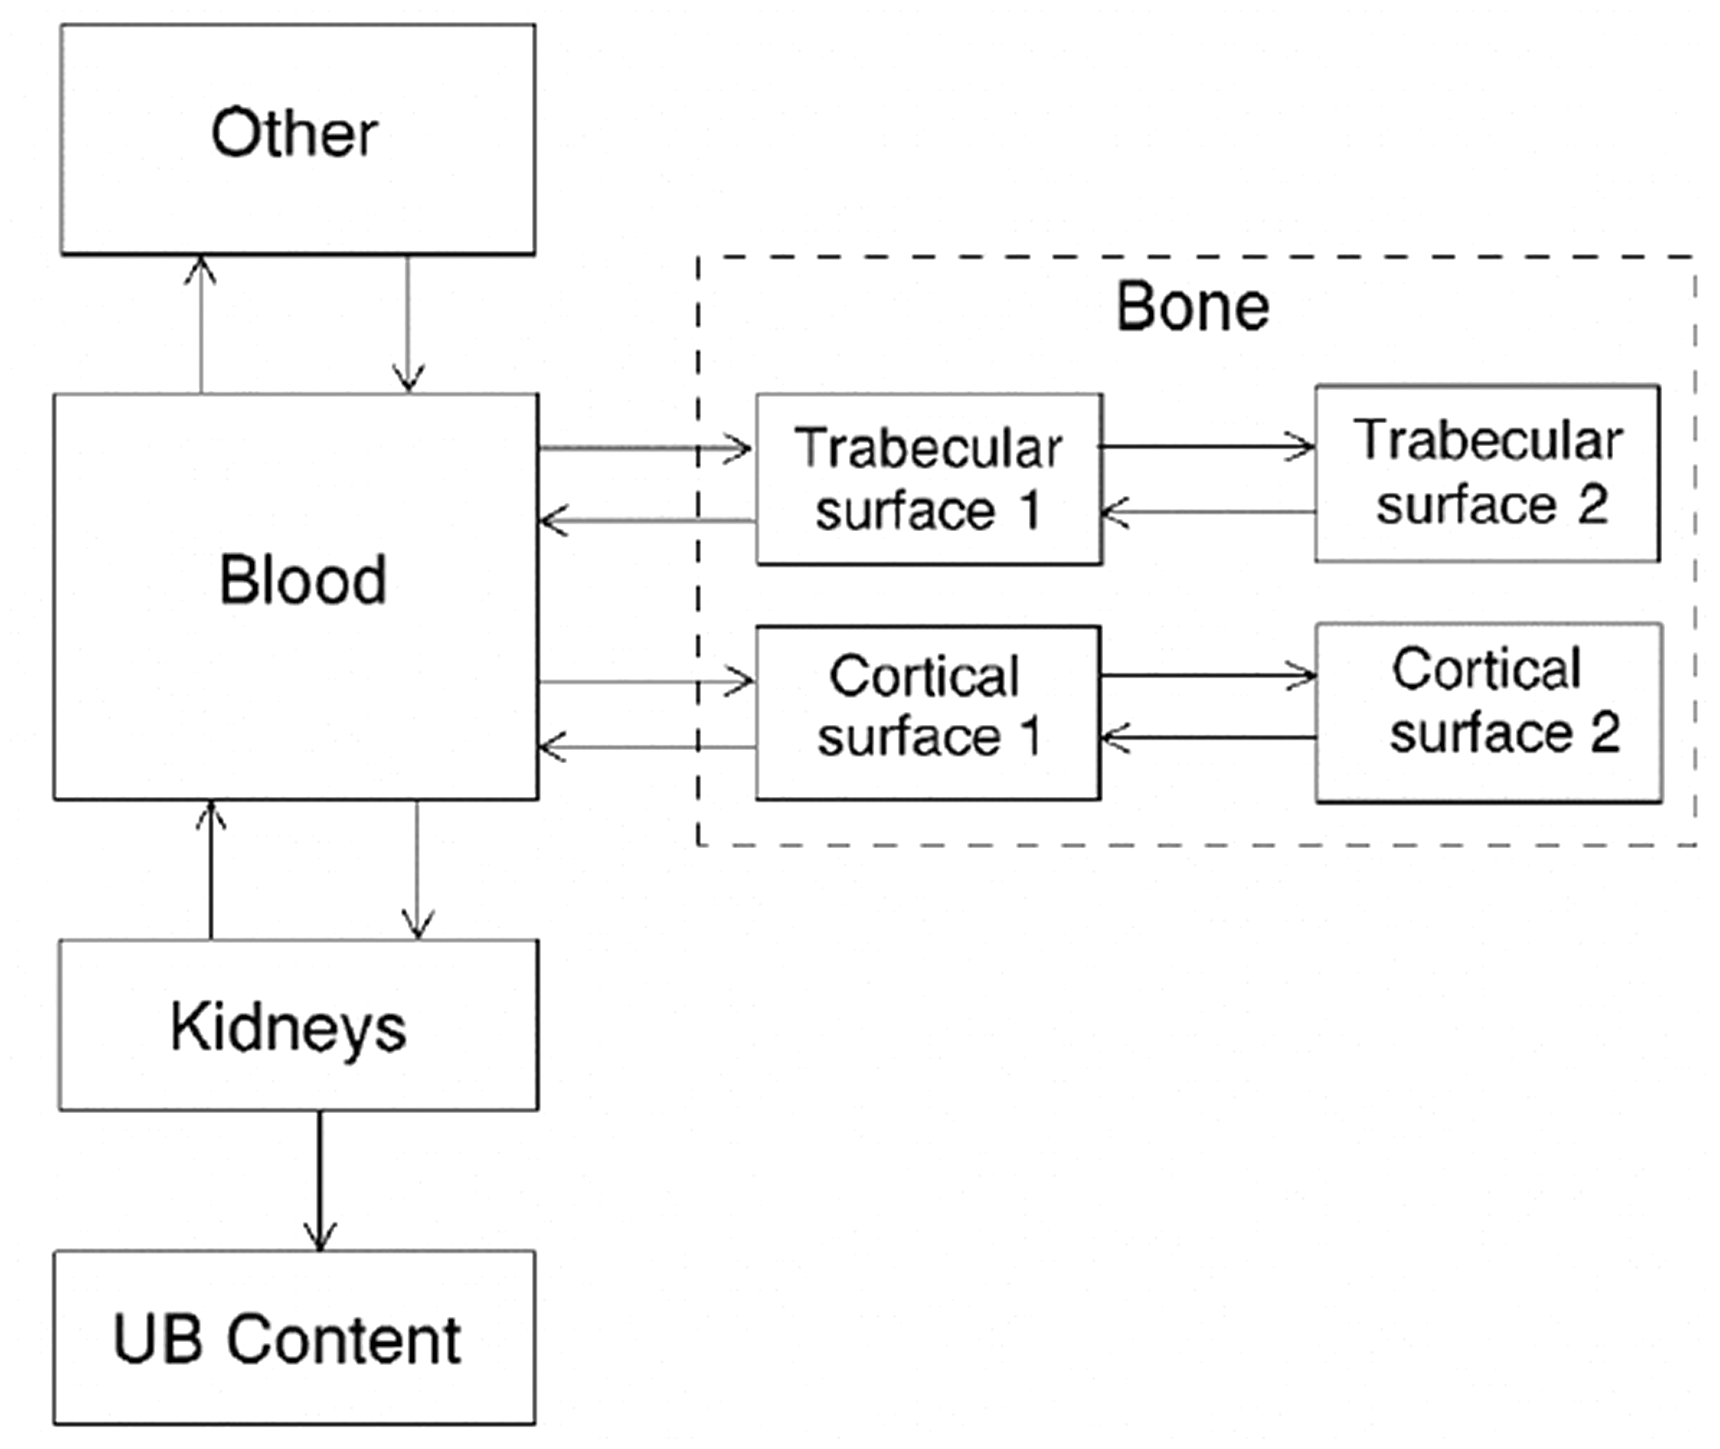
(42) The biokinetic model for systemic fluoride used in this publication is based on the model developed by Charkes et al. (1978), which consolidates results of several studies of the kinetics of 18F in human subjects. The structure of the model used here is shown in Fig. 3.2. Parameter values are listed in Table 3.4. The model incorporates flow rates derived by Charkes et al., but applies these rates within a modified model framework. In view of the relatively short half-life of 18F (∼110 min), the only radioisotope of fluorine addressed in this publication, all bone compartments are assumed to be part of the bone surface. The compartment called ‘Bone ECF’ in Charkes et al.’s model is divided into compartments called ‘Trabecular surface 1’ (TS1) and ‘Cortical surface 1’ (CS1). The compartment called ‘Bone’ in Charkes et al.’s model is divided into compartments called ‘Trabecular surface 2’ (TS2) and ‘Cortical surface 2’ (CS2). The ratio of flow rates from blood to TS1 and CS1 (∼1.25) is the ratio applied to calcium in Publication 134 (ICRP, 2016). The sum of flow rates from blood to TS1 and CS1 is the same as the flow rate from blood to ‘Bone ECF’ in Charkes et al.’s model (with a small rounding difference). The flow rates assigned to ‘Tubular urine’ in Charkes et al.’s model are assigned to the kidneys in the present model. The kidneys are assumed to exchange fluoride with blood, and to lose fluoride to the urinary bladder content. The rate of removal from the urinary bladder content is assumed to be 12 d−1, which is ICRP’s default value for workers and adult members of the public. Transfer coefficients in the biokinetic model for systemic fluorine. Structure of the biokinetic model for systemic fluoride used in this publication. UB, urinary bladder.

3.3. Individual monitoring
(43) Information regarding the detection limit for routine individual measurement is not available.
3.4. Dosimetric data for fluorine
4. Sodium (Z = 11)
4.1. Isotopes
4.2. Routes of intake
4.2.1. Inhalation
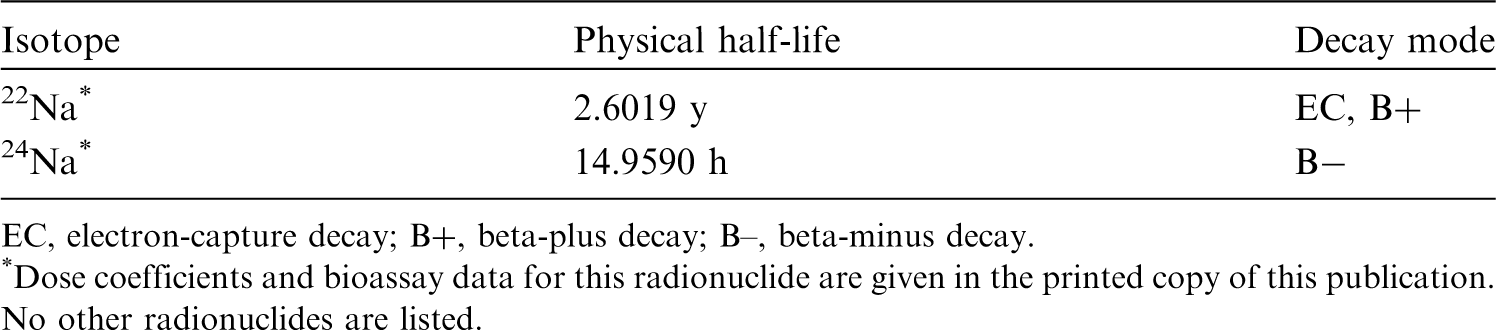
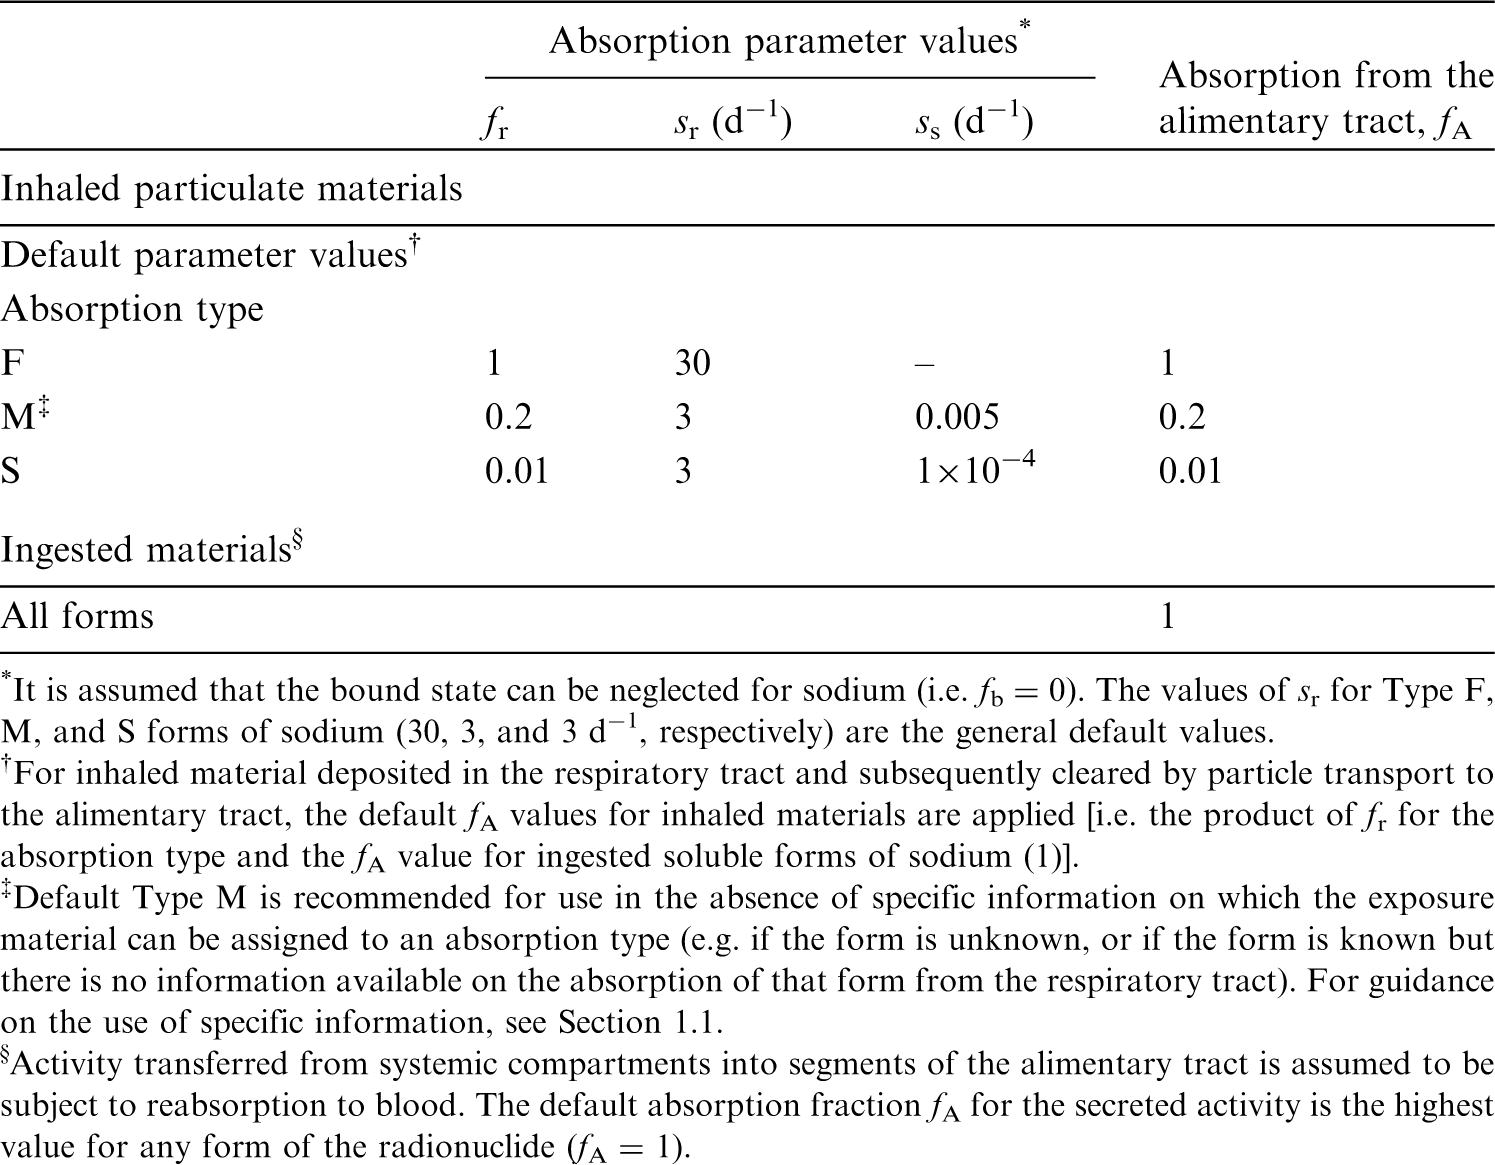
(44) For sodium, default parameter values were adopted on absorption to blood from the respiratory tract (ICRP, 2015). Absorption parameter values and types, and associated fA values for particulate forms of sodium are given in Table 4.2. Committed effective dose coefficients (Sv Bq−1) for the inhalation or ingestion of 18F compounds. AMAD, activity median aerodynamic diameter. Isotopes of sodium addressed in this publication. EC, electron-capture decay; B+, beta-plus decay; B–, beta-minus decay. Dose coefficients and bioassay data for this radionuclide are given in the printed copy of this publication. No other radionuclides are listed. Absorption parameter values for inhaled and ingested sodium. It is assumed that the bound state can be neglected for sodium (i.e. fb = 0). The values of sr for Type F, M, and S forms of sodium (30, 3, and 3 d−1, respectively) are the general default values. For inhaled material deposited in the respiratory tract and subsequently cleared by particle transport to the alimentary tract, the default fA values for inhaled materials are applied [i.e. the product of fr for the absorption type and the fA value for ingested soluble forms of sodium (1)]. Default Type M is recommended for use in the absence of specific information on which the exposure material can be assigned to an absorption type (e.g. if the form is unknown, or if the form is known but there is no information available on the absorption of that form from the respiratory tract). For guidance on the use of specific information, see Section 1.1. Activity transferred from systemic compartments into segments of the alimentary tract is assumed to be subject to reabsorption to blood. The default absorption fraction fA for the secreted activity is the highest value for any form of the radionuclide (fA = 1).

4.2.2. Ingestion
(45) Virtually all sodium is absorbed from the gastrointestinal tract of man (Wiseman, 1964). While some sodium ions are absorbed from the saliva and across the gastric mucosa, sodium absorption occurs predominantly in the small intestine by passive cotransport with chloride ions or glucose, amino acids, or bile acids, and by active transport by the sodium pump. Less than 0.5% of intestinal sodium is lost in faeces each day. The mucosa of the large intestine, like that of the small intestine, has a high capability for active absorption of sodium (ICRP, 2006). (46) f1 was taken to be 1 in Publications 30 and 68 (ICRP, 1980, 1994a). The same value of fA (1) is adopted here for sodium intake in the workplace.
4.2.3. Systemic distribution, retention, and excretion of sodium
4.2.3.1. Biokinetic data
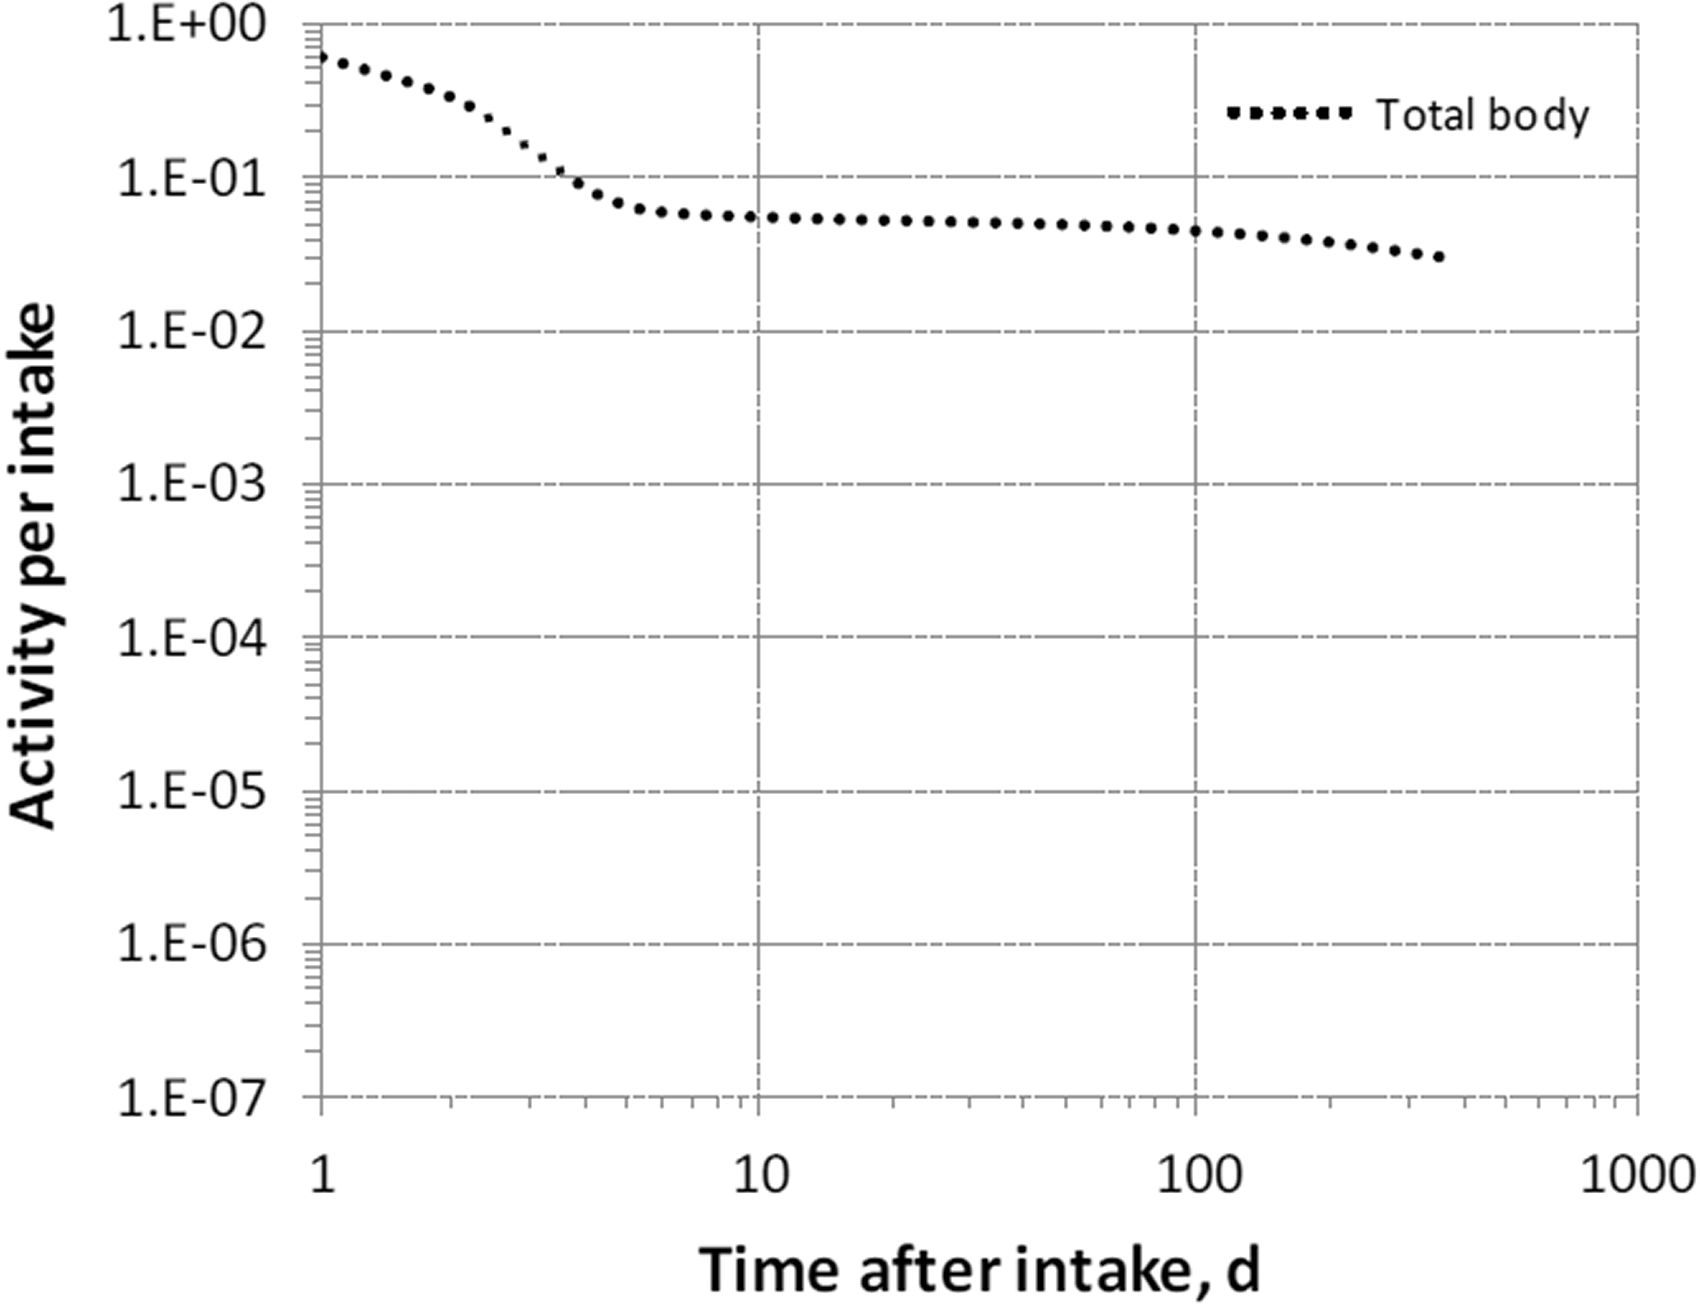
(47) The adult human body typically contains ∼1 g sodium per kg body mass (ICRP, 1975; Mole, 1984; Zhu et al., 2010). The body’s sodium is freely exchangeable with the extracellular fluids except for a portion of sodium in bone representing ∼10% of total-body sodium in an adult human (Mole, 1984). The turnover rate of the body’s exchangeable sodium is inversely related to the level of sodium in the diet. Blood, bone, and soft tissues contain ∼10%, ∼40%, and ∼50%, respectively, of the sodium content of the adult human body (ICRP, 1975; Zhu et al., 2010). (48) Richmond (1980) studied the biokinetics of 22Na over time periods up to ∼9 months after its oral administration to mice, rats, and human subjects; intraperitoneal administration to mice and rats; and intravenous administration to monkeys and dogs. Average total-body retention expressed as a percentage of administered activity (corrected for physical decay of 22Na) in three human subjects was described as a sum of three exponential terms:
(49) Vennart (1963) reported a long-term biological half-time of sodium retention in the human body of ∼1100 d, representing ∼0.3% of the administered amount. At 6–11 months after oral administration of 22Na to 12 patients, median total-body retention represented ∼0.35% of the administered amount (Smilay et al., 1961). In other human studies, Veall et al. (1955) estimated 22Na retention of 1% after 75 d, and Miller et al. (1957) estimated 22Na retention of 0.1% at 1 y. (50) Following intravenous administration of 22Na to four healthy adult human subjects (three females and one male), the serum concentration declined to half the initial value in 12–14 d (Threefoot et al., 1949). Based on average urinary losses, approximately half of the administered amount was removed from the body in 29 d. (51) Bergstrom (1955) studied the sodium loss from bone in rats due to various procedures resulting in acute acidosis or sodium depletion. Only ∼29% of bone sodium could be mobilised. (52) Forbes and McCoord (1969) studied the behaviour of sodium in bone of rats for periods up to 650 d post intraperitoneal injection of 22Na. Most of the activity taken up by bone was removed with a half-time of a few days, but ∼5% of the deposited activity exhibited slow removal with an estimated half-time of ∼700 d. The investigators concluded that the tenaciously retained activity had become an integral part of the bone crystal structure.

4.2.3.2. Biokinetic model for systemic sodium
(53) The structure of the biokinetic model for systemic sodium used in this publication is shown in Fig. 4.1. Transfer coefficients are listed in Table 4.3. (54) The basis for the model for systemic sodium is described by Samuels and Leggett (2021). The transfer coefficients were selected for reasonable consistency between model predictions and the following data sets or assumptions. Excretion in urine, faeces, and sweat represent 94%, 1%, and 5%, respectively, of total excretion. Total-body retention is described by Eq. (4.1) over the observation period in the study by Richmond (1980), with long-term retention [third term in Eq. (4.1)] representing retention of a portion of sodium depositing in bone. The predicted short-term distribution of 22Na is consistent with data of Richmond (1980) for rats. The total-body concentration in adults is ∼1 g kg−1 for long-term intake of 4.4 g Na d−1 [reference intake value given in Publication 23 (ICRP, 1975)]. The predicted long-term distribution of stable sodium in the body is consistent with the autopsy study of Zhu et al. (2010). Transfer coefficients in the biokinetic model for systemic sodium. Structure of the biokinetic model for systemic sodium.

4.3. Individual monitoring
4.3.1. 22Na
(55) Measurements of 22Na may be performed by in-vivo whole-body measurement technique and by gamma measurement in urine.
4.3.2. 24Na
(56) Measurements of 24Na may be performed by in-vivo whole-body measurement technique and by gamma measurement in urine.
4.4. Dosimetric data for sodium
5. Magnesium (Z = 12)
5.1. Isotopes
5.2. Routes of intake
5.2.1. Inhalation
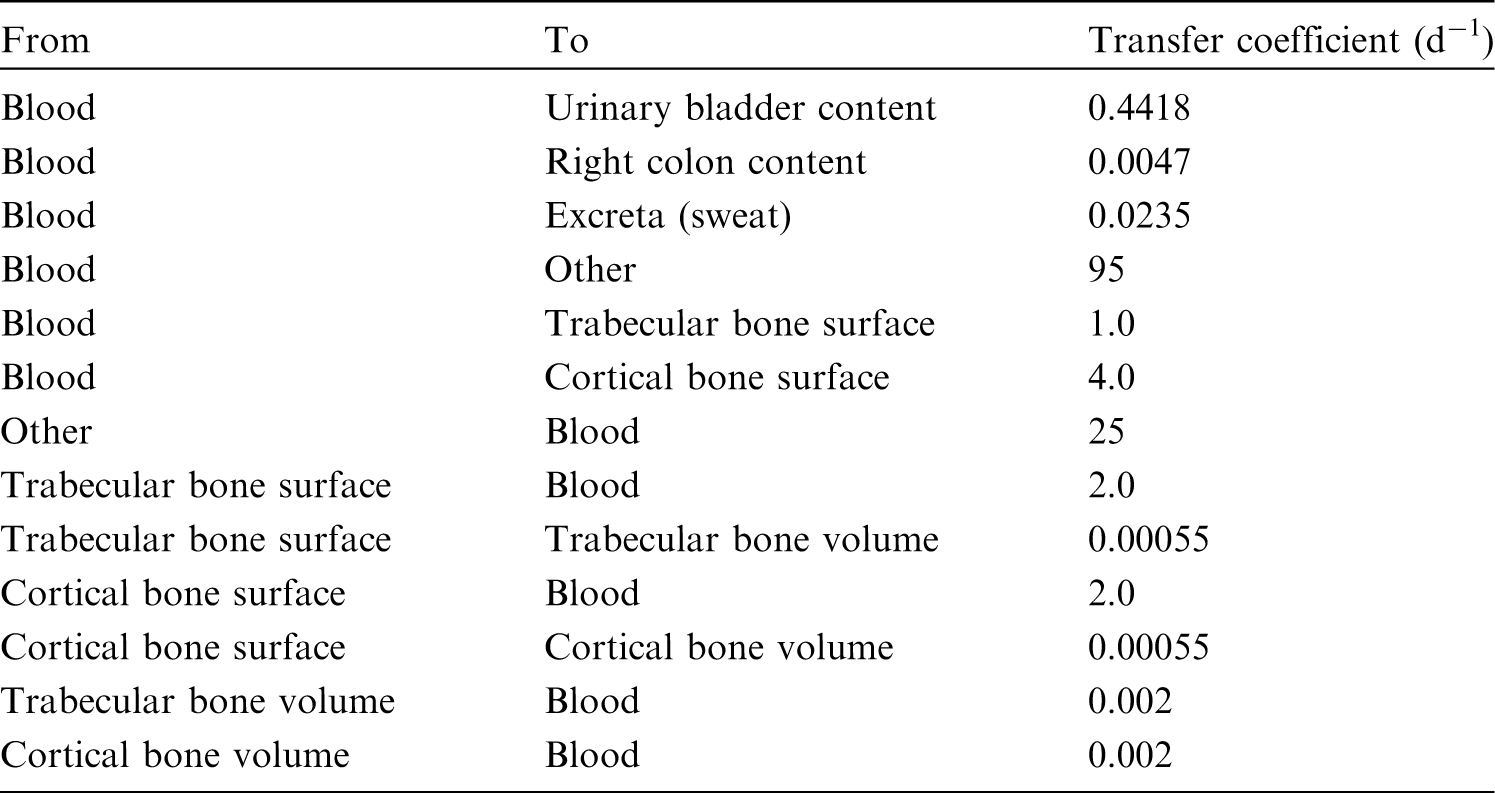
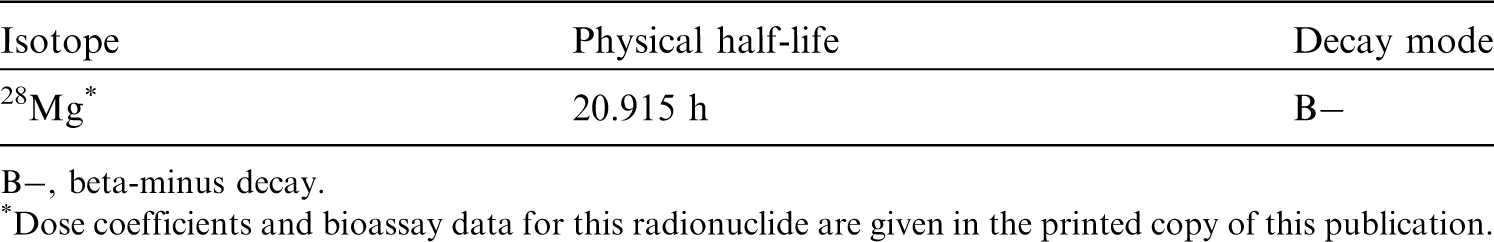
(57) For magnesium, default parameter values were adopted on absorption to blood from the respiratory tract (ICRP, 2015). Absorption parameter values and types, and associated fA values for particulate forms of magnesium are given in Table 5.2. Monitoring techniques for 22Na. Measurement system comprised of germanium detectors. Counting time of 20 min. Monitoring techniques for 24Na. Measurement system comprised of germanium detectors. Counting time of 20 min. Committed effective dose coefficients (Sv Bq−1) for the inhalation or ingestion of 22Na and 24Na compounds. AMAD, activity median aerodynamic diameter. Dose per activity content of 22Na in total body and in daily excretion of urine (Sv Bq−1); 5 µm activity median aerodynamic diameter aerosols inhaled by a reference worker at light work. Dose per activity content of 24Na in total body and in daily excretion of urine (Sv Bq−1); 5 µm activity median aerodynamic diameter aerosols inhaled by a reference worker at light work. N/A, not applicable. Isotopes of magnesium addressed in this publication. B−, beta-minus decay. Dose coefficients and bioassay data for this radionuclide are given in the printed copy of this publication. Absorption parameter values for inhaled and ingested magnesium. It is assumed that the bound state can be neglected for magnesium (i.e. fb = 0). The values of sr for Type F, M, and S forms of magnesium (30, 3, and 3 d−1, respectively) are the general default values. For inhaled material deposited in the respiratory tract and subsequently cleared by particle transport to the alimentary tract, the default fA values for inhaled materials are applied [i.e. the product of fr for the absorption type and the fA value for ingested soluble forms of magnesium (0.5)]. Default Type M is recommended for use in the absence of specific information on which the exposure material can be assigned to an absorption type (e.g. if the form is unknown, or if the form is known but there is no information available on the absorption of that form from the respiratory tract). For guidance on the use of specific information, see Section 1.1. Activity transferred from systemic compartments into segments of the alimentary tract is assumed to be subject to reabsorption to blood. The default absorption fraction fA for the secreted activity is the highest value for any form of the radionuclide (fA = 0.5).


5.2.2. Ingestion
(58) The fractional intestinal absorption of magnesium is generally considered to be of the order of 40–50%, with figures reported from 10% to 70% (Schwartz et al., 1978; ICRP, 1981; EFSA, 2015b). It appears to decrease with increasing magnesium intake (Roth and Werner, 1979; Sabatier et al., 2003b). Magnesium, when present in high concentration, forms an insoluble salt at neutral pH with phytate (Cheryan, 1980). Dietary fibre may bind a variety of elements, including magnesium, and render them unavailable for absorption (Campbell et al., 1976; Reinhold et al., 1976; Knudsen et al., 1996). High intakes of zinc from supplements decrease magnesium absorption (Spencer et al., 1994). (59) The bioavailability of magnesium from mineral water was observed to be 46% in a group of adult women [increased to 52% when water was consumed with a meal (Sabatier et al., 2003b)] and 59% in a group of adult men (Verhas et al., 2002). Magnesium in the aspartate, citrate, lactate, and chloride forms is absorbed more completely by humans than magnesium oxide and magnesium sulphate (Morris et al., 1987; Lindberg et al., 1990; Mühlbauer et al., 1991; Firoz and Graber, 2001; Ranade and Somberg, 2001; Walker et al., 2003). Specifically, the fractional absorption of magnesium oxide appears to be two to four times less than that of soluble forms. Still, in rats, Coudray et al. (2005) and Bertinato et al. (2014) did not observe significant differences in the bioavailability of magnesium oxide and various soluble organic and inorganic magnesium salts, or a negative influence of phytate in the diet. The total amount of magnesium in the diet therefore seems to be the main factor influencing gastrointestinal absorption. (60) In Publications 30 and 68 (ICRP, 1981, 1994a), f1 was taken to be 0.5 for all compounds of magnesium. The same value of fA (0.5) is used here for all chemical forms of magnesium, except the oxide for which a lower fA (0.2) is used.
5.2.3. Systemic distribution, retention, and excretion of magnesium
5.2.3.1. Biokinetic data
(61) Magnesium is an essential element needed for a variety of physiological functions, mainly related to enzyme activity. The adult human body typically contains ∼24 g of magnesium. Only a small portion of the total-body content is carried in blood. The normal concentration in plasma is 0.75–1.0 mmol magnesium L−1. The concentration in red blood cells (RBC) is approximately three times that in plasma. Bone contains ∼60% of the total-body content, and the remainder excluding blood is nearly equally divided between muscle and other soft tissues. Part of bone magnesium exchanges extremely slowly with plasma magnesium. Magnesium residing on bone surfaces is readily released to blood when plasma concentrations decline, but remains bound to bone surfaces at adequate plasma concentrations (Elin, 1987; Vormann, 2003). (62) Aikawa et al. (1960) investigated the behaviour of intravenously administered 28Mg (half-life 20.9 h) in nine normal human subjects (seven males and two females) in the age range 17–54 y. Approximately 20% was removed in urine over 24 h. Faecal excretion was negligible. Exchangeable magnesium was estimated to represent <16% of total-body magnesium. Activity exchanged slowly with stable magnesium in bone, muscle, and RBC. (63) Avioli and Berman (1966) studied magnesium kinetics in 15 normal adult humans, aged 23–34 y, following intravenous administration of 28Mg. Studies of individual subjects were terminated at 2–6 d post injection. Mean urinary and faecal excretion accounted for ∼17% and 2.6%, respectively, of the administered amount (after adjustment for radioactive decay) in five subjects followed for 6 d. Exchangeable magnesium was estimated to represent ∼15% of total-body magnesium. The rapidly exchanging pool was judged to represent extracellular fluid. The data indicated a larger pool of 28Mg that exchanged stable magnesium with Tb of ∼42 d. (64) Watson et al. (1979) studied magnesium kinetics in the whole body, plasma, and RBC in five healthy adult male humans following intravenous administration of 28Mg. Exchangeable magnesium was estimated to represent less than one-quarter of total-body magnesium after 5 d. Total-body retention over the relatively short observation period was described as the sum of two exponential terms, with ∼4.5% removed with Tb of a few hours and the remainder with Tb of ∼30 d. (65) Sabatier et al. (2003a) developed a compartmental model of magnesium metabolism based on results of a stable isotope study involving oral administration of 26Mg and intravenous administration of 25Mg to six healthy adult men in the age range 26–41 y. Isotopic concentrations were determined in blood, urine, and faeces collected over 12 d. The use of stable isotopes enabled longer observation of exchange of magnesium tracers with the body’s magnesium stores, and identification of a larger exchangeable pool than estimated in an earlier study by Avioli and Berman (1966) involving the relatively short-lived radionuclide 28Mg. The exchangeable pool was interpreted as representing 25% of total-body magnesium and consisting of two extraplasma pools that exchange magnesium with plasma and contain 80% and 20% of exchangeable magnesium. The model also described exchange of systemic magnesium with the gastrointestinal tract resulting from secretion of magnesium into the gastrointestinal tract content and reabsorption to blood. Excretion of magnesium was depicted as transfer from plasma to urine and faecal loss of unabsorbed magnesium. The model did not address non-exchangeable magnesium. (66) At 1 d after intravenous administration of 28Mg to dogs, the heart showed the highest activity, followed by the kidneys, liver, and pancreas, among eight examined soft tissues (Brandt et al., 1958). The activity concentration in bone varied greatly from one bone to another, and was generally lower than that in the heart, kidneys, liver, and pancreas. (67) Lazzara et al. (1963) performed a detailed examination of the time-dependent behaviour of 28Mg in dogs over the first 68 h after intravenous administration. There were considerable differences in the rate of exchange of 28Mg with stable magnesium in different tissues. The activity concentration in the kidneys rose rapidly, peaked at ∼4 h, and then declined gradually. The left ventricle, liver, and pancreas initially showed similar 28Mg uptake curves, but peak concentrations occurred at different times for the three organs. There was a continual rise in activity in the cerebellum throughout the observation period. Bone and teeth showed highly variable activity concentrations from one location to another, and neither reached a peak average concentration over the 68-h observation period. Tb for the total body was ∼11 d.
5.2.3.2. Biokinetic model for systemic magnesium
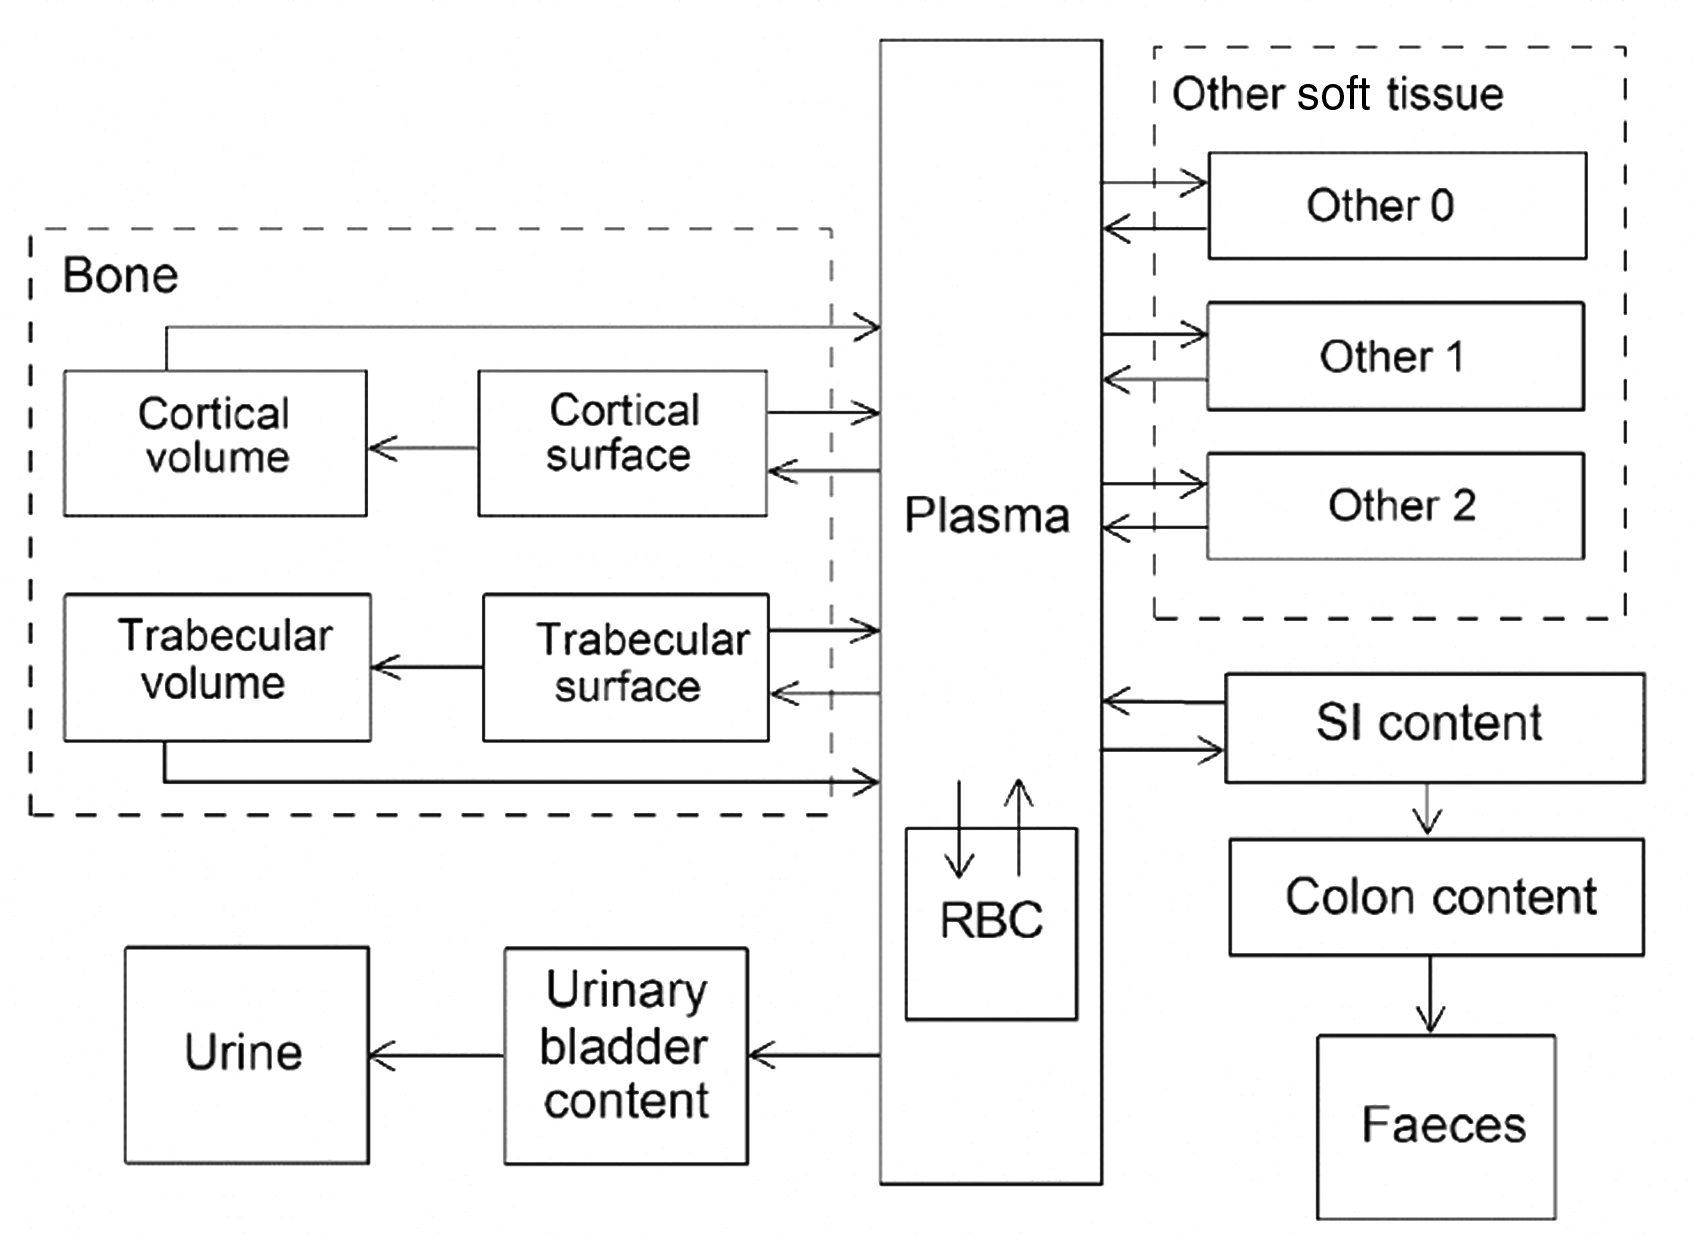
(68) The structure of the biokinetic model for systemic magnesium used in this publication is shown in Fig. 5.1. Transfer coefficients are listed in Table 2.1. (69) The model is an extension of the model of Sabatier et al. (2003a) described above. The median transfer coefficients derived by Sabatier et al. were used as a starting point. Their extraplasma compartment with relatively slow return to blood is assumed here to represent exchangeable sodium in bone. Long-term retention bone compartments were added, and a third soft tissue compartment was added to represent slowly exchangeable magnesium and to approximate the total-body stable magnesium content of adult humans. Model predictions are reasonably consistent with bone and soft tissue magnesium contents in humans (∼55–60% in bone), central urinary and faecal excretion rates reported in the literature, and build-up of the RBC:plasma magnesium ratio as observed by Watson et al. (1979) in normal male subjects. Daily excretion and total body retention of 22Na following inhalation of 1 Bq Type F. Daily excretion and total body retention of 22Na following inhalation of 1 Bq Type M. Daily excretion and total body retention of 22Na following inhalation of 1 Bq Type S. Daily excretion and total body retention of 24Na following inhalation of 1 Bq Type F. Daily excretion and total body retention of 24Na following inhalation of 1 Bq Type M. Daily excretion and total body retention of 24Na following inhalation of 1 Bq Type S. Structure of the biokinetic model for systemic magnesium. SI, small intestine; RBC, red blood cells.


5.2.3.3. Treatment of progeny
(70) The only progeny of magnesium addressed in this publication is 28Al produced by decay of 28Mg. The model for aluminium as a progeny of magnesium is an expansion of the characteristic model for aluminium with added compartments and associated transfer coefficients needed to solve the linked biokinetic models for magnesium and aluminium (see Annex B). For 28Al produced in a compartment not contained in the characteristic model for aluminium, 28Al is assumed to transfer to the central blood compartment of that model at a rate of 1000 d−1 if produced in a blood compartment, and 0.5 d−1 if produced in a tissue compartment, and to follow the characteristic model for aluminium thereafter.
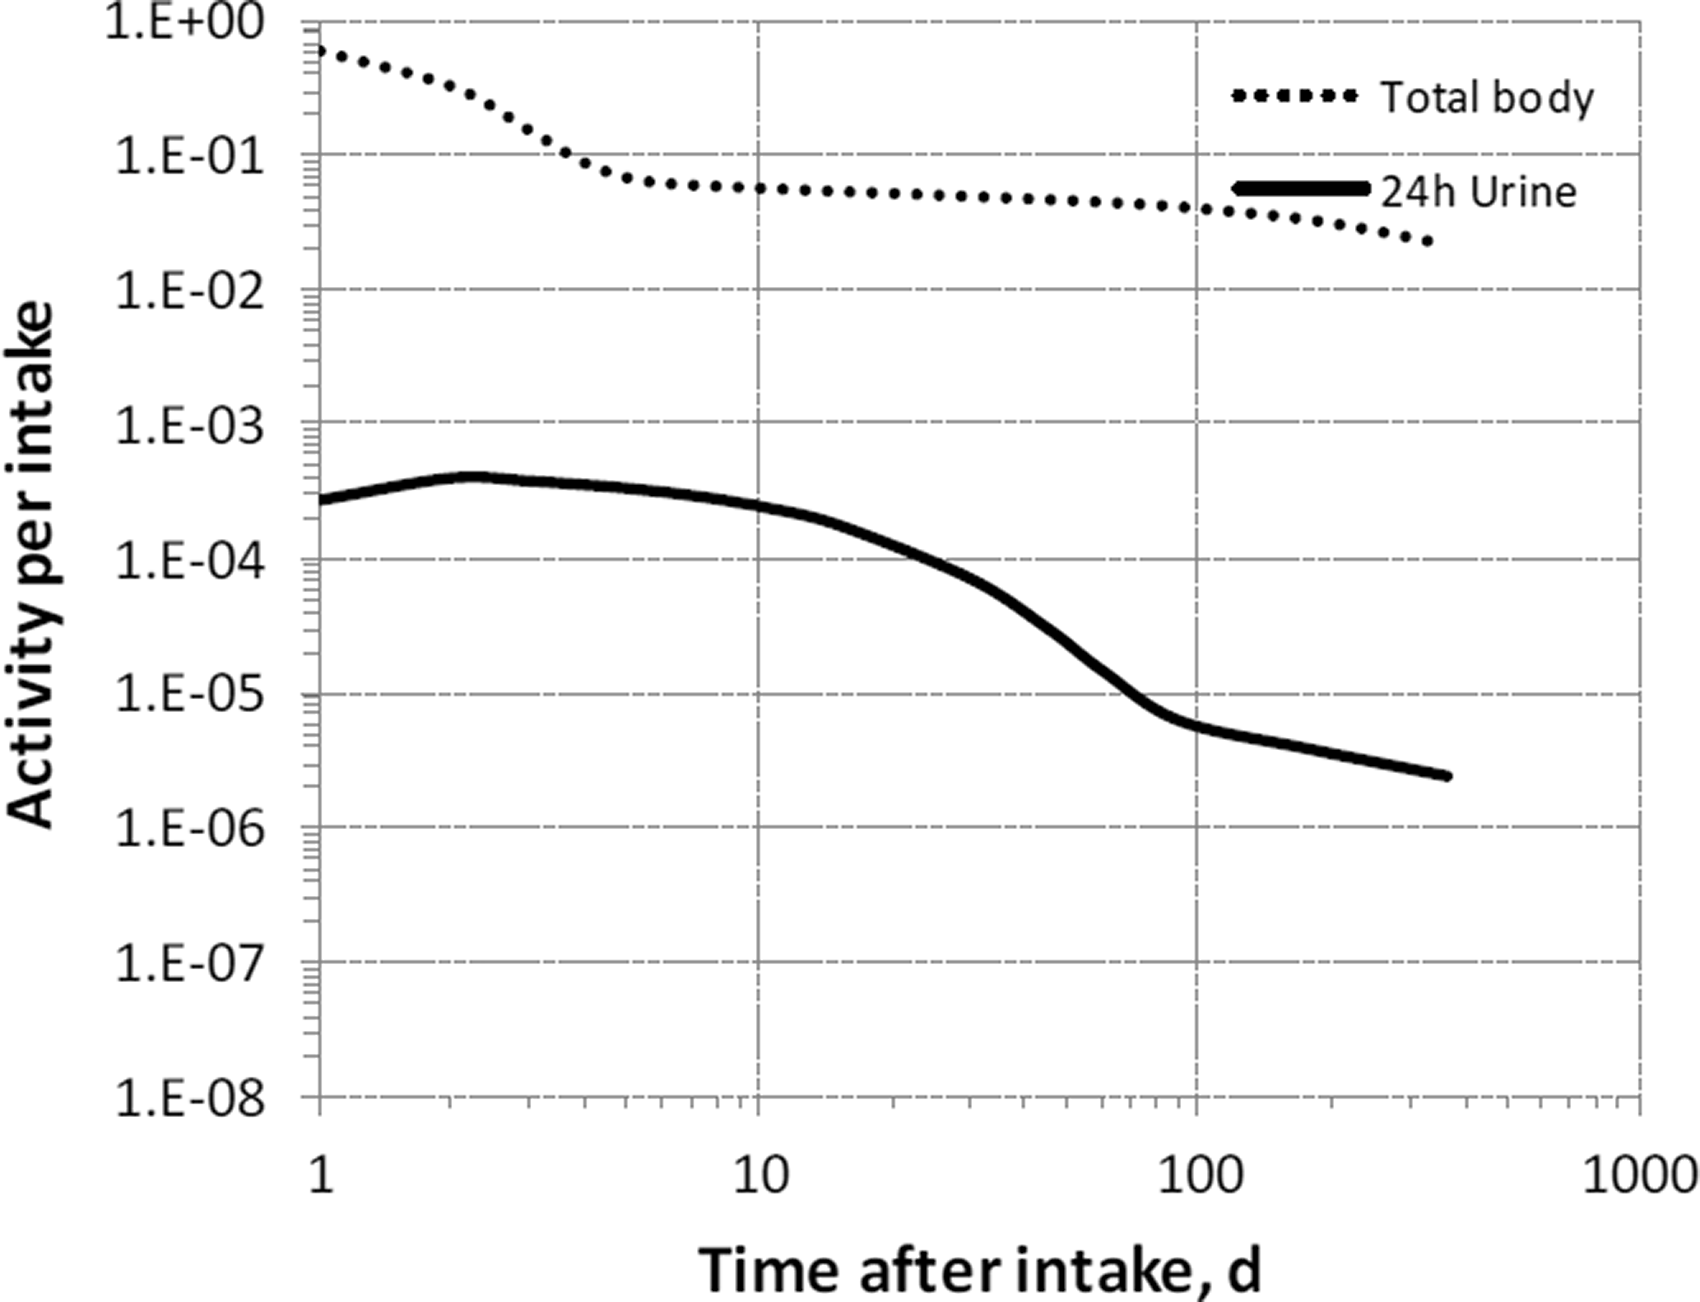
5.3. Individual monitoring
(71) Information regarding the detection limit for routine individual measurement is not available.
5.4. Dosimetric data for magnesium
6. Aluminium (Z = 13)
6.1. Isotopes
6.2. Routes of intake
6.2.1. Inhalation
6.2.1.1. Absorption types and parameter values
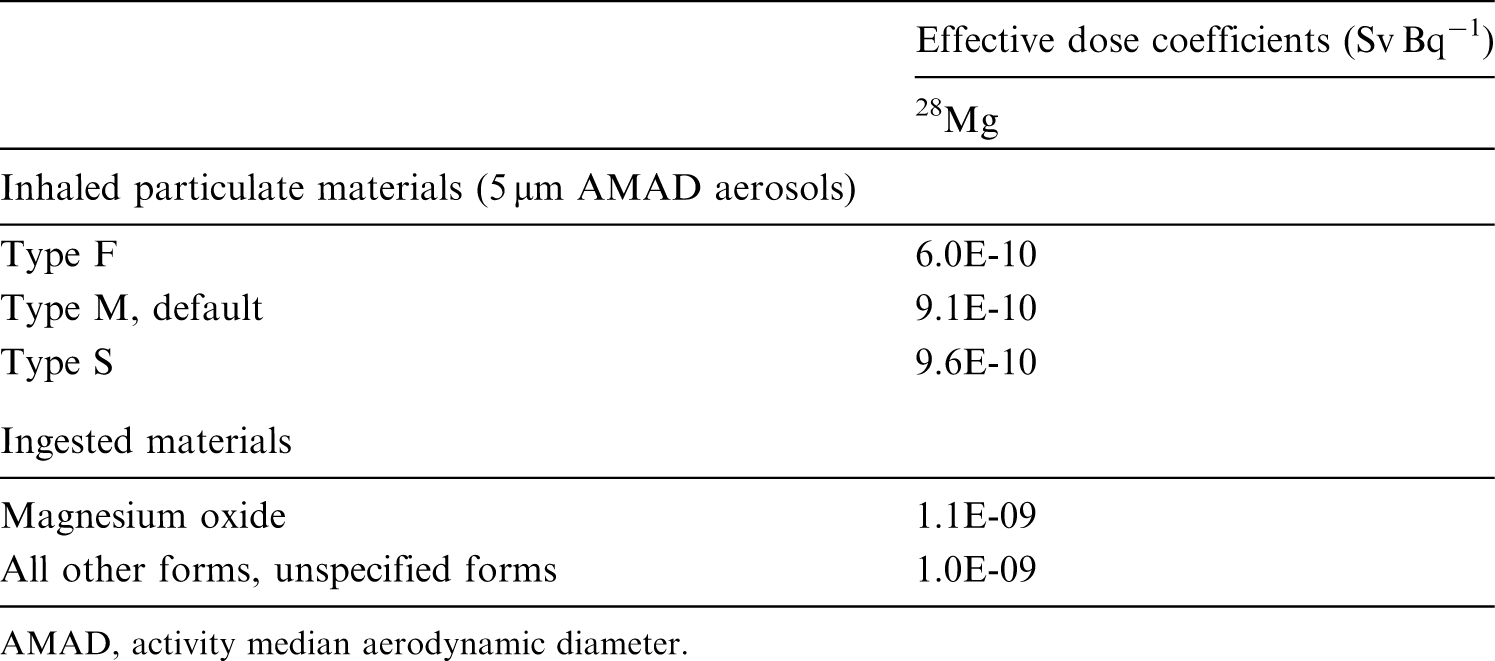
(72) Publication 30 (ICRP, 1981) assigned oxides, hydroxides, carbides, halides, and nitrates of aluminium as well as metallic aluminium to inhalation class W, and all other commonly occurring compounds of the element to inhalation class D on the basis of animal data. Since then, a large amount of information on the behaviour of inhaled aluminium in human subjects has been collected, mainly from workers exposed to aluminium metal and oxide. (73) Absorption parameter values and types, and associated fA values for particulate forms of aluminium are given in Table 6.6. (74) Reference biokinetic models were used here (i.e. by the Task Group) for analysis of the data and the determination of absorption parameter values for aluminium particles. Lung retention data were interpreted using the revised HRTM (ICRP, 2015) and the respiratory tract model for rat described in Supporting Guidance 3 (ICRP, 2002b). Aluminium in lung tissue and blood was taken into account in the comparison with experimental data by using the systemic model for aluminium described in Section 6.2.3. Transfer coefficients in the biokinetic model for systemic magnesium. RBC, red blood cells. Committed effective dose coefficients (Sv Bq−1) for the inhalation or ingestion of 28Mg compounds. AMAD, activity median aerodynamic diameter. Isotopes of aluminium addressed in this publication. EC, electron-capture decay; B+, beta-plus decay. Dose coefficients and bioassay data for this radionuclide are given in the printed copy of this publication. Aluminium exposure and bioassay data for six workers. Aluminium absorption parameter values for six workers. Aluminium exposure and bioassay data for six workers. Aluminium absorption parameter values for six workers. Absorption parameter values for inhaled and ingested aluminium. It is assumed that the bound state can be neglected for aluminium (i.e. fb = 0.0). The values of sr for Type F, M, and S forms of aluminium (30, 3, and 3 d−1, respectively) are the general default values. Materials (e.g. oxide) are generally listed here where there is sufficient information to assign to a default absorption type, but not to give specific parameter values (see text). For inhaled material deposited in the respiratory tract and subsequently cleared by particle transport to the alimentary tract, the default fA values for inhaled materials are applied [i.e. the product of fr for the absorption type and the fA value for ingested soluble forms of aluminium (0.003)]. Default Type S is recommended for use in the absence of specific information (i.e. if the form is unknown, or if the form is known but there is no information available on the absorption of that form from the respiratory tract). For guidance on the use of specific information, see Section 1.1. Activity transferred from systemic compartments into segments of the alimentary tract is assumed to be subject to reabsorption to blood. The default absorption fraction fA for the secreted activity is the highest value for any form of the radionuclide (fA = 0.003).


(a) Aluminium oxide (Al2O3)
(75) Mussi et al. (1984) measured aluminium in urine and plasma of seven workers exposed to aluminium dust or aluminium welding fumes for 6 months. Aluminium was determined from samples of blood and urine. The levels of aluminium in plasma were mainly within the range of values found in non-occupationally exposed subjects. The urinary aluminium levels were much higher than in non-occupationally exposed subjects, and increased from the beginning (mean 46 µg L−1) to the end (mean 93 µg L−1) of the workshift. Two weeks after the termination of exposure, the urinary aluminium levels had decreased to a mean of 9 µg L−1. Exposure in the workplace was also determined from personal air samples (mean 3.7 mg m−3). Analysis here of the data suggested assignment of inhaled aluminium in both dust and fumes to Type S. (76) Sjögren et al. (1985) investigated the relationship between exposure to welding fumes, assumed to consist mainly of aluminium oxide, and aluminium urinary excretion over 1 week. Three male volunteers previously unexposed to aluminium, three male welders exposed to aluminium-containing welding fumes for short periods (1–24 months), and three male welders exposed to aluminium-containing welding fumes for long periods (18–20 y) were subject to air and urine monitoring. The mass median aerodynamic diameter (MMAD) was ∼0.4 µm in metal inert-gas (MIG) welding of aluminium and somewhat smaller in tungsten inert-gas welding. The volunteers performed very light physical work during exposure, and their pulmonary ventilation was estimated to be ∼20 L min−1. The exposure varied between 0.3 and 10.2 mg m−3. The urinary excretion of aluminium for the volunteers was 0.1–0.3% of the total inhaled mass within the next 2 d after exposure. Analysis here of the data gave fr = 0.03, ss < 10−4 d−1 for a volunteer; fr = 0.02, sr = 3 d−1, and ss = 2 × 10⁻⁴ d−1 for a welder exposed for 1 month; fr = 0.02 and ss = 10−4 d−1 for a welder exposed for 19 y; and assignment to Type S for the three individuals. (77) Sjögren et al. (1998) conducted similar investigations in 25 welders by personal air sampling during a workshift, urine sampling at the end of the workshift, and after a period of 16–37 d without exposure. The urinary concentration of aluminium was dependent on the level of current exposure and on the duration of exposure. The observed relationship between air concentrations of aluminium and urinary excretion were consistent with fr = 0.05 when sr and ss were fixed at default values for Type S, suggesting that aluminium welding fumes could be assigned to Type S. (78) Elinder et al. (1991) assessed the concentrations of aluminium in blood, urine, and bone biopsies of two welders exposed to fumes from MIG welding for 20 y. Air concentrations were measured during 1 week at an average of 3–9 mg aluminium m−3. The level of aluminium in urine dropped by 14–63% over 5 y after the end of exposure (from 370–560 µg d−1 during exposure to 170–400 µg d−1 afterwards). The level of aluminium in the skeleton was 18–29 µg per g dry mass. Analysis here gave fr = 0.02–0.04 and ss = 1–8 × 10⁻⁵ d−1. This is consistent with assignment to Type S. (79) Pierre et al. (1995) investigated the variations of atmospheric concentration of aluminium and fluorine compounds at workplaces, and of the corresponding urinary excretion of the two elements in 16 male workers over a working week. Detailed air and urine data are provided for six individuals (Table 6.2). Five of them were potentially exposed to aluminium oxide as well as to other aluminium compounds. In analysis of the air samples, the collected particles yielded a soluble fraction of aluminium obtained by dissolution in water, and an insoluble fraction of aluminium obtained by dissolution in hydrofluoric and nitric acids. The relative soluble and insoluble fractions indicate exposure to less-soluble compounds for Workers A1 and A2 than for Workers B1, B2, C1, and C2. Analysis here of the urine and exposure data gave the absorption parameter values in Table 6.3 and assignment to the type indicated. (80) Pierre et al. (1998) studied the individual exposure, plasma, and urine levels of aluminium for 335 workers from seven aluminium industry plants. Detailed air and urine data are provided for six individuals monitored over 1 week (Table 6.4). One of them (Worker 2) was exposed to aluminium oxide. The authors estimated the solubility of the oxide to be low. Analysis here of the urine and exposure data gave the absorption parameter values in Table 6.5 and assignment to the type indicated (i.e. Type S for exposure to aluminium oxide). However, the lack of information on the duration of former exposure made bioassay interpretation difficult for the most insoluble compounds, so sr and ss were fixed to default values for Type S, and only the value for fr was derived from the individual bioassay and air sampling data. (81) McAughey et al. (1998), Priest et al. (1998b), and Priest (2004) reported the results of a study where two male human volunteers inhaled 26Al-labelled aluminium oxide particles with MMAD of 1.2 µm. The intakes were estimated, from whole-body gamma spectrometry and early faecal samples, as 6 and 16 Bq, respectively. Urinary excretion was monitored for 1000 d: ∼0.02% initial lung deposit (ILD) was cleared each day during the first month, but the amount of aluminium in urine decreased with a half-time of ∼90 d. Overall, the fraction that was transferred to blood was estimated to be 1.9% ILD. Simultaneous analysis here of urine data from both workers gave fr = 0.004, ss = 2 × 10⁻⁴ d−1, and assignment to Type S. (82) Riihimäki et al. (2008) assessed the airborne and internal aluminium exposure of 12 aluminium welders and fitters in a shipyard and five manufacturers of aluminium sulphate. The welders were exposed to aluminium oxide fumes made of ultrafine (diameter <0.1 µm) particles and agglomerates. Personal air samples were collected during two consecutive workdays. Urine and blood samples were collected over 48 h, after a summer holiday, and 1–2 y later. Aluminium in samples was measured by electrothermal atomic absorption spectrometry. Analysis by the authors of the data for a welder (Worker C) suggested fr = 0.012. This is consistent with assignment to Type S. (83) Kiesswetter et al. (2007) studied the exposure and neurobehavioural data of 20 male aluminium welders in the train and truck construction industry. Three investigations were conducted over 4 y to measure total dust in air as well as aluminium in urine and plasma. Comparison of the levels of exposure with the urine bioassay data would be compatible with Type S behaviour of inhaled aluminium. (84) Kiesswetter et al. (2009) conducted a similar study for 92 male aluminium welders in the automobile industry, compared with 50 non-exposed construction workers of the same industry. Three investigations were performed over 4 y and indicated mean values for total dust in air of 0.5–0.8 mg m−3, aluminium in pre-shift urine of 23–43 µg per g creatinine, aluminium in post-shift urine of 21–43 µg per g creatinine, and aluminium in plasma of 5–9 µg L−1. In a control group, mean aluminium in pre-shift urine was 9–10 µg per g creatinine and mean aluminium in pre-shift plasma was 2–5 µg L−1. Comparison of the levels of exposure with the urine bioassay data would be compatible with Type S behaviour of inhaled aluminium. (85) Klosterkötter (1960) investigated the elimination of aluminium oxide for 3 months after short-term inhalation by 40 female white rats. The animals were exposed to high concentrations (33 g Al2O3 m−3) for 5 h d−1 for 4 d. The particle sizes were 5–40 nm, tending to agglomerate in aggregates measuring several microns. The initial alveolar deposit (IAD) was estimated as retention 24 h after termination of the last inhalation. The lung burden then decreased to 87% of IAD after 1 month, 72% after 2 months, and 69% after 3 months. Approximately 0.4% and 1% of IAD was translocated to the mediastinal lymph nodes after 1 and 3 months respectively. This indicates Type S behaviour. (86) Christie et al. (1963) investigated the lung burden of aluminium oxide in rats and hamsters exposed by inhalation to ‘aluminium powder’ (20% aluminium and 80% aluminium oxide with particle sizes of 0.05–7 µm) or to alumina fume produced by arcing two aluminium electrodes (particles with diameters from 0.02 to 0.2 µm). The powder and fume were administered separately, hourly and every 2 h, respectively, over an 8-h day. The rats were exposed to powder or fume for 9–13 months, and the resulting lung burden was assessed after sacrifice at 10, 13, 16, and 20 months. The hamsters were exposed to dust for 4–19 months and then sacrificed for assessment of the lung burden. In rats, 1–6% of the lung deposit at the end of chronic exposure to powder was still in the lungs 6–7 months later, which would indicate Type F or M behaviour. Analysis here gave ss = 0.009–0.01 d−1, which is consistent with assignment to Type M. Following exposure to fume, 34–74% of the lung deposit was still there 6–7 months after the end of exposure, suggesting Type S behaviour. Analysis here gave ss = 1 × 10⁻⁵–7 × 10⁻⁴ d−1, which is consistent with assignment to Type S. In hamsters, the level of aluminium in the lungs was stable over 4–19 months of inhalation of the powder, suggesting Type F or M behaviour. During chronic inhalation of fume, the lung burden increased by a factor of 4–5 from 4 to 19 months, suggesting Type S behaviour. (87) Röllin et al. (1991) studied the tissue distribution of aluminium in rabbits chronically exposed to inhalation of aluminium oxide at 0.56 mg aluminium m−3 for 5 months. The ratio of aluminium content in the organs of the exposed animals to that in the organs of the controls was 67 times higher in the lungs than in bone, and even more so than in other soft tissues. As noted by the authors, the high concentration of aluminium in lung tissue confirms the very slow rate of uptake of aluminium oxide.
(b) Aluminium metal
(88) Several studies provided data on exposure to aluminium metal, as flake powder, dust from metal cutting and milling, or collected from a potroom (building housing the electrolysis cells). However, aluminium oxidises in air and exposure to aluminium metal is therefore likely to include a significant but unknown fraction of aluminium oxide that may influence the analysis of absorption. (89) McLaughlin et al. (1962) conducted the autopsy of a man who had worked for 13.5 y in the ball-mill room of an aluminium powder factory, and measured the aluminium content of body tissues. This was 340–430 µg aluminium per g of wet lung and 5–90 µg aluminium per g wet mass of brain, liver, and bone. Air sampling was performed in the workplace that gave average dust concentrations of 0.94–1.75 mg m−3 containing 60–71% aluminium and flakes of diameter up to 35 µm. Comparison of long-term body retention with measured exposure in the workplace and the relative concentrations of aluminium in the lungs and systemic tissues indicate Type M or S behaviour. (90) As explained above, Mussi et al. (1984) monitored aluminium in urine and plasma, and airborne aluminium in the workplace of seven workers exposed to aluminium dust from polishing and shape cutting, or to aluminium welding fumes for 6 months. Analysis here of the data suggested assignment to Type S for inhaled aluminium in both dust and fumes. (91) Ljunggren et al. (1991) investigated the blood and urine concentrations of aluminium in 13 workers exposed to aluminium flake powder before and after 4–5 weeks of holiday, and among 10 other workers before and after retirement. The powder consisted of flakes of aluminium metal plus some aluminium oxide of diameter 5–200 µm and thickness 0.05–1 µm. Urinary concentration of aluminium was 80–90 times higher in currently exposed workers than in occupationally non-exposed persons. After holidays, a median decrease of 36% was observed. After retirement, aluminium in urine decreased with half-lives from <1 to 8 y depending on the number of years since retirement. The observed variations in urinary aluminium would be compatible with Type M or S behaviour. (92) As explained above, Pierre et al. (1998) studied the individual exposure and plasma and urine levels of aluminium for 335 workers from seven aluminium industry plants. Detailed air and urine data are provided for six individuals monitored over 1 week (Table 6.4). The dust sampled close to the electrolysis tanks was 30–50% soluble in water, and this type of exposure corresponded to relatively high aluminium excretion. However, the highest urinary concentrations were encountered in the case of exposure to aluminium powder, the aqueous solubility of which was very low in the experimental conditions employed. Analysis here of the urine and exposure data gave the absorption parameter values in Table 6.5, and assignment to Type M or S for exposure to aluminium metal. (93) Röllin et al. (2001) investigated the aluminium uptake and excretion of 115 newly employed potroom workers during the construction of an aluminium smelter and up to 1 y into full production. Air, blood, and urine samples were collected over 3 y. Analysis here of the results gave fr = 0.04 and ss = 0.003 d−1. This is consistent with assignment to Type M. (94) As explained above, Riihimäki et al. (2008) assessed the airborne and internal aluminium exposure of 12 aluminium welders and fitters in a shipyard, and five manufacturers of aluminium sulphate. The fitters were exposed to grinding and polishing dusts containing larger particles of metallic aluminium and its oxide. Analysis here of the data for a fitter (Worker A) suggested fr = 0.1 and ss = 1 x 10⁻⁴ d−1. This is consistent with assignment to Type S.
(c) Aluminium fluoride (AlF3)
(95) As explained above, Pierre et al. (1995) investigated variations in atmospheric concentrations of aluminium and fluorine compounds at workplaces, and the corresponding urinary excretion of the two elements in 16 male workers over a working week. Detailed air and urine data are provided for six individuals (Table 6.2). Analysis here of the urine and exposure data for Worker A1 gave assignment to Type S for AlF3 dust (Table 6.3). (96) As already mentioned, Pierre et al. (1998) studied the individual exposure and plasma and urine levels of aluminium for 335 workers from seven aluminium industry plants. Detailed air and urine data are provided for six individuals monitored over 1 week (Table 6.4). The authors estimated the solubility of aluminium fluoride compounds to be low. Analysis here of the urine and exposure data of Worker 3 gave assignment to Type S for aluminium fluoride (Table 6.5).
(d) Bauxite ore [mainly Al(OH)3]
(97) Pierre et al. (1998) estimated the solubility of aluminium hydroxide to be low. Analysis here of the urine and exposure data of Worker 1 gave assignment to Type S for bauxite ore (Table 6.5). (98) As explained above, Riihimäki et al. (2008) assessed the airborne and internal aluminium exposure of 12 aluminium welders and fitters in a shipyard, and five manufacturers of aluminium sulphate [Al2(SO4)3]. The manufacturers were exposed to water-insoluble bauxite ore and water-soluble aluminium sulphate as dusts of particles with diameters from 1 to 10 µm. For the aluminium sulphate plant workers, a mean rapidly absorbed fraction fr = 0.067 was estimated by the authors, consistent with assignment to Type S.
(e) Aluminium chlorhydrate [Al2(OH)5Cl(H2O)x]
(99) Aluminium chlorhydrate (ACH) is a common ingredient in antiperspirant deodorants. Steinhagen et al. (1978) studied the distribution and effects of aluminium in the bodies of rats and guinea pigs exposed by inhalation to ACH with MMAD of 1.2–1.6 µm for 6 months at levels of 0.25–25 mg m−3. Blood, heart, lung, liver, kidney, spleen, and brain tissues were analysed, but aluminium could be detected only in the lungs and peribronchial lymph nodes. The absence of detectable aluminium in systemic tissues, even after 6 months of exposure at the highest level, suggests poor absorption from the lungs. Stone et al. (1979) conducted a similar study for 2 y. Again, no aluminium in excess of the control value was detected in systemic tissues, except for the adrenals of rats exposed to medium and high levels of ACH. The long-term accumulation of aluminium in the lungs and peribronchial lymph nodes, despite mucociliary clearance, and the lack of increased aluminium concentration in systemic organs except the adrenals point towards Type S absorption.
(f) Unspecified compounds
(100) Teraoka (1981) reported the concentrations of 24 elements, including aluminium, in internal organs from 12 healthy males and seven metal workers in Japan, immediately after post-mortem examination. On average, the concentration of aluminium was ∼15 times higher in the lungs than in other soft tissues at the time of death, and 50 times higher in the hilar lymph nodes than in systemic soft tissues. This distribution would point towards inhalation of insoluble aluminium compounds. (101) Gitelman (1995) and Gitelman et al. (1995) reported the means and confidence intervals for aluminium inhalation exposures and urinary excretion among 279 workers from reduction, extrusion, powder, paste, forge, cable, aluminium, and rolling mills from 15 plants representative of the US aluminium industry, divided into two groups based on median exposure to aluminium. The low-exposure group was exposed to a geometric mean of 7 µg aluminium m−3 and excreted, on average, 9.4 µg aluminium per g creatinine. The high-exposure group was exposed to a geometric mean of 550 µg aluminium m−3 and excreted, on average, 15.1 µg aluminium per g creatinine. A control group was exposed to a geometric mean of 3 µg aluminium m−3 and excreted, on average, 6.3 µg aluminium per g creatinine. All those workers had been employed for a minimum duration of 2 y and a median duration of 9 y. Under standard assumptions for exposure, those data would be consistent with Type S absorption of inhaled aluminium.
6.2.1.2. Rapid dissolution rate for aluminium
(102) No reliable estimates have been made of the rapid dissolution rate of aluminium in particulate form. The general default value of 30 d−1 is therefore applied to all Type F forms of aluminium.
6.2.1.3. Extent of binding of aluminium to the respiratory tract
(103) No evidence was found for binding of aluminium to the respiratory tract. It is therefore assumed that the bound state can be neglected for aluminium (i.e. fb = 0.0).
6.2.2. Ingestion
6.2.2.1. Human studies
(104) Hohl et al. (1994) measured 26Al by mass spectrometry in blood and urine of two volunteers over 23 d after ingestion of the chloride (AlCl3), which indicated fractional absorption in the range of 0.1%. Two young male adults ingested 26Al in tap water after overnight fasting. Gastrointestinal uptake was determined from the measurement of blood and was, on average, 0.22% of the ingested dose (Priest et al., 1998b). Steinhausen et al. (2004) studied the biokinetics of aluminium in six healthy volunteers and two patients with chronic renal failure. Fractional intestinal absorption in the range of 0.1% of aluminium ingested as the chloride was derived from measurement of blood and urine samples. (105) Weberg and Berstad (1986) measured the increase of aluminium concentration in serum and urine of 10 healthy subjects after ingestion of aluminium hydroxide antacids, and estimated fractional absorption of 0.004% based on 72-h excretion. This increased to 0.03% and 0.2% when the antacids were ingested with orange juice and citric acid, respectively. Haram et al. (1987) compared the absorption of aluminium from sucralfate (a sucrose aluminium sulphate and aluminium hydroxide complex) and an aluminium-hydroxide-containing antacid. The measurement of daily urinary excretion before and after drug administration indicated similar absorption of ∼0.005% ingested aluminium. Priest et al. (1996) assessed the fractional absorption of ingested aluminium to be 0.5% from the citrate and 0.01% from the hydroxide in two volunteers from the measurement of 26Al content in blood (over 24 h), urine, and faeces (over 6 d) of two volunteers. The administration of aluminium hydroxide together with the citrate increased absorption to 0.14%. Mashitsuka and Inoue (1998) compared the aluminium intake and urinary excretion of four volunteers ingesting an aluminium hydroxide gel with those of nine volunteers ingesting ordinary food alone. They derived fractional aluminium absorption from aluminium hydroxide of 0.003%.
6.2.2.2. Animal studies
(106) Yokel and McNamara (1988) evaluated the uptake of aluminium in different chemical forms (Table 6.7) by comparing plasma concentration over time after oral and intravenous administration to 10 rabbits. Partial nephrectomy did not significantly affect aluminium absorption in 10 other animals, except for an increase to 4.6% for aluminium citrate. By monitoring urinary excretion after gastric gavage, Froment et al. (1989) estimated absorption in rats for several of these aluminium compounds (Table 6.7). Wilhelm et al. (1992) estimated 0.02% fractional absorption of aluminium lactate in rats by comparison of aluminium in blood after intravenous and intragastric administration. Administering lower doses of 26Al to nine rats by gavage, and following blood and urine aluminium content, Schönholzer et al. (1997) estimated fractional intestinal absorption for the hydroxide, citrate, and matotate, and the influence of the addition of sodium citrate (Table 6.7). The fractional absorption of aluminium from the food additive acidic sodium aluminium phosphate (SALP) was estimated to be ∼0.1% in rats (Yokel and Florence, 2006). EFSA (2011) evaluated a more recent study from the industry on the oral bioavailability of various aluminium compounds, including several common food additives (Table 6.7). The carcass 26Al content was measured 7 d after intravenous and oral administration to groups of six rats. However, the level of 26Al after ingestion of aluminium metal and SALP was below the limit of detection. When comparing the bioavailability of orally gavaged aluminium citrate, nitrate, chloride, sulphate, and hydroxide in rats for 7 or 14 d, Poirier et al. (2011) noted few differences in blood and tissue concentrations, except for significantly higher aluminium content in rats gavaged with aluminium citrate. Despite continued aluminium intake, blood and tissue contents decreased between 7 and 14 d. (107) An absorption value of 0.01 was recommended in Publications 30 and 68 (ICRP, 1981, 1994a) for all compounds of aluminium. The new available data allow more precise estimates for gastrointestinal absorption of aluminium in different forms. In this publication, an fA value of 0.003 is adopted for soluble forms of aluminium, including aluminium chloride. A lower value of 1 × 10⁻⁴ is adopted for insoluble forms, including aluminium metal, oxide, hydroxide, and sulphate. Gastrointestinal absorption of aluminium in various chemical forms given by gavage to rabbits (Yokel and McNamara, 1988) and rats (Froment et al., 1989; Wilhelm et al., 1992; Schönholzer et al., 1997; Yokel and Florence, 2006; EFSA, 2011). SALP, sodium aluminium phosphate. Allura Red AC: Allura Red AC is used as a food dye and has the E number E129.
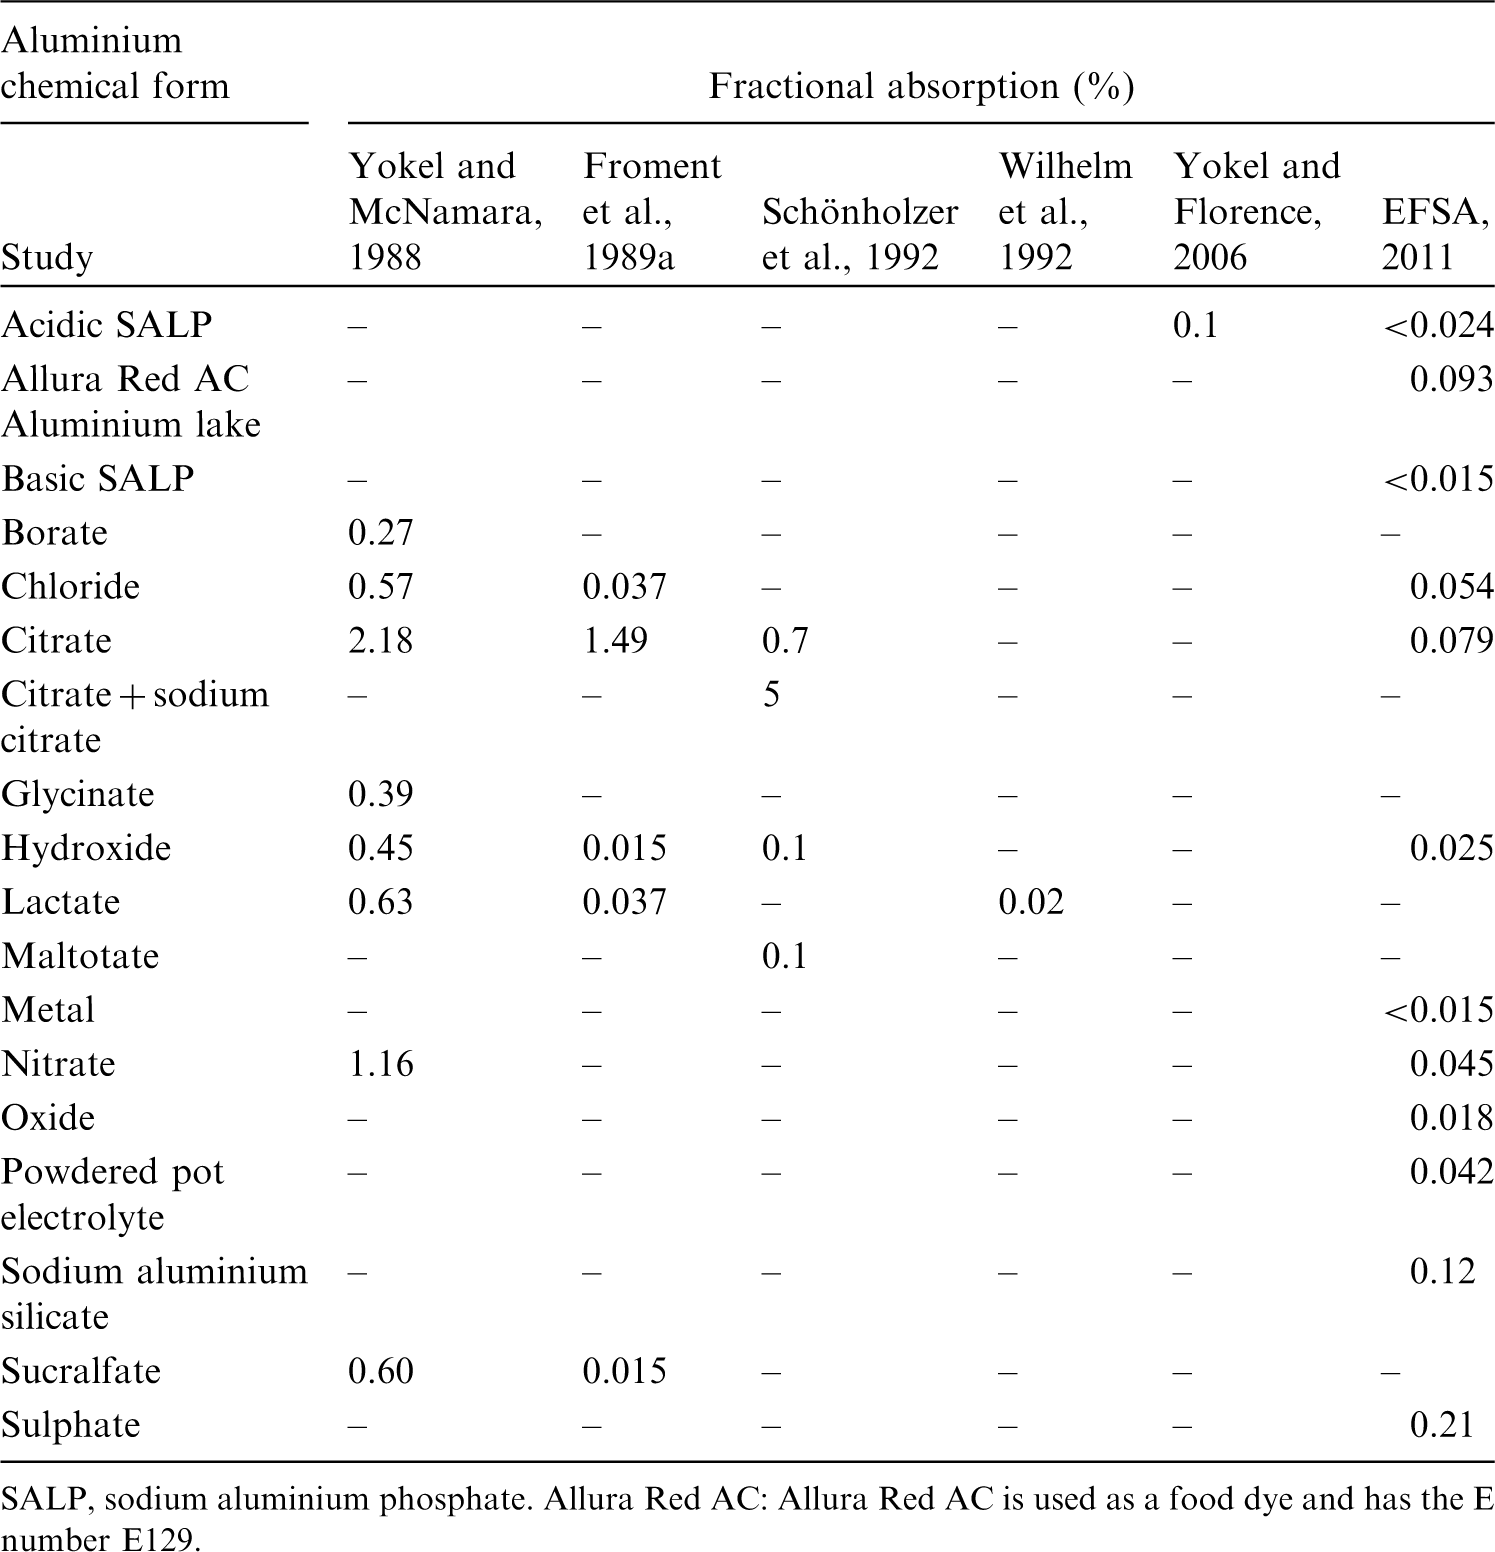
6.2.3. Systemic distribution, retention, and excretion of aluminium
6.2.3.1. Biokinetic data
(108) Aluminium is the most abundant metal in the earth’s crust. It is not an essential element but is of interest to nutritionists because of its interactions with nutrients such as phosphorus, calcium, magnesium, iron, and vitamin D. It is of interest to toxicologists because of the potential adverse health effects of aluminium-containing products (Greger, 1993). (109) The preponderance of absorbed aluminium binds to the circulating iron-transport protein transferrin, which has receptors in many tissues. As much as 15–20% of aluminium entering blood forms small-molecule complexes that presumably are readily excreted (DeVoto and Yokel, 1994). Urinary losses account for >90% of endogenous excretion of aluminium. Biliary secretion accounted for ≤2% of total excretion of aluminium in human subjects, dogs, rabbits, and rats (Yokel and McNamara, 2001). Post-mortem measurements of aluminium in 17 tissues of up to 68 adult male subjects indicate a central total-body content of ∼0.2 g, with the lungs, bone, and soft tissues containing ∼13%, ∼31%, and ∼55%, respectively, of the total-body content (Zhu et al., 2010). These values are reasonably consistent with the conclusions of Skalsky and Carchman (1983), who used published autopsy data to estimate ∼0.3 g aluminium in the adult human body, with the lungs, bone, and soft tissues containing ∼12%, ∼40%, and ∼47%, respectively. (110) The gastrointestinal absorption and systemic biokinetics of aluminium have been difficult to characterise due to difficulties in identifying a suitable tracer (Greger, 1993; Priest, 2004). Except for the long-lived isotope 26Al (half-life 7.2 × 10⁵ y), radioisotopes of aluminium have half-lives <10 min. Application of 26Al in biokinetic studies has been limited by its scarcity and high cost. Until the early 1990s, studies of aluminium biokinetics in human subjects were limited to administration of the stable isotope 27Al. Human studies of 26Al biokinetics initiated in 1991 provided improved information on the bioavailability, blood clearance, excretion pattern, long-term retention, and variable kinetics of aluminium in the human body (Priest, 1997). (111) Priest et al. (1995) investigated the systemic kinetics of 26Al administered intravenously as the citrate to a healthy adult male volunteer. Activity disappeared rapidly from blood. Less than 1% of the injected amount remained in blood after 2 d. Cumulative urinary and faecal excretion accounted for 83% and 1.8%, respectively, of the administered amount after 13 d. Total-body retention of the retained ∼15% declined to ∼4% by 1178 d. Long-term Tb of 7 y was estimated. (112) Talbot et al. (1995) studied the biokinetics of 26Al in six healthy adult males over 5–6 d after intravenous administration as the citrate. The activity concentration in blood was in the range 3.3–13% of injected 26Al L−1 blood at 1 h and 0.093–0.73% L−1 at 1 d. Mean cumulative urinary 26Al represented 59% (range 46–74%) of injected activity at 1 d and 72% (range 62–83%) at 5 d. Faecal excretion accounted for ∼1% of injected 26Al over the first 5 d. Mean total-body retention at 5 d represented 27% (range 16–36%) of administered activity. (113) In biokinetic studies on laboratory animals, the behaviour of aluminium has been found to vary with age, administered form, and route of administration, and to some extent with animal species. Important systemic repositories of aluminium identified in animal studies include bone, liver, and kidneys (Berlyne et al., 1972; Zafar et al., 1997; Wu et al., 2012). The brain shows a low uptake rate but a relatively long retention time of aluminium (Yokel, 2002).
6.2.3.2. Biokinetic model for systemic aluminium
(114) The structure of the biokinetic model for systemic aluminium applied in this publication is shown in Fig. 6.1. Transfer coefficients are listed in Table 6.8. Activity absorbed to blood from the respiratory or alimentary tract is assigned to Blood 1. Parameter values are set primarily for consistency of model predictions and two primary data sets: blood clearance, urinary and faecal excretion rates, and total-body retention of intravenously administered 26Al in human subjects (Priest et al., 1995; Talbot et al., 1995); and the distribution of aluminium in adult male humans as indicated by autopsy data (Skalsky and Carchman, 1983; Zhu et al., 2010). Transfer coefficients in the biokinetic model for systemic aluminium. Structure of the biokinetic model for systemic aluminium.
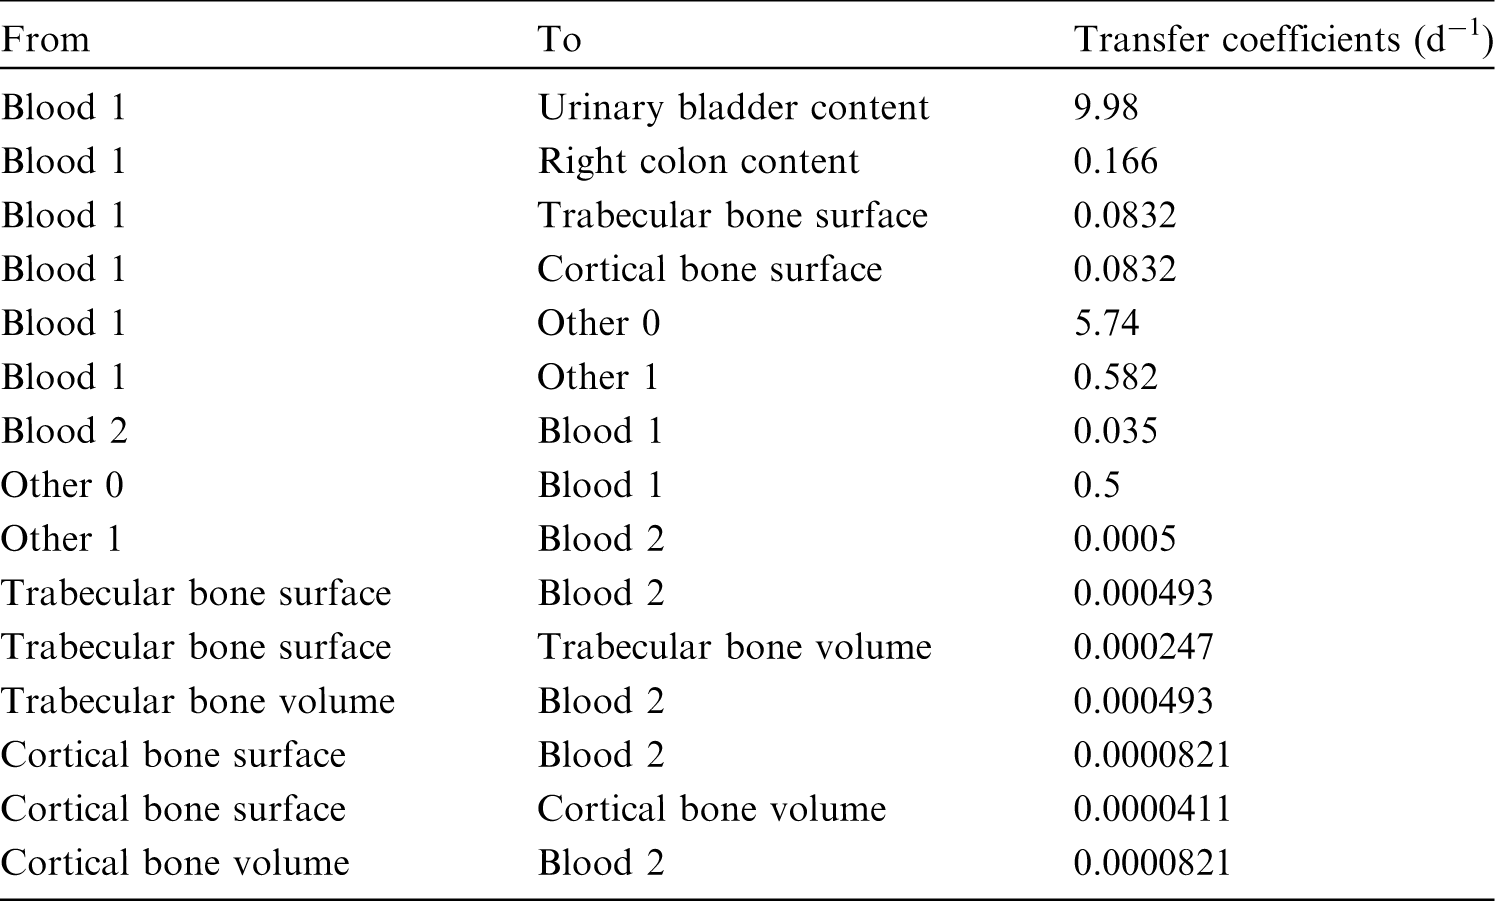
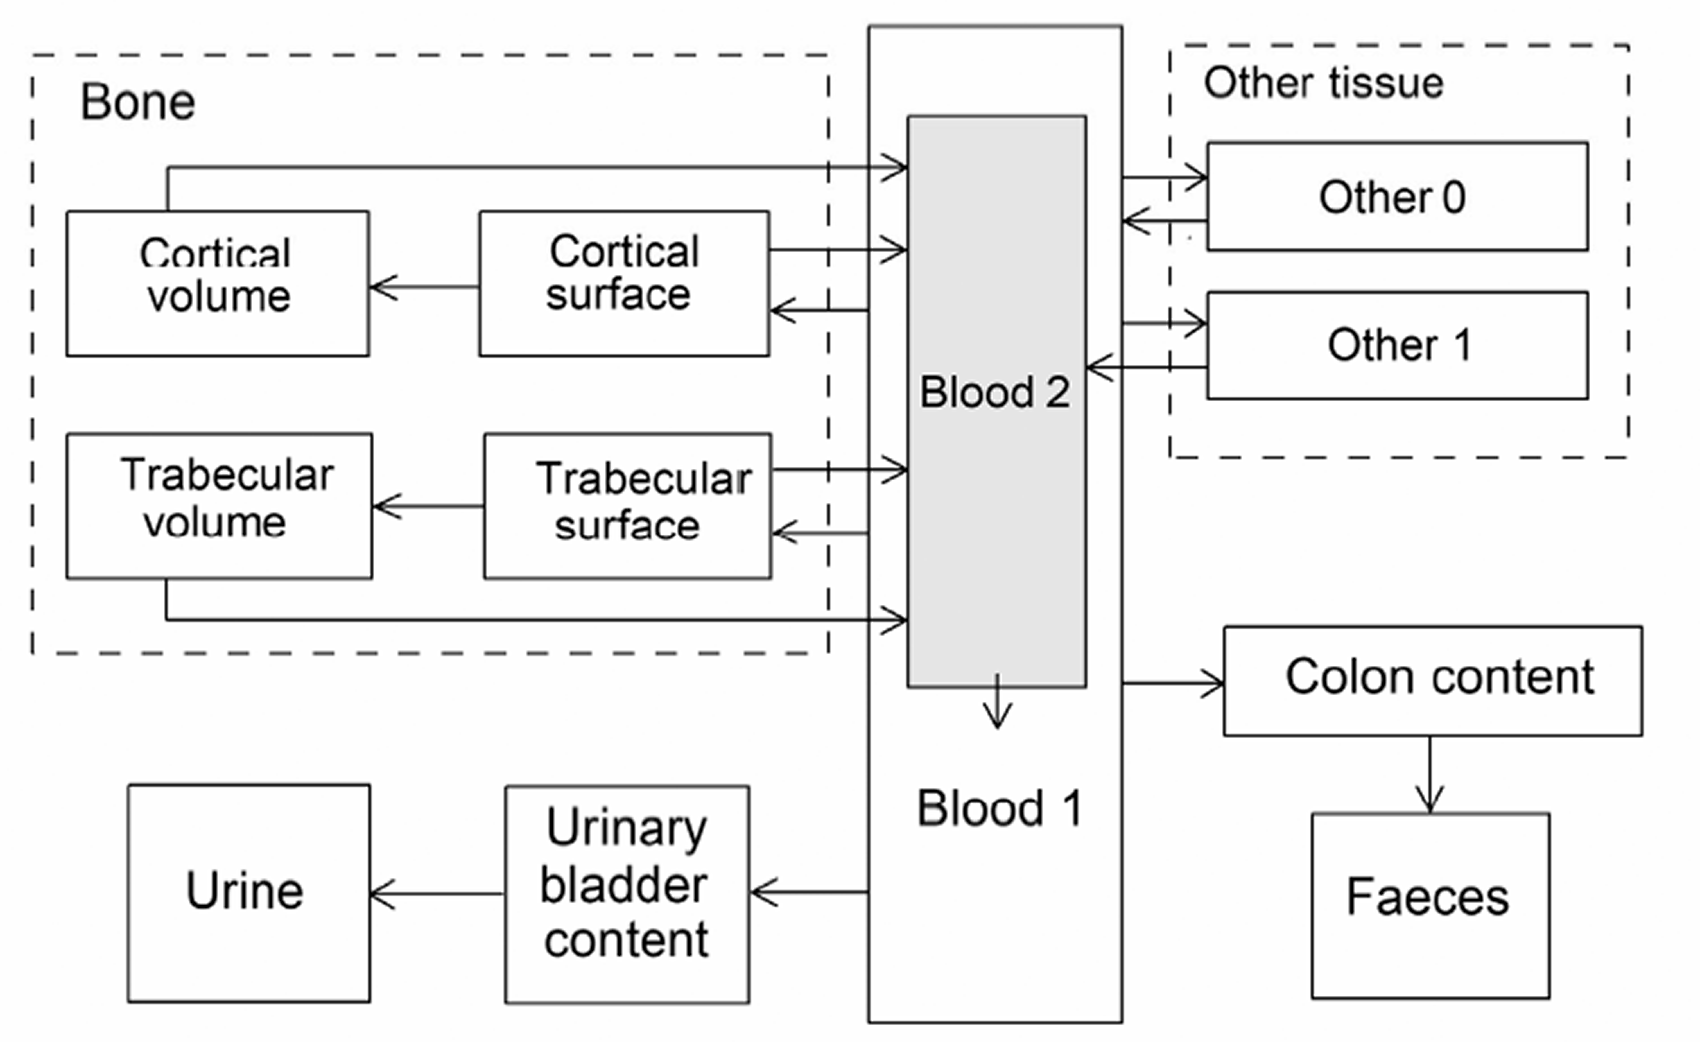
6.3. Individual monitoring
(115) Information regarding the detection limit for routine individual measurement is not available.
6.4. Dosimetric data for aluminium
7. Silicon (Z = 14)
7.1. Isotopes
7.2. Routes of intake
7.2.1. Inhalation
(116) For silicon, default parameter values were adopted on absorption to blood from the respiratory tract (ICRP, 2015). Absorption parameter values and types, and associated fA values for particulate forms of silicon are given in Table 7.2. Committed effective dose coefficients (Sv Bq−1) for the inhalation or ingestion of 26Al compounds. AMAD, activity median aerodynamic diameter. Isotopes of silicon addressed in this publication. B−, beta-minus decay Dose coefficients and bioassay data for this radionuclide are given in the printed copy of this publication. Data for other radionuclides listed in this table are given in the online electronic files on the ICRP website. Absorption parameter values for inhaled and ingested silicon. It is assumed that the bound state can be neglected for silicon (i.e. fb = 0). The values of sr for Type F, M, and S forms of silicon (30, 3, and 3 d−1, respectively) are the general default values. For inhaled material deposited in the respiratory tract and subsequently cleared by particle transport to the alimentary tract, the default fA values for inhaled materials are applied [i.e. the product of fr for the absorption type and the fA value for ingested soluble forms of silicon (0.5)]. Default Type M is recommended for use in the absence of specific information on which the exposure material can be assigned to an absorption type (e.g. if the form is unknown, or if the form is known but there is no information available on the absorption of that form from the respiratory tract). For guidance on the use of specific information, see Section 1.1. Activity transferred from systemic compartments into segments of the alimentary tract is assumed to be subject to reabsorption to blood. The default absorption fraction fA for the secreted activity is the highest value for any form of the radionuclide (fA = 0.5).
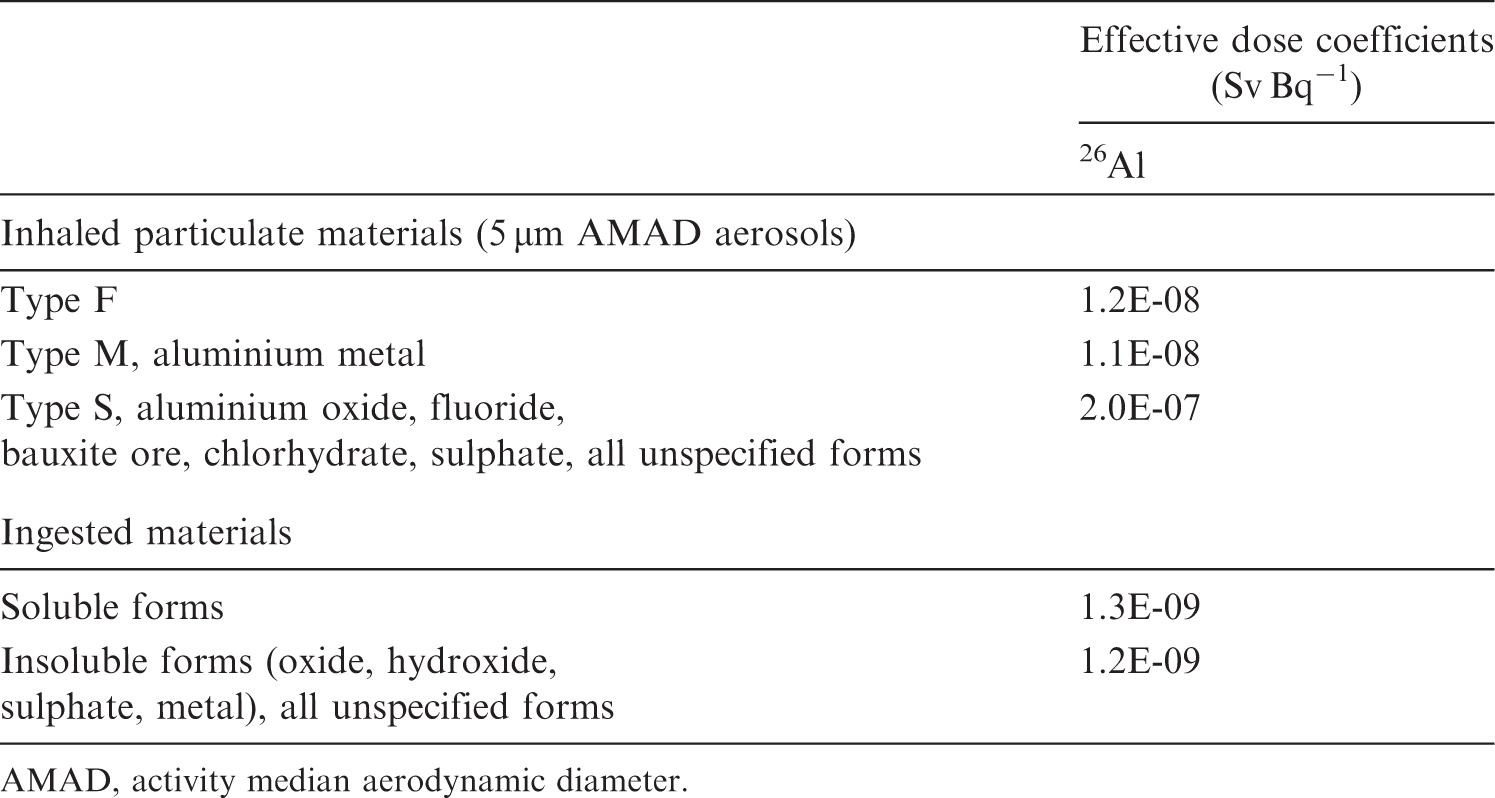
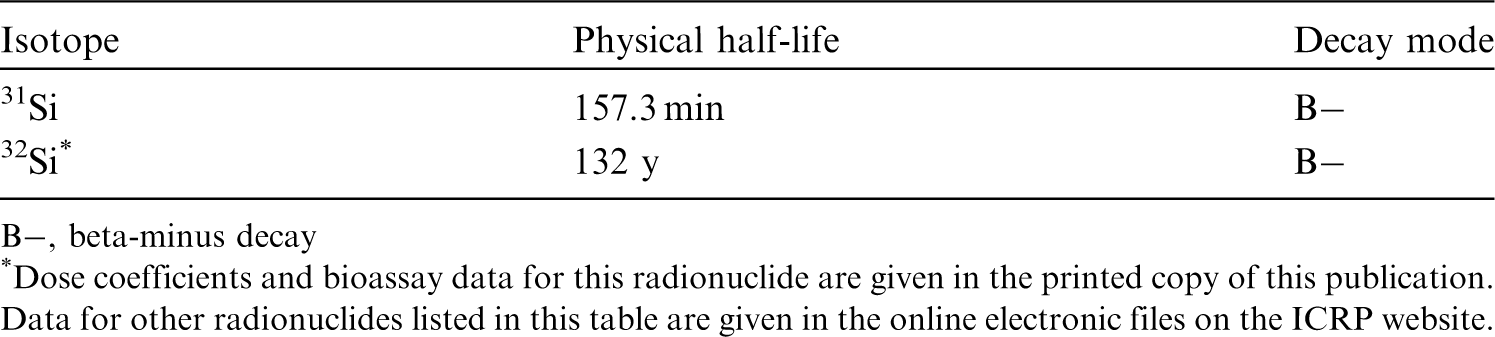

7.2.2. Ingestion
(117) Silicon occurs naturally in food as silicon dioxide and silicates. Orthosilicic acid, formed by hydration of the oxide, is the major silicon species present in drinking water and other liquids, and a natural biological form of silicon (EFSA, 2009). All forms of silica are considered to be poorly soluble particles for which absorption is not well documented (ATSDR, 2017). Early balance studies in animals and limited human data indicate low absorption of silicon dioxide and silicates in the diet: <5% from magnesium trisilicate, <2% from talc, and <0.5% from silica (EFSA, 2018a,b). However, orthosilicic acid is readily absorbed (20–75%) from the gastrointestinal tract in humans (Popplewell et al., 1998; Sripanyakorn et al., 2004, 2009; EFSA, 2009; Van Paemel et al., 2010). (118) In Publications 30 and 68 (ICRP, 1981, 1994a), f1 was taken to be 0.01 for all compounds of silicon. In this publication, a value of fA = 0.01 is used for silicon dioxide and silicates, and a larger fA = 0.5 is adopted for orthosilicic acid.
7.2.3. Systemic distribution, retention, and excretion of silicon
7.2.3.1. Biokinetic data
(119) Silicon is the second most abundant element in the earth’s crust, following oxygen. It is a member of Group VIA of the periodic table, and a chemical and biological analogue of the heavier Group VIA element germanium (Mehard and Volcani, 1975). Silicon is rarely found in its elemental form, but is usually combined with oxygen to form silica (SiO2) or silicates (Jugdaohsingh, 2007). Silicon is present in all tissues of the human body. Excretion of systemic silicon is predominantly in urine. There is evidence of a beneficial role of silicon in bone formation (Jugdaohsingh, 2007). (120) Absorption and urinary excretion of ingested 32Si (half-life 132 y) were measured over the first 2 d in a healthy male subject aged 59 y (Popplewell et al., 1998). Urinary 32Si accounted for ∼34% of the administered amount over 0–12 h, 1% over 12–24 h, and 0.5% over 24–48 h. (121) Sauer et al. (1959) measured the concentration of 31Si in the liver, kidneys, muscle, brain, and blood of guinea pigs over the first 8 h after oral administration of 31SiO2. At all measurement times, the highest concentration was found in the kidneys, but the liver contained approximately twice as much and skeletal muscle contained 20–50 times as much total activity as the kidneys. (122) Adler et al. (1986) examined the biokinetics of 31Si in rats after intracardiac injection of 31Si(OH)4. Activity in blood was nearly equally distributed between plasma and erythrocytes. Activity in plasma was associated almost entirely with protein-free filtrate. From 1 to 4 h after injection, the concentration in plasma decreased with a half-time of ∼1 h. The highest tissue concentration at 1–2 h was found in the kidneys. At 3 h, nearly equal concentrations were seen in the kidneys and liver. Initially, ∼85% of total-body activity was found in skin, muscle, and bone. An increasing concentration ratio of bone to plasma was observed over the first few hours. (123) Berlyne et al. (1986) studied the distribution of 31Si in rats 30 min after its injection as 31S-labelled silicic acid. Activity concentrations were measured in 10 tissues. The highest concentration was found in the kidneys, followed by skin and testes (each 0.35, normalised to 1.0 for the kidneys), bone (0.30), and liver (0.25). Skeletal muscle, skin, bone, liver, and kidneys contained ∼15%, ∼11%, 3.4%, 1.6%, and 1.5%, respectively, of the administered amount. (124) Mehard and Volcani (1975) compared the behaviours of 31Si (half-life 157 min) and 68Ge (half-life 271 d) in rats following intravenous or intraperitoneal administration of 31Si(OH)4 and 68Ge(OH)4. Following intravenous or intraperitoneal injection, accumulation of 31Si and 68Ge in tissues increased for ∼15–40 min, declined rapidly for ∼30 min, and then declined more gradually. The distribution of 31Si differed somewhat for intravenous and intraperitoneal injection. The peak concentration of 31Si in the kidneys was approximately three times that in the liver following intravenous injection, and approximately five times that in the liver following intraperitoneal injection. An apparent difference in kinetics of 68Ge and 31Si was more rapid depletion of 68Ge. The concentration of 31Si in the liver was moderately higher than that of 68Ge over the first 2 h after intravenous injection.
7.2.3.2. Biokinetic model for systemic silicon
(125) The structure of the biokinetic model for systemic silicon used in this publication is shown in Fig. 7.1. Transfer coefficients are listed in Table 7.3. (126) The model is a modification of the systemic model for germanium, a chemical and biological analogue of silicon (see Section 18.2.3). Based on results of a detailed comparative study of the behaviour of 68Ge and 31Si in rats at the total body, tissue, and subcellular levels (Mehard and Volcani, 1975), it is assumed that the systemic kinetics of germanium and silicon are qualitatively similar, but differ quantitively due to slower urinary loss of silicon associated with moderately higher deposition of silicon in systemic tissues. The deposition fractions in tissues assigned to germanium are adjusted to depict a lower flow rate of silicon from blood to the urinary bladder content, and higher flow rates of silicon to tissues, while keeping the total outflow rate of silicon from blood the same as assumed for germanium. The decrease in flow rate from blood to the urinary bladder content was set to approximate comparative observed concentrations of 68Ge and 31Si in rats over the first 2 h after their intravenous injection (Mehard and Volcani, 1975). The increases in germanium flow rates to tissues applied to silicon were proportional to the flow rates of germanium from blood to individual systemic tissues (kidneys, liver, bone, and other tissue). Transfer coefficients (d−1) in the biokinetic model for systemic silicon. Structure of the biokinetic model for systemic silicon.

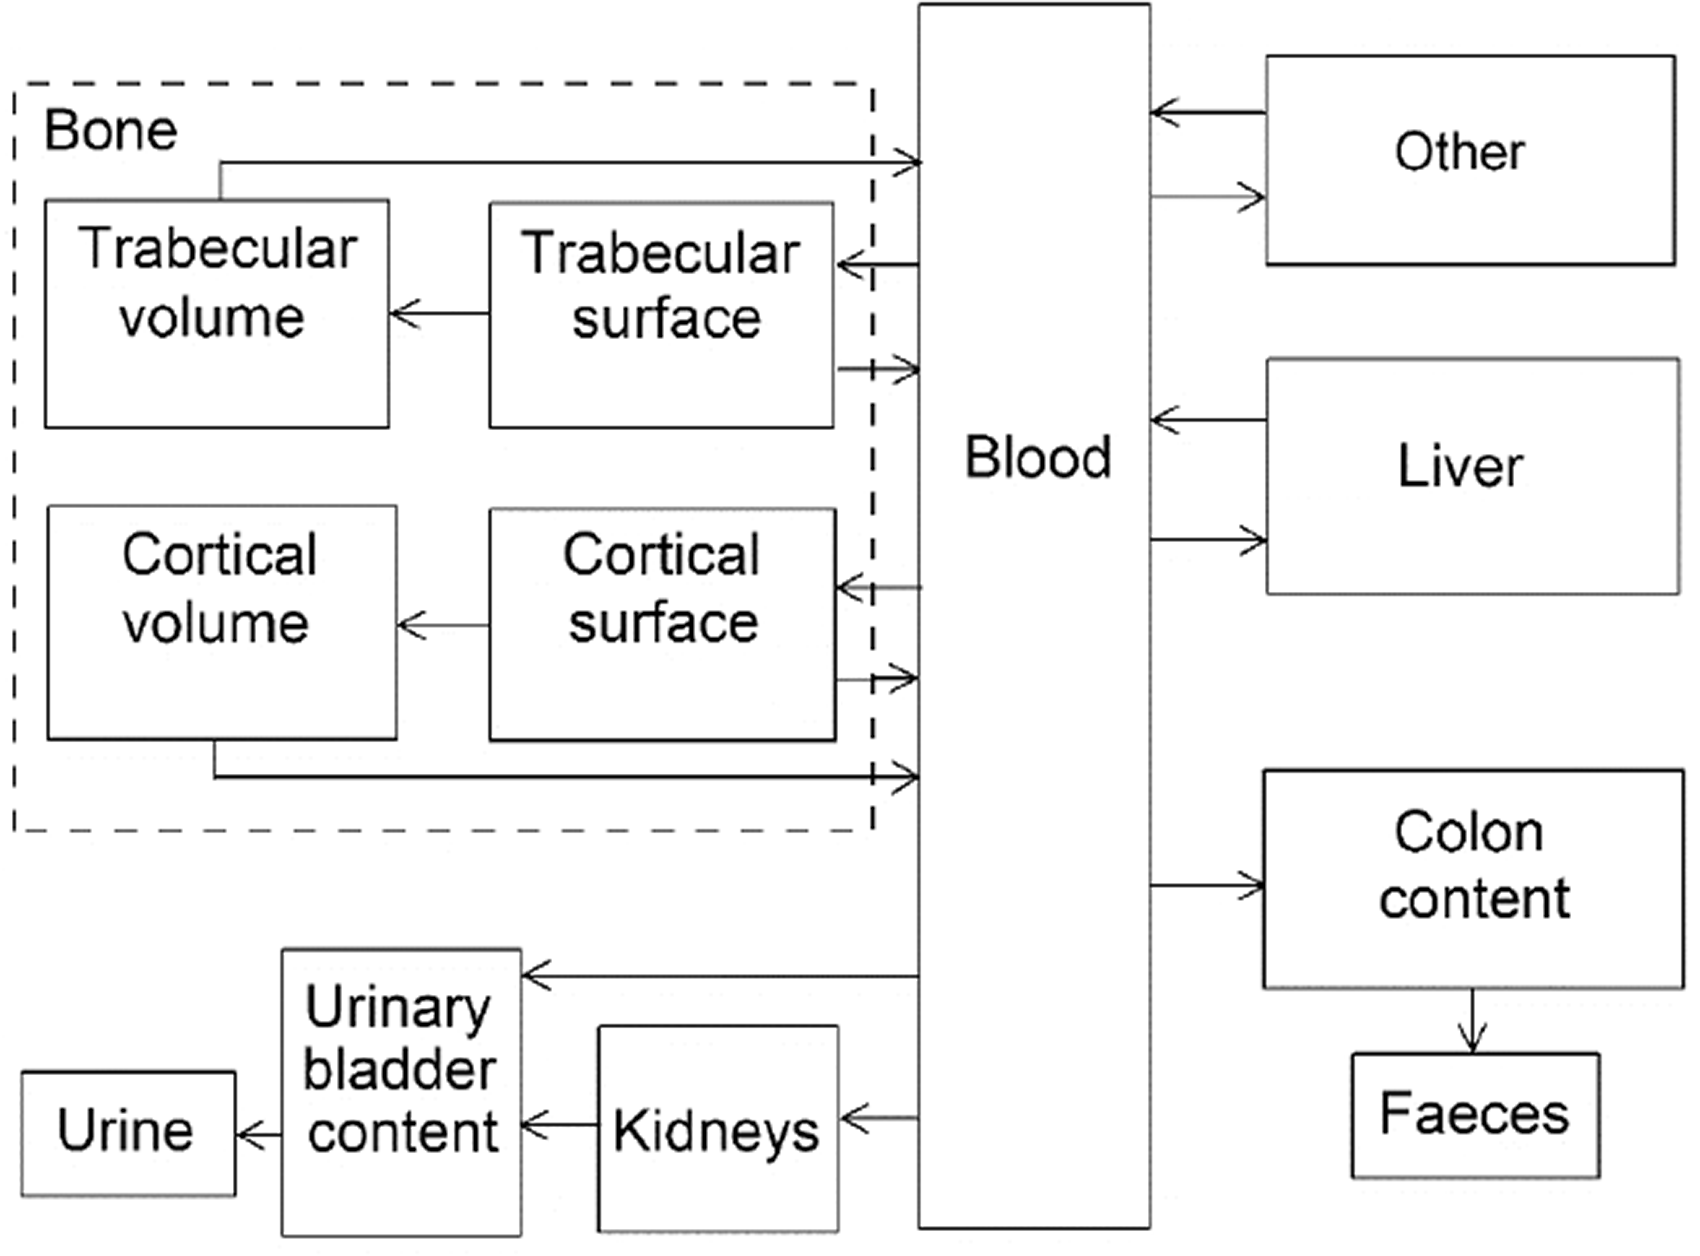
7.2.3.3. Treatment of progeny
(127) The only progeny of silicon addressed in this publication is 32P, as a progeny of 32Si. The characteristic model for phosphorus (ICRP, 2016) was expanded for application to 32P as a progeny of 32Si with added compartments and associated transfer coefficients needed to solve the linked biokinetic models for silicon and phosphorus (see Annex B). If produced in a compartment not contained in the characteristic model for phosphorus, 32P is assumed to transfer to the central blood compartment of the phosphorous model at a rate of 0.3466 d−1, and to follow that model thereafter.
7.3. Individual monitoring
(128) Information regarding the detection limit for routine individual measurement is not available.
7.4. Dosimetric data for silicon
8. Chlorine (Z = 17)
8.1. Isotopes
8.2. Routes of intake
8.2.1. Inhalation
(129) For chlorine, default parameter values were adopted for absorption to blood from the respiratory tract (ICRP, 2015). For chlorine and the other halogens, intakes could be in both particulate and gas and vapour forms, and it is therefore assumed that inhaled chlorine is 50% particulate and 50% gas/vapour in the absence of information (ICRP, 2002b). Absorption parameter values and types, and associated fA values for gas and vapour forms of chlorine are given in Table 8.2 and for particulate forms in Table 8.3. By analogy with the halogen iodine, considered in detail in Publication 137 (ICRP, 2017), default Type F is recommended for particulate forms in the absence of specific information on which the exposure material can be assigned to an absorption type. Committed effective dose coefficients (Sv Bq−1) for the inhalation or ingestion of 32Si compounds. AMAD, activity median aerodynamic diameter. Isotopes of chlorine addressed in this publication. EC, electron-capture decay; B+, beta-plus decay; B−, beta-minus decay; IT, isomeric transition decay. Dose coefficients and bioassay data for this radionuclide are given in the printed copy of this publication. Data for other radionuclides listed in this table are given in the online electronic files on the ICRP website. Deposition and absorption for gas and vapour compounds of chlorine. ET1, anterior nasal passage; ET2, posterior nasal passage, pharynx, and larynx; BB, bronchial; bb, bronchiolar; AI, alveolar-interstitial. Percentage deposited refers to how much of the material in the inhaled air remains in the body after exhalation. Almost all inhaled gas molecules contact airway surfaces, but usually return to the air unless they dissolve in, or react with, the surface lining. The default distribution between regions is assumed: 20% ET2, 10% BB, 20% bb, and 50% AI. It is assumed that the bound state can be neglected for chlorine (i.e. fb = 0). For inhaled material deposited in the respiratory tract and subsequently cleared by particle transport to the alimentary tract, the default fA values for inhaled materials are applied [i.e. the product of fr for the absorption type (or specific value where given) and the fA value for ingested soluble forms of chlorine (1)]. Absorption parameter values for inhaled and ingested chlorine. It is assumed that the bound state can be neglected for chlorine (i.e. fb = 0). The values of sr for Type F, M, and S forms of chlorine (30, 3, and 3 d−1, respectively) are the general default values. For inhaled material deposited in the respiratory tract and subsequently cleared by particle transport to the alimentary tract, the default fA values for inhaled materials are applied [i.e. the product of fr for the absorption type and the fA value for ingested soluble forms of chlorine (1)]. Default Type F is recommended for use in the absence of specific information on which the exposure material can be assigned to an absorption type (e.g. if the form is unknown, or if the form is known but there is no information available on the absorption of that form from the respiratory tract). For guidance on the use of specific information, see Section 1.1. Activity transferred from systemic compartments into segments of the alimentary tract is assumed to be subject to reabsorption to blood. The default absorption fraction fA for the secreted activity is the highest value for any form of the radionuclide (fA = 1).

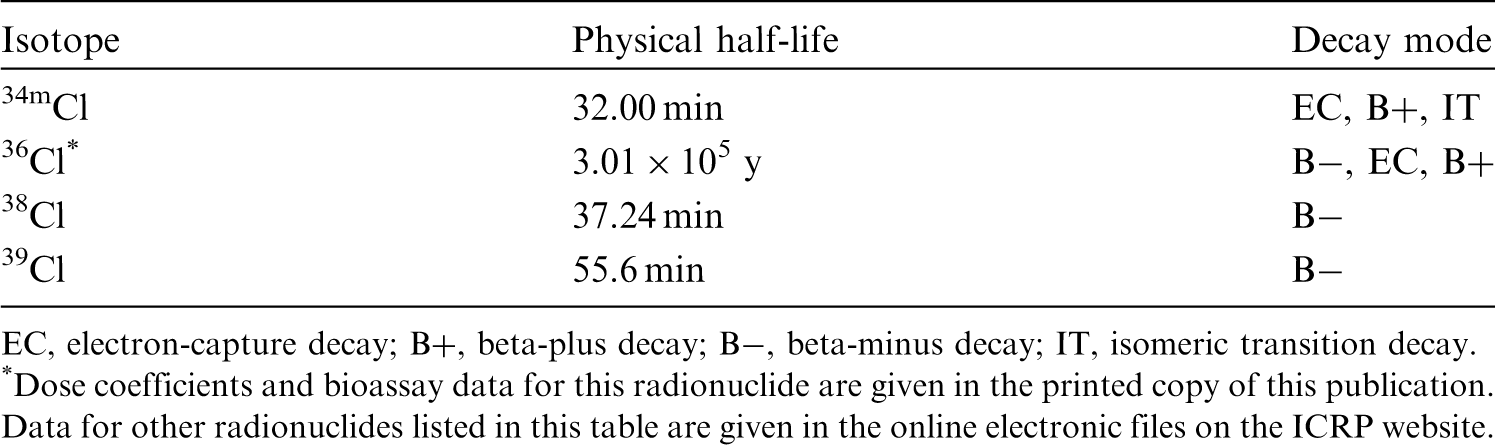
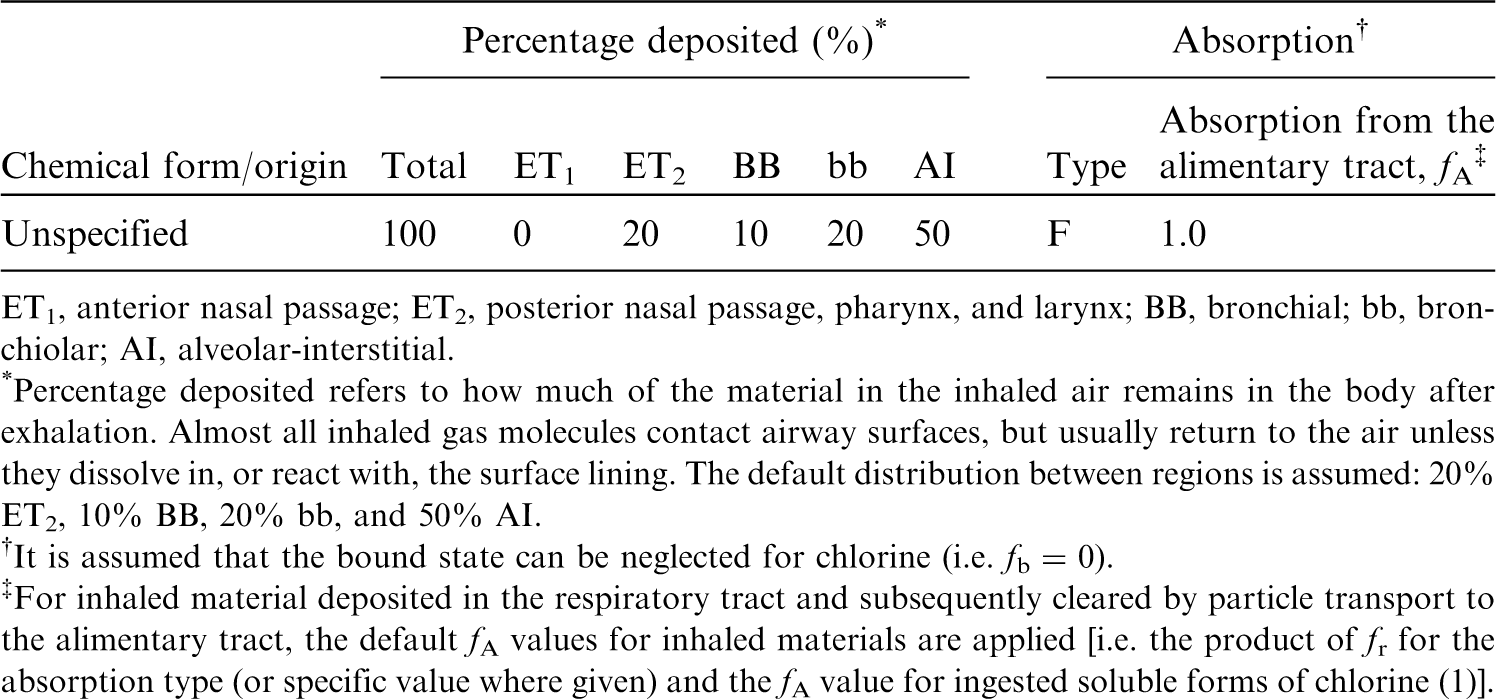

8.2.2. Ingestion
(130) Chlorine (Cl2) dissolves in water and is converted into chloride (Cl−) and hypochlorite anions (ClO−) or hypochlorous acid (HOCl). Small quantities of chlorite (ClO2−), chlorate (ClO3−), and perchlorate (ClO4−) are also formed (Nakagawara et al., 1998). Mainly following the electrochemical gradient created by sodium transport, chloride is passively absorbed in the proximal small intestine and actively transported in the ileum. It is almost completely absorbed from the gut (Burrill et al., 1945; Wiseman, 1964). Perchlorate has been shown, in both human and animal studies, to be readily absorbed after oral exposure, with rapid and near-complete absorption through the digestive system (ATSDR, 2008). Based on short-term urinary excretion in rats, at least 20–40% of radiolabelled chlorine administered orally as hypochlorous acid, chlorate, ClO2, or chlorite is absorbed (Abdel-Rahman et al., 1982, 1983). In non-fasted rats, the absorption of hypochlorite anion is delayed, presumably due to the reaction of chlorine with biomolecules in food (Fukayama et al., 1986). Additional studies in rats, dogs, and swine showed 40–90% gastrointestinal absorption of chlorate salts. Data obtained after chlorate poisoning demonstrated that chlorate is also biologically available in humans after ingestion (EFSA, 2015c). (131) In Publications 30 and 68 (ICRP, 1980, 1994a), f1 was taken to be 1 for all compounds of chlorine. In this publication, fA = 1 is used for all chemical forms of chlorine.
8.2.3. Systemic distribution, retention, and excretion of chlorine
8.2.3.1. Biokinetic data
(132) Inorganic chloride is the dominant form of chlorine in the human body. Ingested chloride is absorbed to blood rapidly and nearly completely, and is largely cleared from blood within a few minutes (Ray et al., 1952). It is distributed mainly in extracellular fluids. Tb for the total body is typically of the order of 8–15 d (Ray et al., 1952), but the half-time can be reduced considerably by elevated intake of chloride, or increased considerably by a salt-deficient diet. (133) The systemic kinetics of chloride closely resemble those of bromide (Reid et al., 1956; Pavelka, 2004). Absorbed bromide clears rapidly from blood and replaces part of the extracellular chloride, with the molar sum of chloride and bromide remaining constant at ∼110 mmol L−1 (Pavelka, 2004). Tb of bromide in the human body is typically of the order of 12 d (Söremark, 1960b).
8.2.3.2. Biokinetics of systemic chlorine
(134) The systemic behaviour of chlorine is assumed to be the same as that of bromine. The relevant physiological forms of chlorine and bromine are assumed to be chloride and bromide, respectively. The common biokinetic model for chloride and bromide is based on the assumptions of rapid removal from blood (half-time 5 min), a uniform distribution in tissues, removal of 50% of absorbed chloride or bromide from the body in 12 d, and a urinary:faecal excretion ratio of 100:1. These conditions are approximated, using a first-order recycling model, with the transfer coefficients listed in Table 8.4. Transfer coefficients in the biokinetic model for systemic bromine.

8.2.3.3. Treatment of progeny
(135) Progeny of chlorine addressed in this publication are radioisotopes of chlorine and argon. The model for chlorine as a parent is assigned to chlorine as a progeny of chlorine. Argon produced in a tissue (i.e. in ‘Other’) is assumed to transfer to blood with a half-time of 15 min, and from blood to the environment (via exhalation) at a rate of 1000 d−1.
8.3. Individual monitoring
8.3.1. 36Cl
(136) Measurements of 36Cl in urine may be used to determine intakes of the radionuclide. The main technique used for urine analysis is liquid scintillation.
8.4. Dosimetric data for chlorine
9. Potassium (Z = 19)
9.1. Isotopes
9.2. Routes of intake
9.2.1. Inhalation
(137) For potassium, default parameter values were adopted on absorption to blood from the respiratory tract (ICRP, 2015). Absorption parameter values and types, and associated fA values for particulate forms of potassium are given in Table 9.2. Monitoring techniques for 36Cl. Committed effective dose coefficients (Sv Bq−1) for the inhalation or ingestion of 36Cl compounds. AMAD, activity median aerodynamic diameter. Dose per activity content of 36Cl in daily excretion of urine (Sv Bq−1); 5 µm activity median aerodynamic diameter aerosols inhaled by a reference worker at light work. N/A, not applicable. Isotopes of potassium addressed in this publication. EC, electron-capture decay; B+, beta-plus decay; B−, beta-minus decay. Dose coefficients and bioassay data for this radionuclide are given in the printed copy of this publication. Data for other radionuclides listed in this table are given in the online electronic files on the ICRP website. Absorption parameter values for inhaled and ingested potassium. It is assumed that the bound state can be neglected for potassium (i.e. fb = 0). The values of sr for Type F, M, and S forms of potassium (30, 3, and 3 d−1, respectively) are the general default values. For inhaled material deposited in the respiratory tract and subsequently cleared by particle transport to the alimentary tract, the default fA values for inhaled materials are applied [i.e. the product of fr for the absorption type and the fA value for ingested soluble forms of potassium (1)]. Default Type M is recommended for use in the absence of specific information on which the exposure material can be assigned to an absorption type (e.g. if the form is unknown, or if the form is known but there is no information available on the absorption of that form from the respiratory tract). For guidance on the use of specific information, see Section 1.1. Activity transferred from systemic compartments into segments of the alimentary tract is assumed to be subject to reabsorption to blood. The default absorption fraction fA for the secreted activity is the highest value for any form of the radionuclide (fA = 1).

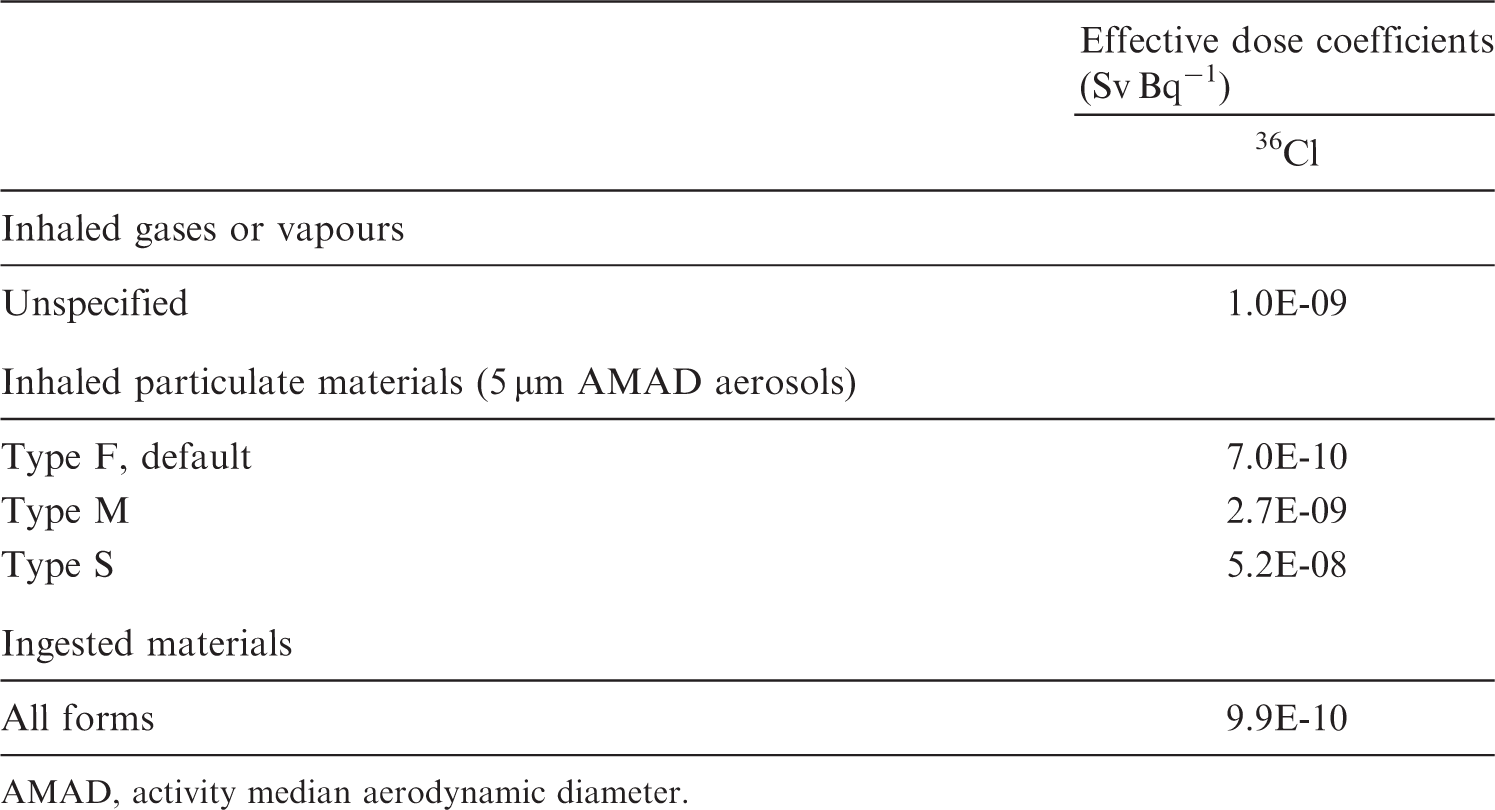


9.2.2. Ingestion
(138) Absorption of potassium mainly takes place by passive diffusion from the small intestine content. Potassium salts are very soluble and ∼90% of dietary potassium is absorbed, while actual absorption is slightly higher because of reabsorption of endogenous secretions into the lumen of the digestive tract (ICRP, 1975; Leggett and Williams, 1986; Demigné et al., 2004). (139) Absorption of potassium from the gastrointestinal tract being nearly complete, f1 was taken to be 1 in Publications 30 and 68 (ICRP, 1980, 1994a). In this publication, fA = 1 is also used for all forms of potassium.
9.2.3. Systemic distribution, retention, and excretion of potassium
9.2.3.1. Biokinetic data
(140) Potassium is an essential element with multiple functions in the human body including regulation of fluid balance and control of electrical activity of the heart, skeletal muscle, and nerves. The potassium content of the adult human body is, on average, ∼1.6–2.0 kg−1 body mass, but varies with the fraction of body mass represented by skeletal muscle, which has a high concentration of potassium. Measurements of potassium concentrations in post-mortem tissues and in plasma and RBC of living subjects indicate the following approximate distribution of potassium in an adult male human: skeletal muscle, 65% of the total-body content; skeleton, 9%; RBC, 8%; liver, 3%; brain, 3%; kidneys, 0.6%; blood plasma, 0.4%; and remainder, 11% [Leggett and Williams (1986) and Zhu et al. (2010)]. Approximately 80–90% of losses from the body are in urine, with the remainder removed mainly in faeces and sweat. (141) Approximately 98% of the body’s potassium resides intracellularly, and 2% is distributed in extracellular fluids. The concentration in extracellular fluids is strictly maintained in the range of ∼137–215 mg L−1. The kidneys are primarily responsible for homeostatic control of the body’s potassium content through adjustment of urinary losses to accommodate variation in potassium intake. Adjustments in renal potassium excretion occur over several hours, and changes in extracellular potassium are buffered during that time by movement of potassium between skeletal muscle and blood plasma (Langham-New and Lambert, 2012; Palmer, 2015; Hinderling, 2016; Udensi and Tchounwou, 2017). (142) Potassium is the principal intracellular cation in most tissues, and is critical to maintenance of the membrane potential of cells. An electrochemical gradient across the cell membrane resulting from a high intracellular concentration of potassium and low intracellular concentration of sodium relative to concentrations in the extracellular fluids is required to sustain intracellular tonicity, transmission of nerve impulses, contraction of muscles including the heart, and maintenance of normal kidney function. The gradient is maintained predominantly by the activity of the membrane-bound transporter Na+-K+-ATPase, also called the ‘Na-K pump’. A single cycle of the pump moves two potassium ions into the cell and extrudes three sodium ions (Palmer, 2015; Hinderling, 2016; Udensi and Tchounwou, 2017). (143) The biokinetics of potassium has been studied extensively in human subjects and laboratory animals, and many kinetic analyses and system models for potassium have been published (Love and Burch, 1953; Ginsburg and Wilde, 1954; Black et al., 1955; Ginsburg, 1962; Downey and Bashour, 1975; Sterns et al., 1979; Leggett and Williams, 1986; Hinderling, 2016). Intravenously injected potassium is removed rapidly from blood plasma and distributed to tissues and, to a lesser extent, to excretion pathways (Corsa et al., 1950; Black et al., 1955; Burch et al., 1955). Following intravenous administration of radiopotassium to human subjects, ∼2% remains in plasma at 20 min, and ≤1% remains at 2 h (Corsa et al., 1950; Black et al., 1955). The rate of transfer from plasma to a tissue depends on the percentage of cardiac output received by the tissue and the tissue’s extraction fraction (i.e. the fraction of potassium extracted by the tissue from plasma during passage from the tissue’s arterial input to its venous output). For example, a potassium extraction fraction of 0.9 has been estimated for the kidneys, heart, and lungs; 0.8 for the intestines; 0.6 for the liver; and 0.01–0.02 for the brain (Leggett and Williams, 1986). The kidneys, which have a high extraction fraction and receive nearly one-fifth of cardiac output, accumulate as much as 20% of intravenously injected potassium within a few minutes after intravenous administration (Black et al., 1955; Emery et al., 1955). Tissues with a low blood perfusion rate such as fat or resting skeletal muscle, or a low extraction fraction such as brain, accumulate potassium relatively slowly. Tissues such as the kidneys with a high rate of uptake but a relatively low content of potassium return much of the accumulated potassium to blood over a relatively short period (Black et al., 1955). Over a period of ∼15 min to several hours, the systemic distribution of potassium generally shifts away from tissues with an initially high rate of uptake to tissues with an initially low rate of uptake. Several hours after intravenous injection of radiopotassium, skeletal muscle typically contains most of the retained activity. Over the first 2–3 d after intravenous injection, RBC gradually accumulate several percent of the injected amount (Corsa et al., 1950). Tb of ∼30 d has been estimated for total-body potassium in adult humans, based on reference values for daily intake and total-body content, and treatment of the body’s potassium as a well-mixed pool (ICRP, 1979a).
9.2.3.2. Biokinetic model for systemic potassium
(144) A relatively detailed biokinetic model for systemic potassium was proposed by Leggett and Williams (1986). The model was built around a blood flow model depicting the distribution of cardiac output to 12 tissue compartments. Additional compartments were added to address the transfer of potassium between plasma and RBC, and between systemic pools and gastrointestinal content. Three excretion pathways were addressed: urinary loss via the kidneys; faecal loss via the intestines; and loss in sweat via skin. Movement of potassium was depicted as a system of first-order processes. The transfer rate from plasma into a tissue T was estimated as the product of the plasma flow rate (plasma volumes per day) to that tissue and a tissue-specific extraction fraction. The transfer rate from tissue T to plasma was estimated from the relative contents of potassium in plasma and T at equilibrium. The equilibrium distribution of potassium was based mainly on autopsy data and typical concentrations of potassium in plasma and RBC. Transfer rates between plasma and RBC and between systemic compartments and gastrointestinal contents were based on empirical data. Model predictions of blood clearance, uptake and loss by systemic tissues, total-body retention, and path-specific excretion rates of potassium were shown to be consistent with observations for human subjects. (145) The biokinetic model for systemic potassium used in this publication is a simplification of the model of Leggett and Williams (1986). The structure of the simplified model (Fig. 9.1) is more consistent with the structures of other systemic models applied in the OIR series. That is, the model depicts a central blood compartment (‘Plasma’) in exchange with a set of peripheral tissue compartments representing relatively important systemic repositories. The transfer coefficients of the simplified model (Table 9.3) were set for reasonable consistency with the original model regarding retention in the total body and in individual tissues depicted explicitly in both models. Transfer coefficients in the biokinetic model for systemic potassium. RBC, red blood cells. Daily excretion of 36Cl following inhalation of 1 Bq unspecified gases or vapours. Daily excretion of 36Cl following inhalation of 1 Bq Type F. Daily excretion of 36Cl following inhalation of 1 Bq Type M. Daily excretion of 36Cl following inhalation of 1 Bq Type S. Structure of the biokinetic model for systemic potassium. RBC, red blood cells.


9.2.3.3. Treatment of progeny
(146) The only progeny of a potassium parent addressed in this publication is 45Ca produced by decay of 45K. For application to 45Ca produced in systemic compartments, the characteristic model for calcium (ICRP, 2016) was expanded to address explicitly each of the tissues and individual compartments addressed explicitly in the model for potassium. The following transfer coefficients from added tissue compartments to the central blood compartment of the calcium model were assigned: RBC, 1000 d−1 (default value); kidneys, 0.1733 d−1; liver, 0.1733 d−1; muscle, 0.1733 d−1; red marrow, 0.1733 d−1; and other, 2.9 d−1. The following transfer coefficients from blood to tissues were also added to the calcium model: kidneys, 0.00766 d−1; liver, 0.0445 d−1; muscle, 0.716 d−1; and red marrow, 0.0289 d−1. The transfer coefficient from blood to the intermediate-term soft tissue compartments of the calcium model was reduced from 1.5 d−1 to 0.703 d−1 to leave the total outflow rate of calcium from blood at 15 d−1.
9.3. Individual monitoring
9.3.1. 40K
(147) Measurements of 40K may be performed by in-vivo whole-body measurement technique.
9.4. Dosimetric data for potassium
10. Scandium (Z = 21)
10.1. Isotopes
10.2. Routes of intake
10.2.1. Inhalation
(148) For scandium, default parameter values were adopted on absorption to blood from the respiratory tract (ICRP, 2015). Absorption parameter values and types, and associated fA values for particulate forms of scandium are given in Table 10.2. Monitoring techniques for 40K. Measurement system comprised of germanium detectors. Counting time of 20 min. Committed effective dose coefficients (Sv Bq−1) for the inhalation or ingestion of 40K compounds. AMAD, activity median aerodynamic diameter. Dose per activity content of 40K in total body and in daily excretion of urine (Sv Bq−1); 5 µm activity median aerodynamic diameter aerosols inhaled by a reference worker at light work. Isotopes of scandium addressed in this publication. EC, electron-capture decay; B+, beta-plus decay; B−, beta-minus decay; IT, isomeric transition decay. Dose coefficients and bioassay data for this radionuclide are given in the printed copy of this publication. Data for other radionuclides listed in this table are given in the online electronic files on the ICRP website. Absorption parameter values for inhaled and ingested scandium. It is assumed that the bound state can be neglected for scandium (i.e. fb = 0). The values of sr for Type F, M, and S forms of scandium (30, 3, and 3 d−1, respectively) are the general default values. For inhaled material deposited in the respiratory tract and subsequently cleared by particle transport to the alimentary tract, the default fA values for inhaled materials are applied [i.e. the product of fr for the absorption type and the fA value for ingested soluble forms of scandium (0.001)]. Default Type M is recommended for use in the absence of specific information on which the exposure material can be assigned to an absorption type (e.g. if the form is unknown, or if the form is known but there is no information available on the absorption of that form from the respiratory tract). For guidance on the use of specific information, see Section 1.1. Activity transferred from systemic compartments into segments of the alimentary tract is assumed to be subject to reabsorption to blood. The default absorption fraction fA for the secreted activity is the highest value for any form of the radionuclide (fA = 0.001).


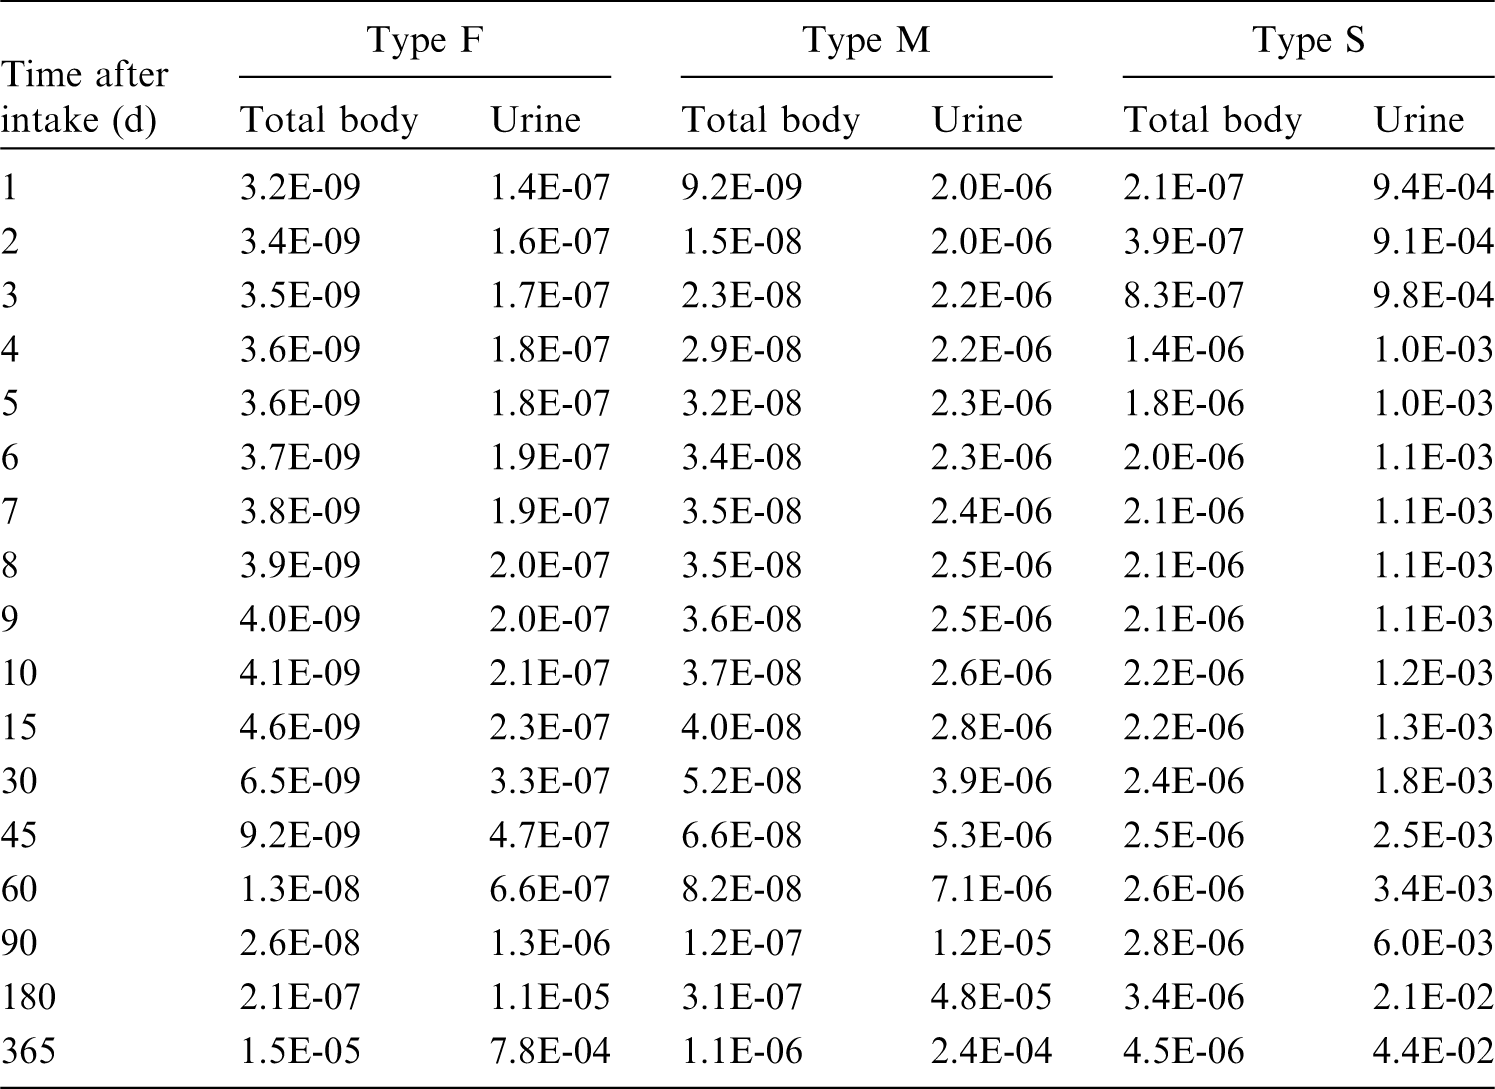
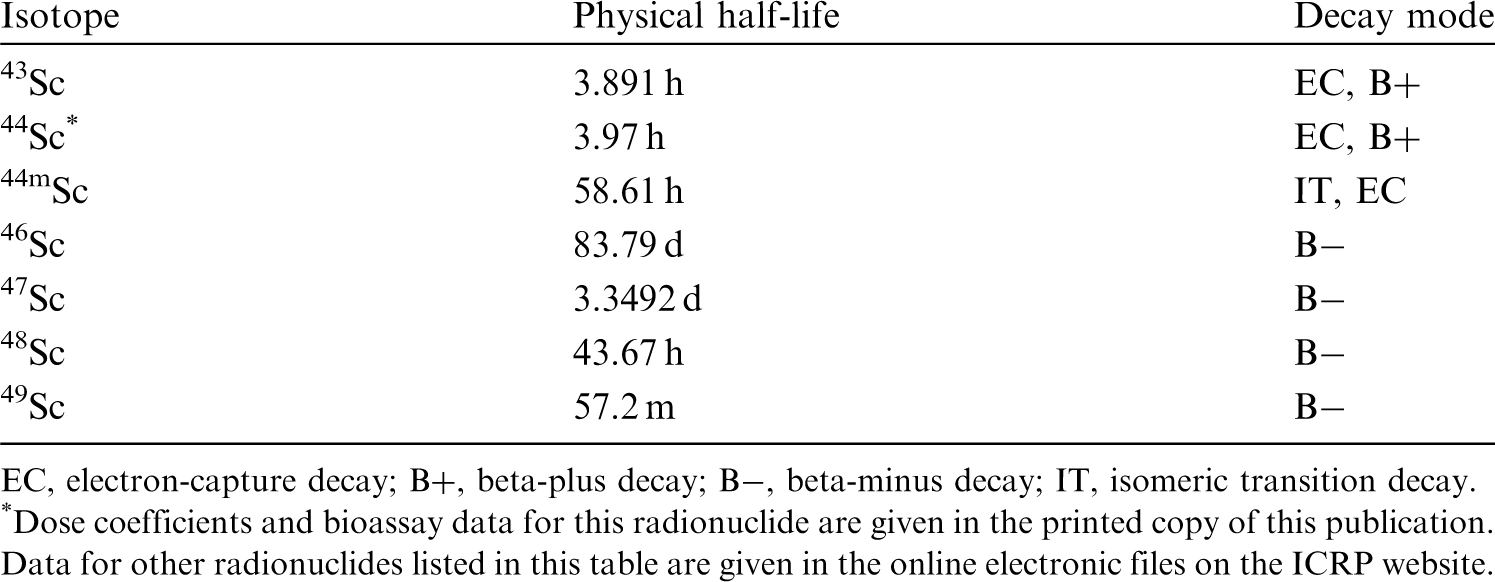

10.2.2. Ingestion
(149) There appears to be little absorption of scandium when administered as 46Sc tagged sand (Miller et al., 1972) or as scandium chloride (Miller and Byrne, 1970). Ninety-six percent of 47Sc is recovered in faeces after intragastric administration to rats. Farrar et al. (1987) assessed intestinal absorption of ∼0.1% of 46Sc after oral administration to rats. In Publications 30 and 68 (ICRP, 1981, 1994a), f1 was taken to be 10−4 for scandium by analogy with yttrium. Based on the work of Farrar et al. (1987), a higher value of fA = 10−3 is adopted here for all chemical forms of scandium.
10.2.3. Systemic distribution, retention, and excretion of scandium
10.2.3.1. Biokinetic data
(150) Rosoff et al. (1965) studied the systemic behaviour of 46Sc in 12 hospital patients following its intravenous administration as the weakly chelated 46Sc nitrilotriacetate. Activity cleared slowly from blood, apparently due, in part, to formation of scandium–globulin complexes that were removed slowly from blood plasma by the reticuloendothelial system. Approximately one-quarter and one-tenth of the administered amount remained in plasma at 1 d and 2 d, respectively. Post-mortem measurements on three subjects who died 5–7 months later showed relatively high activity concentrations in the spleen, liver, and bone. Approximately 10% of the administered amount was excreted during the first 2–3 weeks, and the remaining body burden was lost much more slowly. Excretion during the first 2–3 weeks was primarily in faeces. In a study of biliary excretion of activity by one of the patients, biliary 46Sc approximated its faecal excretion. Tb values based on whole-body counting of two subjects from 2–3 weeks to ∼1.5 y post injection were 1300 and 1557 d. (151) Rosoff et al. (1963) measured the distribution and excretion of 46Sc after intravenous administration of different chemical forms of this radionuclide or physiologically related elements to mice. Weakly bound forms of 46Sc, such as 46Sc citrate, showed relatively high uptake by the liver, spleen, and bone. Strongly chelated forms showed high excretion rates and relatively little accumulation in tissues. (152) At 4 d after intravenous administration of 46Sc citrate to rats, the liver and bone contained, on average, 21% and 16%, respectively, of the administered activity (Durbin, 1959). Approximately 31% of the administered amount had been excreted by that time, mainly in faeces. (153) Following intravenous administration of a mixture of 47Ca and its progeny 47Sc to rats, 47Sc accumulated mainly in the liver, spleen, kidneys, and bone (Taylor, 1966). 47Sc activity in the liver and spleen decreased with effective half-times of 3.1 d and 3.8 d, respectively. Build-up in the liver and spleen over time indicated that activity was moving to these organs after production at other sites. Nearly all of the 47Sc produced in the body by decay of 47Ca arose in bone due to the high uptake and retention of 47Ca by bone. A few percent of 47Sc produced in bone escaped from bone at early times, but little if any escaped at later times. (154) Basse-Cathalinat et al. (1968) used bone scintigraphy to study the behaviour of 47Sc produced in bone following intravenous administration of 47Ca to rats, rabbits, and humans. The clearest images were obtained for rats and rabbits due to the relatively low activity administered to human subjects. At 2 d post administration, elevated levels of 47Sc were found in the liver and spleen, presumably representing mainly the 47Sc present at near equilibrium with 47Ca in the injected solution. Between days 4 and 8, the concentration of 47Sc in the liver declined while the concentration of 47Sc in the skeleton rose sharply. (155) Zalikin et al. (1969) studied the behaviour of 46Sc in rats following intravenous, intratracheal, or oral administration. Following intravenous injection, the systemic distribution of activity depended on the pH of the injected solution. As the pH was increased from 3.0 to 10, deposition in the liver and spleen increased sharply while deposition in the skeleton and kidneys decreased considerably. (156) The distribution of 47Sc was observed in tumour-bearing mice from 1 h to 3 d after intravenous administration (Hara and Freed, 1973). The highest concentrations in healthy tissues at 3 d were found, in decreasing order, in bone, liver, spleen, and kidneys. Autoradiographic examination of bones from a rabbit injected intravenously with 47Sc indicated that skeletal activity was associated mainly with bone marrow. Relatively fast clearance of activity was observed for blood, brain, heart, lungs, stomach, intestines, pancreas, kidneys, and muscle. Liver, spleen, and bone retained scandium over an extended period. (157) Redistribution of 47Sc produced in the body following intravenous administration of 47Ca to mice accounted for a large portion of 47Sc in soft tissues and blood (Freed et al., 1975). Most 47Sc produced in vivo arose from decay of 47Ca in bone, particularly after the first day. 47Sc escaped to some extent from sites of production in bone in the early hours after administration of 47Ca, but no preferential loss of 47Sc from bone was observed thereafter. Loss of 47Sc from bone over days 1–11 was slower than that of 47Ca. After 11 d, the rate of loss of 47Sc from bone approached that of the parent, suggesting removal of both the parent and the progeny by bone resorption. (158) At 2 h after intravenous administration of 47Sc chloride to mice, the highest tissue:blood concentration ratio was found in the liver (1.2), followed by spleen (1.1), lungs (0.84), gallbladder (0.36), heart (0.26), kidneys (0.24), and bone (0.24) (Lachine et al., 1976). Relatively low concentrations were found in the brain (0.02), muscle (0.03), and urinary bladder content (0.03).
10.2.3.2. Biokinetic model for systemic scandium
(159) The structure of the systemic model for scandium (Fig. 10.1) is a modification of the generic model structure for bone-surface-seeking radionuclides. Scandium is treated as a bone-surface seeker based on analogy with its chemical analogue yttrium. The spleen is added to the generic model structure as this organ appears to be an important repository for scandium in laboratory animals. The generic structure is also modified regarding routes of transfer to and from bone marrow compartments, based on indications from animal studies of relatively high transfer from plasma to marrow. (160) Transfer coefficients are listed in Table 10.3. Activity absorbed to blood from the respiratory or alimentary tract is assigned to Blood 1. The transfer coefficients describing outflow from bone tissue compartments are default values for bone-surface seekers. The remaining transfer coefficients were set, as far as feasible, for consistency with the biokinetic database for scandium summarised earlier. For example, parameter values were set for reasonable consistency with the blood kinetics and urinary and faecal excretion rates observed in human subjects (Rosoff et al., 1965; Taylor, 1966), and the time-dependent distribution of scandium in laboratory animals over the early months after acute intake. Where data for scandium were lacking, parameter values were based on analogy with yttrium. Transfer coefficients in the biokinetic model for systemic scandium. ST, soft tissue. ST1 and ST2 are compartments of other soft tissues representing two phases of biological removal to blood. Daily excretion and total body retention of 40K following inhalation of 1 Bq Type F. Daily excretion of 40K following inhalation of 1 Bq Type M. Daily excretion of 40K following inhalation of 1 Bq Type S. Structure of the biokinetic model for systemic scandium. SI, small intestine; Trab, trabecular; Cort, cortical. ST, soft tissue. ST1 and ST2 are compartments of other soft tissues representing two phases of biological removal to blood.
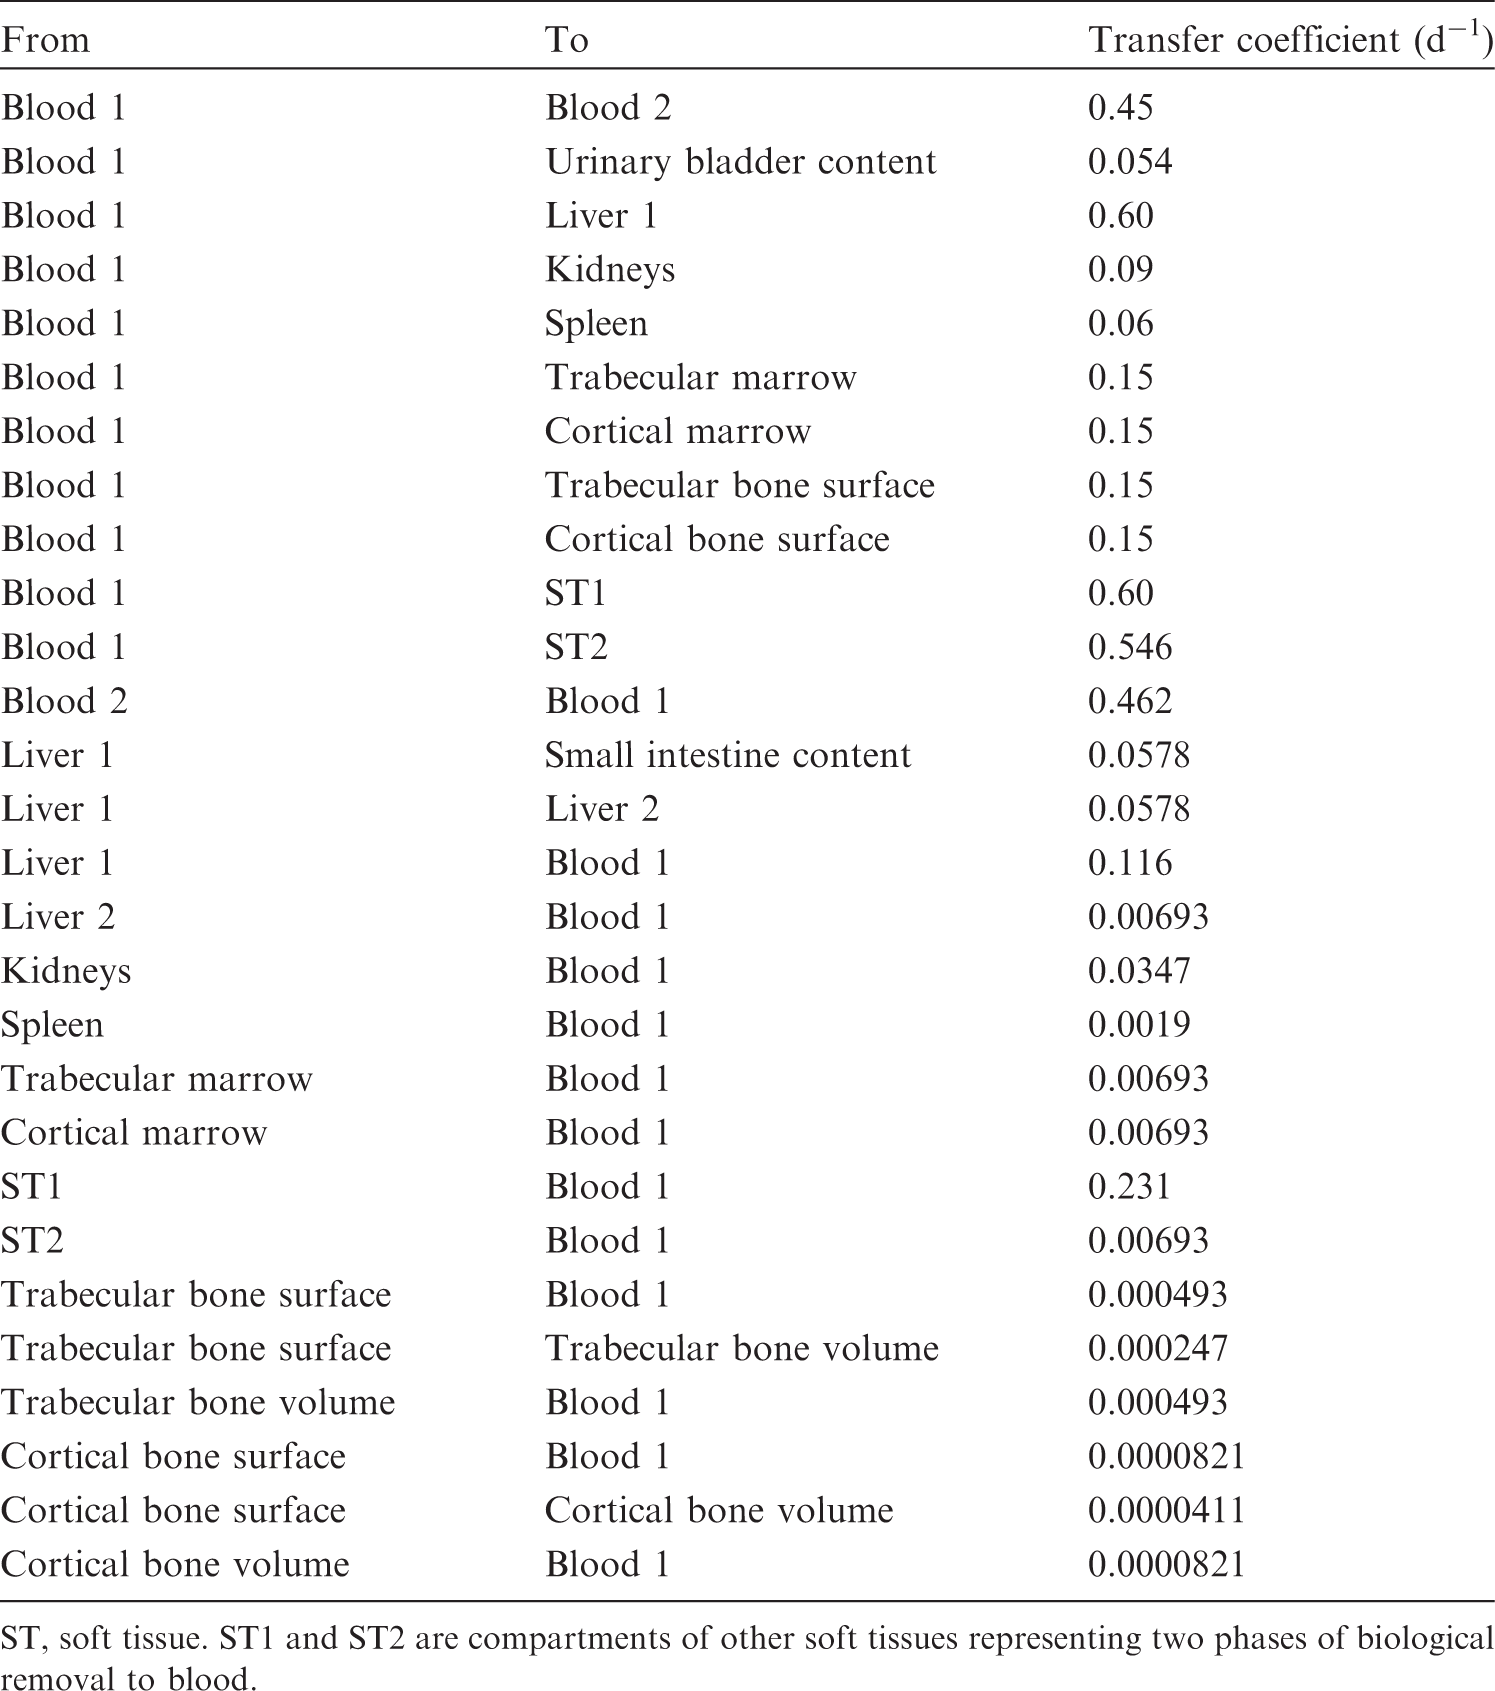
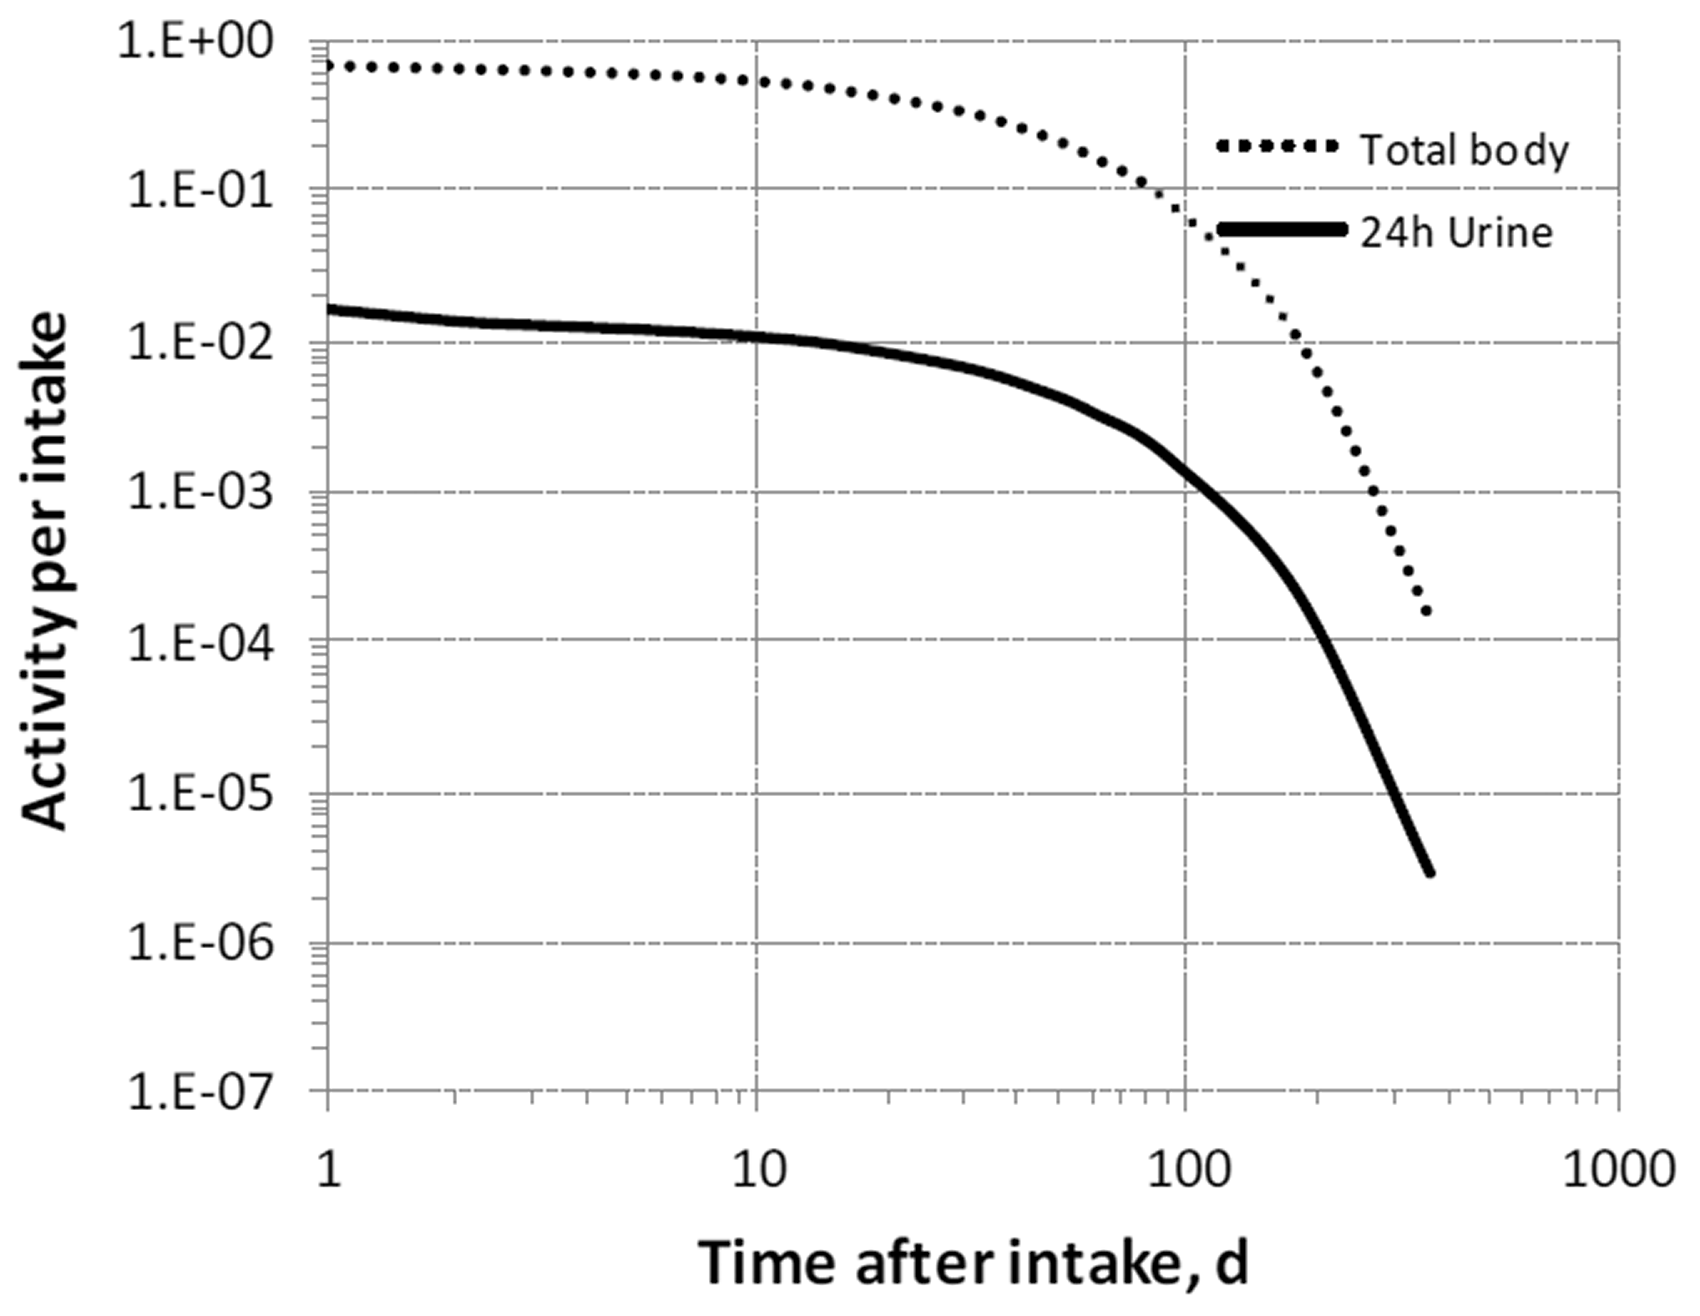


10.2.3.3. Treatment of progeny
(161) The only scandium chain addressed in this publication is the two-member chain consisting of 44mSc and its progeny 44Sc. The biokinetics of the progeny are assumed to be the same as those of the parent from its time of production in a systemic compartment.
10.3. Individual monitoring
(162) Information regarding the detection limit for routine individual measurement is not available.
10.4. Dosimetric data for scandium
11. Titanium (Z = 22)
11.1. Isotopes
11.2. Routes of intake
11.2.1. Inhalation
(163) For titanium, default parameter values were adopted on absorption to blood from the respiratory tract (ICRP, 2015). Absorption parameter values and types, and associated fA values for particulate forms of titanium are given in Table 11.2. Committed effective dose coefficients (Sv Bq−1) for the inhalation or ingestion of 44Sc compounds. AMAD, activity median aerodynamic diameter. Isotopes of titanium addressed in this publication. EC, electron-capture decay; B+, beta-plus decay Dose coefficients and bioassay data for this radionuclide are given in the printed copy of this publication. Data for other radionuclides listed in this table are given in the online electronic files on the ICRP website. Absorption parameter values for inhaled and ingested titanium. It is assumed that the bound state can be neglected for titanium (i.e. fb = 0). The values of sr for Type F, M, and S forms of titanium (30, 3, and 3 d−1, respectively) are the general default values. For inhaled material deposited in the respiratory tract and subsequently cleared by particle transport to the alimentary tract, the default fA values for inhaled materials are applied [i.e. the product of fr for the absorption type and the fA value for ingested soluble forms of titanium (0.001)]. Default Type M is recommended for use in the absence of specific information on which the exposure material can be assigned to an absorption type (e.g. if the form is unknown, or if the form is known but there is no information available on the absorption of that form from the respiratory tract). For guidance on the use of specific information, see Section 1.1. Activity transferred from systemic compartments into segments of the alimentary tract is assumed to be subject to reabsorption to blood. The default absorption fraction fA for the secreted activity is the highest value for any form of the radionuclide (fA = 0.001).


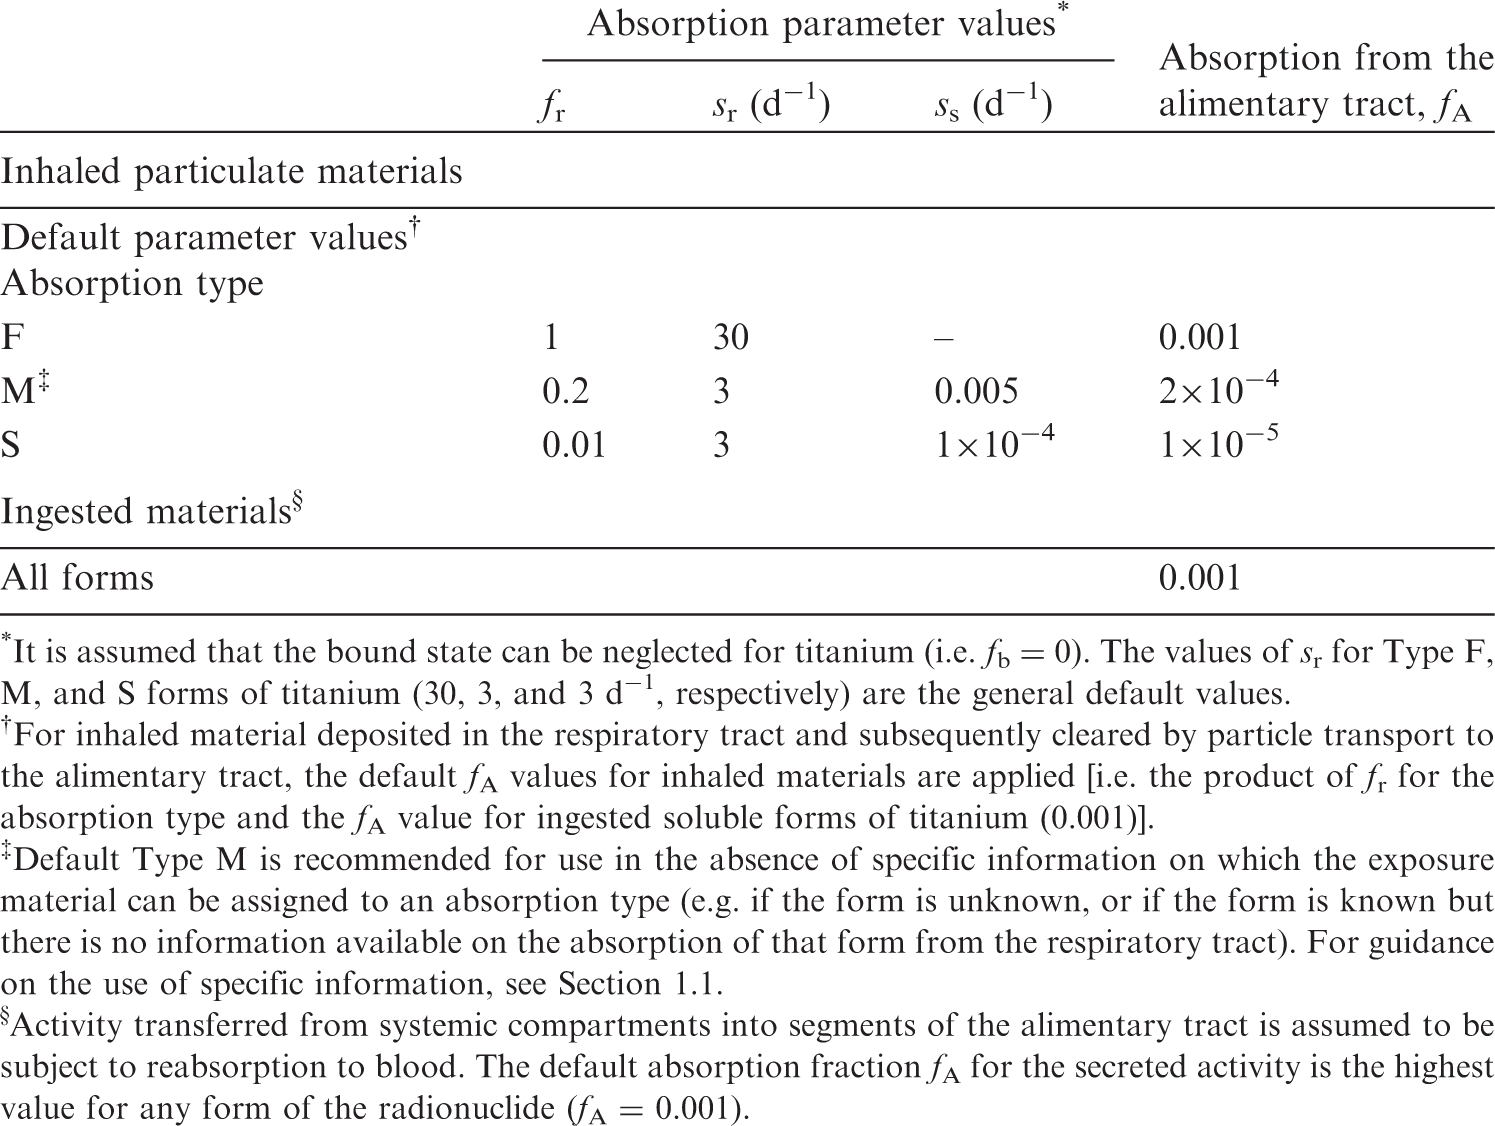
11.2.2. Ingestion
(164) Titanium compounds are poorly absorbed from the gastrointestinal tract (United Nations Environment Programme, 1982). Human studies of ingestion of micro- and nanoparticles of titanium dioxide by volunteers (West and Wyzan, 1963; Böckmann et al., 2000; Jones et al., 2015; Pele et al., 2015) were reviewed by EFSA (2016), who estimated fractional absorption to be in the range of 0.02–0.1%. When 44Ti tetrachloride was given orally to sheep, the comparison of tissue content with that observed after intravenous injection indicated absorption <0.5%. (165) In Publications 30 and 68 (ICRP, 1981, 1994a), fractional absorption of 0.01 was retained for titanium. In this publication, based on recent human studies with titanium dioxide, fA is taken to be 10−3 for all chemical forms of titanium in the workplace.
11.2.3. Systemic distribution, retention, and excretion of titanium
11.2.3.1. Biokinetic data
(166) Titanium is a member of Group IVB of the periodic table, located just above the chemically similar element zirconium. The high reactivity of these elements at high temperatures can result in the formation of extremely stable compounds. Durable materials made from titanium and zirconium are widely used in industry and medicine. (167) The biokinetics of systemic titanium has been studied in laboratory animals and, to a lesser extent, in human subjects, primarily in investigations of the fate of titanium ions or compounds released into the body from titanium-based implants (Merritt et al., 1992; Merritt and Brown, 1995; Golasik et al., 2016a,b); and potential adverse effects of internally deposited TiO2 nanoparticles used in consumer products (Fabian et al., 2008; Shi et al., 2013; Geraets et al., 2014; Schinohara et al., 2014; Elgrabli et al., 2015; Kreyling et al., 2017a,b,c). 45Ti has been investigated for use in radiopharmaceuticals due to the tendency of various titanium compounds to form colloids in the body with resulting accumulation in the liver and spleen, suggesting potential applications of 45Ti in imaging the body’s reticuloendothelial system (Ishiwata et al., 1991). (168) Development of a biokinetic model for systemic titanium from the reported data is complicated by an apparent dependence of the systemic behaviour of titanium on the form and mass of administered titanium and the mode of administration. Such differences in experimental conditions may result in variable accumulation of titanium by the reticuloendothelial system. (169) Thomas and Archuleta (1980) studied the distribution and retention of 44Ti in mice following its intraperitoneal or intravenous administration as the chloride. The results indicated that titanium is relatively insoluble in body fluids. The initial systemic distribution depended strongly on the exposure mode, but did not vary noticeably over time after either intraperitoneal or intravenous administration. The liver, spleen, kidneys, and gastrointestinal tract contained ∼25%, 3.3%, 1.7%, and 3.6%, respectively, of the total-body content after intravenous injection, and 8.4%, 2.1%, 2.0%, and 15%, respectively, after intraperitoneal injection. Differences in the distributions following intraperitoneal and intravenous administration appeared to result largely from adherence of injected material to visceral organs near the injection site, and elevated uptake by the reticuloendothelial system in the case of intravenous injection. Mean Tb of 642 d was estimated for the total body. (170) Merritt et al. (1992) and Merritt and Brown (1995) examined the behaviour of titanium in hamsters following repeated intraperitoneal or intramuscular injections of titanium salts over a few weeks. Transport from the site of injection was slow. One week after the end of six weekly injections of 100 µg of titanium tetrachloride, the following tissues showed titanium concentrations noticeably higher than found in control animals: spleen, 40.5 µg g−1 (above the control level); liver, 6.9 µg g−1; bone matrix, 3.3 µg g−1; bone mineral, 0.9 µg g−1; and kidneys, 2.1 µg g−1. (171) Sarmiento-Gonzalez et al. (2009) determined the titanium concentration in tissues of rats 18 months after the implantation of titanium wires in the femur, 1 week after intraperitoneal injection of soluble titanium as the citrate, or 1 week after intraperitoneal injection of TiO2 microparticles. Titanium concentrations in the kidneys, spleen, lungs, and heart, normalised to a concentration of 1.0 in the liver were, respectively, 2.7, 8.1, 7.4, and 2.1 for rats with implants; 6.5, 6.7, 1.8, and 0.74 for rats injected with titanium citrate; and 2.1, 2.1, 15, and 2.5 for rats injected with titanium dioxide. (172) Golasik et al. (2016a,b) studied the distribution of titanium in selected tissues of rats following administration in ionic form, either as a single intravenous injection or daily oral administration for 30 d. During the first 24 h after intravenous injection or after the end of oral administration, the highest tissue concentration was found in the kidneys, followed by the liver. Over this period, the liver contained a greater portion of the administered titanium than the kidneys due to the larger mass of the liver. In the early hours after intravenous injection, Tb was ∼3.3 h for the kidneys and 1.9 h for the liver. Much slower removal from these tissues was seen from 3 h to 24 h after the end of oral administration. (173) Miller et al. (1976) determined the distribution of 44Ti in lambs after oral or intravenous administration of 44TiCl4. At 2 d after oral administration, the mean activity concentration in systemic tissues, normalised to 1.0 for the liver, decreased in the order: liver (1.0) > kidneys (0.74) > pancreas (0.49) > spleen (0.28) > lung, heart, and adrenals (<0.15). At 2 d after intravenous administration, blood, skeleton, kidneys, liver, and remaining tissue contained ∼18.4%, ∼24.8%, ∼2.1%, ∼1.3%, and ∼48.8%, respectively, of the administered activity; cumulative urinary excretion accounted for ∼3%; and faecal excretion plus gastrointestinal tract contents accounted for ∼1.6%. This distribution broadly resembles that predicted by the systemic model for zirconium adopted in Publication 34 (ICRP, 2016): blood, 38%; bone, 22.8%; kidneys, 0.4%; liver, 1.8%; other tissue, 33%; urine, 3%; and faeces, 1%. Noticeable differences are that the zirconium model predicts slower removal from blood, balanced by slower accumulation in ‘Other tissue’ and lower accumulation in the kidneys. (174) Zhu et al. (2010) measured concentrations of 60 elements including titanium and zirconium in 17 tissues obtained from autopsies of 68 Chinese men from four areas of China. All 68 subjects were considered healthy until the time of sudden accidental death. Concentrations of the elements were also measured in blood of living subjects from each of the four areas. The concentration of an element in a tissue or blood was reported as a median and range of measured values. The results for titanium and zirconium indicate considerable differences in their long-term distributions in the adult human body. For example, the median concentration of zirconium in the ribs (the only bone addressed) was considerably greater than that in soft tissues other than the liver, while the median concentration of titanium in the ribs (983 µg kg−1) was lower than the median concentration in eight soft tissues (e.g. liver, 3220 µg kg−1; muscle, 2060 µg kg−1; kidneys, 1770 µg kg−1). A relatively low median concentration (201 µg kg−1) was determined for the spleen. Blood, liver, kidneys, bone, and all other tissues combined contained ∼0.4%, ∼6%, ∼0.6%, ∼11%, and ∼82%, respectively, of total-body titanium in these subjects based on median concentrations in tissues. (175) The systemic behaviour of titanium administered as TiO2 nanoparticles has been studied extensively in laboratory animals and, to a lesser extent, in human subjects (Fabian et al., 2008; Patri et al., 2009; Xie et al., 2011; Shi et al., 2013; Baisch et al., 2014; Geraets et al., 2014; Elgrabli et al., 2015; Bello and Warheit, 2017; Kreyling et al., 2017a,b,c). Following intravenous injection, titanium generally accumulates mainly in the liver (approximately half of the administered amount during the first week), spleen (approximately 2% in the first week), and lungs (a few tenths of 1% in the first week), and was largely removed from the body after 8 weeks. Kreyling et al. (2017a,b,c) investigated the biokinetics of titanium in rats following intravenous, oral, and intratracheal administration of TiO2 nanoparticles. The systemic behaviour of titanium following intratracheal administration differed from that seen after intravenous injection (Kreyling et al., 2017a), particularly regarding the distribution of systemic titanium over time. The highest concentrations following intratracheal administration were found in the kidneys, liver, and spleen, while the largest fraction of absorbed activity was found in the remaining soft tissues, followed by the skeleton. The systemic behaviour of titanium 1–7 d after administration along the gastrointestinal route was closer to that seen after intratracheal administration than after intravenous administration. Approximately 0.6% of the oral intake was absorbed to blood and ∼0.05% remained in systemic tissues after 7 d, with rounded relative concentrations of 1 in the liver, 1 in lungs, 3 in kidneys, 4 in brain, 5 in spleen, 6 in uterus, and 11 in skeleton.
11.2.3.2. Biokinetic model for systemic titanium
(176) Development of a biokinetic model for systemic titanium is complicated by considerable inconsistencies in reported data. These inconsistencies may arise, in large part, due to variable uptake of titanium by the reticuloendothelial system under different experimental conditions. The titanium model used in this publication is based on the results of studies that do not appear to reflect elevated uptake by the reticuloendothelial system (e.g. Miller et al., 1976; Zhu et al., 2010; Golasik et al., 2016a,b), as such studies may be most appropriate for assessing the fate of radiotitanium in the body. The initial distribution of titanium is based mainly on the results of Miller et al. (1976), which suggest that the initial distribution of systemic titanium is similar but not identical to that of zirconium as depicted in the biokinetic model for systemic zirconium in Publication 134 (ICRP, 2016). The long-term kinetics of titanium are based on relative concentrations of titanium in tissues as determined in the autopsy study of Zhu et al. (2010). Transfer coefficients describing the removal of titanium from bone volume are generic values based on reference rates of cortical and trabecular bone turnover (ICRP, 2002a). (177) The structure of the systemic model for titanium is shown in Fig. 11.1. Transfer coefficients are listed in Table 11.3. Transfer coefficients in the biokinetic model for systemic titanium. SI, small intestine. ST, soft tissue. ST0 and ST1 are compartments of other soft tissues with fast and intermediate turnover, respectively. Structure of the biokinetic model for systemic titanium. SI, small intestine. ST, soft tissue. ST0, ST1, and ST2 are compartments of other soft tissues with fast, intermediate, and slow turnover, respectively.
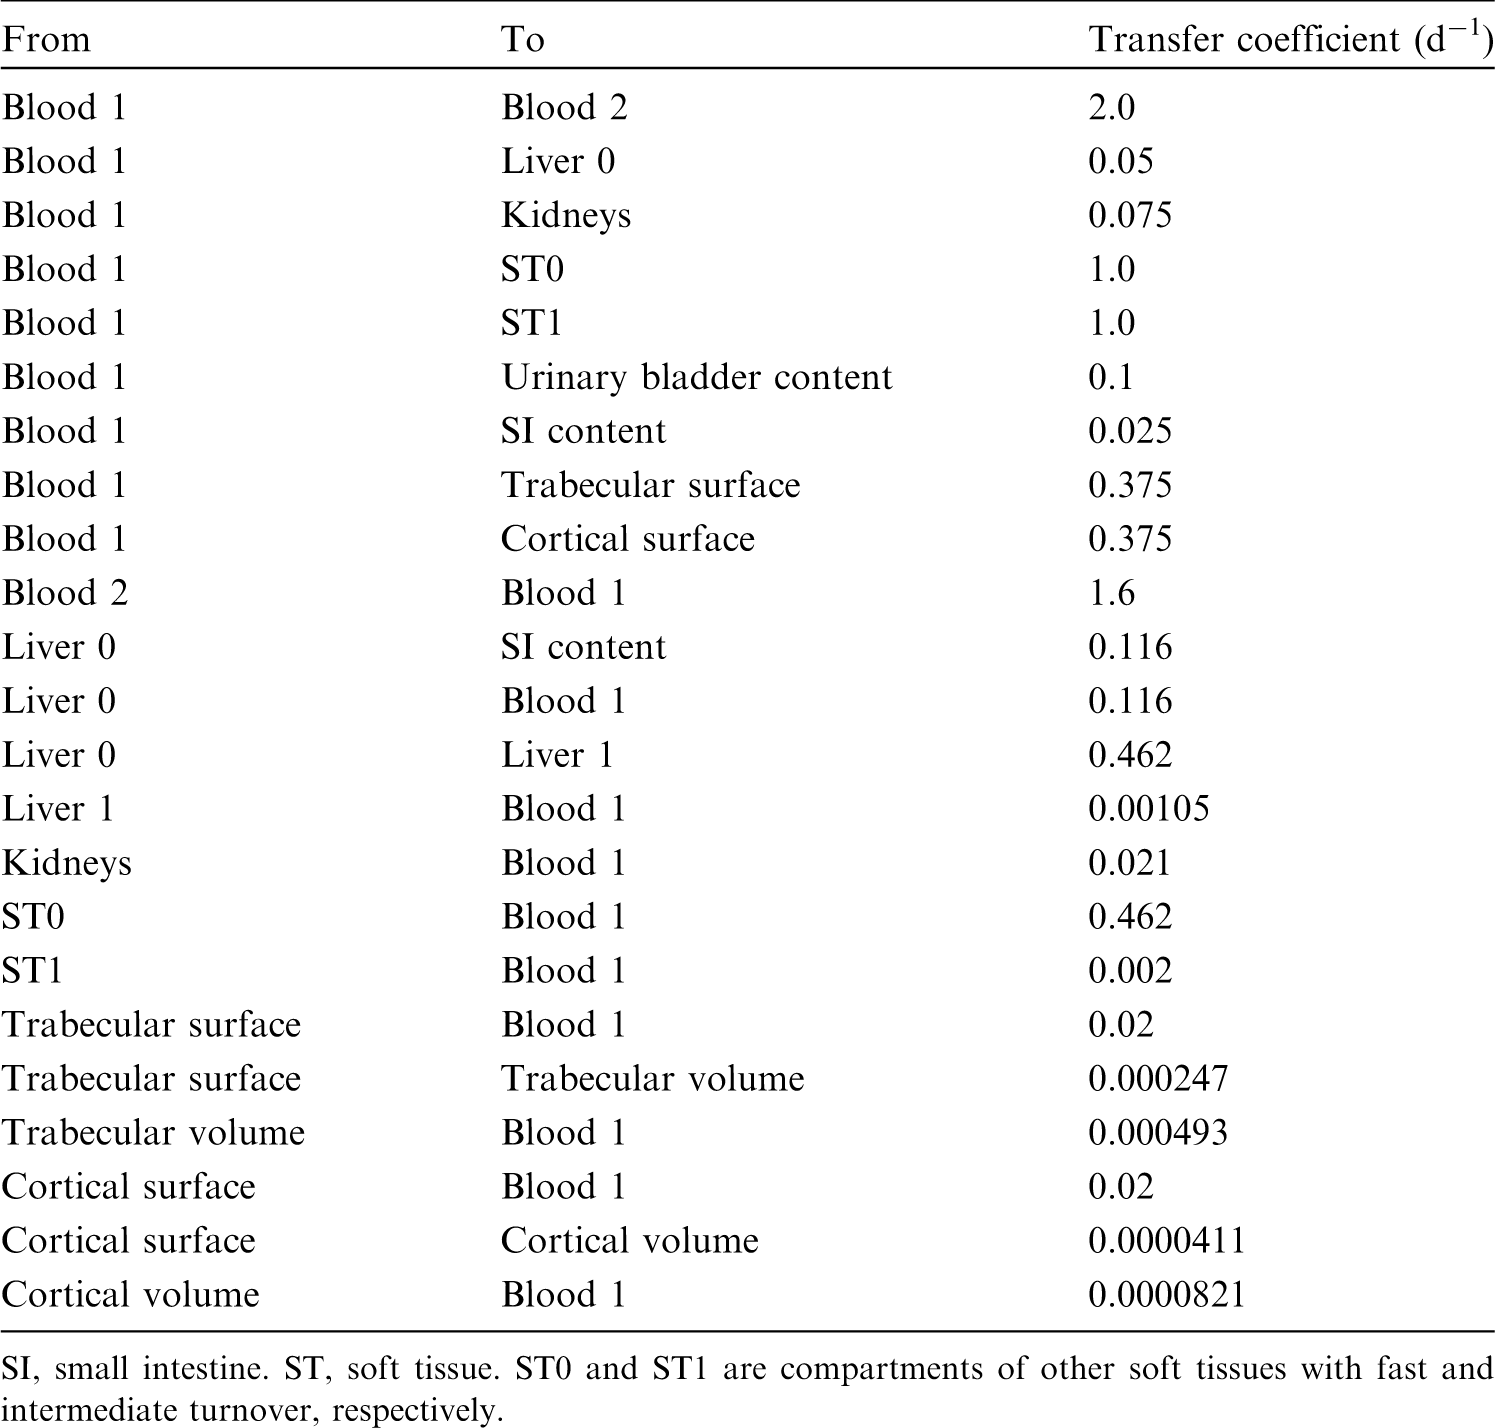

11.2.3.3. Treatment of progeny
(178) The only progeny of titanium addressed in this publication is 44Sc, produced by decay of 44Ti. The characteristic model for scandium is applied to 44Sc as progeny of 44Ti, with added compartments and associated transfer coefficients needed to solve the linked biokinetic models of titanium and scandium. The following transfer rates from compartments appearing in the titanium model to scandium’s central blood compartment are added to the characteristic model for scandium: 1000 d−1 if 44Si is produced in a blood compartment not identified in the scandium model, and at 0.231 d−1 if 44Si is produced in a compartment in titanium’s ‘Other’ not identified in the scandium model.
11.3. Individual monitoring
(179) Information regarding the detection limit for routine individual measurement is not available.
11.4. Dosimetric data for titanium
12. Vanadium (Z = 23)
12.1. Isotopes
12.2. Routes of intake
12.2.1. Inhalation
(180) For vanadium, default parameter values were adopted on absorption to blood from the respiratory tract (ICRP, 2015). Absorption parameter values and types, and associated fA values for particulate forms of vanadium are given in Table 12.2. Committed effective dose coefficients (Sv Bq−1) for the inhalation or ingestion of 44Ti compounds. AMAD, activity median aerodynamic diameter. Isotopes of vanadium addressed in this publication. EC, electron-capture decay; B+, beta-plus decay; B−, beta-minus decay; IT, isomeric transition decay. Dose coefficients and bioassay data for this radionuclide are given in the printed copy of this publication. Data for other radionuclides listed in this table are given in the online electronic files on the ICRP website. Absorption parameter values for inhaled and ingested vanadium. It is assumed that the bound state can be neglected for vanadium (i.e. fb = 0). The values of sr for Type F, M, and S forms of vanadium (30, 3, and 3 d−1, respectively) are the general default values. For inhaled material deposited in the respiratory tract and subsequently cleared by particle transport to the alimentary tract, the default fA values for inhaled materials are applied [i.e. the product of fr for the absorption type and the fA value for ingested soluble forms of vanadium (0.2)]. Default Type M is recommended for use in the absence of specific information on which the exposure material can be assigned to an absorption type (e.g. if the form is unknown, or if the form is known but there is no information available on the absorption of that form from the respiratory tract). For guidance on the use of specific information, see Section 1.1. Activity transferred from systemic compartments into segments of the alimentary tract is assumed to be subject to reabsorption to blood. The default absorption fraction fA for the secreted activity is the highest value for any form of the radionuclide (fA = 0.2).
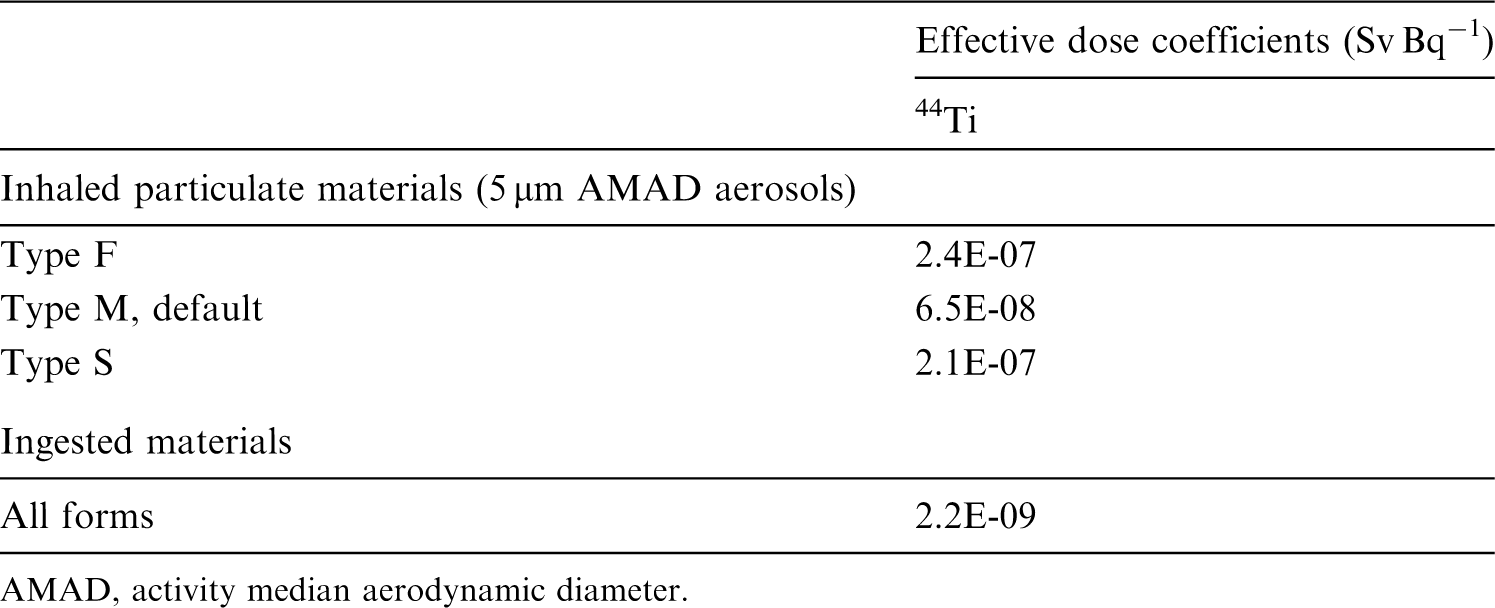


12.2.2. Ingestion
(181) A comparison of the low concentrations of vanadium normally present in urine with the estimated daily intake and faecal levels of the element indicates that <5% of dietary vanadium is absorbed from the gastrointestinal tract (ICRP, 1975; Byrne and Kosta, 1978; WHO, 1996). In-vitro digestion of soil, dust, and concentrate fines from a vanadium titanomagnetite mining region showed higher bioaccessibility of V(V) than V(IV) (Yu and Yang, 2019). (182) Measurement of urinary excretion after administration of V(IV) as ammonium vanadyl tartrate to six human patients (Dimond et al., 1963) and as diammonium oxytartratovanadate to five healthy volunteers (Curran et al., 1959) suggested fractional absorption in the range of ∼0.1–1%. Conversely, Proescher et al. (1917) observed 12.4% excretion in urine of V (V) orally given to a man as sodium metavanadate. Animal experiments confirm the low fractional absorption of V(IV): 0.5–1% of vanadyl sulphate in rats (United Nations Environment Programme, 1988) and rabbits (Curran and Costello, 1956), and 2.6% of vanadium oxydichloride in rats (Sollenberger, 1981). However, by comparing vanadium concentration in blood after oral and intravenous administration of vanadyl sulphate to rats, Azay et al. (2001) estimated a higher fractional absorption of 16%. On the other hand, V(V) given orally to rats as sodium metavanadate appears to be absorbed to a relatively large extent of 16.5–40% (Bogden et al., 1982; Wiegmann et al., 1982; Adachi et al., 2000). However, only 2.6% of the slightly soluble V(V) pentoxide was absorbed by rats after oral administration (Conklin et al., 1982). Hill (1980) found that ascorbic acid reduced vanadium absorption in rats. (183) In Publications 30 and 68 (ICRP, 1981, 1994a), f1 was taken to be 0.01 for all compounds of vanadium. In this publication, the same value of fA (0.01) is retained for all chemical forms of vanadium, except sodium metavanadate for which a higher value of fA (0.2) is adopted.
12.2.3. Systemic distribution, retention, and excretion of vanadium
12.2.3.1. Biokinetic data
(184) The behaviour of vanadium in the human body has been observed in workers exposed to airborne vanadium and in controlled inhalation or ingestion studies (Curran et al., 1959; Barceloux and Barceloux, 1999). These studies mainly address the respiratory behaviour and gastrointestinal absorption of vanadium, and provide little specific information on its systemic behaviour. (185) Information on the systemic kinetics of vanadium is available from studies of the fate of radioactive or stable vanadium after administration to rodents (Strain et al., 1964; Thomassen and Leicester, 1964; Sabbioni et al., 1978, 1981; Roshchin et al., 1980; Sharma et al., 1980, 1987; Hansen et al., 1982; Ando et al., 1989; Ando and Ando, 1990; Merritt and Brown, 1995; Amano et al., 1996; Setyawati et al., 1998; Barceloux and Barceloux, 1999; Hirunuma et al., 1999; Alimonti et al., 2000). Following injection or absorption of vanadium into blood, relatively high concentrations are observed in the kidneys, bone, and liver, with bone becoming the dominant systemic repository at times, remote from uptake to blood. The main route of excretion of absorbed vanadium is through the kidneys. Normally, no more than 10% of absorbed vanadium is excreted in faeces (Barceloux and Barceloux, 1999). At least half of the amount reaching blood is typically excreted within the first 3–4 d (Durbin, 1959; Barceloux and Barceloux, 1999; Hirunuma et al., 1999). (186) Comparative biokinetic studies of the Group VB elements vanadium, niobium, and tantalum (Durbin, 1959; Ando et al., 1989; Ando and Ando, 1990) indicate that these three elements share some biokinetic properties, including primary sites of deposition in the body. However, vanadium is less firmly fixed in tissues and more readily absorbed to blood from intramuscular injection sites, and shows distinctive systemic kinetics including more rapid excretion than the other Group VB elements. In the study described by Durbin (1959), <10% of absorbed vanadium was retained after 2 months, compared with at least three-fold higher retention of niobium or tantalum. (187) The reader is referred to a paper by Leggett and O’Connell (2018) for a more detailed discussion of biokinetic data for systemic vanadium.
12.2.3.2. Biokinetic model for systemic vanadium
(188) A biokinetic model for systemic vanadium proposed by Leggett and O’Connell (2018) is adopted here. The model structure is shown in Fig. 12.1. Transfer coefficients are listed in Table 12.3. Activity absorbed to blood from the respiratory or alimentary tract is assigned to Blood 1. (189) The transfer coefficients for vanadium listed in Table 12.3 were based, to a large extent, on comparative biokinetics of vanadium and niobium (Leggett and O’Connell, 2018). The transfer coefficients for niobium (ICRP, 2016) were modified for closer agreement with the distinctive systemic behaviour of vanadium indicated by data for rodents. Compared with the model for niobium, the parameter values for vanadium were set to predict faster outflow from blood, a higher rate of urinary excretion, a higher rate of removal from the total body, greater uptake by the kidneys, and faster loss from bone and liver indicated by studies on rats. The reader is referred to Leggett and O’Connell (2018) for more details on the selection of transfer coefficients for vanadium. Transfer coefficients in the biokinetic model for systemic vanadium. SI, small intestine. Structure of the biokinetic model for systemic vanadium. SI, small intestine.


12.3. Individual monitoring
(190) Information regarding the detection limit for routine individual measurement is not available.
12.4. Dosimetric data for vanadium
13. Chromium (Z = 24)
13.1. Isotopes
13.2. Routes of intake
13.2.1. Inhalation
(191) For chromium, default parameter values were adopted on absorption to blood from the respiratory tract (ICRP, 2015). Absorption parameter values and types, and associated fA values for particulate forms of chromium are given in Table 13.2. Committed effective dose coefficients (Sv Bq−1) for the inhalation or ingestion of 48V compounds. AMAD, activity median aerodynamic diameter. Isotopes of chromium addressed in this publication. EC, electron-capture decay; B+, beta-plus decay. Dose coefficients and bioassay data for this radionuclide are given in the printed copy of this publication. Data for other radionuclides listed in this table are given in the online electronic files on the ICRP website. Absorption parameter values for inhaled and ingested chromium. It is assumed that the bound state can be neglected for chromium (i.e. fb = 0). The values of sr for Type F, M, and S forms of chromium (30, 3, and 3 d−1, respectively) are the general default values. For inhaled material deposited in the respiratory tract and subsequently cleared by particle transport to the alimentary tract, the default fA values for inhaled materials are applied [i.e. the product of fr for the absorption type and the fA value for ingested soluble forms of chromium (0.01)]. Default Type M is recommended for use in the absence of specific information on which the exposure material can be assigned to an absorption type (e.g. if the form is unknown, or if the form is known but there is no information available on the absorption of that form from the respiratory tract). For guidance on the use of specific information, see Section 1.1. Activity transferred from systemic compartments into segments of the alimentary tract is assumed to be subject to reabsorption to blood. The default absorption fraction fA for the secreted activity is the highest value for any form of the radionuclide (fA = 0.01).


13.2.2. Ingestion
(192) The US Agency for Toxic Substances and Disease Registry (ATSDR, 2012b) and the European Food Safety Authority (EFSA, 2014) reviewed chromium absorption, which is poor from the gastrointestinal tract. In humans and rats, 0.4–2.8% of chromium in the trivalent state was reported to be absorbed following oral administration. The rate of uptake depends on the water solubility of the chemical compounds. Chromium appears to be better absorbed from soil than from chromate salts. Ingested hexavalent chromium is absorbed to a slightly greater extent than trivalent chromium in both rats and humans, with fractional absorption in the range of 1–7%. The reduction of Cr(VI) to Cr(III) by gastric juices, or by mixture with orange juice or ascorbic acid appears to decrease its intestinal absorption. (193) In Publications 30 and 68 (ICRP, 1980, 1994a), f1 was taken to be 0.01 for chromium in the trivalent state and 0.1 for chromium in the hexavalent state. In this publication, fA value of 0.01 is retained for trivalent chromium.
13.2.3. Systemic distribution, retention, and excretion of chromium
13.2.3.1. Biokinetic data
(194) Chromium exists in several oxidation states. The trivalent state [Cr(III)] is the most stable and the dominant naturally occurring form. Chromium in other oxidation states tends to be converted to the trivalent oxide in the environment and in biological systems. (195) The hexavalent form [Cr(VI)] is the second most stable oxidation state of chromium. It behaves differently from Cr(III) in the body and is categorised as a chemical toxin and carcinogen. The different behaviours and effects of Cr(VI) and Cr(III) in the body are associated with the ability of Cr(VI) compounds to cross cell membranes, while Cr(III) is blocked by the membrane (Christensen et al., 1993; O’Flaherty, 1996). (196) Cr(III) is an essential nutrient in humans and several non-human species (Hambidge and Baum, 1972; Christensen et al., 1993; Mertz, 1993; Anderson, 1997). Dietary intake of chromium is typically of the order of 75 µg d−1 (Pechova and Pavlata, 2007). Post-mortem measurements of chromium concentrations in 17 tissues of up to 68 adult male subjects (Zhu et al., 2010) indicate a central total-body content of ∼4 g chromium. Based on median chromium concentrations in tissues and reference tissue masses, ∼55% of total-body chromium is contained in muscle and fat, 25% in bone, 4% in the liver, and 0.5% in the kidneys. (197) Doisy et al. (1971) studied the blood kinetics and excretion of intravenously administered 51Cr(III) in seven normal subjects. The earliest measurements of activity in blood were at 10 min. Blood clearance was slow after 1 h, with the blood content gradually dropping to ∼40% of the early content (average content at 10 min and 1 h) by 3 d post injection and ∼25% by 7 d. Excretion of 51Cr was primarily in urine. Less than 1% of the injected amount appeared in faeces over the first 5 d. (198) Sargent et al. (1979) measured the retention of intravenously administered 51Cr(III) in five normal adult male humans. Total-body activity was measured externally for 8 months, and activity in blood was measured for 40–80 d post injection. Data fitting indicated three components of retention with mean half-times of 0.56 d (35%), 12.7 d (27%), and 192 d (38%). Blood clearance, apparently excluding a rapid phase of removal immediately after injection, was described in terms of four components of retention with mean half-times of 13 min, 6.3 h, 1.9 d, and 8.3 d. (199) Lim et al. (1983) studied the behaviour of intravenously administered 51Cr(III) in three normal subjects using external scanning and measurement of activity in plasma. The highest activity concentrations were seen in the liver, spleen, and bone. The data were used to develop a biokinetic model for systemic chromium consisting of physiological compartments including two plasma pools representing chromium bound to plasma transferrin (BB) and chromium in unbound form (BF), and tissue compartments representing the liver (two compartments), adipose plus muscle tissue, spleen (two compartments), bone, and remaining tissues (two compartments). A complex set of paths of movement between the two plasma compartments and eight tissue compartments was depicted. In view of similarities in the derived kinetics for some tissue compartments, a simpler functional model was developed by grouping tissue compartments with similar kinetics. The functional model consisted of the two plasma compartments BB and BF included in the physiological model, with exchange of chromium between BB and BF; three tissue compartments representing fast (hours), medium (days), and slow (months) exchange between tissues and BB; loss from BF in urine; and loss from BB via all other excretion pathways combined. Derived transfer components were tabulated for the functional model for individual subjects. (200) Chromium has been used to measure the volume and lifetime of RBC in patients and normal subjects based on tenacious retention of 51Cr(III) in RBC after passage of intravenously administered 51Cr(VI) across RBC membranes, and reduction of 51Cr(VI) to 51Cr(III) within the RBC. Following administration of 51Cr(VI) to normal subjects, the label disappeared from blood with Tb of ∼30 d (Korst, 1968). (201) Hopkins (1965) examined the systemic kinetics of intravenously injected 51Cr(III) in rats from 15 min to 4 d after administration. The kinetics varied little if any with dosage level, previous diet, or sex. Initial accumulation in most tissues decreased substantially over the 4-d period, but the kidneys and spleen continued to concentrate 51Cr. Growing rats retained greater amounts than mature animals in bone, while mature animals showed higher retention than younger animals in the kidneys, spleen, and testes. Activity was excreted predominantly in urine. (202) Mertz et al. (1965) studied the long-term behaviour of 51Cr in rats. Total-body retention was not affected by dietary history or amounts injected. Retention R(t) through time t = 72 d could be closely approximated by a sum of three exponential terms:
(203) Onkelinx (1977) studied the systemic behaviour of Cr(III) following intravenous administration of 51CrCl3 to female Wistar rats of different ages (35, 60, and 120 d). Observations included measurements of activity in urine, faeces, and blood over the first few days in all groups, and in tissues of a group of 60-day-old rats at intervals ranging from 1 h to 11 d post injection. In all age groups, urinary excretion accounted for approximately 90% of urinary plus faecal excretion during days 0–3 post injection. In all age groups, plasma clearance from 0 to 265 h post injection could be described as a sum of three exponential terms. As an average for the 120-day-old rats, ∼45% of the initial blood content cleared with a half-time of 2 h, 36% with a half-time of 16 h, and 14% with a half-time of 45 h. In the 60-day-old group, the average activity concentration over the first 24 h, normalised to 1.0 for the liver, decreased in the order: bone epiphyses (8.8) > kidneys (3.1) > bone diaphysis (2.5) > lungs (1.2) > liver (1.0) > spleen (0.85) > pancreas (0.36). The average activity concentration over days 2–11, normalised to 1.0 for the liver, decreased in the order: bone epiphyses (10.5) > bone diaphysis (3.6) > kidneys (2.9) > spleen (1.9) > liver (1.0) > lungs (0.5) > pancreas (0.27). In the 60-day-old group, the activity concentration in erythrocytes remained much lower than that in plasma. The derived data were used to develop a first-order compartmental biokinetic model consisting of a central pool presumably representing extracellular fluids; two hypothetical tissue pools representing rapid and slow exchange with the central pool; and removal from the system due to outflow from the central pool to urine, faeces, and a body sink. Removal to urine represented 51–64% of loss from the system in individual rats, removal to faeces represented 5–8%, and removal to the body sink represented 31–41%. (204) The biokinetics of Cr(VI) has been studied mainly in rodents (Sayato et al., 1980; Weber, 1983; O’Flaherty, 1996; O’Flaherty et al., 2001; Kirman et al., 2012). Considerable reduction of ingested Cr(VI) to Cr(III) occurs in the alimentary tract, starting in the oral cavity and continuing in the stomach and intestines. Low oral intakes of Cr(VI) may be completely reduced to Cr(III) in the alimentary tract (Kerger et al., 1997). Cr(VI) that reaches the systemic circulation appears to be reduced to Cr(III) in RBC and tissues over a relatively short but imprecisely known time period. (205) Weber (1983) studied the respiratory and systemic behaviour of Cr(VI) over a 40-d period following intratracheal administration of 51Cr-labelled chromate to rats. Activity in the lungs declined to approximately one-third of the deposited amount over the first 2–3 d and was retained mainly in alveolar cells. Considerable absorption of Cr(VI) to blood was indicated, for example, by a relatively high uptake of activity by RBC. Much of the absorbed activity was removed from blood with a half-time of 3–4 d. Tb of 51Cr in tissues ranged from 14 to 50 d. The initial concentrations in the kidneys, RBC, and testes showed little decline for 10–15 d but substantial decline by 25–40 d post administration. (206) The biokinetic model for systemic chromium adopted in Publication 30 (1979a) was based mainly on results of studies by Hopkins (1965) and Mertz et al. (1965) of Cr(III) behaviour in rats (summarised above). The model did not address the kinetics of Cr(IV) on the basis that ingested or inhaled Cr(VI) will have been largely reduced to Cr(III) before reaching the systemic circulation. It was assumed that chromium leaves blood with a half-time of 0.5 d, with 30% entering excretion pathways, 5% depositing in bone, and 65% distributing uniformly in other tissues. A removal half-time of 1000 d was assigned to chromium depositing in bone. The 65% entering other tissues was divided into two retention components representing 40% and 25% of activity leaving blood and having removal half-times of 6 and 80 d, respectively. Chromium isotopes with half-lives <15 d were assumed to be uniformly distributed on bone surfaces, and all others were assumed to be distributed in bone volume. (207) Hiller and Leggett (2020) reviewed information on the biokinetics of Cr(III) and Cr(VI) in human subjects and laboratory animals, and proposed systemic models for both forms. Parameter values for Cr(III) were based mainly on results of biokinetic and autopsy studies involving human subjects, particularly data of Sargent et al. (1979), Lim et al. (1983), and Zhu et al. (2010). Data for laboratory animals were used to fill gaps in the data for human subjects. Parameter values for Cr(VI) were based on data on the behaviour of Cr(VI) for rodents, except that the fate of Cr(IV) that enters RBC was based on data for human subjects. Cr(VI) reaching blood was assumed to be reduced to Cr(III) in RBC and tissues. Reduction of Cr(VI) to Cr(III) was not depicted explicitly, but was represented as transfer of absorbed Cr(VI) to RBC, Kidneys 2, Liver 2, and remaining tissues, which gradually release chromium to blood as Cr(III). The model for Cr(III) was applied to Cr(III) that reached blood.

13.2.3.2. Biokinetic model for systemic chromium
(208) The biokinetic model for systemic Cr(III) proposed by Hiller and Leggett (2020) is adopted here for application to radioisotopes of chromium, as Cr(III) is expected to be the dominant form in the workplace under most conditions and the dominant systemic form after intake of Cr(VI). (209) The structure of the systemic model for Cr(III) is shown in Fig. 13.1. Transfer coefficients for Cr(III) are listed in Table 13.3. Transfer coefficients in the biokinetic model for systemic chromium. Structure of the biokinetic model for systemic chromium (Cr).


13.2.3.3. Treatment of progeny
(210) Progeny of chromium addressed in this publication are radioisotopes of vanadium. The model for vanadium as a progeny of chromium is an expanded version of the characteristic model for vanadium with added compartments and associated transfer coefficients needed to solve the linked biokinetic models for chains headed by chromium. If vanadium is produced in a blood compartment of the chromium model not contained in the characteristic model for vanadium, it is assumed to transfer to its central blood compartment at a rate of 1000 d−1, and to follow its characteristic model thereafter. If produced in a tissue compartment not contained in the characteristic model for vanadium, vanadium is assumed to transfer to its central blood compartment at a rate of 0.14 d−1, and to follow its characteristic model thereafter.
13.3. Individual monitoring
13.3.1. 51Cr
(211) Measurements of 51Cr may be performed by in-vivo whole-body measurement technique and by gamma measurement in urine.
13.4. Dosimetric data for chromium
14. Manganese (Z = 25)
14.1. Isotopes
14.2. Routes of intake
14.2.1. Inhalation
(212) For manganese, default parameter values were adopted on absorption to blood from the respiratory tract (ICRP, 2015). Absorption parameter values and types, and associated fA values for particulate forms of manganese are given in Table 14.2. Monitoring techniques for 51Cr. Measurement system comprised of germanium detectors. Counting time of 20 min. Committed effective dose coefficients (Sv Bq−1) for the inhalation or ingestion of 51Cr compounds. AMAD, activity median aerodynamic diameter. Dose per activity content of 51Cr in total body and in daily excretion of urine (Sv Bq−1); 5 µm activity median aerodynamic diameter aerosols inhaled by a reference worker at light work. Isotopes of manganese addressed in this publication. EC, electron-capture decay; B+, beta-plus decay; B−, beta-minus decay; IT, isomeric transition decay. Dose coefficients and bioassay data for this radionuclide are given in the printed copy of this publication. Data for other radionuclides listed in this table are given in the online electronic files on the ICRP website. Absorption parameter values for inhaled and ingested manganese. It is assumed that the bound state can be neglected for manganese (i.e. fb = 0). The values of sr for Type F, M, and S forms of manganese (30, 3, and 3 d−1, respectively) are the general default values. For inhaled material deposited in the respiratory tract and subsequently cleared by particle transport to the alimentary tract, the default fA values for inhaled materials are applied [i.e. the product of fr for the absorption type and the fA value for ingested soluble forms of manganese (0.05)]. Default Type M is recommended for use in the absence of specific information on which the exposure material can be assigned to an absorption type (e.g. if the form is unknown, or if the form is known but there is no information available on the absorption of that form from the respiratory tract). For guidance on the use of specific information, see Section 1.1. Activity transferred from systemic compartments into segments of the alimentary tract is assumed to be subject to reabsorption to blood. The default absorption fraction fA for the secreted activity is the highest value for any form of the radionuclide (fA = 0.05).


14.2.2. Ingestion
(213) The fractional absorption of manganese averages ∼3–5% in adults (ATSDR, 2012c) and remains <10% (EFSA, 2013). It is under homeostatic control and negatively correlated with total dietary manganese and iron intakes. High intakes of calcium, phosphorus, ascorbate, and phytates have been reported to impair manganese absorption. Manganese appears to be absorbed more readily in the gastrointestinal tract of women than men. The absorption is also higher from water than from food (Ruoff, 1995), and from manganese chloride than from manganese oxide (Roels et al., 1997; Zheng et al., 2000). (214) For all compounds of manganese, f1 was taken to be 0.1 in Publications 30 and 68 (ICRP, 1979a, 1994a). In this publication, the value of fA = 0.05 is applied to all chemical forms of manganese.
14.2.3. Systemic distribution, retention, and excretion of manganese
14.2.3.1. Biokinetic data
(215) Manganese is an essential element required for metabolism of amino acids, proteins, carbohydrates, and lipids. Excessive intake of manganese can result in adverse health effects including progressive neurodegenerative damage, with an associated motor dysfunction syndrome similar to that seen in Parkinson’s disease. Most cases of manganese intoxication have been linked to occupational exposure to airborne manganese. (216) Dietary intake of manganese is typically ∼2–6 mg d−1 for adult humans. The adult human body contains ∼10–15 mg of manganese. The body’s manganese is maintained at a nearly constant level by homeostatic controls involving regulation of gastrointestinal uptake and intestinal secretions. High dietary manganese enhances metabolism of manganese in the liver and increases secretion of systemic manganese into the gastrointestinal contents (Andersen et al., 1999; Dorman et al., 2001). Inhaled manganese initially bypasses the homeostatic control processes in the liver and becomes largely bound to transferrin. In persons chronically exposed to elevated mass concentrations of manganese in air, atypically high masses of manganese can accumulate in the brain and other tissues due to delivery to transferrin receptors. (217) Results of a large autopsy study of element concentrations in tissues of adult male humans indicate that the highest median concentrations of manganese, normalised to the concentration in the liver, decrease in the order: liver (1.0) > pancreas, kidneys (∼0.65) > gastrointestinal tissues (0.35–0.55) (Zhu et al., 2010). The lowest concentrations (0.02–0.05) were found in blood, fat, and skin. Based on median concentrations in tissues and reference tissue masses, ∼34% of the body burden was contained in muscle, 24% in bone, 16% in liver, and 2% in kidneys. (218) Isotopic studies on laboratory animals show that absorbed or intravenously injected manganese leaves blood rapidly and initially concentrates largely in organs rich in mitochondria, such as the liver, pancreas, and kidneys (Kato, 1963; Dastur et al., 1971; Chauncey et al., 1977; Dorman et al., 2006). Over time, other organs, including the brain, bone, and muscle, contain increasingly greater portions of the retained activity (Furchner et al., 1966; Dastur et al., 1969, 1971). (219) Excretion of systemic manganese is predominantly in faeces and appears to arise mainly from biliary secretion, although substantial amounts are also removed to the gastrointestinal tract in pancreatic juices and other intestinal fluids (Maynard and Fink, 1956; Mahoney and Small, 1968; Dorman et al., 2001). In hospital patients, faecal excretion of activity was ∼40 times greater than urinary excretion over the first 6 d following intravenous injection of 52Mn in water (Maynard and Fink, 1956). Mahoney and Small (1968) found virtually no 54Mn in urine following its intravenous injection as the chloride into healthy subjects. Davidsson et al. (1989) found that faecal excretion accounted for virtually all biological removal of absorbed activity following ingestion of 54Mn by healthy subjects. (220) Most of the manganese in blood is contained in RBC (Milne et al.,1990). The concentration of manganese in blood plasma is typically ∼0.6–0.7 µg L−1 (Versieck and Cornelis, 1980; Baruthio et al., 1988; Versieck et al., 1988). Reported concentrations in whole blood of healthy adult subjects are typically of the order of 8–12 µg L−1 (Pleban and Pearson, 1979; Milne et al., 1990; Kristiansen et al., 1997). (221) Mena et al. (1967) observed total-body retention of intravenously injected 54Mn in eight healthy adult humans (four of each sex, age range 20–30 y), 14 current manganese miners in good health (aged 23–60 y), and 10 former manganese miners with chronic manganese poisoning (aged 18–56 y). Total-body removal half-times were 35.5 ± 8.4 d (mean ± standard deviation) in the control group, 12.5 ± 2.3 d in the healthy miners, and 26.5 ± 4.8 d in the subjects with manganese poisoning. (222) Mahoney and Small (1968) measured retention of intravenously injected 54Mn in six subjects including both sexes (aged 25–45 y), and studied factors affecting the rate of biological removal of the tracer from the body. Approximately 30% of the injected amount was removed with a half-time of 4 d, and 70% was removed with a half-time of 39 d. Low manganese intake increased the size of the slow component to 84% and the retention half-time to 90 d, but had no effect on the half-time of the fast component. Administration of a large mass of stable manganese 2 months after the start of the study substantially increased the rate of elimination of 54Mn. (223) Davidsson et al. (1989) measured retention and excretion of 54Mn in 14 healthy adults after its ingestion in infant formula. The mean Tb of absorbed activity over the period 10–30 d post ingestion was 16.4 d with a range of 6–32 d. Following intravenous administration of 54Mn to two subjects, the turnover rate during days 10–30 corresponded to Tb of 74 and 24 d, compared with 27 and 8 d, respectively, in the same subjects following oral administration. (224) Finley et al. (1994) and Finley (1999) studied the effects of gender and other factors on absorption and retention of manganese in healthy adult human subjects. Retention data for absorbed manganese for days 10–20 indicated mean whole-body Tb of ∼15 d for men and 12 d for women. Data for days 19–70 indicated mean Tb of ∼48 d for men and 34 d for women.
14.2.3.2. Biokinetic model for systemic manganese
(225) The biokinetic model for systemic manganese adopted for use in this publication was proposed by Leggett (2011). The model structure is shown in Fig. 14.1. Transfer coefficients are listed in Table 14.3. The reader is referred to the paper by Leggett (2011) for descriptions of the bases for parameter values, and comparisons of model predictions with observations of retention of manganese tracers in human subjects. Transfer coefficients in the biokinetic model for systemic manganese. RBC, red blood cells. ST, soft tissue. ST0, ST1, and ST2 are compartments of other soft tissues with fast, intermediate, and slow turnover, respectively. Daily excretion of 51Cr following inhalation of 1 Bq Type F. Daily excretion of 51Cr following inhalation of 1 Bq Type M. Daily excretion of 51Cr following inhalation of 1 Bq Type S. Structure of the biokinetic model for systemic manganese. RBC, red blood cells. ST, soft tissue. ST0, ST1, and ST2 are compartments of other soft tissues with fast, intermediate, and slow turnover, respectively.

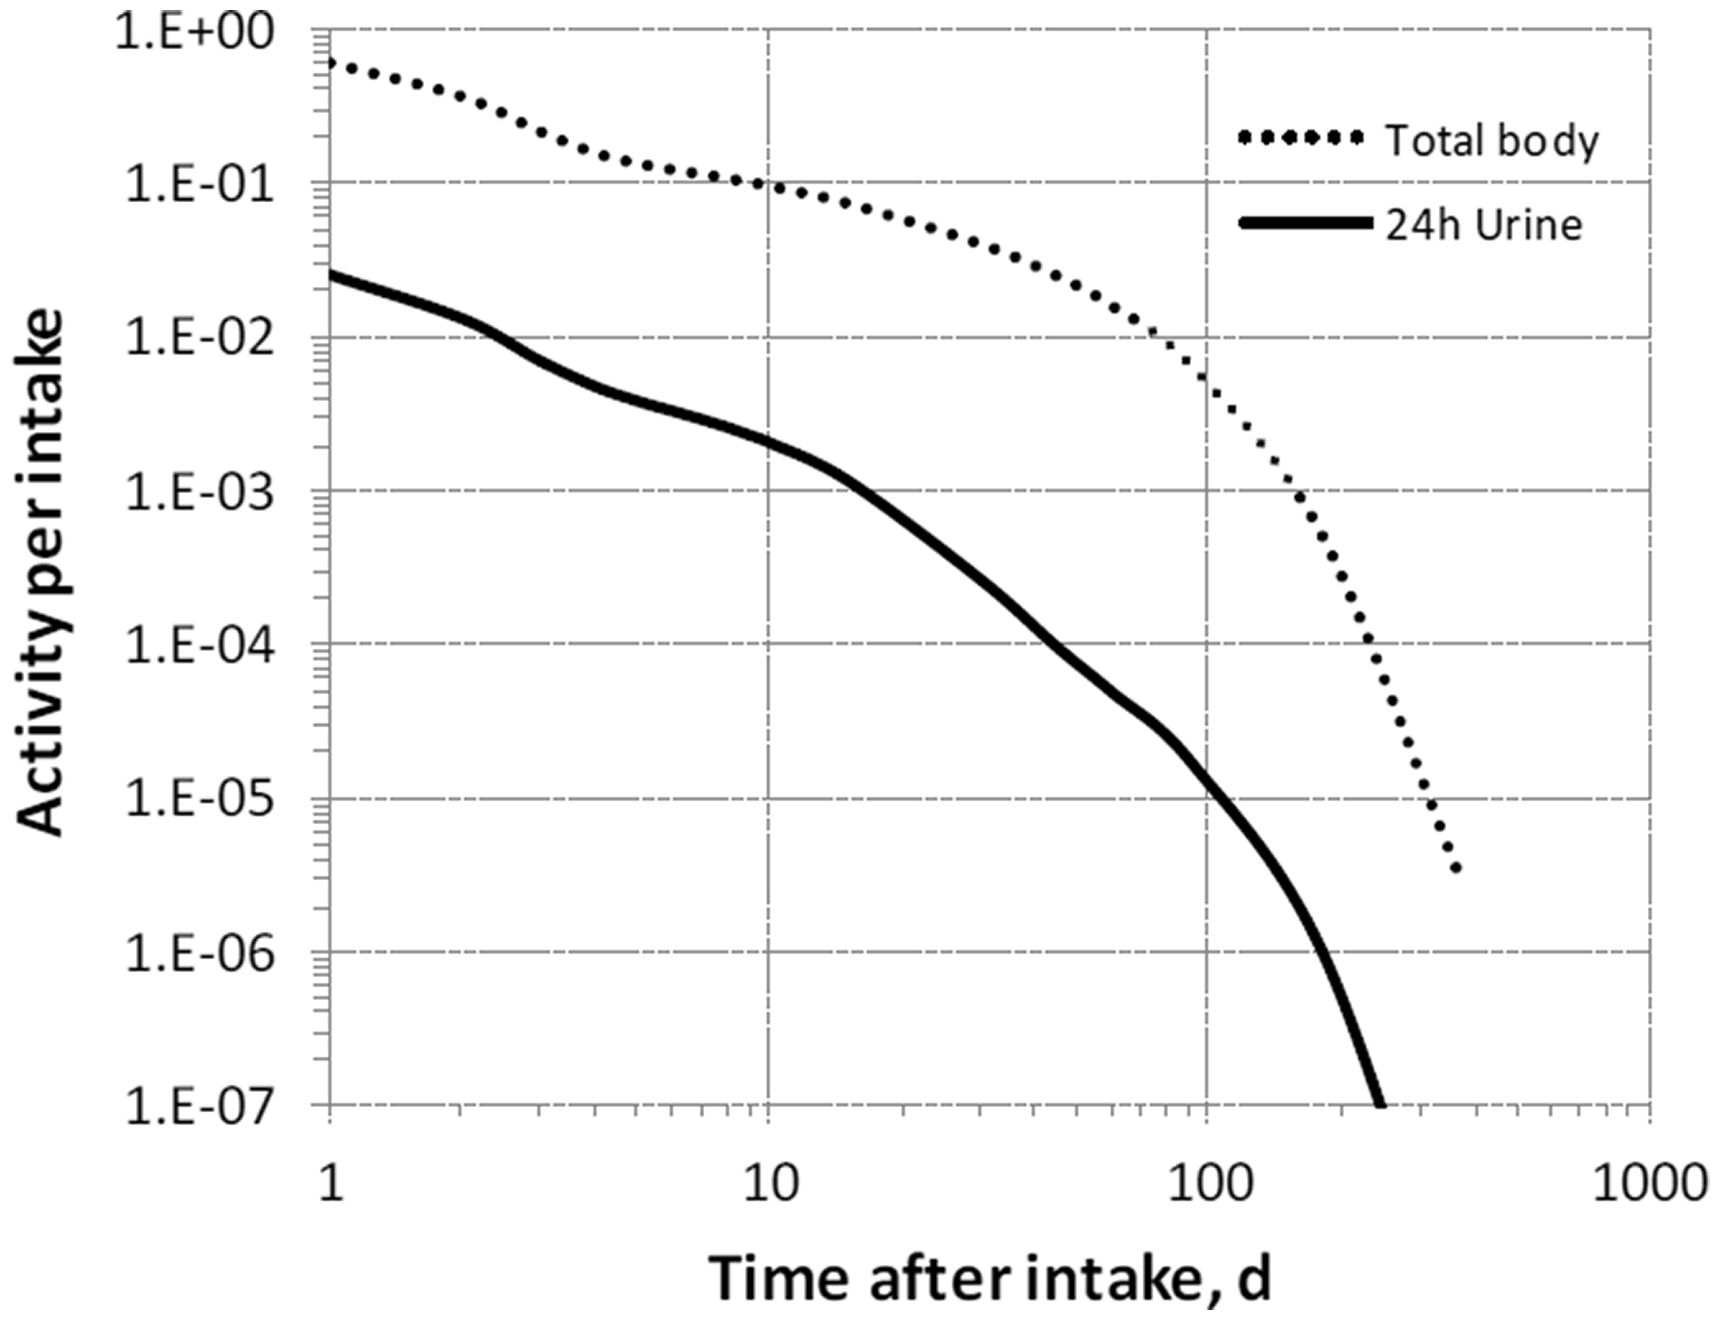


14.2.3.3. Treatment of progeny
(226) Progeny of manganese addressed in this publication are radioisotopes of manganese and chromium. The model for manganese as a parent is applied to manganese produced by decay of another manganese isotope. The model for chromium as progeny of manganese is an expansion of the characteristic model for chromium with added compartments and associated transfer coefficients needed to solve the linked biokinetic models for manganese and chromium (see Annex B). If produced in a compartment not explicitly named in the model for chromium, chromium is assumed to transfer at the following rates: 1000 d−1 if produced in a blood compartment; at the rate of bone turnover if produced in a bone volume compartment; and at 0.25 d−1 if produced in any other compartment.
14.3. Individual monitoring
14.3.1. 54Mn
(227) Measurements of 54Mn may be performed by in-vivo whole-body measurement technique and by gamma measurement in urine.
14.4. Dosimetric data for manganese
15. Nickel (Z = 28)
15.1. Isotopes
15.2. Routes of intake
15.2.1. Inhalation
(228) Little information was found on the behaviour of inhaled nickel in man: National Research Council (1975) reports post-mortem measurements of nickel concentrations averaging 0.1, 0.6, and 70 µg g−1 lung (dry mass), respectively, in groups of normal subjects, ore miners, and ‘victims of nickel carbonyl poisoning’ who had also been chronically exposed to dust with a high nickel content. However, although they show some accumulation following occupational exposure, the deposits were not related to specific exposures, and the retention time in the lungs cannot be estimated. Inhalation of nickel radioisotopes is not generally of major concern, but because of the recognised chemical toxicity of nickel, numerous studies have been conducted on its behaviour following deposition in the respiratory tract (National Research Council, 1975; Sivulka, 2005; Goodman et al., 2011). Information is available from experimental studies of nickel compounds including the carbonyl, chloride, sulphate, sulphides, and oxide – mostly in rats, with a few studies in dogs or monkeys. (229) Absorption parameter values and types, and associated fA values for gas and vapour forms of nickel are given in Table 15.2 and for particulate forms in Table 15.3. Exposures to gas or vapour forms of nickel are relatively unusual compared with exposures to particulate forms, and it is therefore recommended in the OIR series that the particulate form should be assumed in the absence of information (ICRP, 2002b). (230) Reference biokinetic models were used here (i.e. by the Task Group) for analysis of the data and the determination of absorption parameter values. The systemic model for nickel described in Section 15.2.3 was used for all studies. Data from studies in monkeys were interpreted using human particle transport rates from the revised HRTM (ICRP, 2015), and the gastrointestinal tract model from Publication 30 (ICRP, 1979a): respiratory tract deposition fractions were determined from measured bioassay data. The rodent studies were interpreted using the respiratory tract model described in ICRP Supporting Guidance 3 (ICRP, 2002b), and a simplified (three-compartment) version of the Publication 30 gastrointestinal tract model. Unless stated otherwise, in the analyses carried out here, the fraction absorbed in the alimentary tract, fA, was taken to be 0.05 (ICRP, 1993, 1994a). Generally, respiratory tract parameter values were sensitive to the choice of value of fA for soluble, but not for insoluble, forms. (231) In all the analyses carried out here, it was assumed that the bound state could be neglected (or was included in the dissolution phases) [i.e. fb = 0 (see below)]. In a number of the studies on relatively soluble forms (chloride, sulphate, sulphide), the authors of the reports represented lung retention of most of the estimated ILD by a single exponential function with associated biological half-time, Tb of the order of 1 d. As this is short, absorption dominates lung clearance and the rapid dissolution rate, sr, approximates ln(2)/Tb (i.e. ∼1 d−1). However, some absorption would have taken place between deposition of material in the lungs and the first measurement (possibly leading to underestimation of sr), and there would have been a contribution from mucociliary clearance from the conducting airways (possibly leading to overestimation of sr). An estimate of sr based on Tb is therefore only approximate, but considerable effort, and assumptions relating to factors such as the initial deposition, would be required to improve on it, and in most cases was not justified. Monitoring techniques for 54Mn. Measurement system comprised of germanium detectors. Counting time of 20 min. Committed effective dose coefficients (Sv Bq−1) for the inhalation or ingestion of 54Mn compounds. AMAD, activity median aerodynamic diameter. Dose per activity content of 54Mn in total body and in daily excretion of urine (Sv Bq−1); 5 µm activity median aerodynamic diameter aerosols inhaled by a reference worker at light work. Isotopes of nickel addressed in this publication. EC, electron-capture decay; B+, beta-plus decay; B−, beta-minus decay. Dose coefficients and bioassay data for this radionuclide are given in the printed copy of this publication. Data for other radionuclides listed in this table are given in the online electronic files on the ICRP website. Deposition and absorption for gas and vapour compounds of nickel. ET1, anterior nasal passage; ET2, posterior nasal passage, pharynx, and larynx; BB, bronchial; bb, bronchiolar; AI, alveolar-interstitial. Percentage deposited refers to how much of the material in the inhaled air remains in the body after exhalation. Almost all inhaled gas molecules contact airway surfaces, but usually return to the air unless they dissolve in, or react with, the surface lining. The default distribution between regions is assumed: 20% ET2, 10% BB, 20% bb, and 50% AI. It is assumed that the bound state can be neglected for nickel (i.e. fb = 0). For inhaled material deposited in the respiratory tract and subsequently cleared by particle transport to the alimentary tract, the default fA values for inhaled materials are applied [i.e. the product of fr for the absorption type (or specific value where given) and the fA value for ingested soluble forms of nickel (0.05)]. Absorption parameter values for inhaled and ingested nickel. It is assumed that the bound state can be neglected for nickel (i.e. fb = 0.0). The value of sr for Type F forms of nickel (3 d−1) is element-specific. The values for Types M and S (3 d−1) are the general default values. Materials (e.g. nickel chloride) are generally listed here where there is sufficient information to assign to a default absorption type, but not to give specific parameter values (see text). For inhaled material deposited in the respiratory tract and subsequently cleared by particle transport to the alimentary tract, the default fA values for inhaled materials are applied [i.e. the product of fr for the absorption type (or specific value where given) and the fA value for ingested soluble forms of nickel (0.05)]. Default Type M is recommended for use in the absence of specific information on which the exposure material can be assigned to an absorption type (e.g. if the form is unknown, or if the form is known but there is no information available on the absorption of that form from the respiratory tract). For guidance on the use of specific information, see Section 1.1. Activity transferred from systemic compartments into segments of the alimentary tract is assumed to be subject to reabsorption to blood. The default absorption fraction fA for the secreted activity is the highest value for any form of the radionuclide (fA = 0.05).


15.2.1.1. Gases and vapours
(a) Nickel carbonyl [Ni(CO)4]
(232) Tedeschi and Sunderman (1957) measured nickel excreted in urine and faeces during two consecutive 3-d periods following inhalation of nickel carbonyl [Ni(CO)4] vapour by dogs. They estimated that most of the inhaled nickel had deposited in the respiratory tract, and that most of the deposited nickel was excreted rapidly in urine. There was high urinary excretion during the first 3-d period, but not during the second. In complementary balance studies, they concluded that ∼90% of nickel ingested in the diet was excreted in faeces and 10% in urine. They commented that as nickel carbonyl is highly reactive in the presence of oxygen, there was a possibility that it might decompose to produce colloidal nickel on the pulmonary epithelium. (233) Sunderman and Selin (1968) followed the biokinetics of 63Ni for 4 d after inhalation of 63Ni(CO)4 by rats. In complementary experiments, they followed the biokinetics of 63Ni after intravenous injection of 63Ni(CO)4 and 63Ni chloride (63NiCl2). By 4 d after intravenous injection of 63Ni(CO)4, 31% of the injected activity was excreted in urine and 38% in breath, mostly during the first day, and ∼0.5% was excreted in faeces each day. By 4 d after intravenous injection of 63Ni chloride, 90% of the injected activity was excreted in urine, mostly during the first day, and ∼1% was excreted in faeces each day. After inhalation of 63Ni(CO)4, similar amounts were excreted in urine and faeces: ∼13% of the estimated amount inhaled in 1 d and 25% by 4 d. At 1 d, ∼25% of the estimated amount inhaled was retained in the body, mainly distributed in soft tissues. The authors noted that contamination of the pelt with 63Ni(CO)4 resulted in rats ingesting an indeterminate amount of 63Ni by preening, and also made it impractical to measure excretion in exhaled breath. Following inhalation, there was greater excretion in faeces and retention in the respiratory and alimentary tracts than following intravenous injection, probably because of retention of inhaled nickel in the former, and retention of ingested nickel (from preening) in the latter. (234) Using autoradiography, Oskarsson and Tjälve (1979) studied the distribution of 63Ni at times up to 1 d after inhalation of 63Ni(CO)4 by mice. In complementary experiments, they studied the distribution of 63Ni and 14C after intravenous injection of 63Ni carbonyl, and inhalation and intravenous injection of Ni(14CO)4. After inhalation of 63Ni(CO)4, the highest concentrations of 63Ni were found in the respiratory tract, but high levels were also reported in a variety of other tissues, notably the brain and spinal cord. A broadly similar distribution was seen after intravenous injection of 63Ni(CO)4. After intravenous injection or inhalation of Ni(14CO)4, the highest concentrations of 14C were in blood, indicating that decomposition of Ni(CO)4, followed by formation of 14CO–haemoglobin, took place. (235) The experimental data indicate that following inhalation of nickel carbonyl, a large fraction is deposited in the respiratory tract, and most of the deposit is absorbed rapidly into blood. However, there is insufficient information to determine specific parameter values. The general defaults for gases and vapours are therefore adopted here: 100% total deposition in the respiratory tract (regional deposition 20% ET2, 10% BB, 20% bb, and 50% AI) with Type F absorption. It seems possible that the systemic behaviour of nickel absorbed following inhalation of the carbonyl may differ from the model assumed for nickel in this publication; in particular, some may be lost in breath, but this would probably lead to reduction in effective dose per intake.
15.2.1.2. Particulate aerosols
(a) Nickel chloride (NiCl2)
(236) Clary (1975) measured the tissue distribution of 63Ni at 6 h, 1 d, and 3 d after intratracheal instillation of a large mass (1 mg) of 63Ni-labelled 63NiCl2 into rats. There was rapid absorption and excretion of 63Ni. The author noted that by 3 d, 90% of the instilled nickel had been excreted, mainly in urine (75%), but no other excretion data were reported. At 6 h, the concentration was higher in the kidneys than the lungs, but subsequent clearance from the lungs was slower than from other tissues. The results are consistent with assignment to Type F. No analysis was conducted here because the studies below were considered to provide more reliable biokinetic information, being of longer duration and involving much lower masses. (237) English et al. (1981) followed the biokinetics of 63Ni after intratracheal instillation of a low mass (6 µg) of 63Ni-labelled 63NiCl2 (or 63NiO, see below) into rats. Tissue distributions were measured at times between 0.5 h and 90 d. There was rapid clearance from the lungs to other tissues, and to excretion, mainly in urine. Analysis here gave fr = 0.98, sr = 33 d−1 (Tb = 0.021 d), ss = 0.07 d−1 (Tb = 10 d), and assignment to Type F. (238) Carvalho and Ziemer (1982) followed the biokinetics of 63Ni after intratracheal instillation of a low mass (1 µg) of 63NiCl2 into rats. Tissue distributions were measured at times between 35 min and 21 d. The authors fit lung retention with a three-component exponential function with ∼60%, ∼37%, and ∼4% ILD retained with Tb of ∼0.03, ∼1, and ∼3 d, respectively. Although lung clearance was rapid, the highest concentration of 63Ni was found in the lungs at all times. Approximately 75% ILD was excreted at 1 d and >99% at 21 d, mostly in urine. Analysis here gave fr = 0.81, sr = 24 d−1 (Tb = 0.03 d), ss = 0.24 d−1 (Tb = 3 d), and assignment to Type F. (239) Graham et al. (1971) measured nickel concentrations in the lungs and spleen at times up to 4 d after inhalation of (stable) NiCl2 by mice. Concentrations of nickel in the lungs, but not in the spleen, were significantly higher than in controls at all times. Lung retention at 4 d was <30% ILD. Analysis here, assuming a single phase of dissolution (fr = 1.0), gave a reasonable fit to the data with sr = 0.36 d−1 (Tb = 2 d). A better fit was obtained with fr = 0.1, sr poorly defined but of the order of 10 d−1 (Tb = 0.1 d), and ss = 0.3 d−1 (Tb = 2 d). The values of sr and ss are similar to those obtained from the results of the instillation experiments above (English et al., 1981; Carvalho and Ziemer, 1982), but the value of fr is much lower. It is possible that the faster uptake after instillation is an artefact of that method of administration, but it could be due to other reasons. (240) Although specific parameter values for nickel chloride based on in-vivo data are available, they are not adopted here because of the wide range in values of fr, and because inhalation exposure to it is unlikely. Instead, nickel chloride is assigned to Type F. However, with the data on nickel sulphate, the results contribute to the selection of the default rapid dissolution rate for nickel, and the basis for bound-state parameter values for nickel (see below).
(b) Nickel sulphate (NiSO4.6H2O)
(241) Benson et al. (1993, 1995c) followed the biokinetics of 63Ni after inhalation of 63Ni-labelled NiSO4.6H2O by cynomolgus monkeys. The aim, as with parallel experiments on nickel subsulphide and oxide inhaled by monkeys (see below), was to aid in the extrapolation to man of the results of more comprehensive toxicokinetic studies in rodents. Tissue distributions were measured within 1 h of exposure and at times up to 30 d. Nickel cleared rapidly from the lungs and body: by 30 d, ∼1% of the initial body burden (IBB: sum of 63Ni in all tissues and excreta) remained in the body, measurable only in the lungs and kidneys. The authors represented lung retention by a two-component exponential function with ∼96% and 4% IBB retained with Tb of 0.2 and 10 d, respectively. They noted the possibility that the slower phase might be due to binding of nickel to tissue. However, it was found that a large fraction of 63Ni retained in the lungs could be removed by lavage at all times, indicating that it was not bound to lung structures. Analysis here, assuming a single phase of dissolution (fr = 1.0), gave a reasonable fit to the data with sr = 0.29 d−1 (Tb = 2.4 d). A much better fit was obtained with fr = 0.94, sr = 2.7 d−1 (Tb = 0.3 d), and ss = 0.13 d−1 (Tb = 5 d). The values of sr and ss are similar to those obtained from the results of the parallel study of 63Ni-labelled Ni3S2 inhaled by monkeys (see below), although fr was lower (0.14) for Ni3S2. Simultaneous analysis of both, with sr and ss optimised as shared parameters, gave fr = 0.95, sr = 2.6 d−1 (Tb = 0.3 d), and ss = 0.11 d−1 (Tb = 6 d) for NiSO4. These values are similar to those obtained by the authors to describe overall lung retention, and give assignment to Type F. (242) Benson et al. (1991) measured the tissue distribution of 63Ni in rats at times up to 64 d after inhalation of 63Ni-labelled NiSO4.6H2O. It was reported that clearance of 63Ni from the body was rapid, with <1% IBB remaining in the rats at 10–13 d. In general, respiratory tract tissues, especially the lungs, had the highest nickel concentrations. However, by 20 d, <0.1% IBB remained in the lungs: a single component exponential fit gave Tb of ∼1 d. Few details are given, insufficient to estimate parameter values, although the information indicates that fr and sr are ∼1.0 and ∼1 d−1, respectively, with assignment to Type F. (243) Benson et al. (1992, 1995a,c) investigated the effects on lung clearance of repeated inhalation exposure of rats and mice to NiSO4.6H2O (and to NiO – see below). Animals were exposed (whole body) for 6 months to NiSO4.6H2O at concentrations of 0, 0.12, and 0.5 mg m−3 (rats) or 0, 0.25, and 1 mg m−3 (mice). At 2 or 6 months from the start of exposure, subgroups (A and C) inhaled 63NiSO4.6H2O, and 63Ni tissue distributions were measured at times up to 32 d. Repeated inhalation of NiSO4.6H2O did not result in accumulation of nickel in the lungs of either rats or mice, and did not impair the clearance of inhaled 63NiSO4.6H2O. The authors represented lung retention by a two-component exponential function. In rats, >99% ILD was retained with Tb of 2.0–2.9 d, with no measurable clearance of the remaining <0.5% ILD. In mice, 78–96% ILD was retained with Tb of ∼1.5 d, and the rest with Tb of ∼5 d. A large fraction of 63Ni retained in the lungs could be removed by lavage at all times, indicating that it was not bound to lung structures. The information indicates that fr and sr are ∼0.9 and ∼0.5 d−1, respectively, broadly similar to that in monkeys (see above) with assignment to Type F. (244) Medinsky et al. (1987) followed the biokinetics of 63Ni in rats at times up to 4 d after intratracheal instillation of 63Ni-labelled NiSO4.6H2O at three mass levels of stable nickel: 17, 190, or 1800 nmol nickel. There was rapid clearance from the lungs to blood. At the lowest mass, ∼50% ILD remained in the lungs. Lung retention from 1 to 4 d was represented by a single exponential function with Tb of 1.5 d. At higher masses, lung clearance was faster, the slower-clearing phase was smaller, and Tb was shorter. The authors considered that this suggested that potential binding sites for nickel in lung tissue or carrier-mediated clearance mechanisms for nickel were becoming saturated, resulting in more rapid clearance at higher masses due to diffusion of nickel ions. (245) Hirano et al. (1994) measured the lung retention of nickel in rats at times up to 14 d after intratracheal instillation, and 7 d after inhalation of (stable) NiSO4. Lung retention as a fraction of ILD was represented by a single exponential function with Tb = 1.3 d in both experiments. By the end of the experiments, nickel concentrations in the lungs had returned to control levels; however, a small slowly clearing component, as seen in some studies using 63Ni tracer, would not have been detectable against the background. (246) The dissolution parameter values derived above for the study in monkeys are broadly supported by the results of the rodent studies outlined. Although specific parameter values for nickel sulphate based on in-vivo data are available, they are not adopted here because they are close to those for Type F, and inhalation exposure to it is unlikely. Instead, nickel sulphate is assigned to Type F. However, with the data on nickel chloride, the results contribute to the selection of the default rapid dissolution rate for nickel, and the basis for bound-state parameter values for nickel (see below).
(c) Nickel monosulphide (NiS)
(247) Tanaka et al. (1988) measured tissue distributions of nickel in rats at times up to 76 h after inhalation of (stable) amorphous nickel monosulphide, NiS(A). Nickel cleared rapidly from the lungs with Tb estimated by the authors at 20 h (0.83 d). Analysis here (assuming fr = 1.0) gave a good fit to both lung and kidney data with sr = 0.74 d−1 (Tb = 0.94 d), in agreement with the authors’ estimate of lung retention and assignment to Type F. (248) Kuehn and Sunderman (1982) measured in-vitro dissolution rates in water, rat serum, and renal cytosol over 3 d for 17 nickel compounds. Results are only given here for those compounds for which in-vivo studies are included. Results were expressed as dissolution half-times: in the case of amorphous NiS, between 19 and 34 d, which is longer than observed by Tanaka et al. (1988) in vivo. (249) Although specific parameter values for nickel monosulphide based on in-vivo data are available, they are not adopted here because they are close to those for Type F, and inhalation exposure to it is unlikely. Instead, nickel monosulphide is assigned to Type F.
(d) Nickel subsulphide (Ni3S2)
(250) Benson et al. (1993, 1995c) followed the biokinetics of 63Ni after inhalation of 63Ni-labelled Ni3S2 by cynomolgus monkeys. The aim, as with parallel experiments with nickel sulphate (see above) and oxide (see below) inhaled by monkeys, was to aid in the extrapolation to man of the results of more comprehensive toxicokinetic studies in rodents. Tissue distributions were measured within 1 h of exposure and at times up to 16 d. Nickel cleared rapidly from the lungs, but not as rapidly as for nickel sulphate (see above), and there was less distribution to other tissues: by 16 d, ∼10% IBB remained in the body, mostly in the lungs. The authors represented lung retention (as a fraction of IBB) by a single exponential function with Tb of ∼4 d. It was found that a large fraction of 63Ni retained in the lungs could be removed by lavage at all times, indicating that it was not bound to lung structures. Analysis here, assuming a single phase of dissolution (fr = 1.0), gave a reasonable fit to the data with sr = 0.13 d−1 (Tb = 6 d): this is similar to the value obtained by the authors to describe overall lung retention. A much better fit was obtained with fr = 0.14, sr = 6 d−1 (Tb = 0.11 d), and ss = 0.11 d−1 (Tb = 6 d). The values of sr and ss are similar to those obtained from the results of the parallel study of 63Ni-labelled NiSO4 inhaled by monkeys (see above), although fr was higher (0.94) for NiSO4. Simultaneous analysis of both, with sr and ss optimised as shared parameters, gave fr = 0.11, sr = 2.6 d−1 (Tb = 0.3 d), and ss = 0.11 d−1 (Tb = 6 d) for Ni3S2, and assignment to Type F. (251) Benson et al. (1994) followed the biokinetics of 63Ni for 64 d after inhalation of 63Ni-labelled nickel subsulphide (63Ni3S2) by rats. There was rapid lung clearance and distribution to extrarespiratory tract tissues and urine. The authors represented lung retention (as a fraction of IBB) by a single exponential function with Tb = 4.6 d, similar to the result above for monkeys. This indicates that fr and sr are ∼1.0 and ∼0.15 d−1, respectively, with assignment to Type F. (252) Benson et al. (1995b) measured lung content of nickel in rats at times between 1 and 22 d after the start of a programme of repeated (6 h d−1) inhalation exposure of rats to (stable) Ni3S2. Nickel concentrations in the lungs increased rapidly over the first 7 d of exposure and less rapidly, if at all, thereafter. From the rate of accumulation of nickel, the authors calculated the lung retention Tb to be in the range of 3.5–8 d, consistent with the value of ∼5 d reported for similar rats after acute inhalation of 63Ni3S2 (Benson et al., 1994). The lack of further accumulation beyond 7 d also confirms the absence of a significant slow phase (i.e. fr = 1.0). (253) Valentine and Fisher (1984) followed the biokinetics of 63Ni for 32 d after intratracheal administration of 63Ni-labelled Ni3S2 to mice. The authors represented lung retention (after the initial rapid clearance) by a two-component exponential function, with ∼38% and 42% ILD retained with Tb of ∼1.2 and 12 d, respectively. (254) Kuehn and Sunderman (1982) measured in-vitro dissolution rates over 3 d for 17 nickel compounds in water, rat serum, and renal cytosol. Results were expressed as dissolution half-times: in the case of Ni3S2, this ranged between 21 d and >11 y, longer than observed in the in-vivo studies above. (255) The dissolution parameter values derived above for the study in monkeys are broadly supported by the results of the rodent studies outlined. Although specific parameter values for nickel subsulphide based on in-vivo data are available, they are not adopted here because inhalation exposure to it is unlikely. Instead, nickel subsulphide is assigned to Type F.
(e) Nickel hydroxide [Ni(OH)2 (nanoparticles)]
(256) Gillespie et al. (2010) and Kang et al. (2011a,b) investigated the pulmonary toxicity of (stable) nickel hydroxide nanoparticles (nano-NH, 5-nm primary particles produced by arc discharge between nickel electrodes) inhaled (whole-body) by mice, and made limited measurements of lung deposition and clearance. Gillespie et al. (2010) measured the nickel lung content at 24 or 48 h after a 4-h inhalation exposure, or 1 d after repeated exposures for 1 week, 3 months, or 5 months. The authors estimated that after the single exposure, ∼50% ILD cleared within 24 h, most likely via the mucociliary escalator, and a further 10–20% ILD by 48 h. They estimated Tb to be of the order of 1 d, due mainly to dissolution. This was supported by the results of in-vitro dissolution tests in which ∼90% dissolved in 24 h. However, following repeated exposures, nickel content of the lungs increased with exposure duration, indicating greater lung retention. (257) Kang et al. (2011a) compared the nickel lung content in mice at 0.5 and 24 h after a 4-h inhalation exposure to (stable) nano-NH or to NiSO4.6H2O nanoparticles [count median diameter (CMD) 40 nm, produced by nebulising a dilute solution and drying the droplets]. For both materials, retention at 24 h was ∼55% of that at 0.5 h, suggesting similar dissolution rates in the lungs, even though nano-NH dissolved much more slowly in water than NiSO4.6H2O. The results suggest Tb to be of the order of 1 d, which is consistent with the estimates above from more detailed studies of NiSO4.6H2O. (258) Kang et al. (2011b) measured the tissue distribution of nickel 24 h after inhalation of (stable) nano-NH for either 1 week or 5 months. The average mass of nickel in the lungs of the 5-month group was several times that in the 1-week group, showing that accumulation continued. No significant difference was found from control animals in nickel content of any other tissue measured: liver, heart, spleen, and whole blood. Overall, the results indicate Type F or M behaviour, but there is insufficient information to distinguish between the two.
(f) Nickel metal
(259) Serita et al. (1999) followed lung retention of (stable) nickel in rats for up to 84 d after 5-h whole-body inhalation exposure to (stable) ultrafine metallic nickel (Uf-Ni) at three concentrations: 0.15, 1.14, and 2.54 mg m−3. The Tb for nickel in the lungs was similar in the three groups, between 28 and 39 d. The authors observed that this was shorter than for NiO, perhaps because of higher solubility in physiological media. The results indicate Type M or S behaviour. (260) Oller et al. (2008) exposed rats (whole body; 6 h d−1, 5 d week−1) to (stable) metallic nickel particles (0, 0.1, 0.4, and 1.0 mg m−3) for up to 24 months. Nickel levels in the lungs measured at 3, 6, 12, and 24 months indicated that steady-state levels were reached by 12 months. Nickel levels in blood measured at 3 and 6 months also suggested that steady-state levels were reached by 12 months. The results, notably detectable nickel in blood, indicate Type M behaviour. (261) Kuehn and Sunderman (1982) measured in-vitro dissolution rates over 3 d for 17 nickel compounds in water, rat serum, and renal cytosol. Results were expressed as dissolution half-times: in the case of nickel metal, this ranged between 8.4 y and >11 y, indicating Type S behaviour. (262) The lung retention half-times measured by Serita et al. (1999) suggest Type M or S behaviour. The study by Oller et al. (2008) is the only study available in full with measurements related to systemic uptake. The detectable levels of nickel suggest Type M behaviour, and nickel metal is assigned to Type M.
(g) Nickel oxide (NiO)
(263) Benson et al. (1993, 1995c) followed the biokinetics of 63Ni after inhalation by cynomolgus monkeys of 63Ni-labelled NiO [NiO(G), ‘green’ oxide calcined at 1200℃ for 1 h]. The aim, as with parallel experiments with nickel sulphate and subsulphide inhaled by monkeys (see above), was to aid in the extrapolation to man of the results of more comprehensive toxicokinetic studies in rodents. Tissue distributions were measured within 1 h of exposure and at times up to 200 d. After rapid clearance from the upper respiratory tract, clearance from the lung was very slow with the lung Tb estimated at >200 d. Nickel was detected in the trachea and tracheal bifurcation after the first measurement; analysis here showed that particles in transit from the alveolar region could account for it. Little 63Ni dissolved in the lungs and deposited in tissues outside the respiratory tract. Analysis here was limited by the small amounts absorbed. With sr fixed at the general default value for Type M and S materials of 3 d−1, analysis here gave fr = 0.002 and ss ∼5 × 10⁻⁶ d−1, but not well defined, with an upper limit of ∼4 × 10⁻⁵ d−1. These values give assignment to Type S, and are lower than the default values for Type S. (264) Benson et al. (1992, 1995a,c) investigated the effects on lung clearance of repeated inhalation exposure of rats and mice to NiO [NiO(G), ‘green’ oxide calcined at 1200℃] (and to NiSO4.6H2O – see above). Animals were exposed (whole body) for 6 months to NiO at concentrations of 0, 0.62, and 2.5 mg m−3 (rats) or 0, 1.25, and 5 mg m−3 (mice). At 2 or 6 months from the start of exposure, subgroups inhaled 63NiO, and 63Ni tissue distributions were measured at times up to 200 d. Repeated inhalation of NiO resulted in accumulation of nickel in the lungs of both rats and mice, and impaired the clearance of 63NiO inhaled subsequently. The authors represented lung retention by two-component exponential functions. In rats sham-exposed (0 mg NiO m−3) for 2 months, 92% ILD was retained with Tb of 33 d, with negligible clearance of the remaining 8% ILD. In mice sham-exposed for 2 months, 80% and 20% ILD was retained with Tb of 10 d and 77 d, respectively. After 63NiO exposure, no 63Ni was detected in blood, liver, kidneys, or carcass of any rat, nor in blood, liver, or kidneys of any mouse. All the results are consistent with assignment to Type S. (265) Benson et al. (1994) followed the biokinetics of 63Ni for 180 d after inhalation of 63Ni-labelled NiO [NiO(G), ‘green’ oxide calcined at 1200℃] by rats. The authors represented lung retention (as a fraction of IBB) by a single exponential function with Tb = 120 d. Little 63Ni dissolved in the lungs, and none was detected in tissues outside the respiratory tract. Excretion was only detectable in faeces, and most occurred in the first few days. The results give assignment to Type S. (266) Wehner and Craig (1972) followed the tissue distribution of nickel in Syrian golden hamsters for 155 d after 2 d (7 h d−1) of inhalation of (stable) nickel oxide. This deposition and clearance study complemented 3-week and 3-month inhalation toxicity studies. Nickel cleared slowly from the lungs, as expected for an insoluble material: ∼50% ILD remained after 45 d. No significant quantities of nickel were found in the liver, kidneys, or carcass at any time after exposure, indicating that absorption was negligible, and indicating Type S behaviour. (267) Hochrainer et al. (1980) followed lung retention of nickel in rats for 100 d after inhalation of (stable) nickel oxide. The authors represented lung retention by a two-component exponential function with 21% and 79% ILD retained with Tb of 0.82 d and 36.5 d, which they attributed to bronchial and alveolar clearance, respectively. No measurements of nickel were reported in excreta or other tissues, but lung retention appears typical of insoluble particles, indicating Type S behaviour. (268) English et al. (1981) followed the biokinetics of 63Ni after intratracheal instillation into rats of 63Ni-labelled 63NiO, prepared by heating the hydroxide at 250℃ – conversion was incomplete (or to 63NiCl2, see above). Tissue distributions were measured at times between 0.5 h and 90 d. There was slow transfer from the lungs to other tissues, and high retention in the lungs and associated lymph nodes. Analysis here (with sr fixed at the general default value for Type M and S materials of 3 d−1) gave fr = 0.6, ss = 0.005 d−1, and assignment to Type M. (269) Tanaka et al. (1985) measured tissue distributions of nickel in rats at 12 and 20 months after 140 h (7 h d−1 for 1 month) of inhalation of (stable) green nickel oxide, NiO(G), with AMAD of 1.2 µm; and at 0 and 12 months after a similar exposure with AMAD of 4.0 µm. The authors represented lung retention by a single exponential function, with Tb = 350 d and 640 d for the 1.2-µm and 4-µm aerosols, respectively. These are high values for insoluble particles in rats, suggesting some impairment of clearance. Some increase in nickel concentrations at the later times was observed in the liver and spleen, but not in the kidneys, indicating Type M or S behaviour. (270) Kuehn and Sunderman (1982) measured in-vitro dissolution rates over 3 d for 17 nickel compounds in water, rat serum, and renal cytosol. Results were expressed as dissolution half-times: in the case of NiO, this was >11 y in all three media, indicating Type S behaviour. (271) In most studies, no nickel (stable or 63Ni) tracer was detected in systemic tissues following deposition in the lungs. Analysis is limited by the small amounts absorbed, and in most cases would only give upper limits on parameter values. Greater dissolution observed in other studies suggests that its in-vivo behaviour varies with the method of particle preparation. Nickel oxide is therefore assigned to Type S.
15.2.1.3. Rapid dissolution rate for nickel
(272) Nickel sulphate (NiSO4.6H2O) is the most extensively studied form of nickel that is soluble in biological fluids. Analysis of the results of the study in which it was inhaled by cynomolgus monkeys gave fr = 0.95, sr = 2.6 d−1 (Tb = 0.3 d), and ss = 0.11 d−1 (Tb = 6 d). Analysis here, assuming a single phase of dissolution (fr = 1.0), gave a reasonable fit to the data with sr = 0.3 d−1 (Tb = 2 d). Studies in which NiSO4.6H2O was administered to rats and mice by inhalation or intratracheal instillation gave similar results. The two studies in which nickel chloride was administered to rats by intratracheal instillation gave higher values of sr (∼30 d−1). However, the one study in which nickel chloride was administered by inhalation (to mice) did not support such rapid overall dissolution. Based mainly on the results of the study of nickel sulphate inhaled by monkeys, a value for sr of 3 d−1 is applied here to all Type F forms of nickel.
15.2.1.4. Extent of binding of nickel to the respiratory tract
(273) The possibility of nickel binding to lung structures has been noted in several of the reports describing the studies above with soluble forms. For example, following inhalation of 63Ni-labelled NiSO4.6H2O by cynomolgus monkeys, Benson et al. (1995c) represented lung retention by a two-component exponential function with ∼96% and 4% IBB retained with Tb of ∼0.2 and ∼10 d, respectively. They noted the possibility that the slower phase might be due to binding of nickel to tissue for several days. However, it was found that a large fraction of 63Ni retained in the lungs could be removed by lavage at all times, indicating that it was not all bound to lung structures. Medinsky et al. (1987) observed that after intratracheal instillation of 63Ni-labelled NiSO4.6H2O, lung clearance was faster at higher masses, and this suggested that potential binding sites for nickel in lung tissue or carrier-mediated clearance mechanisms for nickel were becoming saturated, resulting in more rapid clearance at higher masses due to diffusion of nickel ions. However, for the most soluble forms (e.g. chloride or sulphate), the possible bound fraction and associated Tb are both small, and it is therefore assumed here that the bound state can be neglected for nickel (i.e. fb = 0.0).
15.2.2. Ingestion
(274) Nickel absorption studies were reviewed in Publications 30 and 67 (ICRP, 1981, 1993), by the International Agency for Research on Cancer (IARC, 1990), by the United Nations International Programme on Chemical Safety (1991), by the Nickel Producers Environmental Research Association (NiPERA, 1996), by Toxicology Excellence for Risk Assessment for the Metal Finishing Association of Southern California, the United States Environmental Protection Agency and Health Canada (TERA, 1999), by the United States Agency for Toxic Substances and Disease Registry (ATDSR, 2005a), and by the Danish Environmental Protection Agency (2008). (275) Ingested nickel is transported through the membrane of the intestinal epithelium into the interstitial areas proximal to capillaries, although the specific mechanism is not exactly known. Specific transport processes may control the manner by which nickel is absorbed from the lumen and transported into the interstitial space. The absorption and secretion of nickel by the jejunum of rats occurs by transmembrane diffusion (Foulkes and McMullen, 1986). Refvik and Andreassen (1995) investigated the surface binding and uptake of Ni2+ in human kidney epithelial cells and found that calcium ionophore potentiated nickel uptake into cells, suggesting that nickel may be transported via Ca2+ channels. The third mechanism of nickel uptake is the phagocytosis of particulate nickel or nickel compounds (Heck and Costa, 1982; Kuehn et al., 1982).
15.2.2.1. Controlled human ingestion studies
(276) Information on nickel absorption in the alimentary tract is available from several controlled studies of adult human volunteers ingesting nickel in food or drinking water, with or without fasting. Menne et al. (1978) studied nickel excretion in urine for 3 d after oral administration of 5.6 mg as the sulphate to six female and seven male volunteers, aged 29–64 y, with psoriasis or leg ulcers. Analysis here gave a mean absorbed fraction of 0.02 with a range from 0.003 to 0.05. Christensen et al. (1979) measured nickel concentration in the serum of three male and nine female healthy volunteers, aged 20–35 y, 2 h after ingestion of 5.6 mg as the sulphate in lactose. Analysis here indicated mean fractional absorption of 0.05 with a range from 0.004 to 0.2. Christensen and Lagesson (1981) performed another similar study with six female and two male healthy volunteers, aged 21–32 y, and monitored nickel in whole blood for 4 h post ingestion and in 24-h urine. The peak level of nickel in blood occurred 2.5 h after ingestion, and the maximum urinary excretion occurred in the first 8 h after ingestion. Analysis here gave a mean fractional absorption of 0.07 with a range from 0.007 to 0.2. (277) Solomons et al. (1982) investigated the influence of diet on nickel absorption. Healthy adult subjects were orally given 5 mg of nickel as sulphate hexahydrate in water following overnight fasting. Plasma nickel concentration was monitored for 4 h post ingestion in five subjects and for up to 24 h post ingestion in one subject. Analysis here gave a mean fractional absorption of 0.2 with a range from 0.1 to 0.3. When nickel was given with a typical Guatemalan meal, the observed fractional absorption was only 0.02. No absorption of nickel given with a North American breakfast was observed. Food constituents, possibly phosphate, phytate, fibres, and similar metal-ion-binding components, may bind nickel and make it much less available for absorption than nickel dissolved in water and ingested on an empty stomach. Nickel absorption also appeared to be significantly reduced after ingestion of cow’s milk, coffee, tea, orange juice, and ascorbic acid, but less so after ingestion of Coca Cola or phytic acid. Disodium EDTA depressed plasma nickel below the level observed in fasting controls. Sunderman et al. (1989) monitored nickel concentration in serum, urine, and faeces of 10 healthy volunteer subjects (six men, four women, aged 22–55 y) for 1 d before and 4 d after ingestion of 12–50 µg of nickel per kg body mass. The subjects had fasted for 12 h prior to nickel ingestion and intake was followed by an additional 3-h fasting period. Nickel was given as the sulphate either with drinking water or with a standard North American breakfast. The authors estimated absorbed fractions of ∼0.01 for nickel in food and ∼0.3 for nickel in drinking water. (278) Hindsen et al. (1994) measured nickel concentrations in blood and urine of 52 female patients with five different types of eczema 3 h and 24 h, respectively, after ingestion of 1 mg of nickel as the sulphate in lactose. The subjects fasted for at least 8 h before and 1 h after nickel ingestion. Analysis here gave fractional absorption of ∼0.09, with a range from 0.07 to 0.13, for the five groups of patients with the same type of eczema. Repeated oral administration of nickel sulphate might decrease intestinal absorption (Santucci et al., 1994). Patriarca et al. (1997) measured nickel concentrations in blood, urine, and faeces of four healthy adult human subjects up to 5 d after ingestion of 10 µg of 62Ni as the metal diluted in water per kg body mass. The subjects fasted overnight before and 2.5 h after the isotope ingestion. The mean observed absorption fraction of ingested nickel was 0.3, with a range up to 0.4. Nielsen et al. (1999) have reported values of fractional gastrointestinal absorption for eight healthy adult male volunteers of 0.3 when administered in water after 4 h of fasting, 0.09 after 1.5 h of fasting, 0.04 when administered at the same time as food, 0.1 when administered after 12 h of fasting and 0.5 h before a meal, 0.2 when administered after 12 h of fasting and 1 h before a meal, and 0.03 when nickel is mixed with a meal. In 40 adult women with vesicular hand eczema who had ingested nickel in water after 12 h of fasting and 4 h before a meal, Nielsen et al. (1999) observed absorption of a fraction of ∼0.1 of intake.
15.2.2.2. Accidental and environmental human exposure studies
(279) Complementary information is brought by studies of environmental balance and accidental exposure. However, this is assumed to be less reliable for the estimation of absorption fraction as intake is more difficult to assess with precision. Tipton et al. (1966) monitored trace elements in diet, urine, and faeces of two, male and female, human subjects aged 34 and 35 y. The comparison of intake and urinary excretion averaged over 1 month indicated fractional absorption of the order of 0.5. Similarly, an American hospital reported values of intake and excretion for two patients corresponding to fractional absorption of 0.5 and 0.6 (Veterans Administration Hospital and Hines, 1976). (280) Nomoto and Sunderman (1970), McNeely et al. (1972), and Horak and Sunderman (1973) reported values of nickel concentration measured in serum, urine, and faeces of healthy adult inhabitants of Hartford, CT, USA. The ratio of daily urinary excretion measured in 50 subjects to daily faecal excretion measured in 10 subjects corresponded to fractional absorption of ∼0.01. Nodiya (1972) reported the daily ingestion intake, and urinary and faecal excretion of 10 male volunteers aged 17 y. The results indicated fractional absorption ranging from 0.09 to 0.12 with a mean of 0.1. Publication 23 (ICRP, 1975) reported values for nickel balance. The ratio between intake in food and fluids and loss in urine, sweat, and hair indicates fractional absorption ∼0.08. (281) Sunderman et al. (1988) followed the consequences of the accidental ingestion of a solution of nickel sulphate and nickel chloride by 32 workers in an electroplating plant. Nickel concentrations in serum and urine were measured for 5 d after exposure. The oral intake was estimated to range from 0.5 to 2.5 g for 20 symptomatic workers. Analysis here of the serum and urine measurement data for a subgroup of 10 heavily exposed workers admitted to hospital indicated fractional absorption of a few percent of the nickel intake. For a group of 11 other workers followed as outpatients, the estimated fractional absorption was ∼10 times lower.
15.2.2.3. Animal studies
(282) The gastrointestinal absorption of dietary nickel was also studied in a few animal experiments involving rats, calves, and dogs. These studies provide information on the absorption of specific chemical forms of nickel and for neonates. Phatak and Patwardhan (1952) investigated, over 4 d, the retention and excretion of nickel in rats fed with 25–100 mg of nickel per 100 mg of basal diet. Measurement results of nickel in food, urine, and faeces indicated fractional absorption of the order of 0.2 for nickel carbonate (24 animals) and 0.1 for nickel soap (12 animals) or finely divided nickel metal (12 animals). Tedeschi and Sunderman (1957) studied nickel balance in dogs. The ratio of nickel excreted in urine to that ingested in food indicated fractional absorption of the order of 0.06. O’Dell et al. (1971) fed 12 male calves with a basal diet supplemented with 0–1.4 g d−1 of nickel as the carbonate. The comparison of urine and faecal excretion indicated absorption of 0.02–0.05 of ingested nickel. Elakhovskaya (1972) orally administered nickel as the chloride in drinking water to rats (0.005, 0.5, or 5 mg L−1) and measured urinary and faecal excretion. The distribution between excretion pathways was consistent with fractional absorption of ∼0.04 (range 0.02–0.06). Ho and Furst (1973) studied nickel urinary excretion after either intraperitoneal injection or oral intubation of a nickel chloride solution to rats. They estimated that 3–6% of the ingested quantity reached the bloodstream. (283) A study in rats suggested gastrointestinal absorption fractions for soluble forms of nickel: 0.3 for the nitrate [Ni(NO3)2], 0.1 for the sulphate (NiSO4) and chloride (NiCl2), and 0.02 for the monosulphide (NiS). This study has also suggested gastrointestinal absorption of 0.005 for nickel subsulphide (Ni3S2) and 0.0009 for nickel metal. For gastrointestinal absorption of nickel oxide, produced at 1030℃ [NiO(G)] or at 550℃ [NiO(B)], the suggested values were 0.0001 for NiO(G) and 0.0004 for NiO(B) (Ishimatsu et al., 1995). More recent data obtained on rats fed with nickel citrate, oxalate, or chloride show gastrointestinal absorption ranging from 0.03 to 0.05 (Paquet et al., 1998). (284) In Publications 30 and 67 (ICRP, 1981, 1993), an absorption fraction of 0.05 was recommended for all ingested nickel compounds. For risk characterisation purposes, the Danish Environmental Protection Agency (2008) retained absorption fractions for nickel metal of 0.003 for fasting individuals and 0.0005 for non-fasting individuals; an absorption fraction of 0.3 for nickel sulphate, chloride, carbonate, and nitrate ingested by fasting individuals; and an absorption fraction of 0.05 for all other scenarios of ingestion exposure. (285) As indicated in Table 15.3, a value of fA = 0.05 is adopted here for nickel ingested in soluble form (carbonate, citrate, oxalate, nitrate, chloride) or in unspecified form. Values of fA = 0.01 for nickel metal and fA = 5 × 10⁻⁴ for nickel oxide are also retained here.
15.2.3. Systemic distribution, retention, and excretion of nickel
15.2.3.1. Biokinetic data
(286) The following summary of biokinetic data for nickel is taken from a review by Melo and Leggett (2017). The reader is referred to that paper for a more detailed discussion of the database and a more extensive bibliography. (287) The nickel content of the adult human body and individual tissues has been estimated from post-mortem measurements. Estimates of total-body nickel in adult humans range from ∼0.5 mg (Sunderman, 2004) to >20 mg (Zhu et al., 2010). (288) Urinary excretion is the primary route of elimination of systemic nickel (Sunderman et al., 1989; Patriarca et al., 1997). Estimates of endogenous faecal excretion of nickel vary from a few percent to ≥20% of the amount reaching blood. Nickel is also removed from the body in sweat, hair, saliva, and other typically minor excretion pathways (Sunderman, 1993). (289) The average concentration of nickel in serum is ≤0.2 µg L−1. The average concentration in urine is in the range of 1–3 µg L−1, depending on food and fluid intake and environmental factors (Templeton et al., 1994). (290) Sunderman et al. (1989) studied the biokinetics of nickel in healthy adult human subjects following acute ingestion of elevated quantities of stable nickel in water (Experiment 1) or food (Experiment 2). The concentrations of nickel in serum, urine, and faeces were determined from 2 d before to 4 d after administration of 12 (n = 4), 18 (n = 4), or 50 (n = 1) µg Ni kg−1. Normal daily intake of nickel by these subjects was of the order of 1–4 µg kg−1. In Experiment 1, the subjects fasted for 12 h before and 3 h after drinking NiSO4 dissolved in water. In Experiment 2, the subjects fasted for 12 h before ingesting a standard American breakfast containing NiSO4. Mean absorption of nickel was ∼27% of the amount ingested in water and 0.7% of the amount ingested in food. The estimated mean removal half-time of absorbed nickel from the body was 28 h. On average, urinary excretion accounted for >90% of absorbed nickel over the observation period. The estimated mean renal clearance of nickel was 8.3 mL min−1 in Experiment 1 and 5.8 mL min−1 in Experiment 2. The results of Experiment 1 are more useful than those of Experiment 2 for purposes of modelling the systemic behaviour of nickel due to the relatively small amount of administered nickel reaching blood in Experiment 2. (291) Patriarca et al. (1997) studied the behaviour of ingested nickel in four healthy adult human subjects using the stable nickel isotope 62Ni as a tracer. The subjects ingested 10 µg 62N per kg body mass, compared with their normal daily intakes of total stable nickel of ∼1–6 µg kg−1. Concentrations of 62Ni were measured in plasma, RBC, urine, and faeces up to 5 d after administration in water. The interindividual variability of results was considerably lower than in the study by Sunderman et al. (1989), in which naturally abundant nickel isotopes were administered. The investigators attributed the comparatively low variability of their data to the ability to distinguish the tracer from other sources of nickel in the tissue and fluid samples, including nickel from normal diet and nickel contamination of samples. Plasma clearance curves were consistent with the serum clearance curve generated by the Sunderman model. However, mean urinary losses of the tracer accounted for only approximately two-thirds of the absorbed amount over 5 d in the subjects of Patriarca et al. (1997), compared with a central estimate of ∼93% over 4 d in the study by Sunderman et al. (1989). The data of Patriarca et al. (1997) indicate that total-body retention at 5 d plus losses from the body by that time via pathways other than urine accounted for approximately one-third of absorbed 62Ni. Endogenous faecal excretion of 62Ni appeared to represent, at most, a few percent of absorbed 62Ni. (292) Nieboer et al. (1992) surveyed experimental and occupational data on the absorption, distribution, and excretion of nickel. They estimated a mean renal clearance of plasma nickel of 7.7 mL min−1 based on data for 26 male workers at two electrolytic refining operations. This is consistent with the estimate of 8.3 mL min−1 by Sunderman et al. (1989) based on a study involving ingestion of nickel in drinking water. Renal clearance of ∼8 mL min−1 corresponds to clearance of 3.8 plasma volumes per day based on the reference plasma volume of 3000 mL for an adult male (ICRP, 2002a). Data collected by Nieboer et al. (1992) indicate that, at typical urine flow rates, ∼30% of nickel filtered by the kidneys enters the urinary bladder content and the remainder returns to blood. (293) Information on uptake and retention of nickel by specific organs and tissues of the body comes mainly from animal studies. At early times after administration, the highest tissue concentration in laboratory animals is usually found in the kidneys. For example, at 24 h after oral administration of three soluble nickel compounds [Ni(NO3)2, NiCl2, and NiSO4] to male Wistar rats, the kidneys contained an estimated 80% of the nickel recovered in measured organs (Ishimatsu et al., 1995). Elevated concentrations at early times after administration have also been observed in the lungs, pituitary, skin, adrenals, and gonads (Parker and Sunderman, 1974; Jacobsen et al., 1978; Olsen and Jonsen, 1979). (294) Smith and Hackley (1968) measured the distribution of activity in rats over the first 72 h after intravenous administration of carrier-free 63Ni. The kidneys showed a much higher activity concentration than other tissues at all times. For example, the kidney:liver concentration ratio was in the range of 18–32 over the first 4 h, and the kidney:femur concentration ratio was 27–59 during that time. The 63Ni content of the kidneys was at least three times greater than that of the liver, and at least as much as the skeleton throughout the 72-h observation period. (295) At 1 d after intravenous administration of 63NiCl2 to rabbits, the activity concentration in the kidneys was ∼23, ∼18, and ∼29 times that in the liver, bone, and muscle, respectively (Parker and Sunderman, 1974). At 1 d after intramuscular administration of 63NiCl2 to rats, the concentration of 63Ni in the kidneys was approximately 29 times that in the liver and 86 times that in muscle (Sunderman et al., 1978). (296) Several short-term studies (days) of the behaviour of nickel in laboratory animals indicate that nickel has a low affinity for bone, but some longer-term studies (weeks or longer) indicate that a portion of nickel entering bone is removed relatively slowly compared with removal from most soft tissues. For example, following intraperitoneal injection of 63NiCl2 to adult mice, the activity concentration was greater in the kidneys than in other investigated tissues at 1–5 d after injection, but much lower than that of the skull, long bones, and incisors at 22 d (Jacobsen et al., 1978). (297) Onkelinx et al. (1973) studied the early kinetics of systemic 63Ni in rats and rabbits following intravenous injection of 63NiCl2. In rats, ∼78% of injected activity was lost in urine and 15% in faeces over 3 d. In rabbits, ∼78% of injected activity was removed in urine during the first 24 h, and biliary secretion during the first 5 h was ∼9% of the administered activity.
15.2.3.2. Biokinetic model for systemic nickel
(298) The model for systemic nickel is taken from Melo and Leggett (2017). The structure of the model is shown in Fig. 15.1. Transfer coefficients are listed in Table 15.4. (299) The model divides systemic nickel into compartments representing blood plasma, RBC, a rapid-turnover kidney compartment (Kidneys 1), a slow-turnover kidney compartment (Kidneys 2), a moderate-turnover liver compartment (Liver 1), a slow-turnover liver compartment (Liver 2), four bone compartments (cortical and trabecular surface and volume), a compartment of other soft tissues with a moderate turnover rate (ST0), and a compartment of other soft tissues with a slow turnover rate (ST1). Removal of systemic nickel from the body is assumed to occur via urine, faeces, and a third excretion pathway representing total losses in sweat, saliva, hair, and nails. (300) The reader is referred to the paper by Melo and Leggett (2017) for a detailed description of the basis of the parameter values listed in Table 15.4. Briefly, parameter values were set mainly for consistency with the following data sets:
Blood kinetics and excretion rates of nickel observed in the controlled human studies of Sunderman et al. (1989) and Patriarca et al. (1997), with preference given to results of the nickel tracer study of Patriarca et al. where data from the two studies were inconsistent. Renal clearance (plasma volumes per day) of 3.8 d−1, based on data of Nieboer et al. (1992) for occupationally exposed subjects, and data of Sunderman et al. (1989) for human subjects administered nickel in drinking water. Relative rates of nickel excretion via urine, faeces, and combined minor excretion routes, as indicated by collective findings for human subjects and laboratory animals. A typical systemic distribution of nickel in the early hours, days, and weeks after uptake to blood, as inferred from collected animal studies. The long-term distribution of nickel in the body as indicated by post-mortem measurements of nickel in human tissues. Reference trabecular and cortical bone turnover rates for adult humans (ICRP, 2002a) as estimators of the long-term rates of removal of nickel from these two types of bone. Transfer coefficients in the biokinetic model for systemic nickel. RBC, red blood cells. ST, soft tissue. ST0 and ST1 are compartments of other soft tissues representing two phases of biological removal to blood. Daily excretion of 54Mn following inhalation of 1 Bq Type F. Daily excretion of 54Mn following inhalation of 1 Bq Type M. Daily excretion of 54Mn following inhalation of 1 Bq Type S. Structure of the proposed model for systemic nickel. UB, urinary bladder; RBC, red blood cells; SI, small intestine. ST, soft tissue. ST0 and ST1 are compartments of other soft tissues with fast and intermediate turnover, respectively.
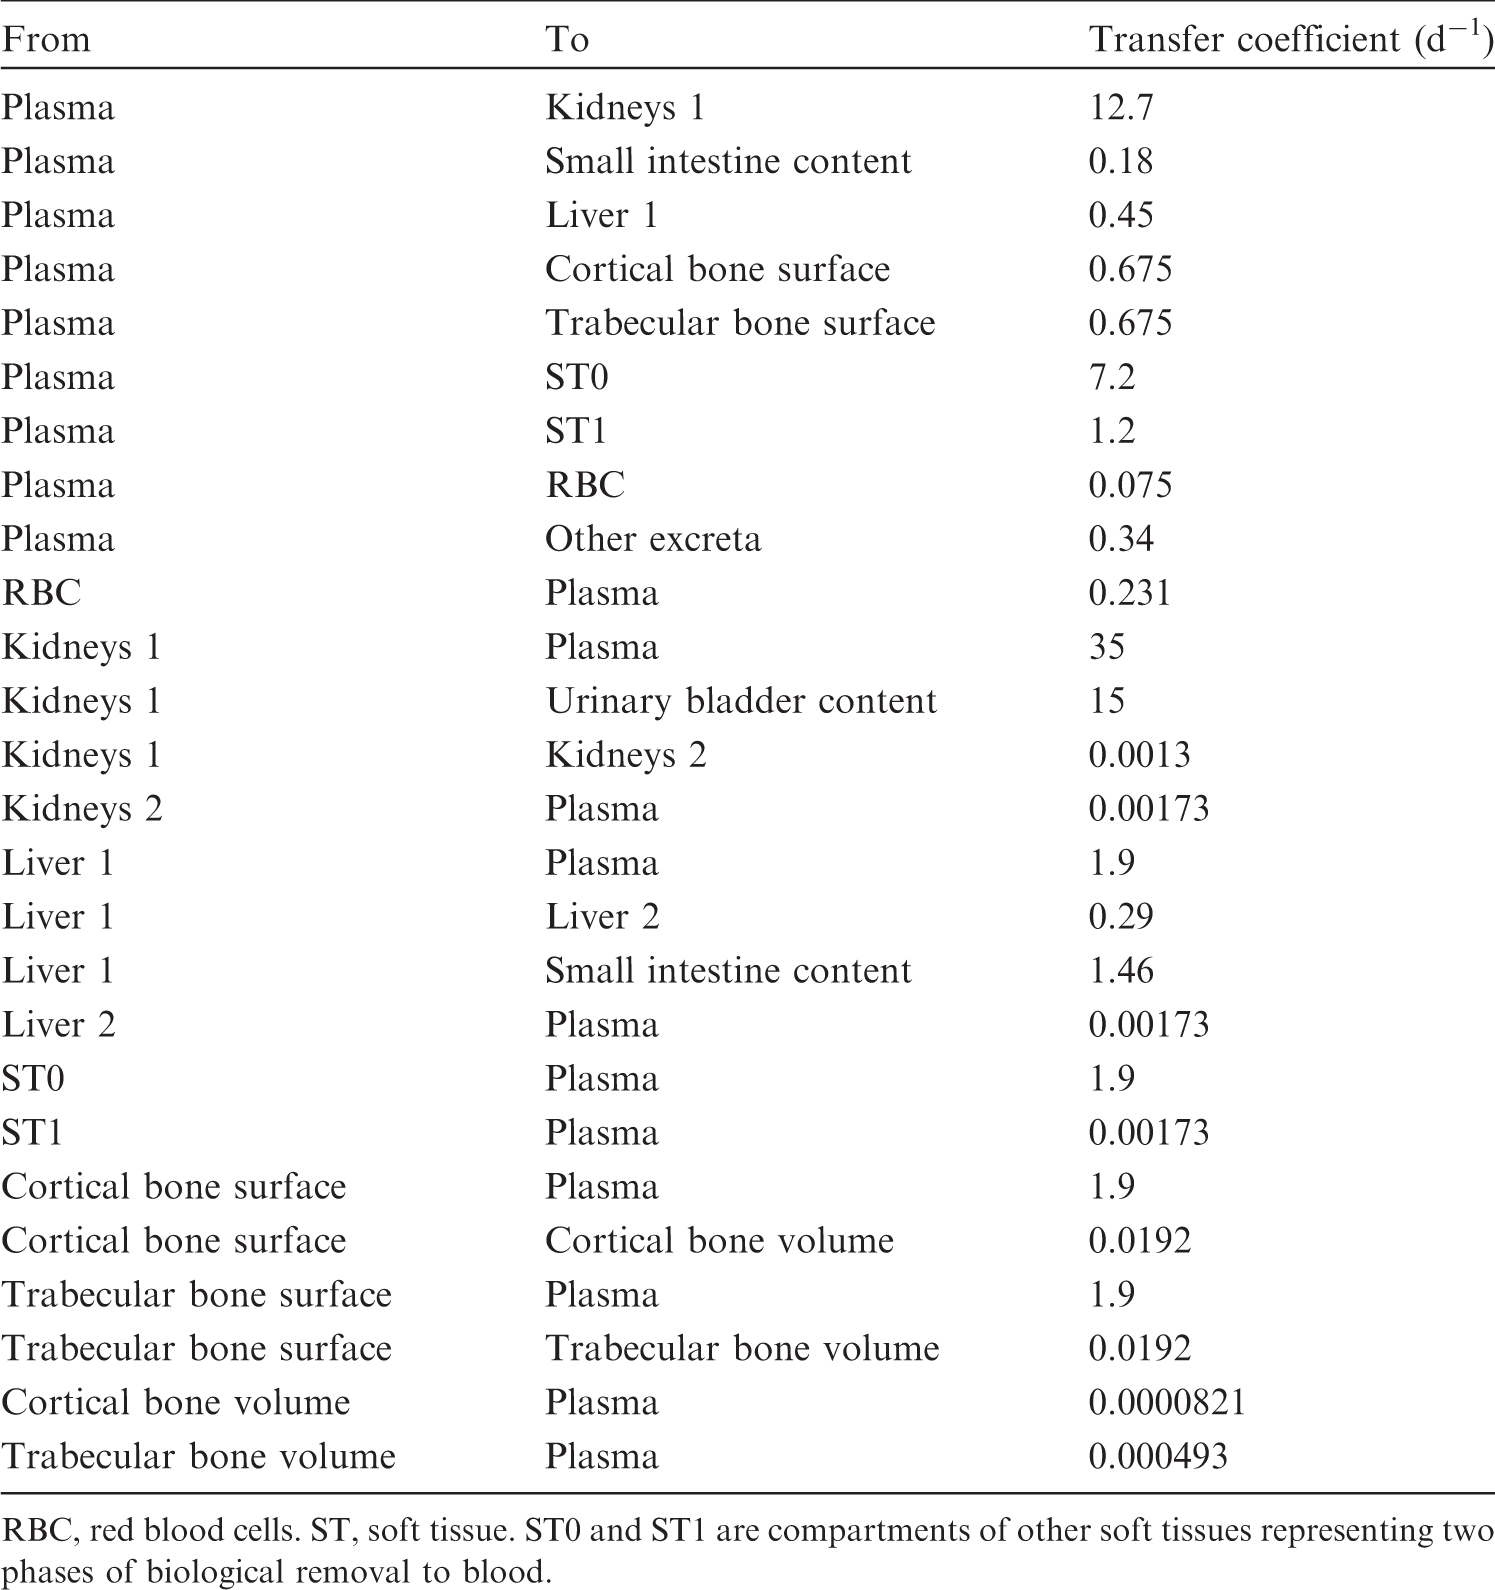
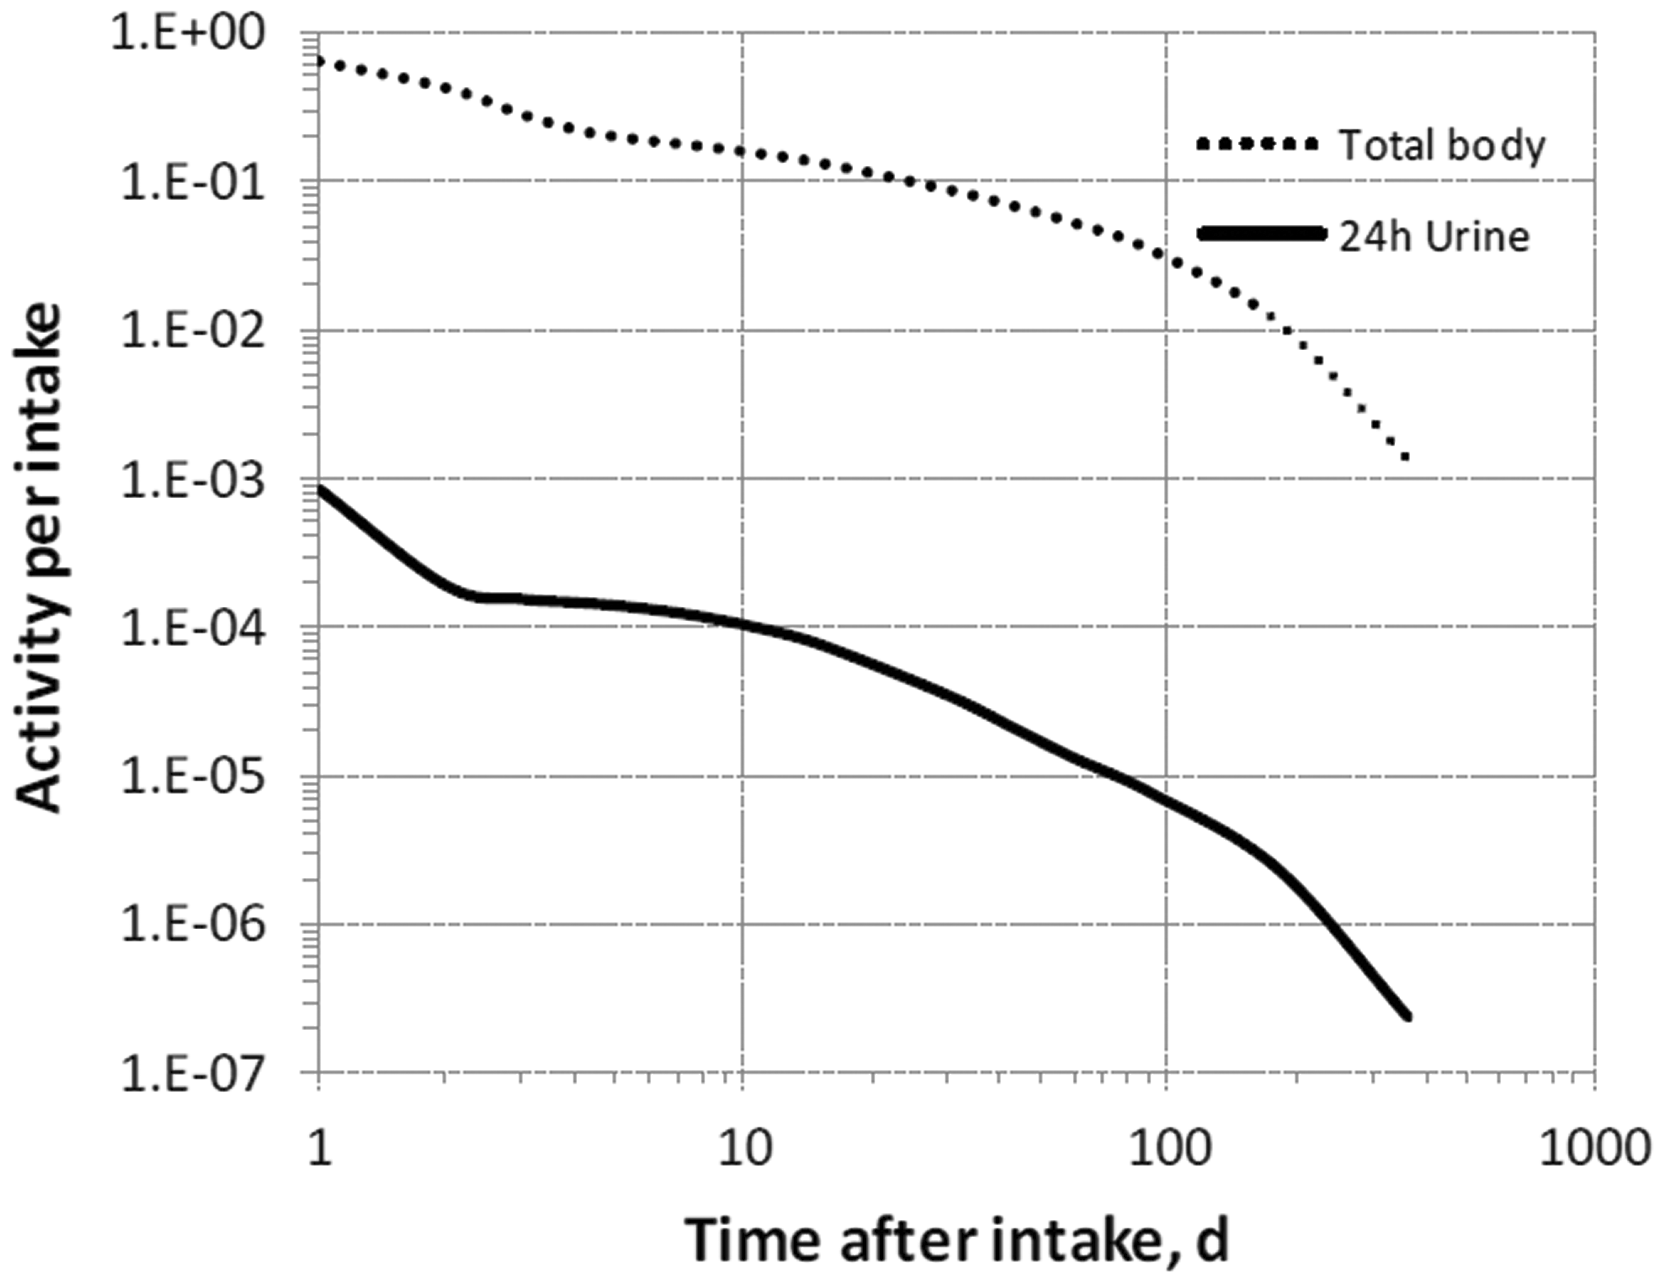


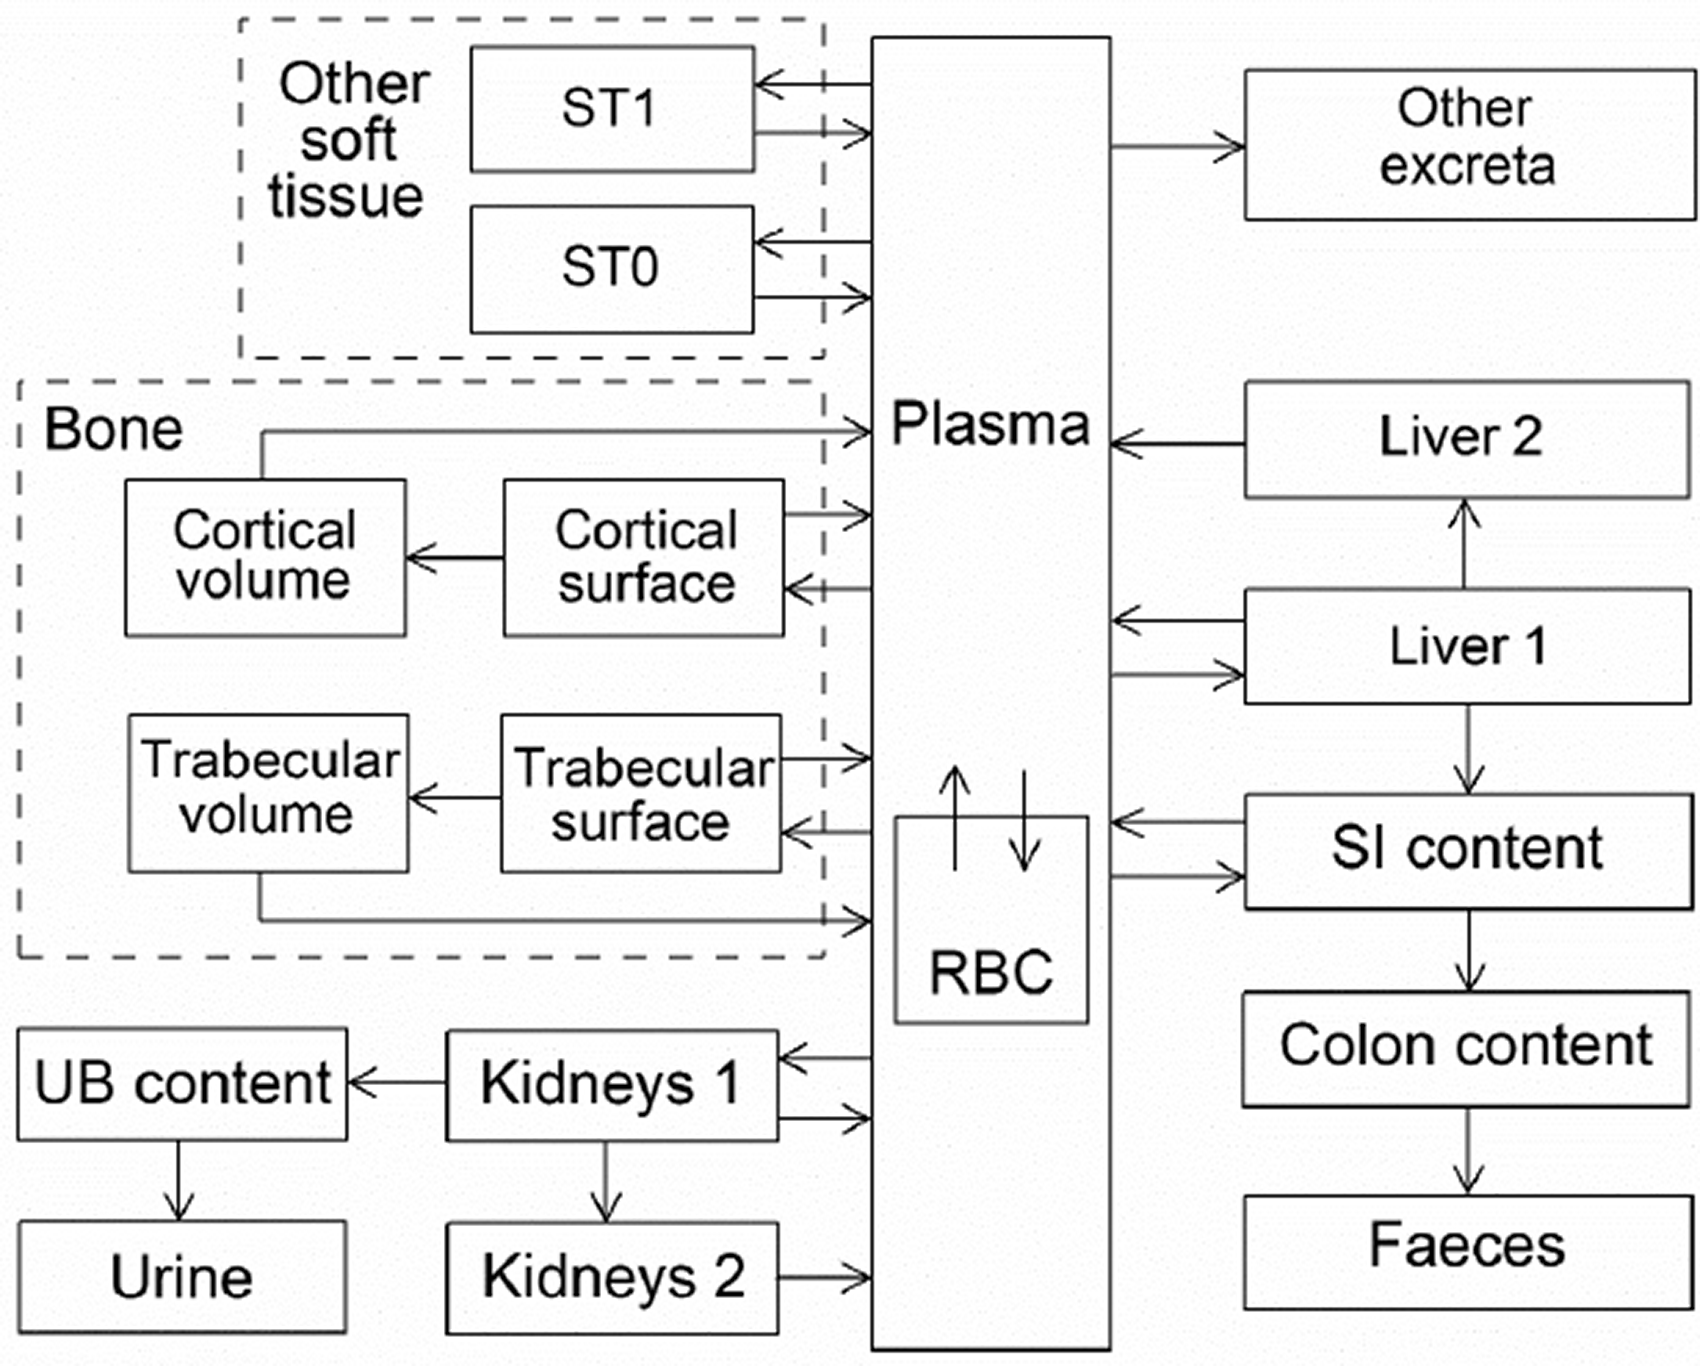
15.2.3.3. Treatment of progeny
(301) Progeny of nickel addressed in this publication are 56Co (half-time 77.2 d), 57Co (272 d), and 66Cu (5.12 min). 66Cu produced in a systemic compartment is assumed to decay at its site of production. The model for cobalt as a progeny of nickel is an expansion of the characteristic model for cobalt with added compartments and associated transfer coefficients needed to solve the linked biokinetic models for nickel and cobalt (see Annex B). If produced in a compartment not explicitly identified in its characteristic model, cobalt is assumed to transfer to its central blood compartment at 1000 d−1 if produced in a blood compartment, and at 0.099 d−1 if produced in a tissue compartment, and to follow its characteristic model thereafter.
15.3. Individual monitoring
15.3.1. 59Ni
(302) Measurements of 59Ni may be performed by liquid scintillation counting in urine.
15.3.2. 63Ni
(303) Measurements of 63Ni may be performed by liquid scintillation counting in urine.
15.4. Dosimetric data for nickel
16. Copper (Z = 29)
16.1. Isotopes
16.2. Routes of intake
16.2.1. Inhalation
(304) For copper, default parameter values were adopted on absorption to blood from the respiratory tract (ICRP, 2015). Absorption parameter values and types, and associated fA values for particulate forms of copper are given in Table 16.2. Monitoring techniques for 59Ni. Monitoring techniques for 63Ni. Committed effective dose coefficients (Sv Bq−1) for the inhalation or ingestion of 59Ni and 63Ni compounds. AMAD, activity median aerodynamic diameter. Dose per activity content of 59Ni in daily excretion of urine (Sv Bq−1); 5 µm activity median aerodynamic diameter aerosols inhaled by a reference worker at light work. Dose per activity content of 63Ni in daily excretion of urine (Sv Bq−1); 5 µm activity median aerodynamic diameter aerosols inhaled by a reference worker at light work. Isotopes of copper addressed in this publication. EC, electron-capture decay; B+, beta-plus decay; B−, beta-minus decay. Dose coefficients and bioassay data for this radionuclide are given in the printed copy of this publication. Data for other radionuclides listed in this table are given in the online electronic files on the ICRP website. Absorption parameter values for inhaled and ingested copper. It is assumed that the bound state can be neglected for copper (i.e. fb = 0). The values of sr for Type F, M, and S forms of copper (30, 3, and 3 d−1, respectively) are the general default values. For inhaled material deposited in the respiratory tract and subsequently cleared by particle transport to the alimentary tract, the default fA values for inhaled materials are applied [i.e. the product of fr for the absorption type and the fA value for ingested soluble forms of copper (0.5)]. Default Type M is recommended for use in the absence of specific information on which the exposure material can be assigned to an absorption type (e.g. if the form is unknown, or if the form is known but there is no information available on the absorption of that form from the respiratory tract). For guidance on the use of specific information, see Section 1.1. Activity transferred from systemic compartments into segments of the alimentary tract is assumed to be subject to reabsorption to blood. The default absorption fraction fA for the secreted activity is the highest value for any form of the radionuclide (fA = 0.5).


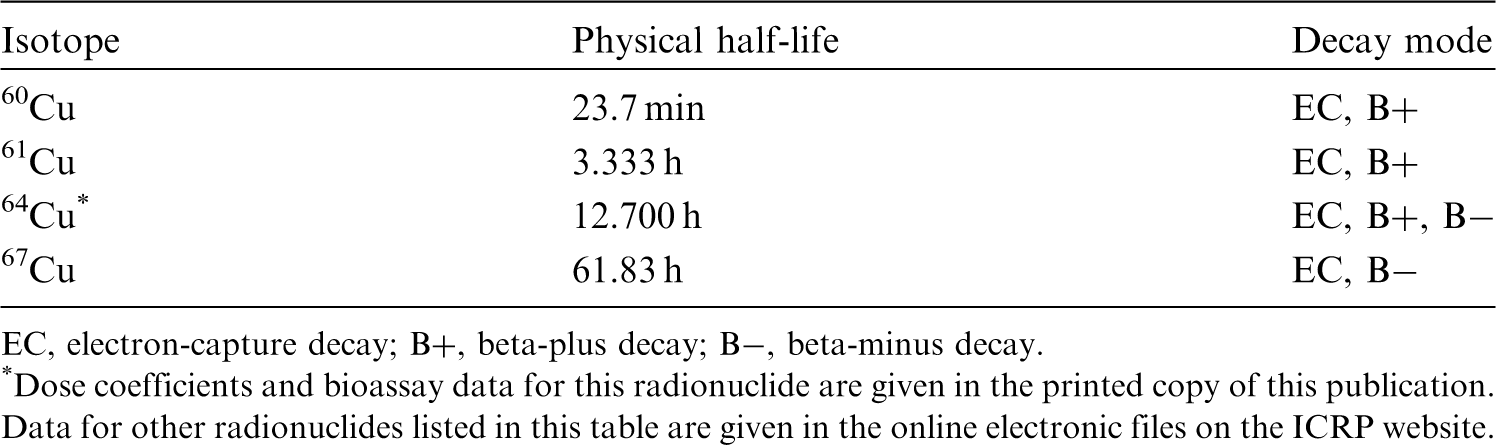

16.2.2. Ingestion
(305) A number of human studies have examined the uptake of copper from the human gastrointestinal tract. They were reviewed in Publication 30 (ICRP, 1980), and more recently by WHO (2011b), ATSDR (2004), and EFSA (2015a). Copper is absorbed from the stomach and the small intestine. The average fractional absorption ranges from 12% to 60%, with the true absorption possibly underestimated in many balance studies that did not consider endogenous losses in faecal excretion. The absorption of copper appears to be inversely related to the amount of copper, zinc, iron, and cadmium in the gut. (306) In Publications 30 and 68 (ICRP, 1981, 1994a), f1 was taken to be 0.5 for all compounds of copper. In this publication, the same value of fA (0.5) is recommended for all chemical forms of copper ingested by adults.
16.2.3. Systemic distribution, retention, and excretion of copper
16.2.3.1. Biokinetic data
(307) Copper is a functional component of several essential enzymes in the human body. It is necessary for normal iron metabolism and formation of RBC. Many enzymatic reactions that are essential for functioning of the brain and nervous system are catalysed by copper. (308) Studies of copper metabolism in human subjects began after the discovery in the late 1920s that copper was required for haemoglobin formation in rats (Hart et al., 1928; Tompsett, 1934, 1935; Chou and Adolph, 1935; Leverton and Binkley, 1944). Biokinetic studies involving administration of radioisotopes of copper to laboratory animals or human subjects began in the 1940s (Turnland, 1998). The half-lives of the longest-lived radioisotopes of copper (64Cu 12.7 h; 67Cu 61.8 h) have limited their uses to relatively short-term studies. (309) Dietary intake of copper by an adult human is typically ∼1–3 mg d−1. Approximately 30–70% of ingested copper is absorbed to blood. Absorption of copper is inversely related to the level of copper intake. Absorbed copper becomes bound to two plasma proteins: albumin and transcuprein. Much of the bound copper is deposited rapidly in the liver, the key organ regarding copper metabolism and homeostasis. Most of the copper entering the liver is incorporated into the enzyme ceruloplasmin, which is released to blood and transferred to tissues (Cartwright and Wintrobe, 1964; Linder and Hazegh-Azam, 1996; Cromwell, 1997; Turnland, 1998; Angelova et al., 2011; Osredkar and Sustar, 2011). (310) The total mass of copper in the adult male human body is ∼70–80 mg (Cartwright and Wintrobe, 1964; Zhu et al., 2010). Measurements of copper concentrations in post-mortem tissues and in blood of living subjects indicate the following approximate distribution of copper in an adult male: blood 5%, skeletal muscle 48%, liver 18%, bone 8%, and other tissue 21% (Zhu et al., 2010). (311) Copper has two stable isotopes, 63Cu and 65Cu, with natural abundances of 69.2% and 30.8%, respectively. Scott and Turnland (1994) investigated the biokinetics of copper in healthy young adult male humans over a 90-d period in which the less abundant isotope 65Cu was administered at different times. The subjects received adequate dietary copper (1.7 mg d−1) for 24 d, low dietary copper (0.79 mg d−1) for 42 d, and high dietary copper (7.5 mg d−1) for 24 d. A solution containing 65Cu was injected intravenously on days 7, 49, and 73, and 65Cu was added to the diet on days 13, 31–32, 55–56, and 79. The time-dependent concentrations of 65Cu were determined in blood components. Observed changes in the 65Cu concentrations were interpreted in view of previously established characteristics of copper in the human body such as the typical mass, distribution, and faecal and urinary excretion rates of copper in adult humans, and the roles of the liver in copper metabolism and storage. The data indicated that plasma contained ∼4% of total-body copper, with ceruloplasmin containing 56–68% of plasma copper. The dietary copper level was judged to influence the flow rate from the liver to plasma, and from plasma to tissues other than the liver. The investigators developed a biokinetic model depicting the observed behaviour of 65Cu in blood plasma, and the inferred time-dependent systemic distribution and excretion of 65Cu. First-order transfer rates between compartments (or delay times, for two of the nine depicted transfers) were developed separately for each subject as fits to subject-specific data. Separate transfer coefficients were developed for oral intake and injection. (312) Relative losses of copper along different excretion pathways were studied in dogs (Cartwright and Wintrobe, 1964). The results indicated that ∼80% of excretion of systemic copper is due to biliary secretion into the small intestine, 16% is excreted after endogenous secretion directly across the intestinal wall, and 4% is excreted in urine. (313) Following administration of 64Cu as cupric acetate to rats, maximal activity concentrations were reached quickly in the liver, kidneys, and gastrointestinal tract (Owen, 1965). Other tissues showed a progressive accumulation of 64Cu after the disappearance of most of the non-ceruloplasmin 64Cu from plasma and emergence of plasma ceruloplasmin 64Cu, suggesting that ceruloplasmin may be the source of copper for tissues. The disappearance of 64Cu from plasma tended to parallel that from the liver after 2 d. (314) Dunn et al. (1991) developed a compartmental model of copper biokinetics in rats based on measurements of intravenously administered 64Cu in plasma, tissues, and excreta over the first 3 d post injection. They interpreted the data in the context of a 16-compartment model that included two plasma compartments representing ceruloplasmin copper (Cp) and all other copper in plasma (NCp), two liver compartments, two compartments representing skin plus muscle (S-M), two compartments representing intestinal tissue, two compartments representing remaining tissue, and six compartments representing excretion pathways and excreta. Movement between compartments was described by first-order transfers. Skin and muscle were treated as a single tissue because the data indicated virtually identical kinetics in these two tissues. The direct observations together with the results of the compartmental analysis indicated the following behaviour of 64Cu. The injected activity entered the NCp fraction of plasma, cleared rapidly into the liver and S-M, and was initially removed at a high rate from the liver in bile. The plasma content levelled out within the first hour, remained constant for ∼10 h, and then began to decline gradually. This was attributed to a decreasing content of activity in NCp, offset by an increasing content in Cp. By 1 h post injection, ∼32% of the administered amount (after correction for physical decay) had accumulated in the liver. Activity was lost from the liver at a relatively high rate for a few hours and more slowly thereafter. Activity in S-M accounted for ∼25% of the administered amount at 2 h, decreased slightly to ∼10 h post administration, and then plateaued or increased slightly over the rest of the observation period, indicating a relatively long component of copper retention. Approximately 25% of the administered amount was excreted in faeces in the first 24 h and ∼45% by 72 h, apparently representing mainly biliary secretion of the tracer.
16.2.3.2. Biokinetic model for systemic copper
(315) The biokinetic model for systemic copper used in this publication is a modification of the model of Scott and Turnland (1994). The model structure applied by those investigators was modified to depict the faecal and urinary excretion pathways applied in the OIR series. (316) The modified model structure is shown in Fig. 16.1. Transfer coefficients are listed in Table 16.3. (317) The mean transfer rates developed by Scott and Turnland (1994) for intravenous administration of 65Cu during the period of adequate intake of copper were used as a starting point. Two delays depicted in the model of Scott and Turnland (1994) were replaced with first-order transfer coefficients. The transfer rate from ‘Liver 2' to ‘Plasma 2' derived by Scott and Turnland (1994) was increased moderately for consistency with the long-term distribution of copper as indicated by autopsy data (Zhu et al., 2010). The transfer rate from ‘Other tissue' to ‘Plasma 1' was decreased to reflect longer retention in soft tissues indicated by data of Dunn et al. (1991) and for consistency with autopsy data. Transfer coefficients in the biokinetic model for systemic copper. Daily excretion of 59Ni following inhalation of 1 Bq nickel carbonyl. Daily excretion of 59Ni following inhalation of 1 Bq Type F. Daily excretion of 59Ni following inhalation of 1 Bq Type M. Daily excretion of 59Ni following inhalation of 1 Bq Type S. Daily excretion of 63Ni following inhalation of 1 Bq nickel carbonyl. Daily excretion of 63Ni following inhalation of 1 Bq Type F. Daily excretion of 63Ni following inhalation of 1 Bq Type M. Daily excretion of 63Ni following inhalation of 1 Bq Type S. Structure of the biokinetic model for systemic copper. SI, small intestine; UB, urinary bladder.


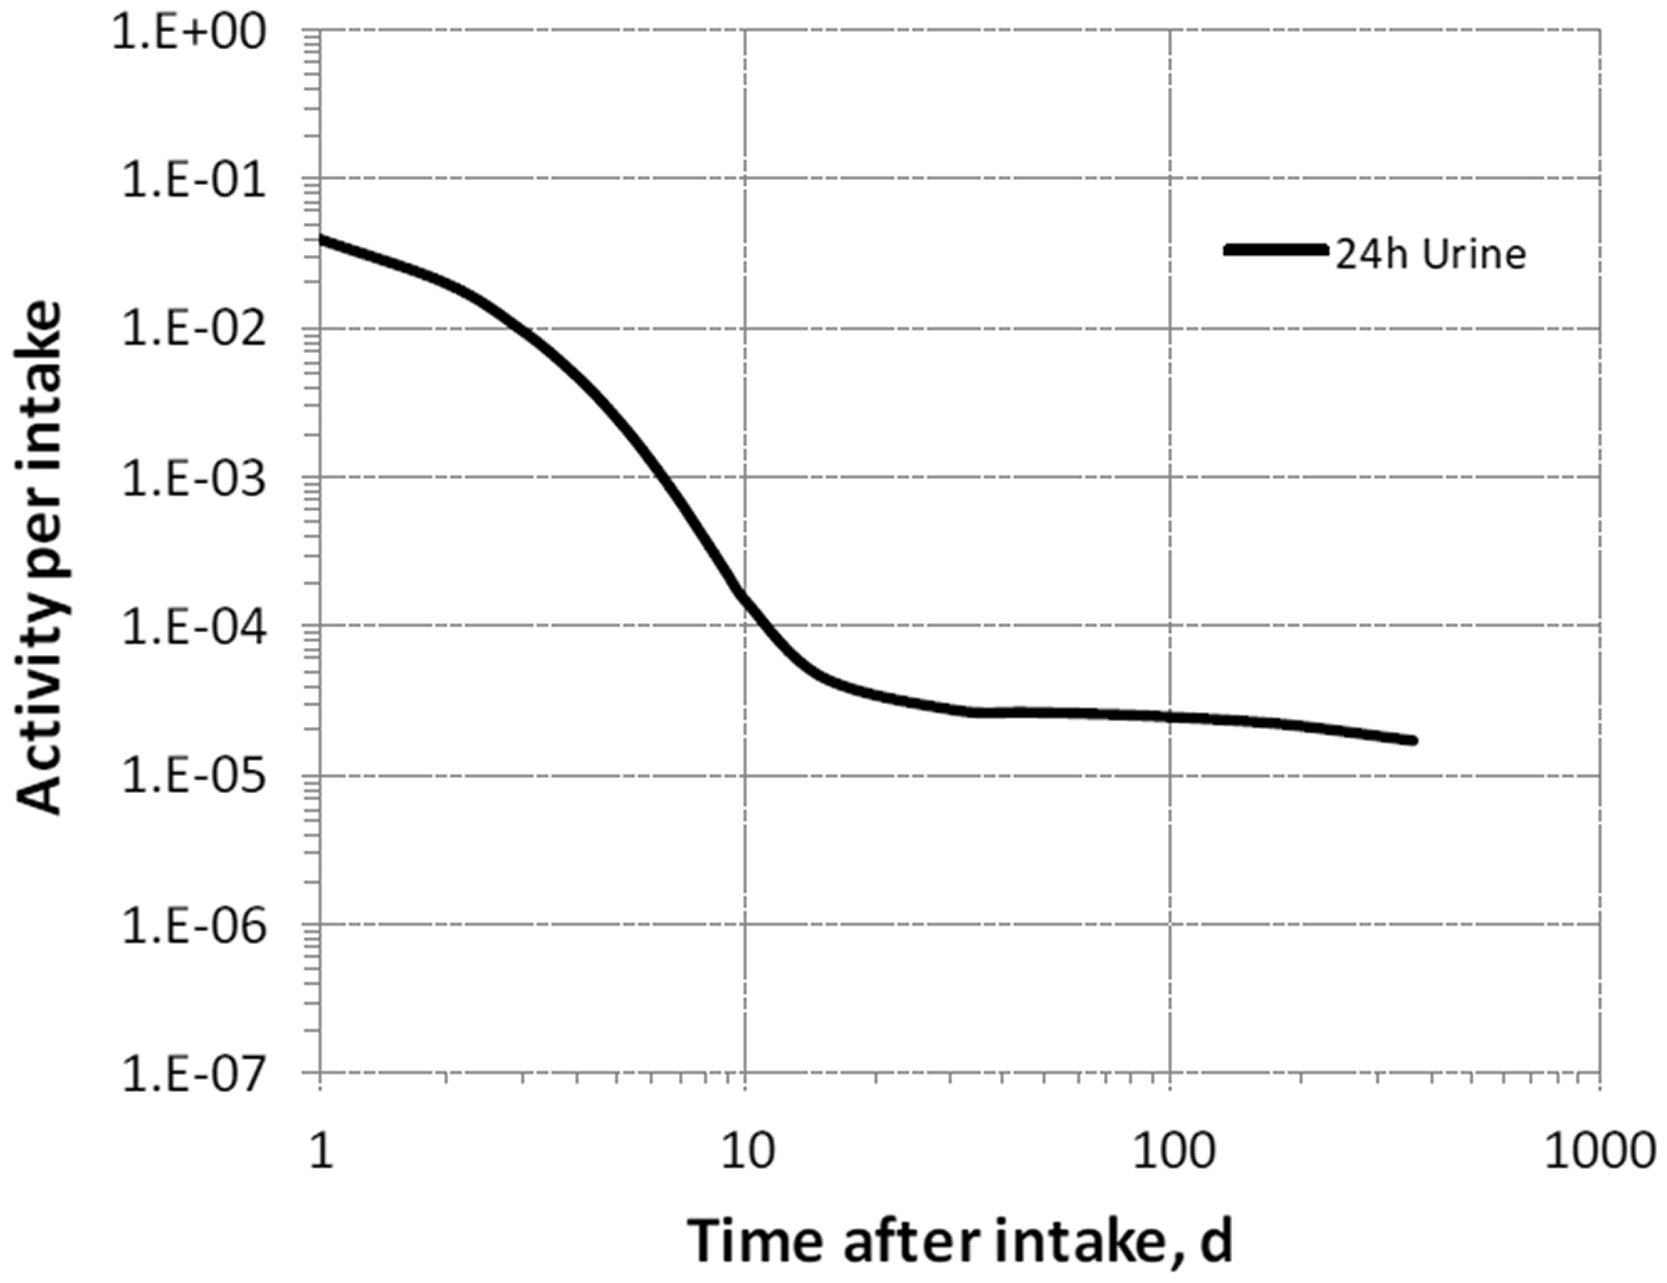
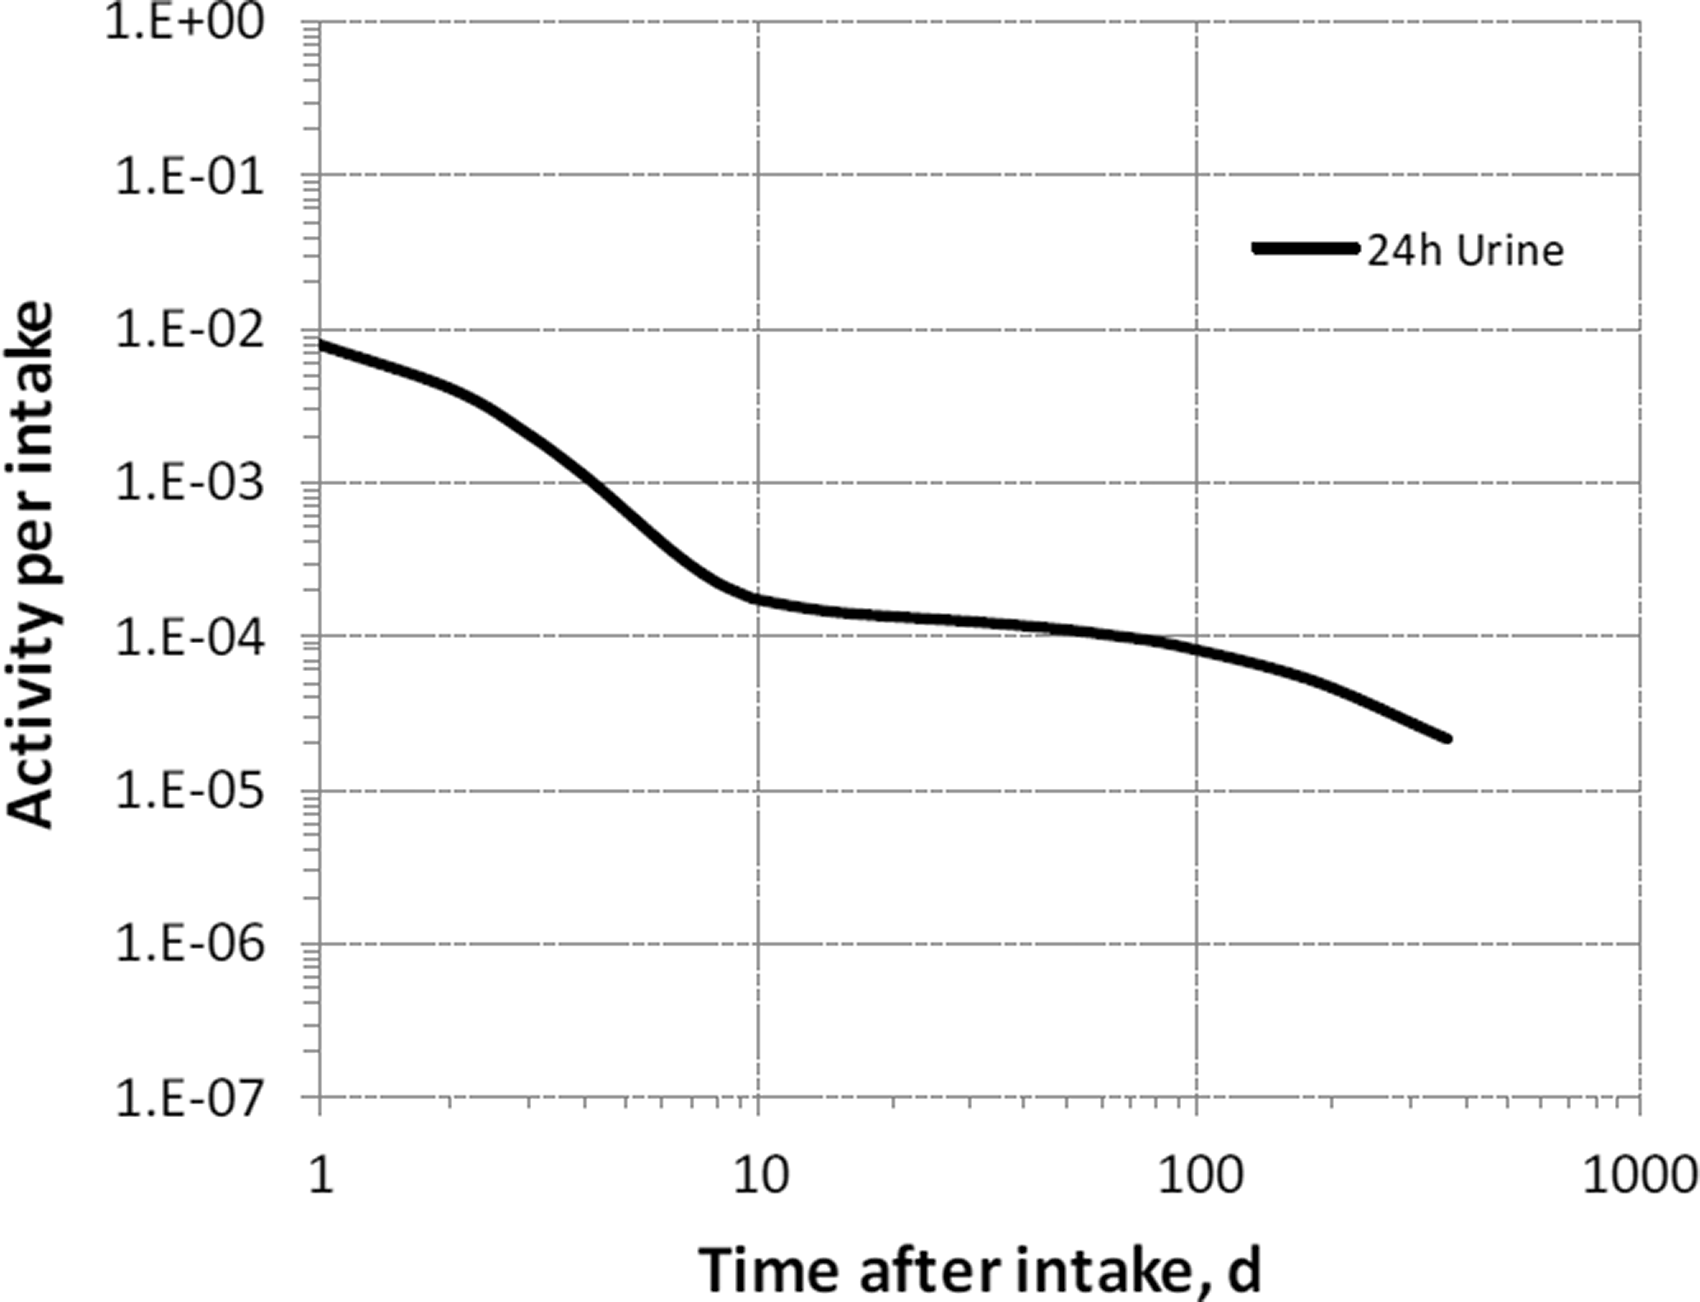


16.3. Individual monitoring
16.3.1. 64Cu
(318) Measurements of 64Cu may be performed by in-vivo whole-body measurement technique and by gamma measurement in urine.
16.4. Dosimetric data for copper
17. Gallium (Z = 31)
17.1. Isotopes
17.2. Routes of intake
17.2.1. Inhalation
(319) For gallium, default parameter values were adopted on absorption to blood from the respiratory tract (ICRP, 2015). Absorption parameter values and types, and associated fA values for particulate forms of gallium are given in Table 17.2. Monitoring techniques for 64Cu. Measurement system comprised of germanium detectors. Counting time of 20 min. Committed effective dose coefficients (Sv Bq−1) for the inhalation or ingestion of 64Cu compounds. AMAD, activity median aerodynamic diameter. Dose per activity content of 64Cu in total body and in daily excretion of urine (Sv Bq−1); 5 µm activity median aerodynamic diameter aerosols inhaled by a reference worker at light work. N/A, not applicable. Isotopes of gallium addressed in this publication. EC, electron-capture decay; B+, beta-plus decay; B−, beta-minus decay. Dose coefficients and bioassay data for this radionuclide are given in the printed copy of this publication. Data for other radionuclides listed in this table are given in the online electronic files on the ICRP website. Absorption parameter values for inhaled and ingested gallium. It is assumed that the bound state can be neglected for gallium (i.e. fb = 0). The values of sr for Type F, M, and S forms of gallium (30, 3, and 3 d−1, respectively) are the general default values. For inhaled material deposited in the respiratory tract and subsequently cleared by particle transport to the alimentary tract, the default fA values for inhaled materials are applied [i.e. the product of fr for the absorption type and the fA value for ingested soluble forms of gallium (0.001)]. Default Type M is recommended for use in the absence of specific information on which the exposure material can be assigned to an absorption type (e.g. if the form is unknown, or if the form is known but there is no information available on the absorption of that form from the respiratory tract). For guidance on the use of specific information, see Section 1.1. Activity transferred from systemic compartments into segments of the alimentary tract is assumed to be subject to reabsorption to blood. The default absorption fraction fA for the secreted activity is the highest value for any form of the radionuclide (fA = 0.001).


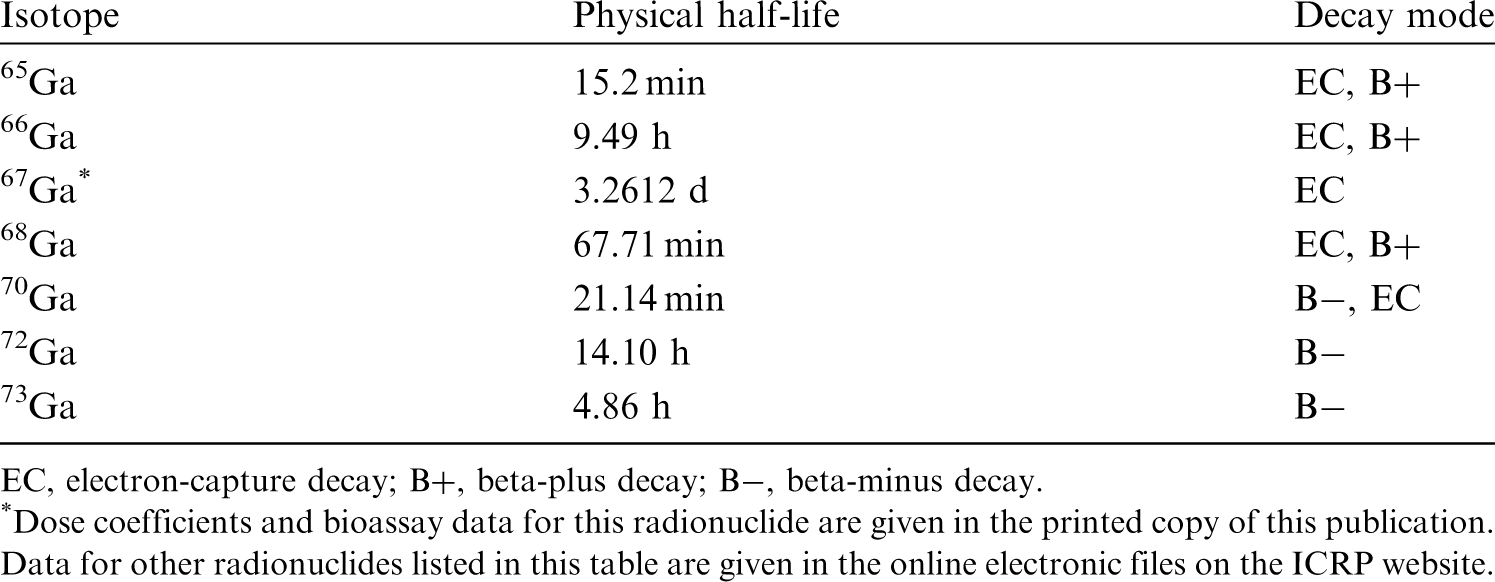
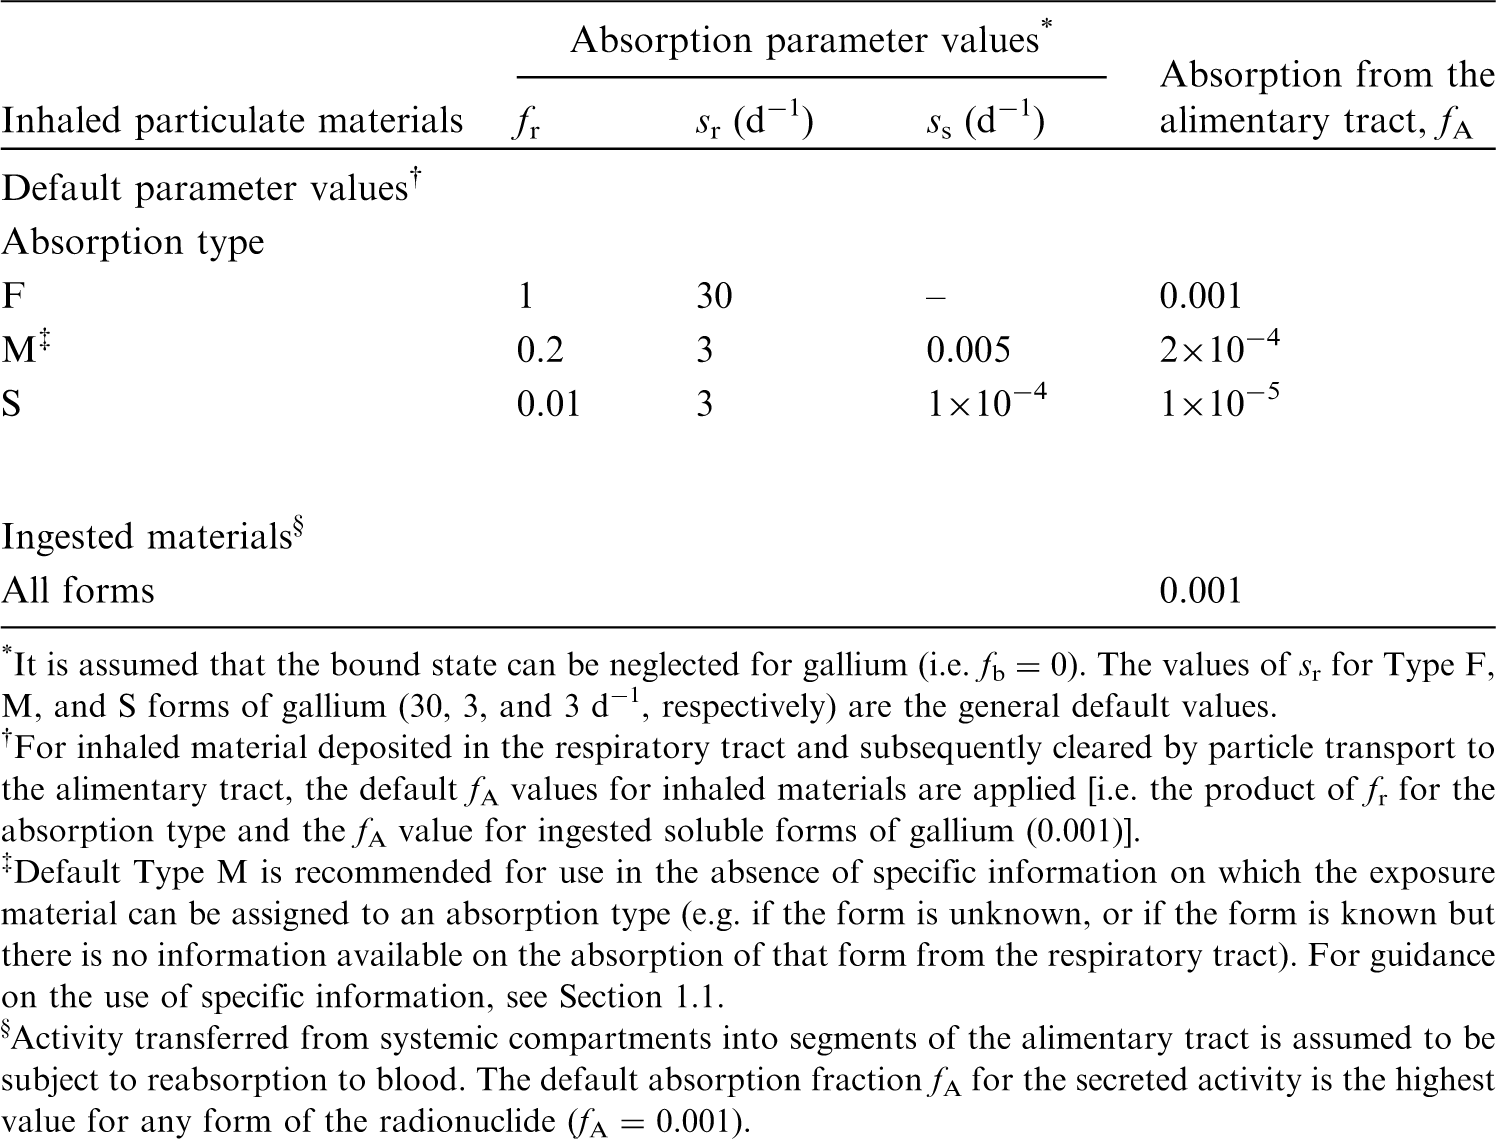
17.2.2. Ingestion
(320) The work of Dudley and Levine (1949) showed that little or no gallium administered as the chloride is absorbed from the gastrointestinal tract of the rat. Valberg et al. (1981) confirmed that gallium is poorly absorbed (<0.5% of intake) after a single oral administration in mice. Rubow et al. (1991) observed the inadvertent ingestion of 67Ga by a 9-month-old child breast-fed by her mother who underwent a gallium scan after Hodgkin’s lymphoma. All ingested activity appeared to be localised in the intestines of the child, with no apparent absorption from the gastrointestinal tract. (321) In Publications 30 and 68 (ICRP, 1981, 1994a), f1 was taken to be 10−3 for all compounds of the element. In this publication, the same value of fA (10−3) is applied to all chemical forms of gallium.
17.2.3. Systemic distribution, retention, and excretion of gallium
17.2.3.1. Biokinetic data
(322) The biokinetics of systemic gallium has been investigated in several human studies, usually in conjunction with medical applications of 67Ga (half-time 3.26 d) or stable gallium. 67Ga has been investigated as a prospective agent for diagnosis and treatment of neoplasms involving bone, and has been used extensively to determine the location of tumours, inflammations, and infections (Nelson et al., 1972). Stable gallium has been found to have beneficial effects in the treatment of conditions associated with accelerated bone resorption (Bockman et al., 1986). (323) Results of in-vivo studies using 67Ga indicate that nearly all gallium in blood is present in plasma, where it is largely bound to the iron-transport protein transferrin (Bernstein, 1998). In addition to its tendency to accumulate in tumours and at sites of inflammation and infection, gallium has a strong affinity for certain healthy tissues including growing and remodelling bone (Bernstein, 1998). In growing bone, gallium is concentrated in the metaphysis, particularly the cartilaginous growth plate. It accumulates, to some extent, on the endosteal and periosteal surfaces of diaphyseal bone (Bockman et al., 1986). Elevated concentrations of gallium are also commonly observed in the liver, spleen, and kidneys (Bernstein, 1998). (324) Blood clearance of gallium can be described reasonably well in terms of two phases of disappearance with half-times of the order of 0.25 d and 7 d (Kriegel, 1984). Approximately one-third of the amount deposited in tissues is removed from the body over a relatively short period, mainly in urine, and the remainder is removed relatively slowly in urine and faeces (Kriegel, 1984). In the biokinetic model for gallium adopted in Publication 30 (ICRP, 1981), short- and long-term retention of gallium in each modelled tissue (bone surface, liver, spleen, and ‘Other’) was characterised by half-times of 1 d and 50 d, applicable to 30% and 70%, respectively, of the amount entering the tissue. (325) Priest et al. (1995) studied the biokinetics of 67Ga over a 21-d period following its intravenous administration to a healthy adult male volunteer. After correction for radioactive decay, retention R(t) in blood at t days post injection (t ≥ 0.2), expressed as a percentage of the injected amount, was described by the power function R(t) = 10.5t−0.75. Urinary and faecal excretion over the first 13 d, corrected for decay, represented ∼27% and ∼10%, respectively, of the injected amount. (326) Nelson et al. (1972) measured activity concentrations in post-mortem samples of 23 patients administered 67Ga intravenously at various times before death. The highest mean concentrations expressed as % kg−1 were found in the spleen (4.1), kidney cortex (3.8), adrenals (3.8), bone marrow (3.6), liver (2.8), kidneys (2.7), and bone (2.6). Some organs, including the kidneys, showed a rapid decrease in activity from high early values but a later slow decrease of retained activity. Considerable variation in tissue concentrations from patient to patient was observed, with most tissues having at least a 10-fold variation. (327) Zhu et al. (2010) measured concentrations of gallium in 17 tissues obtained from autopsies of up to 68 Chinese men from four areas of China. All subjects were considered healthy until the time of sudden accidental death. Based on median gallium concentrations in tissue and reference tissue masses, the preponderance of total-body gallium was contained in fat (31%), bone (25%), and muscle (23%).
17.2.3.2. Biokinetic model for systemic gallium
(328) The structure of the biokinetic model for systemic gallium is shown in Fig. 17.1. Transfer coefficients are listed in Table 17.3. (329) Transfer coefficients were based on data summarised above on the behaviour of human subjects and set for consistency with post-mortem measurements on patients receiving 67Ga injections (Nelson et al., 1972; MIRD, 1973) and reported measurements of total body retention, blood clearance, and urinary and faecal excretion rates (Priest et al., 1995). Derivation of transfer coefficients focused on data for relatively early times after administration, as radioisotopes of gallium addressed in this publication have relatively short half-lives, from 15.2 min to 3.26 d. Transfer coefficients in the biokinetic model for systemic gallium. ST, soft tissue. ST0 and ST1 are compartments of other soft tissues representing two phases of biological removal to blood. Daily excretion of 64Cu following inhalation of 1 Bq Type F. Daily excretion of 64Cu following inhalation of 1 Bq Type M. Daily excretion of 64Cu following inhalation of 1 Bq Type S. Structure of the biokinetic model for systemic gallium. ST, soft tissue. ST0 and ST1 are compartments of other soft tissues representing two phases of biological removal to blood.


17.2.3.3. Treatment of progeny
(330) The only progeny of gallium addressed in this publication is 65Zn, produced by decay of 65Ga. The model for systemic zinc as a progeny of gallium is an expansion of the characteristic model for zinc with added compartments and associated transfer coefficients needed to solve the linked biokinetic models for gallium and zinc (see Annex B). Compartments representing the spleen and red marrow were added to the model for zinc to address all tissues considered explicitly in the model for gallium. The following transfer coefficients were added to the characteristic model for zinc: blood to spleen, 3.0 d−1; blood to red marrow, 3.0 d−1; spleen to blood, 2.5 d−1; red marrow to blood, 2.5 d−1; and other to blood, 10 d−1.
17.3. Individual monitoring
17.3.1. 67Ga
(331) Measurements of 67Ga may be performed by in-vivo whole-body measurement technique and by gamma measurement in urine.
17.4. Dosimetric data for gallium
18. Germanium (Z = 32)
18.1. Isotopes
18.2. Routes of intake
18.2.1. Inhalation
(332) For germanium, default parameter values were adopted on absorption to blood from the respiratory tract (ICRP, 2015). Absorption parameter values and types, and associated fA values for particulate forms of germanium are given in Table 18.2. Monitoring techniques for 67Ga. Measurement system comprised of germanium detectors. Counting time of 20 min. Committed effective dose coefficients (Sv Bq−1) for the inhalation or ingestion of 67Ga compounds. AMAD, activity median aerodynamic diameter. Dose per activity content of 67Ga in total body and in daily excretion of urine (Sv Bq−1); 5 µm activity median aerodynamic diameter aerosols inhaled by a reference worker at light work. N/A, not applicable. Isotopes of germanium addressed in this publication. EC, electron-capture decay; B+, beta-plus decay; B−, beta-minus decay. Dose coefficients and bioassay data for this radionuclide are given in the printed copy of this publication. Data for other radionuclides listed in this table are given in the online electronic files on the ICRP website. Absorption parameter values for inhaled and ingested germanium. It is assumed that the bound state can be neglected for germanium (i.e. fb = 0). The values of sr for Type F, M, and S forms of germanium (30, 3, and 3 d−1, respectively) are the general default values. For inhaled material deposited in the respiratory tract and subsequently cleared by particle transport to the alimentary tract, the default fA values for inhaled materials are applied [i.e. the product of fr for the absorption type and the fA value for ingested soluble forms of germanium (1)]. Default Type M is recommended for use in the absence of specific information on which the exposure material can be assigned to an absorption type (e.g. if the form is unknown, or if the form is known but there is no information available on the absorption of that form from the respiratory tract). For guidance on the use of specific information, see Section 1.1. Activity transferred from systemic compartments into segments of the alimentary tract is assumed to be subject to reabsorption to blood. The default absorption fraction fA for the secreted activity is the highest value for any form of the radionuclide (fA = 1).


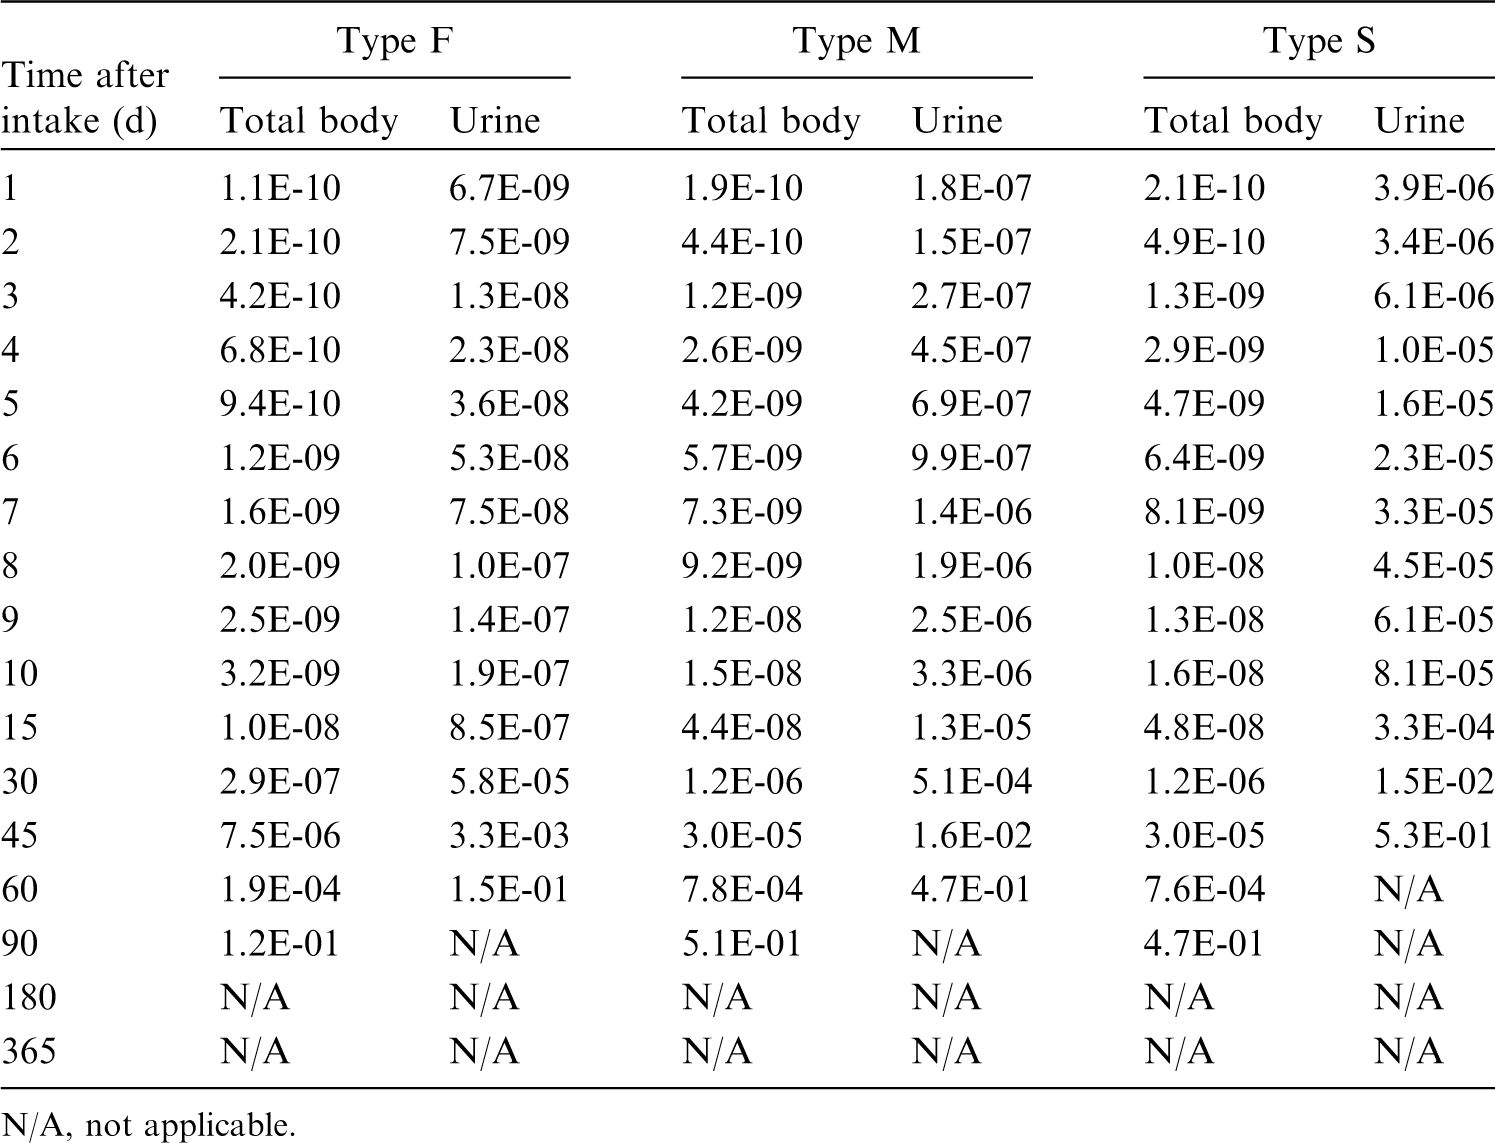
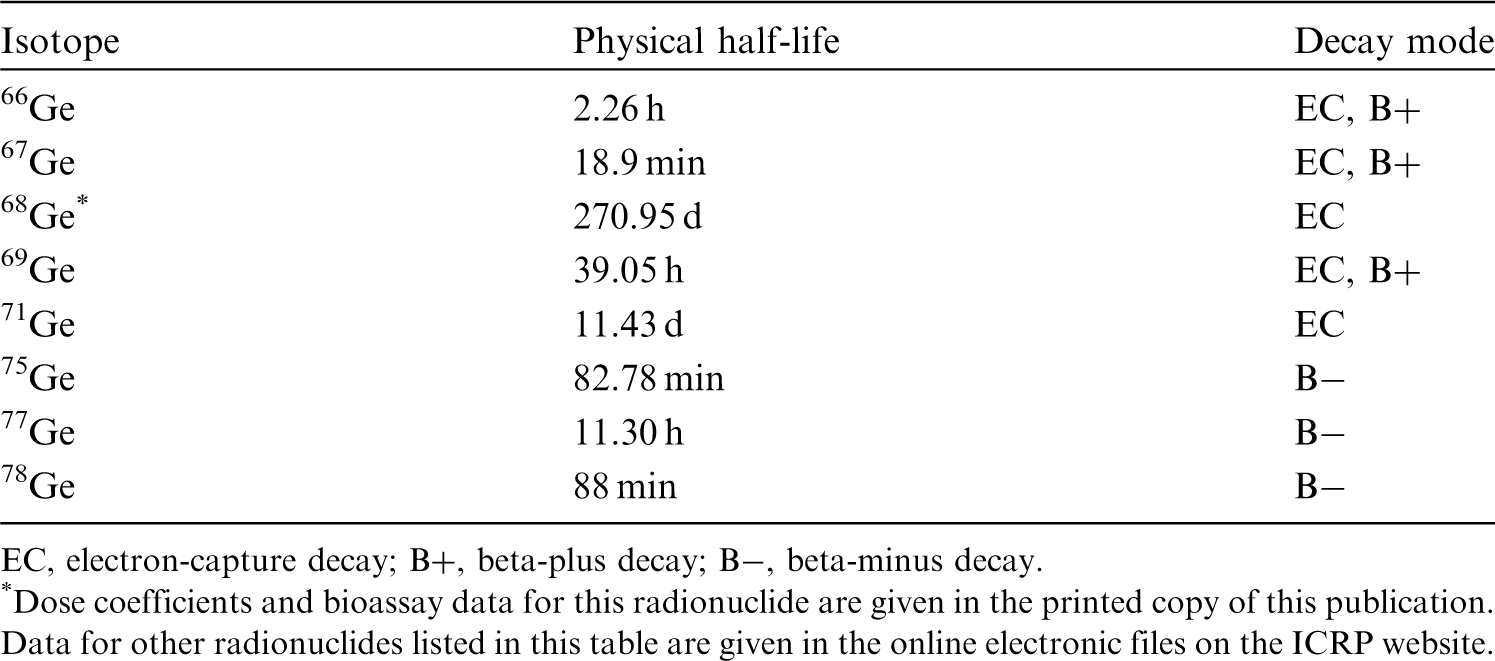
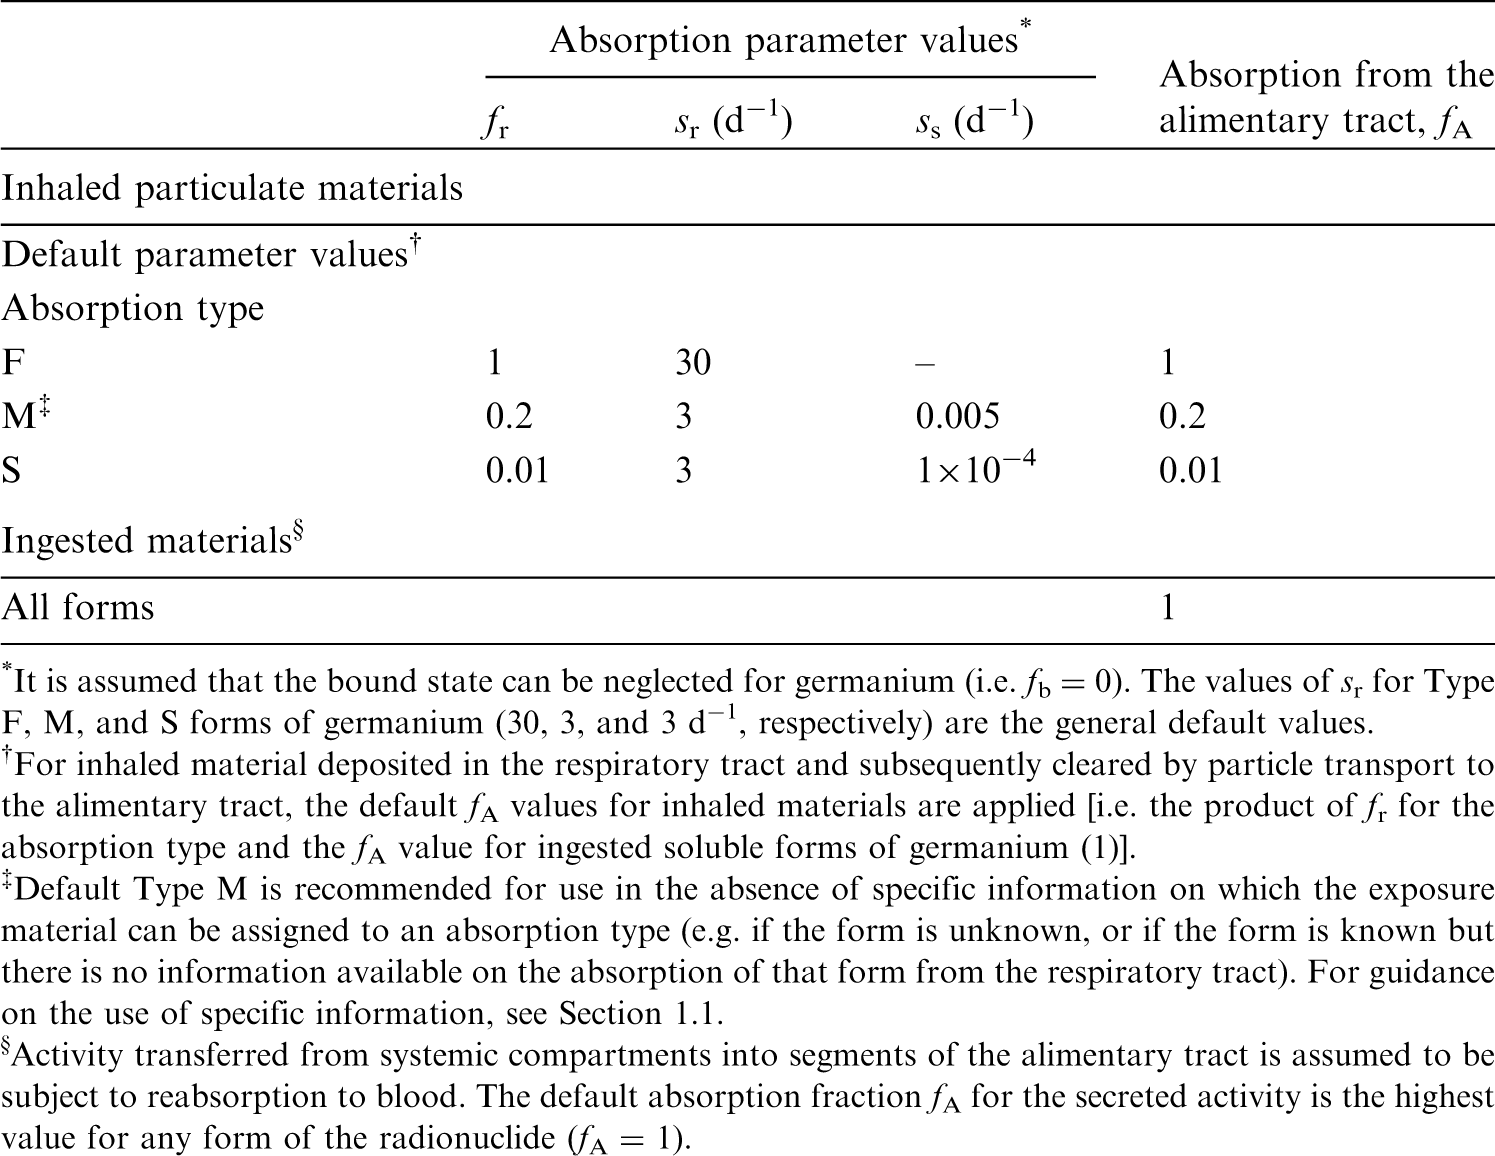
18.2.2. Ingestion
(333) Data on the germanium content of urine suggest that dietary forms of the element are well absorbed from the gastrointestinal tract of man (Schroeder and Balassa, 1967): of a calculated daily intake of 1.5 mg in the diet, 1.4 mg appears in the urine and 0.1 mg in the faeces. In experiments on rats, germanium, orally administered in the form of GeO2, was almost completely absorbed from the gastrointestinal tract (Rosenfeld, 1954). Pharmacokinetics studies with an oral dose of 100 mg kg−1 of 14C labelled carboxyethyl-germanium sesquioxide (132Ge) indicated 30% intestinal absorption. Human patients treated with 25–75 mg kg−1 of 132Ge also had an absorption rate of 30% (Miyao et al., 1980). Tao and Bolger (1997) reviewed 31 published human cases of prolonged intake of germanium leading to renal failure. Although intestinal absorption was not quantified explicitly, high levels of germanium were found in many body tissues and urine of these patients. (334) In Publications 30 and 68 (ICRP, 1981, 1994a), f1 was taken as 1 for all compounds of germanium. In this publication, the value fA = 1 is used for all chemical forms of germanium.
18.2.3. Systemic distribution, retention, and excretion of germanium
18.2.3.1. Biokinetic data
(335) Nagata et al. (1985) reported post-mortem measurements of germanium in a long-term user of a germanium preparation (Subject A) who died of renal failure, and a non-user (Subject B) who died of liver cirrhosis. The highest tissue concentrations in Subject A were seen in the spleen and bone (vertebra), with 12 other tissues showing more than five-fold lower concentrations. The highest concentration in Subject B was seen in bone, with 13 other tissues showing more than 30-fold lower concentrations. (336) Zhu et al. (2010) measured concentrations of germanium in 17 tissues obtained from autopsies of up to 68 Chinese men from four areas of China, and in blood of 10 volunteers from the same areas. The highest median concentrations were found in the ribs (89 µg kg−1), followed by blood, liver, and spleen (∼45 µg kg−1 each); lungs (33 µg kg−1); kidneys (19 µg kg−1); and thyroid (18 µg kg−1). Concentrations in the range of 4–13 µg kg−1 were found in gastrointestinal tract tissues, skeletal muscle, heart, testes, thymus, fat, and skin. Based on median tissue concentrations and reference masses of tissues, bone contained ∼50% of total-body germanium, blood contained 15%, the liver contained 4.5%, the kidneys contained 0.4%, and other tissues contained 30%. The estimated total-body content based on median tissue concentrations was 1.4 mg, which is approximately the same as typical daily intake of germanium in food (Schauss, 1991; Scansetti, 1992). As germanium in food appears to be nearly completely absorbed from the gut (Rosenfeld, 1954; Scansetti, 1992), this suggests low systemic retention of germanium. (337) During the early hours after parenteral administration of germanium compounds to rats or mice (Rosenfeld, 1954; Durbin, 1959; Mehard and Volcani, 1975; Shinogi et al., 1989), the concentration of germanium in the kidneys was much greater than in other tissues. Germanium was excreted rapidly in urine. At 4 d after intravenous administration of 71Ge as NaHGeO3 to rats, cumulative excretion accounted for ∼98% of the administered amount, and the bone, liver, and kidney contents accounted for ∼0.4%, ∼0.5%, and ∼1.1%, respectively (Durbin, 1959). At 3 h after intraperitoneal administration of Na2GeO3 to rats, the concentration of germanium in the kidneys was two to 20 times that in 14 other examined tissues and fluids (Rosenfeld, 1954). Germanium did not appear to be stored by any tissue after multiple weekly doses (Rosenfeld, 1954). (338) Velikyan et al. (2013) investigated the organ distribution of 68Ge in rats through day 7 following intravenous administration of 68GeCl4. Activity was distributed somewhat uniformly among tissues beyond a few hours. Excretion was rapid and primarily in urine. Approximately 90% of the injected activity was eliminated in urine with half-time <1 h. A second, slower phase of retention was observed, with ∼1.8% of the activity remaining in the animals after 1 week. Velikyan et al. (2013) estimated absorbed doses to tissues for adult male and female humans based on the observed residence times in rat tissues. The highest dose estimates for females, expressed as µSv MBq−1, were obtained for the kidneys (185), adrenals (83), liver (38), colon wall (∼20), red marrow (13), osteogenic cells (11), and spleen (11). The lowest dose estimates were obtained for the lungs (3.2), heart wall (2.6), muscle (2.0), pancreas (1.9), and brain (1.2). Dose estimates for 10 other tissues were in the range of 7–10 µSv MBq−1. (339) Shinogi et al. (1989) studied uptake and retention of stable germanium in mice after a single oral administration of GeO2 solution. Germanium concentrations in blood, stomach, small intestine, and eight systemic soft tissues were measured from 1 to 24 h after administration. The maximum concentration in blood and systemic tissues was reached within 1 h. The kidneys showed the highest concentration from 1 to 24 h. The highest Tb was seen in the brain (6.3 h). The half-time in blood was 1.2 h, and in soft tissues other than brain, the half-time was in the range of 2.4–4.4 h. The area under the time–concentration curve, expressed as µg h g−1, decreased in the order: kidneys (51), liver (23), pancreas (13), blood and spleen (11), lung (10), heart (7), testes (6), and brain (1.5). At 24 h, germanium was only detectable in the kidneys, liver, spleen, and brain. (340) Germanium is a member of Group VIA of the periodic table, located just below silicon. In trace amounts, germanium mimics the uptake and accumulation of silicon in laboratory animals. Mehard and Volcani (1975) compared the behaviours of 31Si (half-life 157 min) and 68Ge (half-life 271 d) in rats following intravenous or intraperitoneal administration of 31Si(OH)4 and 68Ge(OH)4. The intravenous and intraperitoneal injection studies yielded broadly similar results, but accumulation of 68Ge was somewhat higher in the liver, kidneys, bladder, and blood after intraperitoneal injection than after intravenous injection. Accumulation of 31Si and 68Ge in tissues increased for ∼15–40 min, declined rapidly for ∼30 min, and then declined more gradually. Faster depletion of 68Ge than 31Si was indicated. Concentrations of 68Ge were measured in blood and 11 tissues on five occasions from 0.1 to 20 d after intravenous injection. Highest concentrations (normalised to 1.0 for kidneys each time) were seen in the kidneys (1.0), liver (0.29), and blood (0.19) at 0.1 d; kidneys (1.0), spleen (0.31), and liver (0.28) at 4 d; and spleen (2.0), kidneys (1.0), and urinary bladder (0.15) at 20 d.
18.2.3.2. Biokinetic model for systemic germanium
(341) The structure of the biokinetic model for systemic germanium used in this publication is shown in Fig. 18.1. Transfer coefficients are listed in Table 18.3. (342) The model for systemic germanium describes the following systemic behaviour of germanium indicated by the biokinetic data summarised above, together with findings for its chemical and biological analogue silicon (see Section 7.2.3.2 on silicon in this publication). The preponderance of germanium injected into blood (∼90%) is removed in urine over the first day. The rest is distributed throughout the body, with the kidneys showing the highest concentration of any tissue over the first day and the highest time-integrated concentration over the first week. After 1 week, ∼2% of the absorbed amount is retained in the total body. The long-term distribution of germanium is consistent with autopsy data of Zhu et al. (2010). Model predictions are also reasonably consistent with the central total-body content of germanium estimated by Zhu et al. (2010), assuming dietary intake of germanium of 1.0–1.5 mg d−1 (Schauss, 1991; Scansetti, 1992) and complete absorption from the gut. Transfer coefficients in the biokinetic model for systemic germanium. Daily excretion of 67Ga following inhalation of 1 Bq Type F. Daily excretion of 67Ga following inhalation of 1 Bq Type M. Daily excretion of 67Ga following inhalation of 1 Bq Type S. Structure of the biokinetic model for systemic germanium.
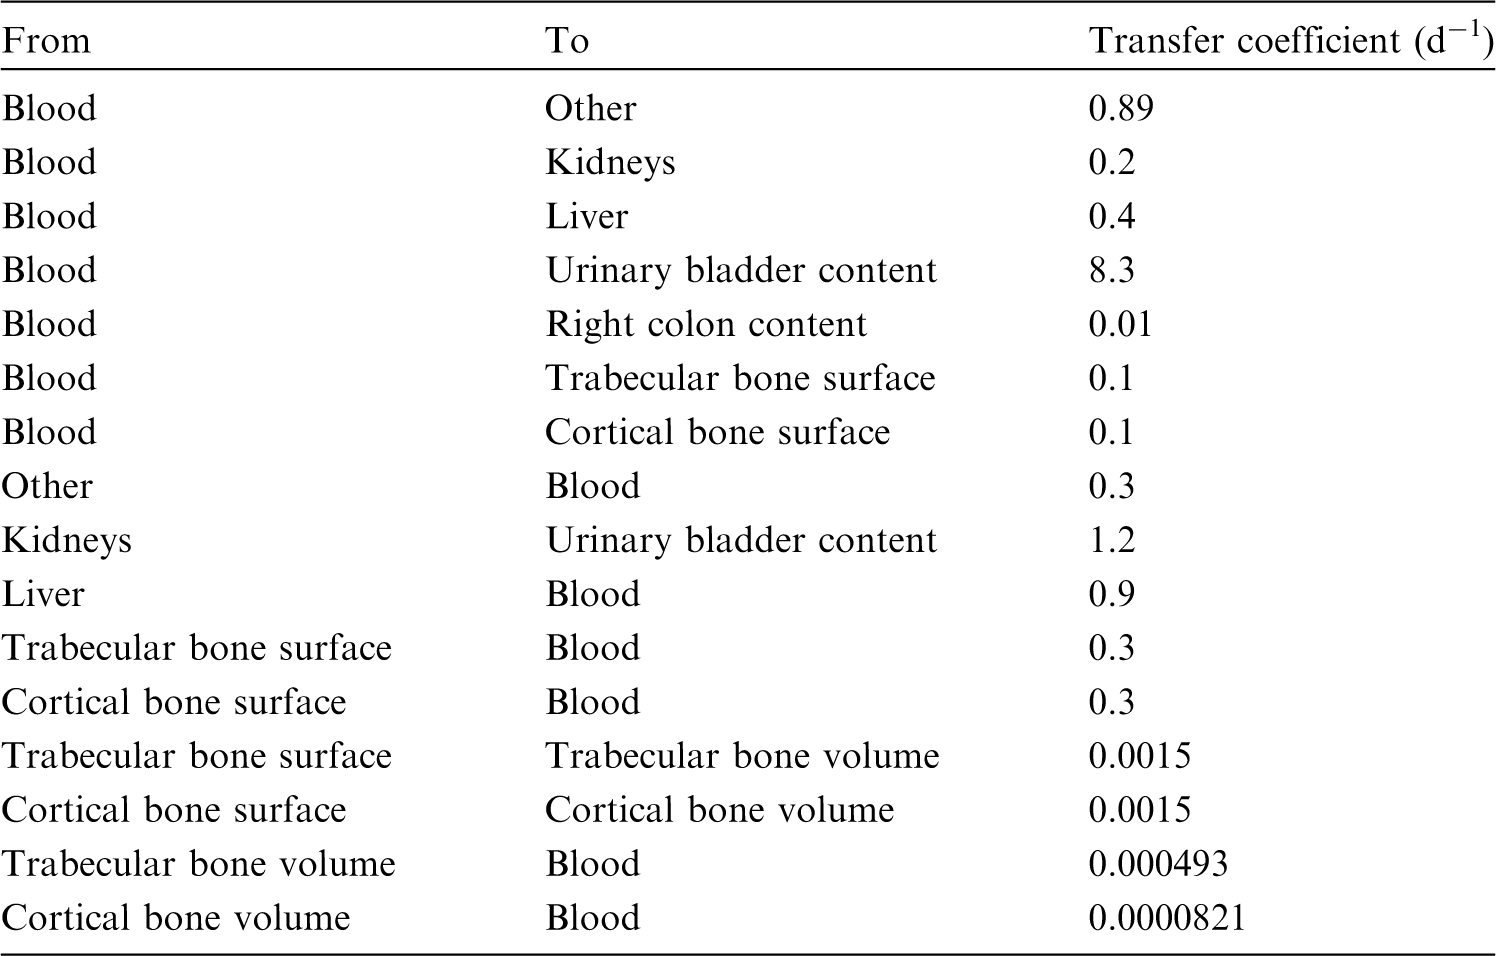


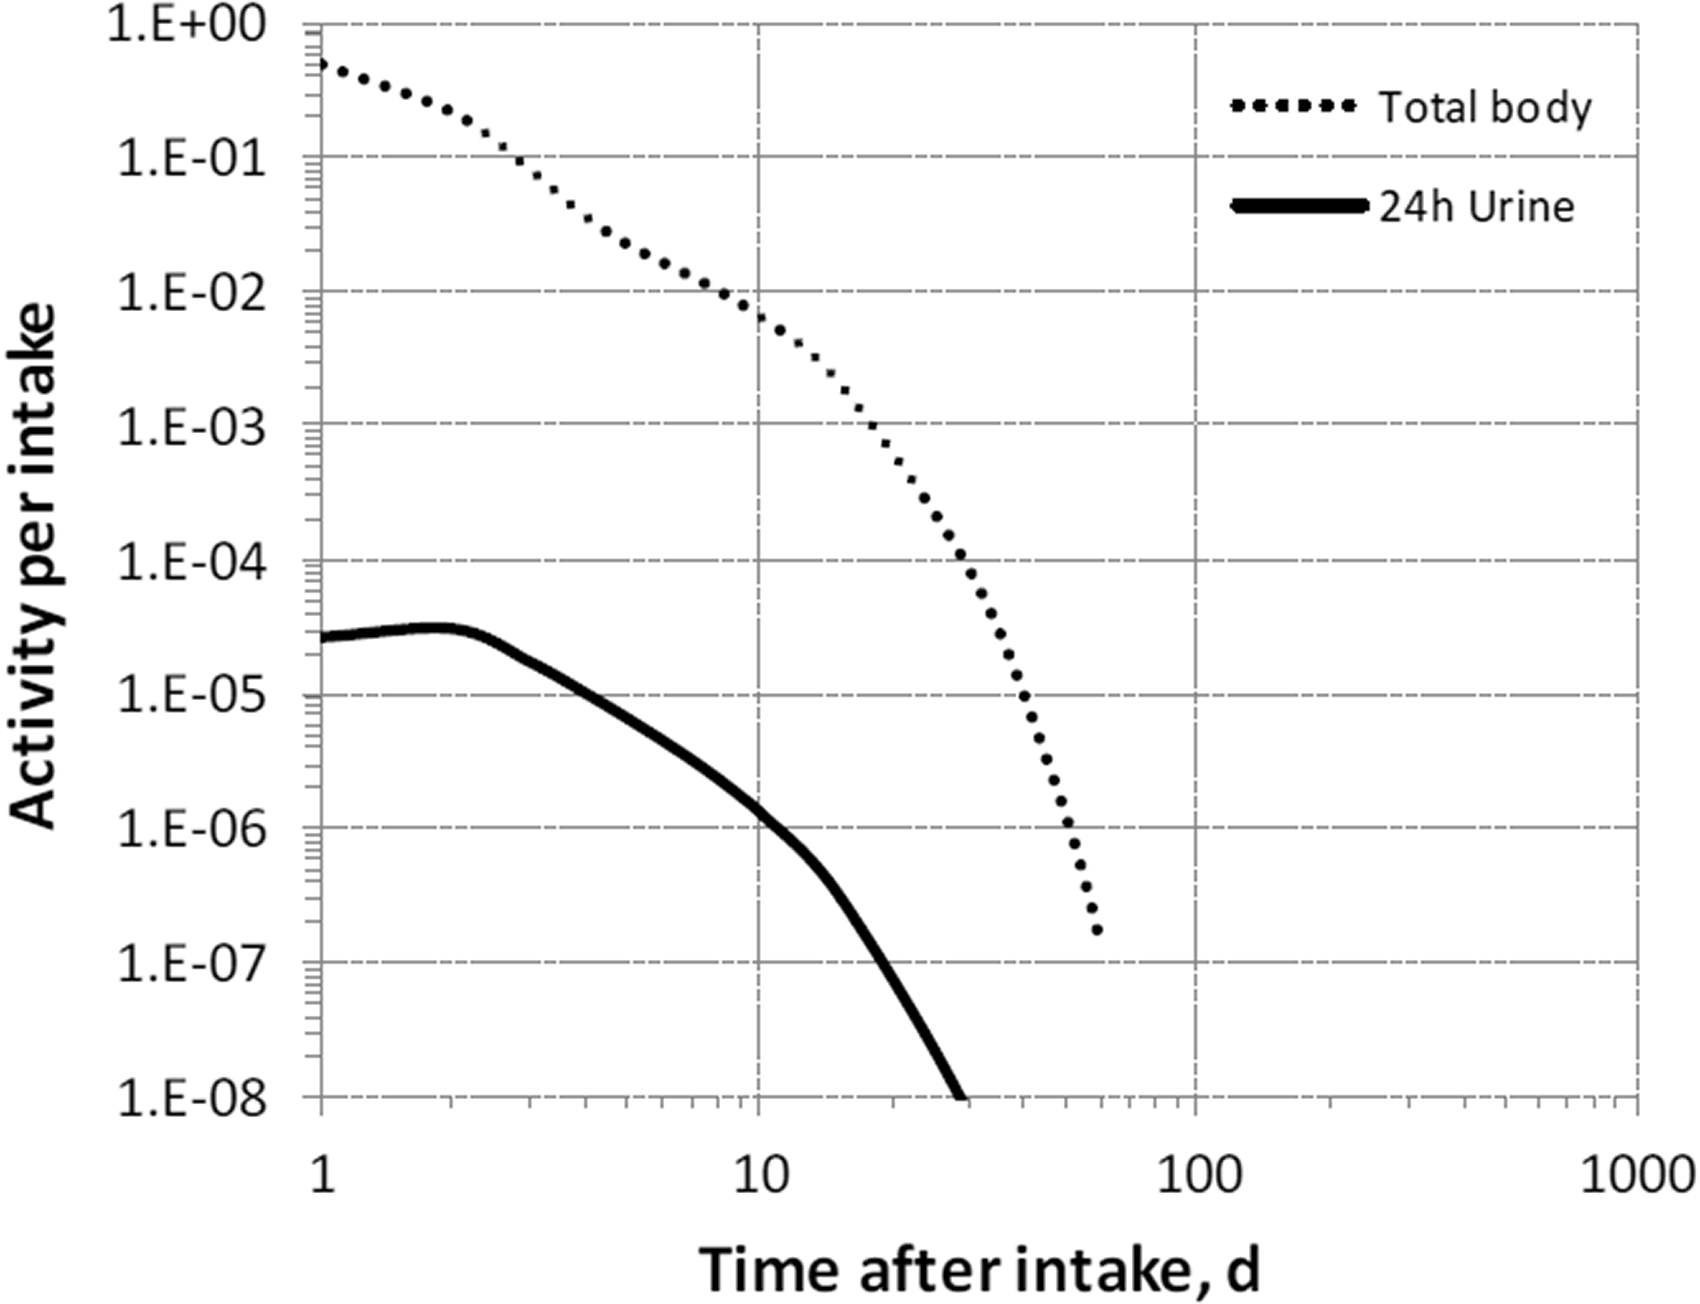

18.2.3.3. Treatment of progeny
(343) Progeny of germanium addressed in this publication are radioisotopes of gallium and arsenic. The models for gallium and arsenic as germanium progeny are expansions of the characteristic models for these elements with added compartments and associated transfer coefficients needed to solve the linked biokinetic models for chains headed by germanium (see Annex B). If produced in a compartment not explicitly named in the progeny’s model, the progeny is assumed to transfer to the central blood compartment of its characteristic biokinetic model, and to follow that model thereafter. The assigned transfer rate to the central blood compartment is the rate of bone turnover for the indicated bone type if the progeny is produced in a bone volume compartment, and at the following element-specific rate if produced in any other ambiguous compartment: gallium, 1.39 d−1; and arsenic, 0.6 d−1.
18.3. Individual monitoring
18.3.1. 68Ge
(344) Measurements of 68Ge in urine may be used to determine intakes of the radionuclide.
18.4. Dosimetric data for germanium
19. Arsenic (Z = 33)
19.1. Isotopes
19.2. Routes of intake
19.2.1. Inhalation
(345) For arsenic, default parameter values were adopted on absorption to blood from the respiratory tract (ICRP, 2015). Absorption parameter values and types, and associated fA values for particulate forms of arsenic are given in Table 19.2. Monitoring techniques for 68Ge. Measurement system comprised of germanium detectors. Counting time of 20 min. Committed effective dose coefficients (Sv Bq−1) for the inhalation or ingestion of 68Ge compounds. AMAD, activity median aerodynamic diameter. Dose per activity content of 68Ge in total body and in daily excretion of urine (Sv Bq−1); 5 µm activity median aerodynamic diameter aerosols inhaled by a reference worker at light work. Isotopes of arsenic addressed in this publication. EC, electron-capture decay; B+, beta-plus decay; B−, beta-minus decay. Dose coefficients and bioassay data for this radionuclide are given in the printed copy of this publication. Data for other radionuclides listed in this table are given in the online electronic files on the ICRP website. Absorption parameter values for inhaled and ingested arsenic. It is assumed that the bound state can be neglected for arsenic (i.e. fb = 0). The values of sr for Type F, M, and S forms of arsenic (30, 3, and 3 d−1, respectively) are the general default values. For inhaled material deposited in the respiratory tract and subsequently cleared by particle transport to the alimentary tract, the default fA values for inhaled materials are applied [i.e. the product of fr for the absorption type and the fA value for ingested soluble forms of arsenic (1)]. Default Type M is recommended for use in the absence of specific information on which the exposure material can be assigned to an absorption type (e.g. if the form is unknown, or if the form is known but there is no information available on the absorption of that form from the respiratory tract). For guidance on the use of specific information, see Section 1.1. Activity transferred from systemic compartments into segments of the alimentary tract is assumed to be subject to reabsorption to blood. The default absorption fraction fA for the secreted activity is the highest value for any form of the radionuclide (fA = 1).


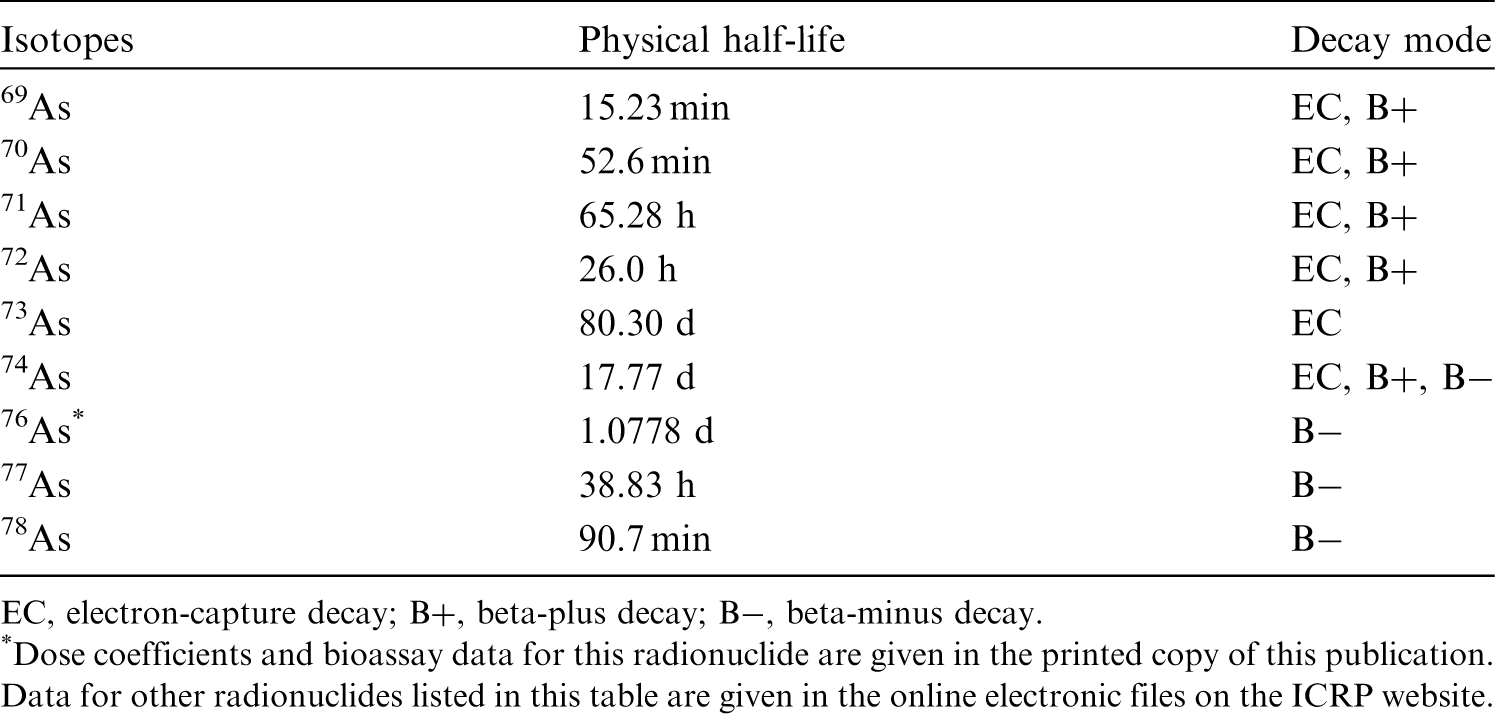

19.2.2. Ingestion
(a) Human studies
(346) Bettley and O’Shea (1975) measured arsenic in blood, urine, and faeces of four patients with carcinoma given a test dose of water-soluble arsenic trichloride and in three control subjects. The administered arsenic appeared to be absorbed almost completely from the gut. Mappes (1977) observed the urinary excretion of ∼70% of arsenic ingested as the trioxide As2O3 dissolved in water. In contrast, the absorption of the insoluble arsenic triselenide (As2Se3) was not detected. Similarly, in hamsters, the fractional absorption of insoluble arsenic compounds (arsenic trisulfide, lead arsenate) was reduced to 20–30% (Marafante and Vahter, 1987). (347) Crecelius (1977) studied the speciation of arsenic in urine after ingestion of arsenic-rich wine, drinking water, and crab meat: ∼80% of arsenic (mostly arsenite As3+) from wine was excreted in urine within 61 h, 50% of arsenate (As5+) from well-water was excreted in urine over 70 h, and most organic arsenic from crab was excreted within 1–2 d. Tam et al. (1982) determined that 58% of 74As ingested by six adult volunteers as arsenic acid was excreted in urine over 5 d. The cumulated urinary excretion of arsenic for 14 d after repeated oral administration of up to 1 mg sodium metaarsenite NaAsO2 amounted to 60% of the ingested quantity (Buchet et al., 1981b). Kumana et al. (2002) evaluated a mean systemic bioavailability of 87% of arsenic trioxide given to nine patients with leukaemia by comparing the arsenic blood content over 2 d after ingestion of 10 mg of oral solution with that measured after intravenous infusion. Zheng et al. (2002) studied the balance over 1 week of arsenic in diet and excretion of six healthy adult volunteers drinking water with high concentrations of arsenic and fluoride. They evaluated fractional absorption of ∼94% of arsenic intake, with no significant influence of the level of fluoride intake.
(b) Arsenic in soil and animal studies
(348) Stanek et al. (2010) compared the bioavailability of arsenic in diet and in soil in 13 human volunteers. A 7-d mass-balance study of arsenic in diet, urine, and faeces indicated a mean absorption of 91% of arsenic in food and beverages. In a 5-d balance study after ingestion of 0.63 g of arsenic-contaminated soil, the soil-arsenic fractional absorption was estimated, on average, as 49%. (349) The US Environmental Protection Agency (US EPA, 2012) reviewed the data on relative bioavailability of arsenic in soil: 103 values were estimated from relevant studies involving bioassays in juvenile swine, monkeys, and mice having ingested soils contaminated by arsenic from various activities including mining, smelting, agriculture, and chemical processes. The estimated systemic absorption of arsenic in soil ranged from 4% to 78% (7–57% 5th–95th percentile range) of that of water-soluble sodium arsenate, with a mean of 31% (median 28%). (350) In Publications 30 and 68 (ICRP, 1981, 1994a), an f1 of 0.5 was recommended for all compounds of arsenic. In this publication, an fA value of 1 is adopted for water-soluble arsenic compounds. An fA value of 0.3 is adopted for insoluble arsenic compounds and arsenic in soil.
19.2.3. Systemic distribution, retention, and excretion of arsenic
19.2.3.1. Biokinetic data
(351) Arsenic is ubiquitous in nature. It exists primarily in the trivalent state in the earth’s crust but is largely oxidised to pentavalent arsenic in soil and water (Mochizuki, 2019). (352) The neurotoxicity of arsenic has long been recognised, and there is epidemiological evidence that it is a carcinogen (WHO, 2000; ATSDR, 2007; Mochizuki, 2019). Inorganic trivalent (arsenite) and pentavalent (arsenate) compounds are the most hazardous forms, with the trivalent state having much more potent toxic properties than the pentavalent form (Hughes, 2002). The toxicokinetics of these two forms have been investigated in human subjects, dogs, rabbits, mice, rats, hamsters, guinea pigs, farm animals, and a variety of non-human primates. Several biokinetic models for inorganic arsenic have been proposed (Menzel et al., 1994; Mann et al., 1996; Yu, 1999; El-Masri and Kenyon, 2008; Ling and Liao, 2009; Adeyemi et al., 2010). (353) Absorbed or injected inorganic As(III) and As(V) initially have noticeably different systemic kinetics (Vahter and Norin, 1980; Lindgren et al., 1982). A substantial portion of absorbed As(V) is reduced to As(III) in the body (Vahter and Marafante, 1985; Vahter, 2002), resulting in more similar distributions of the initially different forms over time. (354) Lindgren et al. (1982) examined the systemic distribution of intravenously injected 74As as As(III) or As(V) in mice using whole-body autoradiography, external counting, and measurement of activity in dissected tissues. Total-body retention over the first 3 d was greater for As(III) than As(V). Comparison of autoradiograms at 1 h indicated higher uptake of As(III) in oral mucosa, stomach wall, and liver, and lower uptake in bone compared with As(V). The relatively high skeletal accumulation of As(V) was attributed to substitution of arsenate ions for the physiologically similar phosphate ions in bone crystal. Comparisons at 24 h indicated similar distributions of activity administered in the different forms, except for higher skeletal uptake of activity administered as As(V). (355) Trivalent arsenic is oxidised in the body to arsenites that are methylated in the liver and, to a lesser extent, in other tissues to form methylarsonic acid (MMA) and dimethylarsinic acid (DMA), which are excreted in urine at a relatively high rate. Buchet et al. (1981a) compared rates of urinary excretion of arsenic and its metabolites following a single oral intake of sodium arsenite (Asi), MMA, or DMA by healthy adult men aged 27–42 y. Total urinary arsenic over 4 d represented 46%, 78%, and 75% of arsenic ingested as Asi, MMA, and DMA, respectively. The time post exposure at which 50% of the 4-d excretion was reached was <4 h for intake of MMA, 11 h for DMA, and 28 h for Asi. (356) Activity concentrations were measured in post-mortem tissues of an adult female cancer patient who was administered 76As intravenously 20 h before death (Ducoff et al., 1948). The highest concentration was found in the liver, followed by the kidneys. Normalised to the concentration of 1.0 in the liver, the concentrations decreased in the order: kidneys (0.64) > spleen, heart, marrow, lymph nodes, stomach, pancreas, muscle, small intestine, and lung (0.23–0.35) > adrenals, ovary, thyroid, and skin (0.14–0.18) > brain and femoral cortical bone (0.05). (357) Mealey et al. (1959) summarised observations of the systemic behaviour of 74As in >100 patients administered 74As(III) intravenously for brain tumour localisation. In four patients followed up to 10 d, blood clearance C(t) of 74As expressed as % dosage L−1 blood at t h (t ≥ 0.25), was described by a sum of three exponential terms:
(358) Pomroy et al. (1980) studied the biokinetics of 74As in six healthy adult male subjects (aged 28–60 y) following its oral administration as arsenic acid [As(V)]. Total-body retention was measured externally for periods up to 103 d, and losses in urine and faeces were measured up to 7 d. The pooled measurements of total-body retention were fit by a sum of three exponential terms indicating Tb of 2.1 d (65.9%), 9.5 d (30.4%), and 38.4 d (3.7%). Cumulative urinary and faecal excretion of 74As over the first 7 d represented, on average, 62% and 6%, respectively, of the administered amount. The portions of faecal losses representing unabsorbed and endogenously secreted activity could not be determined. The excretion patterns are qualitatively consistent with findings of Mealey et al. (1959) for intravenously injected 74As(III) in that most of the amount entering blood was largely excreted in urine over the next few days. However, the initial urinary excretion rate was higher in the subjects of Mealey et al. (1959): 36–56% at 4 h, compared with 18–27% at 1 d observed by Pomroy et al. (1980). (359) Zhu et al. (2010) reported medians and ranges of arsenic concentration in 17 tissues collected at autopsy from up to 68 adult males from four regions of China, and in blood of 16 living subjects from the same regions. The highest median concentration was found in the ribs (102 µg kg−1 wet mass), followed by the thyroid (53) and liver (41). Concentrations in blood and the remaining 14 tissues were in the range of 19–38 µg kg−1. Based on the observed median concentrations of arsenic in tissues and reference masses of tissues, ∼38% of total-body arsenic was contained in bone, 29% in muscle, 11% in fat, 5% in blood, 4% in skin, 3% in liver, and 10% in remaining tissues. (360) In biokinetic studies of inorganic arsenic in laboratory animals, the liver and kidneys usually show high concentrations of arsenic soon after administration of either As(III) or As(V) (Ducoff et al., 1948; Marafante et al., 1981; Lindgren et al., 1982). This is consistent with findings for human subjects (Ducoff et al., 1948; Mealey et al., 1959).

19.2.3.2. Biokinetic model for systemic arsenic
(361) The structure of the biokinetic model for systemic arsenic applied in this publication is shown in Fig. 19.1. Transfer coefficients are listed in Table 19.3. (362) The model is assumed to apply to both As(III) and As(V). Where differences in the kinetics of these two forms are indicated by data from human or animal studies, preference was given to data for As(V). The model was designed for consistency of predictions with the central whole-body retention data determined in human subjects in the study by Pomroy et al. (1980), and reasonable consistency with the early systemic behaviour of inorganic arsenic in human subjects and laboratory animals. Reasonable consistency with the long-term systemic distribution of arsenic in adult humans indicated by autopsy data (Zhu et al., 2010) was required. The model predicts high accumulation of arsenic in the kidneys and liver soon after uptake to blood, but removal of the preponderance of accumulated arsenic from both organs over the next few days. Predicted long-term cumulative urinary and faecal losses represent ∼95 and ∼5% of total excretion of arsenic. Transfer coefficients in the biokinetic model for systemic arsenic. RBC, red blood cells. Daily excretion of 68Ge following inhalation of 1 Bq Type F. Daily excretion of 68Ge following inhalation of 1 Bq Type M. Daily excretion of 68Ge following inhalation of 1 Bq Type S. Structure of the biokinetic model for systemic arsenic. RBC, red blood cells.


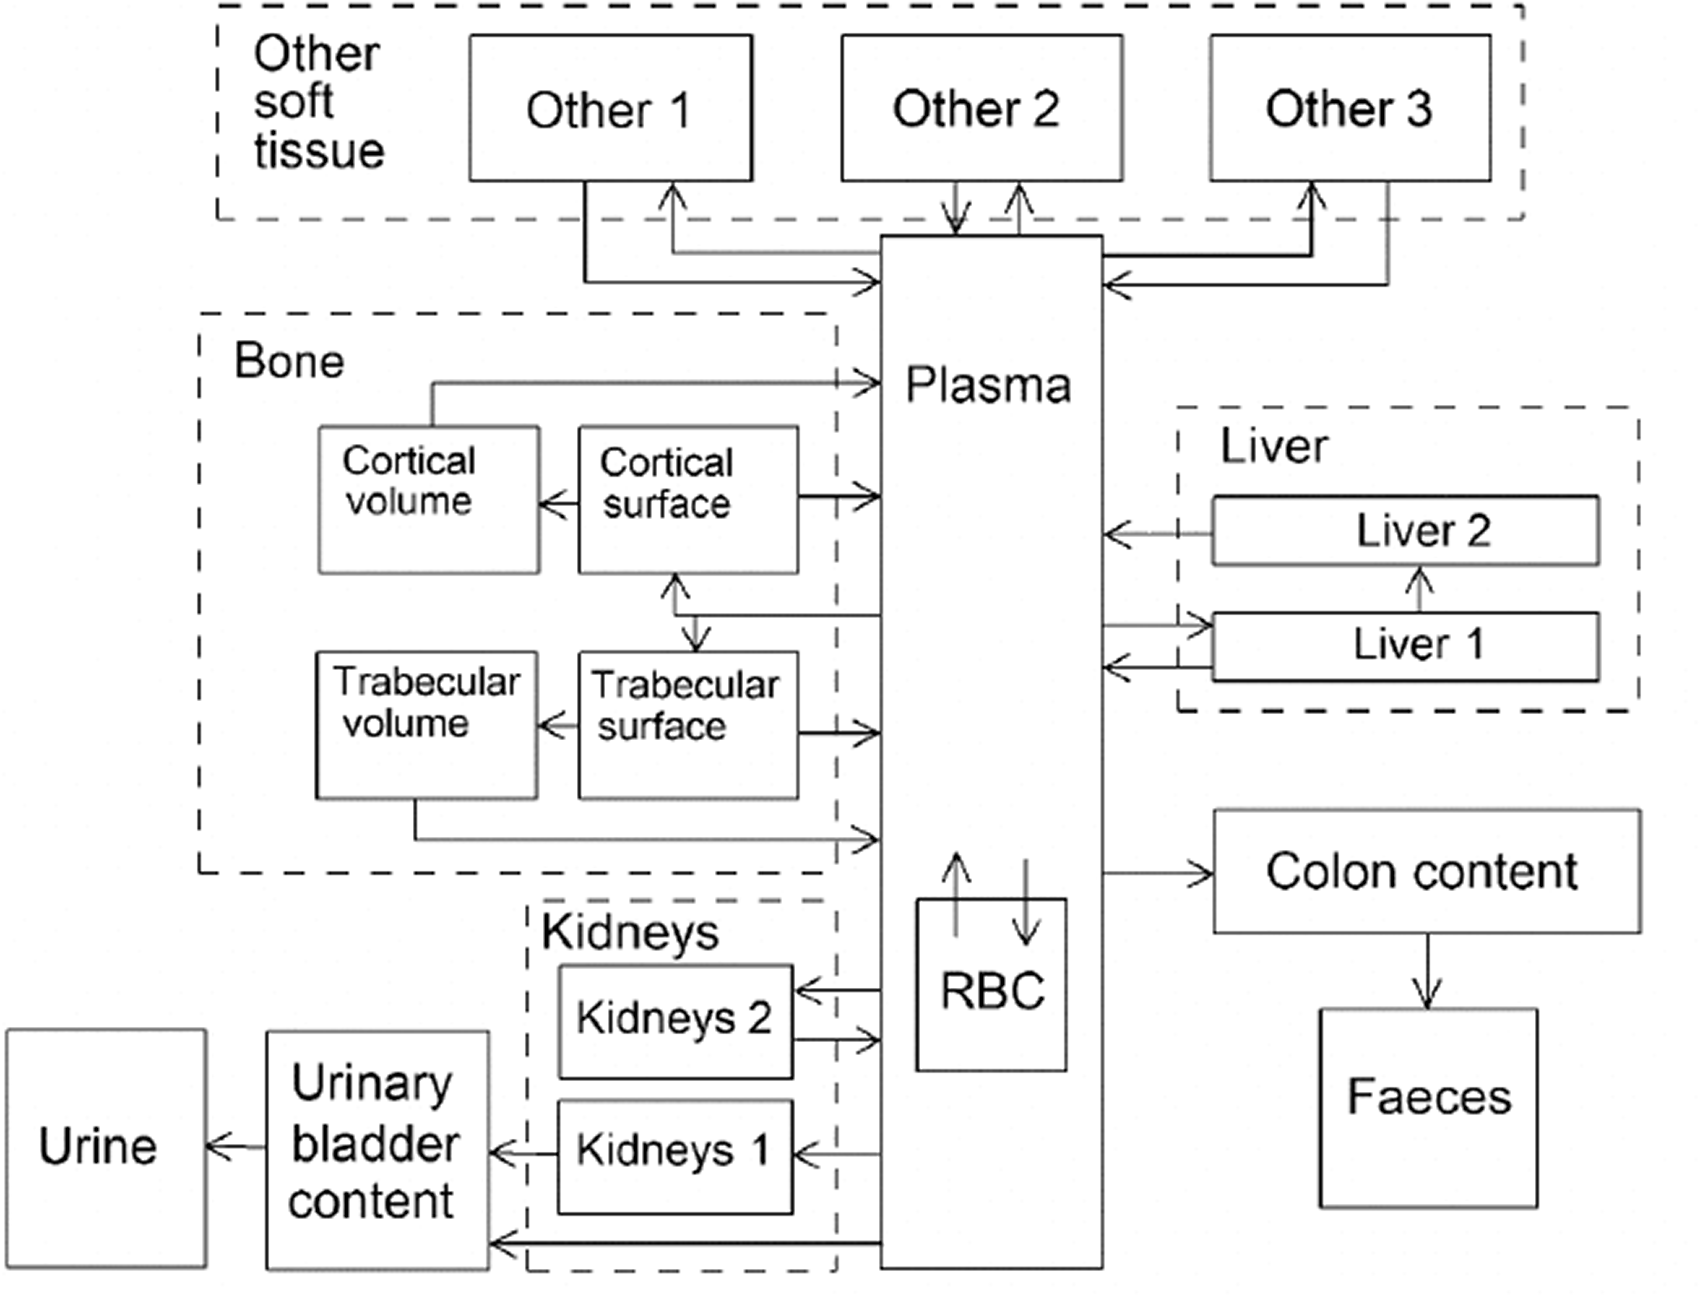
19.2.3.3. Treatment of progeny
(363) Progeny of arsenic addressed in this publication are radioisotopes of germanium. The model for germanium produced in systemic compartments by decay of arsenic is an expanded version of the characteristic model for germanium, with added compartments and associated transfer coefficients needed to solve the linked biokinetic models for arsenic and germanium. Germanium produced in compartments of the model for arsenic that are not addressed in the characteristic model for germanium is assumed to transfer to the central blood compartment of the germanium model at a rate of 1000 d−1 and to follow the characteristic model for germanium thereafter.
19.3. Individual monitoring
(364) Information regarding the detection limit for routine individual measurement is not available.
19.4. Dosimetric data for arsenic
20. Selenium (Z = 34)
20.1. Isotopes
20.2. Routes of intake
20.2.1. Inhalation
(365) No information was found on the behaviour of inhaled selenium in man. Information on the absorption of selenium from the respiratory tract is available from experimental studies of forms of selenium including selenious acid (H2SeO3) and elemental selenium, which were conducted mainly to investigate the potential health hazard of selenium emitted during fossil fuel combustion. Absorption parameter values and types, and associated fA values for particulate forms of selenium are given in Table 20.2. Committed effective dose coefficients (Sv Bq−1) for the inhalation or ingestion of 76As compounds. AMAD, activity median aerodynamic diameter. Isotopes of selenium addressed in this publication. EC, electron-capture decay; B+, beta-plus decay; B−, beta-minus decay; IT, isomeric transition decay. Dose coefficients and bioassay data for this radionuclide are given in the printed copy of this publication. Data for other radionuclides listed in this table are given in the online electronic files on the ICRP website. Absorption parameter values for inhaled and ingested selenium. It is assumed that the bound state can be neglected for selenium (i.e. fb = 0). The values of sr for Type F, M, and S forms of selenium (30, 3, and 3 d−1, respectively) are the general default values. Materials (e.g. selenium dioxide) are generally listed here where there is sufficient information to assign to a default absorption type, but not to give specific parameter values (see text). For inhaled material deposited in the respiratory tract and subsequently cleared by particle transport to the alimentary tract, the default fA values for inhaled materials are applied [i.e. the product of fr for the absorption type and the fA value for ingested soluble forms of selenium (0.8)]. Default Type M is recommended for use in the absence of specific information on which the exposure material can be assigned to an absorption type (e.g. if the form is unknown, or if the form is known but there is no information available on the absorption of that form from the respiratory tract). For guidance on the use of specific information, see Section 1.1. Activity transferred from systemic compartments into segments of the alimentary tract is assumed to be subject to reabsorption to blood. The default absorption fraction fA for the secreted activity is the reference fA (0.8) for ingestion of the radionuclide.
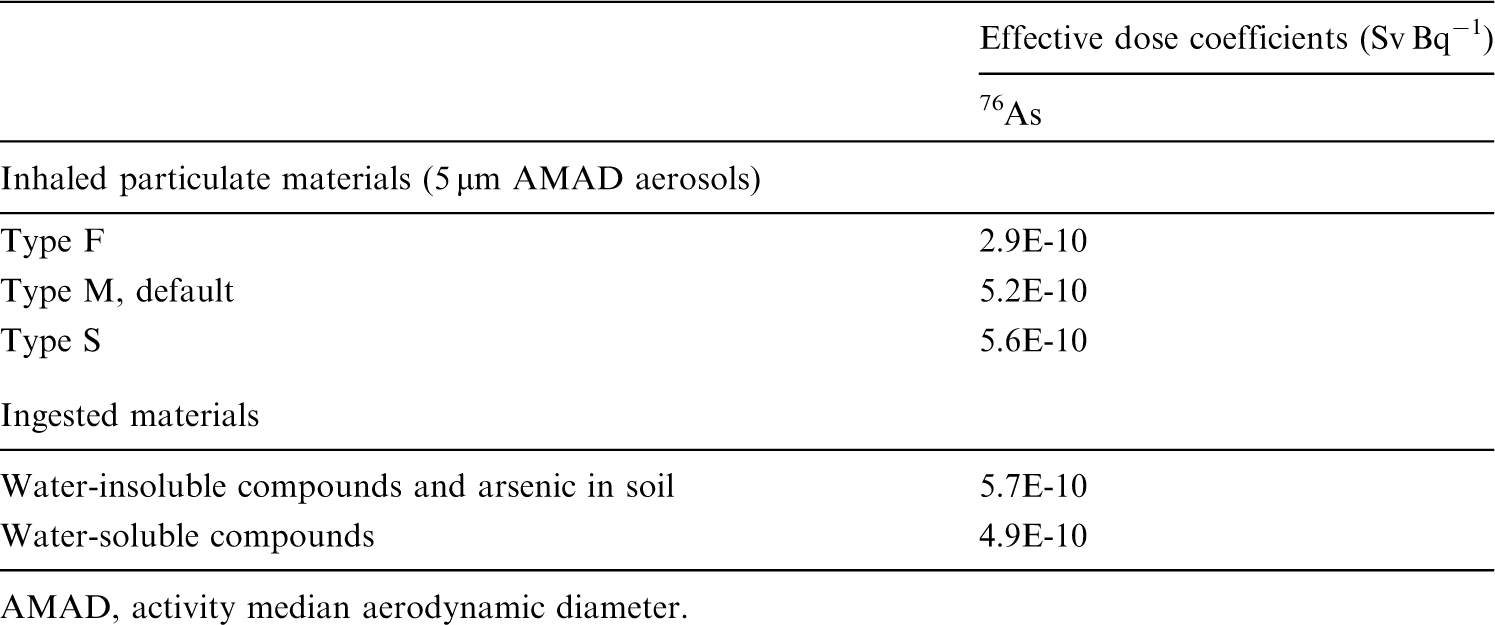
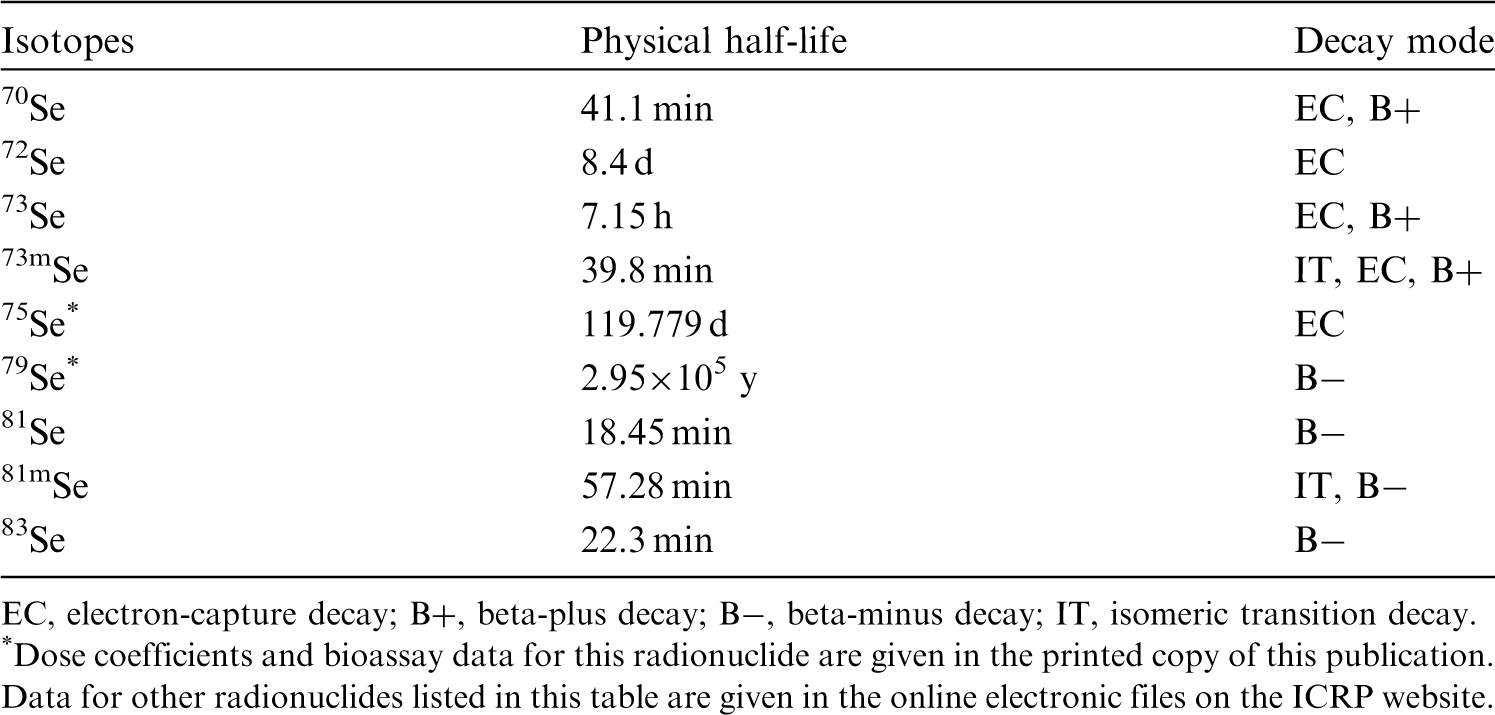
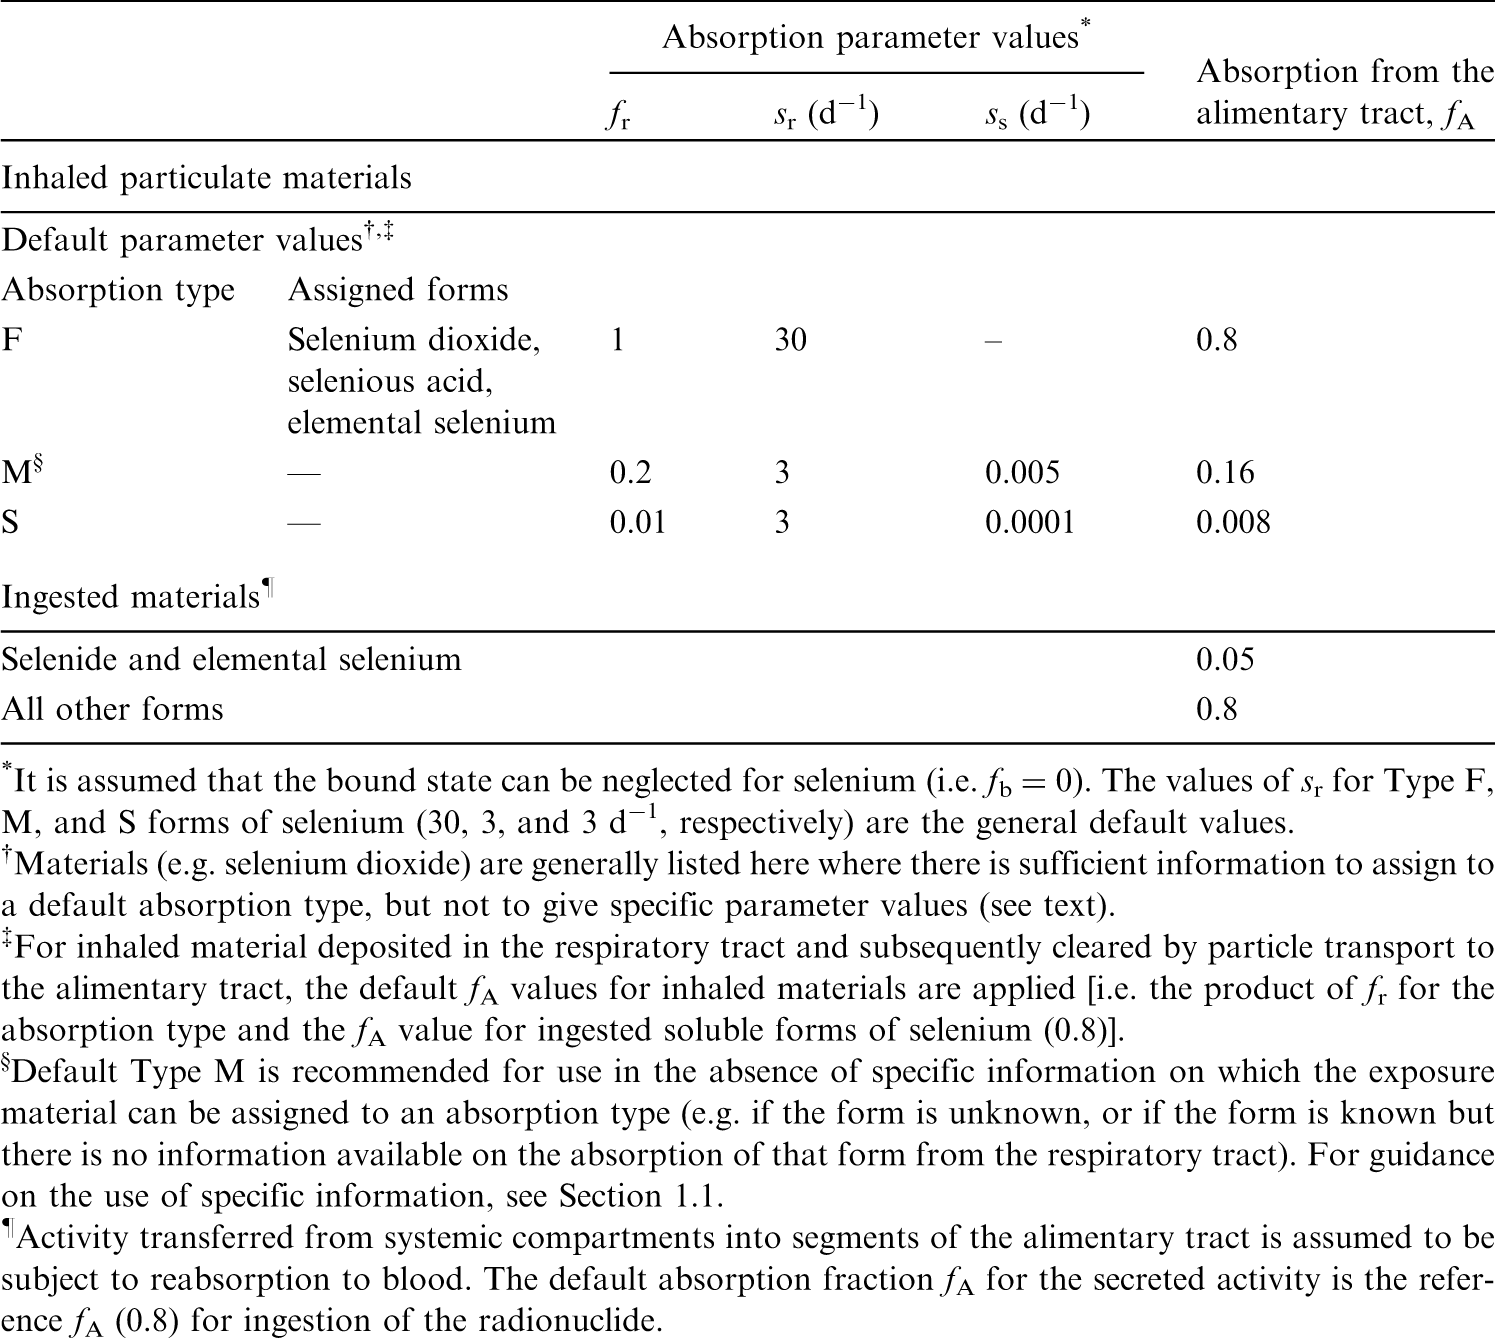
20.2.1.1. Particulate materials
(a) Selenious acid (H2SeO3)
(366) Medinsky et al. (1981) followed the biokinetics of 75Se for 72 d after inhalation of 75Se-labelled selenious acid by rats. The aerosol was heated to 150℃ to form mainly selenium dioxide (SeO2), but this subsequently rehydrated to selenious acid soon after contact with moist air (Burkstaller et al., 1977; Heisler Weissman and Cuddihy, 1979). Complementary experiments were conducted in which the biokinetics of 75Se were followed for 4 d after administration of 75Se-labelled selenious acid to rats by intravenous injection, nasal instillation, gavage, and cutaneous application (Medinsky et al., 1981). The authors estimated that ∼94% of the initial alveolar deposit (IAD) was absorbed by the time of the first measurement of tissue distribution, at 4 h. Medinsky et al. (1981) applied simulation modelling to the results, and represented the absorption of selenium from the respiratory tract by an absorption function (fractional dissolution rate):
(367) This can be approximated using the HRTM with fr = 0.99, sr = 26 d−1, and ss = 0.08 d−1, consistent with assignment to Type F. (368) Weissman et al. (1983) followed the biokinetics of 75Se for 256 d after inhalation of 75Se-labelled selenious acid (heat-treated at 150℃) by beagle dogs. Complementary experiments were conducted in which the biokinetics of 75Se were followed for 4 d after administration of 75Se-labelled selenious acid to dogs by nasal instillation, intravenous injection, gavage, and in food. The authors estimated that ∼97% of the initial lung deposit (ILD) was absorbed by the time of the first measurement of tissue distribution, at 2 h, giving assignment to Type F. Assuming absorption at a constant rate, this gives a value of sr ∼40 d−1. The remaining lung content decreased with Tb of ∼30 d; however, this was similar to the retention half-time in blood and other soft tissues, and so some (if not all) of it could have been systemic activity rather than retention of ILD. The authors estimated that, following nasal instillation, ∼75% of the initial deposit was absorbed by 4 d. (369) Burkstaller et al. (1977) measured the in-vitro dissolution of 75Se-labelled selenious acid (heat-treated at 150℃), as used in the rat and dog inhalation experiments summarised above. Similar results were obtained with four different solvents: 95–97% dissolved within 0.85 d, and the rest at 0.1–0.4% of the original activity per day. (370) Parallel studies in rats and dogs were carried out with 75Se-labelled elemental selenium (see below). It was observed that both forms were absorbed rapidly from the respiratory tract, but selenious acid was absorbed somewhat faster. The distribution of 75Se following absorption to blood was similar in both cases. (371) Although specific parameter values for selenious acid based on in-vivo data are available, they are not adopted here because the data are used as the basis for the default rapid dissolution rate for selenium. Hence specific parameter values for selenious acid would be the same as default Type F selenium parameter values. Instead, selenious acid is assigned to Type F.

(b) Sodium selenate and selenite
(372) Rhoads and Sanders (1985) followed the biokinetics of 75Se for 14 d after intratracheal instillation of sodium selenate and selenite into rats. Results were very similar for the two compounds. Lung retention was fit by a two-component exponential function: 8% and 92% with Tb of 30 min and 1.9 d, respectively. The rapid lung clearance was mainly by absorption to blood, and also consistent with assignment to Type F.
(c) Elemental selenium
(373) Medinsky et al. (1981) followed the biokinetics of 75Se for 72 d after inhalation of 75Se-labelled elemental selenium particles by rats. Complementary experiments were conducted in which the biokinetics of 75Se were followed for 4 d after administration of 75Se-labelled selenious acid to rats by intravenous injection, nasal instillation, gavage, and cutaneous application (Medinsky et al., 1981). The authors estimated that ∼57% of IAD was absorbed by the time of the first measurement of tissue distribution at 4 h. Medinsky et al. (1981) applied simulation modelling to the results, in which they represented the absorption of selenium from the respiratory tract by an absorption function (fractional dissolution rate):
(374) This can be approximated using the HRTM with fr = 0.92, sr = 18 d−1, and ss = 0.08 d−1, consistent with assignment to Type F. (375) Weissman et al. (1983) followed the biokinetics of 75Se for 256 d after inhalation of 75Se-labelled elemental selenium by beagle dogs. Complementary experiments were conducted in which the biokinetics of 75Se were followed for 4 d after administration of 75Se metal to dogs by nasal instillation, gavage, and in food. The authors estimated that ∼80% ILD was absorbed by the time of the first measurement of tissue distribution, at 2 h, indicating assignment to Type F. Assuming absorption at a constant rate, this gives a value of sr ∼20 d−1. The remaining lung content decreased with a half-time of ∼30 d; this was similar to Tb in blood and other soft tissues, and so some (if not all) of it could have been systemic activity rather than retention of ILD. The authors estimated that following nasal instillation, ∼50% of the initial deposit was absorbed by 4 d. (376) Although specific parameter values for elemental selenium based on in-vivo data are available, they are not adopted here because the specific values would be similar to those for default Type F. Instead, elemental selenium is assigned to Type F.

(d) Copper gallium diselenide and copper indium diselenide
(377) As part of a toxicological study of novel compounds used in the photovoltaic and semiconductor industries, Morgan et al. (1997) measured tissue concentrations of copper, gallium, and selenium up to 28 d after administration of copper gallium diselenide to rats by intratracheal instillation. There was no appreciable lung clearance or extrapulmonary accumulation of any of these elements, suggesting Type S behaviour. In a similar study with copper indium diselenide, Morgan et al. (1997) detected no change in lung concentrations of copper, indium, or selenium. The concentration of indium (but not that of copper or selenium) in extrapulmonary tissues increased, suggesting Type M behaviour.
20.2.1.2. Rapid dissolution rate for selenium
(378) Evidence from the experimental studies outlined above shows that absorption is rapid. Values of sr estimated for selenious acid were ∼30–40 d−1, which is close to the general default value of 30 d−1, applied here to all Type F forms of selenium.
20.2.1.3. Extent of binding of selenium to the respiratory tract
(379) Evidence from the experimental studies outlined above suggests that there is probably little binding of selenium. It is therefore assumed that the bound state can be neglected for selenium (i.e. fb = 0.0).
20.2.2. Ingestion
(380) Selenium is an essential trace element. Several reviews of its behaviour in the body have been published (Muth et al., 1967; Frost and Lish, 1975; Underwood, 1977; Levander, 1987; Alexander et al., 1988; Magos and Berg, 1988; Dainty, 2001; ATSDR, 2003). Most of the available information about intestinal absorption refers to dietary selenium and was obtained from balance studies, and stable isotope and radiotracer experiments, many of which were originally carried out in New Zealand where selenium intake is particularly low. Considerably less information is available for other organic and inorganic forms of selenium, especially for those most commonly found in the workplace. For selenomethionine, mean values >0.95 have been reported by Griffiths et al. (1976), Swanson et al. (1983), and Moser-Veillon et al. (1992), whereas Robinson et al. (1978) found absorption of 0.75. A fairly wide range of values (0.4–0.9) have been reported for selenium administered as selenite (Thomson and Stewart, 1974; Janghorbani et al., 1982, 1984; Martin et al., 1989; Patterson et al., 1989; Moser-Veillon et al., 1992). The variations were sometimes observed between studies made by the same group, with the authors being unable to provide a clear interpretation of the findings. Thomson and Robinson (1986) found that absorption of selenium from selenates was superior to that from selenites (0.94 ± 0.04 vs 0.62 ± 0.14). The absorption of elemental selenium appears to be much lower; a value of 0.03 was reported by Robinson et al. (1985) after selenite had been reduced with ascorbic acid. ATSDR (2003) notes that the estimated low intestinal absorption of elemental selenium is consistent with its relatively low toxicity. (381) Results for selenium absorption in animals are in the same range as the human data and show a similar effect of chemical form. Absorption values >0.9 were observed in rats, mice, and dogs for selenomethionine and selenites (Graham et al., 1971; Thomson and Stewart, 1973; Furchner et al., 1975), whereas monkeys showed, in comparison, lower values of absorption for selenites (Furchner et al., 1975). Lower values were also reported for elemental selenium and selenides (Luckey et al., 1975; Nishimura et al., 1991; Archimbaud et al., 1992). (382) In-vivo studies of rats (Whanger et al., 1976) showed that intestinal absorption occurred mainly in the duodenum and, to a lesser extent, in the jejunum and ileum. Absorption of selenium from seleniomethionine was not significantly lower than from sodium selenate (Finley, 1998). On the other hand, in-vivo experiments with ligated rat intestines (Vendeland et al., 1992) and in-vitro experiments with membrane vesicles from rat intestines (Vendeland et al., 1992, 1994) showed significant differences in the velocity and extent of intestinal absorption of selenium from selenocysteine, selenodiglutathione, sodium selenite, or sodium selenate from different parts of the intestines. (383) In Publication 30 (ICRP, 1981), the recommended absorption values were 0.05 for elemental selenium and selenides, and 0.8 for all other compounds. In Publication 69 (ICRP, 1995a), a value of 0.8 was applied to dietary forms. The Publication 30 values are used here; that is, fA = 0.05 for selenides and elemental selenium, and 0.8 for all other compounds.
20.2.3. Systemic distribution, retention, and excretion of selenium
20.2.3.1. Biokinetic data
(384) The biological behaviour of selenium has been investigated extensively in human subjects and laboratory animals, primarily in connection with studies of selenium nutrition and use of 75Se as a diagnostic tool in nuclear medicine (Jereb et al., 1975; Hawkes et al., 2003; Burk, 1976). The systemic behaviour of selenium does not appear to depend strongly on the chemical form administered. (385) Results of human studies (Lathrop et al., 1968, 1972; Falk and Lindhe, 1974; Jereb et al., 1975; Johnson, 1977; Toohey et al., 1979) indicate that total-body retention of ingested or intravenously injected selenium can be described as a sum of three exponential terms representing Tb in the range of 0.5–7 d for the short-term component of retention, 20–70 d for the intermediate-term component, and 120–330 d for the long-term component (ICRP, 1995a). The following retention curve appears to be a reasonable central estimator of the percentage R(t) retained at time t (d) following intravenous administration of selenium to adult subjects:
(386) Selenium is non-uniformly distributed in systemic tissues at all times after uptake to blood. In both human and animal studies, the highest concentrations at early times after ingestion or injection are typically seen in the kidneys and liver, with the spleen, pancreas, and testes also showing elevated concentrations compared with the average for the whole body (Wright and Bell, 1966; Lathrop et al., 1972; Furchner et al., 1975; ICRP, 1981, 1995a). In autopsy studies of human subjects, these same tissues also generally show elevated concentrations of stable selenium compared with the average concentration in the body. Data from a modern study (Zhu et al., 2010) involving measurement of selenium concentrations in tissues of 68 cadavers and blood concentrations in 10 living subjects indicate the following distribution of stable selenium: blood, 6.3% (of total-body selenium); liver, 6.7%; kidneys, 3.2%; spleen, 0.6%; pancreas, 0.4%; bone, 11.9%; testes, 0.2%; and remaining tissues, 70.7%. (387) Lathrop et al. (1972) reviewed biokinetic data for selenium arising from investigations or applications of 75Se-L-selenomethionine as a diagnostic agent. Following intravenous administration of a single dose, ∼14% (range 7.5–18.2%) of the injected amount was recovered in urine and faeces during the first 120 h, with urinary loss representing, on average, approximately 4.5 times faecal loss. Observations over ≥2 y after acute administration indicated that ∼80% of the biological removal was in urine and ∼15% was in faeces. Measurements of activity in expired breath at early times indicated that ∼1% of the injected amount was lost by this route. No losses appeared to occur by sweat during the first 2–3 d. Measurements of activity in hair, nails, and skin of one subject indicated a total loss of ∼4% by these routes during the first 280 d. Blood, liver, muscle, and skin contained ∼15%, ∼20%, ∼34%, and ∼7%, respectively, of total-body activity at 1 d after administration. The systemic distribution changed gradually over several months, with blood, liver, muscle, and skin containing ∼8%, ∼3%, ∼56%, and ∼3%, respectively, of total-body activity at 300 d and 600 d after administration.

20.2.3.2. Biokinetic model for systemic selenium
(388) The systemic model applied here to selenium in the adult is a recycling model that consists of compartments representing blood, liver, kidneys, spleen, pancreas, trabecular bone surface, cortical bone surface, and gonads. Transfer coefficients are set for reasonable consistency with: total-body retention as described by Eq. (20.1); typical relative contents of selenium in the modelled compartments in the early days after acute input of selenium to blood, as judged from reported human and animal studies; and the distribution and total-body content of stable selenium in the body based on the study by Zhu et al. (2010). (389) The model structure is shown in Fig. 20.1. The transfer coefficients are listed in Table 20.3. Transfer coefficients (d−1) in the biokinetic model for systemic selenium. RBC, red blood cells. ST, soft tissue ST1 and ST2 are compartments of other soft tissues representing two phases of biological removal to blood. Structure of the biokinetic model for systemic selenium. RBC, red blood cells. ST, soft tissue. ST1 and ST2 are compartments of other soft tissues representing two phases of biological removal to blood.
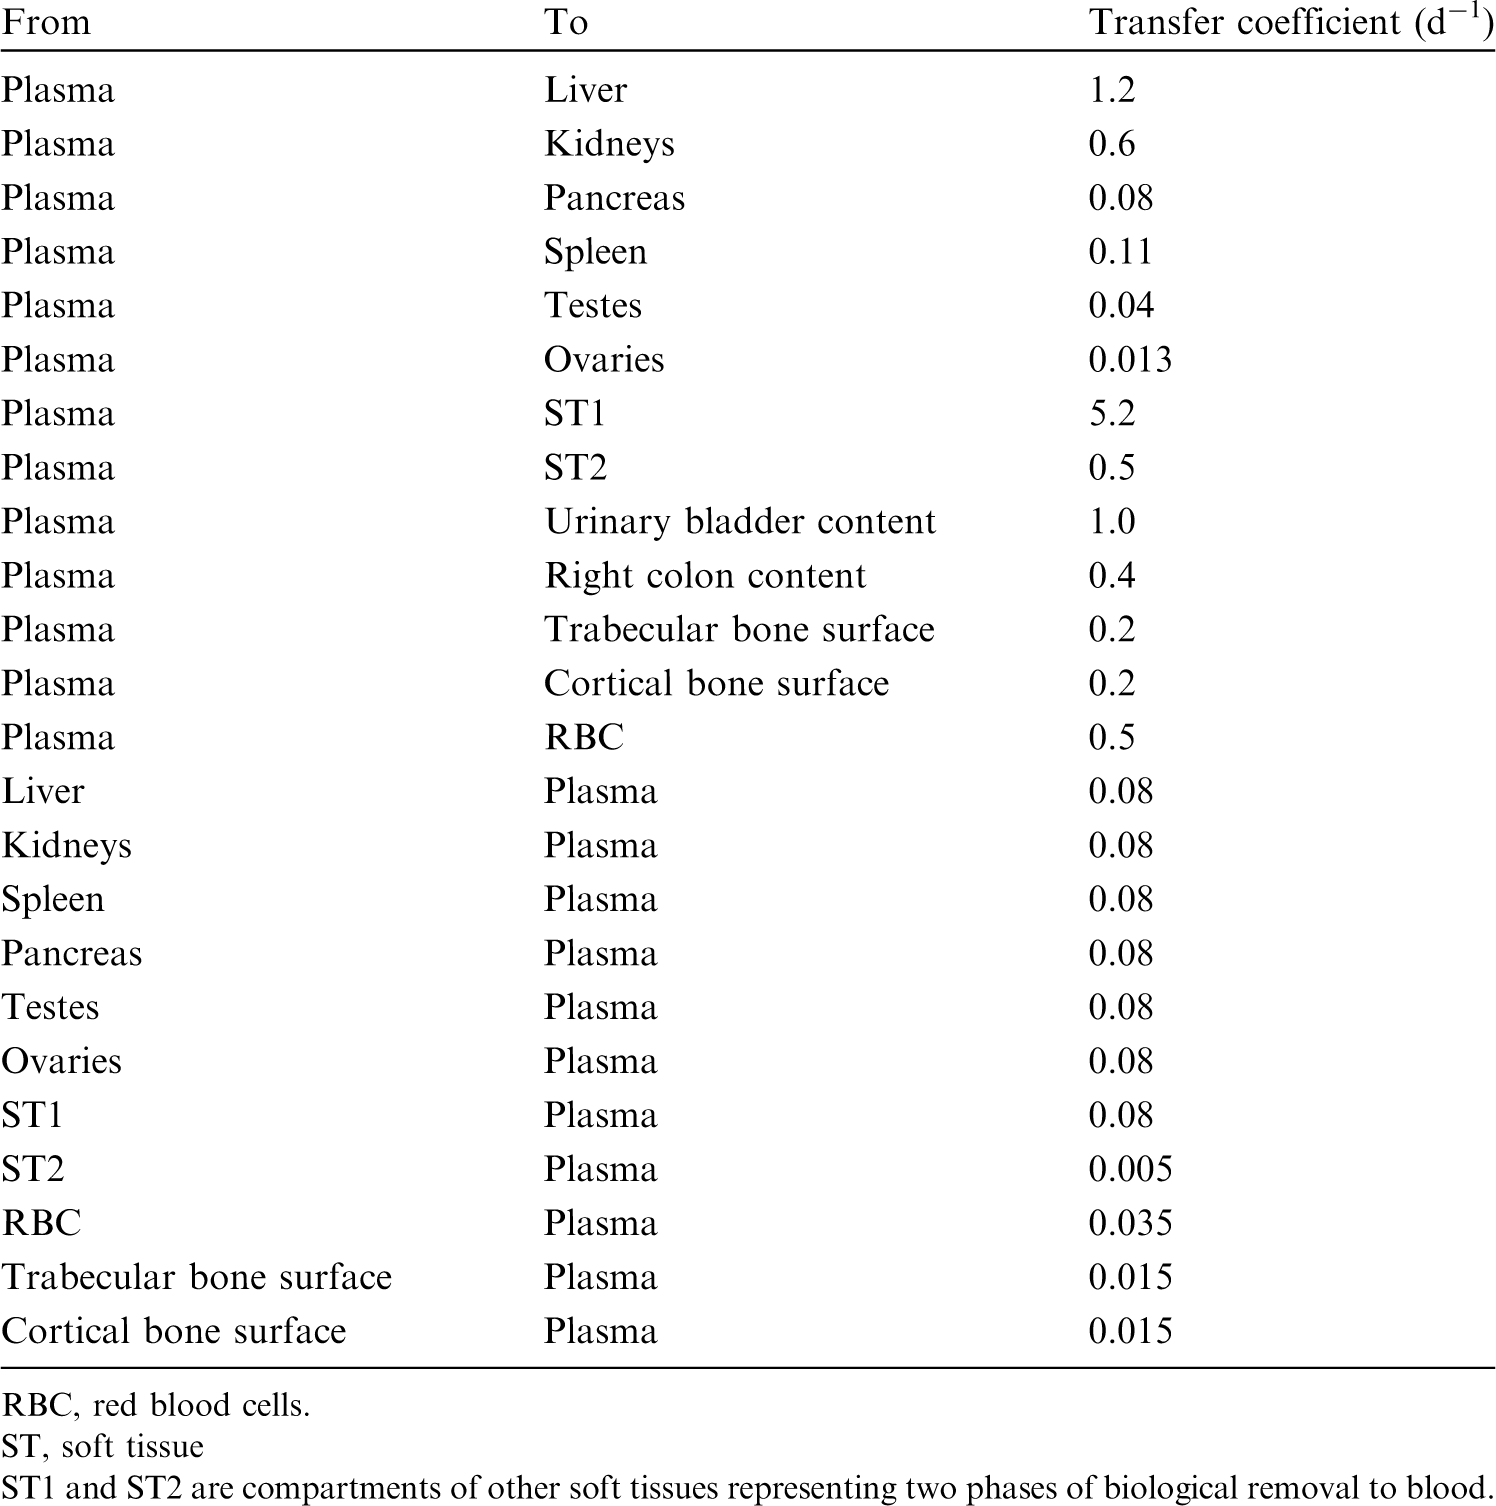

20.2.3.3. Treatment of progeny
(390) Progeny of selenium addressed in this publication are isotopes of selenium, krypton, bromine, and arsenic. The model for selenium as a parent is applied to selenium as a progeny of selenium. Krypton produced in a tissue compartment is assumed to transfer to blood with a half-time of 15 min, and to be removed from blood to the environment (exhaled) at a rate of 1000 d−1. For application to bromine as a progeny of selenium, the characteristic model for bromine was expanded to include explicitly all tissues addressed in the selenium model. Deposition fractions for the tissues added to the bromine model were based on the mass fractions (of total body) of these tissues in the adult male. The assigned rates of transfer of bromine from blood to added tissues are as follows: liver, 5.4 d−1; kidneys, 0.94 d−1; pancreas, 0.42 d−1; spleen, 0.45 d−1; testes, 0.1 d−1; and ovaries, 0.033 d−1. The transfer rate from blood to bromine’s ‘Other’ was reduced to 192.66 d−1 to leave the total outflow rate from blood unchanged. A removal half-time to blood of 15 d−1 was assigned to each of the added compartments. For an arsenic isotope produced in a compartment not contained in the characteristic model for arsenic, the isotope was assumed to transfer to the central blood compartment of the characteristic model for arsenic at a rate of 1000 d−1 if produced in a blood compartment and 0.6 d−1 if produced in a tissue compartment, and to follow the characteristic model for arsenic thereafter.
20.3. Individual monitoring
20.3.1. 75Se
(391) Measurements of 75Se may be performed by in-vivo whole-body measurement technique and by gamma measurement in urine.
20.4. Dosimetric data for selenium
21. Bromine (Z = 35)
21.1. Isotopes
21.2. Routes of intake
21.2.1. Inhalation
(392) For bromine, default parameter values were adopted for absorption to blood from the respiratory tract (ICRP, 2015). For bromine and the other halogens, intakes could be in both particulate and gas and vapour forms, and it is therefore assumed that inhaled bromine is 50% particulate and 50% gas/vapour in the absence of information (ICRP, 2002b). Absorption parameter values and types, and associated fA values for gas and vapour forms of bromine are given in Table 21.2 and for particulate forms in Table 21.3. By analogy with the halogen iodine, considered in detail in Publication 137 (ICRP, 2017), default Type F is recommended for particulate forms in the absence of specific information on which the exposure material can be assigned to an absorption type. Monitoring techniques for 75Se. Measurement system comprised of germanium detectors. Counting time of 20 min. Committed effective dose coefficients (Sv Bq−1) for the inhalation or ingestion of 75Se and 79Se compounds. AMAD, activity median aerodynamic diameter. Dose per activity content of 75Se in total body and in daily excretion of urine (Sv Bq−1); 5 µm activity median aerodynamic diameter aerosols inhaled by a reference worker at light work. Isotopes of bromine addressed in this publication. EC, electron-capture decay; B+, beta-plus decay; B−, beta-minus decay; IT, isomeric transition decay. Dose coefficients and bioassay data for this radionuclide are given in the printed copy of this publication. Data for other radionuclides listed in this table are given in the online electronic files on the ICRP website. Deposition and absorption for gas and vapour compounds of bromine. ET1, anterior nasal passage; ET2, posterior nasal passage, pharynx, and larynx; BB, bronchial; bb, bronchiolar; AI, alveolar-interstitial. Percentage deposited refers to how much of the material in the inhaled air remains in the body after exhalation. Almost all inhaled gas molecules contact airway surfaces, but usually return to the air unless they dissolve in, or react with, the surface lining. The default distribution between regions is assumed: 20% ET2, 10% BB, 20% bb, and 50% AI. It is assumed that the bound state can be neglected for bromine (i.e. fb = 0). For inhaled material deposited in the respiratory tract and subsequently cleared by particle transport to the alimentary tract, the default fA values for inhaled materials are applied [i.e. the product of fr for the absorption type (or specific value where given) and the fA value for ingested soluble forms of bromine (1)]. Absorption parameter values for inhaled and ingested bromine. It is assumed that the bound state can be neglected for bromine (i.e. fb = 0). The values of sr for Type F, M, and S forms of bromine (30, 3, and 3 d−1, respectively) are the general default values. For inhaled material deposited in the respiratory tract and subsequently cleared by particle transport to the alimentary tract, the default fA values for inhaled materials are applied [i.e. the product of fr for the absorption type and the fA value for ingested soluble forms of bromine (1)]. Default Type F is recommended for use in the absence of specific information on which the exposure material can be assigned to an absorption type (e.g. if the form is unknown, or if the form is known but there is no information available on the absorption of that form from the respiratory tract). For guidance on the use of specific information, see Section 1.1. Activity transferred from systemic compartments into segments of the alimentary tract is assumed to be subject to reabsorption to blood. The default absorption fraction fA for the secreted activity is the highest value for any form of the radionuclide (fA = 1).
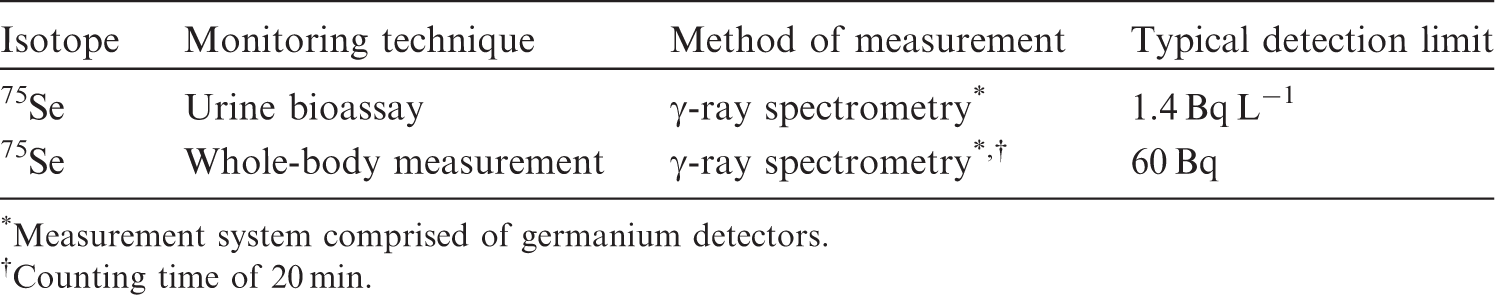
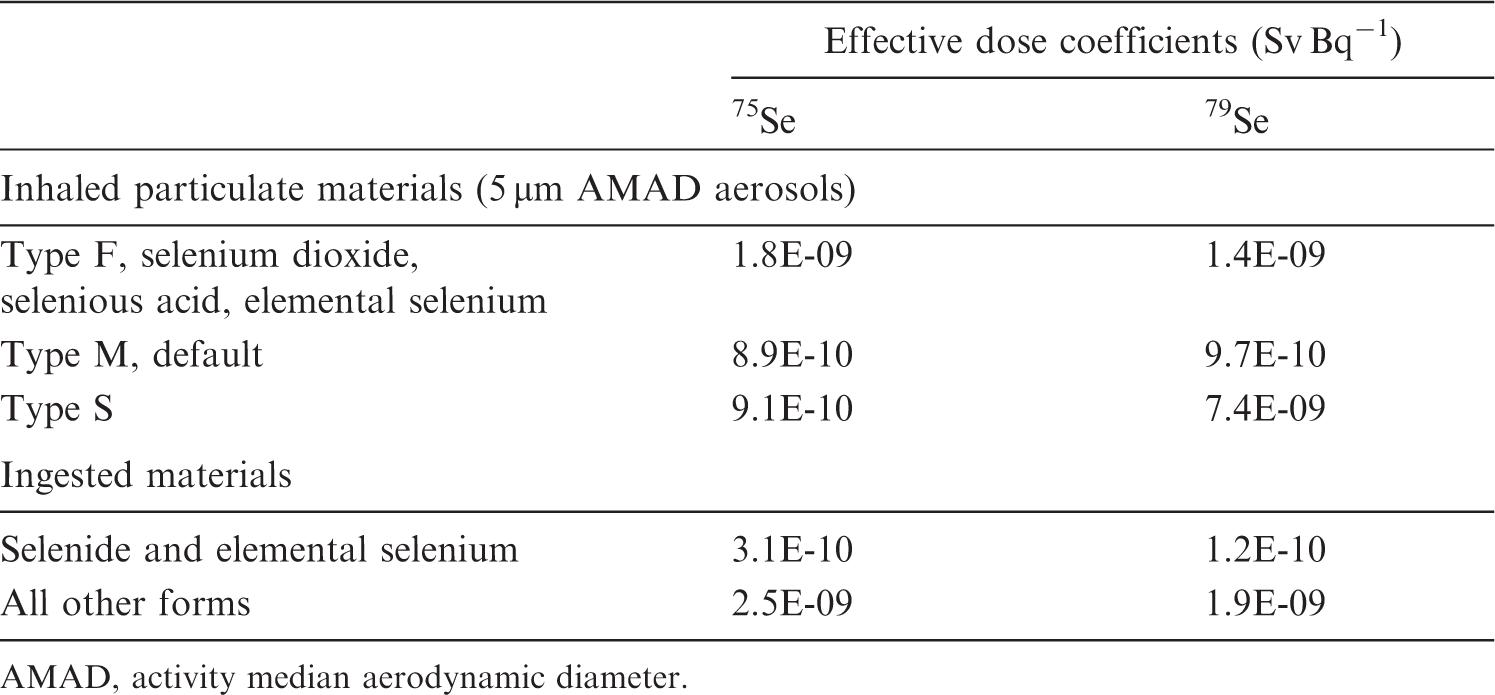


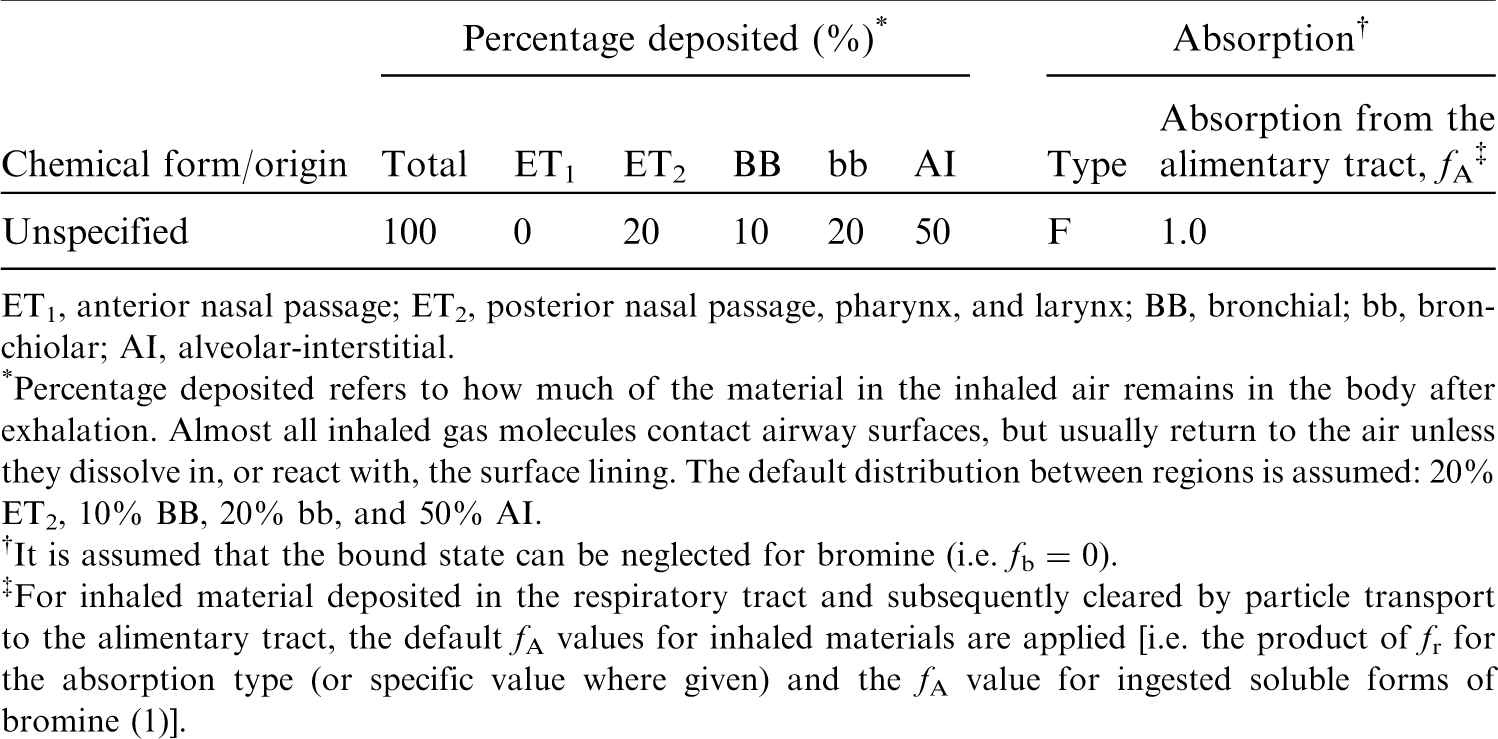

21.2.2. Ingestion
(393) After ingestion, the bromide Br− (Söremark, 1960a; Rauws, 1983; Food and Agriculture Organization of the United Nations, 1989) and bromate BrO3− (US EPA, 2001) ions are rapidly and completely absorbed in the gastrointestinal tract. In Publications 30 and 68 (ICRP, 1980, 1994a), f1 was taken to be 1 for bromide. In this publication, fA = 1 is used for all chemical forms of bromine.
21.2.3. Systemic distribution, retention, and excretion of bromine
21.2.3.1. Biokinetic data
(394) Inorganic bromide is the dominant form of bromine in the human body. The systemic kinetics of bromide closely resemble those of chloride (Reid et al., 1956; Pavelka, 2004). Ingested bromide is absorbed rapidly and nearly completely to blood, and is largely cleared from blood within a few minutes (Ray et al., 1952). It is distributed mainly in extracellular fluids where it replaces part of the extracellular chloride, with the molar sum of chloride and bromide remaining constant at ∼110 mmol L−1 (Pavelka, 2004). (395) Tb of bromide in the human body is ∼12 d (Söremark, 1960b), compared with an estimated half-time of 8–15 d for chloride (Ray et al., 1952). Tb of bromide or chloride in the body can be reduced considerably by elevated intake of chloride, and increased considerably by a salt-deficient diet.
21.2.3.2. Biokinetics of systemic bromine
(396) The systemic behaviour of bromine is assumed to be the same as that of chlorine. The relevant physiological forms of bromine and chlorine are assumed to be bromide and chloride, respectively. The common biokinetic model for bromide and chloride is based on the assumptions of rapid removal from blood (half-time 5 min), a uniform distribution in tissues, removal of 50% of absorbed bromide or chloride from the body in 12 d, and a urinary:faecal excretion ratio of 100:1. These conditions are approximated, using a first-order recycling model, with the transfer coefficients listed in Table 21.4. Transfer coefficients in the biokinetic model for systemic bromine.

21.2.3.3. Treatment of progeny
(397) Progeny of bromine addressed in this publication are radioisotopes of bromine, krypton, and selenium. The model for bromine as a parent is assigned to bromine as a progeny. Krypton produced in tissues is assumed to transfer to blood with a half-time of 15 min and from blood to the environment (via exhalation) at a rate of 1000 d−1. Selenium produced in a tissue is assumed to transfer to blood at a rate of 0.08 d−1 and then to follow the characteristic model for selenium.
21.3. Individual monitoring
(398) Information regarding the detection limit for routine individual measurement is not available.
21.4. Dosimetric data for bromine
22. Rubidium (Z = 37)
22.1. Isotopes
22.2. Routes of intake
22.2.1. Inhalation
(399) For rubidium, default parameter values were adopted on absorption to blood from the respiratory tract (ICRP, 2015). Absorption parameter values and types, and associated fA values for particulate forms of rubidium are given in Table 22.2. Committed effective dose coefficients (Sv Bq−1) for the inhalation or ingestion of 76Br compounds. AMAD, activity median aerodynamic diameter. Isotopes of rubidium addressed in this publication. EC, electron-capture decay; B+, beta-plus decay; B−, beta-minus decay; IT, isomeric transition decay. Dose coefficients and bioassay data for this radionuclide are given in the printed copy of this publication. Data for other radionuclides listed in this table are given in the online electronic files on the ICRP website. Absorption parameter values for inhaled and ingested rubidium. It is assumed that the bound state can be neglected for rubidium (i.e. fb = 0). The values of sr for Type F, M, and S forms of rubidium (30, 3, and 3 d−1, respectively) are the general default values. For inhaled material deposited in the respiratory tract and subsequently cleared by particle transport to the alimentary tract, the default fA values for inhaled materials are applied [i.e. the product of fr for the absorption type and the fA value for ingested soluble forms of rubidium (1)]. Default Type M is recommended for use in the absence of specific information on which the exposure material can be assigned to an absorption type (e.g. if the form is unknown, or if the form is known but there is no information available on the absorption of that form from the respiratory tract). For guidance on the use of specific information, see Section 1.1. Activity transferred from systemic compartments into segments of the alimentary tract is assumed to be subject to reabsorption to blood. The default absorption fraction fA for the secreted activity is the highest value for any form of the radionuclide (fA = 1).


22.2.2. Ingestion
(400) In humans, ingested rubidium chloride is absorbed rapidly and almost completely from the gastrointestinal tract (Lloyd et al., 1973; Williams et al., 1987; Leggett and Williams, 1988). In rats, Usuda et al. (2014) observed a comparable increase in serum concentration and urinary excretion of rubidium 24 h after oral administration of either the acetate, bromide, carbonate, chloride, or fluoride, with the highest increase from rubidium fluoride. In Publications 30 and 68 (ICRP, 1980, 1994a), f1 was taken as 1 for all compounds of rubidium. In the present publication, the same value of fA (1) is used for all chemical forms of rubidium in the workplace.
22.2.3. Systemic distribution, retention, and excretion of rubidium
22.2.3.1. Biokinetic data
(401) Rubidium is an alkali metal and a physiological analogue of the alkali metals potassium and caesium, located, respectively, just above and below rubidium in Group IA of the periodic table. The physiological relationship of these three predominantly intracellular alkali metals has been investigated extensively. It is well established that rubidium and caesium compete with potassium for both active and passive transport across cell membranes. The rate of membrane transport generally decreases in the order potassium ≥ rubidium > caesium, with the numerical relationship depending on the cell type and direction of transport. Typically, cell membranes show moderate discrimination between potassium and rubidium, and much greater discrimination between potassium and caesium (Relman, 1956; Sjodin, 1959; Kernan, 1969; Olsson et al., 1969; Sheehan and Renkin, 1972). (402) Measurements of rubidium and potassium concentrations in post-mortem tissues and in plasma and RBC of living subjects indicate the following approximate distributions of these two elements in an adult male human, where values are % total-body rubidium or potassium (shown as rubidium/potassium): skeletal muscle, 64/65; skeleton, 9/9; RBC, 6/8; liver, 5/3; brain, 2/3; kidneys, 0.6/0.6; blood plasma, 0.3/0.4; and remainder, 13/11 (based on Leggett and Williams, 1988; Zhu et al., 2010). (403) The residence time of absorbed rubidium in humans is typically moderately higher (∼40–50%) than the residence time of potassium (Leggett and Williams, 1986, 1988; Leggett et al., 2003). (404) Burch et al. (1955) compared plasma clearance of simultaneously administered 86Rb and 42K in each of two human subjects – one a control subject and the other with congestive heart failure – over the first 2 h after intravenous injection. The clearance curves for 86Rb and 42K were identical in the subject with heart failure. Slightly slower clearance of 86Rb than 42K was observed in the control subject. (405) Following oral administration of 83Rb to four healthy adult male subjects, plasma contained an estimated 0.31% of the ingested activity at 1 d and 0.28% at 2 d (Lloyd et al., 1972, 1973). Following administration of 86Rb to five adult male subjects, plasma contained 0.24–0.30% of injected 86Rb (Mabille et al., 1961). Plasma concentrations of intravenously administered 86Rb were measured by Burch et al. (1955) in an adult male subject over a 6-week period following injection. The plasma content remained near 0.3% of dosage from 3 to 14 d after injection, decreased to ∼0.2% at 3 weeks, and decreased to ∼0.15% at 4 weeks. (406) As is the case for potassium, >90% of rubidium in blood is contained in RBC by 1 d after absorption or injection. Lloyd et al. (1972, 1973) determined the ratio of the 83Rb concentration in RBC to that in plasma in several human subjects, some healthy and some with muscle disease, 1 and 2 d after administration, and in one healthy male subject at 4–31 d. The ratio averaged 12 and 18 at 1 and 2 d, respectively, and 22–24 at 16–31 d. Five adult male subjects of Mabille et al. (1961) showed an average RBC:plasma concentration ratio for 86Rb of 24 (range, 20–27) at 7–14 d after injection. (407) Ryan et al. (1985) determined the maximum uptake of 82Rb in the left kidneys of two healthy subjects (after correction for rapid radioactive decay) to be 8.8% and 7.1%, respectively, of the intravenously injected amount, apparently occurring in the early minutes after administration. This suggests maximum accumulation of ∼16% of administered rubidium in the kidneys, which is of the same order as early uptake of radiopotassium by the kidneys (Black et al., 1955; Emery et al., 1955). (408) Whole-body retention of radiorubidium has been observed in a number of healthy adult human subjects (Iinuma et al., 1967; Lloyd et al., 1973; Richmond, 1980). Retention can be described reasonably well by a single exponential term, although a small component of short-term retention has been observed in some subjects. Tb based on a single-exponential fit is typically in the range of 1–2 months, with a central value of ∼45 d. (409) Love et al. (1954) compared the distributions of stable potassium and 86Rb in 33 tissues or fluids following intravenous administration of 86Rb to dogs. The distributions were compared in terms of a ‘relative rubidium concentration’ for individual tissues or fluids, intended to reflect the relative levels of accumulation of circulating rubidium and potassium in these pools. The relative rubidium concentration for a tissue or fluid was defined as the average ratio A:B for days 1, 3, and 7 post injection, where A is the concentration ratio of 86Rb to potassium in the tissue or fluid sample, and B is the analogous ratio for simultaneously sampled blood plasma. The relative rubidium ratio was in the range of 1.02–1.91 with a mean value of 1.4 (standard deviation 0.23) for 29 of the 33 pools and <1.0 for the other four pools (urine, 0.66; femur, 0.56; brain, 0.55; cerebrospinal fluid, 0.55).
22.2.3.2. Biokinetic model for systemic rubidium
(410) A relatively detailed biokinetic model for systemic rubidium (similar to the model for potassium described in Section 9.2.3 in this publication) was proposed by Leggett and Williams (1988). The model was built around a blood flow model depicting the distribution of cardiac output to 12 tissue compartments. Additional compartments were added to address transfer of rubidium between plasma and RBC, and between systemic pools and gastrointestinal content. Three excretion pathways were addressed: urinary loss via the kidneys; faecal loss via the intestines; and loss in sweat via skin. Movement of rubidium was depicted as a system of first-order processes. The transfer rate from plasma into a tissue T was estimated as the product of the plasma flow rate to that tissue (i.e. the fraction of cardiac output received by the tissue, times 1766 plasma volumes per day as a reference value for cardiac output) and a tissue-specific extraction fraction. The transfer rate from tissue T to plasma was estimated from the relative contents of rubidium in plasma and tissue T at equilibrium. The equilibrium distribution of rubidium was based mainly on autopsy data and typical concentrations of rubidium in plasma and RBC. Transfer rates between plasma and RBC and between systemic compartments and gastrointestinal contents were based on empirical data. Model predictions of blood clearance, uptake and loss by systemic tissues, total-body retention, and path-specific excretion rates of rubidium were shown to be consistent with observations for human subjects. (411) The biokinetic model for systemic rubidium used in this publication is a simplification of the model of Leggett and Williams (1986). The structure of the simplified model (Fig. 22.1) is more consistent with the structures of other systemic models applied in the OIR series. That is, the model depicts a central blood compartment (plasma) in exchange with a set of peripheral tissue compartments representing relatively important systemic repositories of rubidium. The transfer coefficients of the simplified model (Table 22.3) were set for reasonable consistency with the original model regarding retention in the total body and in individual tissues depicted explicitly in both models. Transfer coefficients in the biokinetic model for systemic rubidium. RBC, red blood cells. Monitoring techniques for 83Rb. Measurement system comprised of germanium detectors. Counting time of 20 min. Monitoring techniques for 84Rb. Measurement system comprised of germanium detectors. Counting time of 20 min. Monitoring techniques for 86Rb. Measurement system comprised of germanium detectors. Committed effective dose coefficients (Sv Bq−1) for the inhalation or ingestion of 83Rb, 84Rb, and 86Rb compounds. AMAD, activity median aerodynamic diameter. Dose per activity content of 83Rb in total body and in daily excretion of urine (Sv Bq−1); 5 µm activity median aerodynamic diameter aerosols inhaled by a reference worker at light work. Dose per activity content of 84Rb in total body and in daily excretion of urine (Sv Bq−1); 5 µm activity median aerodynamic diameter aerosols inhaled by a reference worker at light work. Dose per activity content of 86Rb in daily excretion of urine (Sv Bq−1); 5 µm activity median aerodynamic diameter aerosols inhaled by a reference worker at light work. N/A, not applicable. Daily excretion of 75Se following inhalation of 1 Bq Type F. Daily excretion of 75Se following inhalation of 1 Bq Type M. Daily excretion of 75Se following inhalation of 1 Bq Type S. Structure of the biokinetic model for systemic rubidium. RBC, red blood cells. Daily excretion of 83Rb following inhalation of 1 Bq Type F. Daily excretion of 83Rb following inhalation of 1 Bq Type M. Daily excretion of 83Rb following inhalation of 1 Bq Type S. Daily excretion of 84Rb following inhalation of 1 Bq Type F. Daily excretion of 84Rb following inhalation of 1 Bq Type M. Daily excretion of 84Rb following inhalation of 1 Bq Type S. Daily excretion of 86Rb following inhalation of 1 Bq Type F. Daily excretion of 86Rb following inhalation of 1 Bq Type M. Daily excretion of 86Rb following inhalation of 1 Bq Type S.


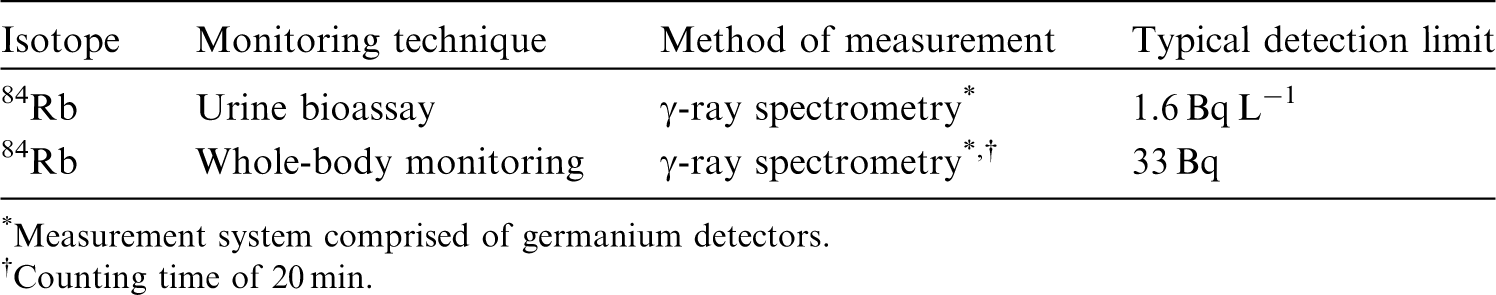
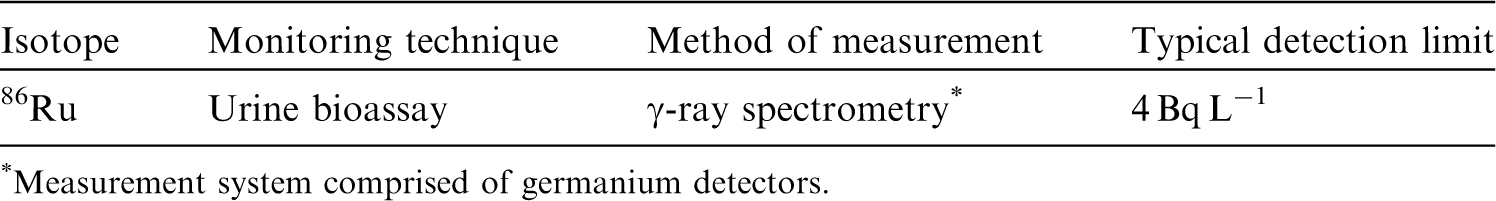
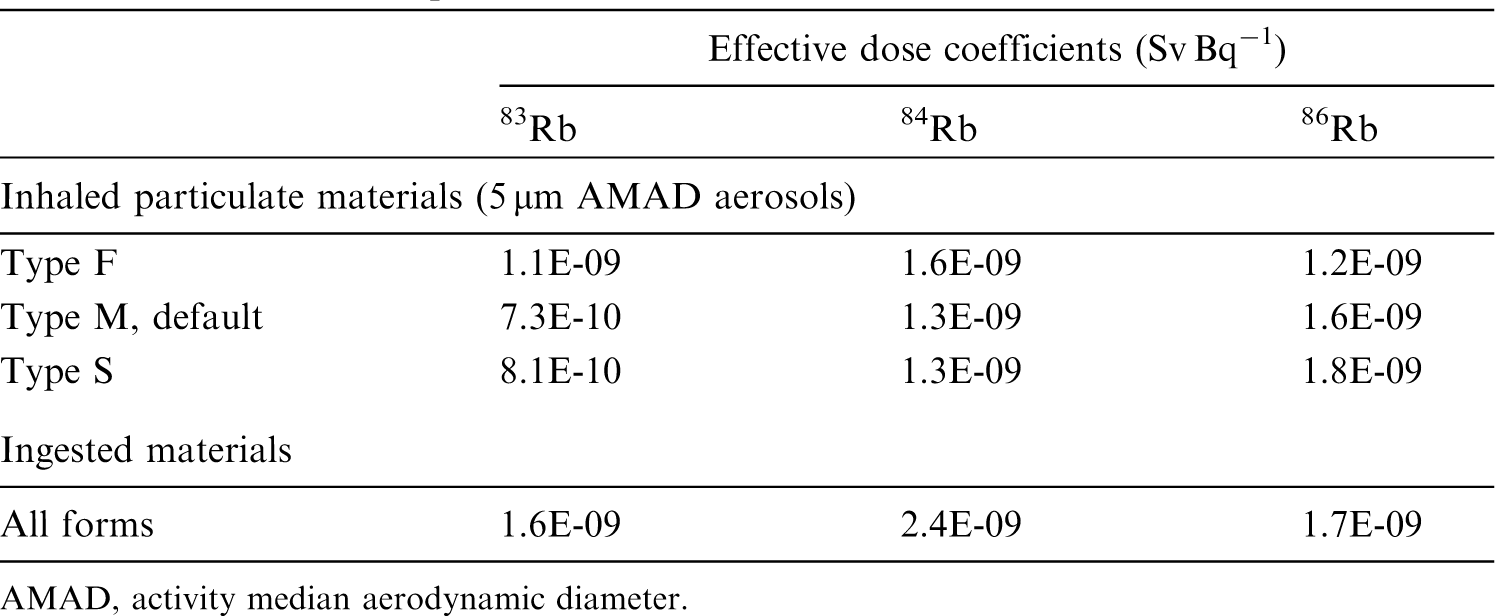


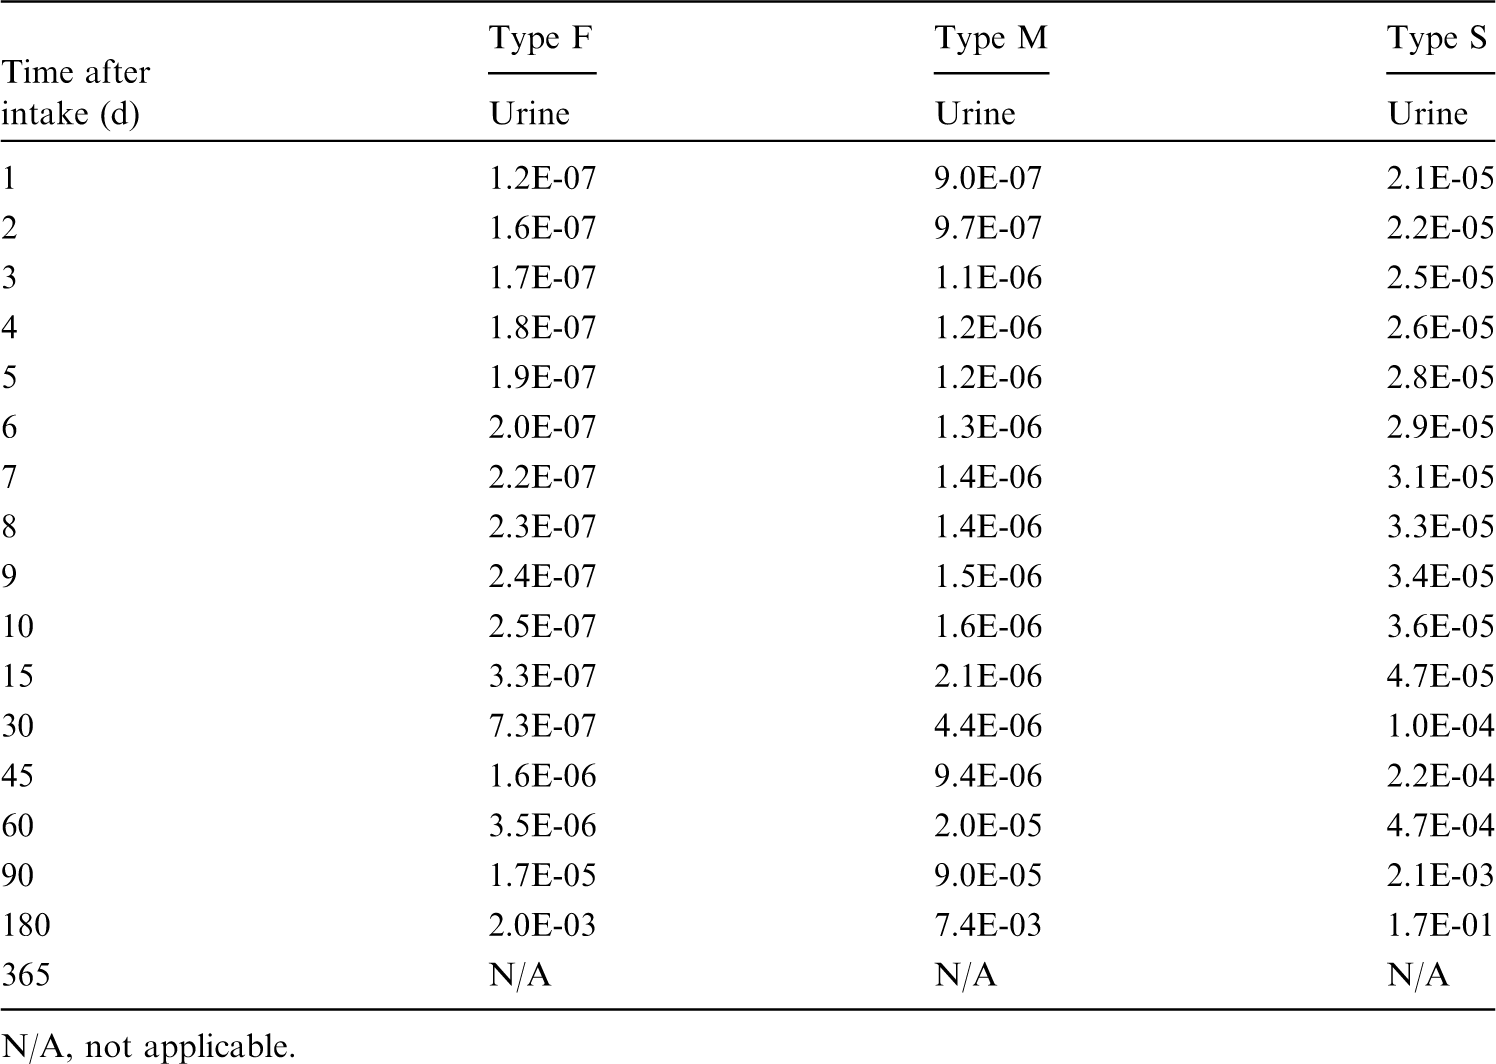


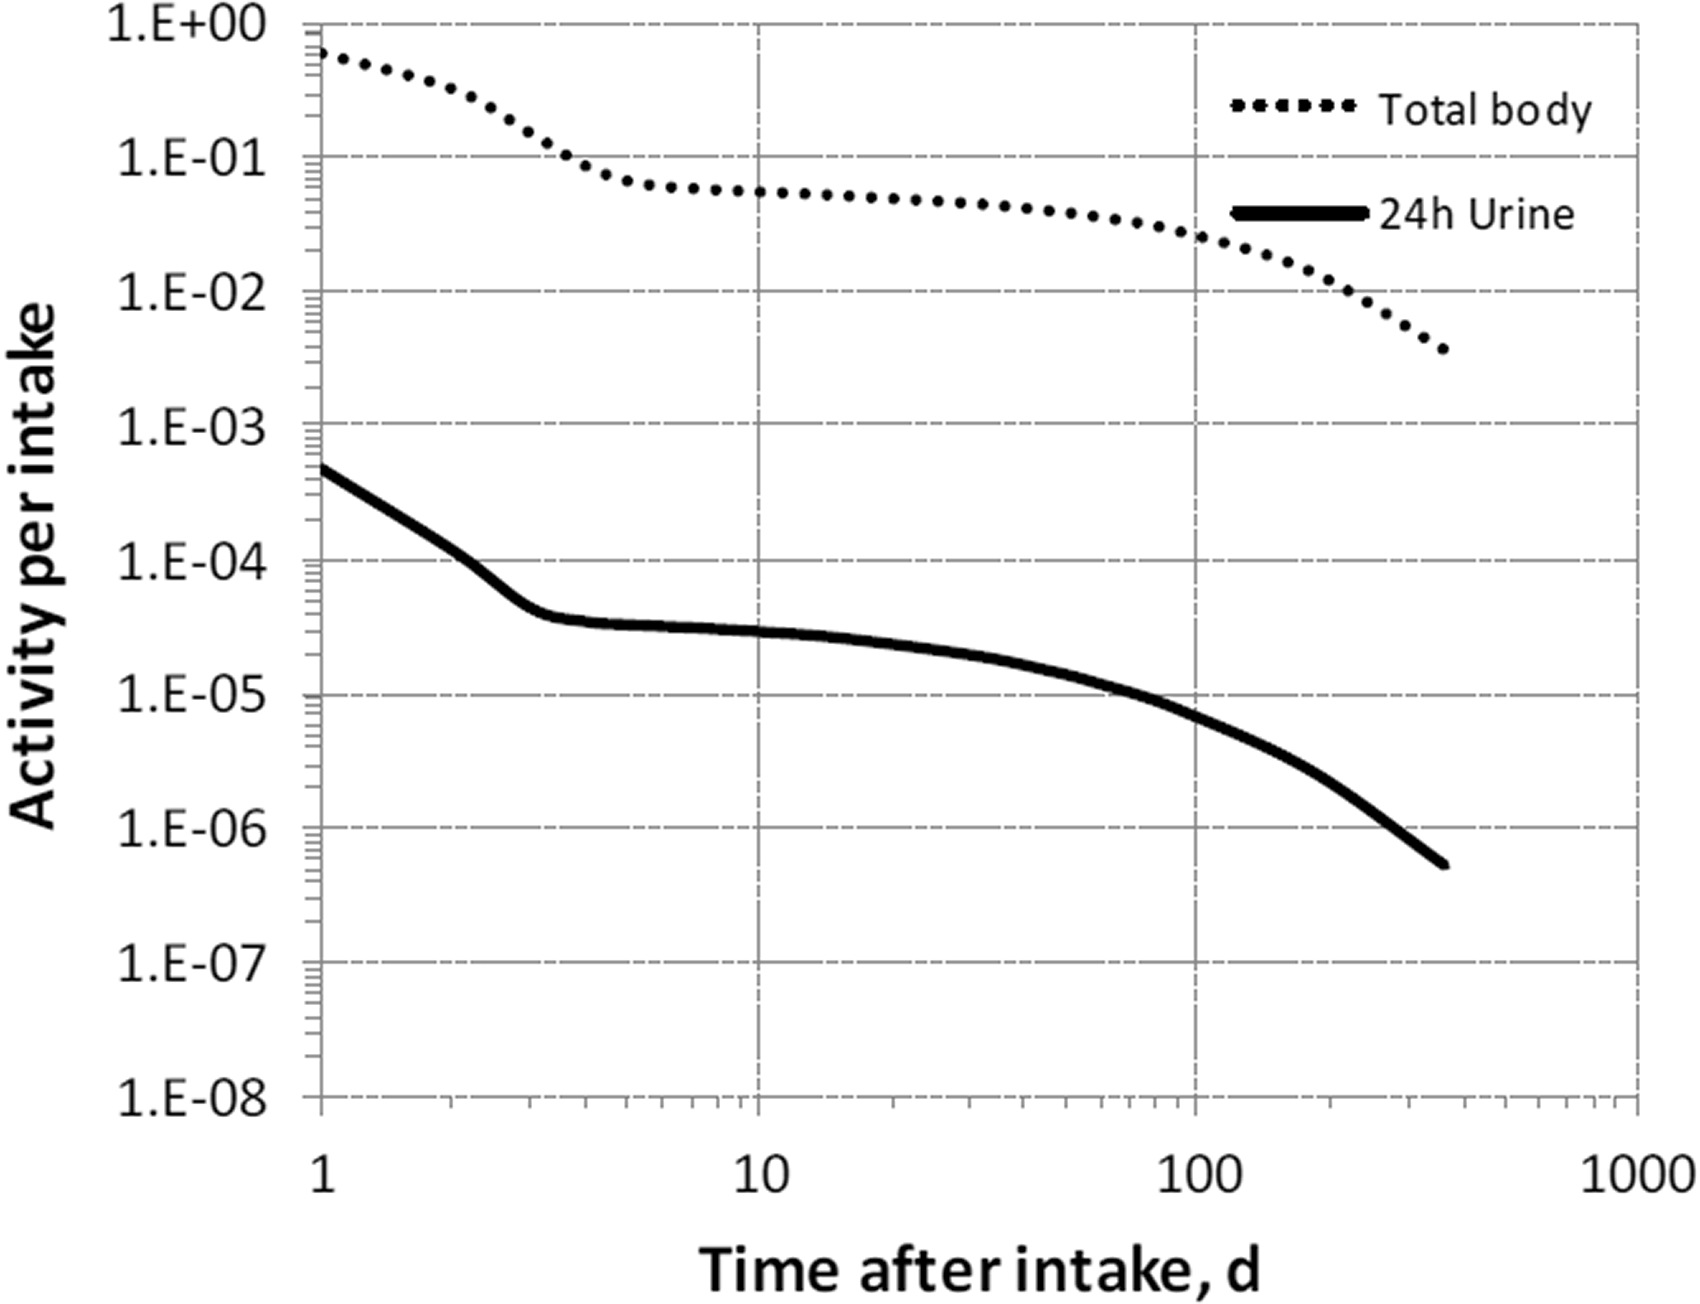


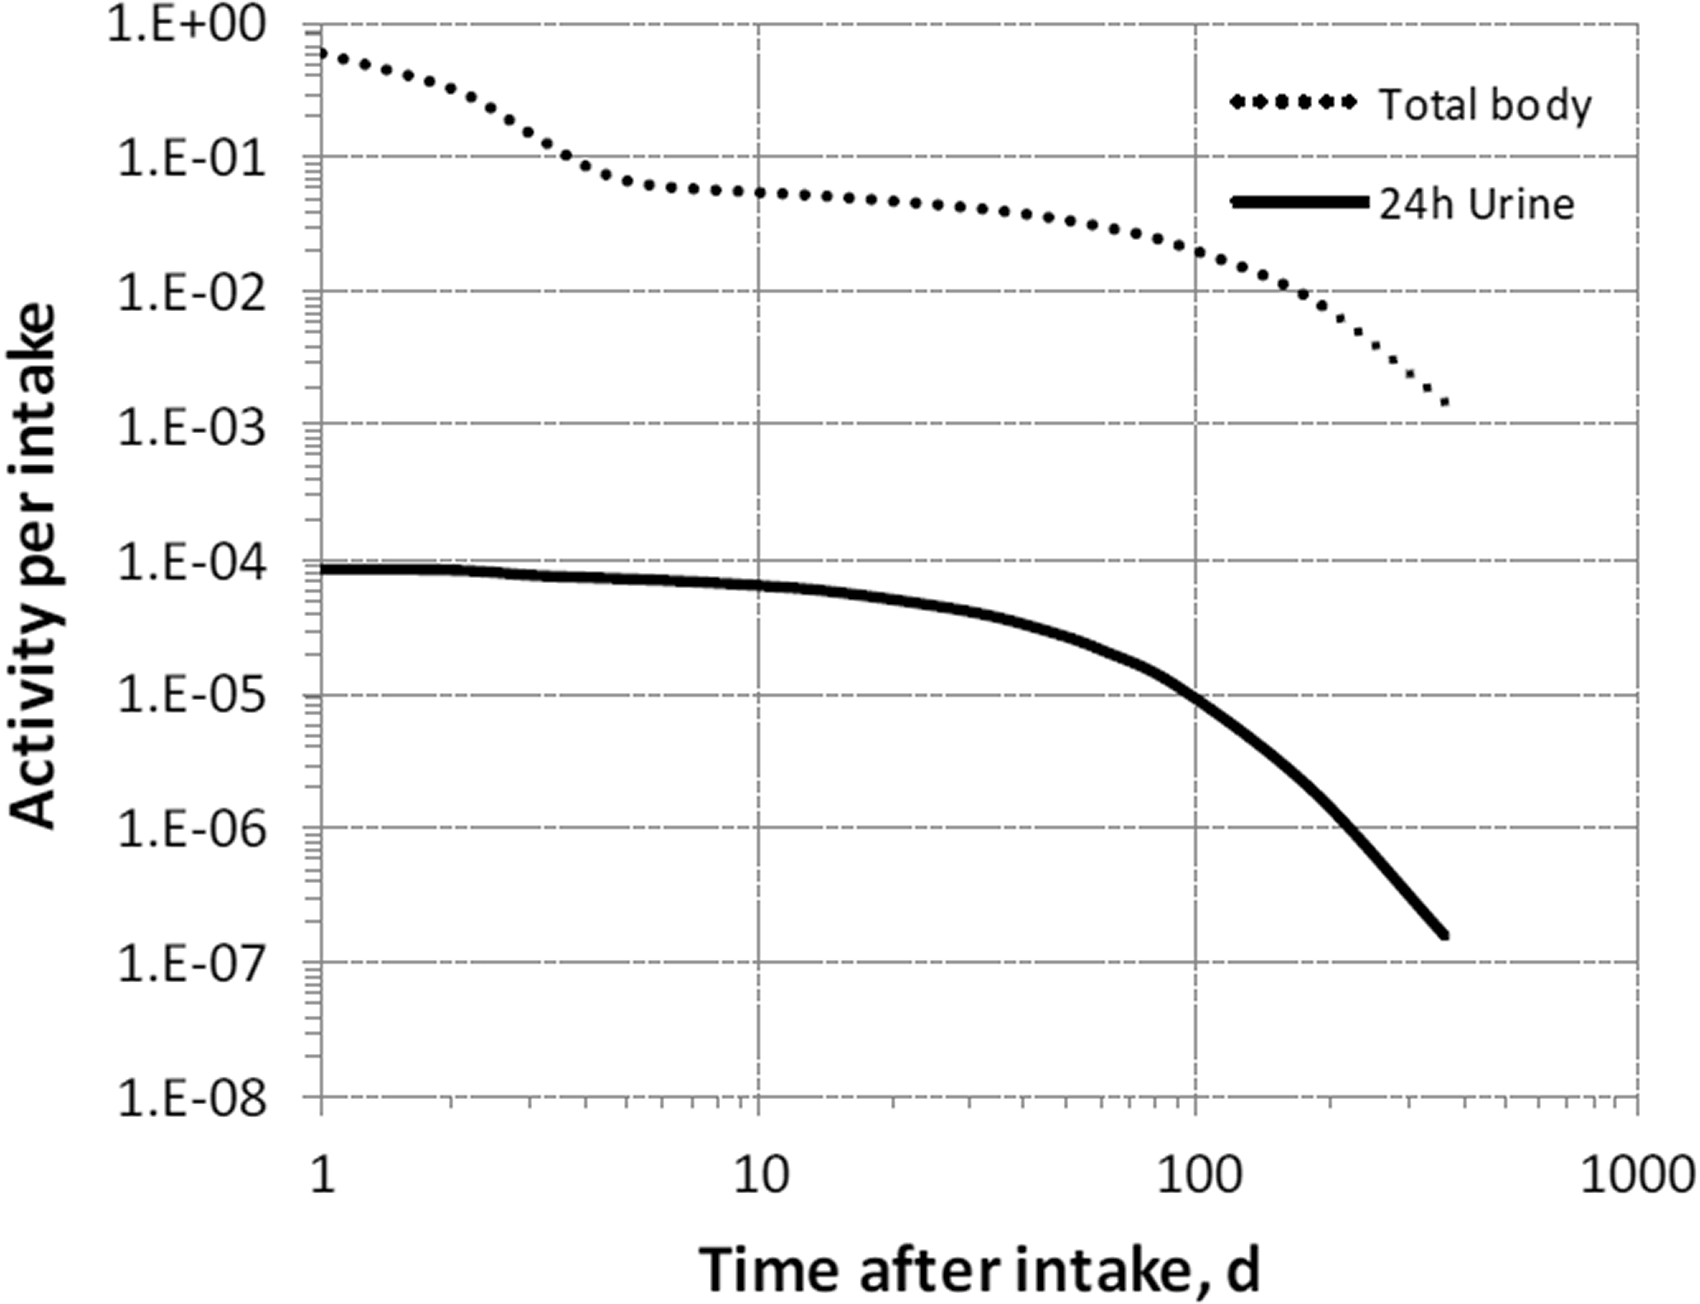


22.2.3.3. Treatment of progeny
(412) Progeny of rubidium addressed in this publication are radioisotopes of rubidium, krypton, and strontium. The model for rubidium as a parent is applied to rubidium as a progeny of rubidium. Krypton produced in a tissue compartment is assumed to transfer to blood with a half-time of 15 min and to be removed from blood to the environment (exhaled) at a rate of 1000 d−1. For application to strontium as a progeny of rubidium, the characteristic model for strontium (ICRP, 2016) was modified to address explicitly each of the tissues addressed in the model for rubidium (see Annex B). The following transfer coefficients from compartments of the rubidium model to the central blood compartment of the strontium model were added to the characteristic model for strontium: RBC, 1000 d−1; kidneys, 0.116 d−1; liver, 0.116 d−1; muscle, 0.116 d−1; red marrow, 0.116 d−1; and rubidium’s ‘Other’, 2.5 d−1. The following transfer coefficients from blood were also added to the strontium model: kidneys, 0.00766 d−1; liver, 0.0445 d−1, muscle, 0.716 d−1; and red marrow, 0.0289 d−1. The transfer coefficient from blood to the intermediate-term soft tissue compartments of the strontium model was reduced from 1.5 d−1 to 0.703 d−1 to leave the total outflow rate of strontium from blood at 15 d−1.
22.3. Individual monitoring
22.3.1. 83Rb
(413) Measurements of 83Rb may be performed by in-vivo whole-body measurement technique and by gamma measurement in urine.
22.3.2. 84Rb
(414) Measurements of 84Rb may be performed by in-vivo whole-body measurement technique and by gamma measurement in urine.
22.3.3. 86Rb
(415) Measurements of 86Rb in urine may be used to determine intakes of the radionuclide.
22.4. Dosimetric data for rubidium
23. Rhodium (Z = 45)
23.1. Isotopes
23.2. Routes of intake
23.2.1. Inhalation
(416) For rhodium, default parameter values were adopted on absorption to blood from the respiratory tract (ICRP, 2015). Absorption parameter values and types, and associated fA values for particulate forms of rhodium are given in Table 23.2. Isotopes of rhodium addressed in this publication. EC, electron-capture decay; B+, beta-plus decay; B−, beta-minus decay; IT, isomeric transition decay. Dose coefficients and bioassay data for this radionuclide are given in the printed copy of this publication. Data for other radionuclides listed in this table are given in the online electronic files on the ICRP website. Absorption parameter values for inhaled and ingested rhodium. It is assumed that the bound state can be neglected for rhodium (i.e. fb = 0). The values of sr for Type F, M, and S forms of rhodium (30, 3, and 3 d−1, respectively) are the general default values. For inhaled material deposited in the respiratory tract and subsequently cleared by particle transport to the alimentary tract, the default fA values for inhaled materials are applied [i.e. the product of fr for the absorption type and the fA value for ingested soluble forms of rhodium (0.05)]. Default Type M is recommended for use in the absence of specific information on which the exposure material can be assigned to an absorption type (e.g. if the form is unknown, or if the form is known but there is no information available on the absorption of that form from the respiratory tract). For guidance on the use of specific information, see Section 1.1. Activity transferred from systemic compartments into segments of the alimentary tract is assumed to be subject to reabsorption to blood. The default absorption fraction fA for the secreted activity is the highest value for any form of the radionuclide (fA = 0.05).
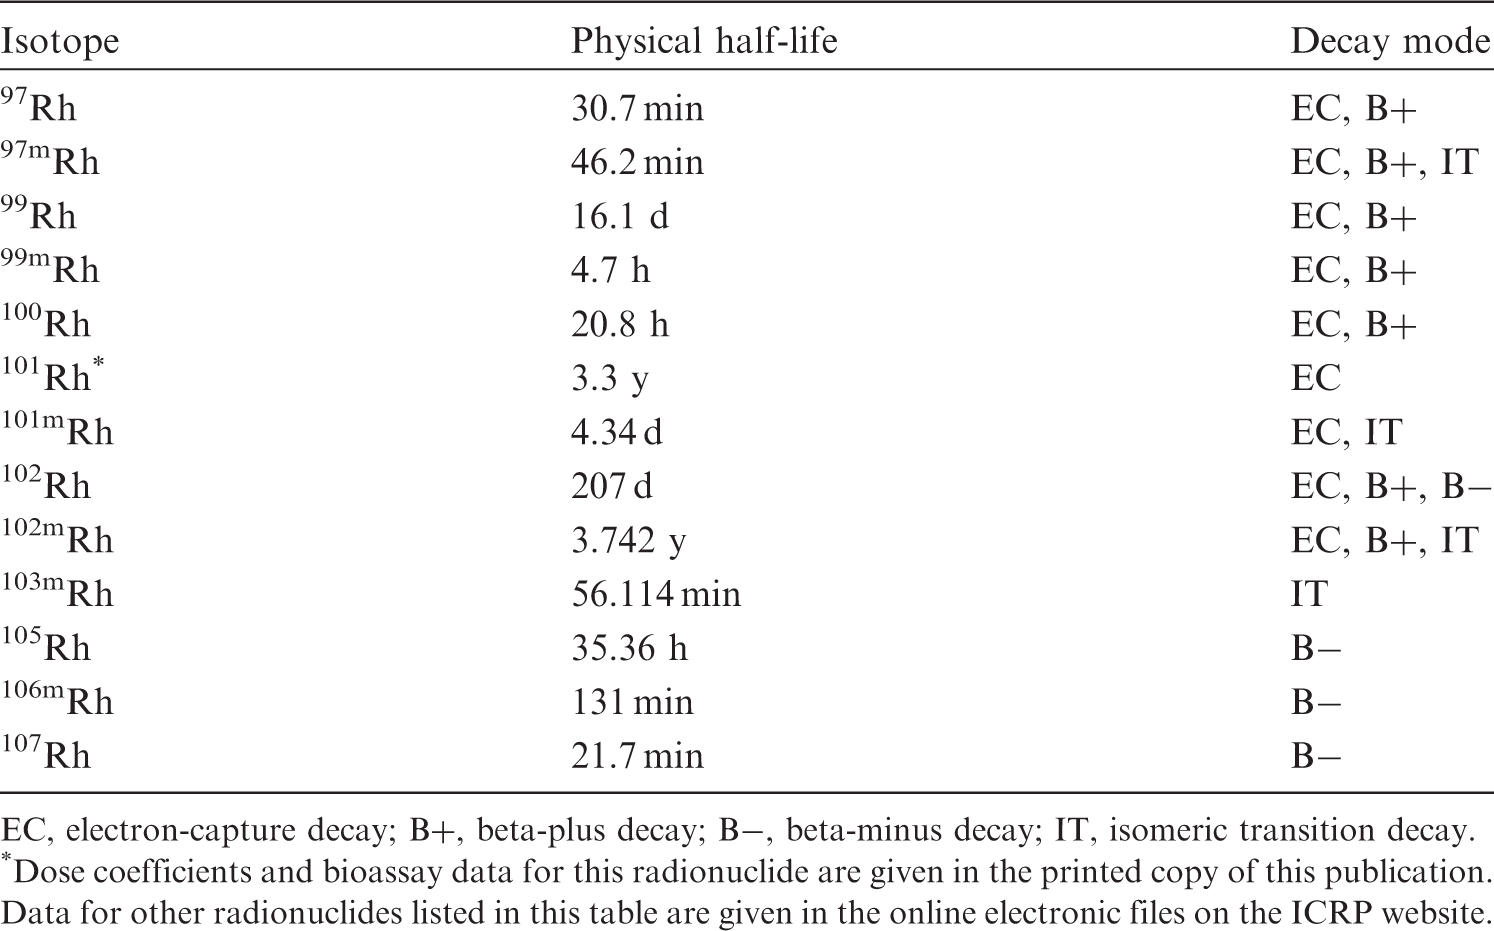
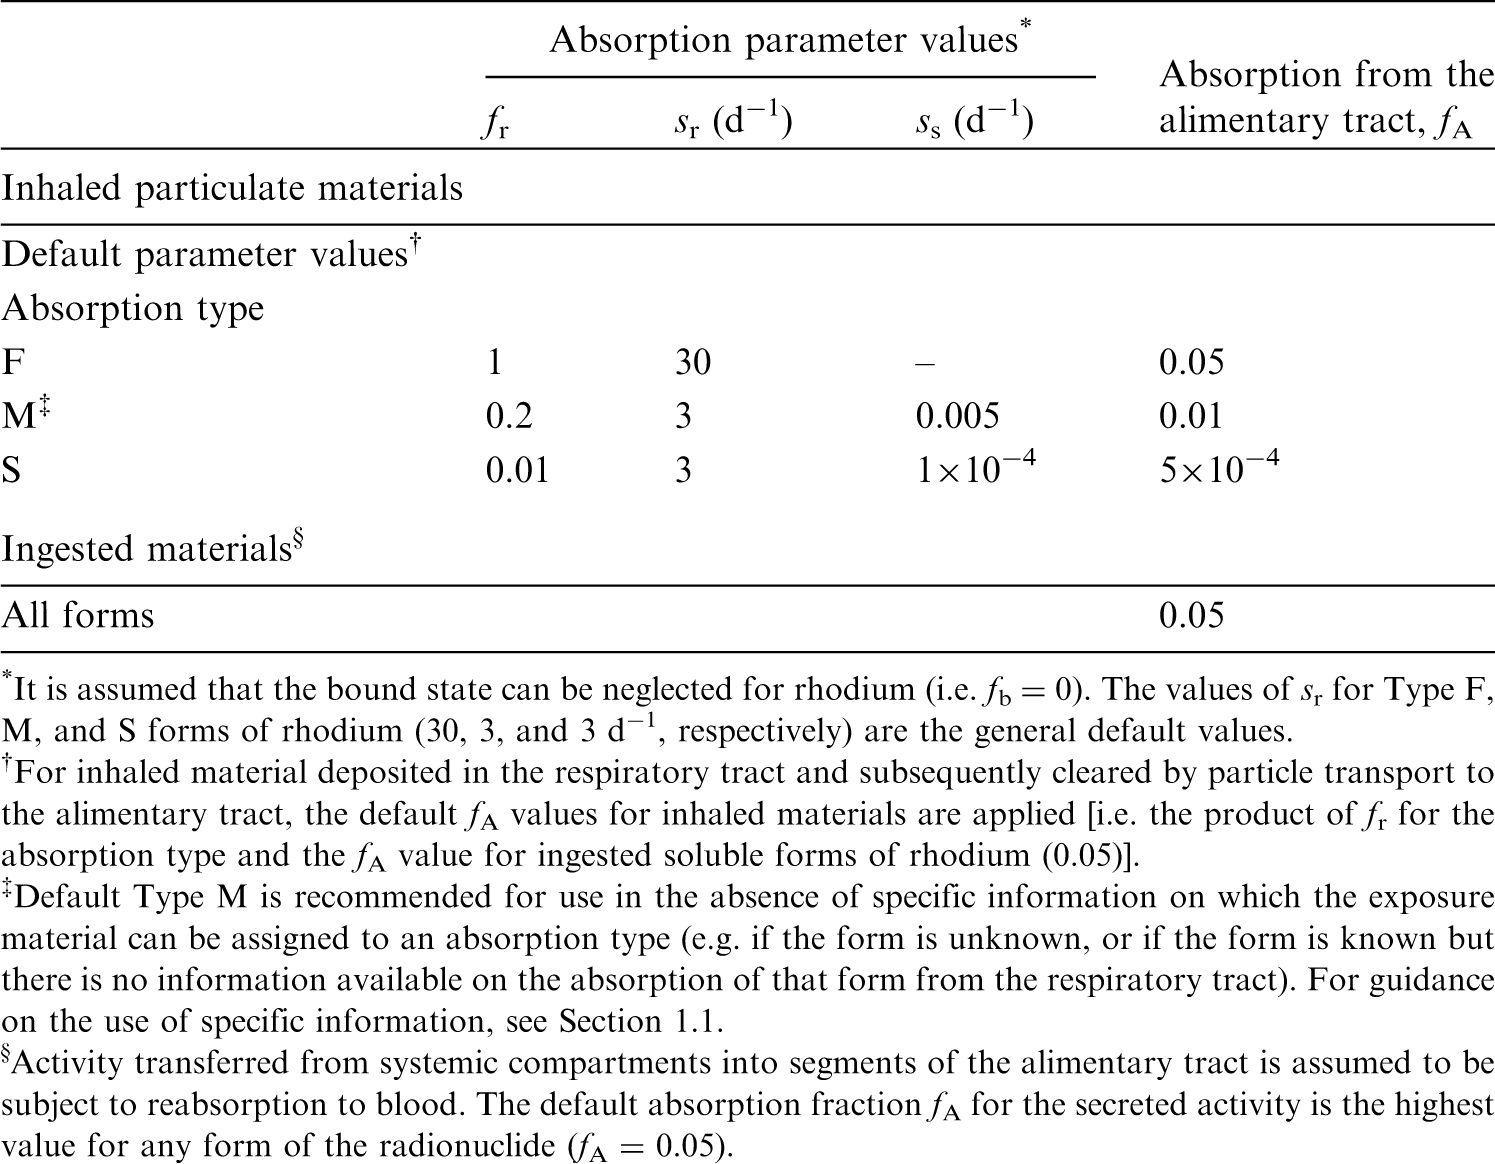
23.2.2. Ingestion
(417) There appears to be no information concerning the uptake of rhodium from the gastrointestinal tract. Systemic section refers to oral admin by Durbin et al. (1957). With an in-vitro assay, Colombo et al. (2008) have estimated the dissolution of rhodium to be ∼66% from road dust, but <0.04% from hydroxide samples and 0.7% from an automobile catalyst powder. Chemically, rhodium resembles ruthenium (Partington, 1954), and f1 was therefore taken to be 0.05 for all its compounds in Publications 30 and 68 (ICRP, 1980, 1994a). The value of fA = 0.05 for ruthenium was confirmed in OIR Part 3 (ICRP, 2017). In this publication, the default assumption is fA = 0.05 for all forms of rhodium in the workplace.
23.2.3. Systemic distribution, retention, and excretion of rhodium
23.2.3.1. Biokinetic data
(418) Durbin et al. (1957) summarised data on the behaviour of rhodium in rats during the first few days after administration of carrier-free 105Rh by various routes. At 4 d after oral administration, activity was only measurable in the kidneys, which contained 0.04% of the administered amount. Excretion after intramuscular administration was mainly in urine during the first few hours. At 18 d after intramuscular injection, ∼46% had been eliminated in urine and 28% in faeces. Throughout the study, the highest concentrations of activity were found in the kidneys, spleen, lymph glands, and skin. At 18 d after injection, these tissues contained 1.1%, 0.50%, 0.35%, and 0.33% of the injected amount, respectively. Distribution and excretion at these times resembled those observed for the chemically similar element ruthenium. (419) Erck et al. (1976) studied the biokinetics of rhodium in tumour-bearing mice after single therapeutic doses of Rh(II) acetate. The primary organ of deposition of rhodium was the liver. No measurable quantity was found in the brain. During the first 24 h, ∼5% of the administered rhodium was eliminated in urine.
23.2.3.2. Biokinetic model for systemic rhodium
(420) The biokinetic model for ruthenium described in Publication 137 (ICRP, 2017) is applied in this publication to rhodium. The model structure is shown in Fig. 23.1. Transfer coefficients are listed in Table 23.3. Transfer coefficients in the biokinetic model for systemic rhodium. ST, soft tissue. ST0, ST1, and ST2 are compartments of other soft tissues with fast, intermediate, and slow turnover, respectively. Structure of the biokinetic model for systemic rhodium. SI, small intestine.
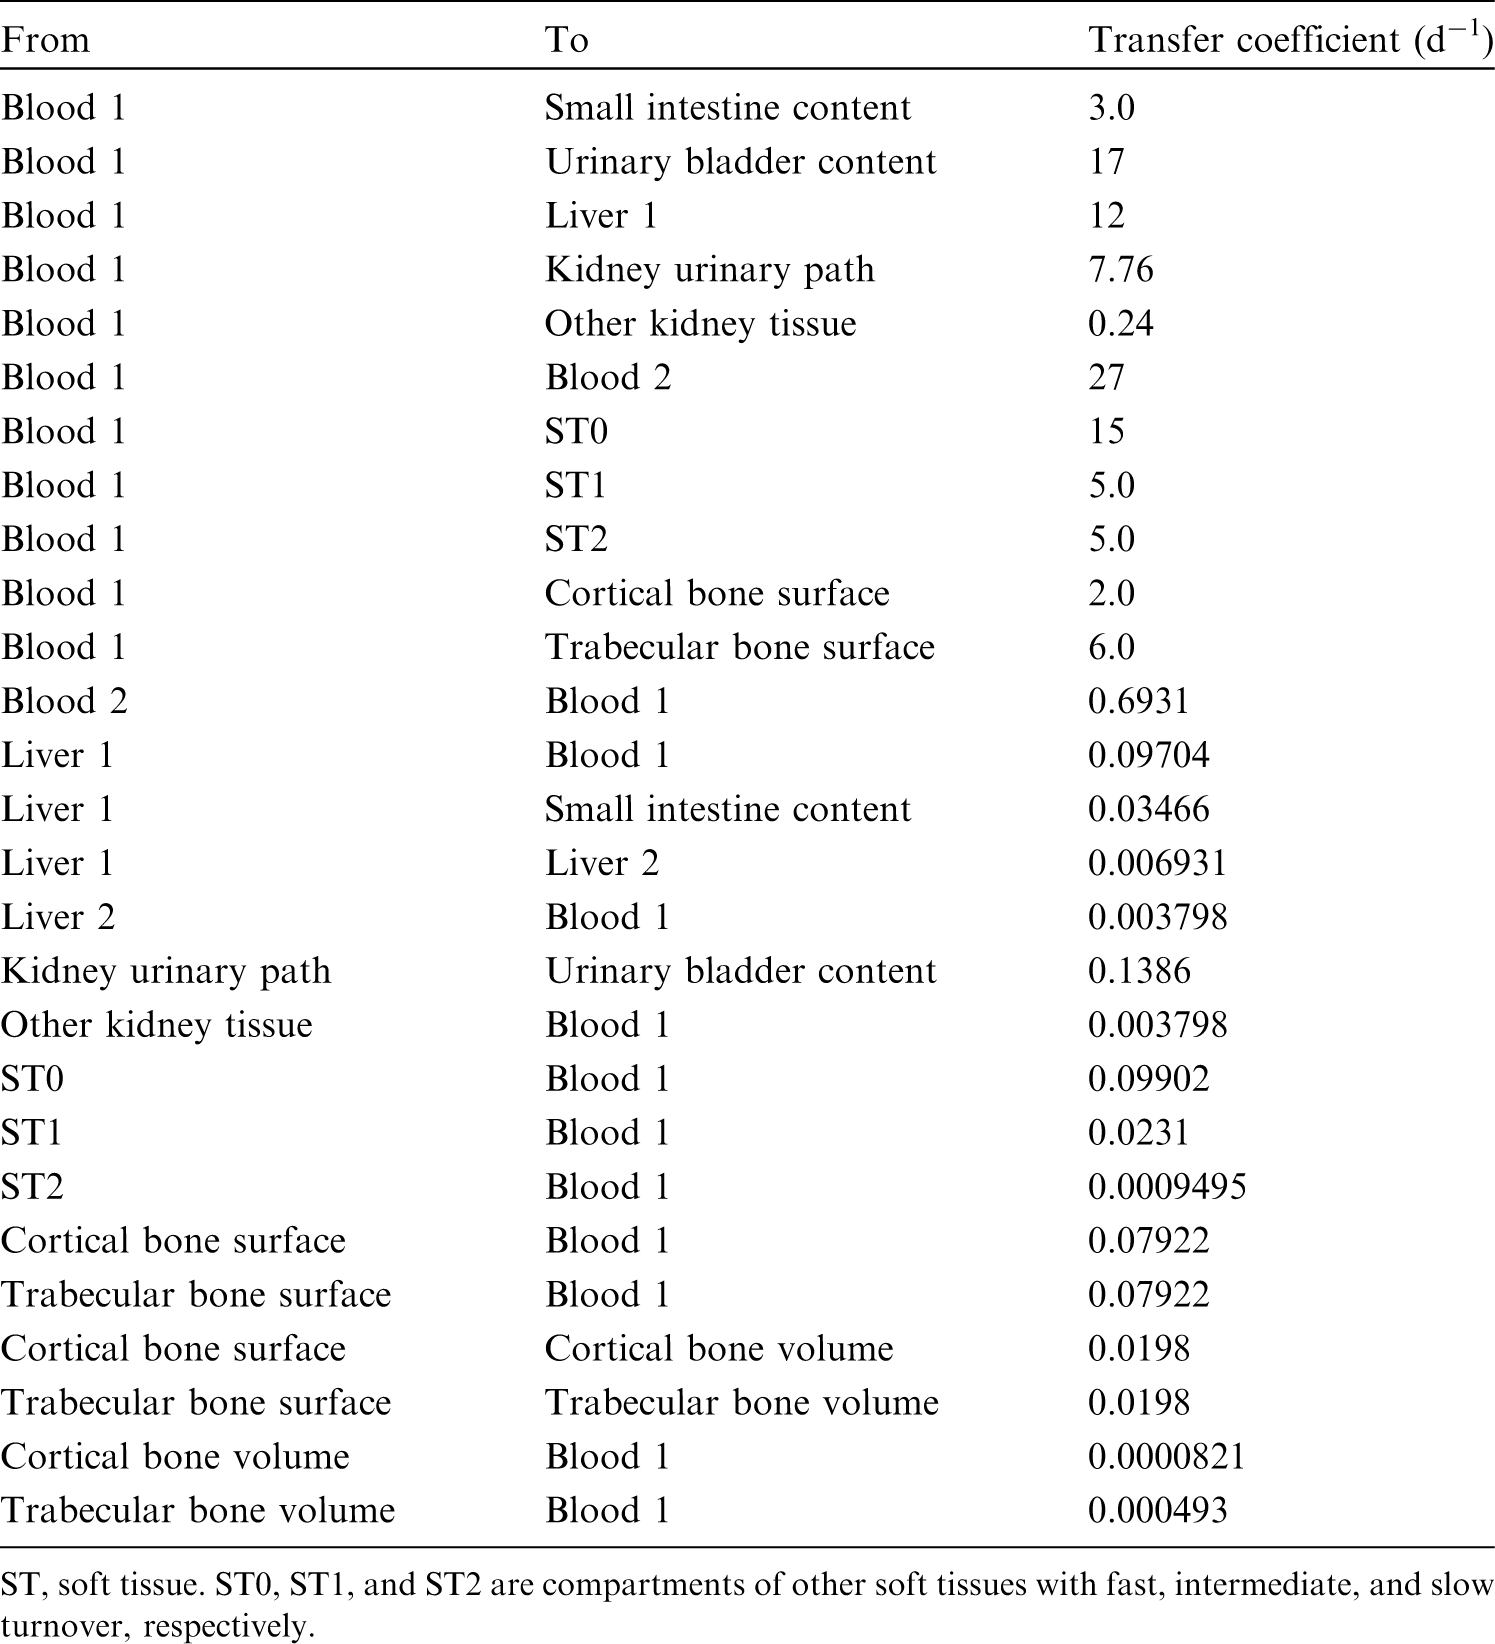
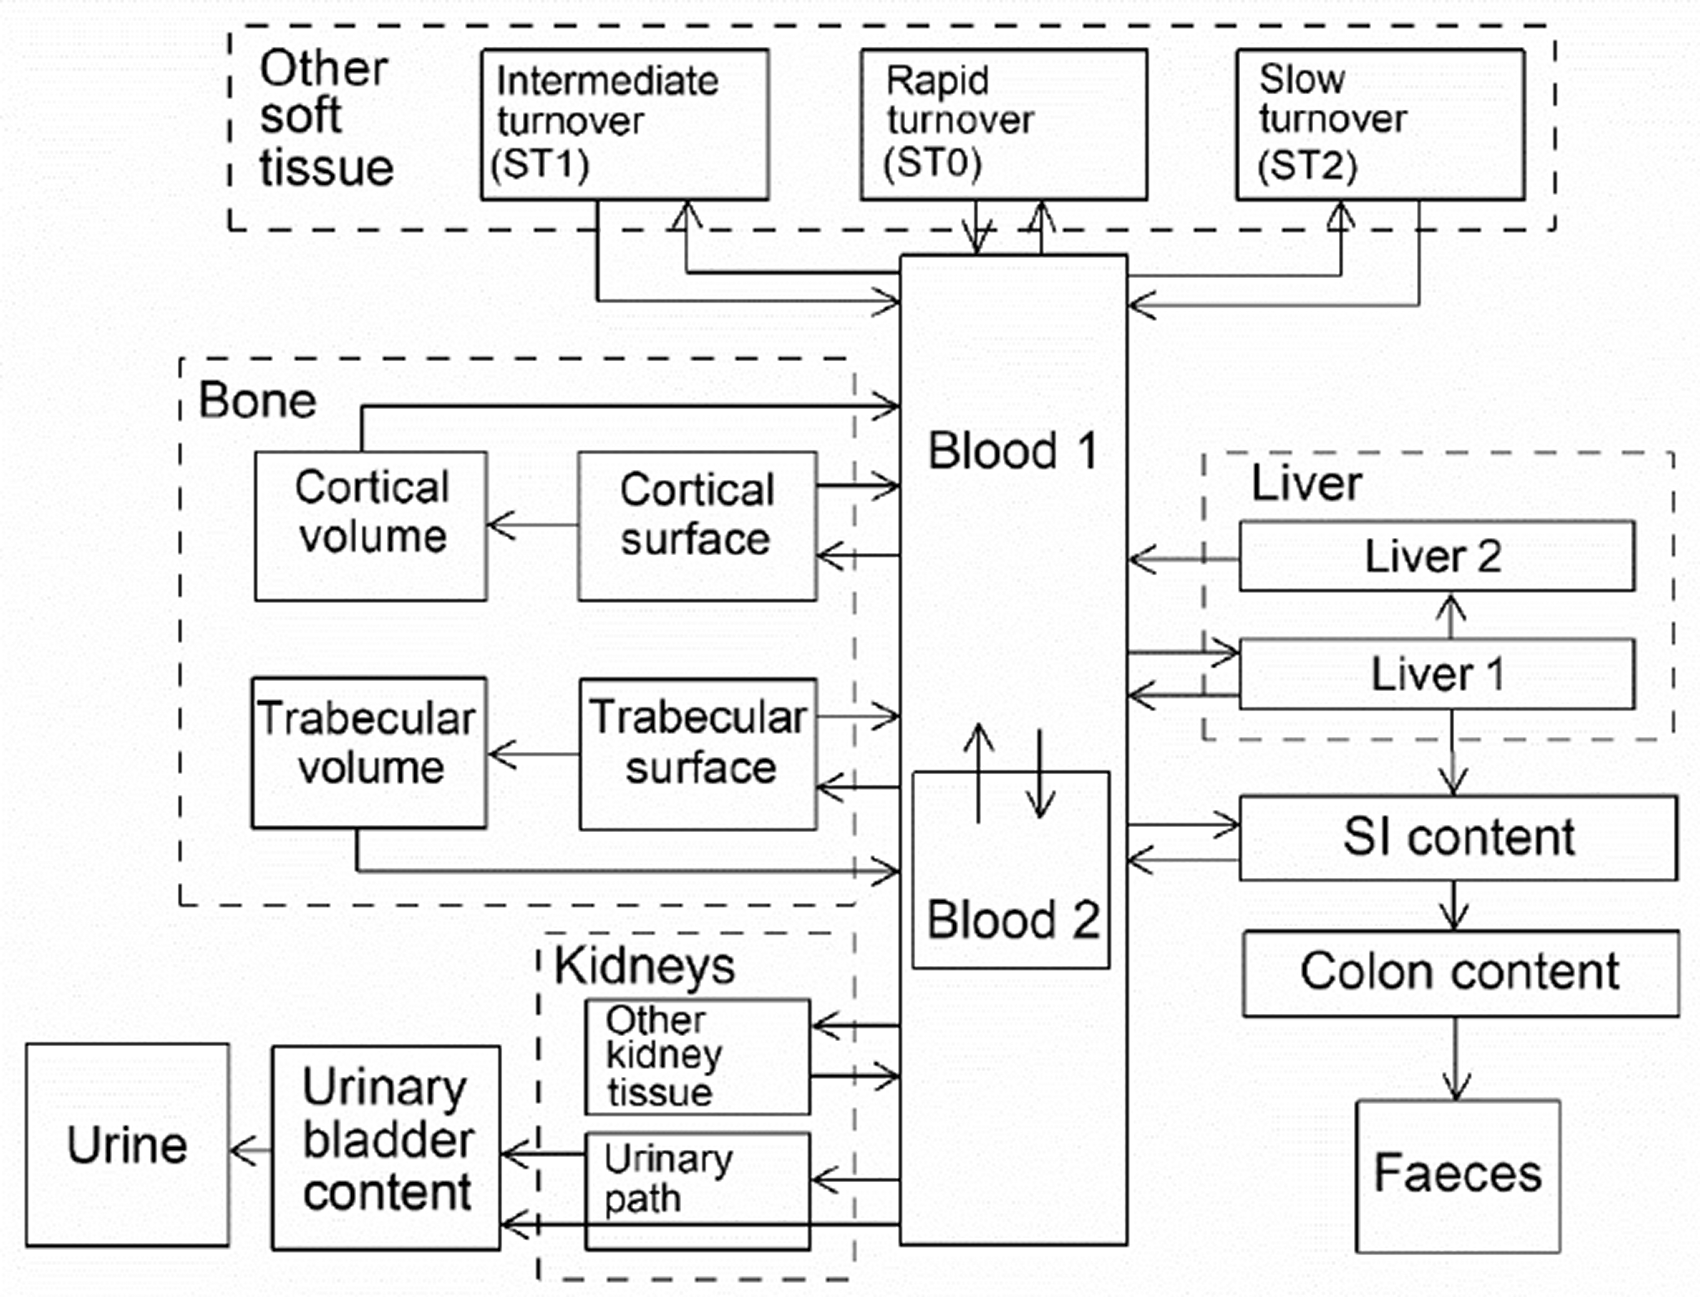
23.2.3.3. Treatment of progeny
(421) Progeny of rhodium addressed in this publication are isotopes of rhodium, ruthenium, and technetium. The common model for rhodium and ruthenium as parents applied in the OIR series is applied to isotopes of these two elements as progeny of rhodium. The model for technetium as a progeny of ruthenium applied in OIR Part 3 (ICRP, 2017) is applied to technetium as a progeny of rhodium.
23.3. Individual monitoring
(422) Information regarding the detection limit for routine individual measurement is not available.
23.4. Dosimetric data for rhodium
24. Palladium (Z = 46)
24.1. Isotopes
24.2. Routes of intake
24.2.1. Inhalation
(423) For palladium, default parameter values were adopted on absorption to blood from the respiratory tract (ICRP, 2015). Absorption parameter values and types, and associated fA values for particulate forms of palladium are given in Table 24.2. Committed effective dose coefficients (Sv Bq−1) for the inhalation or ingestion of 101Rh compounds. AMAD, activity median aerodynamic diameter. Isotopes of palladium addressed in this publication. EC, electron-capture decay; B+, beta-plus decay; B−, beta-minus decay. Dose coefficients and bioassay data for this radionuclide are given in the printed copy of this publication. Data for other radionuclides listed in this table are given in the online electronic files on the ICRP website. Absorption parameter values for inhaled and ingested palladium. It is assumed that the bound state can be neglected for palladium (i.e. fb = 0). The values of sr for Type F, M, and S forms of palladium (30, 3, and 3 d−1, respectively) are the general default values. For inhaled material deposited in the respiratory tract and subsequently cleared by particle transport to the alimentary tract, the default fA values for inhaled materials are applied [i.e. the product of fr for the absorption type and the fA value for ingested soluble forms of palladium (0.005)]. Default Type M is recommended for use in the absence of specific information on which the exposure material can be assigned to an absorption type (e.g. if the form is unknown, or if the form is known but there is no information available on the absorption of that form from the respiratory tract). For guidance on the use of specific information, see Section 1.1. Activity transferred from systemic compartments into segments of the alimentary tract is assumed to be subject to reabsorption to blood. The default absorption fraction fA for the secreted activity is the highest value for any form of the radionuclide (fA = 0.005).


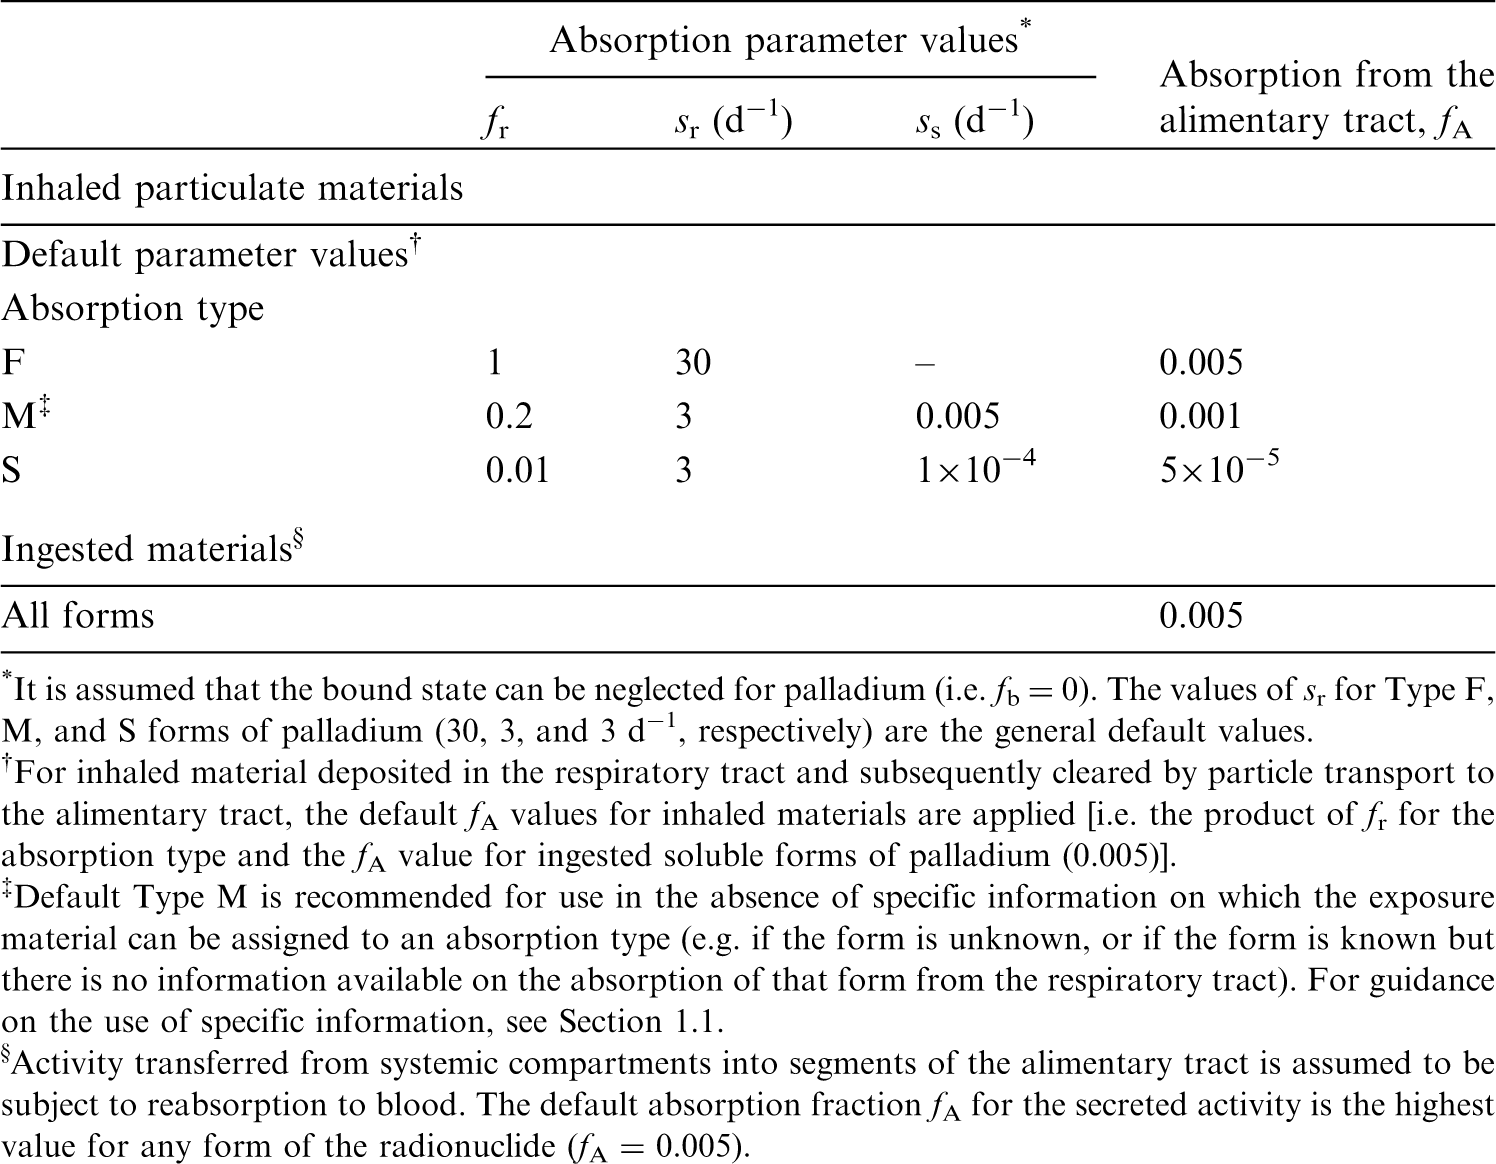
24.2.2. Ingestion
(424) The fractional absorption of palladium, administered as the chloride, from the gastrointestinal tract of adult rats is <5 × 10⁻³ (Moore et al., 1974, 1975b). Acute toxicity data from experiments on rats indicate that the fractional absorption of palladium administered as PdO or PdSO4 is even smaller than that of the chloride (Holbrook et al., 1975). (425) In Publications 30 and 68 (ICRP, 1981, 1994a), f1 was taken to be 5 × 10⁻³ for all compounds of the element. In this publication, the value of fA = 5 × 10⁻³ is also used for all ingested forms of palladium.
24.2.3. Systemic distribution, retention, and excretion of palladium
24.2.3.1. Biokinetic data
(426) Palladium is a member of the platinum group, which also contains ruthenium, rhodium, osmium, iridium, and platinum. These six metals are chemically similar and are generally found together in ores. There is little quantitative data on the behaviour of palladium in humans, but the biokinetics of palladium has been studied in several animal species. (427) Meek et al. (1943) studied the biokinetics and toxic effects of palladium salts in rabbits. Over the first 4 d after intravenous injection, ∼40% of the administered palladium was recovered in urine. Only traces were found in faeces. Palladium accumulated to some extent in the kidneys, liver, lungs, bone marrow, spleen, and muscle. (428) Durbin et al. (1957) and Durbin (1959) described the results of tracer studies of platinum metals in rats including data for 103Pd administered as Na2103PdCl4. Approximately 60% of intravenously injected 103Pd was excreted in urine over the first 4 h, 71% after 1 d, and 76% after 7 d (after correction for radioactive decay). Faecal excretion accounted for ∼4% of the administered amount after 1 d and 13% after 7 d. At 1 d, the liver, kidneys, muscle, bone, and blood contained 8.6%, 8.4%, 1.3%, 1.0%, and 0.8%, respectively, of the administered amount. At 7 d, the liver, kidneys, bone, and spleen contained ∼4%, 5%, 0.2–0.3%, and 0.2% of the administered amount, respectively. At 16 d, the liver and kidneys still contained detectable activity. (429) Moore et al. (1974, 1975b) studied the retention, distribution, and excretion of 103Pd in rats following different modes of administration of 103PdCl2. At 1 d after oral intake, detectable activity was only found in the kidneys and liver, with the kidneys showing a much greater concentration than the liver. After intravenous injection, 103Pd was lost mainly in urine during the first 1–2 d, mainly in faeces from 2 d to 2 weeks, and mainly in urine after 2 weeks. Male rats excreted ∼30% of intravenously injected 103Pd during the first day. At 1 d after intravenous injection, the highest concentrations were seen in the kidneys, followed by the spleen, liver, adrenal glands, lungs, and bone. Approximately 20% of the intravenously injected amount was retained in the body after 40 d, and ∼10% was retained after 76 d (Moore et al., 1974, 1975b). At 104 d after intravenous injection, the highest concentrations of 103Pd were found in the spleen, kidneys, liver, lungs, and bone. (430) Ando et al. (1989) and Ando and Ando (1994) determined the distribution of 103Pd in rats at 3, 24, and 48 h after intravenous injection of 103PdCl2. Cumulative urinary excretion at 3 h represented 6.4% of injected 192Ir. At all three observation times, the highest concentration was found in the kidneys (20.2, 17.1, and 21.4% g−1 at 3, 24, and 48 h, respectively), followed by the liver (14.1, 9.9, and 9.9% g−1, respectively). (431) Ducoulombier-Crépineau et al. (2007) examined the transfer of palladium to systemic tissues and milk following a single oral intake of PdCl2 by lactating goats. Tissues were sampled 8 d after administration to determine palladium concentrations. The highest concentration was found in the kidneys. Little palladium was transferred to milk.
24.2.3.2. Systemic model for palladium
(432) The systemic model for palladium is patterned after the models for the chemically similar elements ruthenium and iridium described in Publication 137 (ICRP, 2017). The same model structure is applied in the OIR series to all six platinum metals. The parameter values developed for iridium are modified for application to palladium, based on two sets of comparative data for palladium and iridium: (1) data of Durbin (Durbin et al., 1957; Durbin, 1959) on the behaviour of both elements in rats; and (2) biokinetic data of Moore et al. (1974, 1975) for palladium in rats compared with biokinetic data of Furchner et al. (1971) for iridium in rats. The modifications of the parameter values in the iridium model are made to depict: faster disappearance of palladium than iridium from blood; a nearly two-fold higher rate of clearance of palladium from blood to urine; two-fold greater deposition of palladium in the kidneys; similar deposition of palladium and iridium in the liver; similar rates of secretion of palladium and iridium from blood to gastrointestinal contents; two-fold lower deposition of palladium in bone; nearly one-third lower deposition of palladium in other tissues; and two-fold faster removal of palladium from all systemic compartments. (433) The structure of the biokinetic model for systemic palladium is shown in Fig. 24.1. Transfer coefficients for palladium are listed in Table 24.3. Transfer coefficients in the biokinetic model for systemic palladium. ST, soft tissue. ST0, ST1, and ST2 are compartments of other soft tissues with fast, intermediate, and slow turnover, respectively. Structure of the biokinetic model for systemic palladium. SI, small intestine.
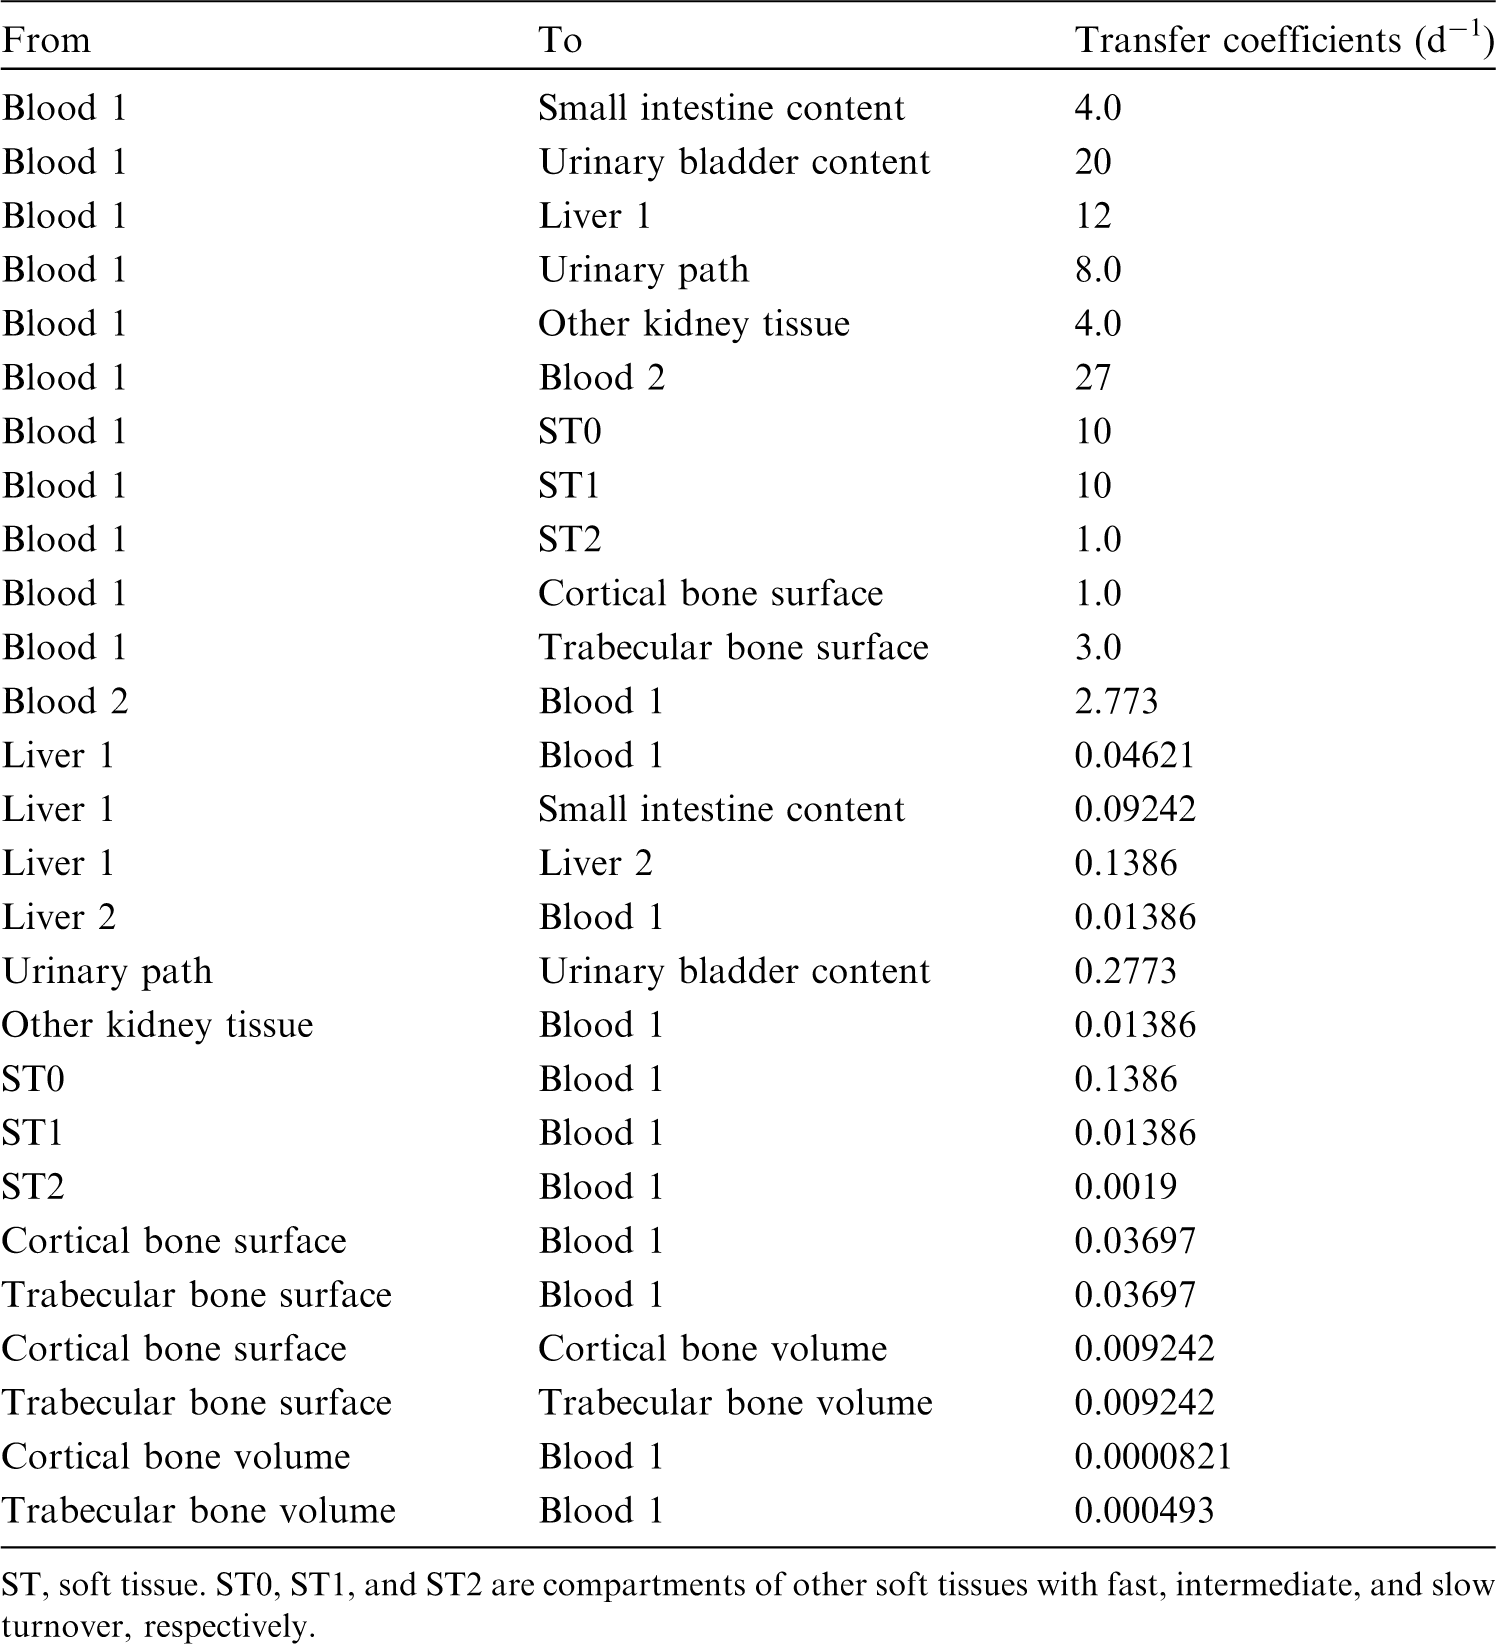

24.2.3.3. Treatment of progeny
(434) Progeny of palladium addressed in this publication are isotopes of rhodium and silver. The characteristic model for rhodium used in this publication is applied to rhodium as a progeny of palladium. The model for silver as a progeny of osmium is an expansion of the characteristic model for silver with added compartments and associated transfer coefficients needed to solve the linked biokinetic models for chains headed by palladium (see Annex B). For a silver isotope produced in a compartment not contained in the characteristic model for silver, the isotope is assumed to transfer to the central blood compartment of the model for silver at a rate of 1000 d−1 if produced in a blood compartment and 8.0 d−1 if produced in a tissue compartment, and to follow the characteristic model for silver thereafter.
24.3. Individual monitoring
(435) Information regarding the detection limit for routine individual measurement is not available.
24.4. Dosimetric data for palladium
25. Silver (Z = 47)
25.1. Isotopes
25.2. Routes of intake
25.2.1. Inhalation
(436) A few studies give information on the absorption of silver from the respiratory tract. Analysis of experimental data to derive absorption parameter values is more difficult than for most elements because excretion of systemic silver is mainly faecal, and so faecal excretion does not enable particle transport from the respiratory tract to be easily distinguished from absorption. (437) Absorption parameter values and types, and associated fA values for inhaled particulate forms of silver are given in Table 25.2.
25.2.1.1. Particulate materials
(a) Elemental silver
(438) Hahn et al. (1952) followed the tissue distribution of 111Ag for 15 d after instillation of a suspension of 111Ag-labelled silver colloid (via a bronchoscope) into the lungs of dogs. Most of the 111Ag was retained in the lung in which it was deposited, although higher concentrations were measured in some associated lymph nodes. There was very little translocation to the liver or spleen, indicating that little absorption occurred, and therefore indicating Type M or S behaviour. (439) Phalen and Morrow (1973) followed the biokinetics of 110mAg for 225 d after inhalation (via endotracheal tube) of metallic silver fume by dogs. The particles were aggregates (AMAD ∼0.5 µm) of primary particles with diameters ∼0.05 µm. Much of the initial lung deposit (ILD) was cleared rapidly; the authors assessed that it was mainly by absorption to blood rather than by mucociliary clearance. Lung retention was represented by a three-component exponential function with rates of 0.4 d−1 (59%), 0.08 d−1 (39%), and 0.017 d−1 (2%). Analysis carried out here (i.e. by the Task Group), assuming that the bound fraction fb = 0.0 (see below), showed that the results could fit with dissolution parameter values of fr = 0.7, sr = 0.3 d−1, and ss = 0.005 d−1 (fixed at the default Type M value), giving assignment to Type M. Phalen and Morrow (1973) also measured dissolution rate constants in vitro of 0.1 µg cm−2 d−1 in distilled water and 10 µg cm−2 d−1 in an interstitial fluid simulant (at ∼36℃). They calculated that the latter would give 99% dissolution in ∼2 d. (440) Camner et al. (1973, 1977) produced 51Cr-labelled Teflon particles coated with silver (and other elements) for lung clearance experiments. In-vitro tests (up to 30 d in saline and 12 d in rabbit serum) showed that most particles retained some silver coating. Thus the silver coating did not dissolve rapidly, indicating Type M behaviour. (441) Takenaka et al. (2000) investigated the behaviour of non-radioactive ultrafine metallic silver particles deposited in the lungs (diameters of primary particles 0.02 µm). They observed that particles in aqueous suspension added to cultured mouse peritoneal macrophages were mainly associated with cells; the size and form of the agglomerated particles remained unchanged over 9 d; and the silver content of the medium was low, indicating Type M behaviour. (442) Takenaka et al. (2000, 2001) also followed the biokinetics of silver for 7 d following intratracheal instillation into rats of an aqueous suspension of these particles: predominantly agglomerates >0.1 µm diameter. There was little change in the silver content of the lungs between 1 and 7 d. The silver content of the liver and lung-associated lymph nodes remained low: a few percent of lung content. In the analyses carried out here, because there were few data, absorption parameter values were fit simultaneously to the results of this experiment, and the two other experiments on the biokinetics of silver deposited in rat lungs carried out by Takenaka et al. (2000, 2001): inhalation of metallic silver and instillation of silver nitrate (see below). Values of fr were varied independently, while values of sr (and systemic rates) were ‘shared’ (i.e. they were varied, but assumed to be the same in the three studies). It was assumed that the bound fraction fb = 0.0 (see below) and that ss = 0.005 d−1 (fixed at the default Type M value). For instillation of metallic silver, the analysis here gave fr = 0.3 and sr = 0.4 d−1, and assignment to Type M. (443) Takenaka et al. (2001) also followed the tissue distribution of silver for 7 d after inhalation of non-radioactive ultrafine metallic silver particles (diameters of primary particles 0.02 µm). In contrast to the behaviour after instillation of agglomerated particles, there was rapid clearance from the lungs to the systemic circulation. At 1, 4, and 7 d, retention in the lungs was ∼38, 9, and 4% ILD. Liver content was ∼9% ILD at 1 h, and 1% ILD at 7 d. Analysis here gave fr ∼1.0 and sr = 0.4 d−1, giving assignment to Type F. (444) Overall, the results suggest that the behaviour of elemental silver particles may be either Type F or Type M, perhaps depending on the method of preparation and/or particle size.
(b) Silver iodide (AgI)
(445) Following inhalation of 131I-labelled silver iodide by mice and sheep (Bair, 1961; Willard and Bair, 1961), 131I was absorbed rapidly from the lungs. There was little difference between its absorption administered as silver iodide and as iodine vapour. The results indicate Type F behaviour, even though silver iodide was studied because it is relatively insoluble in water. Morrow et al. (1968) followed lung retention of 110mAg for at least 7 d after inhalation of silver iodide by dogs and rats, but few details are given. Lung retention followed a two-component exponential function with rates of 0.14 d−1 (7%) and 0.011 d−1 (93%), giving predicted lung retention at 30 d and 180 d of ∼67% and ∼13% ILD. These results are consistent with assignment to Type M. Morrow et al. (1968) noted that, during aerosolization, some conversion to silver oxide probably occurs. Hence it is possible that the rapid absorption of 131I observed by Willard and Bair (1961) resulted from decomposition of silver iodide.
(c) Silver nitrate (AgNO3)
(446) Takenaka et al. (2001) followed the tissue distribution of silver for 7 d after intratracheal instillation of AgNO3 for comparison with that after inhalation of ultrafine silver particles (see above). At 1, 4, and 7 d, lung retention was ∼24%, ∼8%, and ∼6% ILD, and liver content was ∼8%, ∼4%, and ∼1% ILD. In the analyses carried out here, because there were few data, absorption parameter values were fit simultaneously to the results of this experiment, and the two other experiments on the biokinetics of silver deposited in rat lungs carried out by Takenaka et al. (2000, 2001): inhalation and instillation of metallic silver (see above). It was assumed that the bound fraction fb = 0.0 (see below) and ss = 0.005 d−1 (fixed at the default Type M value). For instillation of silver nitrate, analysis here gave fr = 0.95 and sr = 0.4 d−1, giving assignment to Type F.
25.2.1.2. Unknown forms
(447) In one case of accidental human inhalation of 110mAg associated with particles of unknown composition, lung clearance for silver was apparently completed within a few days, which is consistent with Type F behaviour (Newton and Holmes, 1966). (448) Poulheim (1984) made in-vivo external measurements of 60Co, 58Co/54Mn, and 110mAg on several workers following inhalation of activated corrosion products. Most of the activity was located in the thoracic area. Measurements of 110mAg were made in four workers for up to 71 d. Assuming that the retention function given describes retention in the lungs and that the bound fraction fb = 0.0 (see below), analysis carried out here showed that the results could fit well with dissolution parameter values of fr = 0.9, sr = 0.1 d−1, and ss = 0.005 d−1 (fixed at the default Type M value). This result gives assignment of the 110mAg present to Type F, but very close to the boundary with Type M.
25.2.1.3. Rapid dissolution rate for silver
(449) Analysis carried out here, assuming that the bound fraction fb = 0.0 (see below), gave values of sr = 0.3 or 0.4 d−1 for elemental silver inhaled by dogs and rats, and for silver nitrate instilled into the lungs of rats. Based on these results, a rounded value of 1 d−1 is applied here to all Type F forms of silver. As it is lower than the general default value of 3 d−1 for Type M and S materials, it is also applied here to Type M and S forms of silver.
25.2.1.4. Extent of binding of silver to the respiratory tract
(450) There is some experimental information on silver iodide suggesting that silver seems to form stable complexes with ligands of the lungs (Morrow et al., 1968). Phalen and Morrow (1973) observed that the rate associated with the rapid phase of lung clearance was much lower than the dissolution rate in interstitial fluid simulant, and that this might be due to retention of dissolved silver in lung tissue. Takanaka et al. (2001) noted that absorption of silver from the lungs was slower following instillation of the nitrate than following inhalation of ultrafine silver particles, and that this might be due to binding of silver ions to proteins. However, the information is insufficient to estimate the extent of any bound state, and it is largely taken into account by the low value of sr (1 d−1) used. It is therefore assumed that the bound state can be neglected for silver (i.e. fb = 0).
25.2.2. Ingestion
(451) There are no human and very few animal data on silver absorption. Furchner et al. (1968) reported a comparative study of the whole-body retention of silver after intravenous and oral administration of 110mAgNO3 in mice, rats, dogs, and monkeys, which indicated that absorption was <0.1 in each species. Harrison (1979) investigated the oral absorption of 110Ag-labelled sulfadiazine silver (AgSU) in rats. He showed that oral ingestion resulted in substantial silver deposition, particularly in the liver and lungs, but the data provided were not sufficient to derive a fractional absorption factor. (452) In Publication 30 (ICRP, 1980), an absorption fraction of 0.05 was recommended for all chemical forms of silver. This value was adopted in Publication 67 (ICRP, 1993) for dietary intakes. As no new data on the gastrointestinal absorption seem to be available, this value is adopted here as a default value for all chemical forms (fA = 0.05).
25.2.3. Systemic distribution, retention, and excretion of silver
25.2.3.1. Summary of the database
(a) Human studies
(453) Silver is located in Group 11 (IB) of the periodic table, between copper and gold. It exhibits chemical properties intermediate to those two metals. (454) Silver has been used for therapeutic purposes since at least the 17th century. Several adverse health effects can result from continued or high acute exposure to silver, the most common being a permanent blue-gray discoloration of the skin (argyria) or eyes (argyrosis). Other potential effects include liver and kidney damage; changes in blood cells; and irritation of the eyes, skin, respiratory tract, and intestinal tract. The reader is referred to a review by Drake and Hazelwood (2005) of exposure-related health effects of silver, including a discussion of metabolic properties of silver associated with its adverse effects, and case studies of effects of elevated exposure to different forms of silver. Findings on such studies are of limited value for modelling the normal biokinetics of silver in view of the variability of the human data, and an apparent mass effect on silver biokinetics as demonstrated in rats (Scott and Hamilton, 1950). (455) Polachek et al. (1960) studied the metabolic pathways of radiosilver (a mixture of 105Ag, 106Ag, 110mAg, and 111Ag) in a patient with malignant carcinoid. The radiosilver was injected intravenously after incubation in the patient’s blood. Activity was initially associated mainly with RBC (perhaps an artefact of the method of administration) and the globulin fraction of plasma. After 1 d, the concentration in whole blood was similar to that in plasma. Activity was removed from blood largely by the liver. External measurements over the liver indicated a single component of retention with Tb of ∼48 d. Measurements over the sacrum, chest, and heart indicated two components of retention with half-times of 3.8 d and 48 d; the short-term component represented 30–50% of the initial activity over these regions. The urinary:faecal excretion ratio over the first 3 weeks was ∼0.05. At post-mortem, activity was found mainly in the liver and skin, with the liver showing a two-fold higher concentration than skin. (456) Newton and Holmes (1966) studied the behaviour of 110mAg following its accidental inhalation by a worker. Lung clearance of activity appeared to be completed within a few days. Distribution studies based on external counting were continued for 5 months post exposure. A marked localisation of activity in the liver showed Tb of ∼52 d. (457) Zhu et al. (2010) measured concentrations of silver in 17 tissues obtained from autopsies of 68 Chinese men living in four areas of China with different dietary patterns and considered healthy until the time of sudden accidental death. The investigators also measured concentrations of silver in blood of 10 volunteers from each of the four areas. Highest median concentrations (µg kg−1) were found in the liver (52.2), ribs (2.54), kidneys (2.44), adrenals (0.50), and blood (0.43). The following distribution of silver in the body is estimated from median concentrations and reference weights of blood and tissues in Chinese adult males: liver, 64.5%; bone, 17.8%; blood, 1.7%; kidneys, 0.62%; and remaining tissues and fluids, 15.4%.
(b) Animal studies
(458) Hanson et al. (2001) investigated the behaviour of 110mAg administered intraperitoneally as the nitrate to virgin and lactating female rats in an effort to determine whether the behaviour of silver resembles that of copper. They found that the transport and distribution of silver resemble those of copper in some aspects, particularly with regard to high accumulation in the liver and lactating mammary gland, and the fact that silver attaches to some extent to the copper-carrying protein ceruloplasmin in plasma and milk. However, silver was mainly carried in plasma by a different macroglobulin from that involved in copper transport and, overall, was distributed somewhat differently from copper in tissues. (459) Klaassen (1979) investigated the behaviour of silver in rats, rabbits, and dogs after intravenous administration of various masses of silver nitrate. Distribution studies on rats indicated that the liver was the dominant repository at early times. Biliary secretion was found to be an important route of elimination of silver in all three species, but the secretion rate varied markedly with species. For example, the secretion rate over the first 2 h was an order of magnitude lower in rabbits than in rats, and two orders of magnitude lower in dogs than in rats. By 4 d after administration of 0.1 mg silver kg−1 to rats, ∼70% of the injected silver was eliminated in faeces and <1% was eliminated in urine. (460) Following intramuscular administration of radiosilver to rats, most of the absorbed activity was apparently secreted into the gastrointestinal tract in bile during the first day (Scott and Hamilton, 1950). At 1 d and 4 d, the primary systemic repositories were blood (4.1% and 0.85%, respectively, of the absorbed activity), liver (2.8% and 1.3%), bone (4.2% and 0.66%), muscle (2.2% and 2.3%), and skin (1.9% and 0.61%). (461) Furchner et al. (1968) administered 110mAg nitrate to mice, rats, monkeys, and dogs orally, intravenously, and intraperitoneally. Total-body retention and urinary and faecal excretion rates were determined in all species for the intravenous and oral routes, and in mice and rats for intraperitoneal injection. The time-dependent distribution of activity was determined in rats injected intraperitoneally. The urinary:faecal excretion ratio was generally <0.1 over the first 2 weeks. Total-body retention of activity, expressed as the integral of the retention curve, generally increased in the order mice < rats < monkeys < dogs. For monkeys injected intravenously, ∼84.4% was retained with Tb of 1.8 d, 14% with Tb of 7.0 d, and 1.2% with Tb of 73 d. For dogs injected intravenously, ∼7.1% was retained with a half-time of 2.4 d, 78.2% with a half-time of 11 d, and 2.1% with a half-time of 39 d. In rats, the pattern of removal from all tissues over the first 3 weeks resembled that in the total body, except for a relatively slow loss from the brain and spleen. (462) The biokinetics of silver was studied in dogs exposed by inhalation or tracheal intubation to 110mAg-tagged metallic silver (Phalen and Morrow, 1973). The lung deposit showed biological clearance half-times of ∼2, ∼8, and ∼40 d corresponding to ∼59, ∼39, and ∼2%, respectively, of the deposited amount. Absorbed activity deposited primarily in the liver, which contained, on average, ∼40% of the recovered systemic activity at 111 and 225 d post exposure. The liver showed two phases of retention with Tb of 9 d (97%) and 40 d (3%). At most, 1% of the excreted activity was in urine. It appeared that the bulk of excreted 110mAg represented absorbed activity that deposited in the liver and was excreted in faeces following biliary secretion. (463) Beresford et al. (1994) studied the accumulation of 110mAg in female lambs following acute administration as the nitrate directly into the rumen. Activity concentrations were determined in blood, muscle, liver, lungs, kidneys, spleen, brain, and bone through 369 d post exposure. Throughout the study, the liver accounted for >90% of the total 110mAg found in the sampled tissues. Tb of 79 d was estimated for the liver, compared with 39 d for muscle and 29 d for the kidneys.
25.2.3.2. Biokinetic model for systemic silver
(464) The structure of the model adopted for systemic silver is shown in Fig. 25.1. Transfer coefficients are listed in Table 25.3. Activity absorbed to blood from the respiratory or alimentary tract is assigned to Blood 1. (465) The model was designed to approximate the following features of silver kinetics:
The plasma clearance curve determined for a human subject by Polachek et al. (1960). For modelling purposes, it was assumed that the silver concentration in total blood is the same as the observed time-dependent concentration in plasma. Tb of ∼50 d for the total body, as indicated by data of Polachek et al. (1960) and Newton and Holmes (1966) for human subjects. A urinary:faecal excretion ratio of 0.05. This is consistent with findings of Polachek et al. (1960) for a human subject. A ratio of this order is also indicated by animal studies. The distribution of chronically ingested stable silver as indicated by autopsy data together with blood data for living subjects (Zhu et al., 2010). Committed effective dose coefficients (Sv Bq−1) for the inhalation or ingestion of 103Pd and 107Pd compounds. AMAD, activity median aerodynamic diameter. Isotopes of silver addressed in this publication. EC, electron-capture decay; B+, beta-plus decay; B−, beta-minus decay. Dose coefficients and bioassay data for this radionuclide are given in the printed copy of this publication. Data for other radionuclides listed in this table are given in the online electronic files on the ICRP website. Absorption parameter values for inhaled and ingested silver. It is assumed that the bound state can be neglected for silver (i.e. fb = 0). The values of sr for Type F, M, and S forms of silver (1 d−1) are element-specific. Materials (e.g. silver nitrate) are listed here where there is sufficient information to assign to a default absorption type, but not to give specific parameter values (see text). For inhaled material deposited in the respiratory tract and subsequently cleared by particle transport to the alimentary tract, the default fA values for inhaled materials are applied [i.e. the (rounded) product of fr for the absorption type and the fA value for ingested soluble forms of silver (0.05)]. Default Type M is recommended for use in the absence of specific information on which the exposure material can be assigned to an absorption type (e.g. if the form is unknown, or if the form is known but there is no information available on the absorption of that form from the respiratory tract). For guidance on the use of specific information, see Section 1.1. Activity transferred from systemic compartments into segments of the alimentary tract is assumed to be subject to reabsorption to blood. The default absorption fraction fA for the secreted activity is the reference fA ( 0.05) for ingestion of the radionuclide. Transfer coefficients in the biokinetic model for systemic silver. ST, soft tissue. ST0 and ST1 are compartments of other soft tissues representing two phases of biological removal to blood. Structure of the biokinetic model for systemic silver. SI, small intestine. ST, soft tissue. ST0 and ST1 are compartments of other soft tissues representing two phases of biological removal to blood.
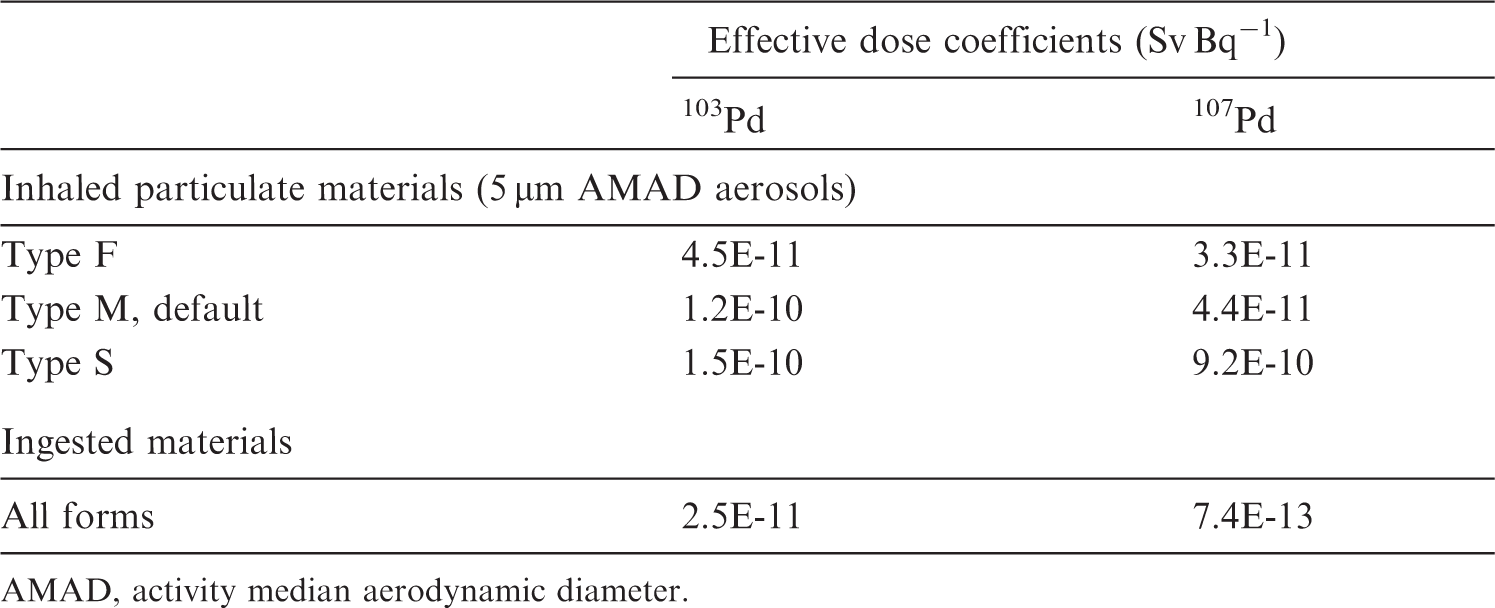

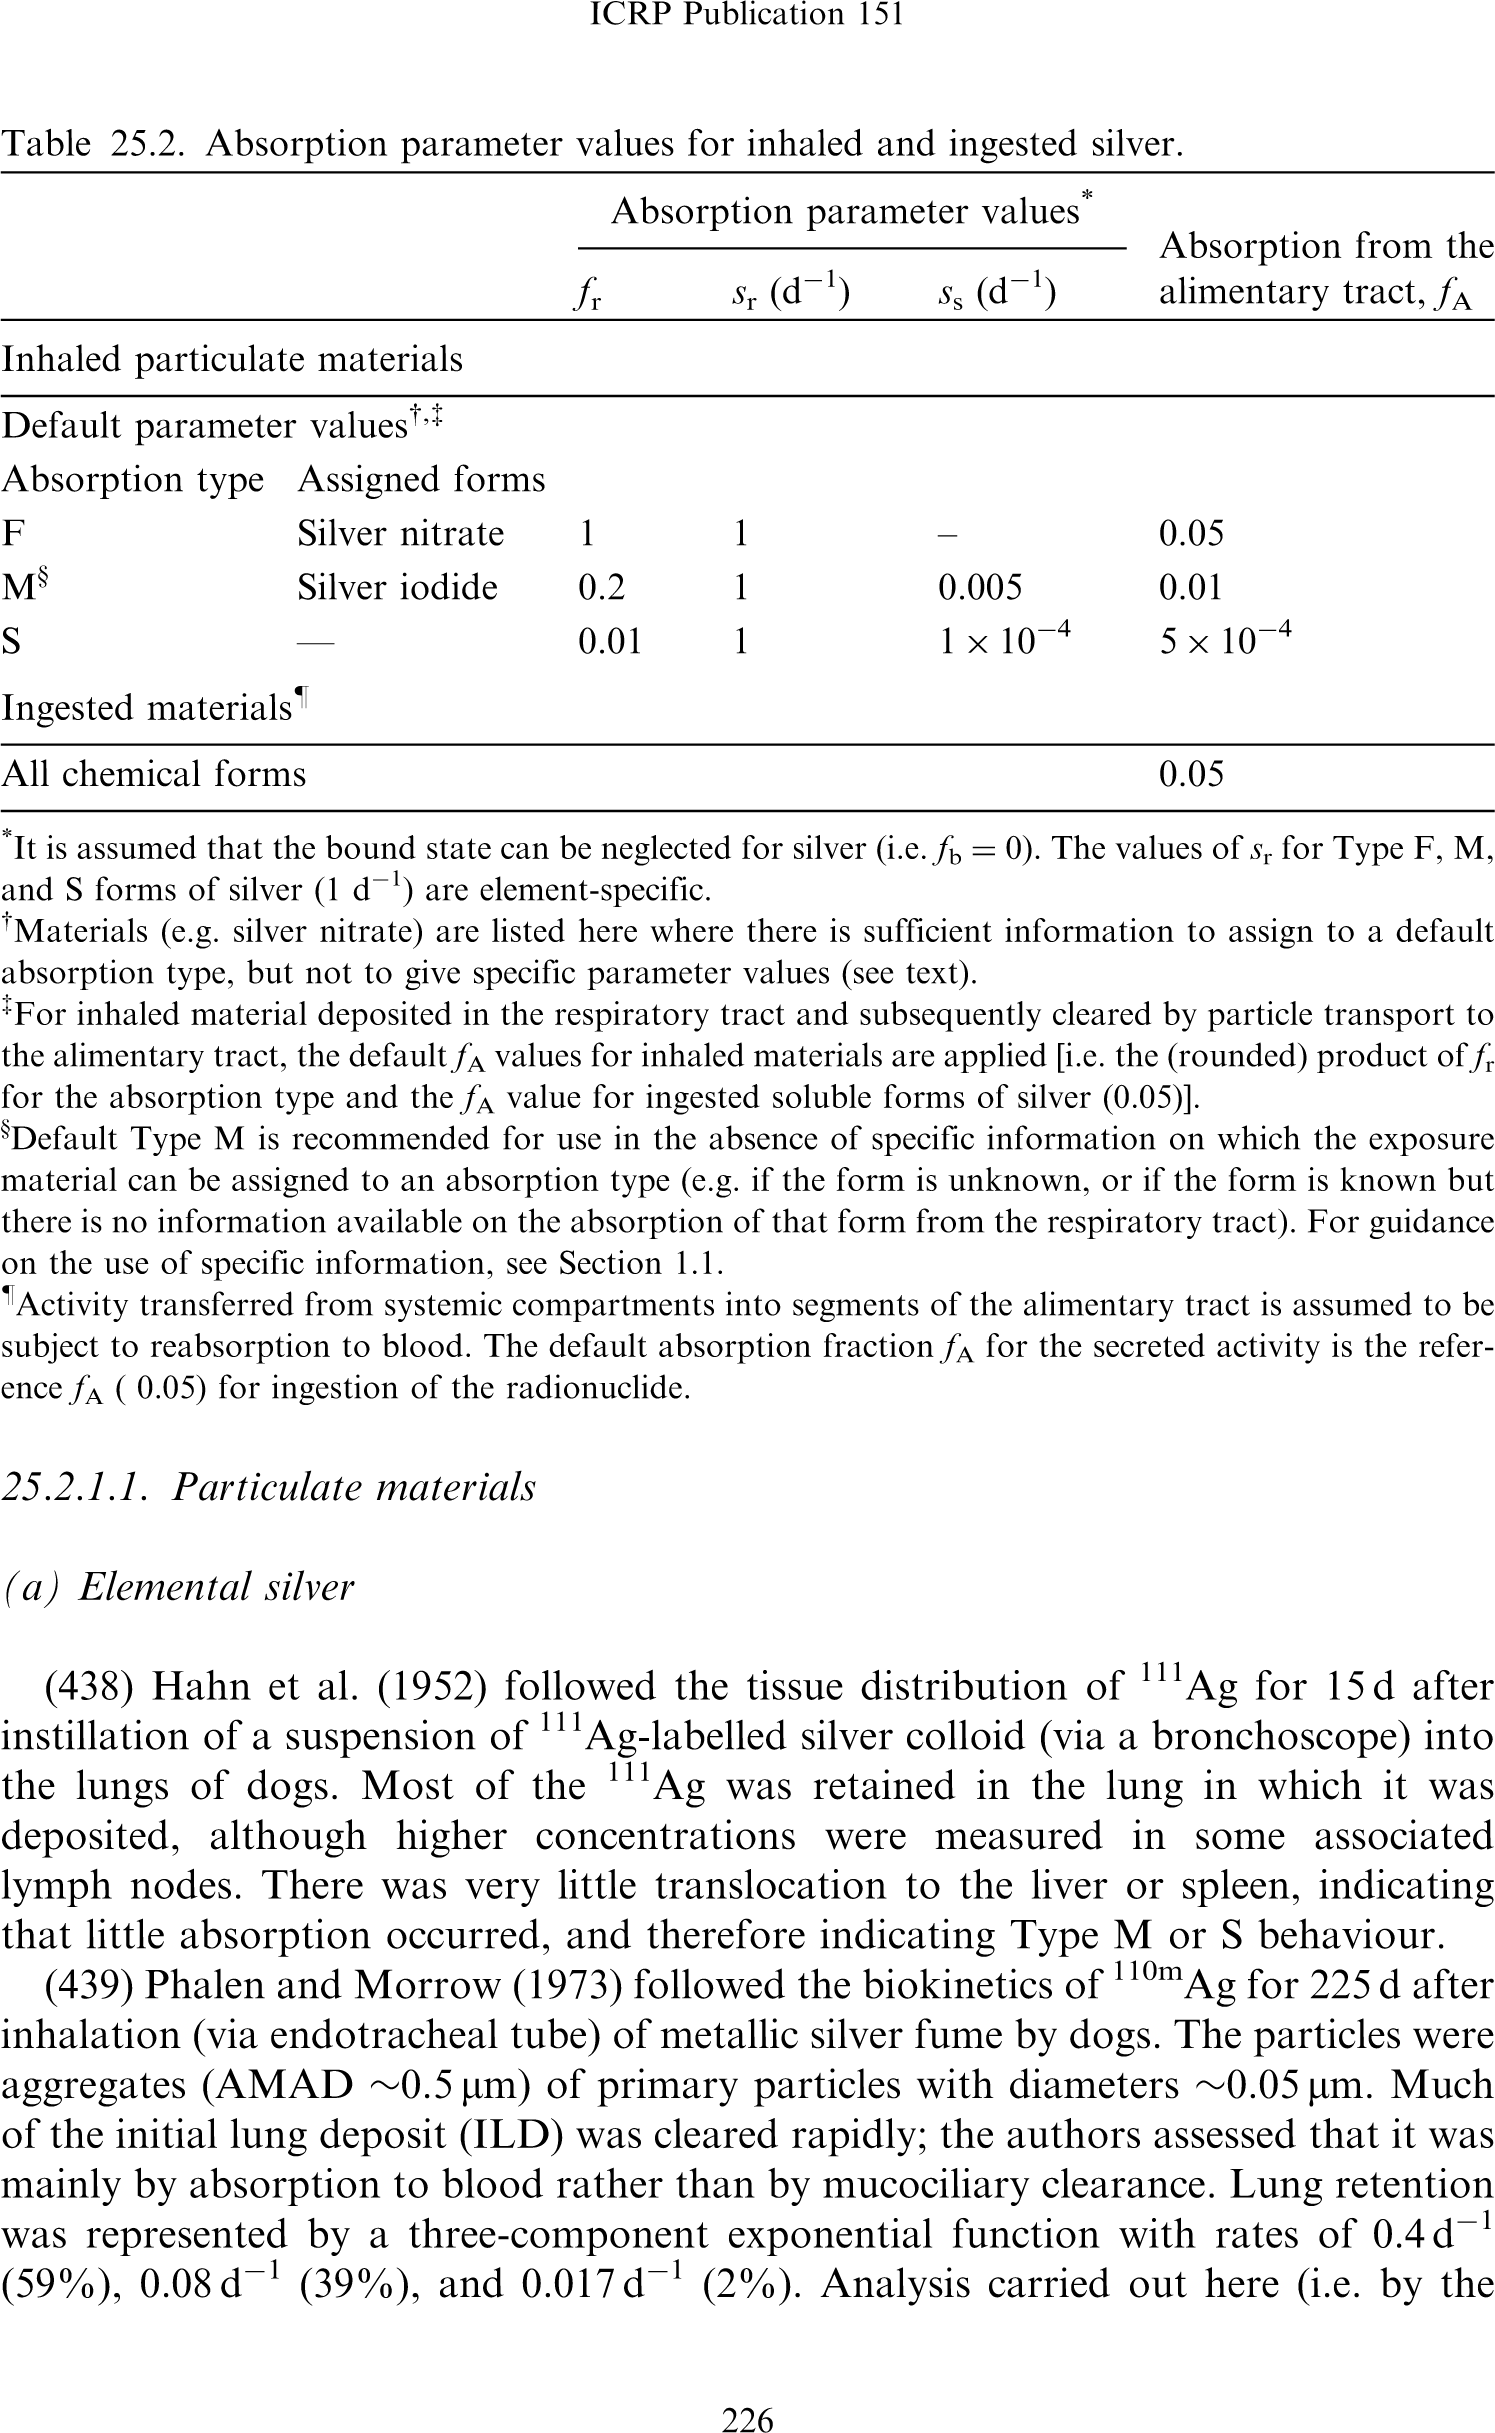
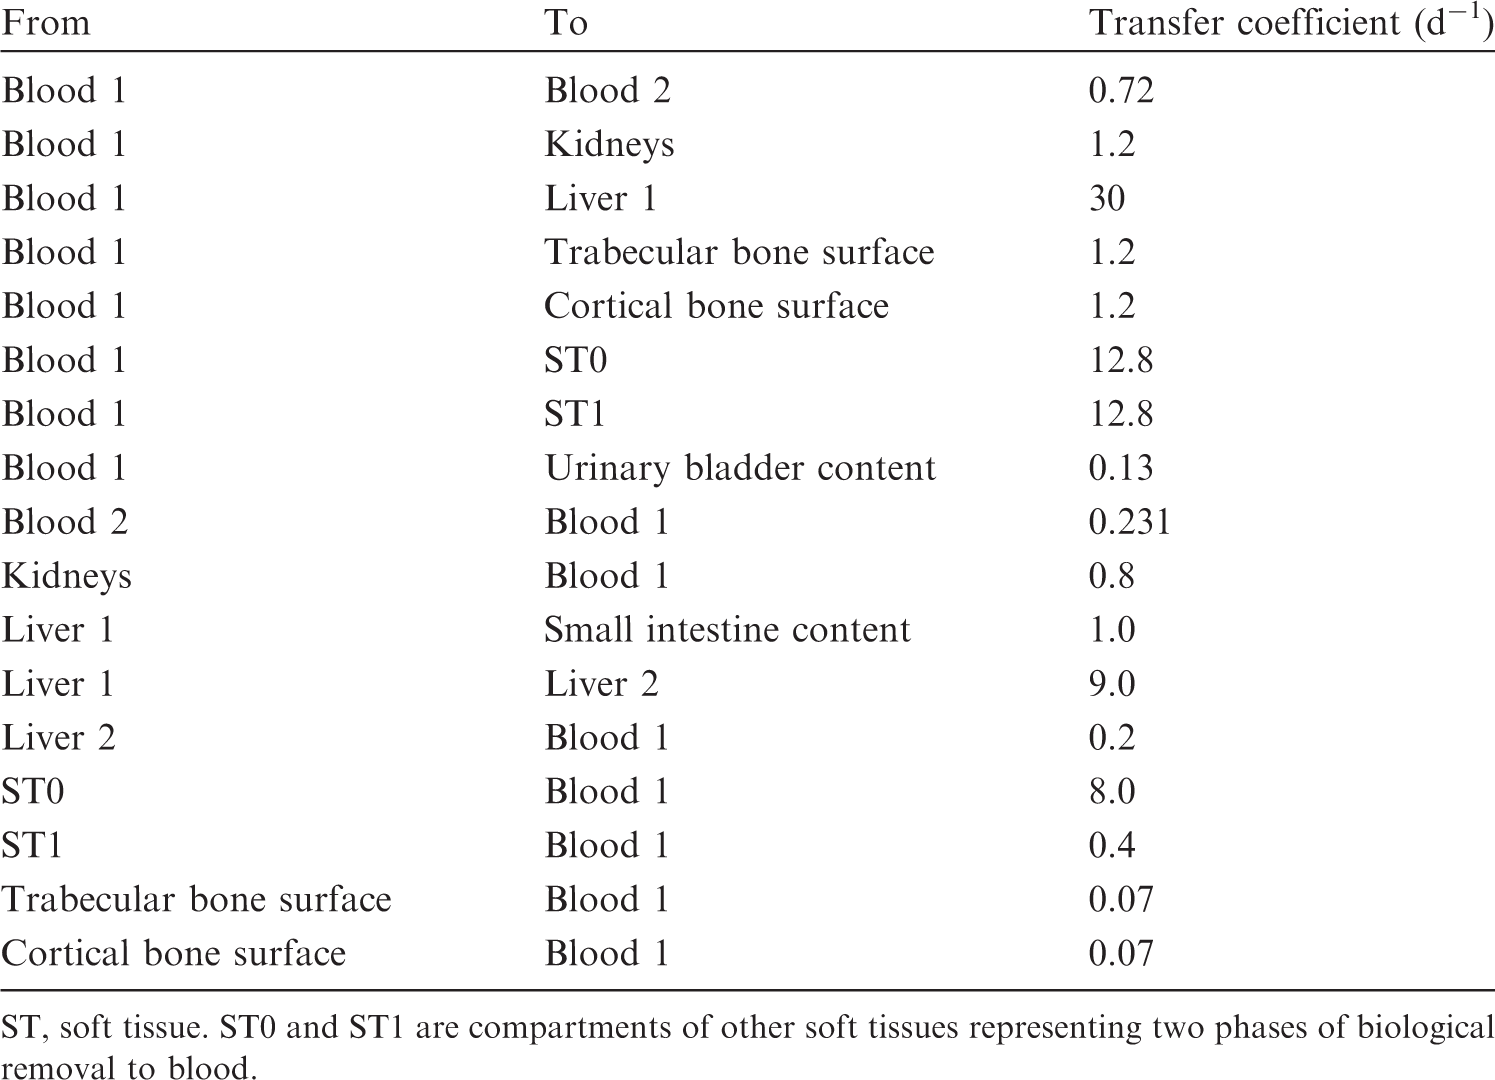
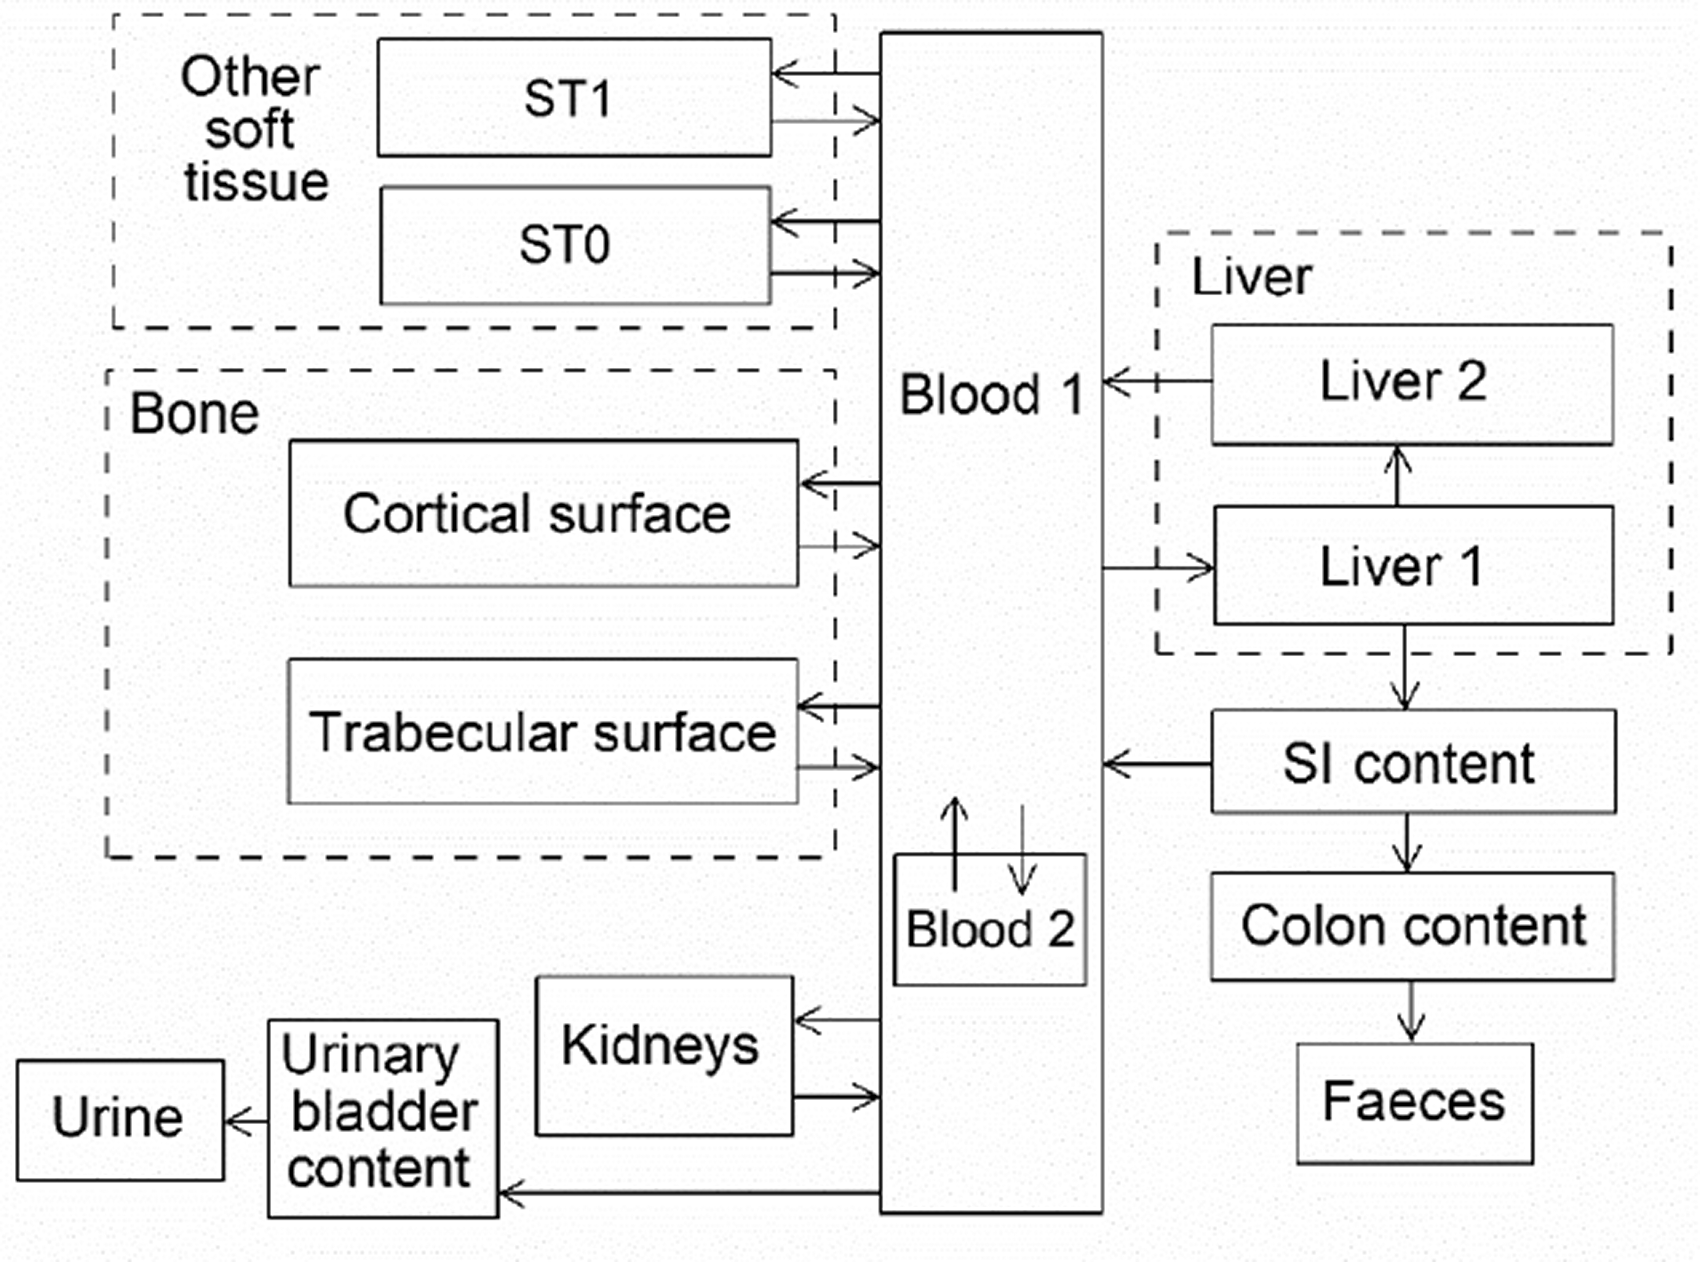
25.2.3.3. Treatment of progeny
(466) Progeny of silver addressed in this publication are isotopes of silver, rhodium, palladium, indium, and cadmium. The model for silver as a parent is applied to silver produced by decay of another isotope of silver. The models for rhodium, palladium, indium, and cadmium as progeny of silver are the characteristic models for these elements with added compartments and associated transfer coefficients needed to solve the linked biokinetic models for chains headed by silver. Muscle and pancreas were added to the explicitly identified tissues in the characteristic model for indium. The following rates of transfer of indium between blood compartments in the characteristic model for indium and the added tissues were assigned: transferrin to pancreas, 0.001 d−1; transferrin to muscle, 0.2 d−1; pancreas to plasma, 2.37 d−1; and muscle to plasma, 2.37 d−1. Rhodium, palladium, indium, or cadmium produced in a compartment of the model for a preceding chain that is not a compartment in the model for that progeny (an ambiguous compartment) is assumed to transfer to the central blood compartment of the progeny’s model, and to follow that model thereafter. The following transfer rates are assigned to progeny produced in ambiguous compartments: 1000 d−1 if produced in a blood compartment; at the rate of bone turnover for the indicated bone type if produced in a bone volume compartment; and at the following element-specific rates if produced in any other compartment: rhodium, 0.09902 d−1; palladium, 0.1386 d−1; indium, 2.37 d−1; and cadmium, 0.5 d−1.
25.3. Individual monitoring
25.3.1. 110mAg
(467) Measurements of 110mAg may be performed by in-vivo whole-body measurement technique and by gamma measurement in urine.
25.4. Dosimetric data for silver
26. Cadmium (Z = 48)
26.1. Isotopes
26.2. Routes of intake
26.2.1. Inhalation
26.2.1.1. Absorption types and parameter values
(468) The ICRP Task Group on Lung Dynamics (1966) assigned oxides and hydroxides of cadmium to inhalation class Y; sulphides, halides, and nitrates to inhalation class W; and all other compounds of the element to inhalation class D. This classification was adopted by ICRP in Publication 30 (ICRP, 1980), although a long-term component of lung retention was observed in dogs exposed to near-lethal doses of cadmium chloride by inhalation (Harrison et al., 1947). Due to its recognised hazards, the inhalation toxicology of cadmium has been studied extensively (ATSDR, 2012a). Information is available on the behaviour of inhaled cadmium particles from animal studies and limited empirical human data. (469) Absorption parameter values and types, and associated fA values for particulate forms of cadmium are given in Table 26.2. (470) Reference biokinetic models were used here (i.e. by the Task Group) for analysis of the data and the determination of absorption parameter values for cadmium particles. Lung retention data were interpreted using the revised HRTM (ICRP, 2015) and the respiratory tract model for rat described in Supporting Guidance 3 (ICRP, 2002b). Cadmium in lung tissue and blood was taken into account in the comparison with experimental data by using the systemic model for cadmium described in Section 26.2.3 and the simple rat systemic model described by Moore et al. (1973). Substantial lung retention of cadmium has been observed following deposition of soluble forms in the lungs (see Section 26.2.1.2) that might be explained either by a bound state or by the formation of particles. It was decided here to assume no bound state (fb = 0) of cadmium in the respiratory tract, as discussed in Section 26.2.1.4. Monitoring techniques for 110mAg. Measurement system comprised of germanium detectors. Counting time of 20 min. Committed effective dose coefficients (Sv Bq−1) for the inhalation or ingestion of 110mAg compounds. AMAD, activity median aerodynamic diameter. Dose per activity content of 110mAg in total body and in daily excretion of urine (Sv Bq−1); 5 µm activity median aerodynamic diameter aerosols inhaled by a reference worker at light work. Isotopes of cadmium addressed in this publication. EC, electron-capture decay; β+, beta-plus decay; β–, beta-minus decay; IT, isomeric transition decay. Dose coefficients and bioassay data for this radionuclide are given in the printed copy of this publication. Data for other radionuclides listed in this table are given in the online electronic files on the ICRP website. Absorption parameter values for inhaled and ingested cadmium. It is assumed that the bound state can be neglected for cadmium (i.e. fb = 0). The values of sr for Type F, M, and S forms of cadmium (30, 3, and 3 d−1, respectively) are the general default values. Materials (e.g. oxide) are generally listed here where there is sufficient information to assign to a default absorption type, but not to give specific parameter values (see text). For inhaled material deposited in the respiratory tract and subsequently cleared by particle transport to the alimentary tract, the default fA values for inhaled materials are applied [i.e. the product of fr for the absorption type (or specific value where given) and the fA value for ingested soluble forms of cadmium (0.05)]. Default Type M is recommended for use in the absence of specific information on which the exposure material can be assigned to an absorption type (e.g. if the form is unknown, or if the form is known but there is no information available on the absorption of that form from the respiratory tract). For guidance on the use of specific information, see Section 1.1. Activity transferred from systemic compartments into segments of the alimentary tract is assumed to be subject to reabsorption to blood. The default absorption fraction fA for the secreted activity is the highest value for any form of the radionuclide (fA = 0.05).
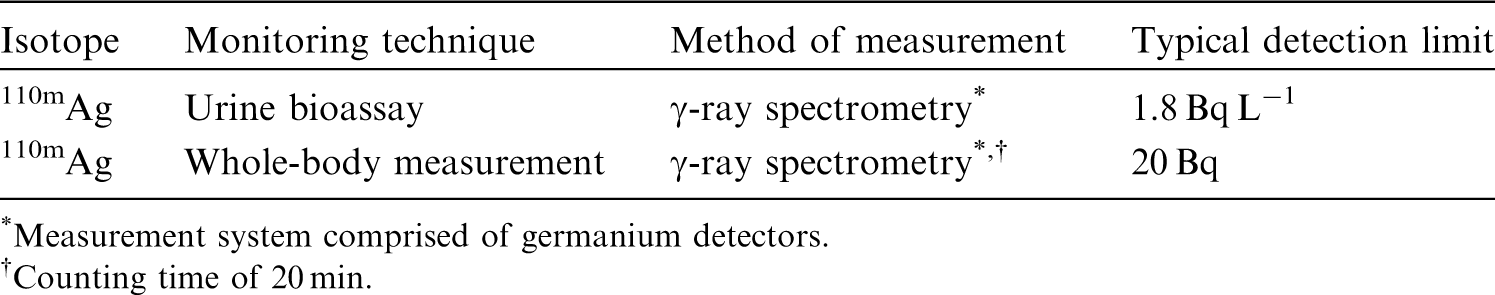

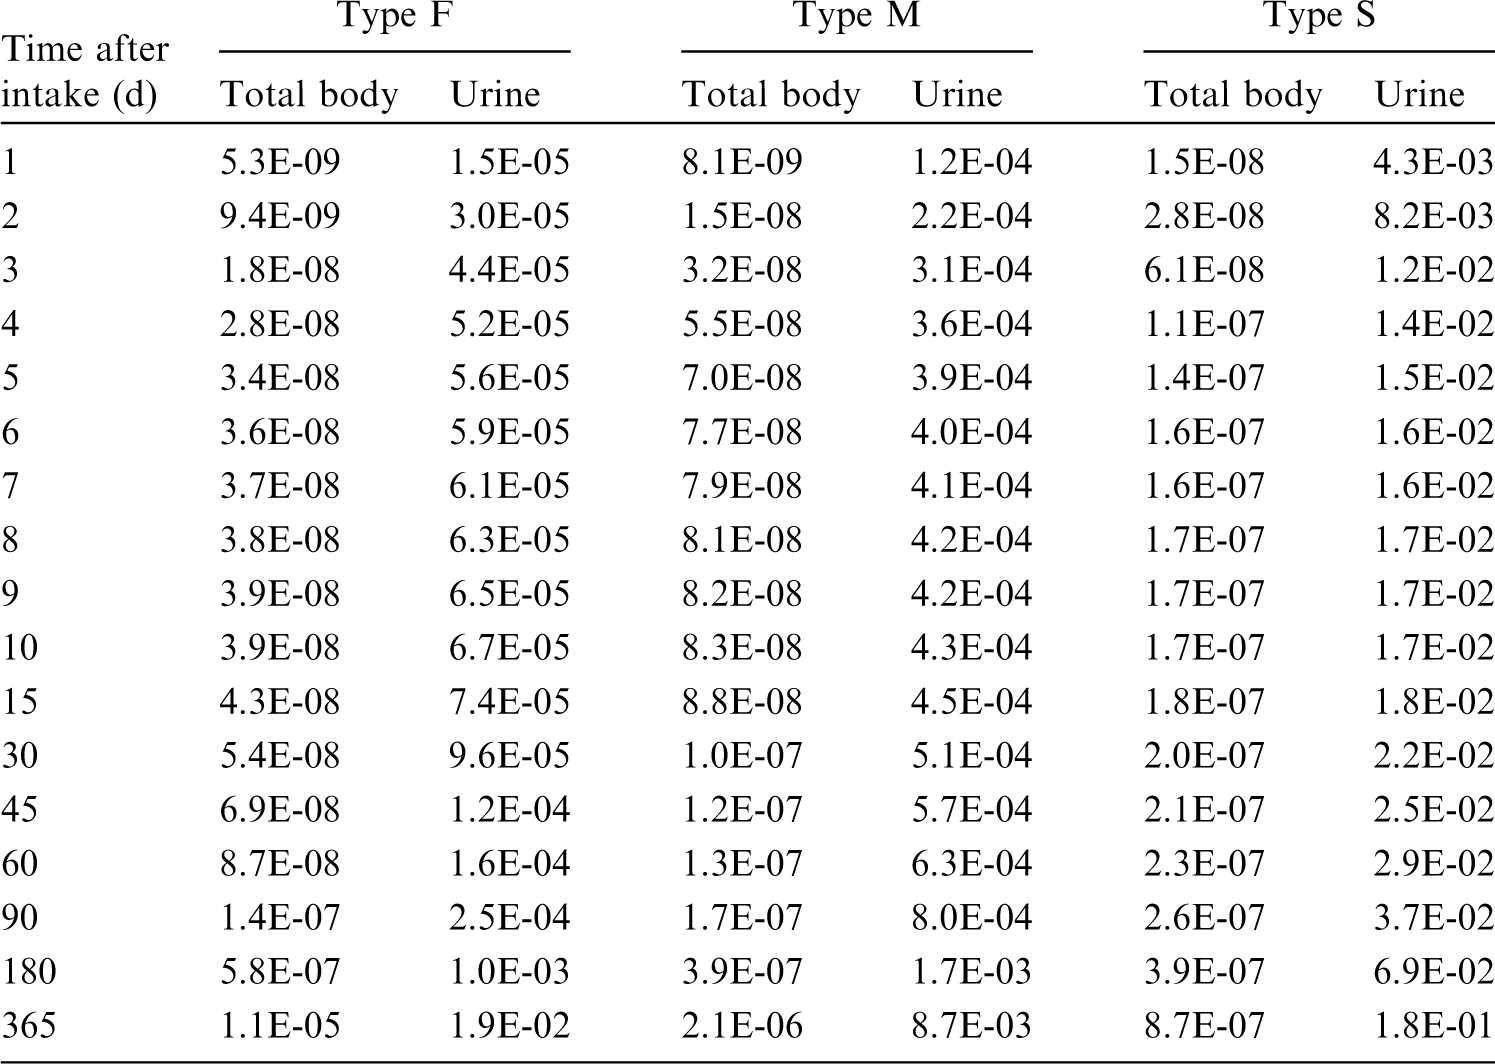
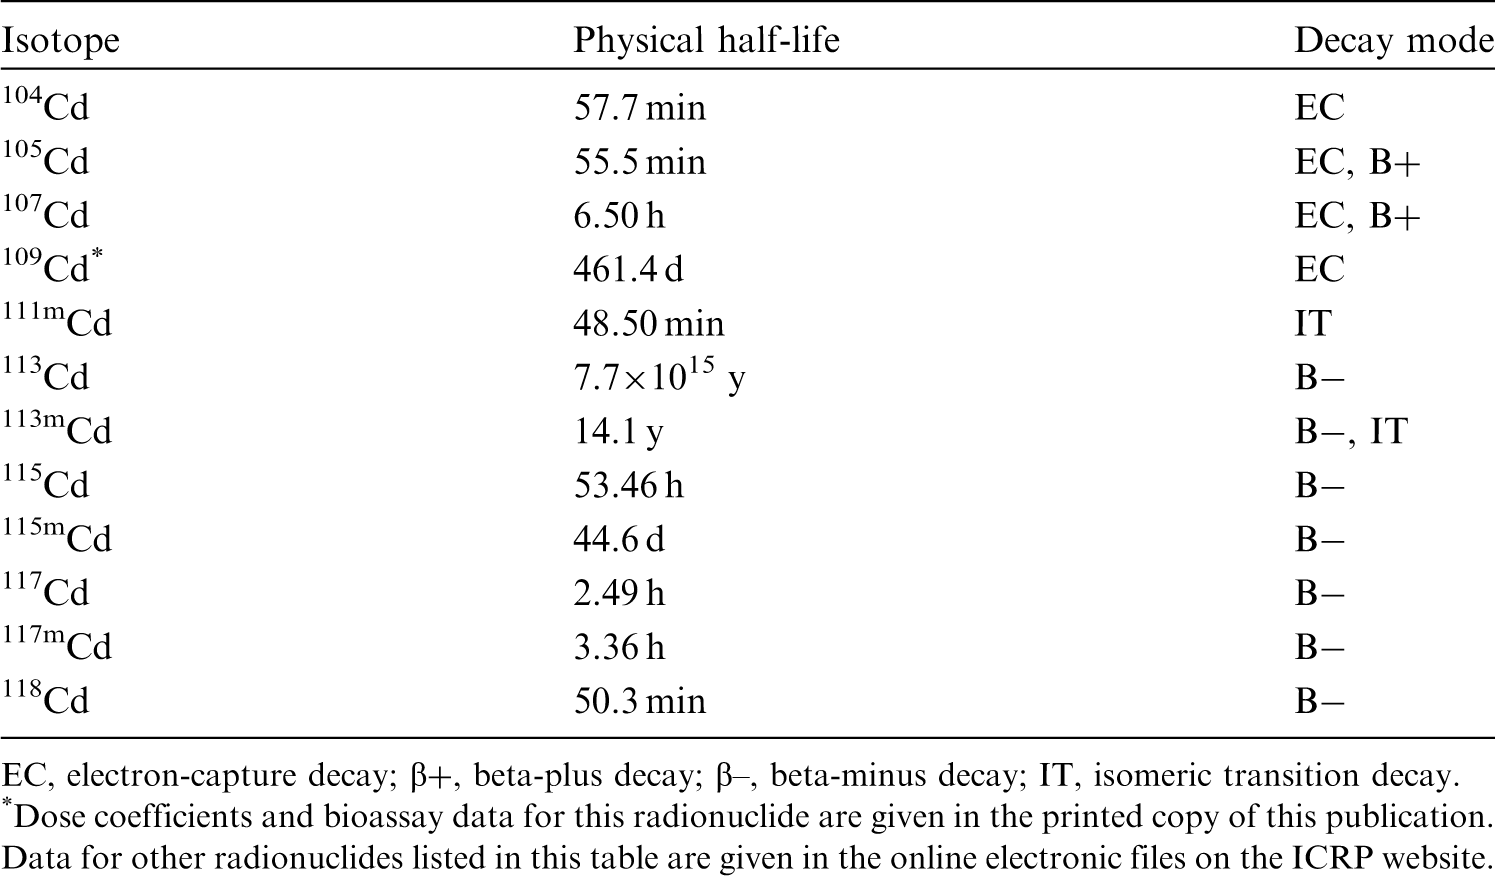
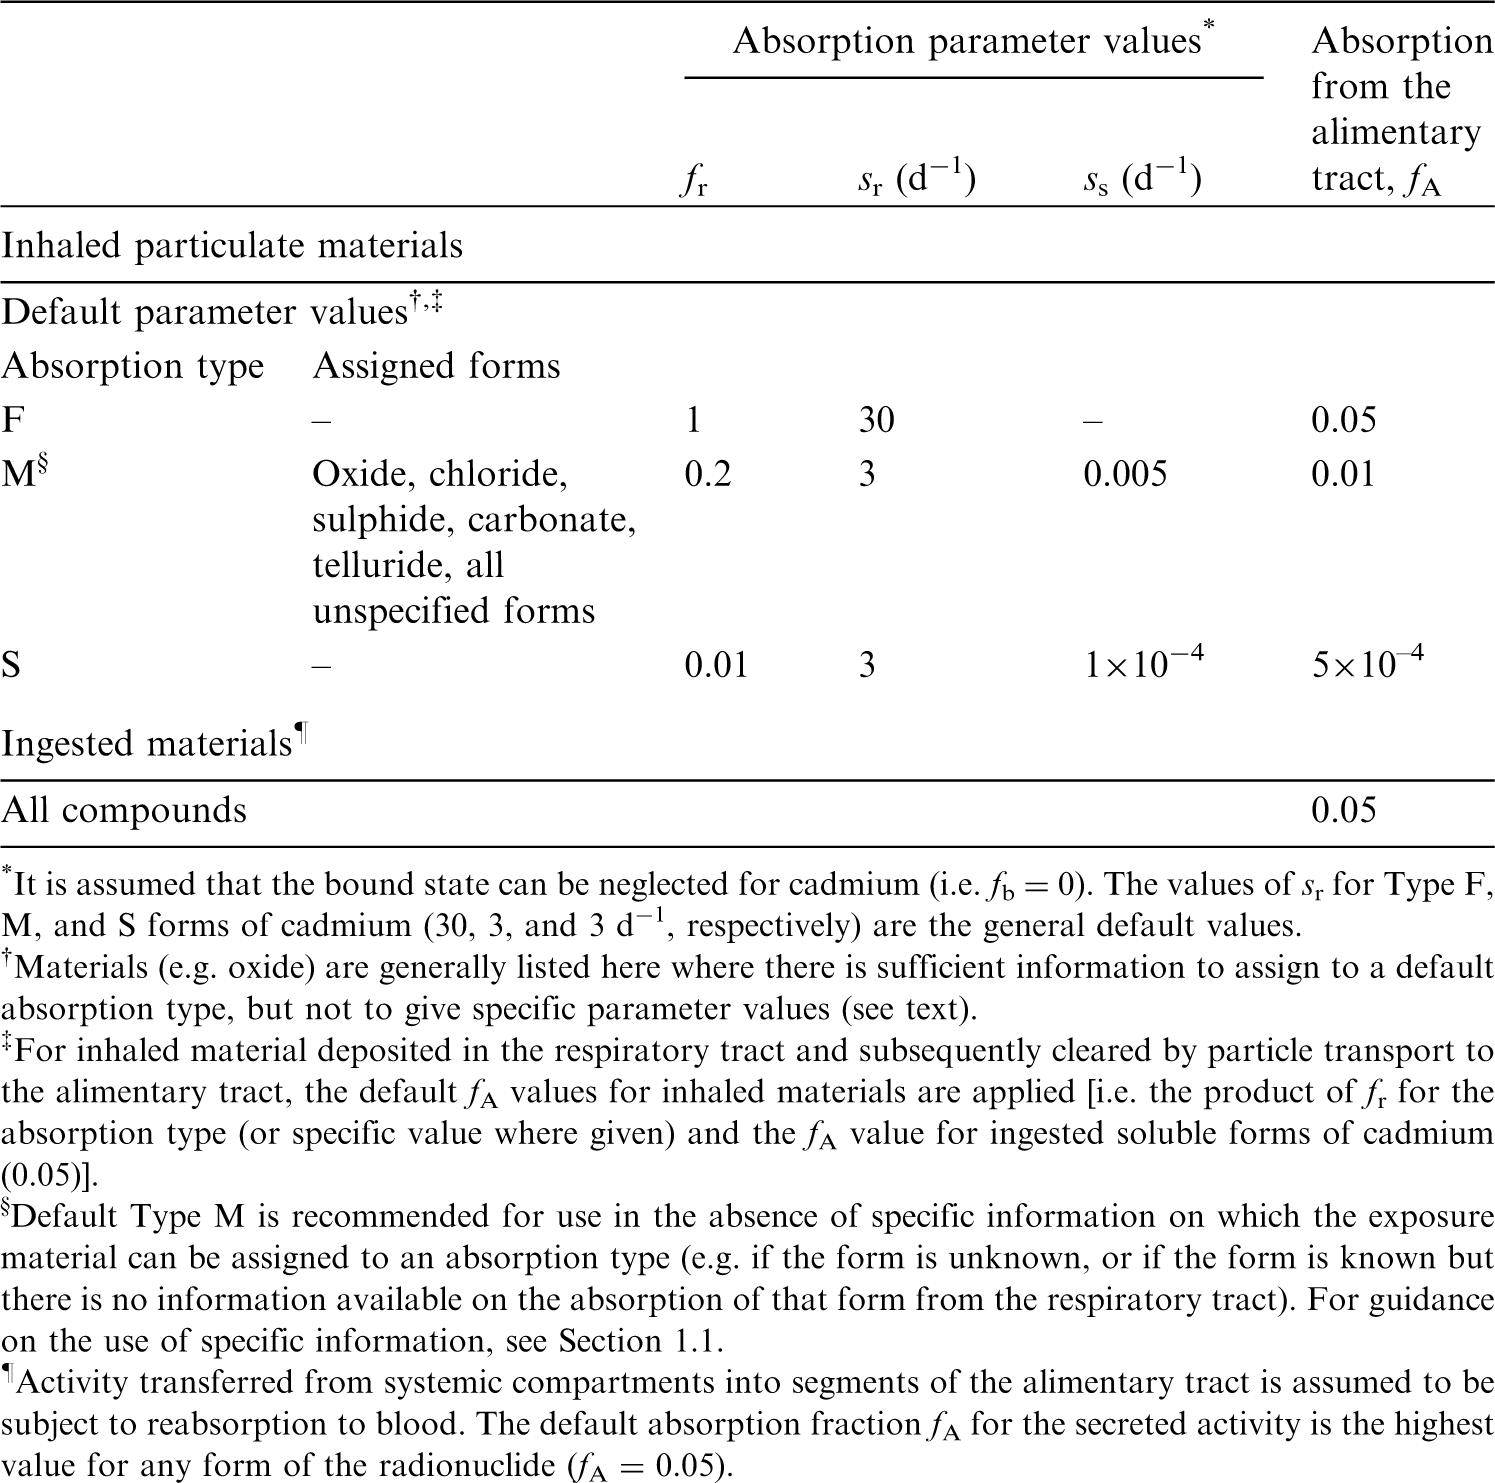
26.2.1.2. Particulate aerosols
(a) Cadmium chloride (CdCl2)
(471) In an early study, Harrison et al. (1947) determined the distribution over 15 weeks of stable cadmium in the tissues of dogs exposed to CdCl2 aerosols by inhalation. The cadmium concentration in the lungs decreased rapidly during the first few days, but residual pulmonary cadmium was still observed 15 weeks after exposure. A significant proportion of inhaled cadmium was found in the kidneys and liver. Therapy with 2,3 dimercaptopropanol did not appear to influence its biokinetics. Analysis here of the data gave fr = 0.3, sr = 0.7 d−1, and ss < 0.005 d−1. This is consistent with Type M behaviour. (472) Moore et al. (1973) studied the whole-body retention of 115mCd in rats after administration of 115mCdCl2 by either ingestion, inhalation, and intraperitoneal or intravenous injection. After initial clearance of 7.3% of intravenously injected activity through faecal excretion during the first 24 h, the biological half-time, Tb, of systemic Cd was 252 d. Comparison here of the whole-body retention data after inhalation and intravenous injection suggested fr ≈ 0.2, ss ≈ 0.01 d−1, and assignment to Type M. (473) Henderson et al. (1979) measured 115mCd in the lungs, gastrointestinal tract, liver, kidneys, and skull of hamsters for 3 weeks after inhalation of CdCl2 aerosols with MMAD of 1.7 µm at two levels of exposure. Two hours after exposure, an upward trend was observed in the amount of Cd2+ transferred to the liver, with increasing amounts of CdCl2 deposited in the lungs. Approximately one-third of the initial lung deposit (ILD) had left the lungs by 24 h. At 3 weeks, lung burdens were ∼40% ILD. Lavages of excised lung failed to remove a significant amount of Cd2+: ∼3.5% of the material present in the lungs was removed at any time. Analysis here of the data gave fr = 0.3, sr = 30 d−1, ss < 0.005 d−1, and assignment to Type M. (474) Oberdörster et al. (1979) observed the clearance and translocation of stable cadmium from rat lungs for 100 d after inhalation of CdO and CdCl2 aerosols with respective MMAD of 0.46 and 0.38 µm. Inhaled CdCl2 particles did not exhibit the initial clearance of CdO, with only 2% removed from the lungs between day 0 and day 1, although the liver and kidneys exhibited significant increases in cadmium on day 1, attributed to cadmium absorbed through the alimentary tract. After that, the lung clearance was mono-exponential with the same Tb of 67 d as for the less soluble CdO. The authors therefore noted that the dissolution rate of cadmium compounds apparently did not play a major role in the long-term clearance of inhaled cadmium from the lungs. The cadmium burden in the liver and kidneys was five to seven times higher than in the CdO experiment. Analysis here of the CdCl2 data gave fr = 0.28, sr = 2 d−1, ss = 0.0055 d−1, and assignment to Type M. (475) Oberdörster et al. (1980) studied the lung deposition and clearance over 100 d of 115mCd in rats exposed to CdCl2 aerosols by nose-only inhalation or by intratracheal instillation. The results showed a bi-exponential pattern with approximately half of the deposited cadmium cleared with short half-lives of 1.1 d (inhalation) and 0.7 d (instillation), and the rest cleared with long half-lives of 61 d (inhalation) and 66 d (instillation). After day 2 post instillation, <2% cadmium could be lavaged out of the lungs. Maxima of 54% and 13% of instilled cadmium eventually reached the liver and kidneys, respectively. Analysis here of the instillation data gave fr = 0.55, sr = 1 d−1, ss = 0.006 d−1, and assignment to Type M. (476) Glaser et al. (1986) determined the retention of stable cadmium in the lungs, liver, and kidneys of rats after 1 month of chronic inhalation of cadmium chloride, cadmium oxide, and cadmium sulphide aerosols; and 2 months after the end of exposure. At the end of the inhalation period, lung cytosolic cadmium was not preferentially bound to metallothionein, but this changed 2 months later when 70–86% of the cytosolic cadmium was measured to be bound to metallothionein. Analysis here of the CdCl2 data indicated absorption of ∼30% of deposited cadmium and assignment to Type M. (477) Oberdörster et al. (1987) determined the pulmonary retention of cadmium in two female Macaca fascicularis monkeys up to 650 d after inhalation of 109CdCl2 via endotracheal tubes, and by in-vivo lung and renal measurement. Lung retention showed Tb of 736 and 964 d, while kidney content increased steadily. A third monkey inhaled 115mCdO and was followed for 240 d. 115mCd lung retention showed a half-life of 637 d, while 115mCd in the kidneys showed a steady-state level after approximately day 50. Autoradiographic measurements in the interstitium of the lung showed that interstitial macrophages carried the highest amount of label, whereas alveolar epithelial cells showed less activity. Analysis here of the 109Cd data suggested fr = 0.7, sr ∼100 d−1, and ss < 0.0001 d−1, which would be consistent with Type M behaviour.
(b) Cadmium carbonate (CdCO3)
(478) Rusch et al. (1986) studied the distribution and excretion of cadmium in rats over 1 month after inhalation of cadmium carbonate (CdCO3) and two insoluble cadmium pigments (see below). Cadmium blood levels indicated that cadmium was absorbed to a greater degree from CdCO3 than from the pigments. The levels of cadmium in the liver and kidneys were much higher following exposure to the carbonate than following exposure to the pigments. Analysis here of the CdCO3 data gave fr = 0.2, sr = 10 d−1, ss = 0.007 d−1, and assignment to Type M.
(c) Cadmium telluride (CdTe)
(479) Morgan et al. (1997) measured the absorption and distribution of cadmium over 4 weeks after intratracheal instillation of cadmium telluride (CdTe) by rats. Cadmium and tellurium levels decreased significantly in the lungs after exposure, and concomitant increases in cadmium levels were detected in the spleen, kidneys, femur, and liver. Analysis here of the cadmium data gave fr = 0.4, sr = 2 d−1, ss = 0.02 d−1, and assignment to Type M.
(d) Cadmium oxide (CdO)
(480) Barrett et al. (1947) generated cadmium oxide fumes with an electric arc striking metallic cadmium, and groups of mice, rats, guinea pigs, rabbits, dogs, and monkeys were exposed to the fumes for 10–30 min. Lung fractional retention of 5–20% inhaled cadmium was estimated at the time of death, from 1 h to 44 d post exposure. For animals exposed to similar concentrations of fumes, the authors noted no significant difference in the cadmium content of the lungs related to time after inhalation or to animal species. Although no temporal pattern was evident, appreciable amounts of cadmium were found in the liver and kidneys, with concentrations comparable with that of the lungs for monkeys, indicating significant absorption. (481) Boisset et al. (1978) measured the stable cadmium content of the lungs, liver, and kidneys in unexposed control rats, and for 3 months after repeated exposures to CdO particles. Twelve percent of inhaled cadmium was deposited in the lungs and cleared with Tb = 56 d, while a slight but significant accumulation was seen in the kidneys and liver. The authors considered that 60% of the lung-deposited cadmium was absorbed. The difference in lung and systemic cadmium content between exposed rats and controls was assessed here to be consistent with fr = 0.2, sr = 3 d−1, and ss = 0.008 d−1, indicating assignment to Type M. (482) As explained above, Oberdörster et al. (1979) observed the clearance of cadmium from rat lungs for 100 d after inhalation of CdO and CdCl2. After an initial phase of rapid clearance, CdO lung retention beyond day 8 could be described by a mono-exponential curve with Tb = 67 d. Approximately 10% of the lung cadmium appeared in the liver and kidneys. Analysis here of the CdO data gave fr = 0.1, sr = 1 d−1, ss = 0.0055 d−1, and assignment to Type M. (483) Hadley et al. (1980) studied the pulmonary absorption of cadmium in rats for 2 weeks after intratracheal instillation of micrometric particles of 109CdO. The half-life of 109Cd in the lungs was ∼4 h, at which time nearly 40% of the 109Cd body burden was in the liver. Less than 10% of the instilled 109Cd was excreted in either urine or faeces during 2 weeks. Analysis here gave fr = 0.7, sr = 3.5 d−1, and ss = 0.027 d−1, indicating borderline Type F–Type M behaviour. (484) Rhoads and Sanders (1985) studied the lung clearance and translocation of the oxides of eight elements, including cadmium, over 2 weeks after deposition in rat lung. After intratracheal instillation, 50% ILD of cadmium was cleared in 8 h. The cadmium liver concentration peaked at ∼60% IAD by 7 d and decreased slowly thereafter. Activity in the kidneys was ∼8% IAD and increasing at the end of the study. Only 10% of the instilled activity had been excreted at 2 weeks, largely in faeces. Analysis here of the CdO data gave fr = 0.75, sr = 5 d−1, ss = 0.005 d−1, and assignment to Type M. (485) As mentioned above, Glaser et al. (1986) determined the distribution of cadmium after 1 month of chronic inhalation of CdCl2, CdO, and CdS, and 2 months after the end of exposure. The results indicate rapid absorption of CdO of the order of 50%, approximately twice that of the chloride and sulphide, and are consistent with assignment to Type M.
(e) Cadmium sulphide (CdS)
(486) Analysis here of the cadmium sulphide data from Glaser et al. (1986) indicated absorption of ∼30% of deposited cadmium and assignment to Type M.
(f) Insoluble pigments
(487) As mentioned above, Rusch et al. (1986) studied the distribution and excretion of cadmium in rats over 1 month after inhalation of CdCO3 and two highly insoluble cadmium pigments (finely divided red and yellow powders of cadmium, selenium, sulphur, and zinc in hexagonal form produced by high-temperature calcination). Cadmium blood levels indicated that cadmium from CdCO3 was absorbed to a greater degree than cadmium from the pigments. The major route of cadmium elimination was through faeces, with 80% being cleared within 24 h, whereas much lower amounts were eliminated in the faeces of the CdCO3-exposed rats. Analysis here of the data for the insoluble cadmium pigments gave fr = 0.001–0.002, and ss < 5 × 10⁻⁴ d−1, consistent with Type S behaviour.
(g) Unspecified forms
(488) Edvardsson (1971) used whole-body measurements to follow, for 2 months, the elimination of 115Cd and 115mCd by workers who had been contaminated while repacking an irradiated sample. A urine sample was taken 3 d after the incident from the most contaminated person. In the two most contaminated people, 115mCd was eliminated with two components of Tb of 1.8 and 34 d, and 0.8 and 12 d, respectively. The low urinary excretion measured was considered here to rule out Type F absorption. (489) Nordberg et al. (1985) reviewed the studies comparing the increased body burden of cadmium among smokers, and estimates of the total inhaled amount of cadmium from the cigarette smoke. Friberg et al. (1974) calculated long-term body retention of 27–54% from the data of Lewis et al. (1972), and suggested that absorption would be higher than this retention. Elinder et al. (1976) used autopsy data from Swedish smokers to estimate respiratory absorption to be ∼45%. The 10-fold ratio between concentrations of cadmium in the blood of Swedish smokers and non-smokers determined by Elinder et al. (1983) would indicate near-complete absorption of cadmium inhaled from cigarettes.
26.2.1.3. Rapid dissolution rate for cadmium
(490) Although data are available to estimate the rapid dissolution rate of cadmium in particulate form, the values obtained here are not different enough from general default values to justify adopting element-specific values.
26.2.1.4. Extent of binding of cadmium to the respiratory tract
(491) There is substantial retention of cadmium in the lungs following deposition of soluble forms such as chloride. In the study by Oberdörster et al. (1979), water-soluble CdCl2 was retained in rat lungs with a similar retention half-life of ∼2 months as the insoluble CdO. This was interpreted by Oberdörster (1988) as the consequence of the chemical binding of dissolved cadmium to lung tissues. This interpretation is supported by the observation of the small fractions (a few percent) of cadmium removed by lavage of lung tissues (Henderson et al., 1979; Oberdörster et al., 1980). (492) An alternative explanation of the relatively long cadmium retention following deposition of soluble forms is the formation of particles, such as colloids or aggregates, within lung fluids. These would be subject to particle transport and the retention Tb of ∼2 months is indeed very similar to that expected for insoluble particles in rat lungs over the same period. Moreover, Oberdörster et al. (1987) observed much longer retention half-lives, ∼2 y, of cadmium in monkey lungs than in rat lungs after inhalation of either CdCl2 or CdO that could be explained by the different particle transport rates in the two species. Finally, lung autoradiography showed that interstitial macrophages carried the highest amount of cadmium, whereas alveolar epithelial cells showed less activity. This would also be more consistent with cadmium in phagocyted particles than in the bound state. (493) In view of these observations, it was assumed here that unabsorbed cadmium was predominantly cleared by particle transport, and that cadmium was retained in the lungs in particulate form, rather than in the bound state. Adequate fits to data were obtained here on that assumption. It is therefore assumed that the bound state can be neglected for cadmium (i.e. fb = 0.0). (494) Note that no evidence was found for binding of cadmium in the conducting airways (ET, BB, and bb regions). Hence, if a bound state had been assumed here, it would have been applied only in the AI region and thoracic lymph nodes. The source regions in AI and thoracic lymph nodes are the same for particulate and bound activity, and therefore the equivalent lung doses are the same whether the retained activity is assumed to be particulate or bound. There would be some difference in the route of clearance and hence doses to other organs.
26.2.2. Ingestion
(495) The US Agency for Toxic Substances and Disease Registry (ATSDR, 2012a) reviewed studies of cadmium absorption, estimated from 1% to 11%, from the retention of cadmium in the bodies of humans following ingestion of radioactive cadmium. From dietary balance studies, the average normal gastrointestinal absorption of ingested cadmium in humans ranged from 3% to 7% (WHO, 2011a; ATSDR, 2012a). The Joint Food and Agriculture Organization/World Health Organization of the United Nations Expert Committee on Food Additives (Joint FAO/WHO Expert Committee on Food Additives, 2001) considered the overall point estimate of 5% for bioavailability to be appropriate. The bioavailability of cadmium can be affected markedly by nutritional factors. Low iron status, as determined from serum ferritin levels, increases the uptake of cadmium from the gastrointestinal tract in the range from 5% to 10%. (496) Most estimates of cadmium absorption in animals are somewhat lower than the values found from human studies. In rats, cadmium sulphide and cadmium sulphoselenide appear to be absorbed much less than cadmium chloride. The presence of divalent and trivalent cations, such as calcium, chromium, magnesium, and zinc, may also decrease cadmium uptake. On the other hand, diets low in iron or calcium increase cadmium absorption. (497) Ingestion of isotopes of cadmium by workers was considered in Publications 30 and 68 (ICRP, 1980, 1994a). The f1 value adopted for ingestion of inorganic forms of cadmium was 0.05 on the basis of animal studies. In this publication, the fA value of 0.05 is recommended for all situations where specific information is not available.
26.2.3. Systemic distribution, retention, and excretion of cadmium
26.2.3.1. Biokinetic data
(498) The biokinetics of cadmium has been studied frequently in human subjects and laboratory animals due to its importance as an industrial and environmental toxicant. Absorbed cadmium is distributed throughout the body, with highest concentrations in the liver and kidneys (Zhu et al., 2010; ATSDR, 2012a). In a worker exposed to cadmium dust, the highest concentrations were found in the liver, kidneys, pancreas, and vertebrae (Friberg, 1984). In workers dying from cadmium inhalation, the concentration of cadmium in lung tissue was lower than in the liver or kidneys (ATSDR, 2012a). (499) Cadmium is in Group IIB of the periodic table, below the chemically similar element zinc. Cadmium is commonly found in zinc ores. Cadmium and zinc have the same valence (2+) in their stable form, but zinc is more stable in its divalent state and, unlike cadmium, does not undergo redox changes. In contrast to zinc, cadmium is not homeostatically controlled by the body and appears to have no essential physiological role. However, cadmium bears some physiological resemblance to zinc. In the mammalian body, cadmium and zinc bind preferentially to the same proteins, and compete for uptake by many of the same cells and binding to the same intracellular sites. Cadmium can replace zinc in several biological processes. The toxic effects of cadmium appear to result, in part, from interactions with zinc at the stage of zinc biological function (Cotzias et al., 1961; Brzoska and Moniuszko-Jakoniuk, 2001). (500) Systemic cadmium enters the urinary bladder and intestines much more slowly than zinc, and hence has a much longer residence time than zinc in the body. Tb of the order of 25 y has been estimated for cadmium (ICRP, 1980; Thorne et al., 1986). (501) Zhu et al. (2010) measured concentrations of cadmium in 17 tissues obtained from autopsies of up to 68 Chinese men from four areas of China. All subjects were considered healthy until the time of sudden accidental death. Based on median cadmium concentrations in tissues and reference tissue masses, ∼30% of total-body cadmium was contained in the kidneys, 24% in liver, 12% in muscle, 11% in bone, 9% in lungs, and 14% in other tissues and fluids. (502) The distribution of cadmium in laboratory animals resembles that found in humans, with the highest concentrations in the liver and kidneys. Similar concentrations are found in the liver and kidneys at early times, but during prolonged exposure, the concentration in the kidneys exceeds that in the liver except for very high exposure (ATSDR, 2012a). (503) The kidneys are the primary target organs for chronic exposure to cadmium. Long-term exposure to cadmium may result in various levels of kidney damage from minor tubular dysfunction to severe kidney impairment. Absorbed cadmium is transported to the liver, where it stimulates synthesis of metallothionein. Cadmium bound to metallothionein is subsequently transported to the kidneys. A portion of the cadmium filtered by the kidneys and a portion of cadmium stored in kidney tissue is excreted in urine. Over time, urinary cadmium becomes closely related to kidney content (Friberg, 1984). (504) Jarup et al. (1983) estimated Tb of cadmium in blood based on measurements over 10–13 y of blood cadmium in five people with previous occupational exposure to cadmium. The collected data were fit by a bi-exponential function. The estimated half-times ranged from 75 to 128 d for the short-term component, and from 7.4 to 16 y for the long-term component.
26.2.3.2. Biokinetic model for systemic cadmium
(505) The structure of the biokinetic model for systemic cadmium applied in this publication is shown in Fig. 26.1. Transfer coefficients are listed in Table 26.3. (506) This model is a modification of the model for zinc applied in OIR Part 2 (ICRP, 2016). The models for cadmium and zinc differ in the following ways: the total outflow rate from plasma is three times greater for cadmium than for zinc; uptake by RBC is lower for cadmium than for zinc; the net excretion rate is much lower for cadmium than for zinc; and rates of return from peripheral systemic compartments to the central compartment (plasma) are much lower for cadmium than for zinc. Also, some structural simplifications of the model for zinc are made for application to cadmium in view of the more limited biokinetic data for cadmium. The number of compartments of ‘Other tissue’ is reduced from three to two, and fewer excretion pathways are depicted. (507) The transfer coefficients in the cadmium model were designed to reproduce the following information or assumptions: the initial systemic distribution of cadmium as indicated by studies on laboratory animals; a retention half-time of ∼25 y in the total body; the long-term distribution of stable cadmium in the body as indicated by a study of element contents in tissues of adult males (Zhu et al., 2010); and typical steady-state contents of stable cadmium in total body, blood, and urine of adult humans. Comparison of model predictions with the observed steady-state contents of stable cadmium in tissues was based on a reference gastrointestinal absorption fraction of 0.05, and a reference dietary intake of 15 µg cadmium per day (ATSDR, 2012a). Transfer coefficients in the biokinetic model for systemic cadmium. RBC, red blood cells. ST, soft tissue. ST0 and ST1 are compartments of other soft tissues representing two phases of biological removal to blood. Daily excretion of 110mAg following inhalation of 1 Bq Type F. Daily excretion of 110mAg following inhalation of 1 Bq Type M. Daily excretion of 110mAg following inhalation of 1 Bq Type S. Structure of the biokinetic model for systemic cadmium. RBC, red blood cells. ST, soft tissue. ST0 and ST1 are compartments of other soft tissues representing two phases of biological removal to blood.


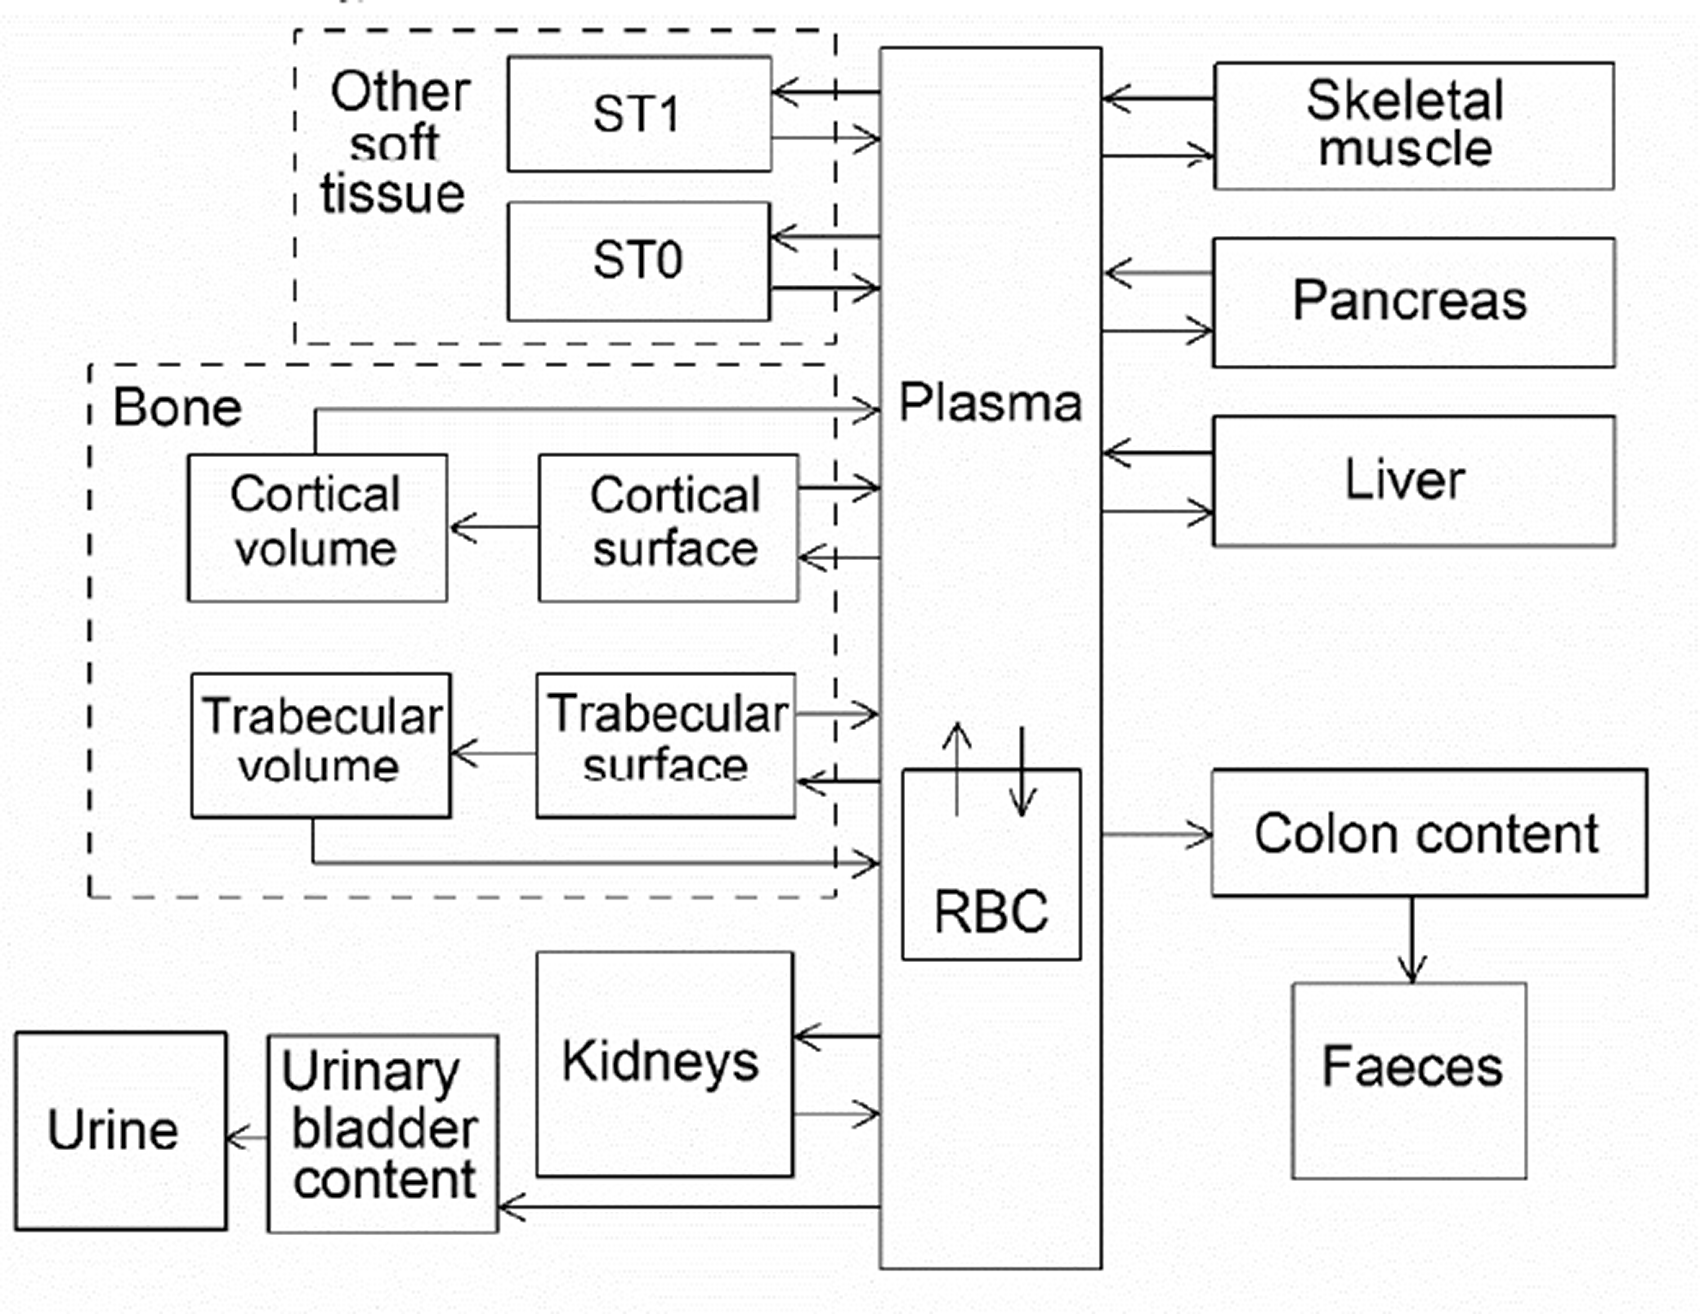
26.2.3.3. Treatment of progeny
(508) Progeny of cadmium addressed in this publication are radioisotopes of cadmium, tin, indium, and silver. The model for cadmium as a parent is applied to cadmium as a progeny of cadmium. The models for tin, indium, and silver as cadmium progeny are expansions of the characteristic models for these elements with added compartments and associated transfer coefficients needed to solve the linked biokinetic models for chains headed by cadmium (see Annex B). The following transfer rates to the central blood compartment in the model for tin, indium, or silver are assigned to these progeny when produced in a compartment of a model for a preceding chain member that is not contained in the model for tin, indium, or silver: 1000 d−1 if produced in a blood compartment; at the rate of bone turnover if produced in a bone volume compartment; and at the following element-specific rates if produced in any other compartment: tin, 0.139 d−1; indium, 2.37 d−1; and silver, 0.4 d−1. Other transfers added to the characteristic models for progeny are as follows: for tin, blood to muscle = 0.297 d−1, blood to pancreas = 0.0012 d−1, blood to red marrow = 0.012 d−1; for indium, blood to muscle = 0.2 d−1, blood to pancreas = 0.001 d−1; for silver, blood to muscle = 5.8 d−1, blood to pancreas = 0.028 d−1.
26.3. Individual monitoring
26.3.1. 109Cd
(509) Measurements of 109Cd in urine may be used to determine intakes of the radionuclide.
26.4. Dosimetric data for cadmium
27. Indium (Z = 49)
27.1. Isotopes
27.2. Routes of intake
27.2.1. Inhalation
(510) For indium, default parameter values were adopted on absorption to blood from the respiratory tract (ICRP, 2015). Absorption parameter values and types, and associated fA values for particulate forms of indium are given in Table 27.2. Monitoring techniques for 109Cd. Measurement system comprised of germanium detectors. Counting time of 20 min. Committed effective dose coefficients (Sv Bq−1) for the inhalation or ingestion of 109Cd compounds. AMAD, activity median aerodynamic diameter. Dose per activity content of 109Cd in total body and in daily excretion of urine (Sv Bq−1); 5 µm activity median aerodynamic diameter aerosols inhaled by a reference worker at light work. Isotopes of indium addressed in this publication. EC, electron-capture decay; B+, beta-plus decay; B−, beta-minus decay; IT, isomeric transition decay. Dose coefficients and bioassay data for this radionuclide are given in the printed copy of this publication. Data for other radionuclides listed in this table are given in the online electronic files on the ICRP website. Absorption parameter values for inhaled and ingested indium. It is assumed that the bound state can be neglected for indium (i.e. fb = 0). The values of sr for Type F, M, and S forms of indium (30, 3, and 3 d−1, respectively) are the general default values. For inhaled material deposited in the respiratory tract and subsequently cleared by particle transport to the alimentary tract, the default fA values for inhaled materials are applied [i.e. the product of fr for the absorption type and the fA value for ingested soluble forms of indium (0.005)]. Default Type M is recommended for use in the absence of specific information on which the exposure material can be assigned to an absorption type (e.g. if the form is unknown, or if the form is known but there is no information available on the absorption of that form from the respiratory tract). For guidance on the use of specific information, see Section 1.1. Activity transferred from systemic compartments into segments of the alimentary tract is assumed to be subject to reabsorption to blood. The default absorption fraction fA for the secreted activity is the highest value for any form of the radionuclide (fA = 0.005).


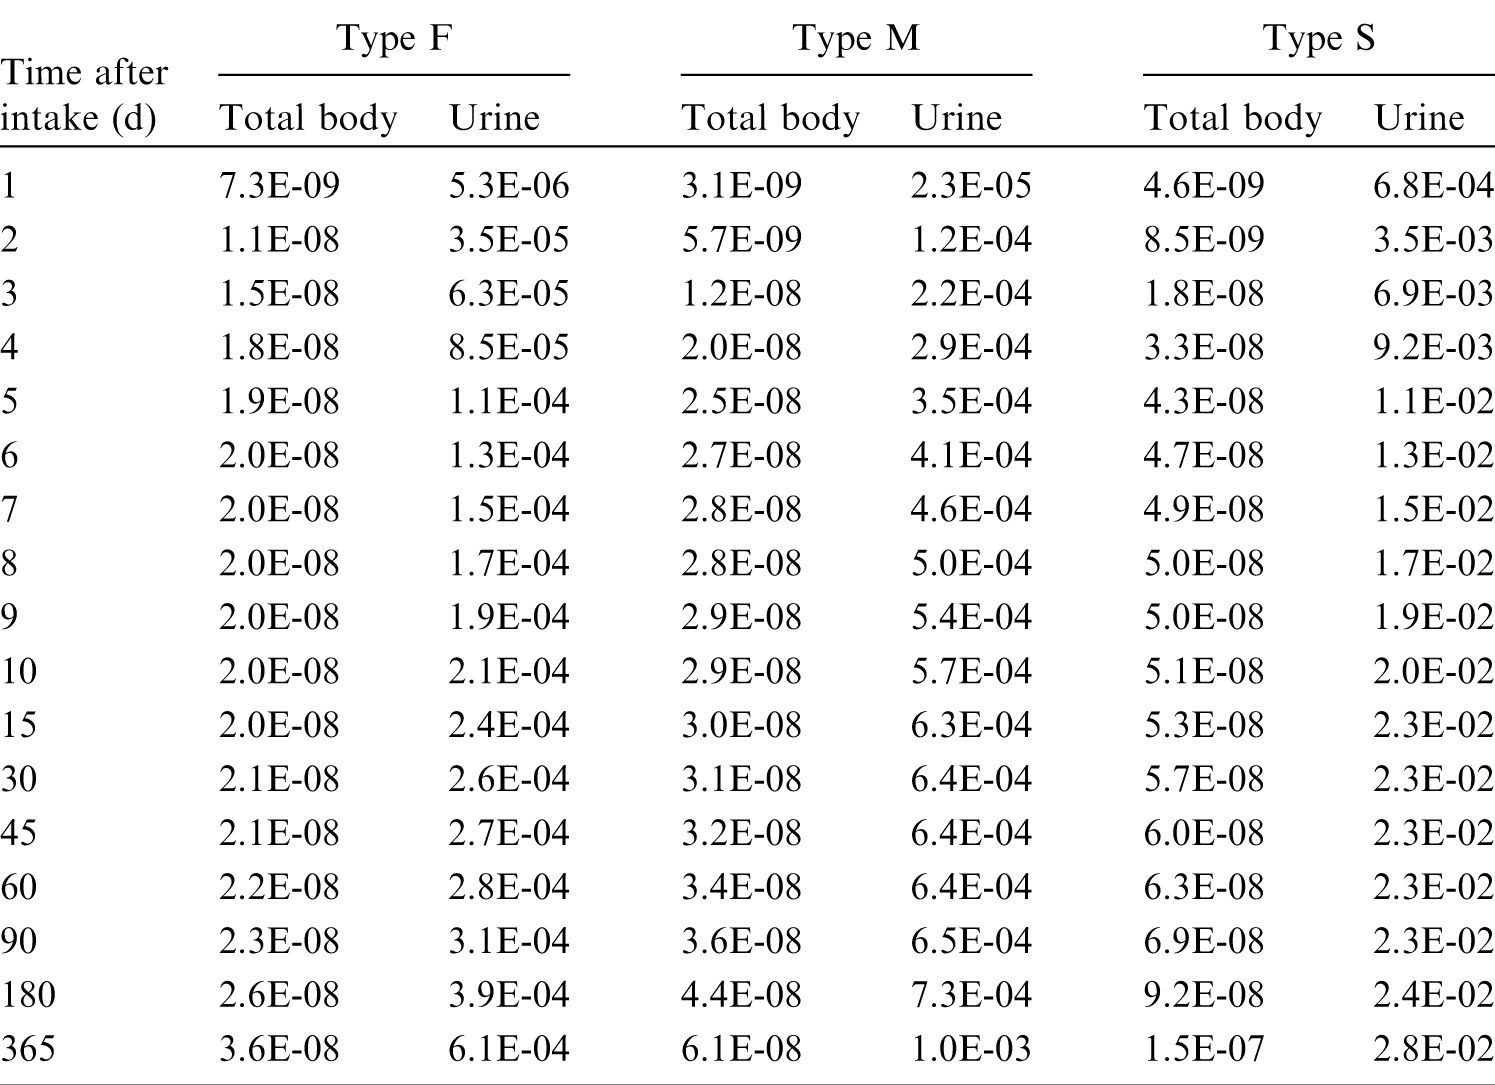

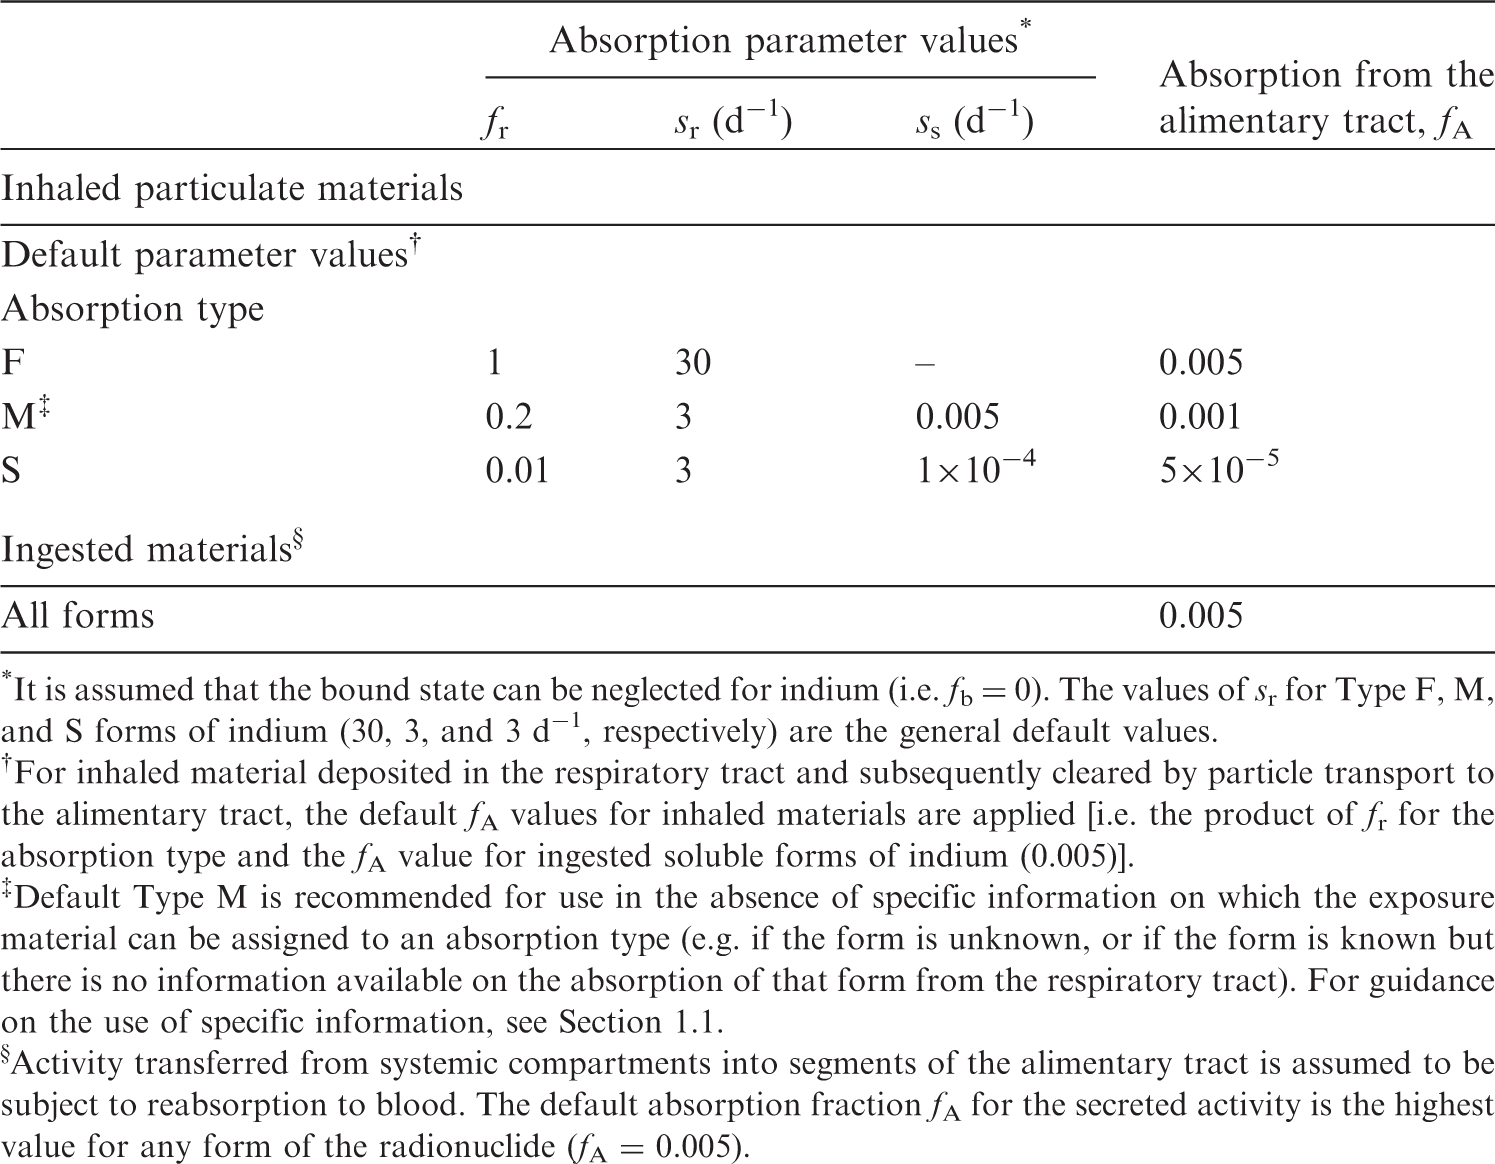
27.2.2. Ingestion
(511) Experiments on rats (Smith et al., 1960) indicated fractional absorption from the gastrointestinal tract of no more than ∼2%, likely ∼0.5%, of indium trichloride diluted with water. Valberg et al. (1981) confirmed in mice that indium chloride is poorly absorbed (<0.5%) after a single oral administration. Toxicity studies (Castronovo and Wagner, 1971) have shown that the toxicity of orally administered indium is much less than the toxicity of indium administered intravenously. In nuclear medicine, Coates et al. (1973) detected no 113mIn activity in blood samples of patients who had ingested 500 µCi of the radionuclide as the chloride in food, indicating very low absorption, if any. Kabe et al. (1996) observed high in-vitro solubility of indium phosphide (InP) powder in synthetic gastric fluid. In adult male rats, 0.7% of a single InP oral dose was absorbed and retained in tissues or excreted in urine after 24 h (Zheng et al., 1994). Van Hulle et al. (2005) studied the biokinetics of indium arsenide (InAs) after subcutaneous and oral administration: in vitro, only 1.3% of an InAs suspension dissolved after 48 h in simulated gastric fluid, and no dissolution was observed in simulated intestinal fluid. In vivo, gastrointestinal absorption in rats was <1%. Asakura et al. (2008) observed no toxicity of indium metal administered orally to rats with a single dosage of 2 g kg−1 or a repeated oral dose of 1 g kg−1 daily for 28 d. Andersen et al. (2017) studied the in-vitro dissolution of indium-tin oxide (ITO) powder in a simulated gastric environment, and observed the release of <0.1% indium from the ITO powder over 4 h. After 60 d of mouse gavage with metal salts of bismuth, indium, and ruthenium, Laval et al. (2018) observed similar ratios of In3+ and Bi3+ concentration in serum to the orally given amount. (512) f1 was taken to be 0.02 for all compounds of indium in Publications 30 and 68 (ICRP, 1980, 1994a). In view of the current database, a lower value of fA = 0.005 is adopted in this publication for all forms of indium, acknowledging it could be even lower for insoluble compounds such as ITO.
27.2.3. Systemic distribution, retention, and excretion of indium
27.2.3.1. Biokinetic data
(513) Most biokinetic studies of indium in human subjects and laboratory animals have involved the administration of InCl, InAs, or In(III), all of which form strong complexes with the iron-transport protein transferrin. This results in some similarities in sites of deposition of indium and iron. Due to chemical differences between indium and iron, however, transferrin-bound indium follows only a portion of the iron distribution pathway and, overall, distributes differently from iron. The biokinetics of indium oxide, another common form of indium, are not well established but appear to differ from those of InCl, InAs, and In(III). (514) In a study of 15 patients used as a relatively healthy control group, transferrin-bound 111In cleared from plasma with a half-time of ∼10.5 h (Simonsen et al., 2009). This is consistent with data of Goodwin et al. (1971) involving eight patients, which indicates a half-time of ∼10 h. Uptake of indium by RBC has been observed in studies on dogs (McIntyre et al., 1974) and rats (Jönsson, 1991). (515) Largely qualitative results of human studies of the systemic behaviour of indium indicate substantial uptake by the liver and bone marrow (McNeil et al., 1974; Sayle et al., 1982; Datz and Taylor, 1985). McNeil et al. (1974) found that neither the retention nor the distribution of indium in the liver changed between 1 and 2 d post injection. In studies on rats, mice, and hamsters, 11–14% of the injected indium accumulated in the liver (Castronovo Jr and Wagner Jr, 1973; McIntyre et al., 1974; Jönsson, 1991; Yamauchi et al., 1992) and was gradually removed in faeces. Approximately 10–12% of injected indium was retained in bone marrow (Smith et al., 1960; Beamish and Brown, 1974; McIntyre et al., 1974; Jeffcoat et al., 1978; Jönsson, 1991). Some indium is removed from the body in urine, but faecal excretion appears to be the dominant excretion pathway. (516) There are some indications from human studies of elevated deposition of indium in bone and spleen. However, it is generally difficult to differentiate between uptake by bone and bone marrow in the external images, and uptake data for the spleen are sparse and not definitive. (517) Indium is removed slowly from the human body. Simonsen et al. (2009) estimated that only 1.8 ± 1.3% of indium entering blood was excreted over the first 4 d. (518) The reader is referred to Andersson et al. (2017) for a more detailed review of information on the systemic behaviour of indium in human subjects and laboratory animals.
27.2.3.2. Biokinetic model for systemic indium
(519) A biokinetic model for systemic indium developed by Andersson et al. (2017) is used in this publication, together with the default transfer rates of ICRP’s Human Alimentary Tract Model and the default emptying rate of the urinary bladder content (12 d−1). The reader is referred to Andersson et al. (2017) for a discussion of the bases for individual parameter values. (520) The model structure is shown in Fig. 27.1. Transfer coefficients are listed in Table 27.3. Transfer coefficients in the biokinetic model for systemic indium. RBC, red blood cells. ST, soft tissue. ST0 and ST1 are compartments of other soft tissues representing two phases of biological removal to blood. Daily excretion of 109Cd following inhalation of 1 Bq Type F. Daily excretion of 109Cd following inhalation of 1 Bq Type M. Daily excretion of 109Cd following inhalation of 1 Bq Type S. The structure of the biokinetic model for systemic indium (from Andersson et al., 2017). TF, transferrin; RBC, red blood cells; SI, small intestine. ST, soft tissue. ST0 and ST1 are compartments of other soft tissues representing two phases of biological removal to blood.
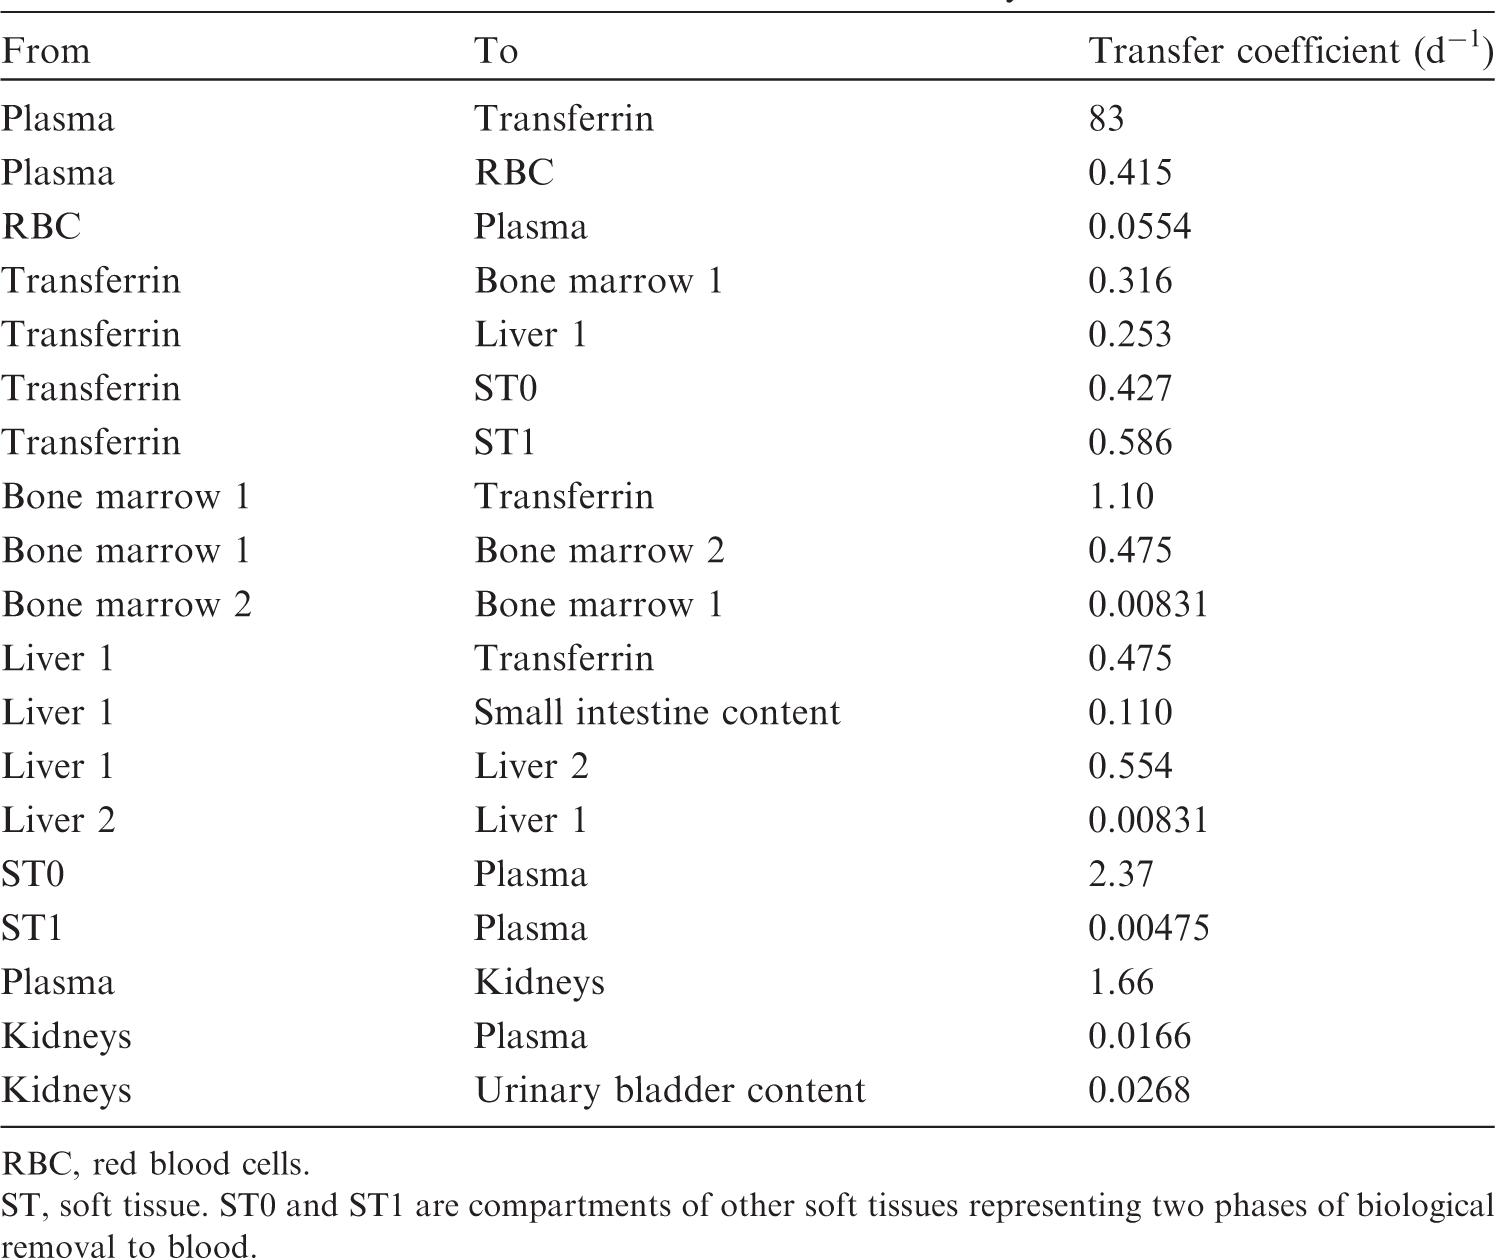


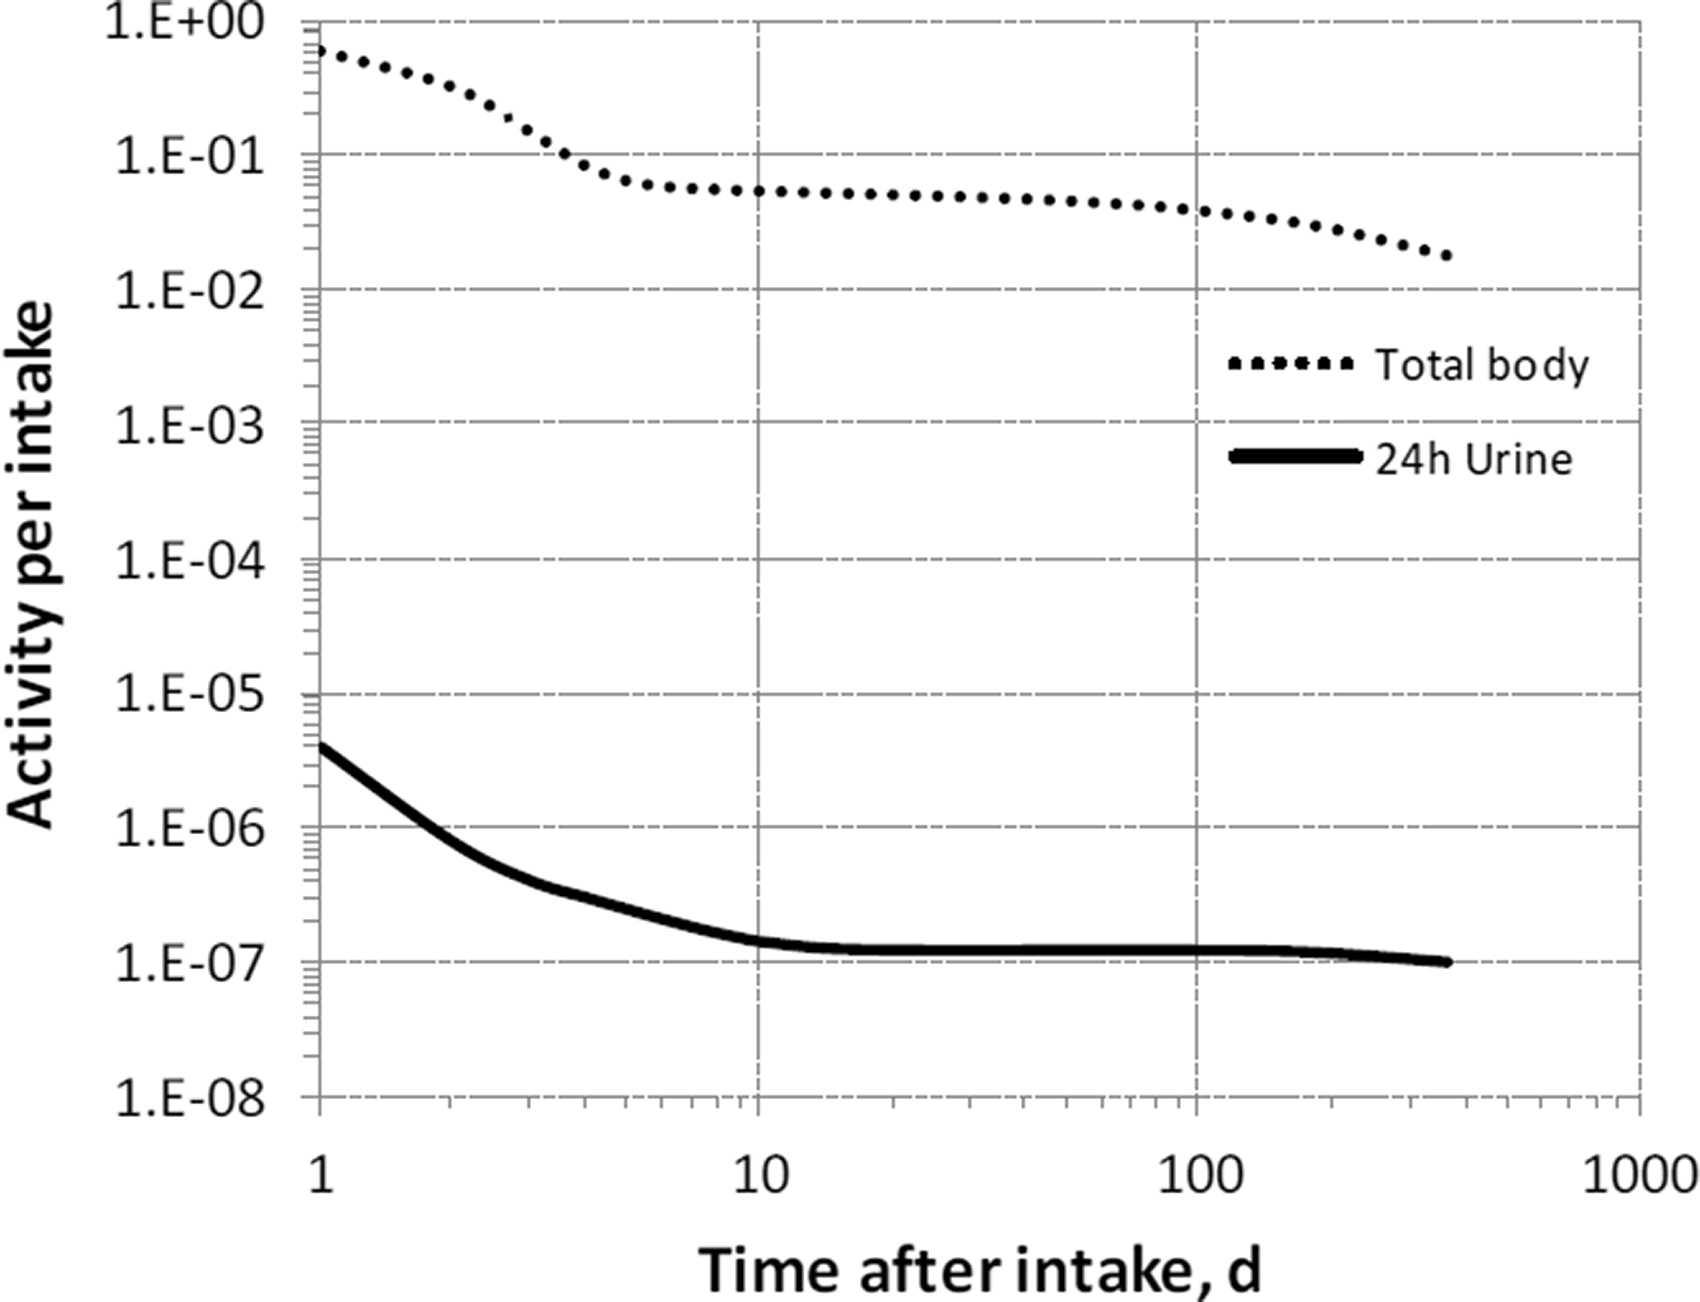
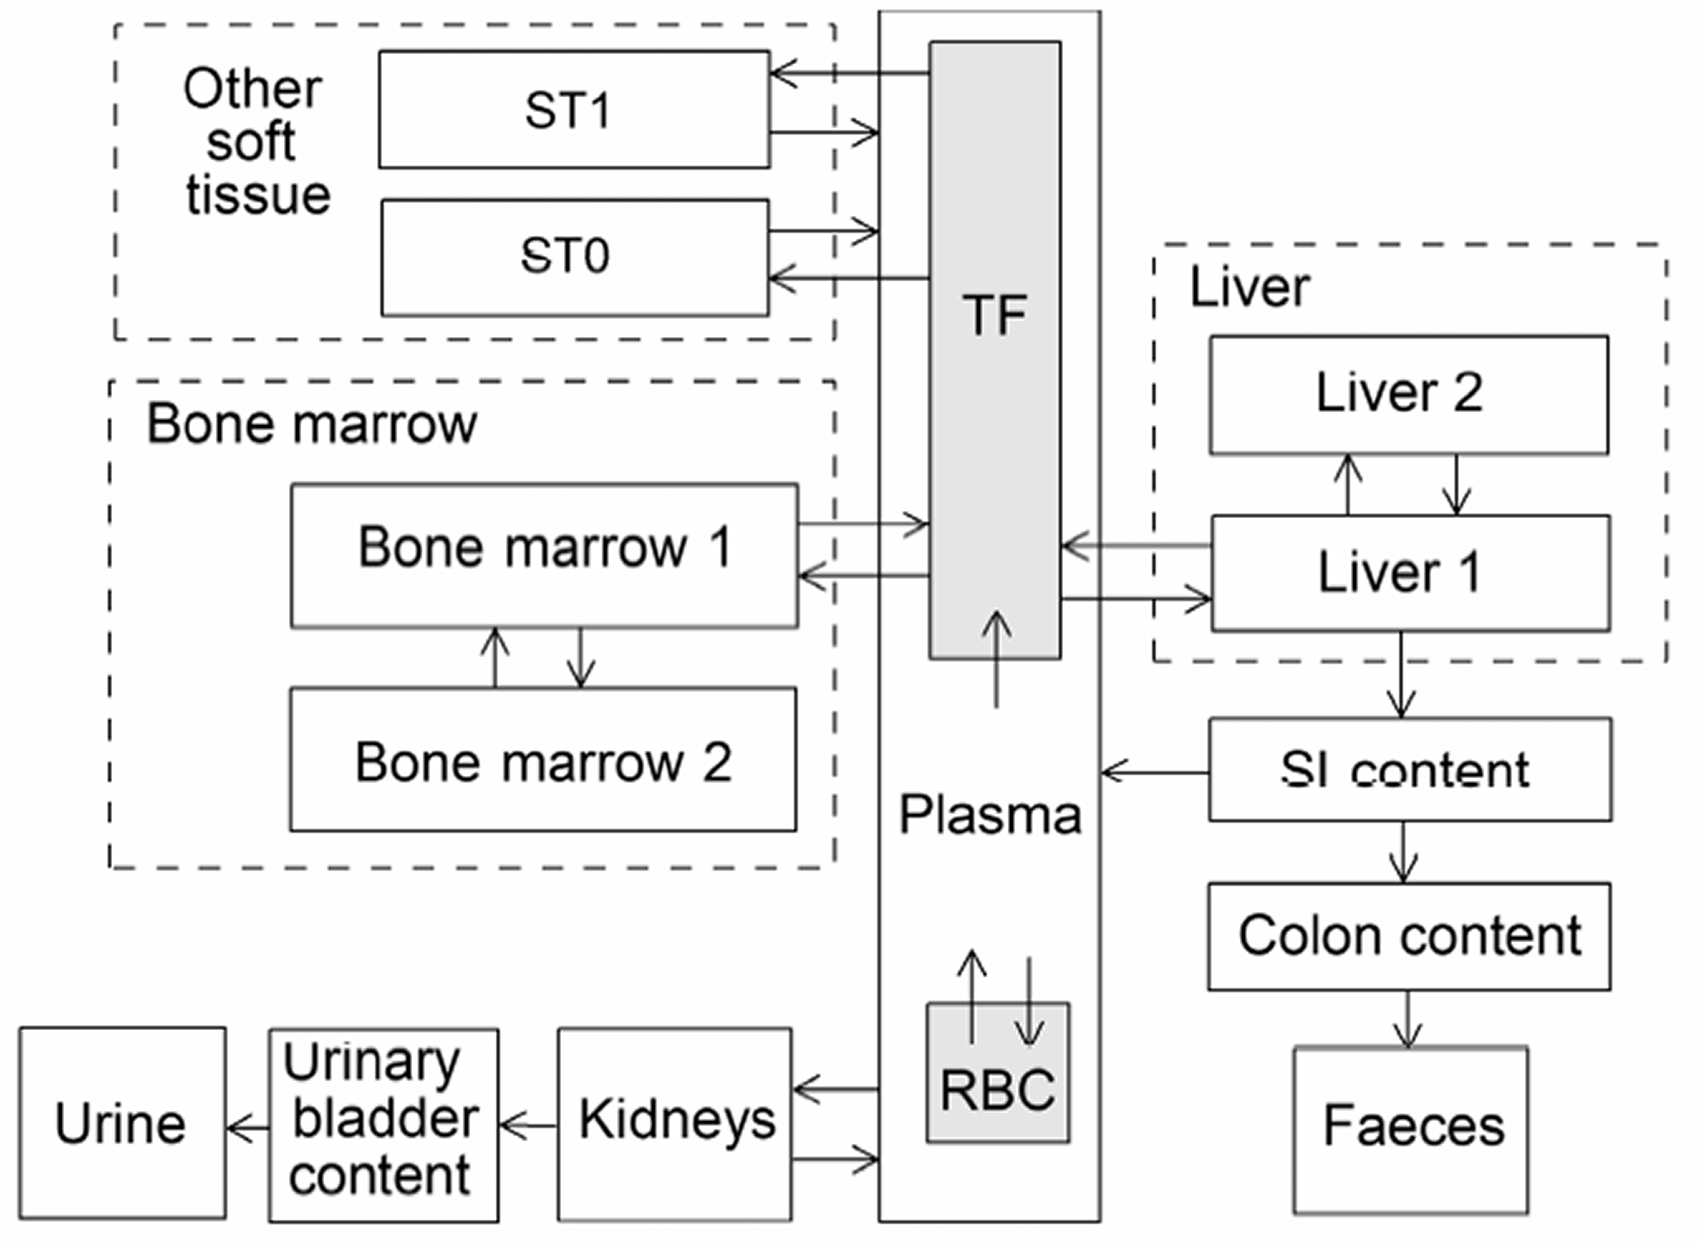
27.2.3.3. Treatment of progeny
(521) Progeny of indium addressed in this publication are radioisotopes of indium, tin, and cadmium. The model for indium as a parent is applied to indium produced by decay of another indium isotope. The models for tin and cadmium as progeny of indium are expansions of the characteristic models for these elements with added compartments and associated transfer coefficients needed to solve the linked biokinetic models for chains headed by indium (see Annex B). If produced in a compartment not explicitly named in the progeny’s model (an ambiguous compartment), the progeny is assumed to transfer at a specified rate to the central blood compartment of its characteristic biokinetic model, and to follow that model thereafter. The following transfer rates to the central blood compartment are assigned to tin or cadmium produced in an ambiguous compartment: 1000 d−1 if produced in a blood compartment; and at the following element-specific rates if produced in any other ambiguous compartment: tin, 1.39 d−1; and cadmium, 0.5 d−1. Other transfers added to the characteristic model for cadmium are blood to red marrow = 3.7 d−1, and red marrow to blood = 0.017 d−1.
27.3. Individual monitoring
27.3.1. 111In
(522) Measurements of 111In in urine may be used to determine intakes of the radionuclide.
27.4. Dosimetric data for indium
28. Tin (Z = 50)
28.1. Isotopes
28.2. Routes of intake
28.2.1. Inhalation
(523) For tin, default parameter values were adopted on absorption to blood from the respiratory tract (ICRP, 2015). Absorption parameter values and types, and associated fA values for particulate forms of tin are given in Table 28.2. Monitoring techniques for 111In. Measurement system comprised of germanium detectors. Counting time of 20 min. Committed effective dose coefficients (Sv Bq−1) for the inhalation or ingestion of 111In compounds. AMAD, activity median aerodynamic diameter. Dose per activity content of 111In in total body and in daily excretion of urine (Sv Bq−1); 5 µm activity median aerodynamic diameter aerosols inhaled by a reference worker at light work. N/A, not applicable. Isotopes of tin addressed in this publication. EC, electron-capture decay; B+, beta-plus decay; B−, beta-minus decay; IT, isomeric transition decay. Dose coefficients and bioassay data for this radionuclide are given in the printed copy of this publication. Data for other radionuclides listed in this table are given in the online electronic files on the ICRP website. Absorption parameter values for inhaled and ingested tin. It is assumed that the bound state can be neglected for tin (i.e. fb = 0). The values of sr for Type F, M, and S forms of tin (30, 3, and 3 d−1, respectively) are the general default values. For inhaled material deposited in the respiratory tract and subsequently cleared by particle transport to the alimentary tract, the default fA values for inhaled materials are applied [i.e. the product of fr for the absorption type and the fA value for ingested soluble forms of tin (0.02)]. Default Type M is recommended for use in the absence of specific information on which the exposure material can be assigned to an absorption type (e.g. if the form is unknown, or if the form is known but there is no information available on the absorption of that form from the respiratory tract). For guidance on the use of specific information, see Section 1.1. Activity transferred from systemic compartments into segments of the alimentary tract is assumed to be subject to reabsorption to blood. The default absorption fraction fA for the secreted activity is the highest value for any form of the radionuclide (fA = 0.02).

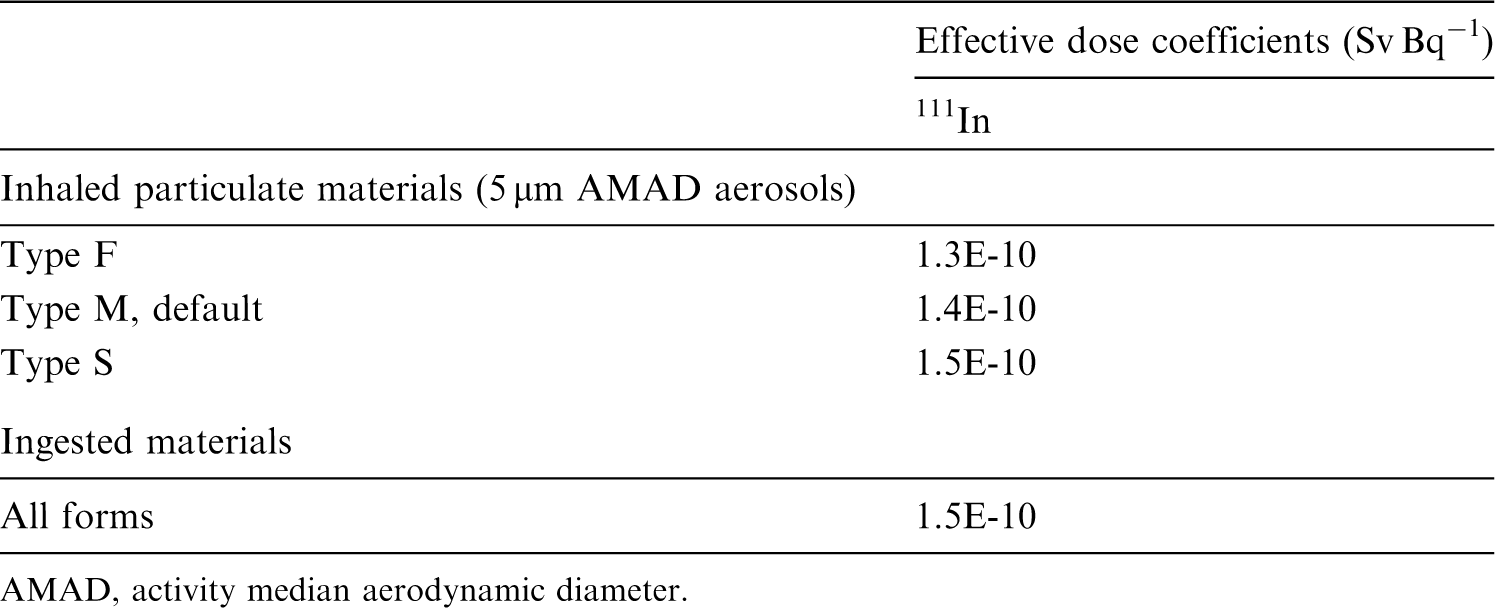


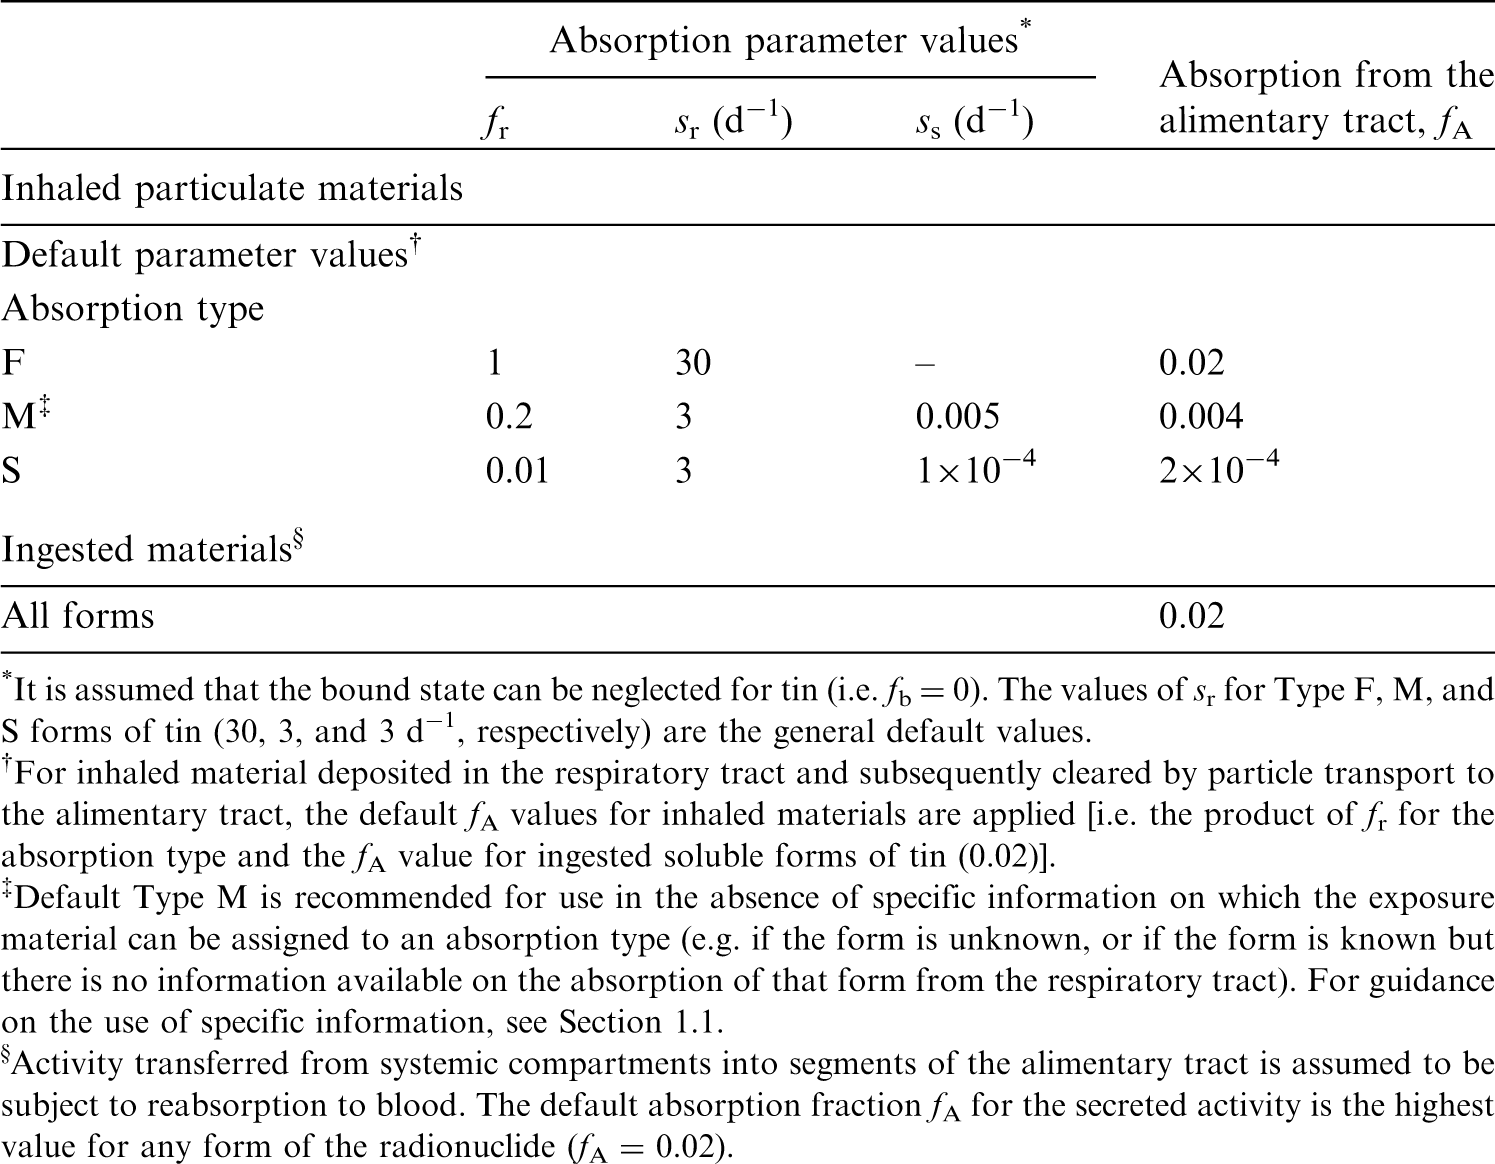
28.2.2. Ingestion
(524) The fractional absorption of dietary or inorganic tin from the gastrointestinal tract is generally small (Barnes and Stoner, 1959; ICRP, 1975; Furchner and Drake, 1976; Underwood, 1977; ATSDR, 2005b). In the case of stannous chloride, the fractional gastrointestinal absorption in mice, rats, rabbits, monkeys, and dogs was always <0.1 and was typically ∼0.02 (Kutzner and Brod, 1971; Furchner and Drake, 1976; Fritsch et al., 1977). The absorption of the citrate, fluoride, or pyrophosphate was similar, with Sn(IV) inorganic compounds being less absorbed than those of Sn(II) (Benoy et al., 1971; Hiles, 1974). (525) In Publications 30 and 68 (ICRP, 1981, 1994a), f1 was taken as 0.02 for all compounds of tin. In this publication, the value of fA = 0.02 is also adopted for all chemical forms of tin ingested in the workplace.
28.2.3. Systemic distribution, retention, and excretion of tin
28.2.3.1. Biokinetic data
(526) Environmental tin exists in one of two series of compounds: the stannous compounds formed by bivalent tin, and the stannic compounds formed by tetravalent tin. Bivalent tin can exist in ionic form. Stannic compounds are covalent, and the ionic form of tetravalent tin does not exist. Common inorganic compounds of tin include stannous chloride (SnCl2), stannous oxide (SnO), stannous fluoride (SnF2), stannic chloride (SnCl4), and stannic oxide (SnO2). Stannic tin can form a volatile hydride (SnH4) and toxicologically important organometallic compounds (Cima, 2011). (527) Several investigators have reported tin concentrations in tissues collected at autopsy from non-occupationally exposed subjects. Hamilton et al. (1973) found the highest concentrations in the lymph nodes (1.5 mg kg−1 wet mass) and bone (1.1), followed by the lungs (0.8), liver (0.4), and kidneys (0.2); relatively low concentrations were found in muscle (0.07) and brain (0.06). Garcia et al. (2001) determined the following mean tissue concentrations in 78 subjects: 0.47 (mg kg−1 wet mass) in bone, 0.27 in brain, 0.25 in kidneys, 0.24 in lungs, and 0.16 in liver. Tissues from 11–13 adult males had mean concentrations of 2.1 mg kg−1 dry mass in the testes, 1.1 in liver, 0.83 in kidney cortex, 0.75 in heart, 0.45 in lungs, and 0.61 in ribs (Chiba et al., 1991). (528) Zhu et al. (2010) reported median values and ranges of tin concentrations in 17 tissues collected at autopsy from up to 68 adult males. The measured concentrations were generally lower than earlier reported values for tin. The highest median concentrations were found in the lungs (0.031 mg kg−1 wet mass), liver (0.022), ribs (0.013), and kidneys (0.012). Concentrations in the stomach, small intestine, large intestine, heart, adrenals, testes, spleen, skin, fat, skeletal muscle, thyroid, pancreas, and thymus were in the range of 0.005–0.009 mg kg−1. The investigators estimated a central total-body content of 0.51 mg. Based on the observed median concentrations of tin in tissues and reference masses of tissues, approximately half of total-body tin was contained in skeletal muscle plus fat, and 22% was contained in bone, assuming ribs are representative of bone. (529) Hiles (1974) studied the biokinetics of inorganic tin in rats following oral or intravenous administration of 113Sn(II) or 113Sn(IV). Approximately 2.85% and 0.64% of 113Sn administered orally as Sn(II) and Sn(IV), respectively, was absorbed to blood. At 48 d after oral intake, the skeleton, liver, and kidneys contained ∼1.0%, 0.08%, and 0.09%, respectively, of 113Sn administered as Sn(II), and 0.24%, 0.02%, and 0.02%, respectively, of 113Sn administered as Sn(IV), indicating similar systemic distributions of the absorbed activity for the two forms. At 48 h after intravenous administration, cumulative urinary excretion accounted for ∼35% of activity administered as Sn(II) and 40% administered as Sn(IV). Cumulative faecal excretion at 48 h represented ∼12% of activity administered as Sn(II) and 3% of activity administered as Sn(IV). This result, together with observations on bile duct cannulated rats, indicated that the biliary pathway was a more important mode of excretion for Sn(II) than for Sn(IV). At 48 h after intravenous injection, bone, liver, and kidneys contained ∼35%, 2.0%, and 5.9%, respectively, of 113Sn administered as Sn(II), and 46%, 0.2%, and 5.3%, respectively, of 113Sn administered as Sn(IV). The difference in accumulation of activity by the liver following administration of Sn(II) and Sn(IV) suggests that these forms were not reduced to a common form over the observation period. In an experiment involving oral administration of 113Sn(II) and 113Sn(IV) for 6 d week−1 for 4 weeks, only bone contained a higher activity concentration at 28 d than at 1 d. Over a 40-d period following the end of the 28-d feeding period, activity was lost from bone with an estimated Tb of 34–40 d. (530) Furchner and Drake (1976) compared the behaviour of 113Sn in mice, Sprague-Dawley rats, African white-tailed rats (Mystromys), monkeys, and dogs following oral, intraperitoneal, or intravenous administration as 113Sn(II) chloride. The intraperitoneal injection study involved mice and rats alone. Mean total excretion over the first 3 d after intravenous injection was ∼25% for mice, 38% for Mystromys, 45% for Sprague-Dawley rats, 39% for monkeys, and 69% for dogs. Excretion over the first 3 d was primarily in urine (e.g. 84% of total excretion in monkeys and 91% in dogs). Total-body retention following intravenous injection was measured for periods of 291 d for rats, 319 d for Mystromys, 325 d for dogs, 338 d for mice, and 469 d for monkeys. Retention in each species could be described as a sum of four exponential terms. Retention was broadly similar across species and showed no relation to body size. As an average over the five studied species, Tb of the four phases of retention for intravenous injection were ∼0.5 d (50%), 4.3 d (13%), 28 d (9%), and 510 d (28%). The mean long-term half-time was ∼760 d for mice, 580 d for Mystromys, 420 d for Sprague-Dawley rats, 370 d for monkeys, and 430 d for dogs. The time-dependent distribution of systemic activity was measured in Sprague-Dawley rats on 10 occasions from 1 to 141 d post intraperitoneal injection. Bone contained 69% of total-body activity at 1 d, 71–76% at 6–113 d, and 65% at 141 d; muscle contained 12–20% at 1–141 d; the liver contained 2.4–5.9% at 1–141 d; and the kidneys contained 3.5% at 1 d, gradually decreasing to ∼1% at 85–141 d.
28.2.3.2. Biokinetic model for systemic tin
(531) The structure of the biokinetic model for systemic tin applied in this publication is shown in Fig. 28.1. Transfer coefficients are listed in Table 28.3. (532) Parameter values were set for reasonable consistency with total-body retention of tin observed in monkeys over the early months after acute input to blood, and with the early systemic distribution of tin observed in rats (Furchner and Drake, 1976). Parameter values determining the long-term distribution of tin were set for reasonable consistency with the central systemic distribution of tin indicated by results of an autopsy study by Zhu et al. (2010). Transfer coefficients in the biokinetic model for systemic tin. Daily excretion of 111In following inhalation of 1 Bq Type F. Daily excretion of 111In following inhalation of 1 Bq Type M. Daily excretion of 111In following inhalation of 1 Bq Type S. Structure of the biokinetic model for systemic tin.


28.2.3.3. Treatment of progeny
(533) Progeny of tin addressed in this publication are isotopes of tin, indium, cadmium, tellurium, and antimony. The model for tin as a parent is applied to tin produced by decay of another isotope of tin. The models for indium, cadmium, tellurium, and antimony as progeny of tin are expansions of their characteristic models with added compartments and associated transfer coefficients needed to solve the linked biokinetic models of chains headed by tin. Muscle and pancreas were added to the explicitly identified tissues in the characteristic model for indium. The following rates of transfer of indium between blood compartments in the characteristic model for indium and the added tissues were assigned: transferrin to pancreas, 0.001 d−1; transferrin to muscle, 0.2 d−1; pancreas to plasma, 2.37 d−1; and muscle to plasma, 2.37 d−1. Indium, cadmium, tellurium, or antimony produced in a compartment of the model for a preceding chain that is not a compartment in the model for that progeny (an ambiguous compartment) is assumed to transfer to the central blood compartment of the progeny’s model, and to follow that model thereafter. The following transfer coefficients are assigned to progeny produced in ambiguous compartments: 1000 d−1 if produced in a blood compartment; at the rate of bone turnover for the indicated bone type if produced in a bone volume compartment; and at the following element-specific rates if produced in any other compartment: indium, 2.37 d−1; cadmium, 0.5 d−1; tellurium, 0.0693 d−1; and antimony, 1.39 d−1.
28.3. Individual monitoring
28.3.1. 113Sn
(534) Measurements of 113Sn in urine may be used to determine intakes of the radionuclide.
28.4. Dosimetric data for tin
29. Hafnium (Z = 72)
29.1. Isotopes
29.2. Routes of intake
29.2.1. Inhalation
(535) For hafnium, default parameter values were adopted on absorption to blood from the respiratory tract (ICRP, 2015). Absorption parameter values and types, and associated fA values for particulate forms of hafnium are given in Table 29.2. Monitoring techniques for 113Sn. Measurement system comprised of germanium detectors. Counting time of 20 min. Committed effective dose coefficients (Sv Bq−1) for the inhalation or ingestion of 113Sn compounds. AMAD, activity median aerodynamic diameter. Dose per activity content of 113Sn in total body and in daily excretion of urine (Sv Bq−1); 5 µm activity median aerodynamic diameter aerosols inhaled by a reference worker at light work. Isotopes of hafnium addressed in this publication. EC, electron-capture decay; B+, beta-plus decay; B−, beta-minus decay; IT, isomeric transition decay; A, alpha decay. Dose coefficients and bioassay data for this radionuclide are given in the printed copy of this publication. Data for other radionuclides listed in this table are given in the online electronic files on the ICRP website. Absorption parameter values for inhaled and ingested hafnium. It is assumed that the bound state can be neglected for hafnium (i.e. fb = 0). The values of sr for Type F, M, and S forms of hafnium (30, 3, and 3 d−1, respectively) are the general default values. For inhaled material deposited in the respiratory tract and subsequently cleared by particle transport to the alimentary tract, the default fA values for inhaled materials are applied [i.e. the product of fr for the absorption type and the fA value for ingested soluble forms of hafnium (0.002)]. Default Type M is recommended for use in the absence of specific information on which the exposure material can be assigned to an absorption type (e.g. if the form is unknown, or if the form is known but there is no information available on the absorption of that form from the respiratory tract). For guidance on the use of specific information, see Section 1.1. Activity transferred from systemic compartments into segments of the alimentary tract is assumed to be subject to reabsorption to blood. The default absorption fraction fA for the secreted activity is the highest value for any form of the radionuclide (fA = 0.002).


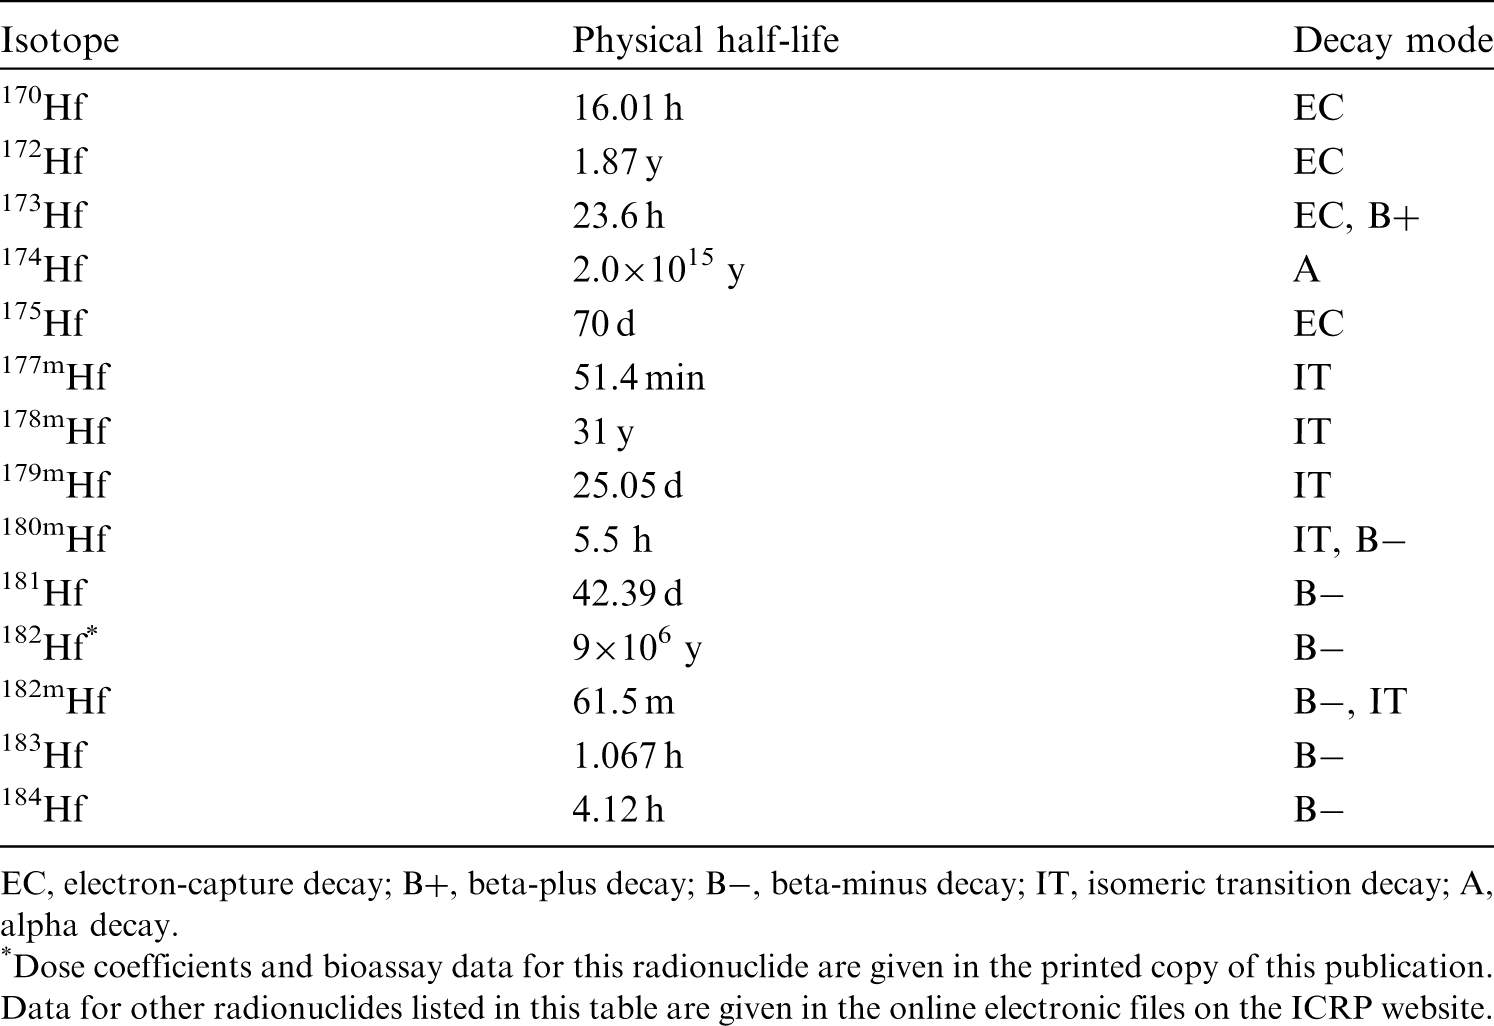

29.2.2. Ingestion
(536) There do not appear to be any relevant data available on the absorption of compounds of hafnium from the gastrointestinal tract. In Publications 30 and 68 (ICRP, 1981, 1994a), by analogy with the chemically similar and more extensively studied element zirconium, f1 was taken to be 0.002 for all compounds of hafnium. The same value of fA (0.002) is used in this publication.
29.2.3. Systemic distribution, retention, and excretion of hafnium
29.2.3.1. Summary of biokinetic data
(537) The chemical and physical properties of the Group IVB element hafnium are virtually identical to those of the lighter Group IVB element zirconium, making these elements difficult to separate in the laboratory. Hafnium and zirconium are found together in nature and are sometimes referred to as geochemical twins because the zirconium/hafnium mass ratio typically shows little variation in rocks and soil. The limited fractionation of hafnium and zirconium in geological material is attributed to their identical valence state in geological circumstances, together with their nearly identical ionic radii (Bau and Dulski, 1995; Breiter and Škoda, 2017). (538) Comparisons of the behaviours of hafnium and zirconium in laboratory animals also indicate closely similar biological behaviours of these elements. For example, virtually identical total-body retention curves over 140 d were derived in biokinetic studies of parenterally administered 95Zr (Richmond et al., 1960) and 181Hf (Taylor et al., 1985) in rats. Comparisons of the systemic behaviours of hafnium and zirconium isotopes in rats indicate similar soft tissue distributions over the first 2 d after intravenous injection (Ando and Ando, 1986). Electron microprobe studies of intracellular localization of zirconium and hafnium in nodular lymphatic cells after administration of low doses of soluble salts indicated that both elements were localised in the lysosomes of macrophages, where they were both associated with phosphorus (Berry and Galle, 1992). Identical effects of cartilaginous dysplasia could be induced in mice by hafnium or zirconium, but not by several other tested metals (Shelley, 1973). (539) Taylor et al. (1983, 1985) investigated the systemic behaviour of 181Hf or 175+181Hf in rats, Chinese hamsters, and marmosets up to 6 months post administration by various routes. Total-body retention curves over 150 d were similar for the three animal species following parenteral administration of hafnium as the citrate. Relatively detailed studies of the time-dependent systemic distribution of activity were conducted for hamsters and rats. The skeleton was the main systemic repository for hafnium, containing ∼29% of intravenously administered hafnium in rats at 14 d post injection and ∼43% at 21 d post subcutaneous administration to hamsters. In rats, the liver content peaked at 6.5% at 7 d and declined to 1.2% at 168 d. In hamsters, the liver content peaked at 5% at 1 d and declined to 2.1% at 168 d. Limited tissue measurements on marmosets suggested a higher liver content than observed in rats and hamsters. (540) Ando and Ando (1986) investigated the biokinetics of 181Hf and 95Zr in tumour-bearing rats following intravenous injection of 181Hf chloride, 95Zr oxalate, and 95Zr nitrate. The activity concentrations were determined at 3, 24, and 48 h after injection for blood, muscle, liver, spleen, kidneys, pancreas, heart, lungs, adrenals, thymus, and tumour. Bone and brain were also addressed in the 181Hf study but not in the 95Zr study. The kinetics of hafnium closely followed that of zirconium in most tissues. The liver and spleen accumulated a larger portion of hafnium than zirconium, which was attributed by the investigations to formation of some colloidal hafnium in the injected solution, and its removal from blood by phagocytic cells of the liver and spleen. Bone was the dominant repository of 181Hf at 24 and 48 h. (541) At 4 d after intravenous administration of 181Hf as the citrate to rats, the median liver:femur and kidney:femur concentration ratios were ∼0.5 (MacDonald and Bahner, 1953). At 14 d after intravenous administration of 175+181Hf as the citrate, the total body, liver, and skeleton contained ∼71%, 4.1%, and 29%, respectively, of the administered amount (Taylor et al., 1983). At 4 d after intravenous administration of 181Hf mandelate to rats, the median liver:femur and kidney:femur concentration ratios were ∼6 and 1.4, respectively (MacDonald and Bahner, 1953). At 16 d after intravenous administration of 181Hf mandelate to rats, the total body, liver, and bone contained ∼93%, 45%, and 13%, respectively, of the administered activity corrected for radioactive decay (Kittle et al., 1951).
29.2.3.2. Biokinetic model for systemic hafnium
(542) In view of the close physical and chemical similarities of zirconium and hafnium, their apparently similar biological behaviour as indicated by available comparative studies, and difficulties in developing a biokinetic model for systemic hafnium based on hafnium-specific information, the systemic model for zirconium applied in Publication 134 (ICRP, 2016) is assigned to hafnium. (543) The structure of the biokinetic model for systemic hafnium is shown in Fig. 29.1. The transfer coefficients are listed in Table 29.3. Parameter values in the biokinetic model for systemic hafnium. SI, small intestine. ST, soft tissue. ST0 and ST1 are compartments of other soft tissues representing two phases of biological removal to blood. Daily excretion of 113Sn following inhalation of 1 Bq Type F. Daily excretion of 113Sn following inhalation of 1 Bq Type M. Daily excretion of 113Sn following inhalation of 1 Bq Type S. Structure of the biokinetic model for systemic hafnium. SI, small intestine. ST, soft tissue. ST0 and ST1 are compartments of other soft tissues representing two phases of biological removal to blood.

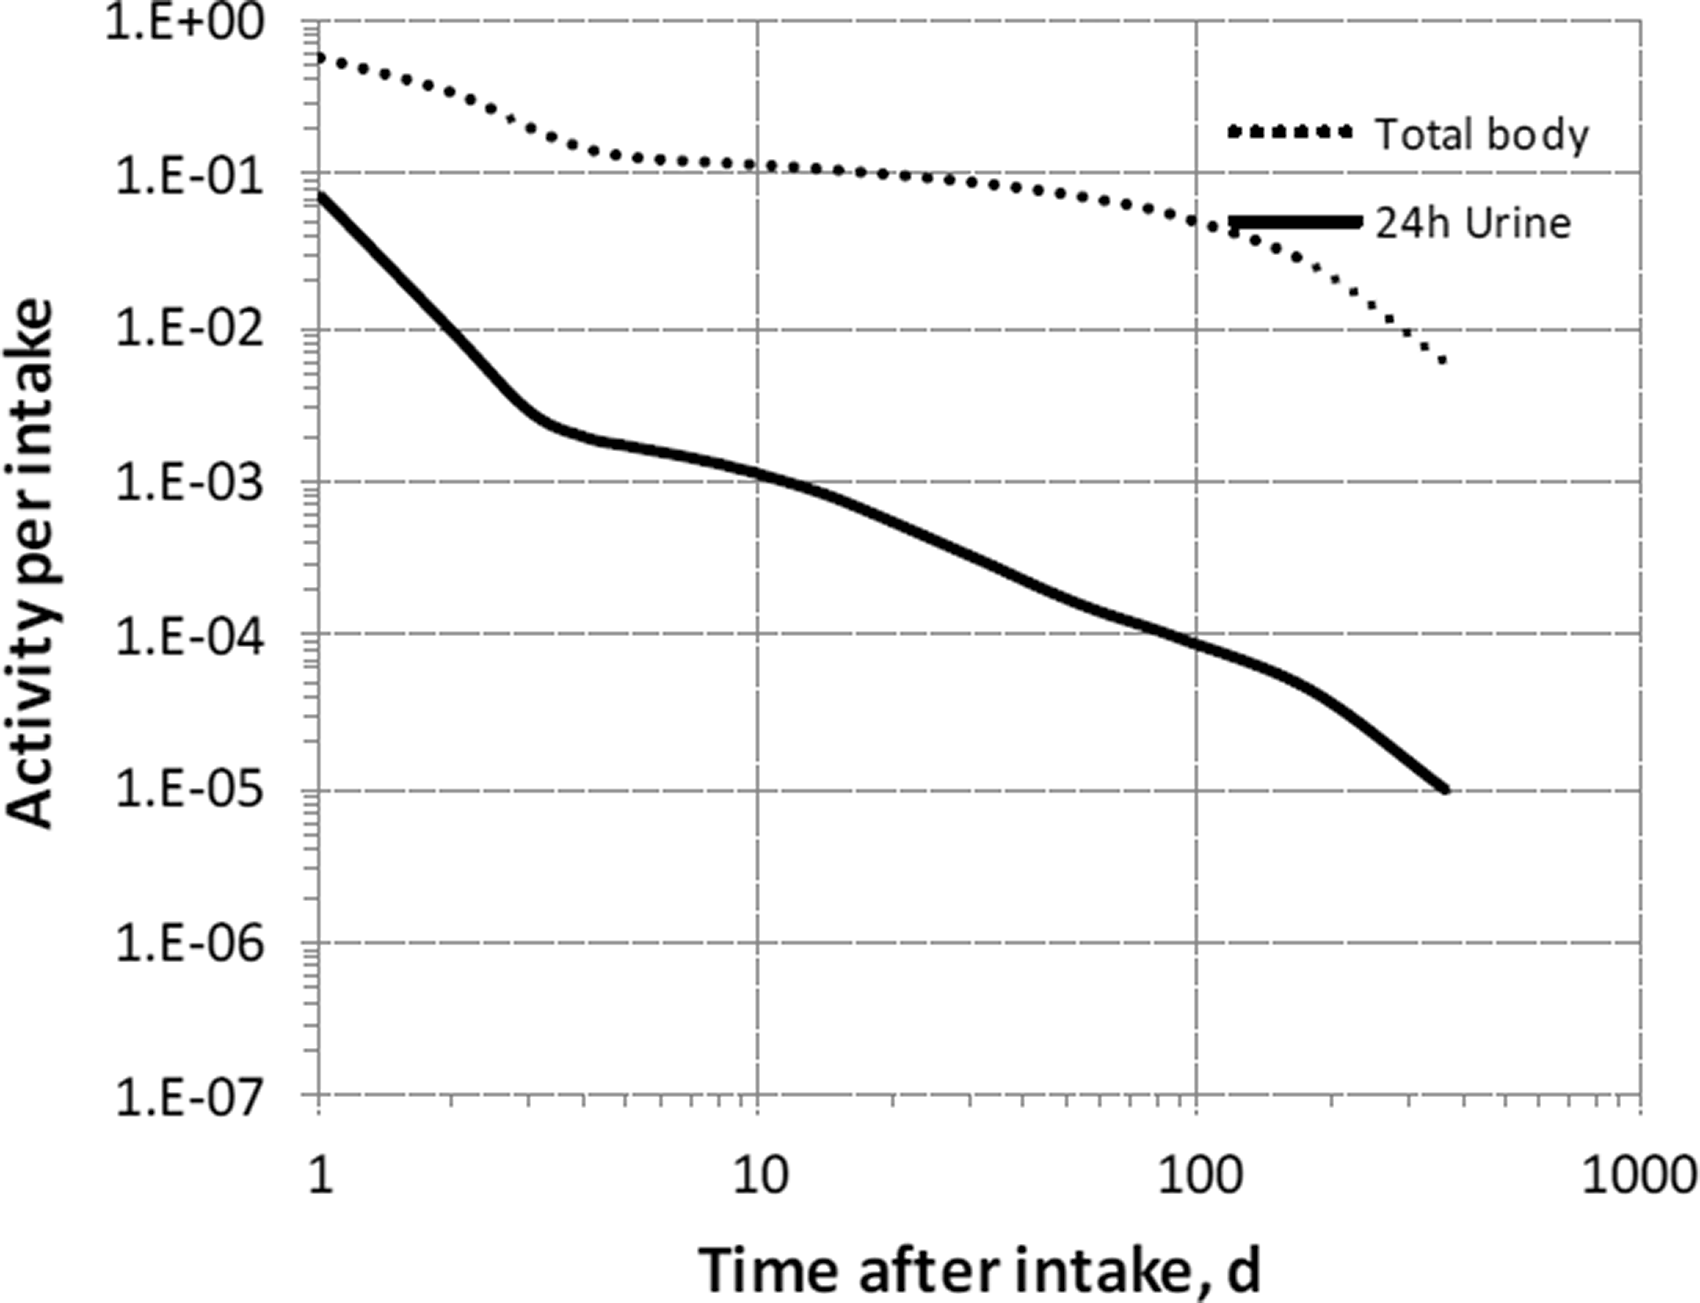

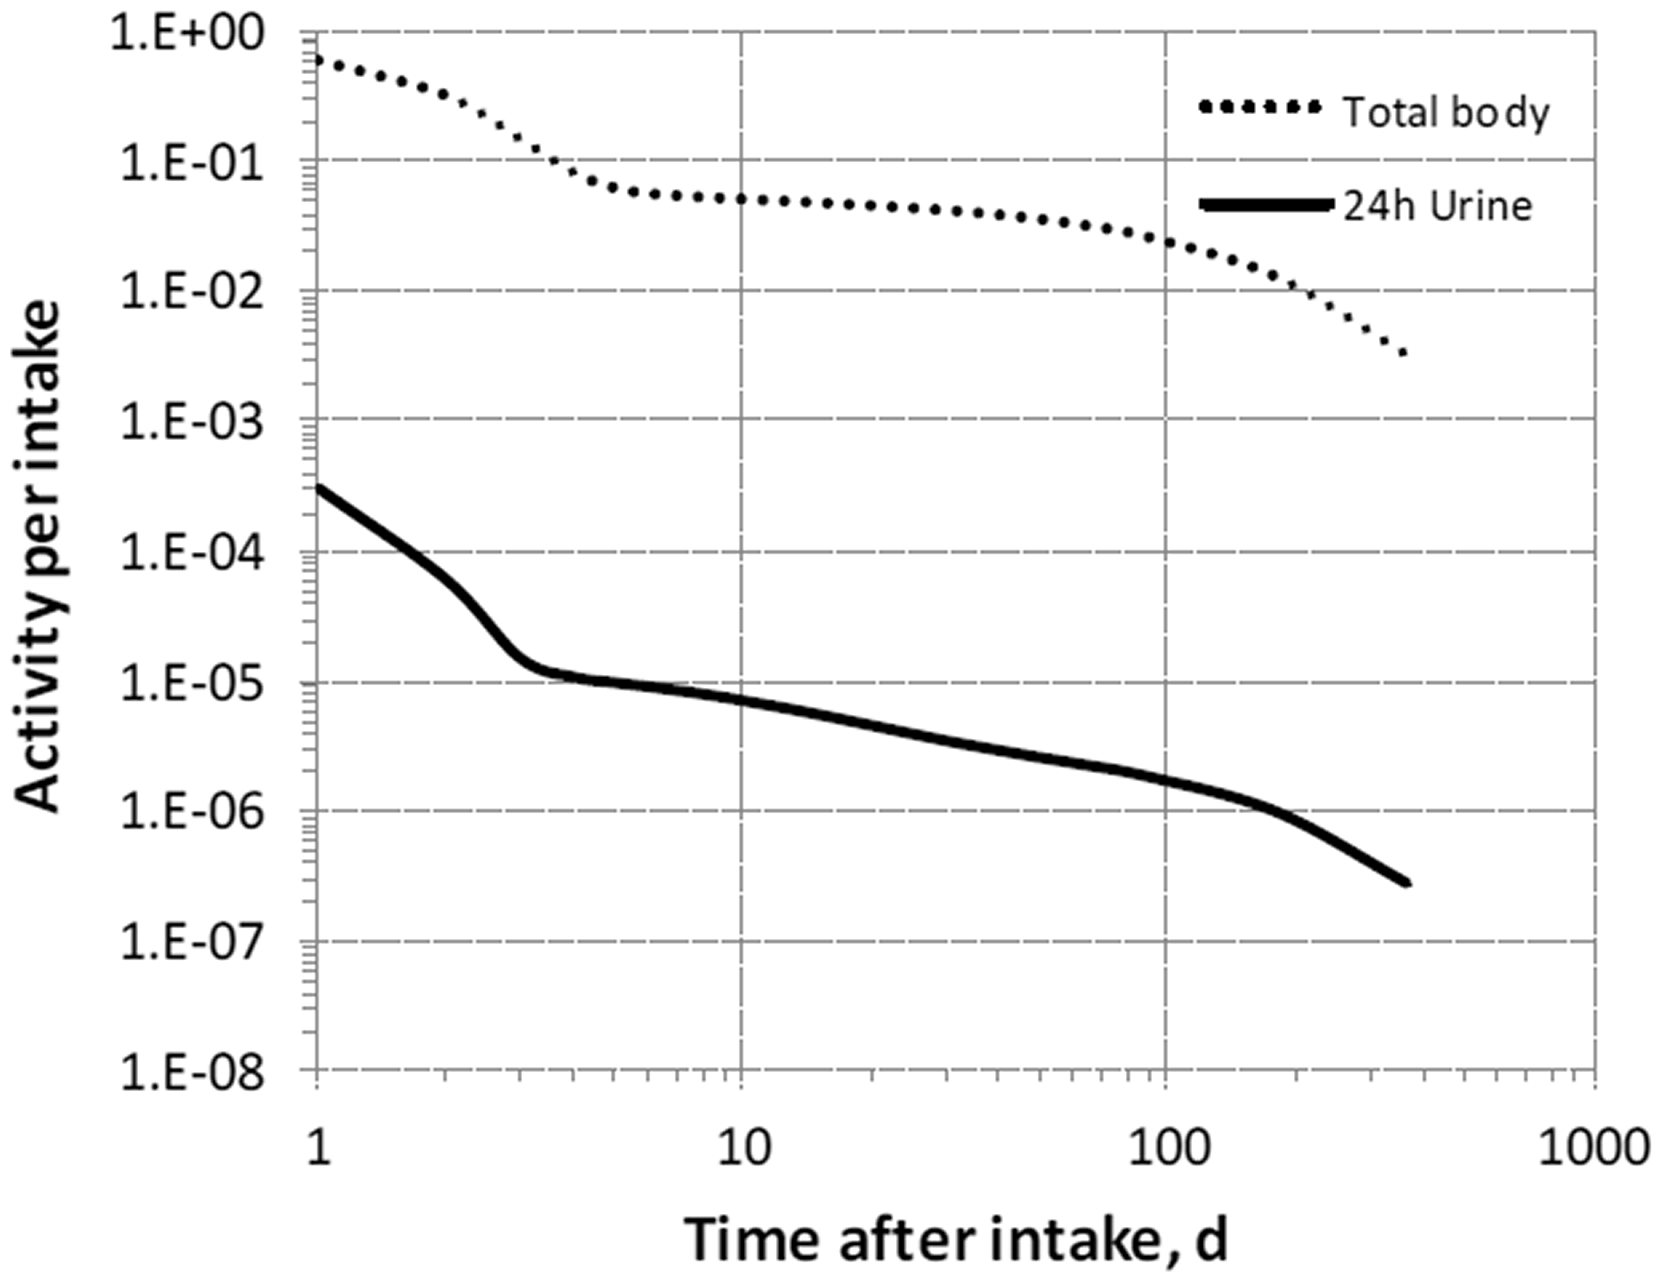

29.2.3.3. Treatment of progeny
(544) Progeny of hafnium addressed in this publication are radioisotopes of hafnium, tantalum, and lutetium. The model for hafnium as a parent is applied to hafnium produced by decay of another hafnium isotope. The models for tantalum and lutetium as progeny of hafnium are expansions of the characteristic models for these elements with added compartments and associated transfer coefficients needed to solve the linked biokinetic models for chains headed by hafnium (see Annex B). For lutetium as a progeny of hafnium, the issue arises that the progeny is produced in some compartments not contained in the characteristic model for lutetium. If produced in a blood compartment not contained in the model for lutetium, the progeny is assumed to transfer to the central blood compartment of its characteristic biokinetic model at a rate of 1000 d−1, and to follow that model thereafter. If produced in a tissue compartment not in the lutetium model, the progeny is assumed to transfer to the central blood compartment of the characteristic model for lutetium at a rate of 1.39 d−1, and to follow that model thereafter.
29.3. Individual monitoring
(545) Information regarding the detection limit for routine individual measurement is not available.
29.4. Dosimetric data for hafnium
30. Tantalum (Z = 73)
30.1. Isotopes
30.2. Routes of intake
30.2.1. Inhalation
(546) For tantalum, default parameter values were adopted on absorption to blood from the respiratory tract (ICRP, 2015). Absorption parameter values and types, and associated fA values for particulate forms of tantalum are given in Table 30.2. Committed effective dose coefficients (Sv Bq−1) for the inhalation or ingestion of 182Hf compounds. AMAD, activity median aerodynamic diameter. Isotopes of tantalum addressed in this publication. EC, electron-capture decay; B+, beta-plus decay; B−, beta-minus decay; IT, isomeric transition decay. Dose coefficients and bioassay data for this radionuclide are given in the printed copy of this publication. Data for other radionuclides listed in this table are given in the online electronic files on the ICRP website. Absorption parameter values for inhaled and ingested tantalum. It is assumed that the bound state can be neglected for tantalum (i.e. fb = 0). The values of sr for Type F, M, and S forms of tantalum (30, 3, and 3 d−1, respectively) are the general default values. For inhaled material deposited in the respiratory tract and subsequently cleared by particle transport to the alimentary tract, the default fA values for inhaled materials are applied [i.e. the product of fr for the absorption type and the fA value for ingested soluble forms of tantalum (0.001)]. Default Type M is recommended for use in the absence of specific information on which the exposure material can be assigned to an absorption type (e.g. if the form is unknown, or if the form is known but there is no information available on the absorption of that form from the respiratory tract). For guidance on the use of specific information, see Section 1.1. Activity transferred from systemic compartments into segments of the alimentary tract is assumed to be subject to reabsorption to blood. The default absorption fraction fA for the secreted activity is the highest value for any form of the radionuclide (fA = 0.001).

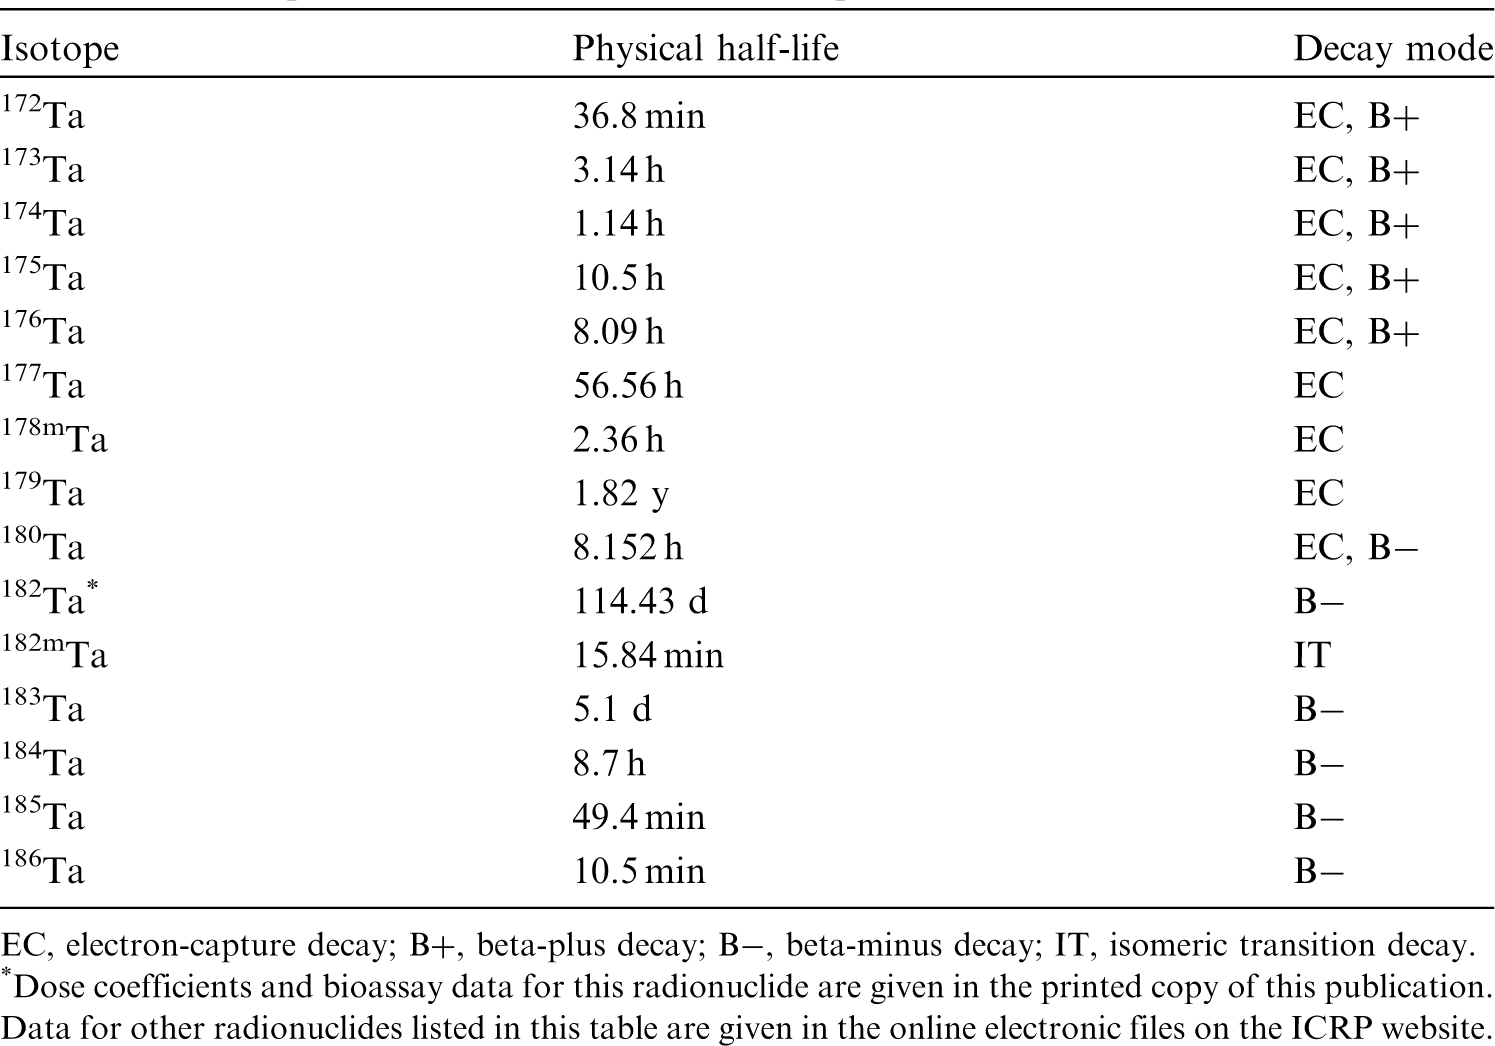
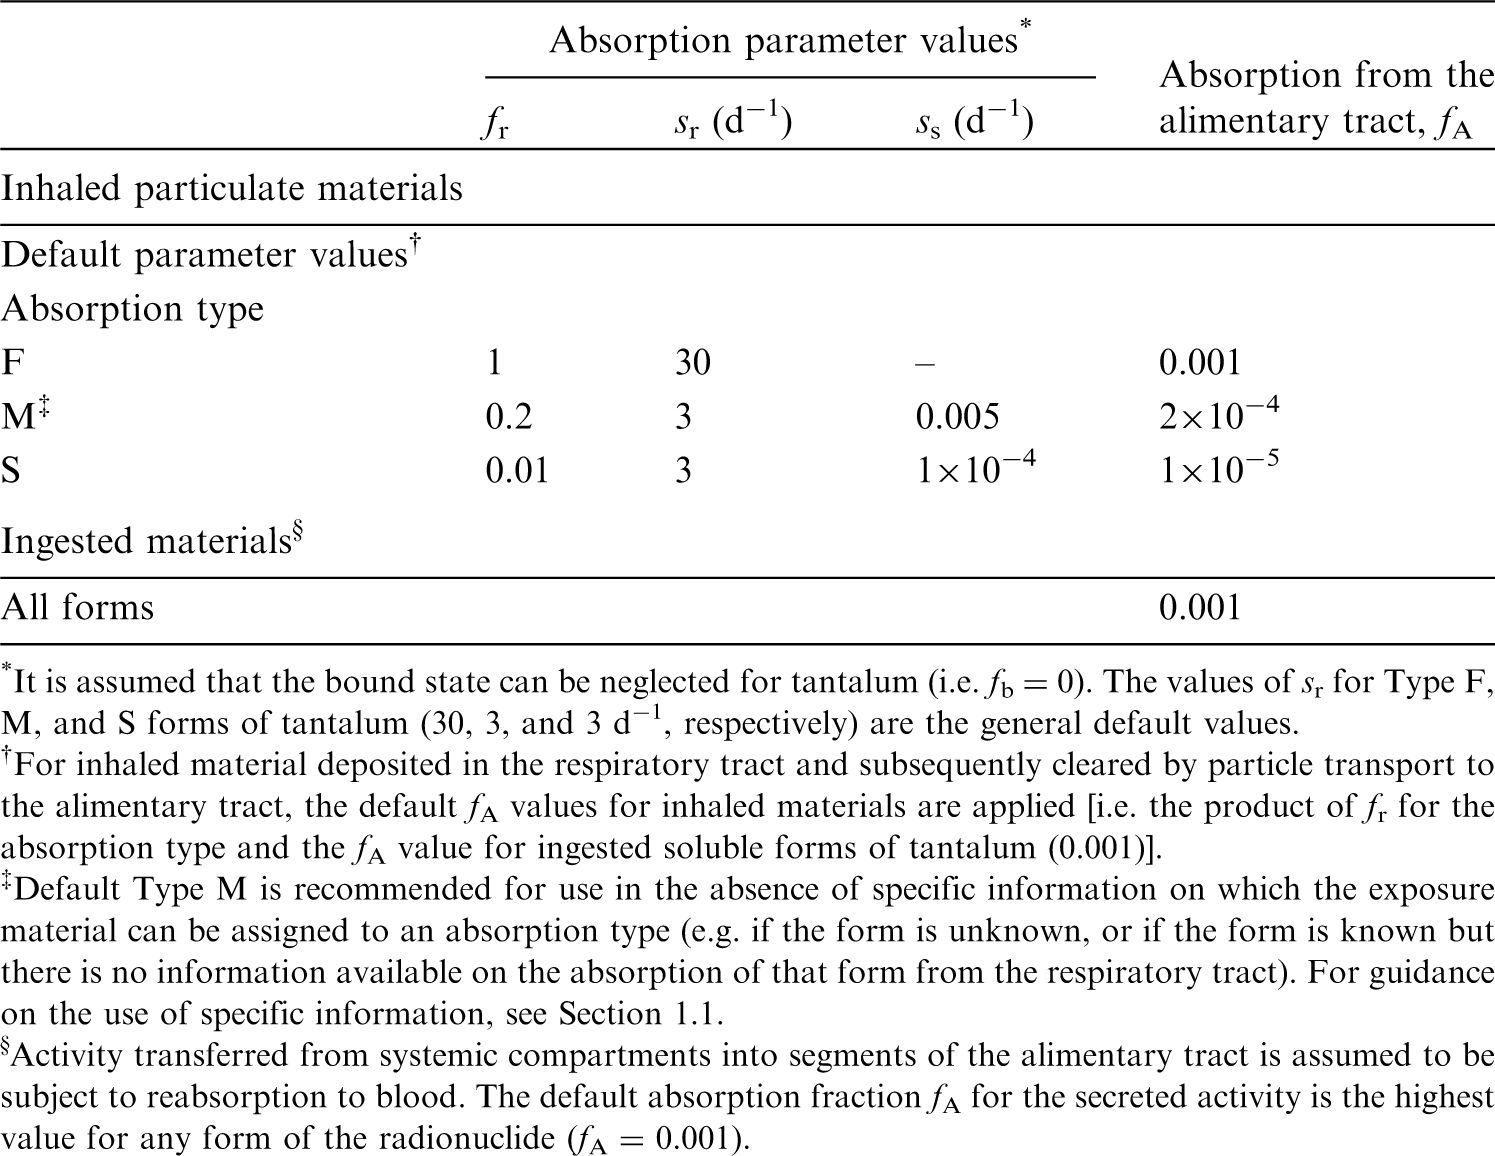
30.2.2. Ingestion
(547) Data from experiments on rats (Fleshman et al., 1971) suggest that the fractional absorption of tantalum, administered as potassium tantalate, from the gastrointestinal tract of the rat is ∼10−3. Other studies on rats (Doull and Dubois, 1949; Cochran et al., 1950) indicate that the fractional absorption of tantalum, administered as the oxide, is also small. When 182Ta was given orally as the tantalate to dogs, all but 1% appeared in the faeces (Rydzynski and Pakulska, 2012). (548) In Publications 30 and 68 (ICRP, 1981, 1994a), f1 was taken as l0−3 for all compounds of tantalum. In this publication, the value of fractional absorption fA = l0−3 is also used as the default for all forms of tantalum in the workplace.
30.2.3. Systemic distribution, retention, and excretion of tantalum
30.2.3.1. Summary of selected studies
(549) The chemical and physical properties of the Group VB element tantalum closely resemble those of the lighter Group VB element niobium. Tantalum and niobium are found together in nature, and are sometimes referred to as geochemical twins because of their similar mass ratios in different geological material from the bulk silicate earth as well as extraterrestrial sources (Münker et al., 2003). The limited fractionation of tantalum and niobium in geological material is attributed to their identical valence state in geological circumstances, together with their nearly identical ionic radii. (550) Information on the biokinetics of systemic tantalum comes mainly from limited studies on rats (Durbin, 1959; Fleshman et al., 1971; Ando et al., 1989; Ando and Ando, 1990). Comparative data for tantalum and niobium provided in these studies suggest that these geochemical twins also behave similarly in biological systems. (551) Ando et al. (1989) and Ando and Ando (1990) studied the distribution and excretion of radioisotopes of 54 elements, including tantalum and niobium, both as the oxalate, following intravenous administration of individual elements to tumour-bearing rats. Activity concentrations were measured in blood, bone, 10 different soft tissues, and an implanted sarcoma. The behaviour of tantalum closely followed that of niobium at all studied sites. (552) In rats administered 95Nb and 182Ta2O5 in citrate solution via intramuscular injection, both radionuclides showed elevated concentrations in the liver, kidneys, and bone (Durbin, 1959). At 4 d post injection, cumulative excretion of activity accounted for 48.6% of administered 182Ta and 39.4% of administered 95Nb. At that time, activity in bone, liver, and kidneys represented ∼23%, 14%, and 10%, respectively, of retained 182Ta, and 27%, 14%, and 5%, respectively, of retained 95Nb. (553) Fleshman et al. (1971) investigated the biokinetics of 182Ta in rats over 106 d after its oral administration as potassium tantalite to rats. Bone was the dominant long-term repository, followed by pelt. At 106 d, bone, liver, and kidneys contained ∼46%, 3.4%, and 1.2% respectively, of the total-body content.
30.2.3.2. Biokinetic model for systemic tantalum
(554) In view of the close physical and chemical similarities of tantalum and niobium, their apparently similar biological behaviour as indicated by available comparative studies, and difficulties in developing a biokinetic model for systemic tantalum based on tantalum-specific information, the systemic model for niobium applied in Publication 134 (ICRP, 2016) is assigned to tantalum. (555) The structure of the systemic model for tantalum is shown in Fig. 30.1. Transfer coefficients are listed in Table 30.3. Parameter values in the biokinetic model for systemic tantalum. SI, small intestine. ST, soft tissue. ST0 and ST1 are compartments of other soft tissues representing two phases of biological removal to blood. Structure of the biokinetic model for systemic tantalum. SI, small intestine. ST, soft tissue. ST0 and ST1 are compartments of other soft tissues representing two phases of biological removal to blood.
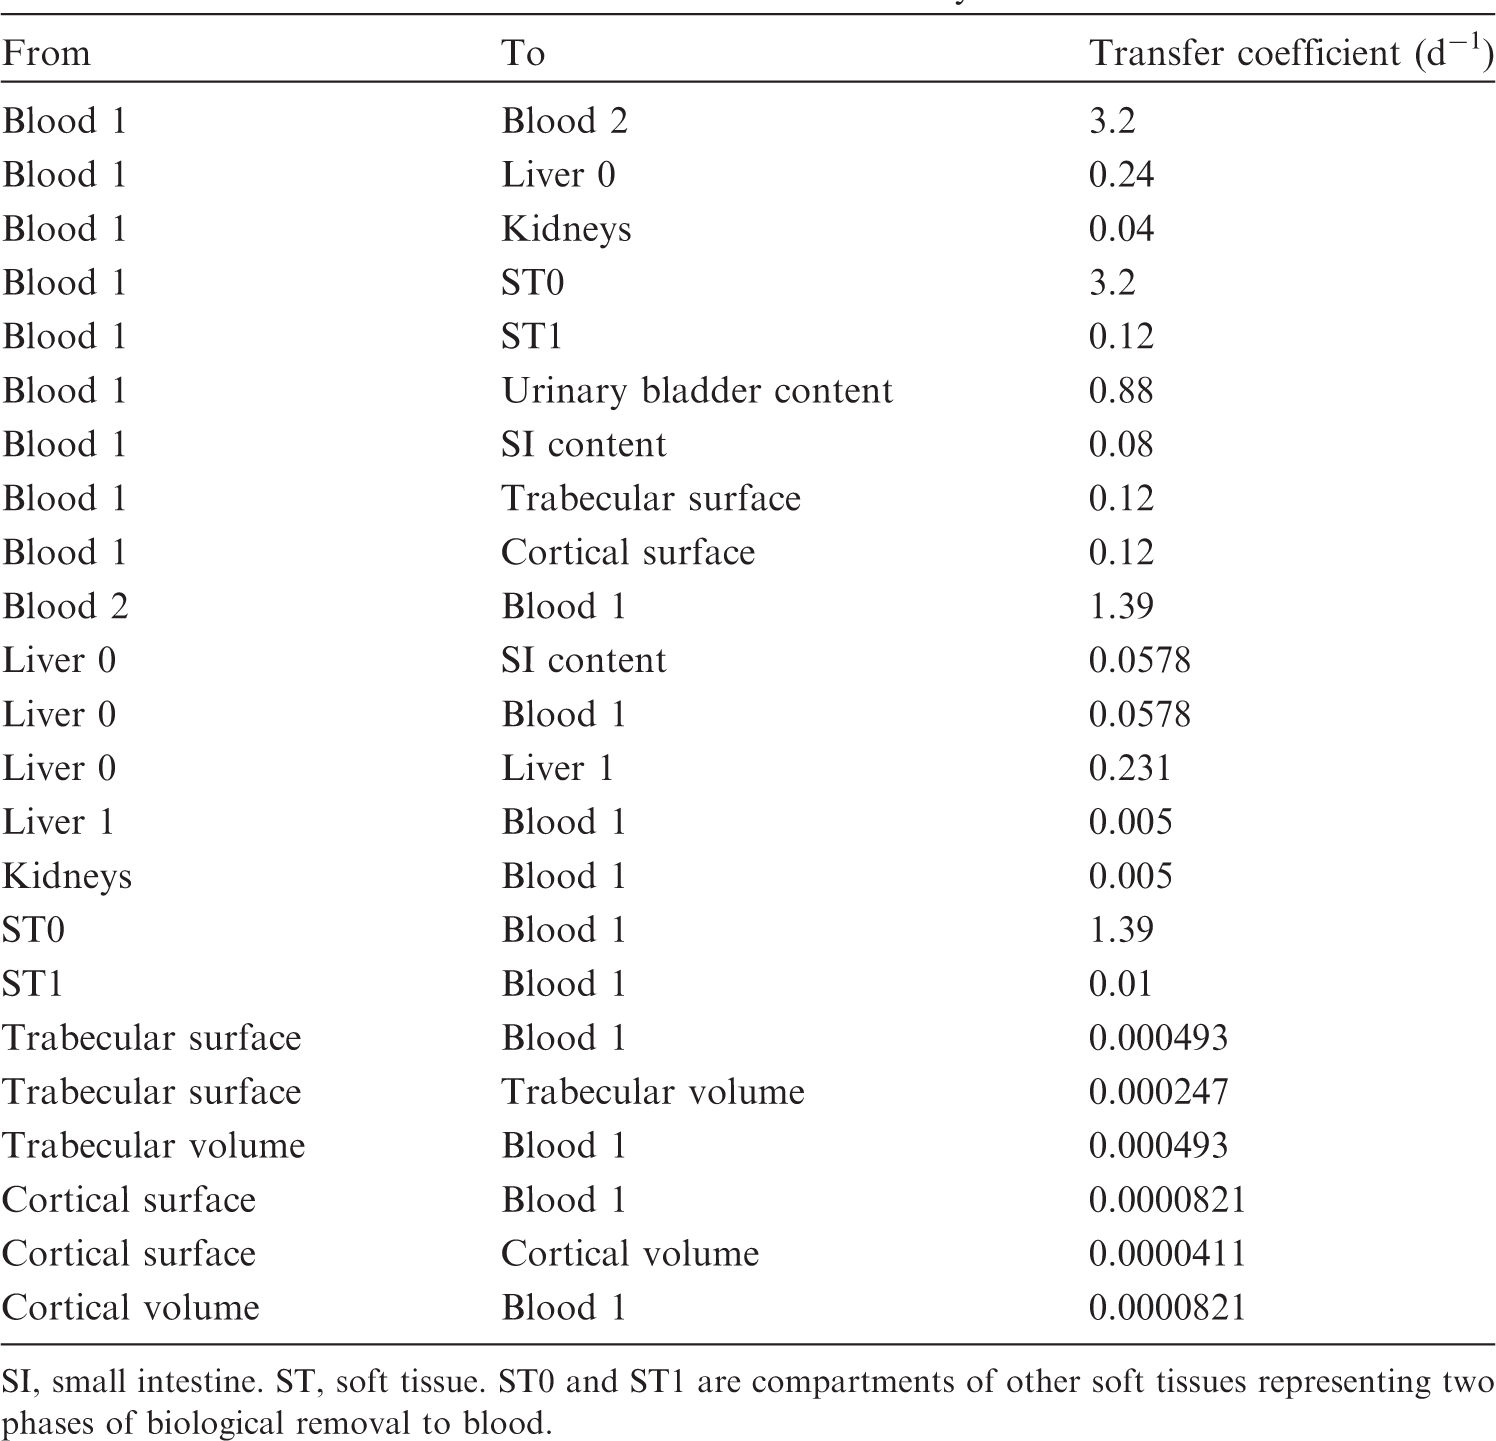

30.2.3.3. Treatment of progeny
(556) Progeny of tantalum addressed in this publication are isotopes of tantalum, hafnium, lutetium, and tungsten. The characteristic models for tantalum and hafnium are applied to these elements as progeny of tantalum. The models for lutetium and tungsten as progeny of tantalum are the characteristic models for these elements with added transfer coefficients needed to solve the linked biokinetic models for chains headed by tantalum. Lutetium or tungsten produced in an ambiguous compartment (i.e. a compartment of the model for a preceding chain that is not a compartment in the model for the progeny) is assumed to transfer to the central blood compartment of the progeny’s model, and to follow that model thereafter. The following transfer rates are assigned to lutetium or tungsten produced in ambiguous compartments: 1000 d−1 if produced in a blood compartment; at the rate of bone turnover for the indicated bone type if produced in a bone volume compartment; and at the following element-specific rates if produced in any other compartment: lutetium, 1.39 d−1; and tungsten, 8.32 d−1.
30.3. Individual monitoring
(557) Information regarding the detection limit for routine individual measurement is not available.
30.4. Dosimetric data for tantalum
31. Tungsten (Z = 74)
31.1. Isotopes
31.2. Routes of intake
31.2.1. Inhalation
(558) For tungsten, default parameter values were adopted on absorption to blood from the respiratory tract (ICRP, 2015). Absorption parameter values and types, and associated fA values for particulate forms of tungsten are given in Table 31.2. Committed effective dose coefficients (Sv Bq−1) for the inhalation or ingestion of 182Ta compounds. AMAD, activity median aerodynamic diameter. Isotopes of tungsten addressed in this publication. EC, electron-capture decay; B+, beta-plus decay; B−, beta-minus decay. Dose coefficients and bioassay data for this radionuclide are given in the printed copy of this publication. Data for other radionuclides listed in this table are given in the online electronic files on the ICRP website. Absorption parameter values for inhaled and ingested tungsten. It is assumed that the bound state can be neglected for tungsten (i.e. fb = 0). The values of sr for Type F, M, and S forms of tungsten (30, 3, and 3 d−1, respectively) are the general default values. For inhaled material deposited in the respiratory tract and subsequently cleared by particle transport to the alimentary tract, the default fA values for inhaled materials are applied [i.e. the product of fr for the absorption type and the fA value for ingested soluble forms of tungsten (0.5)]. Default Type M is recommended for use in the absence of specific information on which the exposure material can be assigned to an absorption type (e.g. if the form is unknown, or if the form is known but there is no information available on the absorption of that form from the respiratory tract). For guidance on the use of specific information, see Section 1.1. Activity transferred from systemic compartments into segments of the alimentary tract is assumed to be subject to reabsorption to blood. The default absorption fraction fA for the secreted activity is the highest value for any form of the radionuclide (fA = 0.5).
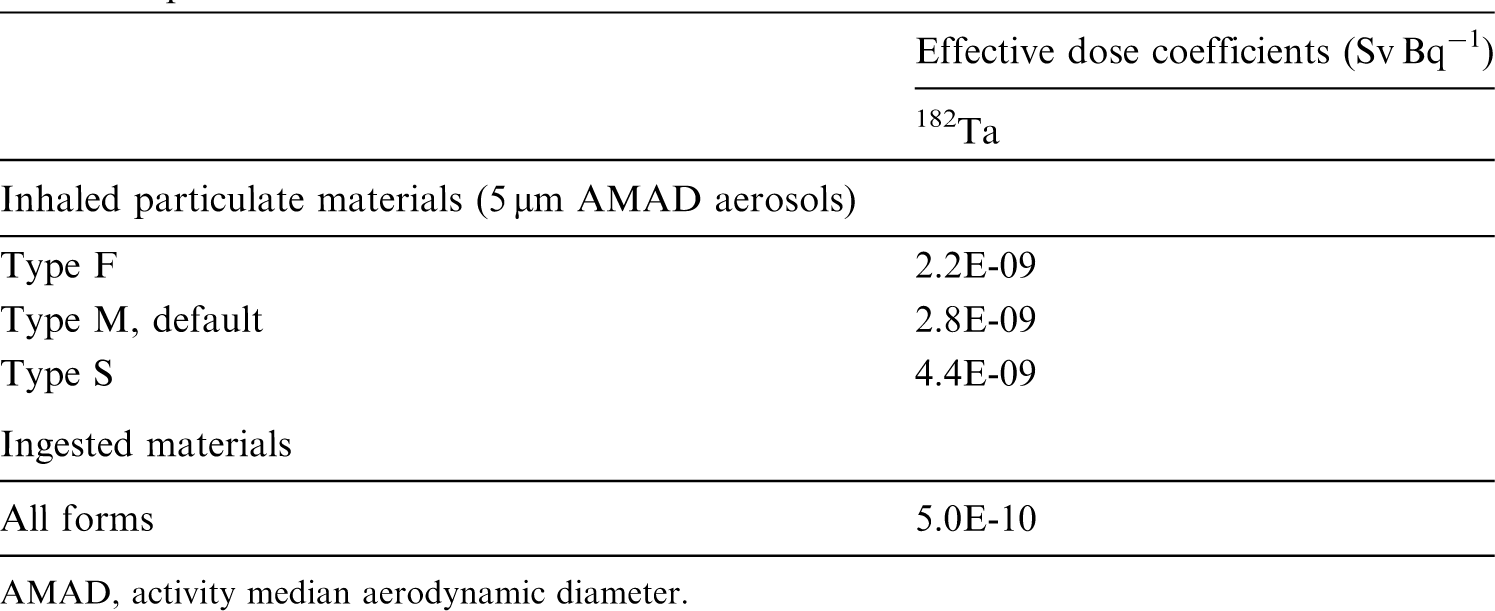


31.2.2. Ingestion
(559) In a controlled balance study involving four adult human volunteers during 5 d, the comparison of the amount of tungsten in daily diet, urine, and faeces suggests that approximately half of the ingested tungsten is absorbed to blood (Wester, 1974). Animal ingestion studies were reviewed by Leggett (1997) and ATSDR (ATSDR, 2005c). The fractional absorption of tungsten from sodium tungstate or tungsten oxide orally administered to rats, dogs, pigs, and sheep was in the range of 25–92%. (560) Absorption decreased markedly when the animals were fed on a diet high in roughage (Bell and Sneed, 1970). This suggests that tungsten absorption may be inhibited by adsorption of the element to food particles, especially those high in cellulose. This may explain why the fractional gastrointestinal absorption of tungsten, administered as the tungstate, has been reported as ∼5% in experiments on goats (Ekman et al., 1977). Lower absorption (∼1%) was also observed when tungsten was administered to rats as tungstic acid (Ballou, 1960). Experiments in which peccaries ingested debris from a nuclear explosion gave fractional absorption of between 10% and 20% for tungsten (Chertok and Lake, 1971c,d). (561) In Publications 30 and 68 (ICRP, 1981, 1994a), f1 was taken as 0.01 for tungstic acid and 0.3 for all other compounds of the element. In this publication, the value of fA = 0.01 is applied to tungstic acid, and fA = 0.5 is adopted for all other compounds, taking into account the recent animal studies and the limited human data.
31.2.3. Systemic distribution, retention, and excretion of tungsten
31.2.3.1. Biokinetic data
(562) Direct information on the behaviour of absorbed tungsten in humans consists largely of measurements of the concentration of tungsten in blood, tissues, and excreta of chronically exposed human subjects (Wester, 1973, 1974; Brune et al., 1980; Nicolaou et al., 1987; Zhu et al., 2010). The time-dependent distribution and excretion of systemic tungsten following short-term intake has been studied in a variety of laboratory animals including: dogs receiving radiotungsten by inhalation or injection (Aamodt, 1973, 1975); swine exposed to radionuclides produced by a nuclear explosion (Chertok and Lake, 1971a,b,c); rodents administered radiotungsten by different routes (Scott, 1952; Wase, 1956; Ballou, 1960; Fleshman et al., 1966; Kaye, 1968; Ando et al., 1989); and various farm animals (sheep, pigs, cows, goats) receiving radiotungsten by injection or ingestion (Bell and Sneed, 1970; Mullen et al., 1976; Ekman et al., 1977). Relatively detailed data are available for rats, but the rat is not a preferred model for tungsten behaviour in the human body because of the rat’s unusually low requirements for the essential element molybdenum (Higgins et al., 1956), a chemical and physiological analogue of tungsten. While the initial systemic distribution of tungsten appears to be reasonably similar in rats and larger animals, rats appear to excrete tungsten at a higher rate than most of the other studied animals. (563) Data for laboratory animals indicate initially rapid clearance of tungsten from blood, with retention of a few tenths of a percent of the absorbed or injected amount in blood over a period of days (Durbin et al., 1957; Durbin, 1959; Ballou, 1960; Chertok and Lake, 1971a,b,c; Aamodt, 1973; Mullen et al., 1976; Ekman et al., 1977; Ando et al., 1989; Mason et al., 1989). Following intravenous administration of 181W as sodium tungstate to beagles, ∼70% of the injected activity was removed from blood with Tb of 35 min, 25% with Tb of 70 min, and most of the remainder with Tb of 5 h (Aamodt, 1973). In goats administered Na2181WO4 intravenously, ∼84% of activity was removed from plasma with Tb of 2 h, 15% with Tb of 9 h, and 0.7% with Tb of 63 h (Ekman et al., 1977). Following intravenous injection of 185W as tungstate into a sheep, ∼25% of injected activity remained in blood after 0.5 h and ∼10% remained after 2 h (Mason et al., 1989). Tissue analysis of young Yorkshire pigs exposed to radioactive fallout from a detonation (Chertok and Lake, 1971a,b,c) suggests that blood may have contained ≥10% of total body radiotungsten after 3 d. (564) Reported data on the relative concentrations of tungsten in plasma and RBC are variable, perhaps reflecting species differences in the affinity of tungsten for RBC. In beagles receiving 181W as sodium tungstate by intravenous injection, the ratio of the concentration of 181W in plasma to that in RBC averaged ∼3 during the first 24 h (Aamodt, 1973). In goats administered Na2181WO4 intravenously, steady-state conditions between plasma and RBC were reached at ∼6 h after injection, at which time the RBC contained 10% of 181W in blood (Ekman et al., 1977). Higher RBC:plasma activity ratios for radiotungsten have been determined in rodents than in larger animals (Wase, 1956; Kaye, 1968). (565) Useful data on early exchange of tungsten between blood and tissues were only found for rats (Scott, 1952; Ando et al., 1989). Mathematical analysis of the data suggest that a sizable portion, of the order of one-third, of the amount leaving blood returns to blood within a few hours. (566) Potentially important systemic repositories for tungsten include the liver, kidneys, spleen, and bone. Data for laboratory animals indicate that a few percent of absorbed tungsten deposits in bone, at least a few tenths of the deposited amount is retained for an extended period, and accumulation of tungsten is greater in growing bone than in mature bone (Fleshman et al., 1966; Kaye, 1968; Aamodt, 1975; Mullen et al., 1976; Ando et al., 1989). Similarities in the behaviour of tungstate, molybdate, and phosphate in biological systems have been observed, and it seems likely that uptake and retention of tungsten by bone are due to substitution of tungstate for phosphate (Fleshman et al., 1966). (567) The systemic biokinetics of tungsten bear some resemblance to those of the chemically similar essential element molybdenum. Tungsten has been used experimentally as a physiological analogue of molybdenum. It is the best known biological antagonist of molybdenum, and the only element capable of producing experimental deficiency of molybdenum, resulting from prevention of incorporation of molybdenum into certain enzymes (Cardin and Mason, 1976). Membrane transport may not distinguish between tungsten and molybdenum, although differences in the biokinetics of these elements may result from the fact that molybdenum compounds are more easily reduced in biological systems (Callis and Wentworth, 1977). An apparent difference in the systemic kinetics of these two elements is that the liver appears to accumulate more molybdenum than tungsten (Leggett, 1997).
31.2.3.2. Biokinetic model for systemic tungsten
(568) A biokinetic model for systemic tungsten developed by Leggett (1997) is adopted here. The model structure is shown in Fig. 31.1. The transfer coefficients are listed in Table 31.3. (569) The model structure is a variation of the systemic model for uranium in the adult used in Publication 69 (ICRP, 1995a) for adult members of the public and in Publications 68 and 137 (ICRP, 1994a, 2017) for workers. The primary change made for application of the model structure to tungsten is the addition of a compartment representing the spleen. Transfer coefficients in the biokinetic model for systemic tungsten. Exch, exchangeable; Nonexch, non-exchangeable. Structure of the biokinetic model for systemic tungsten. RBC, red blood cells; Exch, exchangeable; Nonexch, non-exchangeable.
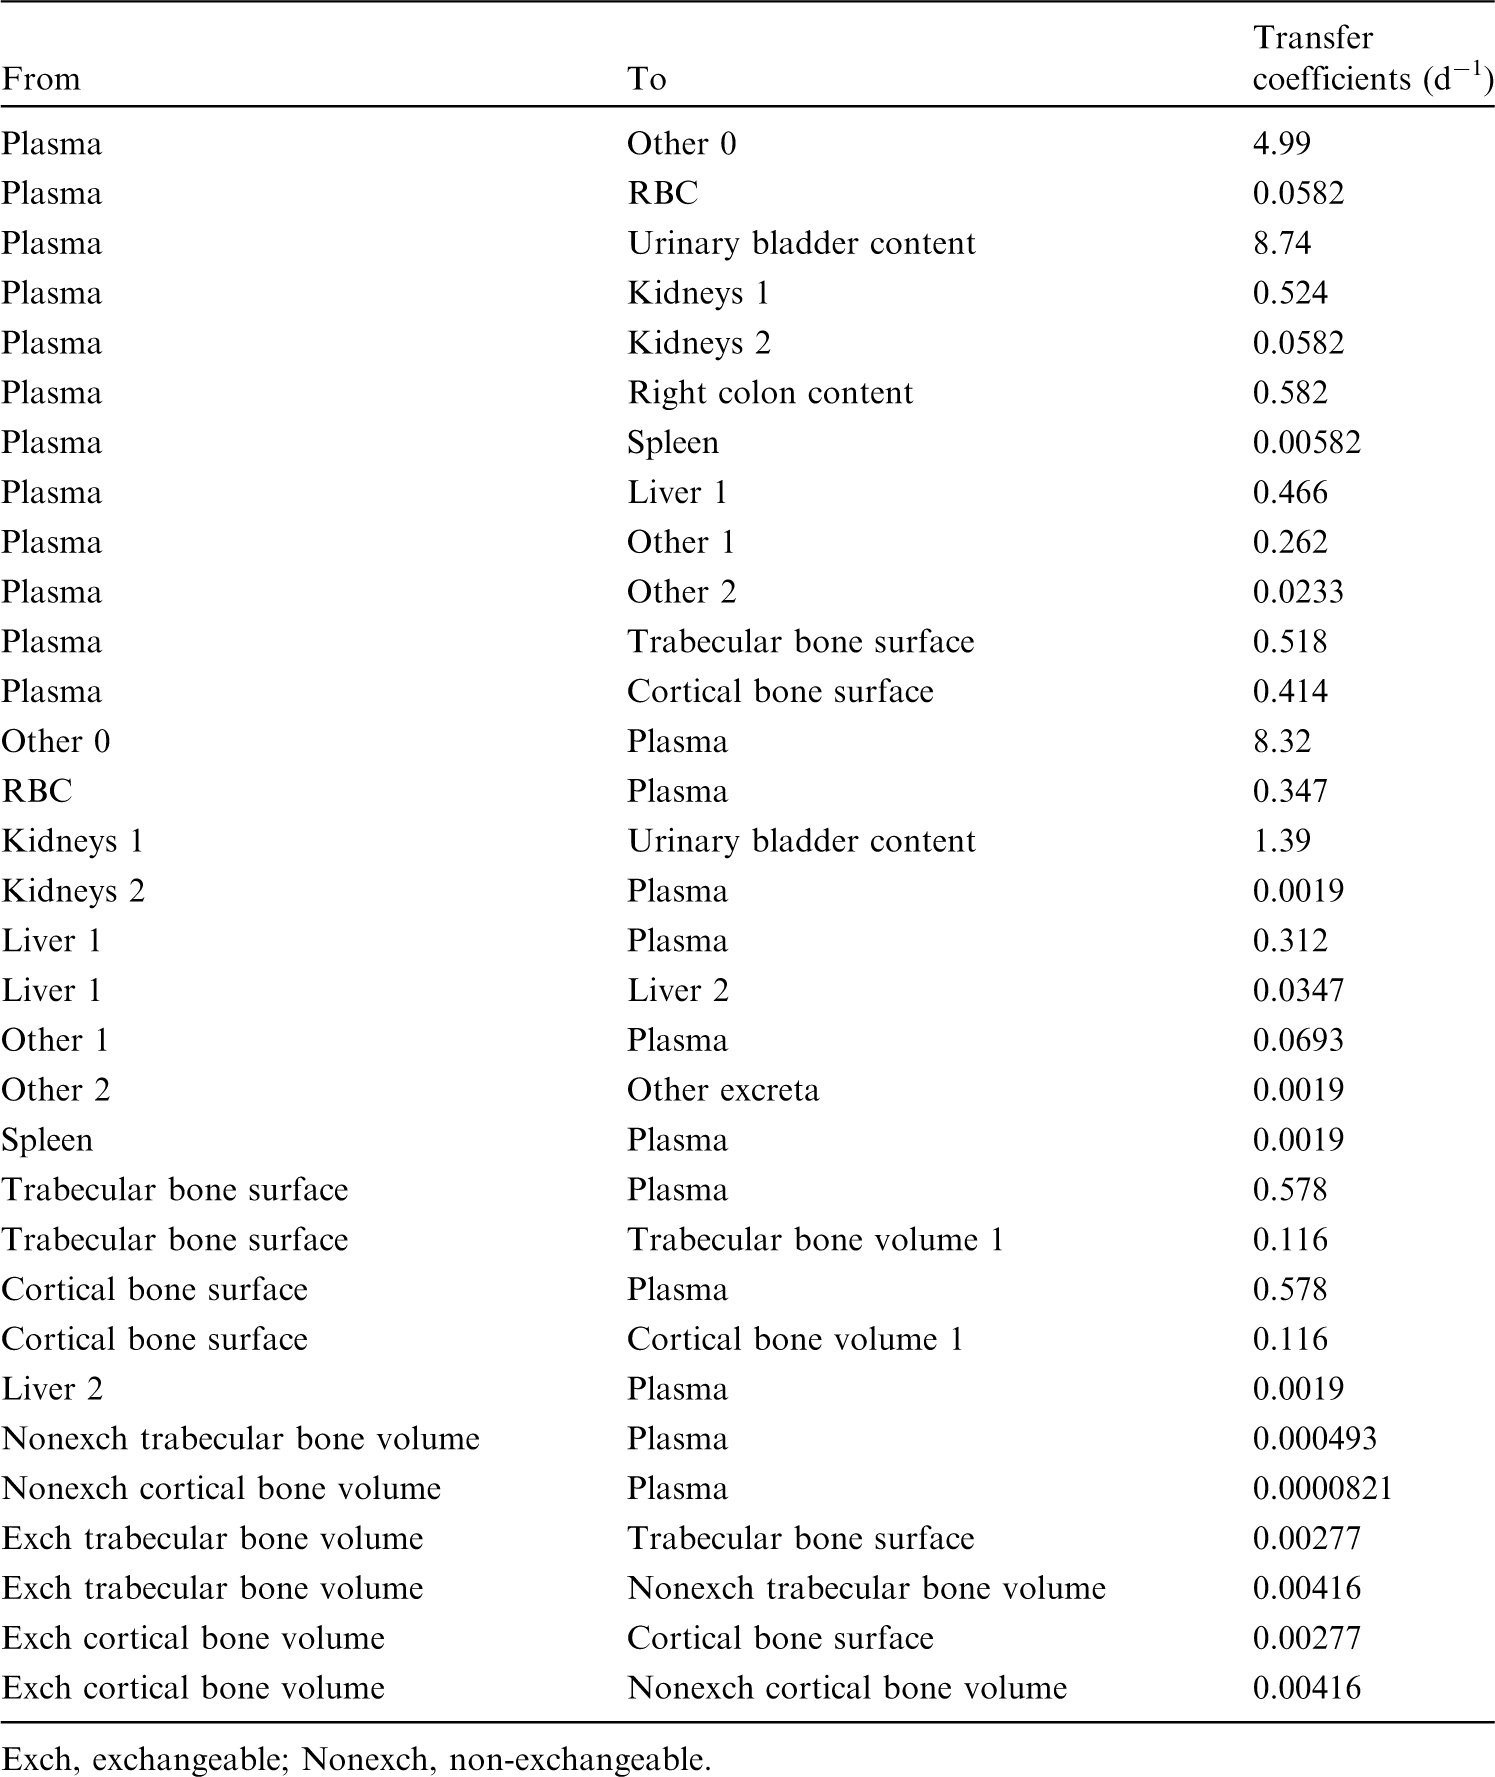

31.2.3.3. Treatment of progeny
(570) Progeny of tungsten addressed in this publication are isotopes of tantalum and rhenium. The characteristic models for tantalum and rhenium are applied to these elements as members of chains headed by tungsten, with added transfer coefficients needed to solve the linked biokinetic models for chains headed by tungsten. Tantalum or rhenium produced in an ambiguous compartment (i.e. a compartment of the model for a preceding chain that is not a compartment in the model for the progeny) is assumed to transfer to the central blood compartment of the progeny’s characteristic model, and to follow that model thereafter. The following transfer rates are assigned to tantalum or rhenium produced in ambiguous compartments: 1000 d−1 if produced in a blood compartment; at the reference rate of bone turnover for the indicated bone type if produced in a bone volume compartment; and at the following element-specific rates if produced in any other compartment: tantalum, 1.39 d−1; and rhenium, 0.462 d−1.
31.3. Individual monitoring
(571) Information regarding the detection limit for routine individual measurement is not available.
31.4. Dosimetric data for tungsten
32. Rhenium (Z = 75)
32.1. Isotopes
32.2. Routes of intake
32.2.1. Inhalation
(572) For rhenium, default parameter values were adopted on absorption to blood from the respiratory tract (ICRP, 2015). Absorption parameter values and types, and associated fA values for particulate forms of rhenium are given in Table 32.2. Committed effective dose coefficients (Sv Bq−1) for the inhalation or ingestion of 181W compounds. AMAD, activity median aerodynamic diameter. Isotopes of rhenium addressed in this publication. EC, electron-capture decay; B+, beta-plus decay; B−, beta-minus decay; IT, isomeric transition decay. Dose coefficients and bioassay data for this radionuclide are given in the printed copy of this publication. Data for other radionuclides listed in this table are given in the online electronic files on the ICRP website. Absorption parameter values for inhaled and ingested rhenium. It is assumed that the bound state can be neglected for rhenium (i.e. fb = 0). The values of sr for Type F, M, and S forms of rhenium (30, 3, and 3 d−1, respectively) are the general default values. For inhaled material deposited in the respiratory tract and subsequently cleared by particle transport to the alimentary tract, the default fA values for inhaled materials are applied [i.e. the product of fr for the absorption type and the fA value for ingested soluble forms of rhenium (0.9)]. Default Type M is recommended for use in the absence of specific information on which the exposure material can be assigned to an absorption type (e.g. if the form is unknown, or if the form is known but there is no information available on the absorption of that form from the respiratory tract). For guidance on the use of specific information, see Section 1.1. Activity transferred from systemic compartments into segments of the alimentary tract is assumed to be subject to reabsorption to blood. The default absorption fraction fA for the secreted activity is the highest value for any form of the radionuclide (fA = 0.9).
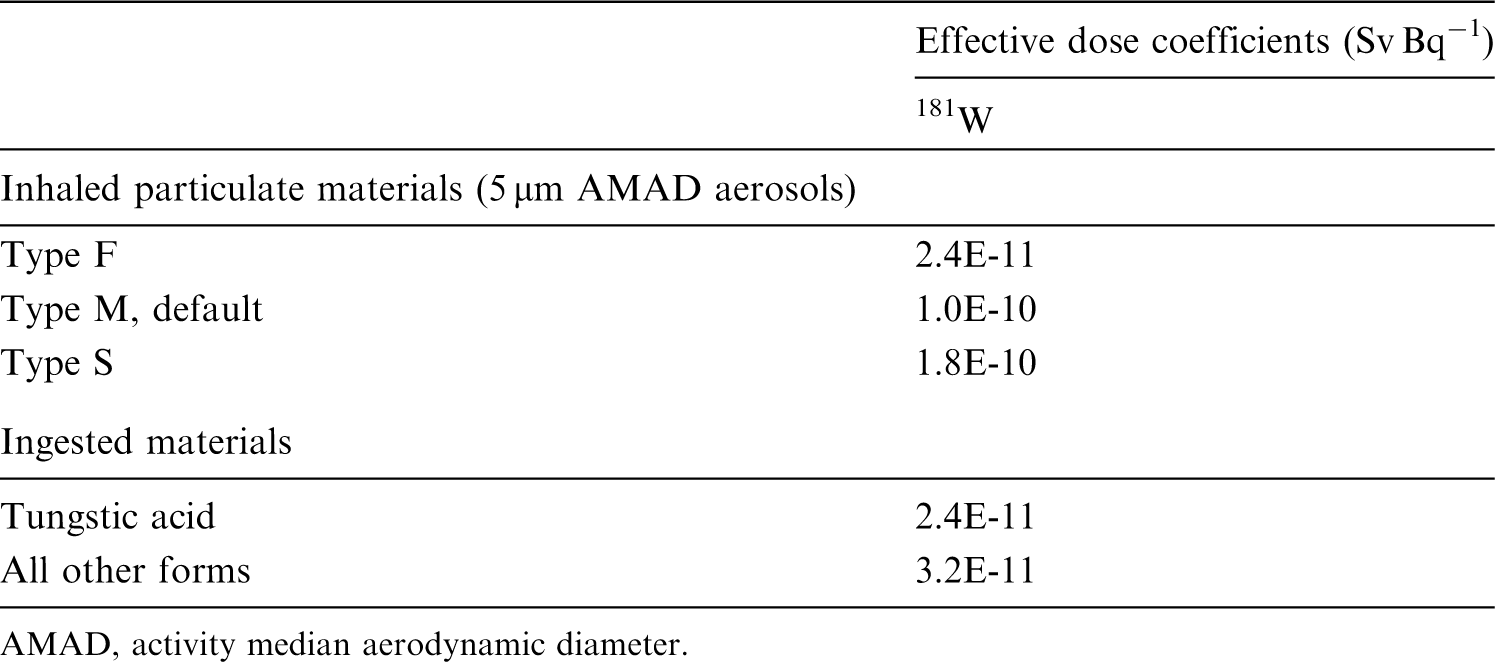
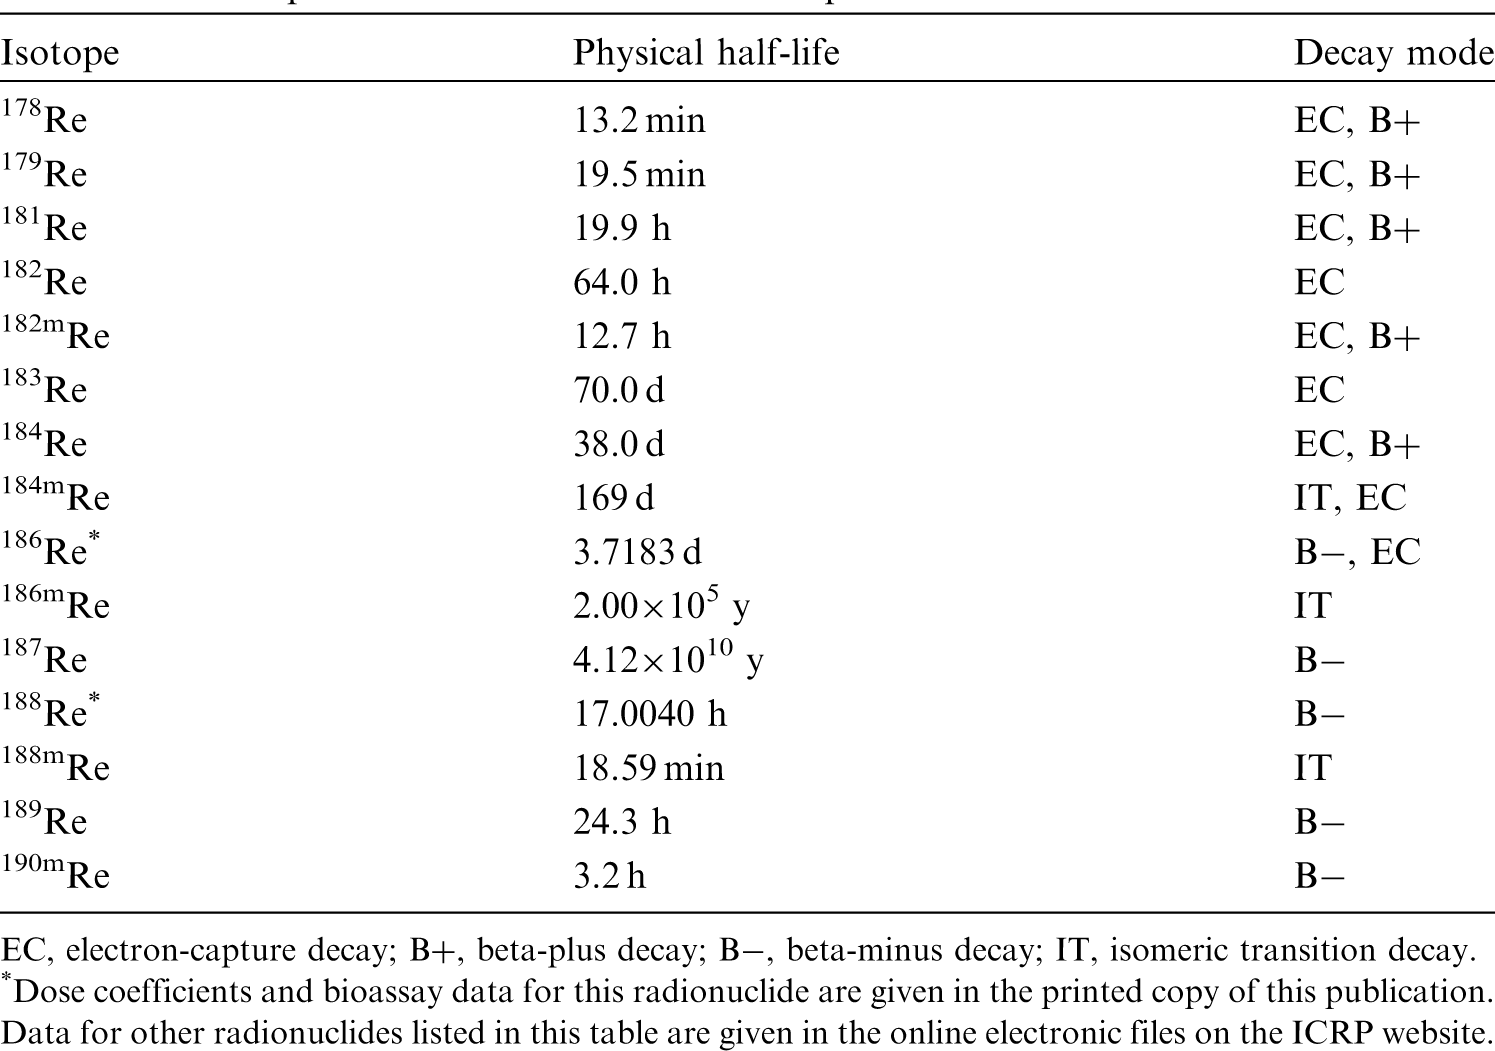
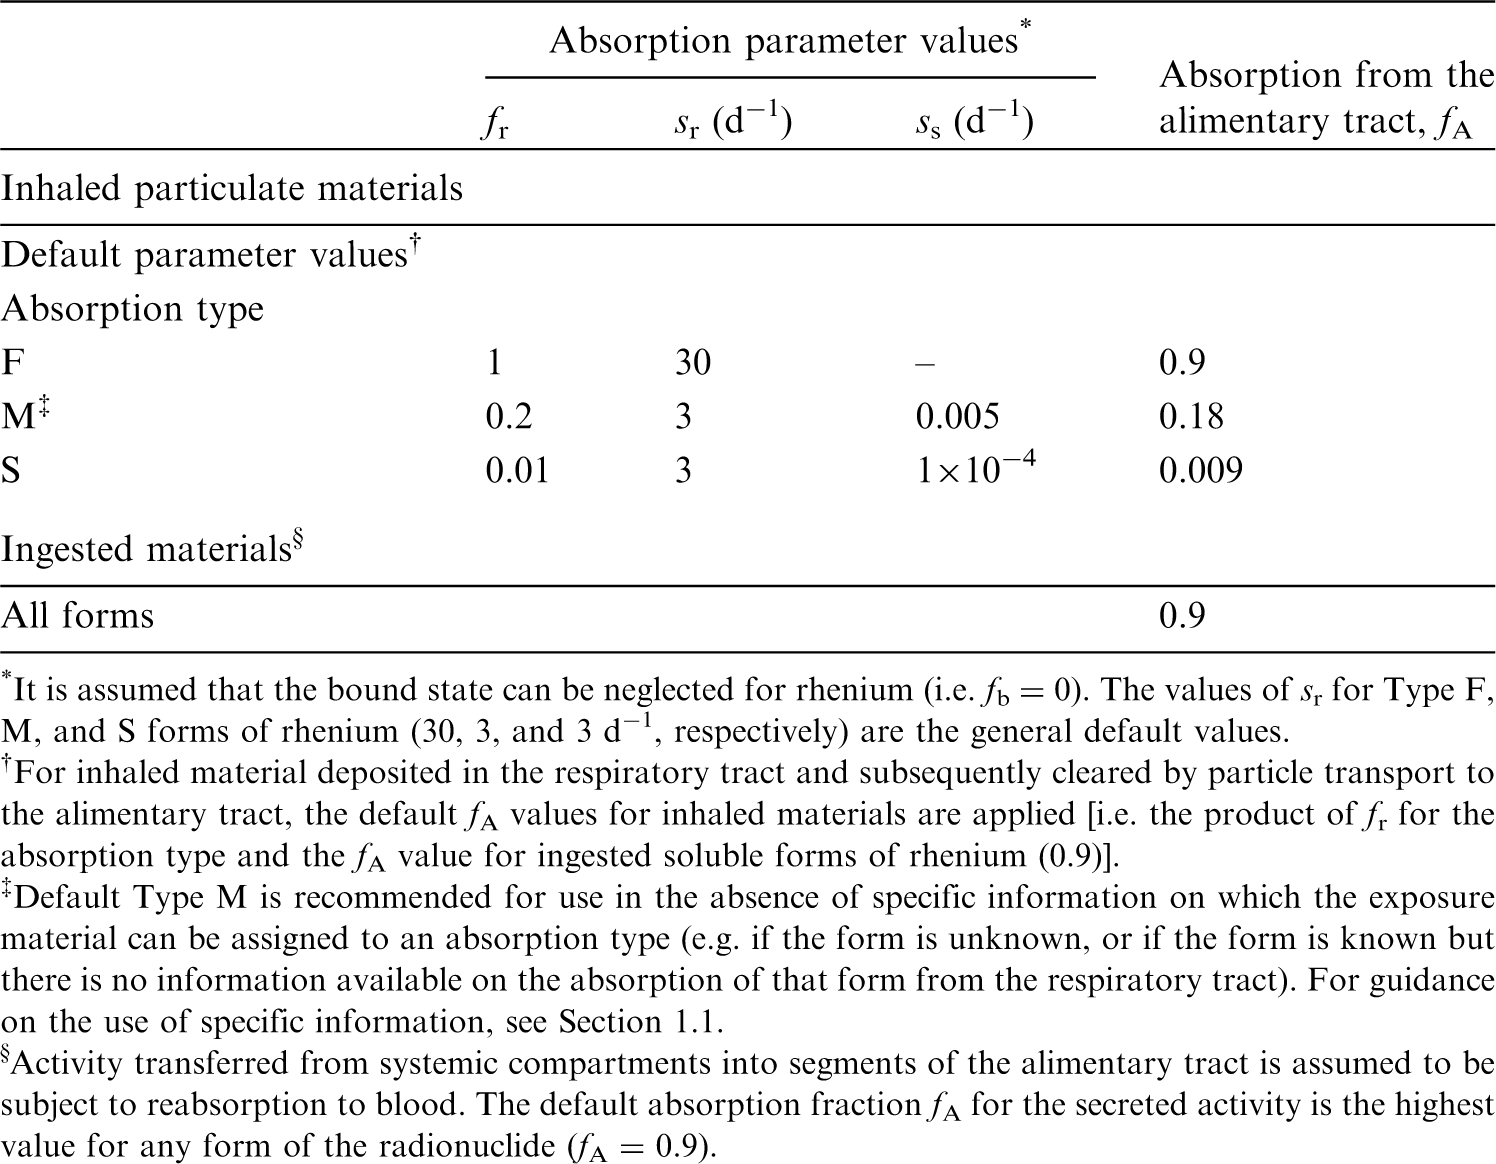
32.2.2. Ingestion
(573) In Publication 30 (ICRP, 1980), as there appeared to be no information available concerning the uptake of rhenium from the gastrointestinal tract, a fractional absorption value of 0.8 was recommended for all chemical forms of rhenium based on the chemical analogy with technetium (Durbin et al., 1957; Durbin, 1959; Zuckier et al., 2004). This value was also adopted in Publication 68 (ICRP, 1994a). In OIR Part 2 (ICRP, 2016), an fA value of 0.9 is used for all chemical forms of technetium in the workplace. (574) The same value of fA (0.9) is therefore adopted here for all chemical forms of rhenium.
32.2.3. Systemic distribution, retention, and excretion of rhenium
32.2.3.1. Biokinetic data
(575) Rhenium is a member of Group VIIA of the periodic table. It exhibits biokinetic properties close to those of the lighter Group VIIA element technetium, presumably due to the similar ionic radii as well as the similar chemical properties of rhenium and technetium (Deutsch et al., 1986; Dadachova et al., 2002; Zuckier et al., 2004). Rhenium and technetium have similar coordination chemistry, often resulting in isostructural rhenium and technetium complexes. These two elements presumably become covalently bound with oxide ions to form the structurally similar anions perrhenate (ReO4−) and pertechnetate (TcO4−) in the body. These anions have medical applications as physiological analogues of iodide (Dadachova et al., 2002).
32.2.3.2. Biokinetic model for systemic rhenium
(576) The systemic biokinetic model applied in the OIR series to technetium is also applied to rhenium. The model structure is shown in Fig. 32.1. Transfer coefficients are listed in Table 32.3. Transfer coefficients in the biokinetic model for systemic rhenium. Kidneys 1 and Kidneys 2 correspond to kidney compartments ‘Urinary path’ and ‘Other tissue’, respectively, in Figure 32.1. ST, soft tissue. ST0, ST1, and ST2 are compartments of other soft tissues with fast, intermediate, and slow turnover, respectively. Structure of the biokinetic model for systemic rhenium. St, stomach; SI, small intestine; RC, right colon; LC, left colon; RS, rectosigmoid. ST, soft tissue. ST0, ST1, and ST2 are compartments of other soft tissues with fast, intermediate, and slow turnover, respectively.


32.2.3.3. Treatment of progeny
(577) Progeny of rhenium isotopes addressed in this publication are radioisotopes of tungsten, tantalum, rhenium, and osmium. The model for rhenium as a parent is applied to rhenium produced by decay of another rhenium isotope. The models for tungsten, tantalum, and osmium as rhenium progeny are their characteristic models with added compartments and associated transfer coefficients needed to solve the linked biokinetic models for chains headed by rhenium (see Annex B). If produced in an ambiguous compartment (i.e. a compartment contained in the model for a preceding chain member but not contained in the progeny’s characteristic model), the progeny is assumed to transfer at a specified rate to the central blood compartment of its characteristic biokinetic model, and to follow that model thereafter. The following transfer rates to the central blood compartment are assigned to tungsten, tantalum, or osmium produced in an ambiguous compartment: 1000 d−1 if produced in a blood compartment; and at the following element-specific rates if produced in any other ambiguous compartment: tungsten, 8.32 d−1; tantalum, 1.39 d−1; and osmium, 0.09902 d−1.
32.3. Individual monitoring
32.3.1. 186Re
(578) Measurements of 186Re may be performed by in-vivo whole-body measurement technique and by gamma measurement in urine.
32.3.2. 188Re
(579) Measurements of 188Re may be performed by in-vivo whole-body measurement technique and by gamma measurement in urine. Measurements of 188Re in urine may be used to determine intakes of the radionuclide.
32.4. Dosimetric data for rhenium
33. Osmium (Z = 76)
33.1. Isotopes
33.2. Routes of intake
33.2.1. Inhalation
(580) For osmium, default parameter values were adopted on absorption to blood from the respiratory tract (ICRP, 2015). Absorption parameter values and types, and associated fA values for particulate forms of osmium are given in Table 33.2. Monitoring techniques for 186Re. Measurement system comprised of germanium detectors. Counting time of 20 min. Monitoring techniques for 188Re. Measurement system comprised of germanium detectors. Counting time of 20 min. Committed effective dose coefficients (Sv Bq−1) for the inhalation or ingestion of 186Re and 188Re compounds. AMAD, activity median aerodynamic diameter. Dose per activity content of 186Re in total body and in daily excretion of urine (Sv Bq−1); 5 µm activity median aerodynamic diameter aerosols inhaled by a reference worker at light work. N/A, not applicable. Dose per activity content of 188Re in total body and in daily excretion of urine (Sv Bq−1); 5 µm activity median aerodynamic diameter aerosols inhaled by a reference worker at light work. N/A, not applicable. Isotopes of osmium addressed in this publication. EC, electron-capture decay; B+, beta-plus decay; B−, beta-minus decay; IT, isomeric transition decay; A, alpha decay. Dose coefficients and bioassay data for this radionuclide are given in the printed copy of this publication. Data for other radionuclides listed in this table are given in the online electronic files on the ICRP website. Absorption parameter values for inhaled and ingested osmium. It is assumed that the bound state can be neglected for osmium (i.e. fb = 0). The values of sr for Type F, M, and S forms of osmium (30, 3, and 3 d−1, respectively) are the general default values. For inhaled material deposited in the respiratory tract and subsequently cleared by particle transport to the alimentary tract, the default fA values for inhaled materials are applied [i.e. the product of fr for the absorption type and the fA value for ingested soluble forms of osmium (0.01)]. Default Type M is recommended for use in the absence of specific information on which the exposure material can be assigned to an absorption type (e.g. if the form is unknown, or if the form is known but there is no information available on the absorption of that form from the respiratory tract). For guidance on the use of specific information, see Section 1.1. Activity transferred from systemic compartments into segments of the alimentary tract is assumed to be subject to reabsorption to blood. The default absorption fraction fA for the secreted activity is the highest value for any form of the radionuclide (fA = 0.01).
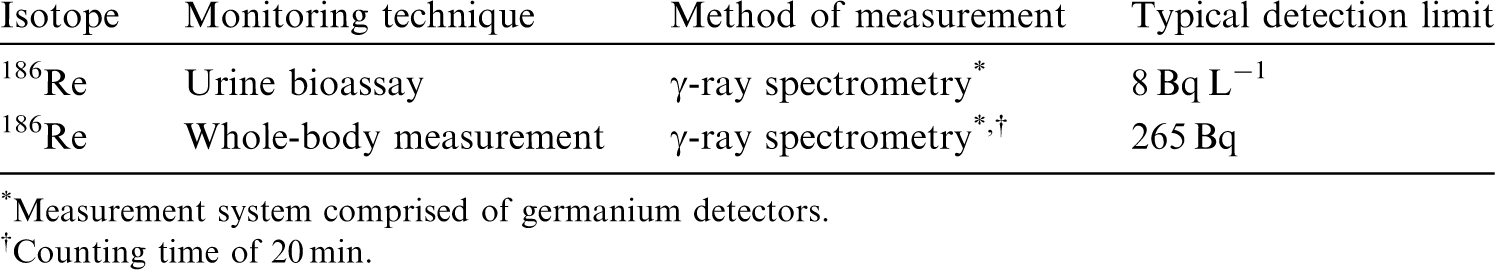
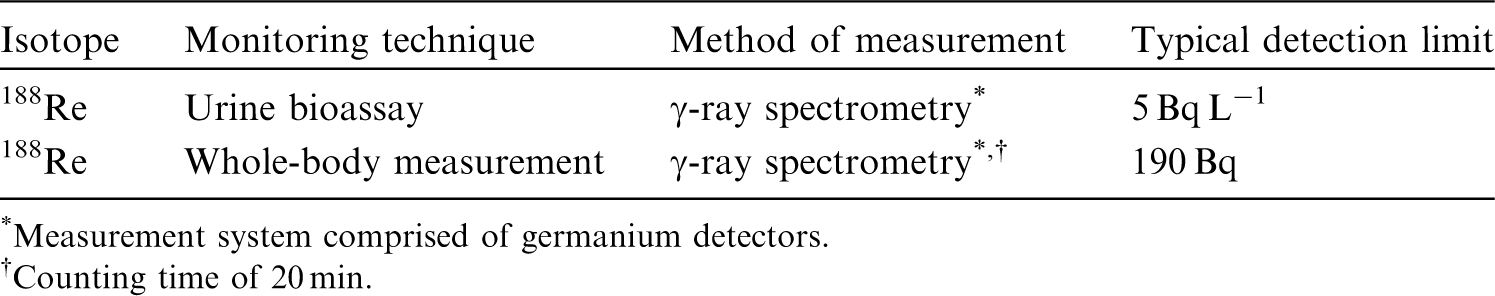
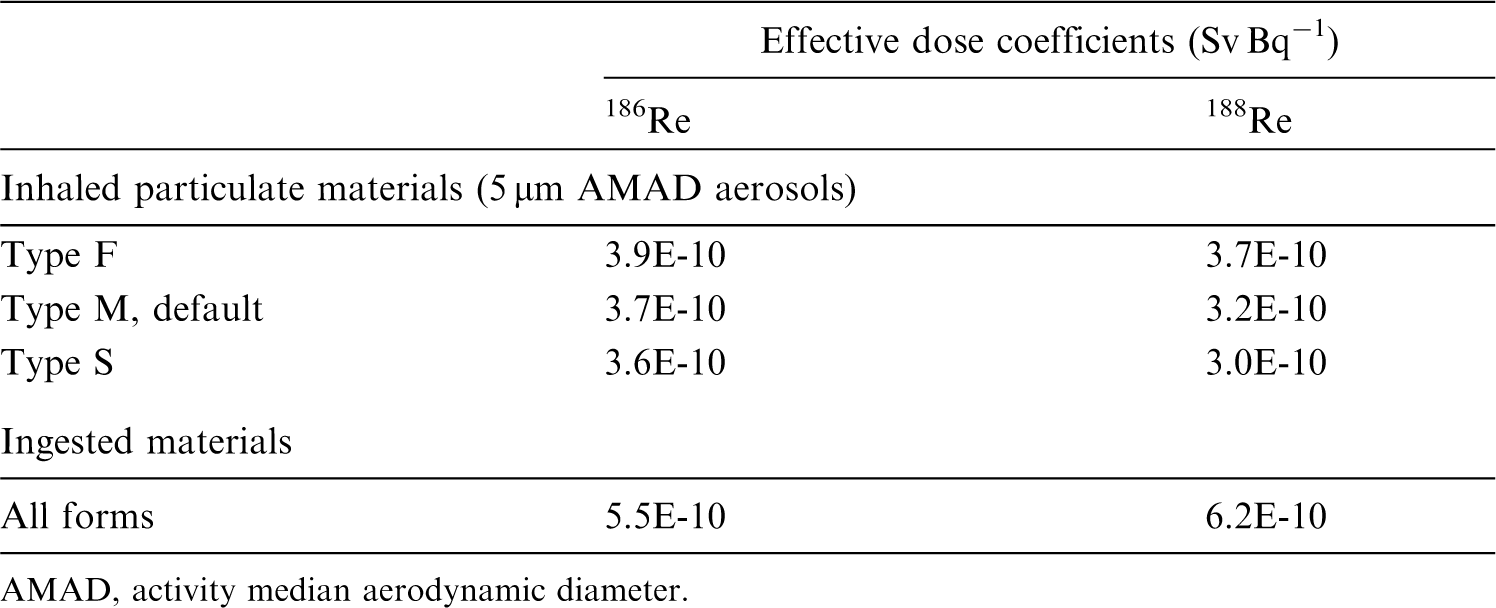
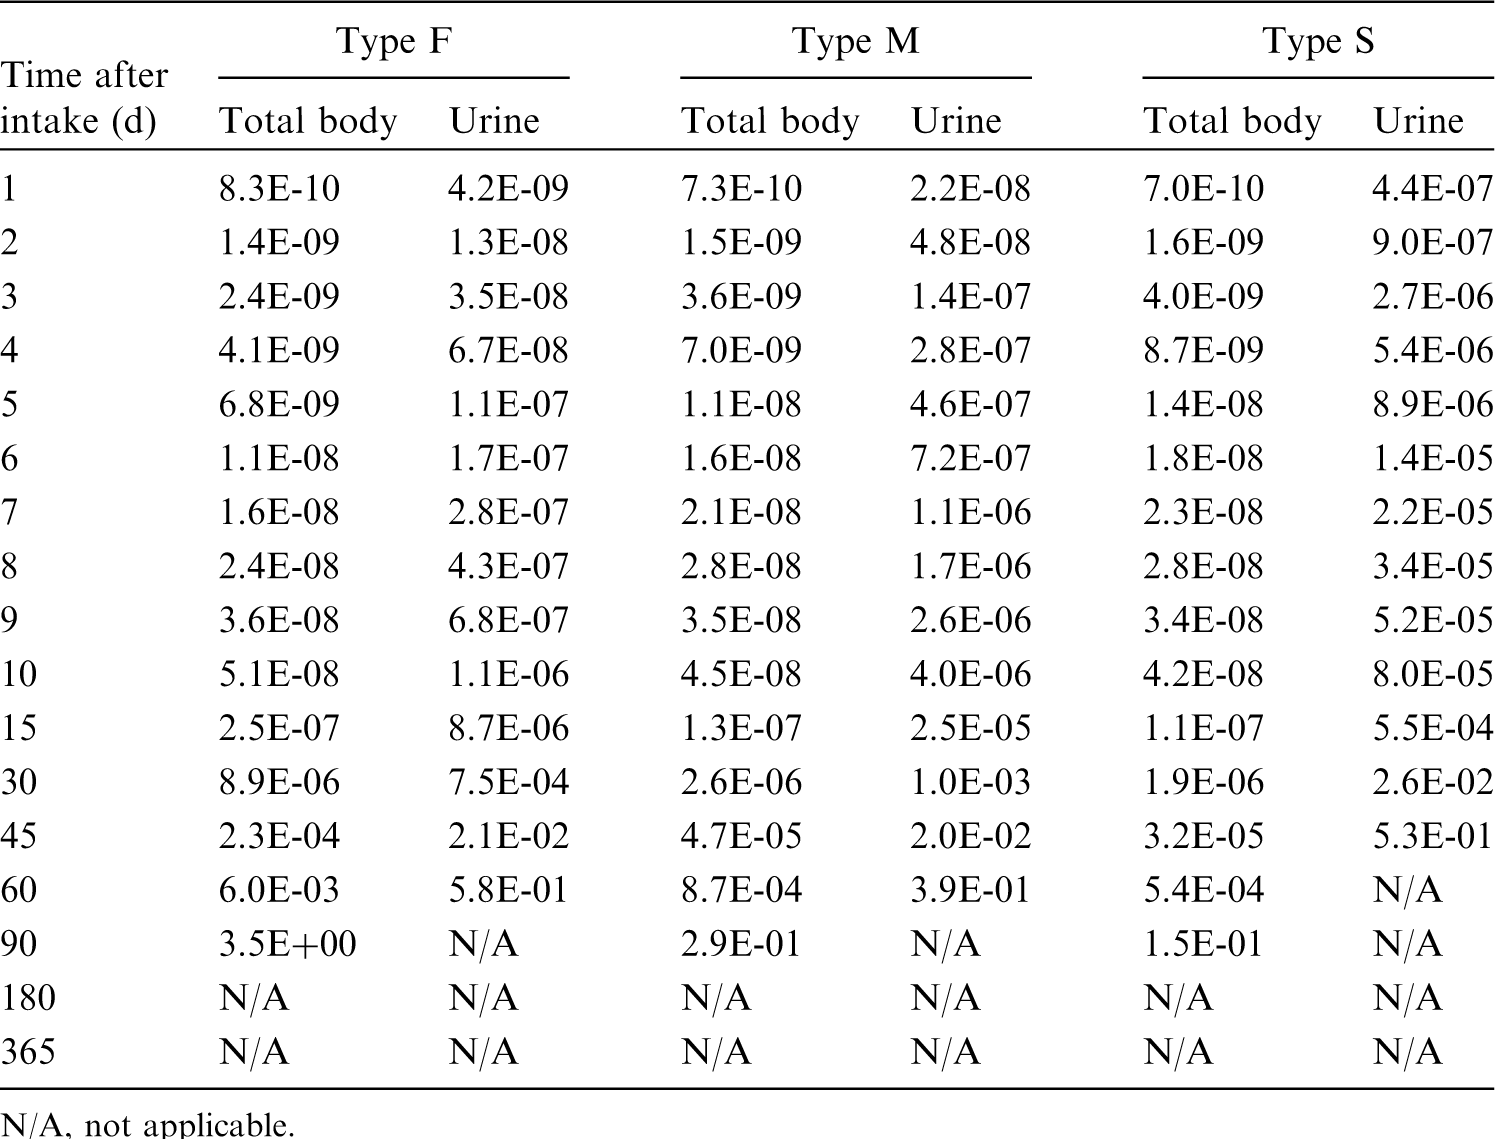


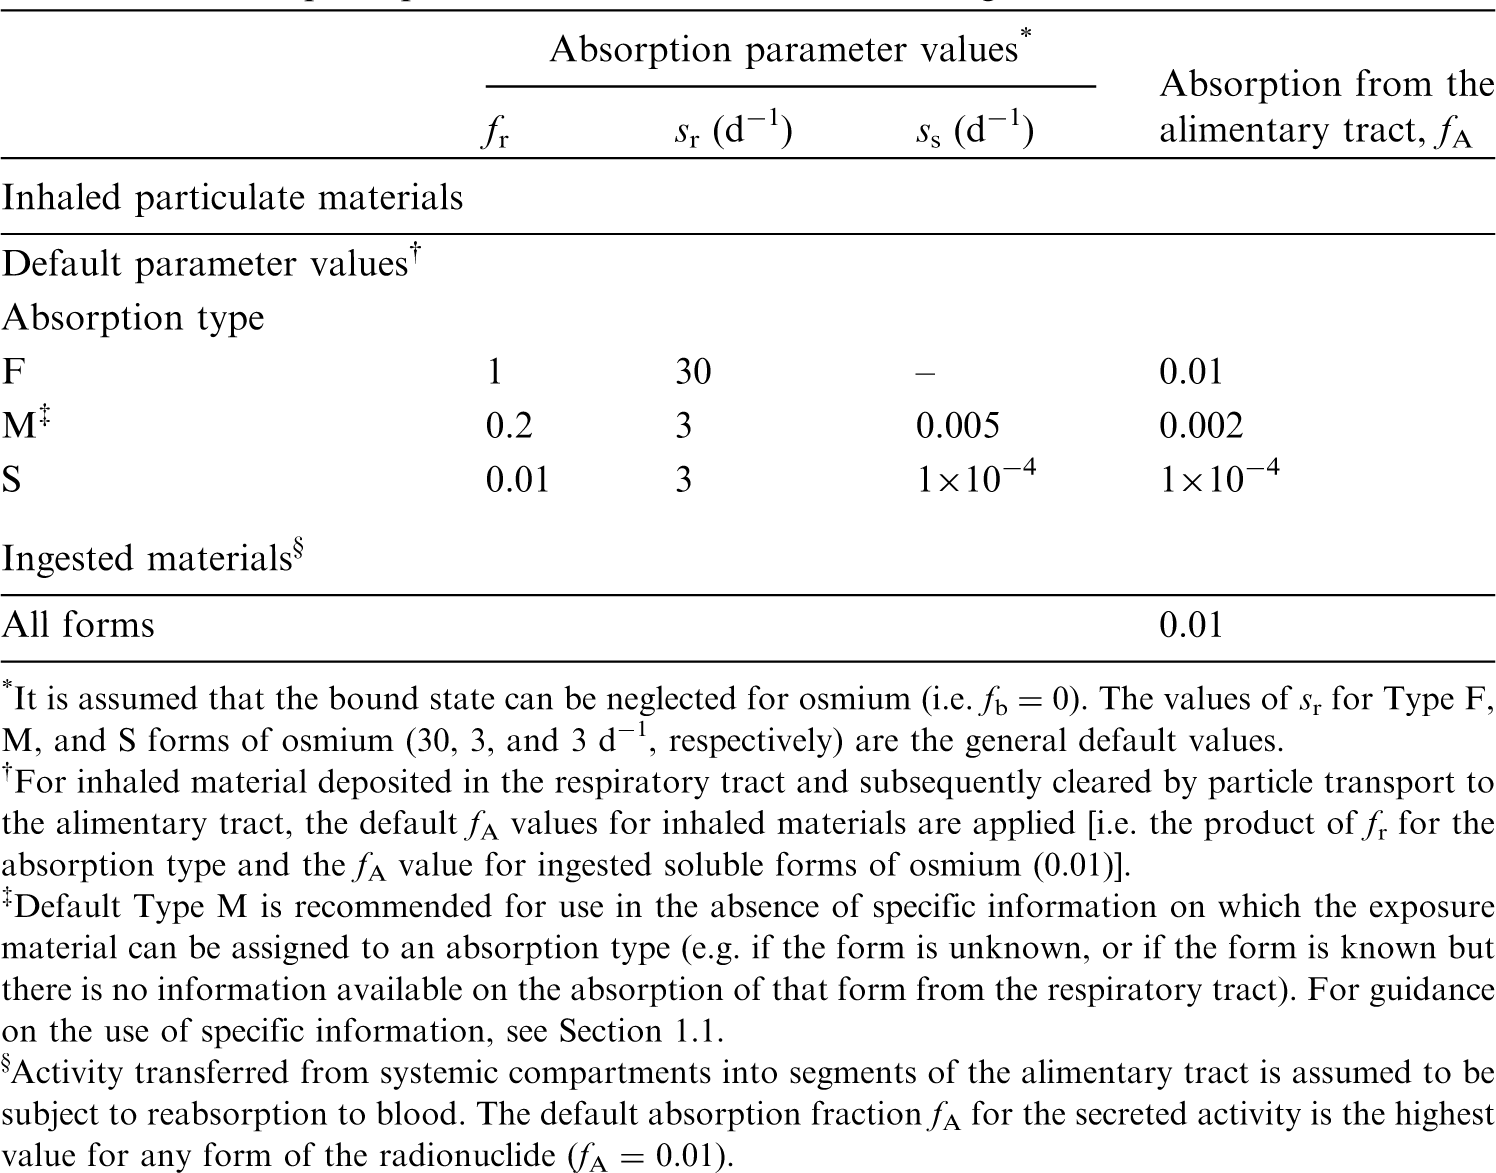
33.2.2. Ingestion
(581) In Publication 30 (ICRP, 1980), as there appeared to be no information available concerning the uptake of osmium from the gastrointestinal tract, a fractional absorption value of 0.01 was recommended for all chemical forms of osmium based on the chemical analogy with iridium. This value was also adopted in Publication 68 (ICRP, 1994a). In OIR Part 3 (ICRP, 2017), the value of fA = 0.01 was confirmed for all chemical forms of iridium. (582) Rodushkin et al. (2011) investigated osmium retention in 22 bank voles trapped in north-easter Sweden. They observed whole-body concentrations of up to ∼7 pg g−1, with the highest concentration seen in kidney tissue, correlated with proximity of a steelworks and with lichen osmium concentration, ∼104 times higher than in voles at the location of animal sampling. However, the available data are not sufficient to quantify the gastrointestinal absorption of osmium. (583) The same value of fA (0.01) as in Publications 30 and 68 (ICRP, 1981, 1994a) is therefore adopted here for all chemical forms of osmium.
33.2.3. Systemic distribution, retention, and excretion of osmium
33.2.3.1. Biokinetic data
(584) Osmium is a member of the platinum group, which comprises six chemically similar elements generally found together in ores: platinum, iridium, ruthenium, rhodium, palladium, and osmium. Biokinetic studies on rodents indicate broadly similar systemic behaviour across the platinum group following administration of relatively soluble forms (Durbin et al., 1957; Durbin, 1959; Moore et al., 1975a,b,c; Weininger et al., 1990; Jamre et al., 2011). (585) Highest concentrations of systemic osmium in rodents are typically seen in the kidneys and liver (Durbin et al., 1957; Durbin, 1959; Weininger et al., 1990; Jamre et al., 2011). Excretion is primarily in urine. The systemic distribution of osmium at 1 d after intravenous injection closely resembled that of platinum (Durbin et al., 1957; Durbin, 1959). (586) Weininger et al. (1990) investigated the influence of the pH of the injection solution on the systemic behaviour of the 191Os impurity in 191Os/191mIr generator eluates. Groups of mice were intravenously injected with 191Os in one of four pH adjustment agents: phosphate, NaOH, lysine, or succinate. Retention was followed for 26 d in three of the groups, but only 11 d in the group receiving 191Os in the lysine buffer because of the fast body clearance in this case. Total-body retention curves for the NaOH (pH 4.5) and phosphate (pH 5.1) groups were similar to one another, and to the retention pattern observed over a similar time period by Moore et al. (1975a,b,c) for systemic platinum in rats. Retention in the NaOH and phosphate groups was approximately twice that in the succinate group (pH 4.5), and more than three times that in the lysine group (pH 8.7) throughout common observation periods. The systemic distributions of 191Os at 23 d were similar for the NaOH and succinate groups, with ∼35% of total-body activity contained in bone, 25% in muscle, 20% in the liver, and 2.5% in the kidneys. For the phosphate group, nearly half of the activity retained at 23 d was found in blood, 9% in bone, 8% in muscle, 12% in the liver, 2% in the kidneys, and 14% in the spleen. In the lysine group, ∼9% of the retained activity was in bone, 30% in muscle, 19% in the liver, 13% in the kidneys, and 24% in the stomach and gut. These results indicate that the systemic kinetics of 191Os depend on characteristics of the injection solution but not necessarily on pH alone, as different retention curves were seen for two agents with the same pH.
33.2.3.2. Biokinetic model for systemic osmium
(587) The systemic behaviour of osmium is assumed to be the same as that of the more frequently studied element platinum, in view of similarities in available comparative systemic data for these elements. The structure of the common biokinetic model for systemic platinum is shown in Fig. 33.1. The common set of transfer coefficients is listed in Table 33.3. Transfer coefficients in the biokinetic model for systemic osmium. ST, soft tissue. ST0, ST1, and ST2 are compartments of other soft tissues with fast, intermediate, and slow turnover, respectively. Daily excretion of 186Re following inhalation of 1 Bq Type F. Daily excretion of 186Re following inhalation of 1 Bq Type M. Daily excretion of 186Re following inhalation of 1 Bq Type S. Daily excretion of 188Re following inhalation of 1 Bq Type F. Daily excretion of 188Re following inhalation of 1 Bq Type M. Daily excretion of 188Re following inhalation of 1 Bq Type S. Structure of the biokinetic model for systemic osmium. SI, small intestine.


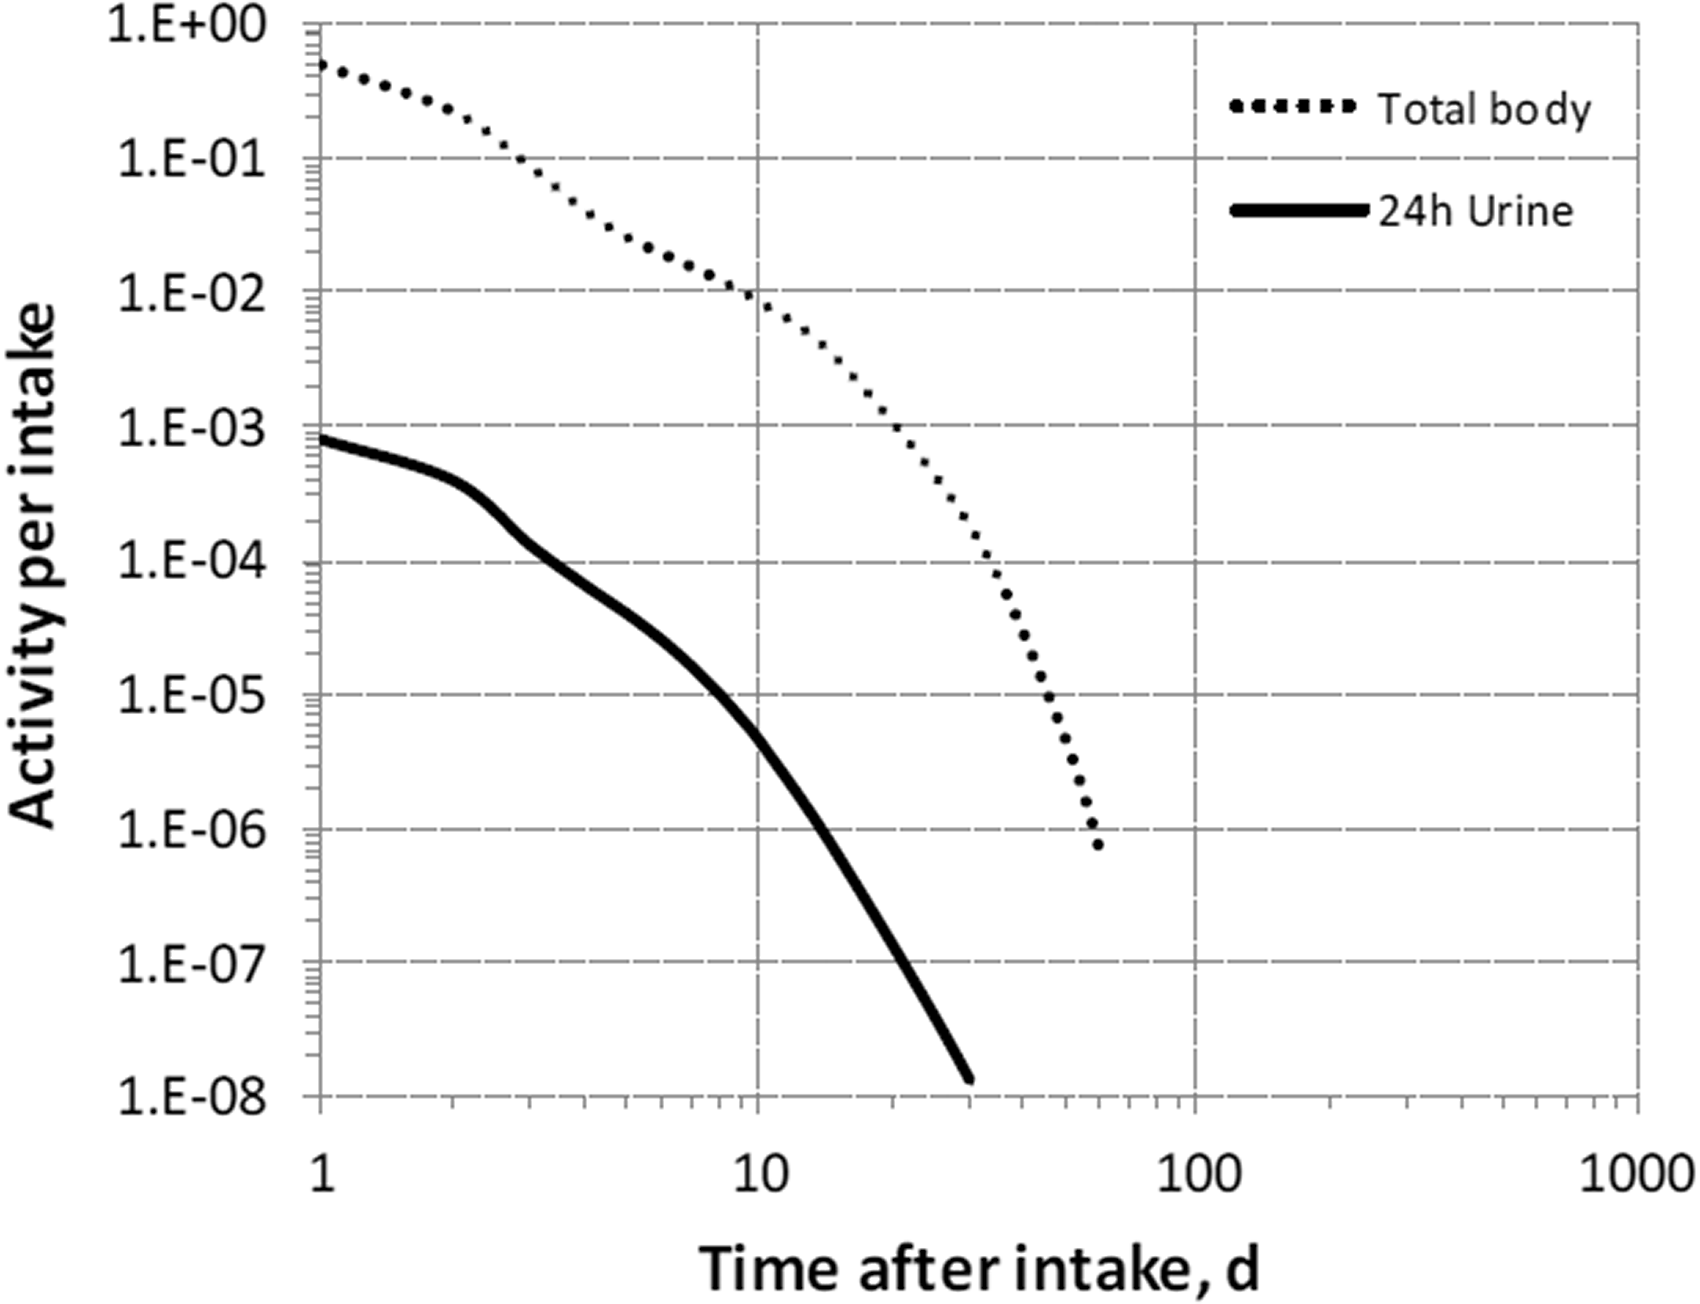


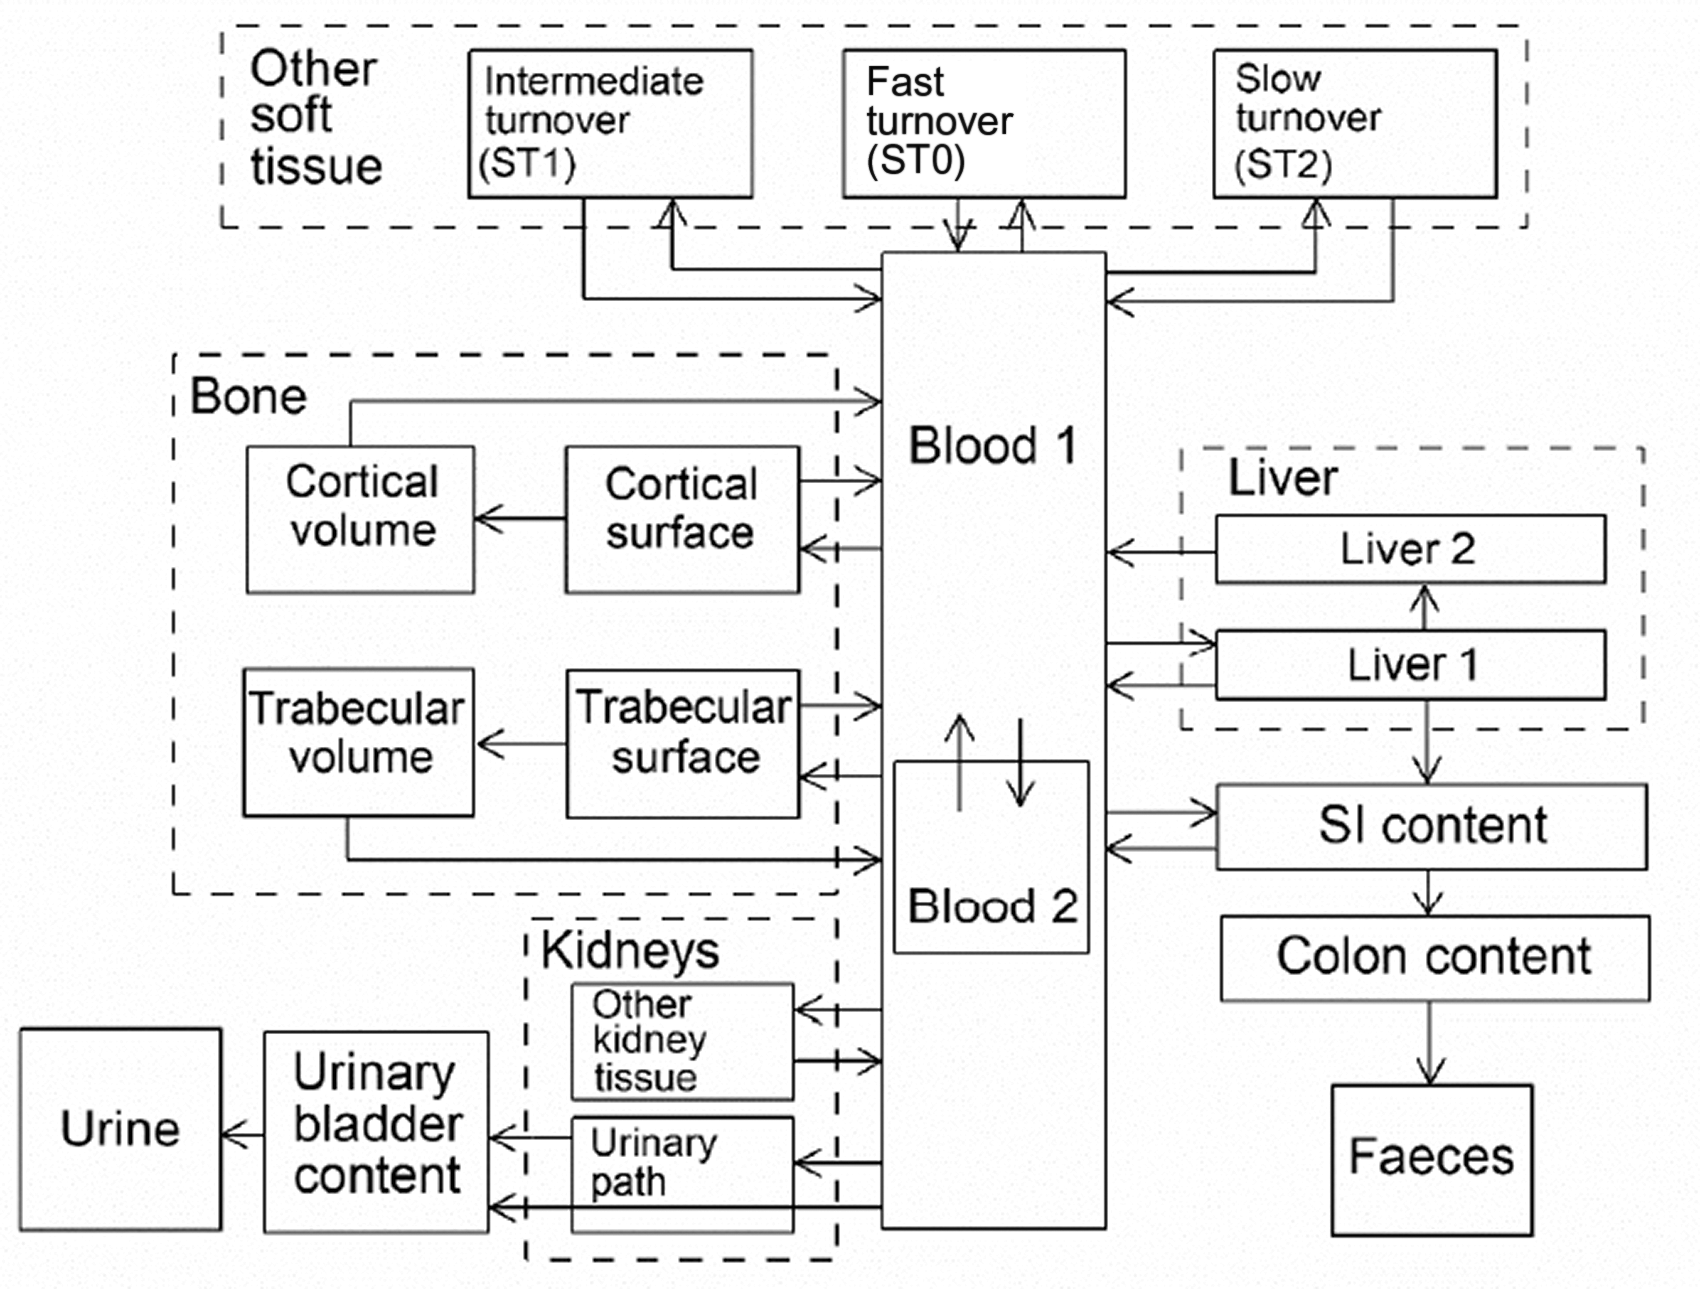
33.2.3.3. Treatment of progeny
(588) Progeny of osmium addressed in this publication are isotopes of osmium, rhenium, tungsten, and iridium. The characteristic models for osmium and iridium are applied without change to these elements as progeny of osmium. The models for rhenium and tungsten as progeny of osmium are expansions of the characteristic models for these elements used in this publication, with added compartments and associated transfer coefficients needed to solve the linked biokinetic models for chains headed by osmium (see Annex B). If produced in an ambiguous compartment (i.e. a compartment not explicitly named in the model for rhenium or tungsten), the progeny is assumed to transfer at a specified rate to the central blood compartment of its characteristic biokinetic model, and to follow that model thereafter. The following transfer rates to the central blood compartment are assigned to rhenium or tungsten produced in an ambiguous compartment: 1000 d−1 if produced in a blood compartment; at the rate of bone turnover if produced in a bone volume compartment; and at the following element-specific rates if produced in any other ambiguous compartment: rhenium, 0.462 d−1; and tungsten, 8.32 d−1.
33.3. Individual monitoring
(589) Information regarding the detection limit for routine individual measurement is not available.
33.4. Dosimetric data for osmium
34. Platinum (Z = 78)
34.1. Isotopes
34.2. Routes of intake
34.2.1. Inhalation
(590) For platinum, default parameter values were adopted on absorption to blood from the respiratory tract (ICRP, 2015). Absorption parameter values and types, and associated fA values for particulate forms of platinum are given in Table 34.2. Committed effective dose coefficients (Sv Bq−1) for the inhalation or ingestion of 194Os compounds. AMAD, activity median aerodynamic diameter. Isotopes of platinum addressed in this publication. EC, electron-capture decay; B+, beta-plus decay; B−, beta-minus decay; IT, isomeric transition decay; A, alpha decay. Dose coefficients and bioassay data for this radionuclide are given in the printed copy of this publication. Data for other radionuclides listed in this table are given in the online electronic files on the ICRP website. Absorption parameter values for inhaled and ingested platinum. It is assumed that the bound state can be neglected for platinum (i.e. fb = 0). The values of sr for Type F, M, and S forms of platinum (30, 3, and 3 d−1, respectively) are the general default values. For inhaled material deposited in the respiratory tract and subsequently cleared by particle transport to the alimentary tract, the default fA values for inhaled materials are applied [i.e. the product of fr for the absorption type and the fA value for ingested soluble forms of platinum (0.01)]. Default Type M is recommended for use in the absence of specific information on which the exposure material can be assigned to an absorption type (e.g. if the form is unknown, or if the form is known but there is no information available on the absorption of that form from the respiratory tract). For guidance on the use of specific information, see Section 1.1. Activity transferred from systemic compartments into segments of the alimentary tract is assumed to be subject to reabsorption to blood. The default absorption fraction fA for the secreted activity is the highest value for any form of the radionuclide (fA = 0.01).


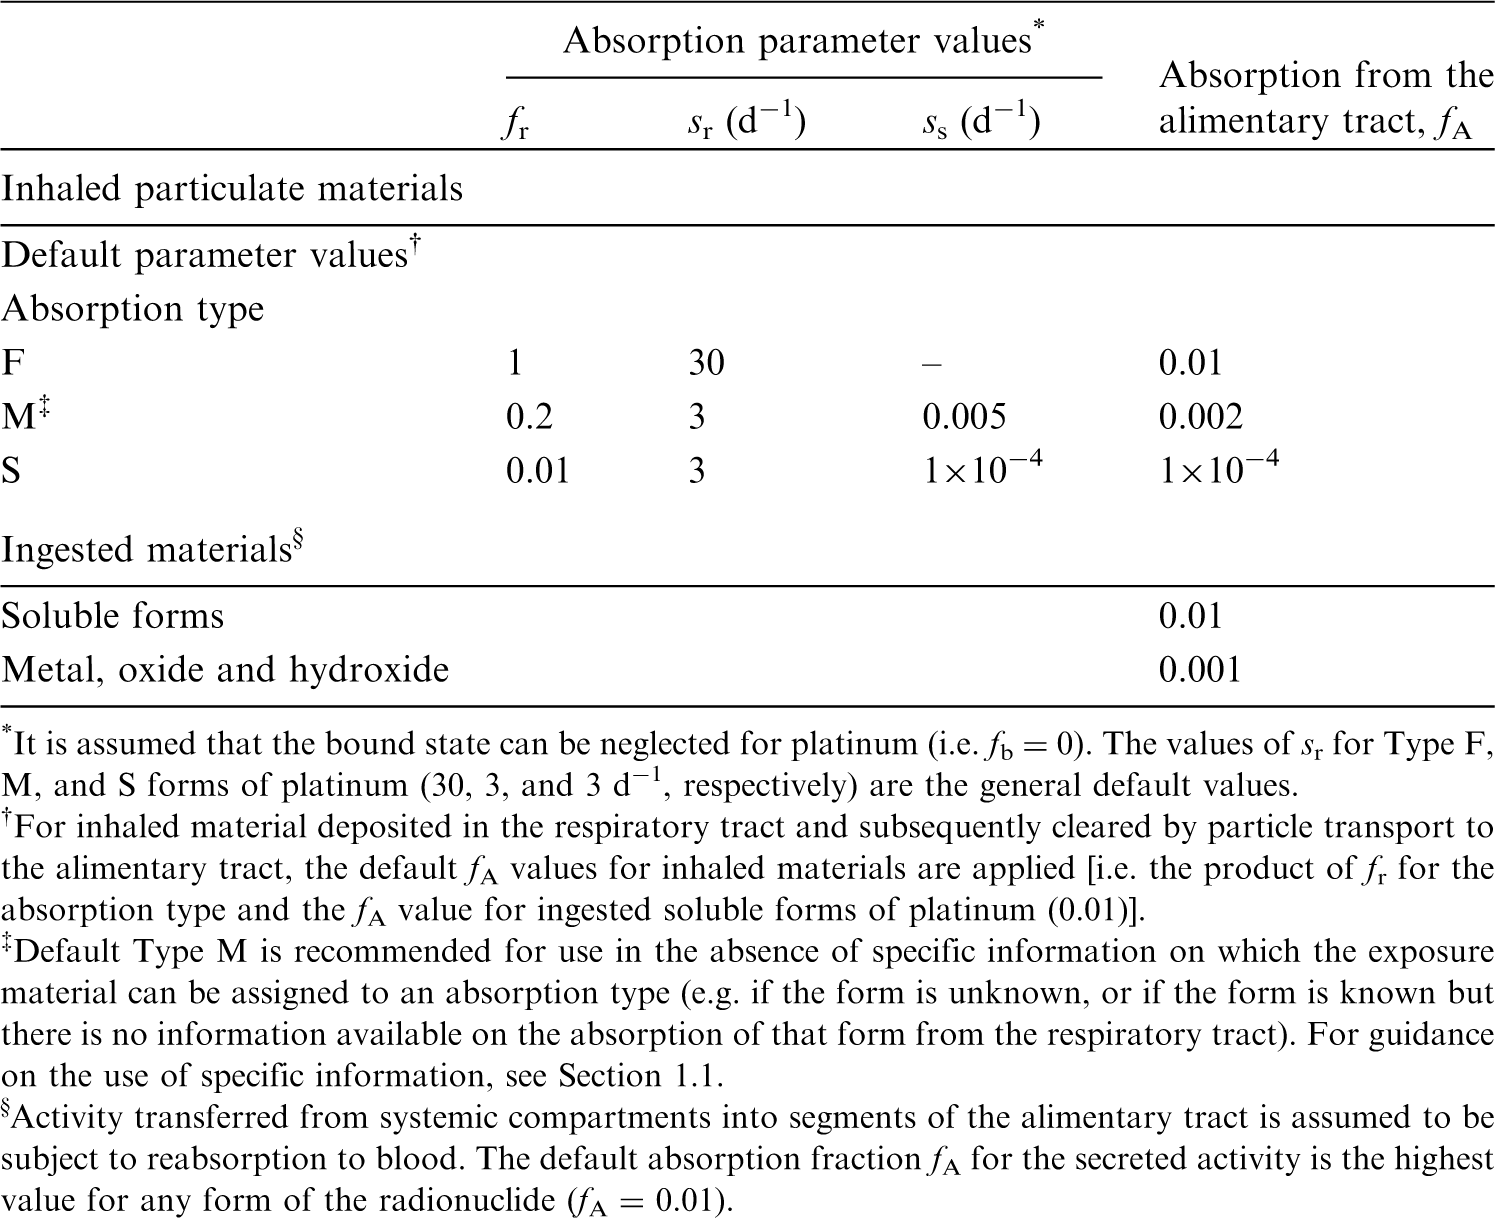
34.2.2. Ingestion
34.2.2.1. Animal studies of soluble platinum
(591) In Publication 30 (ICRP, 1981), a fractional absorption value of 0.01 was recommended for all chemical forms of platinum based on the animal studies by Moore et al. (1975) and Holbrook et al. (1975). This value was also adopted in Publication 68 (ICRP, 1994a). (592) Lown et al. (1980) analysed the systemic distribution of platinum after intragastric administration of the sulphate to adult male mice, and found their results to be consistent with those of Moore et al. (1975). Hirunuma et al. (1997) and Yanaga et al. (1996) studied the uptake, retention, and excretion of several elements including platinum, considered to be in anionic form. The multi-tracer experiment involved oral administration to 12 adult rats and monitoring of organ retention, and urine and faecal excretion for 6 d after administration. Ninety-eight percent of the platinum dose was excreted into faeces and 1.4% into urine, the remainder being found in the kidneys, liver, intestine and skeletal muscle. These results indicate gastrointestinal absorption of ∼0.02.
34.2.2.2. Experimental studies of platinum in vehicle exhaust catalysts
(593) Automobile exhaust catalytic converters emit fine platinum-bearing particles. Platinum is initially in the metallic and oxide forms. After dispersion in road dust, water, sediments, or vegetation, it may interact with environmental ligands, be transformed into more soluble species, and eventually enter the food chain. To simulate the behaviour of exhaust particles, Artelt et al. (1998, 1999) investigated the bioavailability of metallic platinum attached to aluminium oxide particles of diameter <5 µm. Platinum showed solubility of 10% in a physiological sodium chloride solution. Oral administration to eight rats resulted in gastrointestinal absorption of ∼0.1% of platinum intake as estimated from monitoring of urine and faeces over 8 d after administration. In an in-vitro dissolution study, Colombo et al. (2008) have estimated the bioavailability of platinum to be 16% from road dust, but only 0.01% from Pt(OH)2 hydroxide samples and 0.1% from an automobile catalyst powder. No strong influence of pH on dissolution was observed. In another study of dissolution of automobile catalysts in simulated human gastrointestinal tract medium, Turner and Price (2008) observed relatively small bioavailability of platinum of the order of a few percent. The availability of platinum appeared to be controlled by the rate of dissolution of metallic particles in the stomach, and by the kinetics of the formation and dissolution of inorganic compounds of the metal (chlorides or hydroxychlorides), and their organic complexes. (594) Consistent with the above findings, in the study by Holbrook et al. (1975), which did not involve vehicle exhausts, the organ retention of platinum was at least an order of magnitude lower after ingestion of platinum dioxide than after ingestion of platinum chloride or sulphate.
34.2.2.3. Monitoring of population exposure
(595) The level of incorporated platinum in human populations due to dental alloys, environmental exposure, or occupational exposure was investigated in bioassay studies providing qualitative indication on platinum absorption: Begerow et al. (1999a) measured higher levels of platinum in urine of 27 dental technicians than in urine of 17 road construction workers and 17 school leavers, indicating occupational internal exposure from treatment of dental alloys. Enhanced urinary platinum concentrations (>20 ng g−1) and long-term excretions were observed for persons with dental gold alloys (Begerow et al., 1999b). Relatively high platinum concentrations were found in the urine of occupationally exposed persons (Ensslin et al., 1997; Nygren and Lundgren, 1997) and of school children residing in areas with high traffic density (Caroli et al., 2001). Becker et al. (2003) studied the levels of environmental pollutants in the urine of the German population, and found a clear influence of the number of dental inlays, crowns, and bridge elements on the mean levels of platinum in urine. (596) The same value of fA (0.01) is adopted here for soluble forms of platinum as in Publications 30 and 68 (ICRP, 1981, 1994a). A lower fA (0.001) is adopted for metallic, oxide, and hydroxide platinum compounds.
34.2.3. Systemic distribution, retention, and excretion of platinum
34.2.3.1. Biokinetic data
(597) The platinum group comprises six chemically similar elements generally found together in ores: platinum, iridium, ruthenium, rhodium, palladium, and osmium. Biokinetic studies on rodents indicate broadly similar biokinetics across the platinum group (Durbin et al., 1957; Durbin, 1959; Moore et al., 1975a; Weininger et al., 1990; Jamre et al., 2011). (598) The systemic behaviour of platinum has been studied in laboratory animals, mainly rats, and to some extent in human subjects (Durbin et al., 1957; Durbin, 1959; Lange et al., 1973; Smith and Taylor, 1974; Moore et al, 1975a,b,c; Yoakum et al., 1975; Litterst et al., 1976; Hirunuma et al., 1997). Platinum shows a high rate of urinary excretion in the early days after administration. Some, but not all, studies also indicate a relatively high rate of faecal excretion. Following intravenous administration of platinum isotopes as the chloride to rats, the highest concentrations were generally found in the kidneys, followed by the liver (Durbin et al., 1957; Moore et al., 1975a,b,c). At 1 month, the rats contained ∼10–15% of the intravenously injected activity. (599) The biokinetics of platinum has been studied in human subjects following administration of the antitumour agent cis-diamminedichloroplatinum (II) (DDP) (Lange et al., 1973; Smith and Taylor, 1974). The systemic behaviour of the platinum label resembled that of other forms of platinum administered to laboratory animals. Following intravenous administration of 195mPt-labelled DDP to two patients with cancer, ∼35% of the injected activity was excreted in urine during the first 3.5 d (Smith and Taylor, 1974). At most, a few percent of the activity was excreted in faeces during that time. Based on external measurements, the liver accumulated ∼10% of the injected activity during the first day. The estimated Tb values of the label in the liver and total body during days 1–7 were 8 d and 10 d, respectively. The study period was too short to determine any longer-term components of retention.
34.2.3.2. Biokinetic model for systemic platinum
(600) The structure of the biokinetic model for systemic platinum used in this publication is shown in Fig. 34.1. Transfer coefficients are listed in Table 34.3. The same model was applied earlier in the OIR series to platinum as a progeny of iridium. The model is a modification of the characteristic biokinetic model for ruthenium described in Publication 137 (ICRP, 2017). The ruthenium model was modified for application to platinum by shifting a portion of the deposition in bone and soft tissue compartments to the urinary bladder content and kidneys. The modifications are described in Section 8.2.3.3 of Publication 137 (ICRP, 2017). Transfer coefficients in the biokinetic model for systemic platinum. ST, soft tissue. ST0, ST1, and ST2 are compartments of other soft tissues with fast, intermediate, and slow turnover, respectively. Structure of the biokinetic model for systemic platinum. SI, small intestine.
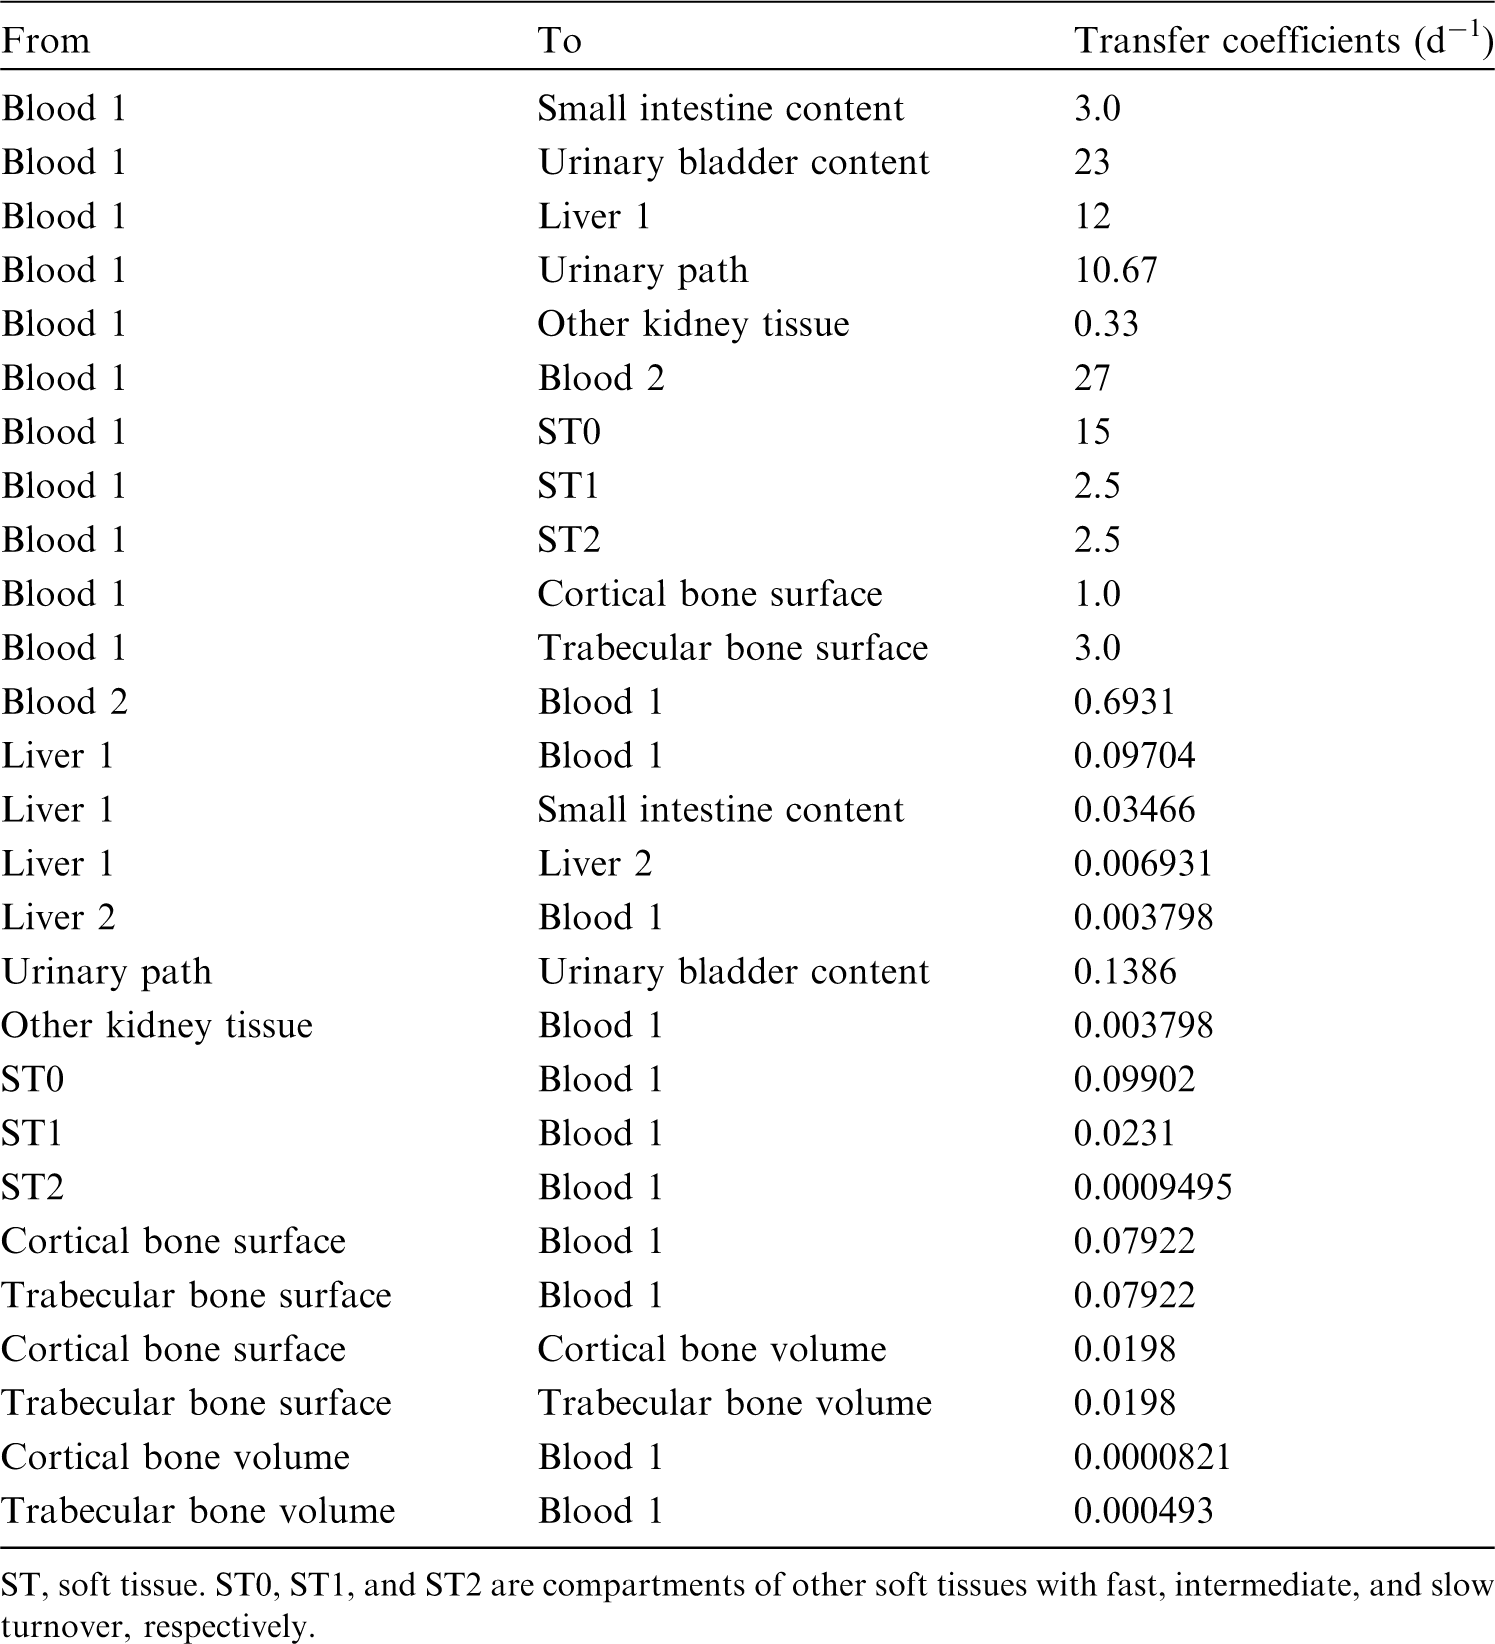

34.2.3.3. Treatment of progeny
(601) Progeny of platinum addressed in this publication are isotopes of platinum, rhenium, osmium, iridium, and gold. The characteristic models for platinum, osmium, and iridium used in this publication are applied to these elements as progeny of platinum. The models for rhenium and gold as progeny of platinum are expansions of the characteristic models for these elements with added compartments and associated transfer coefficients needed to solve the linked biokinetic models for chains headed by platinum (see Annex B). The following transfer rates to the central blood compartment are assigned to rhenium or gold produced in an ambiguous compartment (i.e. a compartment of a preceding chain member that is not a compartment in the characteristic model for the progeny: 1000 d−1 if produced in a blood compartment; at the rate of bone turnover if produced in a bone volume compartment; and at the following element-specific rates if produced in any other ambiguous compartment: rhenium, 0.462 d−1; and gold, 0.0693 d−1).
34.3. Individual monitoring
(602) Information regarding the detection limit for routine individual measurement is not available.
34.4. Dosimetric data for platinum
35. Gold (Z = 79)
35.1. Isotopes
35.2. Routes of intake
35.2.1. Inhalation
(603) The ICRP Task Group on Lung Dynamics (1966) assigned oxides and hydroxides of gold to inhalation class Y, halides and nitrates to inhalation class W, and all other compounds of the element to inhalation class D. In the absence of any relevant experimental data, this classification was adopted by ICRP in Publication 30 (ICRP, 1980). (604) No information was found on the behaviour of inhaled gold in human subjects following accidental intake. The only in-vivo experimental information found on the behaviour of gold following deposition of any soluble form in the respiratory tract was at a single time point in one experiment. Therefore, no estimates could be made of element-specific rapid dissolution rate or bound-state parameter values. (605) However, radioisotopes of gold have been used extensively to label relatively insoluble particles for experimental studies of particle deposition in, and transport from, the respiratory tract. The particle matrices include elemental gold, iron oxide, and Teflon (see below). Elemental gold has been used recently to investigate the behaviour of nanoparticles (particles with at least one dimension <100 nm) after deposition in the lungs. Following deposition of relatively insoluble radiolabelled particles in the lungs, two distinct clearance phases are usually observed: a fast phase (completed in approximately 1 d) and a much slower phase. On the assumption that these represent, respectively, the mucociliary clearance of particles deposited in the conducting tracheobronchial airways, and clearance of particles deposited in the alveolar region, measurements of lung retention for at least a few days after inhalation were used to assess regional deposition. 198Au, a readily available beta-gamma emitter with a half-life of 2.7 d, was often used for regional deposition, and short-term clearance, studies. While such use of the labelled particles showed them to be relatively insoluble for the purposes of the experiment, the short half-life means that measurements were of insufficient duration to distinguish between Type M and Type S behaviour, and no attempt to do so was made here. (606) A few experiments using 195Au (Tb 183 d) were of much longer duration and do provide information to assign the materials used to Type S. (607) Absorption parameter values and types, and associated fA values for particulate forms of gold are given in Table 35.2. Committed effective dose coefficients (Sv Bq−1) for the inhalation or ingestion of 193Pt compounds. AMAD, activity median aerodynamic diameter. Isotopes of gold addressed in this publication. EC, electron-capture decay; B+, beta-plus decay; B−, beta-minus decay; IT, isomeric transition decay. Dose coefficients and bioassay data for this radionuclide are given in the printed copy of this publication. Data for other radionuclides listed in this table are given in the online electronic files on the ICRP website. Absorption parameter values for inhaled and ingested gold. It is assumed that the bound state can be neglected for gold (i.e. fb = 0). The values of sr for Type F, M, and S forms of gold (30, 3, and 3 d−1, respectively) are the general default values. Materials (e.g. elemental gold) are listed here where there is sufficient information to assign to a default absorption type, but not to give specific parameter values (see text). ‡For inhaled material deposited in the respiratory tract and subsequently cleared by particle transport to the alimentary tract, the default fA values for inhaled materials are applied [i.e. the product of fr for the absorption type and the fA value for ingested soluble forms of gold (0.1)]. Default Type M is recommended for use in the absence of specific information on which the exposure material can be assigned to an absorption type; for example, if the form is unknown, or if the form is known but there is no information available on the absorption of that form from the respiratory tract. Activity transferred from systemic compartments into segments of the alimentary tract is assumed to be subject to reabsorption to blood. The default absorption fraction fA for the secreted activity is the highest value for any form of the radionuclide (fA = 0.1).
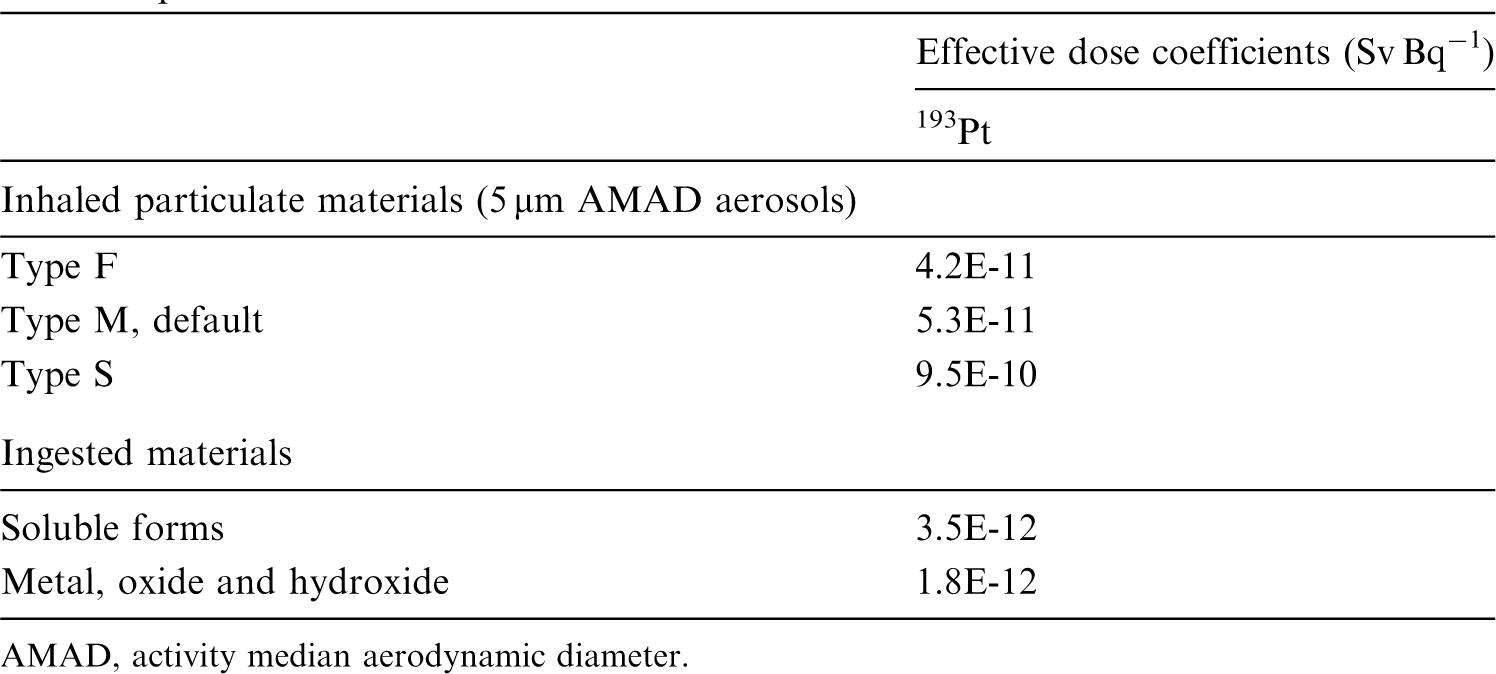

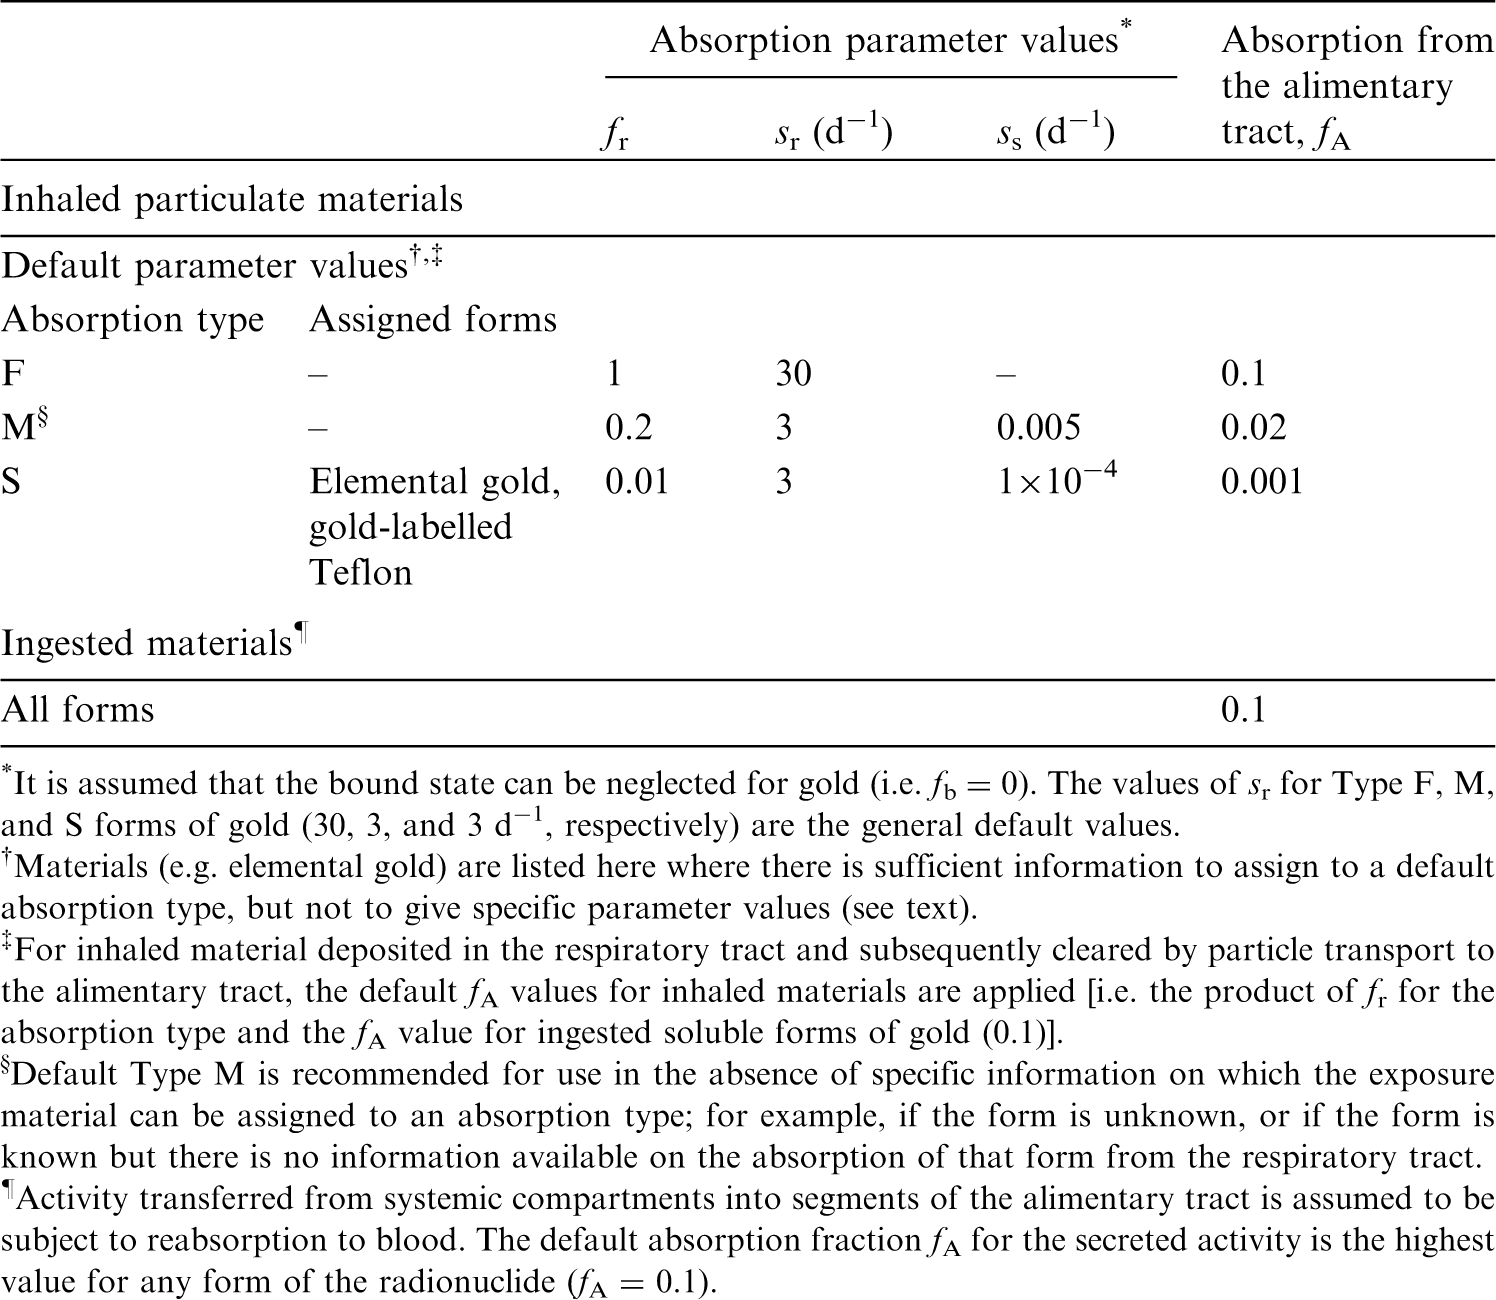
35.2.1.1. Particulate materials
(a) Ionic gold
(608) Kreyling et al. (2014) measured the tissue distribution and excretion of 198Au in rats 24 h after intratracheal instillation of 198Au-labelled soluble gold ions. Approximately 28% of ILD remained in the lungs. If lung retention followed a single exponential function, this result would give a biological half-time, Tb of ∼0.5 d, indicating a rate of absorption to blood of ∼1 d−1. (609) Bachler et al. (2015) measured the translocation across the epithelial tissue boundary of ionic gold for comparison with that of gold nanoparticles (see below). The gold was deposited from an aerosol on to the surface of a monolayer of alveolar epithelial cells in vitro. Translocation in 24 h was ∼75%, similar to that of the smallest particles (2-nm diameter) and much higher than that of the larger particles studied.
(b) Elemental gold
(610) Berg (1951) investigated the distribution of 198Au in dogs 3 d after injection of 198Au-labelled colloidal gold particles into the pleural cavity. Activity found outside the lungs was predominantly in the liver and spleen, and therefore may have transferred mainly in particulate form rather than in solution. (611) Bryant et al. (1953) and Berg et al. (1954) measured the uptake of 198Au-labelled colloidal gold (3–4-nm diameter) into the hilar lymph nodes of dogs for up to ∼30 d after instillation into the bronchial lumen, or injection into the submucosa of a bronchus. The uptake in other organs, including the spleen and liver, was very low, indicating that little 198Au entered the bloodstream. (612) Meneely et al. (1953) studied the tissue distribution of 198Au in dogs at times up to 15 d after intratracheal instillation of 198Au-labelled colloidal gold (∼0.05-µm diameter). They concluded that the low level of activity in the liver and spleen was evidence for a low rate of transfer of the colloid to blood. (613) Welsh and Welsh (1963) investigated uptake by cervical lymph nodes for 8 d following instillation of radiolabelled gold into the human larynx. (614) Gongora et al. (1973, 1974) followed lung retention of 198Au for up to ∼30 d after inhalation of 198Au-labelled gold particles (0.03 µm) by 20 healthy volunteers. Lung retention was fit by a two-component exponential function: the slow phase Tb ranged from 26 to 1000 d. (615) Takahashi et al. (1989) followed the lung retention and distribution of gold for 3 d after intratracheal instillation of stable colloidal gold particles [Count median diameter (CMD), 10 nm] into rats. (616) Patrick and Stirling (1992, 1994) administered 195Au-labelled colloidal gold particles (CMD 10–20 nm) to rats by micro-injection into subpleural alveoli to confine the initial deposition to alveolar tissue. They followed retention and distribution of 195Au for 462 d. Lung retention was well described by a two-component exponential function, with ∼22% of ILD clearing with Tb = 14 d and the rest with mean Tb = 583 d. Patrick and Stirling (1997a) carried out complementary experiments in which the biokinetics of 195Au in rats were followed for 7 d after instillation of a suspension of the particles into the stomach, and for 21 d after intravenous injection of 195Au-labelled gold chloride. Using the results, and measurements of excretion at times between 28 and 462 d, they assessed the rate of dissolution of the gold particles in the lungs to be between 5 × 10⁻⁵ and 4 × 10⁻⁴ d−1, giving assignment to Type S. (617) Patrick and Stirling (1997b) followed the lung retention and distribution of 195Au for 7 d after intratracheal instillation of 195Au-labelled colloidal gold particles (CMD 10–20 nm) into rats. (618) Takenaka et al. (2006) studied the distribution of ultrafine (5–8-nm diameter) stable gold particles for 7 d after inhalation by rats. Lung tissues and lavaged cells were examined by electron microscopy, and gold concentrations in the lungs, lavage fluid, and blood were measured. Only a little particle translocation to the systemic circulation took place. (619) Smith et al. (2007, 2008) followed lung retention of 198Au-labelled gold particles for up to ∼10 d after inhalation by volunteers as an aerosol bolus at the end of each breath to minimise alveolar deposition. The aim of the study was to investigate the effect of particle diameter on clearance from the bronchial tree. The volunteers also inhaled 111In-labelled polystyrene particles with the same aerodynamic diameter, dae (5 µm and 8 µm in the two studies), but larger physical diameter because polystyrene has much lower density than gold. Some subjects provided 24-h urine samples, which were used to confirm that there was no significant leaching of the radiolabels from the particles. (620) Semmler-Behnke et al. (2008) measured the tissue distribution of 198Au in rats 24 h after intratracheal instillation of an aqueous suspension of 198Au-labelled 18-nm- or 1.4-nm-diameter gold nanoparticles. For the 18-nm nanoparticles, 99.8% of the retained 198Au was in the lungs, but for the 1.4-nm nanoparticles, 91.5% was in the lungs and the rest was widely distributed through the body. Complementary experiments were conducted in which the nanoparticles were administered by instillation into the oesophagus or by intravenous injection. There was minimal absorption from the alimentary tract. The distributions were different after intravenous injection: notably the amounts retained in the liver were 94% for the 18-nm nanoparticles and 48% for the 1.4-nm nanoparticles. (621) Balasubramanian et al. (2013) measured the tissue distribution of (stable) gold in rats 2 d after inhalation (whole body 6 h d−1, 5 d week−1 for 3 weeks) of agglomerates (∼45-nm diameter) of primary gold nanoparticles with diameter of 7 nm or 20 nm. Faeces and urine were collected at times during the exposure period. The authors assessed that the ratio of gold detected in the blood and secondary target organs to that in the lungs was 1.4% and 0.2%, respectively, after inhalation of agglomerates of 7-nm and 20-nm gold nanoparticles. There were also differences in tissue distributions between the two primary particle sizes. (622) Schleh et al. (2013) measured the tissue distribution of 195Au in mice immediately after inhalation of 195Au-labelled 20-nm-diameter gold nanoparticles. The aerosol was inhaled via an intratracheal cannula by mice that were anaesthetised and artificially ventilated. The authors assessed that 1.2 ± 0.5% (mean ± standard error of the mean) of ILD translocated across the air–blood barrier. (623) Kreyling et al. (2014) measured the tissue distribution of 198Au in rats 1, 3, and 24 h after intratracheal instillation of 198Au-labelled monodisperse nanoparticles: negatively charged 1.4-, 2.8-, 5-, 18-, 80-, and 200-nm-diameter nanoparticles; and positively charged 2.8-nm diameter nanoparticles. For the negatively charged nanoparticles, assessed translocation across the air–blood barrier was ∼7% for 1.4-nm nanoparticles [similar to that observed by Semmler-Behnke et al. (2008)]; ∼2% for 2.8-nm nanoparticles; and <1% for the larger particles. Kreyling et al. (2014) concluded that translocation was inversely proportional to the gold nanoparticle core diameter between 1.4 nm and 80 nm. However, for the 200-nm particles, it was higher than predicted by this relationship, and similar to that of the 5-nm nanoparticles. Translocation of the positively charged 2.8-nm nanoparticles was significantly lower than that of the negatively charged 2.8-nm nanoparticles. Tissue distributions of translocated 198Au did not vary significantly with core diameter, but urinary excretion increased with decreasing size. (624) Han et al. (2015) measured the tissue distribution of stable gold in rats 1, 3 and 28 d after inhalation (6 h d−1 for 5 d) of 13-nm or 105-nm gold nanoparticles. Transfer of the smaller particles from the lungs to other organs was significantly higher than that of the larger particles, but tissue concentrations were low: <1% of that in the lungs. (625) Bachler et al. (2015) measured translocation across the epithelial tissue boundary of gold nanoparticles (2-, 7-, 18-, 46-, or 80-nm diameter) deposited (from an aerosol) on to the surface of a monolayer of alveolar epithelial cells in vitro. Translocation in 24 h was much higher for the 2-nm particles (∼60%) and 7-nm particles (∼10%) than for the larger particles (∼2%). The translocation fraction for ionic gold (see above) was 75%. (626) Miller et al. (2017) measured (stable) gold in the blood and urine of volunteers during the first 24 h and at 3 months after inhalation of 4-nm (primary particle size) gold nanoparticles. Gold was detectable in the bloodstream in some subjects within 15 min of the 2-h exposure and in the majority (12/14) at 24 h. Gold was still detectable in blood and urine after 3 months. In a second volunteer study, the effect of particle size on translocation from the lungs to blood was investigated at times up to 28 d. Concentrations of gold in blood and urine were much lower after inhalation of 34-nm nanoparticles than after inhalation of 4-nm nanoparticles. To address tissue accumulation over a wider range of particle sizes, mice were instilled intratracheally repeatedly for 5 weeks with 2-, 5-, 10-, 30-, or 200-nm gold particles, and euthanised for analysis 18 h after the last instillation. Gold was detectable in the blood following exposure to each size. However, the incidence of detectable gold, and the concentration of gold, in the blood was far greater following exposure to the smaller particles. Miller et al. (2017) also investigated accumulation of translocated gold nanoparticles in sites of vascular accumulation, following inhalation by volunteers, and instillation into mice. (627) Kreyling et al. (2018) followed the biokinetics of 195Au in rats for 28 d after inhalation (via an intratracheal tube) of 20-nm-diameter 195Au-labelled gold nanoparticles. The study also investigated the effect of age on pulmonary deposition of gold nanoparticles. Lung retention fit by a single exponential function gave Tb = 28 d, but it was recognised that this short time for relatively insoluble particles was likely to be due to the short duration of measurements. It was assessed that ∼2% of the initial deposited pulmonary lung dose had been absorbed into blood by 1 d and was predominantly in soft tissue. This increased to ∼4% at 28 d, mainly excreted in urine. (628) There is evidence from several studies that translocation of gold nanoparticles from the lungs to blood occurs and increases with decreasing particle size. Specific parameter values could, in principle, be calculated for 1.4-nm gold nanoparticles based on the study by Semmler-Behnke et al. (2008), but it is a single in-vivo study and inhalation exposure to such particles is unlikely. Furthermore, the highest measured fraction translocated was only ∼8%, for 1.4-nm gold nanoparticles, and was ∼1% or less for most sizes.
(c) Iron oxide (Fe2O3)
(629) Monodisperse 198Au-labelled iron oxide (Fe2O3) particles have been used extensively to assess regional deposition in the human respiratory tract. (630) Lippmann and Albert (1969) studied the effect of particle size (aerodynamic diameter, dae) on regional deposition of 198Au-labelled Fe2O3 particles inhaled by volunteers. External measurements were made of activity in the head, lung, and abdomen for at least 1 d. (631) Stahlhofen et al. (1980) assessed regional deposition of monodisperse 198Au-labelled Fe2O3 particles between 1- and 10-µm diameter. They followed lung retention for up to 10 d after inhalation by three healthy volunteers. The slow phase of lung retention had a mean Tb = 60 d (range 50–70 d). Stahlhofen et al. (1981) noted that this was shorter than for 198Au-labelled Teflon particles (see below), possibly because of loss of label from Fe2O3. (632) Stahlhofen et al. (1986a,b, 1990) administered monodisperse 198Au-labelled Fe2O3 particles to healthy volunteers as a small ‘bolus’ (i.e. confined to a small volume within the tidal air, to assess particle clearance from specific sites within the lungs). They followed lung retention for a few days after inhalation, which was sufficient to determine the fractions cleared in the fast and slow phases. (633) Stahlhofen et al. (1986b) refer to previously conducted in-vitro dissolution tests in which: ‘No disintegration of the Fe2O3 particles of 198Au from particles suspended in body liquids could be found and the leakage of 198Au from particles suspended in body liquid has been found to remain below 1%’.
(d) Polystyrene
(634) Velasquez and Morrow (1984) measured mucociliary clearance rates in guinea pigs using monodisperse 7.9-µm MMAD polystyrene particles labelled with 198Au and fluorescent dyes. The particles were inhaled via a cannula inserted in the trachea. Their distribution in the lungs was measured at times up to 60 h. The leakage of 198Au from the particles in vitro was assessed to be 0.04 d−1.
(e) Fused aluminosilicate particles
(635) Fused aluminosilicate particles or ‘fused clay’ particles have been used extensively as relatively insoluble particles in inhalation studies, both of biokinetics and of radiation effects. A natural clay mineral is labelled by ion exchange, and the labelled clay particles are heated to ∼1100℃ to form aluminosilicate glass microspheres in which the label is incorporated. Stahlhofen et al. (1987) followed lung retention of 198Au in six volunteers for up to 7 d after inhalation of 198Au-labelled fused aluminosilicate particles.
(f) Carnauba wax
(636) Bianco et al. (1980) followed lung retention of 198Au for 15 d after inhalation of monodisperse carnauba wax particles containing 198Au-labelled gold colloid. Lung retention was fit by two-component exponential functions with Tb averaging 11 h and 13 d. (637) Calamosca and Pagano (1991) followed the biokinetics of 198Au for 23 d after inhalation of 198Au-labelled carnauba wax particles by rats. The tissue distribution was reported for respiratory tract and alimentary tract organs alone, but it was noted that lung clearance was slow, and activity in urine was only slightly positive in some cases, reflecting a low dissolution rate in the lungs. An in-vitro test confirmed low solubility, at least over 1 d.
(g) Teflon
(638) Stahlhofen et al. (1981) followed lung retention of 198Au in five volunteers for up to ∼15 d after inhalation of 195Au-labelled Teflon particles. The slow phase of lung retention had a mean (± standard deviation) Tb of 128 (± 32) d. (639) Philipson et al. (1996) followed lung retention of 195Au in 10 volunteers for ∼3 y after inhalation of 195Au-labelled Teflon particles. The average lung retention Tb estimated from measurements from ∼250 to 900 d was of the order of 1000 d. The leakage of 195Au from the particles in vitro in water was <0.2% y−1. No activity could be measured in urine. The results indicate Type S behaviour.
35.2.1.2. Rapid dissolution rate for gold
(640) Only one in-vivo experimental study was found on the behaviour of gold following deposition of any soluble form in the respiratory tract (see ionic gold above), and measurements were made only at a single time point. Although the results suggest that absorption was relatively slow or incomplete, because of their limited scope, the general default value of 30 d−1 is applied to all Type F forms of gold.
35.2.1.3. Extent of binding of gold to the respiratory tract
(641) No information was found that enabled bound-state parameter values for gold to be estimated. It is therefore assumed that the bound state can be neglected for gold (i.e. fb = 0.0).
35.2.2. Ingestion
(642) In Publication 30 (ICRP, 1980), a fractional absorption value of 0.1 was recommended for all chemical forms of gold in the workplace based on studies by Kleinsorge (1967), Chertok and Lake (1971c), and Silva et al. (1973) showing gastrointestinal absorption varying from 0.03 to 0.13. The value of 0.1 was also adopted in Publication 68 (ICRP, 1994a). (643) The gastrointestinal absorption of gold from the orally administered anti-arthritis pharmaceutical Auranofin was estimated to be of the order of 20% (Tepperman et al., 1984) to 25% (Gottlieb, 1983). (644) Russell et al. (1996) reported a case of gold-flake-containing liquor ingestion. A high level of gold in serum and urine was measured 3 months after the end of 1 y of consumption, with daily urinary excretion approximately similar to the estimated daily intake rate. This suggests high gastrointestinal absorption of ingested gold. (645) Begerow et al. (1999) measured higher levels of gold in urine of 27 dental technicians than in urine of 17 road construction workers and 17 school leavers, indicating occupational internal exposure from treatment of dental alloys. Drasch et al. (2000) measured the level of gold in saliva, blood, urine, and faeces of 81 volunteers, and observed a positive correlation of gold concentration in all analysed bioassays with the number of teeth with gold restorations. The relative levels of gold measured in blood, urine, and faeces are consistent with gastrointestinal absorption of the order of 0.2. Becker et al. (2003) studied the levels of environmental pollutants in the urine of the German population, and found a clear influence of the number of dental inlays, crowns, and bridge elements on the mean level of gold in urine. (646) Schleh et al. (2012) investigated the gastrointestinal absorption of gold nanoparticles with sizes ranging from 1.4 to 200 nm administered by gavage to non-fasted rats. After 24 h, 0.01–0.4% of gold was absorbed. Absoprtion was higher for smaller and negatively charged particles. (647) Although the reported studies indicate significant variations of absorption, the same value of fA (0.1) is adopted here for all chemical forms of gold in the workplace as in Publications 30 and 68 (ICRP, 1981, 1994a).
35.2.3. Systemic distribution, retention, and excretion of gold
35.2.3.1. Biokinetic data
(648) The biokinetics of gold has been investigated in human subjects and laboratory animals in studies related to its medical applications, particularly the use of stable gold for treating rheumatoid arthritis, and short-lived radioactive gold as an imaging agent (Block et al., 1942, 1944; Freyberg et al., 1942; Jeffrey et al., 1958; Lawrence, 1961; Rubin et al., 1967; McQueen and Dykes, 1969; Mascarenhas et al., 1972; Sugawa-Katayama et al., 1975; Jellum et al., 1980; Gottlieb, 1983; Massarella and Pearlman, 1987; Andersson et al., 1988; Bacso et al., 1988; Brihaye and Guillaume, 1990). Other studies have addressed the biological behaviour of gold as a radioactive contaminant in the workplace or environment (Durbin, 1959; Fleshman et al., 1966; Chertok and Lake, 1971a,b,c; Silva et al., 1973). (649) Development of a representative biokinetic model for systemic gold in adult humans is complicated by the apparent dependence of reported data on the mode of administration, chemical form, administered mass, and other study conditions. For gold administered in low mass and relatively soluble form, it appears that much of the absorbed or injected amount is excreted in the first week or two, but a non-trivial portion may be retained for several weeks or months. Excretion is primarily in urine. Most of the retained amount is found in the kidneys, liver, and blood. Most of the gold found in blood is bound to plasma proteins.
35.2.3.2. Biokinetic model for systemic gold
(650) The structure of the biokinetic model for systemic gold used in this publication is shown in Fig. 35.1. Transfer coefficients are listed in Table 35.3. Transfer coefficients (d−1) in the biokinetic models for systemic gold. Structure of the biokinetic model for systemic gold.
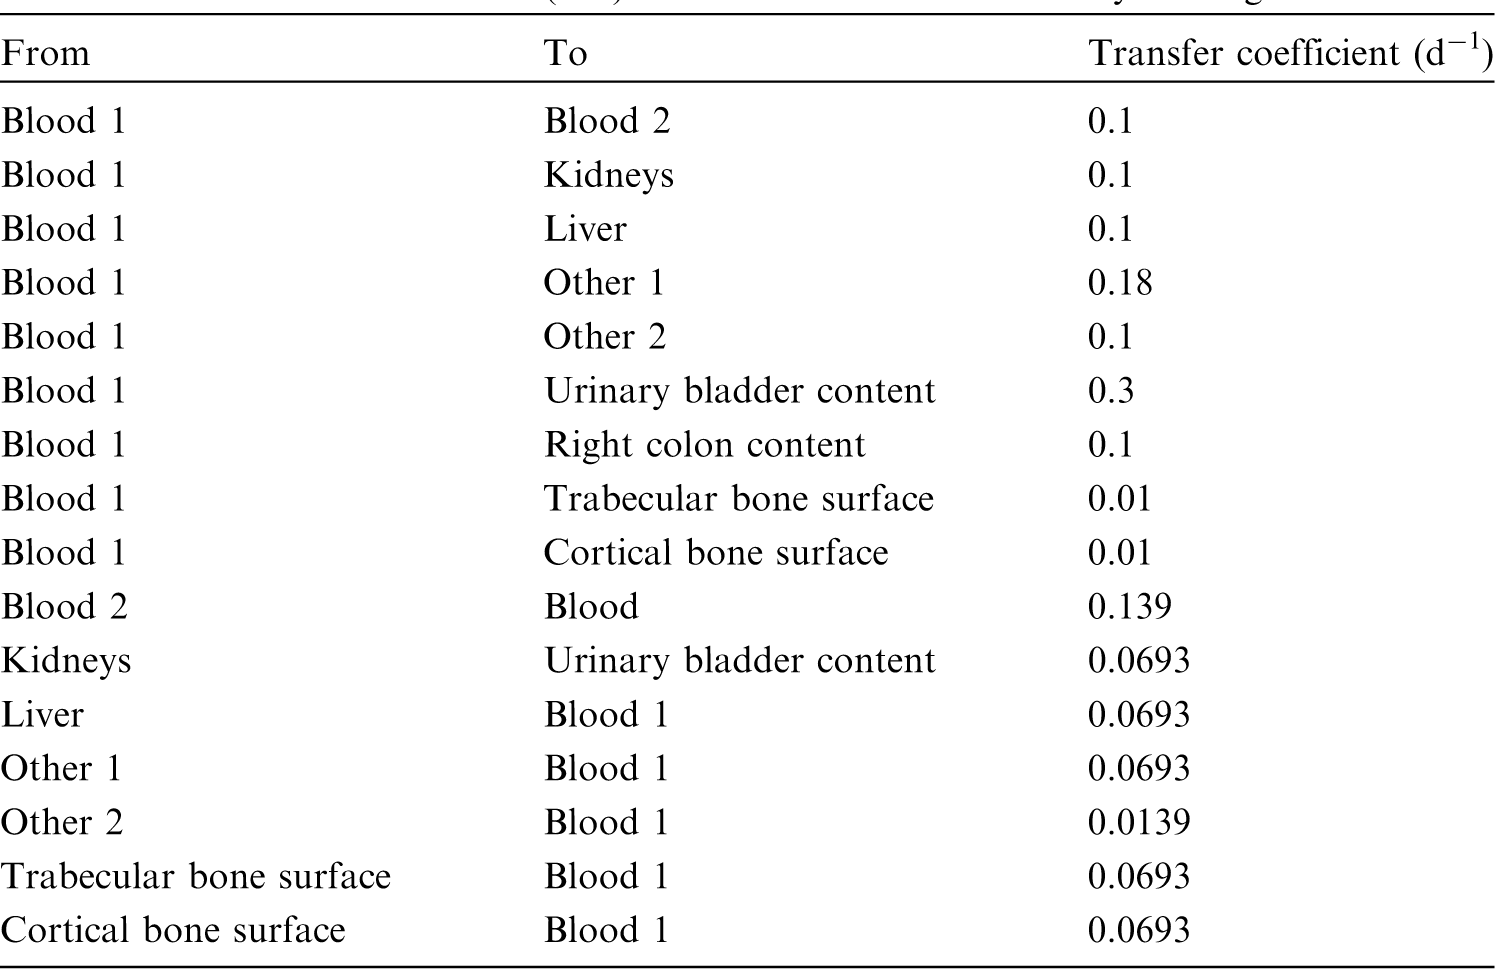

35.2.3.3. Treatment of progeny
(651) Progeny of gold addressed in this publication are radioisotopes of gold, rhenium, osmium, iridium, and platinum. The model for gold as a parent is applied to gold as a progeny of gold. The models for rhenium, osmium, iridium, and platinum as progeny of gold are expansions of the characteristic models for these elements with added compartments and associated transfer coefficients needed to solve the linked biokinetic models for chains headed by gold (see Annex B). If produced in an ambiguous compartment (i.e. a compartment not explicitly named in the progeny’s model), the progeny is assumed to transfer at a specified rate to the central blood compartment of its characteristic biokinetic model, and to follow that model thereafter. The following transfer rates to the central blood compartment are assigned to rhenium, osmium, iridium, and platinum produced in an ambiguous compartment: 1000 d−1 if produced in a blood compartment; and at the following element-specific rates if produced in a tissue compartment: rhenium, 0.462 d−1; osmium or platinum, 0.09902 d−1; and iridium, 0.0693 d−1.
35.3. Individual monitoring
35.3.1. 195Au
(652) Measurements of 195Au may be performed by in-vivo whole-body measurement technique and by gamma measurement in urine.
35.4. Dosimetric data for gold
36. Mercury (Z = 80)
36.1. Isotopes
36.2. Routes of intake
36.2.1. Inhalation
36.2.1.1. Absorption types and parameter values
(653) The ICRP Task Group on Lung Dynamics (1966) assigned oxides, hydroxides, halides, nitrates, and sulphides of mercury to inhalation class W, and sulphates to class D. This classification was adopted by ICRP in Publication 30 (ICRP, 1980). In addition, in Publication 30, it was assumed, based mainly on human studies, that 70% of mercury entering the lungs as mercury vapour is deposited there, and that following deposition, this fraction is translocated to blood with a biological half-time, Tb of 1.7 d. (654) Due to the recognised hazards posed by exposure to mercury, the inhalation toxicology of mercury vapour has been studied extensively. Comprehensive information is available on the behaviour of inhaled mercury vapour from both volunteer experiments and animal studies. Some information is also available from experimental studies of volatile organic compounds and particulate forms. Several studies have been reported following accidental intakes of mercury radioisotopes. (655) Absorption parameter values and types, and associated fA values for gas and vapour forms of mercury are given in Table 36.2, and for particulate forms in Table 36.3. Exposures to both gas/vapour and particulate forms of mercury have occurred, and it is therefore recommended in the OIR series that 50% particulate and 50% gas/vapour should be assumed in the absence of information (ICRP, 2002a). (656) Reference biokinetic models were used here (i.e. by the Task Group) for analysis of the data and determination of absorption parameter values for mercury vapour. Lung retention data were interpreted using the revised HRTM (ICRP, 2015). Mercury in lung tissue and blood was taken into account in the comparison with experimental data using the systemic model for mercury described in Section 36.2.3. Monitoring techniques for 195Au. Measurement system comprised of germanium detectors. Counting time of 20 min. Committed effective dose coefficients (Sv Bq−1) for the inhalation or ingestion of 195Au compounds. AMAD, activity median aerodynamic diameter. Dose per activity content of 195Au in total body and in daily excretion of urine (Sv Bq−1); 5 µm activity median aerodynamic diameter aerosols inhaled by a reference worker at light work. Isotopes of mercury addressed in this publication. EC, electron-capture decay; B+, beta-plus decay; B−, beta-minus decay; IT, isomeric transition decay. *Dose coefficients and bioassay data for this radionuclide are given in the printed copy of this publication. Data for other radionuclides listed in this table are given in the online electronic files on the ICRP website. Deposition and absorption for gas and vapour compounds of mercury. ET1, anterior nasal passage; ET2, posterior nasal passage, pharynx, and larynx; BB, bronchial; bb, bronchiolar; AI, alveolar-interstitial. Percentage deposited refers to how much of the material in the inhaled air remains in the body after exhalation. Almost all inhaled gas molecules contact airway surfaces, but usually return to the air unless they dissolve in, or react with, the surface lining. The distribution between regions is material specific: 2% ET2, 1% BB, 2% bb, and 75% AI. For mercury, it is assumed that a bound fraction fb = 0.24 with an uptake rate sb = 2.1 d−1 is applied throughout the respiratory tract except in the ET1 region. For inhaled material deposited in the respiratory tract and subsequently cleared by particle transport to the alimentary tract, the default fA values for inhaled materials are applied: i.e. the product of fr for the absorption type (or specific value where given) and the fA value for ingested soluble forms of mercury (0.1). Absorption parameter values for inhaled and ingested mercury. For mercury, it is assumed that a bound fraction fb = 0.24 with an uptake rate sb = 2.1 d−1 is applied throughout the respiratory tract except in the ET1 region. The values of sr for Type F, M, and S forms of mercury (30, 3, and 3 d−1, respectively) are the general default values. Materials (e.g. mercuric oxide) are generally listed here where there is sufficient information to assign to a default absorption type, but not to give specific parameter values (see text). For inhaled material deposited in the respiratory tract and subsequently cleared by particle transport to the alimentary tract, the default fA values for inhaled materials are applied: i.e. the product of fr for the absorption type (or specific value where given) and the fA value for ingested soluble forms of mercury (0.1). Default Type M is recommended for use in the absence of specific information on which the exposure material can be assigned to an absorption type (e.g. if the form is unknown, or if the form is known but there is no information available on the absorption of that form from the respiratory tract). For guidance on the use of specific information, see Section 1.1. Activity transferred from systemic compartments into segments of the alimentary tract is assumed to be subject to reabsorption to blood. The default absorption fraction fA for the secreted activity is the highest value for any form of the radionuclide (fA = 0.1).
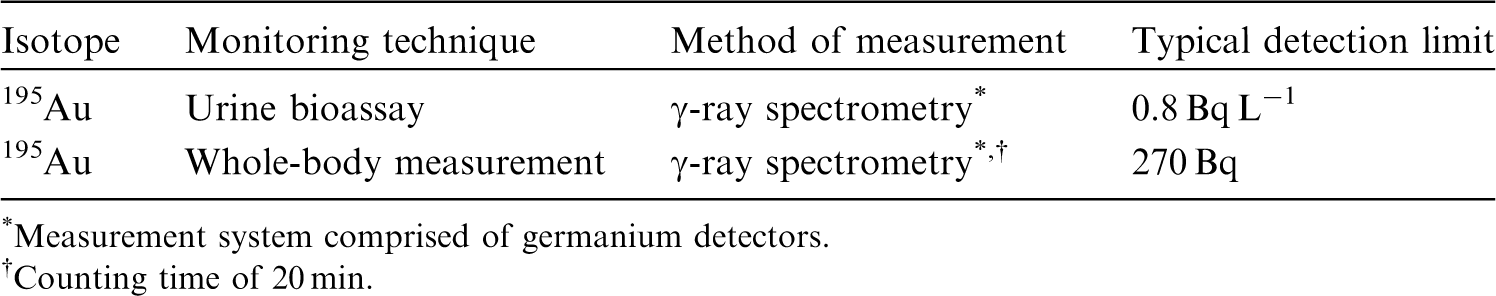


36.2.1.2. Gases and vapours
(a) Elemental mercury (Hg0)
(657) Comprehensive information is available on the behaviour of inhaled mercury vapour (Hg0) from both volunteer and animal experiments. Leggett et al. (2001) carried out a critical review of the literature on the biokinetics of inhaled Hg0 [see Leggett et al. (2001) for details and references to the papers reviewed]. They proposed a lung biokinetic model consistent with the results of the review in the framework of the HRTM (ICRP, 1994b). No more recent relevant studies were found in the literature, and therefore the results of the review by Leggett et al. (2001) have been adopted here. Their estimates of total and regional deposition in the respiratory tract are given in Table 36.2: 75% of inhaled Hg0 depositing in the AI region and only 5% in the conducting airways. (658) With respect to retention, Leggett et al. (2001) concluded that the non-invasive measurements on volunteers who inhaled Hg0 for short periods indicate that much of the retained mercury is absorbed rapidly to blood and the remainder is removed from the lungs over a period of a few days. However, the more precise data for laboratory animals indicate that most of the deposited Hg0 is absorbed rapidly to blood, most of the mercury retained in the lungs is removed to blood over a period of hours, and the remainder is removed to blood over a period of days. They represented absorption from the respiratory tract of the deposited Hg0 by three components: 0.7 absorbed very rapidly (1000 d−1); 0.24 with Tb = 8 h (clearance rate 2.1 d−1); and 0.06 with Tb = 5 d (clearance rate 0.14 d−1). The very rapid absorption was applied only to the activity deposited in the AI region. As there was very little faecal excretion of mercury following inhalation of Hg0, and some of it would have been due to endogenous secretion of mercury after its absorption to blood, Leggett et al. (2001) represented absorption by three ‘bound’ compartments from which clearance was only by absorption to blood, with no particle transport to the alimentary tract. (659) However, in the default implementation of the HRTM (ICRP, 1994b, 2015), there is only one bound compartment. The three-phase absorption described by Leggett et al. (2001) was represented here using the rapid and slow phases of dissolution, and the bound state. Good fits to the lung retention data for guinea pigs and monkeys summarised by Leggett et al. (2001) were obtained using slow dissolution to represent the intermediate phase, and the bound fraction to represent the slow phase, or vice versa, either:
(660) In either case, because most of the deposition is in the AI region, from which particle transport is slow and most of the deposit is absorbed rapidly to blood, there is very little clearance by particle transport, and subsequently to faeces. As discussed below, the results of studies of the distribution of 203Hg after inhalation of 203Hg-labelled mercury vapour or dimethyl mercury are consistent with the assumption that the intermediate phase can be represented by a bound fraction: fb = 0.24 with sb = 2.1 d−1; those parameter values are adopted here. They are assumed to apply throughout the respiratory tract (except ET1 region), and also to particulate forms of mercury.


(b) Dimethyl mercury (C2H6Hg)
(661) Östlund (1969) followed whole-body retention of 203Hg in mice for 25 d after inhalation of 203Hg-labelled dimethyl mercury. Approximately 80% cleared within 6 h by exhalation of dimethyl mercury, and the rest was retained with Tb of ∼7 d. (662) Tissue distribution was determined by whole-body autoradiography 20 min, 1 and 4 h, and 16 d after inhalation, and at 5 and 20 min; 1, 4, and 24 h; and 4 and 16 d after intravenous injection. No differences in retention or distribution were seen between mice given dimethyl mercury by inhalation or by intravenous injection. High concentrations of 203Hg in bronchial and nasal mucosa were noted at 5 min after intravenous injection. At 20 min and 1 h, the concentrations in nasal and bronchial mucosa were very high; high activity was also observed in the mucosa of the oral cavity, the pharynx, and the oesophagus. At 4 h, the concentration in the bronchi was reported to be higher than in fat tissue. At 16 and 24 h, there was a high concentration in the nasal mucosa but no accumulation was seen in the bronchi. There were few changes in distribution at later times (4 and 16 d). (663) It was concluded that the initial tissue distribution reflected the volatility and lipid solubility of dimethyl mercury, while subsequent retention was due to formation of metabolic products such as methyl mercury. It was reported that methyl mercury has no specific affinity to the bronchi, which might explain why its retention there was short-lived. It was suggested that accumulation in the nasal mucosa and the oral part of the digestive tract might be due to secretion from the nasal mucosa of methyl mercury which is then swallowed. (664) Although specific parameter values for dimethyl mercury based on in-vivo data could be assessed, they are not adopted here because inhalation exposure to it is so unlikely, and its systemic behaviour is different from that of the model adopted here.
36.2.1.3. Particulate aerosols
(a) Mercuric acetate [Hg(O2CCH3)2]
(665) Morrow et al. (1968) followed lung retention of 203Hg after inhalation of 203Hg-labelled mercuric acetate by dogs and rats, but few details are given. It was noted that while the acetate is one of the most water-soluble forms of mercury, it is chemically unstable, particularly around neutral pH. Following a rapid absorption phase, its behaviour was nearly identical to that of mercuric oxide (see below). Behaviour similar to oxide was also observed after intramuscular injection. Lung retention was described by a two-component exponential function with Tb = 2.8 d (55%; clearance rate 0.25 d−1) and 26 d (clearance rate 0.027 d−1). This would be consistent with assignment to Type M, but does not take account of the early rapid phase, and Type F cannot be excluded.
(b) Mercuric oxide (HgO)
(666) Morrow et al. (1964) followed retention of 203Hg in the ‘lower respiratory tract’ (presumably mainly the AI region) for 40 d after inhalation of 203Hg-labelled HgO by dogs. Although chosen partly because of its low solubility, clearance was rapid: on average, 45% cleared with Tb <24 h, and the rest with Tb = 33 d (clearance rate 0.021 d−1). Morrow et al. (1968) reported further studies of 203Hg-labelled HgO inhaled by dogs, but few details are given. Lung retention was described by a two-component exponential function with half-times of 0.5 days (60%; clearance rate 1.4 d−1) and of the order of 10 d (clearance rate ∼0.07 d−1). (667) Newton and Fry (1978) studied the behaviour of 203Hg in two workers for up to ∼200 d, starting 3 or 8 d after accidental inhalation of neutron-activated mercuric oxide. In one worker, lung retention was fit by a two-component exponential function with Tb of ∼2 d (66%) and ∼24 d, indicating Type M. However, some clearance would have occurred before measurements started, 3 d after exposure. Lung deposition was lower in the other worker, and measurement of its retention was not attempted. Excretion (measured in one man only) was predominantly urinary after 40 d, when lung clearance was substantially complete and most of the retained activity was present in the kidneys. Taken with the behaviour of HgO inhaled by dogs, the results are consistent with assignment to Type M.
(c) Mercuric nitrate [Hg(NO3)2]
(668) Izumi et al. (1973) followed the whole-body retention and distribution of 203Hg in two workers for up to ∼100 d, starting 10 d after accidental exposure to mercuric nitrate containing 197Hg and 203Hg. Exposure was presumed to have been by inhalation. Measurements of 203Hg in the whole body, including scans along the central body axis, and selected sites were made using external detectors. Whole-body retention showed Tb of ∼30 d for both subjects over the first few weeks. Both radionuclides were deposited mainly in the liver and kidneys. The results indicate that a large fraction of 203Hg retained by the time of the first measurement was systemic, implying Type F or M behaviour.
(d) Methyl mercury chloride (CH3HgCl)
(669) Uchiyama et al. (1976) followed the whole-body retention and distribution of 203Hg in two workers for ∼6 months, starting ∼1 or 2 months after accidental exposure to 203Hg-labelled methyl mercury chloride. Exposure was presumed to have been by inhalation of particles and/or vapour. Measurements of 203Hg in the whole body, head, chest, and upper abdomen were made using external detectors. Whole-body retention showed Tb of ∼100 d for both subjects over the first few weeks. Activity in the head was a large percentage (50–70%) of that in the whole body. The results indicate that a large fraction of 203Hg retained by the time of the first measurement was systemic, implying Type F or M behaviour.
36.2.1.4. Rapid dissolution rate for mercury
(670) No reliable estimates have been made of the rapid dissolution rate of mercury in particulate form. The general default value of 30 d−1 is therefore applied to all Type F forms of mercury.
36.2.1.5. Extent of binding of mercury to the respiratory tract
(671) Evidence was found for binding of mercury to the respiratory tract, mainly from studies of the distribution of 203Hg after inhalation of 203Hg-labelled mercury vapour (Hg0). (672) Berlin et al. (1969) measured tissue concentrations of 203Hg immediately, and 3, 8, and 24 h after inhalation of 203Hg-labelled mercury vapour (Hg0) by guinea pigs. They concluded that a large fraction of the inhaled Hg0 transferred immediately to blood, and a small fraction deposited in the respiratory tract, from which it was slowly absorbed. Lung retention followed an initial Tb of 5 h (clearance rate 3.3 d−1). Concentrations in samples of the trachea and bronchi were several times lower than in the ‘peripheral’ lung, but the distribution in the lungs did not change during clearance. Autoradiographs of the lung showed concentrations of 203Hg in the bronchial tree peripheral to the lobar bronchi to be higher, but concentrations in the trachea and bronchi to be lower, than in alveolar tissue. (673) Khayat and Dencker (1983) determined the tissue distribution of 203Hg by whole-body autoradiography immediately, and 1 and 4 h after inhalation of 203Hg-labelled mercury vapour (Hg0) by mice. High concentrations of 203Hg were found in the epithelium of the respiratory tract: nasal mucosa, trachea, bronchi, and lungs. No major differences in the distribution pattern were observed between 0, 1, and 4 h. However, the lung concentration was lower at 4 h than at 0 and 1 h. (674) Khayat and Dencker (1984) determined the tissue distribution of 203Hg by whole-body autoradiography immediately after inhalation of 203Hg-labelled mercury vapour (Hg0) by rats and marmosets. In both species, high concentrations of 203Hg were found in the epithelium of the respiratory tract: nasal mucosa, trachea, and bronchial tree. It was attributed to oxidation of Hg0 to Hg2+ in these tissues. (675) As described above, Östlund (1969) reported a similar pattern of respiratory tract distribution and retention of 203Hg in mice after inhalation of 203Hg-labelled dimethyl mercury. Tissue distribution was also determined by whole-body autoradiography, but over a longer period: up to 16 d after inhalation. High concentrations of 203Hg in bronchial and nasal mucosa were noted up to 1 h after inhalation. By 16 h, no accumulation was seen in the bronchi, although there was still a high concentration in the nasal mucosa. It is plausible that the similarity in behaviour to that of Hg0 reflects similar properties: high solubility in lipids and rapid oxidation to Hg2+ resulting in formation of metabolic products such as methyl mercury. (676) These results indicate that most of the mercury retained in the respiratory tract (not absorbed immediately into blood) following inhalation of Hg0 is cleared with a Tb of several hours. The finding that clearance is not faster in the upper respiratory tract, where particle transport to the alimentary tract is relatively rapid, than in the peripheral lungs is consistent with the assumption that this phase can be represented by a bound fraction which applies throughout the respiratory tract. (677) As discussed above, following a review of the literature, Leggett et al. (2001) represented absorption from the respiratory tract of the deposited Hg0 by three components: 0.7 absorbed very rapidly (1000 d−1); 0.24 with Tb = 8 h (clearance rate 2.1 d−1); and 0.06 with Tb = 5 d (clearance rate 0.14 d−1). The results summarised here are consistent with the assumption that the intermediate phase can be represented by a bound fraction: fb = 0.24 with sb = 2.1 d−1; and those parameter values are adopted here. They are assumed to apply throughout the respiratory tract (except in the ET1 region in which no absorption takes place), and also to particulate forms of mercury.
36.2.2. Ingestion
(678) Human and animal studies indicate that elemental mercury is virtually unabsorbed, and inorganic salts exhibit absorption of the order of 8–15% (Cooper, 1985; ATSDR, 1999; EFSA, 2012). (679) The uptake of elemental mercury from the gastrointestinal tract is very limited (Nordberg and Sherfving, 1972), and experiments on rats (Bornmann et al., 1970) suggest that <10−4 of ingested elemental mercury is absorbed. Reports of human contamination cases also indicate negligible absorption of elemental mercury (Wright et al., 1980; Sue, 1994). (680) Animal studies of oral administration of inorganic compounds of mercury, mainly as mercuric chloride solutions, provided variable results with fractional absorption averaging in the 10–30% range (Nordberg and Sherfving, 1972; ATSDR, 1999; EFSA, 2012). In humans, the absorption of mercuric chloride and nitrate was evaluated from 2% (EFSA, 2012) to 15% (Rahola et al., 1973; ATSDR, 1999; WHO, 2015) based on limited data. In the case of high intake, mercuric chloride may have a disruptive effect on the permeability barriers of the gastrointestinal tract that might raise absorption (EFSA, 2012). Due to water solubility, it is anticipated that the fractional absorption of mercurous [Hg(I)] compounds from the gastrointestinal tract will be less than that of mercuric compounds [Hg(II)] (Nordberg and Sherfving, 1972). The bioavailability of mercuric sulphide in animals appears to be less than that of mercuric chloride (ATSDR, 1999). (681) In Publications 30 and 68 (ICRP, 1980, 1994a), f1 was taken as 0.02 for all inorganic compounds of mercury. In this publication, a higher value of fA = 0.1 is adopted for all forms when no specific information is available.
36.2.3. Systemic distribution, retention, and excretion of mercury
36.2.3.1. Biokinetic data
(682) Mercury is ubiquitous in nature. It exists in three general forms: elemental mercury (Hg0), which may occur as a liquid or vapour; inorganic mercury compounds as monovalent (mercurous) or divalent (mercuric) mercury; and organic mercury compounds as monovalent or divalent mercury. This section summarises biokinetic data and provides biokinetic models for two forms of mercury often encountered in occupational settings: mercury vapour (Hg0) and divalent inorganic mercury (Hg2+) salts. These two forms initially exhibit distinct kinetics following entry into the systemic circulation, but their systemic behaviours converge over time. The model for systemic Hg0 is an expansion of the model for Hg2+ that adds transfer coefficients depicting the early, distinct behaviour of mercury vapour that reaches blood. (683) Notable initial differences observed in the systemic behaviours of mercury vapour and divalent mercury salts in human subjects and laboratory animals include much greater uptake by RBC and brain following inhalation of mercury vapour (Hayes and Rothstein, 1962; Berlin et al., 1969). Over a period of days, the distribution and retention of mercury inhaled as vapour becomes similar to that seen after exposure to divalent inorganic mercury compounds, as mercury vapour is changed to divalent mercury in RBC and tissues (Hayes and Rothstein, 1962; Berlin et al., 1969). (684) Blood clearance of mercury has been investigated in controlled studies of human subjects who inhaled mercury vapour for a brief period (Hursh et al., 1976, 1980; Cherian et al., 1978; Sandborgh-Englund et al., 1998; Jonsson et al., 1999), and in studies of workers after their removal from chronic exposure to mercury vapour (Barregård et al., 1992; Sallsten et al., 1993). A substantial portion of inhaled vapour moves rapidly into blood, and a smaller portion is oxidised in the lungs and absorbed more slowly. Mercury that enters blood is taken up rapidly by RBC or tissues, or exhaled (Teisinger and Fiserova-Bergerova, 1965; Magos et al., 1989). The portion entering RBC and tissues is oxidised to Hg2+ (Magos et al., 1989). Data for subjects acutely exposed to mercury vapour under controlled conditions and for workers just removed from exposure to mercury vapour indicate an initial removal half-time of divalent mercury from blood of ∼3 d. A second component of retention with a longer half-time (18–45 d) has been observed in workers. Studies of animals administered divalent mercury salts indicate initially rapid disappearance of mercury from blood, but a substantial portion is retained in blood after several hours (Rothstein and Hayes, 1960; Clarkson and Rothstein, 1964). (685) The kidneys have a high affinity for mercury. In laboratory animals exposed briefly to mercury vapour in inhaled air, the mercury content in the kidneys gradually increased to as much as 25–35% of IBB over a period of days. Apparently, the kidneys took up only a few percent of the mercury vapour absorbed to blood, but continued to accumulate divalent mercury that was absorbed more slowly from the lungs to blood or returned from other tissues to blood. (686) External measurements on human subjects acutely exposed to radioactive mercury vapour or inorganic mercury compounds also show considerable accumulation of mercury in the kidneys (Hursh et al., 1976, 1980; Newton and Fry, 1978). Autopsy data on chronically exposed human subjects indicate a higher concentration of stable mercury in the kidneys than in other tissues. (687) External measurements on human subjects following brief inhalation of mercury vapour indicate a mean Tb of 52 d (range 35–90 d) for mercury in the kidneys (Hursh et al., 1976, 1980). External measurements on subjects accidentally exposed to aerosols of mercury indicate a mean half-time of 49 d (range 37–60 d) (Newton and Fry, 1978). These values are reasonably consistent with half-times derived from urinary mercury measurements following exposure to mercury vapour or inorganic mercury compounds. Half-times ≥90 d derived in some cases at times remote from exposure could result from a long-term component of retention in the kidneys, but may also reflect a long-term component in other systemic tissues, as much of the mercury lost from other tissues is accumulated in the kidneys. (688) In laboratory animals exposed briefly to mercury vapour in air, the liver typically accumulated 3–6% (range 2–18%) of IBB shortly after intake. The collective data suggest a slight rise in the liver content over the first few days after inhalation of mercury vapour. Higher initial uptake by the liver was seen after intravenous injection with divalent mercury than after inhalation of mercury vapour (Hayes and Rothstein, 1962; Magos et al., 1989). In laboratory animals, mercury is removed from the liver with a half-time of a few days. (689) Mercury vapour carried in plasma to the brain readily crosses the blood–brain barrier. Mercury vapour that enters the brain is converted to the divalent form, which is trapped because it is more difficult for the divalent form to cross the blood–brain barrier. After acute inhalation of mercury vapour by squirrel monkeys, rats, mice, rabbits, and guinea pigs, the peak mercury content in the brain was typically 1–2% of IBB, which is an order of magnitude greater than uptake of circulating divalent mercury (Berlin et al., 1966, 1969). The pattern of uptake and retention is reasonably consistent across species, despite the large variation in brain size as a fraction of total-body mass. Data for laboratory animals indicate Tb of the order of 10 d for the preponderance of inorganic mercury deposited in the brain. External measurements over the head in human subjects suggest half-times in the range of 14–29 d (Hursh et al., 1976, 1980; Newton and Fry, 1978). (690) More than half of mercury vapour entering blood is deposited in massive soft tissues such as muscle, skin, and fat. Uptake of divalent mercury by massive soft tissues appears to be lower due to relatively greater competition from the kidneys and liver. The portion of total-body mercury in the massive soft tissues declines over a period of days or weeks as mercury redistributes to the kidneys and liver. After inhalation of mercury vapour by rats for a period of 5 h, the kidneys and liver accounted for ∼20% of retained mercury at the end of exposure, 40% after 1 d, 50% after 5 d, and 67% after 15 d (Hayes and Rothstein, 1962). In rats injected with inorganic divalent mercury, the kidneys and liver accounted for ∼10% of the systemic burden after 4 h, 40% after 1 d, 70% after 6 d, 88% after 15 d, and 91% after 52 d (Rothstein and Hayes, 1960). External measurements on human subjects exposed to inorganic mercury suggest that much of the mercury deposited in soft tissues other than the kidneys is lost from soft tissues over a period of a few weeks. (691) In rats receiving mercury chloride by intravenous or intramuscular injection, a slow phase of excretion with a half-time of at least 90 d was apparent by 2 months after injection, when the body burden was ∼17% of the dosage. A component of retention with a half-time on the order of 100 d is also indicated by long-term measurements of urinary mercury following exposure to inorganic mercury. (692) Urinary mercury appears to originate predominantly from mercury stored in the kidneys (Barregård, 1993; Clarkson, 1997). In human subjects, the peak concentration of mercury in urine occurs 2–3 weeks after short-term inhalation of mercury vapour (Barregård, 1993), in parallel with the peak kidney content. (693) Following inhalation of mercury vapour, more than half of absorbed inorganic mercury is removed from the body in urine. Initially, the rate of faecal excretion is much higher than that of urinary excretion, but this relationship reverses over a few weeks. At times remote from exposure, daily urinary losses are considerably larger than faecal losses (Hursh et al., 1976, 1980; Newton and Fry, 1978; Jonsson et al., 1999). Analysis of excretion data for human subjects who inhaled mercury vapour for a short period (Jonsson et al., 1999) indicates that cumulative faecal excretion represented ∼25–30% of IBB. Results of animal studies indicate that faecal excretion of mercury may arise from a combination of biliary secretion and secretions across the intestinal wall that are most prominent in the small intestine (Gregus and Klaassen, 1986; Zalups, 1998). (694) In addition to losses in urine and faeces, mercury is removed from the systemic fluids and tissues by exhalation of mercury vapour, and small amounts are lost through sweat, hair, and other routes. Exhalation of mercury vapour occurs over a period of at least several days, either after administration of mercuric salts or inhalation of mercury vapour (Clarkson and Rothstein, 1964; Hursh et al., 1976; Cherian et al., 1978; Berlin, 1986; Jonsson et al., 1999). Hursh et al. (1976) estimated that ∼7% of IBB was exhaled in expired air over the first few days after acute inhalation of mercury vapour by human subjects. The rate of exhalation of mercury was highest soon after intake and declined with a half-time of 1–2 d.
36.2.3.2. Biokinetic model for systemic mercury
(695) The biokinetic model for systemic mercury adopted in this publication is designed to address absorption of inorganic mercury to blood either as mercury vapour (Hg0) or divalent mercury (Hg2+), or as some combination of these two forms. The model depicts initially distinct kinetics of Hg0 and Hg2+ following entry into the systemic circulation, but convergence of the kinetics of the two forms over time after conversion of Hg0 to Hg2+ in cells. (696) The structure of the systemic model for mercury vapour is shown in Fig. 36.1. The same structure, minus ‘Plasma 0' and its associated arrows, is applied to divalent inorganic mercury. (697) Transfer coefficients for mercury vapour that enters the systemic circulation are listed in Table 36.4. Transfer coefficients for divalent mercury that enters the systemic circulation are listed in Table 36.5. The transfer coefficients listed in Table 36.5 are a subset of those listed in Table 36.4, representing mercury vapour that is converted to divalent mercury in RBC and tissues. Transfer coefficients are intended to depict the typical (central) behaviour of systemic mercury in human subjects, supplemented where needed with data for laboratory animals, as summarised in the preceding section. (698) The fraction of inhaled mercury vapour that is absorbed rapidly into blood, fr(1 − fb), enters the systemic circulation as mercury vapour through ‘Plasma 0', while the slowly absorbed fraction, (1 − fr)(1 − fb), and the bound fraction, fb, enter the systemic circulation through ‘Plasma 1' as mercury vapour is changed to divalent mercury in the lung tissues. (699) Blood is divided into three plasma compartments and a fourth compartment representing RBC. Two plasma compartments, ‘Plasma 0' and ‘Plasma 1', are used to account for differences in the rates of disappearance of absorbed mercury vapour and absorbed divalent mercury from plasma, and differences in their initial distributions. Absorbed mercury vapour is assigned to ‘Plasma 0', and absorbed divalent mercury is assigned to ‘Plasma 1'. A third compartment, ‘Plasma 2', is used to account for a relatively long-term component of retention of divalent mercury in plasma associated with binding to plasma proteins. Transfer coefficients in the biokinetic model for systemic mercury vapour. RBC, red blood cells. Transfer coefficients in the biokinetic model for systemic divalent inorganic mercury. RBC, red blood cells. Daily excretion of 195Au following inhalation of 1 Bq Type F. Daily excretion of 195Au following inhalation of 1 Bq Type M. Daily excretion of 195Au following inhalation of 1 Bq Type S. Structure of the biokinetic model for mercury vapour (all compartments and paths) and inorganic divalent mercury (excludes ‘Plasma 0' and associated paths). HRTM, Human Respiratory Tract Model; HATM, Human Alimentary Tract Model; RBC, red blood cells; Trab, trabecular; Cort, cortical; surf, surface; UB, urinary bladder.

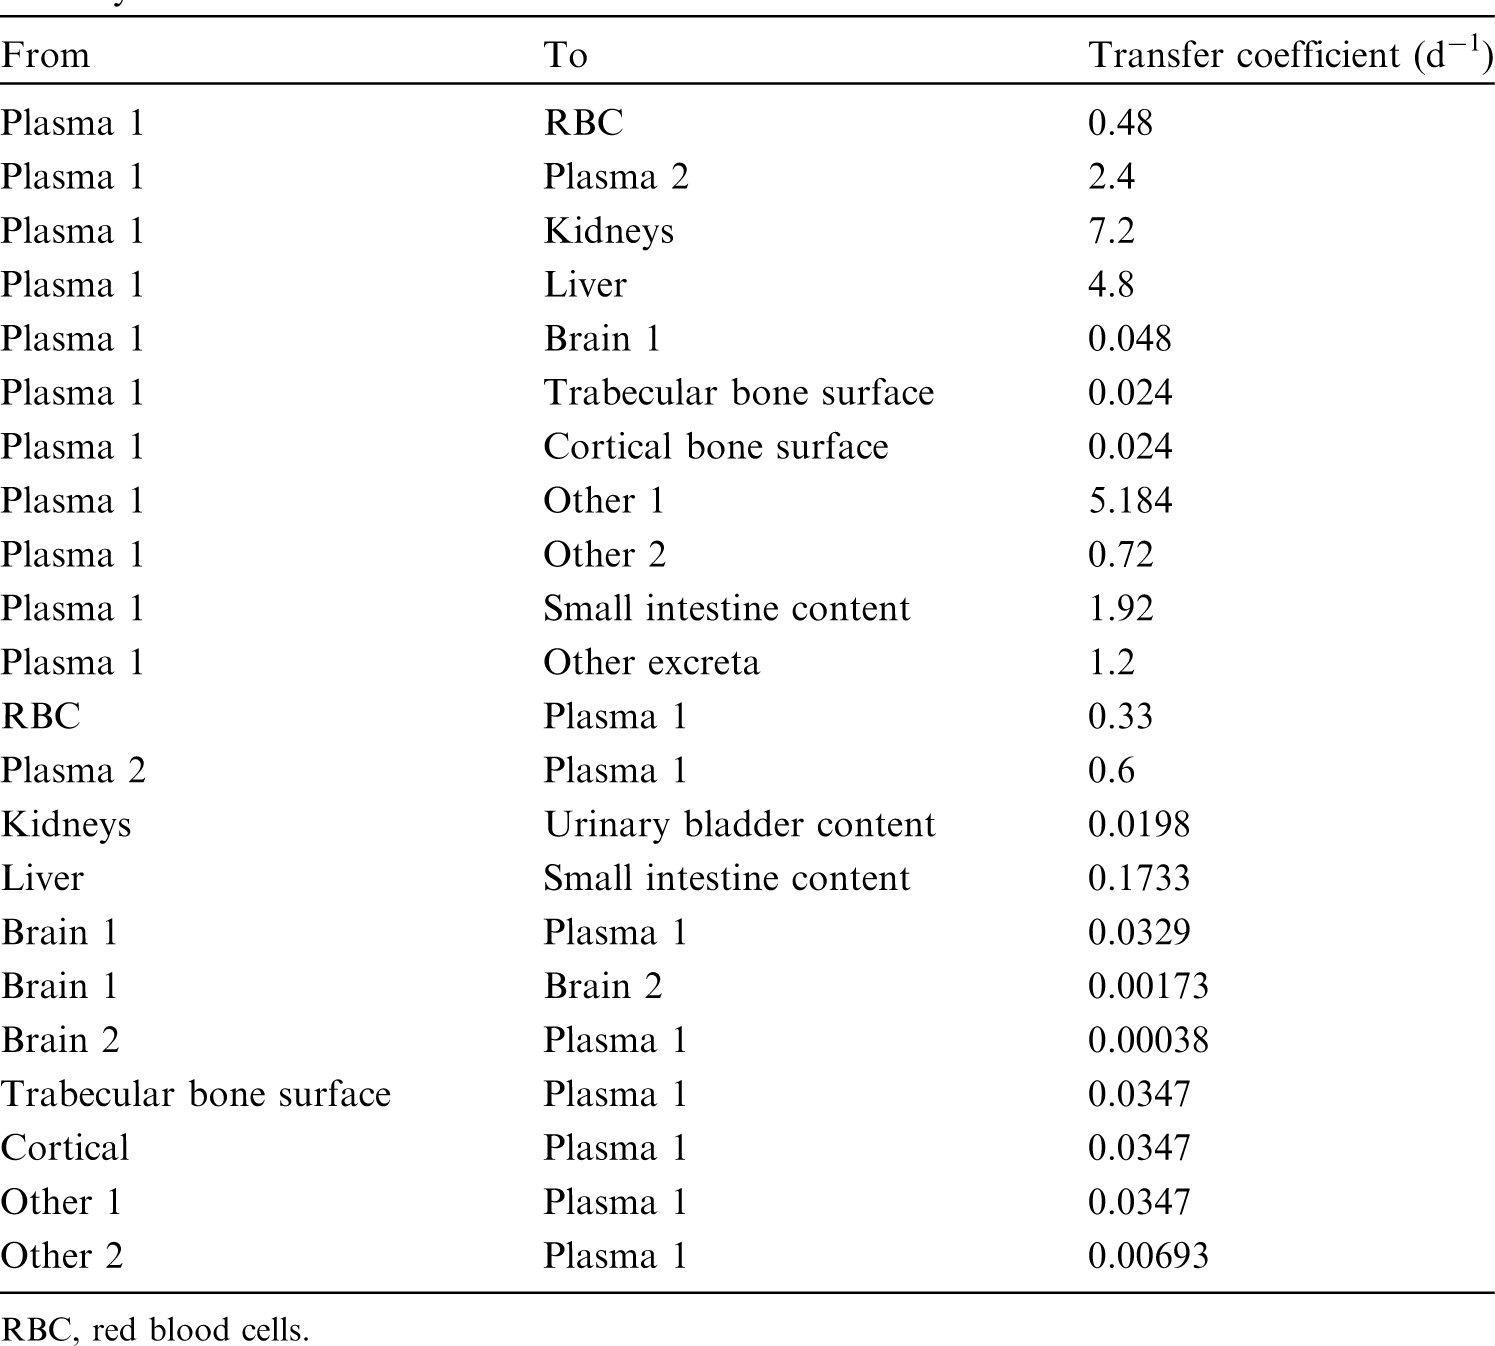


36.2.3.3. Treatment of progeny
(700) Progeny of mercury addressed in this publication are radioisotopes of mercury, gold, osmium, and platinum. The models for all four elements as progeny of mercury are expansions of the characteristic models for these elements with added compartments and associated transfer coefficients needed to solve the linked biokinetic models for chains headed by mercury (see Annex B). If produced in an ambiguous compartment (i.e. a compartment not explicitly named in the progeny’s model), the progeny is assumed to transfer at a specified rate to the central blood compartment of its characteristic biokinetic model, and to follow that model thereafter. The following transfer rates to the central blood compartment are assigned to mercury, gold, osmium, and platinum produced in an ambiguous compartment: 1000 d−1 if produced in a blood compartment; and at the following element-specific rates if produced in any other ambiguous compartment: gold, 0.0693 d−1; and osmium or platinum, 0.09902 d−1.
36.3. Individual monitoring
36.3.1. 203Hg
(701) Measurements of 203Hg may be performed by in-vivo whole-body measurement technique and by gamma measurement in urine.
36.4. Dosimetric data for mercury
37. Thallium (Z = 81)
37.1. Isotopes
37.2. Routes of intake
37.2.1. Inhalation
(702) For thallium, default parameter values were adopted on absorption to blood from the respiratory tract (ICRP, 2015). Absorption parameter values and types, and associated fA values for particulate forms of thallium are given in Table 37.2. Monitoring techniques for 203Hg. Measurement system comprised of germanium detectors. Counting time of 20 min. Committed effective dose coefficients (Sv Bq−1) for the inhalation or ingestion of 203Hg compounds. AMAD, activity median aerodynamic diameter. Dose per activity content of 203Hg in total body and in daily excretion of urine (Sv Bq−1); 5 µm activity median aerodynamic diameter aerosols inhaled by a reference worker at light work. Isotopes of thallium addressed in this publication. EC, electron-capture decay; B+, beta-plus decay; B−, beta-minus decay; IT, isomeric transition decay. Dose coefficients and bioassay data for this radionuclide are given in the printed copy of this publication. Data for other radionuclides listed in this table are given in the online electronic files on the ICRP website. Absorption parameter values for inhaled and ingested thallium. It is assumed that the bound state can be neglected for thallium (i.e. fb = 0). The values of sr for Type F, M, and S forms of thallium (30, 3, and 3 d−1, respectively) are the general default values. For inhaled material deposited in the respiratory tract and subsequently cleared by particle transport to the alimentary tract, the default fA values for inhaled materials are applied [i.e. the product of fr for the absorption type and the fA value for ingested soluble forms of thallium (1)]. Default Type M is recommended for use in the absence of specific information on which the exposure material can be assigned to an absorption type (e.g. if the form is unknown, or if the form is known but there is no information available on the absorption of that form from the respiratory tract). For guidance on the use of specific information, see Section 1.1. Activity transferred from systemic compartments into segments of the alimentary tract is assumed to be subject to reabsorption to blood. The default absorption fraction fA for the secreted activity is the highest value for any form of the radionuclide (fA = 1).


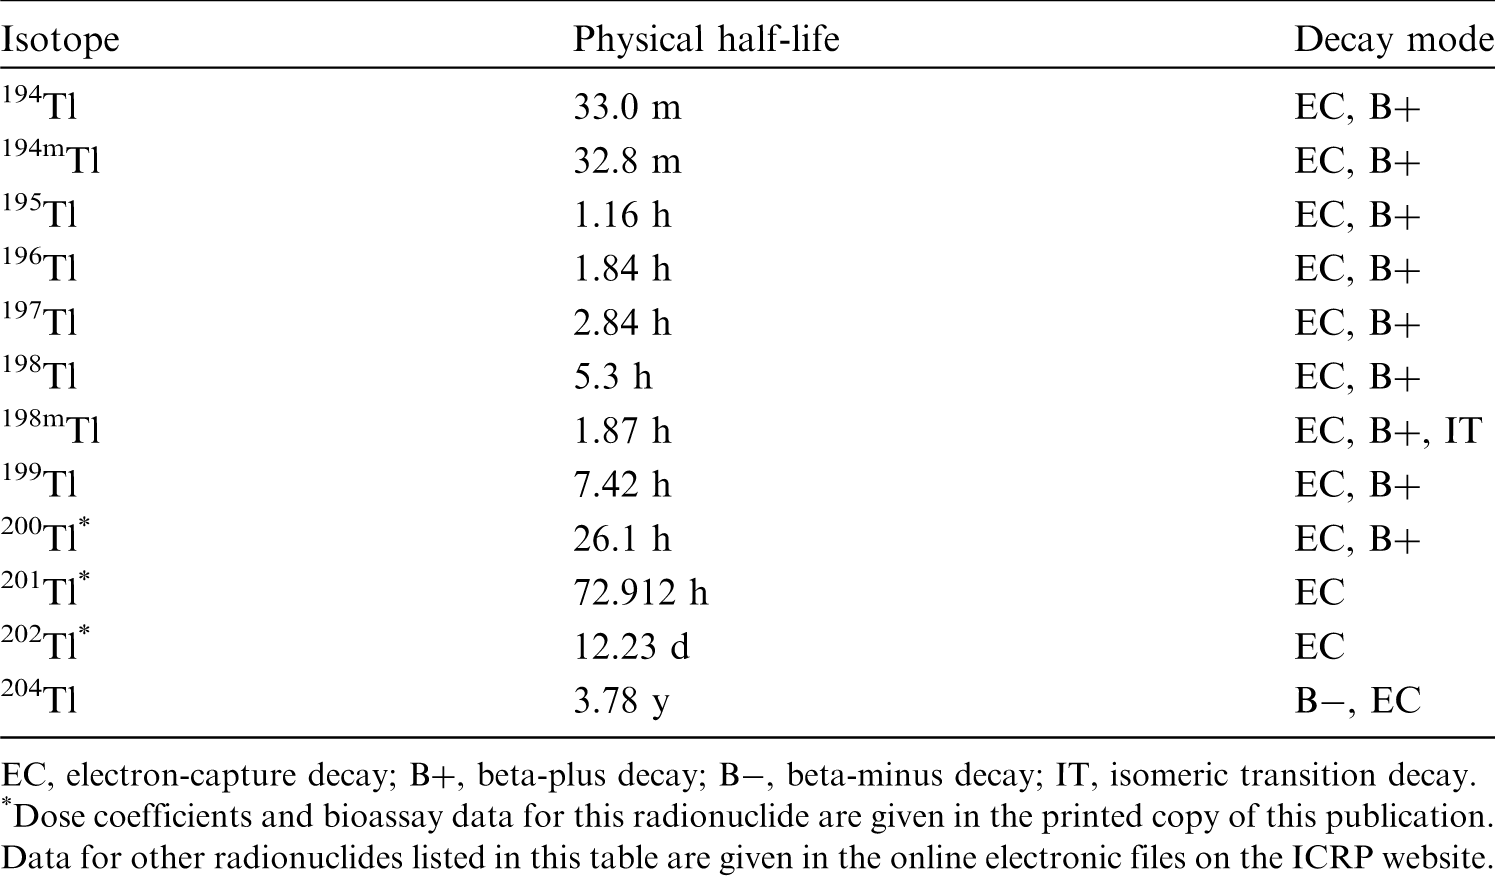

37.2.2. Ingestion
(703) Thallium is absorbed readily from the gastrointestinal tract. It has been detected in the urine of exposed humans and animals (US EPA, 2009), implying absorption from environmental sources. Limited quantitative data indicate that thallium is absorbed rapidly and extensively (60–100%) after oral administration of the sulphate or nitrate to humans (Barclay et al., 1953), dogs (Shaw, 1933), and rats (Lie et al., 1960; Manzo et al., 1983). However, Sabbioni et al. (1980) observed, 16 h and 8 d after oral administration to rats, ∼20 times reduced body retention of dimethyl thallium (III) bromide compared with that of inorganic thallium. This might indicate lower absorption of organic compounds. (704) In Publications 30 and 68 (ICRP, 1981, 1994a), f1 was taken as 1 for all compounds of the element. In this publication, fA = 1 is adopted as the default for all chemical forms of thallium ingested in the workplace.
37.2.3. Systemic distribution, retention, and excretion of thallium
37.2.3.1. Biokinetic data
(705) The biokinetics of thallium has been investigated extensively in human subjects and laboratory animals, due largely to the importance of radiothallium in nuclear medicine and many occurrences of poisoning with stable thallium (Gettler and Weiss, 1943; Barclay et al., 1953; Lie et al., 1960; Gehring and Hammond, 1967; Potter et al., 1971; Bradley-Moore et al., 1975; Strauss et al., 1975; Atkins et al., 1977; Suzuki et al., 1978; Berger et al., 1983; Nakamura et al., 1985; Gregus and Klaassen, 1986; Krahwinkel et al., 1988; Lathrop et al., 1989; Blanchardon et al., 2005; Thomas et al., 2005). Comparisons of the disappearance of radioisotopes of thallium, potassium, and rubidium from blood and their uptake by tissues of laboratory animals suggest a close relationship in the movement of these elements (Gehring and Hammond, 1967; Strauss et al., 1975). These elements are removed rapidly from plasma, and their early distributions are determined largely by the distribution of cardiac output. After entering the cell, thallium is released more slowly than potassium or rubidium, but the mean residence time of thallium in the body is less than that of potassium or rubidium due to a higher rate of clearance from plasma to excretion pathways. (706) Most reported removal half-times of thallium from the adult human body are in the range 9–13 d (Atkins et al., 1977; Krahwinkel et al., 1988; Blanchardon et al., 2005). Chen et al. (1983) reported two components of retention of thallium: 7d and 28 d for 63% and 37% of the injected amount, respectively. It appears that faecal excretion typically represents more than half of cumulative excretion of thallium over a period of weeks following its acute intake, although some relatively short-term human studies have suggested that excretion of thallium is primarily in urine (Barclay et al., 1953; Lathrop et al., 1975; Atkins et al., 1977; Blanchardon et al., 2005).
37.2.3.2. Biokinetic model for systemic thallium
(707) The structure of the biokinetic model for thallium used in this publication is shown in Fig. 37.1. Transfer coefficients are listed in Table 37.3. (708) It is assumed that thallium leaves the central blood compartment (‘Plasma’) at a rate of 200 d−1 (corresponding to a half-time of 5 min) and is distributed as follows: 2.5% to RBC, 0.75% to urinary bladder content, 1.75% to right colon content, 5% to kidneys, 5% to liver, 7.5% to trabecular bone surface, 7.5% to cortical bone surface, and 70% to remaining soft tissues (‘Other’). Thallium returns from RBC to plasma at a rate of 3.7 d−1, and from tissue compartments to plasma at a rate of 2.5 d−1. Transfer coefficients in the biokinetic model for systemic thallium. RBC, red blood cells. Daily excretion of 203Hg following inhalation of 1 Bq mercury vapour. Daily excretion of 203Hg following inhalation of 1 Bq Type F. Daily excretion of 203Hg following inhalation of 1 Bq Type M. Daily excretion of 203Hg following inhalation of 1 Bq Type S. Structure of the biokinetic model for systemic thallium. RBC, red blood cells.
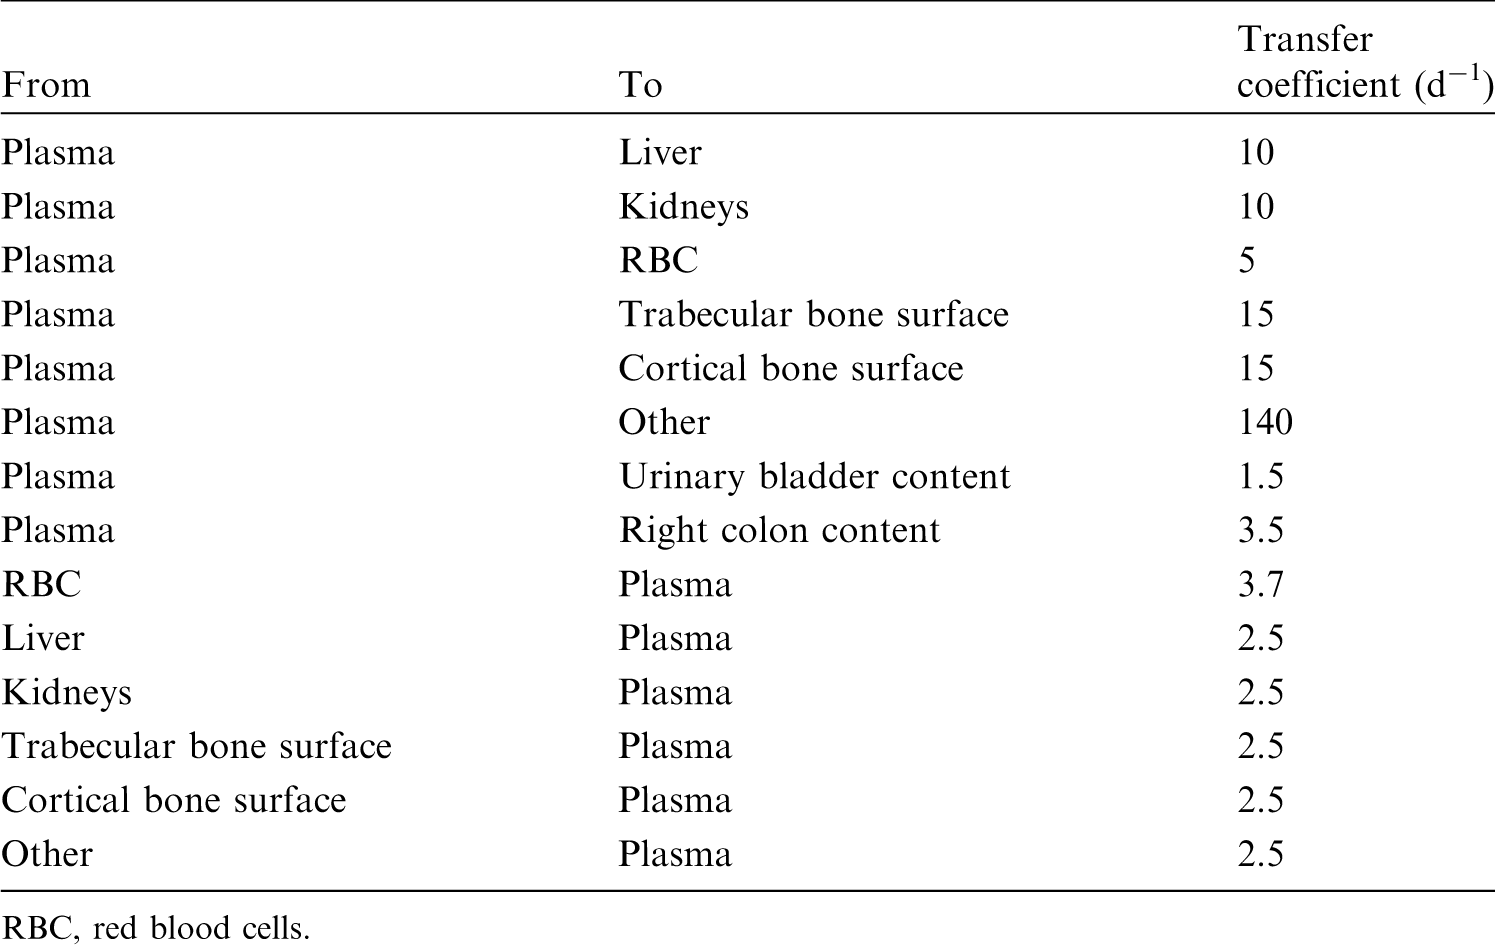

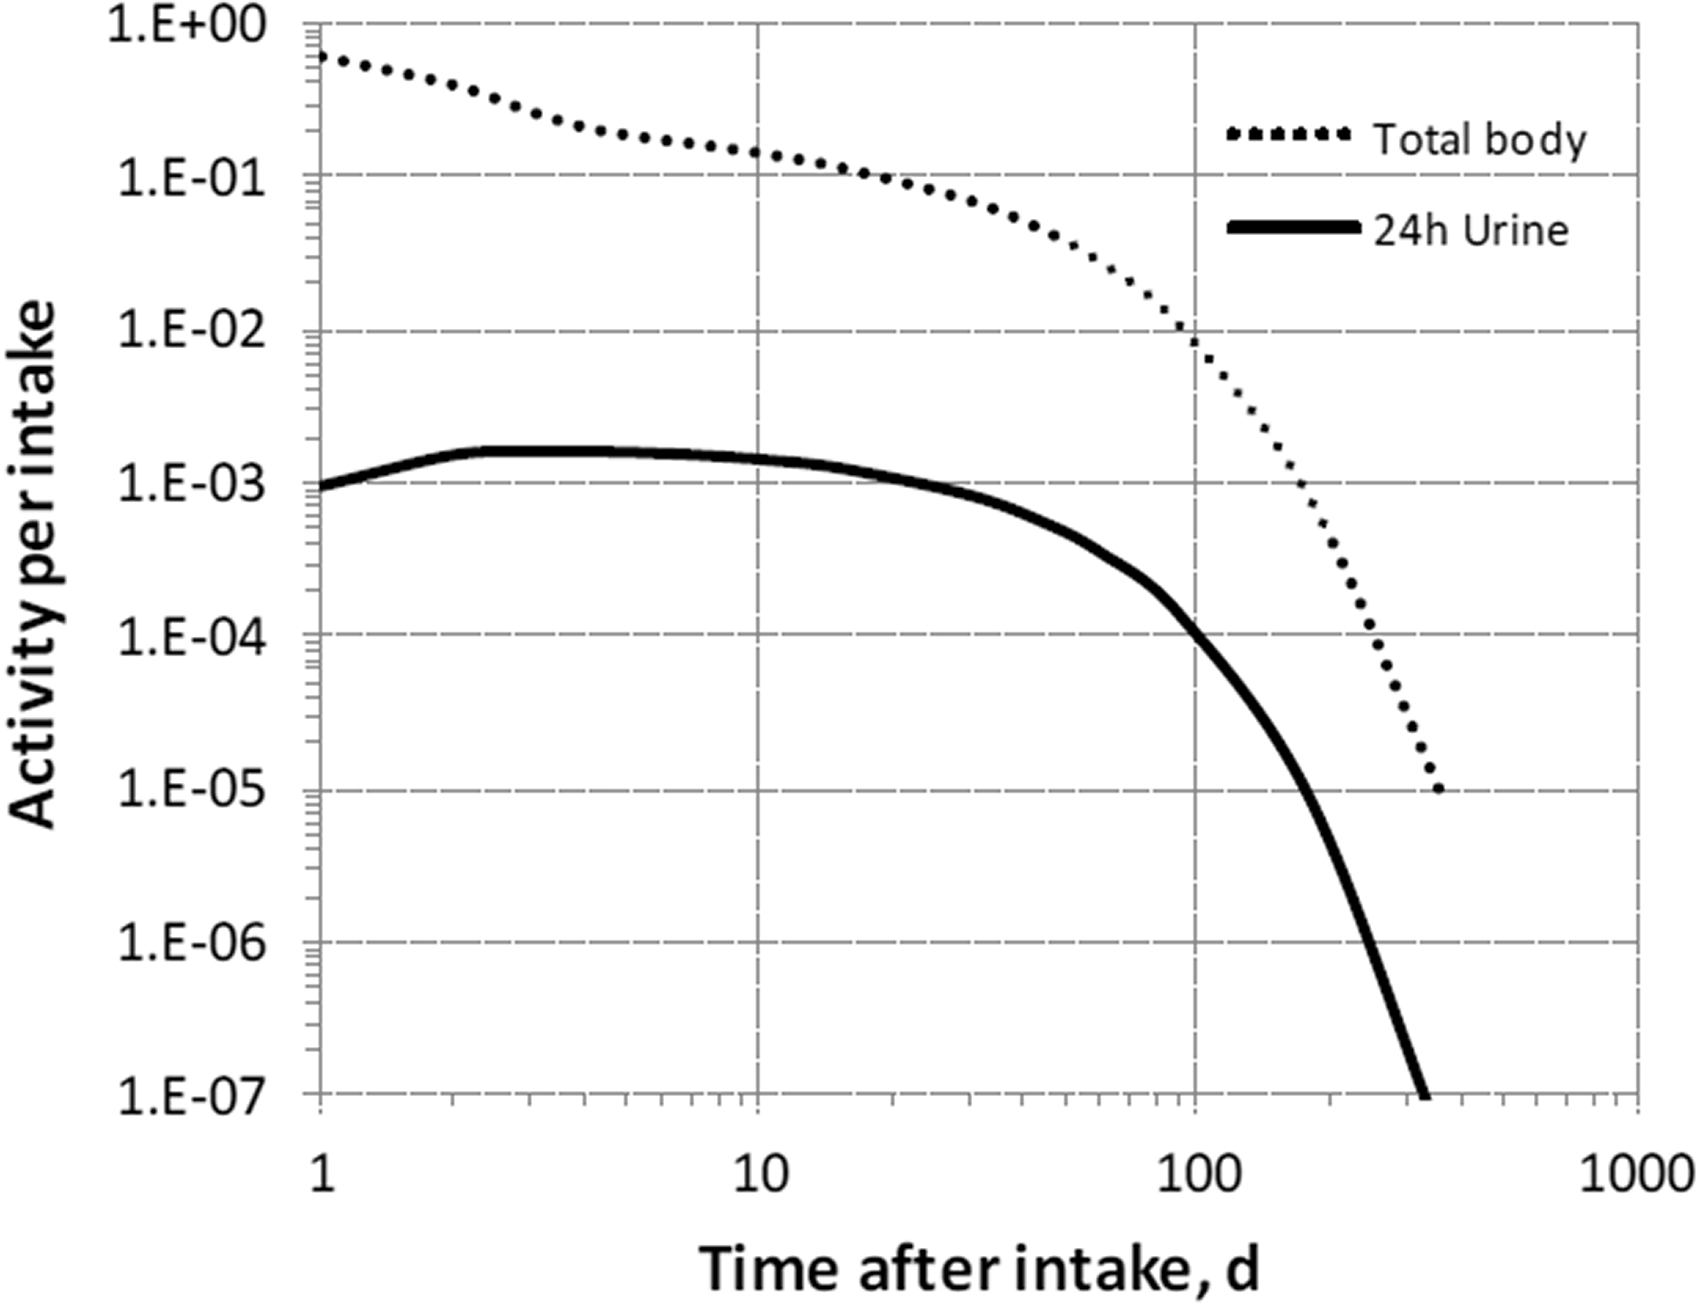

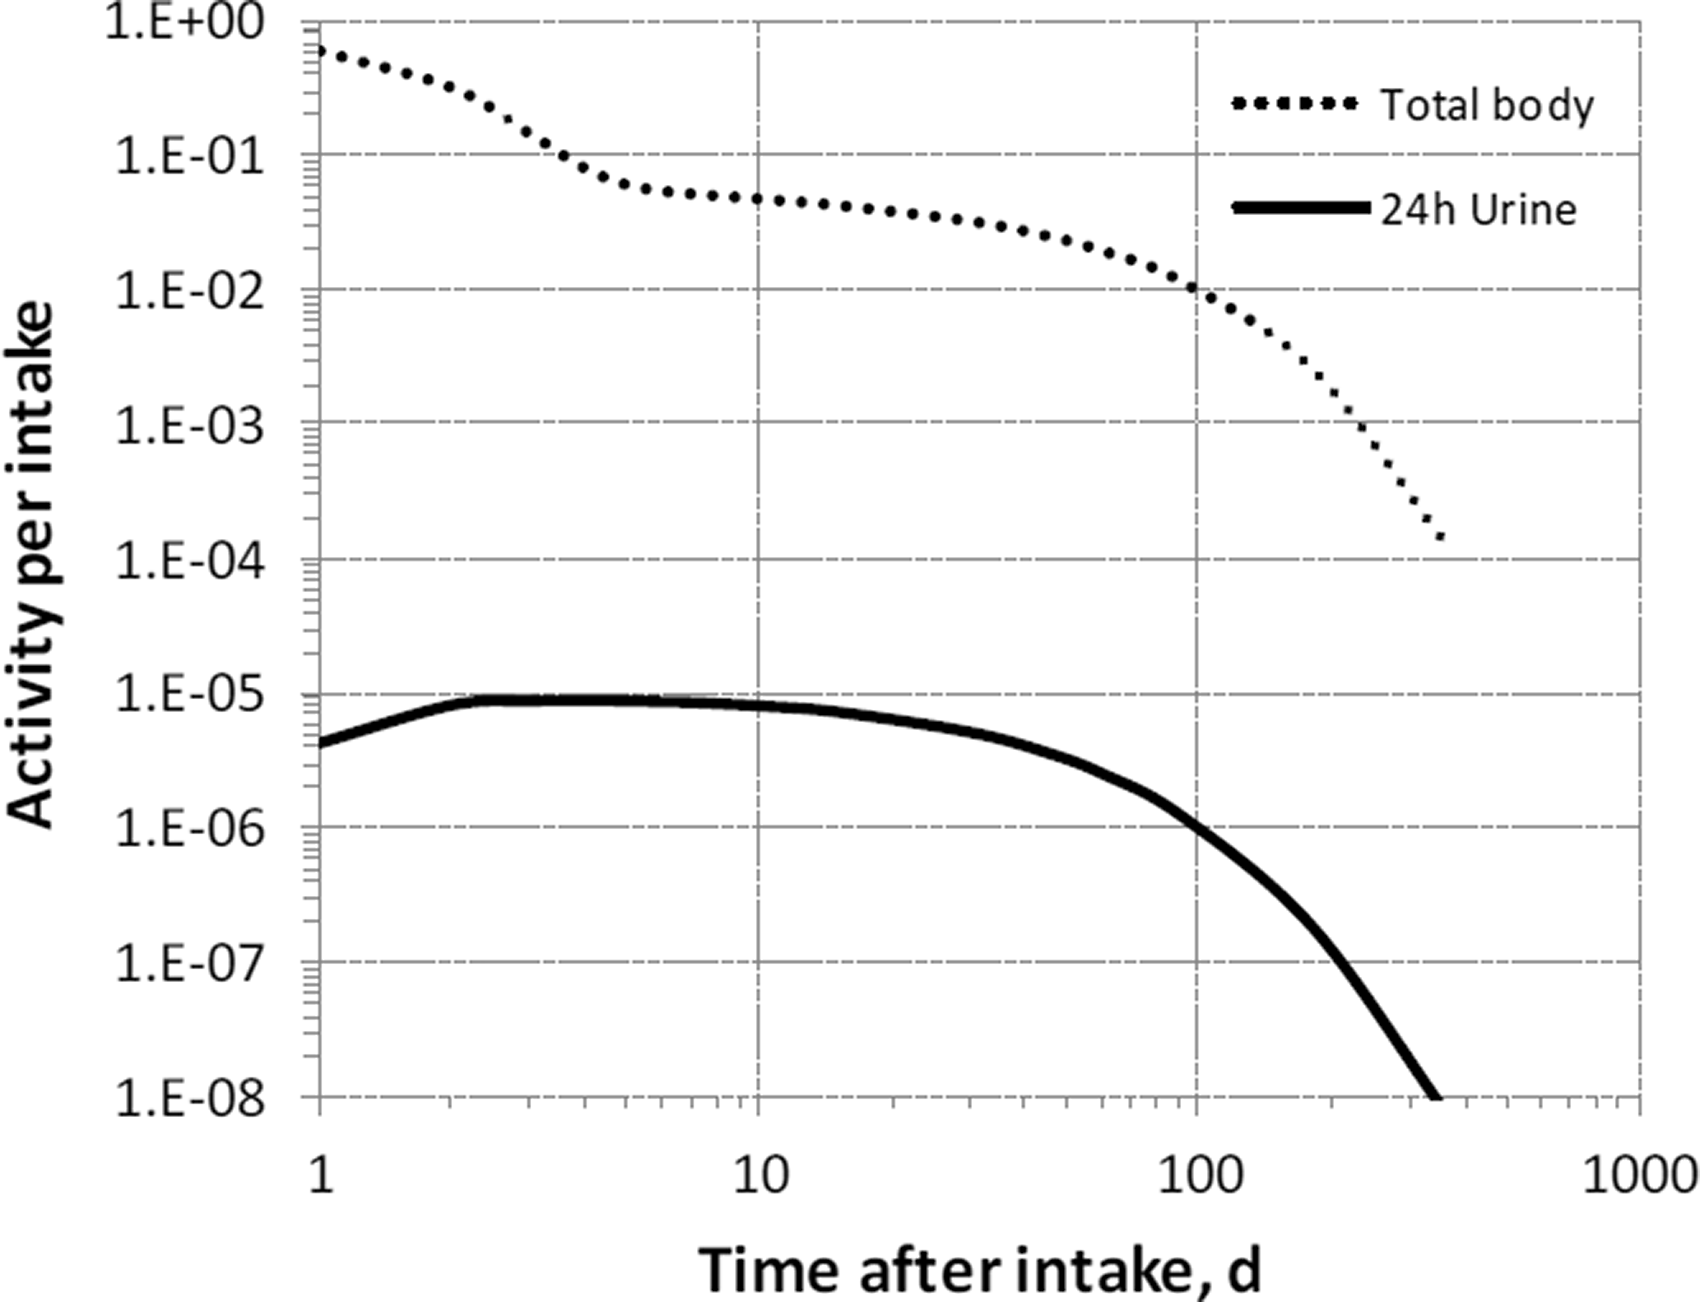

37.2.3.3. Treatment of progeny
(709) Progeny of thallium addressed in this publication are isotopes of thallium, mercury, and gold. The model for thallium as a parent is applied to thallium produced by decay of another isotope of thallium. The characteristic models for gold and divalent mercury are applied to these elements as members of chains headed by thallium with added transfer coefficients needed to solve the linked biokinetic models of chains headed by thallium. The following transfer rates to the central blood compartment are added to the characteristic model for mercury or gold: 1000 d−1 if produced in a blood compartment not contained in the progeny’s model; and at the following element-specific rates if produced in any other ambiguous compartment: mercury, 0.0347 d−1; and gold, 0.0693 d−1.
37.3. Individual monitoring
37.3.1. 200Tl
(710) Measurements of 200Tl in urine may be used to determine intakes of the radionuclide.
37.3.2. 201Tl
(711) Measurements of 201Tl in urine may be used to determine intakes of the radionuclide.
37.3.3. 202Tl
(712) Measurements of 202Tl in urine may be used to determine intakes of the radionuclide.
37.4. Dosimetric data for thallium
38. Astatine (Z = 85)
38.1. Isotopes
38.2. Routes of intake
38.2.1. Inhalation
(713) For astatine, default parameter values were adopted for absorption to blood from the respiratory tract (ICRP, 2015). For astatine and the other halogens, intakes could be in both particulate and gas and vapour forms, and it is therefore assumed that inhaled astatine is 50% particulate and 50% gas/vapour in the absence of information (ICRP, 2002b). Absorption parameter values and types, and associated fA values for gas and vapour forms of astatine are given in Table 38.2 and for particulate forms in Table 38.3. By analogy with the halogen iodine, considered in detail in Publication 137 (ICRP, 2017), default Type F is recommended for particulate forms in the absence of specific information on which the exposure material can be assigned to an absorption type. Monitoring techniques for 200Tl. Measurement system comprised of germanium detectors. Monitoring techniques for 201Tl. Measurement system comprised of germanium detectors. Monitoring techniques for 202Tl. Measurement system comprised of germanium detectors. Committed effective dose coefficients (Sv Bq−1) for the inhalation or ingestion of 200Tl, 201Tl, and 202Tl compounds. AMAD, activity median aerodynamic diameter. Dose per activity content of 200Tl in daily excretion of urine (Sv Bq−1); 5 µm activity median aerodynamic diameter aerosols inhaled by a reference worker at light work. N/A, not applicable. Dose per activity content of 201Tl in daily excretion of urine (Sv Bq−1); 5 µm activity median aerodynamic diameter aerosols inhaled by a reference worker at light work. N/A, not applicable. Dose per activity content of 202Tl in daily excretion of urine (Sv Bq−1); 5 µm activity median aerodynamic diameter aerosols inhaled by a reference worker at light work. N/A, not applicable. Isotopes of astatine addressed in this publication. EC, electron-capture decay; B+, beta-plus decay; B−, beta-minus decay; A, alpha decay. Dose coefficients and bioassay data for this radionuclide are given in the printed copy of this publication. Data for other radionuclides listed in this table are given in the online electronic files on the ICRP website. Deposition and absorption for gas and vapour compounds of astatine. ET1, anterior nasal passage; ET2, posterior nasal passage, pharynx, and larynx; BB, bronchial; bb, bronchiolar; AI, alveolar-interstitial. Percentage deposited refers to how much of the material in the inhaled air remains in the body after exhalation. Almost all inhaled gas molecules contact airway surfaces, but usually return to the air unless they dissolve in, or react with, the surface lining. The default distribution between regions is assumed: 20% ET2, 10% BB, 20% bb, and 50% AI. It is assumed that the bound state can be neglected for astatine (i.e. fb = 0). For inhaled material deposited in the respiratory tract and subsequently cleared by particle transport to the alimentary tract, the default fA values for inhaled materials are applied [i.e. the product of fr for the absorption type (or specific value where given) and the fA value for ingested soluble forms of astatine (1)]. Absorption parameter values for inhaled and ingested astatine. It is assumed that the bound state can be neglected for astatine (i.e. fb = 0). The values of sr for Type F, M, and S forms of astatine (30, 3, and 3 d−1, respectively) are the general default values. For inhaled material deposited in the respiratory tract and subsequently cleared by particle transport to the alimentary tract, the default fA values for inhaled materials are applied [i.e. the product of fr for the absorption type and the fA value for ingested soluble forms of astatine (1)]. Default Type F is recommended for use in the absence of specific information on which the exposure material can be assigned to an absorption type (e.g. if the form is unknown, or if the form is known but there is no information available on the absorption of that form from the respiratory tract). For guidance on the use of specific information, see Section 1.1. Activity transferred from systemic compartments into segments of the alimentary tract is assumed to be subject to reabsorption to blood. The default absorption fraction fA for the secreted activity is the highest value for any form of the radionuclide (fA = 1).

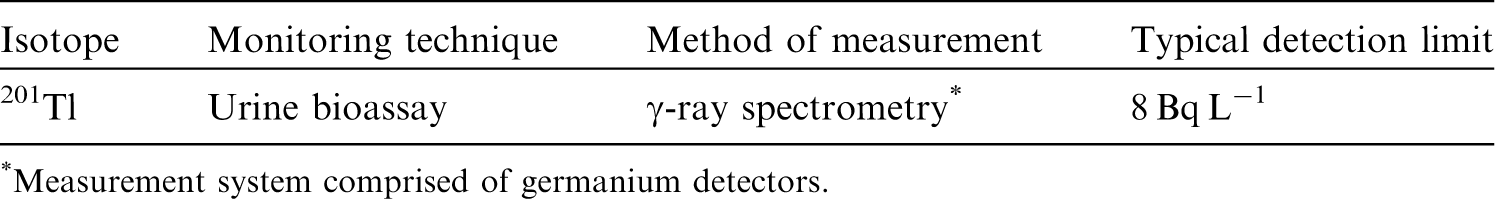
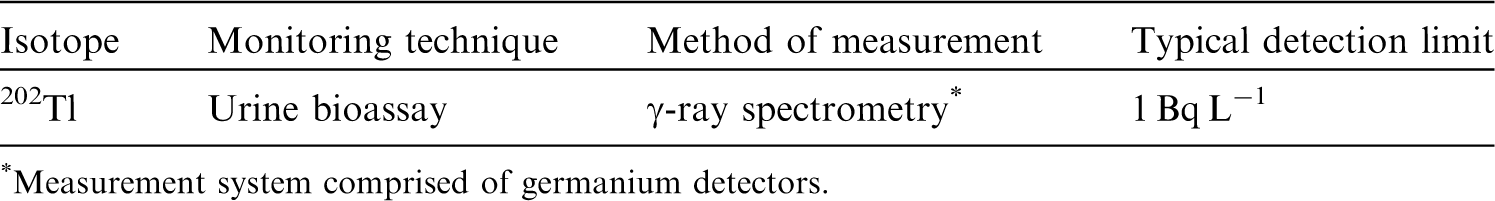
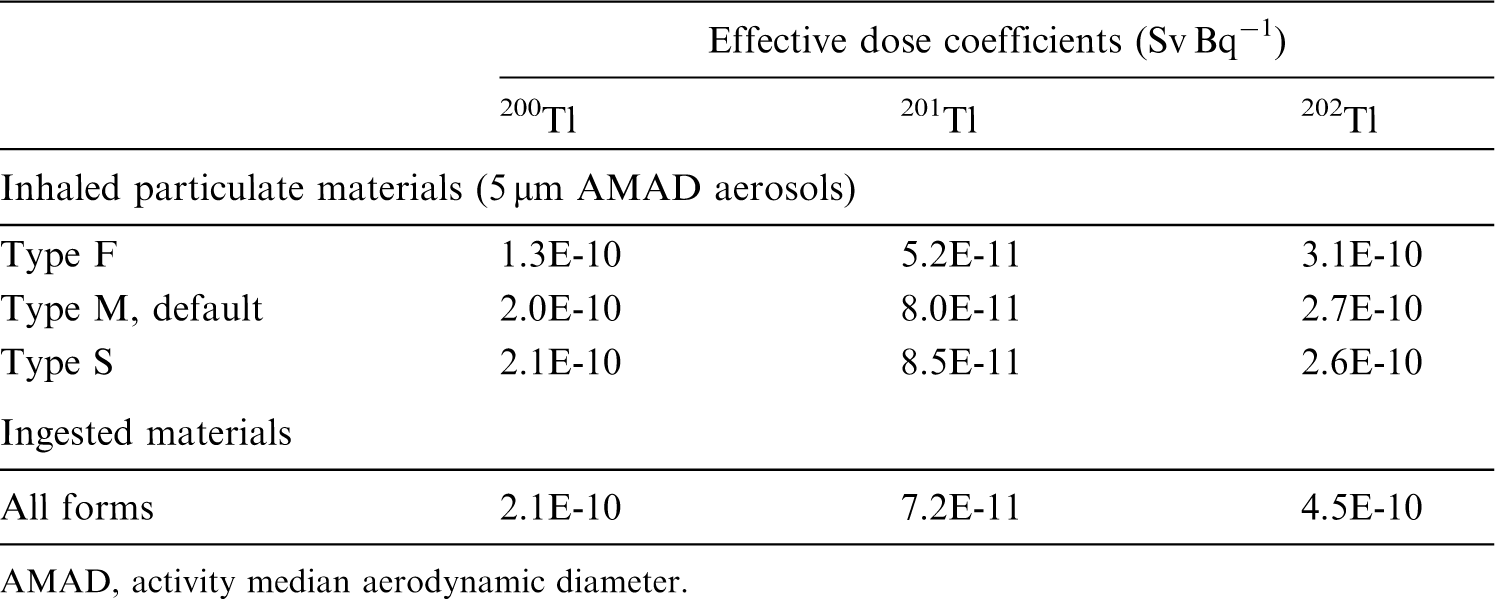
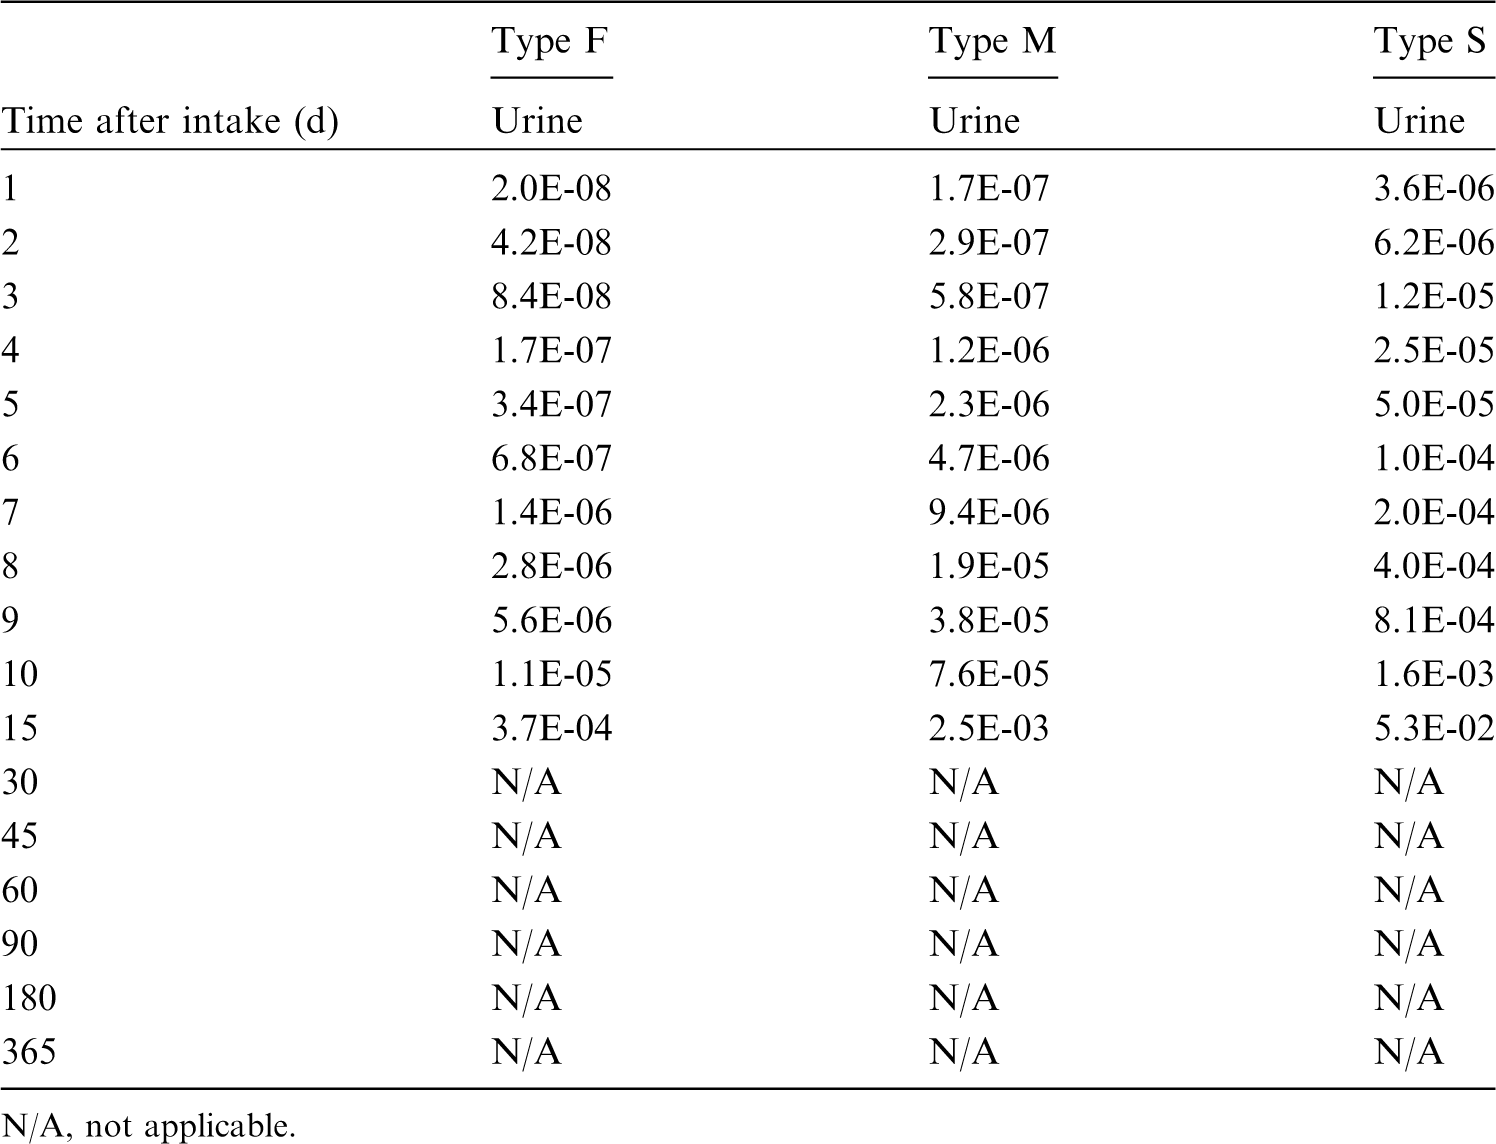

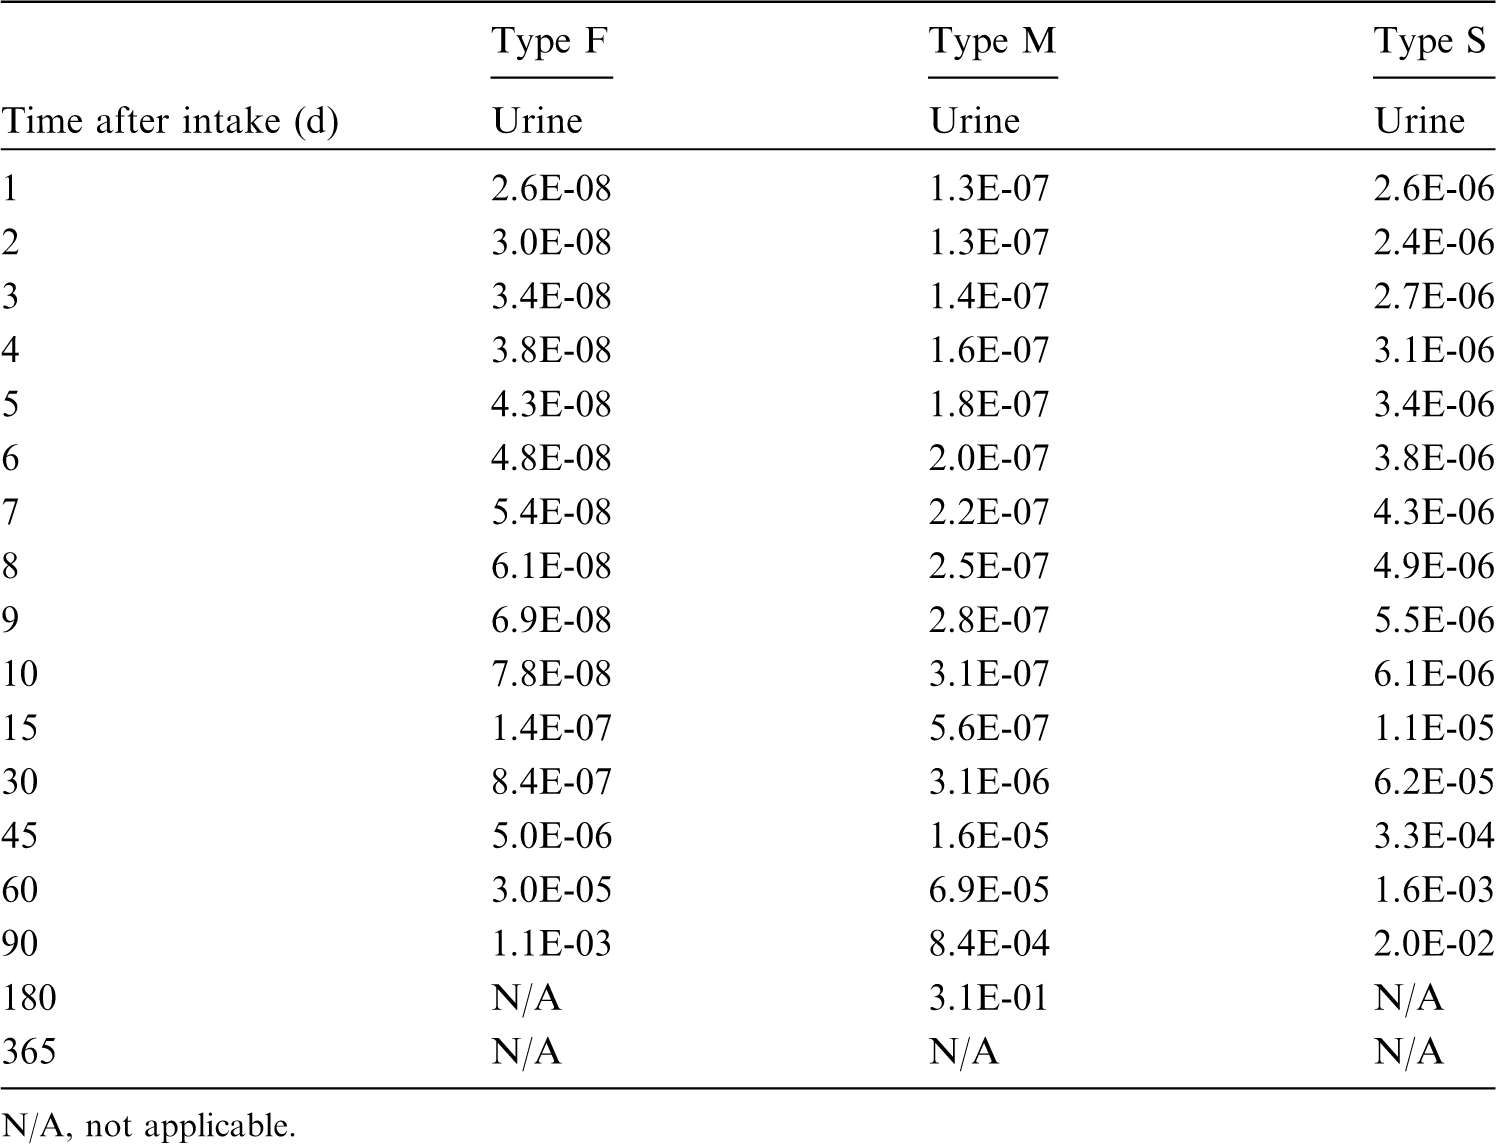


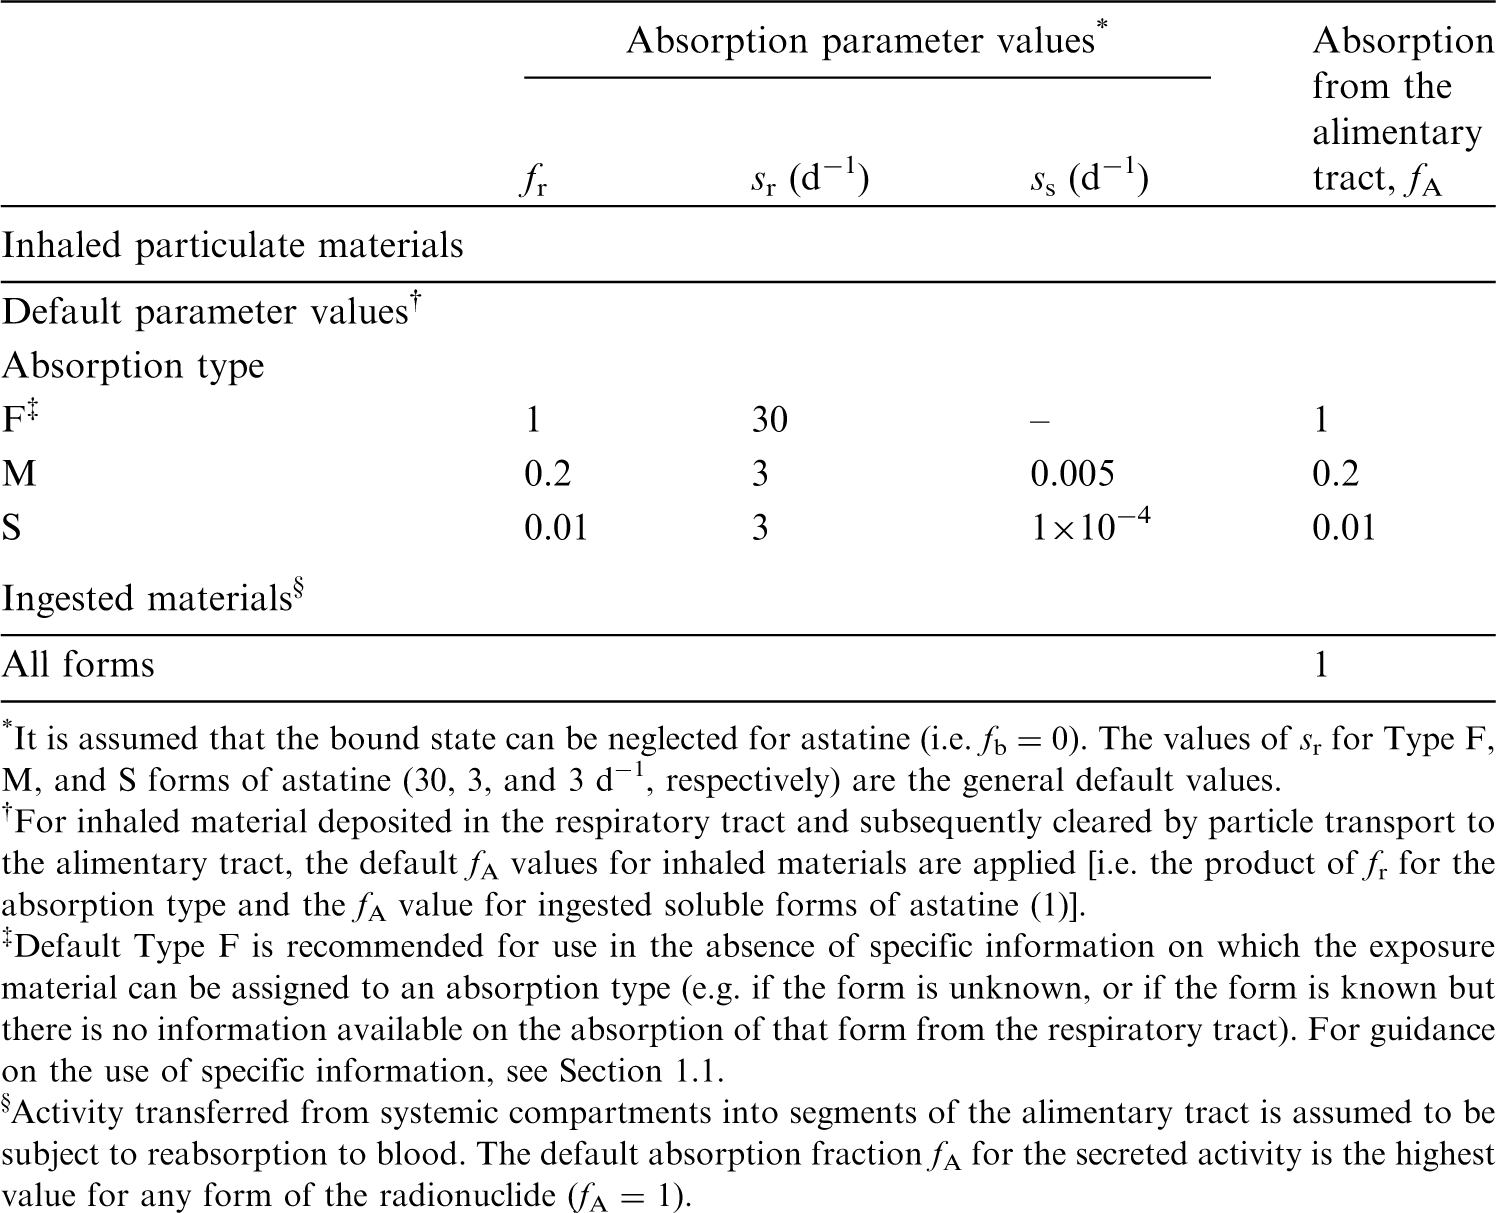
38.2.2. Ingestion
(714) There appears to be no data on the gastrointestinal absorption of astatine. However, as another halogen, it may be expected to be absorbed in a proportion close to that of iodine. Injection studies confirm similar behaviour of astatide and iodide, and indicate partial in-vivo deastatination of organic compounds, formation of sulphur–astatine bonds with proteins, and similar tissue distribution for At−, At0, and At+ (Visser et al., 1981). (715) In Publications 30 and 68 (ICRP, 1981, 1994a), f1 was taken to be 1 for all compounds of astatine by analogy with the lighter halides, chlorine, bromine, and iodine. The same value of fA (1) is used in this publication for all chemical forms of astatine.
38.2.3. Systemic distribution, retention, and excretion of astatine
38.2.3.1. Biokinetic data
(716) Astatine is the heaviest member of the halogen group of elements (Group VIIA of the periodic table). The systemic behaviour of astatine administered as astatide resembles that of the next heaviest halogen, iodine administered as iodide, particularly regarding the selective uptake by the thyroid gland and stomach wall. Other biological similarities of astatine and iodine include their blood clearance rates and excretion patterns. However, some quantitative differences in their systemic behaviours are evident. The level of accumulation of astatine in the thyroid was lower than that of iodine during the first day after administration to human subjects, monkeys, guinea pigs, rats, and mice (Hamilton et al., 1953; Shellabarger and Godwin, 1954; Cobb et al., 1988; Garg et al., 1990). Also, astatine showed longer retention than iodine in the stomach wall and in most other soft tissues (Hamilton et al., 1953; Garg et al., 1990). It is not known whether astatine becomes organically bound in the thyroid, similarly to iodine. (717) Following parenteral administration to guinea pigs, the thyroidal content and cumulative urinary and faecal excretion at 4 h represented 8.5%, 12%, and 0.8%, respectively, of the administered amount of iodide, and 3.4%, 8.8%, and 0.4%, respectively, of administered astatide (Hamilton and Soley, 1940). Corresponding values at 18 h were 17%, 37%, and 17% for iodide, and 5.4%, 36%, and 13% for astatide. The thyroid content of astatine decreased with a biological half-life of about 3 d from 18 to 65 h. No biological removal of iodine from the thyroid was evident during that period. (718) Hamilton et al. (1953) compared the biokinetics of intravenously administered 211At (in sodium sulfite and sodium chloride) and 131I (in sodium chloride) in rats. Plasma clearance was rapid for both radionuclides, with clearance of 131I slightly faster than that of 211At. At 24 h, plasma contained ∼0.9% of injected 211At and 0.6% of injected 131I (after correction for radioactive decay). At 1 h, the thyroid and stomach wall contained, on average, 5.6% and 6.1%, respectively, of injected 131I, and 1.1% and 5.2%, respectively, of injected 211At. The stomach content of 131I decreased steadily to ∼0.5% of the injected amount at 24 h, while the stomach content of 211At increased to 9.9% of the injected amount at 4 h and then decreased gradually to 5.9% at 24 h. The thyroid content of both radionuclides peaked at 24 h, at which time the thyroid contained ∼1.5% of injected 211At and 12% of injected 131I. The 211At content of the thyroid decreased by approximately a factor of 2 from 24 to 48 h, and showed little if any change from 48 to 72 d. The 131I content decreased more slowly than that of 211At after 24 h, declining by approximately one-quarter from 24 to 72 h. Non-thyroidal tissues generally contained a larger portion of injected 211At than injected 131I from 4 to 24 h. (719) Hamilton et al. (1953, 1954a,b) observed higher thyroidal accumulation of 211At (astatide) in limited studies on monkeys and human subjects than was observed in rats. In two monkeys, the thyroid contained 9% and 20% of administered 211At at 24 h. In human subjects with various forms of thyroid pathology, 4.6–17.8% of administered 211At was contained in the thyroid at 24 h, compared with 12–30% of administered 131I (Hamilton et al., 1954a). (720) Harrison and Royle (1984) measured the content of 211At (astatide) in blood, thyroid, kidneys, and testes of mice over the first 28.5 h after intravenous injection. The blood content (corrected for decay) declined to ∼1% of the injected amount by ∼12 h post injection and remained at that level through 28.5 h. The thyroid content peaked at ∼3.5% of the injected amount within 3–4 h post injection, declined to ∼40% of the peak content by 12–15 h, and remained near that level through 28.5 h. (721) Larsen et al. (1998) compared the biokinetics of intravenously administered iodide (131I) and astatide (211At) in mice. Activity concentrations were determined in 12 tissues and in blood. High concentrations of 131I were measured in the thyroid and stomach at 1 and 4 h, with relatively low concentrations found in other tissues at 4 h. The thyroid showed high concentrations of 211At at 1 and 4 h, but only approximately one-half of that of 131I at 1 h and one-quarter at 4 h. The two radionuclides showed similar uptake by the stomach wall at 1 h. By 4 h, the concentration of 131I in the stomach had decreased considerably, while the 211At concentration showed little change. On average, the 211At concentration in individual tissues (% dosage g−1) was 2.2 and 3.0 times the 131I concentration at 1 and 4 h, respectively. (722) Cederkrantz et al. (2015) treated patients with intraperitoneal administration of 211At-MX35 F(ab′)2. They estimated that 10% of the administered 211At escaped from the peritoneal cavity and distributed throughout the body. Absorbed doses to tissues from free 211At were estimated from blood and urine samples, external measurements, and pre-clinical data. Estimated absorbed doses (mGy) to selected tissues decreased in the order: thyroid (blocked with potassium perchlorate), 1.8; kidney, 1.7; lung, 1.6; spleen, 1.3; heart, 1.2; liver, 0.52; red bone marrow, 0.15; breast, 0.14.
38.2.3.2. Biokinetic model for systemic astatine
(723) The biokinetic model for systemic astatine used in this publication is a modification of the sub-model for iodide in the systemic model for iodine adopted in Publication 137 (ICRP, 2017), based on observed similarities and differences in the systemic behaviours of these elements. Fractional uptake of astatine from plasma to the thyroid is assumed to be 40% of the value for iodine. Greater accumulation of astatine than iodine in extrathyroidal tissues is assumed. The structure of the model for iodide is simplified in some ways for application to astatine (e.g. by representing ‘Liver’, ‘Kidneys’, and ‘Other’ as single rather than multiple compartments), but additional tissues are treated explicitly in the astatine model based on apparent differences of the level of accumulation of iodine and astatine in these tissues. (724) The structure of the biokinetic model for systemic astatine applied in this publication is shown in Fig. 38.1. Transfer coefficients are listed in Table 38.4. Transfer coefficients in the biokinetic model for systemic astatine. Daily excretion of 200Tl following inhalation of 1 Bq Type F. Daily excretion of 200Tl following inhalation of 1 Bq Type M. Daily excretion of 200Tl following inhalation of 1 Bq Type S. Daily excretion of 201Tl following inhalation of 1 Bq Type F. Daily excretion of 201Tl following inhalation of 1 Bq Type M. Daily excretion of 201Tl following inhalation of 1 Bq Type S. Daily excretion of 202Tl following inhalation of 1 Bq Type F. Daily excretion of 202Tl following inhalation of 1 Bq Type M. Daily excretion of 202Tl following inhalation of 1 Bq Type S. Structure of the biokinetic model for systemic astatine. Effective dose rate coefficient for submersion exposure – electrons. Effective dose rate coefficient for submersion exposure – photons. Effective dose rate coefficient for submersion exposure – positrons.
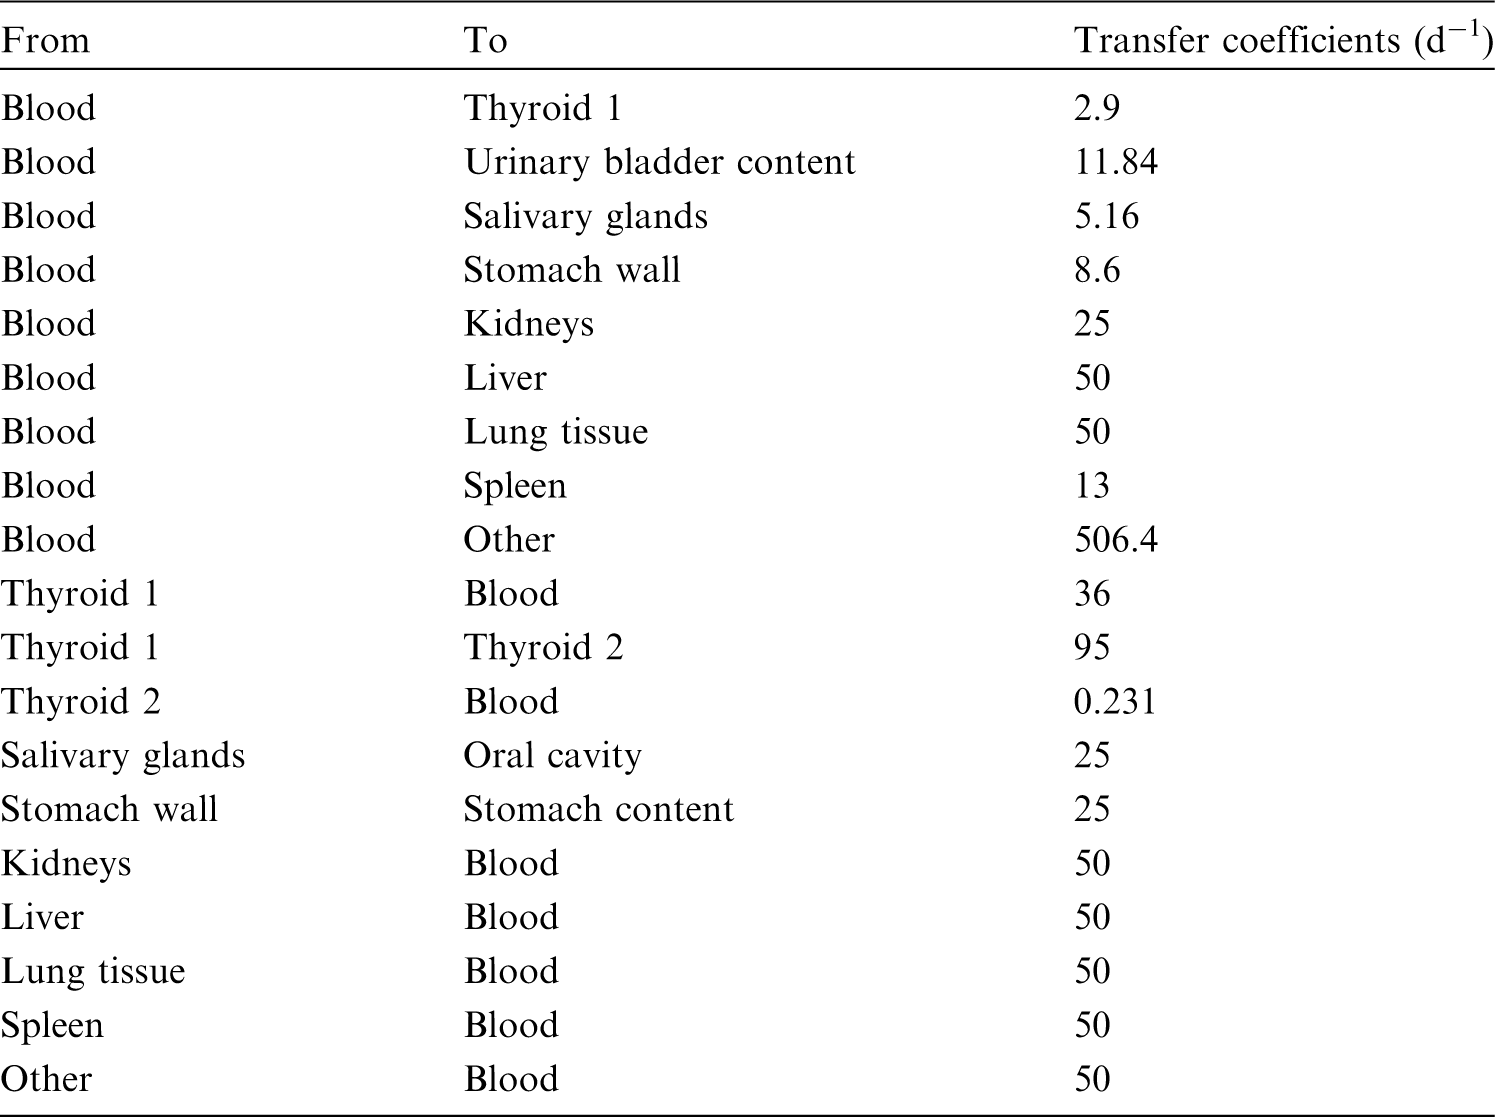


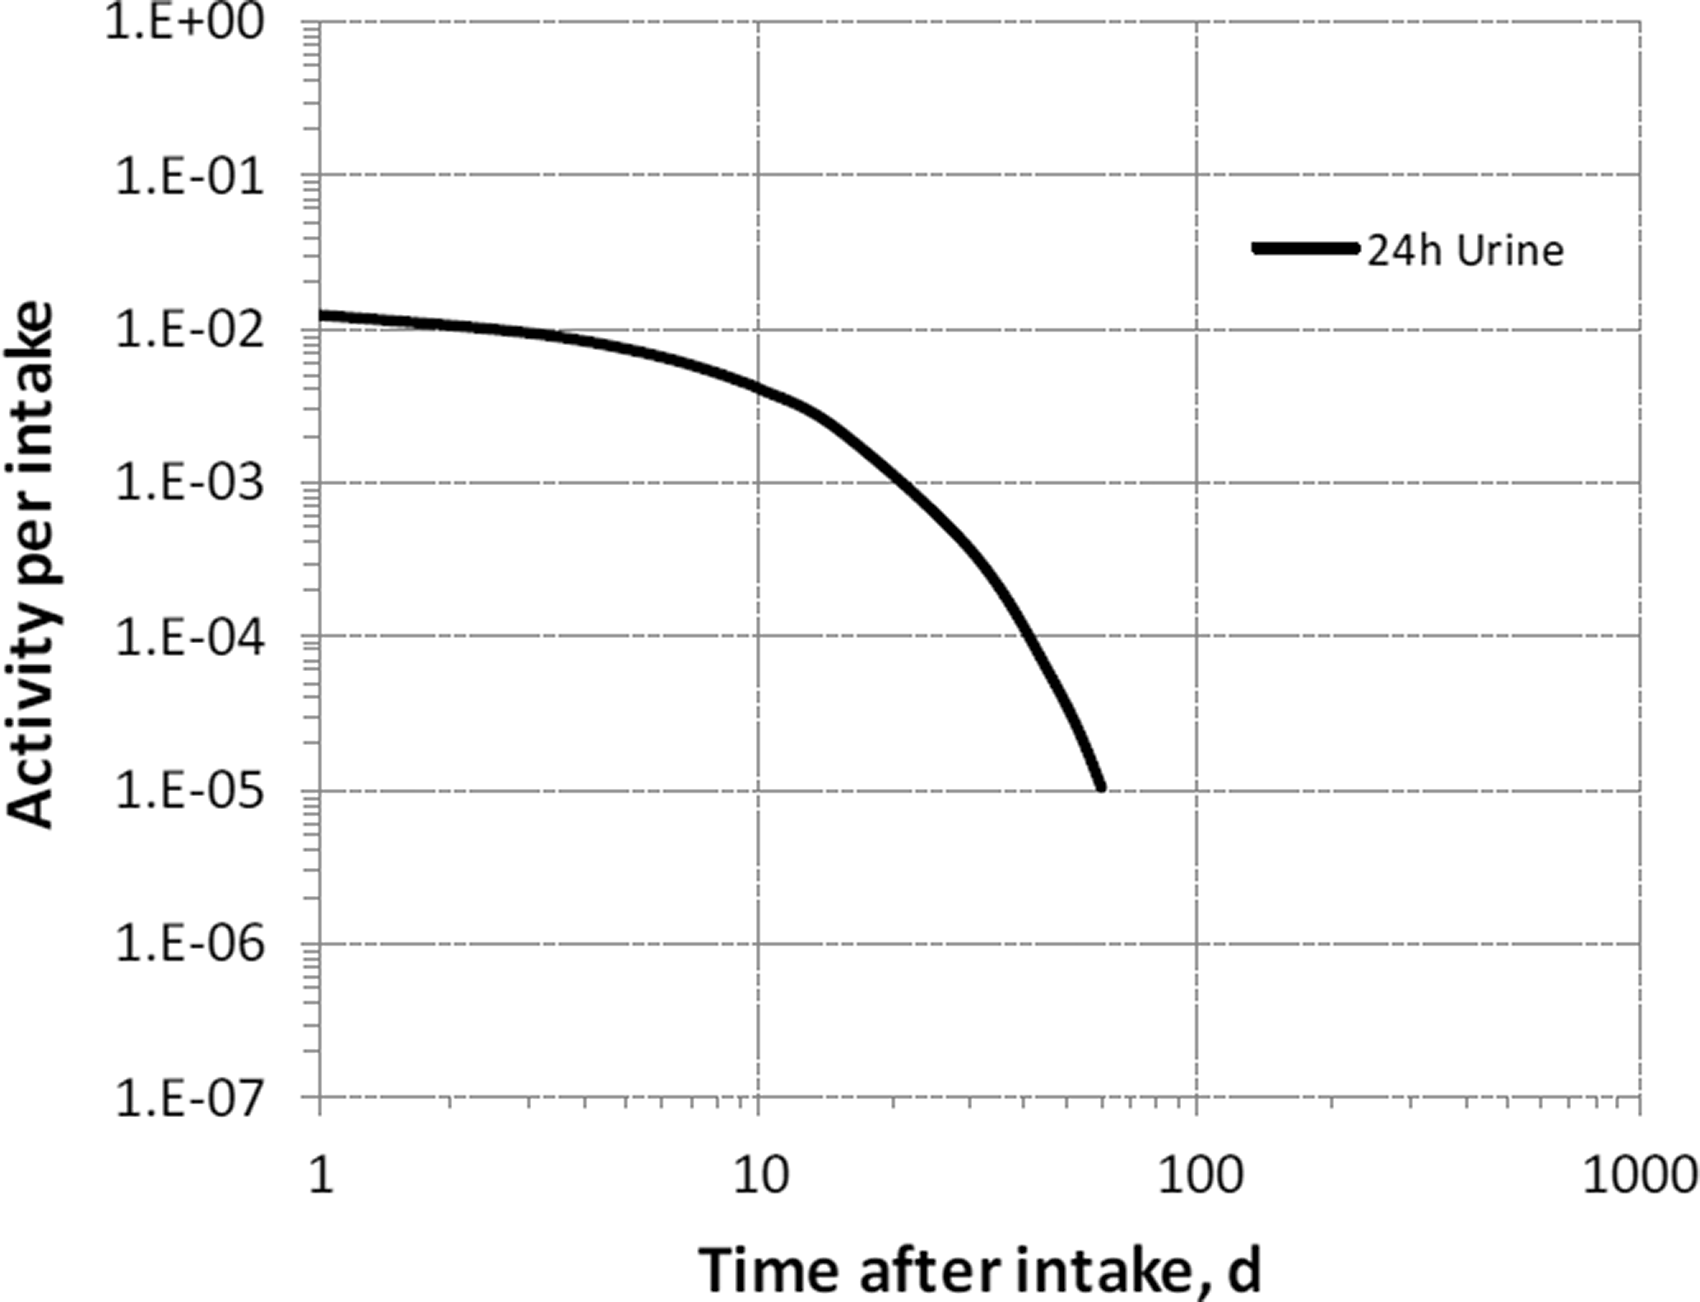

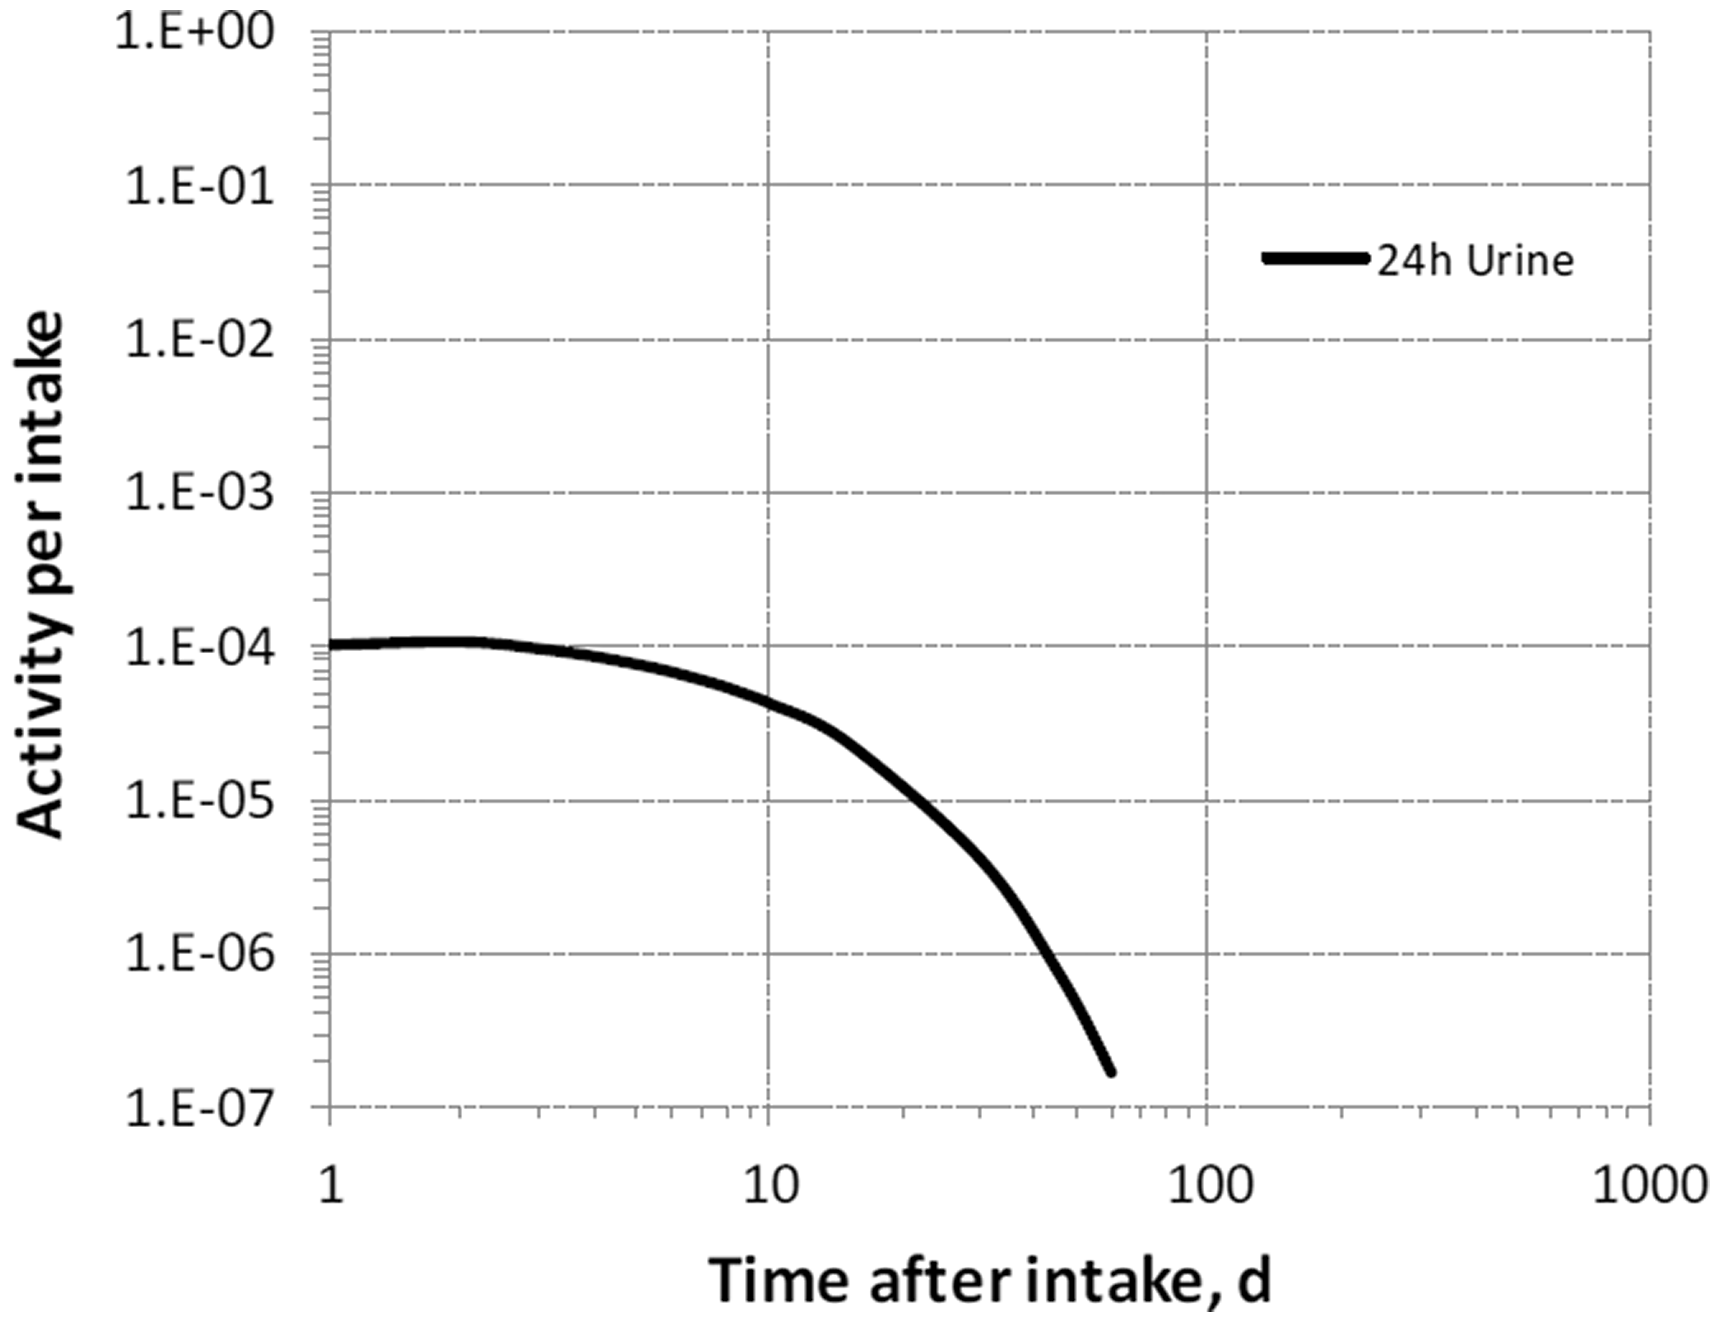


38.2.3.3. Treatment of progeny
(725) Progeny of astatine addressed in this publication are radioisotopes of thallium, lead, bismuth, and polonium. The models for these four elements as progeny of astatine are expansions of their models as progeny of lead, described in Section 9.2.3.3 of Publication 137 (ICRP, 2017). The thyroid, salivary glands, stomach wall, and lung tissue are added to the explicitly identified tissues in the model for polonium as a progeny of lead, and the following transfer rates between blood and the added tissues are assigned: plasma to thyroid, 0.1 d−1; plasma to salivary glands, 0.4 d−1; plasma to stomach wall, 0.2 d−1; plasma to lung tissue, 2.0 d−1; and outflow from each of these four tissues to plasma, 0.099 d−1. As in the models for thallium, lead, bismuth, and polonium as progeny of lead, the following transfer rates to a progeny’s central blood compartments are assigned when the progeny is produced in a compartment that is not in the progeny’s model: 1000 d−1 if produced in a blood compartment; at the rate of bone turnover if produced in a bone volume compartment; and at the following element-specific rates if produced in any other compartment: thallium, 2.5 d−1; lead, 7.39 d−1; bismuth, 66.54 d−1; and polonium, 0.099 d−1.
38.3. Individual monitoring
(726) Information regarding the detection limit for routine individual measurement is not available.
38.4. Dosimetric data for astatine
39. Francium (Z = 87)
39.1. Isotopes
39.2. Routes of intake
39.2.1. Inhalation
(727) For francium, default parameter values were adopted on absorption to blood from the respiratory tract (ICRP, 2015). Absorption parameter values and types, and associated fA values for particulate forms of francium are given in Table 39.2. Committed effective dose coefficients (Sv Bq−1) for the inhalation or ingestion of 210At compounds. AMAD, activity median aerodynamic diameter Unspecified refers here to an unspecified gas or vapor form and not to an any unspecified form of astatine. Isotopes of francium addressed in this publication. EC, electron-capture decay; B+, beta-plus decay; B−, beta-minus decay; A, alpha decay. Dose coefficients and bioassay data for this radionuclide are given in the printed copy of this publication. Data for other radionuclides listed in this table are given in the online electronic files on the ICRP website. Absorption parameter values for inhaled and ingested francium. It is assumed that the bound state can be neglected for francium (i.e. fb = 0). The values of sr for Type F, M, and S forms of francium (30, 3, and 3 d−1, respectively) are the general default values. For inhaled material deposited in the respiratory tract and subsequently cleared by particle transport to the alimentary tract, the default fA values for inhaled materials are applied [i.e. the product of fr for the absorption type and the fA value for ingested soluble forms of francium (1)]. Default Type M is recommended for use in the absence of specific information on which the exposure material can be assigned to an absorption type (e.g. if the form is unknown, or if the form is known but there is no information available on the absorption of that form from the respiratory tract). For guidance on the use of specific information, see Section 1.1. Activity transferred from systemic compartments into segments of the alimentary tract is assumed to be subject to reabsorption to blood. The default absorption fraction fA for the secreted activity is the highest value for any form of the radionuclide (fA = 1).

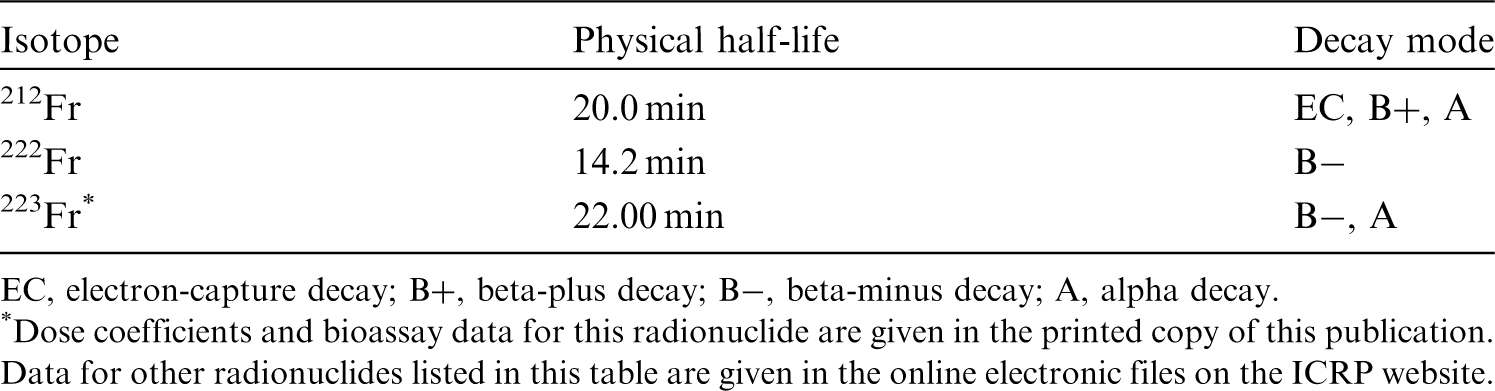

39.2.2. Ingestion
(728) There appear to be no data on the gastrointestinal absorption of francium. In Publications 30 and 68 (ICRP, 1981, 1994a), f1 was taken to be 1 for all compounds of francium, by analogy with potassium, rubidium, and caesium. In this publication, fA = 1 is also applied to all chemical forms of francium.
39.2.3. Systemic distribution, retention, and excretion of francium
39.2.3.1. Biokinetic model for systemic francium
(729) Francium is the heaviest member of the alkali metal family, positioned below caesium in the periodic table. For lack of specific biokinetic data for francium, its systemic behaviour is assumed to be the same as that of caesium. However, a much simpler model is applied to francium than to caesium (ICRP, 2017) in view of the short half-life of francium radioisotopes (≤22 min) and uncertainty in the accuracy of the caesium analogy. (730) Francium is assumed to leave blood at a rate of 200 d−1 (half-time ∼5 min), with 5% going to the urinary bladder content, 1% going to the right colon content, and 94% uniformly distributed in all tissues. Francium deposited in tissues is assumed to transfer to blood at a rate of 0.1 d−1. (731) Transfer coefficients for francium are listed in Table 39.3. Transfer coefficients (d−1) in the biokinetic model for systemic francium. Committed effective dose coefficients (Sv Bq−1) for the inhalation or ingestion of 223Fr compounds. AMAD, activity median aerodynamic diameter. Room dimensions and geometry. Submersion dose rate coefficients for airborne isotopes. EC, electron-capture decay; B+, beta-plus decay; B–, beta-minus decay; IT, isomeric transition decay; A, alpha decay. *Semi-infinite submersion coefficients from Publication 144 (ICRP, 2020). Ar-37 emits no radiations of energy ≥10 keV.
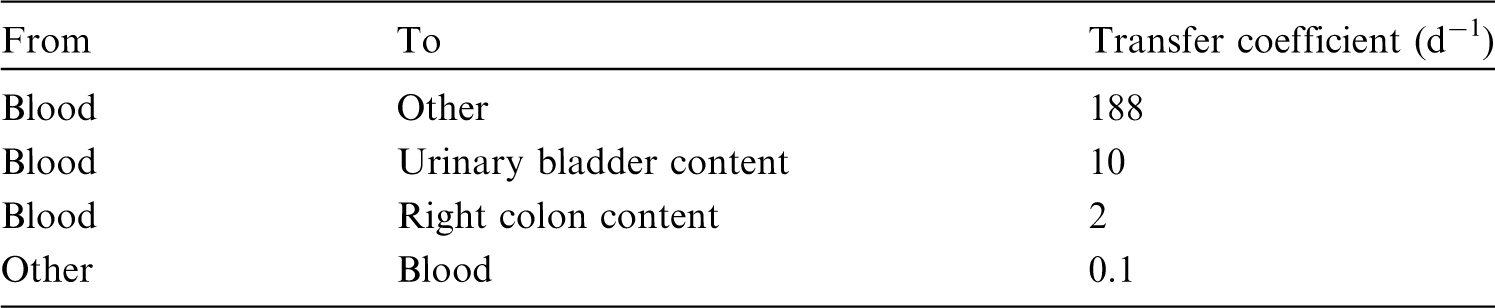

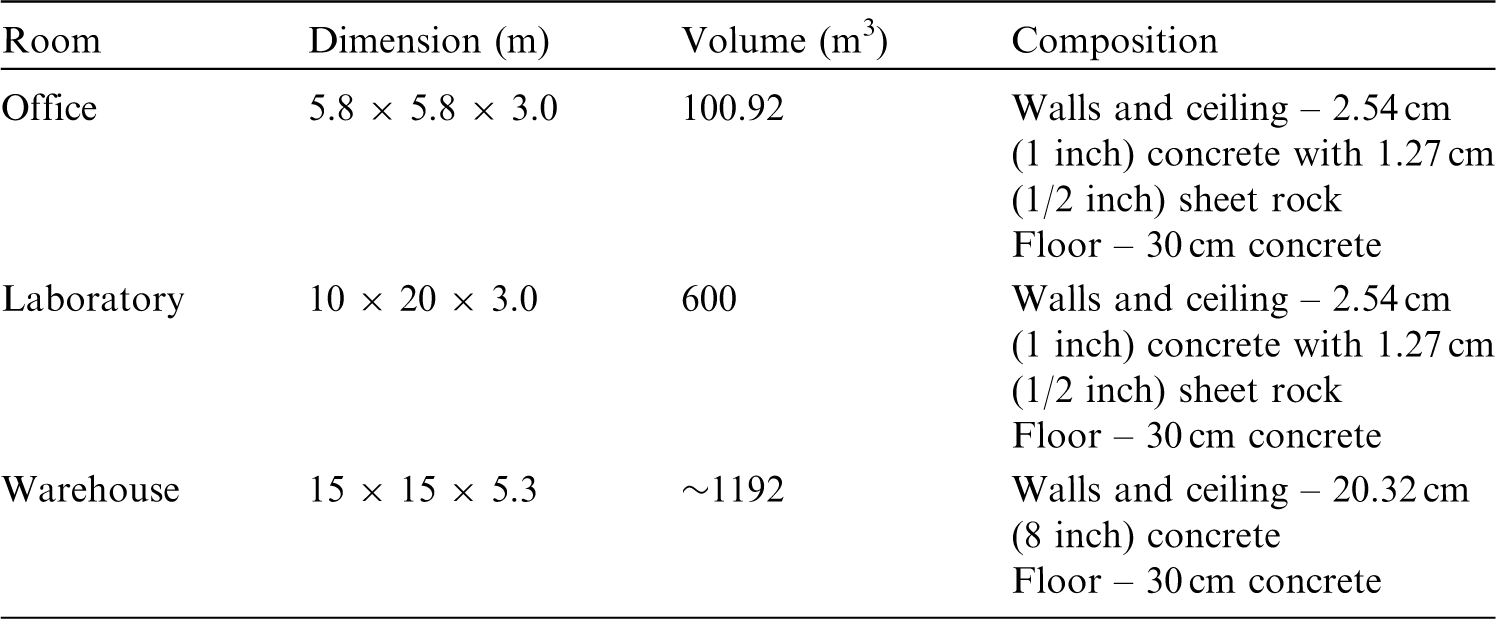
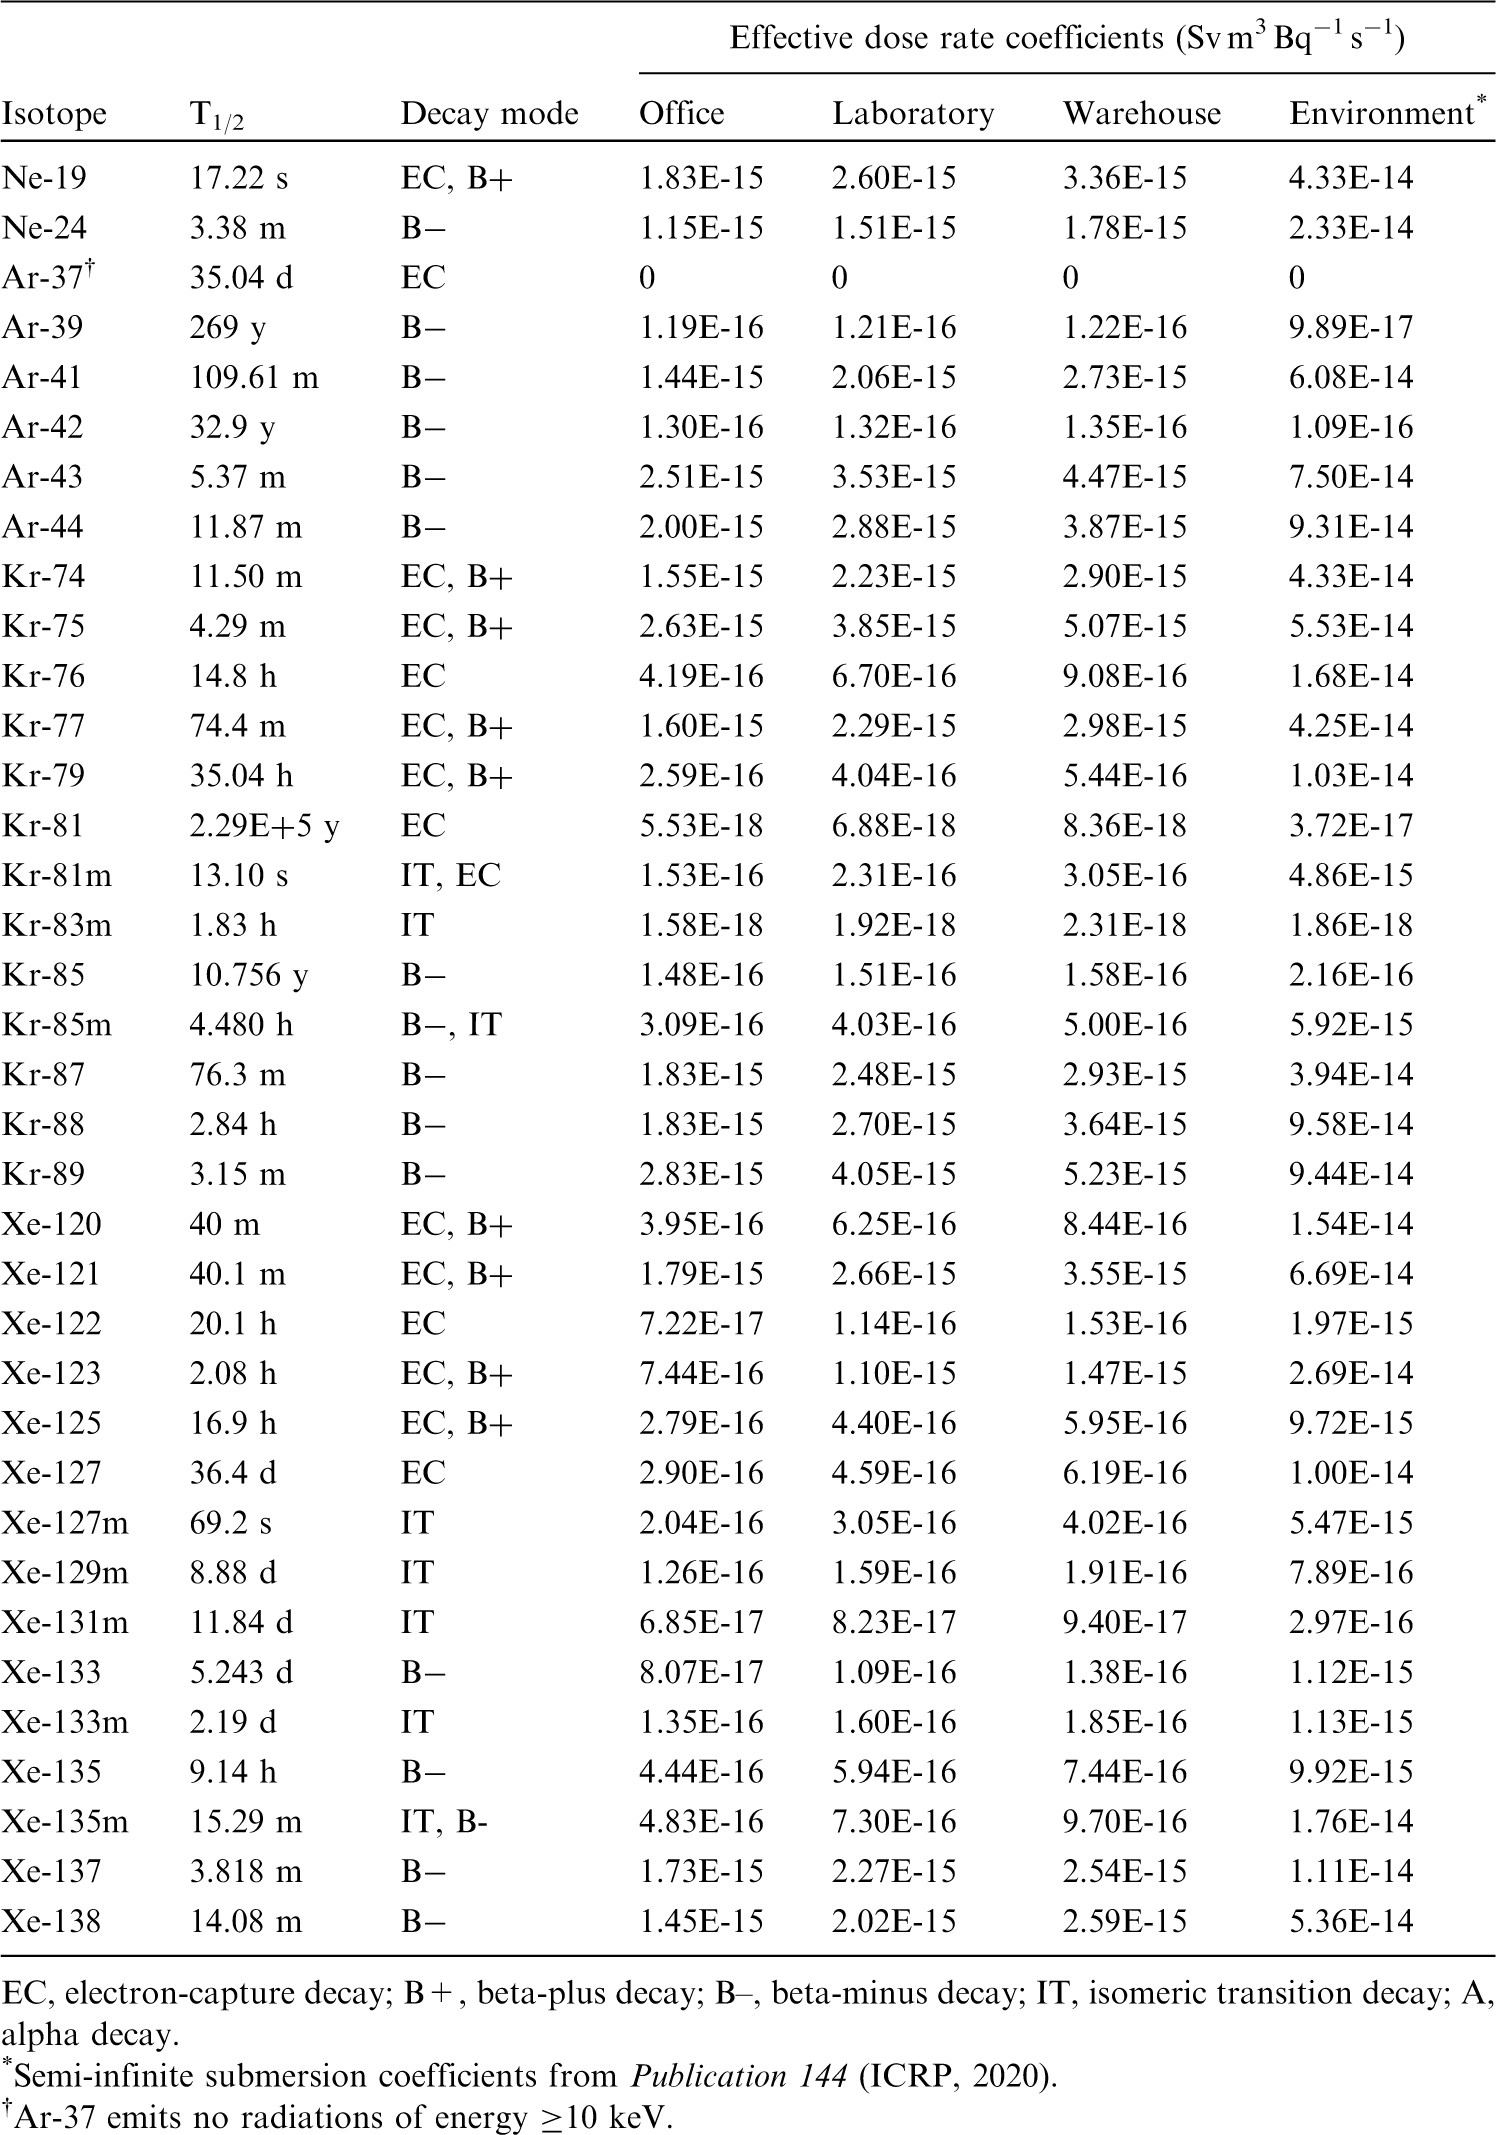
39.2.3.2. Treatment of progeny
(732) Progeny of francium addressed in this publication are isotopes of thallium, lead, bismuth, polonium, astatine, radon, and radium. The models for francium progeny produced in systemic compartments are essentially the same as the models applied to these elements as radium progeny in Section 13.2.3.3 of Publication 137 (ICRP, 2017). As in the models for these elements as progeny of radium, the following transfer rates to a progeny’s central blood compartments are assigned when the progeny is produced in a compartment that is not in the progeny’s model: 1000 d−1 if produced in a blood compartment; at the rate of bone turnover if produced in a bone volume compartment; and at the following element-specific rates if produced in any other compartment: thallium, 2.5 d−1; lead, 7.39 d−1; bismuth, 66.54 d−1; polonium, 0.099 d−1; and radium, 6.98 d−1.
39.3. Individual monitoring
(733) Information regarding the detection limit for routine individual measurement is not available.
39.4. Dosimetric data for francium
Footnotes
ANNEX B. Systemic Biokinetic Models for Progeny
ACKNOWLEDGEMENTS
Publication 130 (ICRP, 2015) was the first in a series of ‘Occupational Intakes of Radionuclides’ (OIR) publications replacing the Publication 30 series (ICRP, 1979b, 1980a, 1981, 1988b) and Publication 68 (ICRP, 1994a) to provide revised dose coefficients for occupational intakes of radionuclides by inhalation and ingestion. It provided an introduction to the series of publications, and included sections on control of occupational exposures, biokinetic and dosimetric models, monitoring methods, monitoring programmes, and retrospective dose assessment. Subsequent parts, including the present publication (OIR Part 5), provide data on various elements and their radioisotopes. This is the final publication in the OIR series.
The electronic annex that accompanies this series of publications contains a comprehensive set of committed effective and equivalent dose coefficients; committed effective dose per content functions; and reference bioassay functions for inhalation, ingestion, and direct input to the blood.
Initial development of the OIR series was undertaken by Task Group 4 on Dose Calculations and Task Group 21 on Internal Dosimetry. In 2014, Task Group 95 on Internal Dose Coefficients and Task Group 96 on Computational Phantoms and Radiation Transport were formed to restructure work on dose coefficients, replacing Task Groups 4 and 21. Task Group 95 continued development of the OIR series, including the current publication, while Task Group 96 continued development of other publications to support the dose coefficient calculations.
ICRP thanks all those involved in the development of this publication for their hard work and dedication over many years.
The work of the authors was aided by significant contributions from K. Eckerman, S. Lamart, M.A. Lopez, A. Giussani, D.W. Jokisch, and all the other members of Task Group 95.

| F. Paquet (Chair) | G. Etherington | J. Marsh |
| M.R. Bailey | T. Fell | D. Melo |
| V. Berkovski | A. Giussani | D. Noβke |
| L. Bertelli | D. Gregoratto | G. Ratia |
| E. Blanchardon | S. Lamart | T. Smith |
| E. Davesne | R.W. Leggett |
M. Kai S. Romanov
C.H. Clement (Scientific Secretary and Annals of the ICRP Editor-in-Chief)
H. Fujita (Assistant Scientific Secretary and Annals of the ICRP Associate Editor)

| J.D. Harrison (Chair) | D. Jokisch | N. Petoussi-Henss |
| F. Paquet (Vice-Chair) | C.H. Kim | T. Sato |
| W.E. Bolch (Secretary) | M.A. Lopez | T. Smith |
| V. Berkovski | R. Leggett | A. Ulanowski |
| E. Blanchardon | J. Li | F. Wissmann |
| A. Giussani |
K. Eckerman
Chair: C. Cousins, UK
Vice-Chair: J. Lochard, France
| K.E. Applegate, USA | S. Liu, China |
|
| S. Bouffler, UK | S. Romanov, Russia | R.H. Clarke, UK |
| K.W. Cho, Korea | W. Rühm, Germany | F.A. Mettler Jr, USA R.J. Pentreath, UK R.J. Preston, USA C. Streffer, Germany E. Vañó, Spain |
| D.A. Cool, USA | ||
| J.D. Harrison, UK | ||
| M. Kai, Japan | ||
| C-M. Larsson, Australia | ||
| D. Laurier, France |
*Although formally not a member since 1988, the Scientific Secretary is an integral part of the Main Commission.
Finally, thank you very much to all organisations and individuals who took the time to provide comments on the draft of this publication during the consultation process.