Abstract

Occupational Intakes of Radionuclides: Part 3
ICRP PUBLICATION 137
Approved by the Commission in October 2015
Keywords: Occupational exposure; Internal dose assessment; Biokinetic and dosimetric models; Bioassay interpretation
Authors on Behalf of ICRP
F. PAQUET, M.R. BAILEY, R.W. LEGGETT, J. LIPSZTEIN, J. MARSH,
T.P. FELL, T. SMITH, D. NOSSKE, K.F. ECKERMAN, V. BERKOVSKI,
E. BLANCHARDON, D. GREGORATTO, J.D. HARRISON
PREFACE
Publication 130 (ICRP, 2015) was the first in a series of ‘Occupational Intakes of Radionuclides’ (OIR) publications replacing the Publication 30 series (ICRP, 1979, 1980, 1981, 1988) and Publication 68 (ICRP, 1994) to provide revised dose coefficients for occupational intakes of radionuclides by inhalation and ingestion. It provided an introduction to the series of publications, and included sections on control of occupational exposures, biokinetic and dosimetric models, monitoring methods, monitoring programmes, and retrospective dose assessment. It also contains the glossary for the OIR series.
The second publication in the OIR series (Publication 134, ICRP, 2016) provided data on 14 individual elements – hydrogen (H), carbon (C), phosphorus (P), sulphur (S), calcium (Ca), iron (Fe), cobalt (Co), zinc (Zn), strontium (Sr), yttrium (Y), zirconium (Zr), niobium (Nb), molybdenum (Mo), and technetium (Tc) – and their radioisotopes, including information on chemical forms encountered in the workplace, a list of principal radioisotopes and their physical half-lives and decay modes, the parameter values of the reference biokinetic models, and data on monitoring techniques for the radioisotopes most commonly encountered in workplaces. For these elements, reviews of data on inhalation, ingestion, and systemic biokinetics were also provided.
Dosimetric data provided in the printed publications of the OIR series include tables of committed effective dose per intake (Sv Bq−1 intake) for inhalation and ingestion, tables of committed effective dose per content (Sv Bq−1 measurement) for inhalation, and graphs of retention and excretion data per Bq intake for inhalation. These data are provided for all absorption types and for the most common isotope(s) of each element section.
The electronic annex that accompanies this series of publications contains a comprehensive set of committed effective and equivalent dose coefficients; committed effective dose per content functions; and reference bioassay functions for inhalation, ingestion, and direct input to blood.
The new biokinetic and dosimetric models, dose coefficients, and bioassay data presented and used in the OIR series of publications supersede those applied in the Publication 30 series, the first volumes of which were published almost 40 years ago (ICRP, 1979, 1980, 1981, 1988). Since that time, the International Commission on Radiological Protection (ICRP) has made modifications to the radiation and tissue weighting factors used in the calculation of effective dose [Publications 60 and 103 (ICRP, 1991, 2007)]; updated some characteristics of the Reference Male and Female [Publication 89 (ICRP, 2002)]; updated radionuclide decay data [Publication 107 (ICRP, 2008)]; adopted new anthropomorphic phantoms [Publication 110 (ICRP, 2009)]; and revised biokinetic models for inhalation, ingestion, and systemic distribution of radionuclides [Publication 130 (ICRP, 2015), Publication 134 (ICRP, 2016) and this publication]. All of these changes ensure that the ICRP dose coefficients make appropriate use of scientific knowledge, and reduce the uncertainties associated with the calculation of doses after internal contamination.
The current publication is the third of the OIR series. It provides data for the following elements: ruthenium (Ru), antimony (Sb), tellurium (Te), iodine (I), caesium (Cs), barium (Ba), iridium (Ir), lead (Pb), bismuth (Bi), polonium (Po), radon (Rn), radium (Ra), thorium (Th), and uranium (U).
Subsequent publications will provide data for most of the other elements.
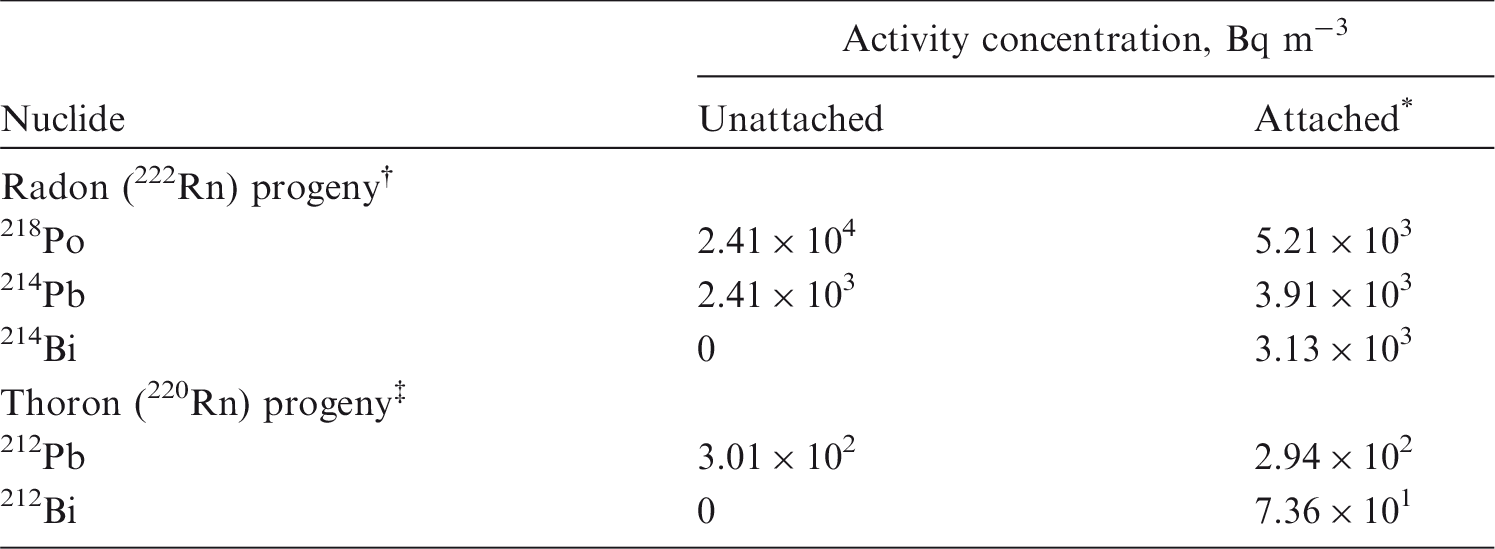
An important question is whether the improvements made to biokinetic and dosimetric models have substantial impacts on the numerical values of dose coefficients. An analysis of the data shows that for inhalation of reference forms of radionuclides (aerosols of 5 µm, Type F, M, or S) and for ingestion, the vast majority of new dose coefficients are slightly lower (within a factor of 2) than those published in the Publication 30 series (ICRP, 1979, 1980, 1981, 1988). In some very rare cases (210Bi Type F, 229/230Th Type S, 234/235/238U Type S), dose coefficients have increased by a factor of approximately 2 because of revision of the biokinetic models and better description of radionuclide retention and distribution in tissues. In three other cases, the dose coefficients have increased by a factor of approximately 4 for 232Th Type S and 214Pb Type F, and approximately a factor of 9 for 212Pb Type F. The dose coefficients for inhalation of radon and progeny, calculated using biokinetic and dosimetric models using the average breathing rate for a reference worker, are 3 mSv per mJ h m−3 (approximately 10 mSv WLM−1) for mines and the majority of indoor workplaces, and 6 mSv per mJ h m−3 (approximately 20 mSv WLM−1) for tourist caves and indoor workplaces where work involves substantial physical activity.
It is reassuring that differences between the old and the new data are mostly small, confirming that the protection of workers was already reliably based on existing data. The increased sophistication and realism of the new biokinetic and dosimetric models allows additional confidence in the data provided, and contributes to reductions in uncertainties. It also means that they are readily applied to the interpretation of bioassay data. It should also be noted that the new data in the OIR series extend the existing data sets, providing specific coefficients for isotopes and chemical forms that were not described previously, contributing to improvements in exposure and dose assessments, and the protection of workers. Furthermore, the OIR series provides physiologically based biokinetic models that can be used for applications other than radiation protection, including in toxicology, pharmacology, and medicine.
Three task groups participated in the completion of this publication. Task Group 21 on Internal Dosimetry (INDOS) and Task Group 4 on Dose Calculations (DOCAL) were involved until 2014, and then were replaced by Task Group 95 on Internal Dose Coefficients (IDC), newly created in 2014.


The membership of Committee 2 was:

The work of the authors was aided by significant contributions from G. Etherington, E. Ansoborlo, A. Giussani, D. Melo, L. Bertelli, G. Ratia, K. Karcher, D.W. Jokisch, and all the Internal Dose Coefficients (IDC) and Computational Phantoms and Radiation Transport (CPRT) members.
References
1. INTRODUCTION
(1) This publication is the third part of a series aimed at providing revised dose coefficients for occupational intakes of radionuclides (OIR) by inhalation and ingestion. It also presents radionuclide-specific information for the design and planning of monitoring programmes, and retrospective assessment of occupational internal doses. (2) The OIR series replaces the Publication 30 series (ICRP, 1979, 1980, 1981, 1988b), and Publications 54, 68 and 78 (ICRP, 1988a, 1994b, 1997). The revised dose coefficients, dose per unit content values, and reference bioassay functions have been calculated using the Publication 100 (ICRP, 2006) Human Alimentary Tract Model (HATM) and a revision of the Publication 66 (ICRP, 1994a) Human Respiratory Tract Model (HRTM) which takes account of more recent data. The revisions made to the HRTM are described in OIR Part 1 (ICRP, 2015). Revisions have also been made to many models for the systemic biokinetics of radionuclides, making them more physiologically realistic representations of uptake and retention in organs and tissues, and excretion.
1.1. Methodology used in the OIR series
(3) The general methodology for producing the biokinetic and dosimetric models is given in OIR Part 1 (ICRP, 2015). Part 1 also contains the glossary for the OIR series. For each element, detailed reviews of the literature were carried out to identify experimental studies and human contamination cases that provide information to quantify absorption to blood from the respiratory and alimentary tracts, and the biokinetics following systemic uptake. These reviews, and the analyses of the data obtained from them, are summarised in each element section. (4) In the case of inhalation, chemical forms are usually addressed in order of decreasing solubility in the lungs. Where information was available, HRTM absorption parameter values were derived from experimental data from both in-vivo and in-vitro studies. For in-vitro studies, estimation of the dissolution parameter values [rapidly dissolved fraction (fr), rapid and slow dissolution rates (sr and ss)] was usually straightforward. For in-vivo studies, however, simulation modelling was often needed to derive them from the data available, typically retention in organs and excretion in urine and faeces [for further information, see Supporting Guidance 3 (ICRP, 2002)]. (5) In some recent publications, the authors derived HRTM parameter values; if so, they are reported. In most cases, parameter values were derived by the ICRP Task Group [Task Group 21 on Internal Dosimetry (INDOS) or Task Group 95 on Internal Dose Coefficients (IDC)] members and their colleagues. This is indicated in the text by wording such as ‘analysis carried out here…’; the first such occurrence for each element is given as ‘analysis carried out here (i.e. by the Task Group)…’. (6) Material-specific rates of absorption have been adopted (and dose coefficients and bioassay functions provided for them in the accompanying electronic annex) for a limited number of selected materials, i.e. those for which:
there are in-vivo data from which specific parameter values can be derived; results from different studies are consistent; it was considered that occupational exposure to the material is likely; and the specific parameter values are sufficiently different from default Type F, M, or S parameter values to justify providing additional specific dose coefficients and bioassay functions. (7) Other materials were assigned to default HRTM absorption types, using the criteria described in Publication 71 (ICRP, 1995) and Supporting Guidance 3 (ICRP, 2002) for making such assignments using experimental data. Type M is assumed for particulate forms of most elements ‘by default’, i.e. in the absence of such information. A material is assigned to Type F if the amount absorbed into blood by 30 d after intake is greater than the amount absorbed over the same period from a hypothetical material with a constant absorption rate corresponding to a half-time of 10 d, under identical conditions. Similarly, a material is assigned to Type S if the amount absorbed into blood by 180 d is less than the amount absorbed over the same period from a hypothetical material with a constant rate of absorption to blood of 0.001 d–1 (extrapolation was used in some cases, as indicated in the text). For studies where it was possible to apply the criteria, a statement is made to the effect that results ‘are consistent with’ (or ‘give’) assignment to Type F (M or S). For studies where the results point towards a particular type but there was insufficient information to apply the criteria, a statement is made to the effect that the results ‘indicate’ or ‘suggest’ Type F (M or S) behaviour. (8) Assignments are not made here on the basis of the known solubility of chemical forms in aqueous media, because this is not considered to be a reliable guide to absorption from the respiratory tract (ICRP, 1994a, Section E.2.2.1). If it is considered appropriate in a particular situation, it would need to be carried out with caution. In practice, it might well be possible to assign a radionuclide to which workers have been exposed to an absorption type without knowing its chemical form (e.g. from environmental and/or bioassay measurements). These could include in-vitro dissolution tests on air filters or swabs, in-vivo measurements (chest compared with whole body), or excretion measurements (urine compared with faeces). Nevertheless, for each element, a default absorption type is recommended for use in the absence of information on which the exposure material can be assigned to Type F, M, or S. For most elements, Type M is recommended by default. (9) For soluble (Type F) forms of each element, estimates are made of the overall rate of absorption from the respiratory tract to blood where information is available. In general, this results from dissolution of the deposited material, and also transfer through lining fluids and epithelium into blood. Nevertheless, for simplicity, this is usually represented by the rapid dissolution rate, sr (see ICRP, 2015, Section 3.2.3). Due to the wide range of estimated values of sr, element-specific values are adopted in the OIR series for those elements for which estimates could be made. Justification of the value chosen for an element is given in the subsection headed ‘Rapid dissolution rate for element’. (10) For some elements, a significant fraction of the dissolved material is absorbed slowly. In some cases, this can be represented by formation of particulate material (which is subject to clearance by particle transport). In others, some dissolved material appears to be attached to lung structural components, and removed only by absorption to blood. To represent the latter type of time-dependent uptake, it is assumed that a fraction, fb, of the dissolved material is retained in the ‘bound’ state, from which it goes into blood at a rate sb. Evidence for retention in the bound state, rather than by transformation into particulate material, may be in one or more forms, such as systemic uptake rather than faecal clearance of the retained material, slower clearance than for insoluble particles deposited in the same region of the respiratory tract, or autoradiography showing diffuse rather than focal retention of activity. (11) The bound state was included in the HRTM, mainly to take account of slow clearance of dissolved materials from the alveolar-interstitial (AI) region. Applying the same bound state parameter values in all regions could lead, unintentionally, to high calculated doses to the bronchial (BB) and bronchiolar (bb) regions. Hence in the OIR series, it is assumed that for those elements for which a bound state is adopted (fb>0), it is only applied in the conducting airways [ET2 (i.e. posterior nasal passage, pharynx, and larynx), BB, and bb regions] if there is supporting experimental evidence. Justification of the values chosen for an element is given in the subsection headed ‘Extent of binding of element to the respiratory tract’.
1.2. Data presented in the OIR series
(12) Data presented in the OIR series are in a standard format for each element and its radioisotopes. Each element section provides information on chemical forms encountered in the workplace; principal radioisotopes, and their physical half-lives and decay modes; reviews of data on inhalation, ingestion, and systemic biokinetics; the structure and parameter values for the systemic biokinetic model; and monitoring techniques and detection limits typically achieved in a practical monitoring programme. The detection limits presented in this publication were derived from a compilation of data from laboratories in Europe, Asia, North America, and South America that perform routine monitoring of the specified radionuclide. The sensitivity of the measurements depends on the technique, the counting time, and other factors. For example, in-vivo detection limits depend on the detection system (type, quality, and number of detectors), counting geometry, and shielding and design of the installation. Those details are outside the scope of this publication. (13) Dosimetric data are provided in the printed publications of the OIR series and in the electronic annex. The methodology for dose calculation is described in OIR Part 1 (ICRP, 2015) and in Publication 133 (ICRP, 2016a). Due to the amount of data to be provided, the printed publications provide tables and graphs restricted to tables of committed effective dose per intake (Sv Bq−1 intake) for inhalation and ingestion, tables of committed effective dose per content (Sv Bq−1 measurement) for inhalation, and graphs of retention and excretion data per Bq intake for inhalation. (14) Data in the printed publications are provided for all absorption types of the most common isotope(s) and for an activity median aerodynamic diameter (AMAD) of 5 µm. In cases for which sufficient information is available (principally for actinide elements), lung absorption is specified for different chemical forms, and dose coefficients and bioassay data are calculated accordingly. The dose coefficients and dose per content values presented in the OIR series are given for a Reference Worker at light work (ICRP, 2015). (15) The electronic annex that accompanies the OIR series contains a comprehensive set of committed effective and equivalent dose coefficients, dose per content functions, and reference bioassay functions for almost all radionuclides included in Publication 107 (ICRP, 2008) that have half-lives equal to or greater than 10 min, and for other selected radionuclides. Data are provided for a range of physicochemical forms and for aerosols with median sizes ranging from an activity median thermodynamic diameter (AMTD) of 0.001 µm to an AMAD of 20 µm. Data for ingestion and injection (i.e. direct entry to the blood) are provided to allow the interpretation of bioassay data for cases of inadvertent ingestion (e.g. of material on contaminated skin) or rapid absorption through intact or damaged skin (injection). (16) The dose coefficients and other radionuclide-specific data are provided as a set of data files which may be accessed by the user directly or by using the accompanying Data Viewer. The Data Viewer permits rapid navigation of the dataset and visualisation of the data in tabulated and graphical formats, such as graphs of the time series of dose per unit content coefficients, or predicted activity content per unit dose (Bq Sv–1) as a function of time after intake. Graphical presentations of decay chains and nuclear decay data from Publication 107 (ICRP, 2008) are also included. (17) OIR Part 2 (ICRP, 2016b) provided the data above on the following elements: hydrogen (H), carbon (C), phosphorus (P), sulphur (S), calcium (Ca), iron (Fe), cobalt (Co), zinc (Zn), strontium (Sr), yttrium (Y), zirconium (Zr), niobium (Nb), molybdenum (Mo), and technetium (Tc). (18) The present publication, Part 3 of the OIR series, provides the data above on the following elements: ruthenium (Ru), antimony (Sb), tellurium (Te), iodine (I), caesium (Cs), barium (Ba), iridium (Ir), lead (Pb), bismuth (Bi), polonium (Po), radon (Rn), radium (Ra), thorium (Th), and uranium (U). Subsequent parts will provide data for most of the other elements. (19) The data and dose coefficients provided in this publication update those provided in previous publications, except in the case of radon. Dose coefficients for inhaled 222Rn and progeny have been calculated previously by the dose conversion convention of Publication 65 (ICRP, 1993) in which epidemiologically based estimates of lung cancer risk per unit exposure to radon are compared with the overall detriment per unit effective dose. Hence values of effective dose per unit exposure were obtained, expressed in mSv per working level month (WLM) or mSv per mJ h m−3. In this publication, OIR Part 3, dosimetric data for radon isotopes are presented for the first time, but the availability of reliable epidemiological data is taken into account in their interpretation and recommended application (Section 12.6.4). A further difference between radon and other elements is that data are provided for inhalation of radon gas together with the inhalation of short-lived progeny.
1.3. References
2. RUTHENIUM (Z=44)
2.1. Chemical forms in the workplace
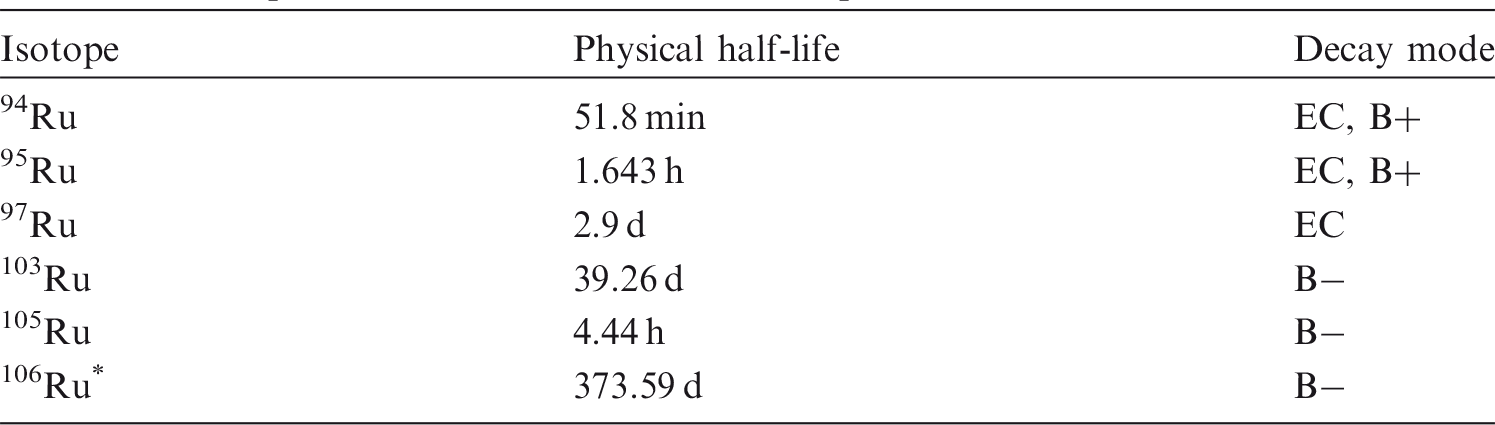
(20) Ruthenium is a transition metal that may exist in various oxidation states from II to VIII. It is assumed that oxidation states III and IV are the most stable, while in strong oxidation conditions, the oxo-anion RuO42− is very stable. Ruthenium may be encountered in industry in a variety of chemical and physical forms, such as oxides [RuO2 and RuO4 (vapour state)], halides, sulphides, and cyanides. (21) 103Ru and 106Ru are produced in the nuclear industry as fission products. 106Ru decays to 106Rh, a beta/gamma emitter with a half-life of 30 s. At the Chernobyl accident, ruthenium became volatile during the fire and was found in metallic form, hundreds of kilometres away from the plant (Pollanen, 1997). Isotopes of ruthenium addressed in this publication. EC, electron-capture decay; B+, beta-plus decay; B−, beta-minus decay. Dose coefficients and bioassay data for this radionuclide are given in the printed copy of this publication. Data for other radionuclides listed in this table are given in the accompanying electronic annex.
2.2. Routes of intake
2.2.1. Inhalation
(22) Some information is available on the behaviour of inhaled ruthenium in human subjects following accidental intake as an oxide or in irradiated fuel fragments. Information on absorption from the respiratory tract is available from experimental studies of ruthenium as tetroxide, chloride, citrate, dioxide, and irradiated uranium dioxide. (23) Absorption parameter values and types, and associated fA values for gas and vapour forms of ruthenium are given in Table 2.2, and for particulate forms in Table 2.3. Exposures to gas and vapour forms of ruthenium are relatively unusual compared with exposures to particulate forms, and it is therefore recommended that particulate forms should be assumed in the OIR series in the absence of information (ICRP, 2002). Deposition and absorption for gas and vapour compounds of ruthenium. ET1, anterior nasal passage; ET2, posterior nasal passage, pharynx, and larynx; BB, bronchial; bb, bronchiolar; AI, alveolar-interstitial. Percentage deposited refers to how much of the material in the inhaled air remains in the body after exhalation. Almost all inhaled gas molecules contact airway surfaces, but usually return to the air unless they dissolve in, or react with, the surface lining. It is assumed that the bound fraction fb is 0.05 for ruthenium, with an uptake rate sb = 0.1 d–1. Absorption parameter values for inhaled particulate forms of ruthenium and for ingested ruthenium. It is assumed that the bound fraction fb is 0.05 for ruthenium, with an uptake rate sb = 0.1 d–1, and that this applies throughout the respiratory tract (posterior nasal passage, pharynx and larynx; bronchial; bronchiolar; and alveolar-interstitial regions; and extrathoracic and thoracic lymph nodes). The values of sr for Type F, M, and S forms of ruthenium (30, 3, and 3 d–1, respectively) are the general default values. Materials (e.g. ruthenium chloride) are listed here where there is sufficient information to assign to a default absorption type, but not to give specific parameter values (see text). For inhaled material deposited in the respiratory tract and subsequently cleared by particle transport to the alimentary tract, the default fA values for inhaled materials are applied; i.e. the product of fr for the absorption type and the fA value for ingested soluble forms of ruthenium (0.05). Default Type M is recommended for us in the absence of specific information on which the exposure material can be assigned to an absorption type; for example, if the form is unknown, or if the form is known but there is no information available on the absorption of that form from the respiratory tract. Activity transferred from systemic compartments into segments of the alimentary tract is assumed to be subject to re-absorption to blood. The default absorption fraction fA for the secreted activity is the reference fA (0.05) for ingestion of the radionuclide.


2.2.1.1. Gases and vapours
(a) Ruthenium tetroxide (RuO4)
(24) Ruthenium tetroxide (melting point 26℃, boiling point 40℃) has a high vapour pressure at room temperature, and is thought to have been involved in several human inhalation incidents (Snipes and Kanapilly, 1983). It is very reactive, and converts to ruthenium dioxide in contact with organic or other reactive surfaces. (25) Snipes et al. (1977) carried out pilot experiments in which the biokinetics of 103Ru were followed for approximately 2 weeks after inhalation of 103RuO4 by dogs and rats. In both species, initial deposition was primarily in the nasopharyngeal (NP) region (broadly equivalent to the extrathoracic airways) and tracheobronchial (TB) region (equivalent to the bronchial and bronchiolar regions). Clearance was rapid and mainly faecal; approximately 85% of the initial body burden (IBB) was retained with a half-time of approximately 1 d, and the rest with a half-time of approximately 1 week. At the end of the study, most of the 103Ru retained in the body in dogs was in the lungs, but was associated with the nasal turbinates in rats. (26) Runkle et al. (1980) followed the biokinetics of 106Ru for 112 d after inhalation of 106RuO4 by rats. Complementary experiments were conducted to measure the absorption of 106Ru following gavage of 106RuO4 or 106RuO2; fractional absorption was estimated to be approximately 0.01 for both. The overall pattern following inhalation was similar to that observed by Snipes et al. (1977): 85%, 13.8%, and 1.2% IBB were retained with biological half-times of 0.6, 4, and 69 d, respectively. Initial deposition was mainly in the NP and TB regions. After the first week, most of the 106Ru retained was associated with the nasal turbinates and head skin, with little systemic uptake. Although most of the 106Ru deposited in the turbinates cleared within a few days, approximately 2% was retained with a half-time of approximately 70 d. As discussed below, bound state parameter values for ruthenium of fb = 0.05 and sb = 0.1 d–1 were chosen here. Assuming these values, dissolution parameter values fitted here (i.e. by the Task Group) for 106RuO4 inhaled by rats (with regional deposition of 99.8% in extrathoracic airways and 0.2% in the alveolar-interstitial region) were fr = 0.92, sr = 0.35 d–1, and ss = 0.01 d–1. (27) Snipes (1981) followed the biokinetics of 106Ru for 512 d after inhalation of 106RuO4 by dogs. In a complementary experiment, the biokinetics of 106Ru were followed for 5 d after ingestion of 106RuO2 by dogs; fractional absorption was estimated to be approximately 0.005. The overall pattern after inhalation was similar to that observed by Snipes et al. (1977), but clearance was even faster: 90%, 0.7%, and 0.3% IBB were retained with effective half-times of 1.2, 14, and 170 d, respectively. Again, initial deposition was primarily in the NP and TB regions. The respiratory tract and pelt contained the highest levels of 106Ru with relatively little systemic uptake. The NP region contained a high proportion of the body content of 106Ru at all times. The trachea, larynx, and lung contained similar amounts of 106Ru at 512 d after exposure, reflecting long-term retention of some of the initial deposit in all regions of the respiratory tract. Autoradiographs showed that 106Ru dispersion in the turbinates and lymph nodes was relatively uniform; only single tracks were observed with no indications of focal accumulation. The long-term retention of a fraction of the 106Ru in the conducting airways, from which most particles are cleared rapidly, and the uniform dispersion shown in the autoradiographs provide strong evidence for a bound fraction for ruthenium. Based on the results of this study, bound state parameter values for ruthenium of fb = 0.05 and sb = 0.1 d–1 were chosen here. Assuming these values, dissolution parameter values fitted by the Task Group for 106RuO4 inhaled by dogs [with regional deposition of 35% ET1 (i.e. anterior nasal passage), 35% ET2, 17% BB, and 0.02% AI] were fr = 0.4, sr = 10 d–1, and ss = 0.001 d–1. (28) Snipes and Kanapilly (1983) reported that incidents involving a release of RuO4 into room air might produce complex exposure atmospheres, with components including RuO4 vapour, ultrafine particles formed by self-nucleation of RuO2, molecular RuO4, or RuO2 adsorbed on or attached to particles in the air. Such complex mixtures of vapour and particles could yield deposition and dose patterns different from those of RuO4 vapour or of a simple particulate aerosol. To provide data to assist in assessing doses from such exposures, Snipes and Kanapilly (1983) followed the biokinetics of 106Ru for 112 d after inhalation by rats of 106RuO4 mixed with an aerosol of fused aluminosilicate particles (FAP, 0.69-µm diameter.) Particle size analysis and the initial deposition pattern indicated that most of the 106Ru in the exposure chamber was in the form of molecular RuO4, with approximately 25% associated with particles of approximately 0.1-µm diameter, and less than 5% associated with FAP. It was estimated that 60% IBB deposited in the upper respiratory tract, 10% in the TB region, 12% in the AI region, and 18% was external contamination, mainly on the nares and head skin. Clearance was rapid and mainly via the alimentary tract to faeces: 92% and 8% IBB were retained with effective half-times of 0.7 and 30 d, respectively. Clearance of 106Ru from the AI region had an effective half-time of approximately 30 d and was predominantly by dissolution. As discussed below, bound state parameter values for ruthenium of fb = 0.05 and sb = 0.1 d–1 were chosen here. Assuming these values, dissolution parameter values fitted by the Task Group (with regional deposition of 87% ET2 and 13% AI) were fr = 0.9, sr = 0.5 d–1, and ss = 0.001 d–1. These are similar to those assessed for RuO4 alone. The main difference is in the higher lung deposition. (29) A worker accidentally inhaled 103RuO4 vapour while performing experiments in which 103Ru was distilled from a neutron-irradiated 235U sample (Webber and Harvey, 1976). External measurements made from 8 to 36 d after the incident indicated that inhaled activity was retained primarily in the region of the nose and mouth. Activity was also detected in the lower abdominal area. There was no evidence of concentration of activity in other tissues. The half-time for biological removal from the body was approximately 15 d. There is insufficient information available to assess parameter values from the reported measurements, but the observations are consistent with parameter values fr = 0.4 and ss = 0.001 d–1 derived above from experimental studies. (30) In two other human exposure incidents (Pusch, 1968; Howells et al., 1977), it was suspected that the released activity was RuO4, but that it was converted, at least in part, to particulate forms of ruthenium, notably RuO2, during mixing and interacting with room air (Snipes and Kanapilly, 1983). In both cases, the ruthenium was only detected in the chest. Details are given below in the ruthenium dioxide section. (31) Based on the experimental studies, dissolution parameter values used here for RuO4 are fr = 0.5, sr = 1 d–1, and ss = 0.001 d–1, with bound state parameter values for ruthenium of fb = 0.05 and sb = 0.1 d–1 (consistent with assignment to default Type M) and fA = 0.01. Regional deposition of 40% ET1, 40% ET2, 12% BB, 7% bb, and 1% AI region is assumed here, based on 106RuO4 inhaled by dogs. (32) However, the study by Snipes and Kanapilly (1983) and accidental exposures suggest that mixing with the ambient aerosol could lead to greater lung deposition of RuO4 and conversion to RuO2 before intake. For prospective assessment of potential releases of RuO4, exposure to 50% RuO4 vapour and 50% RuO2 particulate (5-µm AMAD aerosol) is proposed. For retrospective assessment, it should be recognised that a wide range of mixtures is possible.
2.2.1.2. Particulate materials
(a) Ruthenium chloride (33) Thompson et al. (1958) measured excretion of 106Ru for 60 d after administration of ruthenium chloride to rats by intratracheal instillation, and the tissue distribution at the end of the experiment. They estimated that cumulative urinary excretion accounted for approximately 29% of the initial lung deposit (ILD), cumulative faecal excretion accounted for approximately 66%, activity in the respiratory tract accounted for approximately 2%, and activity in systemic tissues accounted for approximately 3% of the administered amount. Excretion in faeces exceeded that in urine for approximately 15 d, and was much higher than following intravenous or intraperitoneal injection. This suggests that much of the activity deposited in the lung was cleared by particle transport to the alimentary tract before it could be absorbed (i.e. sr < 100 d–1). However, approximately 10% ILD was excreted in urine in the first few days, suggesting that sr > 1 d–1. (34) Burykina (1969) followed the lung retention of 106Ru for 75 d after administration of ruthenium chloride to rats by intratracheal instillation. Although there was some rapid clearance from the lungs, approximately 10% ILD remained in the lungs at 75 d. As discussed below, bound state parameter values for ruthenium of fb = 0.05 and sb = 0.1 d–1 are used here. Assuming these values, dissolution parameter values fitted here (i.e. by the Task Group) were fr = 0.8, sr = 4 d − 1, and ss = 0.007 d–1, consistent with assignment to Type M. (35) Dobryakova (1970) followed the biokinetics of 106Ru for 14 d after administration of ruthenium chloride to rats by intratracheal instillation. There was rapid absorption from the lungs; approximately 50% ILD was absorbed at 30 min and approximately 70% ILD was absorbed at 1 d. Subsequent clearance was slower and excretion was mainly faecal, with approximately 6% ILD remaining in the lungs at 14 d. As discussed below, bound state parameter values for ruthenium of fb = 0.05 and sb = 0.1 d–1 are used here. Assuming these values, dissolution parameter values fitted here were fr = 0.8, sr = 10 d–1, and ss = 0.1 d–1, consistent with assignment to Type F. (36) Although specific parameter values for ruthenium chloride based on in-vivo data are available, they are not adopted here because inhalation exposure to ruthenium chloride is unlikely. Instead, ruthenium chloride is assigned to Type F. (b) Ruthenium oxalate (37) Newton and Latven (1971) followed the biokinetics of 106Ru for 16 d after inhalation by a dog of 106Ru oxalate heat-treated at 100℃. Other dogs inhaled 106Ru oxalate aerosols heat-treated at 500℃ or 1000℃, which was thought to convert most of the 106Ru to 106RuO2 (see below). In a complementary experiment, fractional absorption of 106Ru from the alimentary tract after administration of the same material by gavage to a dog was estimated to be approximately 0.2. Following inhalation, clearance was rapid; 73% IBB was excreted in the first 4 d and the rest with a half-time of 14 d. At 16 d, 40% of the retained 103Ru was in the lungs (approximately 10% ILD), suggesting either Type F or Type M behaviour. The rest was widely distributed. However, 4% was associated with the nasal turbinates; this was a much larger fraction than after inhalation of particles treated at higher temperatures (approximately 0.1%), suggesting retention of a bound fraction. (38) Newton et al. (1975, 1976) followed the biokinetics of 106Ru for 365 d after inhalation by hamsters of 106Ru oxalate aerosols heat-treated at 27℃, 300℃, 600℃, or 1100℃. At 27℃ and 300℃, it was considered that mixed aerosols were formed which contained ruthenium oxalate and degradation products, but at 600℃ and 1100℃, most of the 106Ru was converted to 106RuO2 (see below). In dissolution tests in vitro (synthetic serum ultrafiltrate at 37℃), approximately 38% and 33% dissolved from aerosol samples formed at 27℃ and 300℃, respectively, mainly in the first day, suggesting fr of approximately 0.3 and sr of more than 10 d–1. At 8 d after inhalation of aerosol formed at 27℃, approximately 30% of the retained 106Ru was in the lungs, with approximately 5% in the skeleton and approximately 20% in soft tissues. For the particles formed at 300℃, lung retention was somewhat higher and systemic uptake was lower. For both aerosols, approximately 7% was in the skull, and was attributed to retention of 106Ru in the NP region. As discussed below, bound state parameter values for ruthenium of fb = 0.05 and sb = 0.1 d–1 are used here. Assuming these values, dissolution parameter values fitted here (i.e. by the Task Group) for the aerosol formed at 27℃ were fr = 0.36, sr = 37 d–1, and ss = 0.1 d–1, consistent with assignment to Type F; and for the aerosol formed at 300℃, fr = 0.28, sr = 34 d–1, and ss = 0.008 d–1, consistent with assignment to Type M. (39) Although specific parameter values for ruthenium oxalate based on in-vivo data are available, they are not adopted here because inhalation exposure to ruthenium oxalate is unlikely. Instead, ruthenium oxalate is assigned to Type F. (c) Ruthenium citrate (40) Boecker and Harris (1969) followed the biokinetics of 106Ru for 512 d after inhalation of 106Ru citrate by dogs. Whole-body retention was represented by a four-component exponential function, and 80%, 13%, 4%, and 3% IBB were retained with effective half-times of 0.6, 11, 53, and 280 d, respectively. The large amounts excreted in the first few days, in both urine and faeces, suggest that much of the activity deposited in the respiratory tract was absorbed rapidly, at a rate similar to particle transport from the upper airways to the alimentary tract. Subsequent excretion was mainly via urine. Soon after exposure, the lungs contained approximately 40% IBB, and this decreased to approximately 4% IBB after 16 d. There was wide distribution of the 106Ru retained in the body, but the concentration in lungs remained higher than in other tissues. The authors suggested that hydrolysis of the polyvalent ruthenium might have caused the long-term lung retention. As discussed below, bound state parameter values for ruthenium of fb = 0.05 and sb = 0.1 d–1 are used here. Assuming these values, dissolution parameter values fitted here (i.e. by the Task Group) were fr = 0.8, sr = 0.3 d–1, and ss = 0.005 d–1, consistent with assignment to Type M. Although specific parameter values for ruthenium citrate based on in-vivo data are available, they are not adopted here because inhalation exposure to ruthenium citrate is unlikely. Instead, ruthenium citrate is assigned to Type M. (d) Ruthenium dioxide (RuO2) (41) Bair et al. (1961) followed the biokinetics of 106Ru for 490 d after inhalation of 106RuO2 aerosols by mice. Clearance was initially rapid; approximately 95% IBB cleared within a few days. After the first day, the lungs contained more 106Ru than any other tissue. Lung retention was fit by a three-component exponential function, with 83%, 15%, and 2% ILD retained with biological half-times of 7, 28, and 230 d, respectively. It was estimated that ILD was approximately 25% IBB. Systemic uptake (bone and muscle) accounted for approximately 1% IBB at 1 d, and decreased slowly thereafter. As discussed below, bound state parameter values for ruthenium of fb = 0.05 and sb = 0.1 d–1 are used here. Assuming these values, dissolution parameter values fitted here (i.e. by the Task Group) were fr of approximately 0.3, sr of approximately 10 d–1, and ss of approximately 0.001 d–1, consistent with assignment to Type M. (42) Burykina (1962) measured the tissue distribution of 103Ru at times up to 11 d after administration of 103RuO2 to rats by intratracheal instillation. There were very low activities measured in systemic tissues, less than 0.01% ILD in total, indicating Type S behaviour. (43) Stuart and Gaven (1970) followed the biokinetics of 106Ru for 39 months after inhalation of 106RuO2 by dogs. The 106RuO2 was avidly retained in the lungs. After the early clearance phases, whole-body retention was fit by a single exponential function with biological half-times in the range 5–9 y. From 7 to 39 months, more than 98% of retained 106Ru was in the lungs or associated lymph nodes. As discussed below, bound state parameter values for ruthenium of fb = 0.05 and sb = 0.1 d–1 are used here. Assuming these values, dissolution parameter values fitted by the Task Group were fr = 0.0005, sr = 100 d–1, and ss = 0.0004 d–1, consistent with assignment to Type S. (44) As outlined above, Newton and Latven (1971) followed the biokinetics of 106Ru for 16 d after inhalation by a dog of 106Ru oxalate aerosols heat-treated at 500℃ or 1000℃, which was thought to convert most of the 106Ru to 106RuO2. In complementary experiments, fractional absorption of 106Ru from the alimentary tract after administration of the same materials by gavage to dogs were estimated to be approximately 0.02 and 0.003. Following inhalation, approximately 50% IBB was excreted in the first few days, and the rest with a half-time of approximately 40 and 300 d, respectively. At 16 d after inhalation of aerosol formed at 1000℃, 97% of the retained 103Ru was in the lungs, with approximately 2% in the skeleton and soft tissues combined, suggesting either Type M or Type S behaviour. For the particles formed at 500℃, lung retention was somewhat lower and systemic uptake was higher. (45) As outlined above, Newton et al. (1975, 1976) followed the biokinetics of 106Ru for 365 d after inhalation by hamsters of 106Ru oxalate aerosols heat-treated at 600℃ or 1100℃. In dissolution tests in vitro (synthetic serum ultrafiltrate at 37℃ for 20 d), dissolution was negligible. At 365 d after inhalation of aerosol formed at 1100℃, approximately 84% of the retained 106Ru was in the lungs, with approximately 1% in the skeleton and approximately 1% in soft tissues. For the particles formed at 600℃, lung retention was somewhat lower and systemic uptake was higher. As discussed below, bound state parameter values for ruthenium of fb = 0.05 and sb = 0.1 d–1 are used here. Assuming these values, dissolution parameter values fitted here (i.e. by the Task Group) were fr = 0.001, sr = 100 d–1, and ss = 0.003 d–1 for the aerosol formed at 1100℃; and fr = 0.001, sr = 100 d–1, and ss = 0.0045 d–1 for the aerosol formed at 600℃, consistent with assignment to Type M. (46) Five workers were monitored for several months following acute inhalation of 106Ru, thought to be in the form of RuO2 (Hesp and Coote, 1970). In-vivo chest counts were started 3–13 d after intake and continued up to 377 d. Measurements of urinary 106Ru were started 15–22 d after intake and continued up to 354 d after intake. Long-term retention of 106RuO2 occurred in the chest, presumably in lungs and lymph nodes. The biological half-time for chest retention averaged 206 d (range 174–428 d). A similar average half-time was indicated by urinary data. On average, daily loss in urine was equivalent to approximately 44% of daily biological removal from the chest. The other 56% was presumably lost in faeces or retained in systemic tissues. As discussed below, bound state parameter values for ruthenium of fb = 0.05 and sb = 0.1 d–1 are used here. Assuming these values, dissolution parameter values fitted here (i.e. by the Task Group) were fr = 0.001, sr = 100 d–1, and ss = 0.002 d–1, consistent with assignment to Type M. (47) As noted in the section on ruthenium tetroxide above, in two reported incidents, it was suspected that RuO4 was released into the environment but converted to RuO2 by interaction with the ambient aerosol. (48) Seven individuals were monitored by external counting following accidental inhalation of 103Ru (Pusch, 1968). Drops of water containing fission products of 235U had been spread accidentally on a laboratory floor, and 103Ru in the droplets apparently became airborne and spread throughout the building. The chemical form of airborne 103Ru was not determined but may have been a mixture of 103RuO4 vapour and particulate 103Ru, possibly RuO2 formed by interaction of 103RuO4 with the ambient aerosol through processes described by Snipes and Kanapilly (1983). Ruthenium was not detected in any organ other than the lungs. Measurements of retention in the chest were started 3 d after exposure and continued for 1–4 months. The biological half-time averaged approximately 80 d (range 64–93 d). Urinary excretion accounted for approximately 20% of urinary plus faecal losses in the early days after exposure, suggesting Type M behaviour. (49) Thirty-five workers were exposed to airborne 106Ru for 10–15 min while working in a building where nuclear fuel was reprocessed (Howells et al., 1977). The released activity appeared to have been 106RuO4, but this was presumably converted, in part, to particulate forms of 106Ru during mixing and interacting with room air (Snipes and Kanapilly, 1983). Later analysis of samples from the contaminated building indicated that the ruthenium was in an oxide form (Howells et al., 1977). Immediately after the incident, individuals were monitored by external counting. Localisation (longitudinal and lateral scanning) began within 8 d and indicated that the observed 106Ru was retained in the lungs, with no significant translocation to other body organs. Measurements of chest activities were made on 11 workers for 3 y. Biological half-times estimated for eight workers were in the range 625–3500 d. They were not determined for the other three workers because their fitted effective half-times equalled or exceeded the physical half-life of 106Ru. The apparent increase in lung content was attributed to redistribution of activity to sites with higher counting efficiency. The long biological half-times are consistent with the hypothesis that the deposited 106Ru had been converted to 106RuO2, and suggest Type S behaviour. (50) Based on these studies, ruthenium dioxide is assigned to default Type S. (e) Irradiated fuel fragments (51) Rundo (1965) measured mixed fission products in vivo from 6 to 864 d after suspected accidental inhalation of irradiated uranium by a worker. Measurements indicated that the activity was mainly located in the lungs. Biological clearance of 103Ru could not be measured, suggesting a half-time of more than 230 d, and Type M or S behaviour of the ruthenium present. (52) Mirell and Blahd (1989) made whole-body measurements of activity on seven people from approximately 2 weeks to several months after exposure to the initial Chernobyl reactor accident plume in Kiev, Ukraine. Biological retention half-times were similar for different radionuclides (45 d for 103Ru) and different from those expected for systemic retention, indicating that they were trapped in particles and metabolically inert, thus indicating Type M rather than Type F behaviour. (53) The in-vitro dissolution of samples of particles released from the Chernobyl accident was measured for up to 60 d (Cuddihy et al., 1989). For all radionuclides, including 103Ru and 106Ru, 10% dissolved in a few hours, and the rest with a half-time of 160 d. Hence, fr = 0.1, sr∼10 d–1, and ss = 0.004 d–1, consistent with assignment to Type M. (54) Lang et al. (1994) followed the biokinetics of 95Zr, 95Nb, 103Ru, and 141Ce for 3 months after intratracheal instillation of neutron-irradiated UO2 particles into rats. For 103Ru, the amounts in kidney and bone were less than 1% ILD. It was assessed here that fr was approximately 0.01 and ss was approximately 0.005 d–1, suggesting Type M or Type S behaviour. (55) Based on these studies, ruthenium associated with irradiated fuel fragments is assigned to default Type M.
2.2.1.3. Rapid dissolution rate for ruthenium
(56) Following deposition in the respiratory tract of the most soluble forms of ruthenium studied (chloride, oxalate, and citrate), a rapid phase of dissolution was observed. Analysis here suggested values of sr of the order of 10–100 d–1, but it was considered that there was insufficient information to select a rapid dissolution rate, sr, for ruthenium different from the general default value of 30 d–1, which is applied here to all Type F forms of ruthenium.
2.2.1.4. Extent of binding of ruthenium to the respiratory tract
(57) Following deposition in the respiratory tract of the most soluble forms of ruthenium studied (citrate, chloride, and oxalate), a rapid phase of dissolution was observed but was incomplete. The strongest evidence that the retention was at least partly due to binding to respiratory tract tissues, rather than transformation to relatively insoluble particles, comes from studies of inhaled RuO4. Long-term retention of a fraction of the ruthenium was observed throughout the respiratory tract, but notably in the conducting airways, from which most particles are cleared rapidly. Autoradiographs showed that ruthenium dispersion in the turbinates and lymph nodes was relatively uniform; only single tracks were observed with no indication of focal accumulation, supporting the view that the ruthenium was in a bound form rather than a particulate form. Based on the results of a study of 106RuO4 inhaled by dogs (Snipes, 1981), bound state parameter values for ruthenium of fb = 0.05 and sb = 0.1 d–1 were chosen here. (58) There is experimental evidence that ruthenium in soluble form deposited in the conducting airways is retained in a bound state. It is therefore assumed here that these bound state parameter values apply throughout the respiratory tract (ET2, BB, bb, and AI regions).
2.2.2. Ingestion
(59) Measurements of the urinary and faecal excretion of ruthenium by a male volunteer after ingestion of chloro-complexes of Ru(III) and Ru(IV), Ru-contaminated clams, or nitrosyl Ru(III) suggested that absorption was approximately 0.01 and perhaps somewhat greater for nitrosyl Ru(III) (Yamagata et al., 1969). Studies by Veronese et al. (2003) and Giussani et al. (2008) used stable isotopes for determination of the absorption and retention of ruthenium in five human subjects. They obtained absorption values of 0.0075 ± 0.0012 for inorganic ruthenium (poorly complexed ruthenium), 0.039 ± 0.005 for ruthenium citrate, and less than 0.04 for ruthenium ascorbate. (60) Results from a number of studies on the absorption of 106Ru administered as the chloride to mice, rats, rabbits, guinea pigs, chickens, cats, dogs, and monkeys, including values for fasted animals, were in the range of 0.02–0.06 (Thompson et al., 1958; Bruce and Carr, 1961; Burykina, 1962; Furchner et al., 1971; Stara et al., 1971). Values for 106Ru administered as the oxide to rats and rabbits were in the range of 0.003–0.03. Bruce and Carr (1961), and Bruce (1963) measured the absorption of ruthenium administered in the form of nitrosyl derivatives. Both nitrato- and nitro-complexes of nitrosyl ruthenium are formed during dissolution in nitric acid in the reprocessing of uranium fuels. The nitro-complexes are probably more important because they are more resistant to hydrolysis in neutral and alkaline conditions. Results obtained for the nitrato-nitrosyl complex in rats and rabbits were 0.06 and 0.13, respectively. A value of 0.04 was reported for the absorption of ruthenium administered to rats as a nitro-nitrosyl (Bruce, 1963). Stara et al. (1971) estimated the absorption of ruthenium in cats given nitrosyl ruthenium compounds as between 0.1 and 0.15. Cantone et al. (1994) used stable isotopes to estimate absorption in a rabbit as 0.06. (61) In Publication 30 (ICRP, 1980), an absorption value of 0.05 was recommended for all chemical forms of ruthenium. This value was adopted in Publication 56 (ICRP, 1989) for dietary intakes. In this publication, the default assumption is an fA value of 0.05.
2.2.3. Systemic distribution, retention, and excretion
2.2.3.1. Summary of the database
(a) Data for human subjects
(62) Whole-body retention of ruthenium was measured in a healthy adult male who ingested different chemical forms of 103Ru (t1/2 = 39.3 d) or 106Ru (t1/2 = 373.6 d) on different occasions (Yamagata et al., 1969, 1971). Data for 103Ru indicated two retention components with biological half-times of 2.3 d and 30 d. The early component may have reflected unabsorbed activity, including activity bound in the intestinal mucosa, as observed in laboratory animals after oral administration of ruthenium (Bruce et al., 1962; Nelson et al., 1962; Stara et al., 1971). The longer-term behaviour of 103Ru in the subject could not be determined due to the short radiological half-life. Results from a later study on the same subject using 106Ru suggested a retention component with a half-time of approximately 9 d and a second component with a half-time of 32 d. At longer times, the estimated biological half-time lengthened with the period of observation: 81 d based on observations in the period 40–80 d after intake, 122 d at 80–150 d after intake, 158 d at 150–350 d after intake, and 385 d at 350–660 d after intake. (63) Veronese et al. and Giussani et al. measured the rate of disappearance of the stable isotope 101Ru from blood plasma and its rate of urinary excretion following intravenous injection into healthy volunteers (Veronese et al., 2001, 2003, 2004; Giussani et al., 2008). Solutions with different degrees of complexation of ruthenium with citrate were injected in different experiments. In all cases, there was an initial rapid distribution of ruthenium between plasma and the interstitial fluids. The subsequent pattern of disappearance from plasma depended on the form administered. A relatively fast component of clearance was followed by a relatively slow phase, but the ratio of the size of the fast and slow components varied with the degree of complexation of ruthenium in the injected solution. The investigators concluded that the fast and slow components represented ruthenium complexed with citrate and inorganic ruthenium, respectively. The half-times of the fast and slow components of clearance were estimated as 17 ± 2 min (mean ± standard deviation) and 23 ± 2 h, respectively. The fast component represented an estimated 82 ± 2% of the total for solutions with highly complexed ruthenium and 17 ± 2% for solutions with the lowest degree of complexation. Urinary excretion of ruthenium was rapid following injection of highly complexed ruthenium, with more than 40% of the injected amount excreted in urine during the first 12 h and up to 70% over the first 2 d. Total excretion amounted to less than 25% of the injected amount over the first 48 h after administration of the solution with the lowest degree of complexation. (b) Data for laboratory animals (64) Furchner et al. (1964, 1971) investigated the systemic biokinetic of 106Ru in mice, rats, monkeys, and dogs receiving 106RuCl3 orally or by intraperitoneal or intravenous injection. For each species, whole-body retention data from injection studies were fit by a sum of four exponential terms. Short- and intermediate-term retention as represented by the first three terms was broadly similar in the four species. Long-term retention represented approximately 17% (14.7–18.7%) of the injected amount in all four species, but corresponding biological half-times were more variable: approximately 750 d in mice, 500 d in rats, 200 d in monkeys, and 1500 d in dogs. The large differences in derived long-term half-times may have been due, in part, to the different lengths of observation periods (e.g. 276 d for monkeys and 970 d for dogs), but this does not fully explain the differences. (65) Boecker and Harris (1969) investigated the behaviour of 106Ru in beagles after acute inhalation of 106Ru citrate. By a few days after intake, the systemic burden represented the preponderance of total-body activity, although the concentration of 106Ru in the lungs exceeded that in other tissues throughout the 512-day study. A sum of four exponential terms fit to whole-body retention data paralleled a retention curve determined earlier by Furchner et al. (1964) for dogs receiving 106RuCl3 by intravenous injection. As determined in one of the dogs in the inhalation study, losses by urinary and faecal excretion were approximately the same over the first 3 d, but thereafter, daily urinary excretion was generally three to seven times greater than daily faecal excretion. (66) Cumulative urinary excretion over the first 3 d after intravenous or intraperitoneal injection of 106RuCl3 into monkeys, dogs, rats, and mice was 21.6–29.0% of the injected amount (Furchner et al., 1971). Cumulative faecal excretion was more variable, ranging from 4.1% in dogs to 18.7% in mice. The urinary to faecal excretion ratio over the first 3 d was 2.6 in monkeys, 5.5 in dogs, 2.2 in rats, and 1.6 in mice. (67) In guinea pigs receiving 106RuCl3 by subcutaneous injection, approximately two-thirds of the injected ruthenium was excreted in urine and faeces over the first 47 d (Burykina, 1962). The urinary to faecal excretion ratio during that period was 2.7. (68) In rats, cumulative urinary excretion over the first 60 d accounted for 53.8% of the administered amount after intravenous injection and 51.8% after intraperitoneal injection of 106Ru as chloride (Thompson et al., 1958). The urinary to faecal excretion ratio during the same period was 2.8 for intravenous injection and 2.4 for intraperitoneal injection. (69) Compared with intravenous or intraperitoneal injection data for ruthenium chloride, higher rates of urinary and faecal excretion have been estimated for activity absorbed to blood after inhalation of 106Ru as ruthenium tetroxide vapour (RuO4) by rats (Runkle et al., 1980) or dogs (Snipes, 1981). The systemic distribution of retained 106Ru was broadly similar to that determined in injection studies involving other forms of ruthenium. (70) The time-dependent distribution of ruthenium in systemic tissues and fluids has been studied in several animal species including mice, rats, rabbits, hamsters, guinea pigs, and dogs (Durbin et al., 1957; Thompson et al., 1958; Durbin, 1960; Bair et al., 1961; Bruce and Carr, 1961; Burykina, 1962; Nelson et al., 1962; Bruce, 1963; Seidel et al., 1963; Boecker and Harris, 1969; Furchner et al., 1971; Newton et al., 1976; Runkle and Snipes, 1978; Runkle et al., 1980; Snipes, 1981). A relatively high concentration of ruthenium in blood is indicated in some studies (Burykina, 1962; Newton and Latven, 1971; Snipes, 1981). Liver and kidneys are important repositories for ruthenium in the early days and weeks following its absorption to blood. Bone has been identified as an important long-term repository for ruthenium in some studies (Thompson et al., 1958; Bair et al., 1961; Burykina, 1962; Boecker and Harris, 1969). Reported fractions of systemic activity in liver, kidneys, and bone at any given time after intake are variable. For example, the liver contained approximately 6% of the administered activity at 2 d after intraperitoneal injection of 106Ru as chloride into rats (Furchner et al., 1971), but approximately 19–26% of the absorbed activity at 1–3 d after subcutaneous injection of 106Ru as chloride into guinea pigs (Burykina, 1962). Muscle and skin generally show much lower concentrations than liver and kidneys, particularly at early times after uptake to blood, but usually contain much or most of the systemic activity due to their large mass (Burykina, 1962; Boecker and Harris, 1969; Furchner et al., 1971). Nelson et al. (1962) concluded from an autoradiographic study of mice given 103Ru chloride by intravenous injection that the distribution pattern of ruthenium is determined to a large extent by its elevated uptake and retention in connective tissues. (71) Thompson et al. (1958) concluded from studies of rats administered 106Ru chloride by different modes that activity was retained more tenaciously in bone tissue than in visceral organs of rats, and that deposition was greater in bone of young growing rats than in older animals. After oral administration of ruthenium as nitrosyl-trinitrate to rabbits, the concentration of ruthenium in bone was not uniform but was highest in the ends of bones, apparently associated with higher deposition in areas of better blood supply and, possibly, bone growth (Bruce and Carr, 1961). In an autoradiographic study on mice given 103Ru chloride by intravenous injection, Nelson et al. (1962) found that the concentration of 103Ru was low in cortical bone, but that the epiphyseal plates had significant early uptake and the periosteal layer had marked activity throughout the 32-day period of observation. In relatively long-term studies, activity in bone has usually represented a substantial portion of the systemic content of ruthenium at times remote from intake (Thompson et al., 1958; Bair et al., 1961; Burykina, 1962; Boecker and Harris, 1969), but there are exceptions. For example, in a study on rats, activity in bone was estimated to represent, at most, 8.4% of systemic activity during the first 283 d after intraperitoneal injection of 106Ru as chloride (Furchner et al., 1971). In contrast, in guinea pigs receiving 106Ru as chloride by subcutaneous injection, activity in bone was estimated to represent approximately 40% of the systemic activity at 50 d after administration. At 128–512 d after inhalation of 106Ru as citrate by dogs, activity in the skeleton represented nearly 30% of the systemic activity as estimated from data for muscle, pelt, liver, kidneys, and gastrointestinal tract.
2.2.3.2. Biokinetic model for systemic ruthenium
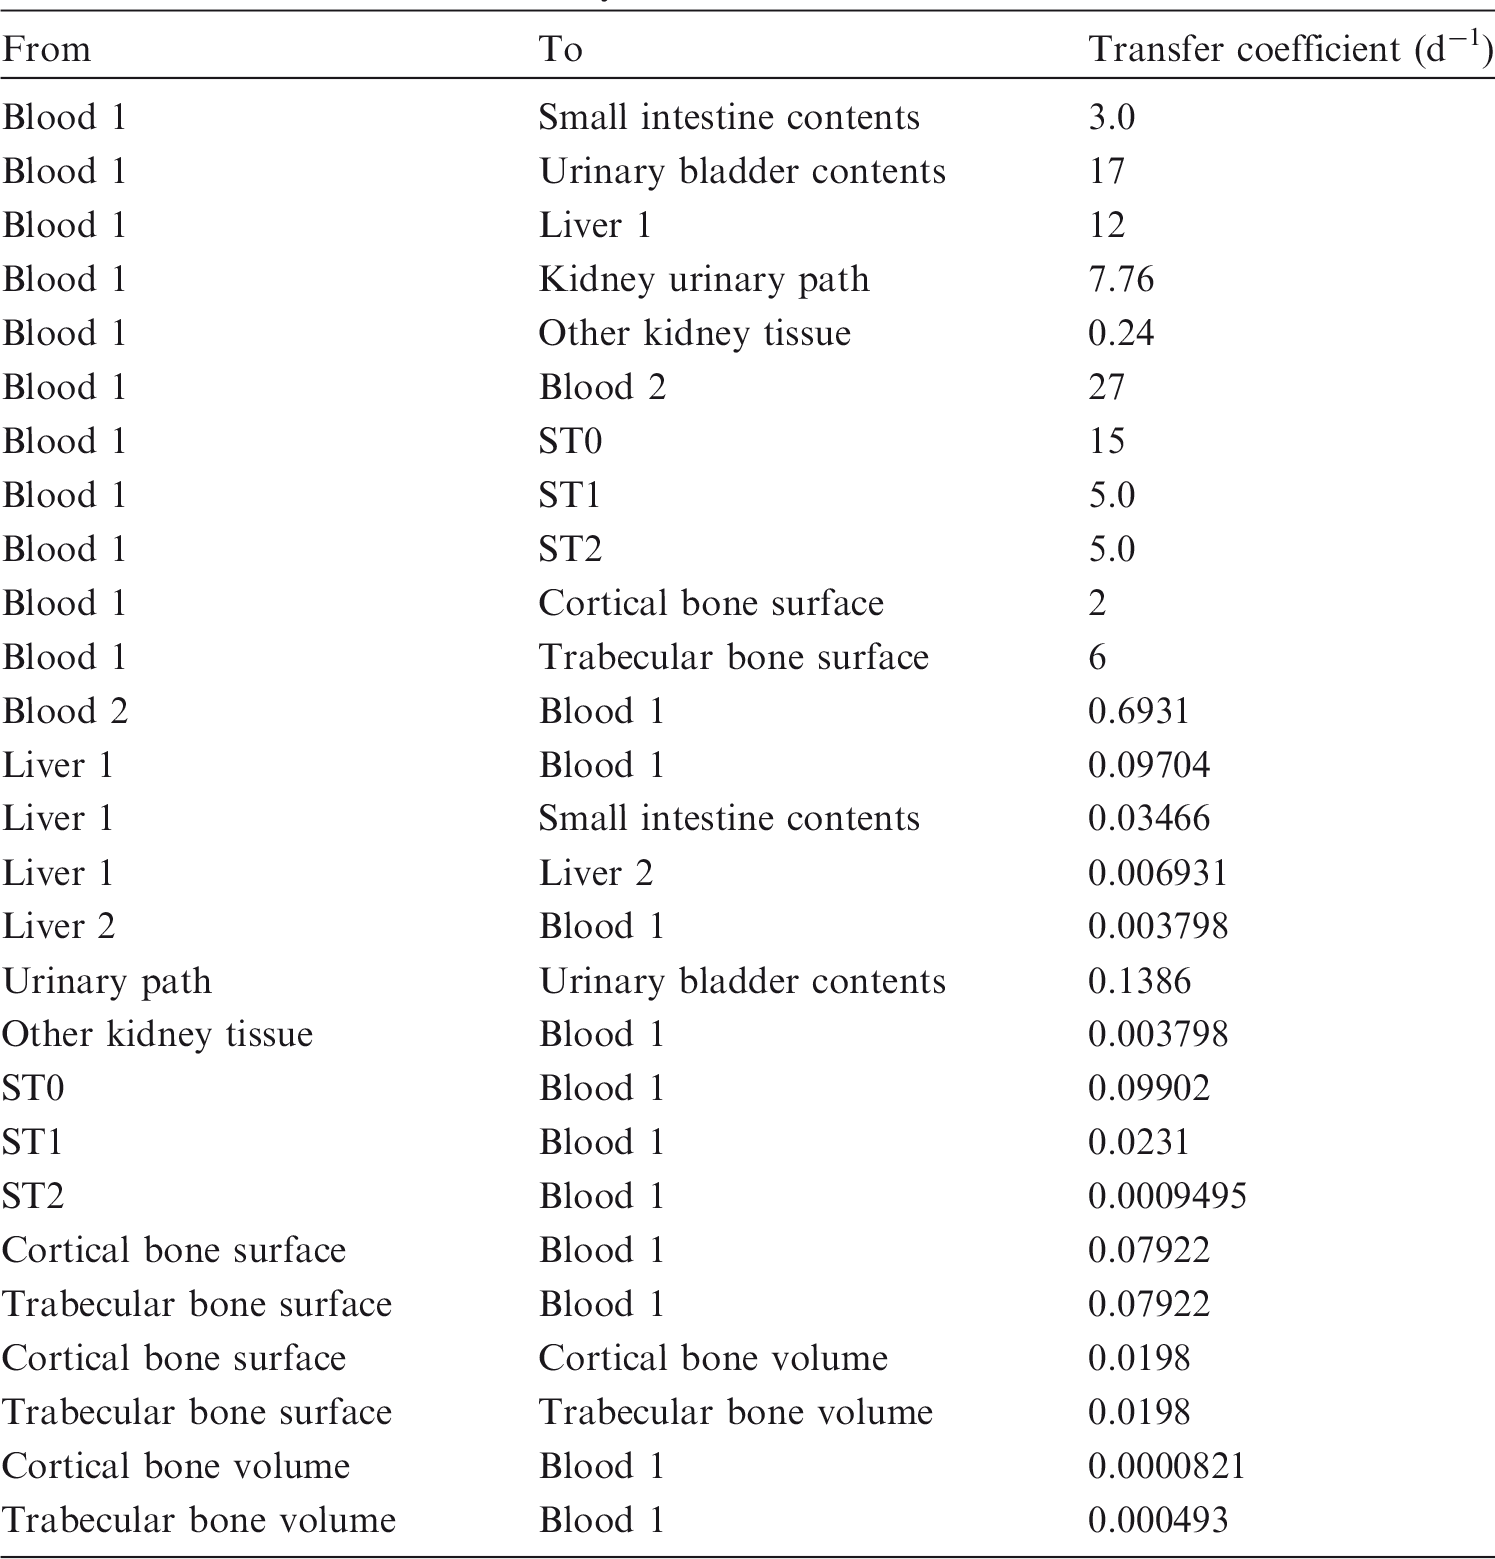
(72) The biokinetic model for systemic ruthenium is taken from a paper by Leggett (2012). The model structure is shown in Fig. 2.1. Transfer coefficients are listed in Table 2.4. (73) The model for blood is based on data of Veronese et al. (2003, 2004) on the rate of disappearance of ruthenium from blood plasma following intravenous injection of different forms of ruthenium. Parameter values describing blood clearance are based on data for the form removed most slowly from plasma (a solution with a low degree of complexation of ruthenium with citrate), in view of the prolonged retention of ruthenium in blood indicated by some inhalation or injection studies on laboratory animals (Burykina, 1962; Newton and Latven, 1971; Snipes, 1981). Retention components determined for blood plasma in the human study are assumed to apply to whole blood. (74) In the model, blood is divided into two compartments: Blood 1 and Blood 2. Ruthenium entering blood is assigned to Blood 1, which is a rapid-turnover pool. Blood 2 is a more slowly exchanging pool that contains most of the activity in blood, except for a short period soon after acute uptake of ruthenium. Activity leaves Blood 1 at the rate 100 d−1, corresponding to a half-time of approximately 10 min, with 27% of outflow going to Blood 2 and the remaining 73% divided among tissue compartments, urinary bladder contents, and gastrointestinal contents. Activity moves from Blood 2 back to Blood 1 with a half-time of 1 d. (75) Urinary excretion is assumed to arise from transfer of activity from blood into the urinary bladder contents and transfer from blood to the kidneys (urinary path), and subsequent release to the urinary bladder contents over a period of days. Faecal excretion is assumed to arise, in part, from biliary secretion of ruthenium into the small intestine contents after uptake by the liver and, in part, from secretion from Blood 1 into the small intestine contents. Parameter values for urinary and faecal excretion are set so that: model predictions are in reasonable agreement with early urinary data for a human subject injected with low-complexed ruthenium and for monkeys, dogs, rats, and mice injected with 106Ru; urinary excretion represents approximately 80% of total excretion based on data for different animal species, but with data for dogs and monkeys given relatively high weight; and the two sources of faecal excretion contribute equally to endogenous faecal excretion of ruthenium in the absence of specific data on relative contributions of these sources. (76) The distribution of ruthenium leaving blood is based to a large extent on the time-dependent distribution of ruthenium determined in laboratory animals, particularly dogs because of the availability of relatively long-term data for dogs. In addition to the 27% of outflow from Blood 1 assigned to Blood 2, outflow from Blood 1 is distributed as follows: 12% to liver, 8% to kidneys, 8% to bone, 17% to urinary bladder contents, 3% to small intestine contents, and 25% to other soft tissue. Activity entering liver is assigned to the rapid-turnover liver compartment called ‘Liver 1’. Fractions 0.97 and 0.03 of activity entering kidneys are assigned to urinary path and other kidney tissue, respectively. Three-quarters of activity entering bone is assigned to trabecular bone surfaces and one-quarter to cortical bone surfaces. Activity entering other soft tissue (25% of outflow from Blood 1) is divided as follows: 15% to the short-term retention compartment ST0; 5% to the intermediate-term retention compartment ST1; and 5% to the long-term retention compartment ST2. (77) Biological half-times for compartments are set to reproduce different phases of loss of ruthenium from the total body observed in laboratory animals and a human subject, and the time-dependent distribution of systemic activity in dogs. Activity is removed from Liver 1 with a biological half-time of 5 d, with 25% going to small intestine contents (via biliary secretion), 5% to Liver 2, and 70% to Blood 1. Activity transfers from Liver 2 to Blood 1 with a half-time of 0.5 y. Activity transfers from urinary path to urinary bladder contents with a half-time of 5 d, and from other kidney tissue to Blood 1 with a half-time of 0.5 y. Activity in soft tissue compartments ST0, ST1, and ST2 returns to Blood 1 with half-times of 7 d, 30 d, and 2 y, respectively. Activity leaves cortical bone surfaces or trabecular bone surfaces with a half-time of 7 d, with 80% transferring to Blood 1 and 20% transferring to the corresponding bone volume compartment. Activity transfers from cortical bone volume or trabecular bone volume to Blood 1 at the rate of bone turnover. Structure of the biokinetic model for systemic ruthenium. SI, small intestine. ST0, ST1, and ST2 represent soft tissues with fast, intermediate, and slow turnover, respectively. Transfer coefficients for systemic ruthenium. ST0, ST1, and ST2 represent soft tissues with fast, intermediate, and slow turnover, respectively. Total body and lung contents, and daily urinary excretion of 106Ru (106Rh measured) following inhalation of 1 Bq ruthenium tetroxide.


2.2.3.3. Treatment of radioactive progeny
(78) The radioactive progeny addressed in the derivation of dose coefficients for ruthenium isotopes are isotopes of rhodium or technetium. Rhodium and ruthenium have similar chemical properties and appear, from limited comparative data, to have broadly similar biokinetic in rats. Therefore, rhodium produced in vivo following intake of ruthenium is assigned the systemic biokinetic model for ruthenium. Technetium as a member of a ruthenium chain is assigned the systemic model for technetium as a parent described in OIR Part 2 (ICRP, 2016). Technetium atoms produced in a systemic compartment of the ruthenium model that is identifiable with a compartment of the characteristic model for technetium [i.e. the model applied in OIR Part 2 to technetium as a parent radionuclide; ICRP (2016)] are assigned the characteristic model for technetium from their time of production. (79) Technetium atoms produced in compartments of the ruthenium model that are ambiguous with regard to the characteristic model for technetium (Blood 2 and other soft tissue compartments) are assigned a transfer coefficient to the blood compartment of the technetium model (blood), and upon reaching blood are assigned the characteristic model for technetium. The blood compartment of the technetium model is identified with the central blood compartment of the ruthenium model, named Blood 1. Technetium atoms produced in compartments of other soft tissues of the ruthenium model are assumed to transfer to blood at the rate 0.462 d−1, the highest transfer coefficient from a compartment of other soft tissues to blood in the technetium model, excluding a rapid-turnover compartment representing extracellular fluid. Technetium atoms produced in Blood 2 of the ruthenium model are assumed to transfer to blood at the rate 1000 d−1, a default value used in this publication to represent rapid biological removal.
2.3. Individual monitoring
(80) 106Ru is a beta emitter but it is measured using the 0.512- and 0.622-MeV gamma rays from its short-lived progeny, 106Rh (t1/2 = 30 s). Urine bioassay and/or whole-body counting may be used to estimate the content of 106Ru internally deposited in the body. Total body and lung contents, and daily urinary excretion of 106Ru (106Rh measured) following inhalation of 1 Bq Type F.

2.4. Dosimetric data for ruthenium
Monitoring techniques for 106Ru.

Lung measurement of 106Ru is not generally used in routine monitoring of workers. The Monte Carlo program Visual Monte Carlo was used to simulate photon emission, to calculate the calibration factor for the geometry and radionuclide, and to calculate the detection limit in the lung (Hunt et al., 2012).
Committed effective dose coefficients (Sv Bq−1) for the inhalation or ingestion of 106Ru compounds.

AMAD, activity median aerodynamic diameter.
Dose per activity content of 106Ru (106Rh measured) in total body, lungs, and in daily excretion of urine (Sv Bq−1); 5-µm activity median aerodynamic diameter aerosols inhaled by a reference worker at light work.


Total body and lung contents, and daily urinary excretion of 106Ru (106Rh measured) following inhalation of 1 Bq Type M.

Total body and lung contents, and daily urinary excretion of 106Ru (106Rh measured) following inhalation of 1 Bq Type S.
2.5. References
3. ANTIMONY (Z = 51)
3.1. Chemical forms in the workplace
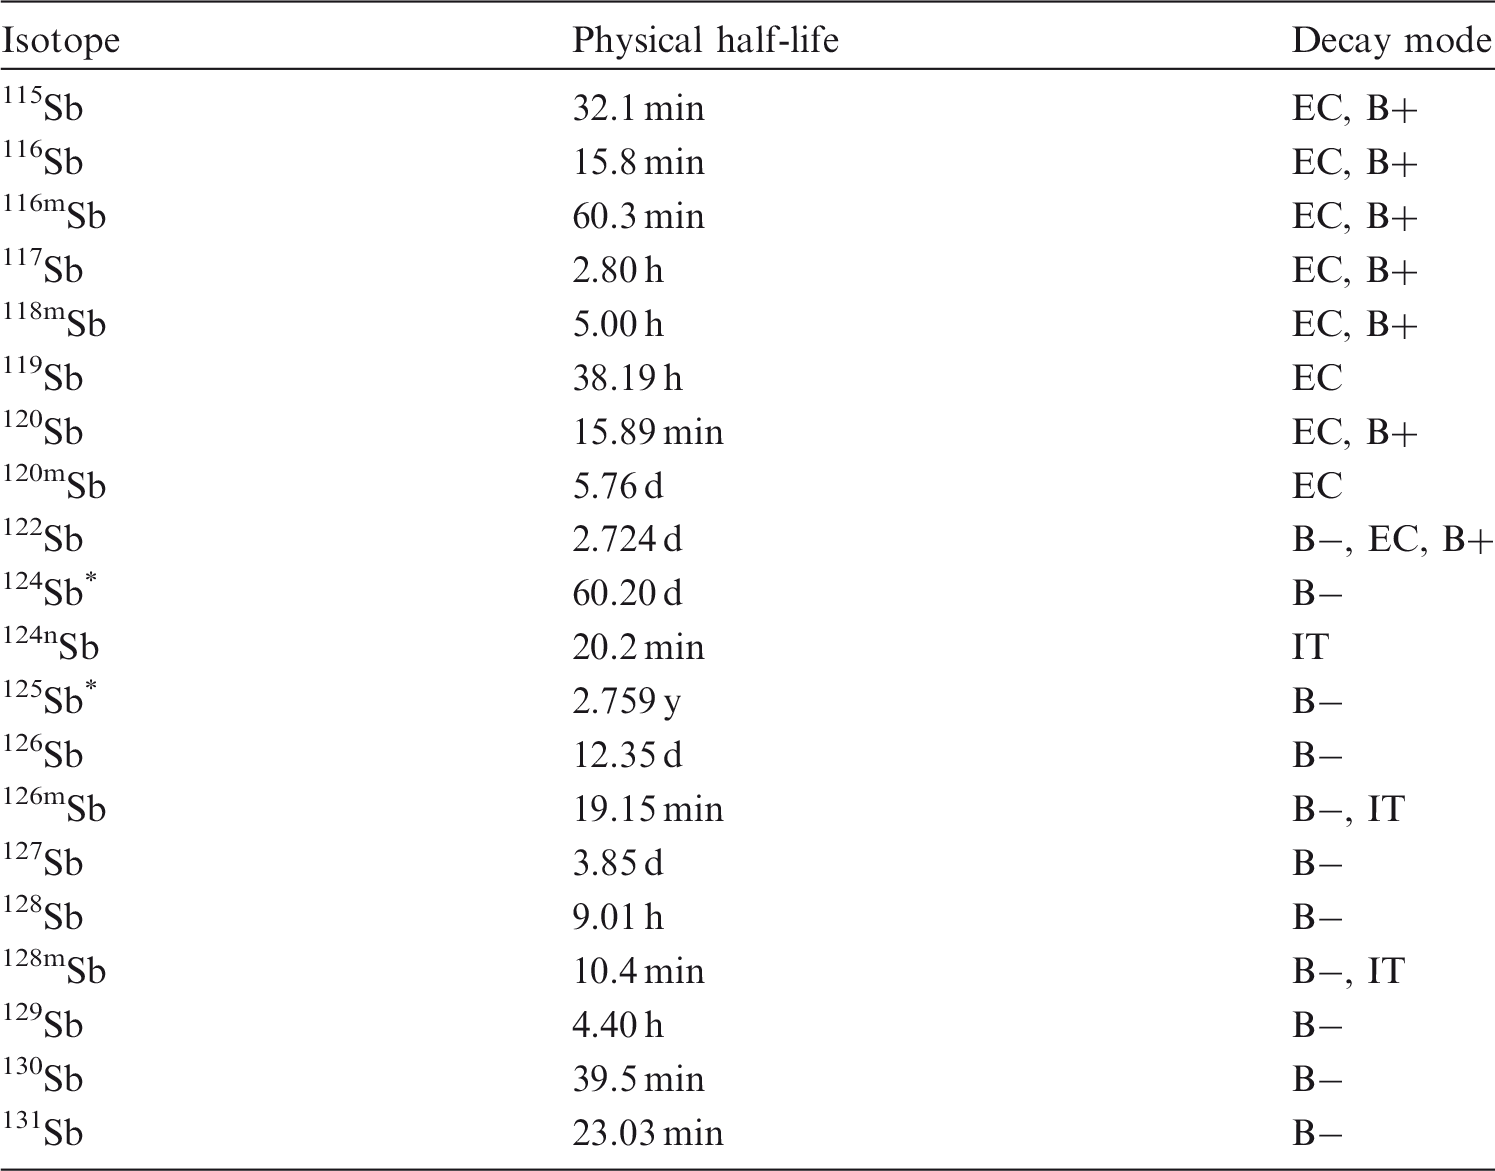
(81) Antimony is a semi-metal or metalloid that occurs mainly in oxidation states III, IV, and V. Antimony may be encountered in industry in a variety of chemical and physical forms, such as oxides, sulphides, chlorides, fluorides, tartrate, and trihydride. It may also be encountered in two anionic forms: SbO2− and SbO3−. 124Sb and 125Sb are fission products that may be associated with irradiated fuel or corrosion products. 125Sb also occurs as a neutron activation product of tin, which may be present in reactor components containing zirconium. Isotopes of antimony addressed in this publication. EC, electron-capture decay; B+, beta-plus decay; B−, beta-minus decay; IT, isomeric transition decay. Dose coefficients and bioassay data for these radionuclides are given in the printed copy of this publication. Data for other radionuclides listed in this table are given in the accompanying electronic annex.
3.2. Routes of intake
3.2.1. Inhalation
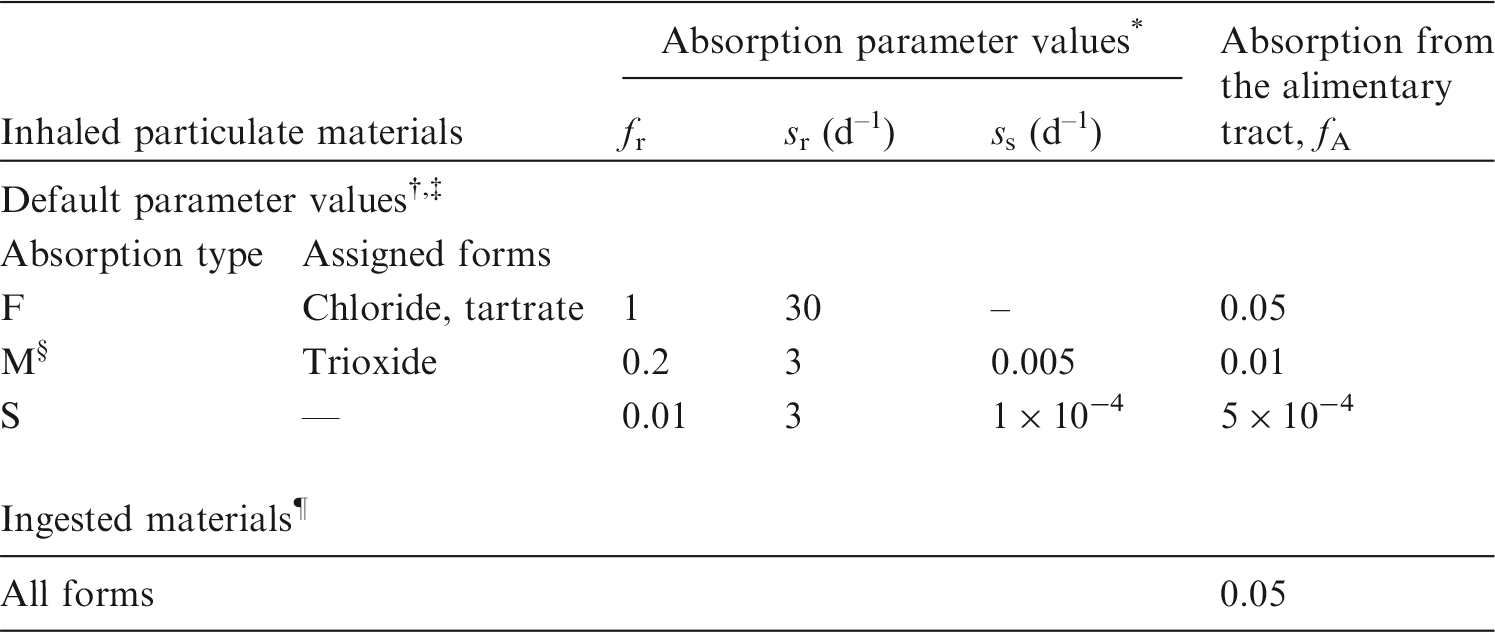
(82) Information on absorption from the respiratory tract is available from experimental studies of antimony inhaled by laboratory animals as chloride, tartrate, or oxide. Studies of workers occupationally exposed to stable antimony have been summarised by IARC (1989). Some information is also available on the behaviour of inhaled 125Sb in humans. (83) Absorption parameter values and types, and associated fA values for particulate forms of antimony are given in Table 3.2. Absorption parameter values for inhaled and ingested antimony. It is assumed that the bound state can be neglected for antimony, i.e. fb = 0.0. The values of sr for Type F, M, and S forms of antimony (30, 3, and 3 d–1, respectively) are the general default values. Materials (e.g. antimony chloride) are generally listed here where there is sufficient information to assign to a default absorption type, but not to give specific parameter values (see text). For inhaled material deposited in the respiratory tract and subsequently cleared by particle transport to the alimentary tract, the default fA values for inhaled materials are applied; i.e. the product of fr for the absorption type and the fA value for ingested soluble forms of antimony (0.05). Default Type M is recommended for use in the absence of specific information on which the exposure material can be assigned to an absorption type; for example, if the form is unknown, or if the form is known but there is no information available on the absorption of that form from the respiratory tract. Activity transferred from systemic compartments into segments of the alimentary tract is assumed to be subject to re-absorption to blood. The default absorption fraction fA for the secreted activity is the reference fA (0.05) for ingestion of the radionuclide.
3.2.1.1. Particulate materials
(a) Antimony chloride (84) Djurić et al. (1962) followed the biokinetic of 124Sb after inhalation of antimony chloride by rats for 140 d. From the results, absorption parameter values calculated here (i.e. by the Task Group) were fr of approximately 1 and sr of approximately 0.5 d–1. Approximately 1% ILD was retained in the lungs with a half-time of approximately 70 d, giving assignment to Type F. However, from approximately 2 weeks after intake, the concentration of 124Sb in the blood was higher than that in the lungs, and hence the long-term lung retention observed may have been largely due to 124Sb in the blood. (b) Antimony tartrate (85) Felicetti et al. (1974b) followed the biokinetic of 124Sb after inhalation by hamsters of trivalent and pentavalent antimony tartrate aerosols, heat-treated at 100℃, for 32 d. In complementary experiments with the same materials, absorption in the gastrointestinal tract was found to be only approximately 1%. In contrast, both forms showed similar, rapid absorption from the lungs; the authors noted that by 2 h post exposure, less than 1% IBB remained in the lungs, indicating fr of approximately 1 and sr of more than 10 d–1. It was also noted that there was considerable faecal excretion and hence limited absorption in the upper respiratory tract, indicating sr of less than 100 d–1. A central value for sr of 30 d–1 is adopted here. It was estimated here that approximately 1% ILD was retained in the lungs at 2 d and 0.1% ILD at 32 d, and it was calculated that fr was approximately 0.99 and ss was approximately 0.1 d–1, giving assignment to Type F. Although similar lung clearance was observed for the two forms, some differences in the systemic tissue distribution (e.g. between liver and skeleton) were noted. (86) Thomas et al. (1973) and Felicetti et al. (1974a) followed the biokinetic of 124Sb after inhalation by mice and dogs, respectively, of aerosols formed by heat-treating antimony tartrate droplets at various temperatures. For each aerosol, groups of mice were killed at intervals to 52 d, and one dog was killed at 32, 64, and 128 d. The chemical form of the antimony after heat treatment was not determined, but the aerosol treated at the lowest temperature (100℃) was referred to as tartrate. From the results in mice, it was estimated here that approximately 1% ILD was retained in the lungs at 2 d and 0.03% ILD at 32 d, and calculated that fr was approximately 0.99 and ss was approximately 0.1 d–1 (as for the hamster study above). Insufficient information was given to estimate absorption parameter values in dogs, but at 32 d, 0.23% ILD was retained, giving assignment to Type F. (87) Although specific parameter values for antimony tartrate based on in-vivo data are available, they are not adopted here because inhalation exposure to antimony tartrate is unlikely. Instead, antimony tartrate is assigned to Type F. (c) Antimony oxides (88) Newton et al. (1994) measured the accumulation and retention of stable antimony trioxide (Sb2O3) in the lungs of rats during 13 weeks of inhalation exposure and for 28 weeks after exposure. It was estimated here, from measurements in the group exposed to the lowest concentration (0.25 mg m–3), that the lung retention half-time was approximately 50 d, indicating Type M or S behaviour. (89) Groth et al. (1986) measured the accumulation of antimony in the lungs of rats after 9 months of chronic inhalation exposure to stable Sb2O3. Concentrations in lungs were considerably higher than in any other tissue. It was estimated here that the lung retention half-time was approximately 50 d, indicating Type M or S behaviour. (90) Rose and Jacobs (1969) followed whole-body retention of 124Sb for 300 d in one worker exposed to an aerosol, said to be oxide, resulting from activation of antimony contamination on a 60Co source. The authors assessed that during the period from 10 d to 6 weeks, there was significant absorption and excretion in urine, but that subsequently, the non-transportable activity was retained in the lungs where it decreased only with the physical half-life. This indicates that the overall behaviour might be Type M or S, but there is insufficient information to determine which. (91) Smelter workers exposed by inhalation to stable antimony trioxide and pentoxide showed a positive relationship between measured antimony lung content and period of employment, such that there was approximately a 10-fold increase for 40 y of employment (McCallum et al., 1971). This indicates that at least some of the material was retained in the lungs on a time-scale of years. Other workers with pulmonary changes related to exposure to antimony trioxide had measured urinary excretion of antimony in hundreds of µg L−1 both during and after employment (McCallum, 1963). This indicates that there is also significant absorption of antimony from the material in the lungs. Although the human data suggest possible Type M and S behaviour, the paucity of results does not provide a basis for firmer classification. (d) Antimony sulphide (92) Groth et al. (1986) measured the accumulation of antimony in the lungs of rats after 9 months of chronic inhalation exposure to stable antimony ore concentrate, which is principally antimony trisulphide (stibnite) Sb2S3. Concentrations in lungs were considerably higher than in any other tissue. It was estimated here that the lung retention half-time was approximately 20 d, indicating Type M behaviour. Compared with rats exposed to oxide in a similar study (see above), the lung concentrations were lower but concentrations in other tissues were similar, suggesting that the sulphide dissolved faster in the lungs than the oxide. (e) Other compounds (93) As noted above, Thomas et al. (1973) and Felicetti et al. (1974a) followed the biokinetic of 124Sb following inhalation by mice and dogs, respectively, of aerosols formed by heat treating droplets of antimony tartrate aerosols at various temperatures. The chemical form of the antimony after heat treatment was not determined, but the higher temperatures (i.e. 500℃ and ∼1000℃) were expected to result in an oxide form (Felicetti et al., 1974a). From the results in mice, it was estimated here that for aerosols formed at both the higher temperatures (500℃ and 1000℃), approximately 5% ILD was retained in the lungs at 2 d and approximately 1% ILD at 32 d, and it was calculated that fr was approximately 0.95, sr was approximately 3 d–1, and ss was approximately 0.03 d–1. Absorption was thus considerably slower than for the tartrate aerosols formed at 100℃, but still gave assignment to Type F. Insufficient information was given to estimate absorption parameter values in dogs, but at 32 d after inhalation of the aerosols formed at the higher temperatures (500℃ and 1000℃), 25% and 5% ILD was retained in the lungs, giving assignment to Types M and F, respectively. (94) Garg et al. (2003) followed whole-body retention of 125Sb for 200–2400 d in seven workers exposed to an aerosol (probably oxide) produced by saw-cutting of an irradiated zirconium alloy pressure tube. Detailed measurements indicated that most of the retained activity was in the lungs, even at 1 y after intake. The authors assessed that lung retention at 180 d after intake was 58–91% of the initial alveolar deposit (estimated from the lung content at 7 d after intake), giving assignment to Type S in each person. However, as the 125Sb and parent tin were presumably minor constituents of the zirconium alloy, the particle matrix might well have been predominantly oxides of other metals (and/or the metals themselves), notably zirconium, which has a highly insoluble oxide [see OIR Part 2, Section 12 (ICRP, 2016)].
3.2.1.2. Rapid dissolution rate for antimony
(95) Evidence from the antimony tartrate studies outlined above suggests a rapid dissolution rate of the order of 30 d–1 (equal to the general default value), which is applied here to all Type F forms of antimony.
3.2.1.3. Extent of binding of antimony to the respiratory tract
(96) Evidence from the antimony tartrate studies outlined above suggests that, following the rapid phase of absorption, only approximately 1% ILD clears relatively slowly from the lungs. There is no evidence available that clearance of this material is mainly by absorption to blood, as assumed for material in the ‘bound state’. It is therefore assumed that the bound state can be neglected for antimony (i.e. fb = 0.0).
3.2.2. Ingestion
(97) No controlled studies on antimony absorption in humans have been carried out, although an accidental exposure to antimony-containing dust (Rose and Jacobs, 1969) demonstrated absorption to be less than 0.05. Results from experiments using female rhesus monkeys suggest that the absorption of antimony administered as tartar emetic (antimony potassium tartrate) was approximately 0.3 (Waitz et al., 1965), while comparable studies with rats gave lower values of approximately 0.05 for this compound (Moskalev, 1964). Most studies performed on different chemical forms of Sb(III) and Sb(V) indicated that intestinal absorption was not usually greater than 0.01 (Rose and Jacobs, 1969; Thomas et al., 1973; Felicetti et al., 1974b), whereas Gerber et al. (1982) found a value of 0.07 for Sb(III) in pregnant mice. Chertok and Lake (1970) reported that absorption was at least 0.04 for dogs fed with 122Sb in debris from a subsurface nuclear test site. Results obtained by Van Bruwaene et al. (1982) for the excretion of 124Sb after oral administration as the chloride, compared with data for intravenous injection, suggested absorption greater than 0.02. Inaba et al. (1984) administered 125Sb to rats, either mixed with blood or biologically incorporated into blood cells, and reported absorption of approximately 0.01 and 0.5, respectively. (98) In Publication 30 (ICRP, 1981), the recommended absorption values were 0.1 for antimony in tartar emetic and 0.01 for all other forms. In Publication 69 (ICRP, 1995), a value of 0.1 was applied to dietary intakes. Due to the variability of the data, a single fA value of 0.05 is recommended here for all situations where specific information is not available.
3.2.3. Systemic distribution, retention, and excretion
3.2.3.1. Summary of the database
(99) The biokinetic of antimony in the human body are not well characterised, despite a long history of therapeutic use of stable antimony and a number of bioassay studies on workers exposed to known levels of stable antimony in air. Subjects administered antimony compounds for therapeutic purposes have generally received large masses of antimony compared with the estimated normal body content. It is uncertain whether the biokinetic data for these subjects reflect normal biokinetic of antimony, but comparative data for different masses of administered antimony do not reveal a mass effect on the excretion rate. (100) Antimony occurs in nature either in the trivalent or pentavalent state, with the trivalent state being the more common and more stable. Trivalent and pentavalent antimony initially show different biokinetic after entering the systemic circulation. For example, Sb(III) is excreted in urine at a lower rate and is accumulated by red blood cells at a higher rate than Sb(V) in the first day or two after intravenous or intramuscular injection. There is evidence of some reduction of Sb(V) to Sb(III) in vivo, and convergence of the systemic biokinetic of these two initial forms over time, but data on the rate and extent of conversion of Sb(V) to Sb(III) are inconsistent. (101) Information on the time-dependent distribution of systemic antimony comes mainly from animal studies. Some species dependence in the behaviour of antimony is indicated. For example, rats have shown much higher accumulation of antimony in red blood cells than mice, dogs, or human subjects. The collective animal data indicate rapid early loss of absorbed or injected antimony in urine, and concentration of much of the retained antimony in the liver, skeleton, and skin or pelt. The longest observed biological half-times for systemic antimony have varied from several days to a few months. Study periods have generally been too short to detect any small long-term component of retention. (a) Human subjects (102) Boyd and Roy (1929) compared the rate of excretion of antimony by patients following intravenous administration of Sb(III) as antimony sodium tartrate and Sb(V) as ethylstibamine. Following injection of Sb(III), approximately 2.5% of the antimony was excreted from 0 to 24 h, 2% from 24 to 48 h, and 1% or less from 48 to 72 h. Following injection of Sb(V), approximately 19% of the antimony was excreted in urine from 0 to 2.5 h, 41% from 0 to 24 h, 6% from 24 to 48 h, and 1.25% from 48 to 72 h. Thereafter, daily excretion remained at 1% or less through Day 13 following injection. Intramuscular injection of the Sb(V) compound produced a slightly lower excretion rate over the first 2 d than intravenous injection of the same compound. (103) Khalil (1931) examined urine, faeces, sweat, milk, and sputum as routes of excretion of antimony in subjects undergoing treatment with Sb(III) as antimony potassium tartrate or stibophen. Urine and faeces appeared to be the only significant routes of excretion. During the 45-day observation period, approximately 45–50% of administered antimony was excreted in urine and approximately 3.5% was excreted in faeces. (104) Goodwin and Page (1943) measured urinary excretion of stable antimony by human subjects from 1 to 48 h after intravenous or intramuscular injection of Sb(III) as stibophen, or intravenous injection of Sb(V) as sodium stibogluconate. Mean (± standard deviation) cumulative urinary excretion at 24 and 48 h after injection of Sb(III) was 20.4 ± 2.2% and 23.9 ± 3.6%, respectively, after intravenous injection and 24.0 ± 9.9% and 26.5 ± 12.0%, respectively, after intramuscular injection. A five-fold difference in the mass of antimony administered intravenously (42.5 vs 8.5 mg) had little, if any, effect on the excretion rate. Total urinary excretion of antimony over the first 48 h after administration of Sb(V) was 83 ± 6% of the injected amount. The portion of antimony excreted as Sb(III) after administration of Sb(V) was low and variable (1.1–7.6%) over the first 6 h, but rose to 50–56% at 28–48 h, indicating gradual conversion of Sb(V) to Sb(III) in the body. (105) Following intravenous infusion of antimony tartar emetic [KSb(III) tartrate] to eight male African soldiers suffering from schistosomiasis, 21 ± 4% (range 18–23%) of the dose was excreted in urine within 72 h (Alves and Blair, 1946). (106) Bartter et al. (1947) investigated the biokinetic of Sb(III) in seven volunteers receiving 124Sb tartar emetic by intravenous injection. More than 90% of the injected activity was removed from blood within 30 min after injection. Thereafter, the blood content declined much more gradually. During the first day, urinary and faecal excretion averaged 10.5 ± 1.9% and 1.5 ± 0.4%, respectively, of the administered amount. During the first 5 d, urinary and faecal excretion averaged 21.2 ± 4.6% and 4.4 ± 1.3%, respectively. Urinary and faecal excretion of antimony measured in one subject over the first 27 d accounted for 66% and 7%, respectively, of the administered amount. The removal half-time from the body in this subject was approximately 14 d between 1 and 27 d after injection. Based on 44 individual daily measurements of excreta from all seven subjects, the mean daily urinary to faecal excretion ratio was 6.8 (range 0.6–25.8). (107) Otto et al. (1947) determined antimony levels in blood plasma, red blood cells, and urine of 14 patients after intramuscular injection of trivalent antimony compounds (anthiolimine or monosodium antimony thioglycollate) or pentavalent antimony compounds (antimony sodium gluconate or ethylstibamine). Trivalent antimony showed five-fold higher concentrations in red blood cells than plasma within the first 24 h after injection. Pentavalent compounds showed much lower affinity than trivalent compounds for red blood cells. Average 24-h urinary excretion of antimony was lower for trivalent compounds (11.4% for anthiolimine and 8.1% for monosodium antimony thioglycollate) than pentavalent compounds (43% for antimony sodium gluconate and 17% for ethylstibamine). (108) Abdallah and Saif (1962) reported studies in which 25 male volunteers were given sodium 124Sb(III)-dimercaptosuccinate (124Sb DMSA) by intramuscular or intravenous injection. Following intramuscular injection, cumulative excretion accounted for approximately 25% of administered 124Sb after 1 d, 50% after 15 d, and 68% after 32 d. Following intravenous injection, cumulative excretion accounted for approximately 35% of the administered 124Sb after 1 d and 63% after 4 d. External measurements indicated relatively high accumulation of activity in the liver, but much higher tissue concentration in the thyroid than in the liver. The thyroid content peaked within the first 24 h, and the liver content peaked approximately 2 d after injection. Two components of retention in the liver are indicated by a plot of the measurements. Approximately 80–85% of the peak content was removed with a half-time of a few days, and the remaining 15–20% had a much longer retention time that could not be quantified over the relatively short observation period. (109) Taylor (1966) reported measurements of antimony in urine of workers who had inhaled SbCl3. The data are too sparse to allow a detailed analysis, but indicate rapid elimination of absorbed antimony in urine. (110) Rose and Jacobs (1969) reported a case of acute inhalation of a relatively insoluble form of 124Sb by a worker in a nuclear research facility. The intake could not be estimated with much accuracy by whole-body counting during the first day due to surface contamination of the worker’s body. During the first 10 d after intake, the authors estimated total faecal excretion to be approximately 1000 times total urinary excretion of 124Sb. The rate of urinary excretion of 124Sb declined rapidly over the first few days after the incident. In the early weeks after the incident, the effective half-life of 124Sb in the body was approximately 30 d, corresponding to a biological half-time of approximately 60 d. In later months, the effective half-life was approximately the same as the radiological half-life of 124Sb (∼60 d), indicating little biological removal of 124Sb from the body. The authors interpreted the data as indicating removal of ‘transportable material in the tissue’, with an effective half-time of 30 d during the early weeks after the incident, and much slower removal of non-transportable material from the lungs at later times. (111) Rees et al. (1980) measured the time-dependent concentrations of antimony in blood plasma and urine of human subjects following intravenous injection of Sb(V) as sodium stibogluconate. The data indicate three phases of removal of antimony from blood plasma, with half-times of 0.2 h (71%), 1.4 h (28%), and 6.9 h (1%). Following intramuscular injection, the plasma clearance from 1 to 24 h appeared to be exponential, with a biological half-time of approximately 2.5 h. The renal clearance rate of antimony approximated the glomerular filtration rate. More than 90% of administered antimony was excreted in urine in the first 8 h after intravenous or intramuscular injection. (112) Chulay et al. (1988) studied blood clearance of antimony in two patients given Sb(V) as sodium stibogluconate and three patients given Sb(V) as meglumine antimoniate. All patients were injected intramuscularly with 10 mg Sb kg−1 daily for 20 d. The two drugs showed similar biokinetic in blood, with peak blood concentrations appearing approximately 2 h after the initial injection. In both cases, the blood content of antimony could be described by a three-term exponential model representing an initial absorption phase with a half-time of 0.85 h, followed by a rapid elimination phase with a mean half-time of 2 h, and a slower phase with a mean half-time of 76 h. (113) Bailly et al. (1991) reported the case of a woman who attempted suicide by ingestion of an unknown amount of Sb(III) as antimony trisulphide (Sb2S3, stibnite). Only a small fraction of the intake was absorbed from the gastrointestinal tract. The concentration of antimony in blood was measured over a period of approximately 130 h after intake. The blood concentration peaked at approximately 4 h post intake, and thereafter decreased bi-exponentially, with estimated biological half-times of approximately 2.6 h (60%) and 210 h (40%). The urinary excretion rate peaked approximately 20 h after intake and declined with a half-time of approximately 46 h over the next 6 d. The concentration of antimony in liver bile peaked approximately 3 h after intake, and from 3 to 60 h decreased with a half-time of approximately 12 h. Interpretation of the data for this subject is complicated by the fact that efforts were made to remove antimony from the body by forced diuresis, repeated gastric lavage, and chelation therapy. (114) Bailly et al. (1991) studied the urinary excretion of antimony in 22 workers employed in the production of Sb(V) compounds antimony pentoxide and sodium antimoniate. The rate of urinary excretion of antimony during an 8-h shift was highly correlated with the concentration of antimony in air during the same period, indicating absorption and rapid removal of a portion of inhaled antimony in urine. Exposure to airborne antimony at a concentration of 500 µg m−3 was estimated to lead to an increase in urinary antimony of 35 µg Sb g creatinine−1 during an 8-h shift. (115) Kentner et al. (1995) studied occupational exposure to two antimony compounds that occur in the production of lead batteries: Sb2O3 in the casting of grids, and SbH3 in the formation of lead plates. The concentration of antimony was measured in air in the grid-casting area and formation area, and in blood and urine of seven workers from the grid-casting area and 14 workers from the formation area. Comparisons of the concentrations of antimony in air and in blood and urine of the workers suggest similar biokinetic of the two forms of inhaled antimony. At the end of the work shifts, the median concentration of antimony in air was 4.5 (1.18–6.6) µg Sb m−3 in the casting area and 12.4 (0.6–41.5) µg Sb m−3 in the formation area. The median blood concentrations in the pre-shift samples were 2.6 (0.5–3.4) µg Sb L−1 for the casting area and 10.1 (0.5–17.9) µg Sb L−1 for the formation area. The average concentration of antimony in urine was 3.9 (2.8–5.6) µg Sb g creatinine−1 for the casting area and 15.2 (3.5–23.4) µg Sb g creatinine−1 for the formation area. (116) Luedersdorf et al. (1987) determined levels of antimony in blood and urine of 109 workers exposed to the oxide of trivalent antimony (Sb2O3) in the glass-producing industry. Workers were divided into four groups with different tasks and different levels of exposure to antimony. The concentration ratio of antimony in urine (median value in µg mL−1) to antimony in blood (median value in µg mL−1) was 1.9 for all 109 workers, and varied from 1.1 to 4.5 for the four groups. (117) Liao et al. (2004) determined levels of five metals including antimony in blood and urine of 103 optoelectronic workers. The concentration ratio of antimony in urine to antimony in blood was 2.5 for all 103 workers, and varied from 2.2 to 4.7 for three different groups of workers with different tasks and levels of exposure. (118) The stable antimony content of human tissues has been determined in a number of occupationally or non-occupationally exposed subjects (Smith, 1967; ICRP, 1975; Sumino et al., 1975; Iyengar et al., 1978; Lindh et al., 1980; Gerhardsson et al., 1982; Coughtrey and Thorne, 1983; Zhu et al., 2010). The reported contents of individual tissues as well as relative contents of different tissues are variable, but the data together with estimates of intake of antimony suggest the existence of long-term components of retention of antimony in bone and soft tissues. Results of a detailed study by Zhu et al. (2010), involving measurements of stable antimony in 17 autopsy tissues of up to 68 Chinese males and in blood of 10 living subjects, indicate the following central distribution of antimony in the body: blood, 6.1%; liver, 15.3%; kidney, 1.4%; bone, 27.8%; thyroid, 0.24%; and remainder, 49.2%. (b) Animal studies (119) Goodwin and Page (1943) studied urinary excretion of antimony by mice following subcutaneous, intravenous, or intramuscular injection of one of three Sb(III) compounds (stibophen, KSb tartrate, or anthiomaline) or one of five Sb(V) compounds (NaSb gluconate, stibamine glucoside, neostibosan, urea-stibamine, or stibacetin). For all compounds and all exposure routes, urinary excretion over the first 48 h accounted for 50–82% of the administered antimony. (120) Brady et al. (1945) reported that, in four dogs, the urinary excretion of radioactive Sb(III) over 36 h after intravenous injection with antimony tartar emeric was 14 ± 8% (range 4–21%). The urinary excretion in one dog injected intravenously with Sb(III) as sodium antimonyl xylitol was 13.7% in 36 h. (121) At 4 d after intramuscular injection of rats with 122,124Sb as HSbO3, blood and bone contained 2% and 0.9%, respectively, of the injected activity (Durbin, 1960). The liver, kidneys, and muscle each contained 0.1% or less of the injected amount. Urinary excretion accounted for 96.5% of total excretion over the 4-day period. (122) Djuric et al. (1962) studied the distribution and excretion of 124Sb in rats after inhalation of an aerosol of 124SbCl3. Two rabbits and one dog were administered intratracheal doses of the same compound for comparison. Rapid early loss from the rat lung was followed by slower loss, with a half-time of the order of 100 d. The primary site of accumulation of absorbed 124Sb in rats was red blood cells. Such high accumulation in red blood cells was not evident in the rabbits or dog. (123) Moskalev (1964) administered 124Sb tartrate emetic to rats by oral or intravenous administration of 124Sb. The liver and skeleton were found to be important repositories for antimony over the first 8 d following either route of administration, but the division of activity between these two organs depended strongly on the route of administration. Comparison with earlier results by the same author indicated that the distribution following intravenous administration also depended strongly on the physico-chemical state of antimony in the initial solution. (124) In mice receiving 124Sb KSb tartrate by intraperitoneal injection, approximately 80% of the administered amount was excreted the first day and 99% during the first 3 weeks (Rowland, 1968). The concentration of 124Sb in blood decreased by a factor of approximately 20 from 15 min to 6 h after injection, and by a factor of approximately 2 from 6 h to 24 h after injection. Loss of activity from the liver was slower than from the rest of the body, but dropped to 0.5–1% of its peak value after 21 d. (125) Thomas et al. (1973) exposed three groups of mice to 124Sb aerosols in a system that yielded head-only exposures. The aerosols were produced from a starting solution of antimony tartrate, but were formed at different temperatures for each group: 100, 500, or 1100℃. The activity contained in the material formed at the lowest temperature cleared from the lungs soon after deposition and deposited primarily in bone, which was estimated to receive a much higher radiation dose than the lungs in this case. The activity in the material formed at the two higher temperatures was retained in the lungs for a longer period, but gradually accumulated to a large extent in bone, although the lung was estimated to receive a much higher radiation dose than bone in this case. In all three groups, the portion of the body burden found in the pelt, excluding the head, increased from approximately 7% at 1 d to approximately 25% at 52 d after exposure. (126) Felicetti et al. (1974a) investigated the biokinetic of trivalent and pentavalent 124Sb over 32 d following inhalation of relatively soluble aerosols by Syrian hamsters. Whole-body clearance of both aerosols occurred in two phases. More than 90% IBB was eliminated over the first 7 d after exposure. The remaining activity was eliminated with a biological half-time of approximately 16 d. No significant difference in excretion patterns was observed between the two aerosols. Systemic activity was found mainly in liver, skeleton, and skin (shaved pelt). Activity in liver was generally higher after inhalation of the trivalent form of 124Sb than the pentavalent form, but the opposite pattern was seen for bone. In blood, 124Sb inhaled in the trivalent form was concentrated in red blood cells at all sampling times, with maximum red blood cell concentration of six to 10 times the plasma concentration at approximately 24 h after exposure. For activity inhaled in the pentavalent form, concentrations were greater in plasma than red blood cells in the early hours after exposure, but the red blood cell to plasma ratio converged over the first day to that seen for inhaled trivalent 124Sb. (127) Felicetti et al. (1974b) studied the biokinetic of inhaled 124Sb in groups of beagle dogs exposed to trivalent 124Sb aerosols formed at different temperatures (100, 500, or 1000℃). Particle sizes were 1.3-, 1.0-, and 0.3-µm AMAD, respectively, for aerosols formed at these three temperatures. Much of the activity inhaled in the aerosol generated at 100℃ cleared rapidly from the lungs and was excreted in urine at a high rate. Activity inhaled in the aerosols formed at higher temperatures was cleared more slowly from the lungs, and the urinary to faecal excretion rate was much lower at early times than for the aerosol formed at 100℃. For example, urinary excretion of 124Sb was at least seven times as great as faecal excretion over the first 24 h following inhalation of the aerosol formed at 100℃, compared with a urinary to faecal excretion ratio of approximately 0.4 over the same period for the aerosol formed at 500℃. From 1 to 32 d post exposure, the urinary to faecal excretion ratio was not significantly different for the three aerosols. From 1 to 21 d post exposure, the concentration of 124Sb in red blood cells was, on average, 6.7 times that in plasma. Average long-term biological half-lives for total-body 124Sb were 100, 36, and 45 d for 124Sb inhaled in aerosols formed at 100, 500, and 1000℃, respectively. Systemic activity was found mainly in liver, skeleton, and pelt, but the thyroid was the dominant systemic tissue in terms of activity concentration. (128) Van Bruwaene et al. (1982) studied the urinary and faecal excretion of inorganic 124,125Sb by lactating cows after oral or intravenous administration. During a 70-day period after intravenous injection, approximately 51% of the administered amount was excreted in urine and 2.4% was excreted in faeces. Almost 16% of the injected amount was found in tissues at 70 d, but most of this was found in the heart and presumed to have resulted from deposition of antimony in blood vessels near the injection site, as had been observed in an earlier animal study with antimony. Different systemic distributions were found for the two exposure routes. Excluding the deposit in the heart, activity retained at 70 d was found mainly in the liver (69% of the body burden), skeleton (7.1%), muscle (7.0%), skin (6.7%), and spleen (6.4%). At 102 d after oral administration, the retained activity was found mainly in the skin (43% of the body burden), skeleton (30%), muscle (10%), and liver (7.3%). The high content of antimony in liver and spleen following intravenous injection may have been due to uptake and retention of colloidal antimony. (129) Bailly et al. (1991) studied the urinary and faecal excretion of Sb(III) by rats after intraperitoneal or intravenous injection of SbCl3. During the first day, urinary and faecal excretion accounted, on average, for approximately 8.6% and 31%, respectively, of antimony administered by intraperitoneal injection, and 19% and 17%, respectively, of antimony administered intravenously.
3.2.3.2. Biokinetic model for systemic antimony
(130) The structure of the biokinetic model for systemic antimony is shown in Fig. 3.1. Transfer coefficients are listed in Table 3.3. These coefficients are based on data for trivalent antimony, which has been studied more than pentavalent antimony and which is expected to be the more frequently encountered form of antimony. For radioisotopes of antimony entering the systemic circulation as pentavalent antimony, the model is expected to underestimate the initial rate of biological removal from the body, and overestimate cumulative nuclear transformations in systemic tissues and fluids. (131) It is assumed that antimony leaves plasma at the rate 100 d−1 (t1/2∼10 min), with approximately 75% moving to the fast-turnover soft tissue compartment ST0, 3.0% to red blood cells, 9.0% to urinary bladder contents, 0.3% to thyroid, 4% to Liver 1, 0.25% to kidneys, 2% to trabecular bone surfaces, 2% to cortical bone surfaces, 0.04% to the slow-turnover soft tissue compartment ST2, and 4.5% to the intermediate-term soft tissue compartment ST1. The following removal half-times are assigned: 1 d from red blood cells to plasma; 0.5 d from ST0 to plasma; 50 d from ST1 to plasma; 1000 d from ST2 to plasma; 1 d from Liver 1, with 35% moving to the small intestine contents in bile, 2% moving to the longer-term liver compartment Liver 2, and 63% returning to plasma; 1000 d from Liver 2 to plasma; 3 d from kidneys to plasma; and 2 d from cortical or trabecular bone surfaces, with 99% returning to plasma and 1% moving to the corresponding bone volume compartment. The transfer coefficients describing the rates of movement from the bone volume compartments to plasma are the generic turnover rates for cortical and trabecular bone. (132) The transfer coefficients listed in Table 3.3 yield the following predictions, which are reasonably consistent with the biokinetic database for antimony summarised above. Initially, there is rapid disappearance of antimony from blood, with only approximately 15% of intravenously injected antimony remaining in blood at 30 min, and less than 6% at 1 h after administration. This rapid phase is followed by a slow phase of disappearance from blood due to accumulation by red blood cells and return of antimony from extravascular spaces to blood. From 1 h to 1 week, the blood content slowly declines to approximately 2% of the injected amount. The ratio of the concentration of antimony in red blood cells to that in blood plasma increases to approximately 5 during the first 24 h after intravenous injection, and increases more gradually over the next week. Antimony is removed from the body mainly in urine, with urinary losses representing approximately 17% of intravenously injected antimony after 24 h, 44% after 1 week, 64% after 1 month, and 85% after 1 y. The urinary to faecal excretion ratio based on cumulative excretion is approximately 7. The thyroid initially shows a much higher concentration than other tissues, but most of the initial thyroid content is lost over a few days. The liver also shows a high initial concentration and relatively fast loss of antimony, but the loss is slower than that for the thyroid. Based on a constant input of antimony to blood, model predictions of the contents of stable antimony in blood, liver, kidneys, thyroid, bone, and remaining tissue as a fraction of total-body antimony are consistent with results of the blood and autopsy study by Zhu et al. (2010). Transfer coefficients for systemic antimony. RBC, red blood cells; ST0, ST1, and ST2 represent soft tissues with fast, intermediate, and slow turnover, respectively. Structure of the biokinetic model for systemic antimony. SI, small intestine; RBC, red blood cells. ST0, ST1, and ST2 represent soft tissues with fast, intermediate, and slow turnover, respectively. Total body and lung contents, and daily urinary excretion of 124Sb following inhalation of 1 Bq Type F. Total body and lung contents, and daily urinary excretion of 124Sb following inhalation of 1 Bq Type M. Total body and lung contents, and daily urinary excretion of 124Sb following inhalation of 1 Bq Type S.
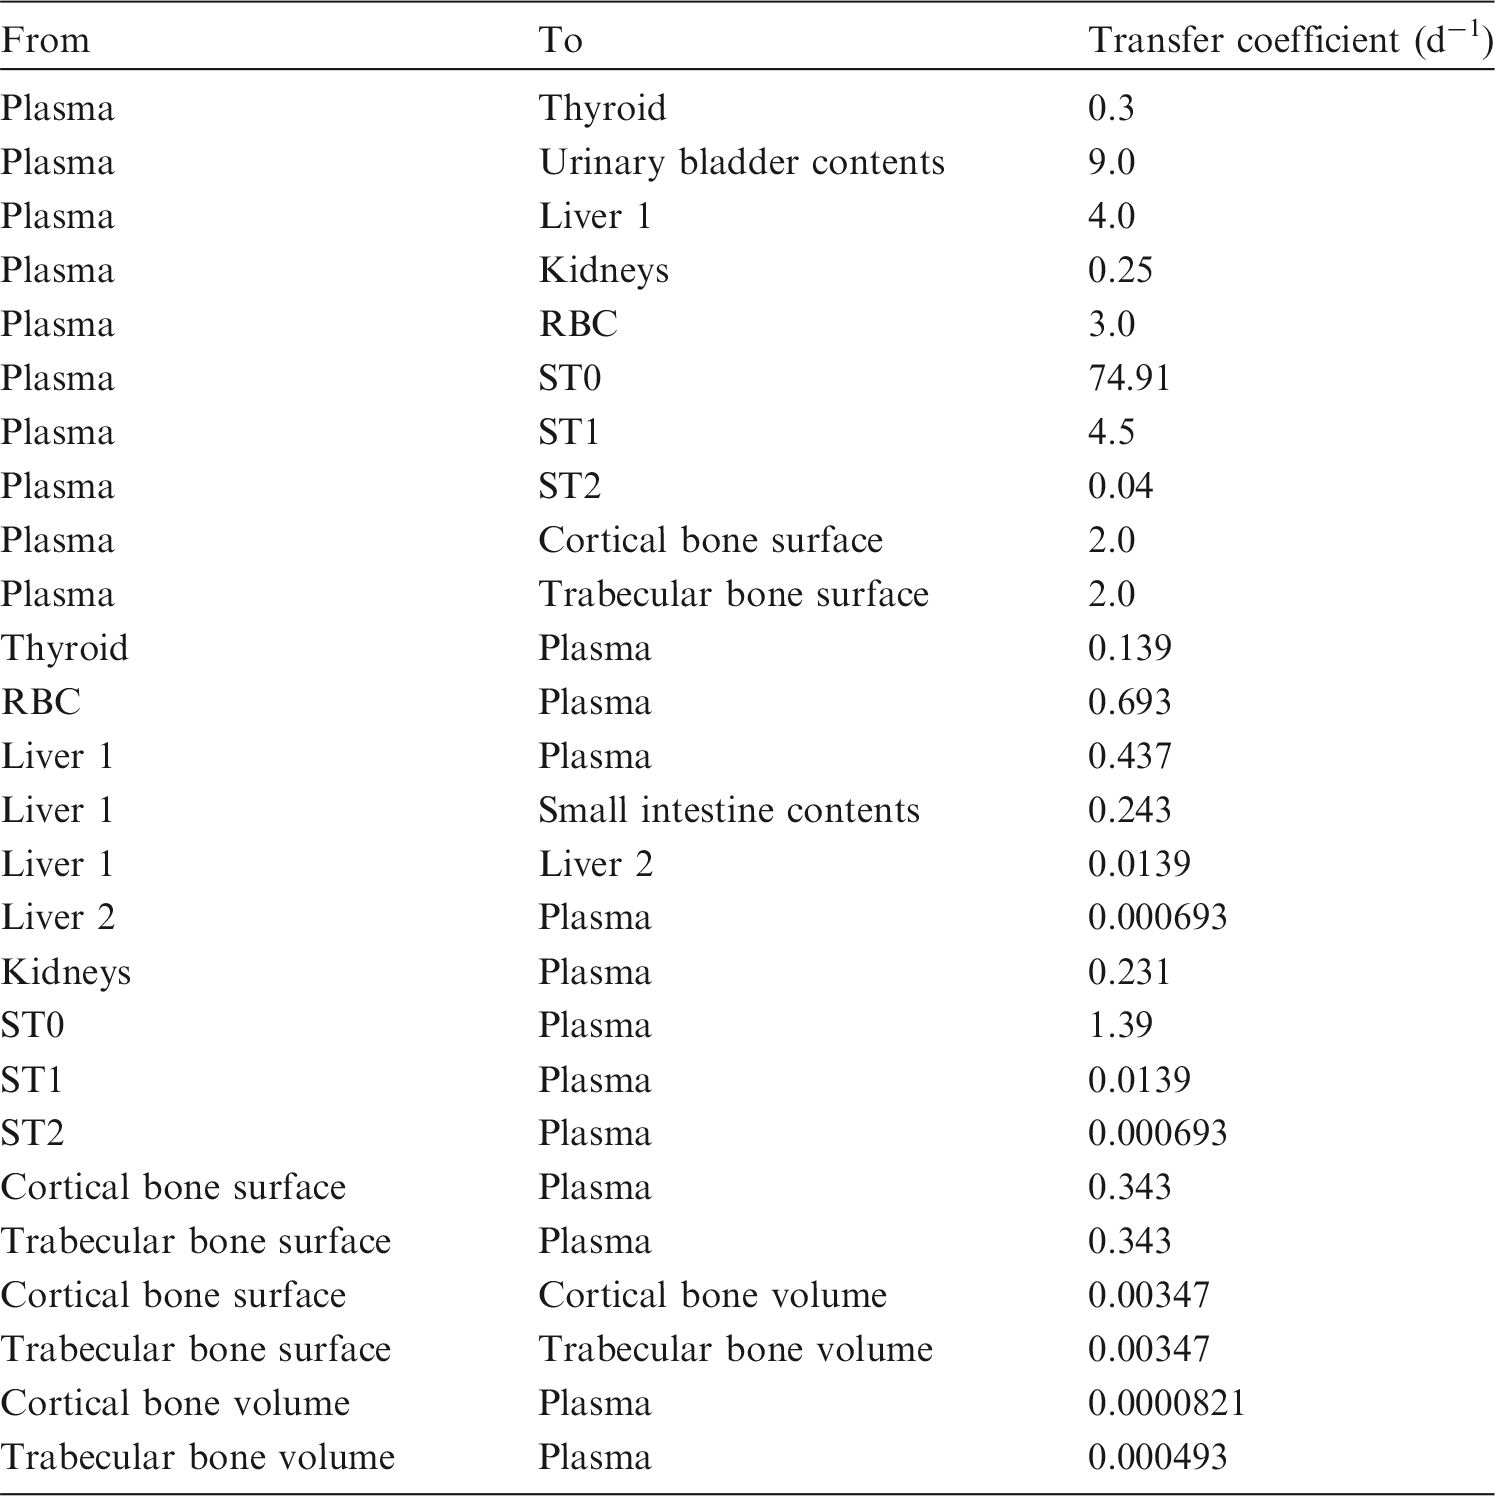


3.2.3.3. Treatment of radioactive progeny
(133) Chain members addressed in the derivation of dose coefficients for antimony isotopes are isotopes of antimony, tellurium, or iodine. Isotopes of antimony, tellurium, or iodine produced in vivo following intake of antimony are assumed to follow the characteristic models for these elements (or a slightly simplified version of the characteristic model, in the case of iodine) from their time of production, insofar as application of this assumption is straightforward. This assumption is sometimes ambiguous due to differences in model structures for the different elements. That is, the site of production of a radionuclide may not be clearly identifiable with a specific compartment in its characteristic model. In such cases, a transfer rate from the site of production of the radionuclide to the central blood compartment in the radionuclide’s characteristic model has been assigned as described below. After reaching its central blood compartment, the radionuclide is assumed to behave as described by its characteristic model. (134) Tellurium atoms produced at soft tissue sites in the antimony model that are ambiguous with regard to the characteristic model for tellurium (ST0, ST1, ST2, Liver 0, and Liver 1) are assumed to be transferred to the central blood compartment of that model (plasma, called ‘Blood 1’ in Fig. 4.1) at the rate 0.0693 d−1 (t1/2 = 10 d). This is the rate of removal from all soft tissue compartments in the characteristic model for tellurium. (135) The characteristic model for iodine is defined in Fig. 5.2 and Table 5.4 of this publication. Two features of that model were simplified for treatment of iodine produced in vivo after intake of antimony. Firstly, the two-compartment submodel of inorganic iodide in ‘other tissue’ was replaced by a single compartment called ‘Other 1’ that exchanges inorganic iodide with a blood compartment called ‘Blood 1’. The following transfer coefficients were assigned: Blood 1 to Other 1, 600 d−1; and Other 1 to Blood 1, 200 d−1. Secondly, the two-compartment submodel of organic iodine in ‘other tissue’ was replaced by a single compartment called ‘Other 2’ that receives organic iodine from a blood compartment called ‘Blood 2’, and returns most of the organic iodine to Blood 2 but transfers a small fraction as inorganic iodide to Blood 1. The following transfer coefficients are assigned: Blood 2 to Other 2, 15 d−1; Other 2 to Blood 2, 9.0 d−1; and Other 2 to Blood 1, 0.09 d−1. Iodine atoms are produced at the following sites in the antimony or tellurium models that are not clearly identifiable with specific compartments of the model for iodine: blood compartments, liver compartments, kidneys, thyroid (in the tellurium model), compartments within ‘other soft tissue’, and bone compartments. The following rates of transfer from these compartments to the blood iodide pool of the characteristic model for iodine are assigned: liver compartments or kidneys, 100 d−1 (the rate of loss from the liver iodide and kidney iodide compartments in the characteristic model for iodine); red blood cells, 1000 d−1; other soft tissue or bone surface compartments, 200 d−1 (the highest transfer coefficient to blood in the simplified model for iodine); thyroid, 36 d−1 (the transfer coefficient from the thyroid iodide pool to the blood iodide pool in the characteristic model for iodine); and trabecular and cortical bone volume compartments, the reference rates of trabecular and cortical bone turnover. Iodine atoms produced in the plasma compartment of the antimony or tellurium model are assigned to the blood iodide pool in the characteristic model for iodine.
3.3. Individual monitoring
3.3.1. 124Sb
(136) 124Sb may be monitored through whole-body measurement and/ or urine bioassay.
3.3.2. 125Sb
(137) 125Sb may be monitored through whole-body measurement and/ or urine bioassay.
3.4. Dosimetric data for antimony
Total body content and daily urinary excretion of 125Sb following inhalation of 1 Bq Type F. Total body content and daily urinary excretion of 125Sb following inhalation of 1 Bq Type M. Total body content and daily urinary excretion of 125Sb following inhalation of 1 Bq Type S. Monitoring techniques for 124Sb. Lung monitoring of 124Sb is not generally used in routine monitoring of workers. Monte Carlo program Visual Monte Carlo was used to simulate the photon emission, to calculate the calibration factor for the geometry and radionuclide, and to calculate the detection limit in the lung (Hunt et al., 2012). Monitoring techniques for 125Sb. Committed effective dose coefficients (Sv Bq−1) for the inhalation or ingestion of 124Sb and 125Sb compounds. AMAD, activity median aerodynamic diameter. Dose per activity content of 124Sb in total body, lungs, and in daily excretion of urine (Sv Bq−1); 5-µm activity median aerodynamic diameter aerosols inhaled by a reference worker at light work. Dose per activity content of 125Sb in total body and in daily excretion of urine (Sv Bq−1); 5-µm activity median aerodynamic diameter aerosols inhaled by a reference worker at light work. Isotopes of tellurium addressed in this publication. EC, electron-capture decay; B+, beta-plus decay; B−, beta-minus decay; IT, isomeric transition decay. Dose coefficients and bioassay data for these radionuclides are given in the printed copy of this publication. Data for other radionuclides listed in this table are given in the accompanying electronic annex.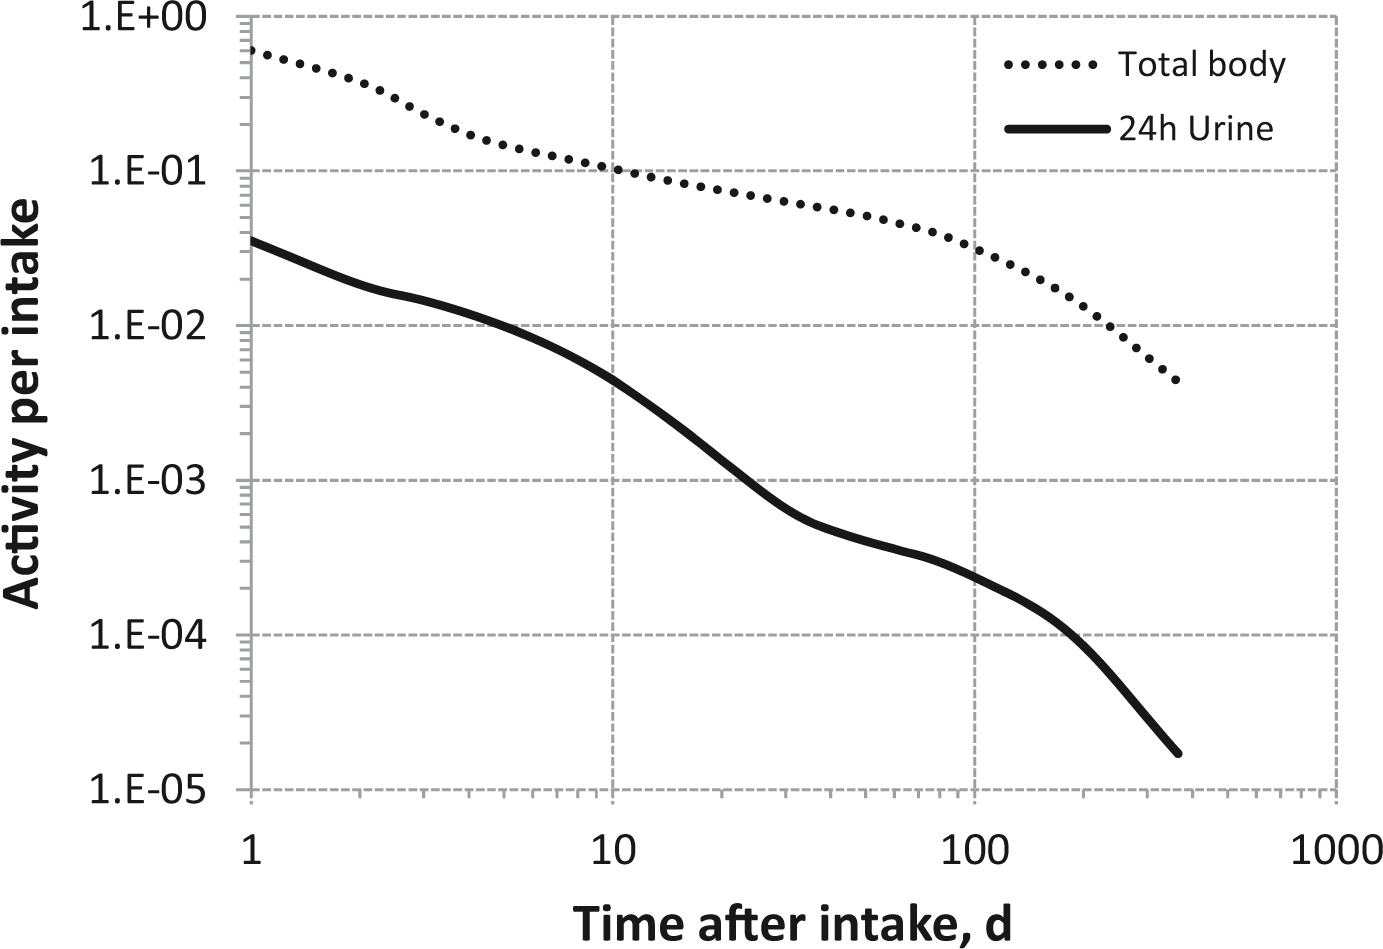
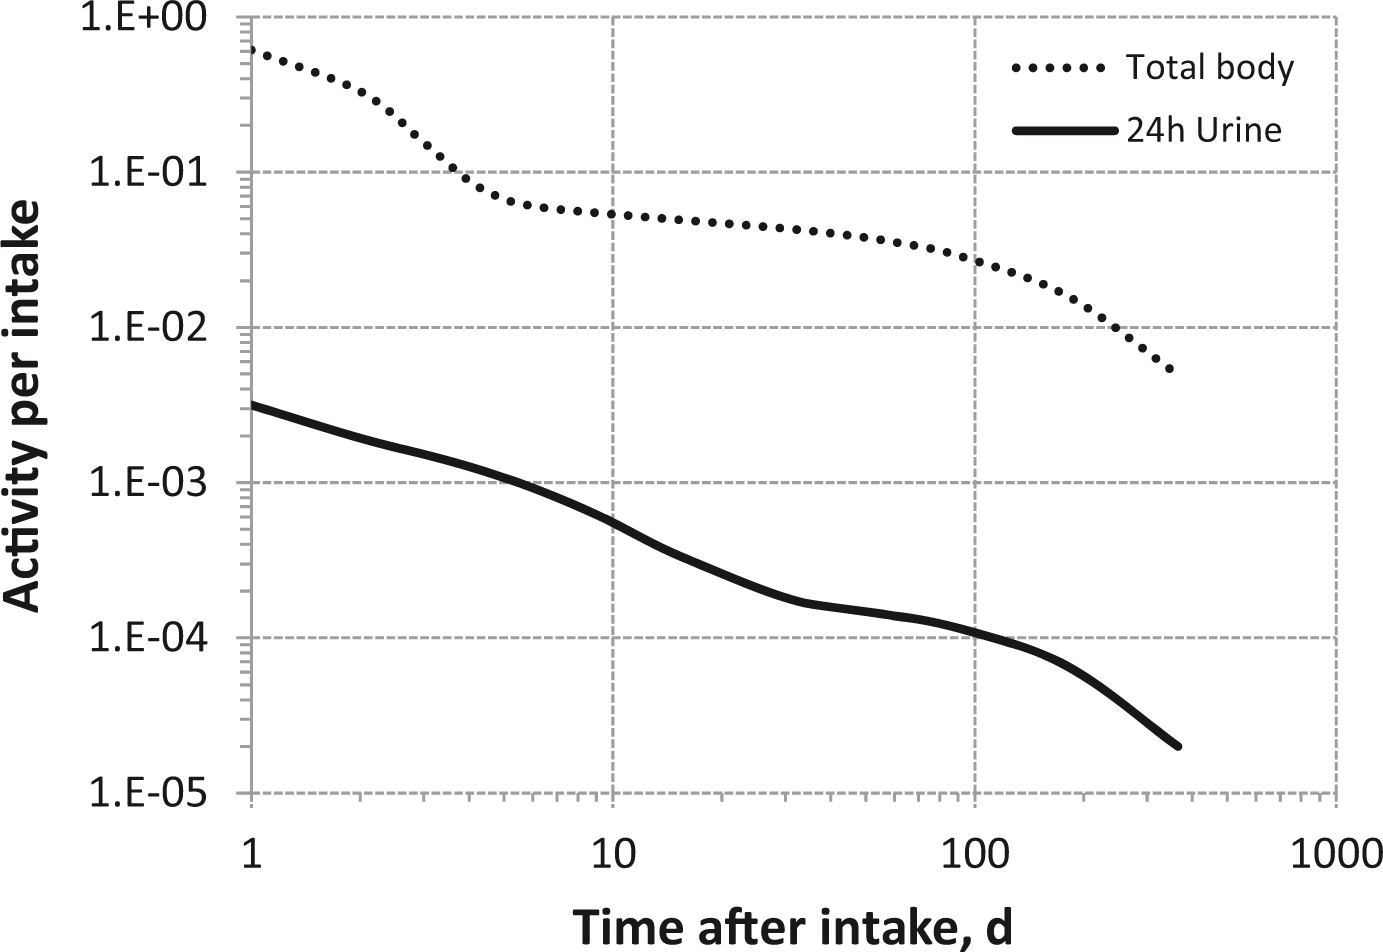
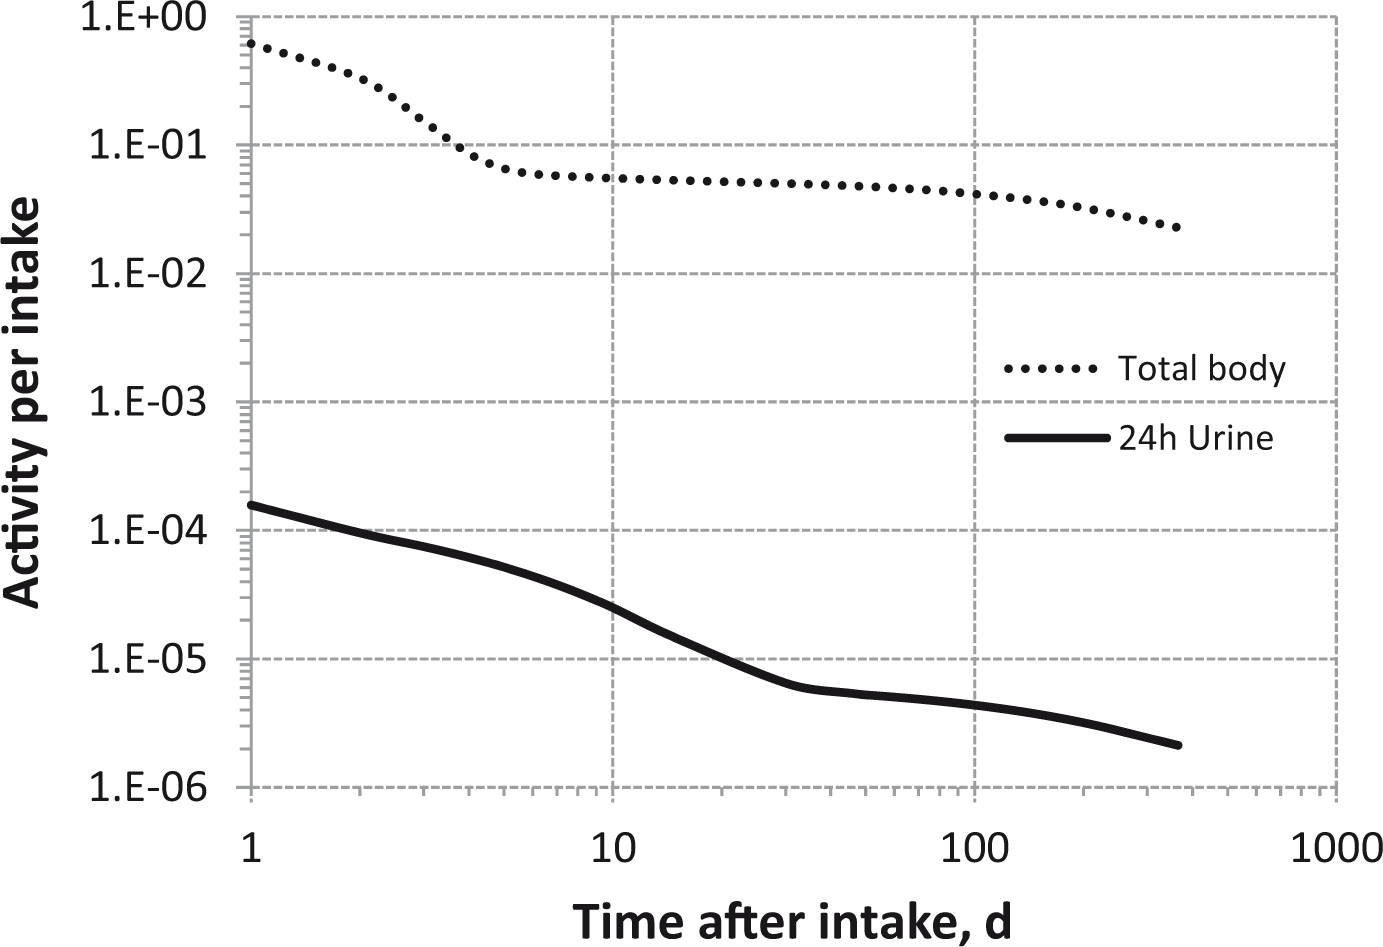


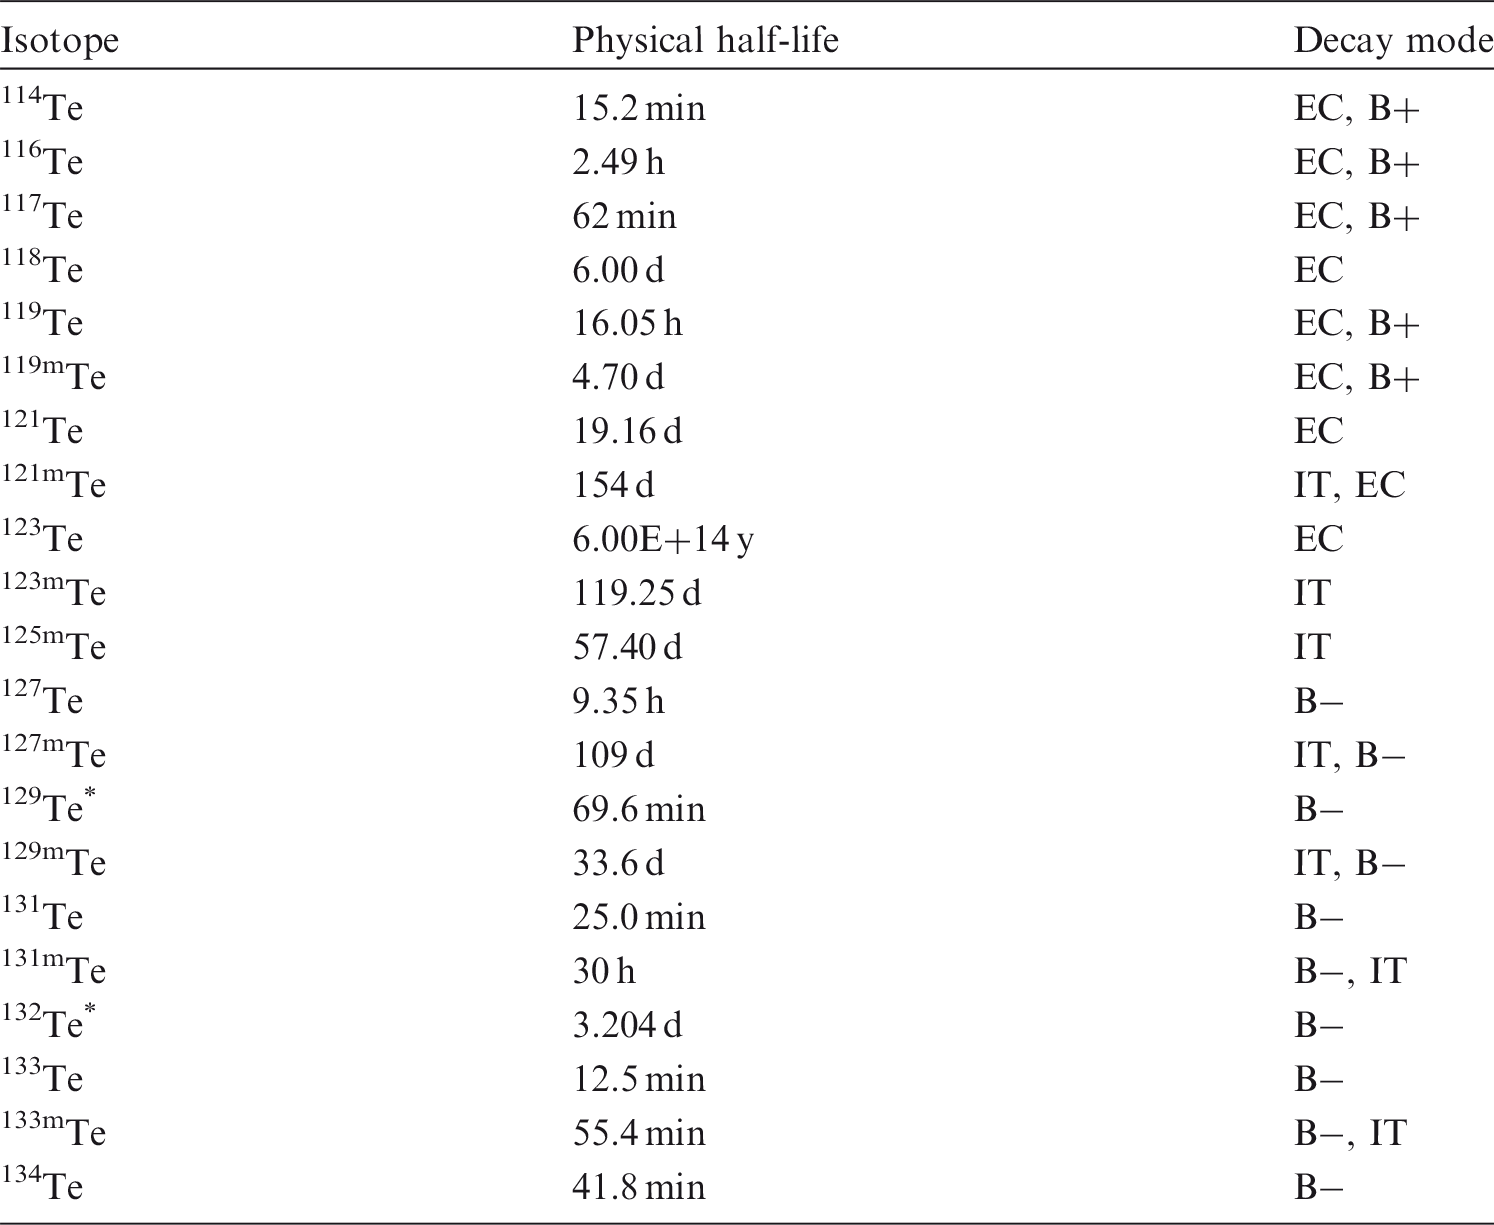
3.5. References
4. TELLURIUM (Z = 52)
4.1. Chemical forms in the workplace
(138) Tellurium is a semi-metal or metalloid that occurs mainly in oxidation states II, II, IV, and VI. Tellurium is in the same chemical series as sulphur and selenium, and forms similar compounds. The two anionic forms are known as tellurite (TeO32−) and tellurate (TeO42−). (139) Tellurium may be encountered in industry in a variety of chemical forms, including elemental vapour or solid forms, oxides, chlorides, and tellurides. The main chemical form of tellurium in fission products is sodium tellurite. (140) 132Te is a fission product which is important in the first few days after a critical accident. Systemic model for tellurium.
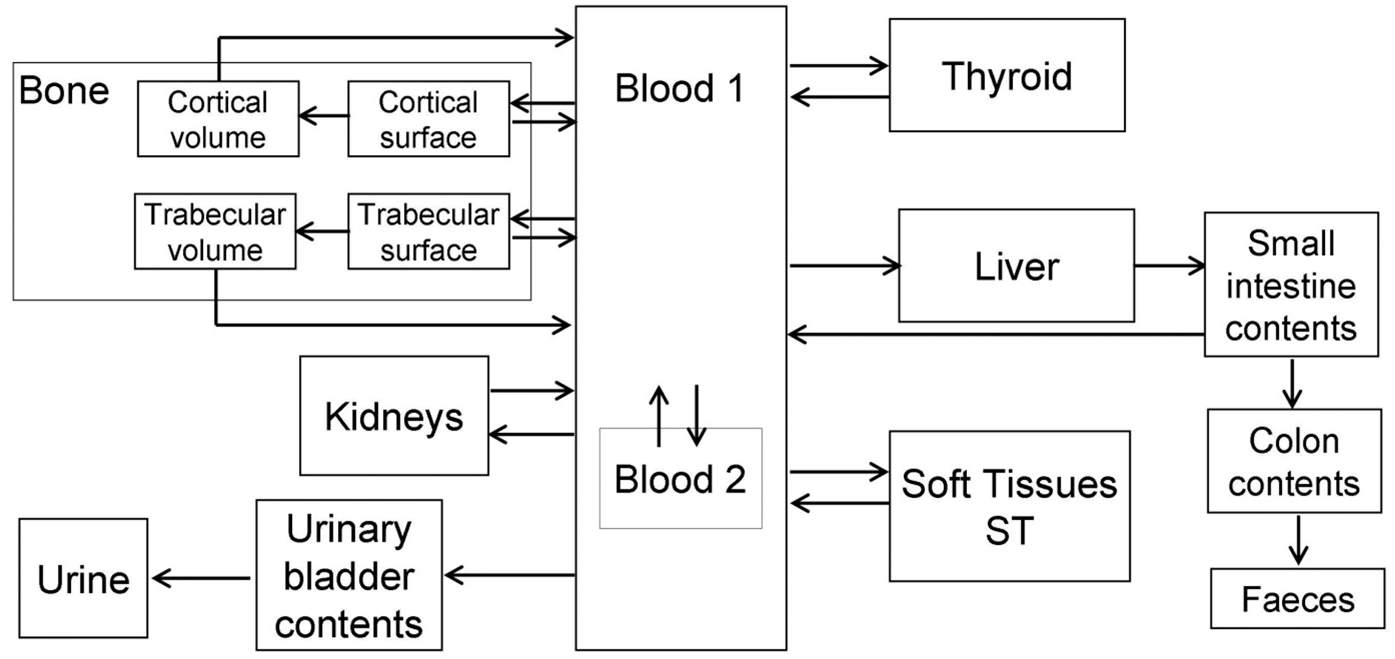
4.2. Routes of intake
4.2.1. Inhalation
(141) A few experimental studies of the behaviour of radiolabelled tellurium (i.e. tracer level) following deposition in the respiratory tract have been identified in the literature. Some information is also available from measurements following inadvertent intakes of irradiated tellurium oxide, from studies of 132Te inhaled by people after the Chernobyl accident, and from toxicological studies of stable tellurium compounds. (142) Absorption parameter values and types, and associated fA values for gas and vapour forms of tellurium are given in Table 4.2 and for particulate forms in Table 4.3. Common forms of tellurium (e.g. dioxide) are solids at room temperature. Exposures to gas or vapour forms of tellurium are therefore probably relatively unusual compared with exposures to particulate forms, and it is therefore recommended in the OIR series that particulate forms should be assumed in the absence of specific information (ICRP, 2002). Whole-body retention for tellurium. Data from Fehér and Andrási (1977). Grey symbols, retention measured in volunteers after administration of TeO2−131I suspension; black symbols, retention measured after accidental contamination by workers; solid line, equation suggested by Fehér and Andrási (1977) on the basis of their data; dashed line, prediction of the occupational intakes of radionuclide model. For the sake of comparison, the workers' values were normalised to the curve prediction for the first available measurement time, as extrapolated from the original graph. Deposition and absorption for gas and vapour compounds of tellurium. ET1, anterior nasal passage; ET2, posterior nasal passage, pharynx, and larynx; BB, bronchial; bb, bronchiolar; AI, alveolar-interstitial. Percentage deposited refers to how much of the material in the inhaled air remains in the body after exhalation. Almost all inhaled gas molecules contact airway surfaces, but usually return to the air unless they dissolve in, or react with, the surface lining. The default distribution between regions is assumed: 20% ET2, 10% BB, 20% bb, and 50% AI. Absorption parameter values for inhaled particulate forms of tellurium and for ingested tellurium. It is assumed that the bound state can be neglected for tellurium, i.e. fb = 0. The value of sr for Type F forms of tellurium is element-specific. The values for Types M and S (3 d–1) are the general default values. Materials (e.g. tellurium chloride) are listed here where there is sufficient information to assign to a default absorption type, but not to give specific parameter values (see text). For inhaled material deposited in the respiratory tract and subsequently cleared by particle transport to the alimentary tract, the default fA values for inhaled materials are applied; i.e. the product of fr for the absorption type and the fA value for ingested soluble forms of tellurium (0.3). Default Type M is recommended for use in the absence of specific information on which the exposure material can be assigned to an absorption type; for example, if the form is unknown, or if the form is known but there is no information available on the absorption of that form from the respiratory tract. Activity transferred from systemic compartments into segments of the alimentary tract is assumed to be subject to re-absorption to blood. The default absorption fraction fA for the secreted activity is the reference fA (0.3) for ingestion of the radionuclide.
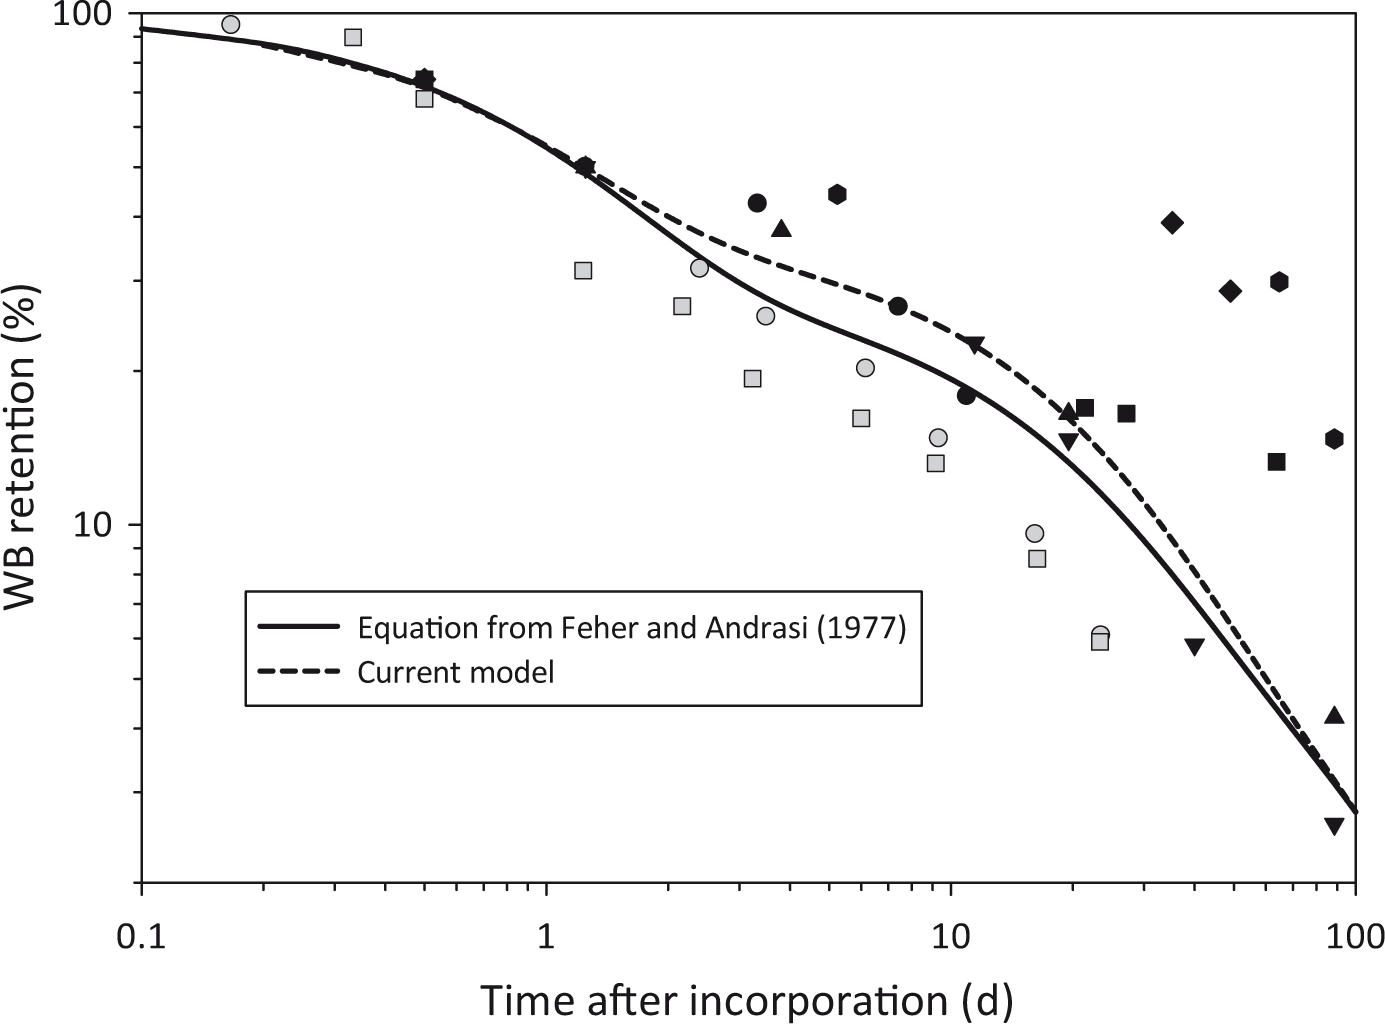


4.2.1.1. Gases and vapours
(143) Accidental inhalation by two men of tellurium in the form of hexafluoride gas and possibly also tellurium esters was reported by Blackadder and Manderson (1975). However, the information reported related mainly to clinical signs and symptoms. Insufficient information is available to estimate the fraction deposited or the rate of absorption. Gas and vapour forms of tellurium are assigned the default behaviour for gases and vapours: 100% total deposition (20% ET2, 10% BB, 20% bb, and 50% AI) and Type F absorption (Table 4.2).
4.2.1.2. Particulate aerosols
(a) Tellurium chloride (144) Dobryakova (1970) followed the biokinetic of 127Te for 14 d after administration of tellurium chloride to rats by intratracheal instillation. There was rapid absorption from the lungs, but the rate decreased with time. Approximately 40% ILD was absorbed at 30 min and 70% ILD at 1 d. Subsequent clearance was slow and mainly faecal, with approximately 6% ILD remaining in the lungs at 14 d. Parameter values estimated here (i.e. by the Task Group) were fr of approximately 0.7 and sr of the order of 50 d–1, but decreasing with time, and assignment to Type F. (b) Elemental tellurium (145) Geary et al. (1978) investigated the toxicological effects up to 180 d after administration of tellurium to rats by intratracheal instillation. No quantitative information on the biokinetic was reported. However, pigmentation and effects in the lungs and other organs indicate that the tellurium was not absorbed rapidly and completely, but that significant absorption did take place, indicative of Type M rather than Type F or S behaviour. (c) Tellurium dioxide (TeO2) (146) Fehér and Andrási (1977) followed whole-body retention of 123mTe for up to 95 d after intake by 10 workers accidentally contaminated with TeO2 irradiated for the production of 131I. Retention fit a two-component exponential function, with approximately 75% and 25% retained with effective half-times of approximately 12 and 70 d, respectively. The authors interpreted the results on the basis that the retained activity was distributed homogeneously in the body, assuming rapid dissolution (Type F). (147) Geary et al. (1978) investigated the toxicological effects up to 180 d after administration of TeO2 to rats by intratracheal instillation. No quantitative information on the biokinetic was reported. However, pigmentation and effects in the lungs and other organs indicate that the tellurium was not absorbed rapidly and completely, but that significant absorption did take place, indicative of Type M rather than Type F or S behaviour. (d) Cadmium telluride (148) As part of a toxicological study, Morgan et al. (1997) measured the concentrations of cadmium and tellurium in lungs and other tissues up to 28 d after administration of cadmium telluride to rats by intratracheal instillation. The lung concentrations of both elements at 28 d was approximately 30% of that at 1 d, and was accompanied by significant increases in concentrations in extrapulmonary tissues, giving assignment to Type M. (e) Unspecified compounds (149) Balonov et al. (2003) summarised the results of in-vivo measurements made 4–8 d after the Chernobyl accident on 65 people evacuated from Pripyat 1.5 d after the accident. 132Te activity was measurable in 56 persons, and in 28 of those with repeated lung measurements, it declined with a half-time of 2.5 ± 0.2 d. Taking account of the 132Te decay half-life of 3.3 d gives a lung clearance half-time of approximately 10 d, and a corresponding clearance rate of 0.07 d–1. During the measurement period, the particle clearance rate from the lungs predicted by the HRTM is approximately 0.01 d–1, suggesting that most of the observed clearance is due to absorption to blood, at a rate (ss) of approximately 0.06 d–1. Since the lung measurements started a few days after intake, they do not, on their own, enable an estimate to be made of the fraction that dissolved rapidly. However, measurements were also made of 132I in the thyroid, which was considered to originate mainly from 132Te deposited in the lungs. The mean ratio of 132I activity in thyroid to that of 132Te in lungs was 0.2, but with considerable variation between individuals (range 0.07–0.6) (Balonov et al., 2003). Analysis was carried out here to make an estimate of fr based on this ratio. It was assumed that sr = 100 d–1 (default), ss = 0.06 d–1 (see above), and fA = fr * 0.3 (the default assumption for inhaled materials, see Footnote † to Table 4.3, the fractional uptake in the alimentary tract value for ingested soluble forms of tellurium being 0.3). This gave a central estimate for fr of approximately 0.3, but with a range similar to that of the ratio of 132I activity in thyroid to that of 132Te in lungs above. Thus, the results are consistent with assignment to default Type M, although they indicate faster absorption than assumed by default. Given the uncertainties involved, specific parameter values are not recommended here for tellurium accidentally released from a nuclear reactor.
4.2.1.3. Rapid dissolution rate for tellurium
(150) Evidence from the tellurium chloride study outlined above suggests a rapid dissolution rate of the order of 50 d–1, which is applied here to all Type F forms of tellurium.
4.2.1.4 Extent of binding of tellurium to the respiratory tract
(151) Evidence from the tellurium chloride study outlined above suggests that, following the rapid phase of absorption, approximately 6% ILD clears relatively slowly from the lungs. There is no evidence available that clearance of this material is mainly by absorption to blood, as assumed for material in the ‘bound state’. It is therefore assumed that the bound state can be neglected for tellurium (i.e. fb = 0.0).
4.2.2. Ingestion
(152) Kron et al. (1991) studied the renal excretion of stable tellurium by healthy volunteers after oral administration of tellurium as sodium tellurate (NaTeO4), sodium tellurite (NaTeO3), and metallic colloid. The calculated fractional absorption values were 0.23 ± 0.09 in four volunteers ingesting sodium tellurate, 0.21 in a single volunteer ingesting tellurite, and 0.10 ± 0.04 in three volunteers ingesting metallic tellurium. Since the main chemical form of tellurium in fission products is sodium tellurite, Kron et al. (1991) proposed that a fractional absorption value of 0.25 should be applied for radiological protection purposes. (153) Experimental data from several animal species including rats, guinea pigs, rabbits, dogs, sheep, and cows gave absorption values in the range 0.2–0.5 for water-soluble tellurites (TeO32−) and approximately 0.1–0.25 for tellurates (De Meio and Henriques, 1947; Barnes et al., 1955; Hollins, 1969; Mullen and Stanley, 1974; Venugopal and Luckey, 1978; Taylor, 1996). Chertok and Lake (1970) argued on the basis of absorption studies on dogs that tellurium radionuclides contained in nuclear debris might be unavailable for absorption across the intestinal wall. (154) In Publication 30 (ICRP, 1979), an absorption value of 0.2 was recommended. A value of 0.3 was adopted in Publication 67 (ICRP, 1993) for intakes in food. The data do not support the use of different values for workers and members of the public, and therefore an fA value of 0.3 is used here.
4.2.3. Systemic distribution, retention, and excretion
4.2.3.1. Summary of the database
(155) The biokinetic of tellurium in the human body are not well characterised. There are only a few data for human subjects, mainly bioassay measurements following accidental exposure in the workplace. A number of studies deal with the toxicological issues of tellurium incorporation and related side-effects, mainly the occurrence of a sour garlic odour on the breath and in urine, sweat, and faeces resulting from occupational exposure to tellurium. This odour seems to be due to the presence of tiny amounts of dimethyl telluride. (a) Summary of data for human subjects (156) Schroeder et al. (1967) estimated the content of tellurium in several human tissues, and calculated that the total amount in the body was approximately 600 mg, which would make tellurium one of the most abundant trace elements in the body. The largest amount was found in bone (90%), with much lower amounts in muscle (3%), liver (1.2%), and fat (3%). The amount found in kidney was approximately 3% of that in liver. The concentration in blood serum amounted to 1.07 ± 0.12 mg L−1 (i.e. 0.17% L−1), and that in unwashed erythrocytes to 1.95 mg L−1. However, the values for blood may be unreliable due to analytical problems (Nason and Schroeder, 1967) and were not confirmed by later studies. van Montfort et al. (1979), for example, found concentrations in blood of unexposed subjects to range between 0.15 and 0.3 µg L−1. (157) Fehér and Andrási (1977) presented the results of a study in which an irradiated and cooled suspension of TeO2−131I was administered to two volunteers. The whole-body retention of tellurium in the first few days after administration was described by a bi-exponential function with effective half-times of 0.7 d (75%) and 10 d (25%). The half-time of the second component of retention is reasonably consistent with whole-body retention measured in 10 persons occupationally contaminated with radiotellurium. The combined findings of the experimental study and the longer-term follow-up of the occupational exposures suggest that whole-body retention can be described by a three-exponential function, with biological half-lives of 0.7 d (70%), 12 d (23%), and 72 d (7%). (158) Kron et al. (1991) studied urinary excretion in five healthy volunteers after oral administration of tellurium in different forms (12 investigations in total): tellurite (Na2TeO4), tellurate (Na2TeO3), metallic form, and intrinsically bound in cress (Lepidium sativum). Cress was consumed both with and without oil and vinegar dressing. The 3-day urinary excretion varied between 3% and 25%. It was higher for tellurate (9–25%) than for tellurite (<8%) or metallic tellurium (4–9%). After ingestion of tellurium with cress, the amount excreted over 3 d ranged between 6% and 16%, and was reduced to 3% when dressing was added. For tellurate and metal tellurium, most of the excretion occurred in the first 24 h after administration, whereas for cress and tellurite, the excretion curve was delayed. For cress, this delay presumably indicates a slower absorption of tellurium bound in organic matter compared with the aqueous solutions. For tellurite, the authors assumed a higher retention in the body for this compound compared with tellurate as an explanation for the lower and slower excretion. (b) Summary of data from animal studies (159) DeMeio and Henriques (1947) administered radioactive tellurite to rabbits, rats, and dogs, and measured the tissue distribution (Table 4.4) and excretion pathways. In rabbits and rats, elevated concentrations were measured in kidneys, spleen, heart, and lungs, and lower concentrations were found in liver. In rats, the tissue concentrations dropped considerably after 1 h. Concentrations in blood averaged 25 ± 4% L−1 at 1 d after intravenous injection in rabbits and 610 ± 390% L−1 in rats at 30 min after intraperitoneal administration. In dogs, the values dropped from 21 ± 12% L − 1 at 1 h to 6.9 ± 2.5% L−1 at 1 d. Approximately 20–23% of tellurite injected intravenously into female dogs was excreted in urine over 5–6 d, with the greatest portion excreted in the first 2–3 h. Finally, the authors concluded that less than 0.1% of the amount of radioactive tellurite injected into rabbits was excreted via expired air during the 24 h following administration. On the basis of the observed excretions, the authors estimated that approximately 60% of tellurium injected into dogs remained in their body after 5–6 d. (160) Barnes et al. (1955) administered 132Te orally to rats and guinea pigs, and determined the distribution of tellurium in the body at 3–4 d (Table 4.5). Approximately 5.5% and 6.5% was excreted in urine over 4 d by the guinea pigs and rats, respectively. Faecal excretion plus activity present in the gut amounted to approximately 93% in the guinea pigs and 80% in the rats. In further experiments, a tellurium solution was injected intravenously into rats, guinea pigs, mice, and one rabbit to follow the blood kinetics and investigate the partition between whole blood and plasma. In general, retention in the blood of mice, guinea pigs, and the rabbit was low (at 1 d, 0.5% in mice, ∼1% in guinea pigs, and 3.2% in rabbit), whereas blood retention in the rats ranged from 22 to 32%. The biological half-life in the rat was approximately 7 d. Tellurium in the blood appeared to be contained completely in the plasma in guinea pigs and mice, and only a small portion was bound to the corpuscles in the rabbit. In contrast, tellurium activity in the blood of rats was significantly higher than in plasma, suggesting that the rat is unique in retaining tellurium within the red blood cells. Tellurium in the plasma of rabbits and corpuscles of rats was shown to be protein-bound. (161) Casey et al. (1963) administered a mixture of radionuclides of tellurium and iodine to lactating sheep, and found relatively low transfer of tellurium to milk (two to three orders of magnitude less than for iodine). Retained tellurium was found mainly in the liver, kidney, and lungs. The highest concentration was found in the thyroid, but the total content of the thyroid was small due to its small mass. (162) Wright and Bell (1966) compared the metabolism of tellurium in sheep and swine. Five animals of each species were orally administered 127mTe as Na2TeO3 via a stomach tube, and five more animals received the same compound via injection into the jugular vein. The blood content of 127mTe in the sheep was low (<0.25% of the administered dose) after oral administration. Intravenously injected tellurium was cleared readily from plasma (10% was retained after 2 h and 2% after 5 d), and only a small portion was recovered in the cell fraction. In swine, the peak concentration in whole blood occurred at approximately 30 h after oral administration, at which time nearly all the 127mTe was in the corpuscular fraction. Clearance of intravenously administered tellurium from plasma was similar to that observed in the sheep, but the corpuscular fraction rose with time (up to 3% at 5 d). The whole-blood clearance after intravenous administration could be described in terms of two components: a fast component with a biological half-time of approximately 10 h, and a slower component with a half-time of several days. The total organ content at 5 d after intravenous administration is given in Table 4.6. No information was given about the skeleton or thyroid. (163) Sheep and swine excreted approximately 11% of the injected 127mTe in faeces and 34% in urine over 5 d. Approximately two-thirds of the urinary excretion occurred in the first 24 h. After oral administration, sheep excreted 75% in faeces and 20% in urine. Swine excreted 70% in faeces and 19% in urine, mostly on the second day. (164) Hollins (1969) studied the metabolism of 127mTe as tellurous acid in rats. The whole-body retention after intraperitoneal injection could be described as a bi-exponential function with half-times of 0.8 d (49%) and 13 d (51%), respectively. After oral administration, 84% was retained with a half-time of 0.12 d, 11% with 0.8 d, and 5% with 12 d. The half-times of the two longer retention terms were the same within the experimental errors as those observed after injection. The highest concentrations of tellurium were observed in kidney, blood, liver, spleen, femur, and lung. Tellurium in blood was almost entirely bound to the protein content of the red blood cells. The tissues could be divided into three classes according to the retention half-time: lung, blood, liver, and heart with a half-time of approximately 10 d; muscle, spleen, and kidney with a half-time of approximately 20 d; and femur (skeleton) with a half-time that was much longer than the duration of the experiment (200 d) and could therefore not be determined with much confidence. Approximately 27% of the injected tellurium was excreted in urine during the first 24 h, and 6% was excreted in faeces. Less than 0.25% of the administered dose was eliminated in breath in the first 24 h. (165) A series of studies on rats was conducted between 1960 and 1970 in the former USSR and Czechoslovakia. The findings are summarised by a document of the Health Council of the Netherlands (2002). After intravenous injection, tellurium was found mainly in the liver (10–20%), muscle (∼10%), and skeleton (8–24%), and to a lesser extent in the kidneys (2.5–7%). Deposition patterns varied with time from administration, with the skeleton being the organ with the greatest retention time. Urinary excretion amounted to 14% of the intravenous dose on Day 1 and 33% in the first week. (166) Agnew and Cheng (1971) investigated protein binding of tellurium in maternal and fetal tissues after intravenous injection of tellurous acid (H2TeO3) labelled with 127mTe into pregnant rats. Activity in whole blood was predominantly in the red blood cells at all times studied. The fraction in red blood cells increased from 65% after 15 min to approximately 95% after 1 week. The bulk of the activity in plasma was in a bound form. After 1 h of circulation, less than 5% of the 127mTe was in an unbound form, and only approximately 0.5% was unbound after 1 week. (167) Mullen and Stanley (1974) studied absorption, distribution, and milk secretion of radiotellurium in dairy cows and calves. The transfer of tellurium to milk was low (∼0.25% of the orally administered activity in 13 d). Retained tellurium was found mainly in the liver, bone, and organs of the digestive/ruminal tract. Again, tellurium concentration in the thyroid was significant (approximately the same order as in the liver), but due to the tiny mass of this organ, the total amount retained was negligible. (168) Valkonen and Savolainen (1985) administered tellurium in the form of TeCl4 in the drinking water of rats for up to 35 d. The tellurium concentration in liver remained constant with time but increased steadily in blood, kidney, and brain. The liver:kidney concentration ratio was 4.1 after 7 d of administration and 2.1 after 35 d. The liver:brain concentration ratio decreased from 8.1 to 1.8 in the same interval. (169) Morgan et al. (1997) administered cadmium telluride intratracheally to rats. After absorption of tellurium into the systemic circulation, significant concentrations were found in the spleen (maximum 82.8 ± 10.2 µg g − 1 tissue), kidney (maximum 8.1 ± 1.3 µg g−1 tissue), liver (maximum 8.8 ± 0.6 µg g−1 tissue), femur (maximum 3.5 ± 0.5 µg g−1 tissue), and blood (maximum 5.3 ± 0.2 µg g−1 tissue). The maximum concentration was reached at Day 14 after administration in all tissues except liver, where the maximum concentration was reached at Day 7. Distribution (%/organ) of radiotellurium activity following injection.
*
Intravenous administration. Values are means for up to six animals each and refer to approximately 1 d after administration. Intraperitoneal administration. Values are means for up to three animals each and refer to approximately 0.5 h after administration. Intraperitoneal administration. Values are for only one animal and refer to approximately 1 d after administration. Distribution (%/organ) of 132Te activity following oral administration.
*
From Barnes et al. (1955). Values are means for two animals each and refer to 3–4 d after administration. Distribution of 132Te 5 d after intravenous administration (% of administered activity).
*
From Wright and Bell (1966). Values presented are the average of five subjects each and refer to 5 d after administration.


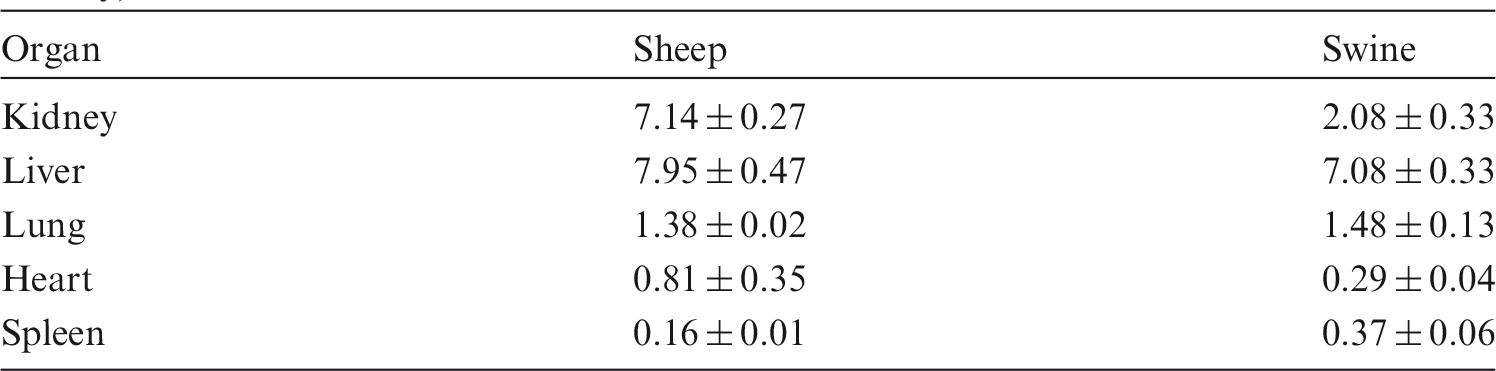
4.2.3.2. Biokinetic model for systemic tellurium
(170) Publication 67 (ICRP, 1993) introduced a simple systemic model for tellurium based on findings in animal studies. That model assumed that 50% of tellurium entering blood goes directly to excretion with a half-time of 0.8 d; 25% is translocated to the skeleton, from which it is removed to excretion pathways with a half-time of 10,000 d; and the rest is divided between the kidneys (2.3%), thyroid (0.2%), and remaining tissues (22.5%), from which it is removed to excretion pathways with a biological half-time of 20 d. A urinary to faecal excretion ratio of 4:1 was assumed for systemic tellurium. (171) In this publication, a variation of the generic model structure for bone-surface-seeking radionuclides is applied to tellurium, with the introduction of the thyroid as a separate compartment primarily to enable the application of the model to tellurium radionuclides produced as progeny of radioiodine. Transfer coefficients of the model are listed in Table 4.6. These coefficients are based predominantly on human data with regard to whole-body retention and urinary excretion, and on animal data, mainly from studies with swine and guinea pigs, with regard to organ distribution. (172) The blood compartment in the generic model structure is divided into two compartments: Blood 1, representing blood plasma, and Blood 2, representing red blood cells. It is assumed that tellurium leaves Blood 1 at the rate 1.16 d−1 (t1/2∼0.6 d) with 65% moving to the urinary bladder contents, 10.5% to liver, 8.75% to Blood 2, 5.25% to bone surfaces (in the ratio 2:1 between trabecular and cortical bone surfaces), 3.5% to kidneys, 0.35% to thyroid, and the remaining 6.65% to other soft tissue. The following removal half-times are assigned: 10 d from Blood 2, kidney, thyroid, and other soft tissue to Blood 1; 10 d from liver to the small intestine contents (representing removal from the liver in bile); and 56 d from cortical or trabecular bone surfaces, with 94.4% returning to Blood 1 and 5.6% moving to the corresponding bone volume compartment. The transfer coefficients describing the rates of movement from the bone volume compartments to Blood 1 are the generic turnover rates for cortical and trabecular bone. (173) No explicit exhalation pathway was introduced in the model, as the available studies indicate that, in spite of the persistent garlic odour experienced after tellurium incorporation, the amount exhaled is negligible. (174) The transfer coefficients listed in Table 4.7 yield the following predictions, which are reasonably consistent with the biokinetic database for tellurium summarised above. Urinary excretion of systemic tellurium is rapid and amounts to 45% in the first 24 h, 64% after 3 d, 72% after 10 d, and 84% after 50 d. These values are in agreement with the urinary excretion observed by Kron et al. (1991) after oral administration of tellurium, taking into account the absorbed fraction of 0.3. Faecal excretion of intravenous tellurium amounts to 0.4% after 3 d, 3.1% after 10 d, and 8.9% after 50 d. Whole-body retention amounts to 55% after 1 d, 23.8% after 10 d, and 2.75% after 100 d, in satisfactory agreement with the data presented by Fehér and Andrási (1977) and with the curve predicted by them, as shown in Fig. 4.2. At 5 d after intravenous injection, 8.2% of the injected amount is contained in liver, 5.2% in skeleton, 2.7% in kidneys, and 0.27% in thyroid. At 100 d, the retained fractions are 2.4%, 0.1%, 0.03%, and 0.003% for skeleton, liver, kidneys, and thyroid respectively. Transfer coefficients for systemic tellurium. ST, other soft tissues.

4.2.3.3. Treatment of radioactive progeny
(175) Chain members addressed in the derivation of dose coefficients for tellurium isotopes are isotopes of tellurium, antimony, iodine, or xenon. Iodine as a progeny of tellurium is assigned the model for iodine as a progeny of antimony, described in Section 3. Tellurium and antimony as progeny of tellurium are assigned the characteristic models for these elements (i.e. the models applied in this publication to these elements as parent radionuclides). The behaviour of xenon as a progeny of tellurium is described by a generic model, described below, for xenon produced in a systemic compartment by decay of a radionuclide. (176) In some cases, the site of production of antimony or iodine may not be clearly identifiable with a specific compartment in its characteristic biokinetic model due to differences in model structures for the different chain members. In such cases, a transfer rate from the site of production of the radionuclide to the central blood compartment in the radionuclide’s model has been assigned as described below. After reaching its central blood compartment, the radionuclide is assumed to behave as described by its biokinetic model. (177) Antimony atoms produced in soft tissue compartments in the tellurium model that are ambiguous with regard to the characteristic model for antimony (compartments representing liver and other soft tissues are assumed to transfer to the central blood compartment of that model (plasma) at the rate 0.693 d−1 (t1/2 = 1 d). This is the highest rate of removal from all soft tissue compartments in the characteristic model for antimony. (178) Iodine atoms are produced at the following sites in the tellurium model that are not clearly identifiable with specific compartments of the model assigned to iodine: Blood 2 (red blood cells), and compartments of bone, liver, kidneys, thyroid, and other soft tissues (other). The following rates of transfer from these sites to the blood iodide pool of the characteristic model for iodine are assigned: from compartments of liver or kidneys, 100 d−1 (the rate of loss from the liver iodide and kidney iodide compartments in the model for iodine); from compartments of blood (other than the central blood compartment), 1000 d−1; from compartments of other soft tissues or bone surfaces, 200 d−1 (the highest transfer coefficient to blood in the model for iodine); from thyroid, 36 d−1 (the transfer coefficient from the thyroid iodide pool to the blood iodide pool in the model for iodine); and from trabecular and cortical bone volume compartments, the reference rates of trabecular and cortical bone turnover. Iodine produced in the central blood pool of the tellurium model is assigned to the blood iodide pool in the model for iodine. (179) A generic biokinetic model is applied in the OIR series to xenon isotopes produced by decay of a radionuclide in systemic compartments. Xenon produced in bone is assumed to transfer to blood at the rate 100 d−1 if produced in bone surfaces, and 0.36 d−1 if produced in bone volume. These rates are taken from the model for radon introduced in Publication 67 (ICRP, 1993), and applied in the OIR series to radon produced in bone surfaces and non-exchangeable bone volume, respectively, by decay of a radium isotope. Xenon produced in a soft tissue compartment is assumed to transfer to blood with a half-time of 20 min. Xenon produced in the central blood compartment in the model for tellurium, antimony, or iodine is assigned to the blood compartment of the xenon model. Xenon produced in any other blood compartment in the tellurium, antimony, or iodine model is assumed to transfer to blood in the xenon model at the rate 1000 d−1. Xenon entering the blood compartment of the xenon model or produced in that compartment is assumed to be removed from the body (exhaled) at the rate 1000 d−1. Partial recycling of xenon to tissues via arterial blood is not depicted explicitly in this model for xenon as a progeny radionuclide, but is considered in the assignment of the half-times in tissues. The model is intended to yield a conservative average residence time of xenon atoms in the body after their production in systemic pools.
4.3. Individual monitoring
(180) 132Te is a gamma emitter. Monitoring of 132Te may be done through whole-body measurement. Urine bioassays may also be used. Total body content and daily urinary excretion of 132Te following inhalation of 1 Bq all unspecified compounds (gases or vapours). Monitoring techniques for 132Te. Committed effective dose coefficients (Sv Bq−1) for the inhalation or ingestion of 129Te and 132Te compounds. AMAD, activity median aerodynamic diameter. Dose per activity content of 129Te in total body and in daily excretion of urine (Sv Bq−1); 5-µm activity median aerodynamic diameter aerosols inhaled by a reference worker at light work. NA, not applicable. Dose per activity content of 132Te in total body and in daily excretion of urine (Sv Bq−1); 5-µm activity median aerodynamic diameter aerosols inhaled by a reference worker at light work. NA, not applicable


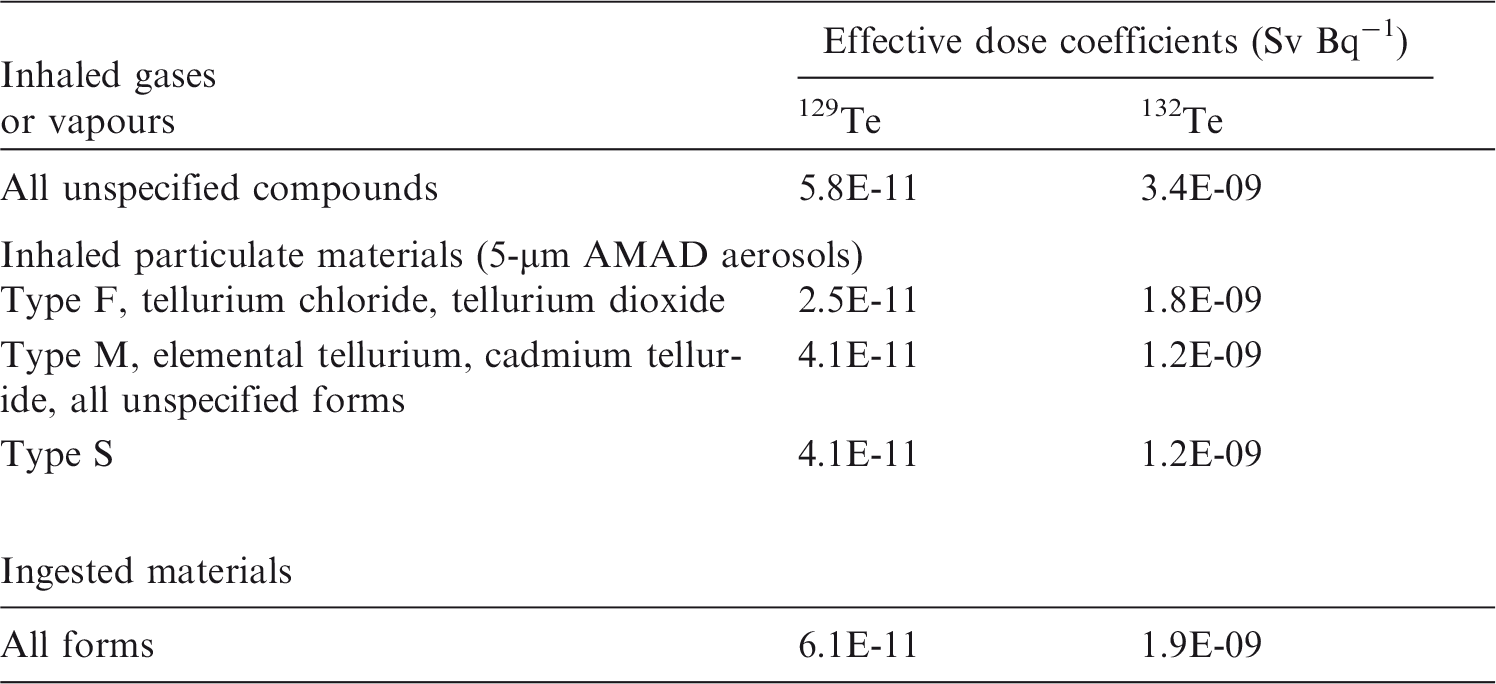


4.4. Dosimetric data for tellurium
Total body content and daily urinary excretion of 132Te following inhalation of 1 Bq Type F. Total body content and daily urinary excretion of 132Te following inhalation of 1 Bq Type M. Total body content and daily urinary excretion of 132Te following inhalation of 1 Bq Type S.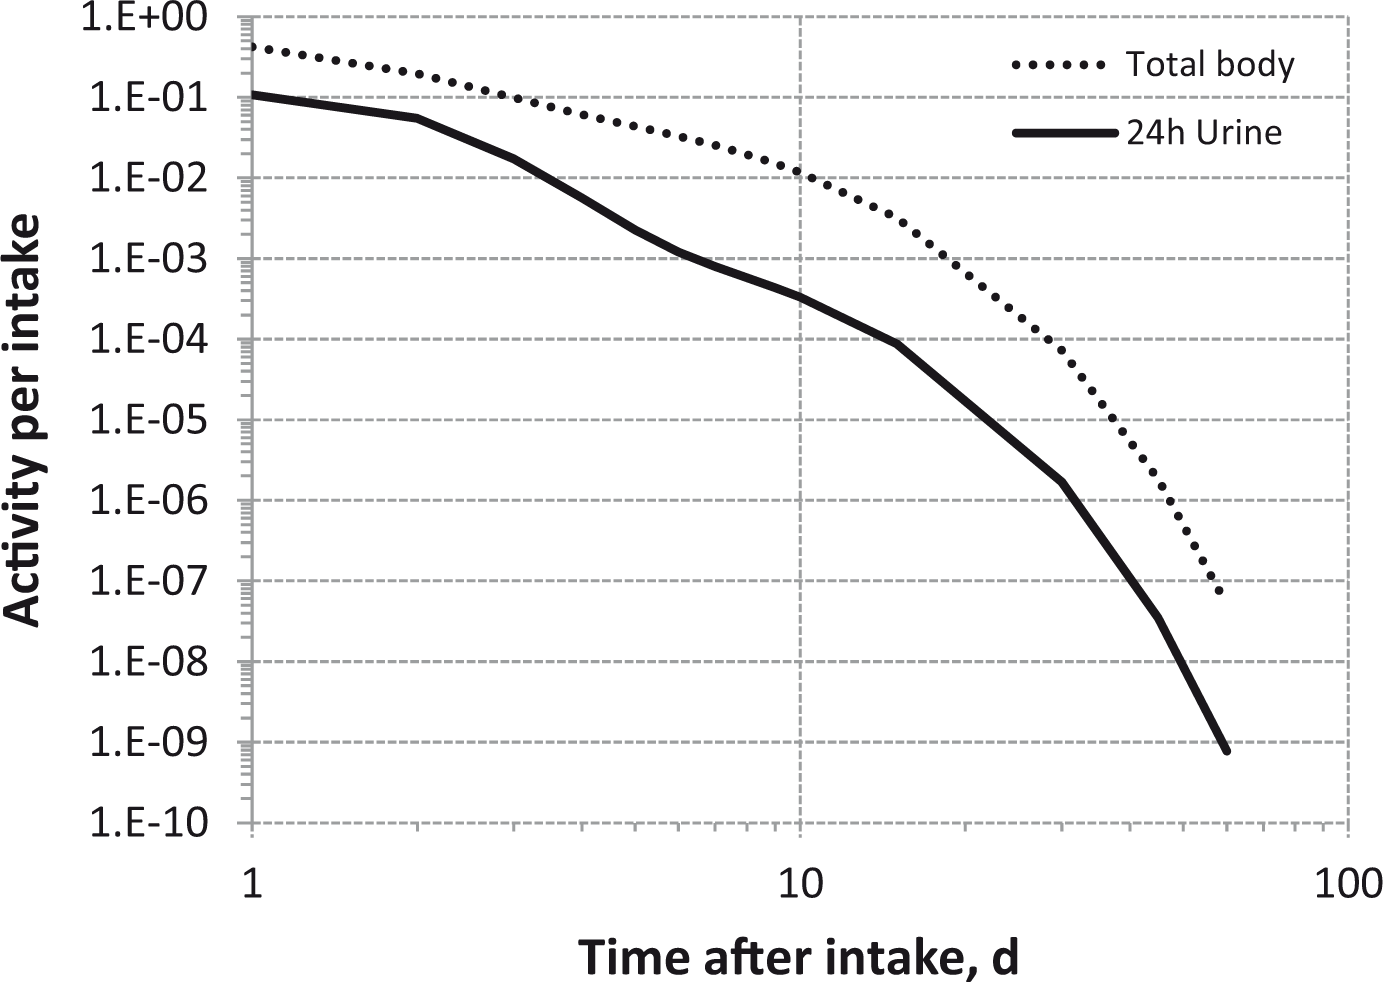
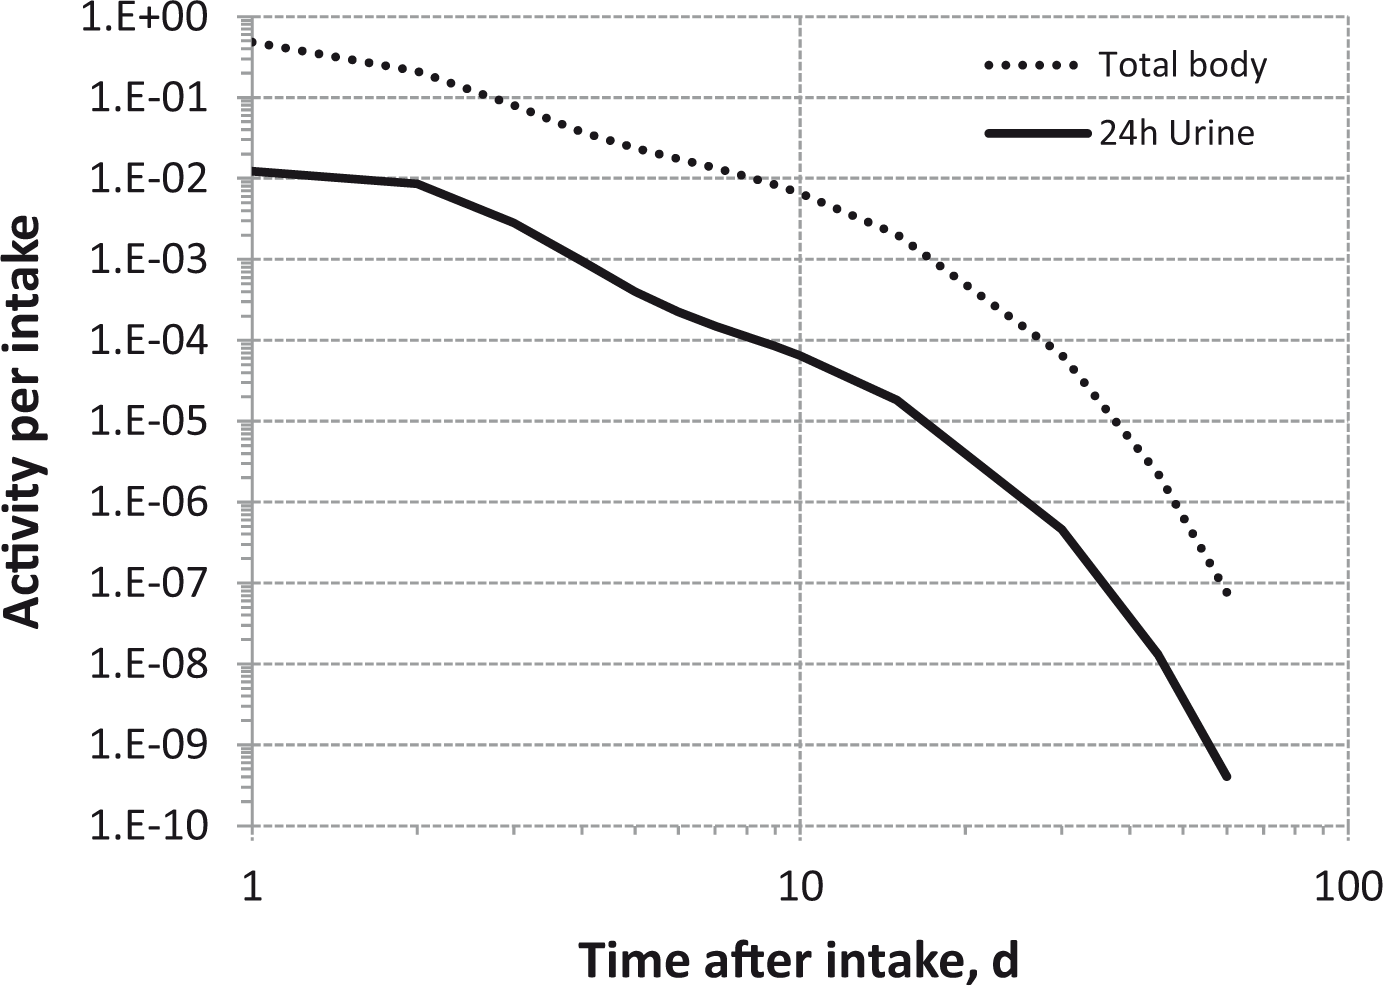
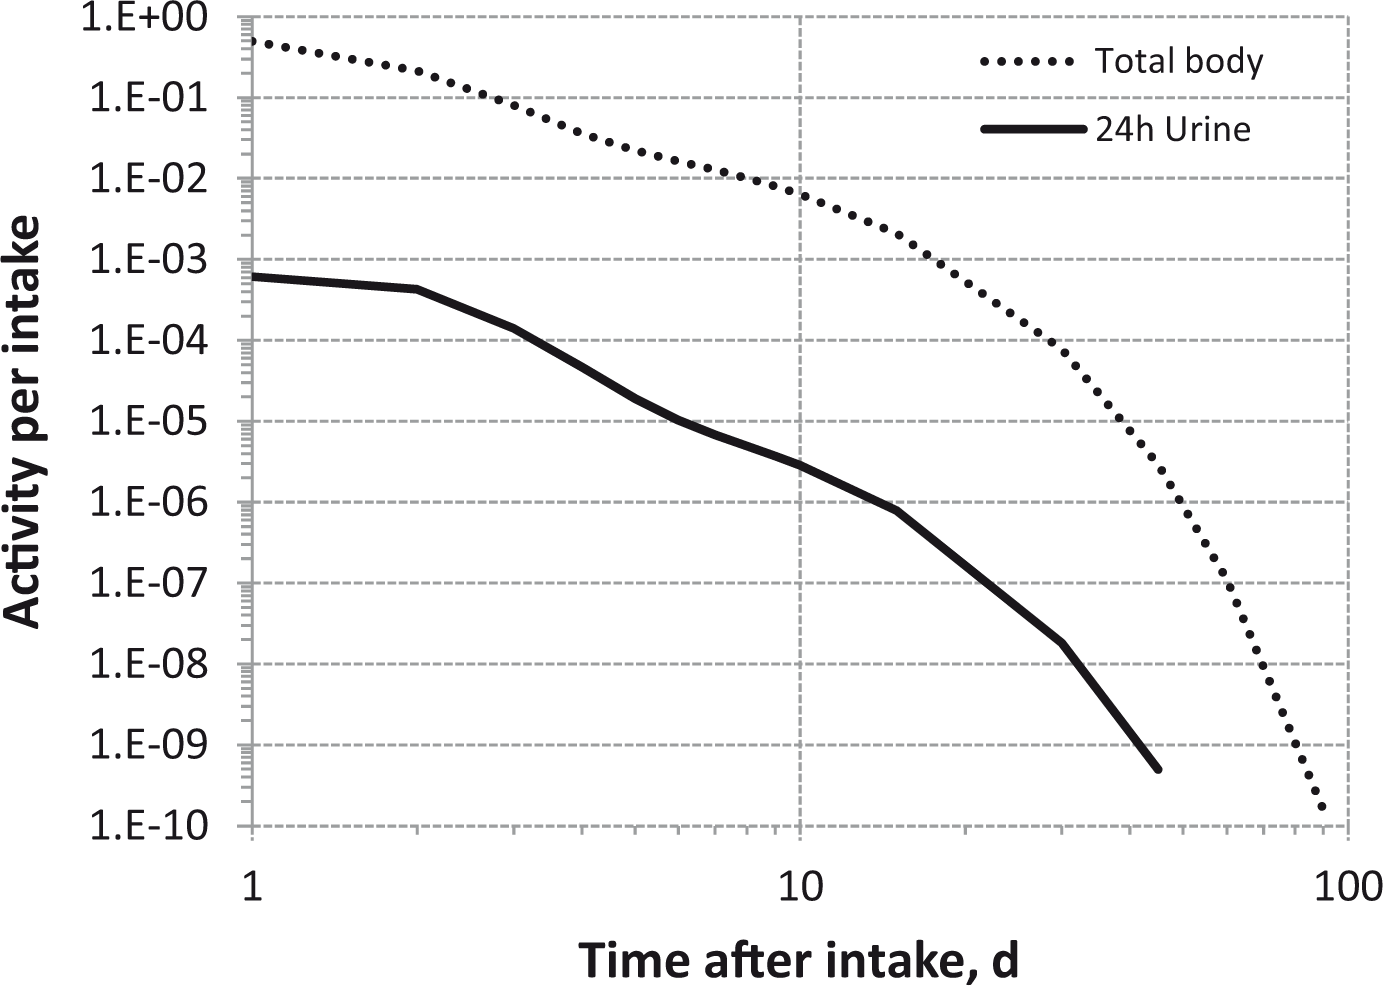
4.5. References
5. IODINE (Z = 53)
5.1. Chemical forms in the workplace
(181) Iodine is a volatile halogen that occurs mainly in oxidation states I, 0, and V. The most common chemical forms of iodine in solution are the iodide (I−) and the iodate (IO3−). Iodine may be encountered in industry in a variety of chemical and physical forms, including vapours and gases, organic compounds such as methyl and ethyl iodide, and particulate forms including metal iodide (NaI, AgI). (182) 131I, 129I, and 132I (from 132Te) are the three main iodine fission products that are released from reactor accidents and are present in fragments of irradiated fuels. 123I and 125I are used in medicine as tracers for imaging and evaluating the function of the thyroid, and 131I is used in medicine for the treatment of thyroid cancer. Biokinetic model for iodine introduced by Riggs (1952) and widely used in radiation protection, with the International Commission on Radiological Protection (ICRP) current parameter values for workers (ICRP, 1994, 1997). In recent ICRP publications, the compartment ‘All inorganic iodide in body’ is called ‘Blood’, the compartment ‘Organic iodine in thyroid’ is called ‘Thyroid’, and the compartment ‘Organic iodine in rest of body’ is called ‘Rest of body’.
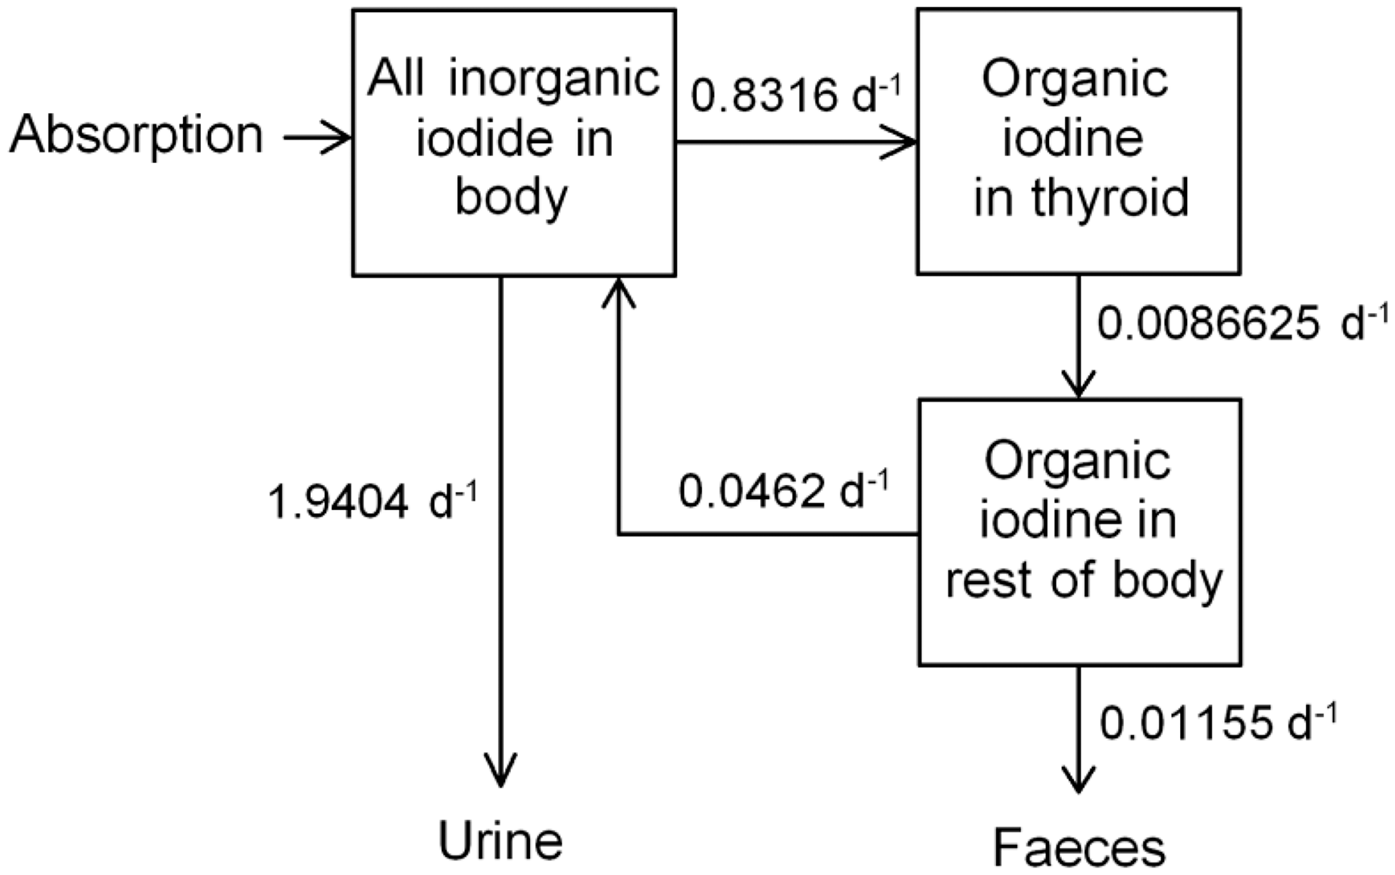
5.2. Routes of intake
5.2.1. Inhalation
(183) Detailed information on the behaviour of inhaled gases and vapours of iodine is available from studies in human volunteers. Hence, although information is also available from animal experiments, it is not reviewed here. Some information on absorption from the respiratory tract is available on inhaled particulate forms of iodine, as iodide from animal experiments, and associated with irradiated fuel fragments from human exposures. (184) Absorption parameter values and types, and associated fA values for gas and vapour forms of iodine are given in Table 5.2, and for particulate forms in Table 5.3. Exposures to both gas/vapour forms and particulate forms of iodine are common, and it is therefore recommended in the OIR series that 50% particulate and 50% gas/vapour should be assumed in the absence of information (ICRP, 2002a). Structure of the biokinetic model for systemic iodine used in this publication. Isotopes of iodine addressed in this publication. EC, electron-capture decay; B+, beta-plus decay; B−, beta-minus decay; IT, isomeric transition decay. Dose coefficients and bioassay data for these radionuclides are given in the printed copy of this publication. Data for other radionuclides listed in this table are given in the accompanying electronic annex. Deposition and absorption for gas and vapour forms of iodine.
*
ET1, anterior nasal passage; ET2, posterior nasal passage, pharynx, and larynx; BB, bronchial; bb, bronchiolar; AI, alveolar-interstitial. For iodine in unspecified gas or vapour form, the behaviour assumed is the same as that for elemental iodine: 100% deposition (50% ET2 and 50% BB) with Type F absorption. Fraction deposited refers to how much of the material in the inhaled air remains in the body after exhalation. Almost all inhaled gas molecules contact airway surfaces, but usually return to the air unless they dissolve in, or react with, the surface lining. Since instantaneous absorption to blood (Type V) is assumed, calculations can be performed assuming direct injection into blood, and the regional deposition does not need to be considered. Nevertheless, for completeness, the deposits in each region are assumed to be distributed in the same proportions as in the default distribution for gases and vapours: 20% ET2, 10% BB, 20% bb, and 50% AI. Not applicable for Type V, because all activity deposited in the respiratory tract is absorbed instantaneously. Absorption parameter values for inhaled particulate forms of iodine and for ingested iodine. It is assumed that the bound state can be neglected for iodine, i.e. fb = 0. The value of sr for Type F forms of iodine (100 d–1) is element-specific. The values for Types M and S (3 d–1) are the general default values. Materials (e.g. sodium iodide) are generally listed here where there is sufficient information to assign to a default absorption type, but not to give specific parameter values (see text). For inhaled material deposited in the respiratory tract and subsequently cleared by particle transport to the alimentary tract, the default fA values for inhaled materials are applied; i.e. the product of fr for the absorption type and the fA value for ingested soluble forms of iodine (1.0). Default Type F is recommended for use in the absence of specific information on which the exposure material can be assigned to an absorption type; for example, if the form is unknown, or if the form is known but there is no information available on the absorption of that form from the respiratory tract. Activity transferred from systemic compartments into segments of the alimentary tract is assumed to be subject to re-absorption to blood. The default absorption fraction fA for the secreted activity is the reference fA (1) for ingestion of the radionuclide.
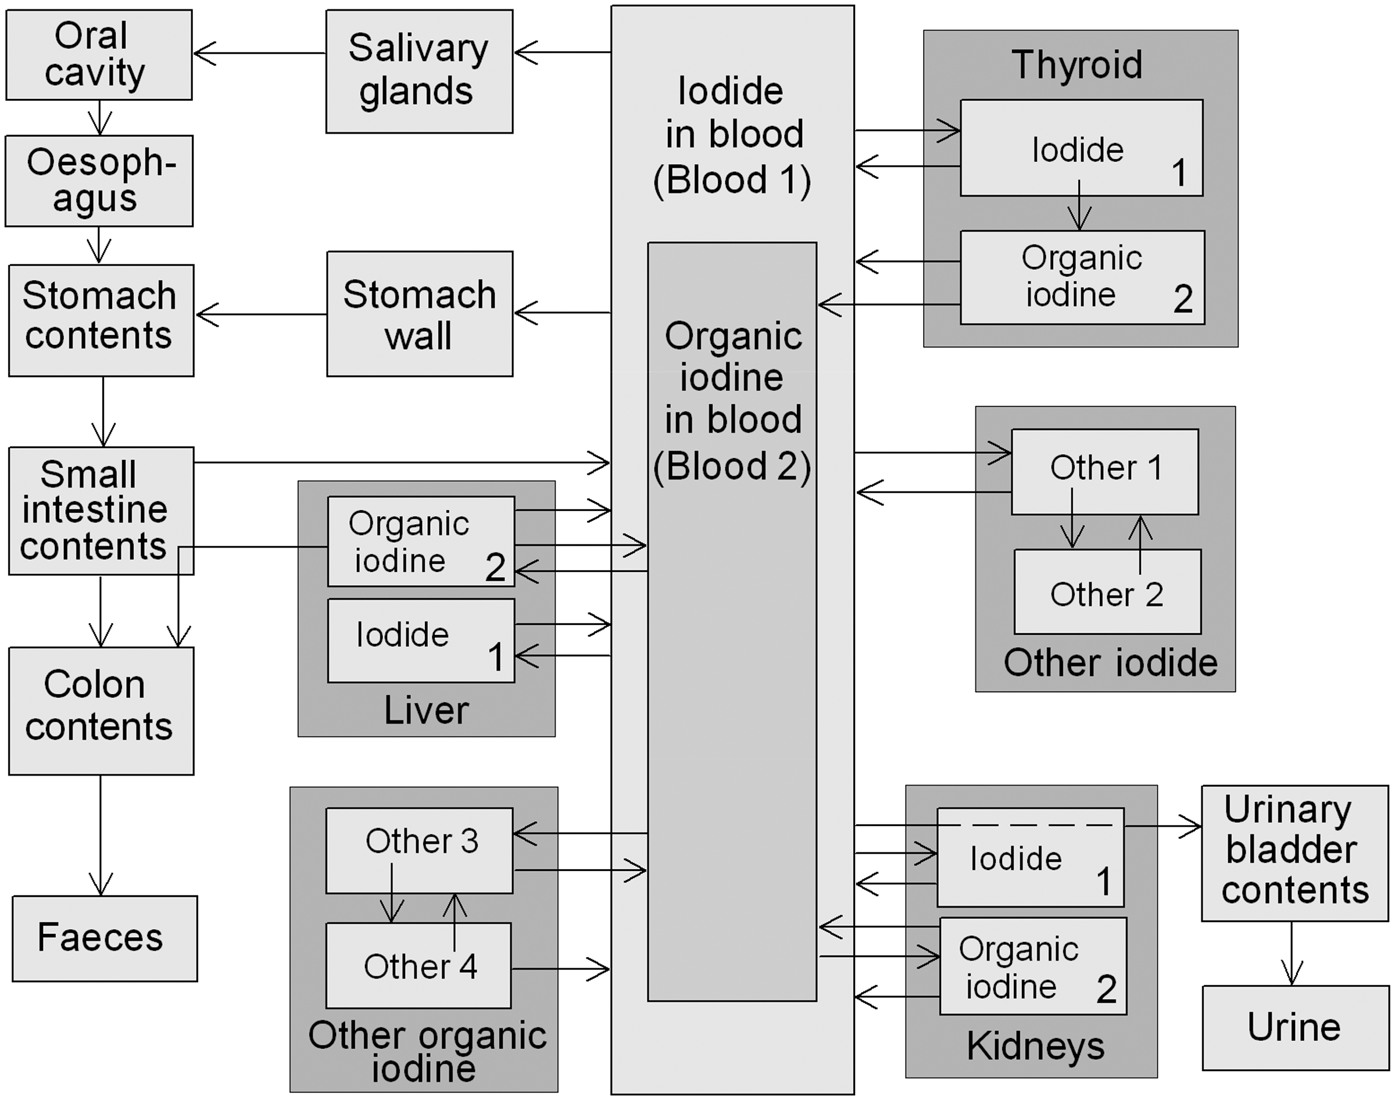


5.2.1.1. Gases and vapours
(a) Elemental iodine (185) Iodine in thyroid measurements were made up to approximately 4 months after intake on five workers who accidentally inhaled 125I vapours released from an open beaker (Bordell et al., 1972). The thyroid activity fell by approximately 30% between the first two measurements (at 0.5 and 4 d after the intake), suggesting that most of the absorption to blood had occurred by the time of the first measurement, and indicating Type F behaviour. (186) Detailed studies have been conducted in human volunteers of the deposition and subsequent biokinetic of iodine inhaled as vapour labelled with 132I (Black and Hounam, 1968; Morgan et al., 1968a). The results confirmed the rapid absorption seen previously in animal experiments. In the experiments conducted by Morgan et al., the iodine was inhaled through a mouthpiece. Respiratory tract deposition was almost complete, and the authors noted that this must be due to the high chemical reactivity of iodine, because it is only sparingly soluble in water. Measurements with collimated detectors showed high deposition in the oral pharynx and transfer downwards, presumably to the stomach. From these and measurements of systemic activity, it was inferred that much of the activity was swallowed and subsequently absorbed from the alimentary tract. The authors concluded that the main site of deposition was the oral pharynx, and while penetration to the trachea and bronchi could not be excluded, it was unlikely that iodine vapour reaches the alveoli. In the experiments conducted by Black and Hounam, the iodine was drawn in through the nose and out through the mouth. Using a similar technique, Pattle (1961) reported negligible penetration of the nose and mouth by iodine vapour. However, Black and Hounam found that deposition was not complete (typically ∼70%) and estimated that, in normal breathing, rather less than 50% of iodine vapour would be deposited in the NP region and the rest in the TB region. Measurements of retention in different parts of the nasal passage were made with collimated detectors from 5 to 100 min after deposition. These showed that there was some deposition in the nasal vestibule (ET1), but the fraction deposited there was not estimated. They estimated a clearance half-time from the nasopharynx of approximately 30 min, but this would not have included clearance during the first few minutes. (187) Analyses of the results of these human volunteer experiments were carried out here (i.e. by the Task Group) to estimate the rate of absorption of iodine from respiratory tract to blood (sr) following its inhalation in elemental form. A compartment model was set up using the revised HRTM (ICRP, 2015) and the systemic model for iodine described below, and applied to estimate values of fractional regional deposition and sr using the reported measurements of 132I in the thyroid and urine. Some parameter values in the systemic model were normalised to the individual subject using reported measurements of 132I in the thyroid and urine following ingestion of 132I-labelled sodium iodide by the same subject. From the reported observations (see above) and for simplicity, it was assumed that deposition occurred only in ET2 and BB. It was found that the results were insensitive to the ratio of deposition between these regions, and the assumption was made of 50% deposition in ET2 and 50% in BB. On that basis, the rate of absorption of iodine from respiratory tract to blood (sr) was estimated to be approximately 100 d–1. As described below, based on this assessment and the results of studies in which iodine was deposited in the respiratory tract as sodium iodide and in a caesium chloride vector, a value of sr of 100 d–1 is applied here to Type F forms of iodine. Hence, for elemental iodine, it is assumed here that there is 100% deposition in the respiratory tract, all in the upper airways (50% ET2 and 50% BB), with Type F absorption. (b) Methyl iodide (CH3I) (188) Detailed studies have been conducted in human volunteers of the deposition and subsequent biokinetic of iodine inhaled as CH3I (Morgan et al., 1967a,b; Morgan and Morgan, 1967). The amount retained varied from 50% to 90% (average 70%), increasing with decreasing number of breaths per minute. It was inferred that most of it deposited in the alveoli. Absorption of the deposited activity to blood was very rapid (estimated t1/2 ∼5 s). Subsequently, the biokinetic were very similar to those of injected iodide, suggesting that CH3I is metabolised rapidly. For methyl iodide, it is therefore assumed here that there is 70% deposition in the respiratory tract (with default regional distribution, Table 5.2) and Type V absorption. (c) Ethyl iodide (C2H5I) (189) The retention of 132I-labelled ethyl iodide (C2H5I) inhaled by human volunteers was in the range 44% to 62%, slightly lower than the same group of subjects exposed to methyl iodide (53–81%) (Morgan et al., 1968b). Urinary excretion of 132I also occurred at a slower rate than that following inhalation of 132I-labelled methyl iodide. However, the difference is small, and for ethyl iodide, it is also assumed here that there is 70% deposition in the respiratory tract (with default regional distribution, Table 5.2) and Type V absorption.
5.2.1.2. Particulate aerosols
(a) Sodium iodide (NaI) (190) Iodine inhaled as sodium iodide is absorbed rapidly into blood. Thiéblemont et al. (1965a,b) studied excretion and thyroid uptake of 131I following inhalation of 131I-labelled NaI by rhesus monkeys, and noted that excretion was similar to that for intravenously injected 131I. Perrault et al. (1967) investigated the absorption of 131I from the respiratory tract following inhalation of 131I-labelled NaI by rhesus monkeys. At 13 min after the end of a 30-min exposure, 82% of activity had been absorbed from the respiratory tract to blood. A compartment model fit by the authors to measurements of 131I in lung and blood gave a half-time for absorption between 2.5 and 10 min (i.e. a rate of the order of 100 d–1). Dawson et al. (1985) measured absorption of 131I in isolated perfused rabbit lung exposed to an aerosol containing 125I-labelled NaI. They calculated a half-time for absorption of approximately 10 min, corresponding to a rate of approximately 100 d–1. Although specific parameter values for sodium iodide based on in-vivo data are available, they are not adopted here. Instead, sodium iodide is assigned to Type F. However, the data are used as the basis for the default rapid dissolution rate for iodine. Hence, specific parameter values for sodium iodide would be the same as default Type F iodine parameter values. (b) Caesium chloride vector (191) Thomas et al. (1970) followed the biokinetic of 131I for 70 d after inhalation of 131I associated with caesium chloride vector aerosols by rats. Immediately after the 10-min exposure, the lung contained only approximately 1% of the initial body content. By 24 h, there were high concentrations in thyroid and pelt. Whole-body retention to 70 d was similar to that in rats following intravenous injection of 131I. Thus, absorption from lungs to blood was rapid, of the order of 100 d–1. The biokinetic of 131I were followed for 30 d after inhalation of 131I associated with caesium chloride vector aerosols by dogs (McClellan and Rupprecht, 1968). It was noted that the maximum thyroid uptake (as a fraction of initial body content) and the time after intake at which the maximum thyroid uptake was reached were very similar for inhaled, ingested, or intravenously injected 131I, which demonstrated the soluble nature of iodide in body fluids. Although specific parameter values for iodine in a caesium chloride vector based on in-vivo data are available, they are not adopted here. Instead, it is assigned to Type F. However, the data are used as the basis for the default rapid dissolution rate for iodine. Hence, specific parameter values would be the same as default Type F iodine parameter values. (c) Silver iodide (AgI) (192) Following inhalation of 131I-labelled silver iodide by mice and sheep (Bair, 1961; Willard and Bair, 1961), 131I was absorbed rapidly from the lungs, even though silver iodide was studied because it is one of the most insoluble iodine compounds in water. Lung retention of 110mAg following inhalation of 110mAg-labelled silver iodide by dogs and rats (Morrow et al., 1968) is consistent with assignment to Type M. However, Morrow et al. noted that some conversion to silver oxide probably occurs during aerosolisation. Hence it appears that the rapid absorption of 131I observed by Bair et al. is probably not inconsistent with the slow absorption of silver reported by Morrow et al., and iodine inhaled as silver iodide is assigned here to default Type F. (d) Irradiated fuel fragments (193) Mirell and Blahd (1989) made whole-body measurements of activity on seven people from approximately 2 weeks to several months after exposure to the initial Chernobyl reactor accident plume in Kiev, Ukraine. Biological retention half-times were similar for different radionuclides (23 d for 131I) and different from those expected for systemic retention, indicating that they were trapped in particles and metabolically inert, thus indicating Type M rather than Type F behaviour. (194) In view of the limited information available, these data are judged to be an insufficient basis to provide specific absorption parameter values. Considerable variability has been observed in the behaviour of caesium associated with irradiated fuel fragments (see Section 6), for which much more information is available. Since this is also likely to be the case for iodine, this form is not assigned specifically to a default type here.
5.2.1.3. Default rapid dissolution rate for iodine
(195) Studies with elemental iodine, sodium iodide, and iodine in a caesium chloride vector outlined above give values of sr of approximately 100 d–1, which is applied here to all Type F forms of iodine.
5.2.1.4 Extent of binding of iodine to the respiratory tract
(196) Evidence from the various experimental studies outlined above suggests that there is probably little binding of iodine. It is therefore assumed that the bound state can be neglected for iodine (i.e. fb = 0.0).
5.2.2. Ingestion
(197) The absorption of iodide from the alimentary tract of humans is virtually complete with reported values of ≥0.9 (Riggs, 1952; Willard and Bair, 1961; Wayne et al., 1964; Underwood, 1971). Keating and Albert (1949) reported a rate of absorption of approximately 5% min−1 in fasted individuals, with complete absorption within 2 h. Iodide absorption depends, however, on the redox conditions in the alimentary tract. Mechanistic studies indicate that some oxidising agents, such as chlorine-based disinfectants, oxidise the basal iodide content of the alimentary tract and decrease its bioavailability (Bercz et al., 1986). (198) For other chemical forms, absorption is less complete. Results obtained for iodine administered to humans as thyroxine suggested absorption of 0.80–0.85 (Wayne et al., 1964). Similar experiments using 125I incorporated in trypsin and given by direct introduction into the duodenum to one volunteer showed that a significant amount of radioactivity appeared in blood within 4 min and increased to a maximum by 75 min. The total activity absorbed in this experiment was approximately 11% of the ingested activity (Lake-Bakaar et al., 1980). In contrast, other studies performed on nine healthy individuals with [131I]-labelled trypsin showed absorption of approximately 0.78–0.98 with peak activity in the plasma 1 h after administration (Bohe et al., 1986). These authors showed that only free 131I is absorbed into the circulation, demonstrating a deiodinating mechanism in the intestine. This variability in iodine absorption between individuals may be explained, in part, by genetic polymorphism (Mithen, 2007). (199) Studies in animals have shown that free iodine and iodate are converted to iodide prior to absorption in dogs (Cohn, 1932). High values of absorption (>0.7–1) have been reported for absorption of iodine and iodide in goats and cattle, as summarised by Coughtrey et al. (1983). (200) In Publication 30 (ICRP, 1979), an absorption value of 1 was recommended for all chemical forms of iodine. This value was adopted in Publication 56 (ICRP, 1989) for dietary intakes. An fA value of 1 is used here for all forms.
5.2.3. Systemic distribution, retention, and excretion
5.2.3.1. Summary of the database
(a) Iodine requirements in adult humans (201) Iodine is an essential component of the thyroid hormones thyroxine (T4) and triiodothyronine (T3), which regulate metabolic processes and are critical for growth and development (Utiger, 2001; BEST, 2005; Delange and Dunn, 2005). Several tens of micrograms of inorganic iodide are trapped daily by the adult human thyroid and used for synthesis of T4 and T3. T4 is only produced in the thyroid and represents more than 90% of the hormonal iodine secreted by the thyroid. Approximately 20% of the circulating T3 is produced in the thyroid, and the rest is produced from T4 in extrathyroidal tissues through a process involving removal of a single iodine atom from T4. T3 is more active than T4, and exerts most of the effects of the thyroid hormones in the body (Greenspan, 2004; BEST, 2005; Bianco and Larsen, 2005). (202) Iodine is largely recycled by the body after use of T4 and T3 by tissues, but the body’s supply must be supplemented with dietary iodine due to obligatory losses in excreta. The World Health Organization (WHO) recommends daily intake of 150 µg of iodine by adults, and 200 µg during pregnancy and lactation to ensure adequate production of thyroid hormones and prevention of goitre and hypothyroidism (WHO, 2001; FAO/WHO, 2002). WHO defines dietary iodine intake of 50–99 µg d−1 (or 50–99 µg L−1 urine, assuming a daily urine volume of 1 L and ignoring losses along other excretion routes) as mild iodine deficiency, 20–49 µg d−1 as moderate iodine deficiency, and less than 20 µg d−1 as severe iodide deficiency. Extensive survey data on dietary and urinary iodine (Parr et al., 1992; O’Hare et al., 1998; Iyengar et al., 2004; WHO, 2004; Caldwell et al., 2005; Delange and Dunn, 2005) indicate that iodine intake is at or above recommended levels in much of the world, but is mildly to severely deficient in many regions. Daily intake of iodine is typically 30–40% lower in women than in men (Oddie et al., 1970; Fisher et al., 1971; Milakovic et al., 2004; Bilek et al., 2005; Burman, 2006; CDC, 2008). The following reference values for dietary iodine are selected on the basis of worldwide survey data: 130 µg d−1 for women, 190 µg d−1 for men, and 160 µg d−1 as a sex-averaged value. (203) The following overview of the systemic biokinetic of iodine in adult humans was excerpted from a review by Leggett (2010). (b) Absorption and distribution of inorganic iodide (204) Iodine occurs in foods mainly as inorganic iodide. Other forms of iodine in foods are reduced to iodide in the alimentary tract before absorption (Cohn, 1932; WHO, 1989). Absorption is primarily from the small intestine but may occur, to some extent, from the stomach and other sites along the alimentary tract (Cohn, 1932; Riggs, 1952; Small et al., 1961). Absorption is rapid and nearly complete in most cases. Keating and Albert (1949) estimated an absorption rate of approximately 5% min−1 in fasted individuals, with virtually complete absorption within 2 h. Absorption was slower when iodide was ingested with food, but was virtually complete after approximately 3 h. More than 99% of iodine orally administered as potassium iodide was absorbed to blood in normal subjects (Oddie et al., 1964; Fisher et al., 1965). (205) Absorbed iodide is distributed rapidly throughout the extracellular fluid. Most of the iodide that leaves blood is recycled to blood within 1–2 h, and much of it is recycled within a few minutes (Riggs, 1952; Wayne et al., 1964; Hays and Solomon, 1965). (206) The iodide ion is largely excluded from most cells but rapidly traverses the red blood cell membrane. Equilibration between plasma iodide and red blood cell iodide occurs in minutes. The concentration of iodide in red blood cell water is approximately the same as in plasma water, giving approximately two-thirds as much iodide in the total red blood cells as in an equal volume of plasma (Myant et al., 1950; Riggs, 1952). (207) A substantial portion of iodide entering blood is concentrated in the salivary glands and stomach wall by active transport. It is subsequently secreted into the alimentary tract contents in saliva and gastric juice, and nearly completely re-absorbed to blood. As a central estimate, the rate of clearance of plasma iodide in saliva plus gastric secretions is approximately 43 mL min−1 (range 36–49 mL min−1) (Hays and Solomon, 1965; Harden and Alexander, 1968; Harden et al., 1969). The concentration of iodine in these secretions is on the order of 30 times its concentration in plasma. There is a delay of approximately 20 min between uptake of iodine by the salivary glands and stomach wall and appearance in the stomach contents, and a delay of approximately 30 min between the peak concentration in plasma and the peak concentration in secretions into the alimentary tract (Riggs, 1952; Hays and Wegner, 1965). (208) The thyroid and kidneys are in competition for blood iodide, and hence for the body’s supply of iodide, due to the rapid recycling of total-body iodide through blood. Normally, more than 90% of the loss of iodine from the body is due to renal clearance of iodide. Little inorganic iodide is lost in faeces. Sweat does not appear to be an important mode of loss of iodide except perhaps in hot climates or during intense exercise (Wayne et al., 1964; Smyth and Duntas, 2005). (209) Iodide in blood plasma is filtered by the kidneys at the glomerular filtration rate. Approximately 70% of the filtered iodide is re-absorbed to blood, and the rest enters the urinary bladder contents and is excreted in urine (Bricker and Hlad, 1955; Vadstrup, 1993). Renal clearance expressed as the volume of plasma iodide or blood iodide cleared per unit time is nearly constant over a wide range of plasma concentrations for a given age and sex. As a central estimate, renal clearance is approximately 37 mL plasma min−1 for euthyroid adult males (Berson et al., 1952; Wayne et al., 1964; Hays and Solomon, 1965). Renal clearance of iodide, expressed as plasma volume per unit time, appears to be approximately 25–30% lower on average in women than in men, but fractional loss of total-body iodide in urine per unit time is similar for men and women (Wayne et al., 1964; Oddie et al., 1966). (210) The concentration of radioiodide in the kidneys may exceed that in most extrathyroidal tissues for a brief period after acute input into blood. In rats, the peak concentration in the kidneys occurred approximately 15 min after intravenous injection (Korolev, 1969; Esposito, 1970), at which time the kidneys contained a few percent of the injected amount (Korolev, 1969). In rats and mice, the concentration of radioiodine in the kidneys was similar to that of the salivary glands during the early hours after intravenous or intraperitoneal injection (Esposito, 1970; Dadachova et al., 2002). Data on laboratory animals generally indicate that the concentration of radioiodide in the kidneys declines rapidly, and is not much greater than that of most other organs by a few hours after administration (Ruegamer, 1953; Ulmer et al., 1959; Moskalev and Yegorova, 1972). Using imaging data for 124I as a tracer for 131I in patients with thyroid cancer, Kolbert et al. (2007) estimated that the dose to kidneys from 131I was, on average, approximately half of the dose to the salivary glands. (211) Data on the extent of accumulation of inorganic radioiodide in the liver are variable. It appears from animal data that the liver typically accumulates a few percent of radioiodide soon after ingestion or intravenous administration, but much less per gram of tissue than the kidneys (Willard and Bair, 1961; Korolev, 1969; Moskalev and Yegorova, 1972; Dadachova et al., 2002; Zuckier et al., 2004). (c) Behaviour of iodide and organic iodine in the thyroid (212) The basic unit of cellular organisation within the thyroid is the follicle, a spherical structure typically a few hundredths of a millimetre in diameter. Each follicle is composed of a single layer of epithelial cells enclosing a lumen filled with a viscous material called ‘colloid’. The colloid consists mainly of thyroglobulin, a protein synthesised by follicular cells and secreted into the lumen. Thyroglobulin serves as a matrix for production and storage of T4 and T3 (Kopp, 2005). (213) Iodide is actively transported from blood plasma into thyroid follicular cells at the plasma membrane. A normal thyroid can concentrate the iodide ion to 20–40 times its concentration in blood plasma. Some of the trapped iodide leaks back into blood, but most of it diffuses across the follicular cell and enters the follicular lumen where it is converted to organic iodine. (214) Berson and Yalow (1955) studied the kinetics of trapping and binding of intravenously injected 131I by the thyroid in 24 hyperthyroid and three euthyroid subjects, first with no inhibition of binding and later with administration of a drug that inhibited binding. They concluded that the rate of binding of trapped iodide is much greater than the rate of return of trapped iodide to blood. When iodide binding was blocked before administration of 131I, activity in the thyroid reached a peak at times varying from several minutes to 1 h or more after injection. In approximately 80% of cases, the rate of loss of trapped 131I from the blocked thyroid was in the range 0.015–0.047 min−1 (22–68 d−1). (215) Robertson et al. (1971) estimated the rate of binding of trapped iodide by the thyroid and the rate of return of trapped iodide to plasma (exit rate) in 15 hyperthyroid and seven euthyroid subjects by kinetic analysis of time-dependent plasma concentrations and thyroid accumulation of intravenously injected 131I. The estimated binding rate was significantly greater in hyperthyroid than in euthyroid subjects, but no significant difference was found in the exit rate in the two groups. The estimated mean exit rate (± standard deviation) for all 22 subjects was 0.025 ± 0.013 min−1 (36 ± 19 d−1). Estimates of the binding rate averaged 0.110 ± 0.042 min−1 (160 ± 60 d−1) in the hyperthyroid subjects and 0.066 ± 0.039 min−1 (95 ± 56 d−1) in the euthyroid subjects. (216) Iodide is transported across the luminal membrane of the follicular cell into the lumen and oxidised at the cell–colloid interface. The neutral iodine atoms formed by oxidation of iodide are bound (organified) within the lumen to specific residues of the amino acid tyrosine. Some tyrosine residues gain one iodine atom, forming monoiodotyrosine (MIT), and others gain two iodine atoms, forming diiodotyrosine (DIT). T4 is formed within the lumen by the coupling of two DIT molecules and hence has four iodine atoms, and T3 is formed within the lumen by coupling of one MIT molecule to one DIT molecule and hence has three iodine atoms. The lumen typically contains 10–15 times more T4 than T3. (217) The thyroid adapts to prolonged reductions or increases in iodine intake by adjusting its rate of uptake of iodide from blood. Adaptation of thyroidal clearance of iodide to dietary intake results in an inverse relation between net 24-h thyroidal uptake of ingested radioiodine (U) and average 24-h urinary excretion of stable iodine (E). The uptake rate U also depends on the mass S of iodine secreted daily by the thyroid. Stanbury et al. (1954) derived the formula U = S/(S + E) or U = [1 + (E/S)]−1, based on the assumption that daily accumulation of organic iodine by the thyroid is in mass balance with daily secretion S of hormonal iodine. They derived a central estimate for S of 57 µg d−1 from measurements of E and U in a relatively large study group, primarily young adult females, with generally low rates of urinary excretion of stable iodine and high incidence of goitre. The formula U = 57/(57+E) is still widely used to estimate thyroidal uptake of radioiodine on the basis of urinary iodide (Ermans, 1993; O’Hare et al., 1998). (218) Zvonova (1989) compiled regional data on dietary intake or urinary excretion of stable iodine, thyroidal uptake of radioiodine, and mass of the thyroid in adult humans. Data were collected for populations in Argentina, West Germany, Russia, Denmark, Scotland, Hungary, West New Guinea, and seven regions in the USA. Estimated dietary intake Y of stable iodine ranged from 5–10 µg d−1 in West New Guinea to 250–700 µg d−1 in some regions of the USA. The mean fractional uptake of ingested radioiodine by the thyroid after 24 h (U) was estimated as 0.14–0.15 for populations with intake exceeding 400 µg d−1, 0.16–0.27 for populations with intake of 250–330 µg d−1, 0.41–0.45 for populations with intake of 80–85 µg d−1, 0.54–0.59 for populations with intake of 40–54 µg d−1, and approximately 0.9 for pupulations with intake of 5–10 µg d−1. Zvonova (1989) derived the relation U = 85/(85 + Y) or U = [1+(Y/85)]−1 based on an assumed balance of daily thyroidal accumulation of organic iodine and secretion S of hormonal iodine. The value S = 85 µg d−1 was derived by fitting the collected data for Y and U. (219) The formulae of Stanbury et al. (1954) and Zvonova (1989) are both broadly consistent with central estimates of thyroidal uptake of radioiodine in populations with dietary iodine up to a few hundred micrograms per day, but substantially underestimate uptake in populations with iodine-rich diet. The underestimates apparently arise because the assumption of balance of thyroidal uptake and hormonal secretion of iodine is invalid at high levels of dietary stable iodine. The rate of accumulation of organic iodine by the thyroid and the rate of loss of iodine from the thyroid both appear to increase at high levels of iodine intake, but the mass of iodine secreted as thyroid hormones appears to remain unchanged (Koutras et al., 1964; Fisher et al., 1965; Nagataki et al., 1967; Ohtaki, 1967; Harrison, 1968; Fisher and Oddie, 1969a). (220) In adults with an iodine-sufficient diet, the thyroid typically stores 5–15 mg of hormonal iodine (Riggs, 1952; Fisher and Oddie, 1969b; Hellstern et al., 1978; Handl et al., 1984; Shapiro et al., 1994; Hays, 2001). Estimates of the rate S of secretion of hormonal iodine by the thyroid (µg I d−1) in individual euthyroid adult humans range from less than 30 µg d−1 to more than 150 µg d−1 (Riggs, 1952; Berson and Yalow, 1954; Stanbury et al., 1954; Ingbar and Freinkel, 1955; Gregerman et al., 1962; Fisher et al., 1965; Fisher and Oddie, 1969a; Zvonova, 1989). Reference values for adults given in reviews and textbooks are generally in the range 55–85 µg d−1 (Riggs, 1952; Halnan, 1964; Fisher and Oddie, 1969a; Alexander et al., 1971; DeGroot et al., 1971; Underwood, 1977; Zvonova, 1989). There is a decline of thyroid hormone secretion with increasing adult age, at least after the fifth or sixth decade (Gregerman et al., 1962; Fisher et al., 1965; Oddie et al., 1965; Herrmann et al., 1981; Mariotti et al., 1995; Sawin, 2005). The secretion rate appears to be approximately one-third lower, on average, in women than in men, although there is some overlap in measurements for women and men (Ingbar and Freinkel, 1955; Fisher et al., 1965; Oddie et al., 1965). The following reference values of S for workers are based on collected data on thyroidal secretion of iodine as T4 for ages 18–65 y and the assumption that T4 represents 90% of total secretion of hormonal iodine: 52 µg d−1 for females, 76 µg d−1 for males, and 64 µg d−1 as a sex-averaged value. (221) Fractional transfer of iodine from thyroid stores to blood per unit time depends on the size of current stores, the rate of secretion of thyroid hormones, and the extent of leakage of iodide from MIT and DIT deiodinated in follicular cells. For example, assuming first-order kinetics and negligible leakage of iodide to blood, thyroidal stores of 5 mg and a secretion rate of hormonal iodine of 64 µg d−1 correspond to a half-time of approximately 54 d; stores of 10 mg and secretion of 76 mg correspond to a half-time of approximately 91 d; and stores of 15 mg and a secretion rate of 80 µg d−1 correspond to a half-time of approximately 130 d. Wellman et al. (1970) estimated a mean half-time of approximately 68 d based on data collected from several studies. In an extensive review of the literature, Dunning and Schwartz (1981) determined a range of 21–372 d and a mean of 85 d for adults. Long-term measurements on five workers acutely exposed to 125I vapour indicated an average biological half-time of approximately 130 d (Bordell et al., 1972). A biological half-time of 90 d is adopted in this publication as a reference value for adults. (d) Behaviour of extrathyroidal T4 and T3 (222) Upon secretion by the thyroid into blood, T4 and T3 are rapidly and almost completely bound to plasma proteins. Little, if any, enters the red blood cells. As a result of protein binding, clearance of organic iodine from the circulation is slower than removal of the iodide ion from the circulation. Reported concentrations of protein-bound iodine in blood plasma of euthyroid subjects are generally in the range 3–8 µg 100 mL−1 and cluster at approximately 5–6 µg 100 mL−1 (Tucker and Keys, 1951; Oppenheimer et al., 1967; Nicoloff and Dowling, 1968; Acland, 1971; Pittman et al., 1971; Nicoloff et al., 1972). (223) A number of investigators have studied the kinetics of radiolabelled T4 after intravenous injection into human subjects (Riggs, 1952; Sterling et al., 1954; Ingbar and Freinkel, 1955; Sterling, 1958; Lennon et al., 1961; Gregerman et al., 1962; Cavalieri and Searle, 1966; Oppenheimer et al., 1967; Nicoloff and Dowling, 1968; Wartofsky et al., 1972; Chopra, 1976; Hays and McGuire, 1980). The removal half-time from blood plasma typically increases from approximately 1 h at 20–60 min after injection to approximately 1 week at equilibrium. Early disappearance from plasma may mainly represent distribution throughout the extracellular fluids, plus uptake by hepatocytes. The slower decline at later times may represent uptake by cells and binding to intracellular proteins throughout the body, reduction to inorganic iodide due to use of the hormones by cells, and biliary secretion followed by faecal excretion of part of the organic iodine entering the liver. External measurements together with liver biopsy data indicate that the liver accumulates approximately 35% (22–52%) of injected T4 during the first 3–4 h after administration, and contains approximately 25% (14–40%) of extrathyroidal T4 at equilibrium (Cavalieri and Searle, 1966; Oppenheimer et al., 1967; Nicoloff and Dowling, 1968; Hays and McGuire, 1980). (224) The kinetics of labelled T3 have been difficult to determine with much precision, largely due to interference of iodoproteins generated by metabolism of the injected trace material (Nicoloff et al., 1972; Hays and McGuire, 1980). Human studies indicate high initial uptake of labelled T3 by the liver, but a shorter retention time than T4 in the liver (Cavalieri et al., 1970). The liver content at equilibrium has been estimated as 5–21% of the total extrathyroidal T3 pool (Cavalieri et al., 1970; Hays, 1985). (225) A portion of T4 or T3 entering the liver is secreted into the small intestine in bile (Greenspan, 2004). The secreted form is poorly absorbed to blood and is largely excreted in faeces (Hays, 1985). This accounts for approximately one-fifth of the loss of organic iodine from extrathyroidal tissues, and reduction to iodide and return to the blood iodide pool accounts for the rest (Berson and Yalow, 1954; Ingbar and Freinkel, 1955; Hiss and Dowling, 1962; Choufoer et al., 1963; Anbar et al., 1965; Hays and Solomon, 1969; Pittman et al., 1971; Chopra, 1976). Endogenous faecal excretion of organic iodine can become a major source of loss of iodine during periods of low intake of iodine (Choufoer et al., 1963; Busnardo and Casson, 1965; Kirchgessner et al., 1999). (226) Animal studies indicate that the concentration of organic iodine in the kidneys is at least as high as that in the liver. For example, in rats receiving daily injections of 125I over a 3-week period, the concentration of labelled T4 in kidneys was similar to that in liver, approximately seven times that in muscle, and more than twice that in heart (Winder and Heninger, 1971). The concentration of labelled T3 in kidneys was nearly twice that in liver, eight to nine times that in muscle, and four times that in heart. (227) Most estimates of the mass of extrathyroidal organic iodine at equilibrium are in the range 500–1000 µg. Most estimates of the biological half-life of T4 in normal subjects are in the range 5–9 d (Sterling et al., 1954; Ingbar and Freinkel, 1955; Gregerman et al., 1962; Anbar et al., 1965; Oppenheimer et al., 1967; Nicoloff and Dowling, 1968; Wartofsky et al., 1972; Chopra, 1976; Hays and McGuire, 1980; ICRP, 1987). The half-life of T3 is approximately 1 d (Pittman et al., 1971; Nicoloff et al., 1972; Inada et al., 1975; Chopra, 1976; Bianchi et al., 1978; Hays and McGuire, 1980; BEST, 2005), and that of reverse T3 (rT3) is a few hours (Chopra, 1976). Extrathyroidal conversion of T4 to T3 or rT3 results, in effect, in an extension of the half-life of T4. Measurements on 73 euthyroid males aged 18–91 y indicate that the rate of T4 production as well as its turnover rate, representing the combined rate of deiodination and faecal excretion, decrease with age, starting some time before 50 y (Gregerman et al., 1962). The half-life of labelled T4 was estimated as 6.6 d in young adult males and 8–9 d after the fifth decade of life (Gregerman et al., 1962). In 165 healthy subjects in the age range 18–86 y, measured rates of deiodination of T4 were similar in male and female subjects in the same age groups (Anbar et al., 1965). The half-time of deiodination of T4 increased with age from approximately 8 d in the third decade of life to approximately 13 d in the sixth decade (Anbar et al., 1965). (228) Nicoloff and Dowling (1968) evaluated the extrathyroidal distribution of 131I-labelled T4 in a group of 13 normal subjects. They interpreted external measurements in terms of a four-compartment model representing blood plasma, extracellular fluid, and hepatic and extrahepatic cellular fluid spaces. Their results indicate that the liver cleared T4 considerably faster than extrahepatic tissues, and contained approximately 14% of extrathyroidal T4 at equilibrium (Nicoloff and Dowling, 1968). Results of human studies by Oppenheimer et al. (1967) interpreted in terms of a two-compartment model suggest greater accumulation of T4 in the liver. (229) In rats receiving daily injections of 125I over a 3-week period, the concentration of labelled T4 in kidneys was similar to that in liver, approximately seven times that in muscle, and more than twice that in heart (Winder and Heninger, 1971). The concentration of labelled T3 in kidneys was nearly twice that in liver, eight to nine times that in muscle, and four times that in heart.
5.2.3.2. Biokinetic model for systemic iodine
(a) Previous models (230) A number of physiological system models have been developed to describe quantitative aspects of the metabolism of iodine as an essential element in humans (Brownell, 1951; Riggs, 1952; Oddie et al., 1955; Hays and Wegner, 1965; Berman et al., 1968; Nicoloff and Dowling, 1968; Alexander et al., 1971; DeGroot et al., 1971; Bazin et al., 1981; McGuire and Hays, 1981; Degon et al., 2008). A three-compartment biokinetic model of iodine developed by Riggs (1952) for application in physiological and clinical studies has been used by ICRP for many years as the basis of its biokinetic models for occupational or environmental intake of radioiodine. The ICRP model with parameter values applied to workers in recent reports (ICRP, 1994, 1997) is shown in Fig. 5.1. The compartments and paths of transfer represent absorption of dietary iodine to blood as inorganic iodide; competition between thyroidal and renal clearance for circulating inorganic iodide; production, storage, and secretion of hormonal iodine by the thyroid; deiodination of most of the secreted hormonal iodine and recycling of inorganic iodide; and loss of the remainder of secreted hormonal iodine in faeces. (231) Variations of the Riggs model and some more detailed iodine models have been developed for specific applications in radiation protection including: age-specific dosimetry of internally deposited radioiodine for application to environmental exposures (Stather and Greenhalgh, 1983; Johnson, 1987; ICRP, 1989); estimation of doses to patients from medical applications of radioiodine (MIRD, 1975; Robertson and Gorman, 1976; McGuire and Hays, 1981; Hays, 1985; ICRP, 1987; Johannsson et al., 2003); dose to the embryo/fetus or nursing infant from intake of radioiodine by the mother (Berkovski, 1999a,b, 2002; ICRP, 2002b); and reduction of radioiodine dose by administration of potassium iodide (Adams and Bonnell, 1962; Ramsden et al., 1967; Zanzonico and Becker, 2000). The model of Berkovski (1999a,b, 2002) for the pregnant or nursing mother and the model of Johannsson et al. (2003) designed for applications in nuclear medicine provide relatively detailed descriptions of the early biokinetic of inorganic iodide to allow improved dosimetry of short-lived radioiodine. (b) Model used in this publication (232) The model for systemic iodine used in this publication is taken from a paper by Leggett (2010). The model describes the biokinetic of systemic iodine in terms of three subsystems: circulating (extrathyroidal) inorganic iodide; thyroidal iodine (trapping and organic binding of iodide, and synthesis, storage, and secretion of thyroid hormones); and extrathyroidal organic iodine. (233) The structure of the model including connections with the alimentary tract is shown in Fig. 5.2. Baseline transfer coefficients for a male or female worker are listed in Table 5.4. (234) The modelled behaviour of extrathyroidal inorganic iodide is an extension of a model of Hays and Wegner (1965) based on bioassay and external measurements of 131I in young adult males during the first 3 h after intravenous injection. The present model adds compartments representing inorganic iodide in kidneys and liver, and adjusts flow rates to account for differences in model structure and the size of the blood iodide pool compared with the model of Hays and Wegner. The following compartments are used to describe the behaviour of extrathryoidal inorganic iodide: a compartment representing iodide in blood plasma plus red blood cells, treated as a well-mixed pool (Blood 1); salivary glands; stomach wall; Liver 1, representing iodide in liver; Kidneys 1, representing iodide in kidneys; Other 1, representing rapidly exchangeable iodide in extracellular fluids of extrathyroidal tissues other than kidneys and liver; Other 2, representing slowly exchangeable iodide in extrathyroidal tissues other than kidneys and liver; and a series of compartments representing different segments of the alimentary tract as represented in the HATM (ICRP, 2006). (235) The behaviour of iodine in the thyroid is described in terms of two compartments representing inorganic iodide (Thyroid 1) and organic iodine (Thyroid 2). Thyroid 1 receives iodide from Blood 1, feeds iodide to Thyroid 2, and leaks some iodide back to Blood 1. Thyroid 2 converts iodide to organic iodine and transfers organic iodine into the blood organic iodine pool (Blood 2). An arrow representing leakage of activity from Thyroid 2 into Blood 1 is included for application of the model to subjects with unusually high dietary iodine, but the baseline transfer coefficient from Thyroid 2 to Blood 1 is set to zero. (236) The modelled behaviour of extrathyroidal organic iodine is an extension of a model of extrathyroidal T4 kinetics developed by Nicoloff and Dowling (1968) from measurements of 131I-labelled T4 in 13 healthy human subjects (seven women and six men). The present model adds a compartment representing organic iodine in the kidneys, and assumed to have the same rate of exchange with blood plasma per gram of tissue as does the liver. The following compartments are used to describe the behaviour of extrathyroidal organic iodine: Blood 2, representing thyroid hormones bound to plasma proteins; Liver 2, representing organic iodine in liver; Kidneys 2, representing organic iodine in kidneys; Other 3, representing rapidly exchangeable organic iodine in extracellular fluids of extrathyroidal tissues other than kidneys and liver; and Other 4, representing slowly exchangeable organic iodine in extrathyroidal tissues other than kidneys and liver. (237) The kidneys and liver are each divided into two compartments to address the different biokinetic of inorganic iodide and organic iodine. The kidneys are treated explicitly because they accumulate both inorganic iodide and hormonal iodine to a greater extent than most extrathyroidal tissues. The liver is treated explicitly mainly because it is an important repository for hormonal iodine. The iodide content of the liver is addressed for completeness. (238) Iodine is assumed to be removed from the body only through urinary and faecal excretion. Iodide moves to urine after transfer from Blood 1 into urinary bladder contents. This represents the net result of glomerular filtration of iodide, re-absorption of much of the filtered iodide to blood, and transfer of the remainder to urinary bladder contents followed by excretion in urine. Organic iodine is excreted in faeces after transfer from Liver 2 to right colon, representing the net result of secretion into the small intestine and transfer of unabsorbed organic iodine to the right colon followed by excretion in faeces. (239) Assuming that stable iodine intake and excretion are in balance, the transfer coefficient λ from blood iodide to thyroid iodide can be estimated in terms of the dietary stable iodine Y (µg d−1) and the rate S of secretion of stable iodine by the thyroid (µg d−1) (Leggett, 2010):
(240) Thus, λ depends on the Y:S ratio. For example, the Y:S ratio based on reference values for a male worker is Y:S = 190 µg d−1:76 µg d − 1 = 2.5. The same ratio is derived from reference values for a female worker: Y:S = 130 µg d−1:52 µg d−1 = 2.5. The resulting transfer coefficient based on the above formula is 7.26 d−1. (241) The above formula for the transfer coefficient λ from blood iodide to thyroid iodide is applicable to any combination of Y and S that gives a transfer coefficient of at least 2.5 d−1. For lower derived values, the transfer coefficient is set at 2.5 d−1. This coefficient, together with baseline values for other coefficients, gives a 24-h thyroid content of approximately 12% of the ingested amount. This appears to be a reasonable average value for dietary iodine between 400 and 2000 µg d−1, although considerable variability is seen between individual subjects. (242) The reader is referred to the paper by Leggett (2010) for a more detailed description of the basis for the model structure and parameter values. (c) Model predictions (243) In the following, predictions of time-dependent activities in tissues and fluids are based on the following transfer rates involving stomach and small intestine contents: 20.57 d−1 from stomach contents to small intestine contents as a reference value for adult males for total diet (ICRP, 2006); 6 d−1 from small intestine contents to colon contents (ICRP, 2006); and 594 d−1 from small intestine contents to blood, representing 99% absorption assuming a competing transfer coefficient of 6 d−1 from small intestine contents to colon contents. (244) Figs. 5.3 and 5.4 show observations (symbols) and model predictions (curves) of the distribution of radioiodine in the first few hours after intravenous injection into adult humans. The open circles in these figures represent means for nine healthy young adult males (Hays and Solomon, 1965); variability of measurements was reported as mean coefficients of variation, which were approximately 12% and 23% for blood plasma and thyroid, respectively. The close agreement in Fig. 5.3 between predictions and the open circles is to be expected because the parameter values dominating model predictions in this case were based in part on these data. The triangles in Fig. 5.3 represent median values determined from graphs of data for five to 13 individual euthyroid patients (Berson et al., 1952); individual measurements varied by less than 15% from the estimated medians. The plus signs in Figs. 5.3 and 5.4 were determined from graphs of mean values for nine to 10 euthyroid subjects (Alexander et al., 1971); variability of measurements was not reported. The model predictions shown in Fig. 5.3 are for total blood iodide. The comparison with observed values assumes equilibration between blood plasma and red blood cell water. (245) In Fig. 5.4, the observations are compared with model-generated curves based on three different values of the transfer coefficient from blood to thyroid. This transfer coefficient is derived from Eq. (5.2) and depends on the Y:S ratio, where Y is dietary stable iodine (µg d−1) and S is daily secretion of hormonal iodine by the thyroid (µg d−1). Estimates of Y and S were not reported for the three study groups addressed in Fig. 5.4. The group represented by plus signs (subjects of Alexander et al., 1971) was from a region with relatively low dietary iodine, suggesting a Y:S ratio less than the baseline value 2.5. The transfer coefficient based on a Y:S ratio of 2 yields reasonable agreement with thyroidal uptake data for that group, as well as data for the healthy young adult male subjects of Hays and Solomon (1965). Short-term urinary data for the third group, represented by the single closed circle, indicate mean iodine intake on the order of 200 µg d−1, suggesting a Y:S ratio greater than the baseline value 2.5. The transfer coefficient based on a Y:S ratio of 3 is consistent with mean 2-h thyroidal uptake for that group. (246) Model predictions of the percentage U of ingested radioiodine in the thyroid at 24 h after intake assuming no radioactive decay are compared in Fig. 5.5 with observed values for subjects with different levels E of stable iodine in urine. Model predictions are based on the transfer coefficients in Table 5.1, except that the transfer coefficient from Blood 1 to Thyroid 1 was varied with E, as described by Eq. (5.3), down to a minimum value of 2.5 d−1. For this comparison, the value S was set at the sex-averaged reference value of 64 µg d−1. (247) The model with baseline parameter values predicts that the thyroid contains approximately 29% of ingested or intravenously injected iodine at 24 h after intake, assuming no radioactive decay. The content of the thyroid is predicted to peak at approximately 30% of the ingested or injected amount during the period 24–48 h after intake. (248) Model predictions of the equilibrium content of iodine in the thyroid, concentration of inorganic iodide and organic iodine in blood, and total extrathoracic contents of inorganic iodide and organic iodide are listed in Table 5.5 for different combinations of dietary iodine Y and thyroidal secretion rate S. The predicted values for each of these quantities based on reference values for dietary stable iodine Y and secretion rate of hormonal iodine S for women, total adult population, and men (see the first three columns of model predictions) are within the ranges of reported values for euthyroid subjects. For example, predictions of the mass of iodide in the thyroid at equilibrium are 6.00, 7.39, and 8.77 g, compared with typical values of 5–15 mg. Predictions of the concentration of organic iodine in blood plasma are 3.9–5.8 µg dL−1, compared with commonly reported values of 3–8 µg dL−1. Baseline parameter values for the biokinetic model for systemic iodine, applicable to a reference worker. Depends on the Y:S ratio, where Y (µg d−1) is dietary intake of stable iodine and S (µg d−1) is the rate of secretion of hormonal stable iodine by the thyroid. For dosimetric purposes, each of the compartments Other 1, Other 2, Other 3, and Other 4 are assumed to be uniformly distributed in all remaining (not explicitly identified) tissues. For high intake of stable iodine, the outflow from Thyroid 2 is split between Blood 2 and Blood 1 as described by Leggett (2010). Non-zero only for high intake of stable iodine (Leggett, 2010). Model predictions of mass or concentration of iodine in tissues and fluids at equilibrium. Baseline transfer coefficient describing thyroidal uptake (7.26 d−1) is applied because the ratio of daily intake of iodine Y to daily thyroidal secretion S is 2.5. Transfer coefficient from blood iodide to thyroid iodide is 5.96 d−1 based on Eq. (5.2).

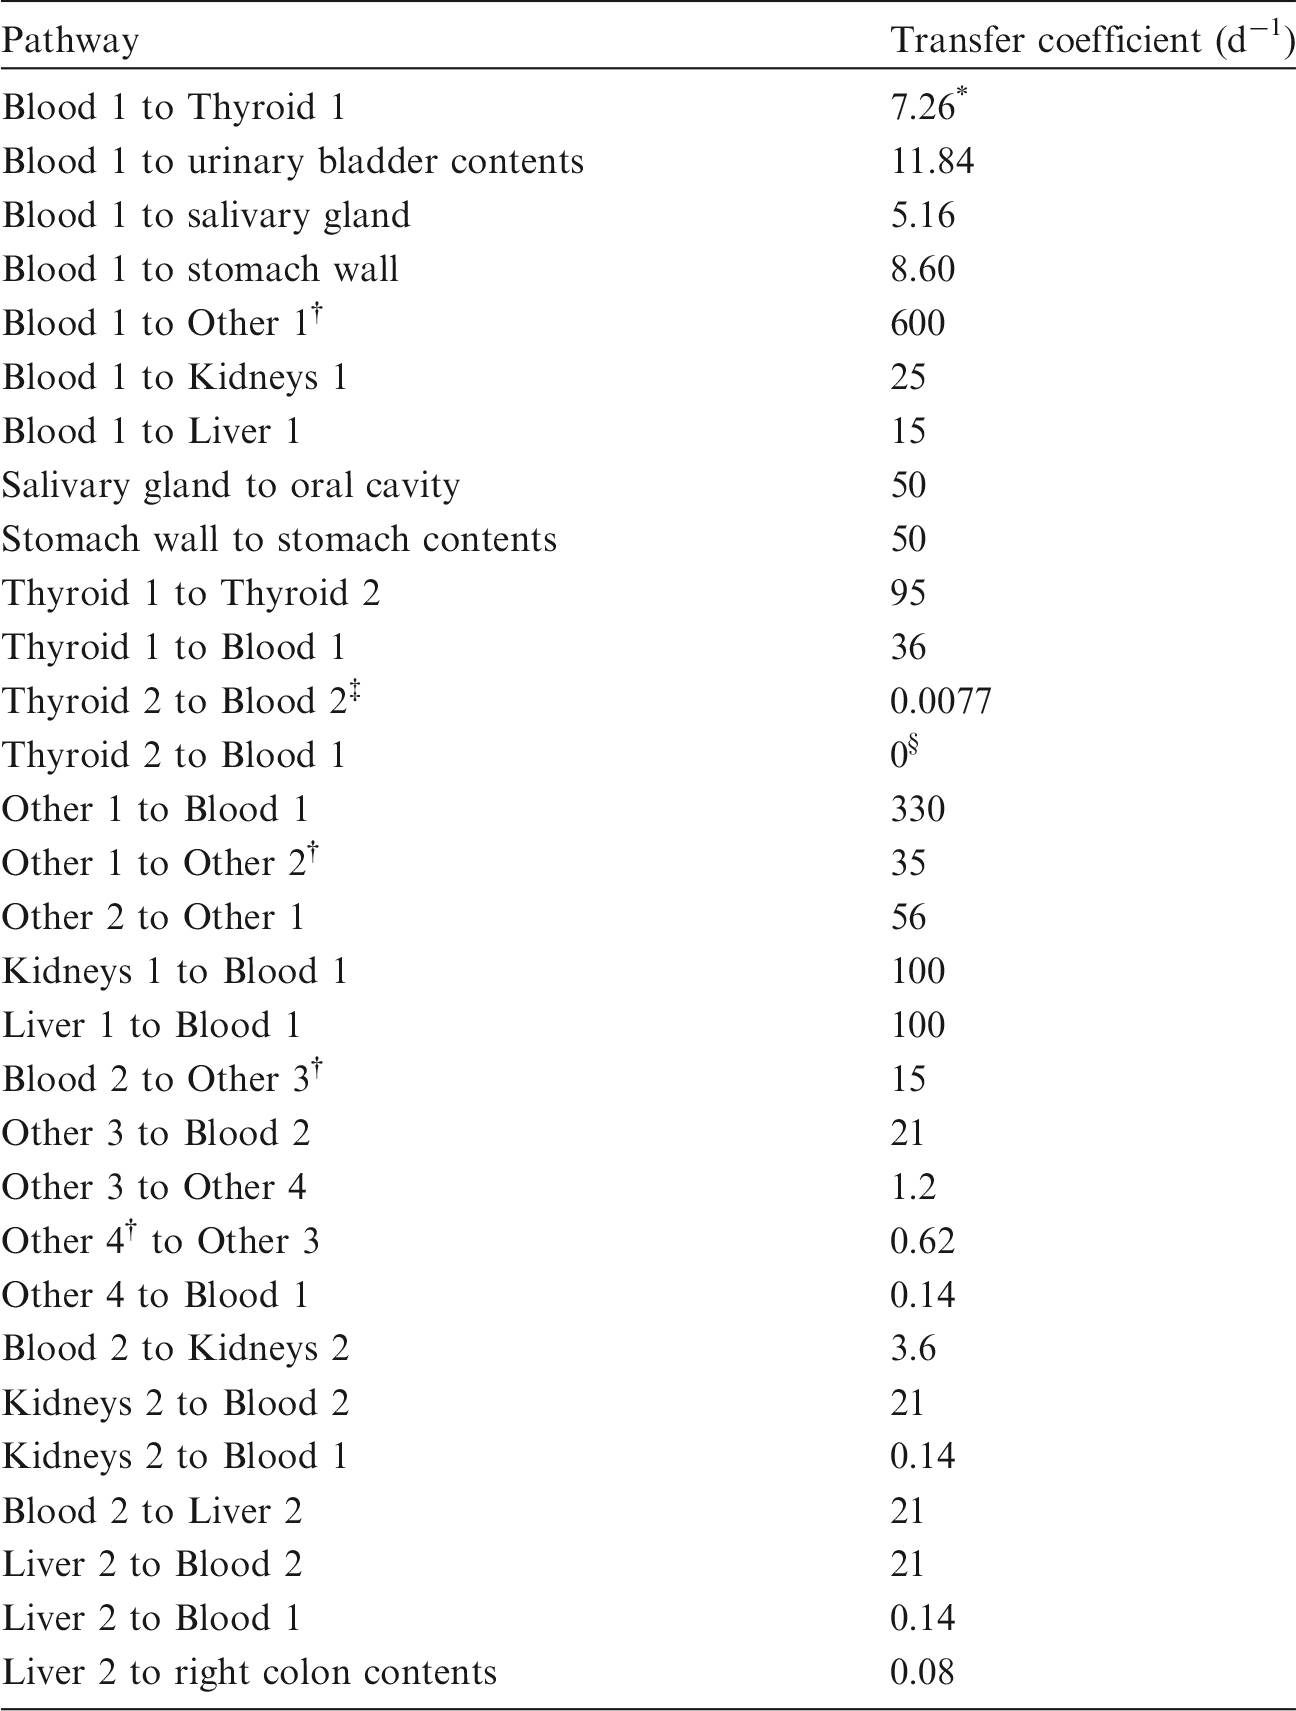

5.2.3.3. Treatment of radioactive progeny
(249) Chain members addressed in the derivation of dose coefficients for iodine isotopes are isotopes of iodine, tellurium, antimony, or xenon. In the iodine chains considered here, iodine, tellurium, or xenon isotopes are produced by decay of the iodine parent, and in some cases, antimony isotopes subsequently arise as progeny of tellurium isotopes. Tellurium, antimony, or iodine atoms produced in vivo following intake of iodine are assumed to follow the characteristic models for these elements (i.e. the models applied in this publication to these elements as parent radionuclides) from their time of production. The implementation of this assumption is not always straightforward. In some cases, the site of production of antimony or tellurium may not be clearly identifiable with a specific compartment in its characteristic biokinetic model due to differences in model structures for the different elements. In such cases, a transfer rate from the site of production of the radionuclide to the central blood compartment in the radionuclide’s characteristic model has been assigned as described below. After reaching its central blood compartment, the radionuclide is assumed to behave as described by its characteristic model. (250) Tellurium atoms produced in the blood iodide compartment of the iodine model are assigned to the plasma compartment (Blood 1) of the tellurium model. Tellurium atoms produced in the blood organic iodine compartment of the iodine model are assumed to transfer to Blood 1 at the rate 1000 d−1. Tellurium atoms produced at soft tissue sites in the iodine model are assumed to transfer to Blood 1 at the rate 0.0693 d−1 (t1/2 = 10 d), which is the rate of removal from all soft tissue compartments in the characteristic model for tellurium. (251) Antimony produced in the blood iodide compartment of the model for iodine or the plasma compartment of the model for tellurium (Blood 1) is assigned to plasma in the model for antimony. Antimony produced in the blood organic iodine compartment of the iodine model is assumed to transfer to plasma at the rate 1000 d−1. Antimony produced at any soft tissue site in the iodine or tellurium model is assumed to transfer to plasma at the rate 0.693 d−1 (t1/2 = 1 d), which is the highest rate of removal from soft tissue compartments in the characteristic model for antimony. Antimony produced in a bone compartment of the tellurium model is assumed to behave as if entering that site as a parent radionuclide. (252) A generic biokinetic model is applied in this publication to xenon isotopes produced by decay of radionuclides in systemic pools. Xenon produced in bone is assumed to transfer to blood at the rate 100 d−1 if produced in bone surfaces and 0.36 d−1 if produced in bone volume. These rates are taken from the model for radon introduced in Publication 67 (ICRP, 1993). Xenon produced in a soft tissue compartment is assumed to transfer to blood with a half-time of 20 min. Xenon produced in the blood inorganic iodide compartment is assigned to the blood compartment of the xenon model. Xenon produced in the blood organic iodine compartment is assumed to transfer to blood in the xenon model at the rate 1000 d−1. Xenon entering the blood compartment of the xenon model or produced in that compartment is assumed to be exhaled at the rate 1000 d−1.
5.3. Individual monitoring
5.3.1. 125I
(253) Thyroid monitoring is generally used for the monitoring of 125I. The urinary excretion rate decreases rapidly with time following intake, and so thyroid monitoring is to be preferred unless the actual time of intake is known. (254) High-purity germanium detectors, in the thyroid counting configuration, should preferably be used because of the low-energy photon emission from 125I. Model predictions of clearance of intravenously injected radioiodine from plasma compared with central values determined in three studies.
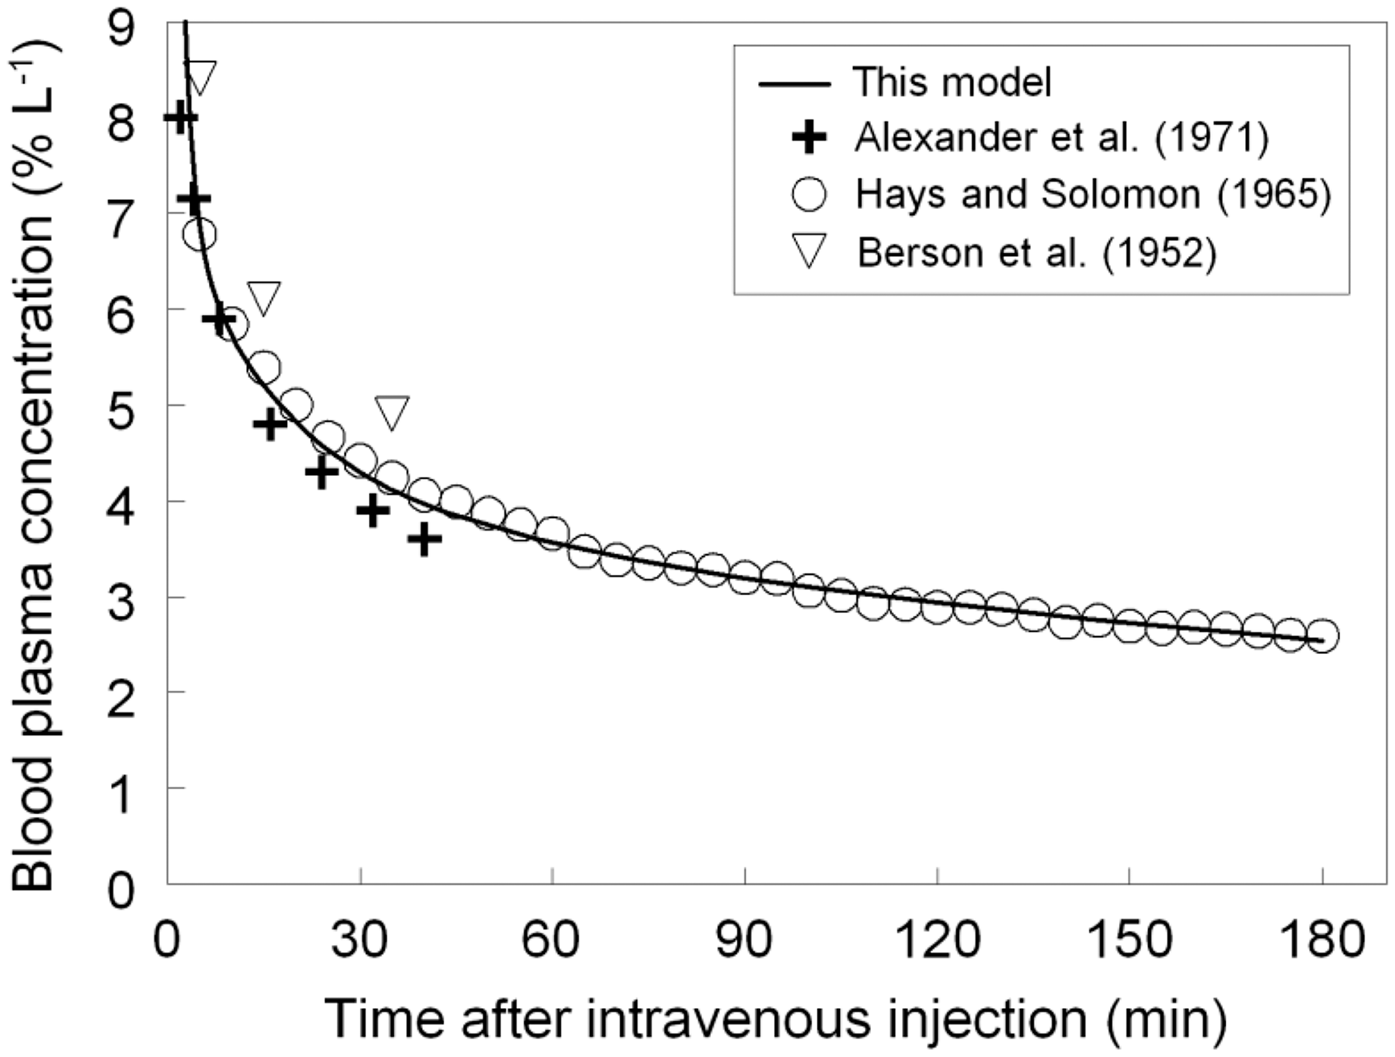
5.3.2. 129I
(255) Thyroid monitoring is generally used for the monitoring of 129I. The urinary excretion rate decreases rapidly with time following intake, and so thyroid monitoring is to be preferred unless the actual time of intake is known. (256) Ge (HP) detectors, in the thyroid measurement configuration, should preferably be used because of the low-energy photon emission from 129I.
5.3.3. 131I
(257) In-vivo monitoring of the thyroid is the preferential method of monitoring 131I exposures. 131I can be readily detected using a NaI detector or a germanium detector system. Urinary monitoring is also a reliable method of monitoring for radioiodine. The urinary excretion rate decreases rapidly with time following intake, and so thyroid monitoring is to be preferred unless the actual time of intake is known. Use of both measurements, where feasible, can increase confidence in estimated doses. (258) Although not common in routine monitoring, whole-body measurement is also feasible in special situations (e.g. when thyroid is blocked).
5.4. Dosimetric data for iodine
Model predictions of thyroidal uptake of intravenously injected 131I compared with mean values of external measurements for three study groups. Y, dietary stable iodine; S, rate of secretion of stable iodine by the thyroid. Model predictions and observations of 24-h uptake of radioiodine by thyroid (U) as a function of daily urinary excretion of stable iodine (E). S, rate of secretion of stable iodine by the thyroid. Source: Leggett (2010). Thyroid content and daily urinary excretion of 125I following inhalation of 1 Bq elemental iodine. Thyroid content and daily urinary excretion of 125I following inhalation of 1 Bq methyl or ethyl iodide. Thyroid content and daily urinary excretion of 125I following inhalation of 1 Bq Type F. Thyroid content and daily urinary excretion of 125I following inhalation of 1 Bq Type M. Thyroid content and daily urinary excretion of 125I following inhalation of 1 Bq Type S. Thyroid content and daily urinary excretion of 129I following inhalation of 1 Bq elemental iodine. Thyroid content and daily urinary excretion of 129I following inhalation of 1 Bq methyl or ethyl iodide. Thyroid content and daily urinary excretion of 129I following inhalation of 1 Bq Type F. Thyroid content and daily urinary excretion of 129I following inhalation of 1 Bq Type M. Thyroid content and daily urinary excretion of 129I following inhalation of 1 Bq Type S. Total body and thyroid content, and daily urinary excretion of 131I following inhalation of 1 Bq elemental iodine. Total body and thyroid content, and daily urinary excretion of 131I following inhalation of 1 Bq methyl or ethyl iodide. Total body and thyroid content, and daily urinary excretion of 131I following inhalation of 1 Bq Type F. Total body and thyroid content, and daily urinary excretion of 131I following inhalation of 1 Bq Type M. Total body and thyroid content, and daily urinary excretion of 131I following inhalation of 1 Bq Type S. Monitoring techniques for 125I. Monitoring techniques for 129I. Monitoring techniques for 131I. Committed effective dose coefficients (Sv Bq−1) for the inhalation or ingestion of 125I, 129I, and 131I compounds. AMAD, activity median aerodynamic diameter. Dose per activity content of 125I in thyroid and in daily excretion of urine (Sv Bq−1); 5-µm activity median aerodynamic diameter aerosols inhaled by a reference worker at light work. Dose per activity content of 129I in thyroid and in daily excretion of urine (Sv Bq−1); 5-µm activity median aerodynamic diameter aerosols inhaled by a reference worker at light work. Dose per activity content of 131I in total body, thyroid, and in daily excretion of urine (Sv Bq−1); 5-µm activity median aerodynamic diameter aerosols inhaled by a reference worker at light work. NA, not applicable. Isotopes of caesium addressed in this publication. EC, electron-capture decay; B+, beta-plus decay; B−, beta-minus decay; IT, isomeric transition decay. Dose coefficients and bioassay data for these radionuclides are given in the printed copy of this publication. Data for other radionuclides listed in this table are given in the accompanying electronic annex. Absorption parameter values for inhaled and ingested caesium. It is assumed that the bound state can be neglected for caesium, i.e. fb = 0.0. The value of sr for Type F forms of caesium (100 d–1) is element-specific. The values for Types M and S (3 d–1) are the general default values. Materials (e.g. caesium chloride) are generally listed here where there is sufficient information to assign to a default absorption type, but not to give specific parameter values (see text). For inhaled material deposited in the respiratory tract and subsequently cleared by particle transport to the alimentary tract, the default fA values for inhaled materials are applied; i.e. the product of fr for the absorption type (or specific value where given) and the fA value for ingested soluble forms of caesium (1.0). Default Type M is recommended for use in the absence of specific information on which the exposure material can be assigned to an absorption type; for example, if the form is unknown, or if the form is known but there is no information available on the absorption of that form from the respiratory tract. Activity transferred from systemic compartments into segments of the alimentary tract is assumed to be subject to re-absorption to blood. The default absorption fraction fA for the secreted activity is the highest value for any form of the radionuclide (fA = 1). Transfer coefficients for the model for systemic caesium. Reference distribution of cardiac output and steady-state distribution of stable caesium in an adult male.
*
Based on estimates of Leggett et al. (2003). Values for gastrointestinal tissue compartments based on estimate for total gastrointestinal tissue and mass fractions of individual tissues. Division of skeletal caesium based on a review by Williams and Leggett (1987). Sum of contents of stomach, small intestine, right colon, left colon, and rectosigmoid colon. In the model, all caesium in bone is assumed to reside on bone surfaces. In the model, other is divided into compartments Other 1 and Other 2, with fast and slow exchange with plasma, respectively. Other 1 receives 5.498% of cardiac output and contains 2.55% of total-body caesium at equilibrium. Other 2 receives 0.002% of cardiac output and contains 0.5% of total-body caesium at equilibrium. Monitoring techniques for 134Cs. Lung monitoring of 134Cs is not generally used in routine monitoring of workers. Monte Carlo program Visual Monte Carlo was used to simulate the photon emission, to calculate the calibration factor for the geometry and radionuclide, and to calculate the detection limit in the lung. (Hunt et al., 2012) Monitoring techniques for 137Cs. Lung monitoring of 134Cs is not generally used in routine monitoring of workers. Monte Carlo program Visual Monte Carlo was used to simulate the photon emission, to calculate the calibration factor for the geometry and radionuclide, and to calculate the detection limit in the lung (Hunt et al., 2012). Detection limit values presented in this table refer to shielded room. Committed effective dose coefficients (Sv Bq−1) for the inhalation or ingestion of 134Cs and 137Cs compounds. AMAD, activity median aerodynamic diameter. Dose per activity content of 134Cs in total body, lungs, and in daily excretion of urine (Sv Bq−1); 5-µm activity median aerodynamic diameter aerosols inhaled by a reference worker at light work. Dose per activity content of 137Cs (137mBa measured) in total body, lungs, and in daily excretion of urine (Sv Bq−1); 5-µm activity median aerodynamic diameter aerosols inhaled by a reference worker at light work. Isotopes of barium addressed in this publication. EC, electron-capture decay; B+, beta-plus decay; B−, beta-minus decay; IT, isomeric transition decay. Dose coefficients and bioassay data for these radionuclides are given in the printed copy of this publication. Data for other radionuclides listed in this table are given in the accompanying electronic annex.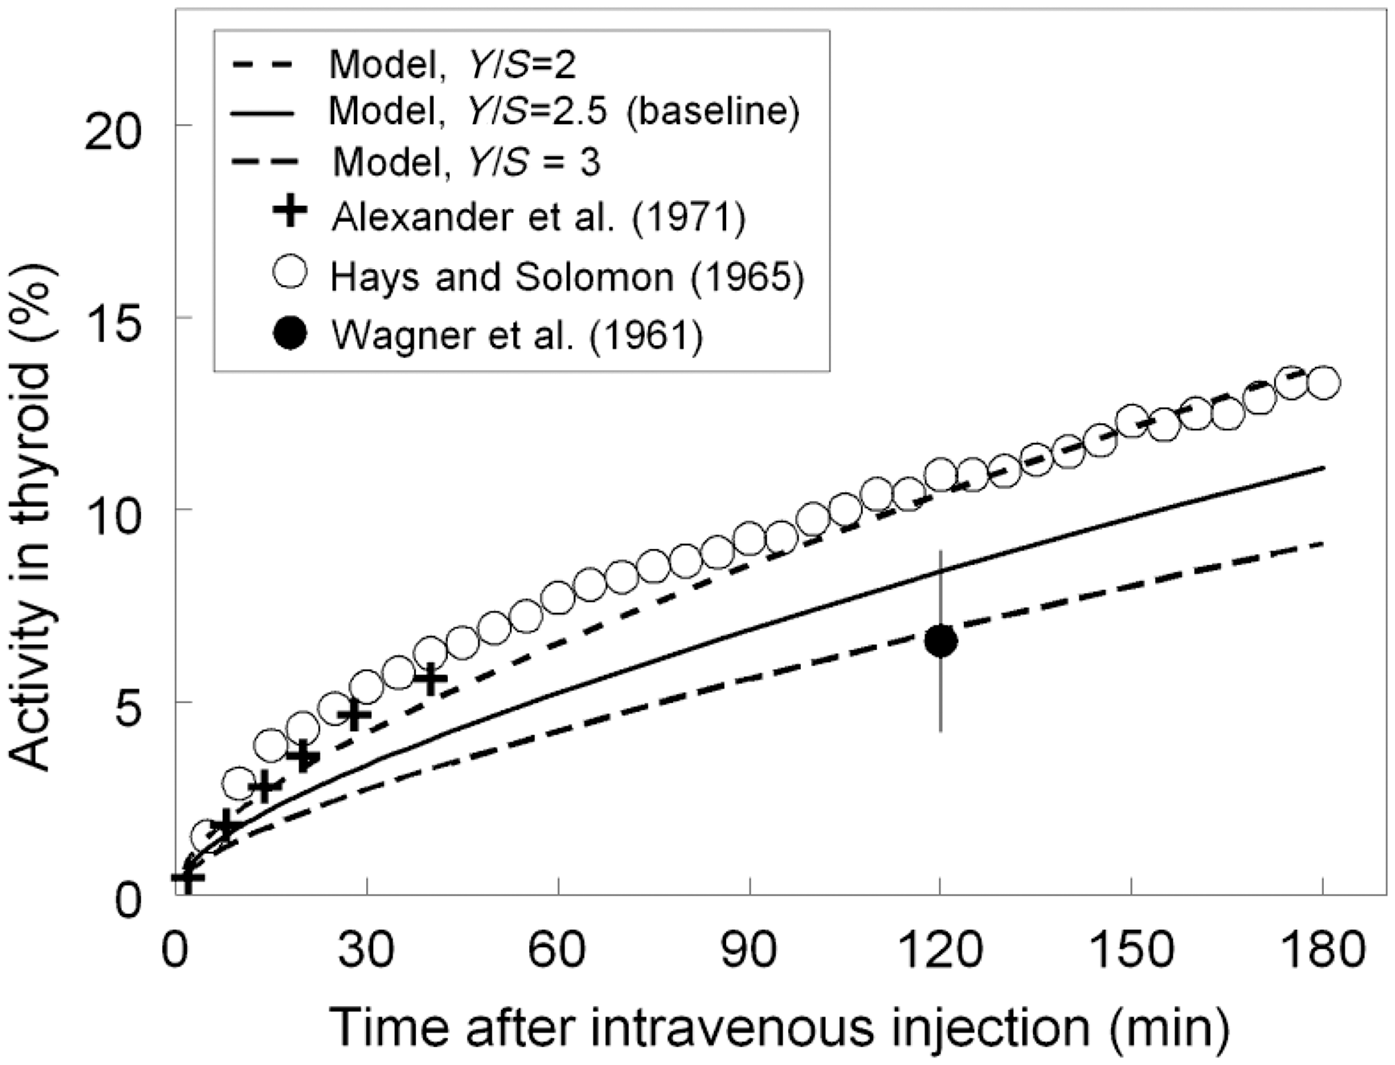
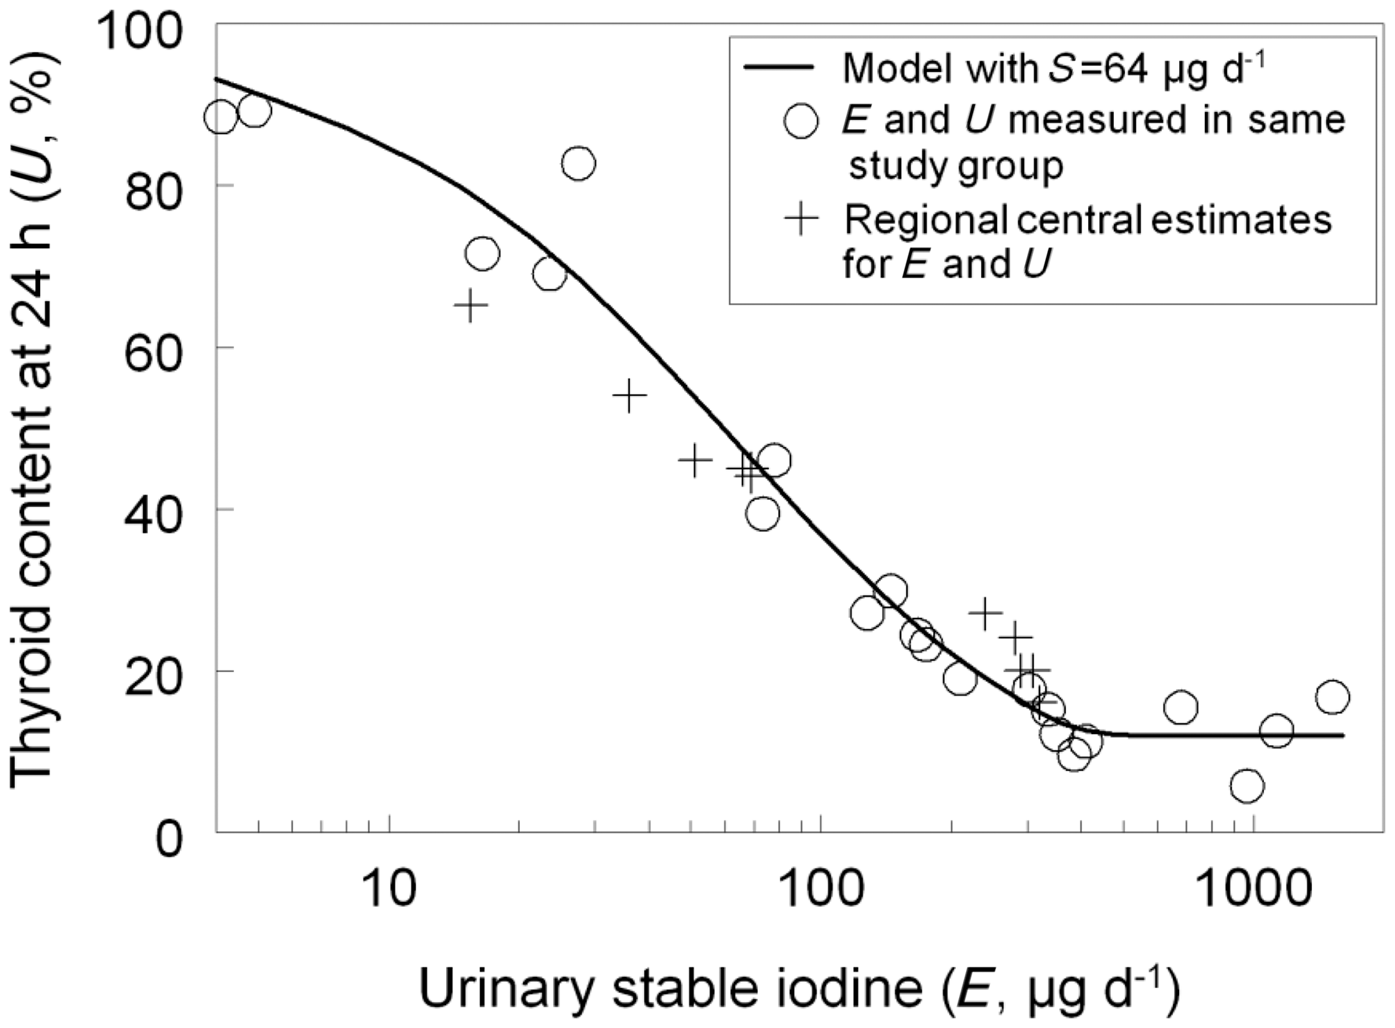
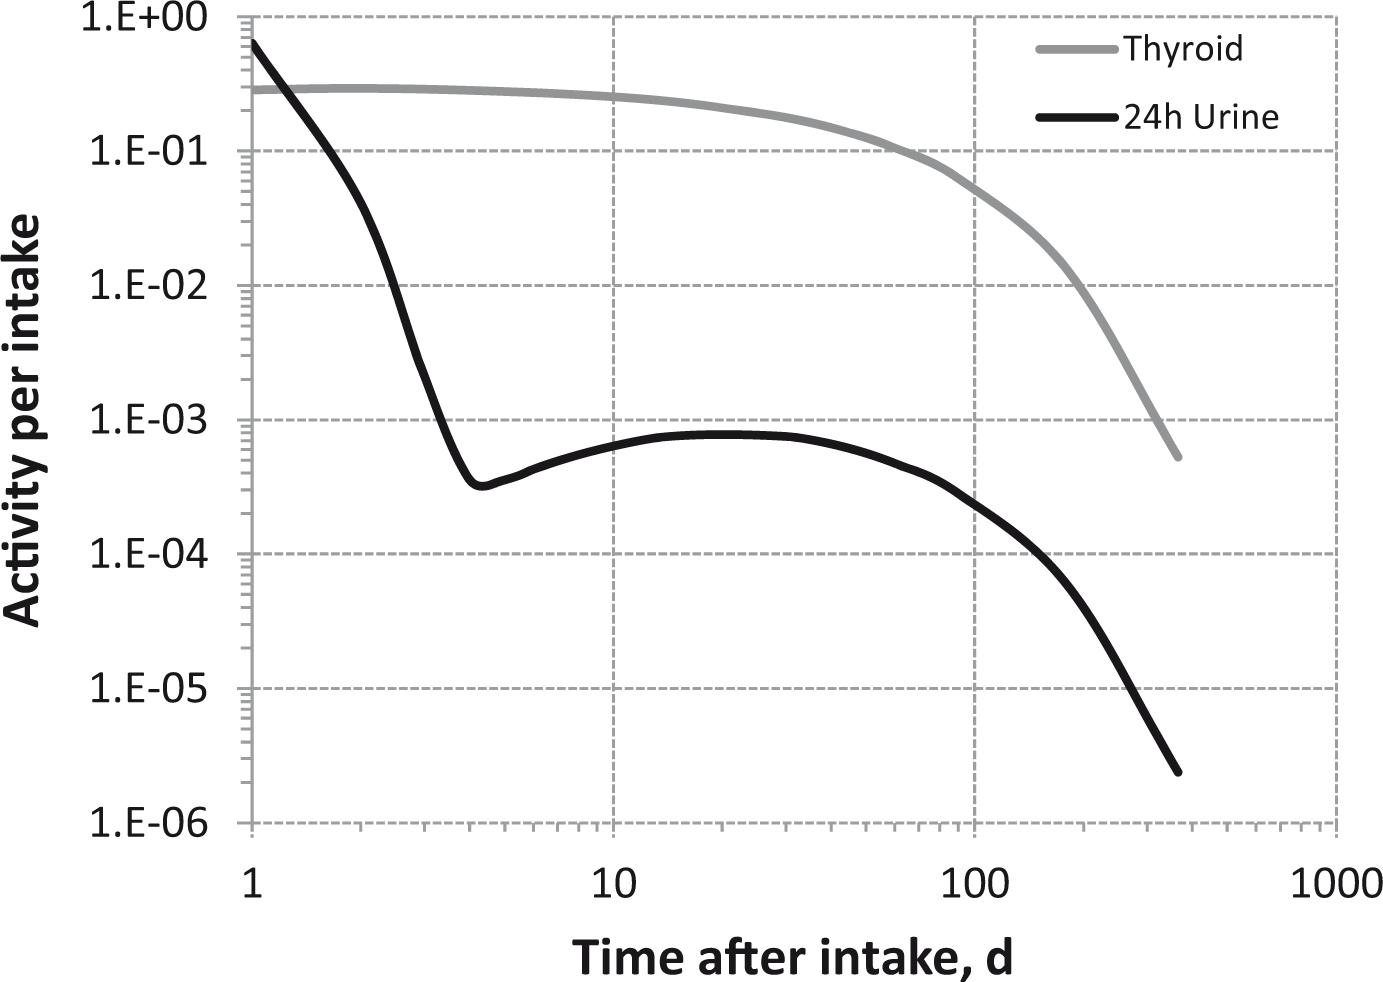
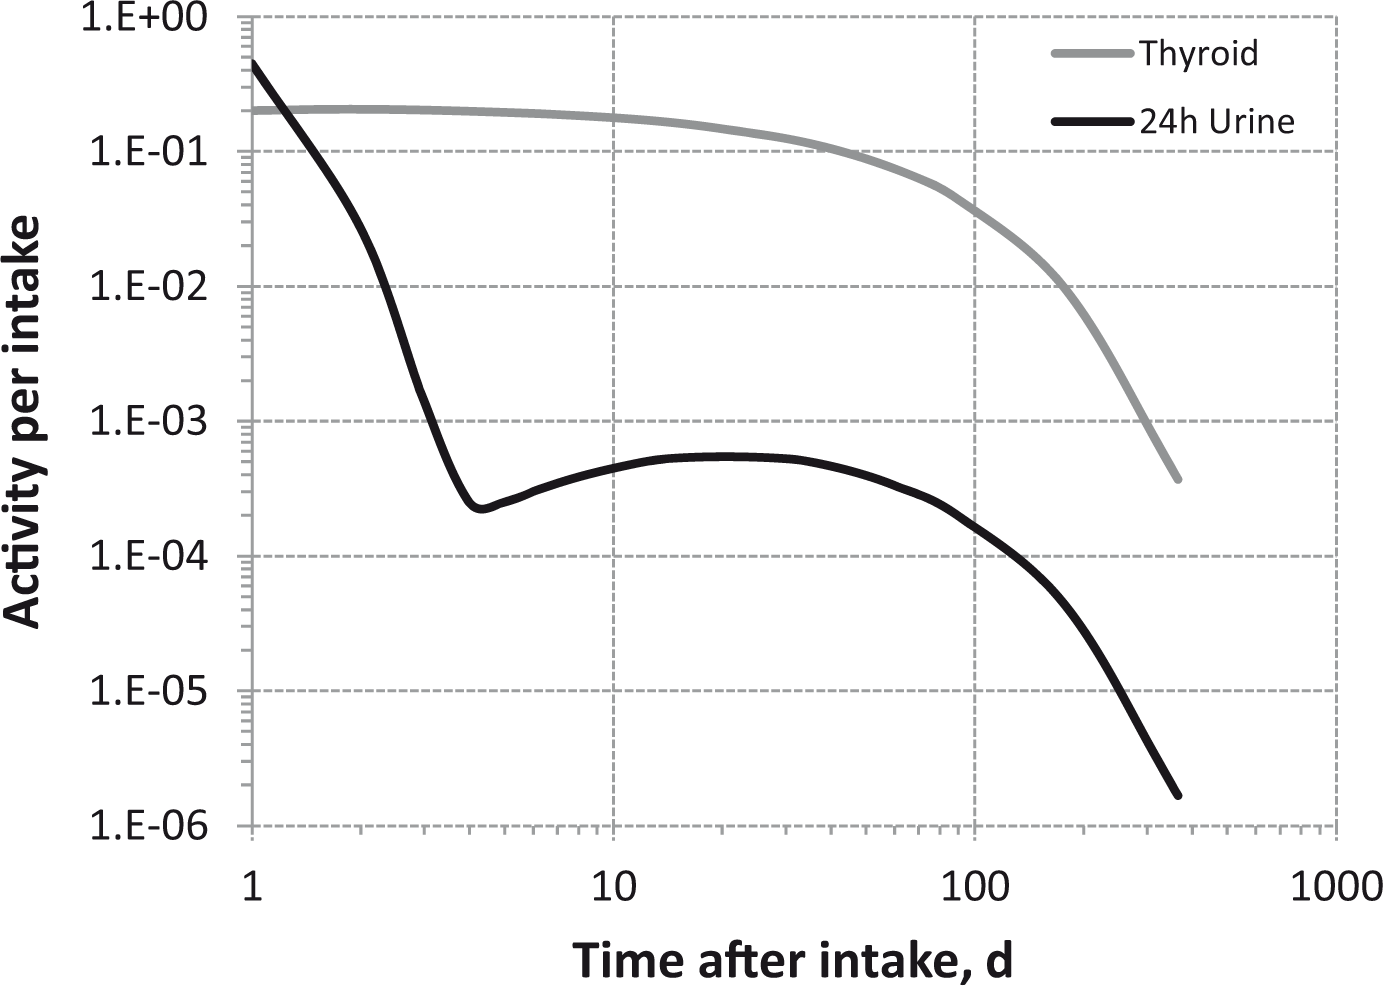


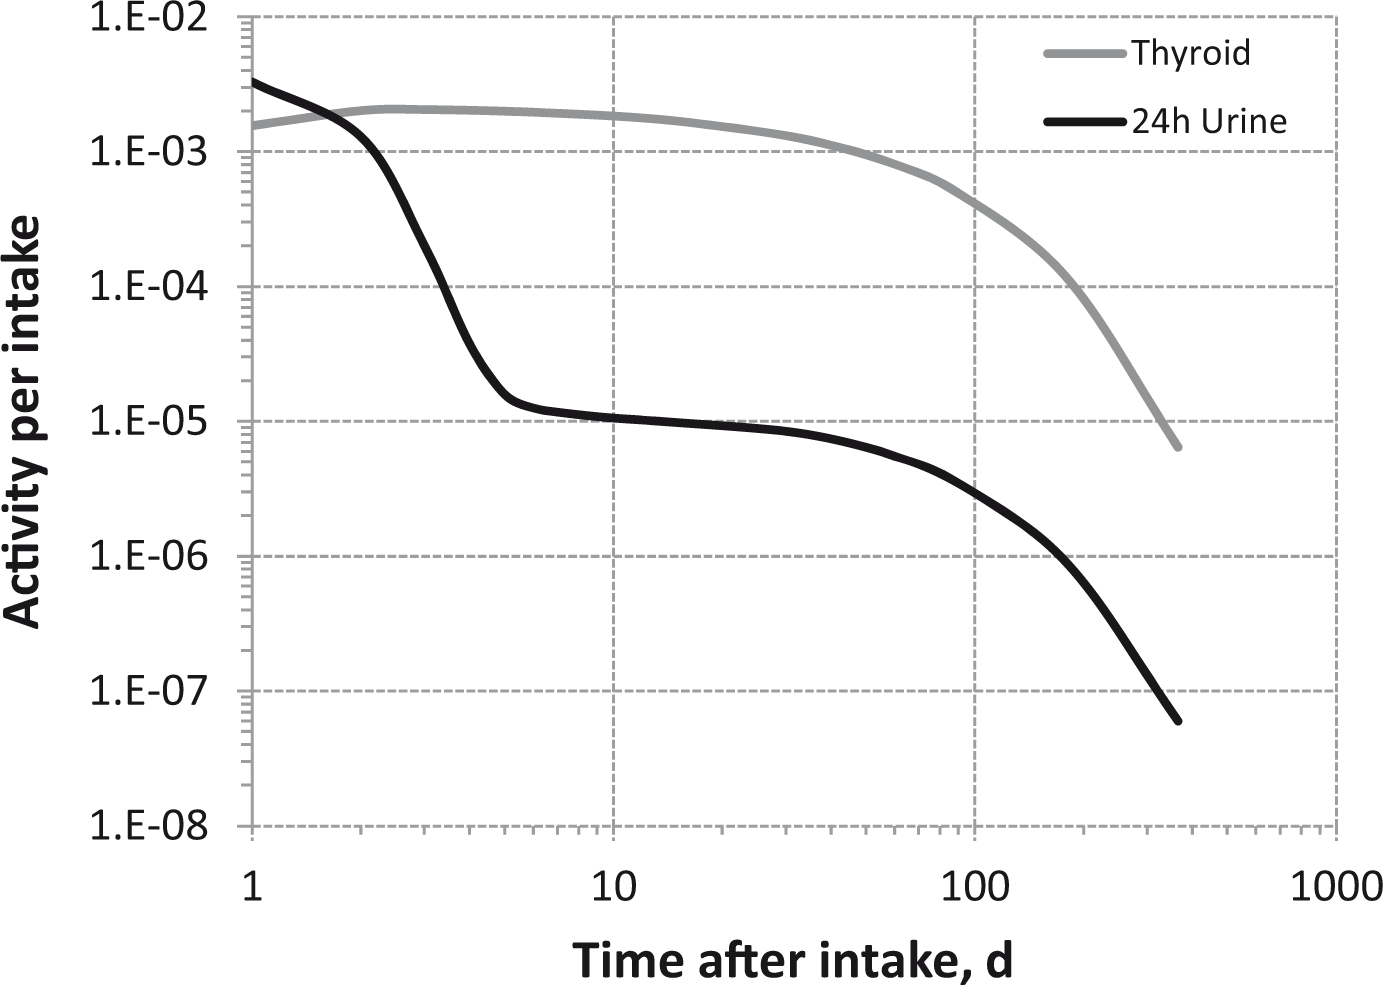


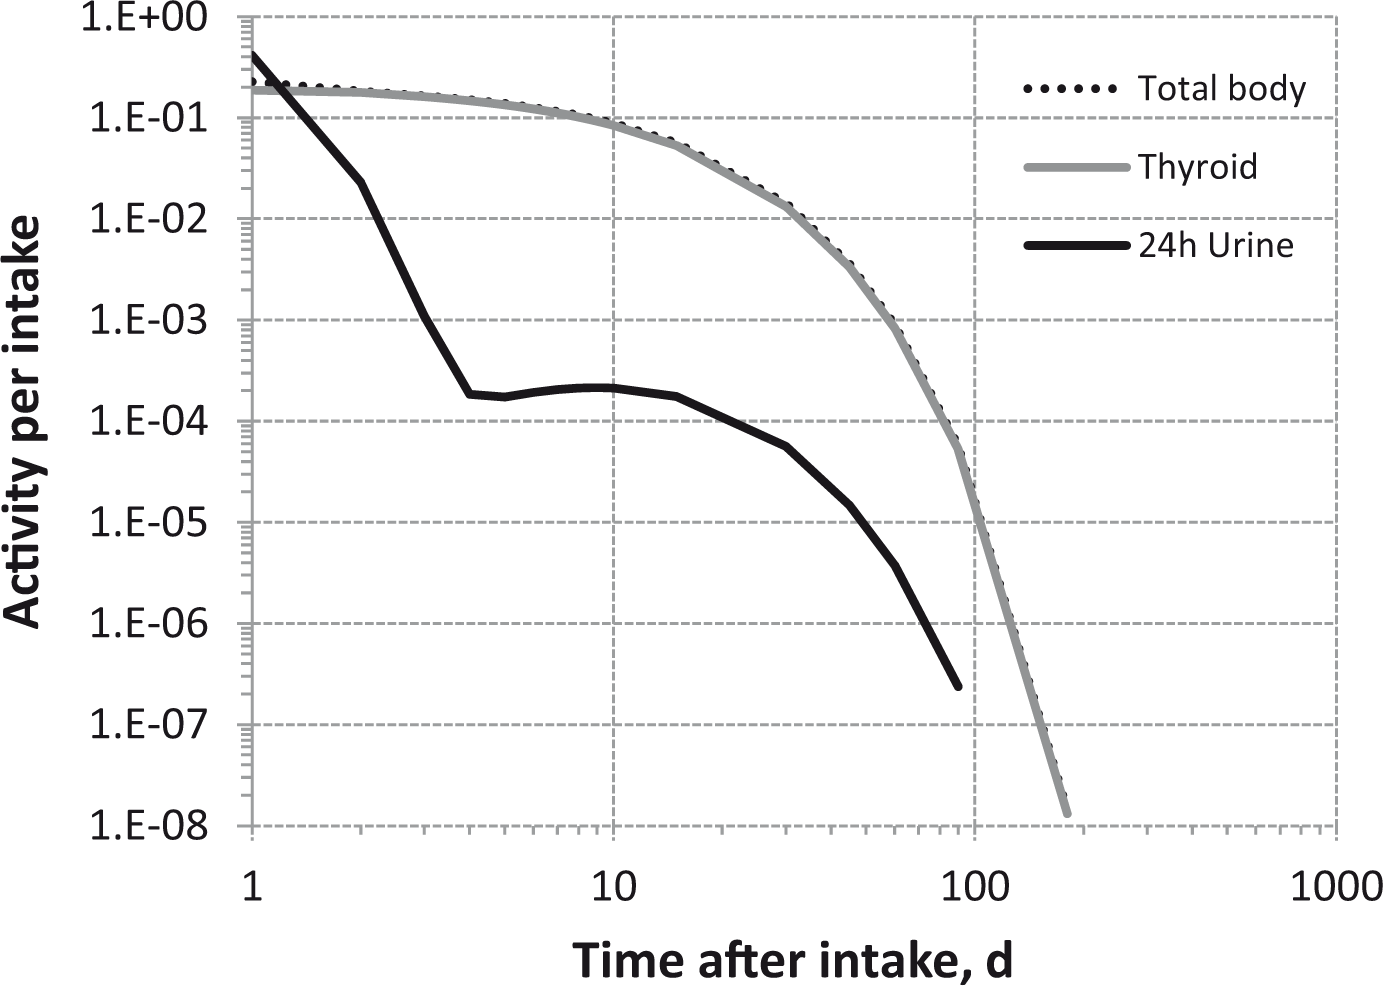

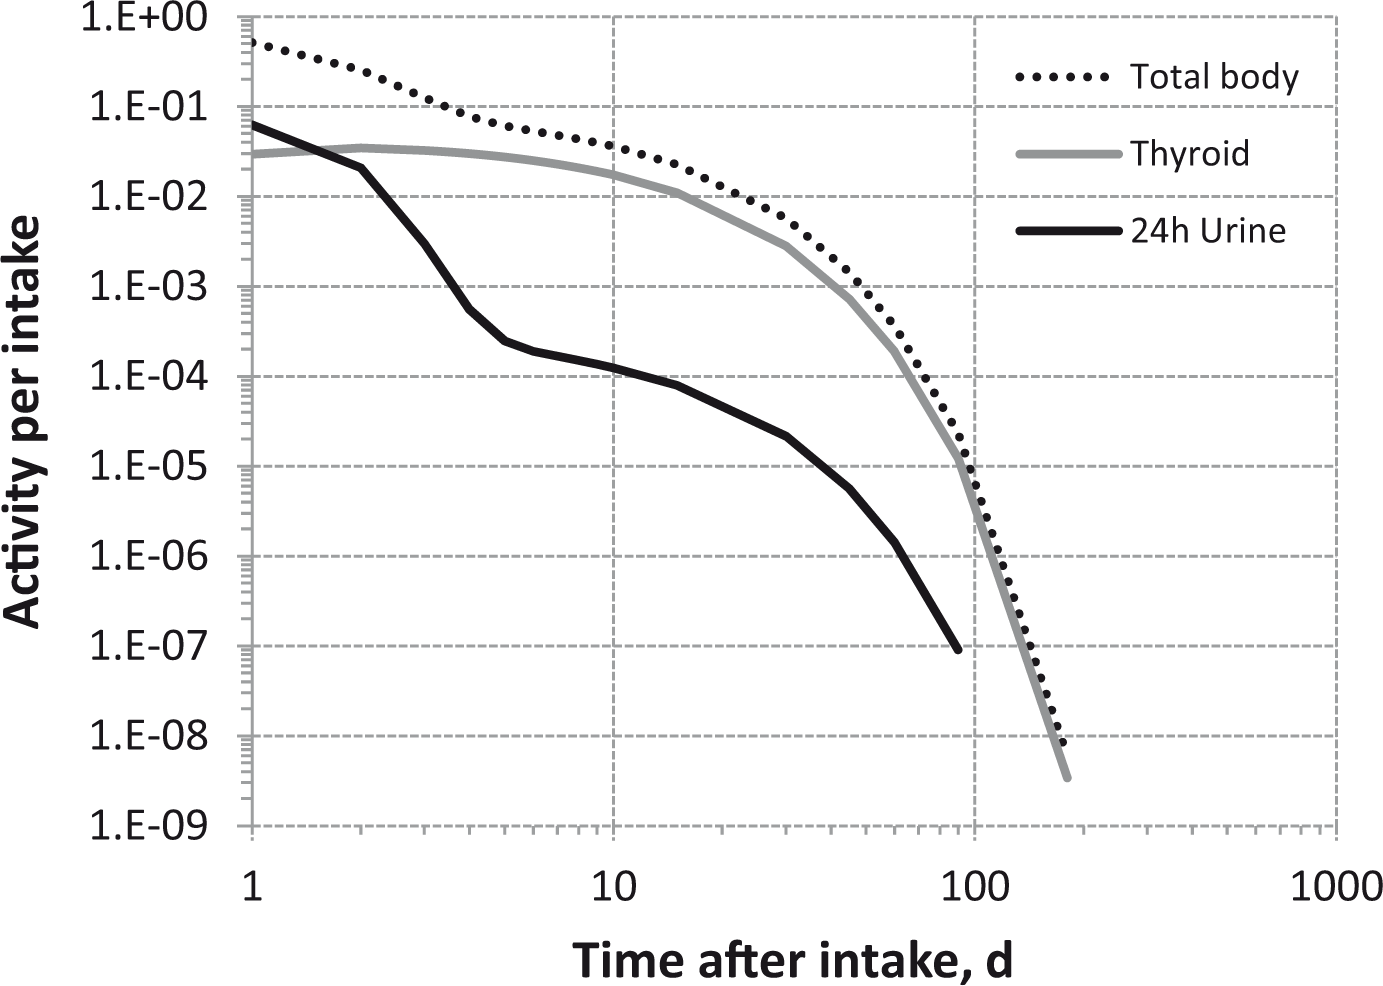
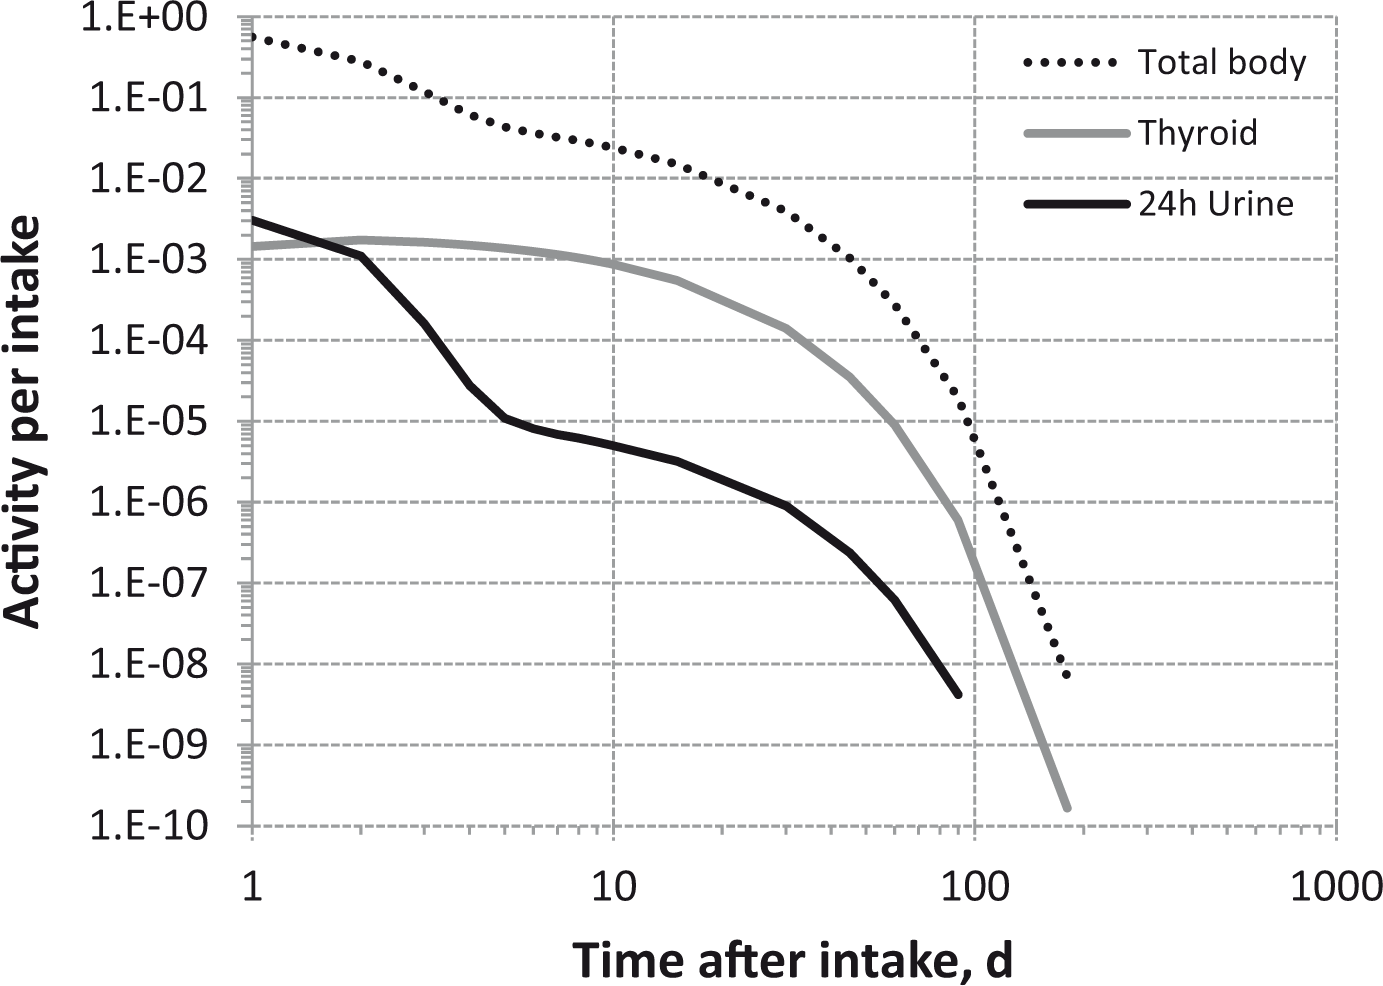
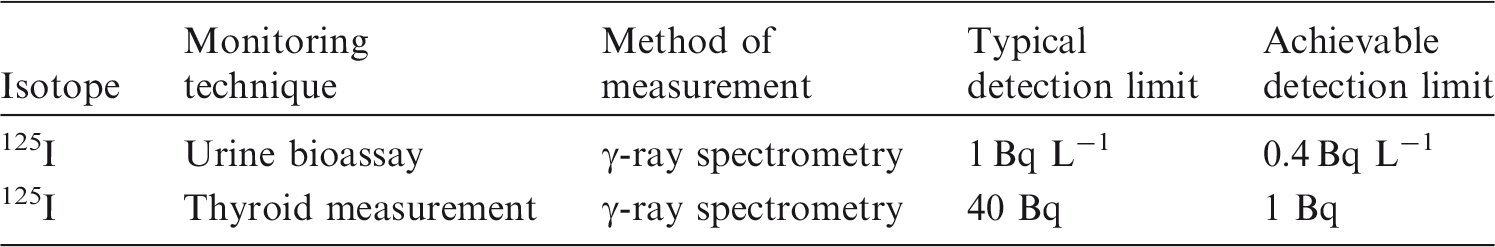
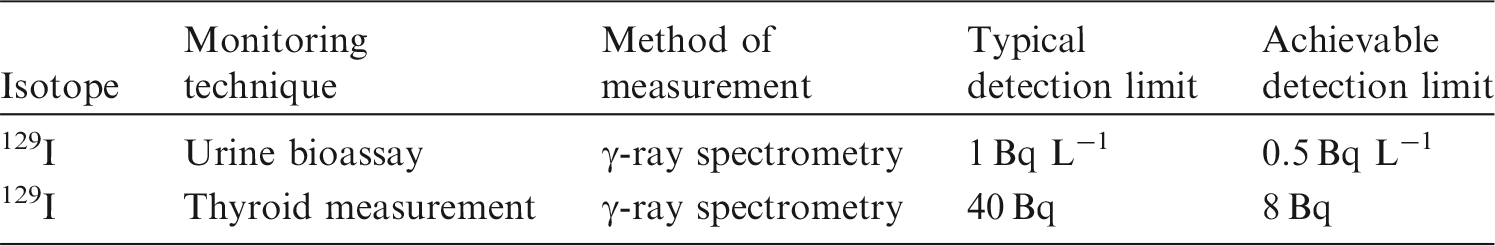


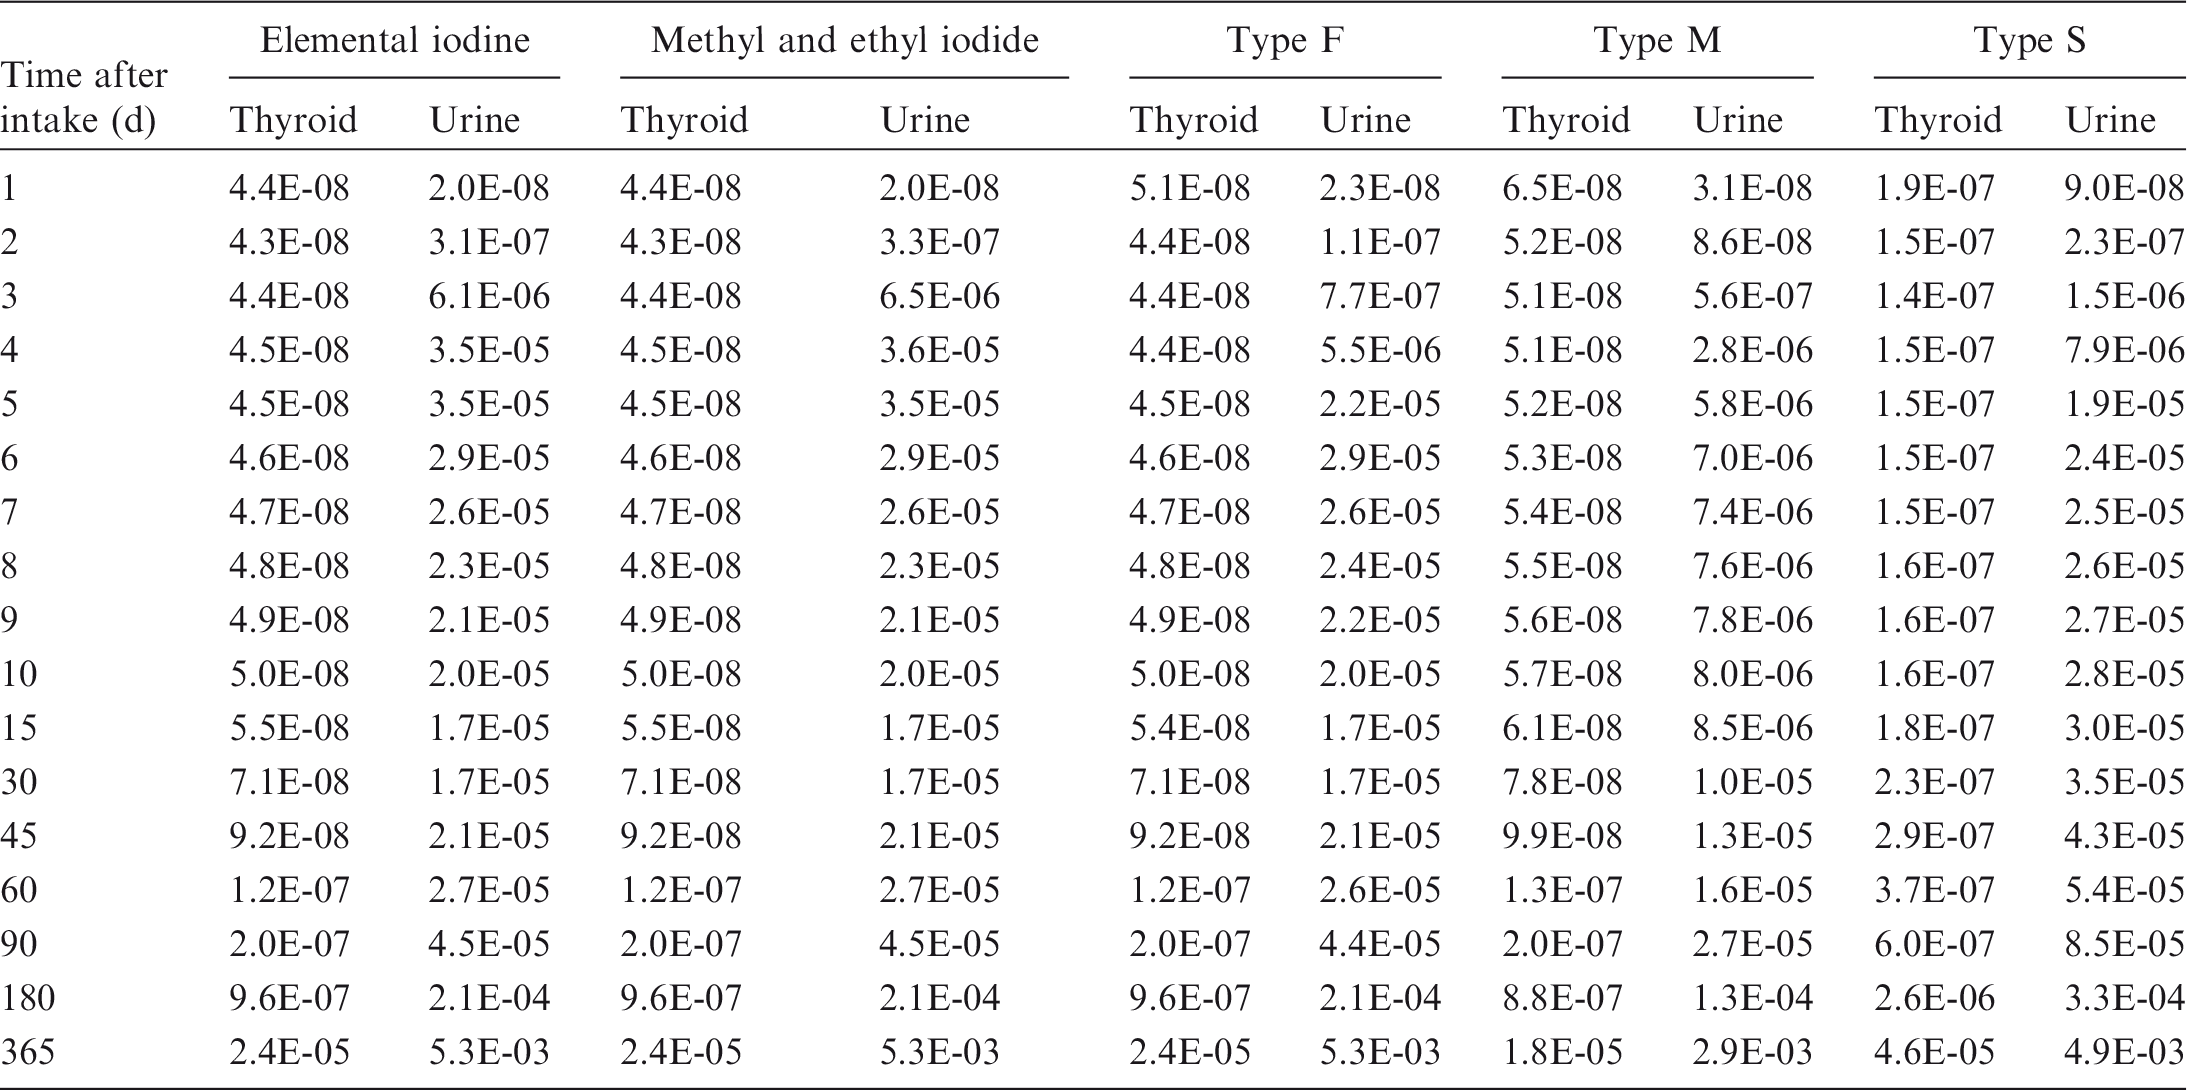


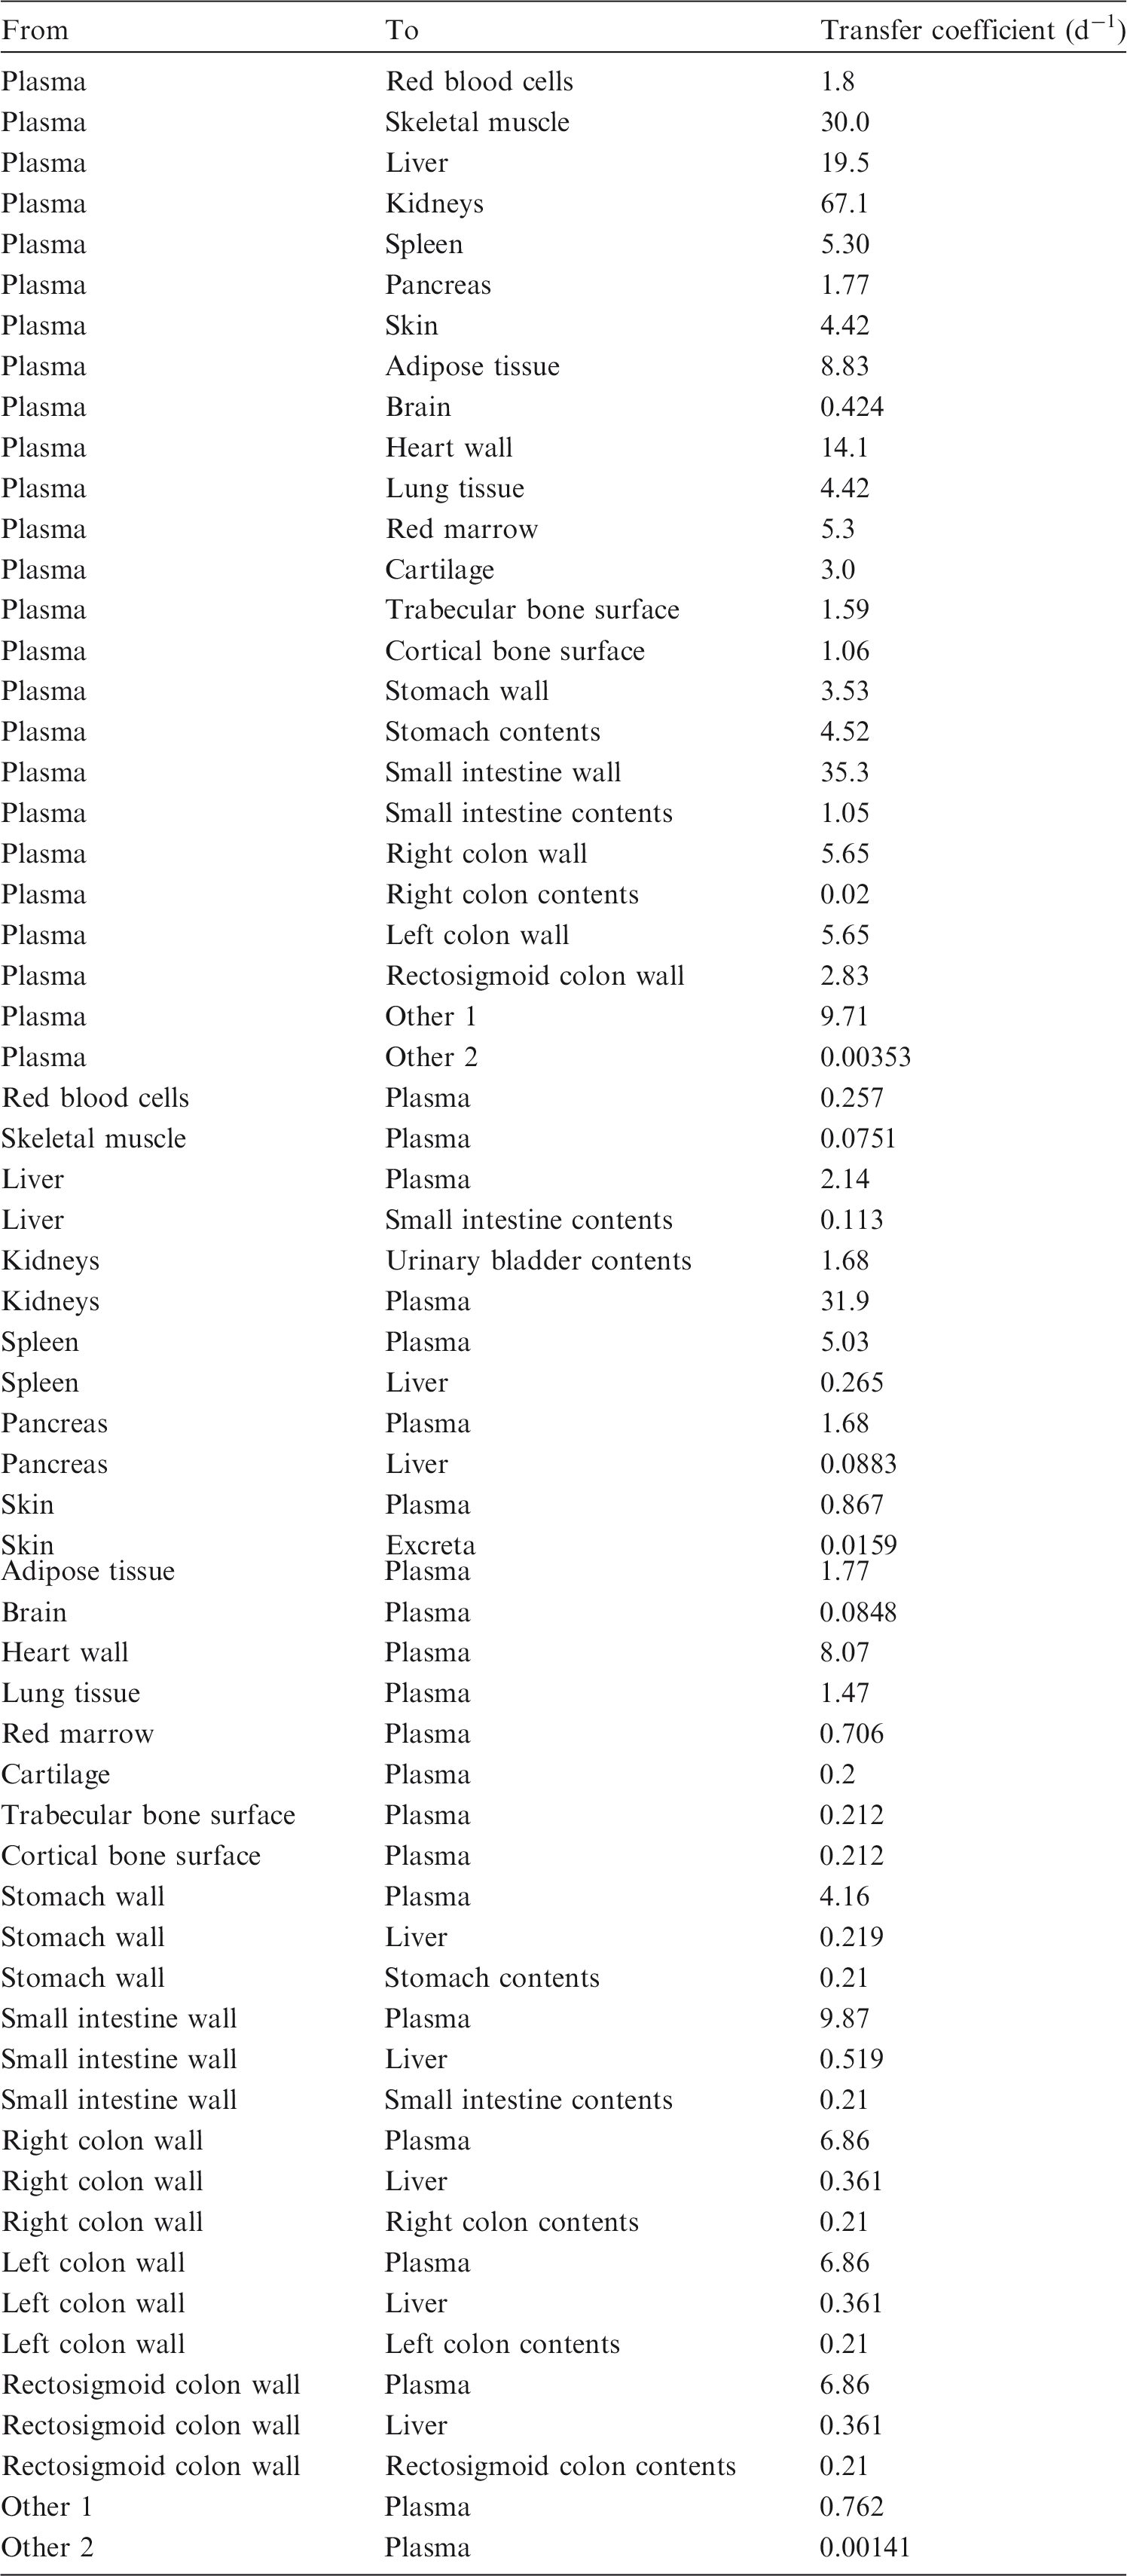


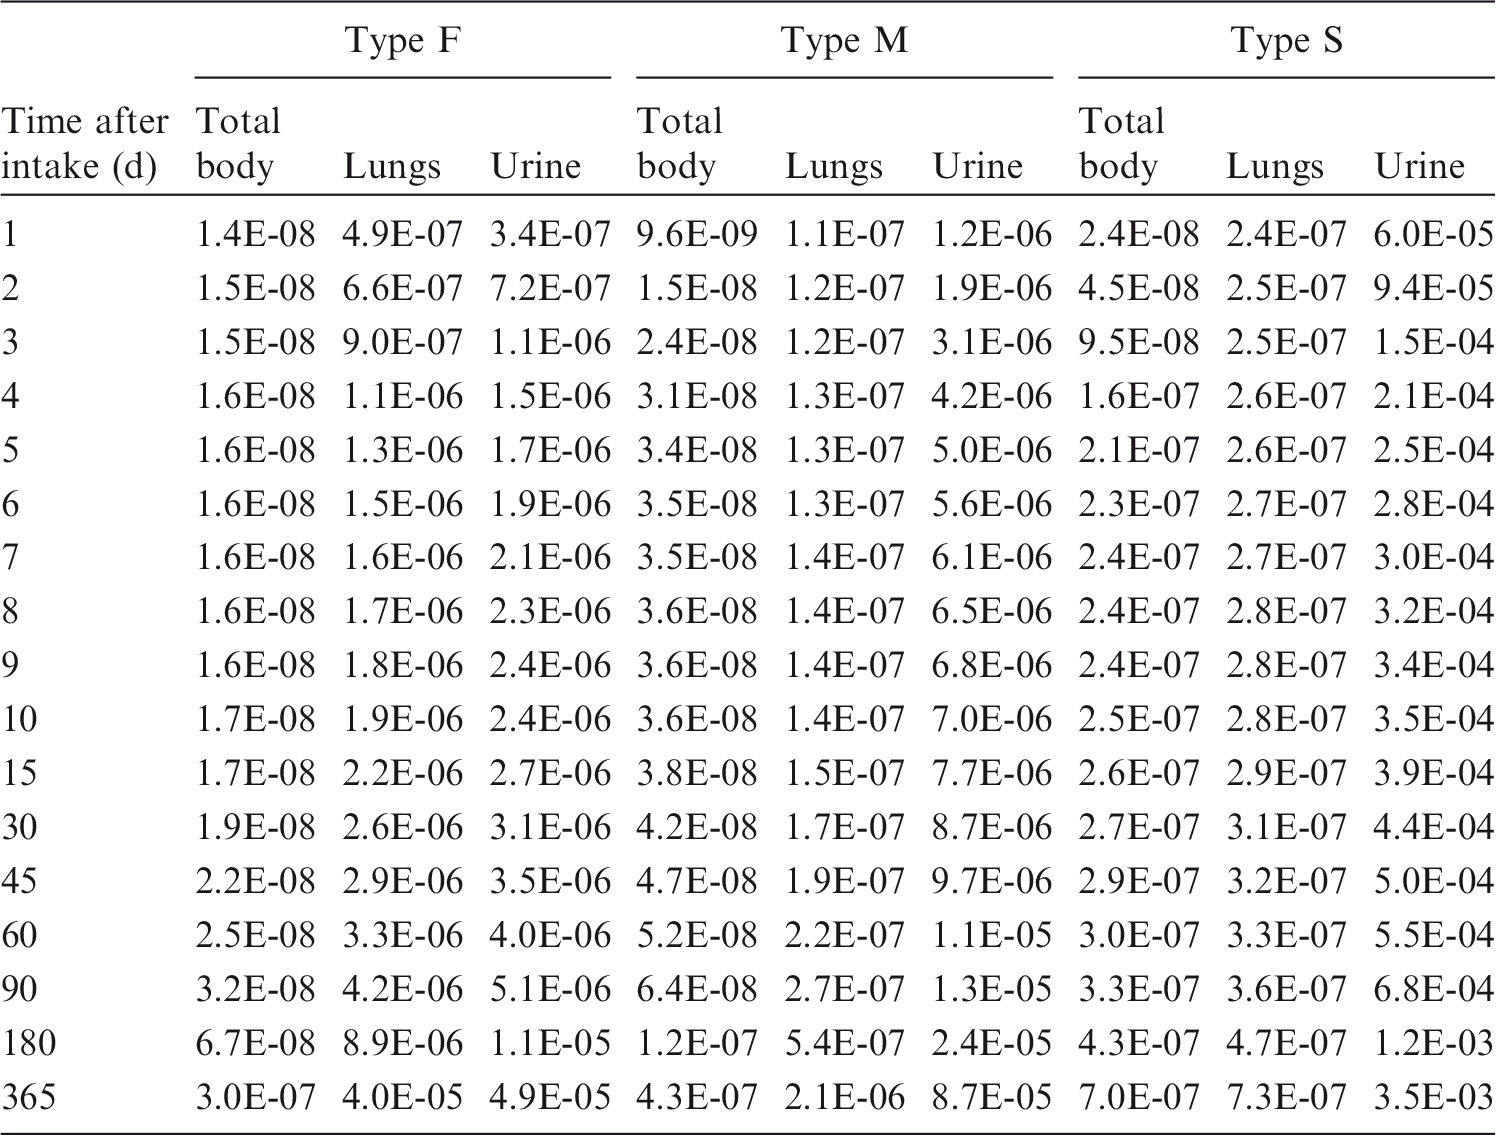


5.5. References
6. CAESIUM (Z = 55)
6.1. Chemical forms in the workplace
(259) Caesium is an alkali metal that only occurs in oxidation state I. Caesium may be encountered in industry in a variety of chemical and physical forms, including soluble inorganic salts (chloride, nitrate) and less soluble sulphate. 134Cs and 137Cs are important fission products and could also be encountered in relatively insoluble fragments of irradiated fuel. 137Cs is commonly used for medical applications as caesium chloride. Structure of the model for systemic caesium and its exchange with caesium in the alimentary tract. Trab, trabecular; cort, cortical; surf, surface; UB, urinary bladder; cont, contents; RBC, red blood cells; St, stomach; SI, small intestine; RC, right colon; LC, left colon; RS, rectosigmoid colon.
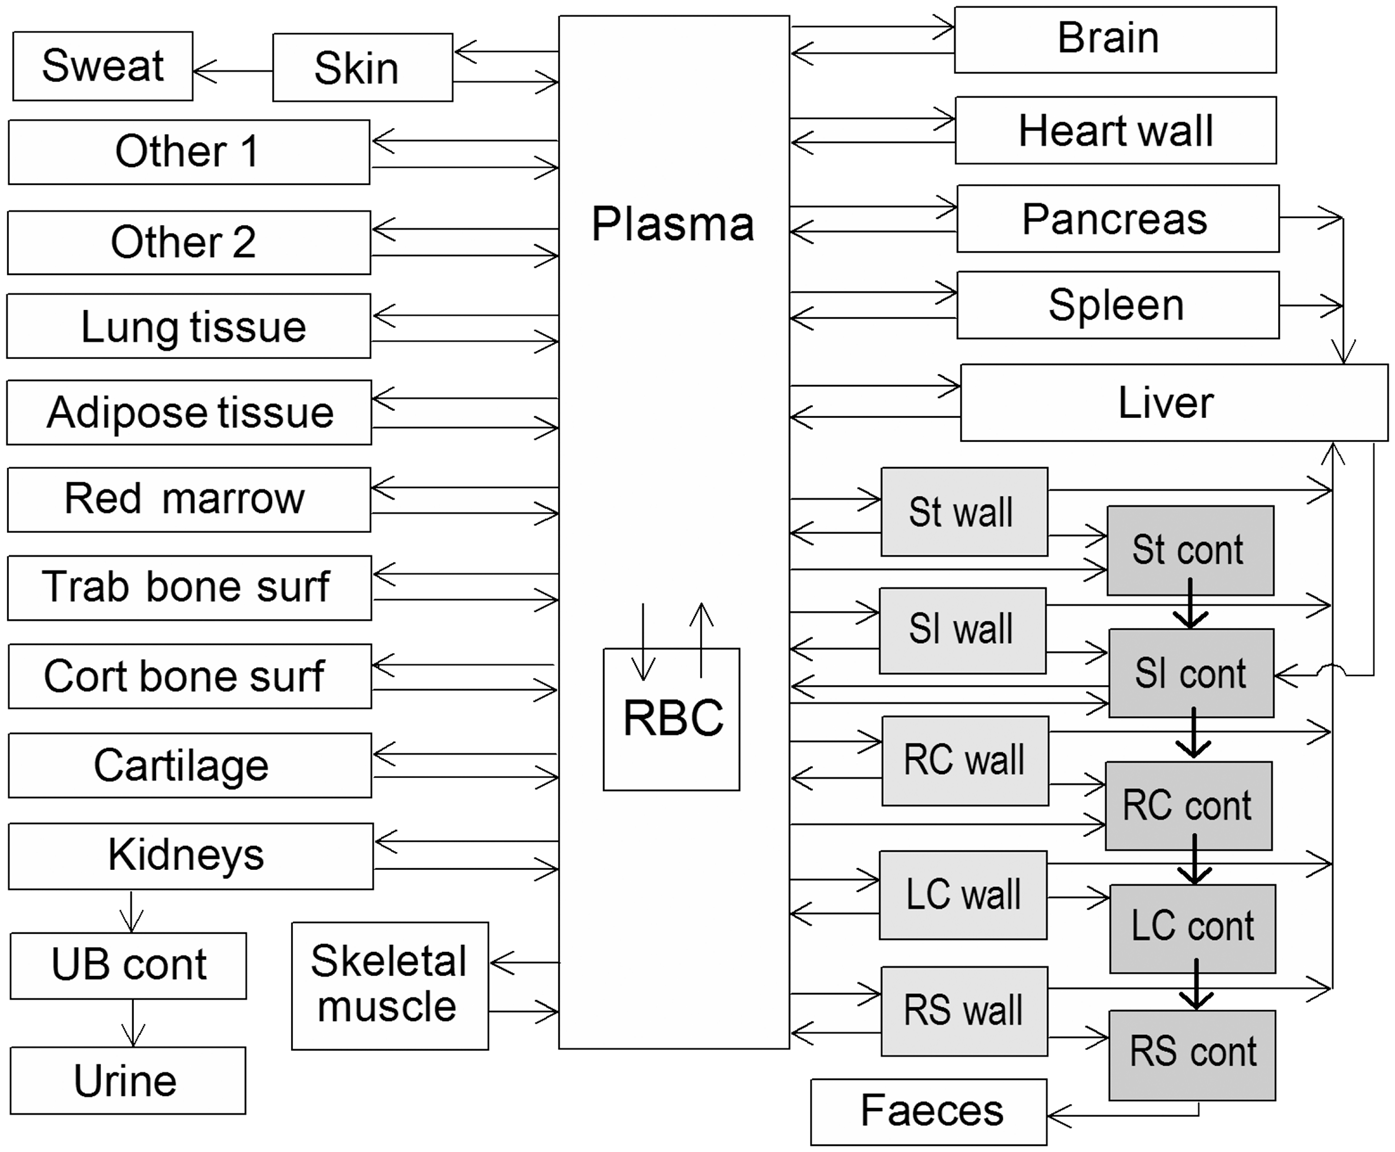
6.2. Routes of intake
6.2.1. Inhalation
(260) There is some information on the behaviour of inhaled caesium in human subjects following accidental intake. Information on absorption from the respiratory tract is also available from experimental studies of caesium in ionic forms (chloride, nitrate), in irradiated fuel fragments and other contaminated dusts associated with nuclear facilities, and in FAP. (261) Absorption parameter values and types, and associated fA values for particulate forms of caesium are given in Table 6.2. Total body and lung contents, and daily urinary excretion of 134Cs following inhalation of 1 Bq Type F.
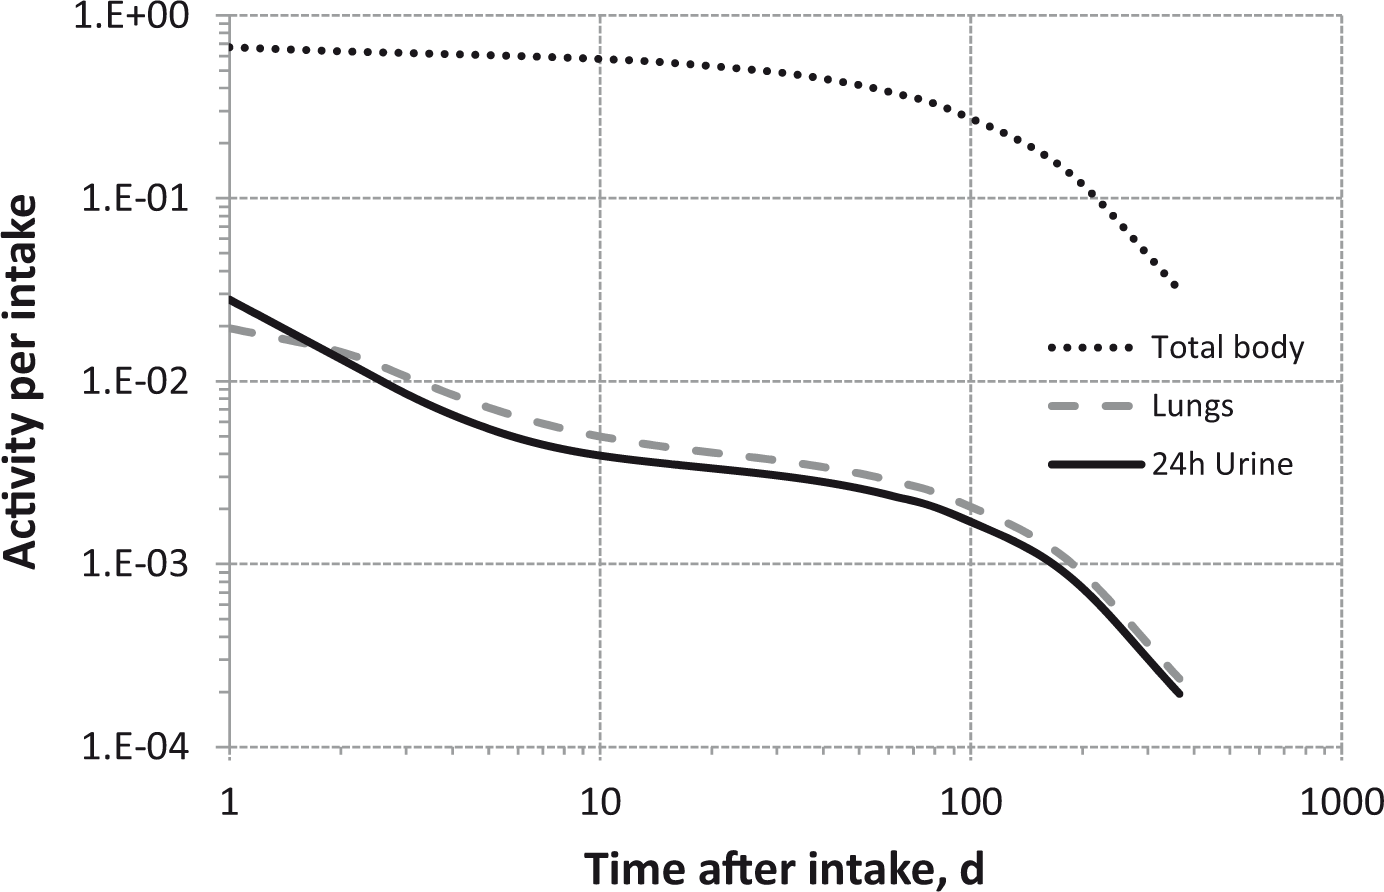
6.2.1.1. Particulate materials
(a) Caesium chloride (262) Animal experiments have shown that caesium chloride (CsCl) is rapidly and completely absorbed from the respiratory tract following inhalation. Lie (1964) and Thomas (1969) observed that in mice, rats, and guinea pigs killed less than 20 min after a 10-min inhalation exposure to 137CsCl, nearly all of the activity had left the lungs, suggesting an absorption rate corresponding to a time of the order of 10 min (i.e. sr∼100 d−1). Stara (1965) similarly observed that in guinea pigs killed 20 min after inhalation of 137CsCl, there had been rapid clearance from the lungs, and by 24 h, the biokinetic of 137Cs was indistinguishable from that following intraperitoneal injection. Morrow et al. (1968) measured a lung retention half-time of 0.003 d (∼4 min) following inhalation of 134CsCl by dogs, giving fr of approximately 1 and sr of 200 d–1. Boecker (1969a) noted that following inhalation of 137CsCl by dogs, the lung quickly became one of the tissues to exhibit a low concentration of 137Cs. It was estimated here (i.e. by the Task Group) from the results of another study in which 137CsCl was inhaled by dogs (Boecker, 1969b) that lung retention at 32 d was less than 1% ILD. (263) Cuddihy and Ozog (1973) deposited 137CsCl directly on to the nasal membranes of Syrian hamsters, and followed the biokinetic of 137Cs for 4 h. Analysis of the results here gave values of fr of approximately 1.0 and sr of approximately 6 d–1 (t½∼2 h), slower than in the other studies, possibly because of the experimental techniques used, including the anaesthetic or slower clearance from the nasal passage than from the lungs. Similar observations were made for strontium and barium chlorides which were also administered by Cuddihy and Ozog [see OIR Part 2, Section 10 (ICRP, 2016) and Section 7 of this publication]. (264) Hölgye and Malý (2002) followed urinary excretion of 137Cs for 370 d after presumed accidental inhalation of the chloride by a worker. Analysis here showed that the results can be well fit assuming Type F absorption (i.e. that absorption from the lungs is rapid compared with transfer from systemic tissues to urine). (265) Based on the results of the experiments outlined above, specific absorption parameter values for caesium chloride were estimated here to be fr = 1 and sr = 100 d−1 (consistent with assignment to default Type F). However, although specific parameter values for caesium chloride based on in-vivo data are available, they are not adopted separately here. The data are (with those for caesium nitrate) used as the basis for the default rapid dissolution rate for caesium. Hence, specific parameter values for caesium chloride would be the same as default Type F caesium parameter values, and therefore caesium chloride is assigned to Type F instead. (b) Caesium nitrate (266) Lie (1964) obtained similar results following inhalation of caesium nitrate by rats as for caesium chloride, but few details were given. In rats killed immediately after a 10-min inhalation exposure, nearly all of the activity had left the lungs, suggesting an absorption rate corresponding to a time of the order of 10 min (i.e. sr∼100 d−1). In view of the few details given, these data are judged to be an insufficient basis to provide specific absorption parameter values, and caesium nitrate is therefore assigned to Type F. (c) Caesium sulphate (267) Miller (1964) followed distribution and retention of 137Cs in two men following accidental intake (presumed to be inhalation) of caesium sulphate. The distribution along the body was unchanged between 9 and 285 d, implying that absorption from the lungs was complete before the first measurement on Day 9, and indicating Type F behaviour. These data are judged to be an insufficient basis to provide specific absorption parameter values, and caesium sulphate is therefore assigned to Type F. (d) Irradiated fuel fragments and other contaminated dusts associated with nuclear facilities (268) Studies have been conducted of caesium associated with irradiated fuel fragments, including particles released from the Chernobyl accident, and other materials, more or less well defined, associated with various nuclear facilities. Such studies indicate that some of the caesium is absorbed rapidly (within days), but a fraction may be retained with the particle matrix and absorbed over a period of months or years. The results of most of these studies indicate Type M behaviour overall, but some indicate Type F behaviour, and two indicate partial Type S behaviour. (e) Chernobyl (269) Mirell and Blahd (1989) made whole-body measurements of activity on seven people from approximately 2 weeks to several months after exposure to the initial Chernobyl reactor accident plume in Kiev, Ukraine. Biological retention half-times were similar for different radionuclides (34 d for 137Cs) and different from those expected for systemic retention, indicating that they were trapped in particles and metabolically inert, thus indicating Type M rather than Type F behaviour. (270) Kutkov (1998, 2000) reported that approximately 920 Chernobyl nuclear power plant workers involved in emergency operations on 26–27 April 1986 were examined by means of a semiconductor whole-body counter. For 15 of these workers who were examined more than five times in the period 40–800 d after the accident, the effective half-time of 137Cs retention in the body ranged from 230 to 590 d with a mean of 360 ± 30 d, much greater than expected for systemic 137Cs (∼110 d). With other information on the characteristics of nuclear fuel particles dispersed in the accident, it was inferred that radionuclides such as 137Cs were trapped in the uranium oxide matrix. Kutkov (1998) reported HRTM parameter values for Chernobyl nuclear fuel particles as sp = 4 d−1, spt = 100 d−1, and st = 0.002 d−1 (and f1 = 0.002), corresponding to fr = 0.04, sr = 104 d–1, and ss = 0.002 d–1, giving assignment to Type M. However, these reports only summarise the results, and little information was given on how the parameter values were derived. (271) Cuddihy et al. (1989) measured the in-vitro dissolution of samples of particles released from the Chernobyl accident for up to 60 d. For all radionuclides measured, including 137Cs, 10% dissolved in a few hours, and the rest with a half-time of 160 d. Hence, fr = 0.1, sr∼10 d–1, and ss = 0.004 d–1, giving assignment to Type M. (272) Kutkov and Komaritskaya (1996) measured the in-vitro leaching (for 122 d) of 137Cs from particles taken from the Chernobyl shelter. Results indicated fr of approximately 0.3, sr of approximately 0.04 d–1, and ss of 0.002 d–1, giving assignment to Type M. (273) To simulate particles produced in a reactor accident such as that at Chernobyl, Al Rayyes et al. (1993) prepared UO2 particles labelled with 134Cs by condensation. In distilled water, approximately 95% dissolved in a few hours, indicating Type F behaviour. However, for particles ‘matured’ in 10% O2 + 90% CO2, approximately 40% remained after 21 d, indicating Type M behaviour. (f) Other workplace exposures (274) Hesp (1964) followed whole-body retention of 137Cs for 300 d after accidental inhalation by a worker, and also reported measurements in urine and in the chest. Analysis here showed that the results can be reasonably well fit, assuming approximately 50% Type F and 50% Type M absorption; i.e. fr is approximately 0.5, but there is insufficient information to determine sr and ss (indicating assignment to Type M overall). (275) The results of a human study in which in-vivo measurements were made for over 2 y after accidental inhalation of irradiated uranium indicate Type F behaviour of the caesium present, although measurements of other radionuclides (95Zr-Nb, 103Ru, and 144Ce) indicate Type M or S behaviour (Rundo, 1965). (276) Raghavendran et al. (1978) followed whole-body retention of 137Cs in 12 radiation workers at the Bhaba Atomic Research Centre for between 72 and 456 d. Results were consistent with retention of systemic caesium, indicating Type F behaviour (assuming intake by inhalation). (277) Froning et al. (2004) followed whole-body retention of 137Cs for 16 y after accidental inhalation of high temperature reactor fuel element ash by a worker. Measurements showed that the longest-lived component was concentrated in the thoracic region, suggesting long-term lung retention of a relatively insoluble component. The authors found that data up to approximately 2000 d could be well represented by assuming 77% Type F and 23% Type S. However, subsequent clearance was slower than predicted for default Type S. Analysis here
1
confirmed this assessment, which can be represented by fr = 0.77, sr = 100 d–1, and ss = 10–4. Application here of the revised HRTM, which assumes longer retention in the AI region than the original HRTM (see ICRP, 2015, Section 3.2.2), gave a better fit to the measurements after 2000 d, but with a smaller 'insoluble' fraction retained, i.e. with a higher value of fr (∼0.9). (278) Andrieu and Fatome (1979) studied the clearance of mixed fission and activation products in graphite particles of approximately 1 µm following controlled inhalation by a volunteer; data over approximately 7 y imply partial Type S behaviour for the 137Cs component. (279) The biokinetic of 137Cs were followed for 6 months after intratracheal instillation into rats of a suspension of residues from a reactor fuel cooling pond (Stradling et al., 1989). Lung retention at 30 d was 2% ILD, giving assignment to Type F. However, insufficient information was published to enable derivation of absorption parameter values. (280) The biokinetic of 137Cs were followed for 6 months after intratracheal instillation into rats of a complex radionuclide bearing dust from the ventilation grid of the reactor fuel hall of a nuclear power plant (Stradling et al., 1996, 1997). The absorption parameter values – fr = 0.82, sr = 2.7 d–1, and ss = 1.4 10–3 d–1 – derived by ICRP (2002, Section E4.4) are consistent with assignment to Type M. (281) Kotrappa et al. (1977) measured in vitro the fractions of several radionuclides that dissolved rapidly (within 6 h) from air samples taken at five working areas in a nuclear power plant. For 134+137Cs, the fraction was between 98% (consistent with Type F) and 38% (indicating possible Type M behaviour). Dua et al. (1987) measured the in-vitro dissolution of particles on an air sample from a reactor spent fuel bay for up to 200 d. For all radionuclides measured, including 137Cs, approximately 40% dissolved with a half-time of 1.2 d, and the rest with a half-time of 155 d. Hence, fr = 0.4, sr∼0.6 d–1, and ss = 0.004 d–1, giving assignment to Type M. (282) Although specific absorption parameter values were derived from the results of one in-vivo study, the results from others indicate that the biokinetic of caesium in the forms considered in this section are likely to vary markedly. Caesium associated with irradiated fuel fragments, and other unspecified contaminated dusts from nuclear facilities, is therefore assigned to Type M. (g) Fused aluminosilicate particles (283) FAP or ‘fused clay’ particles have been used extensively as relatively insoluble particles in inhalation studies, both of biokinetic and of radiation effects. A natural clay mineral is labelled by ion exchange, and the labelled clay particles heated to approximately 1100℃, to form aluminosilicate glass microspheres in which the label is incorporated. It has been shown in several animal studies (mouse, rat, guinea pig, and dog) that when caesium is incorporated into FAP, a small fraction is absorbed rapidly from the lungs (fr∼0.1). The rest is absorbed slowly, at rates of the order of 0.001 d–1 (Boecker et al., 1974; Snipes et al., 1983; Snipes and McClellan, 1986). In most cases, the results give assignment to Type M, but for the largest particles (2.8-µm AMAD) used by Snipes et al. (1983), they give assignment to Type S. In view of the variability of the results, and because inhalation exposure to caesium-labelled FAP is unlikely, specific parameter values for it are not used here, nor is it assigned to a default type.
6.2.1.2. Rapid dissolution rate for caesium
(284) Studies with caesium chloride and nitrate outlined above give values of sr of approximately 100 d–1, which is applied here to all Type F forms of caesium.
6.2.1.3 Extent of binding of caesium to the respiratory tract
(285) Evidence from the caesium chloride studies outlined above suggests that there is probably little binding of caesium. It is therefore assumed that the bound state can be neglected for caesium (i.e. fb = 0.0).
6.2.2. Ingestion
(286) Human volunteer studies using 137Cs in soluble inorganic form have shown virtually complete absorption from the alimentary tract (Rosoff et al., 1963; Rundo et al., 1963; Naversten and Liden, 1964; LeRoy et al., 1966). Thus, for example, Rundo et al. (1963) measured an average fractional absorption of 0.99 for 10 normal subjects following the ingestion of 137CsCl, and LeRoy et al. (1966) measured values from 0.87 to 0.9 on four healthy subjects. (287) 134Cs and 137Cs incorporated into insoluble particles may be less available for absorption. LeRoy et al. (1966) reported values of 0.29–0.36 for 134Cs contained in microspheres from leachable glass and ingested by three volunteers. These values were approximately 0.8 when 134Cs was given as caesium silicate to five volunteers. (288) McKay and Memmott (1991) have shown that absorption of caesium adsorbed on to inorganic sedimentary material was significantly lower than unity. Experiments with animals showed that absorption of 137Cs from irradiated reactor fuel particles (2–10 µm) in adult rats was less than 0.1 (Talbot et al., 1993). (289) In Publication 30 (ICRP, 1979), complete absorption from the alimentary tract was assumed for all chemical forms of caesium. This value was adopted in Publication 56 (ICRP, 1989) for dietary intakes. In this publication, an fA value of 1 is adopted for all forms of caesium, except in situations where it is considered that the material is insoluble (e.g. fuel particles) and a lower fA value of 0.1 is appropriate.
6.2.3. Systemic distribution, retention, and excretion
6.2.3.1. Summary of database
(290) Caesium is a physiological analogue of the lighter alkali metals potassium and rubidium. Caesium has been shown to compete with these elements for both active and passive membrane transport across cell membranes, but is generally transported less readily than potassium or rubidium by these processes (Hodgkin, 1947; Sjodin and Beauge, 1967; Edwards, 1982; Latorre and Miller, 1983; Cecchi et al., 1987). In-vitro studies of the relative selectivity of potassium, caesium, and rubidium by membranes have revealed much about the structure and functions of ionic channels and carriers. (291) Numerous studies of the biological behaviour of caesium in human subjects and laboratory animals have been published since the 1950s due to the importance of the fission-produced isotopes 137Cs and 134Cs as occupational and environmental hazards. The retention time of caesium in the human body has been found to vary with age, sex, diet, muscle mass, pregnancy, and diseases that affect the behaviour of potassium in the body. Studies on laboratory animals indicate that absorbed caesium is initially distributed heterogeneously in the body with highest concentration in the kidneys, but gradually attains a more near-uniform distribution (Stather, 1970; Moskalev, 1972). Autopsy studies on environmentally exposed humans indicate that caesium concentrations do not differ greatly for different tissues, but higher concentrations are generally found in skeletal muscle than in other measured tissues (Yamagata, 1962; Williams and Leggett, 1987). Measurements on persons briefly exposed to elevated levels of 137Cs in accidents or controlled studies show that whole-body retention for periods up to 3–4 y can usually be represented by the sum of two exponential terms. The long-term component typically represents 85–95% of uptake in adults. The long-term half-time is generally in the range 45–150 d in adults, although values on the order of 200 d have been reported (Rundo, 1964; Cryer and Baverstock, 1972; Lloyd et al., 1972, 1973; Leggett, 1986). (292) Leggett et al. (1998) reviewed data on whole-body retention of caesium in healthy adults from 14 studies involving two to 239 subjects per study. Central estimates of the long-term half-time in adult males were in the range 79–133 d, with an overall mean of approximately 97 d. Intersubject variability within a given study was generally small, with a typical coefficient of variation of approximately 20% and a typical geometric standard deviation (σg) of approximately 1.2. In eight of the 14 studies, retention half-times were measured in both men and women. There was some overlap in half-times for individual male and female subjects, but the mean half-time for females was 15–35% lower than that for males in each of the eight studies. (293) The long-term half-time of caesium in the body is usually reduced during pregnancy to approximately two-thirds of the value when not pregnant (Lloyd et al., 1966; Zundel et al., 1969; Melo et al., 1997; Thornberg and Mattsson, 2000).
6.2.3.2. Biokinetic model for systemic caesium
(294) In the model for systemic caesium adopted in Publication 30 (ICRP, 1979), caesium is assumed to be uniformly distributed in the body at all times after uptake to blood. Whole-body retention at time t (d) is represented as a sum of two exponential terms:
(295) The model for systemic caesium used in this publication is adapted from a model proposed by Leggett et al. (2003) that is constructed around a dynamic blood flow model involving a number of different blood pools (Leggett and Williams, 1995; Leggett et al., 1999; Leggett et al., 2003). The dynamic blood flow model is useful, for example, for predicting the blood circulation and tissue accumulation of ultra-short-lived isotopes of caesium or its physiological analogues (Leggett et al., 1999, 2003). For application to a caesium isotope with half-life of at least a few minutes, it suffices to treat blood plasma as a well-mixed central compartment. The latter form of the model is used in this publication, with modifications described below. (The reader is referred to Leggett (2013) for an expanded discussion of the model used here including comparisons with earlier models for cesium.) (296) In the original model, the skeleton is divided into two compartments representing red marrow and all remaining skeletal tissues. In the present version of the model, skeletal caesium is divided into four specific pools that appear to contain nearly all of the skeletal content (Williams and Leggett, 1987): red marrow, cartilage, trabecular bone surfaces, and cortical bone surfaces. (297) A simplistic representation of the gastrointestinal tract used in the original model to describe exchange of caesium between systemic and gastrointestinal pools is replaced here by the gastrointestinal portion of the HATM. (298) The structure of the model as applied in this publication is shown in Fig. 6.1. Baseline parameter values are listed in Table 6.3. Most of the parameter values were taken from Table 2 of Leggett et al. (2003), which provides baseline values for a reference adult male for the case of a well-mixed plasma pool. Modification or addition of some parameter values was required due to the structural differences between the present and original versions of the model indicated above. The methods of derivation of the values in Table 6.3 are summarised below. (299) The derivation of most parameter values involves reference values for cardiac output and the percentage of cardiac output received by individual tissues. The assumed cardiac output in a resting adult male is 1766 plasma volumes d−1. The assumed distribution of cardiac output is given in Table 6.4. (300) Movement of caesium is depicted as a system of first-order processes. The transfer coefficient from plasma into a tissue T is estimated as the product of the plasma flow rate to that tissue (1766 plasma volumes per day multiplied by the fraction of cardiac output received by the tissue) and a tissue-specific extraction fraction, E
T
. The extraction fraction for a tissue is defined as the fraction of caesium atoms extracted by that tissue during passage of caesium from arterial to venous plasma. (301) Data on tissue-specific extraction fractions for caesium and its physiological analogues potassium and rubidium were reviewed by Leggett and Williams (1986, 1988), and Leggett et al. (2003). In general, tissue extraction from plasma decreases in the order potassium ≥ rubidium > caesium. For example, extraction by the myocardium in dogs was estimated as 0.71 (range 0.64–0.80) for potassium, 0.65 (range 0.58–0.76) for rubidium, and 0.22 (range 0.09–0.30) for caesium (Love et al., 1968; Poe, 1972). More information on extraction fractions was found for potassium and rubidium than for caesium. Data for potassium and rubidium were extrapolated to caesium by applying modifying factors as indicated by data on discrimination between these elements by tissues (Leggett et al., 2003). Initial selections of extraction fractions were modified in some cases after testing the model against reported caesium distributions in the early minutes or hours after administration to laboratory animals (Carr, 1966; Love et al., 1968; Stather, 1970; Yano et al., 1970; Moskalev, 1972; Poe, 1972; Nishiyama et al., 1975; Krulik et al., 1980; Gregus and Klaasen, 1986) or human subjects (Rosoff et al., 1963; Nishiyama et al., 1975). For example, an initially selected extraction fraction of 0.003 for brain was reduced to 0.002 for improved agreement with observations of the time-dependent increase of the caesium content of the brain following acute intake. The final selections of extraction fractions for caesium are as follows: 0.2 for kidneys, walls of the gastrointestinal tract, and heart wall; 0.05 for liver and skin; 0.002 for brain; and 0.1 for all other tissues. (302) The transfer coefficient from a tissue T to plasma is based on the relative contents of caesium in plasma and T at equilibrium (Table 6.4), as estimated from collected studies of stable and radioactive caesium in living human subjects and cadavers (Williams and Leggett, 1987; Leggett et al., 2003). If T exchanges caesium with plasma alone, the transfer coefficient R2 from T to plasma is determined as R2 = R1 x P/A, where A and P are the fractions of total-body caesium in the tissue and plasma at equilibrium, and R1 is the transfer coefficient from plasma to T. (303) The use of extraction fractions and the equilibrium distribution for caesium to derive transfer coefficients between plasma and tissues is illustrated for skeletal muscle. The transfer coefficient from plasma to skeletal muscle is estimated as 0.1 × 0.17 × 1766 d−1 = 30.022 d−1 (rounded to 30 in Table 6.3), where 0.1 is the estimated extraction fraction for skeletal muscle, 0.17 is the reference fraction of cardiac output going to skeletal muscle, and 1766 d−1 is the reference cardiac output in plasma volumes per day. The transfer coefficient from skeletal muscle to plasma is 0.002 × 30.022 d−1/0.8 = 0.0751 d−1, where 0.002 and 0.8 are fractions of total-body caesium in plasma and skeletal muscle at equilibrium, respectively. Derived parameter values are rounded to three significant figures in Table 6.3. (304) The concept of an extraction fraction does not apply to red blood cells. The transfer coefficients between plasma and red blood cells are derived from observed transfer rates for potassium and comparative data on potassium and caesium. The transfer coefficient for potassium from plasma to red blood cells is estimated from data from several experimental studies as 6 d−1 (Leggett and Williams, 1986, 1988). The rate of transfer of caesium into red blood cells is approximately 0.3 times that of potassium in humans, rabbits, and rats (Love and Burch, 1953; Forth et al., 1963; Gyorgyi and Kanyar, 1973), and thus is estimated as 0.3 × 6 d−1 = 1.8 d−1. The transfer coefficient from red blood cells to plasma can be determined from the caesium inflow rate (1.8 d−1) and the equilibrium fractions of caesium in plasma and red blood cells, respectively. Based on the reference steady-state content of red blood cells (as a fraction of total-body caesium, Table 6.4), the transfer coefficient from red blood cells to plasma is 1.8 d−1 x 0.002/0.014 = 0.257 d−1. (305) The concept of an extraction fraction also does not apply to cartilage, which contains no blood vessels but receives nutrients via a permeable matrix in contact with extravascular fluids. The simplifying assumption is made that cartilage receives caesium directly from plasma and returns caesium to plasma. Transfer coefficients describing exchange between plasma and cartilage are set to depict rapid uptake and subsequently elevated concentration of radiocaesium in cartilage, as observed in different animal species (Ekman, 1961; Nelson et al., 1961; Furchner et al., 1964), and to yield a cartilage content of 3% of total-body caesium at equilibrium (Williams and Leggett, 1987). (306) For a compartment T that receives caesium from plasma but loses caesium to multiple compartments, the total outflow rate R from T is derived as illustrated above for skeletal muscle, and additional information is used to divide R into transfer coefficients representing different paths of movement. For example, the derived rate of loss R from skin is divided into transfer coefficients R1 and R2 representing the rate of loss from skin to plasma and the rate of loss from skin to sweat, respectively. The value for R2 is set for consistency with data of Yamagata et al. (1966) on the appearance of activity in sweat after ingestion of 132Cs by a human subject, and R1 is determined as R–R2. As a second example, the compartment representing the stomach wall is assumed to return caesium to plasma via the portal vein, and to lose caesium to the stomach contents due to cell sloughing. The total rate of loss R (4.59 d−1) from the stomach wall to all destinations is derived as illustrated earlier for skeletal muscle. The transfer coefficient from the stomach wall to the stomach contents representing cell sloughing is set at 0.21 d−1, an estimated average cell sloughing rate from gastrointestinal tract tissues to gastrointestinal contents (Leggett et al., 2003). The rate of loss of caesium from the stomach wall via the portal vein is calculated as the total removal rate from stomach wall minus the rate of cell sloughing: 4.59 d−1− 0.21 d−1 = 4.38 d−1. Outflow from the stomach wall via the portal vein is divided between the plasma and liver compartments on the basis of the extraction fraction for liver (0.05). That is, the transfer coefficient from the stomach wall to the liver is 0.05 × 4.38 d−1 = 0.219 d−1, and the transfer coefficient from the stomach wall to plasma is 0.95 × 4.38 d−1 = 4.16 d−1. (307) Some of the transfer coefficients are based on a combination of basic physiological data and empirical data for caesium. For example, the rate of transfer of caesium into the gastrointestinal tract in liver bile is estimated as 5% of total outflow from the liver based on data on the rate of bile flow in man, and observed concentration ratios for caesium in liver and bile in different animal species. A total outflow rate from the liver of 2.25 d−1 is based on the derived transfer coefficient from plasma to liver of 19.5 d−1, and the assumption that the liver contains 2% of total-body caesium at equilibrium. The transfer coefficient from liver to the small intestine content in bile is calculated as 0.05 × 2.25 d−1 = 0.113 d−1. (308) Urinary excretion of caesium is depicted as transfer from plasma to a well-mixed kidney compartment, and division of outflow from that compartment to plasma and urinary bladder contents. Transfer from plasma to kidneys is represented as an effective extraction fraction times the blood flow rate to kidneys, where the effective extraction fraction includes atoms temporarily retained in the tubules after filtration at the glomerulus as well as atoms entering kidney tissue directly from blood plasma. The division of kidney outflow between plasma and urinary bladder contents is set for consistency with short-term urinary excretion data for healthy adult males (Lloyd et al., 1972, 1973). It is assumed that the renal deposit represents the only source of urinary caesium. That is, it is assumed that none of the urinary caesium arises from filtered or secreted atoms that pass to the urinary bladder without being retained in kidney tissue. (309) Endogenous faecal excretion is assumed to arise from transfer of caesium into the alimentary tract contents in saliva, gastric juices, pancreatic secretions, liver bile, and other secretions. It is assumed that 99% of the secreted activity that reaches the small intestine is re-absorbed to blood, and that absorption occurs only in the small intestine. (310) The model depicts a small component of very long-term retention observed in human subjects involved in the accident in Goiania, Brazil (Melo et al., 1997, 1998), and in experimental studies on rats that received 137Cs by intraperitoneal injection (Thomas and Thomas, 1968). In eight adult human subjects involved in the Goiania accident, this small component of retention had an estimated half-time on the order of 500 d, and represented an estimated 0.01–0.25% of uptake to blood, with estimates falling between 0.04% and 0.07% for five of the eight subjects. In rats, this component represented less than 0.01% of injected 137Cs and had a half-time of 150–200 d. The physiological basis for this retention component is not known. It is represented in the model as a compartment called ‘Other 2’ that is assumed to receive 0.002% of cardiac output and to contain 0.5% of total-body caesium at equilibrium. This long-term component of retention does not represent an important contribution to dose per unit intake of radiocaesium, but can be important for interpretation of bioassay data collected at times remote from exposure. (311) As is the case for the original model, the present version of the model can be used to simulate the effect of binding of caesium to Prussian blue or other unabsorbed material in the gut. The simulation is carried out by changing the relative fractions of caesium assumed to move from the small intestine contents to blood and to the right colon contents. If it is assumed that all caesium entering the small intestine is carried by Prussian blue to the right colon contents and is eventually excreted in faeces, the long-term retention half-time for the adult male decreases by approximately 60%. Melo et al. (1998) found that oral administration of Prussian blue reduced the long-term retention half-time by an average of 69% (range 36–83%) in 11 adult male subjects. Ruwei et al. (1985) found an average reduction in the half-time of approximately 50% in five subjects. Madshus et al. (1966) found an average reduction of 64% in two subjects.

6.2.3.3. Treatment of radioactive progeny
(312) Chain members addressed in the derivation of dose coefficients for caesium isotopes are isotopes of caesium, xenon, barium, and iodine. (313) 134mCs (t1/2 = 2.9 h) decays to 134Cs (t1/2 = 2.06 y), which presumably behaves as if entering its site of production as a parent radionuclide. 125Cs (t1/2 = 45 m) decays to the noble gas 125Xe (t1/2 = 16.9 h), which decays to 125I (t1/2 = 59.4 d). 125Xe produced by decay of 125Cs on bone surfaces is assumed to transfer to blood at the rate 100 d−1. Xenon produced in a soft tissue compartment is assumed to transfer to blood with a half-time of 20 min. Xenon entering blood is assumed to be removed from the body (exhaled) at the rate 1000 d−1, corresponding to a half-time of 1 min. (314) 125I produced by serial decay of 125Cs and 125Xe is assigned the model for iodine as a progeny of antimony, described in Section 3. The compartments of the caesium model representing liver and kidneys are assumed to correspond to the compartments for liver iodide and kidney iodide in the model for iodine. When produced in a compartment that is not identifiable with a compartment in the characteristic model for iodine, 125I is generally assumed to transfer to blood (at the rate 200 d−1, the highest transfer rate to blood in the iodine model) and then to follow the characteristic model for iodine. An exception is that 125I produced in red blood cells is assumed to transfer to the iodide blood pool in the iodine model at the rate 1000 d−1. (315) 127Cs (t1/2 = 6.25 h) decays to the noble gas 127Xe (t1/2 = 36.4 d). In this case, inclusion of decays of the progeny based on the xenon model described above has a negligible effect on dose estimates for the parent due to the relatively long half-life of the xenon isotope. (316) 137Cs (t1/2 = 30.2 y) decays to 137mBa (t1/2 = 2.55 min). Wasserman et al. (1959) demonstrated considerable dissociation of 137mBa from 137Cs in rats at 4–7 d after intraperitoneal administration of 137Cs/137mBa, despite the short half-life of 137mBa. 137mBa was found to exceed equilibrium proportions in bone, blood, and plasma by factors of 3.3, 3.9, and 14, respectively. Some soft tissues were moderately deficient in 137mBa, while others showed little or no deviation from equilibrium. The authors concluded, nevertheless, that soft tissues were likely to be the main source of the excess 137mBa in plasma, and that red blood cells probably also contributed to the excess. Skeletal muscle was not sampled but seems likely to have been a major contributor to the excess 137mBa in plasma and bone, as it presumably contained the preponderance of systemic 137Cs after 4–7 d. (317) The model applied in the OIR series to 137mBa as a progeny of 137Cs is based on a model proposed by Leggett (2013) but expands that model by depicting exchange of 137mBa between blood and several soft-tissue pools rather than a single soft-tissue pool. Leggett modified the model for barium as a parent radionuclide described in Section 7 of this publication in the following ways for application to 137mBa produced in vivo by decay of 137Cs: (1) compartments and pathways not relevant to the short-term behaviour of systemic barium were eliminated; and (2) the rate of exchange of barium between plasma and a rapid-turnover soft tissue compartment as well as the rates of transfer of barium to tissues and excretion pathways were increased to provide an improved fit to blood clearance data for human subjects immediately following intravenous injection of 133Ba (Newton et al., 1991). Kinetic studies with radioisotopes of barium and other alkaline earth elements indicate that these elements initially leave plasma with a half-time of a few minutes, and equilibrate rapidly with an extravascular pool approximately three times the size of the plasma pool (Newton et al., 1991; Leggett, 1992). Studies of the short-term behaviour of 133mBa in human subjects indicate that the important repositories for barium during the early minutes after intravenous administration are bone and colon (Korsunskii et al., 1981). The following systemic model for 137mBa produced by decay of 137Cs is based on these considerations and the findings of Wasserman et al. (1959) regarding the dissociation of 137mBa from 137Cs in rats. Barium produced in skeletal muscle and red blood cells transfers to plasma at the rate 1000 d−1, the default value for extremely rapid transfer between systemic compartments. Barium produced in all other soft tissue compartments transfers to plasma at the rate 200 d−1 (t1/2 = 5 min), chosen to yield, at most, a moderate deficiency of 137mBa in these tissues compared with equilibrium values. Barium produced in bone decays at its site of production. Barium transfers from plasma to trabecular bone surfaces at the rate 19.4 d−1, cortical bone surfaces at the rate 15.6 d−1, right colon contents at the rate 40.3 d−1, urinary bladder contents at the rate 4.48 d−1, and a set of compartments representing extracellular fluids of each of the soft tissues addressed in the model for cesium (Fig. 6.1) at a total rate of 184 d−1. The transfer coefficient from the soft tissue compartment back to plasma is 61.4 d−1. The total rates of exchange of 137mBa between blood and soft tissues are taken from the model of Leggett (2013) but in that model are applied to a single soft-tissue pool. In the present model the flow rate 184 d-1 from blood to soft tissues is divided into flow rates into extracellular fluids of each of 16 tissues: heart, liver, kidneys, muscle, stomach, small intestine, right colon, left colon, rectosignmoid colon, spleen, pancreas, brain, red marrow, skin, lung, and other soft tissues. In view of the short half-life of 137mBa, it is assumed that its sites of decay after transfer to soft tissues are determined by the distribution of cardiac output. Transfer rates from blood to individual soft tissue pools are based on the reference arterial distribution of cardiac output in the adult male given in Publication 89 (2002, p. 142). For example, the transfer rate from blood to spleen is calculated as 0.03 × 184 d−1 = 5.52 d−1, where 0.03 is the reference fraction of cardiac output going to the spleen. Barium entering the urinary bladder or right colon contents follows the generic excretion models. The transfer coefficients from plasma to bone surface compartments and excretion pathways are two times the corresponding values given in the model for barium as a parent. The rates of transfer between plasma and the collective soft tissue compartments are set for consistency with the early plasma clearance data of Newton et al. (1991) for human subjects, with the constraint that the transfer coefficient from soft tissues to plasma is one-third the coefficient from plasma to soft tissues. This constraint implies that the content of the soft tissue compartment is three times that of plasma at steady state. The model predicts that the plasma content of 137mBa at 4–7 d after injection of 137Cs to blood is 13–16 times the equilibrium value, which is consistent with the findings of Wasserman et al. (1959) for rats. The bone content of 137mBa at 4–7 d is predicted to be approximately twice the equilibrium value compared with the ratio 3.3 determined by Wasserman et al. (1959). The high rate of migration of 137mBa from its sites of production to bone indicated by the findings for rats could not be reproduced while remaining consistent with reported biokinetic data (e.g. blood clearance data) for barium in human subjects.
6.2.3.4. Differences with sex
(318) The long-term biological half-time of caesium in the total body, representing approximately 90% of absorbed caesium, is typically approximately one-quarter (15–35%) lower in women than in men, and approximately one-third lower in pregnant women than in non-pregnant women. During lactation, there is substantial transfer of caesium from blood to the mammary glands to milk (ICRP, 2004).
6.3. Individual monitoring
6.3.1. 134Cs
(319) 134Cs internal exposures may be detected using urinalysis or in-vivo whole-body counting. Total body and lung contents, and daily urinary excretion of 134Cs following inhalation of 1 Bq Type M.

6.3.2. 137Cs
(320) 137Cs internal exposures are detected by gamma spectroscopy using the 0.661-MeV gamma ray from its progeny 137mBa (t1/2 = 2.5 min), which is produced in approximately 94.4% of decays of 137Cs and exists in secular equilibrium with 137Cs in the body. Gamma spectroscopy is used for in-vivo measurements and for excreta analysis.
6.4. Dosimetric data for caesium
Total body and lung contents, and daily urinary excretion of 134Cs following inhalation of 1 Bq Type S. Total body and lung contents, and daily urinary excretion of 137Cs (137mBa measured) following inhalation of 1 Bq Type F. Total body and lung contents, and daily urinary excretion of 137Cs (137mBa measured) following inhalation of 1 Bq Type M. Total body and lung contents, and daily urinary excretion of 137Cs (137mBa measured) following inhalation of 1 Bq Type S.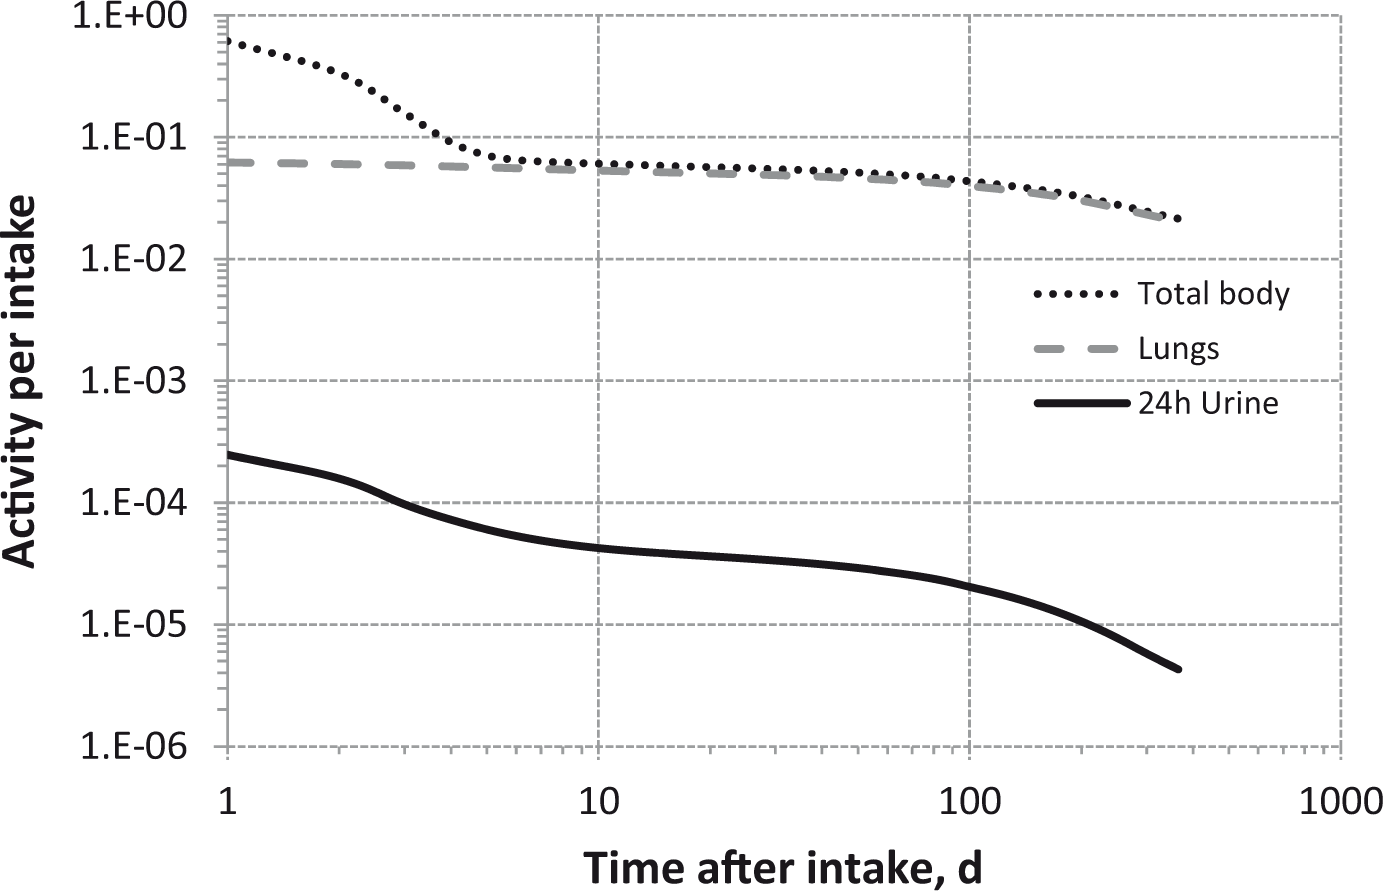
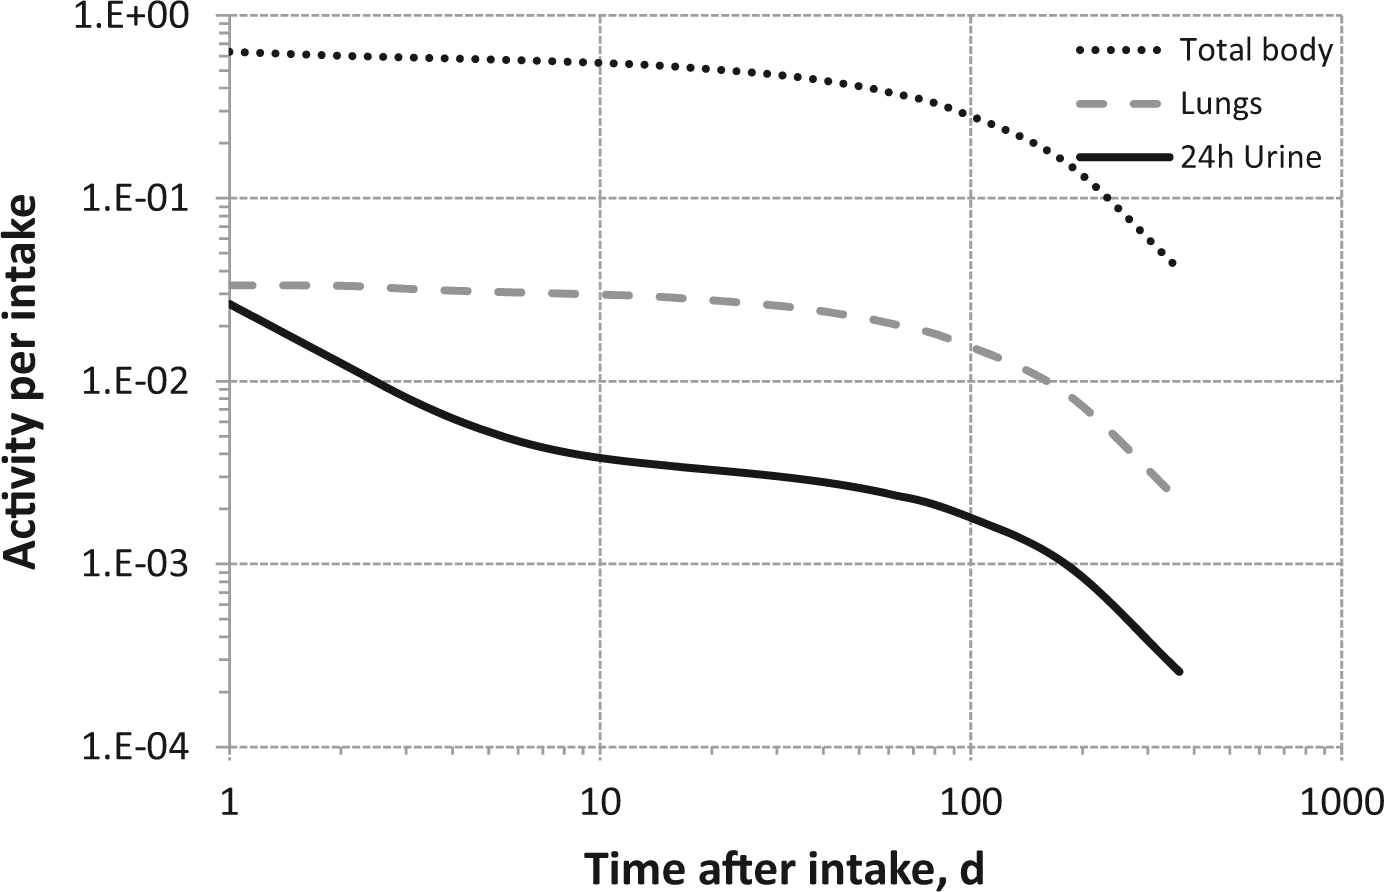
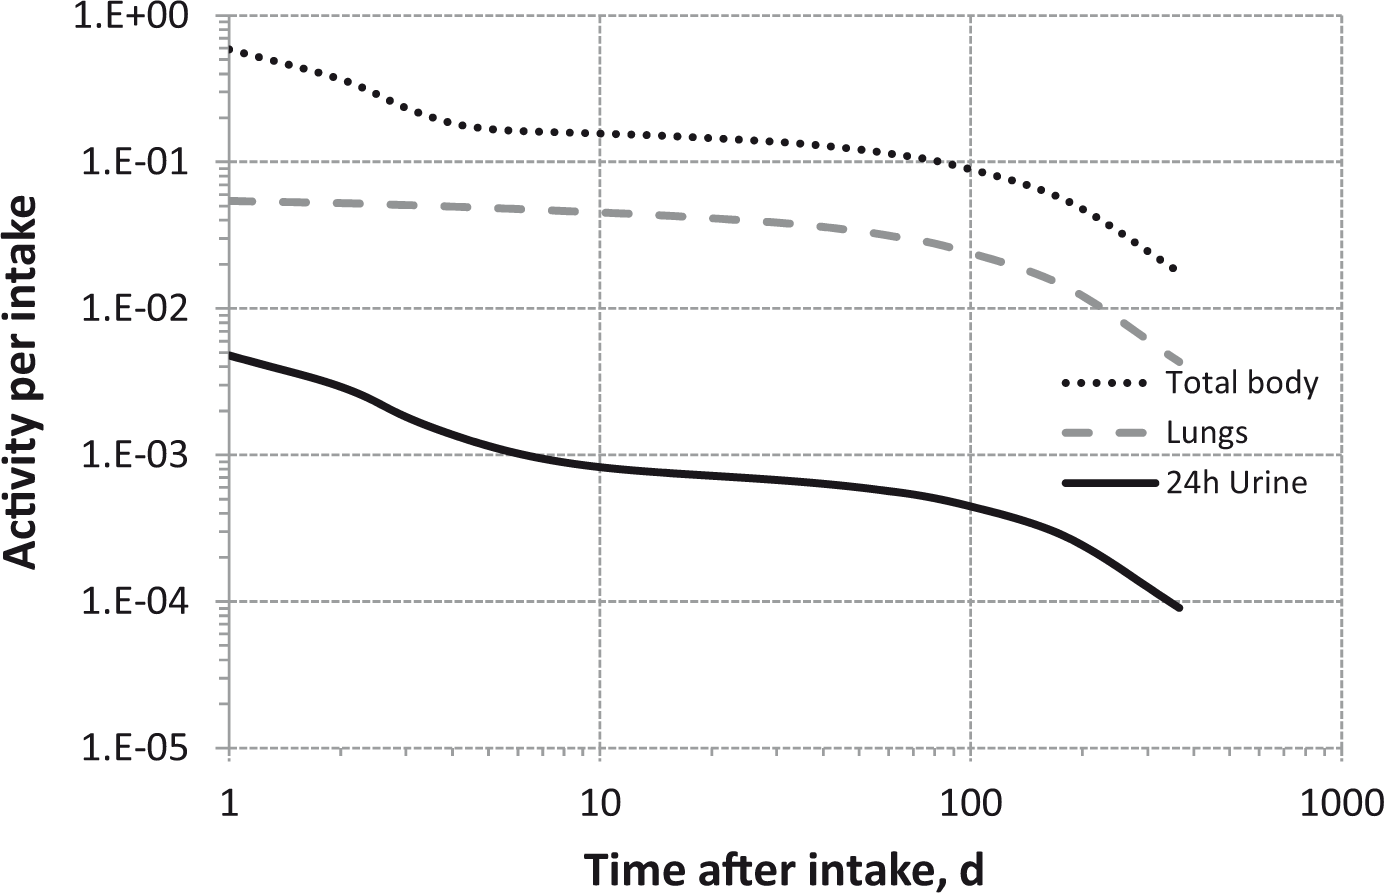

6.5. References
7. BARIUM (Z = 56)
7.1. Chemical forms in the workplace
(321) Barium is an alkaline earth element that occurs mainly in oxidation state II. It is a chemical analogue of calcium. Chemical forms encountered in industry include simple inorganic salts such as chlorides, sulphates, and carbonates. Barium sulphate is used as an x-ray radiocontrast agent for imaging the human alimentary tract. 133Ba is routinely used as a standard source in the calibration of gamma-ray detectors in nuclear physics studies. Structure of the model for systemic barium. Exch, exchangeable; nonexch, non-exchangeable; RBC, red blood cells. ST0, ST1, and ST2 represent soft tissues with fast, intermediate, and slow turnover, respectively.

7.2. Routes of intake
7.2.1. Inhalation
(322) No direct information was found on the behaviour of inhaled barium in man. Information on absorption from the respiratory tract is available from experimental studies of barium as chloride, sulphate, or in FAP. (323) Absorption parameter values and types, and associated fA values for particulate forms of barium are given in Table 7.2. Comparisons of measured whole-body retention of 133Ba injected intravenously into six healthy men (Newton et al., 1991, 2001) with predictions of the systemic biokinetic model adopted in Publication 67 (ICRP, 1993) and used in this publication. Data for the first 3 y post injection were used in the construction of the model. Absorption parameter values for inhaled and ingested barium. It is assumed that the bound state can be neglected for barium, i.e. fb = 0.0. The value of sr for Type F forms of barium (20 d–1) is element-specific. The values for Types M and S (3 d–1) are the general default values. Materials (e.g. barium chloride) are listed here where there is sufficient information to assign to a default absorption type, but not to give specific parameter values (see text). For inhaled material deposited in the respiratory tract and subsequently cleared by particle transport to the alimentary tract, the default fA values for inhaled materials are applied; i.e. the product of fr for the absorption type (or specific value where given) and the fA value for ingested soluble forms of barium (0.2). Default Type M is recommended for use in the absence of specific information on which the exposure material can be assigned to an absorption type; for example, if the form is unknown, or if the form is known but there is no information available on the absorption of that form from the respiratory tract.


7.2.1.1. Particulate materials
(a) Barium chloride (324) Cember et al. (1961) reported that more than 99% of barium administered to rats by intratracheal injection of 133BaCl2 had cleared from the lungs within 3 h. Cuddihy and Griffith (1972) observed very rapid, and almost complete, absorption of 140BaCl2 following inhalation of 140Ba–140La by dogs, consistent with assignment to Type F. They developed a biokinetic model to represent the results, and with it estimated a rate of transfer of barium from the respiratory tract to blood of 25 d–1 (t1/2∼40 min). In the model, a small fraction (0.3%) of the deposit in the pulmonary region was retained indefinitely. This was not discussed; it could represent a small ‘bound’ component, or systemic barium in lung tissues and blood. In a complementary experiment, alimentary tract absorption of 140Ba following administration of 140BaCl2 to dogs by gavage was 7%. However, Cuddihy and Griffith noted that reported values of alimentary tract absorption reported in the literature for BaCl2 varied greatly. In subsequent studies (Cuddihy et al., 1974) of dogs that inhaled 133BaCl2, essentially all of the existing body content was measured in the skeleton 16 d after the exposure. In-vitro dissolution of the same material showed that more than 99.9% dissolved at a rate of 14 d–1 (t½∼1 h). Cuddihy and Ozog (1973) deposited 140BaCl2 directly on to the nasal membranes of Syrian hamsters; the results give an absorption rate of approximately 7 d–1 (t½∼2 h). This is somewhat slower than in other studies, possibly because of the experimental techniques used, including the anaesthetic or slower clearance from the nasal passage than from the lungs. Similar observations were made for strontium and caesium chlorides which were also administered by Cuddihy and Ozog [see OIR Part 2, Section 10 (ICRP, 2016) and Section 6 in this publication]. (325) Based on the results of the experiments outlined above, specific absorption parameter values for barium chloride were estimated here (i.e. by the Task Group) to be fr = 1 and sr = 20 d−1 (consistent with assignment to default Type F). However, although specific parameter values for barium chloride based on in-vivo data are available, they are not adopted here because inhalation exposure to barium chloride is unlikely. Instead, barium chloride is assigned to Type F. However, the data are used as the basis for the default rapid dissolution rate for barium. Hence, specific parameter values for barium chloride would be the same as default Type F barium parameter values. (b) Barium carbonate (326) For details, see OIR Part 2, Section 3 (ICRP, 2016). Measurements of lung retention of 14C following pulmonary intubation of barium 14C-labelled carbonate into rats, and accidental inhalation by man, indicate assignment to Type F. (c) Barium sulphate (327) Morrow et al. (1964) observed a biological half-time in the lungs of 8 d following inhalation of 131BaSO4 by a dog, corresponding to a rate of absorption of approximately 0.1 d–1, and assignment to Type F. Cuddihy et al. (1974) followed the behaviour of 133Ba for 16 d after inhalation of 133BaSO4 by dogs. In-vitro dissolution tests of the same material gave fr = 0.9, sr = 0.4 d–1 (t½∼2 d), and ss = 0.0017 d–1 (t½∼400 d), consistent with Type F. These values were incorporated in a biokinetic model, which gave predictions in good agreement with the observed in-vivo behaviour. In similar experiments with heat-treated (900℃) 133BaSO4 (Cuddihy et al., 1974), in-vitro dissolution tests gave fr = 0.2, sr = 0.07 d–1 (t½∼10 d), and ss = 0.038 d–1 (t½∼18 d), consistent with Type M. Again, biokinetic model predictions using these values were in reasonable agreement with the observed behaviour. (328) 133BaSO4 has also been used as an effectively insoluble test material to study the retention and clearance of particles deposited in the trachea in several species (Patrick and Stirling, 1977; Takahashi and Patrick, 1987; Takahashi et al., 1993; Patrick and Stirling, 1997). Most of these studies were of short duration (typically 1 week), and absorption was not considered to be a significant clearance pathway. In one, however, measurements were made for 6 months, and included tissue distribution data which indicate Type M behaviour (Takahashi and Patrick, 1987). In rats, approximately 1% of the material deposited on the distal trachea was retained with a half-time of 88 d, and the main clearance route identified was to lymph nodes, suggesting an absorption rate of less than 0.01 d–1. (329) Overall, a wide range of absorption rates has been observed, possibly due to differences in the method of preparation of BaSO4. Specific parameter values are therefore not proposed and BaSO4 is assigned to Type M. (d) Fused aluminosilicate particles (330) FAP or ‘fused clay’ particles have been used extensively as relatively insoluble particles in inhalation studies, both of biokinetic and of radiation effects. A natural clay mineral is labelled by ion exchange, and the labelled clay particles are heated to approximately 1100℃ to form aluminosilicate glass microspheres in which the label is incorporated. Cuddihy et al. (1974) followed the behaviour of 133Ba for 512 d after inhalation of 133Ba FAP by dogs. In-vitro dissolution tests (duration 120 d) of the same material gave fr = 0.12, sr = 0.13 d–1 (t½∼5 d), and ss = 0.0016 d−1 (t½∼430 d), consistent with Type M. These were incorporated in a biokinetic model, which gave predictions in good agreement with the observed behaviour.
7.2.1.2. Rapid dissolution rate for barium
(331) Studies with barium chloride outlined above give values of sr of approximately 20 d–1, which is applied here to all Type F forms of barium.
7.2.1.3. Extent of binding of barium to the respiratory tract
(332) Evidence from the barium chloride studies outlined above suggests that there is probably little binding of barium. It is therefore assumed that the bound state can be neglected for barium (i.e. fb = 0.0).
7.2.2. Ingestion
(333) Barium absorption depends on its chemical form. Barium sulphate is poorly absorbed from the gastrointestinal tract of adults (Figueroa et al., 1968; Boender and Verloop, 1969), while acid-soluble barium salts (e.g. acetate, carbonate, chloride, nitrate, hydroxide, etc.) are readily dissolved in gastric acid and absorbed (Leggett, 1992a). Other factors are known to affect absorption. In animals, fasting and low calcium concentration in the gut may increase barium absorption by a factor of 2–3 (Taylor et al., 1962; Della Rosa et al., 1967; Cuddihy and Griffith, 1972). (334) Figueroa et al. (1968) fed five patients with stable barium sulphate and recovered 97.7–103% of the barium given orally in faeces after 5 d. In another study using stable barium sulphate and barium titanate, average urinary excretion by five to nine human subjects during the 24 h after oral intake varied from approximately 0.16 to 0.26 µg g−1 ingested (Clavel et al., 1987), leading other authors to conclude that absorption of these forms should be of the order of 10−4 (Leggett, 1992a). (335) LeRoy et al. (1966) found the absorption of 133Ba from simulated fall-out to be highly variable. Absorption could only be detected by whole-body counting in four of the eight subjects, and varied between 0.01 and 0.15. The analysis of barium in human excreta (Harrison et al., 1956) suggested absorption of approximately 0.07, and the fraction of dietary barium excreted in urine of two subjects in a balance study was 0.02 and 0.06 (Tipton et al., 1969). In five female cancer patients with normal gut function, absorption of 140Ba added to orange juice as the chloride was approximately 0.08, with a range of 0.03–0.16. Studies in which the absorption of barium and radium have been compared in rats, dogs, sheep, pigs, and cows have shown similar levels of absorption of the two elements (Garner, 1960; Taylor et al., 1962; Sansom and Garner, 1966; Della Rosa et al., 1967). (336) In Publication 30 (ICRP, 1979), absorption was taken to be 0.1 for all forms of barium. However, as concluded by Leggett (1992a), absorption of soluble forms of barium may be higher. On the basis of chemical similarity with radium, and similar absorption values reported for the two elements, a value of 0.2 was adopted in Publication 67 (ICRP, 1993). (337) An fA value of 0.2 for adults is recommended here for direct ingestion of soluble forms of barium. For insoluble forms such as barium sulphate or titanate, an fA value of 10−4 is recommended.
7.2.3. Systemic distribution, retention, and excretion
7.2.3.1. Summary of the database
(338) The alkaline earth element barium is a physiological analogue of the alkaline earth elements calcium, strontium, and radium, but has different biokinetic from those elements due to discrimination by biological membranes and hydroxyapatite crystals of bone. The biokinetic of barium resemble those of radium much more closely than those of calcium or strontium. (339) Retention and distribution of barium have been determined in controlled studies involving healthy human subjects (ICRP, 1973, 1993; Leggett, 1992a). There is also information on the biokinetic of barium in other animal species (Leggett, 1992b; ICRP, 1993). Data for human subjects or laboratory animals used in the development of the model for systemic barium used in this publication are summarised below in the discussion of the basis for parameter values.
7.2.3.2. Biokinetic model for systemic barium
(a) Structure of the model (340) The generic model structure for bone-volume-seeking radionuclides (Fig. 7.1) was used in Publication 67 (ICRP, 1993) to model the systemic biokinetic of barium. The same model structure is applied in this publication. The compartments and paths of movement as applied to barium are summarised below. (341) Blood plasma is treated as a uniformly mixed pool that contains all barium in blood, and exchanges activity with soft tissues and bone surfaces. Soft tissues are divided into three compartments corresponding to fast, intermediate, and slow return of activity to plasma (compartments ST0, ST1, and ST2, respectively). The liver and kidneys are not addressed separately in the model for barium, but are included implicitly in the soft tissue compartments. Bone is divided into cortical and trabecular bone, and each of these bone types is further divided into bone surfaces and bone volume. Bone volume is viewed as consisting of two pools: one that exchanges with activity in bone surfaces for a period of weeks or months, and a non-exchangeable pool from which activity can be removed only by bone-restructuring processes. Activity depositing in the skeleton is assigned to bone surfaces. Over a period of days, a portion of the activity on bone surfaces moves to exchangeable bone volume, and the rest returns to plasma. Activity leaves exchangeable bone volume over a period of months, with part of the activity moving to bone surfaces and the rest to non-exchangeable bone volume. The rate of removal from non-exchangeable bone volume is assumed to be the rate of bone turnover, with different turnover rates applying to cortical and trabecular bone. Barium is assumed to be lost from the body only by urinary and faecal excretion. (b) Parameter values (342) The parameter values for barium applied in Publication 67 (ICRP, 1993) to an adult member of the public are adopted in this publication for application to workers. The basis for the parameter values is summarised below. (343) The biological behaviour of injected or ingested barium has been investigated in several controlled studies involving human subjects (Bauer et al., 1957; LeRoy et al., 1966; Harrison et al., 1967; Newton et al., 1977, 1991, 2001; Harrison, 1981; Korsunskii et al., 1981) and several animal species (Richmond et al., 1960, 1962a,b; Farnham and Rowland, 1965; Ellsasser et al., 1969; Hardy et al., 1969; Wood et al., 1970; Cuddihy and Griffith, 1972; Stather, 1974; Domanski et al., 1980). It has been shown that the biokinetic of barium are similar but not identical to those of radium. For example, data for a healthy 60-year-old male human injected with 223Ra and 133Ba indicate similar retention of these radionuclides in blood and in the total body for several days after injection, but a slightly more rapid decline of whole-body 223Ra after a few weeks (Harrison et al., 1967; Newton et al., 1977). In human studies, administered radium and barium isotopes have been excreted primarily in faeces (Schales, 1964; Harrison et al., 1967; Maletskos et al., 1969; Korsunskii et al., 1981) and have shown fairly similar faecal excretion rates for at least 1 month after injection (Harrison et al., 1967). Barium appears to be eliminated in urine at a greater rate than radium (Harrison et al., 1967), but urinary excretion constitutes only a small fraction of total excretion of both elements in humans (Harrison et al., 1967; Korsunskii et al., 1981; Newton et al., 1991). In a study of the fate of 226Ra and 133Ba acutely ingested by eight beagles from 43 to 1500 d of age, Della Rosa et al. (1967) found that these two radionuclides were absorbed and retained with nearly the same efficiency in each animal, with 30 d retention of barium being slightly greater as an average than that of radium. In cows, radium and barium behaved similarly with regard to secretion into the gut, resorption from bone, and concentration in pigmented tissue, but differed in their rates of secretion into milk, loss in urine, and whole-body accretion (Sansom and Garner, 1966). (344) Kinetic analysis of plasma disappearance curves for normal subjects injected intravenously with radioisotopes of calcium, strontium, barium, or radium indicates that these elements initially leave plasma at a rate of several hundred plasma volumes per day, and equilibrate rapidly with an extravascular pool approximately three times the size of the plasma pool (Heaney, 1964; Harrison et al., 1967; Hart and Spencer, 1976). Total transfer rates from plasma of 70 d−1 yield reasonable fits to plasma disappearance curves for barium and radium at times greater than 1–2 h after injection (Leggett, 1992a). The rapid early removal from plasma is not addressed in this model. (345) Fractional deposition of barium in the fast-turnover soft tissue compartment ST0 is determined as the balance after other deposition fractions have been assigned. As discussed below, deposition fractions of 0.25 for bone, 0.1 for intermediate-turnover soft tissues (ST1), 0.002 for slow-turnover soft tissues (ST2), and 0.32 for excretion pathways are assigned to barium, leaving 0.328 for ST0. The derived transfer rate from plasma to ST0 is 0.328 × 70 d−1 = 23 d−1. Based on the assumed relative amounts of barium in ST0 and plasma, the transfer rate from ST0 to plasma is set at one-third the transfer rate from plasma to ST0, or 7.67 d−1. (346) Data on intermediate-term retention of injected barium in human soft tissues are largely qualitative, but indicate that little barium remains in soft tissues by a few days after injection (Korsunskii et al., 1981; Newton et al., 1991). This conclusion is consistent with direct measurements of injected, ingested, or inhaled barium in tissues of laboratory animals (Garner, 1960; Loutit and Russell, 1961; Bligh and Taylor, 1963; Wood et al., 1970; Cuddihy and Griffith, 1972). In-vitro measurements indicate that barium competes with calcium for transport across cell membranes, and in some cases may be transported in preference over calcium but may not be sequestered at intracellular sites that sequester calcium or strontium (Mullins, 1959; Shine et al., 1978; Carafoli, 1987; Tsien et al., 1987). Comparative data on the distributions of intravenously injected strontium and barium in rats (Bligh and Taylor 1963) indicate similar deposition of these elements in soft tissues, but a much higher rate of loss of barium than strontium from soft tissues. In this model, it is assumed that barium is deposited in the intermediate-term soft tissue compartment ST1 to the same extent as calcium or strontium (deposition fraction = 0.1), but returns to plasma at a much higher rate than those elements. A removal half-time of 1 d for barium is broadly consistent with soft tissue data on laboratory animals and qualitative information for human subjects. The derived transfer rate from plasma to ST1 is 0.1 × 70 d−1 = 7 d−1 and from ST1 to plasma is ln(2)/1 d = 0.693 d−1. (347) Despite the low intermediate-term retention of injected barium in soft tissues, a non-trivial portion of total-body barium can be found in human soft tissues after chronic exposure (Schroeder et al., 1972; ICRP, 1973, 1975; Schlenker et al., 1982). Much of this may reside in small, relatively insoluble deposits of barium sulphate (Garner, 1960; Schroeder et al., 1972; Van Middlesworth and Robison, 1975; Doig, 1976). In this model, ST2 is used to account for nearly all the barium in soft tissues during chronic intake. The deposition fraction for ST2 is set for consistency with the estimate that 4.7% of total-body barium resides in soft tissues of the average adult (Schlenker et al., 1982), taking account of the projected contribution of ST1 and assuming that the removal half-time from ST2 to plasma is the same as estimated for calcium (5 y). It is assumed that 0.2% of barium leaving plasma enters ST2. The derived transfer rate from plasma to ST2 is 0.002 × 70 d−1 = 0.14 d−1 and from ST2 to plasma is ln(2)/5 y = 0.00038 d−1. (348) Data from human and animal studies indicate that the rate of loss of alkaline earth elements from bone over the first few months after injection increases in the order calcium < strontium < barium < radium, and fractional long-term retention increases in the reverse order. Some element-specific parameter values are required to account for these differences, but most of the parameter values describing bone kinetics are generic (i.e. the same for each of these alkaline earth elements). The basis for applying generic values is discussed in OIR Part 2, Sections 6 and 10 (ICRP, 2016). Essentially, kinetic analysis of whole-body retention data for humans and more direct examination of alkaline earth kinetics in laboratory animals do not reveal distinct differences between these elements with regard to the following: early accumulation in bone as a fraction of activity reaching blood; initial division between trabecular and cortical bone; early rate of loss from bone, interpreted for the purposes of the present model as transfer from bone surfaces to plasma; the fraction subject to intermediate-term retention in bone, interpreted as transfer from bone surfaces to exchangeable bone volume; and the rate of removal from bone at times remote from uptake, interpreted as removal of non-exchangeable activity due to bone resorption. The following generic parameter values are applied [OIR Part 2, Sections 6 and 10 (ICRP, 2016)]: fractional deposition in bone = 0.25; fractional deposition in trabecular bone = 1.25 times that in cortical bone; half-time on bone surfaces = 1 d, with five-sixths transferring to plasma and one-sixth transferring to exchangeable bone volume; and removal rate from non-exchangeable trabecular and cortical bone volume = 18% and 3% y−1, respectively. The transfer rates for barium derived from these generic parameter values are as follows: plasma to trabecular bone surfaces = (1.25/2.25) × 0.25 × 70 d−1 = 9.72 d−1; plasma to cortical bone surfaces = (1/2.25) × 0.25 × 70 d−1 = 7.78 d−1; trabecular or cortical bone surfaces to the corresponding exchangeable bone volume compartment = (1/6) × ln(2)/1 d = 0.116 d−1; trabecular or cortical bone surfaces to plasma = (5/6) × ln(2)/1 d = 0.578 d−1; trabecular bone volume to plasma = 0.000493 d−1; and non-exchangeable cortical bone volume to plasma = 0.0000821 d−1. (349) Observed differences in the behaviour of alkaline earth elements in bone are accounted for by differences in the rate of removal from the exchangeable bone volume compartments, and the fraction transferred from exchangeable to non-exchangeable bone volume. It is assumed, in effect, that calcium, strontium, barium, and radium are all equally likely to become temporarily incorporated in bone mineral after injection into blood, but that the likelihood of reaching a non-exchangeable site in bone crystal decreases in the order calcium > strontium > barium > radium. Fractional transfers of calcium, strontium, barium, and radium from exchangeable to non-exchangeable bone volume are set at 0.6, 0.5, 0.3, and 0.2, respectively, and the balance is assumed to return to bone surfaces. The removal half-times from exchangeable bone volume are set at 100 d, 80 d, 50 d, and 30 d, respectively. These values are set to achieve reasonable consistency with whole-body retention curves for humans injected with radioisotopes of the alkaline earth elements (e.g. Harrison et al., 1967; Newton et al., 1991). The assumed fractional transfers to non-exchangeable bone volume are also reasonably consistent with results of in-vitro measurements. For example, under conditions approximating physiological, Neuman (1964) found that calcium incorporated into forming hydroxyapatite crystals is 65% non-exchangeable, and Stark (1968) determined discrimination factors relative to calcium of 0.93 for strontium, 0.56 for barium, and 0.32 for radium in forming crystals. Such in-vitro results have varied, to some extent, with experimental conditions, length of aging of the crystals, and the definition of discrimination (Neuman, 1964; Stark, 1968). (350) For barium, the above estimates of the removal half-time from exchangeable bone volume and the fractional transfers to non-exchangeable bone volume and bone surfaces yield the following transfer rates: exchangeable to non-exchangeable bone volume (cortical or trabecular) = 0.3 × ln(2)/50 d = 0.0042 d−1; and exchangeable bone volume to bone surfaces = 0.7 × ln(2)/50 d = 0.0097 d−1. (351) Based on estimates from human studies (Harrison et al., 1967; Newton et al., 1991), it is estimated that approximately 32% of barium leaving plasma is deposited in excretion pathways, and that the ratio of urinary to faecal excretion is approximately 1:9. The derived transfer rate from plasma to urinary bladder contents is 0.1 × 0.32 × 70 d − 1 = 2.24 d−1 and from plasma to right colon contents is 0.9 × 0.32 × 70 d−1 = 20.16 d−1. (352) Newton et al. (1991, 2001) conducted a long-term study of the biokinetic of 133Ba in six healthy adult male subjects. Data for the first 3 y of that study were considered in the development of the systemic model (Leggett, 1992b) adopted in Publication 67 (ICRP, 1993) and used in the present publication. External measurements of whole-body retention of 133Ba in each subject were continued until recently (Newton et al., 2001), providing a check on model predictions through approximately 13 y post injection. Model predictions are compared in Fig. 7.2 with the reported data. Transfer rates (d−1) for barium. Exch, exchangeable; nonexch, non-exchangeable. ST0, ST1, and ST2 represent soft tissues with fast, intermediate, and slow turnover, respectively. Monitoring techniques for 133Ba. Monitoring techniques for 140Ba. Committed effective dose coefficients (Sv Bq−1) for the inhalation or ingestion of 133Ba and 140Ba compounds. AMAD, activity median aerodynamic diameter. Dose per activity content of 133Ba in total body and in daily excretion of urine (Sv Bq−1); 5-µm activity median aerodynamic diameter aerosols inhaled by a reference worker at light work. Dose per activity content of 140Ba in total body and in daily excretion of urine (Sv Bq−1); 5-µm activity median aerodynamic diameter aerosols inhaled by a reference worker at light work. NA, not applicable. Isotopes of iridium addressed in this publication. EC, electron-capture decay; B+, beta-plus decay; B−, beta-minus decay; IT, isomeric transition decay. Dose coefficients and bioassay data for this radionuclide are given in the printed copy of this publication. Data for other radionuclides listed in this table are given in the accompanying electronic annex.


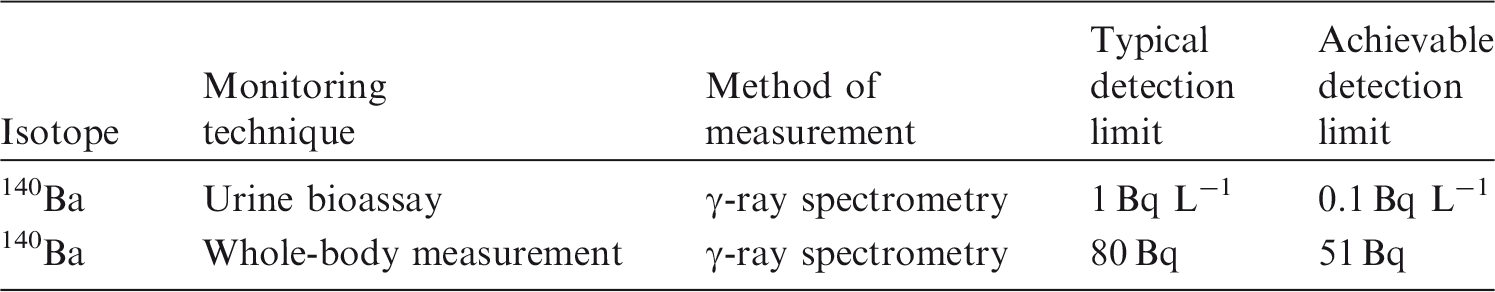


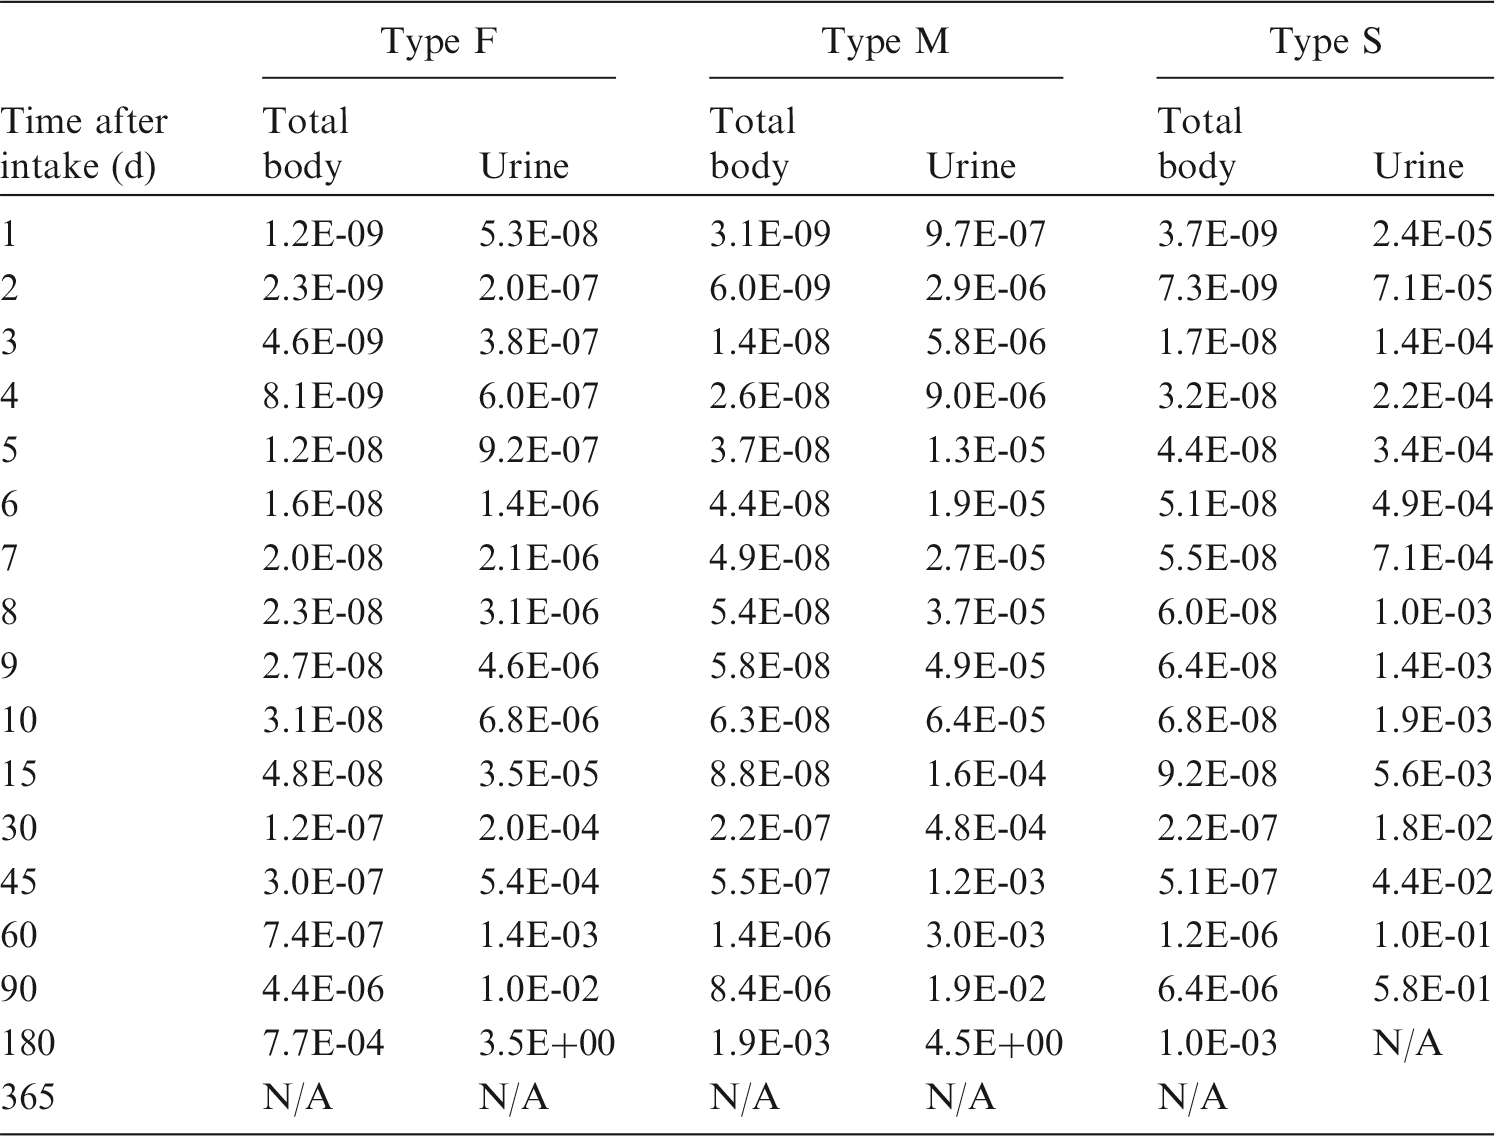

7.2.3.3. Treatment of radioactive progeny
(353) The radioactive progeny addressed in the derivation of dose coefficients for radioisotopes of barium are isotopes of barium, caesium, lanthanum, and cerium. (354) Barium, caesium, lanthanum, and cerium atoms produced in vivo following intake of barium are assumed to follow the characteristic models for these elements (i.e. the models applied in the OIR series to these elements as parent radionuclides) from their time of production, insofar as application of this assumption is straightforward. This assumption is sometimes ambiguous due to differences in model structures for the different elements. That is, the site of production of a radionuclide may not be clearly identifiable with a specific compartment in its characteristic model. In such cases, a transfer rate from the site of production of the radionuclide to the central blood compartment in the radionuclide’s characteristic model has been assigned as described below. After reaching its central blood compartment, the radionuclide is assumed to behave as described by its characteristic model. (355) A caesium atom produced in a soft tissue compartment of the barium model is assumed to transfer to the plasma compartment of the characteristic model for caesium at the rate 1000 d−1, a default value used in this publication to describe rapid biological transfer. Caesium produced in a bone volume compartment of the barium model transfers to the central blood compartment at the rate of bone turnover. Caesium produced in a bone surface compartment transfers to plasma at the rate of removal from bone surface compartments given in the characteristic model for caesium (0.212 d−1). A caesium atom produced in the blood compartment of the barium model is assumed to be produced in the plasma compartment of the characteristic model for caesium. (356) The characteristic model for lanthanum and cerium (the same model is applied to both elements) will appear in a later part of this series. The reader is referred to a paper by Taylor and Leggett (2003) for a description of the model. In this publication, a lanthanum or cerium atom produced in a soft tissue compartment of the barium model is assumed to transfer to the blood compartment of the lanthanum/cerium model with a half-time of 0.5 d. This is the shortest biological half-time for any soft tissue compartment in the lanthanum/cerium model. A lanthanum or cerium atom produced in a bone compartment of the barium model is assumed to be removed to blood at the rate of bone turnover.
7.3. Individual monitoring
7.3.1. 133Ba
(357) Monitoring of 133Ba is usually accomplished through urine bioassay. Total body content and daily urinary excretion of 133Ba following inhalation of 1 Bq Type F.

7.3.2. 140Ba
(358) Monitoring of 140Ba is usually accomplished through urine bioassay. Whole-body measurement may also be used.
7.4. Dosimetric data for barium
Total body content and daily urinary excretion of 133Ba following inhalation of 1 Bq Type M. Total body content and daily urinary excretion of 133Ba following inhalation of 1 Bq Type S. Total body content and daily urinary excretion of 140Ba following inhalation of 1 Bq Type F. Total body content and daily urinary excretion of 140Ba following inhalation of 1 Bq Type M. Total body content and daily urinary excretion of 140Ba following inhalation of 1 Bq Type S.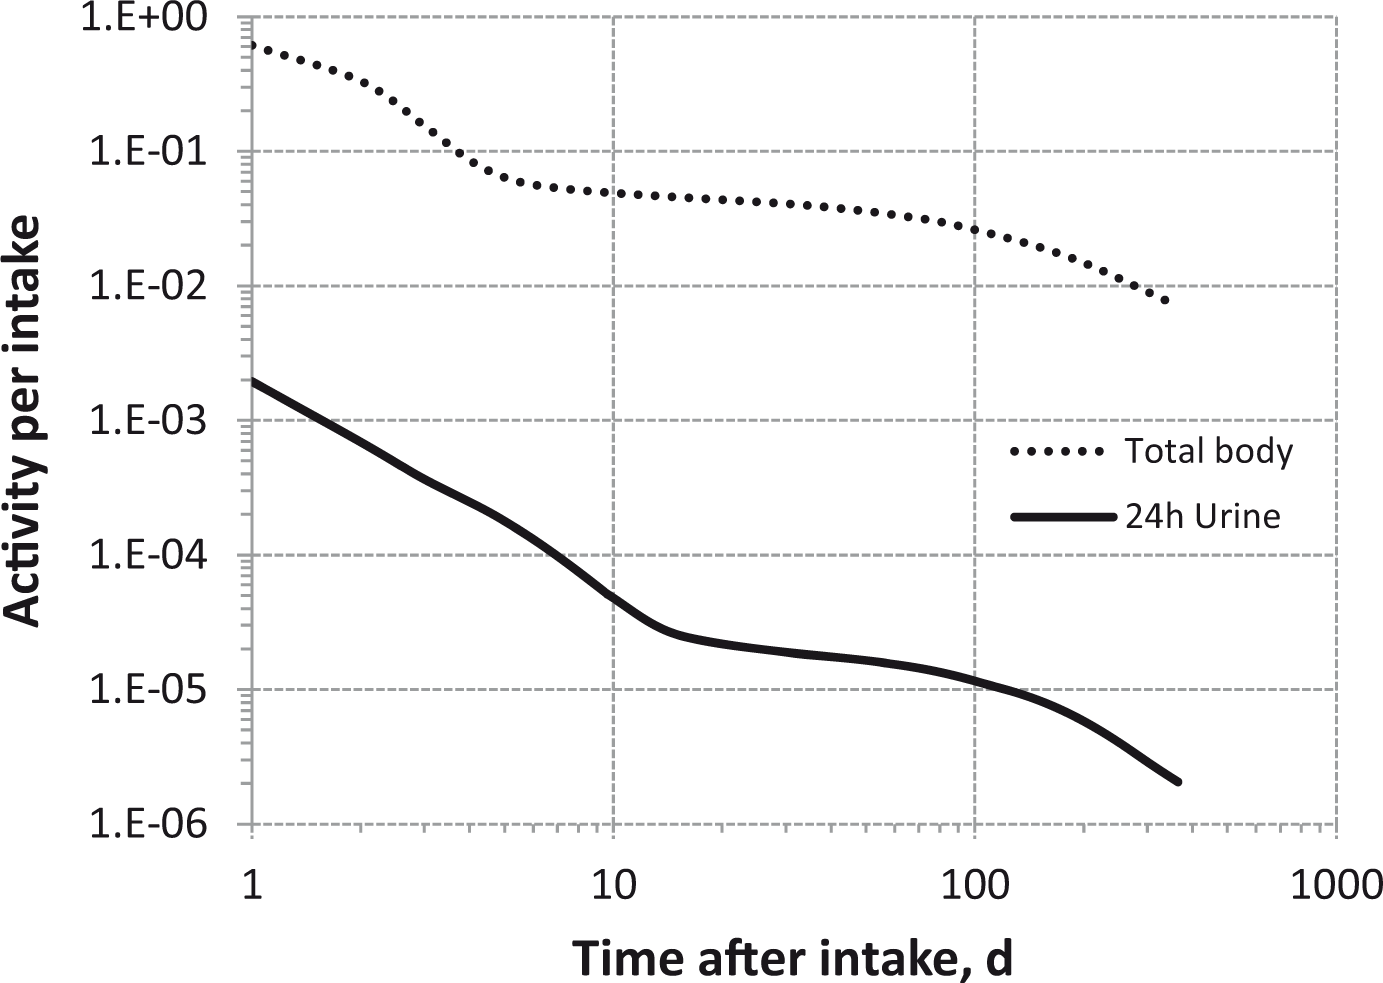


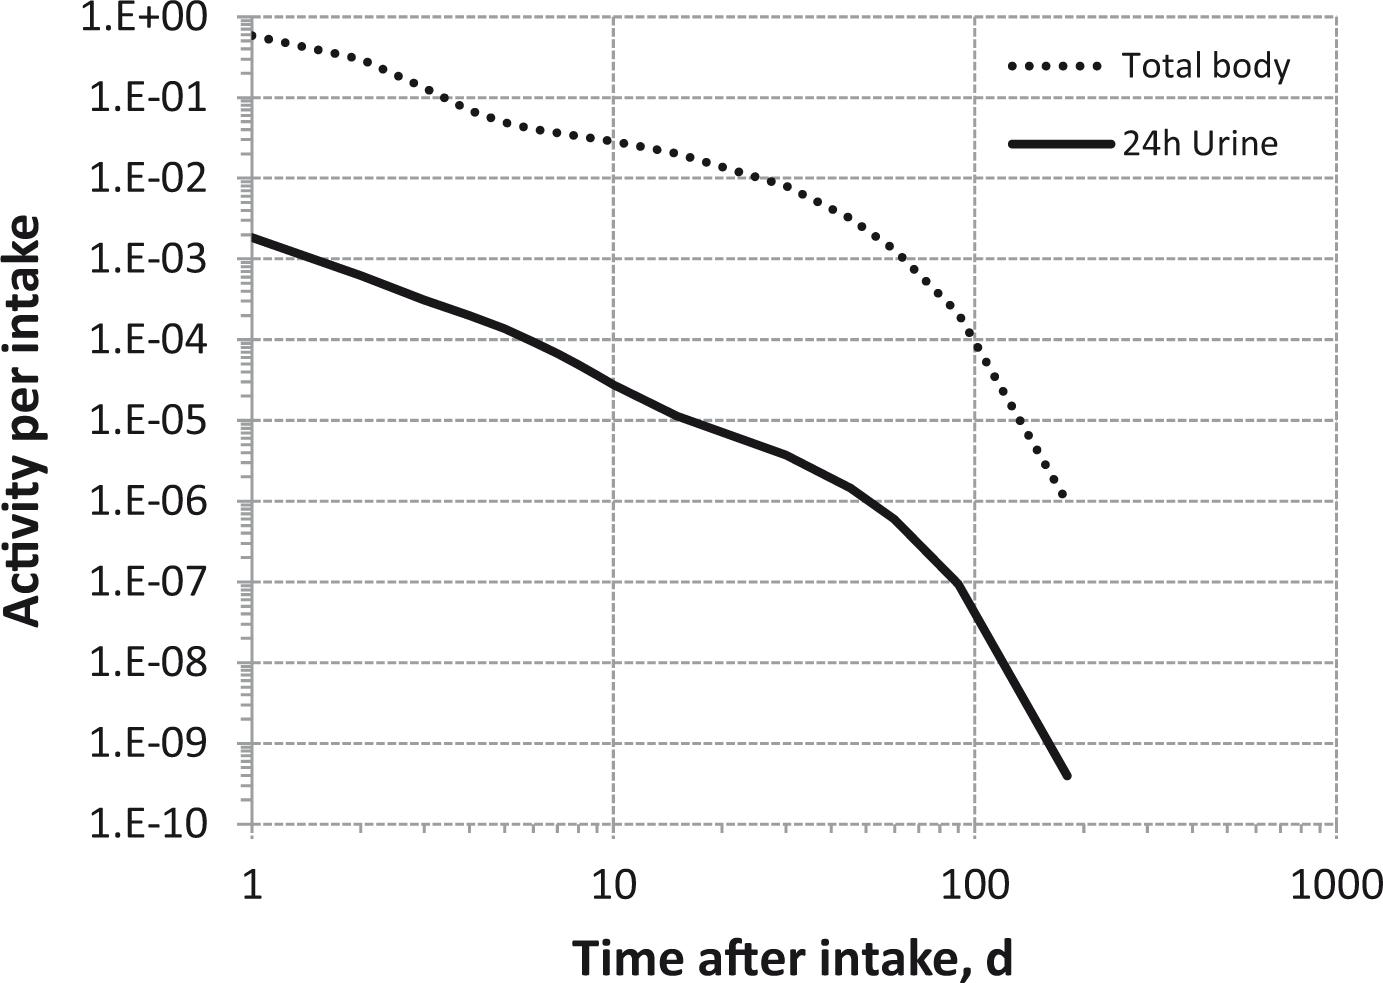
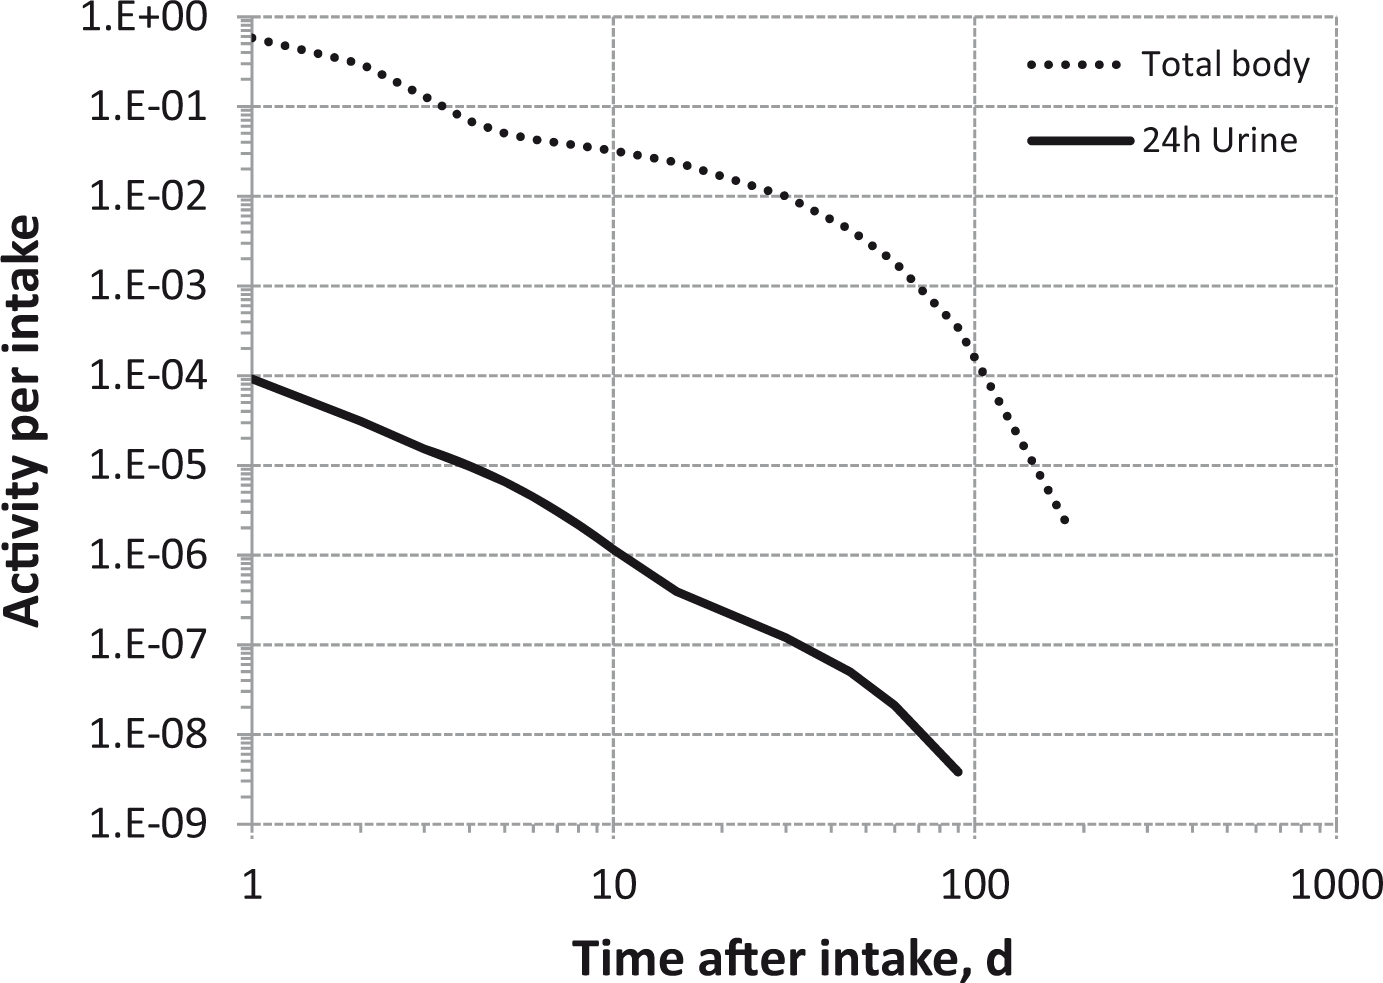
7.5. References
8. IRIDIUM (Z = 77)
8.1. Chemical forms in the workplace
(359) Iridium is a transition metal that occurs mainly in oxidation states III and IV. Iridium may be encountered in industry in a variety of chemical and physical forms, including oxides (IrO2, Ir2O3), chlorides, and fluorides. Iridium also forms a number of organometallic compounds, such as iridium carbonyl. (360) 192Ir is used as a gamma-radiation brachytherapy source for the treatment of cancer.
8.2. Routes of intake
8.2.1. Inhalation
(361) Some information was found on the behaviour of inhaled iridium in human subjects following accidental intake. Information on absorption from the respiratory tract is available from experimental studies of iridium chloride and elemental iridium. (362) Absorption parameter values and types, and associated fA values for particulate forms of iridium are given in Table 8.2. Absorption parameter values for inhaled and ingested iridium. It is assumed that the bound state can be neglected for iridium, i.e. fb = 0. The values of sr for Type F, M, and S forms of iridium (30, 3, and 3 d–1, respectively) are the general default values. Materials (e.g. iridium chloride) are listed here where there is sufficient information to assign to a default absorption type, but not to give specific parameter values (see text). For inhaled material deposited in the respiratory tract and subsequently cleared by particle transport to the alimentary tract, the default fA values for inhaled materials are applied; i.e. the product of fr for the absorption type and the fA value for ingested soluble forms of iridium (0.01). Default Type M is recommended for use in the absence of specific information on which the exposure material can be assigned to an absorption type; for example, if the form is unknown, or if the form is known but there is no information available on the absorption of that form from the respiratory tract. Activity transferred from systemic compartments into segments of the alimentary tract is assumed to be subject to re-absorption to blood. The default absorption fraction fA for the secreted activity is the reference fA (0.01) for ingestion of the radionuclide.

8.2.1.1. Particulate materials
(a) Iridium chloride (363) Kreyling et al. (2002) followed the biokinetic of 192Ir for 7 d after intratracheal instillation of 192IrCl3 into rats. By 7 d, approximately 8% ILD remained in the lungs, 10% ILD in soft tissues and bone, and smaller amounts in other tissues; 60% was excreted in urine and 10% in faeces (mostly in the first 3 d). Similar results (unpublished) were obtained following inhalation (Kreyling, 2010). Analysis here (i.e. by the Task Group) gave fr of approximately 0.9. There is insufficient information to estimate other parameter values precisely, but the low faecal excretion suggests that the rapid dissolution rate is high compared with particle transport rates from the upper respiratory tract (100 d–1 or more). The results thus indicate assignment to Type F. (b) Elemental iridium (metal/oxide) (364) Casarett et al. (1960) followed the biokinetic of 192Ir for 28 d after inhalation by rats of the aerosol formed by nebulising an aqueous suspension of 192Ir-labelled iridium. They estimated that approximately 95% of the initial deposit deposited in the upper respiratory tract. Only approximately 0.2% of the initial deposit was retained in the lungs after 2 d, clearing with a half-time of approximately 23 d. Immediately after inhalation, approximately 5% of the initial deposit was found in the carcass, which decreased to approximately 0.5% by 14 d with a corresponding increase in urinary excretion. These results suggest that the rapid dissolution rate is high compared with the particle transport rate from the upper respiratory tract (100 d–1 or more). On that assumption, analysis here gave fr of approximately 0.1, indicating assignment to Type M or S. (365) Kreyling et al. (2002) and Semmler et al. (2004) used 192Ir-labelled particles produced with a spark generator (an intermittent arc between two electrodes in argon) as relatively inert particles to study the biokinetic of inhaled ultrafine particles, especially particle transport pathways. The aerosol, produced by evaporation and condensation, consists of agglomerates of primary particles of approximately 2–5-nm diameter. Analysis showed the iridium nanoparticles to be oxidised at the surface (Szymczak et al., 2006). The aerosol was administered (via an endotracheal tube) to rats which were intubated and ventilated to avoid extrathoracic deposition and to optimise deep lung deposition. In a complementary experiment in which a suspension of the particles was administered via the oesophagus, no detectable 192Ir was observed in urine (Kreyling et al., 2002), which suggests that fractional absorption from the alimentary tract fA was less than 10−4. (366) Kreyling et al. (2002) followed the biokinetic of 192Ir for 7 d after inhalation (via an endotracheal tube) by rats of 15- and 80-nm count median diameter agglomerates of 192Ir-labelled particles, or intratracheal instillation of a particle suspension (15-nm count median diameter). By 7 d after inhalation, 47% and 36% of the deposited 15- and 80-nm particles had cleared, predominantly to faeces. Following inhalation of both aerosols, urinary excretion by 7 d was approximately 2% ILD, and following instillation, approximately 0.1% ILD. For both aerosols, a few percent of ILD was found in tissues other than the lung, but most of this 192Ir was attributed to particle translocation, rather than dissolution. Semmler et al. (2004) followed the biokinetic of 192Ir for 180 d after inhalation (via an endotracheal tube) of 15-nm count median diameter agglomerates of 192Ir-labelled particles. As in the study by Kreyling et al. (2002), only small fractions of ILD were found in tissues other than the lung, and most was attributed to particle translocation. Based on these results, those of Kreyling et al. (2002), and unpublished excretion data (Kreyling, 2010), parameter values assessed here were fr = 0.0 and ss = 0.01 d–1, giving assignment to Type M. (367) Cool et al. (1979) and Brodsky and Wald (2004) followed lung retention and excretion of 192Ir for 2 y after accidental inhalation of iridium aerosol (produced by cutting into a source) by two workers. Biological retention half-times assessed from lung retention and faecal excretion were in the range 700–3000 d, and it was reported that urine samples showed only ‘low activity’, indicating assignment to Type S. (368) Whole-body retention of 192Ir was followed for 4 months after accidental inhalation by a worker of aerosol (considered to be metal or oxide) produced by grinding the tip of an electrode which had been used to seal 192Ir sources for industrial radiography by electrowelding (IAEA, 1999). Partial-body monitoring showed the highest count rate above the chest. There was little clearance after 13 d, indicating assignment to Type S. (c) 192Ir-labelled carbon (369) Kreyling et al. (2009) produced carbon chain aggregates (count median diameter ∼25 nm) containing a small fraction (<1%) of 192Ir ultrafine (2–5 nm) particles by spark discharge between an 192Ir-labelled iridium electrode and a graphite rod. At 24 h after inhalation (via an endotracheal tube) by rats, particle translocation to tissues (measured by 192Ir activity) was less than for 20-nm pure iridium (see above).
8.2.1.2. Rapid dissolution rate for iridium
(370) The experimental information for iridium chloride and elemental iridium suggests that the rate is high compared with particle transport rates from the upper respiratory tract (100 d–1 or more), but is insufficient to provide an estimate. There is therefore no justification for choosing a rate different from the general default value of 30 d–1, which is applied here to all Type F forms of iridium.
8.2.1.3. Extent of binding of iridium to the respiratory tract
(371) Information from the iridium chloride study outlined above suggests that approximately 10% of iridium deposited in the lungs in soluble form is retained. However, there is no evidence that it is retained in the bound state rather than in particulate form. It is therefore assumed that the bound state can be neglected for iridium (i.e. fb = 0.0).
8.2.2. Ingestion
(372) No human data are available on the absorption of iridium from the gastrointestinal tract. (373) The fractional absorption of iridium, administered as chloride (Na2192IrCl6), has been measured in several mammalian species (mouse, rat, monkey, and dog) and ranged from 0.01 in mice to approximately 0.04 in monkeys (Furchner et al., 1971). (374) In Publication 30 (ICRP, 1979), an absorption value of 0.01 was recommended. Since no new data on the gastrointestinal absorption seem to be available, an fA value of 0.01 is adopted here for all chemical forms.
8.2.3. Systemic distribution, retention, and excretion
8.2.3.1. Summary of the database
(a) Data for human subjects (375) Data on the biokinetic of iridium in human subjects are primarily from cases of accidental intake of 192Ir (Cool et al., 1979; Kelsey and Mettler, 2001; Brodsky and Wald, 2004). The case studies provide little information on the systemic behaviour of iridium. (b) Data for laboratory animals (376) Casarett et al. (1960) studied the biokinetic of acutely inhaled metallic 192Ir in rats. The count median diameter of the particles was 0.07 µm with σg of approximately 1.5. Several rats were sacrificed immediately after exposure for determination of deposition in the respiratory tract, and pairs of rats were sacrificed at 3 h after exposure and at 1, 3, 6, 9, 13, and 14 d after exposure. Excretion was measured in some animals up to 28 d. Mean deposition in the respiratory tract was approximately 58% of the inhaled activity. More than 95% of the deposition was in the upper respiratory tract. The half-time of the initial phase of clearance was 2–4 h, and the half-time of the second phase was approximately 24 h. Activity was found in liver in two rats immediately after exposure and in one rat at 3 h after exposure, amounting to approximately 0.2–0.6% of the deposited amount. In other rats, no significant activity was found in liver or other tissues excluding skin, except for spleen in two rats (0.14% at time zero and 0.02% at 3 d) and bone in two rats (0.55% at time zero and 0.14% at 3 h). Small but measurable activities were found in skin throughout the 28-day study. Urinary and faecal excretion accounted for less than 4% and more than 96% of the deposited amount, respectively, over 28 d. The urinary excretion rate averaged over 48-h periods was on the order of 1% d−1 for 0–2 d, 0.1% d−1 for 10–12 d, and 0.01% d−1 for 26–28 d. (377) Durbin et al. (1957) and Durbin (1960) described the results of tracer studies with 190Ir or 192Ir in rats. Kidney, liver, and spleen were the main deposition sites. Excretion was mainly in urine. After intravenous injection, 36% was excreted in urine in the first 4 h. At 1 d, the liver, kidneys, bone, blood, and muscle of rats contained 19.3%, 4%, 3.1%, 6.4%, and 5.6%, respectively, and excretion accounted for 43.5% of the administered amount. By 33 d, 45% was excreted in urine and 35% in faeces, and approximately 12% remained in liver, skin, and muscle. (378) Furchner et al. (1971) studied the systemic behaviour of 192Ir in mice, rats, monkeys, and dogs after oral administration, intravenous injection, or intraperitoneal injection of Na2192IrCl6. Cumulative urinary excretion during the first 2 d after oral intake averaged 0.86% of the administered amount in mice, 2.02% in Mystromys rats, 0.96% in Sprague-Dawley rats, 1.34% in monkeys, and 3.54% in dogs. These results indicate that average fractional uptake by the gastrointestinal tract was higher than the value of 0.01 applied to iridium in Publication 68 (ICRP, 1994). Whole-body retention over several months following intravenous or intraperitoneal injection was similar in dogs, mice, Mystromys rats, and Sprague-Dawley rats (Fig. 8.1). Monkeys showed lower excretion rates initially than dogs, mice, or rats but a faster drop in the body burden than the other species at times remote from injection (Fig. 8.1). Whole-body retention in all species could be described in terms of three components with average biological half-times on the order of a few hours, a week, and several months (120–375 d). On average, the rapid phase of loss represented approximately 20% (9–27%) of the administered amount, compared with mean excretion of 43.5% in rats receiving 190Ir or 192Ir chloride by intravenous injection as reported by Durbin (1960). The long-term component represented at least 46% of the administered amount in all species. As illustrated in Table 8.3, whole-body retention curves based on the different animal species and different modes of injection give fairly similar cumulative activities in the body for iridium isotopes with a range of half-lives. The distribution of activity was determined in rats over the first 120 d after intraperitoneal injection. The retention times in individual organs approximately paralleled that in the whole body. Highest concentrations were found in spleen, kidneys, and liver, in that order. The concentration in bone was a factor of 2–3 lower than that of liver, but was higher than the average concentration in the body. The liver, kidneys, and bone contained approximately 15%, 5%, 1–2%, and 10% of total-body content, respectively, during the observation period. The authors concluded from comparison with injection data of Durbin et al. (1957) for rats that the rate of loss of iridium from the body depends on the chemical form reaching blood. (379) Ando et al. (1989) determined the distribution of 192Ir in rats at 3, 24, and 48 h after intravenous injection of H2192IrCl6. Cumulative urinary excretion at 3 h represented 79.8% of injected 192Ir. At all three observation times, the highest concentration was found in kidneys, followed by liver. In contrast to findings of Durbin et al. (1957) and Furchner et al. (1971), the concentration of iridium in the spleen was an order of magnitude lower than that of kidney and a factor of 3–4 lower than that of liver. (380) Hirunuma et al. (1997) studied uptake, retention, and excretion of 17 trace elements including iridium in Wistar rats over the first 6 d after oral intake of radioisotopes of these elements in a hydrochloric acid solution. Iridium was found in liver, kidney, and intestinal tissue, with the kidneys generally showing the highest concentration. Iridium was not detectable by the multi-tracer technique in brain, skeletal muscle, bone, spleen, testes, or blood. On Day 3, the liver, kidneys, and intestines contained approximately 0.35%, 0.26%, and 0.13%, respectively, of the administered iridium. On Day 6, these three organs contained approximately 0.11%, 0.13%, and 0.04%, respectively, of the administered iridium. Over the 6-day study, approximately 90% of the administered iridium was excreted in faeces and 7.7% was excreted in urine, indicating that most of the absorbed iridium was excreted during the short study period. Cumulative activities of iridium isotopes in the whole body based on retention curves derived by Furchner et al. (1971). Values for a given isotope are normalised to the value for that isotope in dogs. Intravenous injection. Intraperitoneal injection. Whole-body retention of 192Ir in laboratory animals following intravenous or intraperitoneal injection of Na2192IrCl6 (curve fits reported by Furchner et al., 1971). Curve 1, dogs, intravenous injection, observation period 304 d; curve 2, monkeys, intravenous injection, observation period 227 d; curve 3, mice, intravenous injection, observation period 352 d; curve 4, rats, intravenous injection, observation period 280 d; curve 5, mice, intraperitoneal injection, observation period 364 d; curve 6, rats, intraperitoneal injection, observation period 371 d.


8.2.3.2. Biokinetic model for systemic iridium
(381) Biokinetic data for iridium summarised above indicate that whole-body retention is not predictable on the basis of body size, and does not vary greatly from one species to another. Three phases of excretion of absorbed or intravenously injected iridium are indicated: a rapid phase of loss, primarily in urine, with a half-time of a few hours; an intermediate phase of loss with a half-time on the order of 1–2 weeks; and a slow phase of loss with a half-time of several months. The fraction of uptake associated with each of these phases is variable and depends on the form of iridium reaching blood. For example, the fraction associated with the rapid phase of loss in urine has varied from less than 0.1 to 0.8 or more. The rate of loss from individual tissues approximately parallels that in the whole body. Concentrations of iridium in the kidneys and liver are much higher than those in most other tissues. Elevated uptake of iridium by the spleen is indicated by some data, but findings are inconsistent. Data on rats indicate that the liver contains approximately 15–20% of the systemic content during the first few months after input to blood. Most studies indicate that kidneys and bone accumulate less iridium than the liver. (382) The structure of the biokinetic model for systemic iridium is shown in Fig. 8.2. Transfer coefficients are listed in Table 8.4. Whole-body retention data of Furchner et al. (1971) for dogs were used as a guide for model parameters. The retention data for dogs are typical of the studied species. (383) In the model for iridium, urinary excretion is assumed to arise from transfer of activity from blood into the urinary bladder contents as well as transfer from blood to the kidneys (urinary path) and subsequent release to the urinary bladder contents over a period of days. Faecal excretion is assumed to arise, in part, from biliary secretion into small intestine contents from a liver compartment (Liver 1) and, in part, from secretion from Blood 1 into small intestine contents. The parameter values are set so that the two sources of faecal excretion contribute equally to endogenous faecal excretion of iridium, in the absence of specific data on relative contributions of these sources. Deposition fractions and removal half-times for compartments are set to reproduce different phases of loss of iridium from the total body as observed in laboratory animals. (384) Clearance of iridium from blood is modelled on the basis of human data for the chemically related element ruthenium (Veronese et al., 2003, 2004). Blood is divided into two compartments: ‘Blood 1’ and ‘Blood 2’. Iridium entering blood is assigned to Blood 1, which is a rapid-turnover pool. Blood 2 is a more slowly exchanging pool that contains the preponderance of activity in blood, except for a short period soon after acute uptake of iridium. Activity leaves Blood 1 at the rate 100 d−1, corresponding to a half-time of approximately 10 min, with 27% of outflow going to Blood 2 and the remaining 73% divided among tissue compartments, urinary bladder contents, and gastrointestinal contents. Activity moves from Blood 2 back to Blood 1 with a half-time of 1 d. (385) In addition to the 27% of outflow from Blood 1 assigned to Blood 2, outflow from Blood 1 is assumed to be distributed as follows: 12% to liver, 6% to kidneys, 8% to bone, 12% to urinary bladder contents, 4% to small intestine contents, and the remainder (31%) to ‘other’. Activity entering liver is assigned to a compartment called ‘Liver 1’ that has relatively fast turnover. Two-thirds of the activity entering kidneys (4% of outflow from Blood 1) is assigned to urinary path and one-third (2%) to other kidney tissue; thus, a total of 12% + 4% = 16% of activity leaving Blood 1 enters the urinary excretion pathways. Activity depositing in bone is divided between cortical bone surfaces and trabecular bone surfaces in the ratio 1:3 as assumed in the OIR series for all platinum metals. Activity entering ‘other’ is divided as follows: fast-turnover compartment ST0, 15%; intermediate turnover compartment ST1, 15%; and slow-turnover compartment ST2, 1%. (386) Activity transfers from Liver 1 with a half-time of 5 d, with one-third going to the small intestine contents (biliary secretion), one-half to Liver 2, and one-sixth to Blood 1. Activity transfers from Liver 2 to Blood 1 with a half-time of 100 d. Activity transfers from urinary path to urinary bladder contents with a half-time of 5 d, and from other kidney tissue to Blood 1 with a half-time of 100 d. Activity in soft tissue compartments ST0, ST1, and ST2 returns to Blood 1 with half-times of 10 d, 100 d, and 2 y, respectively. Activity leaves cortical and trabecular bone surfaces with a half-time of 30 d, with 80% returning to Blood 1 and 20% entering the corresponding bone volume compartment. Activity is transferred from the bone volume compartments to Blood 1 at the rate of bone turnover. (387) As illustrated in Fig. 8.3, model predictions are consistent with whole-body retention of iridium as determined in dogs after intravenous injection with 192Ir (Furchner et al., 1971). Transfer coefficients for systemic iridium. ST0, ST1, and ST2 represent soft tissues with fast, intermediate, and slow turnover, respectively. Comparison of model predictions of whole-body retention of iridium with observations for dogs. Data points derived from whole-body retention curve reported by Furchner et al. (1971) for dogs injected intravenously with Na2192IrCl6. Structure of the biokinetic model for systemic iridium. SI, small intestine. ST0, ST1, and ST2 represent soft tissues with fast, intermediate, and slow turnover, respectively.

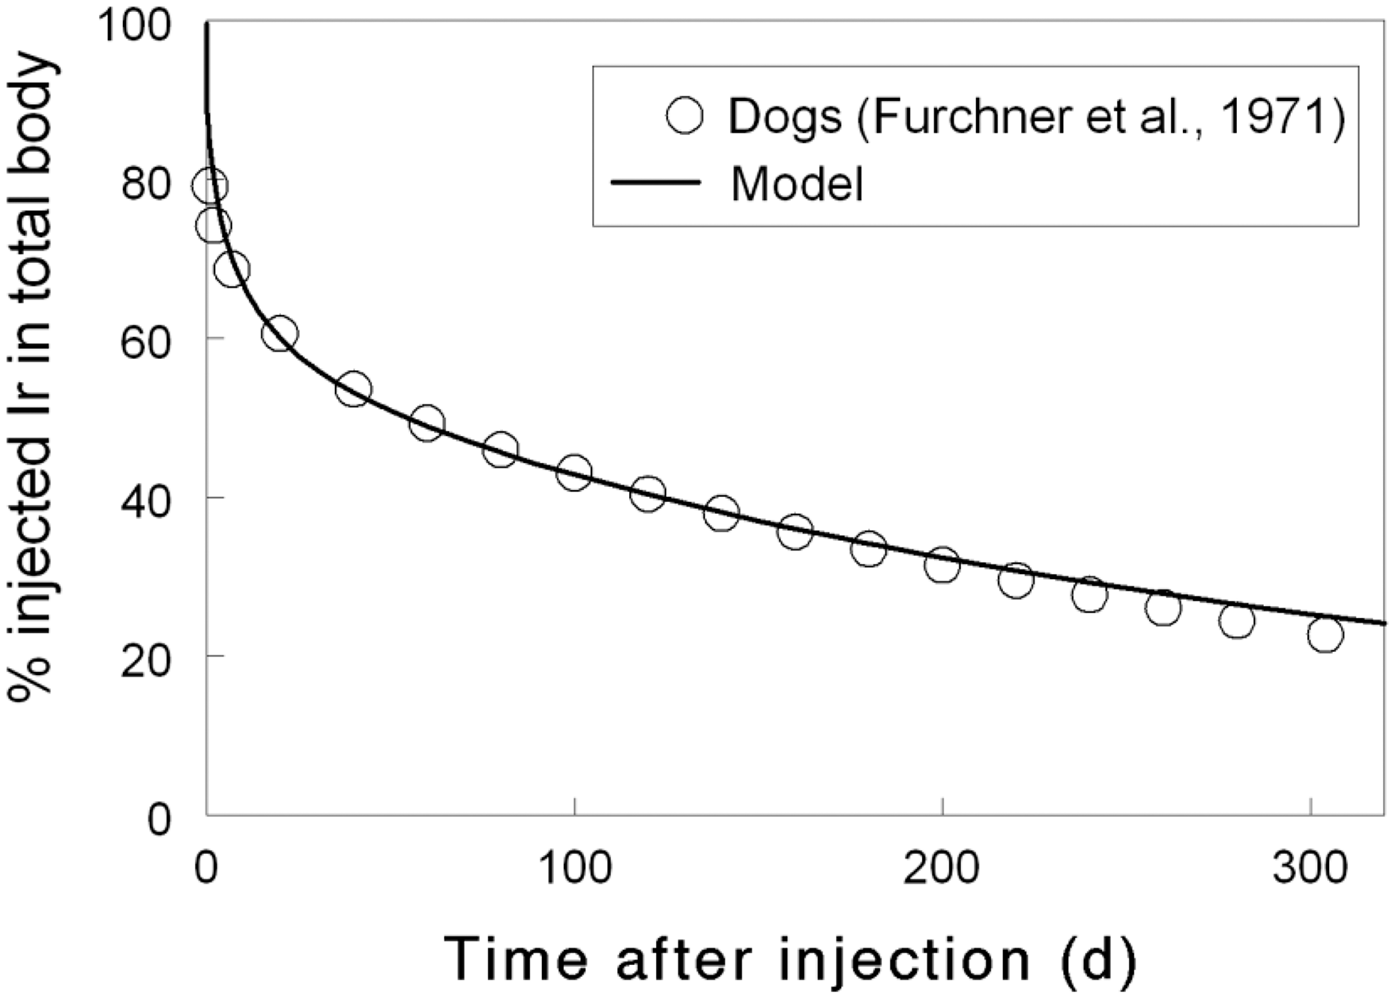

8.2.3.3. Treatment of radioactive progeny
(388) Chain members addressed in the derivation of dose coefficients for isotopes of iridium are isotopes of iridium, platinum, osmium, and rhenium. (389) Platinum and osmium are members of the platinum group, which also contains iridium, ruthenium, rhodium, and palladium. These six metals are chemically similar and generally are found together in ores. (390) The systemic biokinetic of ingested, inhaled, or injected platinum have been studied in laboratory animals, mainly rats, and to some extent in human subjects (Durbin et al., 1957; Durbin, 1960; Lange et al., 1973; Smith and Taylor, 1974; Moore et al., 1975a,b,c; Yoakum et al., 1975; Litterst et al., 1976; Hirunuma et al., 1997). Platinum shows a high rate of urinary excretion in the early days after administration. Some but not all studies also indicate a relatively high rate of faecal excretion. Following intravenous administration of platinum isotopes as the chloride to rats, highest concentrations were generally found in the kidneys, followed by the liver (Durbin et al., 1957; Moore et al., 1975a,b,c). At 1 month, the rats contained approximately 10–15% of the intravenously injected activity. (391) Biokinetic studies of platinum in human subjects have focused on the behaviour of the antitumour agent cis-diamminedichloroplatinum (II) (DDP) (Lange et al., 1973; Smith and Taylor, 1974). In these studies, the biokinetic of the platinum label were similar to the behaviour of other forms of platinum following their administration to laboratory animals. Following intravenous administration of 195mPt-labelled DDP to two cancer patients, approximately 35% of the injected activity was excreted in urine during the first 3.5 d (Smith and Taylor, 1974). At most, a few percent of the activity was excreted in faeces during that time. Based on external measurements, the liver accumulated approximately 10% of the injected activity during the first day. The biological removal half-times of activity from the liver and total body from Day 1 to 7 were estimated as 8 and 10 d, respectively. The study period was too short to determine any longer-term components of retention. (392) Biokinetic studies on rodents (Durbin et al., 1957; Durbin, 1960; Weininger et al., 1990; Jamre et al., 2011) indicate that the systemic behaviour of osmium is similar to that of platinum and the other members of the platinum group. The systemic distribution of osmium at 1 d after intravenous injection closely resembled that of platinum (Durbin et al., 1957; Durbin, 1960). Highest concentrations of intravenously injected osmium generally occur in the kidneys and liver. Excretion of osmium is primarily in urine. Durbin et al. (1957) and Durbin (1960) found that the rate of excretion of osmium was initially higher than that of other members of the platinum group. This may reflect differences in the administered forms of these elements or experimental conditions, as osmium was administered as NaHOsO5 or OsO4 while the other elements were administered as chloride compounds. Also, studies on mice indicate that the excretion rate of osmium depends on the pH of the injected solution, with longest retention observed at relatively low pH (Weininger et al., 1990). The total-body retention curves over the first 4 weeks following intravenous administration of osmium to mice at relatively low pH (4.5–5.1) were similar to the retention pattern observed by Moore et al. (1975a,b,c) for systemic platinum in rats. (393) In this publication, the same biokinetic model is applied to osmium and platinum as progeny of systemic iridium. The model is a modification of the characteristic biokinetic model for ruthenium used in this publication. The ruthenium model is modified by shifting a portion of the deposition in bone and soft tissue compartments ST1 and ST2 to the urinary bladder contents and kidneys. Specifically, the ruthenium model is modified for application to osmium and platinum as iridium progeny by the following changes in transfer coefficients: Blood 1 to trabecular bone surfaces, reduced from 6 d−1 to 3 d−1; Blood 1 to cortical bone surfaces, reduced from 2 d−1 to 1 d−1; Blood 1 to ST1, reduced from 5 d−1 to 2.5 d−1; Blood 1 to ST2, reduced from 5 d−1 to 2.5 d−1; Blood 1 to urinary bladder contents, increased from 17 d−1 to 23 d−1; Blood 1 to Kidneys 1 (urinary path), increased from 7.76 d−1 to 10.67 d−1; and Blood 1 to Kidneys 2 (other kidney tissue), increased from 0.24 d−1 to 0.33 d−1. These modifications leave the total outflow rate from the central blood compartment, Blood 1, unchanged at 100 d−1. (394) An osmium or platinum atom produced in vivo following intake of iridium is assigned the model for these elements described above from its time of production. This is straightforward for osmium and platinum atoms because their preceding chain members are also members of the platinum group, and all members of this group have the same model structure. Each compartment in the model for osmium and platinum is identified with the iridium compartment with the same name. (395) Rhenium is a member of Group VIIA of the periodic table and exhibits chemical and biokinetic properties remarkably close to those of the adjacent Group VIIA element technetium (Durbin et al., 1957; Deutsch et al., 1986; Yanaga et al., 1996, Dadachova et al., 2002; Zuckier et al., 2004). Rhenium and technetium presumably become covalently bound with oxide ions to form the structurally similar anions perrhenate (ReO4−) and pertechnetate (TcO4−) in the body and in many environment settings. These two anions have important medical applications as close physiological analogues of iodide, with the important exception that there is little, if any, organic binding of perrhenate or pertechnetate in the thyroid. The systemic biokinetic model applied in this publication to technetium as a member of ruthenium chains (see Section 2) is also applied to rhenium as a member of iridium chains.
8.3. Individual monitoring
(396) 192Ir may be detected in urine or whole-body counting.
8.4. Dosimetric data for iridium
Total body and lung contents, and daily urinary excretion of 192Ir following inhalation of 1 Bq Type F. Total body and lung contents, and daily urinary excretion of 192Ir following inhalation of 1 Bq Type M. Total body and lung contents, and daily urinary excretion of 192Ir following inhalation of 1 Bq Type S. Monitoring techniques for 192Ir. Lung measurement of 192Ir is not generally used in routine monitoring of workers. Monte Carlo program Visual Monte Carlo was used to simulate the photon emission, to calculate the calibration factor for the geometry and radionuclide, and to calculate the detection limit in the lung (Hunt et al., 2012). Committed effective dose coefficients (Sv Bq−1) for the inhalation or ingestion of 192Ir compounds. AMAD, activity median aerodynamic diameter. Dose per activity content of 192Ir in total body, lungs, and in daily excretion of urine (Sv Bq−1); 5-µm activity median aerodynamic diameter aerosols inhaled by a reference worker at light work. Isotopes of lead addressed in this publication. EC, electron-capture decay; B+, beta-plus decay; B−, beta-minus decay; IT, isomeric transition decay; A, alpha decay. Dose coefficients and bioassay data for these radionuclides are given in the printed copy of this publication. Data for other radionuclides listed in this table are given in the accompanying electronic annex. Absorption parameter values for inhaled and ingested lead. It is assumed that the bound fraction fb is 0.5 for lead, with an uptake rate sb = 1.7 d–1, and that this applies throughout the respiratory tract (ET2, BB, bb, and AI regions, and associated lymph nodes LNET and LNTH). The value of sr for Type F forms of lead (100 d–1) is element-specific. The values for Types M and S (3 d–1) are the general default values. For inhaled material deposited in the respiratory tract and subsequently cleared by particle transport to the alimentary tract, the default fA values for inhaled materials are applied; i.e. the product of fr for the absorption type and the fA value for ingested soluble forms of lead (0.2). See text for summary of information on which parameter values are based, and on ranges of parameter values observed in different studies. For lead as a progeny of radon, specific parameter values are used for dissolution in the lungs, and absorption in the alimentary tract: they are applied in Annex A (Table A.2) and used in the calculation of dose coeffcients for radon progeny aerosols, given in Table 12.6 of the radon chapter. Materials (e.g. lead dichloride) are listed here where there is sufficient information to assign to a default absorption type, but not to give specific parameter values (see text). Default Type F is recommended for use in the absence of specific information on which the exposure material can be assigned to an absorption type; for example, if the form is unknown, or if the form is known but there is no information available on the absorption of that form from the respiratory tract. Activity transferred from systemic compartments into segments of the alimentary tract is assumed to be subject to re-absorption to blood. The default absorption fraction fA for the secreted activity is the reference fA (0.2) for ingestion of the radionuclide. Transfer coefficients in the biokinetic model for systemic lead. RBC, red blood cells; exch, exchangeable; nonexch, non-exchangeable; SI, small intestine. ST0, ST1, and ST2 represent soft tissues with fast, intermediate, and slow turnover, respectively. Monitoring techniques for 210Pb. Monitoring techniques for 212Pb. Monitoring techniques for 214Pb. Committed effective dose coefficients (Sv Bq−1) for the inhalation or ingestion of 210Pb, 212Pb, and 214Pb compounds. AMAD, activity median aerodynamic diameter. Dosimetric data on lead as progeny of radon are given in Table 12.6.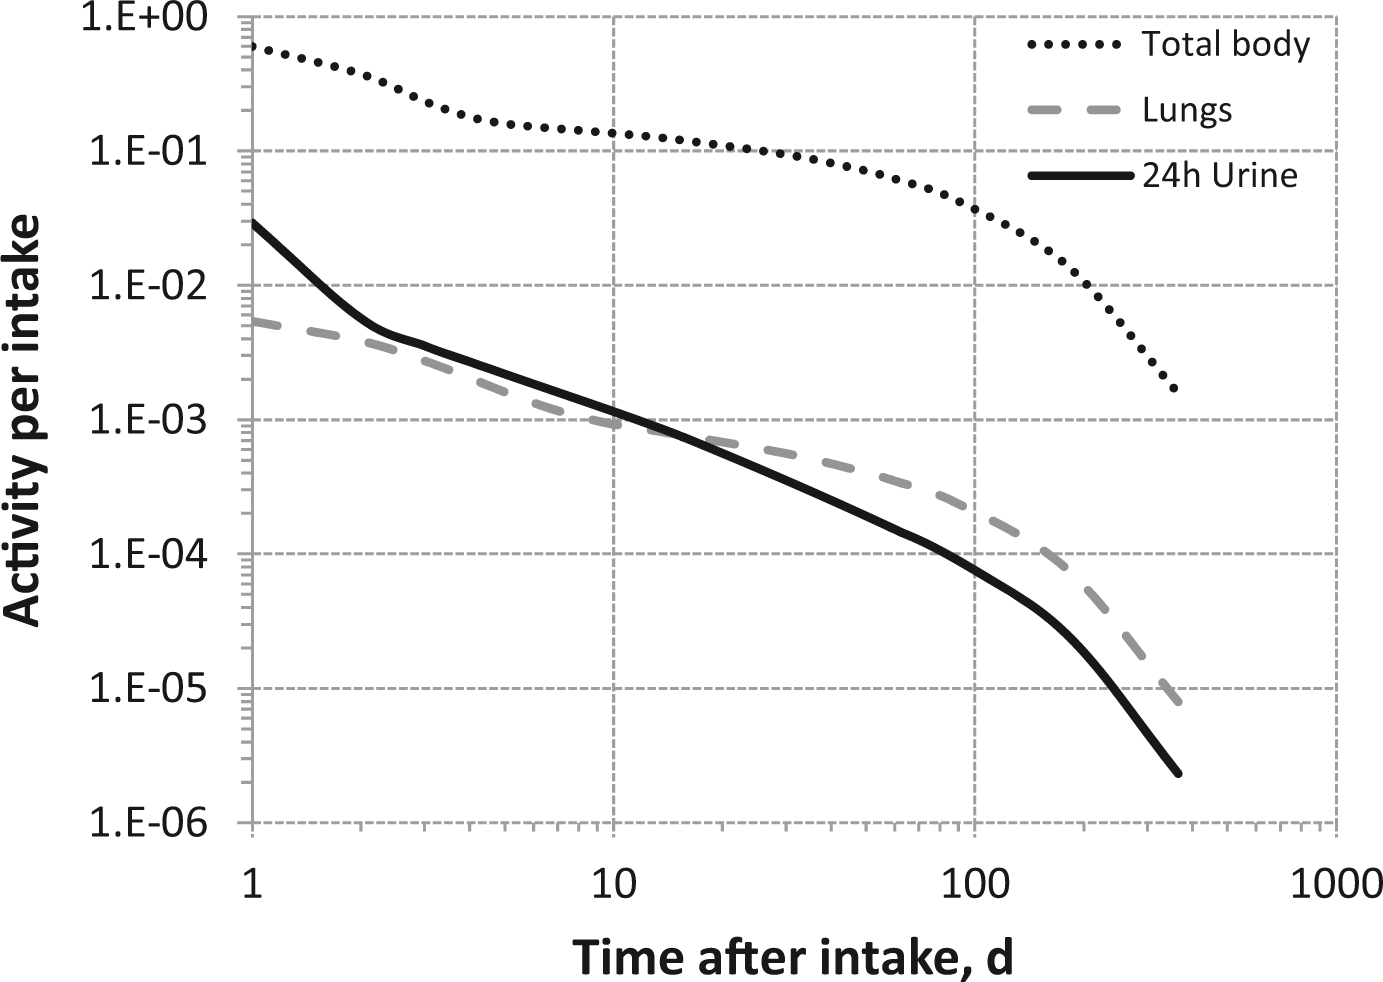
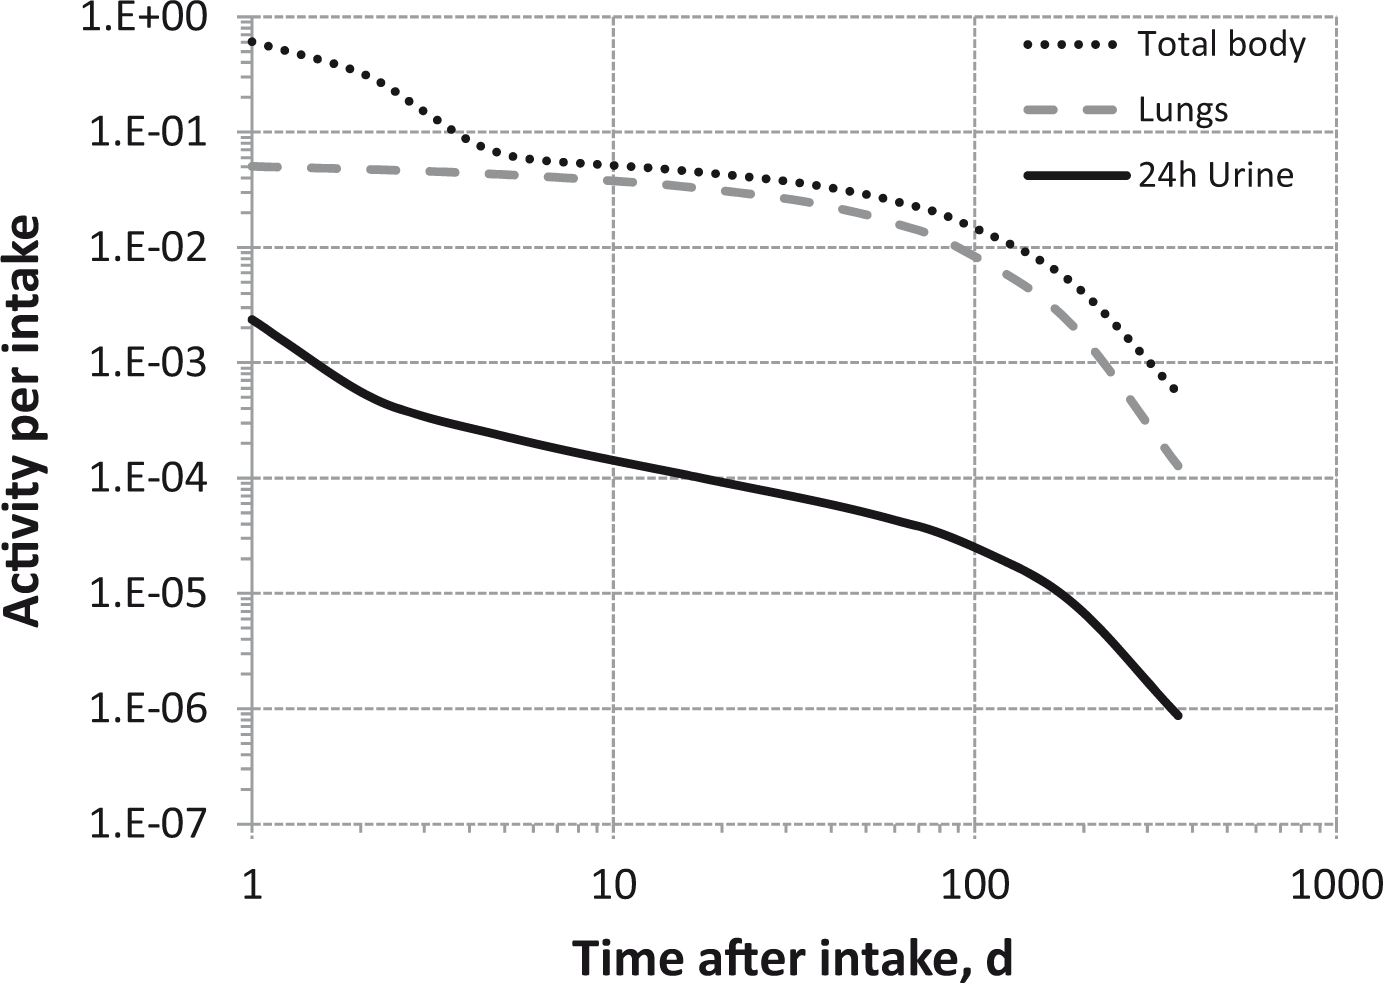
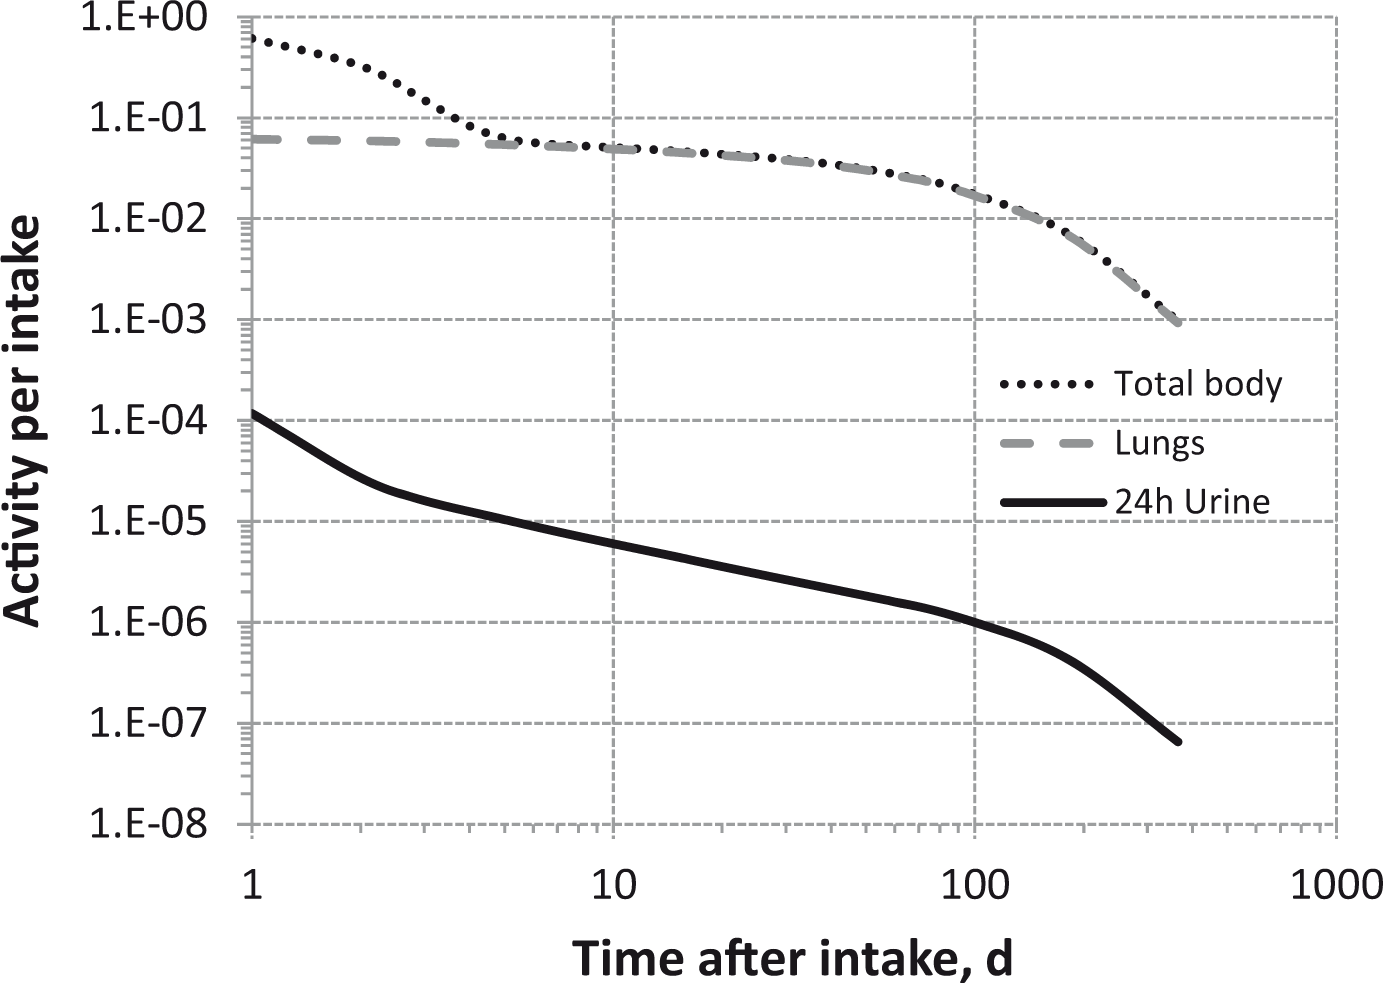


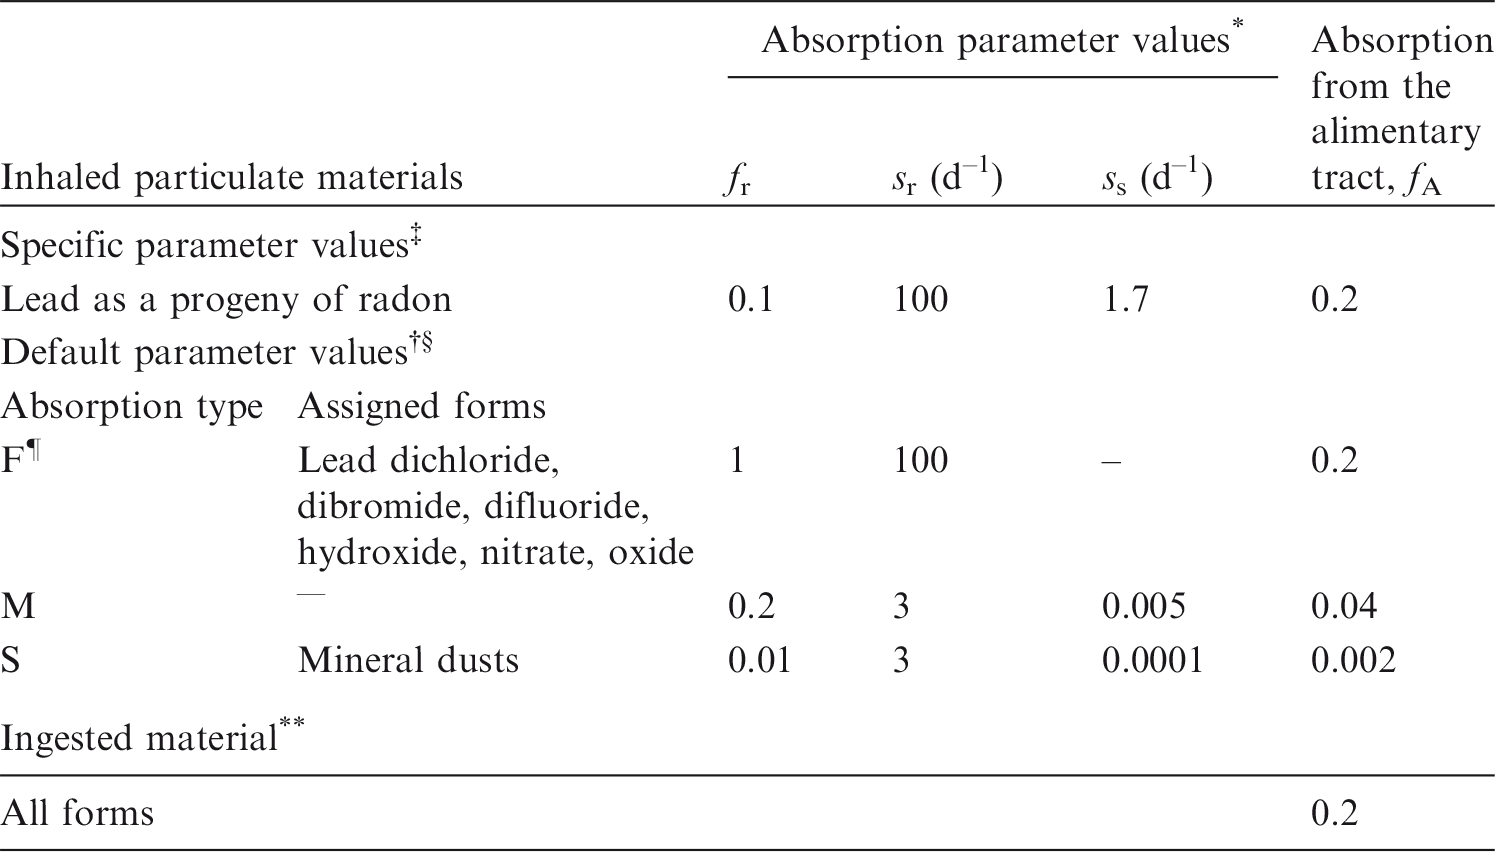
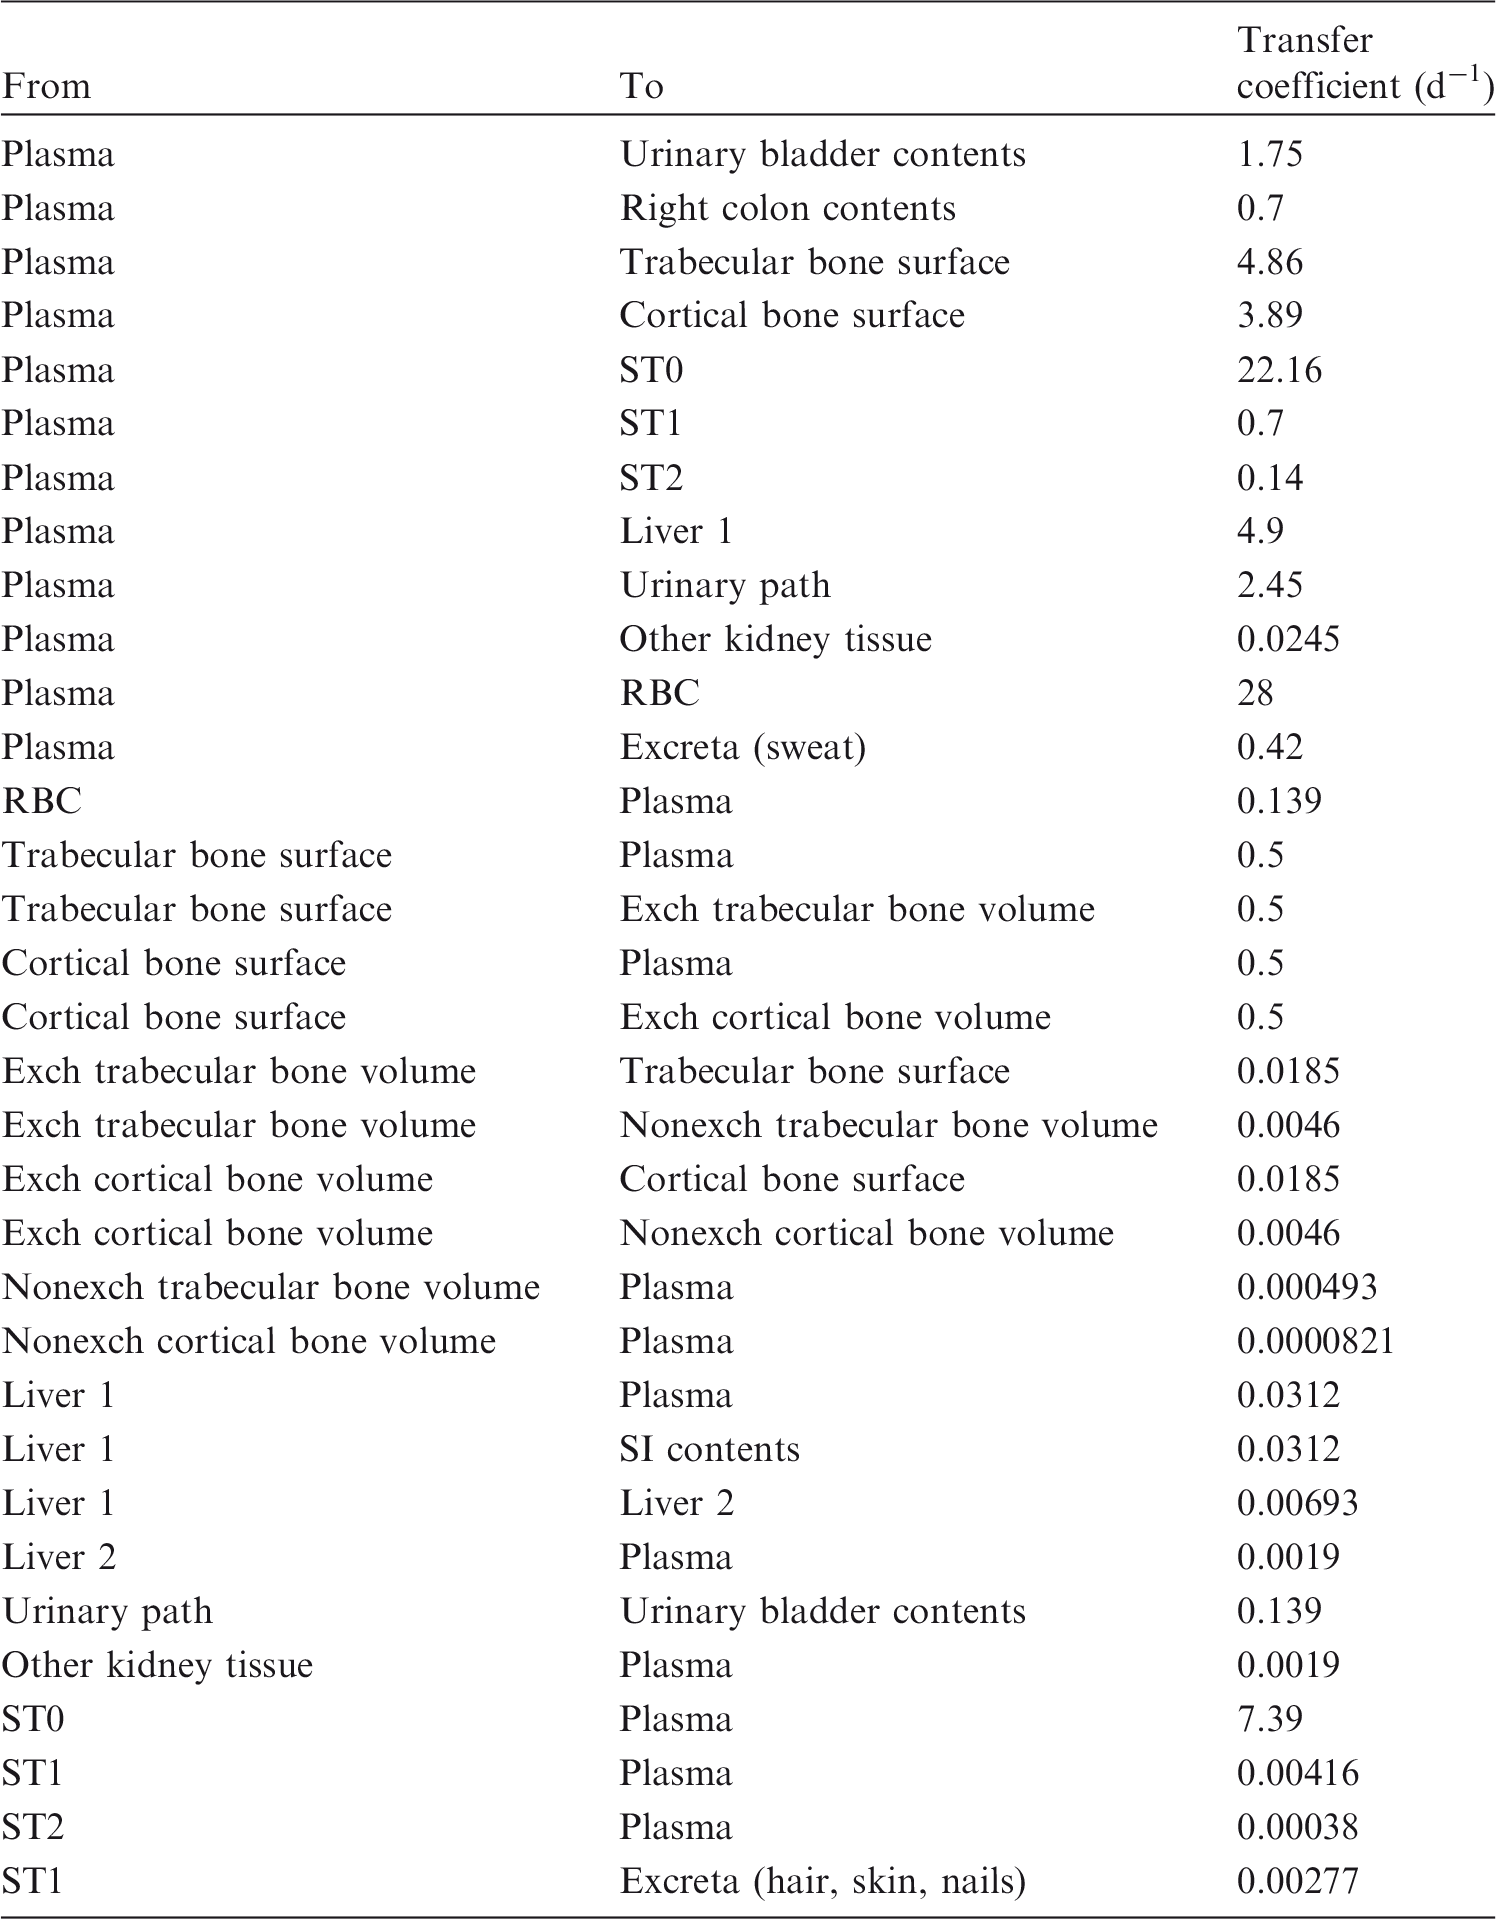


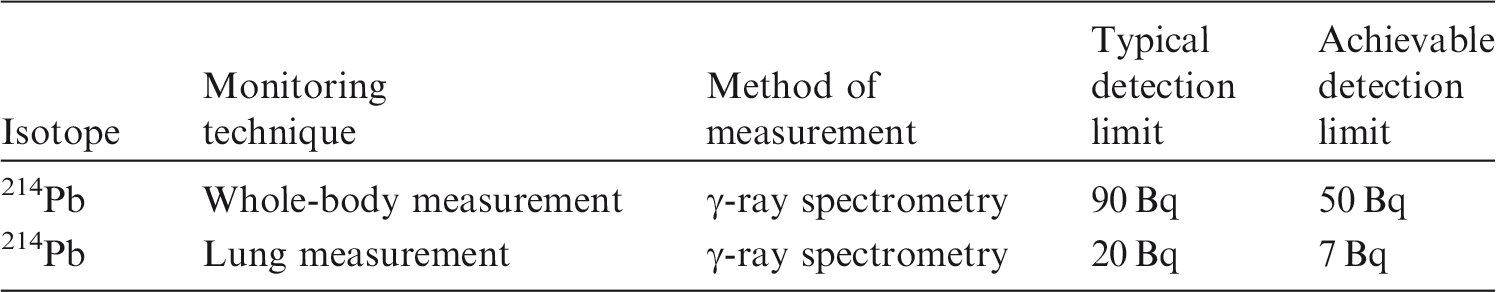
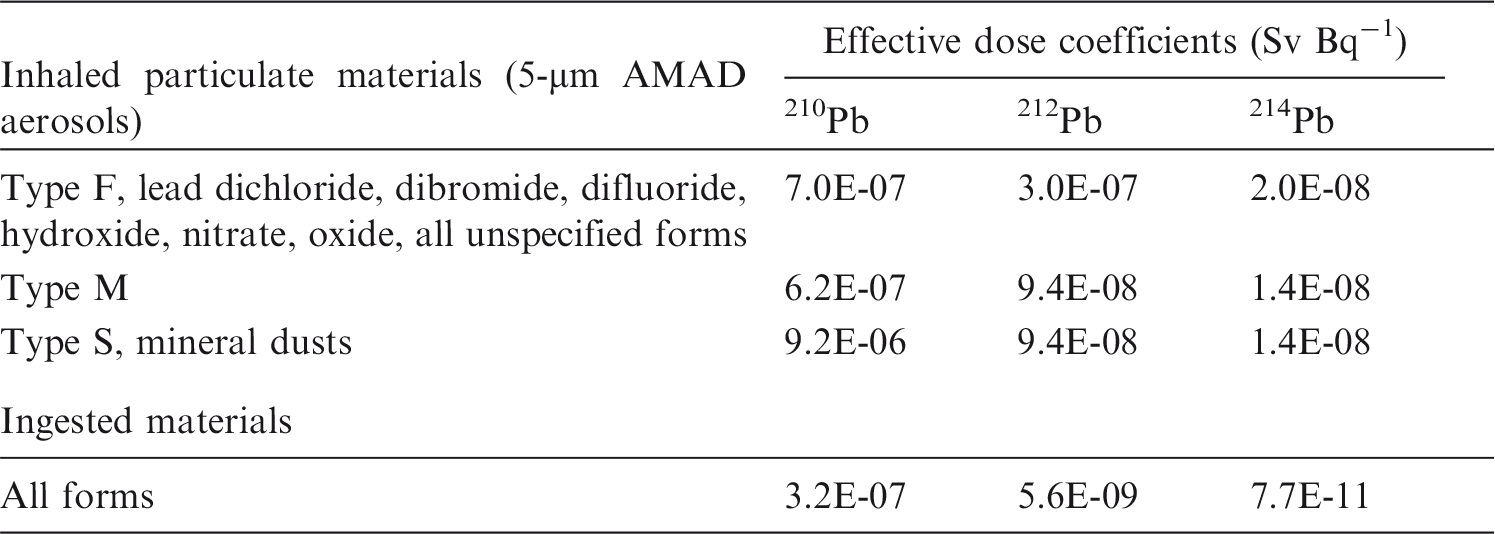
8.5. References
9. LEAD (Z = 82)
9.1. Chemical forms in the workplace
(397) Lead is a soft metal that occurs mainly in oxidation states II and IV. Lead may be encountered in industry in a variety of chemical and physical forms, including oxides (PbO, PbO2, Pb2O3, Pb3O4), chlorides, sulphides, fluorides, nitrates, and also as organic vapour compounds (tetra-ethyl, tetra-methyl). Lead may also be present in uranium mines and mills. Molten lead is used as a coolant in lead-cooled fast reactors. (398) 210Pb originates from the decay of 238U and 234Th, and 212Pb from the decay of 232Th.
9.2. Routes of intake
9.2.1. Inhalation
(399) Information on absorption from the respiratory tract is available from experimental studies of the behaviour of lead inhaled in a variety of forms by both animals and humans. In particular, studies have been conducted to improve assessment of risks from exposure to radioisotopes of lead inhaled as progeny radionuclides of radon, and from exposure to stable lead as an atmospheric pollutant (e.g. from petrol engine exhaust). (400) Absorption parameter values and types, and associated fA values for particulate forms of lead are given in Table 9.2. Parameter values are not given for the gas and vapour forms considered here because occupational exposure to radioisotopes in such forms is unlikely. Exposures to gas and vapour forms of lead are relatively unusual compared with exposures to particulate forms, and therefore it is proposed here that particulate forms should be assumed in the absence of information (ICRP, 2002b). However, for radiation protection purposes, the most important exposures to radioisotopes of lead are as progeny radionuclides of radon. Specific consideration was given here (i.e. by the Task Group) to studies of the absorption of lead administered in that form, and to studies using other ionic forms (e.g. nitrate) that were designed to investigate the absorption of radon progeny radionuclides from the respiratory tract. Dose coefficients for isotopes of lead inhaled as radon progeny are given in Section 12, where factors such as the relevant aerosol size distribution are addressed. Otherwise, exposures to radioisotopes of lead occur most often as progeny radionuclides associated with intakes of uranium, thorium, or radium. Skeleton content and daily urinary excretion of 210Pb following inhalation of 1 Bq Type F.

9.2.1.1. Gases and vapours
(a) Tetra ethyl lead (TEL) (401) Heard et al. (1979) followed the biokinetic of 203Pb for approximately 1 week after inhalation of 203Pb-labelled tetra-ethyl lead (TEL) vapour by four healthy male volunteers. Initial deposition averaged 37% of the inhaled vapour. There was rapid uptake of 203Pb from the lungs, with the first blood samples taken 3 min after intake indicating approximately 10% of the deposit in the cells and approximately 30% in the plasma, and hence an absorption rate greater than 100 d–1. The systemic behaviour was different from that of inorganic lead. Loss from blood was much faster: concentrations in both fractions fell by two orders of magnitude in the first 10 h. At 1 h, more than 50% of 203Pb deposited from inhalation was present in the liver, remaining fairly constant during the remaining 6 d of observation. Approximately 20% of the 203Pb TEL deposited was lost by exhalation within 48 h. These results indicate approximately 40% deposition in the respiratory tract with Type F absorption for TEL. (b) Tetra methyl lead (TML) (402) Three of the subjects in the study of TEL above inhaled 203Pb-labelled tetra-methyl lead (TML) in separate studies (Heard et al., 1979). Initial deposition averaged 51% of the inhaled vapour. The behaviour of 203Pb inhaled as TML was similar to that for TEL, with rapid uptake of 203Pb from the lungs, except that initially more 203Pb was in the cells than in the plasma. Approximately 40% of the 203Pb TEL deposited was lost by exhalation within 48 h. These results indicate approximately 50% deposition in the respiratory tract with Type F absorption for TEL. (403) However, although specific parameter values for TEL and TML based on in-vivo data could be assessed, they are not adopted here because inhalation exposure to TEL and TML is so unlikely. Furthermore, the systemic behaviour of lead inhaled in these forms differs from that of the model adopted here. The information is, however, useful for comparison with the behaviour of lead inhaled in ionic form, which is absorbed from the lungs much more slowly than lead inhaled in these organic forms.
9.2.1.2. Lead as a progeny of radon
(404) In this section, studies are considered in which 212Pb (t1/2 = 11 h) formed from decay of 220Rn (t1/2 = 56 s) and 216Po (t1/2 = 0.15 s), or 214Pb (t1/2 = 27 min) formed from decay of 222Rn (t1/2 = 3.8 d) and 218Po (t1/2 = 3.1 min) was inhaled directly, while still airborne. For decay schemes, see Annex A, Figs. A.1 and A.3. Studies in which lead ions were inhaled as nitrate or chloride, or in which lead ions (either formed from decay of 220Rn and 216Po, or as nitrate) were administered to the respiratory tract in a liquid medium, which are also relevant to lead as a progeny of radon, are considered below in the section on particulate forms. (a) Lead as an unattached progeny of radon (405) Booker et al. (1969) followed lung retention, blood concentration, and faecal excretion of 212Pb for up to 3 d after inhalation (by mouth) of unattached 212Pb (vapour, formed from decay of 220Rn/216Po) by one volunteer. In a complementary experiment, the amount of 212Pb in blood was measured at times up to 2 d after intravenous injection of 212Pb into the same volunteer. Of the initial deposit in the respiratory tract, 37% was recovered in faeces during the first 3 d, which the authors attributed to high deposition in the upper airways. Overall, clearance from the chest occurred with a half-time of approximately 10 h. (406) Marsh and Bailey (2013) carried out detailed analyses of this and other studies to estimate absorption parameter values appropriate for short-lived radon progeny. The studies by James et al. (1977) and Greenhalgh et al. (1979, 1982) outlined below, which were designed to investigate the early clearance of lead ions deposited in the lungs, showed a rapid phase, approximately 10–40% absorbed with a half-time of approximately 15 min, and evidence that some of the slow phase was due to binding. Marsh and Bailey (2013) therefore gave specific consideration to the rapid absorption phase and the bound state. For this experiment, absorption parameter values were assessed from the lung, blood and faecal data published by Booker et al. (1969) using a subject-specific systemic model, and assuming an absorption model with a rapid dissolution rate (sr) of 67 d−1 (t1/2 = 15 min) and slow dissolution (ss) and uptake (sb) rates of 1.7 d−1 (t1/2 = 10 h). Other parameter values were assessed to be fr = 0.36 and fb = 0.82, which gives rapid absorption of approximately 6% of the initial deposit [fr*(1–fb)]. Activity deposited in the upper respiratory tract retained in particulate form would mainly clear by mucociliary action to faeces, whereas activity retained in the bound state would not. This potentially enables a distinction to be made between the two pathways (provided sr, and hence transfer to the bound state, is fast compared with particle transport). The faecal measurement was lower than the predicted value, even with the high bound fraction estimated, and suggests that sr is more than 67 d–1. However, because the result was only for one volunteer and because of measurement uncertainties, Marsh and Bailey (2013) judged that it did not provide a better basis for estimating sr than the information on which the value of 67 d–1 was based. (407) Butterweck et al. (2001, 2002) carried out volunteer experiments to determine the absorption rate of unattached radon progeny. Twenty-one volunteers were exposed in a radon chamber with well-controlled aerosol and radon progeny conditions. The aerosol was predominantly unattached radon progeny. Eleven volunteers inhaled by mouth and seven by nose. Measurements were made of radon gas and progeny (214Pb and 214Bi) in blood samples taken at the end of a 30-min exposure (Butterweck et al., 2002). In-vivo measurements of the head and chest were carried out over a 30-min period, starting approximately 7 min after exposure (Butterweck et al., 2001). No clearance from the head (other than physical decay) was observed over this period, indicating that small fractions of unattached 214Pb and 214Bi were absorbed rapidly to blood (sr≫100 d–1), as measured by the blood sample, while the rest (fb) was bound to tissues (or stationary mucus). Assuming a rapid dissolution rate (sr) of 1000 d–1 with fr = 1.0 and an uptake rate from the bound state (sb) of 1.7 d–1, Butterweck et al. (2002) estimated that fb was in the range 0.7–0.85 for radon progeny (without distinguishing between 214Pb and 214Bi). In this study, the fraction of the initial deposit that was absorbed rapidly [fr*(1–fb)] was in the range 0.15–0.3, which is more than observed in the study by Booker et al. (1969) (see above). Marsh and Bailey (2013) re-evaluated these data using a systemic model based on the Publication 67 model for lead (ICRP, 1993), but modified to take account of the early rapid exchange between plasma and extravascular fluid. Assuming sr = 1000 d−1 with fr = 1, they estimated fb was approximately 0.7 for lead. The longer duration measurements made by Booker et al. (1969) are consistent with assignment to Type F. (408) Bianco et al. (1974) followed chest retention and blood concentration of 212Pb for up to 2 d after inhalation by dogs (via endotracheal tube) of unattached 212Pb (formed from decay of 220Rn/216Po, effective diffusion diameter ∼11 nm). Fitting a single exponential function to the chest data (after correction for 212Pb in blood) gave an average biological half-time for lung clearance of approximately 12 h with values in the range 7–20 h. The corresponding absorption half-time would be greater because no correction was made for mucociliary clearance. However, some would have occurred before the first chest measurement took place, and similarly there could have been some rapid absorption that was not observed. There is insufficient information in the paper for more detailed analysis. (b) Lead as a radon progeny attached to ambient aerosols (409) Booker et al. (1969) followed blood concentration, and urinary and faecal excretion of 212Pb in two volunteers for up to 3 d after inhalation (by mouth) of an aerosol formed by mixing 212Pb (formed from decay of 220Rn/216Po) with particles (condensation nuclei, mainly 0.05–5-µm diameter). In complementary experiments, the amount of 212Pb in blood was measured at times up to 2 d after intravenous injection of 212Pb into the same volunteers. Of the initial respiratory tract deposit, only 2–3% was recovered in faeces during the first 3 d, which the authors attributed to low deposition in the upper airways. Overall clearance from the chest was deduced from the blood measurements to occur with a half-time of approximately 10 h. The authors noted that this was similar to that observed following inhalation of unattached 212Pb (see above), even though it was expected that there was relatively greater deposition in the lower respiratory tract than in the upper respiratory tract for 212Pb attached to particles, and suggesting similar rates of absorption to blood in both cases. (410) Hursh et al. (1969) followed lung retention, blood concentration, and urinary and faecal excretion of 212Pb in 10 volunteers for up to 3 d after inhalation (by mouth) of an aerosol formed by mixing 212Pb (formed from decay of 220Rn/216Po) with natural room aerosol. On average, approximately 3% of the initial respiratory tract deposit was excreted in urine in the first 24 h, and total faecal excretion (in 24–76 h) was approximately 3% of the initial respiratory tract deposit. The authors estimated that, on average, clearance of 212Pb from lungs to systemic tissues occurred with a half-time of 6.5 h, although they inferred (from detailed measurements of urinary excretion) that some lead was absorbed promptly from the lungs. They noted that 212Pb in blood and systemic tissues made a significant contribution to uncertainty in the lung measurements, but complementary intravenous injection experiments, which would have enabled direct correction to be made, were not carried out. (411) Hursh and Mercer (1970) followed lung retention, blood concentration, and urinary and faecal excretion of 212Pb in four volunteers for up to 3 d after inhalation (by mouth) of an aerosol formed by mixing 212Pb (formed from decay of 220Rn/216Po) with natural room aerosol. In complementary experiments, the amount of 212Pb in blood was measured at times up to 2 d after intravenous injection of 212Pb into the same volunteers. On average, approximately 2% of the initial respiratory tract deposit was excreted in urine in the first 24 h, and total faecal excretion (in 34–50 h) was 0.35% of the initial respiratory tract deposit; the authors inferred that the latter suggested low deposition in ciliated airways. They noted that the blood lead appeared to increase more rapidly in two subjects compared with the other two, and that this suggested that 212Pb inhaled as freshly generated 212Pb of very small diameter may be more readily absorbed from the lung parenchyma to blood than an aged aerosol associated with larger diameter particles. However, the authors noted that ‘the determination is not sufficiently precise to establish this relationship’. They estimated that, on average, clearance of 212Pb from lungs to systemic tissues occurred with a half-time of 10.5–11.5 h, after correcting for activity outside the lungs. (412) Singh et al. (1986) reported that concentrations of 210Pb (t1/2 = 22 y) in the lungs of uranium miners obtained at autopsy were several times higher than concentrations of 238U, 234U, or 230Th. This indicated that there were sources of intake of 210Pb in addition to uranium ore dust. The authors suggested several possibilities, one of which was inhalation of 210Pb present in the mine air but not associated with ore dust. If this originated from radon in the mine air, it suggests that it was retained in the lungs in a relatively insoluble (Type M or S) form. (413) Marsh and Birchall (1999) re-evaluated the published data from experiments in which volunteers inhaled 212Pb attached to condensation nuclei or to ‘natural’ particles in room air (Booker et al., 1969; Hursh et al., 1969; Hursh and Mercer, 1970) to estimate an absorption half-time for lead, assuming a single component. The best estimate obtained was 10 h with a 95% confidence interval of ±2 h, which gave an absorption rate of approximately 1.7 d–1. Marsh and Bailey (2013) carried out a more detailed analysis of these and other studies to estimate absorption parameter values appropriate for short-lived radon progeny, giving specific consideration to the rapid absorption phase (see paragraph above on lead as an unattached progeny of radon). The published data from experiments in which volunteers inhaled 212Pb attached to condensation nuclei were re-evaluated with a two-component model. Assuming sr = 67 d − 1 (t1/2 = 15 min), values of fr and ss of 0.06 and 1.4 d−1 (t1/2 = 12 h), respectively, were estimated. However, the information did not permit assessment of fb as for unattached 212Pb (see above) because there was low deposition in the upper respiratory tract [and for Booker et al. (1969), there were no direct measurements of activity in the lungs]. (414) Based on these studies and those below on ionic lead, lead nitrate, and lead oxide, bound state parameter values for lead of fb = 0.5 and sb = 1.7 d–1 were chosen here (see below). For the studies of radon as a progeny above, and ionic lead below, specific parameter values of approximately fr = 0.3, sr = 100 d–1, ss = 1.7 d–1, fb = 0.8, and sb = 1.7 d–1 were estimated (i.e. a somewhat higher value of fb). Note that (neglecting particle transport) the fraction of the initial deposit in the respiratory tract that is absorbed into blood in the rapid phase is given by fr*(1 – fb), thus these parameter values are consistent with rapid absorption of 0.3*(1 – 0.8) = 0.06. A similar fractional rapid absorption would be obtained with fb = 0.5 and fr = 0.12. Absorption parameter values of fr = 0.1, sr = 100 d–1, ss = 1.7 d–1, fb = 0.5, and sb = 1.7 d–1 (consistent with assignment to default Type F) are used here for lead as a short-lived progeny of radon. For absorption in the alimentary tract of material cleared from the respiratory tract, in the absence of specific information, the default assumption made is that fractional absorption in the alimentary tract is the product of fr and fA, where fA is fractional absorption in the alimentary tract for relatively soluble forms of the element. This approach was based on the consideration that fr represents the soluble fraction of the material, which is available for absorption in the alimentary tract, and fA represents alimentary tract absorption of the soluble fraction (ICRP, 2015). However, in this case, ss is sufficiently high at 1.7 d−1 that all the material can be considered soluble, and fractional absorption in the alimentary tract is taken to be equal to fA for relatively soluble forms of the element (i.e. 0.2). These specific parameter values, included in Table 9.2, are applied in Annex A to give absorption parameter values for radon progeny (Table A.2). These were used in the calculation of dose coeffcients for radon progeny aerosols, given in Table 12.6 of the radon chapter.
9.2.1.3. Particulate aerosols
(a) Ionic lead (415) Greenhalgh et al. (1978, 1979) investigated the absorption of lead ions (203Pb or 214Pb) instilled into the bronchi of rabbits or rats in different media. In rabbits, the average amounts in blood at 20 and 42 min after instillation (estimated at ∼4% and 7%, respectively, of the amount instilled) were similar, whether instilled in lead nitrate solution or in fresh rat mucus (both isotopes), or in isotonic saline (203Pb). The authors inferred that approximately 10% of instilled lead was absorbed in a rapid phase with a half-time of approximately 10 min. In rats, systemic absorption of 203Pb at 30 min after instillation in water, isotonic saline, or hypertonic saline was similar, averaging 42% of the amount instilled, but higher than in rabbits (∼13%). It was somewhat higher when instilled as nitrate (53%) and in 0.1 N HCl (61%). (416) Greenhalgh et al. (1982) investigated the rapid clearance phase of radon progeny radionuclides by comparing the biokinetic of ionic 212Pb with those of insoluble radiolabelled particles (88Y-labelled fused aluminosilicate, FAP) instilled together on to the nasal mucosa of rats. The 88Y FAP acted as a tracer for deposition and mucociliary clearance. The suspension was prepared by collecting 216Po ions from the decay of 220Rn in a chamber on to an electrode, and transferring the 212Pb formed to distilled water; a suspension of the 88Y FAP in water was allowed to dry out, and the 212Pb solution was added to the container. Activity retained in the head, and blood concentration, were followed for 100 min. By the end of the experiment, approximately 8% of the 212Pb had been absorbed (rate ∼66 d−1). Thus, rapid absorption of the initial deposit [fr*(1–fb)] was approximately 8%. Nevertheless, the fraction of the initial deposit remaining in the nose was greater for 212Pb (∼40%) than for the particles (∼30%). The authors concluded that some of the 212Pb was retained by binding either to static mucus or epithelial tissue, and developed a two-phase (sol and gel) model of mucociliary clearance to explain the results. Analysis by Marsh and Bailey (2013) assuming slow dissolution (ss) and uptake (sb) rates of 1.7 d−1 (10-h half-time, see paragraph above on lead as an unattached progeny of radon) gave absorption parameter values of fr = 0.35, sr = 60 d−1 (t1/2 = 17 min), and fb = 0.7. (b) Lead nitrate (Pb(NO3)2) (417) James et al. (1977) followed the biokinetic of 212Pb for up to 100 min after instillation of 212Pb nitrate into the trachea or bronchioles of rabbits. The solution was prepared by collecting 216Po ions from the decay of 220Rn in a chamber on to an electrode, and transferring the 212Pb formed to distilled water containing stable lead nitrate carrier. From both sites, approximately 20% of deposited 212Pb was absorbed to blood with a half-time of approximately 4 min (250 d−1), and the remainder with a half-time estimated at approximately 9 h (1.8 d−1). Insoluble radiolabelled particles were instilled simultaneously into the bronchioles of one rabbit to act as a tracer for mucus. It was found that, despite absorption to blood, the 212Pb cleared more slowly than the particles, and it was inferred that this indicated slow diffusion of 212Pb through the epithelium (i.e. that some binding occurs). It was reported that more of the 212Pb remaining in the lungs was associated with mucus than with epithelium by the end of the experiment (2 h after instillation). (418) Chamberlain et al. (1978) administered to four volunteers an aerosol of 203Pb-labelled nitrate (AMAD in the range 0.4–0.8 µm), formed by adding nitrogen to the flame produced by burning 203Pb-labelled tetra-ethyl lead in propane. Measurements of 203Pb in the chest, blood, and excreta were made for approximately 4 d. Complementary measurements were also made of 203Pb in the legs to correct lung measurements for systemic 203Pb, based on the results of similar measurements made after intravenous injection of 203Pb. Lung retention was represented by a three-component exponential function with half-times of 1 h (26%), 2.2 h (33%), and 10 h (41%) (rates of 17, 7.6, and 1.7 d−1, respectively). Clearance was almost entirely by systemic uptake; only a small percentage of ILD was cleared by mucociliary action and swallowed. Chamberlain et al. (1978) noted that lead nitrate was far more soluble in vitro than indicated by the lung measurements, and suggested that the mechanism for transferring lead from lung fluid to blood is a relatively slow process that determines the overall transfer rate. (419) Ballou et al. (1986) measured lung retention and tissue distribution of 232U, 228Th, 224Ra, 212Pb, 212Bi, and 208Tl at 24 h after intratracheal instillation into rats of 232U nitrate with its progeny radionuclides (for further information, see Section 15.2.1). For 212Pb, on average, 2.1% ILD was measured in the lungs at 1 d. Correcting for the physical decay of 212Pb gives retention of 10% ILD at 1 d. (420) Moody et al. (1994b) and Moody and Stradling (1992) measured the tissue distribution of 228Th, 212Pb, 212Bi, and 208Tl at times from 6 h to 7 d after intratracheal instillation into rats of a nitrate solution of 228Th in equilibrium with its progeny radionuclides. 220Rn is a precursor of 212Pb, but it is unlikely that a significant amount was lost from solution before deposition in the lungs because of its short half-life of 56 s. Its average half distance of diffusion in water was estimated to be 50 µm by Ballou and Hursh (1972). For 212Pb, on average, 8.4% ILD was measured in the lungs at 6 h and 1.2% ILD at 1 d; clearance was much faster than that of the parent 228Th. Correcting for the physical decay of 212Pb gives retention of 12.5% ILD at 6 h and 5.6% ILD at 1 d. From these results, it was assessed here, assuming either (i) that the retained lead was in particulate form [i.e. a slow dissolution (ss) rate of 1.7 d−1 with no bound state (fb = 0)] or (ii) that the retained lead was in the bound state with an uptake rate (sb) of 1.7 d−1 with no slow dissolution (fr = 1) (see paragraphs above on lead as a progeny of radon), that sr was approximately 50 d−1 (t1/2∼20 min) with fr of approximately 0.75 or fb of approximately 0.25 (i.e. ∼ 75% cleared rapidly in either case). Later measurements were not included because of possible significant contributions to measured 212Pb from decay of higher members of the chain. (421) Based on these studies and others, bound state parameter values for lead of fb = 0.5 and sb = 1.7 d−1 were chosen (see below). Note that (neglecting particle transport) the fraction of the initial deposit in the respiratory tract that is absorbed into blood in the rapid phase is given by fr *(1 – fb), which for fb = 0.5 gives fr *(0.5). For the study in which lead nitrate was inhaled by human volunteers (Chamberlain et al., 1978), approximately 50% ILD was cleared rapidly (components with half-times >3 h), suggesting a value for fr of approximately 1.0. Specific parameter values derived for lead nitrate would be close to those for Type F (including the bound state parameters for lead), and therefore lead nitrate is assigned here to Type F. (c) Lead chloride (PbCl2) (422) Morrow et al. (1980) followed lung retention and blood concentration of 203Pb in eight volunteers for up to 4 d after inhalation (by mouth) of an aerosol formed by nebulising a sodium chloride vector solution to which carrier-free 203PbCl2 was added, giving an AMAD of approximately 0.25 µm. Lung retention was represented by a two-component exponential function with, on average (after correction for systemic 203Pb and physical decay), 7% clearing at a rate of 0.023 min−1 (33 d−1, half-time 30 min) and 93% at a rate of 0.00088 min−1 (1.3 d−1, half-time 13 h). The corresponding absorption rates would be lower because of particle transport to the alimentary tract. However, at this aerosol size, deposition in the upper respiratory tract would have been relatively low, and so the contribution would be small, at least to the slow phase. The authors noted that the blood data suggested that the rapid phase could be due to absorption rather than mucociliary clearance. Some mucociliary clearance and some rapid absorption would have occurred before the first chest measurement took place, shortly after aerosol administration. Without faecal clearance measurements, estimates of specific absorption parameter values could not be made here; the results are consistent with assignment to Type F. (d) Lead hydroxide (Pb(OH)2) (423) Morrow et al. (1980) followed lung retention and blood concentration of 203Pb in nine volunteers for up to 4 d after inhalation (by mouth) of a Pb(OH)2-NaCl aerosol formed by nebulising a sodium chloride vector solution to which carrier-free 203PbCl2, stable lead chloride, and sodium hydroxide were added, giving an AMAD of approximately 0.25 µm. Lung retention was represented by a two-component exponential function with, on average (after correction for systemic 203Pb and physical decay), 12% clearing at a rate of 0.012 min−1 (17 d−1, half-time 60 min) and 88% at a rate of 0.00081 min−1 (1.2 d−1, half-time 14 h). The authors noted that the results were not significantly different from those obtained with carrier-free lead chloride (see above), despite differences in chemical form and mass. As for the chloride, estimates of specific absorption parameter values could not be made; the results are consistent with assignment to Type F. (424) Stradling et al. (2005) and Moody et al. (1994a) measured the tissue distribution of 228Th, 212Pb, 212Bi, and 208Tl at times from 1 to 168 d after intratracheal instillation into rats of a suspension of 228Th hydroxide in equilibrium with its progeny radionuclides. For 212Pb, on average, 2.7% ILD was measured in the lungs at 1 d when administered with a low mass (50 pg) of thorium [5% ILD when administered with a high mass (6.5 µg) of thorium]. Clearance was much faster than that of the parent 228Th. Correcting for the physical decay of 212Pb gives retention of 13% ILD at 1 d. From this result, it was assessed here that sr was greater than 2 d−1 (t1/2∼8 h). Alternatively, assuming fr = 1 and sr = 100 d−1 gave fb = 0.8. Later measurements were not included because of possible significant contributions to measured 212Pb from decay of higher members of the chain. There was insufficient information to quantify a slower phase as seen in other studies of soluble forms of lead; its presence would give a higher value for sr. The results are consistent with assignment to Type F, to which lead hydroxide is assigned. (e) Lead oxide (PbO and Pb3O4) (425) Rendall et al. (1975) measured lead levels in blood (only) of baboons that inhaled red lead oxide (Pb3O4) either as a ‘coarse’ (mass median diameter 6 µm) or ‘fine’ (mass median diameter 2 µm) aerosol at similar mass concentrations. There is insufficient information to assess absorption parameter values, but blood levels were higher following exposure to coarse dust than to fine dust. Since it is likely that deposition in the upper respiratory tract was higher and deposition in the lungs lower for the coarse dust than for the fine dust, the results suggest that there was rapid absorption from the upper respiratory tract and/or the alimentary tract. (426) Boudene et al. (1977) measured tissue distribution and excretion in rats for 6 d following inhalation (whole body) of an aerosol formed by passing nebulised gasoline labelled with organic 210Pb with air through a tube furnace at 600℃. Lung clearance was rapid, reducing to 11% ILD at 24 h and 1% ILD at 6 d. There is detailed information on the biokinetic (nine time points within the first day) but large uncertainties on the deposition pattern (extrathoracic and pelt). From the results, parameter values assessed here, assuming that the lead which was not cleared in the rapid phase was retained in the bound state (fr = 1), were sr of approximately 5 d−1 (t1/2∼3 h), fb of approximately 0.2, and sb of approximately 0.5 d−1 (t1/2∼33 h), giving assignment to Type F. (427) Chamberlain et al. (1978) administered to six volunteers an aerosol of 203Pb-labelled oxide (AMAD in the range 0.4–0.8 µm), formed by eliminating nitrogen from the flame produced by burning 203Pb-labelled tetra-ethyl lead in propane. Measurements of 203Pb in the chest, blood, and excreta were made for approximately 4 d. Complementary measurements were also made of 203Pb in the legs to correct lung measurements for systemic 203Pb, based on the results of similar measurements made after intravenous injection of 203Pb. Lung retention was represented by a four-component exponential function with half-times of 0.5 h (25%), 2.9 h (32%), 9.8 h (25%), and 38 h (18%) (rates of 33, 5.7, 1.7, and 0.4 d−1, respectively). Clearance was almost entirely by systemic uptake; only a small percentage of ILD was cleared by mucociliary action and swallowed. Chamberlain et al. (1978) noted that, in contrast to nitrate and motor exhaust aerosols, the lead oxide was less soluble in vitro than indicated by the lung measurements, and suggested that this might be because of efficient fluid flow in the lungs. (428) Rhoads and Sanders (1985) followed the biokinetic of lead in rats for 91 d after inhalation of non-radioactive PbO. Lung retention was represented by a two-component exponential function with half-times of 1 d (93%) and 89 d (7%), consistent with assignment to Type F. (429) Lung retention of lead oxide inhaled by human volunteers was similar to that of lead nitrate (Chamberlain et al., 1978), and therefore specific parameter values derived from them would also be close to those for Type F (including the bound state parameters for lead), and therefore lead oxide is assigned here to Type F. (f) Lead difluoride (PbF2) (430) Stradling et al. (2005) and Moody et al. (1994a) measured the tissue distribution of 228Th, 212Pb, 212Bi, and 208Tl at times from 1 to 168 d after intratracheal instillation into rats of a suspension of 228Th fluoride in equilibrium with its progeny radionuclides. For 212Pb, on average, 6.0% ILD was measured in the lungs at 1 d when administered with a low mass (60 pg) of thorium. Correcting for the physical decay of 212Pb gives retention of 28% ILD at 1 d. Clearance was faster than that of the parent 228Th. From this result, it was assessed here that sr was at least 1 d−1 (t1/2∼8 h). Later measurements were not included because of possible significant contributions to measured 212Pb from decay of higher members of the chain. There was insufficient information to quantify a slower phase as seen in other studies of soluble forms of lead; its presence would give a higher value for sr. However, when administered with a high mass (6.5 µg) of thorium, 18% ILD of 212Pb was measured in the lungs at 1 d. Correcting for the physical decay of 212Pb gives retention of approximately 80% ILD at 1 d, similar to that of the parent thorium. The results indicate Type F behaviour and lead difluoride is assigned to Type F. (g) Lead in fresh or age-aggregated motor exhaust (including lead dibromide, PbBr2) (431) Although mainly related to environmental, rather than occupational, exposure, information relating to lead in motor exhaust and tobacco smoke is included here for completeness. (432) Chamberlain et al. (1975, 1978) administered various aerosols derived from 203Pb-labelled motor exhaust to several volunteers. Measurements of 203Pb in the chest, blood, and excreta were made for up to approximately 4 d. Complementary measurements were also made of 203Pb in the legs to correct lung measurements for systemic 203Pb, based on the results of similar measurements made after intravenous injection of 203Pb. Absorption from the alimentary tract following ingestion of exhaust particles collected on filters was also determined. In most cases, patterns of lung clearance and systemic uptake were similar to those found by these authors for lead inhaled as nitrate or oxide (see above), often in the same volunteers. For fresh motor exhaust, Chamberlain et al. (1978) represented lung retention by a three-component exponential function with half-times of 1.2 h (27%), 2.3 h (39%), and 8.1 h (34%) (rates of 14, 7.2, and 2.1 d−1, respectively). Clearance was almost entirely by systemic uptake; only a small percentage of ILD was cleared by mucociliary action and swallowed. For aged exhaust (stored and, in some cases, exposed to ultraviolet light), a fourth component was needed; approximately 10–15% was retained with a half-time of 40–220 h. Chamberlain et al. (1975) reported that most of the 203Pb in the lungs was retained with a half-time of approximately 6 h, and the rest cleared more slowly. Most studies of the composition of exhaust lead (e.g. Habibi, 1973) have identified complex mixtures of lead oxides, halides, and ammonium salts, together with sulphates and carbonaceous material. This suggests that Type F behaviour may be characteristic of many lead compounds other than those for which specific information is available. In particular, since lead dibromide was an important constituent of lead in motor exhaust, it suggests that, like lead chloride, it should be assigned to Type F. (h) 210Pb in cigarette smoke tar (433) A brief summary is given here; for further information; see Section 11. 210Pb and its progeny, 210Pb, are inhaled in cigarette smoke (Desideri et al., 2007). Martell (1974) reported that 210Pb concentrates in resinous material in tobacco leaves, forming insoluble particles during combustion. Cohen et al. (1979) measured 210Po concentrations in the TB tree and lung parenchyma in autopsy tissues from smokers and non-smokers, and attributed differences to the retention of insoluble particles containing 210Pb/210Po in cigarette smoke. Cohen et al. (1985) measured 210Po in the lungs of rats after exposure to cigarette smoke enriched in 210Pb/210Po; results indicate Type M or S behaviour for both 210Pb and 210Po. (i) Mineral dust (434) A potentially important source of intake of 210Pb in particulate aerosols arises from airborne mineral dusts containing the natural long-lived parent. In this case, the absorption rate will probably be determined by the dissolution rate of the mineral matrix in lung fluids. Measurements have been made of the dissolution in simulated lung fluid of samples of coal fly ash (Kalkwarf et al., 1984) and condensate from calcining phosphate rock dust (Kalkwarf and Jackson, 1984) for 60 d. By this time, the amounts of 210Pb dissolved were less than 0.2% and less than 5%, respectively, indicating assignment to Type S in both cases. (j) Uranium ore dust (435) Duport et al. (1991) measured the dissolution in simulated lung fluid of long-lived radionuclides in uranium ore dust from Canadian mines. For further information, see Section 15.2.1.1 (Part m) and Section 15.2.1.2. For high-grade ore, measurements were made for up to 60 d. Results were presented as undissolved fractions as functions of time, and showed two components, which were expressed as Class D (rapid) and Class Y (slow) fractions. For 210Pb, the rapidly dissolved fraction was 0.28. HRTM parameter values fitted to the 210Pb data by Marsh et al. (2012) were fr = 0.26, sr = 3.9 d−1, and ss = 0.001 d−1, indicating assignment to Type M. For 210Pb, no effects of size were observed in total dissolution over 40 d for particles in size ranges 7–10, 3–7, 1–3, and less than 1 µm. For low-grade and medium-grade ores, measurements were made for 12 d, but only on samples of relatively coarse dust, the smallest fraction being less than 37 µm. For 210Pb, rapidly dissolved fractions were lower (<0.01), indicating assignment to Type S. (k) Thorium dioxide (436) Hodgson et al. (2000, 2003) measured the tissue distribution of 228Th, 212Pb, 212Bi, and 208Tl at times from 1 to 168 d after intratracheal instillation into rats of suspensions of 232Th dioxide enriched with 228Th, in equilibrium with its progeny radionuclides, with geometric diameters of approximately 0.4 and 2 µm (for further information, see Section 14.2.1). There was little absorption of the thorium itself, consistent with assignment to Type S. The activity of 212Pb in the lungs was approximately 50% and 80% of that of thorium at 1 d for the 0.4- and 2-µm particles, respectively, and 25% and 70% at later times. The lower concentrations of 212Pb were attributed to diffusion of 220Rn (thoron) and recoil of the progeny from alpha-particle decay.
9.2.1.4. Progeny radionuclides of lead formed in the respiratory tract
(437) The general approach to treatment of progeny radionuclides formed in the respiratory tract is described in OIR Part 1, Section 3.2.3 and Annex A (ICRP, 2015). In summary, it is expected that the rate at which a particle dissociates is generally determined by its matrix, and hence the physico-chemical form of the inhaled material. It is recognised that nuclei formed by alpha decay within a particle matrix may be expelled from it into the surrounding medium by recoil, but to implement this routinely would add greatly to the complexity of calculations. It is expected that the behaviour of soluble (e.g. Type F) material in the respiratory tract would depend on its elemental form (i.e. that of the progeny radionuclide). Nevertheless, for simplicity, in the OIR series, the absorption parameter values of the parent are, by default, applied to all members of the decay chain formed in the respiratory tract. Exceptions are made for noble gases formed as progeny radionuclides, which are assumed to escape from the body directly, at a rate of 100 d−1, in addition to other routes of removal. (438) For decay schemes of lead isotopes in the natural decay series, including 214Pb, 212Pb, and 210Pb, see Annex A, Figs. A.1–A.3. Studies specifically comparing the behaviour of lead with that of its progeny radionuclides (bismuth and thallium isotopes) are summarised here (for further information, see Section 10.2.1). (439) Drew (1971) reported that the tissue distributions of 212Pb (t1/2 = 11 h) and 212Bi (t1/2 = 61 min) activities were similar in rats following exposure to 220Rn (thoron) and its progeny radionuclides for 2 d. However, the exposure situation was complex because 212Pb and 212Bi in tissues originated from inhalation of 220Rn and its decay within the body, inhalation of 212Pb and 212Bi, and also their ingestion from food and preening of fur. It is therefore difficult to estimate how much of the 212Bi originated from decay of 212Pb in the lungs. Furthermore, between dissection of the animals and measurements of activities in tissues, 212Bi would have grown in rapidly, i.e. the 212Bi content of the tissues would have increased as a result of its formation through decay of 212Pb in the tissues. Thus, the activities of 212Bi present in vivo may have been significantly lower than those measured. (440) As noted above, measurements have been made of the tissue distributions of 212Pb and its progeny radionuclides, 212Bi and 208Tl, following administration to rats of 228Th in various chemical forms (nitrate, hydroxide, fluoride, dioxide), in equilibrium with its progeny radionuclides. In all these studies, the distributions of 212Bi and 208Tl were similar to each other and those of the parent 212Pb. As their physical half-lives are so short (61 min and 3 min, respectively), measurements made at 6 h onwards would be mainly of activity formed from decay of 212Pb within the body, rather than from intake of 212Bi (or 208Tl). The similar distributions of 212Bi (and 208Tl) to those of 212Pb might suggest that there was no rapid movement of 212Bi from the site (e.g. the lungs) in which it was formed by decay of 212Pb. However, 212Bi (and 208Tl) would have grown in rapidly between dissection of the animals and measurements of activities in tissues. Without detailed information (which is not available) regarding the time that elapsed between dissection of the animals and measurements, it is not possible to correct for this ingrowth, and hence estimate the absorption rates of the bismuth or thallium formed as progeny radionuclides in the lungs. However, since the half-life of 208Tl is so short (as is that of 207Tl present in the 235U decay series, 5 min), the absorption rate of thallium would have to be very high to influence dose assessments. (441) As described above, Butterweck et al. (2001, 2002) measured radon gas, 214Pb, and 214Bi in blood samples taken from volunteers at the end of a 30-min inhalation exposure to unattached radon progeny. In-vivo measurements of the head and chest were also carried out. Assuming a rapid dissolution rate (sr) of 1000 d−1 with fr = 1 and an uptake rate from the bound state (sb) of 1.7 d−1, Butterweck et al. (2002) estimated that the rapid absorption of the initial deposit is in the range 0.15–0.3 and the remaining fraction is bound with fb in the range 0.7–0.85 for radon progeny (without distinguishing between 214Pb and 214Bi). However, Butterweck et al. (2002) also estimated absorption rates for 214Pb and 214Bi from their activities in the blood sample and the estimated respiratory tract deposition, assuming that absorption from respiratory tract to blood could be represented by a single rate constant (sr), i.e. fr = 1 and fb = 0, although this model seems inconsistent with the in-vivo measurements. They obtained absorption half-times of approximately 60 min for 214Pb and approximately 25 min for 214Bi, suggesting that there was greater absorption of 214Bi than of 214Pb by the end of the exposure when the blood sample was taken. (442) As noted above, Singh et al. (1986) measured concentrations of 210Pb (t1/2 = 22 y) in the lungs of uranium miners obtained at autopsy. In most (six out of eight) cases, several years elapsed between death and analysis, so that, regardless of its concentration in the lungs at death, 210Po would have reached equilibrium with 210Pb. For the other two miners, the analysis was within a few months of death, and the authors inferred that the results indicated that 210Po and 210Pb were in equilibrium at the time of death.
9.2.1.5. Rapid dissolution rate for lead
(443) The absorption of lead from the respiratory tract following deposition in ionic form has been studied extensively. There have been human volunteer and laboratory animal studies of the biokinetic of lead inhaled in several ionic forms: as a progeny of radon and as nitrate, chloride, hydroxide, fluoride, and oxide. There have also been laboratory animal studies in which solutions of ionic lead were instilled on to the nasal and bronchial epithelium to study the absorption of lead in more detail. Most of these show a similar pattern. As noted by Morrow et al. (1980), where absorption from the respiratory tract to blood has been represented by a single overall absorption rate, half-times of approximately 10 h were obtained for several different forms of lead. For some inhalation studies, the duration of exposure and delay before the first measurement mean that a minor rapid component (time scale of minutes) would not have been observed. However, in studies with sufficient data, two components are generally observed: a rapid phase, with approximately 10–75% clearing with a half-time between a few minutes and 1 h (rate between ∼20 and 200 d−1), and the rest clearing with a half-time of approximately 10 h (rate ∼1.7 d−1). Exceptions are the human volunteer studies of lead as an unattached progeny of radon (Booker et al., 1969; Butterweck et al., 2001, 2002); the results indicate a rate for the rapid phase of more than 100 d−1. Studies of lead inhaled as a progeny of radon give values of sr of approximately 100 d−1, which is applied here to all Type F forms of lead.
9.2.1.6. Extent of binding of lead to the respiratory tract
(444) There is strong evidence for a bound state for lead, on a time scale relevant to its inhalation as a progeny of radon. As noted above, the absorption of lead from the respiratory tract following deposition in ionic form has been studied extensively. In studies with sufficient data, two components are generally observed: a rapid phase (10–75% clearing in <1 h) and the rest with a half-time of approximately 10 h. (445) This similarity in the half-time associated with slow uptake of lead in several different ionic forms suggests that it is a characteristic of the element rather than determined by dissociation of the different forms. The slow phase was not observed when lead was inhaled in organic form (tetra-ethyl or tetra-methyl lead); the rate of uptake observed (∼50% in a few minutes) seems consistent with the size of the molecules. Uptake of inorganic ionic lead was much slower, indicating that some mechanism slows down its uptake to blood. (446) The question of whether the slow phase of absorption of ionic lead represented binding to respiratory tract components has been considered for over 30 y. Chamberlain et al. (1978) noted that lead nitrate was far more soluble in vitro than indicated by the lung measurements, and suggested that the mechanism for transferring lead from lung fluid to blood is a relatively slow process that determines the overall transfer rate. (447) Hursh and Mercer (1970) complemented their inhalation studies of lead as a radon progeny (see above) with ultrafiltration experiments (transfer though dialysis membrane); the 212Pb aerosol was collected electrostatically on to a metal plate, and dispersed ultrasonically into the liquid medium tested. In distilled water or heparinised plasma, less than 1% was ultrafilterable but this was greatly increased by the addition of citrate. The authors attributed the low fraction without added citrate to binding of lead to the dialysis membrane (distilled water) or proteins (plasma). (448) Most directly, James et al. (1977) and Greenhalgh et al. (1982) compared the biokinetic of ionic 212Pb with those of insoluble radiolabelled particles instilled together on to the bronchiolar epithelium of rabbits or nasal mucosa of rats. Despite some rapid absorption into blood, 212Pb cleared more slowly than the particles. The authors concluded that some 212Pb was retained by binding either to static mucus or epithelial tissue. However, a similar clearance half-time has been observed with ionic lead deposited predominantly in the alveolar region (see above, e.g. lead as a radon progeny attached to ambient aerosols), which does not have a mucus lining, suggesting that there is binding to the epithelium. (449) For the experiment by Booker et al. (1969) in which a volunteer inhaled unattached 212Pb (see above), Marsh and Bailey (2013) assessed absorption parameter values fr = 0.36 and fb = 0.82 (assuming an absorption model with sr = 67 d−1 and ss = sb = 1.7 d−1). Neglecting the bound state (assuming fb = 0) underestimated lung retention and overestimated faecal excretion. Marsh and Bailey (2013) obtained similar parameter values from assessment of the results of the experiment by Greenhalgh et al. (1982). Butterweck et al. (2002) estimated fb to be in the range 0.7–0.85, assuming that fr = 1, from the results of their experiments in which volunteers inhaled unattached radon progeny radionuclides. Marsh and Bailey (2013) estimated fb to be approximately 0.7 for lead from these data. (450) Note that (neglecting particle transport) the fraction of the initial deposit in the respiratory tract that is absorbed into blood in the rapid phase is given by fr*(1 – fb). For the studies in which lead nitrate and lead oxide were inhaled by human volunteers (Chamberlain et al., 1978), approximately 60% ILD was cleared rapidly (components with half-times <3 h) (little mucociliary clearance and faecal excretion). These results suggest a lower value of fb than the estimates made for lead as a progeny of radon. Similarly, fb values of approximately 0.25 were estimated here for lead nitrate instilled into rats or lead oxide inhaled by rats based on the data of Moody et al. (1994b) and Boudene et al. (1977), respectively. (451) On the basis of all these results, a bound fraction with fb = 0.5 and a rate of uptake sb = 1.7 d−1 is adopted here for lead. There is experimental evidence that lead in soluble form deposited in the conducting airways is retained in a bound state. It is therefore assumed here that these bound state parameter values apply throughout the respiratory tract (ET2, BB, bb, and AI regions).
9.2.2. Ingestion
(452) Lead absorption has been studied extensively in man and animals (ICRP, 1993). Factors shown to affect absorption of lead include ingestion of milk, calcium and iron status, protein deficiency, vitamin D, and fasting. Of these, fasting causes the greatest variation in uptake. For example, James et al. (1985) measured absorption in volunteers given 203Pb acetate in water to be approximately 0.65 after a 12-h fast compared with approximately 0.04 when taken with a meal. At 3 h after a meal, absorption averaged approximately 0.16 with a range of 0.05–0.5, and after 5 h, the average was approximately 0.45 with a range of 0.3–0.65. Individual variation was also shown by Blake (1976) who measured absorption ranging from 0.1 to 0.7 in 10 volunteers given 203Pb chloride. Heard and Chamberlain (1982) showed that the fractional absorption of 203Pb was approximately 0.4–0.5 when given as chloride in distilled water to volunteers under fasting conditions and that this fractional absorption was reduced to 0.1–0.2 when 203Pb was ingested in tea, coffee, or beer. (453) In the age-specific biokinetic model of lead in humans developed by Leggett (1993), assignment of an f1 value of 0.15 in adults is suggested. (454) Publication 30 (ICRP, 1980) derived an absorption value of 0.2 that was applied in Publication 67 (ICRP, 1993) to dietary intakes. An fA value of 0.2 is used here for direct ingestion of all forms of lead.
9.2.3. Systemic distribution, retention, and excretion
9.2.3.1. Summary of the database
(455) Following intravenous administration of radiolead to human subjects, the injected activity initially cleared from blood at a rate of 1 min−1 or greater (Wells et al., 1975; Chamberlain et al., 1978). A minimum blood content of approximately one-third of the injected amount was reached within 2–3 min, at which time approximately three-quarters of activity in blood resided in red blood cells. Increased activity in blood was then seen for 24–48 h as the tracer returned from extravascular spaces and accumulated in red blood cells (Booker et al., 1969; Wells et al., 1975; Chamberlain et al., 1978). Within a few hours after injection, 99% or more of activity in blood was bound in or on red blood cells (Booker et al., 1969; Hursh et al., 1969; Wells et al., 1975; Chamberlain et al., 1978; Everson and Patterson, 1980; DeSilva, 1981; Heard and Chamberlain, 1984; Manton and Cook, 1984). (456) At 1–2 d after introduction of radiolead into adult humans by injection or inhalation, the blood contained 40–75% (mean 58 ± 12%) of the amount reaching the circulation (Hursh and Suomela, 1968; Booker et al., 1969; Hursh et al., 1969; Wells et al., 1975; Chamberlain et al., 1978; Morrow et al., 1980; Heard and Chamberlain, 1984). Over the next few weeks, activity was cleared from blood with a biological half-time on the order of 15–20 d (Rabinowitz et al., 1973, 1974, 1976; Wells et al., 1975; Heard and Chamberlain, 1984). (457) Soon after introduction of radiolead into blood plasma, the tracer is largely available for diffusion into extravascular fluids and filtration by the kidneys (Vander et al., 1977; Chamberlain et al., 1978; Heard and Chamberlain, 1984). Under steady-state conditions, however, most of the lead in plasma is bound to proteins (Griffin and Matson, 1972). (458) The liver contained approximately 10–15% of administered radiolead at 1 d after intravenous injection into adult humans (Heard and Chamberlain, 1984), baboons (Cohen et al., 1970), or dogs (Lloyd et al., 1975). Most of the activity deposited in the liver was removed with a biological half-time of a few weeks. Autopsy measurements on chronically exposed adult humans indicate that the liver typically contains approximately 2–3% of total-body lead. The blood:liver concentration ratio in chronically exposed persons is typically approximately 0.2 (Blanchard and Moore, 1970, 1971; Hamilton et al., 1972; Barry, 1975, 1981; Gross et al., 1975; ICRP, 1975). (459) Part of the loss of lead from the liver can be accounted for by biliary secretion into the gastrointestinal content, but return of lead from the liver to blood also must be postulated to explain the limited losses in faeces. Estimates of the contribution of biliary secretion to total faecal excretion of lead are variable. For example, data of Rabinowitz et al. (1976) indicate that biliary secretion represents no more than half of all endogenous secretion of lead into the gastrointestinal tract, while data of Ishihara and Matsushiro (1986) suggest that hepatic bile is the main route of faecal elimination of absorbed lead from the body. (460) Results of experimental studies on dogs and rodents indicate that the kidneys accumulated as much as 15–20% of intravenously injected radiolead within the first 1–2 h, most of the accumulated activity represented filtered lead, and a substantial portion of the early accumulation was re-absorbed or lost in urine within a few hours (Morgan et al., 1977; Victery et al., 1979; Keller and Doherty, 1980). In rats, the kidneys contained approximately 10% of the intravenously injected amount after 1 d, but less than 2% after 9 d. In baboons receiving radiolead by intravenous injection, the kidneys contained approximately 4% of the administered amount after 1 d, 0.6% after 30 d, and 0.1% after 60 d (Cohen et al., 1970). In dogs receiving 210Pb by intravenous injection, the kidneys contained approximately 0.5% of the administered activity at 1 month (Lloyd et al., 1975). Comparison of the decline of renal and hepatic activity from 1 d to approximately 2 months after intravenous administration of radiolead to baboons (Cohen et al., 1970) indicates that the removal half-time from the kidneys is approximately half of that from the liver, if each of these organs were treated as a single compartment. This agrees with estimates for baboons exposed to lead by daily ingestion over a period of a few months (Mallon, 1983). (461) Gradual loss of lead from red blood cells, liver, kidneys, and other soft tissues over the first few weeks can be accounted for by a slow loss in urine and faeces and a continual increase in skeletal lead. Typically, 3–5% of injected or absorbed lead is lost in urine during the first day. The urinary:faecal excretion ratio is approximately 2 during Days 3–14 after absorption of lead to blood in humans. Approximately 30% of intravenously injected radiolead is removed in urine and faeces during the first 20 d (Hursh and Suomela, 1968; Booker et al., 1969; Hursh et al., 1969; Hursh and Mercer, 1970; Wells et al., 1975; Chamberlain et al., 1978; Heard and Chamberlain, 1984). (462) In baboons (Cohen et al., 1970) and human subjects (Heard and Chamberlain, 1984), there was evidence of rapid skeletal uptake of approximately 10–15% of intravenously administered lead. The skeletal content remained nearly constant over the next 2–3 d and then increased slowly over an extended period as activity returned from red blood cells and soft tissues to plasma. In human subjects, the skeleton contained approximately 20% of the injected amount after 20 d. Autopsy data for persons chronically exposed to environmental lead indicate that the skeletal content of lead increases throughout life, and represents 90% or more of systemic lead by the fifth decade (Tipton and Cook, 1963; Barry, 1975, 1981; Gross et al., 1975; Leggett, 1993). (463) Skeletal behaviour of lead appears to be qualitatively similar to that of the alkaline earth elements, and quantitatively similar to that of barium or radium, if account is taken of the slower deposition of lead in the skeleton due to competition from red blood cells (Hursh, 1973; Lloyd et al., 1975; Domanski and Trojanowska, 1980; Heard and Chamberlain, 1984). Lead has been used frequently as a marker of bone growth and osteon formation, and a close resemblance to calcium has been demonstrated in such studies (Vincent, 1957; Lacroix, 1960; Scheiman-Tagger and Brodie, 1964; Hong et al., 1968; Yen and Shaw, 1977). Lead is incorporated into the crystalline structure of bone, where it replaces calcium ions (MacDonald et al., 1951; Verbeeck et al., 1981; Miyake et al., 1986). (464) Autoradiographs of bone sections from baboons injected with 210Pb indicate that a portion of skeletal activity remains near bone surfaces at 1–2 months after administration, as appears to be the case for radium and barium. Studies on human subjects indicate that the distribution of lead in bone may be skewed towards bone surfaces for at least a few months after exposure, but the subjects generally have been exposed to heavy levels of lead that could affect bone metabolism (Lindh et al., 1978; Flood et al., 1988). Burial of lead beneath the surfaces in regions of bone formation has been observed, and there is evidence that lead is eventually distributed throughout the bone volume (Vincent, 1957; Lacroix, 1960; Scheiman-Tagger and Brodie, 1964; Hong et al., 1968; Yen and Shaw, 1977; Lindh et al., 1978; Hu et al., 1989). In beagles, long-term skeletal retention of lead is similar to that of strontium and radium (Hursh, 1973; Lloyd et al., 1975). As lead is incorporated into the bone crystal, long-term losses from bone presumably are largely controlled by the rate of bone resorption. (465) In a study of the comparative behaviour of injected lead, calcium, and barium in bone of rabbits, Domanski and Trojanowska (1980) found that the build-up of lead in bone is similar to that of barium and greater than that of calcium when related to integrated activity in plasma. Similar results for lead and calcium were obtained by Heard and Chamberlain (1984) for humans injected with radioisotopes of these two elements. For example, the relatively low uptake of lead by the skeleton at early times, compared with radium, apparently reflects a competition by red blood cells for lead that does not occur to a significant extent for the alkaline earth elements. The later build-up in the skeleton results from the gradual release of activity from red blood cells, and the longer retention of lead in the skeleton than in red blood cells.
9.2.3.2. Biokinetic model for systemic lead
(466) The biokinetic model for systemic lead used in this publication is the model applied to adult members of the public in Publication 67 (ICRP, 1993) and to workers in Publication 68 (ICRP, 1994). The model is a simplification of a model by Leggett (1993), which provides more detail concerning the initial exchange of lead between plasma and extravascular spaces, its kinetics in red blood cells, and its distribution in soft tissues. (467) The model structure is shown in Fig. 9.1. Parameter values for a reference worker are listed in Table 9.2. Lead-specific parameter values (all parameter values other than those based on bone remodelling rates) were based on results of: controlled studies on human subjects receiving stable or radioactive lead by injection, acute inhalation, or acute ingestion; long-term balance studies on human subjects; autopsy measurements on environmentally exposed humans; bioassay and autopsy measurements on occupationally exposed persons; and radioisotopic studies on laboratory animals, primarily non-human primates and dogs. (468) An early, rapid exchange of lead that occurs between plasma and extravascular spaces (Leggett, 1993) is not addressed in the present model. It is assumed here that lead leaves plasma at a rate of 70 d−1, and that a substantial portion of activity leaving plasma goes to the rapid turnover soft tissue compartment (ST0) that is three times as large as the plasma compartment. Inflow and outflow rates selected for red blood cells yield an estimate of approximately 58% of injected lead in red blood cells at l–2 d after injection. It is assumed that 40% of outflow from plasma deposits in red blood cells. A biological half-time of 5 d for lead in red blood cells is set to yield a net half-time in blood (elongated by recycling) of approximately 20 d in the time between a few days and a few weeks after injection, based on data for humans. (469) Urinary and faecal excretion rates were based on observations of the fate of intravenously injected radiolead in human subjects. It is assumed that 6% of outflow from plasma enters urinary excretion pathways. Part of this (2.5%) is assumed to pass instantaneously through the kidneys to the bladder contents, and the rest (3.5%) is assumed to deposit in the renal tubules and to be released to the bladder contents over a period of days. It is assumed that 4.15% of outflow from plasma enters the intestinal contents either directly or indirectly: 1% passes directly into the right colon contents, and 45% of the deposition in liver (0.45 × 7% of outflow from plasma) is secreted into the small intestine contents. The portion of lead secreted into the small intestine contents is assumed to be subject to re-absorption to blood. Based on an absorption fraction fA = 0.2, the model predicts that approximately 3.5% of outflow from plasma is excreted in faeces. (470) Loss of lead in sweat is assumed to represent 0.6% of outflow from plasma. A fourth excretion pathway, representing loss of lead in hair, skin, and nails, is depicted as outflow from soft tissue compartment ST1 (described below). The predicted loss of lead from the body through this fourth pathway is equivalent to 0.4% of outflow from plasma. (471) The liver is assumed to consist of two compartments: one with relatively short retention (Liver 1) and one with relatively long retention (Liver 2). Activity entering the liver is assigned to Liver 1. A small portion of the activity leaving Liver 1 is assigned to Liver 2, but most of the outflow is divided between plasma and the small intestine. Parameter values describing uptake, retention, and removal of lead by the liver were based on biokinetic studies of radiolead in human subjects, baboons, and dogs, and blood:liver concentration ratios observed in persons chronically exposed to low levels of environmental lead. It is assumed that 7% of lead leaving plasma deposits in Liver 1, the removal half-time from Liver 1 is 10 d, 10% of activity leaving Liver 1 deposits in Liver 2, and the remaining 90% of outflow from Liver 1 is evenly divided between plasma and small intestine contents. The removal half-time from Liver 2 is 1 y. (472) The kidneys are assumed to consist of two compartments: one with relatively short retention (urinary path) and one with relatively long retention (other kidney tissue). The urinary path receives lead from plasma and loses activity to the urinary bladder contents. Other kidney tissue exchanges lead slowly with plasma. Parameter values describing uptake, retention, and removal of lead by the kidneys were based on biokinetic studies of radiolead in baboons, dogs, and rats, and blood:liver concentration ratios observed in persons chronically exposed to low levels of environmental lead. It is assumed that 3.5% of outflow from plasma deposits in the urinary path and 0.035% deposits in other kidney tissue. The removal half-time from the urinary path to the urinary bladder contents is 5 d. The removal half-time from other kidney tissue is 1 y. (473) Other soft tissues are divided into compartments ST0, ST1, and ST2, representing fast (hours), intermediate (months), and slow (years) return of lead to plasma. These are not physically identifiable compartments. They are defined on a kinetic basis for reasonable agreement with estimates of the lead content of soft tissues other than liver and kidneys during chronic exposure, or as a function of time after acute intake of lead. The underlying datasets include results of a variety of studies on laboratory animals and human subjects. Compartments ST1 and ST2 are assigned 1% and 0.2% of outflow from plasma, respectively. The fast-turnover compartment is assigned 31.66% of outflow from plasma, where the last three figures reflect an adjustment of the initially assigned deposition fraction to account for 100% of outflow from plasma. The biological half-times in ST0, ST1, and ST2 are approximately 2.25 h, 100 d, and 5 y, respectively. Outflow from the intermediate-term compartment ST1 is divided between plasma (60%) and an excretion compartment representing loss of lead in hair, skin, and nails (40%). (474) Parameter values describing the bone kinetics of lead at early to intermediate times after uptake to blood are based on studies of radiolead in adult humans, baboons, and dogs, and analogy with radium. Bone surfaces are assumed to receive 12.5% of outflow from plasma. The assumed division between trabecular and cortical surfaces is based on analogy with radium. Lead is removed from bone surfaces at a rate of 1 d−1, with 50% returning to plasma and 50% entering exchangeable bone volume. The rates of transfer from the exchangeable bone volume compartments to bone surfaces and to non-exchangeable bone volume are based on analogy with radium. The assumed rate of removal from each bone volume compartment to plasma is the reference bone turnover rate for that bone type (ICRP, 2002a). Structure of the biokinetic model for systemic lead. RBC, red blood cells; GI, gastrointestinal; exch, exchangeable; nonexch, non-exchangeable. ST0, ST1, and ST2 represent soft tissues with fast, intermediate, and slow turnover, respectively. The primary parameter values such as compartment deposition fractions and biological half-times underlying the transfer coefficients given in Table 9.3 are summarised below. The reader is referred to the paper by Leggett (1993) for a detailed discussion of the conceptual basis of the model and the data sets used in the development of parameter values.

9.2.3.3. Treatment of radioactive progeny
(a) Dosimetrically significant lead progeny (475) Several lead isotopes addressed in this publication have radioactive progeny that contribute, to some extent, to dose coefficients for the internally deposited lead parent. The radioactive progeny addressed in calculation of dose coefficients for radioisotopes of lead are isotopes of gold, mercury, thallium, lead, bismuth, and polonium. The biokinetic models applied to these elements as progeny of systemic lead are described below. (b) Gold (476) The biokinetic of gold have been investigated extensively in human subjects and laboratory animals in studies related to its medical applications, particularly the use of stable gold for treating rheumatoid arthritis and short-lived radioactive gold as an imaging agent (Block et al., 1942, 1944; Freyberg et al., 1942; Jeffrey et al., 1958; Lawrence, 1961; Rubin et al., 1967; McQueen and Dykes, 1969; Mascarenhas et al., 1972; Sugawa-Katayama et al., 1975; Gottlieb, 1983; Jellum et al., 1980; Massarella and Pearlman, 1987; Andersson et al., 1988; Bacso et al., 1988; Brihaye and Guillaume, 1990). Also, several studies have addressed the biological behaviour of gold as a radioactive contaminant in the workplace or environment (Durbin, 1960; Fleshman et al., 1966; Chertok and Lake, 1971a,b,c; Silva et al., 1973). Development of a representative biokinetic model for systemic gold in adult humans is complicated by the apparent dependence of reported data on the mode of administration, chemical form, administered mass, and other study conditions. The following general properties appear to be typical of gold administered in relatively soluble form. Much of the gold reaching blood is excreted in the first week or two, but a non-trivial portion is retained for several weeks or months. Excretion is primarily in urine. Most of the retained amount is found in the kidneys, liver, and blood. Most of the gold found in blood is bound to plasma proteins. (477) The following systemic model is applied to gold produced in vivo following intake of lead. Gold leaves the central blood compartment (Blood 1) at the rate 1 d−1 and is distributed as follows: 10% to Blood 2 (a blood compartment with relatively slow turnover), 30% to urinary bladder contents, 10% to right colon contents, 10% to kidneys, 10% to liver, 5% to red marrow, 1% to spleen, 1% to trabecular bone surfaces, 1% to cortical bone surfaces, 0.5% to skin, 0.06% to testes, 0.02% to ovaries, 10% to Other 2 (a soft tissue compartment with slow turnover), and the remaining 11.42% to Other 1 (a soft tissue compartment with a moderate turnover rate). Blood 1, kidneys, and liver are identified with plasma, Kidneys 1, and Liver 1, respectively, in the model for lead (Fig. 9.1). Gold transfers from Blood 2 to Blood 1 with a half-time of 5 d; from liver, Other 1, spleen, testes, ovaries, red marrow, skin, trabecular bone surfaces, and cortical bone surfaces to Blood 1 with a half-time of 10 d; from kidneys to urinary bladder contents with a half-time of 10 d; and from Other 2 to blood with a half-time of 50 d. Gold produced by radioactive decay in a blood compartment that is not identifiable with a blood compartment of the gold model is assumed to transfer to Blood 1 at the rate 1000 d−1. Gold produced in a soft tissue compartment not identifiable with a compartment in the model for gold is assumed to transfer to Blood 1 with a half-time of 10 d. Gold produced in a compartment of trabecular or cortical bone volume is assumed to transfer to Blood 1 at the reference turnover rate for that bone type. (c) Mercury (478) The model for mercury produced in vivo following intake of lead is based on biokinetic data for human subjects and laboratory animals exposed to inorganic forms of mercury, primarily divalent mercury salts (Friberg, 1956; Rothstein and Hayes, 1960; Cember, 1962; Hayes and Rothstein, 1962; Berlin and Ullberg, 1963; Clarkson and Rothstein, 1964; Joselow et al., 1967; Johnson and Johnson, 1968; Berlin et al., 1969; Brown et al., 1975; Hursh et al., 1976, 1980; Jugo, 1976; Cherian et al., 1978; Newton and Fry, 1978; Berlin, 1986; Jonsson et al., 1999). Retention data for mercury entering the body as a vapour are also considered for times remote from intake, as the biokinetic of this initial form of mercury gradually converge to that seen after intake of divalent mercury salts. Studies of animals administered divalent mercury salts indicate initially rapid disappearance of mercury from blood, but a substantial portion of the injected amount is retained in blood after several hours. Animal and human studies indicate that as much as 30–40% of divalent mercury reaching blood is deposited in the kidneys, and is retained there with a half-time on the order of 50 (35–90) d. In rats injected with inorganic divalent mercury, the kidneys and liver accounted for approximately 10% of the systemic burden after 4 h, 40% after 1 d, 70% after 6 d, 88% after 15 d, and 91% after 52 d. In human subjects, more than half of absorbed inorganic mercury is removed from the body in urine. Initially, the rate of faecal excretion is much higher than that of urinary excretion, but this relation reverses over a few weeks as the kidney content builds up and the content of other systemic tissues declines. In addition to losses in urine and faeces, mercury is removed from the systemic fluids and tissues by exhalation as mercury vapour, and small amounts are lost through sweat, hair, and other routes. External measurements on human subjects exposed to inorganic mercury suggest that much of the mercury deposited in soft tissues other than kidneys is removed over a period of a few weeks. In rats receiving mercury chloride by intravenous or intramuscular injection, a slow phase of excretion with a half-time of 3 months or more was apparent by 2 months after injection. A component of retention in the body with a half-time on the order of 100 d is also indicated by long-term measurements of urinary mercury following human exposure to inorganic mercury. (479) The systemic model for mercury as a member of a lead chain consists of the following compartments: Plasma 1 (diffusible mercury), Plasma 2 (protein-bound mercury), red blood cells, kidneys, liver, spleen, red marrow (active marrow), testes, ovaries, cortical bone surfaces, trabecular bone surfaces, and compartments Other 1 and Other 2 representing moderate and slow phases of loss from remaining soft tissues, respectively. Plasma 1, kidneys, and liver are identified with plasma, Kidneys 1, and Liver 1, respectively, in the model for lead (Fig. 9.1). Mercury absorbed to blood or re-entering blood from tissues is assigned to Plasma 1. The total transfer coefficient from Plasma 1 to all destinations is 16.636 h−1, corresponding to a half-time of 1 h. Outflow from Plasma 1 is divided as follows: 4% to red blood cells, 12% to Plasma 2, 35% to kidneys, 20% to liver, 10% to small intestine contents, 3% to red marrow, 0.6% to spleen, 0.2% to skin, 0.03% to testes, 0.01% to ovaries, 3.5% to Other 2, 5% to excreta (excretion other than urine and faeces), 1% to cortical bone surfaces, 1% to trabecular bone surfaces, and the remaining 4.66% to Other 1. Mercury transfers from red blood cells to Plasma 1 with a half-time of 3 d, from Plasma 2 to Plasma 1 with a half-time of 1 d, from kidneys to urinary bladder contents with a half-time of 35 d, from bone surface compartments to Plasma 1 with a half-time of 20 d, from Other 1 to Plasma 1 with a half-time of 20 d, and from Other 2 to Plasma 1 with a half-time of 100 d. Mercury is removed from liver with a half-time of 10 d, with outflow from liver equally divided between Plasma 1 and small intestine contents. Mercury transfers from red marrow, spleen, skin, testes, and ovaries to Plasma 1 with a half-time of 20 d. Mercury is absorbed from small intestine contents to Plasma 1 based on the reference absorption fraction for ingested inorganic mercury, and the unabsorbed portion transfers to the right colon contents and is eventually excreted in faeces. Mercury produced by radioactive decay in a blood compartment that is not identifiable with a blood compartment of the mercury model is assumed to transfer to Plasma 1 at the rate 1000 d−1. Mercury produced in a soft tissue compartment not identifiable with a compartment in the model for mercury is assumed to transfer to Plasma 1 with a half-time of 20 d. Mercury produced in a compartment of cortical or trabecular bone volume is assumed to transfer to Plasma 1 at the reference turnover rate for that bone type. (d) Thallium (480) The biokinetic of thallium have been investigated extensively in human subjects and laboratory animals, due mainly to the importance of radiothallium in nuclear medicine and many occurrences of accidental or malicious poisoning with stable thallium (Gettler and Weiss, 1943; Barclay et al., 1953; Lie et al., 1960; Gehring and Hammond, 1967; Potter et al., 1971; Bradley-Moore et al., 1975; Strauss et al., 1975; Atkins et al., 1977; Suzuki et al., 1978; Berger et al., 1983; Nakamura et al., 1985; Gregus and Klaassen, 1986; Krahwinkel et al., 1988; Lathrop et al., 1989; Blanchardon et al., 2005; Thomas et al., 2005). Comparisons of the disappearance of radioisotopes of thallium, potassium, and rubidium from blood and their uptake by tissues of laboratory animals suggest a close relation in the movement of these elements, presumably associated with their similar ionic radii (Gehring and Hammond, 1967; Strauss et al., 1975). These elements are removed rapidly from plasma, and their early distributions are determined largely by the distribution of cardiac output. After entering the cell, thallium is released more slowly than potassium or rubidium, but the mean residence time of thallium in the body is less than that of potassium or rubidium due to a higher rate of clearance from plasma to excretion pathways. Most reported removal half-times of thallium from the adult human body are in the range 9–13 d (Atkins et al., 1977; Krahwinkel et al., 1988; Blanchardon et al., 2005). Chen et al. (1983) reported two components of retention of thallium: 7 d for 63% and 28 d for 37% of the injected amount. It appears that faecal excretion typically represents more than half of cumulative excretion of thallium over a period of weeks following its acute intake, although some relatively short-term human studies have suggested that excretion of thallium is primarily in urine (cf. Barclay et al., 1953; Lathrop et al., 1975; Atkins et al., 1977; Blanchardon et al., 2005). (481) The following systemic model is applied to thallium produced in vivo following intake of lead. Thallium leaves the central blood compartment (plasma) at the rate 200 d−1 (corresponding to a half-time of 5 min) and is distributed as follows: 2.5% to red blood cells, 0.75% to urinary bladder contents, 1.75% to right colon contents, 5% to kidneys, 5% to liver, 2.5% to skin, 1.5% to red marrow, 0.2% to spleen, 0.3% to testes, 0.1% to ovaries, 7.5% to trabecular bone surfaces, 7.5% to cortical bone surfaces, and 65.4% to remaining soft tissues (other). Kidneys and liver are identified with Kidneys 2 and Liver 1, respectively, in the model for lead (Fig. 9.1). Thallium returns from red blood cells to plasma at the rate 3.7 d−1, and from tissue compartments to plasma at the rate 2.5 d−1. Thallium produced by radioactive decay in a blood compartment that is not identifiable with a blood compartment of the thallium model is assumed to transfer to plasma at the rate 1000 d−1. Thallium produced in a soft tissue compartment not identifiable with a compartment of the thallium model is assumed to transfer to plasma at the rate 2.5 d−1. Thallium produced in a compartment of cortical or trabecular bone volume is assumed to transfer to plasma at the reference turnover rate of that bone type. (e) Lead (482) The systemic model for lead as a progeny of lead is an extension of the characteristic model for lead described above. Compartments representing red marrow, spleen, skin, testes, and ovaries are added to the model structure for consistency with the models for other lead progeny. Each of the added compartments is assumed to exchange activity with plasma alone. Transfer coefficients between plasma and these compartments are set for reasonable consistency with the equilibrium concentration of lead in these compartments relative to the equilibrium concentration in liver as indicated by results of autopsy studies on human subjects (Blanchard and Moore, 1970, 1971; Gross et al., 1975; Skerving et al., 1983). The removal half-time from each of the added compartments is set at 1 y, which is the long-term removal half-time from liver (t1/2 from Liver 2 to plasma). It is assumed that 0.6% of outflow from plasma goes to red marrow, 0.03% goes to spleen, 0.2% goes to skin, 0.005% goes to testes, and 0.002% goes to ovaries. The transfer coefficients from plasma to each of the soft tissue compartments Other 0, Other 1, and Other 2 are reduced by approximately 2.5% to maintain a total outflow rate from plasma of approximately 70 d−1. Lead produced in a soft tissue compartment of a preceding chain member not identifiable with a compartment of the lead model is assumed to transfer to plasma at the rate 7.39 d−1; the highest rate of transfer to plasma in the lead model. Lead produced in a blood compartment of a preceding chain member that is not identifiable with a blood compartment of the lead model is assigned the transfer rate 1000 d−1 to plasma. (f) Bismuth (483) The systemic model for bismuth as a progeny of lead is based on the characteristic model for bismuth applied in this publication. The structure of the characteristic model for bismuth is modified by the addition of compartments representing red marrow, spleen, skin, testes, and ovaries, which are explicitly identified in models for some other elements appearing in lead chains. Each of these compartments is assumed to exchange bismuth with plasma. Transfer coefficients for the added compartments are selected for reasonable consistency with the biokinetic database underlying the characteristic model for bismuth, and with the retention curve for total soft tissues based on that original model. The specific changes to the characteristic model for bismuth are as follows: (1) the transfer coefficients from plasma to the added compartments are 0.3 d−1 for red marrow, 0.3 d−1 for skin, 0.02 d−1 for spleen, 0.003 d−1 for testes, and 0.001 d−1 for ovaries; (2) the transfer coefficient from plasma to the other soft tissue compartment with a moderate turnover rate (0.0347 d−1, equivalent to a half-time of 20 d) is reduced from 4.2 d−1 to 3.576 d−1; and (3) the assigned transfer coefficient from each of the added compartments to plasma is 0.0347 d−1. Bismuth produced in a blood compartment that is not identifiable with a blood compartment of the bismuth model is assumed to transfer to plasma at the rate 1000 d−1. Bismuth produced in a trabecular or cortical bone volume compartment is assumed to transfer to plasma at the reference turnover rate for that bone type. (g) Polonium (484) The systemic model for polonium as a member of a lead chain is the same as the systemic model applied in this publication to polonium as a parent radionuclide (Section 11), except that no distinction is made in the progeny model between polonium entering blood from the respiratory and alimentary tracts (see the description of the more detailed absorption model for polonium as a parent in Section 11.2.3). With reference to the transfer coefficients for polonium as a parent listed in Table 11.3, polonium as a progeny transferred to blood from either the respiratory or alimentary tract is assigned to Plasma 2. Polonium produced in a blood compartment that is not identifiable with a blood compartment of the polonium model is assumed to transfer to Plasma 2 in the polonium model (Fig. 11.1) at the rate 1000 d−1. Polonium produced in a soft tissue compartment not identifiable with a compartment of the polonium model is assumed to move to Plasma 2 with a half-time of 7 d. Polonium produced in a compartment of cortical or trabecular bone volume is assumed to transfer to Plasma 2 at the reference rate of turnover of that bone type.
9.3. Individual monitoring
(485) The monitoring results of lead in excreta samples of occupationally exposed personnel should be compared with the background excreta lead concentrations of the local population by statistical techniques. A baseline might be established for an individual or for the bioassay monitoring programme. Skeleton content and daily urinary excretion of 210Pb following inhalation of 1 Bq Type M.
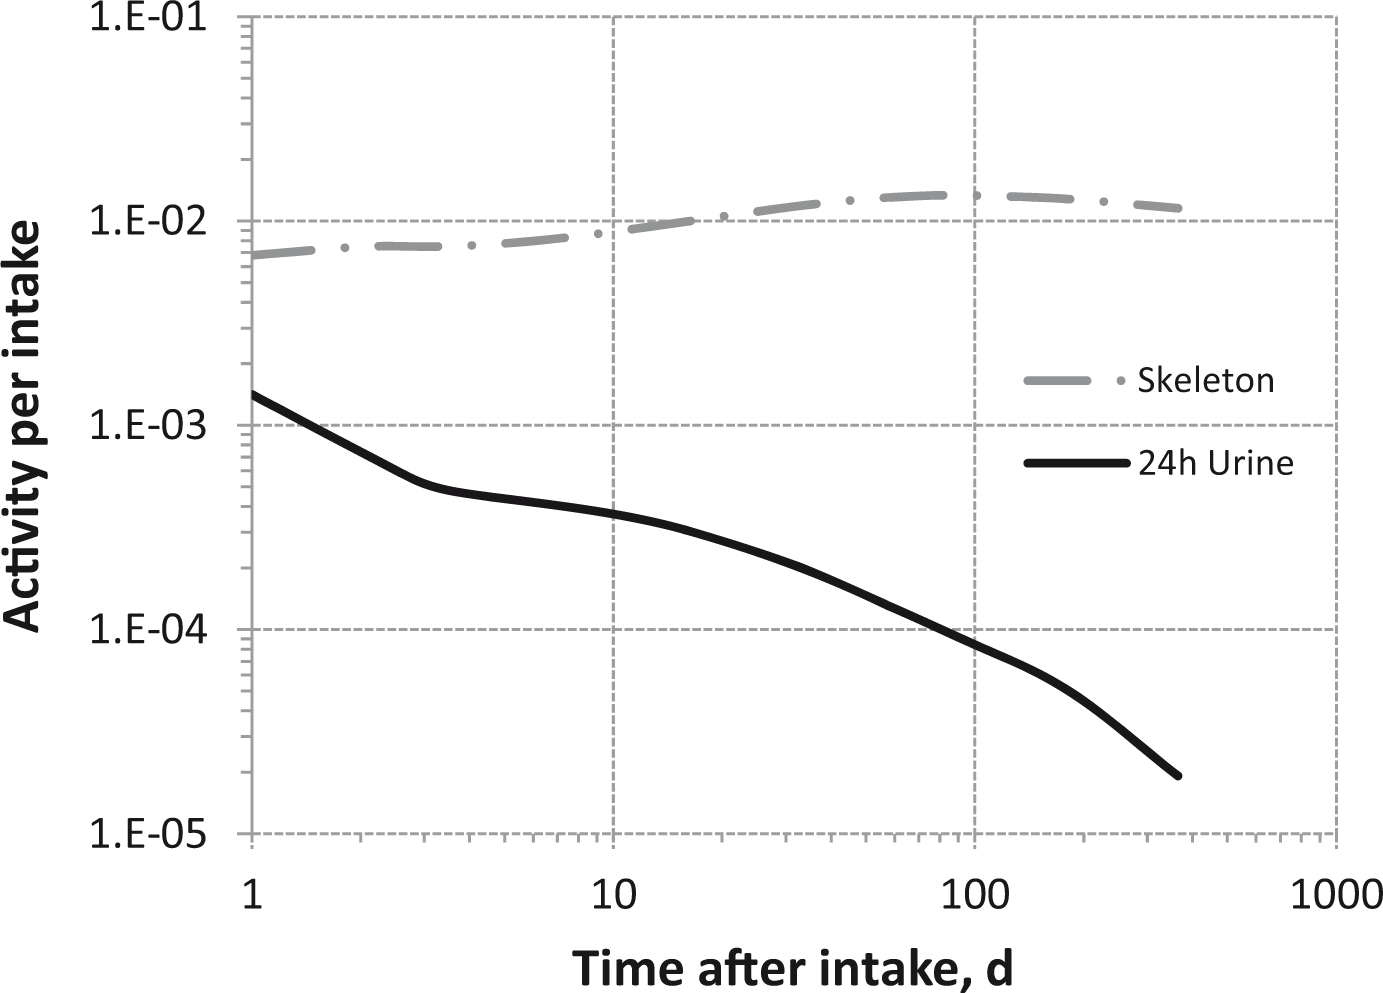
9.3.1. 210Pb
(486) Urine bioassay is used for the monitoring of 210Pb. In addition, when necessary, measurements of the concentration in faeces may be performed. For refined monitoring of 210 Pb skeleton burdens, in-vivo measurements of the cranium and knee might be performed.
9.3.2. 212Pb
(487) In-vivo monitoring, and lung and whole-body measurement are the main techniques used to determine 212Pb intakes.
9.3.3 214Pb
(488) In vivo monitoring, and lung and whole-body measurement are the main techniques used to determine 214Pb intakes.
9.4. Dosimetric data for lead
Skeleton content and daily urinary excretion of 210Pb following inhalation of 1 Bq Type S. Total body content and daily urinary excretion of 212Pb following inhalation of 1 Bq Type F. Total body content and daily urinary excretion of 212Pb following inhalation of 1 Bq Type M. Total body content and daily urinary excretion of 212Pb following inhalation of 1 Bq Type S. Dose per activity content of 210Pb in skeleton and in daily excretion of urine (Sv Bq−1); 5-µm activity median aerodynamic diameter aerosols inhaled by a reference worker at light work. Dose per activity content of 212Pb in total body and lungs (Sv Bq−1); 5-µm activity median aerodynamic diameter aerosols inhaled by a reference worker at light work. NA, not applicable. Dose per activity content of 214Pb in total body and lungs (Sv Bq−1); 5-µm activity median aerodynamic diameter aerosols inhaled by a reference worker at light work. NA, not applicable.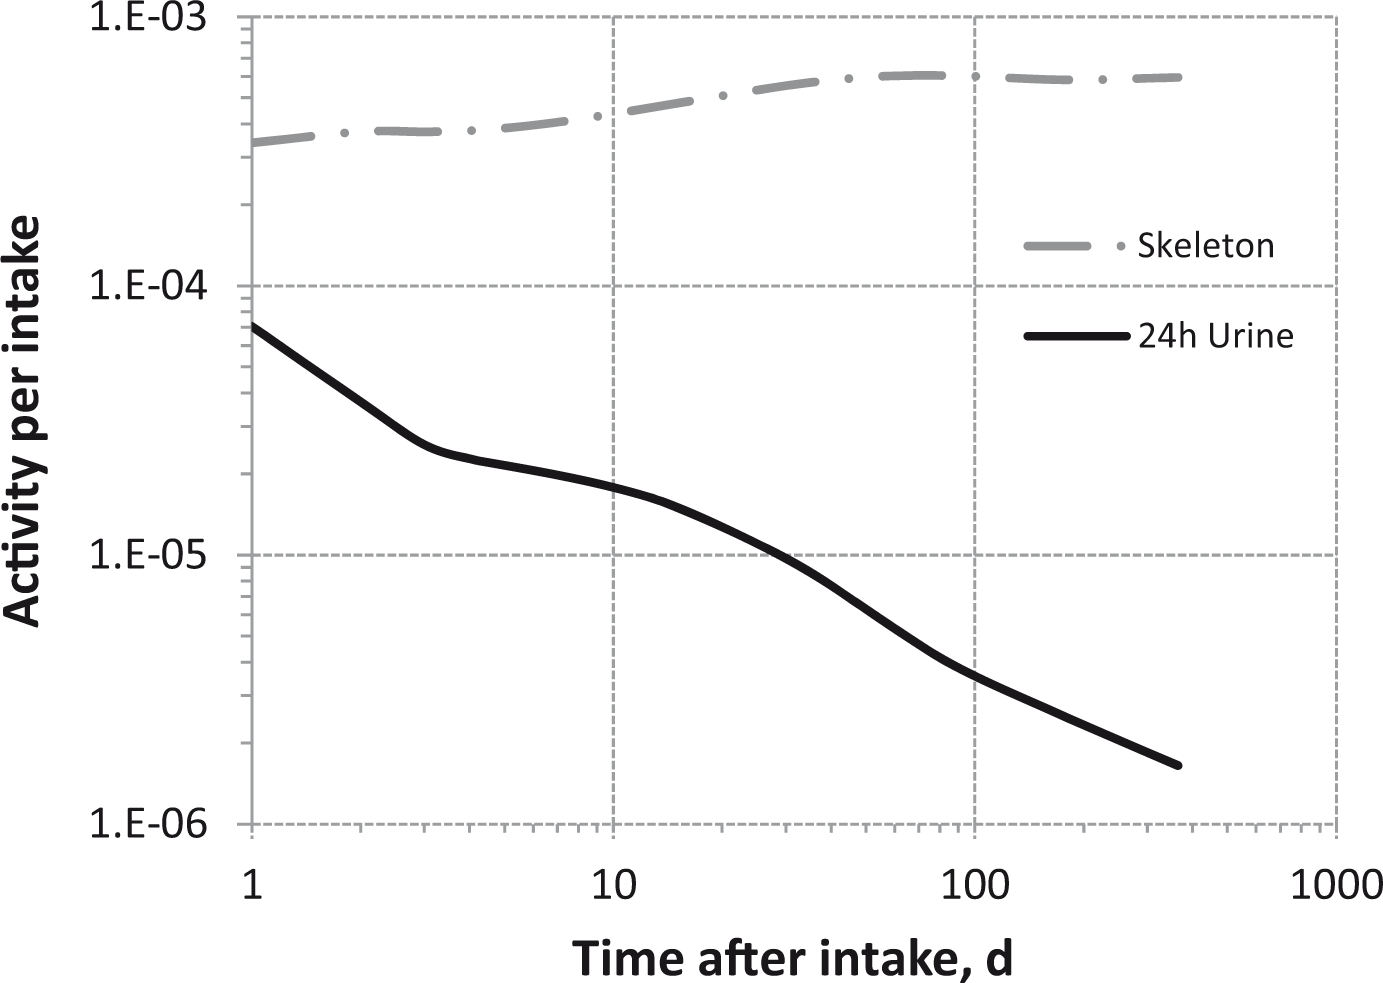


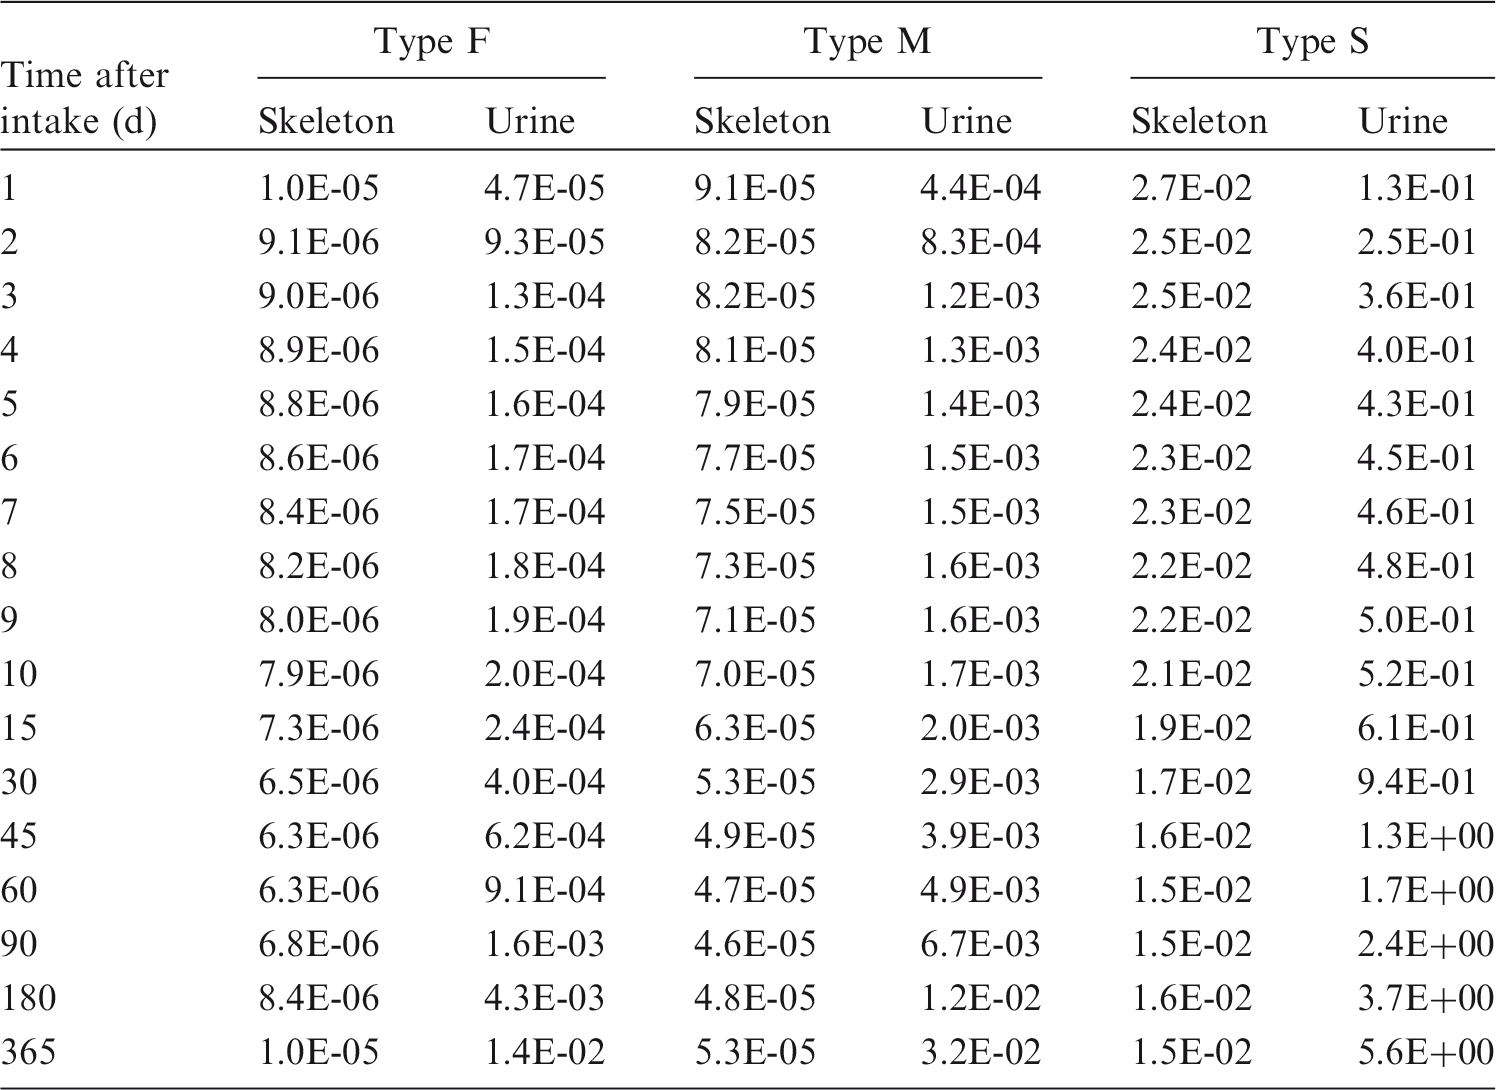


9.5. References
10. BISMUTH (Z = 83)
10.1. Chemical forms in the workplace
(489) Bismuth is a metalloid that occurs mainly in oxidation state III. Arsenic and antimony are good chemical analogues of bismuth. Bismuth is encountered in industry in a variety of chemical and physical forms, including oxides, chlorides, fluorides, iodides, and sulphides. (490) Several isotopes of bismuth with short half-lives (e.g. 210Bi, 211Bi, 212Bi, 214Bi) occur within the radioactive disintegration chains of actinium, radium, and thorium (see Figs. 14.1, 15.1, and 15.2). Structure of the biokinetic model for systemic bismuth. RBC, red blood cells; GI, gastrointestinal. ST0, ST1, and ST2 represent soft tissues with fast, intermediate, and slow turnover, respectively.
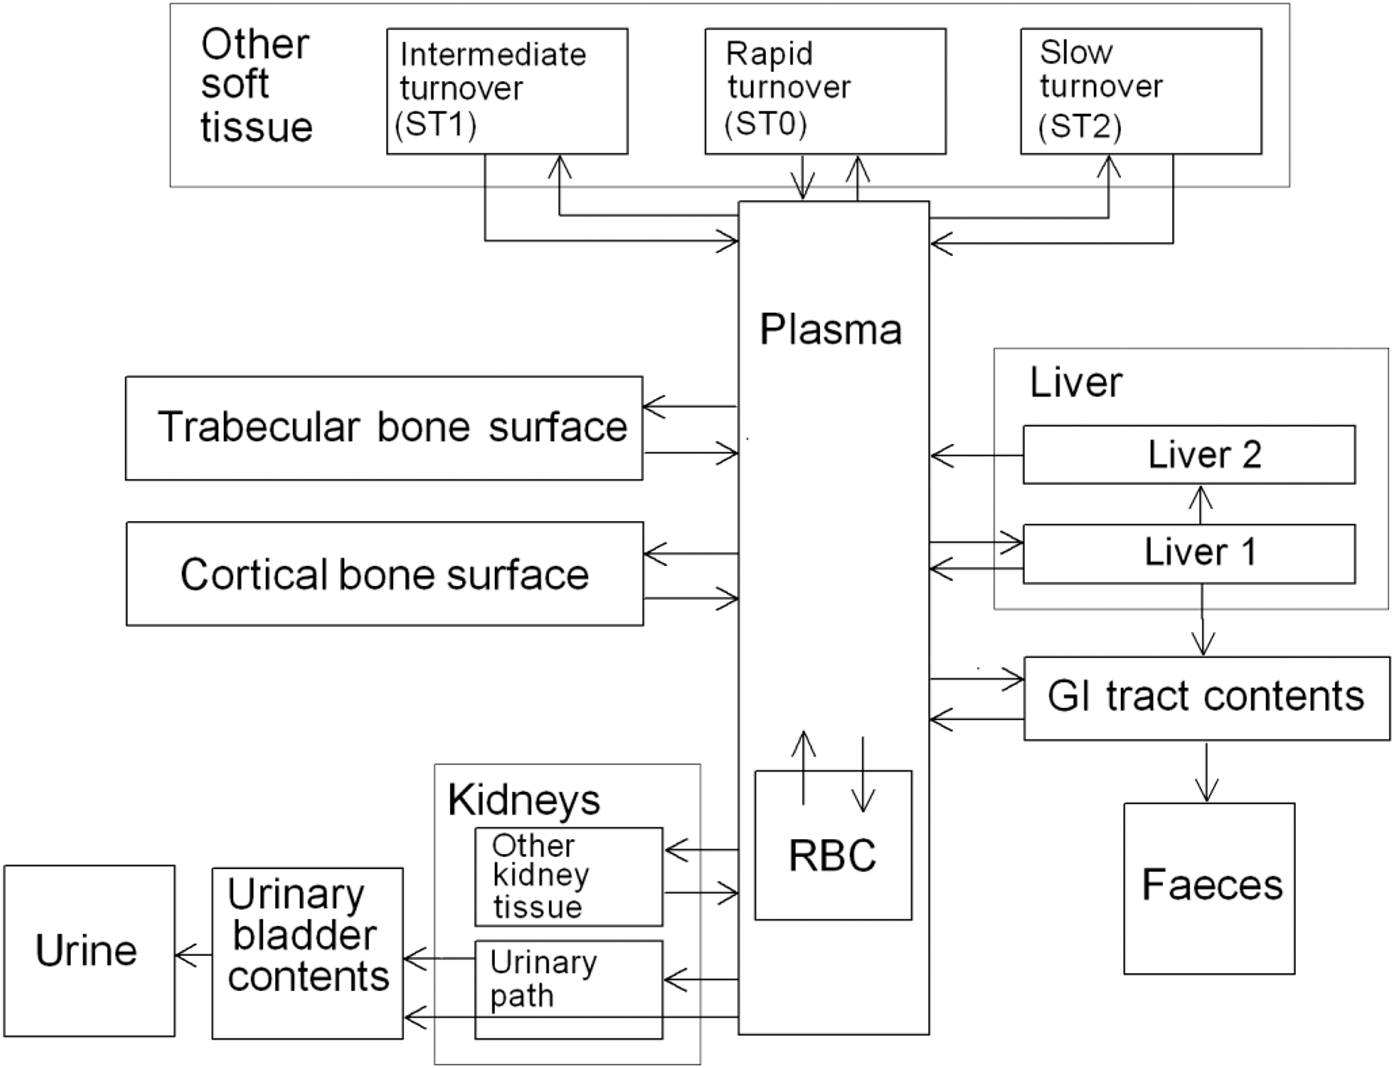
10.2. Routes of intake
10.2.1. Inhalation
(491) Very little information from which parameter values can be assessed is available from experimental studies of the behaviour of bismuth deposited in the respiratory tract. (492) Absorption parameter values and types, and associated fA values for particulate forms of bismuth are given in Table 10.2. For radiation protection purposes, the most important exposures to radioisotopes of bismuth are progeny radionuclides of radon. Dose coefficients for isotopes of bismuth inhaled as radon progeny radionuclides are given in Section 12, where factors such as the relevant aerosol size distribution are addressed. Otherwise, exposures to radioisotopes of bismuth occur most often as progeny radionuclides associated with intakes of uranium, thorium, or radium. Model predictions of total-body retention of intravenously injected bismuth compared with observations of Newton et al. (2001) for a human subject injected intravenously with 207Bi citrate. Retention through Day 25 estimated from excretion measurements, and for subsequent times from external measurements. Isotopes of bismuth addressed in this publication. EC, electron-capture decay; B+, beta-plus decay; B−, beta-minus decay; IT, isomeric transition decay; A, alpha decay. Dose coefficients and bioassay data for these radionuclides are given in the printed copy of this publication. Data for other radionuclides listed in this table are given in the accompanying electronic annex. Absorption parameter values for inhaled and ingested bismuth. It is assumed that the bound state can be neglected for bismuth, i.e. fb = 0. The values of sr for Type F, M, and S forms of bismuth (1 d–1) are element-specific. †For inhaled material deposited in the respiratory tract and subsequently cleared by particle transport to the alimentary tract, the default fA values for inhaled materials are applied; i.e. the product of fr for the absorption type (or specific value where given) and the fA value for ingested soluble forms of bismuth (0.05). Materials (e.g. bismuth as a progeny of radon) are listed here where there is sufficient information to assign to a default absorption type, but not to give specific parameter values (see text). In the case of bismuth as a progeny of radon, these Type F parameter values are applied in Annex A (Table A.2) and used in the calculation of dose coefficients for radon progeny aerosols, given in Table 12.6 of the radon chapter. Default Type M is recommended for use in the absence of specific information on which the exposure material can be assigned to an absorption type; for example, if the form is unknown, or if the form is known but there is no information available on the absorption of that form from the respiratory tract. Activity transferred from systemic compartments into segments of the alimentary tract is assumed to be subject to re-absorption to blood. The default absorption fraction fA for the secreted activity is the reference fA (0.05) for ingestion of the radionuclide.


10.2.1.1. Bismuth as a progeny of radon
(493) In this section, studies are considered in which 212Bi (t1/2 = 61 min) formed from decay of 220Rn (t1/2 = 56 s), 216Po (t1/2 = 0.15 s), and 212Pb (t1/2 = 11 h), or 214Bi (t1/2 = 20 min) formed from decay of 222Rn (t1/2 = 3.8 d), 218Po (t1/2 = 3.1 min), and 214Pb (t1/2 = 27 min) was inhaled directly, while still airborne. For decay schemes, see Annex A, Figs. A.1–A.3. Studies in which bismuth ions were administered to the respiratory tract in a liquid medium, which might also be relevant to bismuth as a progeny of radon, are considered below in Section 10.2.1.2. (494) Drew (1971) reported that the tissue distributions of 212Pb and 212Bi activities were similar in rats following exposure to 220Rn (thoron) and its progeny radionuclides for 2 d. However, the exposure situation was complex because the 212Pb and 212Bi in tissues originated from inhalation of 220Rn and its decay within the body, inhalation of 212Pb and 212Bi, and also their ingestion from food and preening of fur. It is therefore difficult to estimate how much of the 212Bi originated from intake of 212Bi, and how much from decay of 212Pb in the body. (495) Butterweck et al. (2001, 2002) carried out volunteer experiments to determine the absorption rate of unattached radon progeny (for further information, see Section 9.2.1). Volunteers inhaled an aerosol that was predominantly unattached radon progeny. Measurements were made of 222Rn, 214Pb, and 214Bi in blood samples taken at the end of a 30-min exposure (Butterweck et al., 2002). In-vivo measurements of the head and chest were carried out over a 30-min period, starting approximately 7 min after exposure (Butterweck et al., 2001). No clearance from the head (other than physical decay) was observed over this period for 214Pb, indicating that a small fraction of the unattached 214Pb was absorbed rapidly to blood (sr ≫ 100 d−1), as measured by the blood sample, while the rest (fraction fb) was bound to tissues (or stationary mucus). Assuming a rapid dissolution rate (sr) of 1000 d−1 with fr = 1.0 and an uptake rate from the bound state (sb) of 1.7 d−1, Butterweck et al. (2002) estimated values of fb in the range 0.7–0.85 for radon progeny (without distinguishing between 214Pb and 214Bi) from the blood measurements. However, Butterweck et al. (2002) also estimated ‘absorption rates’ for 214Pb and 214Bi from their activities in the blood sample and the estimated respiratory tract deposition, assuming that absorption from respiratory tract to blood could be represented by a single rate constant (sr), i.e. fr = 1 and fb = 0, although this model seems inconsistent with the in-vivo measurements. They obtained absorption half-times of approximately 60 min for 214Pb and approximately 25 min for 214Bi, suggesting that there was greater absorption of 214Bi than of 214Pb by the end of the exposure when the blood sample was taken. (496) Hursh et al. (1969) followed lung retention, blood concentration, and urinary and faecal excretion of 212Pb in 10 volunteers for up to 3 d after inhalation (by mouth) of an aerosol formed by mixing 212Pb (formed from decay of 220Rn/216Po) with natural room aerosol (for further information, see Section 9.2.1). Measurements of 212Bi were also made but, because of its short half-life, faecal excretion of 212Bi could not be determined. Initial deposition of 212Bi in the lungs was approximately 10% of the 212Pb activity, as expected, because of its lower concentration in the air. Measurements of urinary excretion of 212Bi were reported for one subject. Hursh and Mercer (1970) measured 212Bi activities in blood and urine in four volunteers after inhalation of an aerosol formed by mixing 212Pb with natural room aerosol (for further information, see Section 9.2.1). However, the results were not reported in order ‘to conserve space and because the findings were in all cases similar to those reported earlier’ with reference to Hursh et al. (1969). Marsh and Birchall (1999) used the measurements of urinary excretion of 212Bi reported by Hursh et al. (1969) to estimate the absorption rate for bismuth. They took account of ingrowth from decay of its parent 212Pb in the lungs and following systemic uptake. They assumed that absorption of both lead and bismuth could be represented by a single component (i.e. fr = 1 and fb = 0). In the analysis, the absorption half-time for lead was fixed at 10 h. The best fit was obtained with an absorption half-time for bismuth of 13 h, suggesting Type F behaviour. However, the authors noted that this value should be treated with caution as it was based on data from a single subject. Marsh and Bailey (2013) carried out a more detailed analysis of the results of human volunteer studies of inhaled radon progeny to estimate absorption parameter values appropriate for short-lived radon progeny, giving specific consideration to the rapid absorption phase and binding (for further information, see Section 9.2.1). However, for the study by Hursh et al. (1969), the information available did not permit assessment of fb. On this basis, bismuth as a progeny of radon is assigned to Type F, as noted in Table 9.2, and applied in Annex A to give absorption parameter values for radon progeny (Table A.2). These were used in the calculation of dose coeffcients for radon progeny aerosols, given in Table 12.6 of the radon chapter.
10.2.1.2. Particulate materials
(497) In all of the studies summarised below, except that of Greenhalgh et al. (1977) who administered 207BiCl3, isotopes of uranium or thorium with their progeny radionuclides were administered by intratracheal instillation into rats, and measurements were made of the lung retention and tissue distribution of 228Th, 212Pb, 212Bi, and 208Tl at times from 6 or 24 h onwards. In all these studies, the distributions of 212Bi (and 208Tl) were similar to those of the parent 212Pb. As their physical half-lives are so short (61 min and 3 min, respectively), measurements made at 6 h onwards would be mainly of activity formed from decay of 212Pb within the body, rather than from intake of 212Bi. The similar distributions of 212Bi and 208Tl (allowing for the 36% branching ratio for the formation of 208Tl from decay of 212Bi) to those of 212Pb might suggest that there was no rapid movement of 212Bi from the site (e.g. the lungs) in which it was formed by decay of 212Pb. However, 212Bi (and 208Tl) would have grown in rapidly between dissection of the animals and measurements of activities in tissues. Thus, the activities of 212Bi (and 208Tl) measured may have been significantly higher than those present in vivo, and without detailed information (which is not available) about the time which elapsed between dissection of the animals and measurements, it is not possible to correct for this and hence estimate the absorption rate of bismuth from the respiratory tract. (a) Bismuth chloride (BiCl3) (498) Greenhalgh et al. (1977) followed the lung retention of 207Bi for approximately 1 h after instillation of 207Bi instilled as BiCl3 solution into the bronchi of rabbits. There was little clearance in this time, and the amount of 207Bi in blood after 90 min was less than 1% of that instilled. The authors estimated that the clearance half-time was greater than 1 d. This appears to have been a pilot study that was not followed-up. (b) Bismuth nitrate (Bi(NO3)3) (499) Ballou et al. (1986) measured lung retention and tissue distribution of 232U, 228Th, 224Ra, 212Pb, 212Bi, and 208Tl at 24 h after intratracheal instillation into rats of 232U nitrate with its progeny radionuclides (for further information, see Section 15.2.1). Moody et al. (1994a) and Moody and Stradling (1992) measured the tissue distribution of 228Th, 212Pb, 212Bi, and 208Tl at times from 6 h to 7 d after intratracheal instillation into rats of a nitrate solution of 228Th in equilibrium with its progeny radionuclides (for further information, see Sections 9.2.1 and 14.2.1). In both studies, the distributions of 212Bi (and 208Tl) were similar to those of 212Pb. However, no estimate could be made here (i.e. by the Task Group) of the rate of absorption of 212Bi from the lungs (see above). (c) Bismuth hydroxide (Bi(OH)3) (500) Moody et al. (1994b) and Stradling et al. (2005) measured the tissue distributions of 228Th, 212Pb, 212Bi, and 208Tl at times from 1 to 28 d after intratracheal instillation into rats of a suspension of 228Th hydroxide in equilibrium with its progeny radionuclides (for further information, see Sections 9.2.1 and 14.2.1). The distributions of 212Bi (and 208Tl) were similar to those of 212Pb. However, no estimate could be made here of the rate of absorption of 212Bi from the lungs (see above). (d) Bismuth fluoride (BiF3) (501) Moody et al. (1994b) and Stradling et al. (2005) measured the tissue distributions of 228Th, 212Pb, 212Bi, and 208Tl at times from 1 to 28 d after intratracheal instillation into rats of a suspension of 228Th fluoride in equilibrium with its progeny radionuclides (for further information, see Sections 9.2.1 and 14.2.1). The distributions of 212Bi (and 208Tl) were similar to those of 212Pb. However, no estimate could be made here of the rate of absorption of 212Bi from the lungs (see above). (e) Thorium dioxide (502) Hodgson et al. (2000, 2003) measured the tissue distributions of 228Th, 212Pb, 212Bi, and 208Tl at times from 1 to 168 d after intratracheal instillation into rats of suspensions of 232Th dioxide enriched with 228Th, in equilibrium with its progeny radionuclides (for further information, see Sections 9.2.1 and 14.2.1). There was little absorption of the thorium itself, consistent with assignment to Type S. The activity of 212Pb in the lungs was lower than that of thorium, which was attributed to diffusion of 220Rn (thoron) and recoil of the progeny from alpha-particle decay. The distributions of 212Bi (and 208Tl) were similar to those of 212Pb. However, no estimate could be made here of the rate of absorption of 212Bi from the lungs (see above).
10.2.1.3. Progeny radionuclides of bismuth formed in the respiratory tract
(503) The general approach to treatment of progeny radionuclides formed in the respiratory tract is described in OIR Part 1, Section 3.2.3. and Annex A (ICRP, 2015). In summary, it is expected that the rate at which a particle dissociates is generally determined by its matrix, and hence the physico-chemical form of the inhaled material. It is recognised that nuclei formed by alpha decay within a particle matrix may be expelled from it into the surrounding medium by recoil, but to implement this routinely would add greatly to the complexity of calculations. It is expected that the behaviour of soluble (e.g. Type F) material in the respiratory tract would depend on its elemental form (i.e. that of the progeny radionuclide). Nevertheless, for simplicity, in the OIR series, the absorption parameter values of the parent are, by default, applied to all members of the decay chain formed in the respiratory tract. Exceptions are made for noble gases formed as progeny radionuclides, which are assumed to escape from the body directly, at a rate of 100 d−1, in addition to other routes of removal. (504) For decay schemes of bismuth isotopes in the natural decay series 210Bi, 211Bi, 212Bi, and 214Bi, the reader is directed to Annex A, Figs. A.1–A.3. Studies specifically comparing the behaviour of bismuth with that of its progeny (thallium) are summarised here. (505) As noted above, measurements have been made of the tissue distributions of 212Bi and its progeny, 208Tl, following administration to rats of 228Th in various chemical forms (nitrate, hydroxide, fluoride, dioxide), in equilibrium with its progeny radionuclides. In all these studies, the distributions of 212Bi (and 208Tl) were similar to each other and those of the parent 212Pb. As their physical half-lives are so short (61 min and 3 min, respectively), measurements made at 6 h onwards would be mainly of activity formed from decay of 212Pb within the body, rather than from intake of 212Bi (or 208Tl). However, the half-life of 208Tl (3 min) is so short that it would easily reach equilibrium with 212Bi between dissection of the animals and measurements of activities in tissues. It is not possible to correct for this ingrowth and hence estimate the absorption rate from the respiratory tract of thallium formed as a progeny of bismuth. However, since the half-life of 208Tl is so short (as is that of 207Tl present in the 235U decay series, 5 min), the absorption rate would have to be very high to influence dose assessments.
10.2.1.4. Rapid dissolution rate for bismuth
(506) Inferences drawn from the three studies outlined above, which might provide information on the rapid dissolution rate for bismuth, are contradictory. Greenhalgh et al. (1977) estimated that the lung retention half-time was greater than 1 d following instillation of 207BiCl3 into the bronchi of rabbits; much slower absorption than that of lead over the period (1 h) of measurement. Marsh and Birchall (1999) estimated the absorption rate for bismuth using measurements of urinary excretion of 212Bi by a volunteer following inhalation of attached radon progeny radionuclides reported by Hursh et al. (1969). They assumed that absorption of both lead and bismuth could be represented by a single component (i.e. fr = 1 and fb = 0). The best fit was obtained with an absorption half-time for bismuth of 13 h, very similar to that obtained for lead (i.e. sr∼1 d−1). Butterweck et al. (2002) assessed that absorption of 214Bi was faster than that of 214Pb during inhalation of unattached radon progeny. (507) The main use for absorption parameter values for bismuth is in assessing doses from inhaled radon progeny radionuclides. A value of sr of 1 d−1, based on the assessment of Marsh and Birchall (1999), is adopted here. The short-lived isotopes of bismuth (214Bi, 212Bi, and 211Bi) formed as progeny radionuclides of radon have radioactive decay constants ≫1 d−1, so the bismuth absorption rate will have little influence in assessing doses from inhaled radon progeny radionuclides.
10.2.1.5. Extent of binding of bismuth to the respiratory tract
(508) There is insufficient information to estimate the extent of any bound state. It is therefore assumed by default that fb = 0.
10.2.2. Ingestion
(509) Few data are available on bismuth absorption in human and animals. It has been stated that basic salts of bismuth are only poorly absorbed from the gastrointestinal tract (Sollman, 1957), and suggested that the fractional absorption of dietary bismuth from the gastrointestinal tract is approximately 0.08 (ICRP, 1975). (510) The absorption of bismuth from five 205Bi compounds was studied in man (Dresow et al., 1992). From single oral doses of these five compounds, less than 0.1% bismuth was absorbed and excreted in urine, with significantly higher absorption from the colloidal subcitrate and gallate compounds (∼0.04%) than from salicylate, nitrate, and aluminate (0.002–0.005%). Koch et al. (1996a,b) have studied the pharmacokinetics of bismuth following administration of single or multiple oral doses of ranitidine bismuth citrate to healthy subjects. They showed that bismuth absorption from ranitidine bismuth citrate was below 0.5% of the dose, and bismuth elimination was predominantly by renal secretion. Boertz et al. (2009) studied the biotransformation and excretion of bismuth after ingestion of 215 mg of colloidal bismuth subcitrate by 20 male volunteers. Bismuth absorption in the stomach and upper intestine was very low, and a total of 0.03–1.2% of the ingested bismuth was eliminated in urine during the 56-h test. (511) The bioavailability of 205Bi from various oral bismuth preparations was also studied in rats (Dresow et al., 1991). The intestinal absorption, calculated from 205Bi whole-body retention and accumulated urinary excretion, was very low, but significantly higher (∼0.3%) from bismuth citrates (bismuth citrate and colloidal bismuth subcitrate) compared with bismuth nitrate, salicylate, gallate, and alluminate (0.04–0.11%). (512) Publication 30 recommended an absorption value of 0.05 to apply to all chemical forms (ICRP, 1980). (513) The most recent studies confirm this absorption value for bismuth, and an fA value of 0.05 is therefore adopted here for direct ingestion of all chemical forms.
10.2.3. Systemic distribution, retention, and excretion
10.2.3.1. Summary of the database
(514) Bismuth has been used since the late 1700s as a therapeutic agent for a number of disorders of the human body. For example, it has been used externally on burns and inflamed skin; orally for gastrointestinal inflammations, ulcers, and as an opaque medium for x-ray examinations; and intramuscularly for treatment for syphilis (Sollman, 1957). Serious adverse affects including death have sometimes occurred. Successful treatments have often involved maintenance of maximal non-toxic concentrations of bismuth. The optimal dosages have been worked out by measurement and estimation of absorption, distribution, and excretion, both clinically and in animal studies. (515) The systemic biokinetic of bismuth have been found to vary with the route of administration and the form administered. Concentration of particulate or colloidal forms is particularly high in the reticulo-endothelial system (Einhorn et al., 1964; Eridani et al., 1964). (516) In the early period after acute input to blood, most forms of bismuth are rapidly cleared from plasma to extracellular fluids and excretion pathways. For example, 75% or more of bismuth in human plasma injected intravenously into rats or bismuth citrate injected intravenously into humans left the circulation in the first 5–10 min (Coenegracht and Dorleyn, 1961; Hursh and Brown, 1969; Newton et al., 2001). After the rapid equilibration between blood plasma and extracellular fluids, the disappearance of bismuth from blood is much slower. In a human subject receiving 207Bi citrate by intravenous injection, approximately 6% of the injected amount remained in blood after 1 h, 1% after 7 h, and 0.5% after 1 d (Newton et al., 2001). (517) Data on the distribution of bismuth in blood are inconsistent. Some investigators have concluded that bismuth shows little affinity for erythrocytes (Benet, 1991; Koch et al., 1996a), while others have concluded that bismuth in blood is present primarily in erythrocytes (D’Souza and Francis, 1987; Rao and Feldman, 1990; Newton et al., 2001). (518) In studies involving continued oral dosing of human subjects for 6–8 weeks with bismuth compounds, there was a continual rise in plasma concentration and the urinary excretion rate (Froomes et al., 1989). Apparent steady-state levels were reached after approximately 18 d (range 7–29 d). Renal clearance of bismuth from normal volunteers and patients with gastritis averaged 22.2 mL min−1. Elimination half-lives based on declining concentrations of bismuth in plasma and urine were 20.7 and 21.6 d, respectively. Similarly, in patients with bismuth encephalopathy, Boiteau et al. (1976) found plasma elimination half-times of approximately 13–22 d and urine half-times of approximately 10–20 d. Data of Loiseau et al. (1976) indicated a half-time in plasma of approximately 23 d. (519) The pharmacokinetics of bismuth were studied in 60 healthy male subjects, aged 19–40 y, for single oral administration of ranitidine bismuth citrate and for twice-daily doses for 28 d in 27 healthy male subjects, aged 20–49 y (Koch et al., 1996a,b). After single administration, the concentration of bismuth in plasma typically peaked after 30–45 min and declined with a half-time initially on the order of 1 h. The bismuth concentrations in plasma for 15 subjects measured up to 154 d after the last intake indicated three components of removal, with average half-times of 20 min, 11.1 h, and 20.7 d. (520) Gavey et al. (1989) measured the bismuth concentration in plasma and urine in nine patients before, during, and after treatment with tripotassium dicitrato bismuthate for 6 weeks. The 24-h urinary clearance of bismuth was estimated as 19.4 and 19.8 plasma volumes per day based on data for 3 and 6 weeks after the start of exposure, assuming a plasma volume of 3000 mL. (521) Most forms of bismuth show high deposition in the kidneys and subsequent clearance to urine (Durbin, 1960; Eridani et al., 1964; Matthews et al., 1964; Russ et al., 1975; Pieri and Wegmann, 1981; Slikkerveer and de Wolff, 1989). Human subjects injected with bismuth citrate excreted one-third or more of the administered bismuth in urine during the first day (Coenegracht and Dorleyn, 1961; Newton et al., 2001). Lower excretion rates have been observed for some forms used in clinical studies. For example, approximately 13% of bismuth injected as citrate adsorbed on charcoal was excreted in urine during the first day (Coenegracht and Dorleyn, 1961), 2–3% of bismuth injected as phosphate appeared in urine on the first day (Coenegracht and Dorleyn, 1961), and as little as 5% of bismuth injected as a salicylate suspension was excreted in urine during the first 3 weeks after injection (Sollmann, 1957). Microscopic studies of the epithelium of the proximal renal tubules have shown accumulations of bismuth in the nucleus, cytoplasm, and possibly the lysosomes (Slikkerveer and de Wolff, 1989). (522) Clinical data indicate that faecal excretion constitutes 4–10% of total excretion of bismuth with oil solutions, 6–22% with ‘watery’ solutions, and 12% with oil suspensions (Sollmann, 1957). In rats and rabbits, faecal excretion arising to a large extent from biliary secretion accounts for 10–20% of the total excretion of bismuth (Pieri and Wegmann, 1981; Vienet et al., 1983; Gregus and Klaassen, 1986). (523) In a study of the fate of intravenously injected tracer doses of 206Bi in human subjects, Coenegracht and Dorleyn (1961) concluded from in-vivo measurements that 206Bi injected as citrate was taken up and retained to a large extent by the liver and spleen. They suggested that injected bismuth citrate may form complexes with plasma proteins, and that the size of the bismuth protein complexes will largely determine the initial distribution of bismuth in the body. A high rate of urinary excretion of 206Bi in the first few days after injection presumably represented activity that did not attach to plasma proteins or was released fairly quickly from these proteins. (524) Extended retention of a portion of the administered bismuth has been reported for relatively insoluble bismuth compounds used in clinical applications (Sollmann, 1957). Autopsy measurements have been interpreted as indicating that the total bismuth stored in the body for an extended period may be as much as 7% of the administered amount (Sollmann, 1957), with approximate relative concentrations (wet weight) of bismuth in different organs being as follows: kidney, 33; liver, 6.8; spleen, 1.6; colon, 1.3; lung, 0.9; brain, 0.6; and blood, 0.5 (Sollmann and Seifter, 1942). The kidneys and liver each contained nearly 10% of the total found in the body (Sollman, 1957). (525) Buijs et al. (1985) found 207Bi (t1/2 = 38 y) remaining in two human subjects treated 25 y earlier with 206Bi injections contaminated with small amounts of 207Bi. They estimated from measurements of the rate of decline of total-body 207Bi and from assumptions on the early rate of excretion of bismuth that 7% of injected bismuth was retained with a half-time close to 20 y. The estimate applies to bismuth injected as phosphate or as citrate adsorbed on charcoal, the two forms known to be administered to at least one of the subjects. These two forms are taken up to some extent by the reticulo-endothelial system (Coenegracht and Dorleyn, 1961), and it appeared from external measurements that the long-retained activity in the two human subjects was associated largely with organs of this system (Buijs et al., 1985). (526) Newton et al. (2001) studied the biokinetic of bismuth in a healthy male volunteer after intravenous injection with 207Bi citrate. They estimated that the liver contained 60% of the body content at 3 d. An estimated 55% was lost in excreta, primarily urine, during the first 47 h. Longer-term losses were much slower. Approximately 0.6% of the injected amount remained at 924 d. The long-term half-time was estimated as 1.9 y. (527) Studies on rats indicate elevated deposition in kidneys and sometimes in liver, but the systemic distribution varies with the form of bismuth reaching blood. For example, the ratio of the concentration in kidneys to that in liver averaged approximately 15 at 2 h after intravenous injection with bismuth nitrate (Gregus and Klaassen, 1986); 10 at 2 h after intravenous injection of bismuth in human plasma (Hursh and Brown, 1969); 5 at 2–48 h after intravenous injection with bismuth citrate (Pieri and Wegmann, 1981); 50 at 6–48 h after intraperitoneal injection with bismuth citrate (Russ et al., 1975); 20 at 72–144 h after intravenous injection with bismuth nitrate (Vienet et al., 1983); and 40 at 2–6 h after intraperitoneal injection of bismuth in a carbonate buffer (Zidenberg-Cherr et al., 1987). (528) In studies on rabbits, the liver was generally a more important repository for bismuth than the kidneys (van den Werff, 1965). The systemic distribution of 206Bi was determined from a few days up to approximately 2 weeks after intravenous administration of different forms, including citrate or phosphate in 5% charcoal suspension in saline, nitrate, phosphate in 5% glucose, and acetate in saline solution. Distributions varied considerably from one form of 206Bi to another. As averages over all animals studied, all forms of 206Bi administered, and all observation times, the liver, kidneys, skeleton, and remaining tissues contained approximately 38%, 18%, 17%, and 22%, respectively, of the body burden. Typically, the portion of the total-body content in the skeleton increased with time, while the portions in liver and kidneys decreased with time. (529) Deposition of bismuth in bone has also been observed in rats (Eridani et al., 1964; Hursh and Brown, 1969; Russ et al., 1975; Gaucher et al., 1979; Gregus and Klaassen, 1986). Reported values for uptake and retention by bone are highly variable and may depend on the administered form of bismuth. At 4 d after intramuscular injection of 206Bi into rats as BiOCl or BiO(OH), 14.4% of the administered dosage was found in kidneys, 6.6% in liver, 1.5% in bone, and 0.6% in muscle (Durbin, 1960). Approximately three-quarters of the administered activity was excreted in the first 4 d, mainly in urine. In rats receiving 206Bi citrate by intraperitoneal injection, total-body activity declined from approximately 59% of the administered activity at 6 h to approximately 12–18% at 3–5 d (Russ et al., 1975). Bone contained approximately 4–7% of the administered amount at 0.5 h, and approximately 1% from 1 to 6 d. The kidney content declined from almost 40% of the administered amount at 0.5 h to approximately 12% at 3–6 d. The liver content was less than 1% of the administered amount from 0 to 6 d. (530) Data for dogs injected with 224Ra (Lloyd et al., 1982) or 228Th indicate that there is considerable migration of 212Bi (t1/2 = 60.6 min) from its parent, 212Pb, in bone surfaces, red blood cells, and some soft tissues, and that much of the migrating bismuth accumulates in the kidneys or is quickly eliminated in urine. In human subjects who inhaled 212Pb, 212Bi escaped more quickly from red blood cells than did its parent 212Pb, and the rate of urinary excretion of 212Bi was three to four times that of 212Pb (Hursh et al., 1969). In bone, 210Bi tends to remain, to a large extent, with 210Pb at times remote from exposure, indicating that bismuth probably does not escape readily from lead in bone volume.
10.2.3.2. Biokinetic model for systemic bismuth
(531) The structure of the biokinetic model for systemic bismuth is shown in Fig. 10.1. Transfer coefficients are listed in Table 10.3. It is assumed that bismuth leaves blood plasma at the rate 400 d−1 (t1/2∼2.5 min), with three-quarters moving to the fast-turnover soft tissue compartment ST0, representing extracellular fluids in the present model. Outflow of the remaining one-quarter is divided as follows: 20% to urinary bladder contents, 4% to right colon contents, 30% to liver (Liver 0), 30% to urinary path, 5% to other kidney tissue, 2.5% to cortical bone surfaces, 2.5% to trabecular bone surfaces, 0.5% to red blood cells, 1.3% to the slow-turnover soft tissue compartment ST2, and the remaining 4.2% to the intermediate-term soft tissue compartment ST1. Half of the activity deposited on bone surfaces is assigned to cortical bone and half is assigned to trabecular bone. The following removal half-times are assigned: 15 min from ST0 to plasma; 2 d from Liver 0, with 60% moving to the small intestine contents in bile and 40% moving to Liver 1; 10 d from Liver 1 to plasma; 1 d from urinary path to urinary bladder contents; 5 d from other kidney tissue to plasma; 20 d from a bone surface compartment or ST1 to plasma; 4 d from red blood cells to plasma; and 600 d from ST2 to plasma. (532) Model predictions are compared with the human injection data of Newton et al. (2001) in Figs. 10.2–10.4. Parameter values for systemic model for bismuth. RBC, red blood cells. ST0, ST1, and ST2 represent soft tissues with fast, intermediate, and slow turnover, respectively.
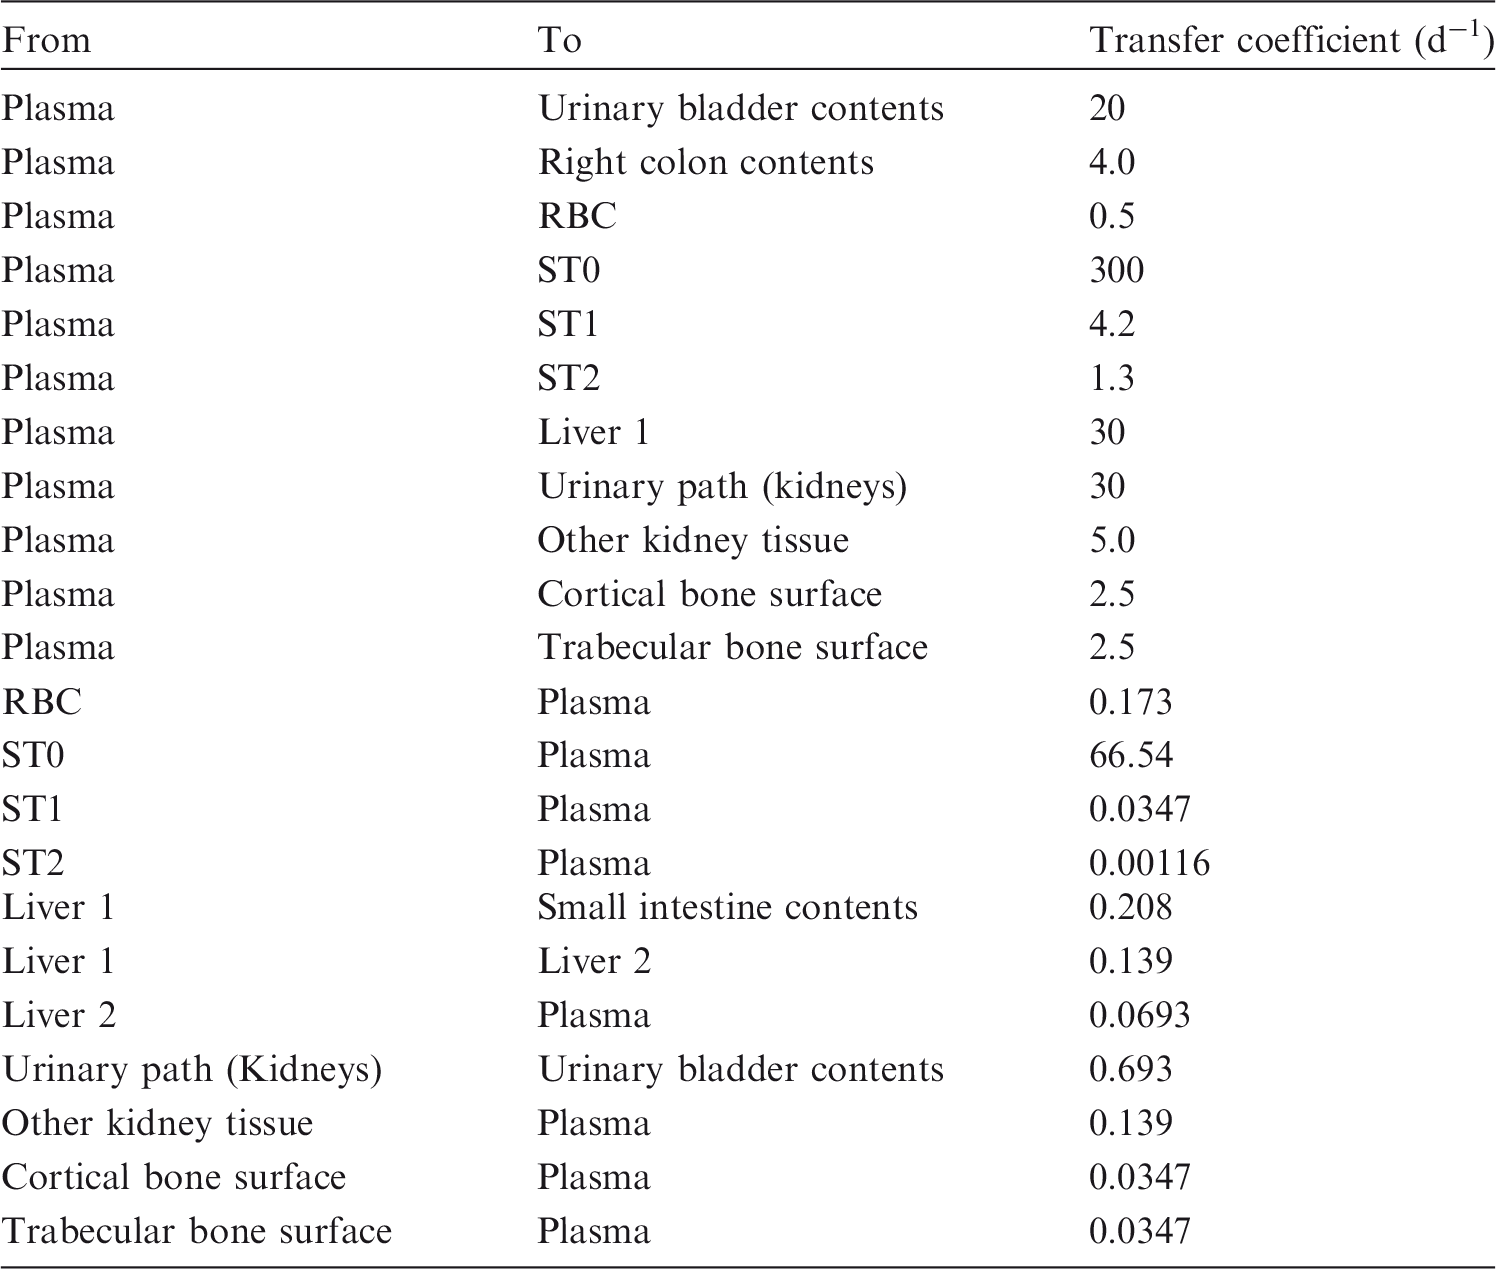
10.2.3.3. Treatment of radioactive progeny
(533) The members of bismuth chains considered in the calculations of dose coefficients for bismuth isotopes are isotopes of lead, thallium, polonium, or bismuth. The systemic models for radioisotopes of these elements as progeny of bismuth are the same as their systemic models as progeny of lead, described in Section 9.
10.3. Individual monitoring
10.3.1. 210Bi
(534) Urine bioassay is used for the monitoring of 210Bi. Model predictions of blood retention of intravenously injected bismuth compared with observations of Newton et al. (2001) for a human subject injected intravenously with 207Bi citrate.
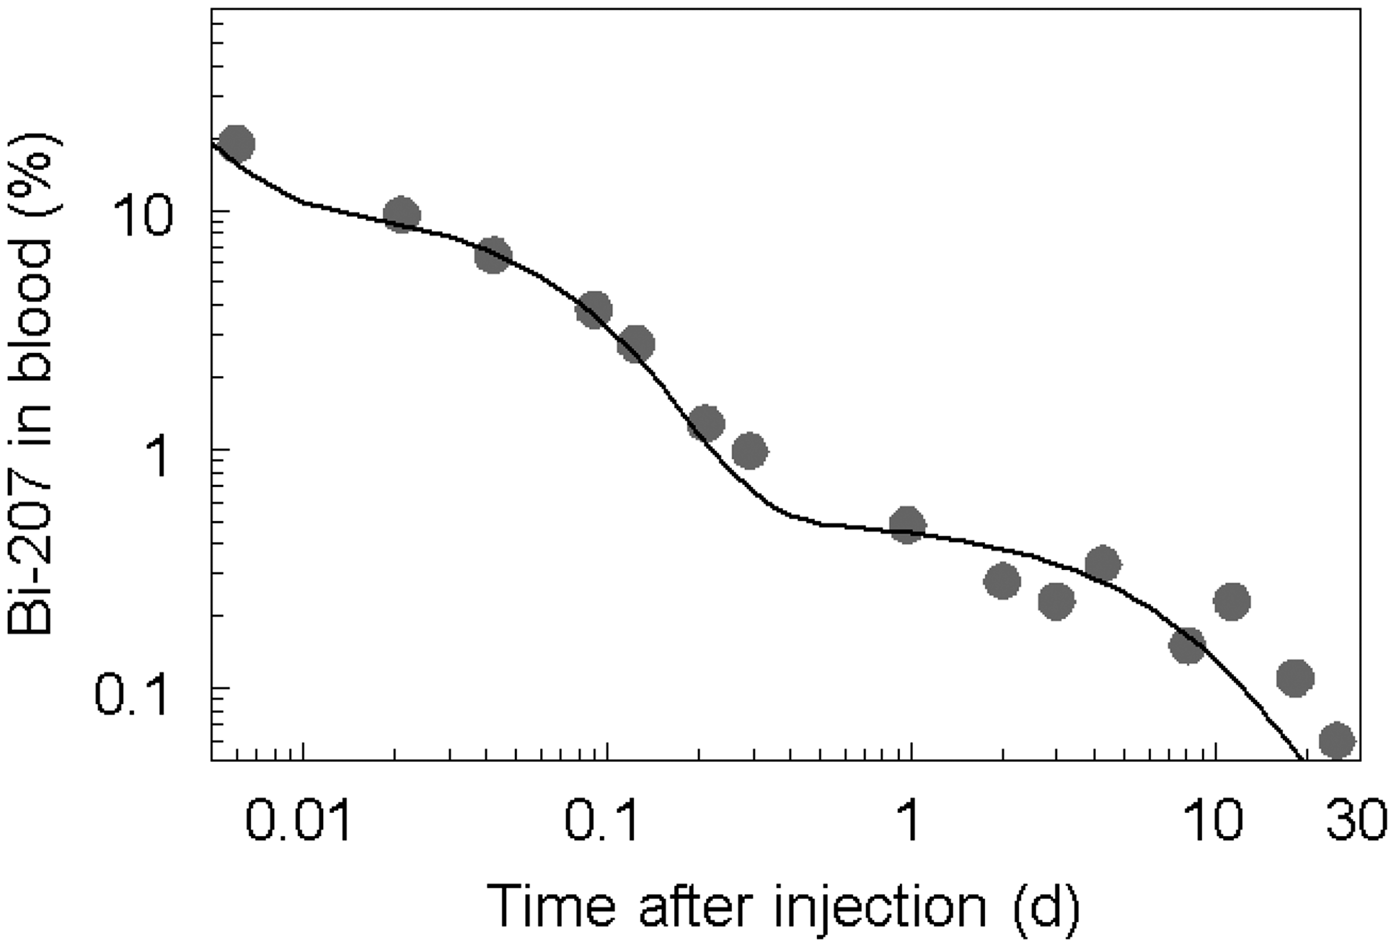
10.3.2. 214Bi
(535) Whole-body counting is used for the monitoring of 214Bi. Monitoring techniques for 210Bi. Monitoring techniques for 214Bi. Committed effective dose coefficients (Sv Bq−1) for the inhalation or ingestion of 210Bi and 214Bi compounds. AMAD, activity median aerodynamic diameter. Dosimetric data on bismuth as progeny of radon are given in Table 12.6. Dose per activity content of 210Bi in daily excretion of urine (Sv Bq−1); 5-µm activity median aerodynamic diameter aerosols inhaled by a reference worker at light work. NA, not applicable. Dose per activity content of 214Bi in total body (Sv Bq−1); 5-µm activity median aerodynamic diameter aerosols inhaled by a reference worker at light work. NA, not applicable. Isotopes of polonium addressed in this publication. EC, electron-capture decay; B+, beta-plus decay; A, alpha decay. Dose coefficients and bioassay data for this radionuclide are given in the printed copy of this publication. Data for other radionuclides listed in this table are given in the accompanying electronic annex. Absorption parameter values for inhaled and ingested polonium. It is assumed that the bound state can be neglected for polonium, i.e. fb = 0.0. The value of sr for Type F forms of polonium (3 d–1) is element-specific. The values for Types M and S (3 d–1) are the general default values. Materials (e.g. polonium chloride) are generally listed here where there is sufficient information to assign to a default absorption type, but not to give specific parameter values (see text). For inhaled material deposited in the respiratory tract and subsequently cleared by particle transport to the alimentary tract, the default fA values for inhaled materials are applied; i.e. the product of fr for the absorption type and the fA value for ingested soluble forms of polonium (0.1). Default Type M is recommended for use in the absence of specific information on which the exposure material can be assigned to an absorption type; for example, if the form is unknown, or if the form is known but there is no information available on the absorption of that form from the respiratory tract. Activity transferred from systemic compartments into segments of the alimentary tract is assumed to be subject to re-absorption to blood. The default absorption fraction fA for the secreted activity is the reference fA (0.1) for ingestion of the radionuclide. Transfer coefficients in the model for systemic polonium. RBC, red blood cells. Monitoring techniques for 210Po. Committed effective dose coefficients (Sv Bq−1) for the inhalation or ingestion of 210Po compounds. AMAD, activity median aerodynamic diameter. Dose per activity content of 210Po in daily excretion of urine (Sv Bq−1); 5-µm activity median aerodynamic diameter aerosols inhaled by a reference worker at light work. Isotopes of radon addressed in this publication. A, alpha decay. Dose coefficients and bioassay data for these radionuclides are given in the printed copy of this publication. Partition coefficients for radon, xenon, and krypton.* Nussbaum and Hursh, 1957, 1958; Conn, 1961; Kirk et al., 1975; Bell and Leach, 1982; Peterman and Perkins, 1988; NAS, 1999; Khursheed, 2000. Values assigned by Bernard and Snyder (1975). Transfer coefficients in the biokinetic model for inhaled or ingested radon. RT-air, respiratory tract air; Blood-A, arterial blood; Blood-V, venous blood; Breast_g, glandular breast tissue; Breast_a, adipose tissue in breast. The rate at which activity enters RT-air is assumed to be: λ Cenv VRT-air (Bq d−1), where λ is the transfer coefficient from the environment to RT-air (2600 d−1), Cenv is the concentration of radon in the environment (Bq L−1), and VRT-air (L) is the average volume of RT-air (3.858 L for male) (ICRP, 1994b; Bailey et al., 1996). Reference blood flow rates, compartment volumes, and blood:tissue partition coefficients used to derive transfer coefficients. Breast_g, glandular breast tissue; Breast_a, adipose tissue in breast; Blood-A, arterial blood; Blood-V, venous blood. From Publication 89 (ICRP, 2002). Based on reference tissue masses given in Publication 89 (ICRP, 2002) and specific gravities listed in the text. See Table 12.2 and discussions in text of partition coefficients for red marrow and ‘other’ [Para. (645)]. See discussion in text. Effective dose coefficients following the inhalation of radon gas alone. This is the effective dose rate following chronic exposure to unit concentration of radon after the radon concentration in organs and tissues has reached saturation (i.e. equilibrium). Effective dose coefficients (in Sv Bq−1) for inhaled radon (222Rn) or thoron (220Rn) progeny. Values are given for each mode of the assumed aerosol distribution for indoor workplaces, mines, and tourist caves.* u, unattached mode; n, nucleation mode; a, accumulation mode. Assumed aerosol distributions are given in Tables A.3 and A.4. The corresponding regional distributions in the ICRP Human Respiratory Tract Model are given in Tables A.6 and A.8 of Annex A for 222Rn and 220Rn progeny, respectively. Effective doses from inhalation of radon and thoron in workplaces by a reference worker with an average breathing rate of 1.2 m3 h−1. fp, unattached fraction in terms of the potential alpha energy concentration; F, equilibrium factor. The assumed aerosol distributions for the different workplaces are given in Tables A.3 and A.4 of Annex A. For radon, 1 WLM = (6.37 × 10⁵/F) Bq h m−3; for thoron, 1 WLM = 4.68 × 10⁴ Bq h m−3 of equilibrium equivalent concentration of 220Rn; 1 WLM = 3.54 mJ h m−3. In terms of mSv per Bq h m−3 of equilibrium equivalent concentration of 220Rn. Isotopes of radium addressed in this publication. A, alpha decay; B−, beta-minus decay. Dose coefficients and bioassay data for these radionuclides are given in the printed copy of this publication. Data for other radionuclides listed in this table are given in the accompanying electronic annex. Absorption parameter values for inhaled and ingested radium. It is assumed that the bound state can be neglected for radium, i.e. fb=0.0. The value of sr for Type F forms of radium (10 d–1) is element-specific. The values for Types M and S (3 d–1) are the general default values. Materials (e.g. radium nitrate) are generally listed here where there is sufficient information to assign to a default absorption type, but not to give specific parameter values (see text). For inhaled material deposited in the respiratory tract and subsequently cleared by particle transport to the alimentary tract, the default fA values for inhaled materials are applied; i.e. the (rounded) product of fr for the absorption type (or specific value where given) and the fA value for ingested soluble forms of radium (0.2). Default Type M is recommended for use in the absence of specific information on which the exposure material can be assigned to an absorption type; for example, if the form is unknown, or if the form is known but there is no information available on the absorption of that form from the respiratory tract. Activity transferred from systemic compartments into segments of the alimentary tract is assumed to be subject to re-absorption to blood. The default absorption fraction fA for the secreted activity is the reference fA (0.2) for ingestion of the radionuclide. Transfer coefficients for radium. Exch, exchangeable; nonexch, non-exchangeable. ST0, ST1, and ST2 represent soft tissues with fast, intermediate, and slow turnover, respectively. In-vitro monitoring techniques for 226Ra. ICP-MS, inductively coupled plasma mass spectrometry. Short preparation time (5–8 h), not used in routine. Several weeks preparation time (20–30 d). 2–3 d preparation time. 1.72 × 10⁻¹⁰ mg L–1 = 6.3 mBq L–1. Results were given in mg of ash and converted to mg d–1 by considering 4 g ash per daily faecal excretion. In-vivo monitoring techniques for 226Ra. Monitoring techniques for 228Ra.

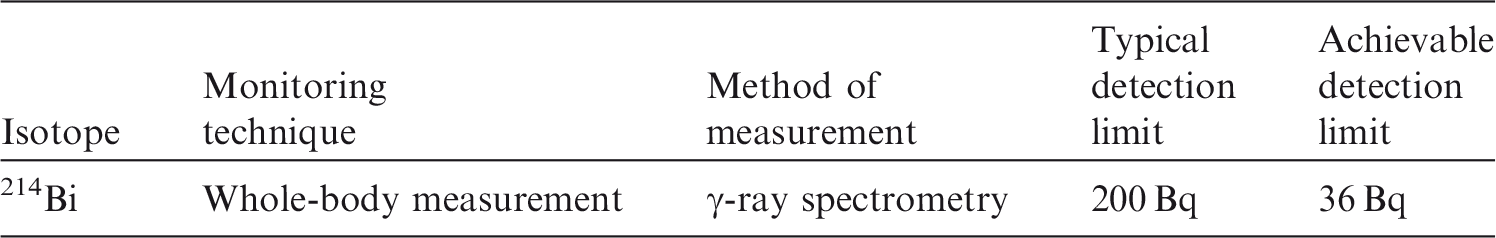


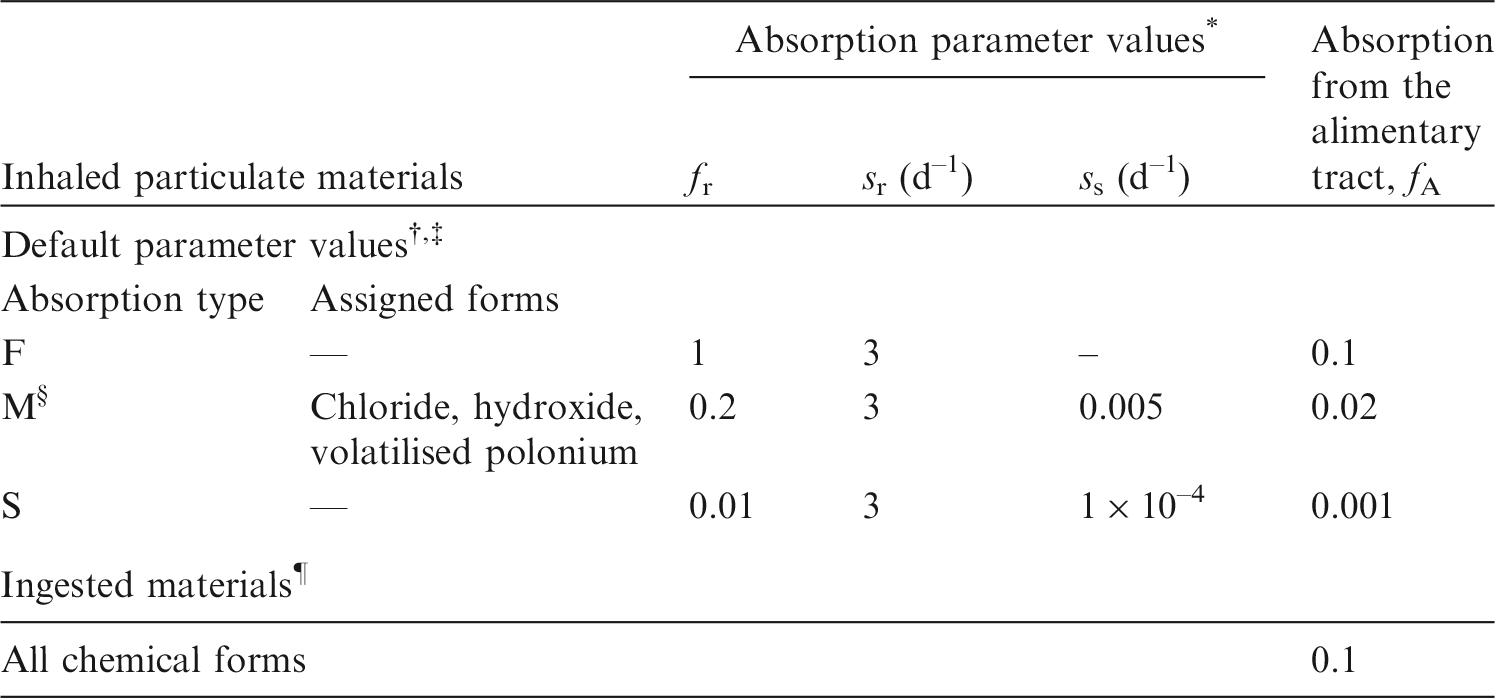


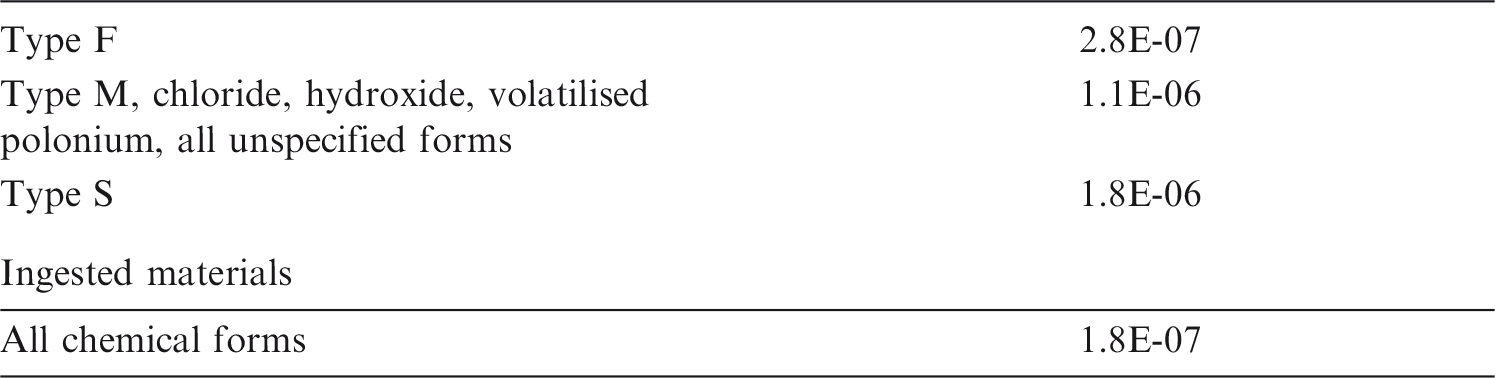
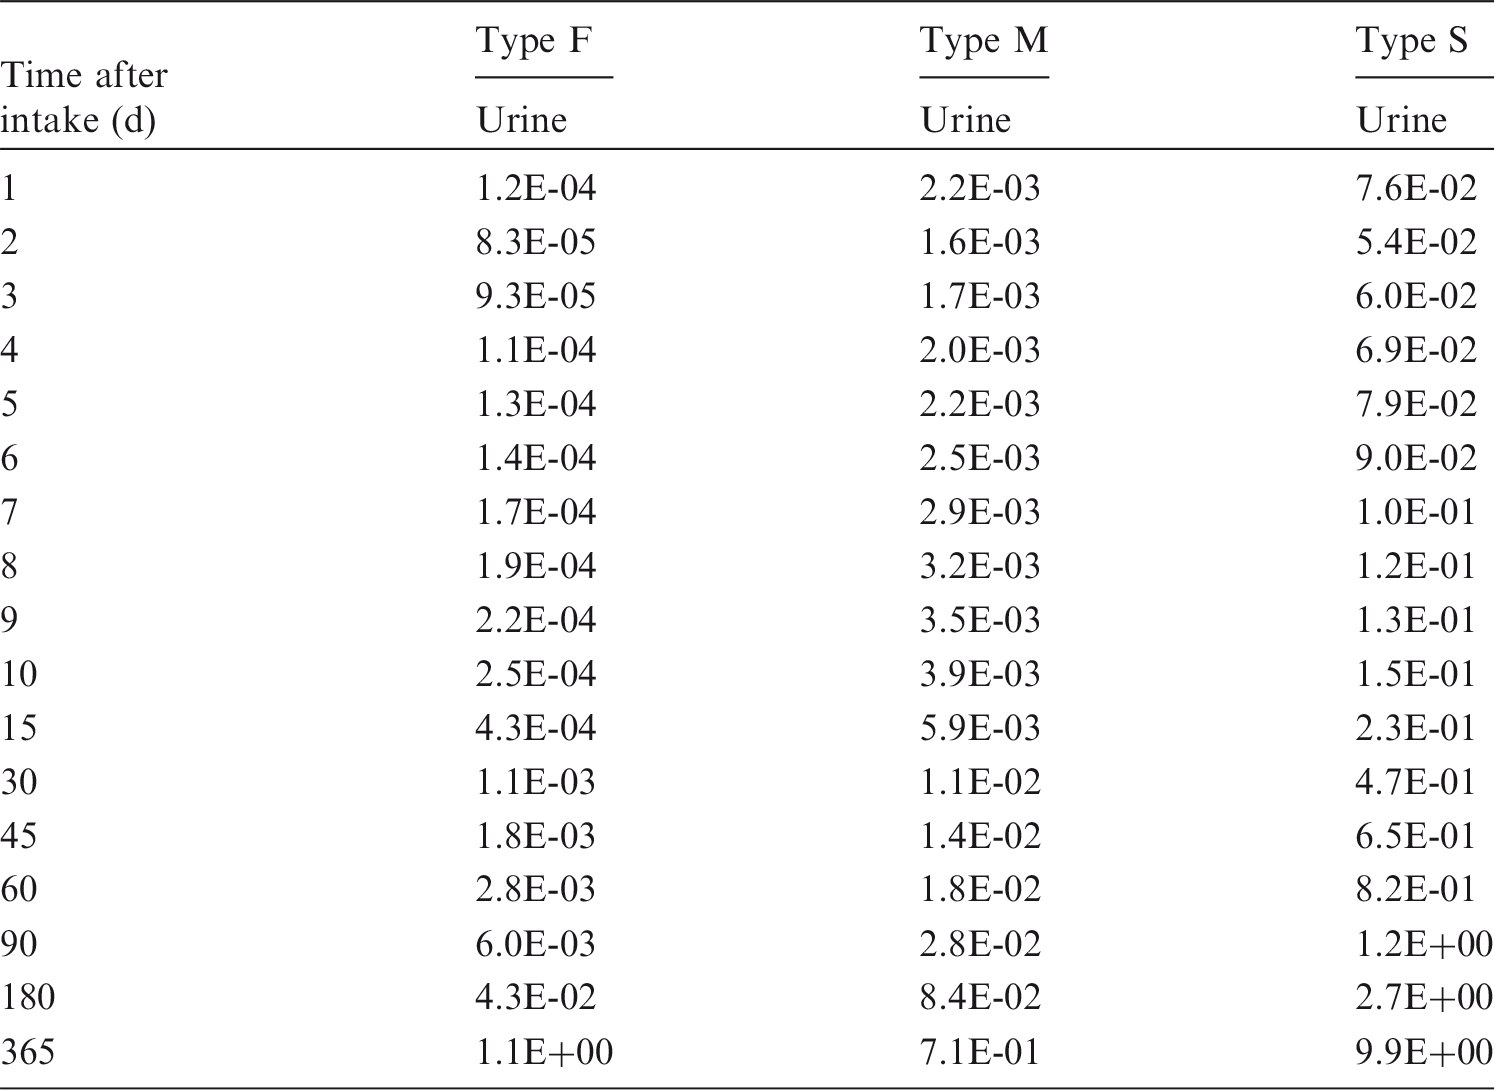


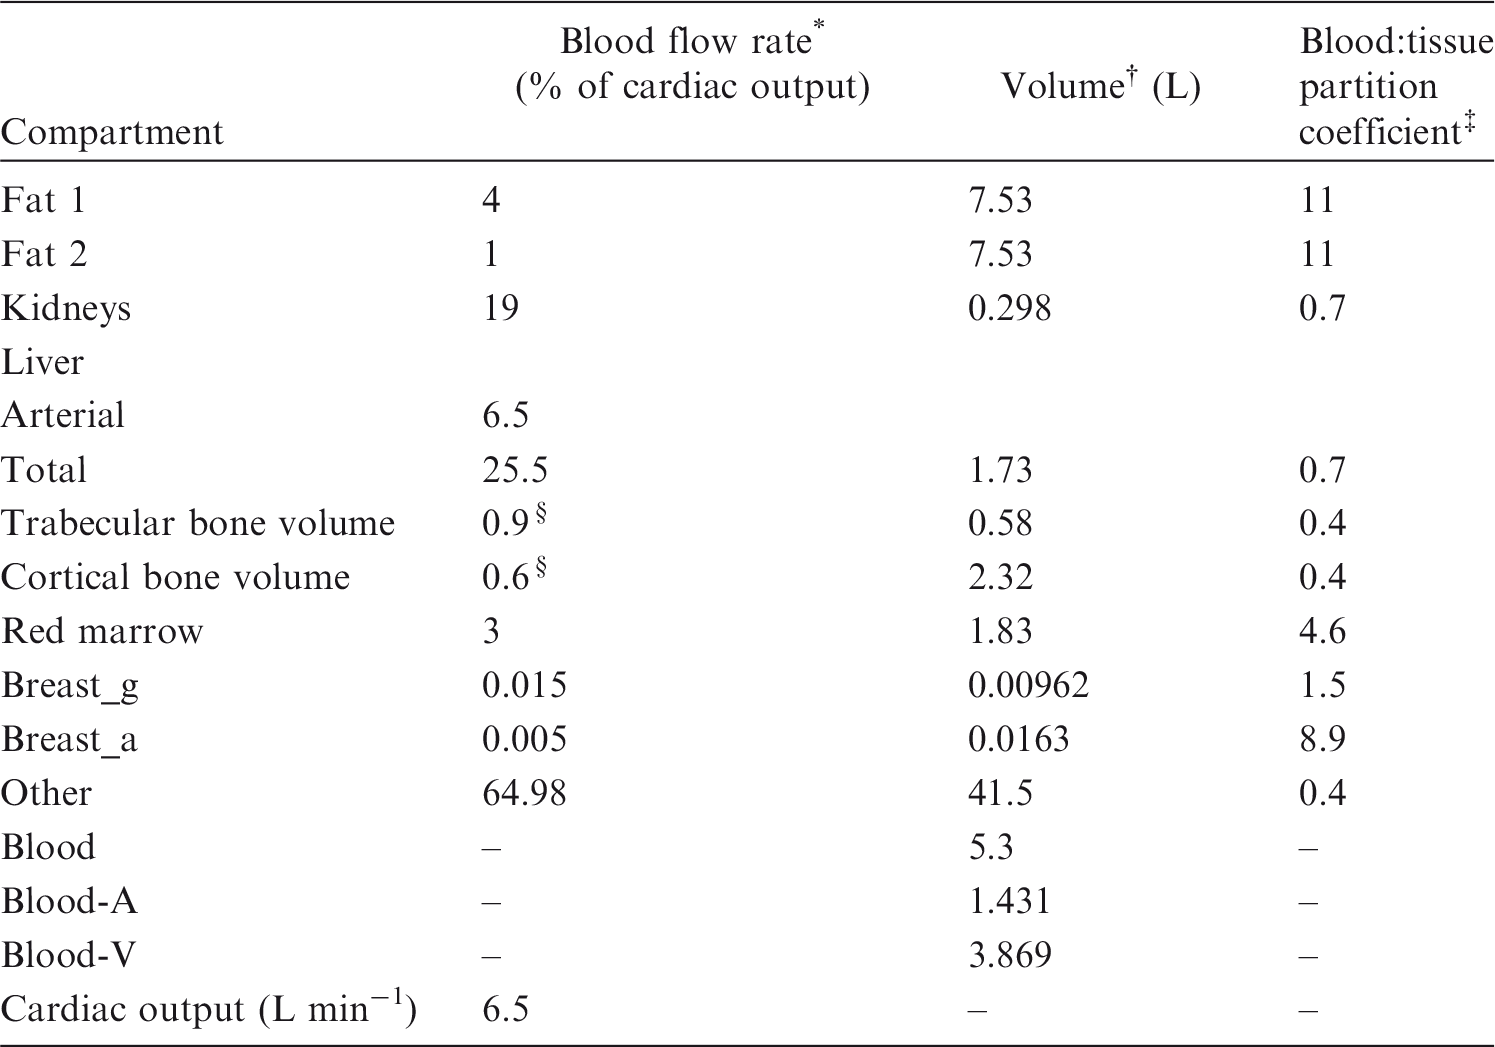

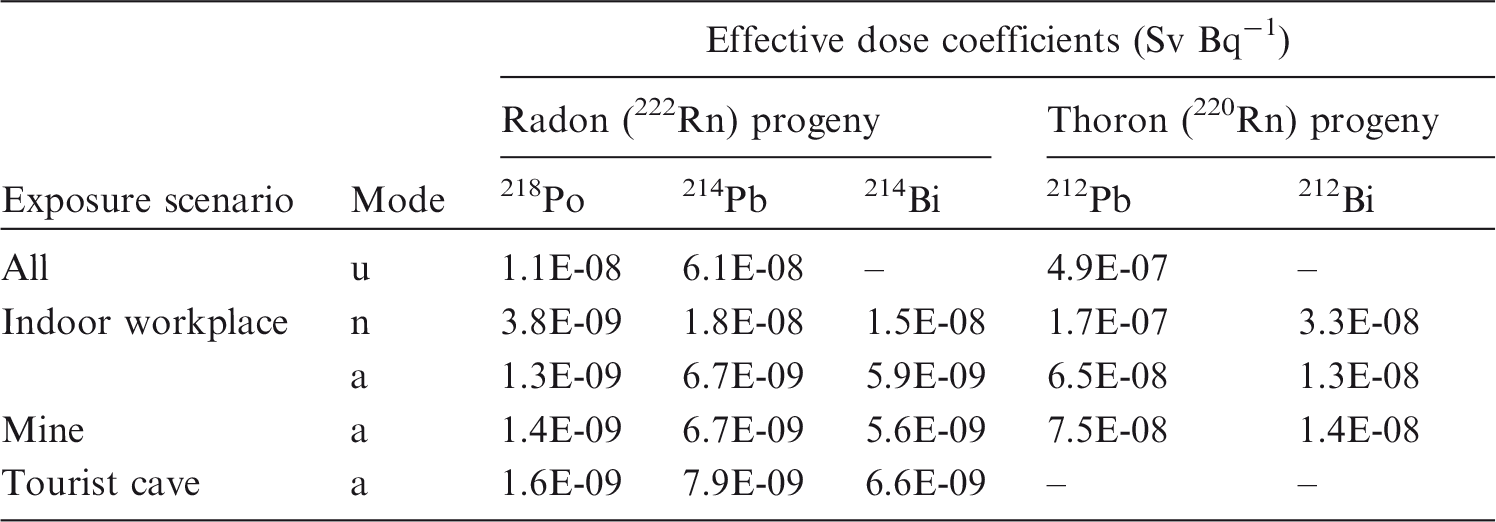


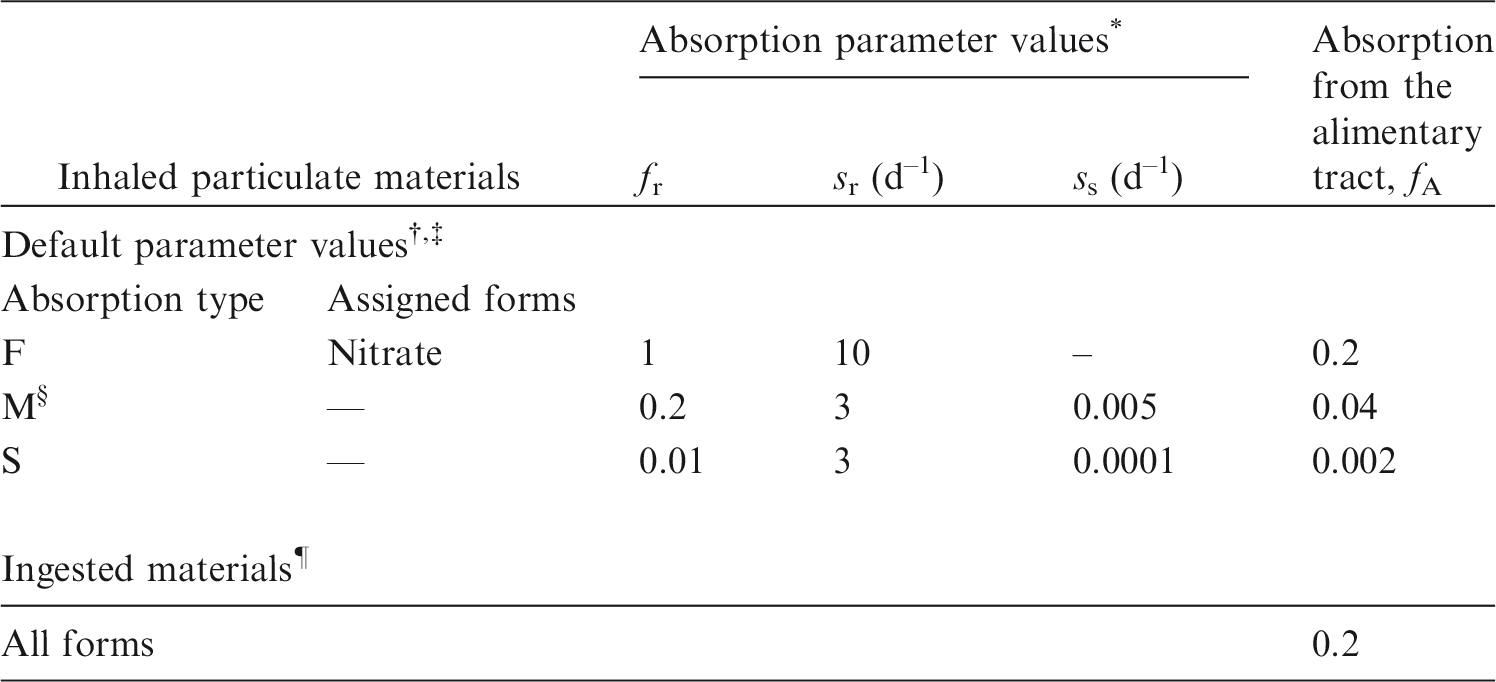
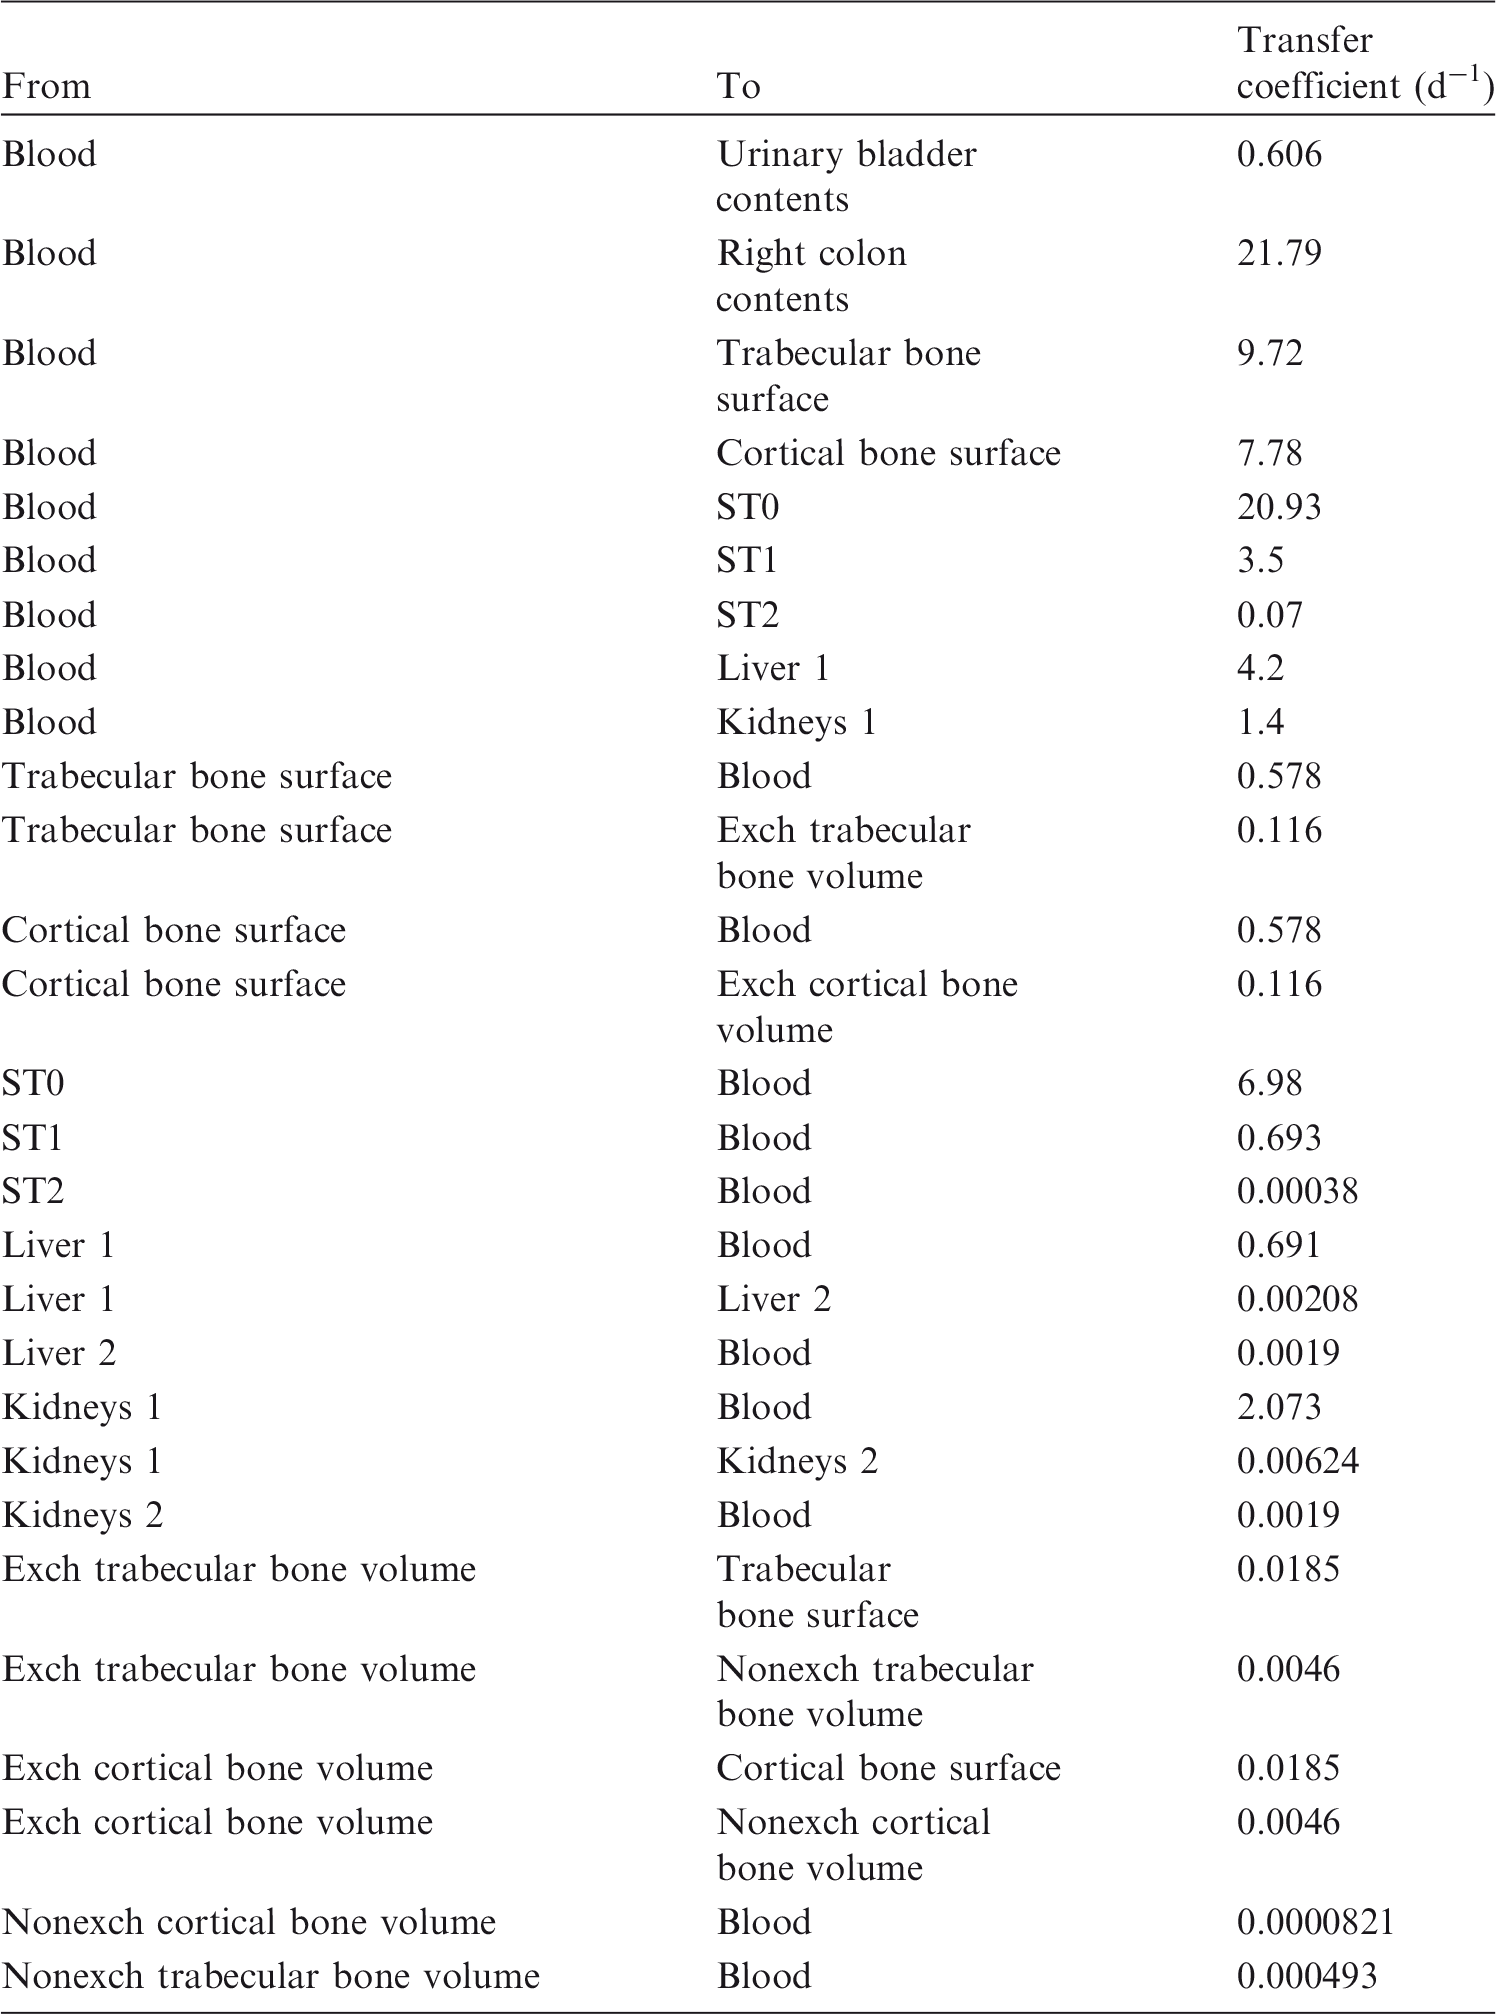
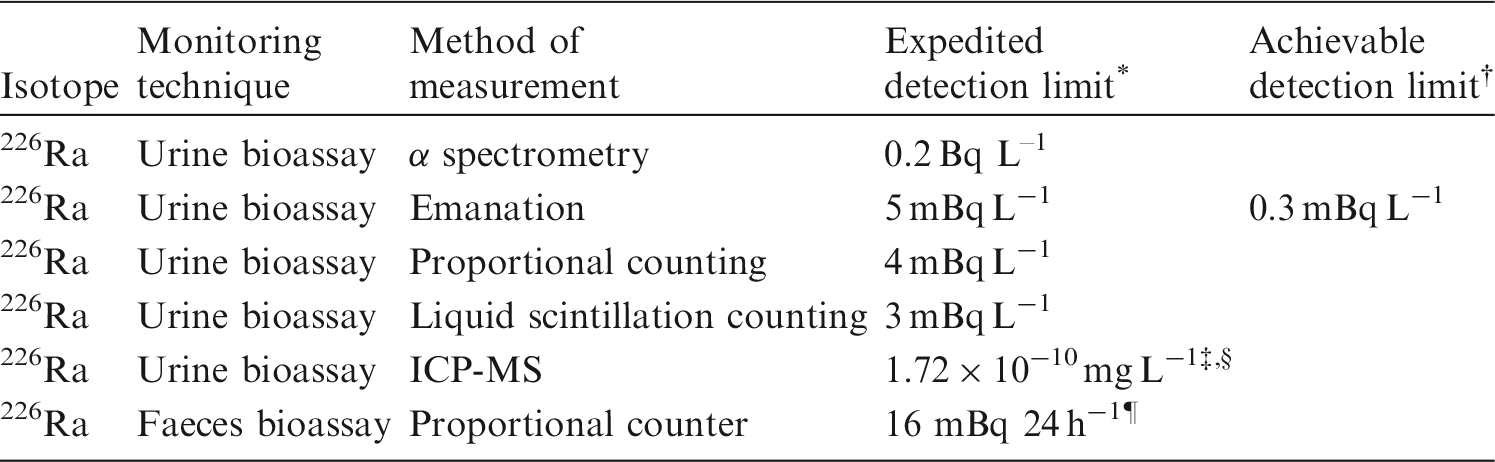

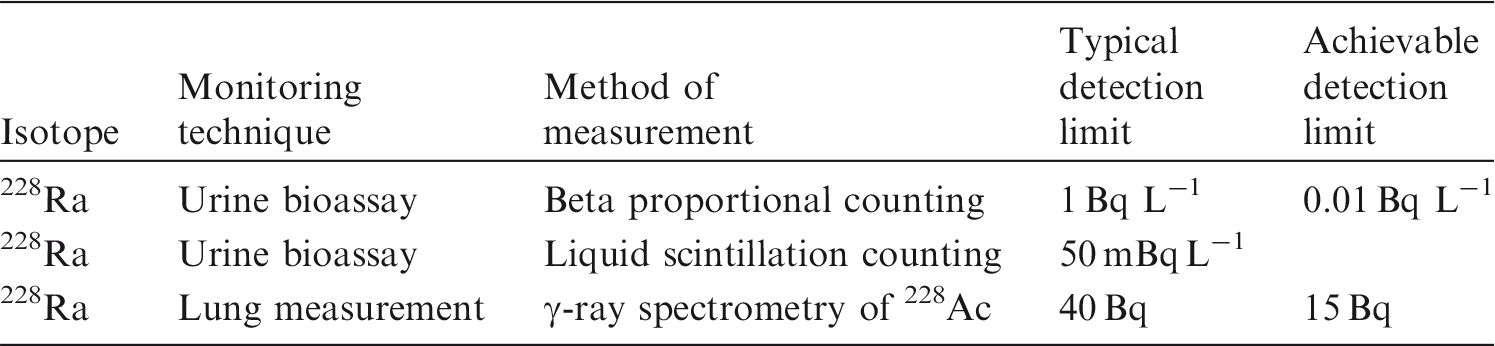
10.4. Dosimetric data for bismuth
Model predictions of cumulative urinary and faecal excretion of intravenously injected bismuth compared with observations of Newton et al. (2001) for a human subject injected intravenously with 207Bi citrate. Daily urinary excretion of 210Bi following inhalation of 1 Bq Type F. Daily urinary excretion of 210Bi following inhalation of 1 Bq Type M. Daily urinary excretion of 210Bi following inhalation of 1 Bq Type S. Structure of the biokinetic model for systemic polonium. HRTM, Human Respiratory Tract Model; RBC, red blood cells; GI, gastrointestinal. Daily urinary excretion of 210Po following inhalation of 1 Bq Type F. Daily urinary excretion of 210Po following inhalation of 1 Bq Type M. Daily urinary excretion of 210Po following inhalation of 1 Bq Type S.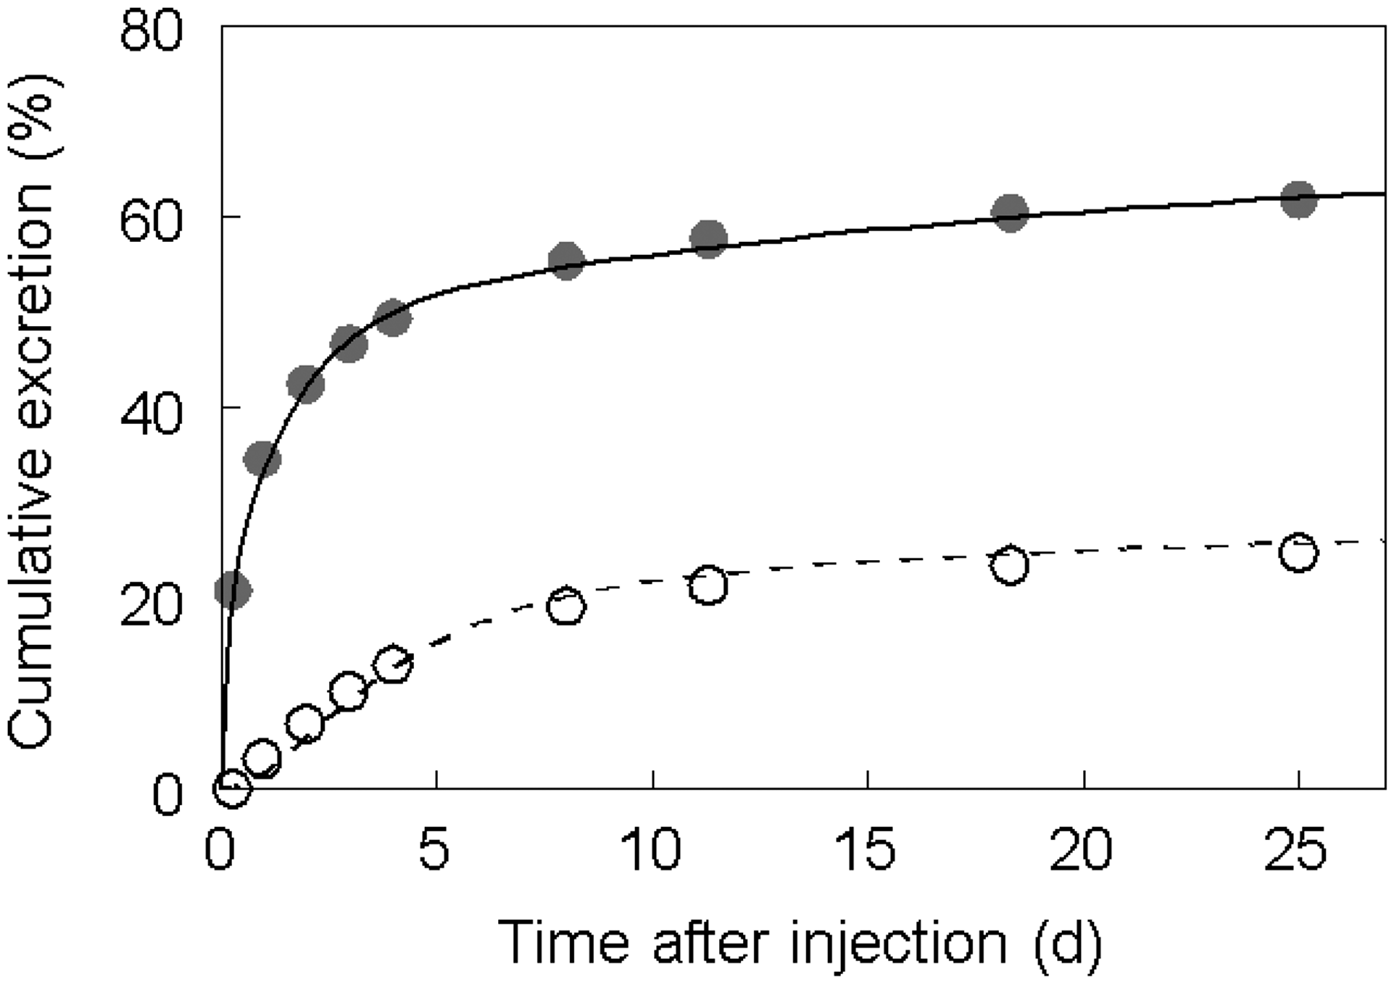

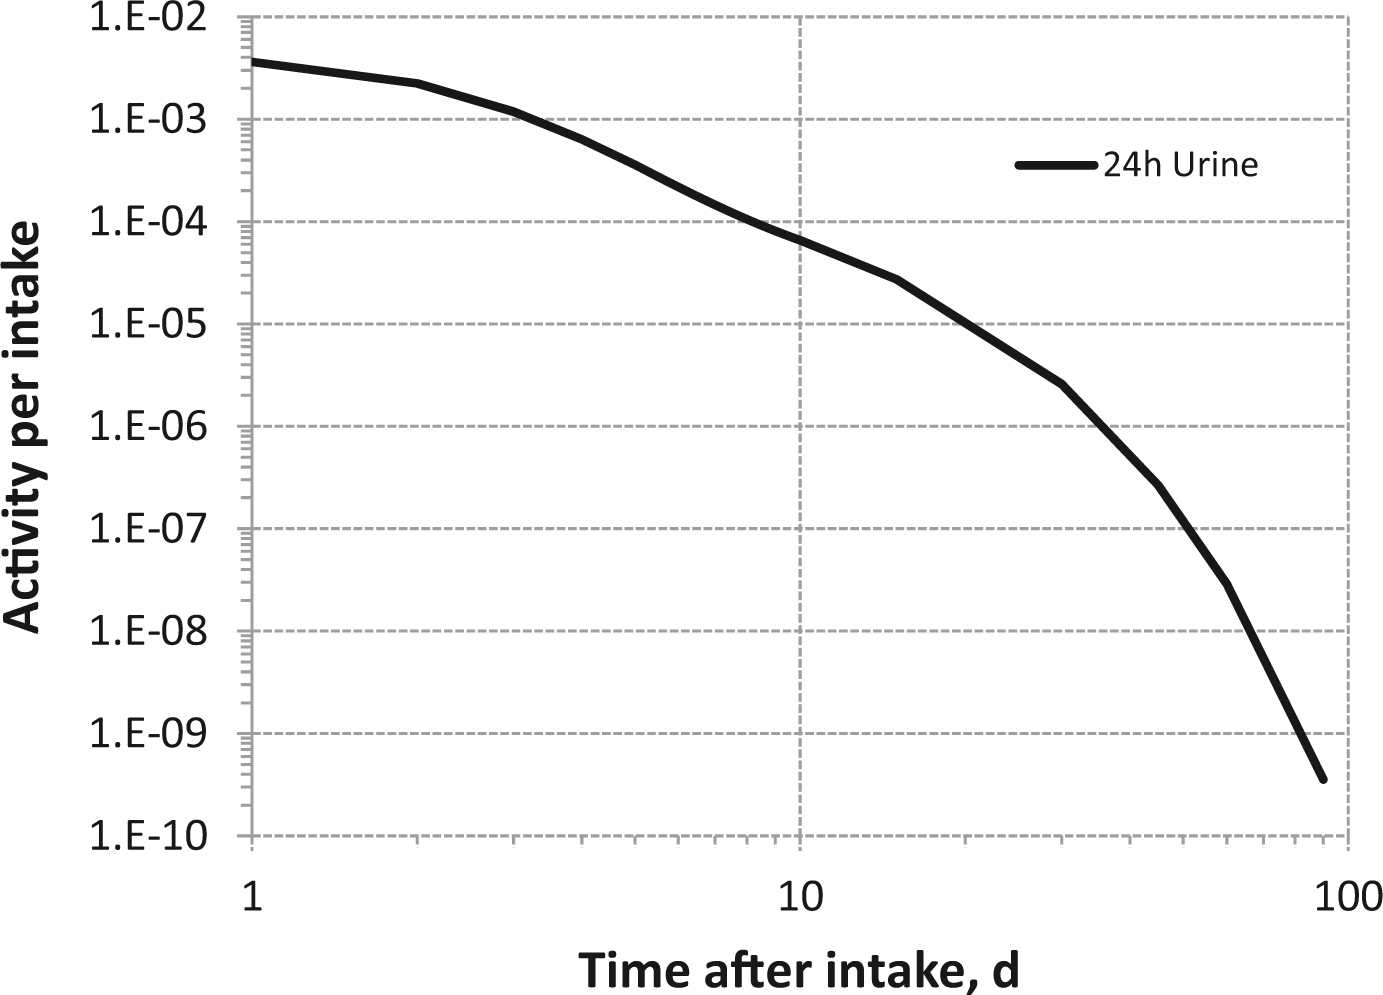

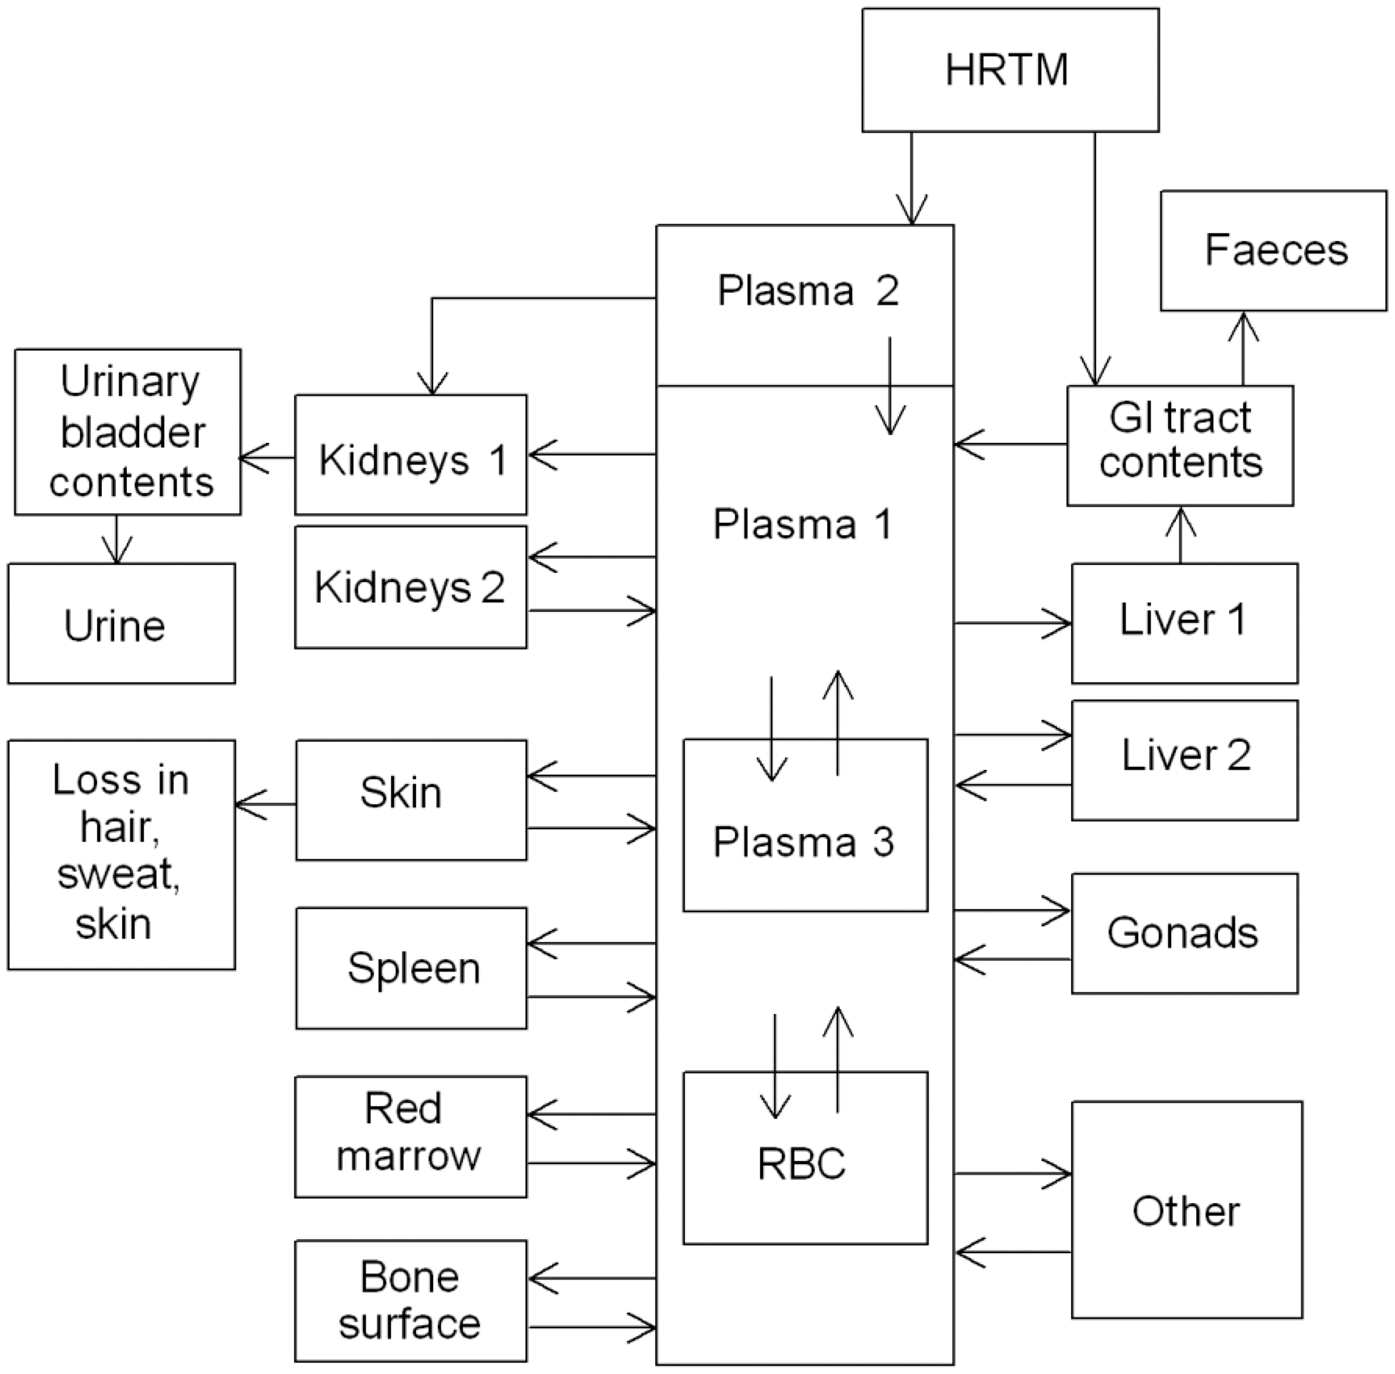


10.5. References
11. POLONIUM (Z = 84)
11.1 Chemical forms in the workplace
(536) Polonium is a metalloid that occurs mainly in oxidation state IV. Bismuth and tellurium are good chemical analogues of polonium. Polonium may be encountered in industry in a variety of chemical and physical forms, including oxides, hydroxides, acidic polonium vapours, and inorganic salts (bromides, chlorides, and iodides), and also volatile organic forms such as dimethyl and dibenzyl-polonium. A mixture or alloy of polonium and beryllium can be used as a neutron source. Polonium is produced by the decay of 220Rn and 222Rn, which belong to the 232Th and 238U natural radioactive series, respectively. The main polonium isotope present in the environment is 210Po.
11.2. Routes of intake
11.2.1. Inhalation
(537) The most important widespread exposures to radioisotopes of polonium are as progeny radionuclides of radon. The alpha-emitting isotopes 218Po (t1/2 = 3 min) and 214Po (t1/2 = 160 µs) give rise to most of the dose from inhalation of the short-lived progeny radionuclides of 222Rn, as do 216Po (t1/2 = 0.15 s) and 212Po (t1/2 = 300 ns) for those of 220Rn (thoron). The decay schemes are shown in Annex A, Figs. A.1–A.3. Dose coefficients for isotopes of polonium inhaled as short-lived radon progeny radionuclides are given in Section 12, where factors such as the relevant aerosol size distribution are addressed. (538) Otherwise, inhalation of 210Po (t1/2 = 138 d) arises through its formation as the last radioactive member of the 238U decay series, and through its use as a high specific activity alpha-emitting source. It may be present in mineral dusts containing the whole series, or in the atmosphere as a progeny of 222Rn via relatively long-lived 210Pb (t1/2 = 22 y). Workers in uranium and other mines are exposed to both. There is evidence that atmospheric 210Pb accumulates on growing tobacco leaves, leading to intakes of 210Pb and 210Po by smokers. (539) Applications of 210Po as a high specific activity alpha emitter include electrostatic charge eliminators and neutron sources. The high specific activity gives rise to special issues, notably the spontaneous formation of 210Po aerosol above 210Po samples. Borisov (1999) showed that 210Po on open surfaces releases particles ranging from individual 210Po atoms to aggregates of more than 3000 atoms. Borisov (1999) also reported that gaseous polonium is present in aerosols containing 210Po, resulting in some penetration of fibrous filters, and that the gaseous fraction formed in moist air resembles polonium hydride, which is unstable, decomposing to polonium and hydrogen. (540) Information is available on the behaviour of polonium following deposition in the respiratory tract from animal experiments with several chemical forms, and from some accidental human intakes. (541) However, the behaviour of ionic (soluble) polonium following deposition in the respiratory tract is difficult to determine because ionic solutions (e.g. chloride) are unstable at neutral pH and in many biological media, resulting in colloid formation. Adsorption of polonium on to surfaces has caused experimental problems (e.g. in determining amounts administered). All the experiments described below used 210Po because of its relatively long half-life and availability, but as its yield of penetrating photons is very low, direct external counting could not be used to estimate initial deposits or whole-body content in vivo. Analysis of experimental data to derive absorption parameter values is difficult. Excretion of systemic polonium is mainly faecal, and so faecal excretion does not enable particle transport from the respiratory tract to be easily distinguished from absorption. There is also significant absorption of polonium in the alimentary tract (∼10%), and in inhalation experiments, with high deposition in the extrathoracic airways and rapid clearance to the alimentary tract, this contributed to early uptake to blood, along with the rapid phase of absorption from the respiratory tract. Studies of polonium hydroxide colloid administered to rats by intratracheal instillation and nose-only inhalation are considered first, because they provide the most detailed information on the rapid phase of absorption. In deriving absorption parameter values from the results of studies using rats, the systemic model structure described in Section 11.2.3.2 was used, but it was modified using information from the polonium hydroxide studies (Casarett, 1964; Thomas and Stannard, 1964) and from intravenous injection experiments in rats conducted at the same institute (Stannard, 1964). (542) Absorption parameter values and types, and associated fA values for particulate forms of polonium are given in Table 11.2.
11.2.1.1. Particulate materials
(a) Polonium hydroxide colloid [PoO(OH)2] (543) Thomas and Stannard (1964) studied the tissue distribution and excretion of 210Po after intratracheal administration into rats of a freshly neutralised solution of 210Po in 0.5 N HCl. This preparation was termed ‘polonium hydroxide colloid’ by Morrow and Della Rosa (1964), referring to Morrow et al. (1964) who investigated the formation of polonium colloids. According to Morrow and Della Rosa (1964), it consists almost entirely of colloid particles less than 50 Å (5 nm) in diameter. One group of 30 rats was used to study the short-term biokinetic, with emphasis on lung clearance: seven were sacrificed during the first 24 h, and the rest at times up to 62 d [further details are given in Thomas and Stannard (1956)]. Another 39 rats were used for a long-term experiment with measurements up to 478 d. Lung retention at 1, 10, and 60 d after administration was estimated to be approximately 70%, 45%, and 5% ILD (after correction for incomplete recovery in 210Po measurements and blood-borne 210Po). The distribution of systemic activity was broadly similar to that observed following intravenous injection of a similar 210Po preparation into rats (Stannard, 1964). The ratio of faecal to urinary excretion was more than 20 during the first week, during which time approximately 4% ILD was excreted in faeces, presumably reflecting particle transport from the bronchial tree to the alimentary tract. After 10 d, the ratio was approximately 10, similar to that observed after intravenous injection (Stannard, 1964), indicating that most of the excretion was systemic. Analysis carried out here (i.e. by the Task Group) of the results of the short-term (62-day) study, assuming that the 210Po retained in the lungs was in particulate form rather than bound (fb = 0, see below), gave absorption parameter values of fr = 0.5, sr = 2 d−1, and ss = 0.02 d−1. Analysis of the results of the long-term study gave similar values of fr and sr, but a lower value of ss (∼0.01 d−1). Both sets of parameter values give assignment to Type M. (544) Casarett (1964) followed the distribution and excretion of 210Po following brief (20-min) nose-only exposure of 44 rats to polonium hydroxide colloid (neutralised 210Po chloride) carried on a sodium chloride vector aerosol (count median diameter = 0.05 µm). Further details are given by Casarett (1958). Six rats were sacrificed immediately after exposure, and the rest were sacrificed in pairs at times up to 30 d, including nine time points in the first 24 h, giving unusually detailed information on the rapid phase of respiratory tract clearance for an inhalation experiment. Complete urine and faecal collections were made for each rat, which also enabled the ‘dose’ (i.e. the initial total deposit) in each rat to be estimated. The measurements of activity distribution were complemented by a comprehensive autoradiographic study. The amounts of 210Po in the alimentary tract and faeces in the first 3 d indicate that approximately 60% of the initial total deposit was deposited in the upper respiratory tract (the skinned head and trachea) and bronchial tree. However, this might also have included some ingestion of 210Po deposited on the pelt during preening. The particle clearance rate to the alimentary tract was estimated here to be approximately 10–15 d−1 (t1/2 = 1.5 h). The assumption that this clearance was predominantly by particle transport sets an upper limit of approximately10 d−1 on the rapid absorption rate (sr). Casarett (1964, p. 158) reported that ‘During exposure, approximately 20% of the deposited load left the lung and was translocated to other tissues…’ which would imply a value of sr of the order of 100 d−1. The basis for this inference is not apparent from the tissue or blood data presented in that paper, but Casarett (1958, pp. 151–152) relates it to the presence of approximately 25% of the initial total deposit in the ‘residual carcass’ in the first few measurements (which fell to approximately 4% of the initial total deposit by 1 d, and remained at that level thereafter). However, it appears that this might well have included most, if not all, of the pelt, and it is plausible that the transient high 210Po content could have been due to external contamination. Since it seems inconsistent with amounts in blood and other tissues, it was not included in analyses carried out here. Similarly, Casarett (1964) noted that the appearance of high excretion (∼4% of the initial total deposit) in urine in the first 12 h was evidence for rapid absorption. However, whereas the urinary excretion rate was much higher during the first few days (>1% of the initial total deposit per day) than subsequently (typically <0.1% of the initial total deposit per day), this was not observed after intratracheal instillation of similar material (Thomas and Stannard, 1964), for which the rate was approximately 0.07% d−1 during the first week. It seems plausible that the high early excretion rate after inhalation was due to contamination from the pelt, as noted by Kimball and Fink (1950). Bailey et al. (1985) similarly observed much higher urinary excretion of 85Sr by rats in the first few days after nose-only inhalation than after instillation of 85Sr-labelled fused aluminosilicate particles, and that most of the activity in such samples was removed by filtration, and was therefore probably particulate contamination. The early urine data were not, therefore, included in analyses here. Lung retention at 10 and 30 d after exposure was approximately 37% and 17% of the lung content at the end of exposure, respectively. As for the instillation experiment, the ratio of faecal to urinary excretion after 10 d was approximately 10, similar to that observed after intravenous injection (Stannard, 1964), indicating that most of the excretion was systemic. (545) The content of the upper respiratory tract (based on the skinned head and trachea) fell rapidly from approximately 30% of the initial total deposit immediately after exposure, to approximately 2% of the initial total deposit at 8–24 h. Casarett (1958, p. 166) alluded to retention of approximately 2% of the initial total deposit in the trachea throughout the 30-day study period. He considered it more likely to represent 210Po in associated structures (e.g. lymphatic tissues) than 210Po in transit from lungs to alimentary tract. This could be evidence of a bound fraction, but could include contributions from other sources, such as systemic 210Po (see below). Autoradiographs of the lungs throughout the 30 d showed both clusters of alpha tracks and many individual tracks, indicating the presence of both particulate and ionic 210Po. Casarett (1958, p. 97) judged that most 210Po in the lungs appeared to be in particulate form. (546) Analysis carried out here, assuming that the 210Po retained in the lungs was in particulate form rather than bound (fb = 0, see below), gave absorption parameter values of fr = 0.1, sr = 2 d−1, and ss = 0.03 d−1, giving assignment to Type M. The values of sr and ss are in good agreement with those derived above for the short-term instillation experiment. The value of fr is lower, which might reflect a difference resulting from the method of administration, or a higher proportion of colloidal material in the inhalation experiment. The value of sr (rounded to 2 d−1) was therefore used in the analyses of results of other experiments with similar forms of polonium, but for which there were insufficient data to define sr. (547) Smith et al. (1961) determined the distribution of 210Po at approximately 1, 4, and 5 months after inhalation by six dogs of polonium hydroxide colloid (neutralised 210Po chloride) carried on a sodium chloride vector aerosol (count median diameter = 0.04 µm), similar to that inhaled by rats (Casarett, 1964). Urinary and faecal excretion were also measured. Further details (including daily excretion and additional tissue measurements) are given by Smith et al. (1960). However, there are differences in some of the results reported in the two papers; some, but not all, could be attributed to decay correction being made in the 1961 paper but not in the 1960 report. Since the 1961 paper refers to the other as an earlier version, it was used as the definitive source in analyses carried out here. Approximately 50% of the initial total deposit cleared in approximately 3 d, which was attributed to clearance from the upper respiratory tract, suggesting that the rapid dissolution rate is slow compared with particle transport from the upper respiratory tract. The other approximately 50% of 210Po in the body was retained with a half-time of 37 d. Lung retention after 30 d as a fraction of the remaining body content decreased with a half-time of 36 d. Since particle transport from the lungs of dogs is so slow, this would have been mainly by absorption. Analysis carried out here gave values of fr of approximately 0.3 and ss of 0.03 d−1, assuming that the 210Po retained in the lungs was in particulate form rather than bound (fb = 0, see below), and that sr = 2 d−1 (based on the more detailed studies with polonium hydroxide in rats, see above). These are in broad agreement with the studies in rats described above, and also give assignment to Type M. Autoradiography of tissues from dogs sacrificed at 28 and 29 d showed uniform distribution of 210Po as single tracks, except for lesser concentrations in and on tissues of the bronchial tree. This might suggest lung retention in the bound state rather than particulate form (see below). (548) Morrow and Della Rosa (1964) studied the tissue distribution and excretion of 210Po after intratracheal administration of a freshly neutralised stock solution of 210Po in 0.5 N HCl to seven rabbits. Further details are given by Morrow and Della Rosa (1956). For two rabbits, the neutralised solution was aged for 1 week in order to increase the fraction of polonium colloid, but no differences in retention characteristics were noted between the two preparations, and the results were combined. At 2 d after administration, the lungs contained approximately 60% ILD. The authors estimated that of the 40% cleared, approximately half was in the alimentary tract and contents, and half (i.e. ∼20% ILD) absorbed into blood, indicating a value of fr of approximately 0.2. Since the first measurement was at 1 d, only a lower limit on sr can be set of 1 d−1 or more. At 10 and 30 d, the lungs contained approximately 24% and 2% ILD, respectively. These values are significantly lower than those obtained in the experiments with rats [45% and 18%, respectively; Thomas and Stannard (1964)]. From 2 to 30 d, lung retention could be represented by a single exponential function with a rate of 0.12 d−1 (t1/2∼5.7 d). This is an upper limit on ss because some of the clearance was due to particle transport. However, the rate of particle transport from the rabbit lung is not known (rabbits have not often been used to study alveolar clearance). The authors estimated that approximately 60% ILD had been absorbed from the lung by 30 d, which suggests that absorption was the dominant clearance process, and hence that ss is likely to be in the range 0.05–0.1 d−1. This is much faster than assessed for rats or dogs, and would give assignment to Type F. Another interspecies difference, compared with rats, is the much higher urinary excretion in rabbits than in rats, the ratio of faecal to urinary excretion being approximately 0.5 after 10 d. Higher urinary excretion in rabbits than in rats was also observed after intravenous injection (Silberstein et al., 1950a). In four other rabbits, 210Po was attached to silver particles (<10-µm diameter) before neutralisation [only reported in Morrow and Della Rosa (1956)]. The biokinetic of 210Po was broadly similar to that following administration of hydroxide colloid alone. Lung clearance was even faster; retention could be represented by a single exponential function with a rate of 0.25 d−1 (t1/2∼2.8 d). Surprisingly, this did not appear to result from greater particle transport to the alimentary tract, but from greater absorption; whole-body retention and urinary excretion were higher, and faecal excretion was lower. Complementary autoradiographic studies (on the same rabbits, with or without silver particles) were reported by Casarett (1958). It was noted that most of the activity was usually found in one lung lobe. As in the rat studies, autoradiographs of the lungs throughout the 28 d showed both clusters of alpha tracks and many individual tracks, indicating the presence of both particulate and ionic 210Po. (549) Although specific parameter values for polonium hydroxide based on in-vivo data are available, they are not adopted here because inhalation exposure to polonium hydroxide is unlikely, and because they are similar to those for default Type M. Instead, polonium hydroxide is assigned to Type M. (b) Polonium chloride (PoCl2; PoCl4) (550) Berke and DiPasqua (1964) followed the biokinetic of 210Po in rats for 60 d after a 5-h whole-body exposure to 210Po chloride carried on a sodium chloride vector aerosol (count median diameter = 0.1 µm). However, whereas the aerosols administered in the studies described in the section above on polonium hydroxide colloid were neutralised, the solution was acidified (0.1 N HCl) in this experiment. This might have resulted in a greater proportion of the 210Po being in ionic, rather than colloidal, form. Further details are given by Berke and DiPasqua (1957). With a relatively long exposure and few early measurements (immediately after exposure, 1 and 3 d), there is little information to define sr. The whole-body exposure resulted in extensive contamination of the pelt, which would have affected early excretion measurements. Preening would have led to ingestion of an indeterminate amount of 210Po, and absorption from the alimentary tract to blood, making it difficult to estimate early uptake from the respiratory tract. Lung retention of 210Po at 10, 30, and 60 d was approximately 44%, 15%, and 10% ILD (based on the estimated lung content at the end of exposure). These results are similar to those observed following administration of polonium hydroxide (Casarett, 1964; Thomas and Stannard, 1964; see above). Activity in the upper respiratory tract (skinned head) was approximately 12% of the body content (excluding pelt and alimentary tract) immediately after exposure. This fell rapidly to approximately 3% of the body content, and remained at that level throughout the experiment. Berke and DiPasqua (1957) suggested that this might be due to continuing ingestion (e.g. of excreta). Analyses carried out here gave absorption parameter values of fr = 0.4 and ss = 0.01 d−1, assuming that the 210Po retained in the lungs was in particulate form rather than bound (fb = 0, see below), and that sr = 2 d−1 (based on the more detailed studies with polonium hydroxide, see above). These parameter values give assignment to Type M. The value of ss is broadly similar to values derived from studies using polonium hydroxide (see above). A central value of 0.015 d−1 was therefore used in the analyses of results of other experiments with similar forms of polonium, but for which there were insufficient data to define ss. (551) Although specific parameter values for polonium chloride based on in-vivo data are available, they are not adopted here because inhalation exposure to polonium chloride is unlikely, and because they are similar to those for default Type M. Instead, polonium chloride is assigned to Type M. (c) Volatilised polonium (oxide) (552) Kimball and Fink (1950) investigated the biokinetic of 210Po for 10 d after a brief inhalation of volatilised polonium by rats. The aerosol was produced by deposition of 210Po from solution on to a nickel foil, through which a current was passed until it was red hot. The chemical form was not investigated, but oxide is mentioned in the report. Measurements of the diffusion coefficient of polonium ions newly formed by decay of radon indicate that they exist in a variety of chemical forms as a result of interaction with components of air (Busigin et al., 1981). According to Chu and Hopke (1988), polonium ions are rapidly converted to PoO2+ in the presence of oxygen. In one experiment (individual nose-only inhalation for 10–60 s), lung retention fell to approximately 60% ILD at 24 h and approximately 10% ILD at 10 d. The authors assessed that lung clearance was mainly by absorption to blood. Although data were not given, it was stated that (when extreme precautions were taken) animals sacrificed within a few minutes of exposure showed only traces of activity outside the respiratory tract, suggesting that the rapid absorption was on a time-scale of hours rather than minutes. In another experiment (group of 20 rats, simultaneous head-only 15-min inhalation), lung clearance appeared to be slower, falling from approximately 40% ILD at 24 h to approximately 30% ILD at 10 d. Analyses carried out here gave values of fr of approximately 0.4 for both experiments, assuming that the 210Po retained in the lungs was in particulate form rather than bound (fb = 0, see below), and that sr = 2 d−1 and ss = 0.015 d−1 (based on more detailed studies with polonium hydroxide, see above). These parameter values give assignment to Type M. Retention of material in the upper respiratory tract (based on the skinned head and trachea) was reported of the order of 10% of the estimated initial deposit in the upper respiratory tract. This could be evidence of a bound fraction, but could include contributions from other sources, such as systemic 210Po (see below). Autoradiography of lungs from a rat sacrificed immediately after inhalation showed uniform distribution of 210Po in alveolar tissue, and clear deposition throughout bronchi and bronchioles. However, by 24 h after inhalation, autoradiography showed only a little 210Po remaining in the bronchial walls. (553) Although specific parameter values for volatilised polonium based on in-vivo data are available, they are not adopted here because of the uncertainty about them, and because they are similar to those for default Type M. Instead, volatilised polonium is assigned to Type M. (d) Mineral dusts (554) Intakes of 210Po in particulate aerosol form can arise from exposure to airborne mineral dusts containing the natural long-lived parent 210Pb. In this case, the absorption rate will probably be determined by the dissolution rate of the mineral matrix in lung fluids. Measurements have been made of the dissolution in simulated lung fluid of samples of coal fly ash (Kalkwarf et al., 1984) and condensate from calcining phosphate rock dust (Kalkwarf and Jackson, 1984) for 60 d. By this time, the amounts of 210Po dissolved were less than 0.2% and less than 1%, respectively, indicating assignment to Type S in both cases. (e) Polonium condensed with cigarette smoke tar (555) Although mainly related to environmental, rather than occupational, exposure, information relating to 210Po in tobacco smoke is included here for completeness. 210Po and its precursor, 210Pb, are inhaled in cigarette smoke (Holtzman, 1967; Little and Radford, 1967; Parfenov, 1974; Cross, 1984; Skwarzec et al., 2001; Desideri et al., 2007). Higher concentrations of 210Po have been measured in the lungs of smokers than in non-smokers, indicating that not all the 210Pb and 210Po inhaled are readily soluble (Little et al., 1965; Holtzman and Ilcewicz, 1966; Rajewsky and Stahlhofen, 1966). It has been reported that 210Pb is concentrated in resinous material in the tips of trichomes (hairs) on the surfaces of tobacco leaves, which forms relatively insoluble particles during combustion (Martell, 1974; Radford and Martell, 1975). The 210Po present probably vaporises during combustion, but grows in from decay of 210Pb after deposition in the respiratory tract. (556) Cohen et al. (1979) measured the concentration of 210Po in the TB tree and parenchyma (alveolar interstitial region) of tissues obtained at autopsy from smokers, ex-smokers, and non-smokers. In non-smokers, the ratio of 210Po concentration in the TB region to that in the AI region was approximately 3 (resulting mainly from systemic 210Pb/210Po). In smokers and ex-smokers, the ratio was approximately 1; the higher concentration of 210Po in the parenchyma was attributed to the retention of relatively insoluble particles containing 210Pb/210Po inhaled in cigarette smoke. Cohen et al. (1980) measured the dissolution (in physiological saline at 37℃) of alpha activity of cigarette smoke collected on membrane filters. No decrease in activity was observed (estimated upper limit on dissolution ∼20%), although there was a considerable reduction in sample mass. Cohen et al. (1985) measured 210Po in the lungs of rats at times during 6 months of exposure to smoke from cigarettes enriched in 210Pb/210Po, and up to 5 months afterwards. A two-component compartment model was fit to measurements of lung retention following the end of exposure; a good fit was obtained, with 90% cleared at a rate of 0.036 d−1 (t1/2 = 19 d) and 10% cleared at a rate of 0.0055 d−1 (t1/2 = 125 d). This indicates Type M or S behaviour for both 210Pb and 210Po. (f) Unknown form (accidental exposures of workers) (557) Follow-up data for many cases of apparently acute inhalation of 210Po by workers have been reported, but in a high proportion, only urine (and, in some cases, blood) measurements were reported so little can be inferred about respiratory tract absorption (Naimark, 1948, 1949; also see Section 11.2.3.1 below). Some cases are considered here; in most of these, urinary and faecal excretion measurements were reported. The biokinetic models used in this publication predict that for inhalation of a 5-µm AMAD aerosol by a reference worker, the ratio of faecal to urinary excretion is fairly constant from approximately 10 d after intake, being approximately 3 for default Type F or Type M 210Po (which does not allow a distinction to be made between them), and approximately 40 for Type S. However, in their review, Leggett and Eckerman (2001) pointed out that a technique widely used for routine workplace monitoring of 210Po in urine involved spontaneous deposition of 210Po on to a metal disc, without prior acid digestion, and this could underestimate the activity present. In none of the cases considered in this section was it reported that acid digestion was used prior to 210Po deposition on to a metal disc, and so any conclusions must be treated with caution since the urine measurements may have been underestimated, and the ratio of faecal to urinary excretion overestimated. (558) Foreman et al. (1958) reported excretion data for two physicists who were exposed to 210Po for, at most, a few minutes after the rupture of a Po-Be source, for approximately 200 d after the incident (urinary excretion for both, and faecal excretion for one). Both urinary and faecal excretion showed at least two phases. The estimated biological half-time of the first (rapid) urinary component, representing approximately 6% of total urinary excretion, was 0.75 d. The ratio of faecal to urinary excretion was approximately 20 over the period 10–100 d, suggesting behaviour between Types M and S. Analysis here, using the systemic model described in Section 11.2.3.2 and the updated HRTM (inhalation of a 5-µm AMAD aerosol by a reference worker) with sr = 2 d−1, gave estimated parameter values of fr = 0.02 d−1 and ss = 0.001 d−1. (559) Sheehan (1964) analysed blood, urine, and faeces of a worker who inhaled 210Po in acid vapours. Measurements apparently started several days after exposure. Urine and blood both showed a biological half-time of 43 d. Total urinary and faecal excretion determined for Days 47–52 post exposure indicated a ratio of faecal to urinary excretion of 6.5, suggesting behaviour between Types M and S, but closer to Type M. (560) Scott and West (1975) measured excretion of 210Po in urine and faeces for 160 d, starting an estimated 2 d after the presumed accidental inhalation by a worker of material from a 210Po source. Contamination was found throughout the room. Although the paper's summary refers to ‘an exposure to 210-Po oxide…’, the only information on chemical form given is that the source was made by vapour-depositing polonium metal on to a metal disc. Only approximately 3% of the estimated activity deposited in the respiratory tract was excreted in urine. The urine data showed very high day-to-day variation. The ratio of faecal to urinary excretion was in the range 20–30 over the period 10–110 d, suggesting behaviour between Types M and S. (561) Ilyin (2001) reported measurements on a worker who died as a result of a large accidental intake of 210Po by inhalation (no information was given on its form). Reported activities retained at death, 13 d after intake, were: whole body, 100 MBq; lungs, 13 MBq; kidney, 4.5 MBq; and liver, 21 MBq. The daily excretion rate was reported to be 1.6 MBq d−1 (urine 25.5%, faeces 33.8%, vomit 32.4%, saliva 7.1%, and sweat 1.2%). Harrison et al. (2007) discussed the reported symptoms in relation to estimated tissue doses. They obtained a consistent fit to the urine and post-mortem tissue measurements using the Publication 66 (ICRP, 1994) Type M default values of sr (100 d−1) and ss (0.005 d−1), but with higher values of fr and fractional intestinal absorption than the default values. Analysis here, using the systemic model described in Section 11.2.3.2 and the updated HRTM (inhalation of a 5-µm AMAD aerosol by a reference worker) with sr = 2 d−1, ss = 0.005 d−1, and fA constrained to 0.1*fr (see Table 11.2, Footnote †), gave a consistent fit to post-mortem tissue measurements with fr of approximately 0.7. The result was insensitive to the choice of sr. The ratio of faecal to urinary excretion was lower (∼1.3) than predicted by the systemic model used here, but may have been affected by the response to the radiation, which included severe vomiting.
11.2.1.2. Default rapid dissolution rate for polonium
(562) Studies with polonium hydroxide colloid give values of sr of approximately 2 d−1. This is close to the general default value of 3 d−1 for Type M and S materials, and in view of the uncertainties in assessing absorption parameter values for polonium, a value of 3 d−1 is also applied here to all Type F forms of polonium.
11.2.1.3. Extent of binding of polonium to the respiratory tract
(563) The studies with polonium hydroxide, chloride, and volatilised polonium (oxide) all suggest that there is respiratory tract retention of polonium deposited in ionic (soluble) form. However, whether this is retained in particulate or bound form is unclear. Due to colloid formation at and around neutral pH, some colloid formation before deposition in the respiratory tract almost certainly occurred with polonium hydroxide, and may have occurred with the other materials. Similarly, colloid formation may well have occurred after deposition. Thus, formation of some particulate material would be expected. (564) The high proportion of systemic excretion going to faeces makes it difficult to distinguish clearance by absorption from clearance by particle transport, and hence the extent of any bound fraction. As noted above, in several studies, retention of 210Po in the upper respiratory tract was noted, and might be considered to be evidence of a bound fraction. However, this was usually based on retention in the skinned head, which would have included 210Po in soft tissues, blood, and lymphatics. Clearance from the upper respiratory tract appeared to be slower than from the lungs; if retention in the respiratory tract was due predominantly to a bound fraction, then the rate of uptake to blood should be similar from the upper respiratory tract and lungs. Autoradiographic studies which complemented the radiochemical measurements of activity distribution and excretion also indicated the presence of both particulate and ionic 210Po. The latter might be considered to be evidence of a bound fraction, but some would have been systemic or blood-borne. Another indication of retention in a bound, rather than particulate, form is the similarity in the retention kinetics of different chemical forms administered, suggesting that retention is characteristic of the element rather than related to dissolution of different particulate forms (see Section 9). Thus, there are indications that there might well be some binding of polonium. However, the information is insufficient to estimate the extent of the bound state with confidence. Although it is not clear that the bound state for polonium is negligible, it is assumed by default that fb = 0.
11.2.2. Ingestion
(565) Fractional absorption of 210Po from the alimentary tract has been measured in human subjects and in animals (Harrison et al., 2007; Scott, 2007). (566) A male patient being treated for chronic myeloid leukaemia was reported to be a volunteer for ingestion of 7 Bq kg−1 body mass in drinking water. Blood concentrations and urinary excretion after administration were approximately one-tenth of corresponding values obtained in other subjects after intravenous injection of polonium chloride, suggesting an f1 of 0.1 (Fink, 1950; Silberstein et al., 1950b). Leggett and Eckerman (2001) re-analysed these data and estimated that absorption was at least 0.15. (567) The absorption of 210Po in animals has been reported for rats, guinea pigs, and cats. In rats, the fractional absorption has been reported as 0.03–0.06 for an unspecified chemical form (Anthony et al., 1956) and 0.06 for the chloride (Della Rosa et al., 1955). In a study of two rats exposed by gavage to approximately 20 MBq kg−1 body mass of freshly neutralised 210Po chloride, fractional absorption was estimated as 0.024 and 0.048 (Cohen et al., 1989). Haines et al. (1993) obtained values for rats of 0.05 for the nitrate forms. For 210Po administered as the citrate, absorption was reported as 0.07–0.09 in rats and guinea pigs. After administration by gavage of 0.52 MBq kg−1 body mass to rats (chemical form not specified), f1 was found to be 0.03–0.05 (Spoerl and Anthony, 1956). (568) Fractional absorption in animals seems to be identical in males and females. Stannard (1964) reported average f1 values of 0.05 for male rats and 0.045 for female rats based on balance studies after correcting for the amount of polonium assumed to be excreted into the intestine via the bile (Scott, 2007). (569) In a series of experiments by Morrow et al. (1964), cats were administered either a colloidal hydroxide or soluble citrate form of 210Po by gavage. After placing 210Po in the stomach, 0.6–1.6% was absorbed, independent of chemical form, over a 7-h period. However, significant differences were found for the two isotopes when the solution was placed in isolated duodenal loops of the small intestine. Over a 10-h period, absorption was up to 40 times greater for the citrate solution. The authors indicated that gastric acidity converted the colloidal 210Po to a soluble form in the stomach, making absorption comparable to the monomeric citrate form. (570) In Publication 30 (ICRP, 1979), an f1 value of 0.1 was recommended. A higher value of 0.5 is applied to polonium in foodstuffs (ICRP, 1993). In this publication, an fA value of 0.1 is used for all chemical forms in the workplace.
11.2.3. Systemic distribution, retention, and excretion
11.2.3.1. Summary of the database
(a) Human subjects – occupational data (571) Leggett and Eckerman (2001) reviewed records of approximately 1500 former polonium workers and estimated urinary half-times for numerous cases of apparently elevated, acute exposure. Approximately 95% of the derived effective half-times were in the range 8–52 d, corresponding to a range of biological half-times of 8.5–83 d. The mean, median, and mode of the effective half-times were approximately 30, 30, and 34 d, corresponding to biological half-times of 38, 38, and 45 d, respectively. (572) Silverman (1944) reported data for a male worker who was exposed while handling a foil containing 44.4 GBq of 210Po. Daily urine sampling and weekly faecal sampling began immediately and continued for 64 d. Biological half-times of 34.9 and 29.3 d were derived from urinary and faecal excretion data, respectively. (573) Sheehan (1964) described a case in which a worker punctured his finger with a wire contaminated with 210Po. Daily urinary excretion of 210Po decreased by approximately a factor of 4 during the first 2–3 d after the incident, and then decreased with a biological half-time of approximately 29 d over the next 14 weeks. (574) Testa (1972) described a case in which a 59-year-old woman contaminated her hands by cleaning a chemical hood where a 210Po nitrate solution had been handled. Both ingestion intake (from a habit of finger sucking) and absorption through the skin were suspected. Urinary excretion measurements were initiated approximately 1 week after the incident. These data indicated a biological half-time of 29 d, but an early, rapid component may have been missed since the first measurement was at Day 7 or 8, and the urinary excretion rate fell by more than a factor of 2 between the first measurement and the second, which was made approximately 10 d later. (575) A solution containing 210Po was accidentally splashed on the face of a female technician at Mound Laboratory (Cohen et al., 1989). Measurements of 210Po in urine, faeces, and blood over several months indicate biological half-times of 13.1, 28.6, and 20.3 d, respectively. (576) Wraight and Strong (1989) described a case in which a worker was exposed to 210Po through a puncture wound of the thumb. The authors derived biological half-times of 35, 40, and 26 d from measurements of 210Po in urine, faeces, and blood, respectively. Faecal excretion of 210Po was highly variable, and only one faecal measurement was made at times greater than approximately 1 month after the incident. Urinary data for this subject may be described more precisely in terms of two excretion phases with biological half-times of approximately 5 d (representing ∼30% of total urinary excretion) and 42 d (Leggett and Eckerman, 2001). (577) Follow-up data for several cases of apparently acute inhalation of 210Po by workers have been reported (Naimark, 1948, 1949; Spoerl, 1951; Jackson and Dolphin, 1966). Estimated biological half-times for individual subjects, based for the most part on urinary excretion data, generally fall in the range 20–60 d. Central estimates for relatively large groups of workers are usually in the range 30–50 d. These half-times reflect combined retention times in the respiratory tract and systemic tissues. Selected incidents are described below. (578) Foreman et al. (1958) reported urinary and faecal excretion data for two physicists who were exposed to airborne 210Po for, at most, a few minutes after the rupture of a Po-Be source. Both urinary and faecal excretion showed at least two phases. The estimated biological half-time of the first (rapid) urinary component, representing approximately 6% of total urinary excretion, was 0.75 d. The estimated biological half-time of the first faecal component, representing approximately 60% of total faecal excretion, was approximately 0.6 d. Urinary as well as faecal data for times greater than a few days after exposure indicate a biological half-time of approximately 40 d, based on re-evaluation of the plotted data (Leggett and Eckerman, 2001). (579) Sheehan (1964) analysed blood, urine, and faeces of a worker who inhaled 210Po in acid vapours. Measurements apparently started several days after exposure. Urine and blood both showed a biological half-time of 43 d. Total urinary and faecal excretion determined for Days 47–52 post exposure indicated a ratio of faecal to urinary excretion of 6.5. The technique used to measure 210Po in urine did not involve wet-ashing of samples, and thus could have underestimated urinary excretion of 210Po (Fellman et al., 1989). (580) Scott and West (1975) measured excretion of 210Po in urine and faeces of a worker following accidental inhalation of material thought to consist of small particles of 210Po oxide. Urine sampling began approximately 2 d after the exposure, and faecal sampling began 2 d later. A biological half-time of 33 d was estimated from the urinary excretion data, but the data are highly variable and not closely represented by a single half-time. (b) Human subjects – controlled studies (581) Silberstein et al. (1950b) measured 210Po in urine, faeces, and blood of four volunteers (Subjects 1–4) who were administered 210Po chloride by intravenous injection, and in a fifth volunteer (Subject 5) who ingested 210Po chloride. Subject 1 was suffering from generalised lymphosarcoma, Subject 2 from acute lymphatic leukaemia, and Subjects 3–5 from chronic myeloid leukaemia. Observations on Subjects 1, 2, 3, 4, and 5 were continued for up to 43, 6, 71, 13, and 228 d, respectively. Biological half-times fitted to the time-dependent concentration of 210Po in urine, faeces, or blood of these subjects varied somewhat with the observation period, and also showed considerable intersubject variability. For the subjects who were followed for several weeks or months (Subjects 1, 3, and 5), urinary excretion data indicate half-times of 30–50 d for the period starting 1 week after exposure; faecal excretion data indicate half-times of 33–52 d for this period; and data for red blood cells indicate half-times of 12–48 d for this period. Urinary excretion data for the first week after administration yield biological half-times as short as 3 d. (582) Excretion data for the subject of Silberstein et al. (1950b) who ingested 210Po chloride (Subject 5) were re-analysed in an attempt to determine fractional absorption from the gastrointestinal tract. Under the assumption that all faecal excretion at times greater than 1 week after ingestion was due to secretion of systemic 210Po into the gastrointestinal tract, it is estimated that endogenous faecal excretion represented at least 14% of ingested 210Po. Measurements of urinary excretion indicate that approximately 0.5% of the ingested amount was removed in urine. Thus, it appears that at least 14.5% of the ingested amount was absorbed to blood. The estimate of 0.5% for urinary excretion may be an underestimate due to problems with the measurement technique (Fellman et al., 1989). (583) Subject 2 of Silberstein et al. (1950b) died of acute lymphatic leukaemia 6 d after injection of 210Po. The distribution of 210Po was determined from tissue samples taken approximately 1 h after his death. The usefulness of the data for this subject are limited not only by the fact that he was terminally ill, but also because estimated recovery of polonium was substantially greater than 100%, probably due to substantial overestimates of the mass of some tissues. For example, skin was estimated to represent 18% of body weight, which is approximately four-fold greater than the relative mass of skin given in the ICRP’s Reference Man publication (ICRP, 1975). For the purposes of the present study, the distribution of polonium in the human subject has been recalculated on the basis of current information on typical organ weights, and by constraining organ contents to achieve mass balance. (584) Hunt and Allington (1993) determined urinary 210Po in six subjects who had ingested crab meat containing elevated concentrations of this radionuclide. Urinary excretion rates were determined for periods of 9–21 d in five of the subjects. Biological half-times of 3–8 d are indicated by these short-term data. Comparison of faecal excretion data with the ingested amounts indicates that fractional absorption to blood ranged from approximately 0.6 to more than 0.9 in the six subjects. Urinary excretion over the first 7 d represented 0.4–1.1% of the absorbed amount in four of the subjects, and 5.1% in a fifth subject. It is not evident whether these data for ingestion of biologically incorporated polonium are pertinent to occupational exposures to 210Po, but the data demonstrate the potentially high absorption of some forms of polonium from the gastrointestinal tract, and the potentially high variability in the biokinetic of absorbed polonium. (c) Laboratory animals (585) Data on the biokinetic of polonium in laboratory animals were reviewed by Leggett and Eckerman (2001). The systemic behaviour of polonium is qualitatively similar among species in most respects, but some species differences have been identified. For example, the blood cells of rats appear to have an unusually high affinity for polonium absorbed after ingestion, and rabbits show an unusually high rate of loss of polonium from the body.
11.2.3.2. Biokinetic model for systemic polonium
(586) A biokinetic model for systemic polonium proposed by Leggett and Eckerman (2001) is used in this publication. The model structure is shown in Fig. 11.1. Transfer coefficients are given in Table 11.3. The basis for each of the transfer rates is discussed below. (a) Blood (587) Data on non-human primates indicate that there is a rapid phase of removal of polonium from blood, followed by one or more slower phases of removal (Cohen et al., 1989). The rapid phase represented approximately 80–90% of intravenously injected polonium, and had a half-time on the order of 10–40 min. The remainder was removed with a half-time of approximately 8–19 d in the baboon, and approximately 37 d in the tamarin. The slower phase of removal appears to be associated with attachment of polonium to red blood cells and plasma proteins (Thomas, 1964; Cohen et al., 1989). (588) The relative quantities of polonium associated with red blood cells and plasma proteins varies with species, but in all species, the total amount of polonium in red blood cells exceeds that in plasma at most times after absorption or injection of polonium into blood (Silberstein et al., 1950a; Smith et al., 1961; Thomas, 1964; Cohen et al., 1989). There was considerable inter- and intrasubject variability in the relative quantities of 210Po in red blood cells and plasma determined in human subjects administered 210Po by intravenous injection or ingestion, but the content of red blood cells averaged approximately 1.5 times that of plasma (Silberstein et al., 1950b). (589) The initial behaviour of polonium in blood may depend on the route of exposure. After exposure by inhalation or wounds, there is generally an early, rapid loss of polonium in urine (Foreman et al., 1958; Smith et al., 1961; Casarett, 1964; Wraight and Strong, 1989) that appears to be absent or less pronounced after exposure by other routes. (590) The model for blood was designed to depict rapid and slow phases of removal such as those observed in non-human primates (Cohen et al., 1989); to approximate blood retention data for human subjects (Silberstein et al., 1950a), non-human primates (Cohen et al., 1989; Fellman et al., 1994), and dogs (Parfenov and Poluboyarinova, 1969); and to depict a higher rate of urinary excretion of polonium after exposure through inhalation or wounds than after exposure by other routes. Variation in the rate of urinary excretion with route of exposure is modelled by using different receptor compartments in plasma with different rates of transfer to the urinary excretion pathways. Specifically, a compartment called ‘Plasma 2’ is assumed to receive inflow to blood from the respiratory tract or wounds, and a compartment called ‘Plasma 1’ is assumed to receive inflow to blood from all other sources, including polonium that returns from systemic tissues to blood. Outflow from Plasma 2 is assumed to be rapid (t1/2 = 1 min, corresponding to a transfer rate of 1000 d−1) and is divided between Plasma 1 and a kidney compartment (Kidneys 1) that feeds the urinary bladder contents. This scheme yields an initially higher rate of urinary excretion for exposure by inhalation or wounds than for other routes. As default values, 80% of outflow from Plasma 2 is assigned to Plasma 1 and 20% is assigned to Kidneys 1. Assignment of a higher percentage to Kidneys 1 may be indicated in cases where the observed urinary excretion rate falls rapidly during the first few days after acute intake of polonium. This is because an unusually rapid decline in the urinary excretion rate may indicate that an unusually high fraction of the amount entering the systemic circulation was cleared rapidly by the kidneys. (591) A third plasma compartment (Plasma 3) is used to represent protein-bound, or non-diffusible, polonium in plasma. Red blood cells are represented by a single compartment. (592) The removal half-time from Plasma 1 is assumed to be 10 min, corresponding to a total transfer rate of 100 d−1. Plasma 3 and red blood cells are assumed to receive 4% and 6% of the polonium atoms that leave Plasma 1, respectively (i.e. the deposition fractions for Plasma 3 and red blood cells are 0.04 and 0.06, respectively). The removal half-time from either red blood cells or Plasma 3 back to Plasma 1 is assumed to be 7 d. (b) Liver and faecal excretion (593) Data for laboratory animals (Smith et al., 1961; Parfenov and Poluboyarinova, 1969; Fellman et al., 1994) and one human subject (Silberstein et al., 1950b) indicate that a substantial portion of injected or absorbed polonium deposits in the liver. It appears that much of the initial uptake by the liver may be removed with a half-time of a few days, and the remainder may be lost over a period of weeks. Endogenous faecal excretion of polonium appears to arise mainly from biliary secretion from the liver (Silberstein et al., 1950b; Fellman et al., 1994). (594) In this model, the liver is assumed to consist of two compartments: Liver 1 and Liver 2. Liver 1 is used to represent relatively rapid removal of polonium from the liver and to account for biliary secretion of polonium, which appears to decline rapidly with time. Liver 2 is used to describe relatively long-term retention in the liver. (595) The total liver is assumed to receive 35% of the outflow from Plasma 1, with half of this amount depositing in Liver 1 and half depositing in Liver 2. Polonium is assumed to be removed from Liver 1 to the small intestine contents with a half-time of 5 d, and from Liver 2 to Plasma 1 with a half-time of 7 d. Passage from Plasma 1 to Liver 1 to the small intestine contents is assumed to be the sole source of endogenous faecal excretion of polonium. (c) Kidneys and urinary excretion (596) In this model, the kidneys are assumed to consist of two compartments: Kidneys 1 and Kidneys 2. Kidneys 1 represents polonium that is eventually removed to the urinary bladder contents after filtration at the glomerulus and deposition in the renal tubules. Kidneys 2 represents polonium that is eventually returned to blood after entering kidney tissue, either from nutrient blood or the tubular lumen. For simplicity, polonium entering either Kidneys 1 or Kidneys 2 is assumed to transfer directly from Plasma 1. Also, there is assumed to be no direct transfer of filtered polonium into the urinary bladder contents. That is, filtered polonium is assumed to reside temporarily in kidney tissue before being transferred to the urinary bladder contents. (597) Parameter values describing renal retention of polonium were chosen to fit retention data for human subjects, baboons, and dogs. Kidneys 1 and Kidneys 2 are each assumed to receive 5% of polonium atoms that leave Plasma 1. The removal half-time from Kidneys 1 to urinary bladder contents is assumed to be 4 d, and the removal half-time from Kidneys 2 to Plasma 1 is assumed to be 7 d. (598) After parameter values describing faecal excretion of polonium had been selected, parameter values describing urinary excretion were set, in part, to yield a (cumulative) ratio of faecal to urinary excretion of approximately 3. The typical value of this ratio for human subjects has not been established. The selected value of 3 is a compromise, based on a fairly wide range of values determined for human subjects and non-human primates. The selected value is slightly lower than the value determined for tamarins (Cohen et al., 1989; Fellman et al., 1989) and higher than the value determined for baboons (Fellman et al., 1989). The true ratio seems likely to be lower than the value of 10 or more determined by Silberstein et al. (1950b) for human subjects, in view of findings of Fellman et al. (1989) that the measurement technique of Silberstein et al. substantially underestimates the concentration of polonium in urine, at least in baboons and tamarins. Results of a modern study on a human subject exposed through a puncture wound seem consistent with the relatively low ratio of faecal to urinary excretion determined by Silberstein et al. (Wraight and Strong, 1989); however, the technique for measuring urinary polonium was not described, and conclusions concerning the ratio of faecal to urinary excretion were based on an uncertain curve fit to scattered faecal excretion data. Reported ratios of faecal to urinary excretion for human subjects exposed to 210Po by inhalation are in the range 6.5–70, but provide only upper-bound estimates of the ratio of faecal to urinary excretion for systemic polonium for two reasons: (1) a substantial portion of 210Po found in faeces may have been transported from the lungs to the gastrointestinal tract without having been absorbed to blood; and (2) some of the reported values were based on a measurement technique that may substantially underestimate the concentration of 210Po in urine. (599) The measurement technique used by Silberstein et al. (1950b) and some later investigators involved spontaneous deposition of 210Po from raw urine on to a suitable metal disc. Recovery was estimated by plating 210Po from samples that had been spiked with known amounts of 210Po. There is evidence from studies on laboratory animals, however, that 210Po excreted in urine is not plated with the same efficiency as 210Po added to urine, unless the samples have been digested with acid prior to deposition (Fellman et al., 1989). Although it is tempting to adjust older urinary excretion data for human subjects to account for potentially low recovery of 210Po, as indicated by results for laboratory animals, such adjustments would involve substantial uncertainties because recovery of metabolised 210Po from raw urine appears to depend on species as well as time since exposure (Fellman et al., 1989), and because there is some question as to whether inaccuracies in older methods are as great as indicated by modern reconstructions of those methods. Moreover, reported data on urinary excretion of 210Po often have not been accompanied by a description of the measurement technique. (d) Spleen (600) The spleen is represented as a single compartment in exchange with Plasma 1. Parameter values were set for reasonable consistency with spleen retention data for baboons, dogs, and one human subject (Leggett and Eckerman, 2001). It is assumed that the spleen receives 2% of the outflow from Plasma 1, and that the removal half-time from spleen to Plasma 1 is 7 d. (e) Skin (601) Data on laboratory animals and man indicate that skin initially takes up a few percent of polonium that enters plasma, but retains polonium more tenaciously than most other tissues. At times remote from acute intake, skin may contain half or more of the systemic burden. Much of the skin content is found around hair follicles (Soremark and Hunt, 1966). Hair has a relatively high polonium content at times remote from exposure (Mayneord and Hill, 1964). (602) In this model, skin is represented as a single compartment that receives 5% of polonium that leaves Plasma 1. The removal half-time from skin is assumed to be 50 d. Half of the polonium leaving skin is assumed to be lost in excreta (hair, skin, sweat), and the other half is assumed to return to Plasma 1. (603) In baboons, the pelt contained 53% of the body content at 91 d post injection (Fellman et al., 1989). In dogs, the pelt contained 44%, 43%, 54%, and 51% of total-body polonium at 116, 131, 146, and 149 d after inhalation (Smith et al., 1961). Model predictions are reasonably consistent with these data. (f) Skeleton (604) Experimental data on laboratory animals indicate that approximately 5% of the injected or absorbed amount deposits in the skeleton. Soon after exposure, most of the skeletal deposition is found in the marrow spaces, and appears to be associated primarily with active marrow (ICRP, 1993). A smaller amount found in the mineralised skeleton may be associated with organic material in bone. The bone deposit may be retained longer than most soft tissue polonium. (605) In this model, the skeleton is represented as two compartments, identified as red marrow and bone surfaces. It is assumed that these compartments receive, respectively, 4% and 1.5% of polonium leaving Plasma 1, and that both compartments lose polonium to Plasma 1. The removal half-time from red marrow is assumed to be 7 d, and the removal half-time from bone surfaces is assumed to be 30 d. The bone surface deposit is assumed to be equally divided between trabecular and cortical bone. (g) Gonads (606) Data on uptake and retention of polonium by the gonads are variable, but indicate elevated concentrations compared with most tissues (Silberstein et al., 1950b; Blanchard and Moore, 1971; Cohen et al., 1989; Naylor et al., 1991). In this model, the testes and ovaries are each considered as a single compartment that exchanges polonium with Plasma 1. These compartments are assumed to receive, respectively, 0.1% and 0.05% of polonium leaving Plasma 1. The removal half-time from each of these compartments is 50 d. (h) Other tissues (607) Remaining tissues and fluids are lumped into a compartment (other) that is assumed to exchange polonium with Plasma 1. Parameter values for this compartment were chosen for consistency with data on baboons (Cohen et al., 1989). Other is assumed to receive 32.4% of polonium leaving Plasma 1, which is the amount not accounted for in the sum of deposition fraction for all explicitly identified compartments. The removal half-time from other to Plasma 1 is assumed to be 7 d.
11.2.3.3. Treatment of radioactive progeny
(608) Progeny of polonium isotopes addressed in the calculation of dose coefficients are isotopes of bismuth, lead, and thallium. The systemic models for radioisotopes of these elements as progeny of bismuth are the same as their systemic models as progeny of lead, described in Section 9.
11.3. Individual monitoring
(609) Monitoring of 210Po intakes is accomplished through urine bioassay, using a technique that involves wet acid digestion followed by alpha spectrometry. The monitoring results of 210Po in urine samples of occupationally exposed personnel should be compared with the background excreta polonium concentrations of the local population by statistical techniques. A baseline might be established for an individual or for the bioassay monitoring programme.
11.4. Dosimetric data for polonium
11.5. References
12. RADON (Z = 86)
12.1. Introduction
(610) This section generally follows the standard format in the OIR series of providing biokinetic and dosimetric data for the topic element, including effective dose coefficients based on intake of radioisotopes of the element without accompanying progeny (Table 12.5). However, for radon exposures in general, inhalation of the airborne radon progeny accounts for most of the radiation dose, and not the inhalation of the radon gas itself. Effective dose coefficients for the inhalation of progeny of 222Rn or 220Rn are accordingly provided in Annex A and summarised here, expressed in units of mSv per mJ h m−3, mSv per WLM, and mSv per Bq h m−3 (Tables 12.6 and 12.7). (611) Annex A provides a detailed treatment of the dosimetry of radon progeny, including a review of empirical data on physical properties of airborne radon progeny, and a description of quantities and units that characterise the concentration of radon and radon progeny in the air. Effective dose coefficients are provided for inhalation of short-lived progeny of 222Rn or 220Rn in indoor workplaces and mines. Effective dose coefficients are also calculated for inhalation of 222Rn progeny in tourist caves. In addition, Annex A provides information and dosimetric data to support calculations of site-specific dose coefficients for use in cases where aerosol conditions are significantly different from typical conditions, and where sufficient and reliable aerosol data are available to warrant such calculations. Organ and tissue equivalent dose coefficients for exposures to radon and thoron progeny are given in the accompanying electronic annex. Effective dose coefficients for the inhalation of actinon (219Rn) progeny are also given in Annex A. (612) Effective dose coefficients for submersion exposure to the airborne radon (222Rn), thoron (220Rn), and actinon (219Rn) and their progeny are dealt with separately in OIR Part 5. For 222Rn, this dose makes only a small contribution to the overall effective dose, typically on the order of 1%. (613) The application of dose coefficients is described in Section 12.5 and in Annex A (Section A.2). Relation of body fat (% of body weight) and long-term clearance half-time of inhaled xenon or krypton. Data on xenon from Susskind et al. (1977). Data on krypton from Ellis et al. (1977).
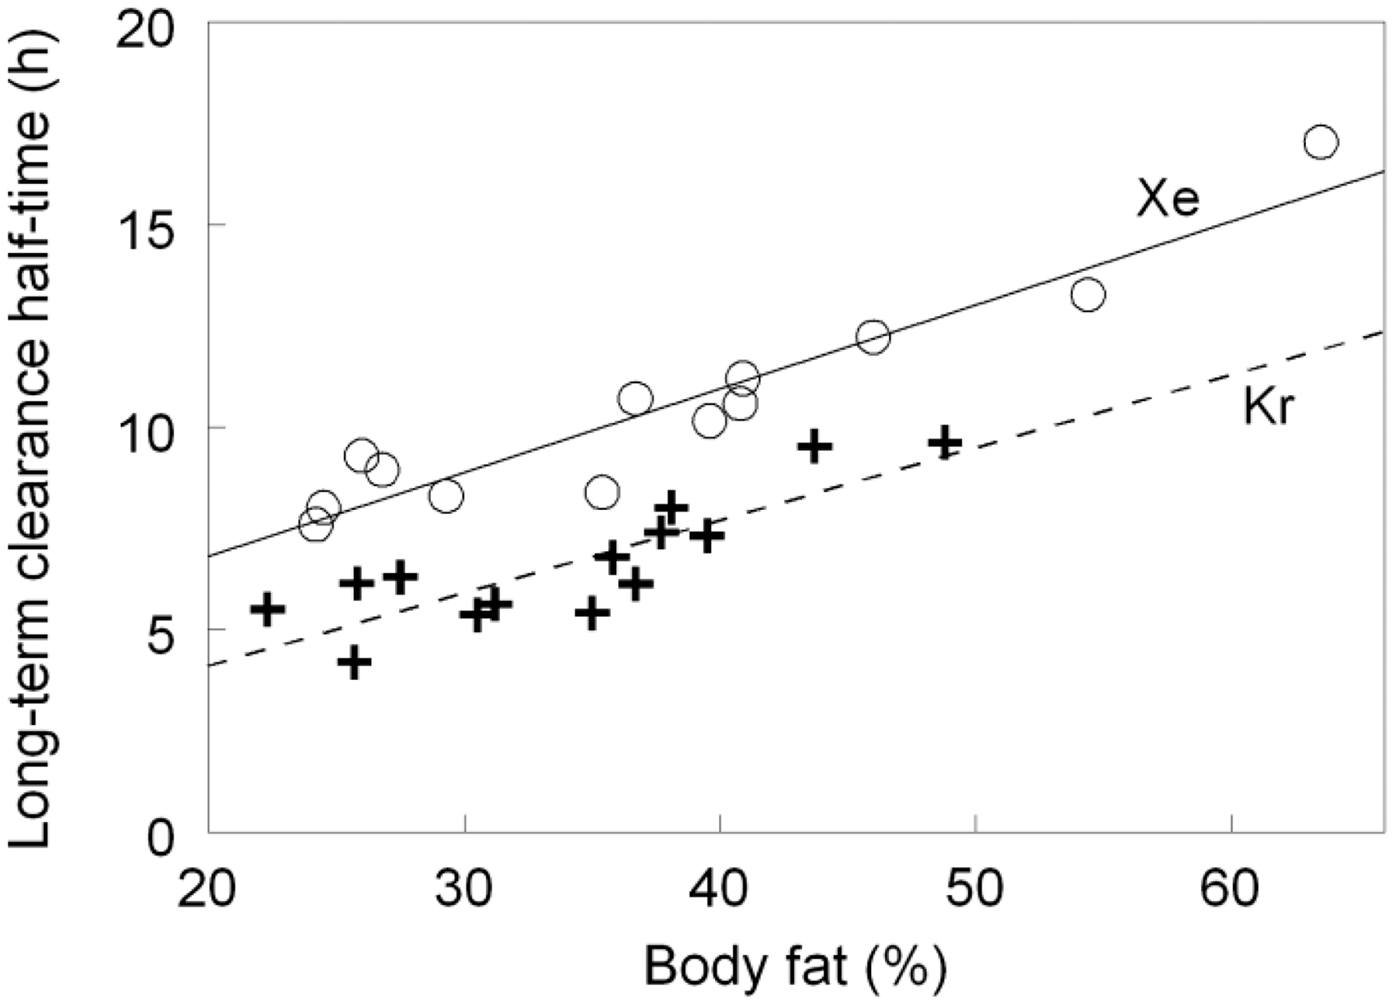
12.2. Chemical forms in the workplace
(614) Radon is an inert (noble) gas that is encountered in elemental form either as a gas or dissolved, usually in water. (615) Three isotopes of radon are considered in this section: 222Rn, 220Rn, and 219Rn (Table 12.1). They are usually encountered as progeny radionuclides of radium isotopes (226Ra, 224Ra, and 223Ra), which are members of the three natural radioactive decay series, headed by the primordial radionuclides 238U, 232Th, and 235U, respectively. Due to their origins, the isotopes 222Rn, 220Rn, and 219Rn are commonly known as radon, thoron, and actinon, respectively. The two isotopes 222Rn and 220Rn are the main sources of exposure from radon of importance for radiation protection. (616) Uranium, radium, and thorium occur naturally in soil and rocks, and provide a continuous source of radon. Radon can escape from the Earth's crust either by molecular diffusion or by convection, and as a consequence is present in the air outdoors and in all buildings. The build-up of activity concentrations of radon and its short-lived progeny within enclosed spaces gives rise to a potential radiation hazard. This applies particularly to workplaces such as underground mines, tourist caves, and water supply facilities where ground water with a high radon concentration is treated or stored. (617) Radon, which has a half-life of 3.8 d, can diffuse in soil more than 1 m from the point where it is formed. As a result, the ground underneath buildings is usually the main source of indoor radon. In contrast, as thoron has a short half-life (56 s), it travels shorter distances than radon from the point where it is formed. As a consequence, building materials are usually the main source of indoor thoron exposure. As actinon (219Rn) has an even shorter half-life (4 s), its contribution to workplace exposure is generally low. Structure of the biokinetic model for systemic radon. RT-air, respiratory tract air; Blood-A, arterial blood; Blood-V, venous blood; Breast_g, glandular breast tissue; Breast_a, adipose tissue in breast; HATM, Human Alimentary Tract Model (ICRP, 2006).

12.3. Routes of intake
12.3.1. Inhalation
(618) Although radon is chemically inert, a proportion of inhaled radon gas is absorbed into the blood stream from the lungs, where it moves rapidly within the body. Radon gas absorbed to pulmonary blood is distributed in arterial blood to tissues, and is then transferred from tissues to venous blood. The gas is carried in venous blood to pulmonary blood where some of it is exhaled, while the rest returns to arterial blood and the cycle continues. The biokinetic model for radon gas described in Section 12.3.3.2 is used to calculate doses from inhalation of radon gas. The transfer rates between blood and tissues depend on blood flow rates, tissue and blood volumes, and the relative solubility of radon in tissues and blood represented by tissue-to-blood partition coefficients. Transfer rate constants from lung air-to-blood, blood-to-tissues, tissues-to-blood, and blood-to-lung air are given in Section 12.3.3.2. Equilibrium concentrations in tissues, blood, and lung air are reached for continuous chronic exposure to a given radon concentration. The time it takes for 222Rn to reach equilibrium concentrations in tissues varies from several minutes to a few days depending upon their blood supply and the tissue-to-blood partition coefficient. However, the value of the equilibrium concentration of 222Rn in a tissue can be calculated directly from the ambient concentration, the tissue-to-blood partition coefficient, the blood-to-air partition coefficient, and the density of the tissue (Leggett et al., 2013). (619) The equivalent doses to regions of the respiratory tract arising from radon gas within the airways are calculated assuming that the radon gas within the airways equilibrates rapidly with the ambient air concentration. Specific absorbed fractions (SAFs) for a source consisting of the volume of the gas within the respiratory tract airways (RT-air) have been calculated recently by ICRP (2016). These SAFs have been used in the dosimetric calculations in this publication, whereas previously the SAF for source organ RT-air for non-penetrating radiations was approximated by assuming the activity in the volume of the gas within the airways can be replaced by the same activity uniformly deposited on the airway surface (ICRP, 1994b; Bailey et al., 1996).
12.3.2. Ingestion
(620) Radon is soluble in water, and if high concentrations are found in drinking water, this can be a significant route of intake. Volunteer experiments have shown that radon is readily absorbed from the alimentary tract into blood (Section 12.3.3.1). The site or sites of absorption have not been clearly established, but some investigators have postulated that ingested radon is absorbed from the stomach as well as from the small intestine. As a result of different assumptions regarding the residence time of ingested radon in the stomach, and the extent of diffusion of radon through the stomach wall, published estimates of dose to the stomach wall per intake of ingested 222Rn vary by two orders of magnitude (von Döbeln and Lindell, 1964; Hursh et al., 1965; Suomela and Kahlos, 1972; Crawford-Brown, 1989; Brown and Hess, 1992; Harley and Robbins, 1994; Sharma et al., 1997; NAS, 1999; Khursheed, 2000). The rate of removal of radon from the stomach assumed in the dose calculations has varied from a few minutes to a few hours. The following approaches illustrate the variety of assumptions that have been made concerning accumulation of radon in the stomach wall. Hursh et al. (1965) assumed that the stomach wall contains radon at the same concentration as occurs in the stomach contents at all times following ingestion, and that radon is uniformly distributed in the wall. A committee of the US National Academy of Sciences (NAS, 1999) estimated, on the basis of a diffusion model, that the time-integrated concentration of radon at the depth of the radiosensitive cells in the stomach wall is 30% of the time-integrated concentration in the contents. Harley and Robbins (1994) concluded, on the basis of the structure and secretory properties of the stomach wall, that any radon that diffuses from the contents into the wall does not reach a depth at which the alpha emissions could irradiate the stem cells. Khursheed (2000) and Leggett et al. (2013) concluded, on the basis of biokinetic model fits to observations of whole-body retention of acutely ingested 222Rn in human subjects (Hursh et al., 1965), that the data favour the assumption that absorption occurs primarily or completely in the small intestine. (621) The biokinetic model for radon gas following ingestion assumed in this publication is described in Section 12.3.3.2. In this model, it is assumed that radon gas does not diffuse from stomach contents to stomach wall, but that radon is absorbed to blood solely via the small intestine.
12.3.3. Systemic distribution, retention, and excretion
12.3.3.1. Summary of the database
(622) The noble gases are chemically inert, but are absorbed to blood from the lungs or the gastrointestinal tract and retained in systemic tissues to some extent, due in part to their solubility in blood and tissues. Much of the gas that reaches blood is cleared by the lungs in a single pass, but a portion is partitioned between the blood and tissues. The rate of transfer of the gas from blood to a tissue can be estimated on the basis of the fraction of cardiac output received by the tissue. The rate of return from a tissue to blood depends on both the blood perfusion rate and the relative solubility of the gas in blood and the tissue, represented by a gas-specific tissue-to-blood partition coefficient. The partition coefficient for two compartments is defined as the ratio of the concentrations of the gas in the compartments at equilibrium. Some experimentally determined tissue-to-blood partition coefficients for the noble gases radon, xenon, and krypton are listed in Table 12.2. Half-times for the build-up or washout of these gases are a few minutes for tissues with a rich blood supply and low to moderate partition coefficients, but are much greater for fatty tissues because of their poor blood supply and high tissue-to-blood partition coefficient. Within 1 h of acute intake or the start of continuous intake of radon, xenon, or krypton, body fat contains most of the systemic content. (623) The partition coefficients for radon given in Table 12.2 were derived from radon solubility coefficients quoted by Bernard and Snyder (1975), which in most cases were based on in-vivo rat data of Nussbaum and Hursh (1957, 1958). The values for bone and skin were based on radon solubility in physiological saline. (a) Ingestion of 222Rn by volunteers (624) A number of investigators have used measurements of 222Rn in breath or external measurements of the short-lived chain member 214Bi to estimate whole-body retention of radon in human subjects after ingestion of elevated levels in water or other material (Vaternahm, 1922; Fernau and Smereker, 1933; Meyer, 1937; Andersson and Nilsson, 1964; von Döbeln and Lindell, 1964; Hursh et al., 1965; Suomela and Kahlos, 1972; Gosink et al., 1990; Brown and Hess, 1992). Reported rates of loss of radon from the body are variable, probably due, in large part, to differences in experimental conditions, such as the timing of intake of radon relative to meals, the level of physical activity of the subjects after intake of radon, and the length of the observation period. Retention half-times in the range 30–70 min have been reported in several studies involving relatively short observation periods. Multiple retention components with half-times varying from a few minutes to several hours have been determined in some studies with relatively long observation periods. (625) Hursh et al. (1965) used periodic measurements of breath to estimate total-body retention of 222Rn following acute intake of 222Rn in water by two subjects on two occasions. In three of the four individual experiments, the radon was ingested 2 h after a normal light breakfast. In the fourth experiment, the radon was ingested 10 min after a heavy breakfast. Retention was longer in the fourth experiment than in the first three, presumably due to a longer retention time in the full stomach. Retention of radon in the subjects with an empty stomach could be expressed as a sum of three exponential terms corresponding to half-times of approximately 11 min (61%), 19 min (34%), and 3 h (5%). Retention in the subject with a full stomach could be expressed as a sum of three exponential terms corresponding to half-times of approximately 12 min (39%), 58 min (51%), and 5 h (10%). Hursh et al. (1965) interpreted the data as indicating that much of the ingested radon mixes with the stomach contents, diffuses out through the stomach wall into the splanchnic venous blood system, and passes through the liver and up into the right heart to the lungs, where much of the absorbed amount is rapidly lost in the expired air. Uptake of radon by systemic tissues was assumed to be divided mainly among three pools: liver, fat, and other. Fat was estimated to contain only a small portion of the systemic burden in the early minutes after intake, but a major portion after 2–3 h. (626) Suomela and Kahlos (1972) used external measurements of the 222Rn chain member 214Bi to estimate whole-body retention of radon in 10 healthy adult male subjects who ingested radon-rich water as a single intake. A single exponential function with biological half-time in the range 30–50 min was found to describe the elimination of 222Rn reasonably well in some cases over observation periods of up to approximately 6 h. In other cases, a second component with a half-time of 1.5–2 h was evident within the 6-h observation period. Suomela and Kahlos (1972) compared their findings with results from earlier studies of retention of 222Rn ingested in water by human subjects (Andersson and Nilsson, 1964; van Döbeln and Lindell, 1964; Hursh et al., 1965). The retention curves determined by Hursh et al. (1965) for a full and empty stomach bounded the retention curves determined in other studies over the first 6 h after intake. (627) Gosink et al. (1990) used breath measurements to estimate the rate of loss of 222Rn from a 51-year-old male subject (1.96 m, 112 kg) in different experiments involving consumption of water with a moderately high natural concentration of 222Rn. During a period of relatively high physical activity, the subject eliminated virtually all the ingested 222Rn during the first 4 h after intake. During mild activity, the biological half-time was 45–65 min. For a sedentary or sleeping period, a biological half-time was estimated as 11.2 h for a substantial portion of the ingested radon. For the sedentary case, the subject exhaled less than 3% of ingested 222Rn h−1 after the first hour. (628) Brown and Hess (1992) conducted 41 tests on 38 human subjects, aged 9–85 y, to measure elimination rates of 222Rn in expired breath following acute intake of 222Rn in drinking water. The levels of physical activity of the subjects ranged from inactive to marathon level. The percentage of elimination of 222Rn from the body during the first 30 min after intake ranged from 12% to 68%. The elimination rate showed a moderate correlation with the time passed since eating. Estimated retention half-times ranged from 17 to 400 min. (b) Inhalation of 222Rn and other inert gases by volunteers (629) In a series of experiments, Harley et al. (1951, 1994) studied the retention of inhaled radon by subjects following exposures to constant, elevated concentrations of radon in air for periods up to 8.5 h. Measurements of 222Rn in periodic breath samples after the end of exposure were used to infer the rate of loss of 222Rn from the body. Approximately the same peak total-body content of radon (∼850 Bq) was estimated following exposure for 8.5 h at an air concentration of 25.9 Bq L−1, and for 7 h at 22.2 Bq L−1, suggesting that saturation may have been approached. Following both the 7- and 8.5-h exposures, the activity remaining in the body at the end of exposure showed five distinct components of retention. In the more detailed study involving exposure for 8.5 h, approximately 8% of the total expired radon was removed with a half-time of 23 s, 9% with a half-time of 4.5 min, 18% with a half-time of 41 min, 32% with a half-time of 3.4 h, and 33% with a half-time of 18 h. These retention half-times are broadly similar to half-times observed in human subjects following inhalation of xenon or krypton (Ellis et al., 1977; Susskind et al., 1977). (630) Susskind et al. (1977) used in-vivo measurements to estimate retention of inhaled 127Xe in 12 human subjects. Five components of retention with average biological half-times of 21.7 s, 3.05 min, 0.40 h, 2.71 h, and 10.4 h were determined. The half-time of the slowest component of clearance ranged from 7.4 h to 17.0 h, and correlated highly with total body fat as a percentage of body weight (Fig. 12.1). The mean half-time (± standard deviation) of this component for five subjects with body fat representing less than one-third of total body weight was 8.4 ± 0.7 h. On average, the slowest component of clearance represented approximately 13% of the retained activity, excluding the rapid clearance represented by the retention components with half-times 21.7 s and 3.05 min. (631) Ellis et al. (1977) studied total-body retention of 79Kr in 16 subjects by whole-body external counting following a 10- or 30-min inhalation period. The retention data were resolved into a five-component exponential curve with average half-times of 21.5 s, 4.74 min, 0.33 h, 2.41 h, and 7.0 h. The last three retention components represented, on average, 61.7%, 29.6%, and 9.4% of the retained activity, excluding the rapid clearance represented by the retention components with half-times of 21.5 s and 4.74 min. The half-time of the long-term component ranged from approximately 4.2 h to 9.6 h, and correlated significantly with the estimated percentage of total body fat (Fig. 12.1). The mean half-time (± standard deviation) for six subjects with body fat representing less than one-third of body weight was 5.5 ± 0.7 h. (c) Loss of noble gases from the body other than by exhalation (632) Loss of radon or other noble gases through skin and in urine and faeces is expected to be small compared with loss by exhalation. Limited measurements of radon or its progeny in urine following ingestion of high levels of radon in drinking water indicated that urinary excretion did not represent a significant mode of loss (Hursh et al., 1965; Gosink et al., 1990). On the basis of a mechanistic biokinetic model of inert gases in the human body, Peterman and Perkins (1988) estimated that loss of xenon through the skin amounts to approximately 0.6% of its loss through the lungs.
12.3.3.2. Biokinetic model for systemic radon
(633) Compartmental biokinetic models have been developed for a number of inert gases, including radon, on the basis of physical laws governing transfer of a non-reactive and soluble gas between materials (Kety, 1951; Bell and Leach, 1982; Peterman and Perkins, 1988; Sharma et al., 1997; NAS, 1999; Khursheed, 2000; Yu and Kim, 2004). The biokinetic of such a gas are assumed to be determined by the blood-to-air partition coefficient and the blood perfusion rates, tissue-to-blood partition coefficients, and volumes of the tissues represented by the compartments of the model. As depicted in the standard modelling approach, an inert gas entering the lung air after inhalation or entering pulmonary blood after absorption from the gastrointestinal contents equilibrates instantly between lung air and pulmonary blood, with relative concentrations in the two pools determined by their volumes and blood-to-air partition coefficients. Gas retained in the pulmonary blood is distributed in arterial blood to tissues in proportion to the percentage of cardiac output received by each tissue. The transfer rate from a tissue to venous blood is determined by the blood perfusion rate, the volume of the compartment, and the tissue-to-blood partition coefficient. The gas is carried in the venous blood to the pulmonary blood. The cycle continues until the body burden is depleted due to exchange between pulmonary blood and lung air, and loss from the body in expired air. (634) For a given tissue, a set of differential equations can be derived by considerations of mass balance and equilibrium. As an example, consider a systemic tissue that receives blood from the arterial pool alone, and from which blood leaves solely in the venous stream. The rate of change of the activity of inert gas in a tissue is Fi (CB-A – CB-V), where Fi is the blood flow rate (L min−1) through the systemic tissue, CB-A is the activity gas concentration (Bq L−1) in non-pulmonary arterial blood, and CB-V is the activity gas concentration in non-pulmonary venous blood. In the standard modelling approach, it is assumed that the perfusion of the gas in tissues is instantaneous, allowing equilibrium to be achieved between venous blood and tissue such that CB-V = Ci/Pi, where Ci is the activity concentration of the gas in the tissue and Pi is the tissue-blood partition coefficient. Thus, for a given organ, the differential equation describing the rate of change of the activity of gas Qi in a tissue is: (635) A biokinetic model for systemic radon proposed by Leggett et al. (2013) is applied in this publication. The model is based largely on the theoretical considerations summarised above, but includes some empirical features and simplifications. The model was developed in two steps. First, a relatively detailed model structure and parameter values for radon were developed on the basis of the theoretical considerations described above. This initial version involved three blood compartments representing pulmonary, arterial, and venous blood, and 20 compartments representing systemic tissues. The model was then simplified by dividing blood into two compartments representing arterial and venous blood, and pooling several tissue compartments with broadly similar predictions of time-dependent radon concentrations. The simplified model was found to provide reasonably good approximations of data for human subjects exposed to elevated levels of radon by ingestion or inhalation. (636) The structure of the model used in this publication is shown in Fig. 12.2. Baseline transfer coefficients for the adult male are listed in Table 12.3. The basis for these transfer coefficients is described below. The reader is referred to Leggett et al. (2013) for a summary of sex differences in quantities such as blood flow rates and tissue volumes used to derive the transfer coefficients, and a tabulation of parameter values for adult females as well as adult males. (637) Blood is divided into arterial and venous blood (Blood-A and Blood-V, respectively). These compartments are assumed to represent 27% and 73%, respectively, of the total blood volume based on reference sizes of blood pools summarised in Publication 89 (ICRP, 2002). The reference total blood volume for the adult male is 5.3 L (ICRP, 2002). (638) Fat is represented as two compartments with equal volumes but different blood perfusion rates as a way of depicting the two phases of relatively long-term retention (several hours) observed in human subjects following inhalation of radon or radioisotopes of xenon or krypton. The blood perfusion rate of Fat 1 is assumed to be four times higher than that of Fat 2, which implies that the removal half-time from Fat 2 is four times greater than the removal half-time from Fat 1. (639) For continuous inhalation of radon, it is assumed that the activity concentration in RT-air rapidly reaches equilibrium with the activity concentration in the environment, Cenv. The transfer rate λ from RT-air to environment is assumed to be 2600 d−1 (t1/2 = 23 s), based on observed half-times for the rapid phase of exhalation of radon, xenon, or krypton by human subjects immediately after a period of continuous inhalation (Harley et al., 1951; Ellis et al., 1977; Susskind et al., 1977). The removal half-time presumably depends on the breathing rate, but it is assumed to be constant for dosimetric purposes. The rate at which activity enters the RT-air is assumed to be λ Cenv VRT-air (Bq d−1), where VRT-air is the average volume of the RT-air (3.858 L for the adult male) (ICRP, 1994b; Bailey et al., 1996). (640) It is assumed that the radon in RT-air diffuses to Blood-A rapidly, allowing the achievement of equilibrium between Blood-A and RT-air such that CB-A = CRT-air Pb-air, where Pb-air is the blood-to-air partition coefficient (Table 12.2), and CRT-air is the activity concentration in RT-air. On the basis of mass balance and equilibrium, the rate of change of activity in RT-air is given by:
(641) From Eq. (12.4), it can be seen that the transfer rate constant from Blood-V to RT-air is F/VB-V, and the transfer rate constant from RT-air to Blood-A is F Pb-air/VRT-air. (642) Radon ingested in drinking water or other material is transferred from stomach contents to small intestine contents at a material-specific stomach emptying rate. The default transfer coefficient from stomach contents to small intestine contents is the reference value for total diet (ICRP, 2002, 2006) (20.57 d−1 for the adult male). (643) Radon is transferred from small intestine contents to liver at the rate 5994 d−1. This corresponds to an absorption fraction of 0.999, based on a reference transfer coefficient of 6 d−1 from the small intestine contents to the right colon contents (ICRP, 2002, 2006). (644) With exceptions described later, derivations of transfer coefficients between systemic compartments are based on the blood flow rates, compartment volumes, and tissue-to-blood partition coefficients listed in Tables 12.2 and 12.4. The blood flow rates are taken from Publication 89 (2002). The compartment volumes are based on reference tissue masses for the adult male (ICRP, 2002), together with the following densities based on information summarised in Publication 23 (ICRP, 1975) and Publication 89 (ICRP, 2002): fat, 0.92 g cm−3; red marrow, 1 g cm−3; all other soft tissues, 1.04 g cm−3; and bone, 1.9 g cm−3. (645) The tissue-to-blood partition coefficients are based on estimates in Table 12.2. A rounded partition coefficient of 0.4 for ‘other’ is based on the value for skeletal muscle, which represents much of the volume of ‘other’. The density and tissue-to-blood partition coefficient for red marrow are based on reference masses of active marrow and total marrow (active + inactive) given in Publication 89 (ICRP, 2002), and the assumptions that red marrow is composed of 60% active marrow and 40% fat, and represents half the mass of total marrow. The tissue-to-blood partition coefficient for red marrow is derived as a mass-weighted average of the tissue-to-blood partition coefficients for fat and other: [0.4 × 11(fat)] + [0.6 × 0.4(other)]=4.6. The derived density of red bone marrow is (0.4 × 0.92 g cm−3) + (0.6 ×1.04 g cm−3) = 1 g cm−3. (646) The compartments and parameter values describing uptake and retention of radon by the breast are based on information on the female breast and extrapolated to the male breast as described below. Breast is divided into two compartments: Breast_g, representing glandular tissue of the breast; and Breast_a, representing the adipose tissue that makes up the rest of the breast. Breast_g and Breast_a are standard source regions in the dosimetric system used in the OIR series, and are assumed to represent 40% and 60%, respectively, of the mass of the breast. Fat is assumed to represent 80% of the mass of Breast_a, based on the typical fat content of adipose tissue in adults as estimated in Publication 89 (ICRP, 2002). The tissue-to-blood partition coefficient for Breast_a is derived as a mass-weighted average of the tissue-to-blood partition coefficients for fat and other: [0.8 × 11(fat)] + [0.2 × 0.4(other)]=8.9. Fat is assumed to represent 10% of the mass of Breast_g. This is based on the estimate by Ramsay et al. (2005) for lactating breasts that approximately 10% of the mass of glandular breast tissue is intraglandular fat, and the qualitative findings by Nickell and Skelton (2005) that there is a substantial amount of fat intermixed with the breast parenchyma, especially in overweight patients seeking breast reduction. The tissue-to-blood partition coefficient for Breast_g is derived as [0.1 × 11(fat)] + [0.9 × 0.4(other)]=1.5. Breast_g and Breast_a are assumed to receive 0.3% and 0.1%, respectively, of cardiac output in the adult female and 0.015% and 0.005%, respectively, in the adult male. These are rounded values based on the masses of these tissues, the relative blood perfusion rates of ‘other’ (as a surrogate for Breast_g) and fat (as a surrogate for Breast_a), a reference blood flow rate of 0.4% of cardiac output for total breast in adult females (ICRP, 2002), and scaling by mass to a blood flow rate of 0.02% of cardiac output for total breast in the adult male. (647) Radon gas depositing in bone is assigned to bone volume. Transfer coefficients from Blood-A to trabecular and cortical bone volume are based on the reference blood flow rates of 0.9% and 0.6% to trabecular and cortical bone, respectively, expressed as a percentage of cardiac output (ICRP, 2002). (648) The derivation of transfer coefficients is illustrated for the adult male. Radon is cleared from Blood-A at the rate 6.5 L min−1 × 1440 min d−1/1.431 L=6541 d−1, where 1.431 L = 0.27 × 5.3 L is the volume of Blood-A and 6.5 L min−1 is the reference value for cardiac output for the adult male (ICRP, 2002). Radon is transferred from Blood-V to lung air at the rate 6.5 L min−1 × 1440 min d−1/3.869 L = 2419 d−1, where 3.869 L = 0.73 × 5.3 L is the volume of Blood-V. The transfer coefficient from Blood-A to kidneys, for example, is 0.19 × 6541 d − 1 = 1243 d−1, where 0.19 is the fraction of cardiac output received by the kidneys in the adult male. The transfer coefficient from kidneys to Blood-V is 1440 min d−1 × 0.19 × 6.5 L min−1/(0.298 L × 0.7) = 8525 d−1, where 0.298 L is the volume of the kidneys and 0.7 is the kidney-to-blood partition coefficient. (649) Tissue compartments other than liver receive radon from Blood-A alone. In addition to Blood-A, liver receives a portion of outflow from ‘other’, representing radon that leaves the splanchnic tissues, as well as radon absorbed from the alimentary tract following its ingestion. The splanchnic tissues include spleen, pancreas, stomach, small intestine, and large intestine. Activity leaving tissue compartments is assigned to Blood-V, except that the portion of outflow from other representing outflow from splanchnic tissues is assigned to liver. The fraction of outflow from ‘other’ assigned to liver is 19/(19 + 46) = 19/65, based on estimated blood flows of 19% and 46%, respectively, of cardiac output through splanchnic and non-splanchnic tissues within ‘other’. (650) Fig. 12.3 compares model predictions derived from the baseline parameter values in Table 12.3 with observations of total-body retention in adult male subjects exposed acutely to elevated levels of 222Rn in drinking water. Two sets of predictions are shown, one based on relatively fast transfer of radon from the stomach to the small intestine (t1/2 = 15 min), and one based on relatively slow transfer (t1/2 = 1 h). The predicted total-body retention pattern based on a half-time of 15 min in the stomach is reasonably similar to the retention pattern observed for subjects who ingested radon 2 h after a light breakfast (Hursh et al., 1965). The predicted retention pattern based on a half-time of 1 h in the stomach is reasonably similar to the pattern observed by the same investigators for a subject who ingested radon 10 min after a heavy breakfast. (651) Fig. 12.4 compares model predictions with observations of the rate of exhalation of 222Rn by an adult male following exposure to a constant, elevated concentration (Cenv = 25.9 Bq L−1) of radon in a closed room for 8.5 h (Harley et al., 1951). The rate of exhalation of radon at the end of the 8.5-h exposure was 132 Bq min−1. This indicates a radon inhalation rate (Br Cenv) of 132 Bq min−1, and is consistent with the breathing rate (Br) of 5 L air min−1 estimated by Harley et al. A transfer rate λ of 2600 d−1 (1.8 min−1) from RT-air to environment is estimated from the fastest component (t1/2 = 23 s) of the exhalation rate of radon determined in the human study. The estimated volume of lung air involved in the radon exchange with blood is VL
-
air = Br/λ = 2.8 L. Based on a lung air volume of 2.8 L, the transfer coefficient from RT-air to Blood-A is F Pb-air/ VL-air = 1437 d−1, where F is cardiac output in blood volumes per day and Pb-air is the blood-to-air partition coefficient. This case-specific estimate of the transfer coefficient from RT-air to Blood-A was used in the model simulation in Fig. 12.4 rather than the baseline value 1043 d−1 listed in Table 12.3. All other model parameters were assigned their baseline values. A radon inhalation rate of 190,000 Bq d−1 (132 Bq min−1) was assumed. Comparison of model predictions and observations of total-body retention of radon following its ingestion in drinking water.


12.3.3.3. Treatment of radioactive progeny of systemic radon
(652) The radon isotopes addressed in this publication as parent radionuclides are 222Rn, 220Rn, and 219Rn. Their radioactive progeny considered in the determination of dose coefficients are isotopes of lead, polonium, bismuth, and thallium. The systemic models for these elements as radon progeny are modifications of their models as lead progeny, described in Section 9. The model structure for each element as a lead progeny is modified by adding four compartments represented explicitly in the systemic model for radon (Fig. 12.2): Fat 1, Fat 2, Breast_g, and Breast_a. Each of these compartments is assumed to exchange the element with its central blood compartment (plasma). For bismuth or lead, the added compartments are assumed to have been part of the intermediate-term compartment of other soft tissues (ST1) in the model for the element as a progeny of lead. For polonium or thallium, the added compartments are assumed to have been part of the single compartment representing remaining soft tissue (also called ‘ST1’ in the following) in the model for the element as a progeny of lead. For each of the four elements, the rate of transfer from plasma to an added compartment reflects the percentage of cardiac output received by the tissue relative to the portion of cardiac output received by all compartments of other soft tissues in the model for the element as a progeny of lead; the transfer coefficient from plasma to ST1 is reduced by the sum of the transfer coefficients from plasma to the added compartments; and the removal half-time from each added compartment to plasma is the removal half-time from ST1 to plasma. (653) For bismuth, the transfer coefficients from plasma to the added compartments are 0.2 d−1 for Fat 1, 0.05 d−1 for Fat 2, 0.0009 d−1 for Breast_g, and 0.0003 d−1 for Breast_a, and the removal half-time from each of these compartments to plasma is 20 d. For lead, the transfer coefficients from plasma to the added compartments are 0.04 d−1 for Fat 1, 0.01 d−1 for Fat 2, 0.00015 d−1 for Breast_g, and 0.00005 d−1 for Breast_a, and the removal half-time from each of these compartments to plasma is 166.6 d. For polonium, the transfer coefficients from plasma to the added compartments are 2.1 d−1 for Fat 1, 0.52 d−1 for Fat 2, 0.0075 d−1 for Breast_g, and 0.0025 d−1 for Breast_a, and the removal half-time from each of these compartments to plasma is 7 d. For thallium, the transfer coefficients from plasma to the added compartments are 8.4 d−1 for Fat 1, 2.1 d−1 for Fat 2, 0.03 d−1 for Breast_g, and 0.01 d−1 for Breast_a, and the removal half-time from each of these compartments to plasma is 6.65 h (transfer coefficient 2.5 d−1). (654) A radon progeny produced in RT-air is assumed to be exhaled at the rate 1000 d−1. A radon progeny produced in compartment Blood-A or Blood-V in the radon model is assumed to transfer to plasma in the progeny model at the rate 1000 d−1.
12.4. Individual monitoring
(655) Radon and thoron monitoring programmes generally involve continuous air area monitoring of 222Rn, 222Rn progeny, or 220Rn progeny. Personal air samplers for 222Rn progeny or 220Rn progeny may also be used. Monitoring strategies and methods have been discussed in detail by the International Commission of Radiation Units and Measurements (ICRU, 2012). (656) In-vivo measurements of 210Pb in bone (skull and knee) have been used to retrospectively estimate the integrated exposures of miners to 222Rn and their progeny over several years (Scheler et al., 1998; Guilmette et al., 2000; Dantas et al., 2006, 2007). In general, such measurements are not recommended as radon exposure estimates because they are difficult to interpret, and the incorporated 210Pb could have originated from sources other than inhaled radon progeny (European Commission, 2016). However, they can be used as an indicator of high radon exposures. Polonium may also be measured in urine samples for screening as an indication of radon progeny exposure (Azeredo and Lipsztein, 1991; Lipsztein et al., 2001). Comparison of model predictions and observations of the exhalation rate of radon following continuous exposure to a high concentration of radon in air for 8.5 h.

12.5. Dosimetric data for radon
12.5.1. Ingestion of radon gas
(657) Equivalent doses to organs per activity of 222Rn ingested are given in the accompanying electronic annex. The effective dose per intake of ingested 222Rn is 6.9E-10 Sv per Bq.
12.5.2. Inhalation of radon gas
(658) The equilibrium effective dose rate for continuous chronic exposure to unit concentration of 222Rn is 1.8E-7 Sv per Bq h m−3 (Table 12.5). In other words, this is the effective dose rate following chronic exposure to unit concentration of radon after the radon concentration in organs and tissues has reached saturation (i.e. equilibrium). (659) The effective dose coefficients in terms of Sv Bq−1 intake of radon gas are also given in Table 12.5 and the corresponding equivalent doses to organs are given in the accompanying electronic annex. These values can be converted to effective dose per exposure (Sv per Bq h m−3) by multiplying the Sv Bq−1 value by (λ × VRT-air × 1/24), where λ is the transfer coefficient from the environment to RT-air (2600 d−1) in the radon gas biokinetic model (Table 12.3), and VRT-air (m3) is the average volume of RT-air (3.858 × 10⁻³ m3 for an adult male; ICRP, 1994b; Bailey et al., 1996).
12.5.3. Effective dose coefficients for inhaled 222Rn and 220Rn progeny
(660) Table 12.6 lists effective dose coefficients (Sv Bq−1) for inhalation of individual short-lived radon (222Rn or 220Rn) progeny. Values are calculated for each mode of the assumed aerosol distribution for indoor workplaces, mines, and tourist caves, characteristics of which are given in Tables A.3 and A.4 of Annex A. The corresponding regional distributions in the ICRP Human Respiratory Tract Model for each mode are given in Tables A.6 and A.8 of Annex A. The progeny addressed in Table 12.6 are those that generally dominate the estimated lung dose and effective dose from exposure to radon and accompanying progeny. The tabulated values can be used to calculate values of effective dose per potential alpha energy exposure by applying Eqs. (A.5) and (A.6) of Annex A. (661) Table 12.7 provides values of effective dose for inhalation of 222Rn gas with its short-lived progeny and 220Rn progeny, expressed in units of mSv WLM−1, mSv per mJ h m−3, and mSv per Bq h m−3. Further details of the calculations of doses from 222Rn and 220Rn progeny are given in Annex A (see Table A.11).
(662) The calculations for 222Rn gas and progeny assume an equilibrium factor (F) of 0.4 for indoor workplaces and tourist caves, and an F value of 0.2 for mines. In general, it is the inhalation of the airborne radon progeny rather than the inhalation of the radon gas that dominates the lung dose and the effective dose. The dose from inhaling radon gas is only a small component of the total effective dose; less than 2% and 5% for indoor workplaces and mines, respectively. Inhalation of 220Rn gas makes a negligible contribution to doses; tabulated values are for 220Rn progeny alone.
12.6. Use of dosimetric data for radon
(663) Publication 65 (ICRP, 1993) provided an epidemiologically based dose conversion convention, with a value of 1.4 mSv per mJ h m−3 (5 mSv WLM−1) for workers. In Publication 115 (ICRP, 2010), more recent epidemiological data were reviewed, focusing on results for lower levels of exposure in mines, and a revision of the detriment adjusted nominal risk coefficient for a mixed adult population of smokers and non-smokers was proposed, from 8 × 10⁻⁵ per mJ h m−3 to 1.4 × 10⁻⁴ per mJ h m−3 (from 2.8 × 10⁻⁴ WLM−1 to 5 × 10⁻⁴ WLM−1). Comparisons of lung cancer risks for residential exposures with estimates derived for miners showed good agreement. A more recent study of a large cohort of German uranium miners showed lower but broadly consistent results for lung cancer risks at lower levels of exposure (Kreuzer et al., 2015). (664) The Statement on Radon included in Publication 115 (ICRP, 2010) adopted the revised nominal risk coefficient of 1.4 × 10⁻⁴ per mJ h m−3 (5 × 10⁻⁴ WLM−1). The statement further indicated the Commission’s intention to apply the same approach to intakes of radon and its progeny as for other radionuclides, and to provide dosimetrically based coefficients. (665) Using the revised nominal risk coefficient of 1.4 × 10⁻⁴ per mJ h m−3 (5 × 10⁻⁴ WLM−1), and Publication 103 (ICRP, 2007) detriment values, a dose conversion convention value of 3.3 mSv per mJ h m−3 (12 mSv WLM−1) for adults is obtained (Marsh et al., 2010). The dose coefficients for inhalation of radon and progeny, calculated using biokinetic and dosimetric models using the average breathing rate for a reference worker, are 3.3 mSv per mJ h m−3 (12 mSv WLM−1) for mines, 5.7 mSv per mJ h m−3 (20 mSv WLM−1) for indoor workplaces, and 6.7 mSv per mJ h m−3 (24 mSv WLM−1) for the specific case of tourist caves (Table 12.7). In these calculations, the reference worker is assumed to spend two-thirds of the time in exercise. Using a more realistic breathing rate for sedentary occupations such as office workers gives a dose coefficient of 4 mSv per mJ h m−3 (approximately 14 mSv WLM−1) (Harrison and Marsh, 2012). Using the same methodology, the dose coefficient for exposure in homes has been calculated as 3.7 mSv per mJ h m−3 (13 mSv WLM−1) (Marsh and Bailey, 2013).
12.7. Recommendations
(666) The present situation is a remarkable consistency between coefficients obtained by dosimetric calculations and conversion coefficients based on epidemiological comparisons. Noting that inhaled 222Rn and progeny is a special case for which there is good epidemiology as well as dosimetry, and taking account of the two methods of calculation of dose coefficients with their associated uncertainties, the Commission recommends the following rounded dose coefficients. (667) For the calculation of doses following inhalation of radon and radon progeny in underground mines and in buildings, in most circumstances, the Commission recommends a dose coefficient of 3 mSv per mJ h m−3 (approximately 10 mSv WLM−1). The Commission considers this dose coefficient to be applicable to the majority of circumstances with no adjustment for aerosol characteristics. (668) However, for indoor workplaces where workers are engaged in substantial physical activities, and for workers in tourist caves, the Commission recommends a dose coefficient of 6 mSv per mJ h m−3 (approximately 20 mSv WLM−1). (669) In cases where aerosol characteristics are significantly different from typical conditions, sufficient, reliable aerosol data are available, and estimated doses warrant more detailed consideration, it is possible to calculate site-specific dose coefficients using the data provided in Annex A and the accompanying electronic annex (see Annex A for further details). (670) Dose coefficients for the inhalation of thoron (220Rn) progeny are given for two situations of exposure: indoor workplaces and mines (Table 12.7). On the basis of these calculations, it is recommended that a single rounded value of 1.5 mSv per mJ h m−3 (5 mSv WLM−1) is used for all situations of occupational exposure. This dose coefficient is considered to be applicable to the majority of circumstances with no adjustment for aerosol characteristics. As in the case of inhalation of radon progeny, if sufficient, reliable aerosol data are available and estimated doses warrant more detailed consideration, calculation of site-specific dose coefficients can be carried out using the dosimetric data provided in Annex A and the accompanying electronic annex (see Annex A for further details).
12.8. References
13. RADIUM (Z = 88)
13.1. Chemical forms in the workplace
(671) Radium is an alkaline earth element that occurs mainly in oxidation state II. It is a chemical analogue of calcium and barium. Chemical and physical forms encountered in industry include oxides, nitrates, chlorides, sulphates, and luminising residues. Radium can be found in trace amounts in uranium ores. A mixture of radium and beryllium is used as a neutron source. 224Ra, 226Ra, and 228Ra are the isotopes of radium most commonly encountered in workplaces. 223Ra is currently under investigation for use in medicine as a treatment for bone metastases.
13.2. Routes of intake
13.2.1. Inhalation
(672) Several studies have been reported on the behaviour of inhaled radium in human subjects following accidental intake, especially of the sulphate, which was used in powder form in gamma-ray sources. However, it is difficult to estimate the contribution of absorption to lung clearance in such cases because the systemic excretion of radium is predominantly by the faecal route. Information on absorption from the respiratory tract is available from experimental studies of radium as nitrate or in fly ash.
Lung content and daily urinary and faecal excretion of 226Ra following inhalation of 1 Bq Type F. (673) Absorption parameter values and types, and associated fA values for particulate forms of radium are given in Table 13.2.

13.2.1.1. Particulate materials
(a) Radium nitrate (Ra(NO3)2) (674) Following administration of 232UO2(NO3)2 with its progeny radionuclides to rats by intratracheal instillation (Ballou et al., 1986), approximately 3% of the 224Ra present was retained in the lungs after 1 d, consistent with assignment to Type F (for further information, see Section 15.2.1). (675) Following administration of Ra(NO3)2 (alone or with thorium nitrate) to rats by intratracheal instillation (Moody and Stradling 1992; Moody et al., 1994), approximately 14% ILD was retained in the lungs after 6 h and approximately 5% ILD after 1 or 7 d. From the results, it was assessed here (i.e. by the Task Group) that fr was approximately 0.95 and sr was approximately 10 d−1, but it was not possible to estimate ss. (676) Based on the results of the experiments outlined above, specific absorption parameter values for radium nitrate were estimated here to be fr = 1 and sr = 10 d−1 (consistent with assignment to default Type F). However, although specific parameter values for radium nitrate based on in-vivo data are available, they are not adopted here because inhalation exposure to radium nitrate is unlikely. Instead, radium nitrate is assigned to Type F. However, the data are used as the basis for the default rapid dissolution rate for radium. Hence, specific parameter values for radium nitrate would be the same as default Type F radium parameter values. (b) Radium sulphate (RaSO4) (677) Marinelli et al. (1953) reported measurements on six people following accidental inhalation of a mixture of radium and barium sulphates, resulting from rupture of a capsule. The observed lung retention half-time of 120 d suggested that the material was relatively insoluble. Looney and Archer (1956) reported measurements on two men, also following the inhalation of a mixture of radium and barium sulphates from a damaged source. The results from both studies are difficult to interpret. (c) Coal fly ash (678) Kalkwarf et al. (1984) measured the in-vitro dissolution of radionuclides in 11 samples of coal fly ash (three to five size fractions from three sources). Less than 0.2% of the 226Ra present dissolved during the 60 d, indicating Type S behaviour. (d) Uranium ore dust (679) Duport et al. (1991) measured the dissolution in simulated lung fluid of long-lived radionuclides in uranium ore dust from Canadian mines (for further information, see Sections 15.2.1.1 (Part m) and 15.2.1.2). For high-grade ore, measurements were made for up to 60 d. Results were presented as undissolved fractions as functions of time, and showed two components which were expressed as Class D (rapid) and Class Y (slow) fractions. For 226Ra, the rapidly dissolved fraction was 0.12. HRTM parameter values fitted to the 210Pb data by Marsh et al. (2012) were fr = 0.11, sr = 7.3 d−1, and ss = 4 × 10⁻⁴ d−1, indicating assignment to Type M. For 226Ra, no effects of size were observed in total dissolution over 40 d for particles in size ranges 7–10, 3–7, 1–3, and less than 1 µm. For low- and medium-grade ores, measurements were made for 12 d, but only on samples of relatively coarse dust, the smallest fraction being less than 37 µm. For 226Ra, rapidly dissolved fractions were lower (0.07), indicating assignment to Type S. (e) Other compounds (680) In another case of human inhalation, Toohey et al. (1984) reported a lung retention half-time of 120 d. However, the radium compound was unknown (radium-contaminated dust from grinding old rubber liners from ion-exchange tanks). It was considered by the authors to be insoluble because the amount recovered in faecal excretion corresponded closely to the amount clearing from the lungs.
13.2.1.2. Progeny radionuclides of radium formed in the respiratory tract
(681) The general approach to treatment of progeny radionuclides formed in the respiratory tract is described in OIR Part 1, Section 3.2.3. and Annex A (ICRP, 2015). In summary, it is expected that the rate at which a particle dissociates is generally determined by its matrix, and hence the physico-chemical form of the inhaled material. It is recognised that nuclei formed by alpha decay within a particle matrix may be expelled from it into the surrounding medium by recoil, but to implement this routinely would add greatly to the complexity of calculations. It is expected that the behaviour of soluble (e.g. Type F) material in the respiratory tract would depend on its elemental form (i.e. that of the progeny radionuclide). Nevertheless, for simplicity, in the OIR series, the absorption parameter values of the parent are, by default, applied to all members of the decay chain formed in the respiratory tract. Exceptions are made for noble gases formed as progeny radionuclides, which are assumed to escape from the body directly, in addition to other routes of removal. For calculation purposes, it is assumed that radon formed as a progeny within the respiratory tract escapes from the body at a rate of 100 d−1, in addition to other routes of removal [for further information, see OIR Part 1, Section 3.2.3 (ICRP, 2015) and Section 14.2.1.2 in this publication]. (682) For decay schemes of radium isotopes in the natural decay series, including 223Ra, 224Ra, 226Ra, and 228Ra, see Annex A, Figs. A.1–A.3. (683) Studies specifically comparing the behaviour of radium with that of its progeny radionuclides (lead, bismuth, and thallium isotopes) are summarised here (for further information, see Sections 9.2.1 and 10.2.1). (684) Studies relating to the loss from the body (emanation) of radon formed in the respiratory tract are summarised in Section 14.2.1.2, even though radium is its immediate predecessor. It was considered useful to have the relevant information in one place, and to avoid repetition. The most important practical application of radon emanation is measurement of exhaled 220Rn to assess intakes of relatively insoluble thorium (thoron-in-breath measurements), and most studies investigating radon formed in the respiratory tract involved thorium deposited in the lungs. (685) Ballou et al. (1986) measured lung retention and tissue distribution of 232U, 228Th, 224Ra, 212Pb, 212Bi, and 208Tl at 24 h after intratracheal instillation into rats of 232U nitrate with its progeny radionuclides (for further information, see Section 15.2.1). As noted above, for 224Ra, approximately 3% ILD was retained in the lungs at 24 h. For the first descendant measured, 212Pb, approximately 2.1% ILD was measured in the lungs; correcting for the physical decay of 212Pb gives retention of 10% ILD at 24 h. However, measurements of 212Pb are difficult to interpret, being partly of material administered with the parent 224Ra, and partly formed from its decay in the lungs. Furthermore, the 212Pb measured could have been higher than that present in vivo because of ingrowth of 212Pb between dissection and measurement. If not due to ingrowth, the greater fractional retention of lead could reflect its slower absorption than that of radium observed when administered separately. (686) As described in Section 9.2.1, measurements have been made of the tissue distributions of 212Pb and its progeny radionuclides, 212Bi and 208Tl, following administration to rats of 228Th in various chemical forms (nitrate, hydroxide, fluoride, dioxide) in equilibrium with its progeny radionuclides. These included 224Ra, but it was not measured. In all these studies, the distributions of 212Bi and 208Tl were similar to each other and those of the parent 212Pb. In the study of thorium nitrate (Moody and Stradling, 1992; Moody et al., 1994), a complementary study was carried out with 226Ra [see Section 13.2.1.1 (Part a)]. For 212Pb, on average, 8.4% ILD was measured in the lungs at 6 h and 1.2% ILD at 1 d (clearance was much faster than that of 228Th). Correcting for the physical decay of 212Pb gives retention of 12.5% ILD at 6 h and 5.6% ILD at 1 d. This is similar to that found for 226Ra (see above), suggesting similar overall clearance of radium and lead over this period.
13.2.1.3. Rapid dissolution rate for radium
(687) From the results of studies with radium nitrate outlined above, the value of sr was assessed to be approximately 10 d−1, which is applied here to all Type F forms of radium.
13.2.1.4. Extent of binding of radium to the respiratory tract
(688) Evidence from the radium nitrate studies outlined above suggests that there is probably little binding of radium. It is therefore assumed that the bound state can be neglected for radium (i.e. fb = 0.0).
13.2.2. Ingestion
(689) Radium is a good chemical analogue of barium and calcium, and its absorption depends on its chemical form. Factors affecting absorption of radium are various. It seems that aging significantly decreases radium absorption by a factor of 2–4 compared with adults (Taylor et al., 1962), whereas fasting and low calcium intake increases its absorption (Taylor et al., 1962; Della Rosa et al., 1967). (690) Data from balance studies reviewed by the ICRP Task Group on Alkaline Earth Metabolism in Adult Man (ICRP, 1973) indicated the fraction of radium absorbed from food or drinking water to be between 0.15 and 0.21. Results from a study of a single human volunteer who ingested 0.05 mg radium suggested that approximately 25–35% of the ingested amount remained in the body at 5–6 d (Seil et al., 1915). Normal elderly subjects ingesting mock radium dial paint containing 224RaSO4 absorbed an average of approximately 0.2 (Maletskos et al., 1966, 1969). (691) In Publication 30 (ICRP, 1979), an absorption value of 0.2 was adopted and that was also applied to dietary intakes in Publication 67 (1993). An fA value of 0.2 is used in this publication for all forms of radium.
13.2.3. Systemic distribution, retention, and excretion
13.2.3.1. Biokinetic database
(692) The alkaline earth element radium is a physiological analogue of the alkaline earth elements calcium, strontium, and barium but has different biokinetic from those elements due to discrimination by biological membranes and hydroxyapatite crystals of bone. The biokinetic of radium resemble those of barium much more closely than those of calcium or strontium. (693) Retention and distribution of radium have been determined in a number of persons who were briefly exposed to radium isotopes (ICRP, 1973, 1993; Leggett, 1992). There is also extensive information on the biokinetic of radium in laboratory animals, particularly dogs (Leggett, 1992; ICRP, 1993). Data for human subjects and laboratory animals used in the development of the model are summarised below in the discussion of the basis for parameter values.
13.2.3.2. Biokinetic model for systemic radium
(a) Structure of the model (694) The model for systemic radium applied in this publication is a modification of the model adopted in Publication 67 (ICRP, 1993). In the earlier version of the model, the liver was represented as a single compartment, and the kidneys were not depicted explicitly but were included as part of other soft tissues. In the present version, the kidneys are also depicted explicitly, and both the liver and kidneys are modelled as two compartments representing relatively fast and relatively slow loss of radium. (695) The structure of the present model is shown in Fig. 13.1. Blood plasma (‘blood’ in Fig. 13.1) is treated as a uniformly mixed pool that contains all radium in blood, exchanges activity with soft tissues and bone surfaces, and loses activity to urinary and faecal excretion pathways. Soft tissues are divided into compartments representing two phases of loss from the liver, two phases of loss from the kidneys, and three phases of loss from remaining soft tissues. Bone is divided into cortical and trabecular bone. Each of these bone types is further divided into bone surfaces and bone volume. Bone volume is viewed as consisting of two pools: one that exchanges with activity in bone surfaces over a period of months, and one non-exchangeable pool from which activity is removed only by bone-restructuring processes. Activity depositing in the skeleton is assigned to bone surfaces. Over a period of days, a portion of the activity on bone surfaces moves to exchangeable bone volume and the rest returns to plasma. Activity leaving exchangeable bone volume is divided between bone surfaces and non-exchangeable bone volume. The assigned rate of removal from non-exchangeable bone volume is the reference rate of bone turnover for trabecular or cortical bone. (b) Parameter values (696) Retention and distribution of radium have been determined in a number of persons who were briefly exposed to radium isotopes (Schlundt et al., 1933; Norris et al., 1955; Mays et al., 1962, 1963; Miller and Finkel, 1965; Harrison et al., 1967; ICRP, 1973; Parks et al., 1978; Harrison, 1981; Schlenker et al., 1982; Parks and Keane, 1983; Keane and Schlenker, 1987). These data can be supplemented with extensive biokinetic data for radium in beagles (Wood et al., 1970; Lloyd et al., 1976a,b, 1982, 1983a,b,c,d; Parks et al., 1978) and with human and beagle data for barium, a chemical and physiological analogue of radium. In extrapolation of data from beagles to man, consideration must be given to the relatively low rate of faecal excretion of heavy alkaline earths in beagles (Van Dilla et al., 1958; Della Rosa et al., 1967; Cuddihy and Griffith, 1972) compared with human subjects (Harrison et al., 1967; Newton et al., 1991). (697) Kinetic analysis of plasma disappearance curves for normal subjects injected intravenously with radioisotopes of calcium, strontium, barium, or radium indicates that these elements initially leave plasma at a rate of several hundred plasma volumes per day, and equilibrate rapidly with an extravascular pool approximately three times the size of the plasma pool. Total transfer rates from plasma of 70 d−1 yield reasonable fits to plasma disappearance curves for radium and barium at times greater than 1–2 h after injection (Leggett, 1992). The rapid early removal from plasma is not depicted in this model. (698) Soft tissues apparently contain a substantial portion of systemic radium for a period of days or weeks after its uptake to blood (Hursh and Lovaas, 1963; Atherton et al., 1965; Harrison et al., 1967; Hardy et al., 1969; Schlenker et al., 1982; Qiyue et al., 1988). Based on a review of data on 226Ra in human soft tissues, Schlenker et al. (1982) estimated that soft tissue retention rises to approximately 58% of whole-body retention at 18 d after single intake, and then falls steadily to 33% at 100 d and 6% at 1000 d. These estimates relied on assumptions and features of the ICRP’s alkaline earth model introduced in the 1970s (ICRP, 1973). A model-free fitting procedure would yield somewhat lower estimates at early times. Harrison et al. (1967) inferred from measurements on a human subject receiving 223Ra by intravenous injection that extracellular fluids of soft tissues of man contain approximately one-quarter of administered radium at 24 h. In adult beagles, soft tissues contained approximately 62% of the total-body burden of intravenously injected 224Ra at 1 h, 29% at 1 d, and 12% at 7 d (Lloyd et al., 1982). The liver and kidneys contained, on average, approximately one-third of the total 226Ra in soft tissues from 7 to 1190 d after its intravenous administration to adult beagles (Atherton et al., 1965). (699) Autopsy measurements of environmental 226Ra in adult humans indicate that soft tissues contain 10–30% of total-body 226Ra (Hursh and Lovaas, 1963; Rajewsky et al., 1965; Maletskos et al., 1969; ICRP, 1973; Qiyue et al., 1988). These estimates have been based on means or pooled samples for several subjects, which may give misleading results since measured 226Ra concentrations are likely to be distributed asymmetically in the population. Using median values of 226Ra to calcium ratios obtained from the literature, Schlenker et al. (1982) estimated that soft tissues contain 5.5–6% of the natural 226Ra in the total body. (700) In the present model, fractional deposition of radium in the fast-turnover soft tissue compartment ST0 is determined as the balance after other deposition fractions have been assigned. As discussed below, deposition fractions of 0.25 for bone, 0.05 for intermediate-turnover soft tissues (ST1), 0.001 for slow-turnover soft tissues (ST2), 0.06 for liver, 0.02 for kidneys, and 0.32 for excretion pathways are assigned to radium, leaving 0.299 for ST0. The derived transfer rate from plasma to ST0 is 0.299 × 70 d−1 = 20.93 d−1. Based on the assumed relative amounts of radium in ST0 and plasma, the transfer rate from ST0 to plasma is set at one-third of the transfer rate from plasma to ST0, or 6.98 d−1. (701) The biokinetic of radium in the liver are modelled on the basis of observations of the behaviour of 224Ra and 226Ra in adult beagle dogs (Glad et al., 1960; Atherton et al., 1965; Lloyd et al., 1982). The liver consists of compartments Liver 1 and Liver 2 with fast and slow turnover, respectively. It is assumed that 6% of outflow from blood deposits in Liver 1 and is removed from Liver 1 with a half-time of 1 d, with 99.7% returning to blood and 0.3% moving to Liver 2. Radium transfers from Liver 2 to blood with a half-time of 1 y. These assumptions yield the following transfer coefficients: blood to Liver 1, 0.06 × 70 d−1 = 4.2 d−1; Liver 1 to blood, 0.997 × (ln(2)/1 d) = 0.691 d−1; Liver 1 to Liver 2, 0.003 × (ln(2)/ 1 d) = 0.00208 d−1; and Liver 2 to blood, ln(2)/365 d = 0.0019 d−1. (702) The biokinetic of radium in the kidneys are also based on data for adult beagle dogs (Glad et al., 1960; Atherton et al., 1965; Lloyd et al., 1982). The kidneys are divided into compartments Kidneys 1 and Kidneys 2 with fast and slow turnover, respectively. It is assumed that 2% of outflow from blood deposits in Kidneys 1 and is removed from Kidneys 1 with a half-time of 8 h, with 99.7% returning to plasma and 0.3% moving to Kidneys 2. Radium transfers from Kidneys 2 to plasma with a half-time of 1 y. These assumptions yield the following transfer coefficients: blood to Kidneys 1, 0.02 × 70 d−1 = 1.4 d−1; Kidneys 1 to blood, 0.997 × (ln(2)/0.3333 d) = 2.073 d−1; Kidneys 1 to Kidneys 2, 0.003 × (ln(2)/0.3333 d) = 0.00624 d−1; and Kidneys 2 to blood, ln(2)/365 d = 0.0019 d−1. (703) It is assumed that 5% of outflow from blood deposits in the intermediate-term soft tissue compartment ST1, and that activity returns from ST1 to blood with a half-time of 1 d. The implied transfer coefficients are blood to ST1 = 0.05 × 70 d−1 = 3.5 d−1and ST1 to blood = ln(2)/1 d = 0.693 d−1. (704) The removal half-time from the long-term soft tissue compartment ST2 to blood is assumed to be 5 y, the same as applied in the models for calcium, strontium, and barium. Fractional deposition of radium in ST2 is set to yield reasonable agreement with autopsy data for persons exposed over a short period to relatively high levels of 226Ra, and persons exposed over their lifetimes only to natural levels of 226Ra (Schlenker et al., 1982). It is assumed that 0.1% of radium leaving blood enters ST2. The derived transfer rate from blood to ST2 is 0.001 × 70 d−1 = 0.07 d−1, and from ST2 to blood is ln(2)/5 y = 0.00038 d−1. (705) Data from human and animal studies indicate that the rate of loss of alkaline earth elements from bone over the first few months after injection increases in the order calcium < strontium < barium < radium, and fractional long-term retention increases in the reverse order. Some element-specific parameter values are required to account for these differences, but most of the parameter values describing bone kinetics are generic (i.e. the same for each of these alkaline earth elements). The basis for applying generic values is discussed in OIR Part 2, Sections 6 and 10 (ICRP, 2016). Essentially, kinetic analysis of whole-body retention data for humans and more direct examination of alkaline earth kinetics in laboratory animals do not reveal distinct differences between these elements with regard to the following: early accumulation in bone as a fraction of activity reaching blood; initial division between trabecular and cortical bone; early rate of loss from bone, interpreted for the purposes of the present model as transfer from bone surfaces to plasma; the fraction subject to intermediate-term retention in bone, interpreted as transfer from bone surfaces to exchangeable bone volume; and the rate of removal from bone at times remote from uptake, interpreted as removal of non-exchangeable activity due to bone resorption. The following generic parameter values are applied [see OIR Part 2, Sections 6 and 10 (ICRP, 2016)]: fractional deposition in bone = 0.25; fractional deposition in trabecular bone=1.25 times that on cortical bone; half-time on bone surfaces = 1 d, with five-sixths transferring to plasma and one-sixth to exchangeable bone volume; and removal rate from non-exchangeable trabecular and cortical bone volume = 18% and 3% y−1, respectively. The transfer rates for radium derived from these generic parameter values are as follows: blood to trabecular bone surfaces = (1.25/2.25) × 0.25 × 70 d−1 = 9.72 d−1; blood to cortical bone surfaces = (1/2.25) × 0.25 × 70 d − 1 = 7.78 d−1; trabecular or cortical bone surfaces to the corresponding exchangeable bone volume compartment = (1/6) × ln(2)/1 d = 0.116 d−1; trabecular or cortical bone surfaces to blood = (5/6) × ln(2)/1 d = 0.578 d−1; trabecular bone volume to blood = 0.000493 d−1; and non-exchangeable cortical bone volume to plasma = 0.0000821 d−1. (706) Observed differences in the behaviour of alkaline earth elements in bone are accounted for by differences in the rate of removal from the exchangeable bone volume compartments and the fraction transferred from exchangeable to non-exchangeable bone volume. It is assumed, in effect, that calcium, strontium, barium, and radium are all equally likely to become temporarily incorporated in bone mineral after injection into blood, but that the likelihood of reaching a non-exchangeable site in bone crystal decreases in the order calcium > strontium > barium > radium. Fractional transfers of calcium, strontium, barium, and radium from exchangeable to non-exchangeable bone volume are set at 0.6, 0.5, 0.3, and 0.2, respectively, and the balance is assumed to return to bone surfaces. The removal half-times from exchangeable bone volume are set at 100 d, 80 d, 50 d, and 30 d, respectively. These values are set to achieve reasonable consistency with whole-body retention curves for humans injected with radioisotopes of the alkaline earth elements (e.g. Harrison et al., 1967; Newton et al., 1977, 1991; Harrison, 1981). The assumed fractional transfers to non-exchangeable bone volume are also reasonably consistent with results of in-vitro measurements. For example, under conditions approximating physiological, Neuman (1964) found that calcium incorporated into forming hydroxyapatite crystals is 65% non-exchangeable, and Stark (1968) determined discrimination factors relative to calcium of 0.93 for strontium, 0.56 for barium, and 0.32 for radium in forming crystals. Such in-vitro results have varied, to some extent, with experimental conditions, length of aging of the crystals, and the definition of discrimination (Neuman, 1964; Stark, 1968). (707) For radium, the above estimates of the removal half-time from exchangeable bone volume and the fractional transfers to non-exchangeable bone volume and bone surfaces yield the following transfer rates: exchangeable to non-exchangeable bone volume (cortical or trabecular) = 0.2 × ln(2)/30 d = 0.0046 d−1; and exchangeable bone volume to bone surfaces = 0.8 × ln(2)/30 d = 0.0185 d−1. (708) Based on estimates from human studies (Looney et al., 1956; Schales, 1964; Harrison et al., 1967; Maletskos et al., 1969; Newton et al., 1991), it is estimated that 32% of radium leaving plasma is deposited in excretion pathways, and that the ratio of urinary to faecal excretion is 1:36. The derived transfer rate from blood to urinary bladder contents is 0.606 d−1, and from blood to the right colon contents is 21.79 d−1.
Model for systemic radium used in this publication. Exch, exchangeable; nonexch, non-exchangeable; GI, gastrointestinal. ST0, ST1, and ST2 represent soft tissues with fast, intermediate, and slow turnover, respectively. (709) The transfer coefficients of the model for systemic radium in the worker are summarised in Table 13.3.

13.2.3.3. Treatment of radioactive progeny
(a) Dosimetrically significant progeny of radium (710) The radioactive progeny of radium isotopes addressed in the derivation of dose coefficients for radium isotopes are isotopes of radon, polonium, lead, bismuth, thallium, actinium, thorium, radium, francium, and astatine. Systemic models for these elements as radium progeny are summarised below. (b) Radon (711) A generic model structure is applied in the OIR series to radon, xenon, and krypton produced in systemic compartments by decay of a parent radionuclide. These gases are assigned the model for transfer of radon from bone to blood introduced in Publication 67 (ICRP, 1993), but are assigned element-specific rates of transfer from soft tissues to blood. Specifically, radon, xenon, or krypton produced in non-exchangeable bone volume, exchangeable bone volume, or bone surfaces transfers to blood at the rate 0.36 d−1, 1.5 d−1, or 100 d−1, respectively. Radon produced in a soft tissue compartment transfers to blood with a half-time of 30 min, compared with a half-time of 20 min for xenon and 15 min for krypton. Radon, xenon, or krypton produced in blood or entering blood after its production in a systemic compartment is removed from the body (exhaled) at the rate 1000 d−1, corresponding to a half-time of 1 min. (c) Thallium, lead, bismuth, and polonium (712) The models for thallium, lead, bismuth, and polonium produced in vivo following intake of radium are modifications of their systemic models as progeny of lead, described in Section 9. For each of these four elements, the red marrow compartment is replaced by a compartment with the same kinetics (i.e. the same paths and rates of inflow and outflow) named ‘trabecular marrow’ for consistency with the models for other radium progeny; a compartment is added to represent cortical marrow, which is assumed to exchange activity with plasma; the transfer coefficient from plasma to cortical marrow is one-third of the transfer coefficient from plasma to trabecular marrow; the removal half-time from cortical marrow is the same as that for trabecular marrow; and the transfer coefficient from plasma to ST1 is reduced to maintain the original total outflow rate from plasma to all destinations. (d) Actinium (713) A modified version of the characteristic model for actinium, described in a later part of the OIR series, is applied to actinium as a uranium progeny. Studies on laboratory animals indicate that the systemic behaviour of actinium is broadly similar to that of americium (USEPA, 1999; NCRP, 2009). The charactistic models for actinium and americium applied in a later part of the OIR series are both variations of the systemic model for americium described in Publication 67 (ICRP, 1993). The characteristic model for actinium differs from the Publication 67 model for americium only with regard to the behaviour of activity deposited in the gonads and liver. The removal half-time from the gonads is reduced from 10 y to 5 y. The liver, which is treated as a single compartment in the americium model of Publication 67, is divided into two compartments: Liver 1 and Liver 2. Actinium entering the liver is assigned to Liver 1. Actinium is removed from Liver 1 with a half-time of 30 d, with 97.4% going to Liver 2 and 2.6% going to the small intestine contents (biliary secretion). Actinium transfers from Liver 2 to blood with a half-time of 1 y. (714) For application to actinium as a progeny of radium, two compartments representing the spleen and skin are added to the explicitly identified source regions in the characteristic model for actinium for consistency with the source regions addressed in models for other radium progeny. Skin and spleen are taken from the intermediate soft tissue compartment ST1; that is, the deposition fraction for ST1 is reduced by the deposition fractions assigned to spleen and skin, and the removal half-time from ST1 to blood is assigned to spleen and skin. Deposition in skin is calculated as its mass fraction of other soft tissues times its deposition fraction in other soft tissues, excluding deposition in the fast-turnover compartment ST0. The deposition fraction for spleen is set at one-third of the deposition fraction for skin, considering the relative masses of these tissues and the typically higher concentrations of actinides in spleen than skin observed in laboratory animals and human subjects. If actinium is produced in a compartment that is not identifiable with a compartment in its characteristic model, it is assumed to transfer to actinium’s central blood compartment at the rate 1000 d−1 if produced in a blood compartment, at the rate of transfer from the fast-turnover soft tissue compartment ST0 to blood (1.386 d−1) if produced in a soft tissue compartment, and at the rate of bone turnover if produced in a bone volume compartment. (e) Thorium (715) The model for thorium as a progeny of radium is a modification of the systemic model applied in this publication to thorium as a parent radionuclide. Two compartments, one representing spleen and the other representing skin, are added to that model. Spleen and skin are assumed to exchange thorium with blood. Parameter values for these compartments are based on limited data from animal studies and human autopsy studies (Stover et al., 1960; Thomas et al., 1963; Larsen et al., 1984; Singh et al., 1983; Stehney and Lucas, 2000; Glover et al., 2001). Spleen and skin are assumed to receive 0.5% and 2%, respectively, of thorium ‘leaving the circulation’ as defined in Section 14. The transfer coefficient from blood to the intermediate-term soft tissue compartment ST1 (Fig. 14.2) is reduced to maintain the original removal half-time from blood. The assumed removal half-time from spleen and skin to blood is 2 y, the same as the removal half-time from ST1 to blood. Thorium produced in a compartment of a preceding chain member that is not identifiable with a compartment in the thorium model is assumed to transfer to the blood compartment of the thorium model at the following rate: 1000 d−1 if produced in a blood compartment; 0.462 d−1 if produced in a soft tissue compartment (the highest rate of removal from a compartment of other soft tissues in the thorium model); and at the rate of bone turnover if produced in an exchangeable bone volume compartment. (f) Radium (716) The model for radium produced by serial decay of members of a radium chain is a modification of the model for radium as a parent radionuclide. Single compartments representing spleen, trabecular marrow, cortical marrow, testes, ovaries, and skin are added for consistency with the models for other progeny of radium. The six added compartments are taken from the intermediate- and long-term soft tissue compartments ST1 and ST2, respectively, in the model for radium as a parent. Deposition of radium as a progeny in spleen, trabecular marrow + cortical marrow (i.e. total combined marrow), testes, ovaries, or skin is calculated as its mass fraction of other soft tissues times the sum of deposition fractions for ST1 (0.05) and ST2 (0.001). Deposition in trabecular marrow is assumed to be three times greater than deposition in cortical marrow. The derived transfer cofficients from blood to spleen, trabecular marrow, cortical marrow, testes, ovaries, and skin are 0.0093 d−1, 0.165 d−1, 0.055 d−1, 0.0021 d−1, 0.00068 d−1, and 0.2 d−1, respectively. The removal rate from each added compartment is set at 0.02 d − 1, which is a rounded value based on an effective removal half-time from ST1 + ST2. The deposition fractions for ST1 and ST2 are reduced uniformly (each by the same percentage) for mass balance. Radium produced in a blood compartment of a preceding chain member that is not identifiable with a compartment in the radium model is assumed to transfer to the central blood compartment of the radium model at the following rates: 1000 d−1 if produced in a blood compartment, and 6.98 d−1 if produced in a soft tissue compartment. The value 6.98 d−1 is the highest rate of removal from a compartment of other soft tissue in the characteristic model for radium. (g) Francium and astatine (717) Radioisotopes of francium and astatine appearing in radium chains considered in this publication have half-lives varying from less than 1 s to 22 min. These short-lived radionuclides are assumed to decay at their sites of production in systemic tissues and fluids.
13.3. Individual monitoring
(718) The monitoring results of radium in excreta samples of occupationally exposed personnel should be compared with the background excreta radium concentrations of the local population by statistical techniques. A baseline might be established for an individual or for the bioassay monitoring programme. Lung content and daily urinary and faecal excretion of 226Ra following inhalation of 1 Bq Type M.

13.3.1. 226Ra
(719) 226Ra is an alpha emitter. Intakes of 226Ra are generally monitored through analysis of its excretion in urine. Several measurement techniques may be used to measure the excretion rate of 226Ra. Some of these techniques require several days for the preparation of the samples before counting, and a further 20–30 d for 226Ra to be in equilibrium with its progeny radionuclides. In emergency situations, a faster method is required, and the detection limit will be higher. Other techniques, such as inductively coupled plasma mass spectrometry (ICP-MS), might be used, with a preparation time of approximately 2–3 d. Radium may also be measured by lung counting, through its 186 keV of gamma emission. Precautions must be taken since 235U emits a photon of almost identical energy. On some occasions, 226Ra may also be monitored through faecal excretion.
13.3.2. 228Ra
(720) 228Ra intakes may be determined through analysis of its excretion in urine, using beta counting in a proportional counter or liquid scintillation counting, after chemical separation. Measurement of 228Ac gamma photons is possible, but detection limits are high. (721) 228Ra cannot be detected directly by in-vivo measurement. The lung content of 228Ra can be inferred from a measurement of its immediate progeny, 228Ac.
13.4. Dosimetric data for radium
Lung content and daily urinary and faecal excretion of 226Ra following inhalation of 1 Bq Type S. Committed effective dose coefficients (Sv Bq−1) for the inhalation or ingestion of 226Ra and 228Ra compounds. AMAD, activity median aerodynamic diameter. Dose per activity content of 226Ra in lungs and in daily excretion of urine and faeces (Sv Bq−1); 5-µm activity median aerodynamic diameter aerosols inhaled by a reference worker at light work. Dose per activity content of 228Ra in lungs (228Ac measured) and in daily excretion of urine (Sv Bq−1); 5-µm activity median aerodynamic diameter aerosols inhaled by a reference worker at light work. Lung content (228Ac measured) and daily urinary excretion of 228Ra following inhalation of 1 Bq Type F. Lung content (228Ac measured) and daily urinary excretion of 228Ra following inhalation of 1 Bq Type M. Lung content (228Ac measured) and daily urinary excretion of 228Ra following inhalation of 1 Bq Type S.
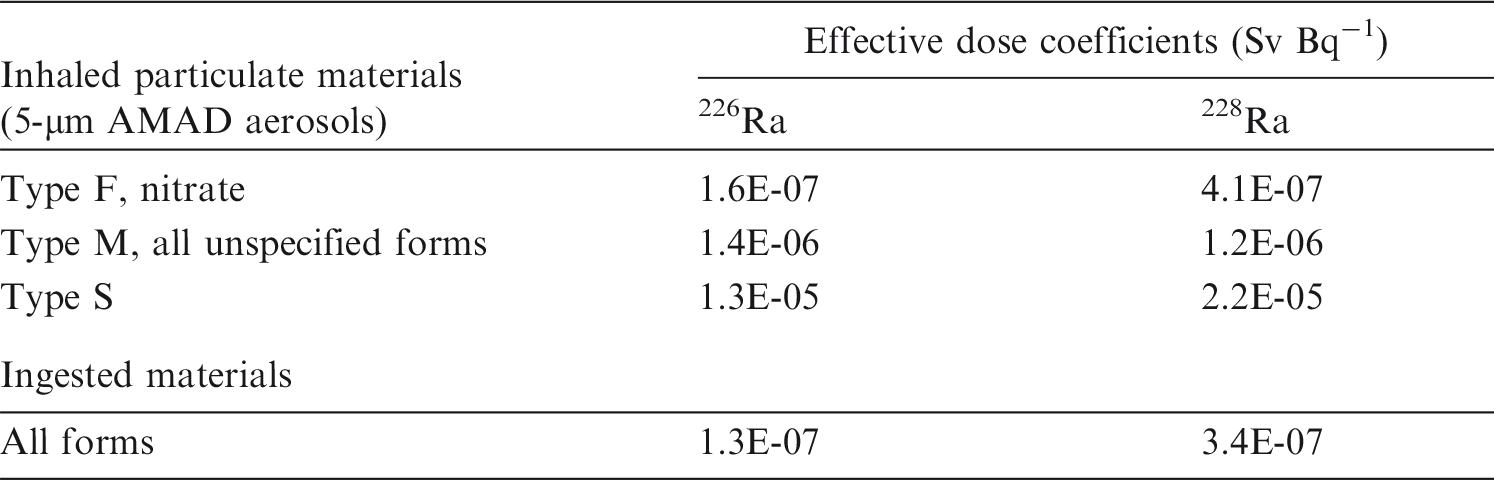


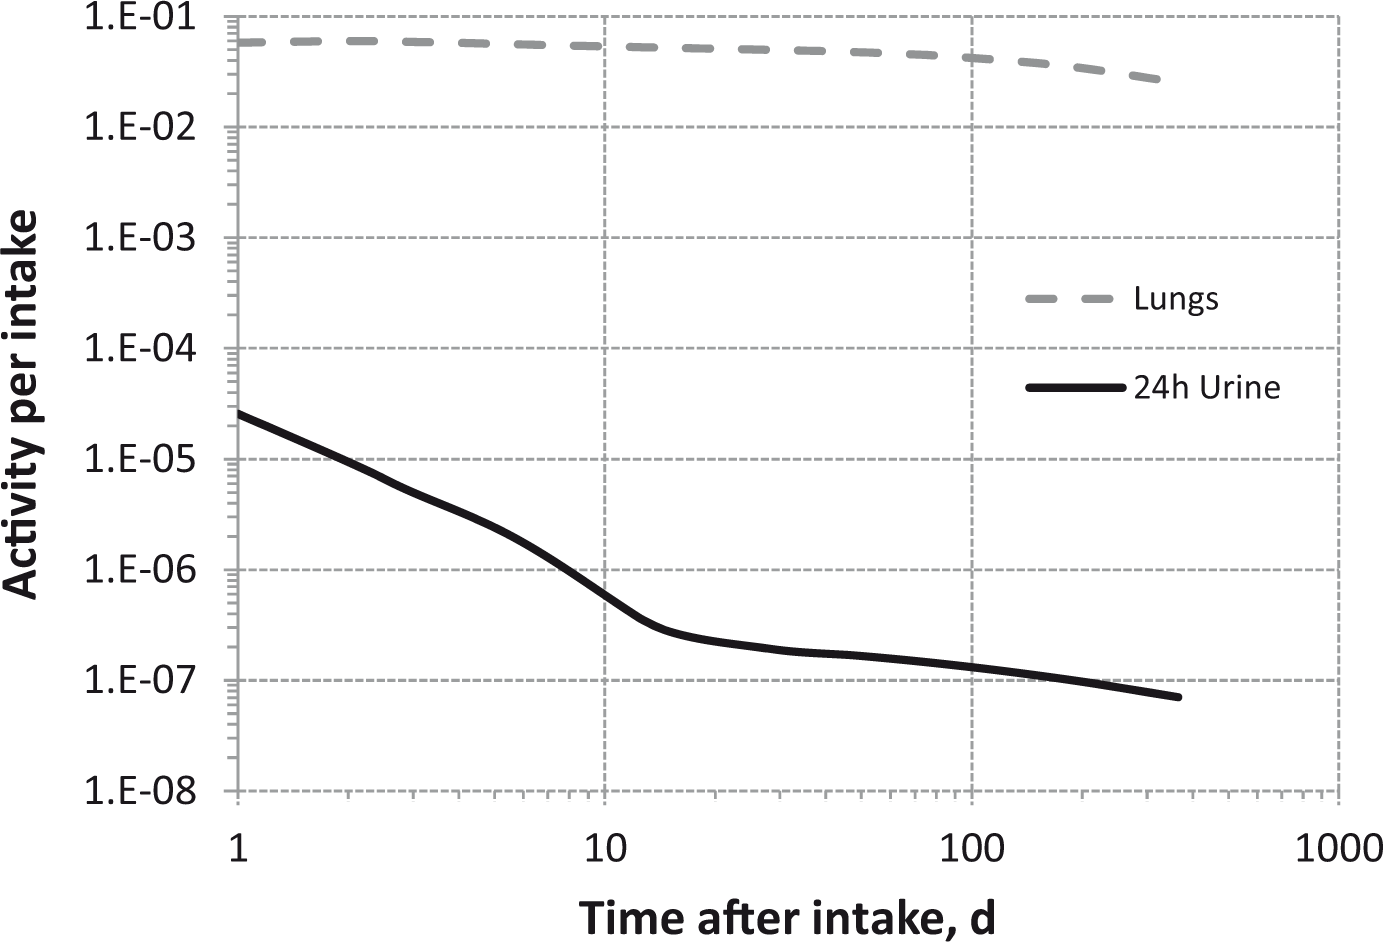
13.5. References
14. THORIUM (Z = 90)
14.1. Chemical forms in the workplace
(722) Thorium is an actinide element that occurs mainly in oxidation state IV. It is naturally abundant in the earth, and the main ores are thorite, thorianite, and monazite, the latter occurring mainly as mineral sand. Thorium may be encountered in industry in a variety of chemical and physical forms, such as oxides (ThO2), hydroxides, nitrates, fluorides, and sulphates. (723) 232Th can be used as fuel in a nuclear reactor to absorb slow neutrons and to produce 233U, which is fissile. Structure of the biokinetic model for systemic thorium. GI, gastrointestinal. ST0, ST1, and ST2 represent soft tissues with fast, intermediate, and slow turnover, respectively.

14.2. Routes of intake
14.2.1. Inhalation
(724) Information is available on the biokinetic behaviour of thorium after deposition of various chemical forms in the respiratory tract after accidental human exposure, and from experimental studies with animals, mainly rats. (725) Absorption parameter values and types, and associated fA values for particulate forms of thorium are given in Table 14.2. In referring to default types, it should be noted that the biokinetic behaviour of thorium is exceptional in that, following deposition of water-soluble forms in the lungs, a minor fraction of the lung deposit is absorbed very rapidly, after which absorption is minimal. This indicates that there are no commonly encountered Type F forms of thorium. Lung content (212Pb measured) and daily urinary and faecal excretion of 228Th following inhalation of 1 Bq of water-soluble forms, including thorium chloride, citrate, nitrate, and sulphate; thorium fluoride.

14.2.1.1. Particulate materials
(a) Thorium chloride (ThCl4) (726) Boecker et al. (1963) conducted a series of experiments to determine the effect of the mass of thorium deposited in the lungs on its disposition, by following the biokinetic of 234Th (t1/2 = 24 d) for up to 90 d after inhalation of the chloride by rats. They observed that, soon after exposure, a fraction of the thorium deposited in the lungs was absorbed into the body, but after this, the thorium organ contents remained approximately constant; the lung content decreased with time, with excretion of thorium predominantly in faeces. Similar behaviour has been observed following deposition of other water-soluble thorium compounds in the lungs (see below). It suggests that the fraction of thorium that is not absorbed rapidly is retained in the lungs in particulate form, rather than bound to respiratory tract tissues. They also found that the percentage of ILD of thorium that was absorbed, and the fractions excreted in urine and faeces, did not appear to be affected by variation in the mass of ILD by a factor of 105. This was in contrast to mass-dependent biokinetic observed by Thomas et al. (1963) following injection by different routes, including intratracheal instillation. It was considered that this might be due to the relatively high local concentrations that occurred in the injection studies, compared with the more diffuse (in both space and time) distribution following inhalation. At the first measurement of distribution, made less than 1 h after exposure, the ‘remainder’ tissue (taken by the authors to represent activity absorbed from the lungs) contained approximately 10% ILD, and showed little further change. This indicated that the absorption rate corresponds to a time constant of less than 1 h (i.e. sr > 20 d−1). However, it was not very much greater because it appeared that clearance from the upper respiratory tract was mainly to the alimentary tract. At this time, there were similar amounts of thorium in the upper respiratory tract and in the alimentary tract plus contents, indicating that the particle transport rate from the upper respiratory tract was approximately 20 d−1; this was assumed in all the assessments carried out here (i.e. by the Task Group) for thorium inhaled by rats. The lung content decreased from approximately 85% ILD at 6 d to 28% ILD at 84 d. Absorption parameter values of fr = 0.06, sr = 90 d−1, and ss = 0.002 d−1 were assessed here. Retention in lung and carcass were represented well, without the need to introduce the bound state. (727) Boecker (1963) followed the biokinetic of 234Th for 32 d after inhalation of the chloride by rats. At the first measurement of distribution, made less than 1 h after exposure, the ‘remainder’ tissue contained approximately 7% ILD, which increased to approximately 15% at 2 d onwards. Absorption parameter values of fr = 0.13, sr = 20 d−1, and ss = 0.004 d−1 were assessed here. Boecker (1963) also found that thorium in rats exposed up to five times behaved similarly to thorium in rats exposed on a single occasion. (b) Water-soluble forms of thorium and Type F thorium (728) Based on the results of the experiments outlined above, and those with thorium citrate and nitrate below, specific dissolution parameter values of fr = 0.1, sr = 50 d−1, and ss = 0.005 d−1 (consistent with assignment to default Type M) are used here for water-soluble forms of thorium, including chloride. It should be noted that with an initial uptake as high as approximately 10% ILD, it is difficult to estimate the low value of ss. This consideration also applies to the following compounds that are assigned to Type M. Since the estimated values of ss are close to the Type M default value of 0.005 d − 1, this value was used. The values of sr, with those estimated for chloride (below), are also used here to assign the specific value of sr for Type F thorium. Default Type F thorium (with dissolution parameter values fr = 1, sr = 50 d−1) is nevertheless retained as an option.
Thorium citrate
(729) Thomas et al. (1963) measured the tissue distribution of 234Th at times from 7 to 19 d after intratracheal instillation into rats as the citrate, as a preliminary to inhalation experiments (see citrate below and chloride above). There was no obvious change with time, and mean values were reported. When administered at tracer level, approximately 3% ILD remained in the lungs and approximately 50% was absorbed (deposited in systemic organs). When administered with carrier, approximately 10% ILD remained in the lungs and approximately 15% was absorbed, indicating Type F and Type M behaviour, respectively. (730) Boecker (1963) followed the biokinetic of 234Th for 32 d after inhalation of the citrate by rats. The first measurement of distribution was made soon ( < 1 h) after exposure. The ‘remainder’ tissue, taken by the author to represent activity absorbed from the lungs, already contained approximately 40% ILD, and showed little further change. This was more than found for the chloride in a similar experiment (∼10% ILD, see above), but suggests that, as for the chloride, sr was more than 20 d−1 but not much greater. Approximately 60% ILD remained in the lungs at 7 d, much more than after intratracheal instillation (see above), and it was suggested that the difference was an artefact of the instillation procedure. Absorption parameter values of fr = 0.14, sr = 70 d−1, and ss = 0.01 d−1 were assessed here, giving assignment to Type M. (731) Based on the results of the experiments outlined above, and those with thorium chloride (above) and nitrate (below), specific absorption parameter values of fr = 0.1, sr = 50 d−1, and ss = 0.005 d−1 (consistent with assignment to default Type M) are used here for water-soluble forms of thorium, including citrate. The values of sr, with those estimated for chloride (above), are also used here to assign the specific value for Type F thorium.
Thorium nitrate (Th(NO3)4)
(732) Ballou et al. (1986) measured the tissue distributions of 232U and its progeny radionuclides at 24 h after their intratracheal instillation into rats as nitrates (for further information, see Section 14.2.1.2 and Section 15.2.1). For 228Th, lung retention was 52% ILD, much higher than for the other radionuclides, with deposition in the skeleton at 12% ILD, broadly similar to the behaviour observed after instillation of thorium sulphate (see below). (733) Gray et al. (1991) measured the tissue distribution of 230+232Th at times between 7 and 252 d after administration to rats by inhalation or intratracheal instillation of thorium nitrate with ILD of approximately 5 µg thorium. Following inhalation, lung retention decreased from 73% ILD to 12.6% ILD between 7 and 252 d. It was estimated that approximately 10% was absorbed by 7 d, with little subsequent change. Thus, the overall behaviour was similar to that observed for inhaled chloride and citrate (see above). With the first measurement at 7 d, there is no information on which sr can be estimated. Stradling et al. (2004) derived two sets of parameter values from the data; assuming a ‘low’ value for sr of 3 d−1 gave fr = 0.07 and ss = 3.5 × 10⁻⁴ d−1, and assuming a ‘high’ value for sr of 100 d−1 gave fr = 0.04 and ss = 5 × 10⁻⁴ d−1. Values of sr in the range 20–90 d−1 were obtained here from the results of inhalation experiments with chloride and citrate (see above). Taking a central value of 50 d−1, a good fit to the data was obtained here with fr = 0.04 and ss = 8 × 10⁻⁴ d−1, giving assignment to Type M. Very similar values were obtained for the data following instillation (fr = 0.05 and ss = 8 × 10⁻⁴ d−1). (734) Gray et al. (1991) also followed the biokinetic of thorium after intratracheal instillation into rats of thorium nitrate with ILDs of approximately 2 pg or 3 ng thorium, with the first measurement at 1 or 7 d and the last at 28 or 84 d. Assuming sr = 50 d−1 and ss = 8 × 10⁻⁴ d−1 (as in the longer-term studies), values of fr of approximately 0.3 were obtained here for both (giving assignment to Type M). Thus, a larger fraction was absorbed rapidly when these lower masses were instilled, as observed by Thomas et al. (1963) for thorium citrate. (735) Moody et al. (1994a) and Moody and Stradling (1992) measured the tissue distributions of 228Th, 212Pb, 212Bi, and 208Tl at times from 6 h to 7 d after intratracheal instillation into rats of a nitrate solution of 228Th in equilibrium with its progeny radionuclides (ILD 17 ng Th) (for further information, see Section 14.2.1.2). For thorium, approximately 20% ILD was absorbed by 6 h, with little subsequent change, indicating that sr was more than 4 d−1. They also measured the tissue distribution of 228Th at times from 1 to 84 d after instillation of thorium nitrate (ILD 32 ng). Assuming sr = 50 d−1 and ss = 8 × 10⁻⁴ d−1 (as above), values of fr of 0.2 and 0.14, respectively, were obtained here. (736) Stradling et al. (2005a) measured the tissue distribution of 228Th at times from 1 to 84 d after intratracheal instillation of a nitrate solution of 228Th into rats. Absorption was somewhat greater for ILD of 1.6 pg thorium than for ILD of 0.17 µg thorium. Assuming sr = 50 d−1 and ss = 8 × 10⁻⁴ d−1 (as above), values of fr of 0.35 and 0.25 were obtained here. The behaviour of thorium was not significantly affected by the presence of uranium when they were administered together (for further information, see Section 15.2.1.2). (737) Thus, similar overall behaviour was reported in these experiments, with absorption to blood largely complete by the time of the first measurement. The studies with citrate and chloride outlined above suggest that, following inhalation, there is little effect of mass on the biokinetic of thorium, but following instillation, the rapidly absorbed fraction decreases with mass instilled. Similarly, for thorium nitrate administered by instillation, the fraction of ILD absorbed rapidly tends to decrease with increasing ILD. Values of fr estimated here varied from 0.05 to 0.35 (giving assignment to Type M), with the lowest value at the highest ILD. A value of fr = 0.04 was obtained from the results of the only inhalation experiment with thorium nitrate (Gray et al., 1991). Based on the results of the experiments outlined above, and those with thorium chloride and citrate, specific absorption parameter values of fr = 0.1, sr = 50 d−1, and ss = 0.005 d−1 (consistent with assignment to default Type M) are used here for water-soluble forms of thorium, including nitrate.
Thorium sulphate (Th(SO4)2)
(738) Scott et al. (1952) measured the tissue distribution of 234Th at 4 d after intratracheal instillation into rats of thorium sulphate solution (with carrier). Approximately 35% ILD remained in the lungs and 4% was deposited in systemic organs, indicating somewhat less absorption than for instillation of thorium citrate (see above), but also indicating Type M behaviour. Since the thorium sulphate was administered in solution, the specific parameter values adopted here for water-soluble forms of thorium (fr = 0.05, sr = 50 d−1, and ss = 0.001 d−1) are also applied to thorium sulphate. (c) Thorium fluoride (ThF4) (739) Stradling et al. (2005b) and Moody et al. (1994b) measured the tissue distributions of 228Th, 212Pb, 212Bi, and 208Tl at times from 1 to 168 d after intratracheal instillation into rats of a suspension of 228Th or 228+232Th fluoride (ILD 60 pg or 6.5 µg thorium) in equilibrium with the progeny radionuclides of 228Th (for further information, see Section 14.2.1.2). As for the water-soluble forms (see above), absorption of thorium to blood was largely complete by the time of the first measurement. However, the authors noted that although the tissue distribution of systemic thorium was independent of mass or chemical form administered, the fraction excreted rapidly in urine was much higher than observed for the nitrate, and suggested that this might reflect the transfer of ultrafine particles through the kidneys. Lung retention at 168 d was greater with the higher mass than with the lower mass administered (25% vs 8% ILD), presumably because particle transport was impaired. Estimated absorption in the first day was greater for ILD of 60 pg thorium (12% ILD) than for ILD of 6.5 µg thorium (6% ILD). Assuming sr = 50 d−1 (as above, since most absorption took place within 1 d), values of fr of 0.10 and 0.06, respectively, and values of ss of 0.003 d−1 and 0.001 d−1, respectively, were obtained here, giving assignment to Type M. The parameter values assessed are similar to those adopted here for water-soluble forms of thorium (fr = 0.1, sr = 50 d−1, and ss = 0.005 d−1), and therefore these specific absorption parameter values are also used here for thorium fluoride. (d) Thorium hydroxide (Th(OH)4) (740) Albert (1966), in a review of lung retention of thorium, referred to a study in which approximately 2% ILD of the thorium was absorbed from the lungs in 2 months after intratracheal instillation of Th(OH)4 into rats (Thomas, 1957). (741) Stradling et al. (2005b) and Moody et al. (1994b) measured the tissue distributions of 228Th, 212Pb, 212Bi, and 208Tl at times from 1 to 168 d after intratracheal instillation into rats of a suspension of 228Th or 228+232Th hydroxide (ILD 50 pg or 6.5 µg thorium) in equilibrium with the progeny radionuclides of 228Th (for further information, see Section 14.2.1.2). Results were similar to those obtained for the fluoride. Absorption to blood was largely complete by the time of the first measurement. However, the authors noted that although the tissue distribution of systemic thorium was independent of mass or chemical form administered, the fraction excreted rapidly in urine was much higher than observed for the nitrate, and suggested that this might reflect the transfer of ultrafine particles through the kidneys. Lung retention at 168 d was greater with the higher mass than with the lower mass administered (17% vs 8% ILD), presumably because particle transport was impaired. Estimated absorption in the first day was somewhat greater for ILD of 50 pg thorium (8% ILD) than for ILD of 6.5 µg thorium (6% ILD). Assuming sr = 50 d−1 (as above, since most absorption took place within 1 d), values of fr of 0.07 and 0.06, respectively, and values of ss of 0.002 d−1 and 0.001 d−1, respectively, were obtained here, giving assignment to Type M. The parameter values assessed are similar to those adopted here for water-soluble forms of thorium (fr = 0.1, sr = 50 d−1, and ss = 0.005 d−1), and therefore these specific absorption parameter values are also used here for thorium hydroxide. (e) Thorium dioxide (ThO2) (742) Hodge and Thomas (1959) reported that high concentrations of thorium were found in the lungs and lymph nodes of dogs sacrificed 7 y after a 2-year inhalation exposure to ThO2. Few details are given, but the authors inferred that negligible amounts of thorium had cleared from the lungs in 7 y, indicating Type S behaviour. (743) Newton et al. (1981) followed the retention of 228Th for 7 y in a man who became internally contaminated, presumably through its inhalation in oxide form. The first measurements were made approximately 500 d after the presumed time of intake. The authors assessed that, by this time, only a small fraction of the 228Th in the body was in the lungs, suggesting Type M rather than Type S behaviour. (744) Ballou and Hursh (1972) followed retention of 228Th in the lungs of dogs for 150 d after inhalation of ThO2, by in-vivo measurements of exhaled thoron (220Rn) and 208Tl gamma emissions over the thorax, and post-mortem measurements of 228Th in the lungs. At 14 d, approximately 1% ILD was in the body outside the lungs, indicating that fr was approximately 0.01. The authors estimated lung retention half-times of 350–500 d, suggesting Type S behaviour (for further information, see Section 14.2.1.2). (745) LaMont et al. (2001) measured the dissolution rates in simulated lung fluid of freshly prepared and aged samples of ThO2 for 100 d. The fractions dissolved over 100 d were approximately 2 × 10⁻⁶ and 1 × 10⁻⁵, respectively. The higher value for the aged oxide was attributed to radiolytic damage and consequent increase in surface area. Most of the dissolution occurred in the first day or so, giving values of fr of approximately 2 × 10⁻⁶ and 1 × 10⁻⁵, and values of ss less than approximately 10−7 d−1 and 10−8 d−1, respectively. (746) Hodgson et al. (2000, 2003) measured the tissue distributions of 228Th, 212Pb, 212Bi, and 208Tl at times from 1 to 168 d after intratracheal instillation into rats of suspensions of 232Th dioxide enriched with 228Th in equilibrium with its progeny radionuclides, with two different particle sizes (geometric diameters ∼0.4 and 2 µm). Approximately 1% ILD was measured in the carcass at the first measurement (6 h), with no further measurable increase, showing that sr was not less than approximately 10 d−1. The authors derived absorption parameter values of fr = 0.02, sr = 10 d−1, and ss = 1 × 10⁻⁶ d−1, giving assignment to Type S. However, they considered that the value of fr should not be regarded as typical of ThO2. They referred to in-vitro dissolution tests (LaMont et al., 2001, see above) which showed much lower values of fr. In view of this, specific parameter values are not adopted for thorium dioxide, which is assigned to Type S, but it should be recognised that absorption could be even lower than assumed for default Type S. (f) Thorium ore and refinery dusts (747) Measurements of thorium progeny radionuclides in the chest and exhaled air of nearly 200 former thorium refinery workers, made at least 3 y after the end of exposure to a range of compounds from monazite ore to thorium nitrate, indicate long-term retention and hence Type S behaviour for at least some of the material (Stehney et al., 1980; Rundo et al., 1981) (for further information, see Section 14.2.1.2). Analysis of autopsy tissues from five workers showed excess concentrations of thorium in lung and lymph nodes (Mausner, 1982; Stehney and Lucas, 2000). The authors noted that the large amounts of 232Th remaining in the lungs 6–30 y after the end of employment supported the long-term lung retention assumed in the original HRTM. (748) Maniyan et al. (2000) carried out repeated in-vivo measurements of the progeny 208Tl in the chest of four workers at a monazite processing plant. They had previous chronic inhalation exposure for 25–30 y mainly to thorium hydroxide and phosphate. Measurements, which extended over periods of approximately 500–1200 d, indicated a clearance half-life for thorium in the chest of approximately 1000 d. However, it was recognised that because of the long exposure, there were contributions to the measurements from activity in lymph nodes and skeleton. (749) Jaiswal et al. (2004) reported that the ratios of daily urinary excretion to lung content of thorium in five workers exposed chronically (10–32 y) at a plant that processed thorium concentrate (hydroxide) to produce thorium nitrate and oxide were consistent with the predictions of the HRTM and Publication 69 systemic thorium model (ICRP, 1994a, 1995a) assuming Type S, but not Type M. (750) As part of a programme of measurements of the dissolution in simulated lung fluid of thorium and uranium in dusts to which workers were exposed (see below), Duport et al. (1991) observed negligible dissolution of 232Th in samples of Ni-ThO2 (2%Th:98%Ni) alloy from a plant that produced heat- and corrosion-resistant alloys for aircraft industries. (g) Uranium ore dust (751) There is experimental evidence that thorium present in uranium ore dust is retained in the lungs longer than other constituents of the particle matrix (Stuart and Beasley, 1967; Stuart and Jackson, 1975). Similarly, Fisher et al. (1983) measured significantly higher activity levels of 234U and 238U than of the progeny 230Th in excreta samples obtained from active uranium millers, indicating that clearance of uranium in the inhaled ore dust was faster than that of thorium. In contrast, Wrenn et al. (1985) measured 230Th concentrations similar to those of 234U in the lungs of five uranium miners. In a later study (Singh et al., 1987), the same group found 230Th to 234U concentration ratios of more than 1 in the lungs of three uranium miners and two uranium millers. They concluded that, overall, dissolution in the human lungs of uranium and thorium in uranium ore dust was similar (for further information, see Section 15.2.1.2). (752) Duport et al. (1991) measured the dissolution in simulated lung fluid of long-lived radionuclides in uranium ore dust from Canadian mines (for further information, see Sections 14.2.1.2 and 15.2.1.2). For high-grade ore, measurements were made for up to 60 d. Results were presented as undissolved fractions as functions of time, and showed two components, expressed as Class D (rapid) and Class Y (slow) fractions. For 238U and 230Th, the rapidly dissolved fractions were 0.25 and 0.15, respectively, indicating assignment to Type M. HRTM parameter values fitted to the 230Th data by Marsh et al. (2012) were fr = 0.14, sr = 4.6 d−1, and ss = 7 × 10⁻⁴ d−1. For both radionuclides, no effects of size were observed in total dissolution over 40 d for particles in size ranges 7–10, 3–7, 1–3, and less than 1 µm. For low- and medium-grade ores, measurements were made for 12 d, but only on samples of relatively coarse dust, the smallest fraction being less than 37 µm. For 238U, rapidly dissolved fractions were greater than those measured in the high-grade ores: approximately 0.33 and 0.5 for low- and medium-grade ores, respectively. Measurements were also made of 232Th in low-grade ore, and a much lower fraction was obtained (0.01), indicating assignment to Type S. (753) Reif (1994) measured the dissolution rates in simulated lung fluid of thorium residues from two different uranium mill tailings in the USA for 100 d. Dissolution parameter values calculated were fr = 0.0 and ss = 6.4 × 10⁻⁴ d−1 for one compound; and fr = 0.3, sr = 0.23 d−1, and ss = 0.0041 d−1 for the second compound, indicating assignment to Type S and Type M, respectively. (754) Bečková and Malátová (2008) measured dissolution for 26 d of 238U, 234U, and 230Th in simulated serum ultrafiltrate of uranium ore dust collected on personal air filters in a mine in the Czech Republic. The dust contained no measurable 232Th series radionuclides. Moderate dissolution of both uranium isotopes was observed, indicating assignment to Type M (for further information, see Section 15.2.1). In contrast, no dissolution of 230Th was detected, indicating assignment to Type S. (h) Other mine dusts (755) Chen et al. (1995) followed lung retention of thorium by measurements of exhaled thoron in a worker involved in crushing ore containing iron, rare earths, and thorium (∼0.04%). This worker’s lung content was the highest found in a survey of over 100 workers at the mine (Chen et al., 1988), and he suffered from pneumoconiosis. Approximately 40% of the thorium remaining in the lungs when exposure stopped cleared within approximately 1 y, but there was very little further clearance during the following 5 y, indicating Type S behaviour of at least some of the dust. (i) Environmental thorium (756) Although mainly related to public, rather than worker, exposure, information relating to environmental thorium is included here for completeness. (757) Measurements of environmental levels of thorium in autopsy tissues from members of the public showed that the fraction of thorium in the lungs (∼25% of the estimated total body content) was considerably greater than that of plutonium (∼5%), and suggested a long-term lung retention half-time for thorium of between 1 and 8 y (Wrenn et al., 1981; Singh et al., 1983). The concentrations of thorium in the lymph nodes were 10–20 times those in the lungs in autopsy tissues from members of the public (Hamilton et al., 1972; Ibrahim et al., 1983; Singh et al., 1983; Wrenn et al., 1985; Sunta et al., 1987). (758) Jaiswal et al. (2004) found good agreement between measured values of thorium in lung, skeleton, and liver in autopsy tissues from members of the public, and those predicted by the HRTM assuming Type S, and the Publication 69 systemic model for thorium (ICRP, 1994a, 1995a). These results indicate that environmental thorium is inhaled mainly in insoluble forms.
14.2.1.2 Progeny radionuclides of thorium formed in the respiratory tract
(759) The general approach to treatment of progeny radionuclides formed in the respiratory tract is described in OIR Part 1, Section 3.2.3. and Annex A (ICRP, 2015). In summary, it is expected that the rate at which a particle dissociates is generally determined by its matrix, and hence the physico-chemical form of the inhaled material. It is recognised that for progeny radionuclides formed within particles by alpha emission, recoil of the progeny nucleus from the alpha emission expels some of the progeny from the particle. In the case of decay chains, this will result in successively lower activities of members compared with the parent retained in relatively insoluble particles. Experimental evidence relating to this is described below in Section 14.2.1.2 (Part b). However, it was considered impractical to implement loss of progeny radionuclides by alpha recoil in the calculation of dose coefficients and bioassay functions in the OIR series [for further information, see OIR Part 1, Annex A (ICRP, 2015)]. Nevertheless, this phenomenon should be borne in mind, especially when using progeny radionuclides to monitor intakes and doses of the parent. This is of particular importance in the case of thorium. (760) Exceptions are made for noble gases formed as progeny radionuclides, which are assumed to escape from the body directly, in addition to other routes of removal. For calculation purposes, it is assumed that radon formed as a progeny radionuclide within the respiratory tract escapes from the body at a rate of 100 d−1, in addition to other routes of removal [for further information, see Section 14.2.1.2 (Part b)]. (761) The decay schemes of thorium isotopes in the natural decay series (227Th, 228Th, 230Th, 231Th, 232Th, and 234Th) are shown in Annex A, Figs. A.1–A.3. (762) It is expected that the behaviour of soluble (e.g. Type F) material in the respiratory tract would depend on its elemental form (i.e. that of the progeny radionuclide). Nevertheless, for simplicity, in the OIR series, the absorption parameter values of the parent are, by default, applied to all members of the decay chain formed in the respiratory tract. (763) The behaviour of progeny radionuclides of thorium can be of particular importance in this context because there is generally significant long-term retention of thorium in the lungs following its deposition in water-soluble form (see above). Conversely, soluble forms of important progeny radionuclides of thorium, notably radium and lead, are absorbed relatively readily from the respiratory tract into the systemic circulation. Studies specifically comparing the behaviour of thorium with that of its progeny radionuclides are summarised below, although it should be noted that the progeny radionuclides were administered with the thorium as well as being formed from decay of thorium (and its progeny radionuclides) in the respiratory tract. For more information, see sections on radium (13.2.1.2), lead (9.2.1.4), bismuth (10.2.1.3), and uranium (15.2.1.2) in this publication, relating to the behaviour of their progeny radionuclides formed in the respiratory tract. (764) As noted above, measurements have been made of the tissue distributions of 212Pb, 212Bi, and 208Tl following administration to rats of 228Th in various chemical forms (nitrate, hydroxide, fluoride, dioxide) in equilibrium with its progeny radionuclides. 220Rn is a precursor of 212Pb, but it is unlikely that a significant amount was lost from solution before deposition in the lungs because of its short half-life of 56 s. Its average half-distance of diffusion in water was estimated to be 50 µm by Ballou and Hursh (1972). The behaviour of 212Pb is compared with that of 228Th for each chemical form below (for further information, see Section 9.2.1). In all of these studies, the distributions of 212Bi and 208Tl were similar to each other and those of the parent 212Pb. As their physical half-lives are so short (61 min and 3 min, respectively), measurements made at 6 h onwards would be mainly of activity formed from decay of 212Pb within the body, rather than from intake of 212Bi or 208Tl. The similar distributions of 212Bi and 208Tl to those of 212Pb might suggest that there was not rapid movement of 212Bi from the site (e.g. the lungs) in which it was formed by decay of 212Pb. However, 212Bi (and 208Tl) would have grown in rapidly between dissection of the animals and measurements of activities in tissues. Thus, the activities of 212Bi (and 208Tl) present in vivo may have been significantly lower than those measured, and without detailed information (which is not available) about the time which elapsed between dissection of the animals and measurements, it is not possible to correct for this ingrowth and hence estimate the absorption rate from the respiratory tract of the bismuth formed as a progeny of lead, nor that of the thallium formed as a progeny of bismuth. However, since the half-life of 208Tl is so short (as is that of 207Tl present in the 235U decay series, 5 min), the absorption rate would have to be very high to influence dose assessments. (a) Relatively soluble (Type M) forms (765) Ballou et al. (1986) measured the tissue distributions of 232U, 228Th, 224Ra, 212Pb, 212Bi, and 208Tl at 24 h after intratracheal instillation of 232U nitrate with its progeny radionuclides into rats (for further information, see Section 15.2.1). Measurements of 228Th, 224Ra, and perhaps 212Pb were mainly of material administered with the parent 232U, rather than formed from its decay in the lungs. The physical half-lives of 212Bi and 208Tl are so short (61 min and 3 min, respectively) that measurements made at 24 h would mainly be of activity formed in situ. Lung retention was 7.9% ILD for 232U, 52% ILD for 228Th, and approximately 2–3% ILD for the other progeny radionuclides measured, reflecting the high lung retention of thorium, and relatively rapid lung clearance of radium and lead observed in other studies in which soluble forms were administered. Similarly, the distribution between liver, skeleton, and kidneys of 232U, 228Th, 224Ra, and 212Pb reflected the elemental forms. The distributions of 212Bi and 208Tl were similar to those of 212Pb, presumably because of their short physical half-lives; whatever their distribution in vivo, they would tend to equilibrium between dissection and measurement. (766) Lipsztein et al. (1989) made in-vivo measurements of 228Ac and 208Tl in the lungs of two workers involved in the chemical treatment of monazite sand. They considered that the exposures were to Class W (moderately soluble, i.e. Type M) forms of thorium. The mean ratio of 228Ac to 208Tl was 1.5, suggesting that some members of the decay series cleared faster than 228Ac, but the differences were not great. (767) Moody et al. (1994a) and Moody and Stradling (1992) measured the tissue distributions of 228Th, 212Pb, 212Bi, and 208Tl at times from 6 h to 7 d after intratracheal instillation into rats of a solution of 228Th nitrate in equilibrium with its progeny. For 228Th, on average, 48% ILD was measured in the lungs at 6 h and 40% ILD at 1 d (see above). For 212Pb, clearance was much faster, with 8.4% ILD at 6 h and 1.2% ILD at 1 d (correcting for the physical decay of 212Pb, 12.5% and 5.6% ILD, respectively). Later measurements of 212Pb could have included significant ingrowth of 212Pb from decay of higher members of the chain in the lungs. Nevertheless, the concentration of 212Pb remained much lower than that of the 228Th parent (presented as a high 228Th:212Pb ratio). (768) Stradling et al. (2005b) and Moody et al. (1994b) measured the tissue distributions of 228Th, 212Pb, 212Bi, and 208Tl at times from 1 to 168 d after intratracheal instillation into rats of a suspension of 228Th or 228+232Th fluoride in equilibrium with the progeny radionuclides of 228Th. For thorium (see above), on average, 65% ILD was measured in the lungs at 1 d when administered with a low mass (60 pg) of thorium, and 72% ILD when administered with a high mass (6.5 µg) of thorium. For 212Pb, the corresponding amounts were 6.0% and 18% ILD. Correcting for the physical decay of 212Pb gives retention of 28% and 84% ILD at 1 d. Thus, at the low mass, clearance was much faster than that of the parent 228Th, but not at the high mass. From the results for low mass, it was assessed here that sr was at least 1 d−1 (t1/2∼8 h). Later measurements of 212Pb could have included significant ingrowth of 212Pb from decay of higher members of the chain in the lungs. Nevertheless, as for the nitrate, the concentration of 212Pb remained lower than that of the 228Th parent (presented as a high 228Th:212Pb ratio). (769) Stradling et al. (2005b) and Moody et al. (1994b) measured the tissue distributions of 228Th, 212Pb, 212Bi, and 208Tl at times from 1 to 168 d after intratracheal instillation into rats of a suspension of 228Th or 228+232Th hydroxide in equilibrium with the progeny radionuclides of 228Th. For thorium (see above), on average, 59% ILD was measured in the lungs at 1 d when administered with a low mass (60 pg) of thorium, and 75% ILD when administered with a high mass (6.5 µg) of thorium. For 212Pb, the corresponding amounts were 2.7% and 5.3% ILD. Correcting for the physical decay of 212Pb gives retention of 13% and 25% ILD at 1 d. At both mass levels, clearance of 212Pb was much faster than that of the parent 228Th. Later measurements of 212Pb could have included significant ingrowth of 212Pb from decay of higher members of the chain in the lungs. (770) In the studies by Moody et al. (1994ab), Moody and Stradling (1992), and Stradling et al. (2005b), the concentration of 212Pb remained much lower than that of the 228Th parent, despite ingrowth (presented as a high 228Th:212Pb ratio). This might be due, in part, to loss of intermediate progeny radionuclides by alpha recoil and diffusion of radon, but also due, in part, to more rapid dissolution (leaching) of the progeny radionuclides, including 212Pb, from the particle matrix. Stradling et al. (2004) proposed that as the progeny (radium and lead) are absorbed rapidly, as expected for radium and lead nitrates, they should be assigned to Type F. (771) For the other moderately soluble forms, the situation is less clear; retention of lead is less than that of thorium, but greater than that of lead nitrate. The progeny radionuclides are therefore also assigned to Type M. (b) Relatively insoluble (Type S) forms (772) Newton (1968) followed lung retention of 231 Pa and 227Ac after accidental inhalation in a relatively insoluble form by external measurement of x rays and gamma rays from 231 Pa and the progeny radionuclides of 227Ac:227Th and 223Ra (for the decay scheme, see Annex A, Fig. A.2). Much of the 227Ac was inhaled with the 231 Pa, rather than formed as a progeny radionuclide within the lungs. The estimated biological half-life of 227Ac in the lungs (in the range 300–400 d) was less than that of 231 Pa (1000 ± 300 d), suggesting that it cleared more rapidly. In contrast, no significant difference was found between the levels of 227Th and 223Ra in the chest, indicating that they were in equilibrium, with no significant preferential clearance of 223Ra. (774) For these radionuclides, no effects of size were observed in total dissolution over 40 d for particles in size ranges 7–10, 3–7, 1–3, and less than 1 µm. For low- and medium-grade ores, measurements were made for 12 d, but only on samples of relatively coarse dust, the smallest fraction being less than 37 µm. For 238U, rapidly dissolved fractions were higher (0.33 and 0.5 for low- and medium-grade ores) than those measured in the high-grade ores. However, for other radionuclides, the fractions were lower: 0.07 for 226Ra and less than 0.01 for 210Pb. Measurements were also made for 210Po in low- and medium-grade ores, and low fractions were obtained (0.00 and 0.005, respectively). Consistent differences in dissolution between uranium, thorium, and their progeny radionuclides were not apparent. (c) Emanation of radon: recoil and diffusion (775) Griffiths et al. (1980) developed a model to describe the retention of 232U and its progeny radionuclides, which include 228Th, in the lungs following inhalation in ThO2 or UO2 particles. In addition to chemical dissolution, they considered recoil emanation of progeny nuclei by alpha-particle decay, and diffusion emanation of 220Rn from particles. They presented equations to calculate fractional losses by recoil and diffusion as functions of particle size (for spherical particles alone). They calculated recoil ranges of approximately 0.05 µm for the progeny radionuclides, assuming a particle density of 10 g cm−3, and fractional losses by recoil emanation in the range 0.3–0.1 for aerosols with AMAD in the range 1–10 µm. The calculated loss of 220Rn from particles by diffusion emanation was difficult to predict, ranging from 0.03 to 0.7 depending on the assumed diffusion coefficient (10−15–10−11 cm2 s−1). (776) Coombs and Cuddihy (1983) measured the fraction of 228Th escaping by recoil and the fraction of 220Rn escaping by diffusion from size-fractionated samples of ThO2 and uranium oxide (mixture of UO2.2 and U3O8) containing 1% 232U. The fraction of 228Th escaping increased from approximately 0.07 for particles with AMAD 2.5 µm (count median diameter ∼1 µm) to approximately 0.3 for particles with AMAD 0.65 µm (count median diameter ∼0.1 µm). This was in reasonable agreement with the model of Griffiths et al. (1980). Calculated recoil range was expressed in terms of recoil range times density, with values of approximately 20 µg cm−2. The fraction of 220Rn escaping by diffusion increased from approximately 0.07 for particles with AMAD 2.5 µm to approximately 0.35 for particles with AMAD 0.65 µm, and gave a diffusion coefficient of approximately 3 × 10⁻¹⁴ cm2 s−1. This was similar to the fraction of 228Th escaping by recoil, and therefore presumably similar to the fraction of 220Rn escaping by recoil, since the recoil ranges of 220Rn and 228Th are similar (Griffiths et al., 1980). (777) Johnson and Peterman (1984) developed a model to describe the emanation of 220Rn from ThO2 particles by alpha-particle recoil, and its exhalation from the lungs. They calculated that the fraction of 220Rn atoms produced that escaped from particles (density 10 g cm−3) by recoil decreased from approximately 1.0 at 1-nm diameter to approximately 0.5 at 10-nm diameter and approximately 0.1 at 0.5-µm diameter. The average fraction for an aerosol of AMAD 1 µm was calculated to be 0.2, which seems to be consistent with the results derived by Griffiths et al. (1980). (778) Ballou and Hursh (1972) measured thoron (220Rn) in the breath of dogs at times up to 150 d after inhalation of ThO2 (see above), and, for comparison, after intravenous injection of ThO2. After intravenous injection, approximately 75% of the ThO2 was retained in the lung vasculature. Lung retention of 228Th was also followed by in-vivo measurements of 208Tl gamma emissions over the thorax, and post-mortem measurements of 228Th in the lungs. At 14 d, the activity of the 224Ra progeny was approximately 70% of that of the 228Th, suggesting some differential loss of 224Ra. The ratio of thoron in the lung space to 228Th in the whole body was lower (0.065) immediately after inhalation than after intravenous injection (0.11), but increased to approximately 0.1 by 14 d. By this time, most of the 228Th was in the lungs, and the ratio of thoron in the lung space to 228Th in the lungs remained fairly constant thereafter. The lower initial value was attributed to the particles being embedded in mucus in the upper respiratory tract. (779) Measurements of thorium progeny radionuclides in the chest (212Bi and, in some cases, 228Ac) and exhaled air (thoron, 220Rn) of nearly 200 former thorium refinery workers were made at least 3 y after the end of exposure to a range of compounds from monazite ore to thorium nitrate (Stehney et al., 1980; Rundo et al., 1981; Toohey et al., 1985). Measurements of exhaled thoron were expressed as the activity of freely emanating 224Ra (the parent of 220Rn) at the mouth of the subject. They found an average value of 0.101 for the ratio of freely emanating 224Ra to retained 212Bi, from which they deduced an average exhalation of 9.2% of the thoron produced. Stebbings (1985) reported a positive correlation between this ratio and the thorium body content, which could lead to serious underestimation if it were applied to estimate the thorium body content from exhaled thoron at population exposure levels. (780) Rundo and Toohey (1986) reported that measurements of 212Bi in the thorax and of exhaled thoron made on an employee of a ceramics firm showed no change over a period of 7 y. Mean values reported gave a value of 0.07 for the ratio of freely emanating 224Ra to retained 212Bi, similar to that reported by Rundo et al. (1981) for former thorium refinery workers. (781) Terry and Hewson (1993, 1995) measured thoron in the breath of 62 workers exposed to monazite dust in the mineral sands industry. For six of them, in-vivo measurements were also made of 228Ac, 212Pb, and 208Tl in the lungs. The authors estimated that, on average, 4.7% of the thoron produced in the lungs was exhaled. They also reported that (excluding data for the two workers with the lowest lung burdens) the mean ratio of the 911-keV 228Ac peak to the 2615-keV 208Tl peak was 1.42. They inferred that the 232Th decay series is not in secular equilibrium, but that up to 30% of the progeny radionuclides formed from 228Ac to 208Tl had translocated from the lungs. (782) Hodgson et al. (2000, 2003) measured the tissue distributions of 228Th, 212Pb, 212Bi, and 208Tl at times from 1 to 168 d after intratracheal instillation into rats of suspensions of 232Th dioxide enriched with 228Th in equilibrium with its progeny radionuclides, with geometric diameters of approximately 0.4 and 2 µm. There was little absorption of the thorium itself, consistent with assignment to Type S [see Section 14.2.1.1 (Part e)]. The activity of 212Pb in the lungs was approximately 50% and 80% of that of thorium at 1 d for the 0.4- and 2-µm particles, respectively, and 25% and 70% at later times. The lower concentrations of 212Pb were attributed to diffusion of 220Rn (thoron) and recoil of the progeny from alpha-particle decay, and the authors suggested that the concentration of 212Pb relative to that of 228Th would be even lower following deposition of ultrafine particles. These inferences are consistent with the conclusions of Coombs and Cuddihy (1983) (see above), although some more rapid dissolution of lead (and/or its precursors) than of thorium cannot be completely excluded. (783) Thus, consideration of the recoil range of progeny nuclei formed by alpha emission and measurements of emanation of such progeny radionuclides indicate that an important fraction is transferred from particles to the surrounding medium. Measurements of progeny radionuclide ratios to thorium seem broadly consistent with this model. The fraction decreases with increasing particle size and density, but is of the order of 10% for aerosols likely to be encountered in the workplace. However, as noted above, it was considered impractical to implement loss of progeny radionuclides by alpha recoil in the calculation of dose coefficients and bioassay functions in the OIR series [for further information, see OIR Part 1, Section 3.2.3, and Annex A (ICRP, 2015)]. Nevertheless, this phenomenon should be borne in mind, especially when using progeny radionuclides to monitor intakes and doses of thorium. (784) For calculation purposes, it is assumed that radon formed as a progeny within the respiratory tract escapes from the body at a rate of 100 d−1, in addition to other routes of removal (ICRP, 1995b). This rate was set as a convenient, arbitrary, rapid rate. The underlying assumption is that loss of radon is a continuous process, such as diffusion. The three radon isotopes in the natural decay series – 222Rn (radon), 220Rn (thoron), and 219Rn (actinon) – have half-lives of approximately 3.8 d, 56 s, and 4 s, and therefore decay rates of approximately 0.18, 1100, and 15,000 d−1, respectively. Hence, the assumption of a rate of loss of 100 d−1 implies that nearly all 222Rn escapes from the particles before it decays, approximately 10% of 220Rn escapes, and nearly all 219Rn decays within the particles. (785) The predicted transfer to lung air of approximately 10% of 220Rn formed is broadly consistent with observations that approximately 10% of the thoron produced in particles in the lungs is exhaled (see above). It was assessed here that most of the 220Rn entering lung air is exhaled.
2
However, the prediction that all of the 222Rn escapes from the particles is not supported by measurements of radon emanation coefficients (the fraction of radon atoms that escape from the particles in which they were formed) made on dust samples. Duport and Edwardson (1984) reported values between 0 and 0.5 for micron-sized samples of uranium ore dust. Kalkwarf et al. (1985) measured radon emanation coefficients in the range 0.001–0.1 for coal fly ash particles in sized fractions from less than 0.5 µm to 11–15 µm. They recognised that since the particles in their experiments were closely packed, some recoiling radon would be injected into adjacent particles, and emanation would be somewhat greater in the lungs. Strong and Levins (1982) measured the effect of moisture content on emanation of radon from uranium mine tailings. The radon flux from a column of powder was higher when it was moist than when it was dry; this was attributed to recoiling radon atoms being stopped in the water between particles (from which it subsequently diffused) rather than becoming trapped in other particles. The discussion assumed that the main mechanism of radon loss from particles was recoil following decay of the parent 226Ra. Thus, the assumption of a rate of transfer of radon from particles of 100 d−1 appears to be pragmatic; it is simple to apply and seems to predict exhalation of 220Rn (thoron) in broad agreement with observations, but probably overestimates loss of 222Rn from particles in the lungs.
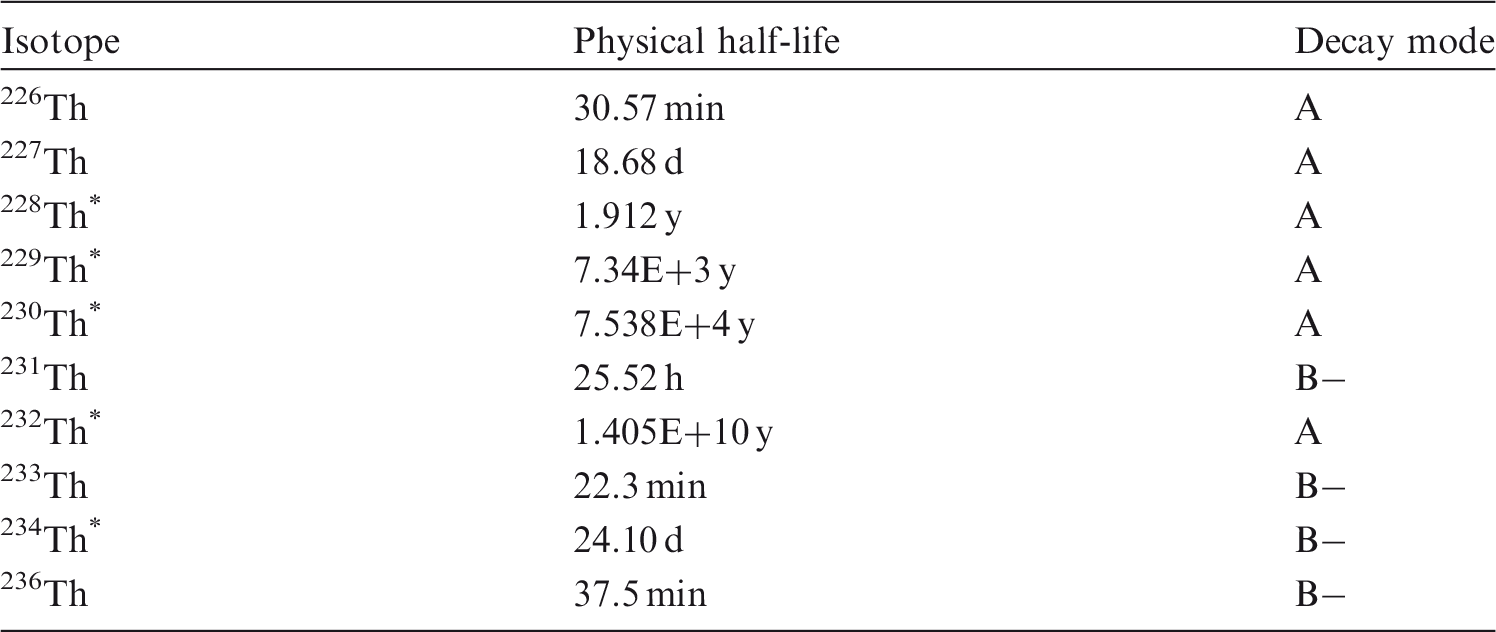
14.2.1.3. Rapid dissolution rate for thorium
(786) In the various studies of the biokinetic following deposition of water-soluble forms of thorium in the lungs, it was observed that only a fraction of ILD, usually less than 50%, was absorbed into blood, and that most of the absorption had taken place by the time of the first measurement of tissue distribution. The earliest measurements of distribution were made less than 1 h after inhalation of thorium chloride or citrate by rats, which indicated that the absorption rate corresponds to a time constant of less than 1 h (i.e. sr > 20 d−1). However, it was not very much greater because it appeared that clearance from the upper respiratory tract was mainly to the alimentary tract. Values of fr estimated here from the results of three experiments were 20, 70, and 90 d−1. A central value of 50 d−1 is adopted here, and applied to all Type F forms of thorium. However, as noted above, the results of studies of water-soluble forms of thorium (chloride, citrate, nitrate, sulphate) deposited in the lungs indicate that there are no commonly encountered Type F forms of thorium.
14.2.1.4. Extent of binding of thorium to the respiratory tract
(787) As noted above, in the various studies of the biokinetic following deposition of water-soluble forms of thorium in the lungs, it was observed that only a fraction of ILD, usually less than 50%, was absorbed into blood. Clearance from the lungs continued, with excretion mainly to faeces, indicating that the clearance was predominantly by particle transport, and that the thorium was retained in the lungs in particulate form, rather than in the bound state. Adequate fits to data were obtained here on that assumption. It is therefore assumed that the bound state can be neglected for thorium (i.e. fb = 0.0).
14.2.2. Ingestion
(788) Maletskos et al. (1969) measured the absorption of 234Th ingested as the sulphate in a mock ‘dial’ paint by six elderly humans. The values obtained were in the range 10−4 to 6 × 10⁻⁴ with a mean of 2 × 10⁻⁴. Estimates of thorium absorption have also been derived by Johnson and Lamothe (1989) from human data on skeletal content, dietary intake, estimated inhalation rates, and excretion data, giving values of less than 0.001–0.01. However, these estimates of absorption are uncertain because they are based on balance studies involving disparate data sources. Dang and Sunta (1990) questioned the higher uptake values reported by Johnson and Lamothe (1989), and reinterpreted the data used by them to suggest absorption values of approximately 0.001–0.002. Their own data for thorium concentrations in tissues, body fluids, and daily diet for urban Indian populations suggested values below 0.001. Roth et al. (2005) measured urinary excretion of 232Th in 11 adults who were not occupationally exposed. Comparison with reference intake values suggested that absorption was approximately 0.005. (789) There have been several reports of thorium absorption in rats and mice, with values of 5 × 10⁻⁵ to 6 × 10⁻³ for rats (Traikovich, 1970; Pavlovskaya et al., 1971; Sullivan, 1980), approximately 6 × 10⁻⁴ for mice (Sullivan, 1980; Sullivan et al., 1983), and 0.001 for fasted mice (Larsen et al., 1984). (790) In Publication 30 (ICRP, 1979), an absorption value of 2 × 10⁻⁴ was recommended on the basis of the study of Maletskos et al. (1969). In Publications 67 (ICRP, 1993) and 69 (ICRP, 1995a), because similar values have been obtained in more recent human studies on the absorption of plutonium, americium, neptunium, and curium, a general absorption value of 5 × 10⁻⁴ was adopted for dietary intake by adults for all actinides other than uranium. In Publication 68 (1994b), a value of 2 × 10⁻⁴ was applied to oxides and hydroxides, with 5 × 10⁻⁴ applied for all other chemical forms. An fA value of 5 × 10⁻⁴ is adopted here for all chemical forms.
14.2.3. Systemic distribution, retention, and excretion
14.2.3.1. Summary of the database
(a) Human subjects (791) Maletskos et al. (1966, 1969) examined the clearance of thorium from blood, and its retention and excretion after intravenous injection of 234Th citrate into normal human subjects in the age range 63–83 y. Detailed measurements were reported for three male and two female subjects (Maletskos et al., 1966). During the first day, thorium disappeared from blood with a half-time of a few hours. On average, approximately 10% of the injected amount remained in blood after 1 d, 3% after 2 d, 1.5% after 3 d, and 0.3% after 10 d. As indicated by whole-body counting and analysis of excreta, whole-body retention was greater than 90% of the injected amount at 3 weeks after injection. Cumulative urinary excretion represented 4.5–6.1% of the injected amount over the first 5 d after injection, and an additional 2–3% over the next 19 d. Little activity was lost in faeces during the first 5 d. The ratio of urinary to faecal excretion over the first 5 d averaged approximately 12 for the male subjects and 25 for the female subjects. External measurements indicated virtually no biological removal from the body during the period from 3 to 16 weeks after injection. There appeared to be no elevated accumulation of thorium in the liver compared with other soft tissues. (792) Long-term measurements of 227Th or 228Th in the bodies and excreta of accidentally exposed workers suggest a minimum biological half-time of 10–15 y for the total-body content (Rundo, 1964; Newton et al., 1981). Similar measurements on workers chronically exposed to thorium over one to three decades (Dang et al., 1992) suggest that the rate of removal of the systemic burden to urine was less than 1% y−1. (793) Stehney and Lucas (2000) reported concentrations of 232Th and activity ratios of 228Th to 232Th and 230Th to 232Th in autopsy samples from five subjects who had worked for 3–24 y at a thorium refinery. The time from the end of work to death ranged from 6 to 31 y. The subjects were presumably exposed primarily by inhalation. For three workers for whom analyses were available for both bone and liver, the 232Th content of total bone averaged approximately 20 times that of the liver based on the masses of the reference organs. For two workers for whom analyses were available for both liver and kidneys, the 232Th content of the liver averaged approximately 30 times that of the kidneys. In most samples, the activity ratios 228Th:232Th and 230Th:232Th were in the ranges 0.2–0.4 and 0.1–0.2, respectively. (794) Measurements of thorium isotopes in autopsy samples from non-occupationally exposed subjects (Wrenn et al., 1981; Ibrahim et al., 1983; Singh et al., 1983) indicate that the skeleton typically contains more than three-quarters of the systemic burden during or after chronic exposure to thorium. The reported contents of the liver and kidneys are variable but typically represent approximately 2–4% and 0.3–1%, respectively, of the systemic burden. These estimates are based on the assumption that muscle, fat, and skin do not accumulate more than 20% of the systemic content, as suggested by data on laboratory animals (Stover et al., 1960; Boecker et al., 1963; Thomas et al., 1963; Traikovich, 1970; Larsen et al., 1984). (795) Glover et al. (2001) reported detailed measurements of 232Th in tissues of a whole-body donor to the US Transuranium and Uranium Registries. The subject had no known occupational exposure to thorium, but had occupational intakes of plutonium and americium, and had been chelated with DTPA following an incident 19 y before his death. The authors estimated that the skeleton, liver, kidneys, and other soft tissues contained approximately 56%, 0.36%, 0.19%, and 43% of systemic 232Th. The ratio 156 for skeletal 232Th to liver 232Th estimated for this subject is substantially greater than values typically determined for human subjects with or without occupational exposure to 232Th. (b) Laboratory animals (796) Stover et al. (1960) studied the biological behaviour of 228Th in adult beagle dogs over a 1300-day period following its intravenous administration. Biological retention was approximately 88% of the injected amount at 3 weeks, 80–85% at 3 months, and 65–70% at 2.5 y. The urinary excretion rate was approximately four times the faecal excretion rate in the first few weeks, but the urinary to faecal excretion ratio gradually decreased and was close to 1 at 2.5 y after injection. Approximately 70%, 5%, and 3% of injected thorium deposited in the skeleton, liver, and kidneys, respectively. At times greater than 100 d after administration, approximately 80% of retained thorium was in the skeleton and approximately 20% was widely distributed in soft tissues, with relatively high concentrations in the liver and kidneys. There was little, if any, decline in the thorium content of compact bone over 1300 d or in trabecular bone over 800 d, but there was a noticeable decline in activity in trabecular bone over 800–1300 d after administration. The thorium content of the liver and kidneys declined considerably in the first several months after injection, but showed little or no decrease thereafter. Retention of thorium in the kidneys and its rate of urinary excretion at times remote from injection may have been affected by radiation damage at high dosage levels (Stover et al., 1960). (797) Comparison of the organ distributions of thorium isotopes in humans and beagles exposed to environmental levels alone indicate broad similarities in the long-term distributions of systemic thorium in the two species (Singh et al., 1988). There are also broad similarities in the patterns of distribution and excretion of injected thorium in human subjects (Maletskos et al., 1966, 1969) and beagles (Stover et al., 1960) at early times after administration. (798) The biokinetic of systemic thorium have been studied in various small mammals including rats, mice, guinea pigs, and rabbits (Scott et al., 1952; Boecker et al., 1963; Thomas et al., 1963; Traikovich, 1970; Larsen et al., 1984). In many cases, the administration of high concentrations of thorium apparently resulted in colloid formation and high deposition in the reticulo-endothelial system or in the tissue into which thorium was introduced (e.g. lung with intratracheal injection, or muscle with intramuscular injection). The results of such high-dose studies do not appear to be useful for determining the biokinetic of thorium after intake at levels likely to be encountered in the environment or in most occupational situations. (799) For tracer levels of thorium administered as the citrate to rats, deposition was considerably greater in bone than other systemic tissues (Thomas et al., 1963). Muscle and pelt accounted for approximately 20% of the systemic activity at 7–54 d post injection. (800) Boecker et al. (1963) found that the level of absorption of thorium to blood and its subsequent pattern of distribution and excretion following acute inhalation by rats did not depend on the initial lung content of inhaled thorium. The absorbed activity was deposited mainly in the skeleton. The liver content at 0–40 d was approximately 15–20% of the skeletal content, and the kidney content during that time was approximately 3% of the skeletal content. The content of pelt and muscle plus connective tissue was approximately the same as liver. The urinary to faecal excretion ratio increased gradually to a value of approximately 0.6–0.7 at 40–50 d post inhalation. (801) At 3 d after injection of thorium into mice, approximately 90% of the systemic burden was found in the skeleton, 6% in liver, 4% in kidneys, and 0.1% in reproductive organs (Larsen et al., 1984). A urinary to faecal excretion ratio of 16 was observed. The systemic distribution of thorium was essentially the same after gastrointestinal absorption as after intravenous injection.
14.2.3.2. Biokinetic model for systemic thorium
(802) The biokinetic model for systemic thorium used in this publication is the model applied to adult members of the public in Publication 69 (ICRP, 1995a) and to workers in Publication 68 (ICRP, 1994b). The model structure (Fig. 14.1) is the generic structure for bone-surface-seeking radionuclides. Parameter values for a reference worker are listed in Table 14.3. The primary parameter values such as compartment deposition fractions and biological half-times underlying the transfer coefficients given in Table 14.3 are summarised below. The conceptual basis of the model and the selection of parameter values are described by Leggett (1997). (803) In the following summary of the model, the ‘removal half-time’ from a compartment refers to the biological half-time that would be observed if there were no recycling to that compartment. This will generally differ from the apparent or ‘externally viewed’ half-time observed in the presence of recycling. Transfer coefficients from blood to various compartments are based on ‘deposition fractions’, which provide a convenient way to describe the initial distribution of activity leaving the circulation. (804) Blood is treated as a uniformly mixed pool. ST0 is a soft tissue pool that includes the extracellular fluids and exchanges material with blood over a period of days. ST0 is used to depict an early build-up and decline of material in soft tissues, and to account for early feedback of material to blood. ST0 is viewed as an integral part of the early circulation of thorium. In the summary of parameter values below, deposition fractions for compartments other than ST0 are given in terms of activity ‘leaving the circulation’, and refer to the division of thorium among compartments other than ST0. (805) The removal half-time from blood is assumed to be 0.25 d, corresponding to a total transfer coefficient (the sum of transfer coefficients to all repositories) of ln(2)/0.25 d = 2.7726 d−1, where ln(2) is the natural logarithm of 2. Since 30% of this goes to ST0, the transfer coefficient from blood to ST0 is 0.3 × 2.7726 d−1 = 0.8318 d−1. Transfer coefficients from blood to other compartments are based on deposition fractions described below and the rate at which thorium leaves the circulation, which is taken to be the total transfer coefficient from blood to all compartments minus the transfer coefficient from blood to ST0: 2.7726 d−1 – 0.8318 d − 1 = 1.9408 d−1. For example, the transfer coefficient from blood to a compartment with a deposition fraction of 0.01 is 0.01 × 1.9408 d−1 = 0.019408 d−1, before rounding. (806) It is assumed that 70% of thorium leaving the circulation deposits on bone surfaces. One-half of the deposited amount is assigned to trabecular bone surfaces and one-half is assigned to cortical bone surfaces. The fate of thorium after its deposition on bone surfaces is described by the generic model for bone-surface-seeking radionuclides. That is, the rate of translocation of skeletal deposits is controlled by bone-restructuring processes. The transfer coefficient from a bone surface or volume compartment to the corresponding bone marrow compartment is the rate at which that type of bone surface is resorbed. The transfer coefficient from a bone surface compartment to the corresponding bone volume compartment is one-half of the surface formation rate. A common rate (referred to as the ‘bone turnover rate’) is used for both bone formation and bone resorption, and is applied to both surface and volume remodelling. Bone turnover rates used here are reference values for adults given in Publication 89 (ICRP, 2002). The removal half-time from bone marrow to blood is assumed to be 0.25 y. (807) The liver is divided into compartments representing hepatocytes (Liver 1) and reticulo-endothelial cells (Liver 2). The deposition fraction assigned to the liver is 0.05. Thorium depositing in the liver is assigned to Liver 1. The removal half-time from Liver 1 is 1 y. Half (50%) of the activity leaving Liver 1 is assigned to Liver 2, 25% is assigned to blood, and 25% is assigned to small intestine contents (representing biliary secretion). The long-term retention compartment, Liver 2, is assumed to lose activity to blood with a biological half-time of 9 y. In addition to endogenous faecal excretion of thorium via liver bile, it is assumed that 0.5% of thorium leaving the circulation is secreted into right colon contents, and subsequently excreted in faeces. (808) The kidneys are assumed to consist of two compartments, one with relatively short retention and one with relatively long retention. These compartments are referred to as ‘urinary path’ and ‘other kidney tissue’, respectively. Urinary path receives thorium from blood and loses activity to urinary bladder contents. Other kidney tissue receives thorium from blood and loses thorium to blood. It is assumed that 3.5% of thorium leaving the circulation deposits in urinary path and 1% deposits in other kidney tissue. The removal half-time from urinary path to urinary bladder contents is 15 d. The removal half-time from other kidney tissue is 5 y. It is further assumed that 5.5% of activity leaving the circulation moves instantaneously through the kidneys and deposits in urinary bladder contents. Hence, a total of 9% of thorium leaving the circulation is assumed to enter urinary excretion pathways. (809) The model describing uptake and removal of thorium by the gonads is the default model for the actinide elements. It is assumed that deposition in the gonads, expressed as a percentage of thorium leaving the circulation, is 0.001% g−1 gonadal tissue. This yields depositions of 0.035% and 0.011% of thorium leaving the circulation in the 35-g testes of the reference adult male and 11-g ovaries of the reference adult female (ICRP, 2002). The removal half-time from gonads to blood is assumed to be 5 y. (810) Other soft tissues are divided into compartments ST0, ST1, and ST2 representing fast, moderate, and slow return of thorium to blood, respectively. These compartments and associated parameter values are defined on a kinetic basis and are not physically identifiable entities. They are based mainly on observations of the time-dependent content of soft tissues other than liver and kidneys following intravenous administration of thorium to laboratory animals. As described earlier, it is assumed that 30% of outflow from blood deposits in ST0. It is assumed that 2% of activity leaving the circulation deposits in ST2. The percentage left over after all other deposition fractions in the model have been chosen, amounting to approximately 12.5% of thorium leaving the circulation, is assigned to the intermediate-turnover soft tissue compartment ST1. The removal half-times from ST0, ST1, and ST2 are 1.5 d, 2 y, and 100 y, respectively.
14.2.3.3. Treatment of radioactive progeny
(811) The progeny of thorium isotopes addressed in the derivation of dose coefficients are isotopes of actinium, thorium, protactinium, uranium, radium, radon, polonium, lead, bismuth, thallium, francium, and astatine. The model for uranium produced by serial decay of members of a uranium chain is a modification of the model for uranium as a parent radionuclide (see Section 15). Single compartments representing spleen, trabecular marrow, cortical marrow, testes, ovaries, and skin are added for consistency with the models for other progeny of thorium. The six added compartments are taken from the intermediate-term soft tissue compartment ST1 in the model for uranium as a parent. Deposition of uranium as a progeny in spleen, trabecular marrow + cortical marrow (i.e. total combined marrow), testes, ovaries, or skin is calculated as its mass fraction of other soft tissues times the deposition fraction for ST1 (0.0665 of uranium ‘leaving the circulation’, as defined in Section 15). Deposition in trabecular marrow is assumed to be three times greater than deposition in cortical marrow. The derived transfer cofficients from blood to spleen, trabecular marrow, cortical marrow, testes, ovaries, and skin are 0.004 d−1, 0.075 d−1, 0.025 d−1, 0.001 d−1, 0.0003 d−1, and 0.09 d−1, respectively. The removal half-time from each added compartment is set at 20 d, the removal half-time from ST1. The deposition fraction for ST1 is reduced by the sum of deposition fractions for the six added compartments. Uranium produced in a soft tissue compartment that is not identifiable with a compartment in the characteristic model for uranium is assumed to transfer to plasma at the rate 8.32 d−1, the highest rate of loss from any compartment of other soft tissue in the characteristic model for uranium. Uranium produced in a bone volume compartment that is ambiguous with regard to the uranium model (e.g. trabecular or cortical bone volume in the thorium model) is assumed to be produced in non-exchangeable bone. (812) The models for actinium, thorium, radium, radon, polonium, lead, bismuth, thallium, francium, and astatine produced systemically by serial decay of members of a thorium chain are the same as the models applied to these elements as progeny of radium (see Section 13). The model for thorium as a radium progeny is applied to protactinium as a thorium progeny based on the similar systemic behaviours of protactinium and thorium in rats (Lanz et al., 1946; Schuppler et al., 1988; Durbin, 2011). A radionuclide produced in a bone volume compartment that is ambiguous with regard to the model for that element (e.g. radium produced in trabecular or cortical bone volume in the thorium model) is assumed to be produced in non-exchangeable bone.
14.3. Individual monitoring
14.3.1. 228Th
(813) 228Th monitoring techniques include urine and faeces bioassay. Care must be taken when interpreting intakes of 228Th through measurements of the nuclide concentrations in excreta samples due to the presence of natural thorium. The monitoring results of 228Th in excreta samples of occupationally exposed personnel should be compared with the background excreta thorium concentrations of the local population by statistical techniques. A baseline might be established for an individual or for the bioassay monitoring programme. (814) 228Th itself cannot be detected directly by in-vivo measurement. The body content of 228Th can be inferred from the measurement of the gamma emissions of the progeny radionuclides, 212Pb and 208Tl. Assumptions concerning the equilibrium ratio between 228Th and its progeny radionuclides are required. The ratios of progeny radionuclide activities to 228Th in the source material are important. Depending on these ratios, monitoring done immediately after exposure might be strongly influenced by inhaled 220Rn. The biokinetic of 212Pb in the lung should be considered, as 212Pb might have a faster clearing rate from the lungs than thorium. (815) In addition, as explained in Section 14.2.1.2, a fraction of the progeny radionuclides formed within the lung will leave the lung at a faster clearance rate, not taken into account in the bioassay functions described in the OIR series. The underestimation due to the loss of progeny radionuclides by alpha recoil should be added to the uncertainty of the result. (816) Measurement of thoron (220Rn) in breath is a potentially useful technique for determining lung burdens of 228Th. The uncertainties in the assessment of lung burdens are difficult to quantify and may underestimate the lung burdens, as explained in Section 14.2.1.2 (Part c). Lung content (212Pb measured) and daily urinary and faecal excretion of 228Th following inhalation of 1 Bq Type F.
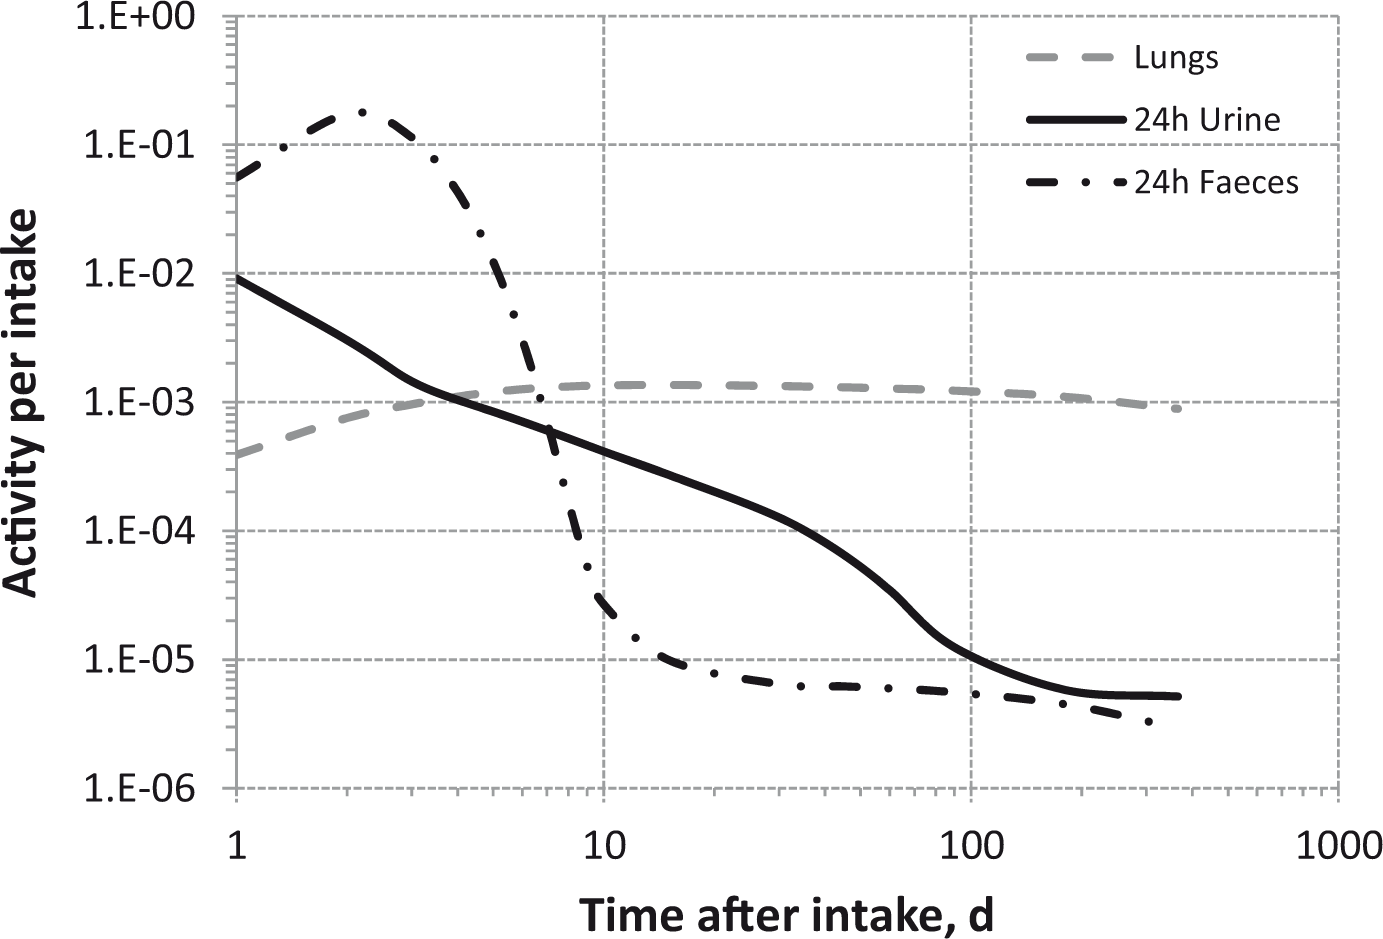
14.3.2. 229Th
(817) Urine bioassay is used to determine 229Th intakes.
14.3.3. 230Th
(818) 230Th intake is determined though urine and faeces bioassay.
14.3.4. 232Th
(819) Intakes of 232Th are determined by in-vitro bioassay of urine samples, complemented or not by analysis of faeces. In general, it is necessary to use the most sensitive measurement technique to be able to detect 232Th exposures at the investigation levels. As thorium is a nuclide naturally present in the environment and in the diet, excretion rates of natural thorium are expected and should be evaluated for the population in the region of residence of the workers. This is especially important for the interpretation of faeces sample results. The monitoring results of 232Th in excreta samples of occupationally exposed personnel should be compared with the background excreta thorium concentrations of the local population by statistical techniques. A baseline might be established for an individual or for the bioassay monitoring programme. (820) 232Th itself cannot be detected directly by in-vivo measurement. In-vivo lung counting is performed using the measurement of its progeny radionuclides. Assessment of 232Th lung content by measurement of the gamma emissions of progeny nuclides is not straightforward. It depends on equilibrium assumptions in the source material to which the worker is exposed and on the biokinetic of the chain members in the lung. For sources of exposure in which 232Th is presumed to be in equilibrium with the progeny radionuclides, 228Ac is generally chosen to be measured because no assumptions about 220Rn are needed to calculate the corresponding 232Th activity. As explained in Section 14.2.1.2, 228Ra and 228Ac have faster clearing rates from the lungs than thorium. In addition, a fraction of the progeny radionuclides formed within the lungs will leave the lungs in a faster clearing rate, not taken into account in the bioassay functions described in the OIR series. The underestimation due to the loss of progeny radionuclides by alpha recoil should be added to the uncertainty of the result. (821) When the source of exposure is a purified thorium source, containing 232Th and 228Th alone in equal quantities immediately after purification, 228Ac will not be measurable for a long time. On the other hand, in approximately 3 weeks, 212Pb will be in equilibrium with 228Th, and may be used to assign intakes, keeping in mind the uncertainties on underestimation of thorium due to the faster clearing rate of the progeny radionuclides formed within the lungs. If the 232Th source is purified again, depending on the amount of 228Th which is left, the measurement of 212Pb will underestimate the 232Th, and may not even be useful for screening. (822) Thus, in order to estimate 232Th content using lung monitoring of the progeny radionuclides, it is necessary to know the ratios of progeny activities to 232Th in the source of exposure. In addition, the biokinetic of progeny radionuclides in the lungs should be evaluated carefully. (823) Measurement of thoron (220Rn) in breath is a potentially useful technique for determining lung burdens of 232Th. The uncertainties in the assessment of lung burdens are difficult to quantify and may underestimate the lung burdens, as explained in Section 14.2.1.2 (Part c).
14.3.5. 234Th
(824) 234Th is a gamma emitter. Its intake may be determined through bioassay analysis of urine samples or though in-vivo lung counting.
14.4. Dosimetric data for thorium
Lung content (212Pb measured) and daily urinary and faecal excretion of 228Th following inhalation of 1 Bq Type M. Lung content (212Pb measured) and daily urinary and faecal excretion of 228Th following inhalation of 1 Bq Type S. Daily urinary excretion of 229Th following inhalation of 1 Bq of water-soluble forms, including thorium chloride, citrate, nitrate, and sulphate; thorium fluoride. Daily urinary excretion of 229Th following inhalation of 1 Bq Type F. Daily urinary excretion of 229Th following inhalation of 1 Bq Type M. Daily urinary excretion of 229Th following inhalation of 1 Bq Type S. Daily urinary and faecal excretion of 230Th following inhalation of 1 Bq of water-soluble forms, including thorium chloride, citrate, nitrate, and sulphate; thorium fluoride. Daily urinary and faecal excretion of 230Th following inhalation of 1 Bq Type F. Daily urinary and faecal excretion of 230Th following inhalation of 1 Bq Type M. Daily urinary and faecal excretion of 230Th following inhalation of 1 Bq Type S. Lung content (228Ac measured) and daily urinary and faecal excretion of 232Th following inhalation of 1 Bq of water-soluble forms, including thorium chloride, citrate, nitrate, and sulphate; thorium fluoride. Lung content (228Ac measured) and daily urinary and faecal excretion of 232Th following inhalation of 1 Bq Type F. Lung content (228Ac measured) and daily urinary and faecal excretion of 232Th following inhalation of 1 Bq Type M. Lung content (228Ac measured) and daily urinary and faecal excretion of 232Th following inhalation of 1 Bq Type S. Lung content and daily urinary excretion of 234Th following inhalation of 1 Bq of water-soluble forms, including thorium chloride, citrate, nitrate, and sulphate; thorium fluoride. Lung content and daily urinary excretion of 234Th following inhalation of 1 Bq Type F. Lung content and daily urinary excretion of 234Th following inhalation of 1 Bq Type M. Lung content and daily urinary excretion of 234Th following inhalation of 1 Bq Type S.
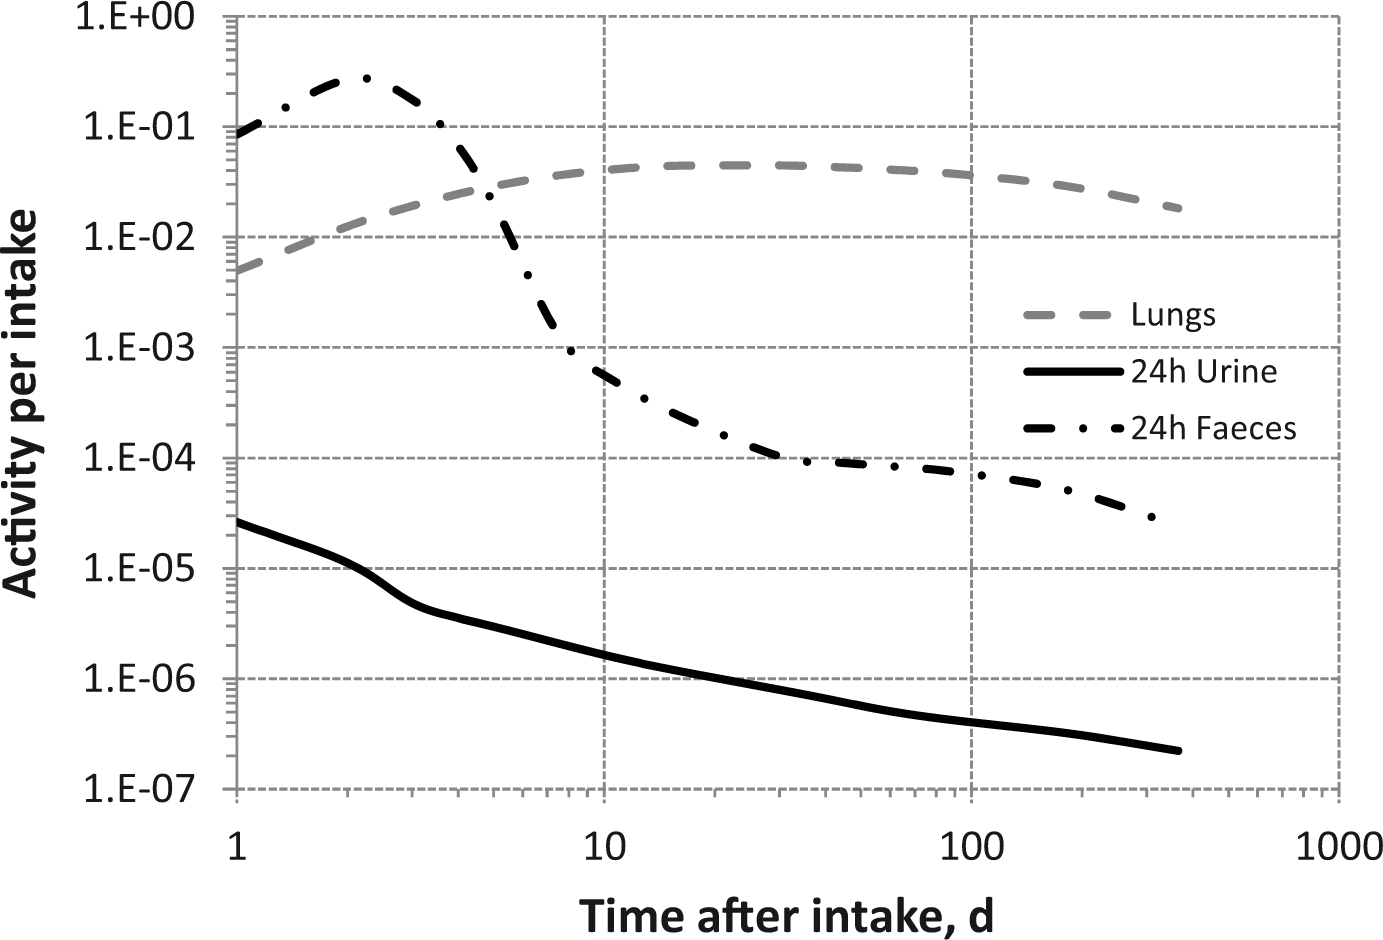
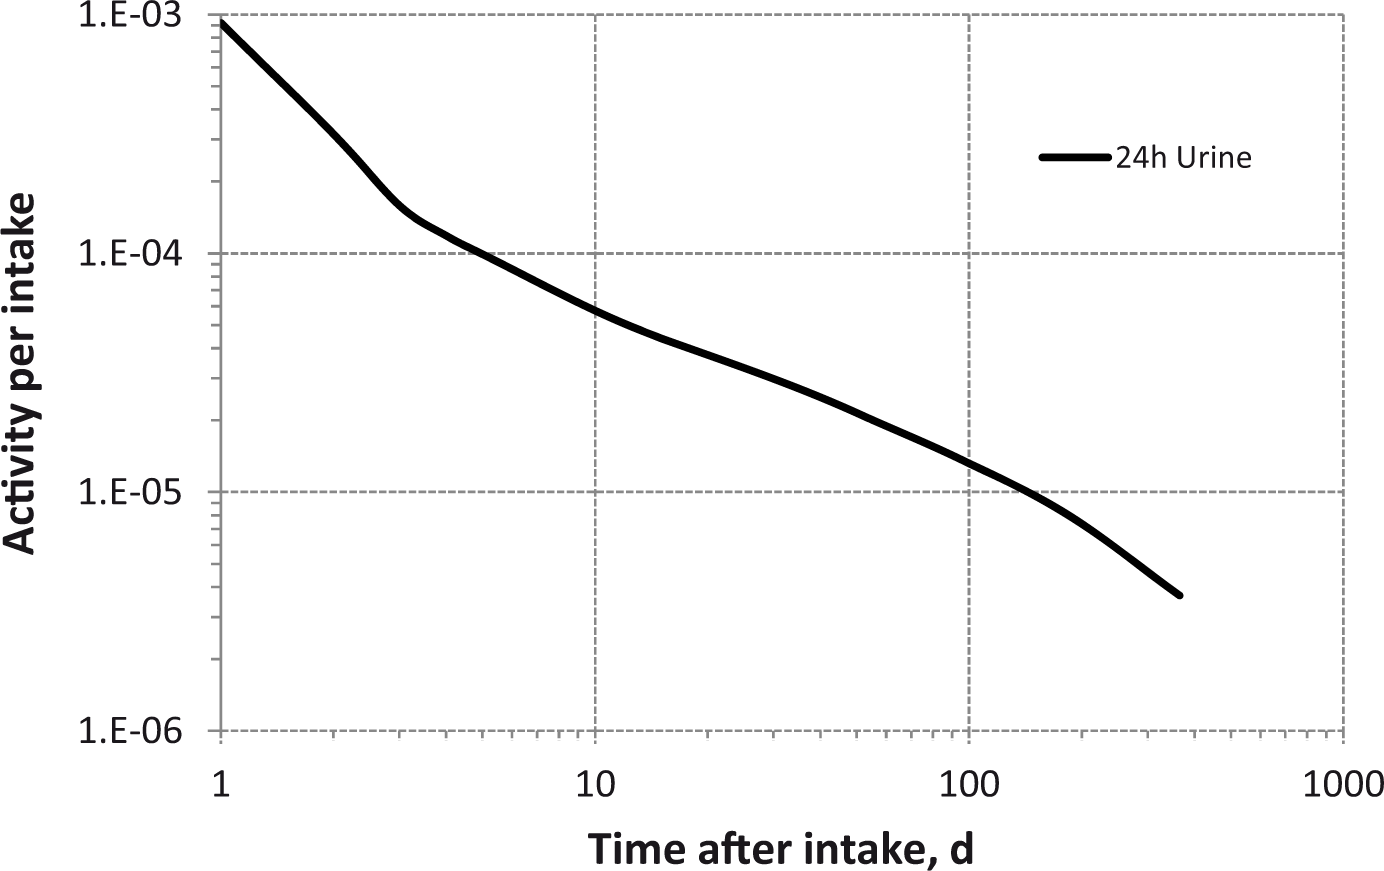


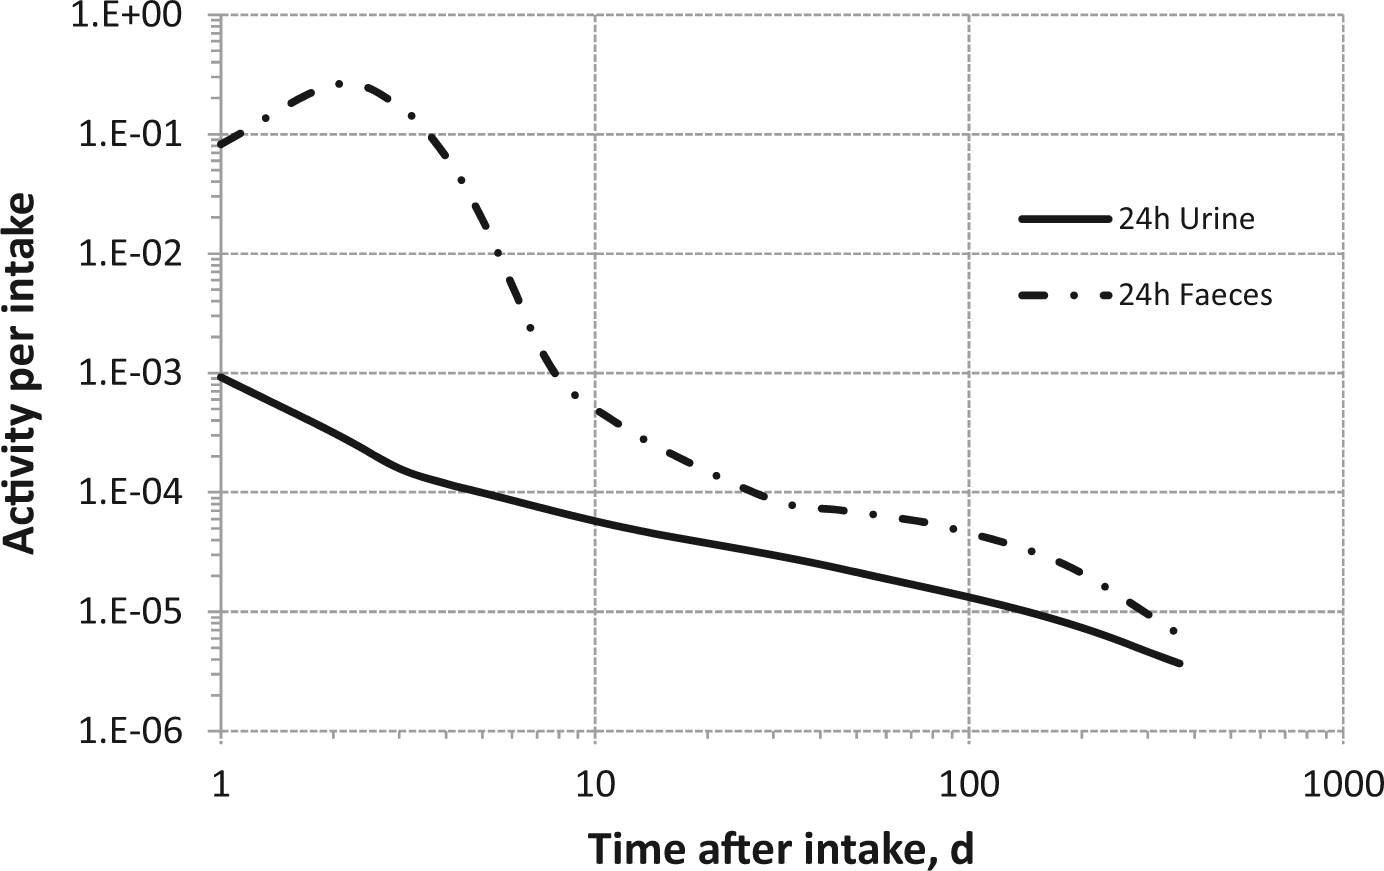


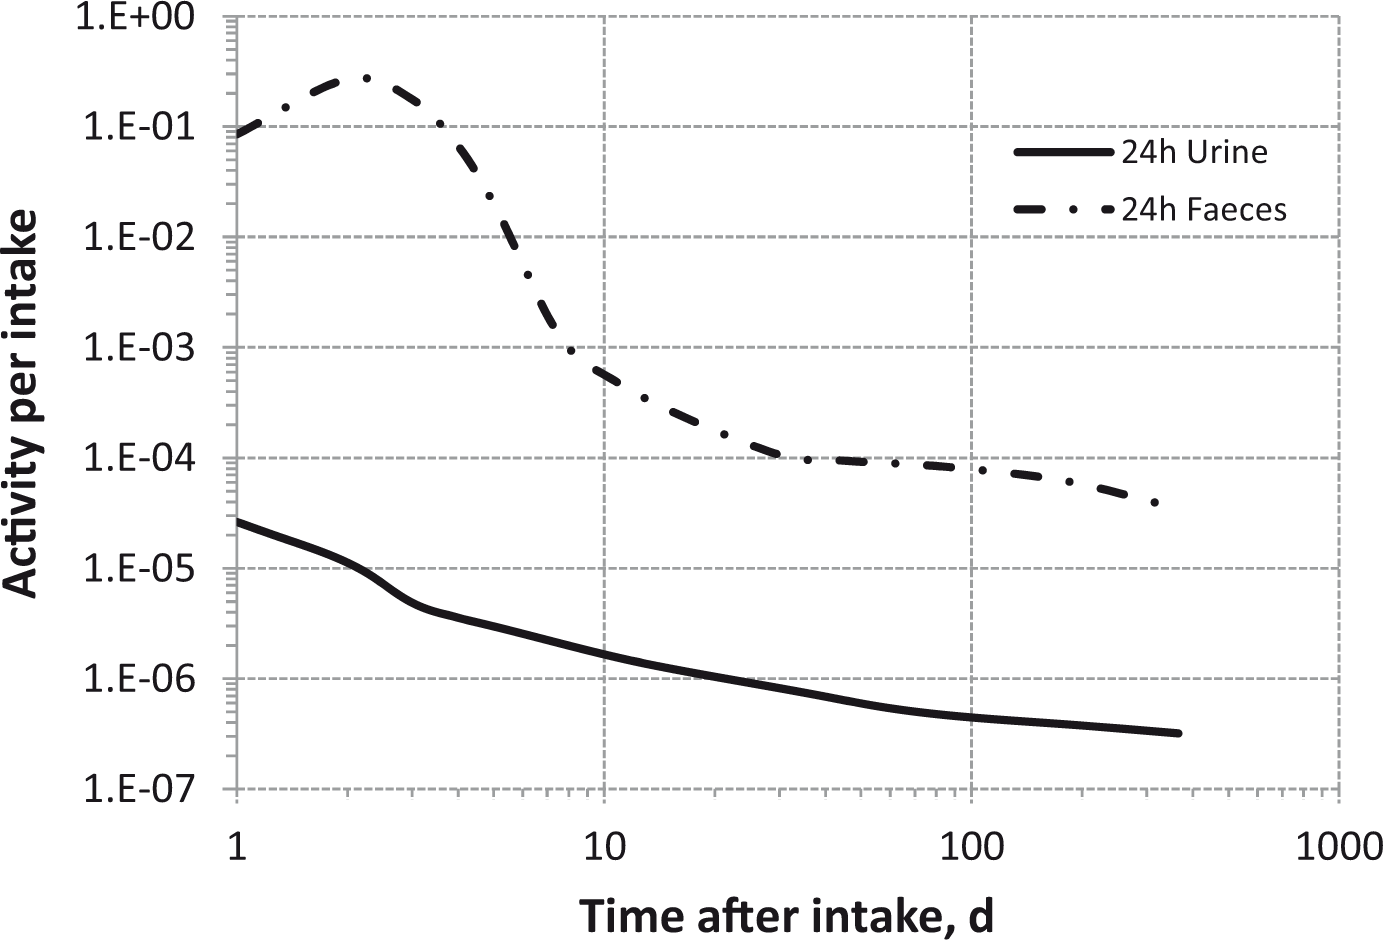


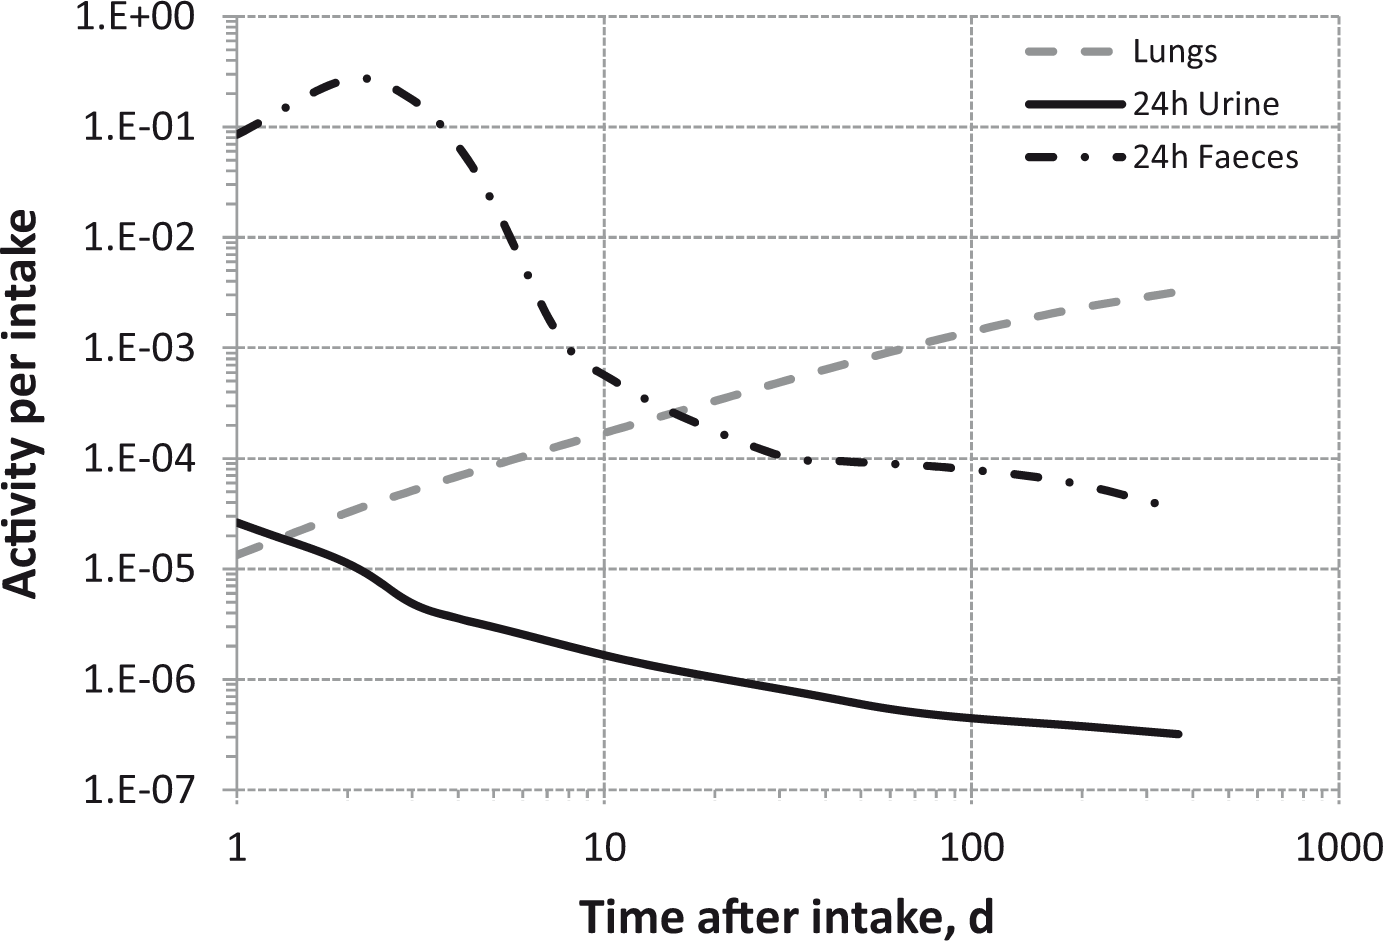


14.5. References
15. URANIUM (Z = 92)
15.1. Chemical forms in the workplace
(825) Uranium is an actinide element that occurs mainly in oxidation states IV and VI. It is encountered in industry in a variety of chemical and physical forms, including oxides (UO3, UO4, UO2, U3O8, uranates), inorganic salts (nitrates, chlorides, fluorides, carbonates, phosphates), and some organic compounds (acetylacetonate, tri-butyl-phosphate). Some forms, notably the metal, carbide, and oxide, may be encountered as depleted (∼0.2% 235U), natural (0.7% 235U), or enriched (>0.7% 235U) uranium. The chemical behaviour of any given uranium compound will be similar irrespective of whether it is present in natural, depleted, or enriched form. Depleted uranium has found use as a shielding material in aeronautics and military applications, such as counterweights for aircraft control surfaces. 238U, 235U, and 234U are the three major isotopes, and 235U is typically the main fissile material for nuclear power reactors.
Structure of the model for systemic uranium. RBC, red blood cells; GI, gastrointestinal; exch, exchangeable; nonexch, non-exchangeable. ST0, ST1, and ST2 represent soft tissues with fast, intermediate, and slow turnover, respectively. Isotopes of thorium addressed in this publication. A, alpha decay; B−, beta-minus decay. Dose coefficients and bioassay data for these radionuclides are given in the printed copy of this publication. Data for other radionuclides listed in this table are given in the accompanying electronic annex. Absorption parameter values for inhaled and ingested thorium. It is assumed that the bound state can be neglected for thorium, i.e. fb = 0.0. The value of sr for Type F forms of thorium (50 d–1) is element-specific. The values for Types M and S (3 d–1) are the general default values. For inhaled material deposited in the respiratory tract and subsequently cleared by particle transport to the alimentary tract, the default fA values for inhaled materials are applied; i.e. the (rounded) product of fA for the absorption type (or specific value where given) and the fA value for ingested soluble forms of thorium (5 × 10⁻⁴). See text for summary of information on which parameter values are based, and on ranges of parameter values observed for individual materials. For water-soluble forms of thorium, specific parameter values are used for dissolution in the lungs, but the default value of fA. Materials (e.g. thorium hydroxide) are listed here where there is sufficient information to assign to a default absorption type, but not to give specific parameter values (see text). Default Type S is recommended for use in the absence of specific information on which the exposure material can be assigned to an absorption type; for example, if the form is unknown, or if the form is known but there is no information available on the absorption of that form from the respiratory tract. Activity transferred from systemic compartments into segments of the alimentary tract is assumed to be subject to re-absorption to blood. The default absorption fraction fA for the secreted activity is the reference fA (5 × 10⁻⁴) for ingestion of the radionuclide. Transfer coefficients in the biokinetic model for systemic thorium. ST0, ST1, and ST2 represent soft tissues with fast, intermediate, and slow turnover, respectively. *‘Urinary path’ in Fig. 14.1. ‘Other kidney tissue’ in Fig. 14.1. Monitoring techniques for 228Th. Detection limit values for lung measurement refer to 212Pb measurement. Monitoring techniques for 229Th. Monitoring techniques for 230Th. Monitoring techniques for 232Th. ICP-MS, inductively coupled plasma mass spectrometry. 7.37 × 10⁻⁸ g L−1 = 0.3 mBq L−1. 1.47 × 10⁻⁸ g L−1 = 0.06 mBq L−1. Detection limit values refer to 228Ac measurement. Monitoring techniques for 234Th. Committed effective dose coefficients (Sv Bq−1) for the inhalation or ingestion of 228Th, 229Th, 230Th, 232Th, and 234Th compounds. AMAD, activity median aerodynamic diameter. Dose per activity content of 228Th in lungs (212Pb measured) and in daily excretion of urine and faeces (Sv Bq−1); 5-µm activity median aerodynamic diameter aerosols inhaled by a reference worker at light work. Dose per activity content of 229Th in daily excretion of urine (Sv Bq−1); 5-µm activity median aerodynamic diameter aerosols inhaled by a reference worker at light work. Dose per activity content of 230Th in daily excretion of urine and faeces (Sv Bq−1); 5-µm activity median aerodynamic diameter aerosols inhaled by a reference worker at light work. Dose per activity content of 232Th in lungs (228Ac measured) and in daily excretion of urine and faeces (Sv Bq−1); 5-µm activity median aerodynamic diameter aerosols inhaled by a reference worker at light work. Dose per activity content of 234Th in lungs and in daily excretion of urine (Sv Bq−1); 5-µm activity median aerodynamic diameter aerosols inhaled by a reference worker at light work. NA, not applicable. (826) It should be noted that intakes of the more readily absorbed uranium compounds are limited by considerations of chemical toxicity rather than radiation dose (ICRP, 1997; ATSDR, 1999, 2011; Royal Society, 2001, 2002; WHO, 2001, 2004, 2006, 2011; Ansoborlo et al., 2015). Isotopes of uranium addressed in this publication. A, alpha decay; EC, electron-capture decay; IT, isomeric transition decay; B−, beta-minus decay; SF, spontaneous fission. Dose coefficients and bioassay data for these radionuclides are given in the printed copy of this publication. Data for other radionuclides listed in this table are given in the accompanying electronic annex.
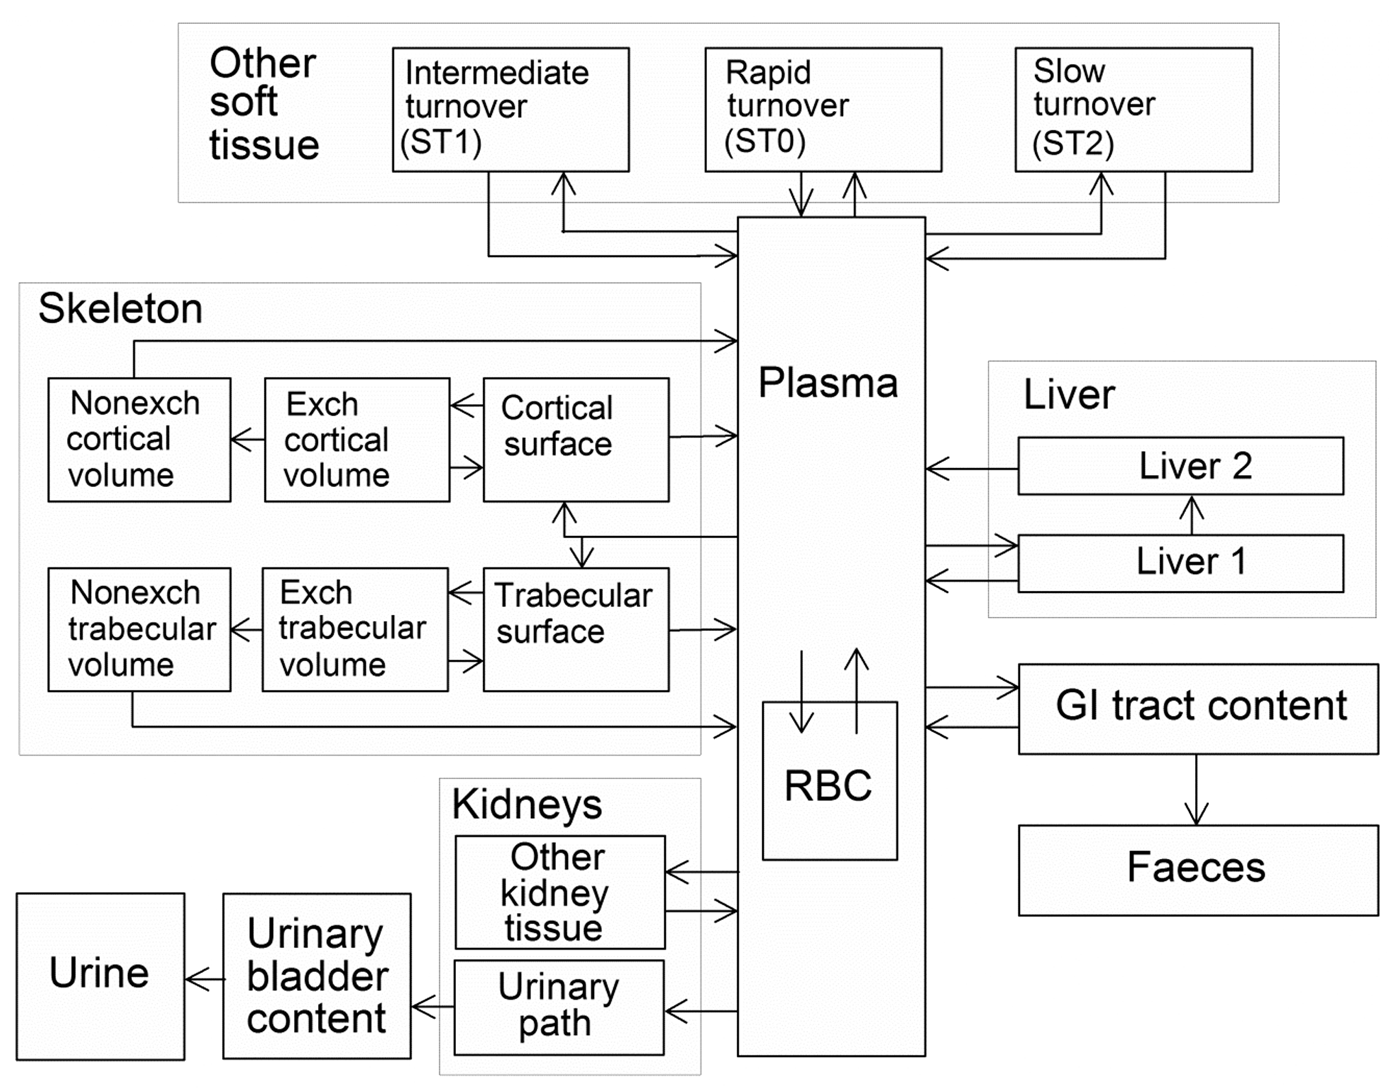


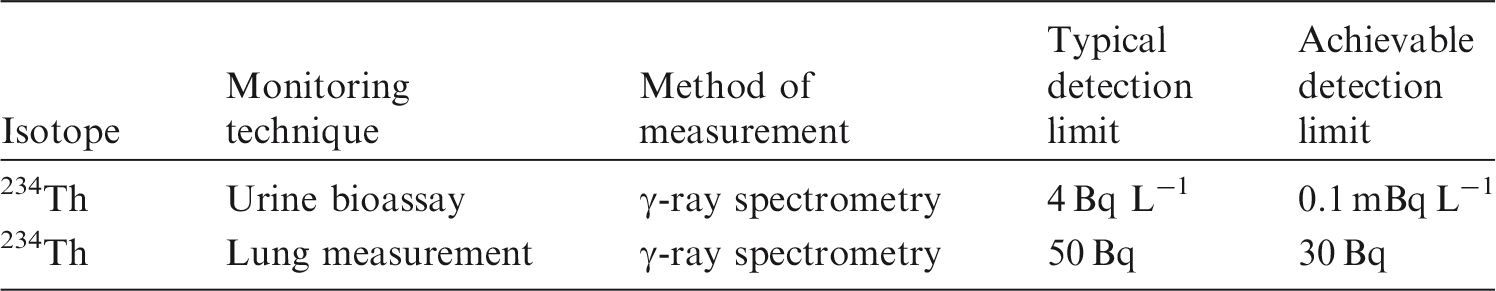


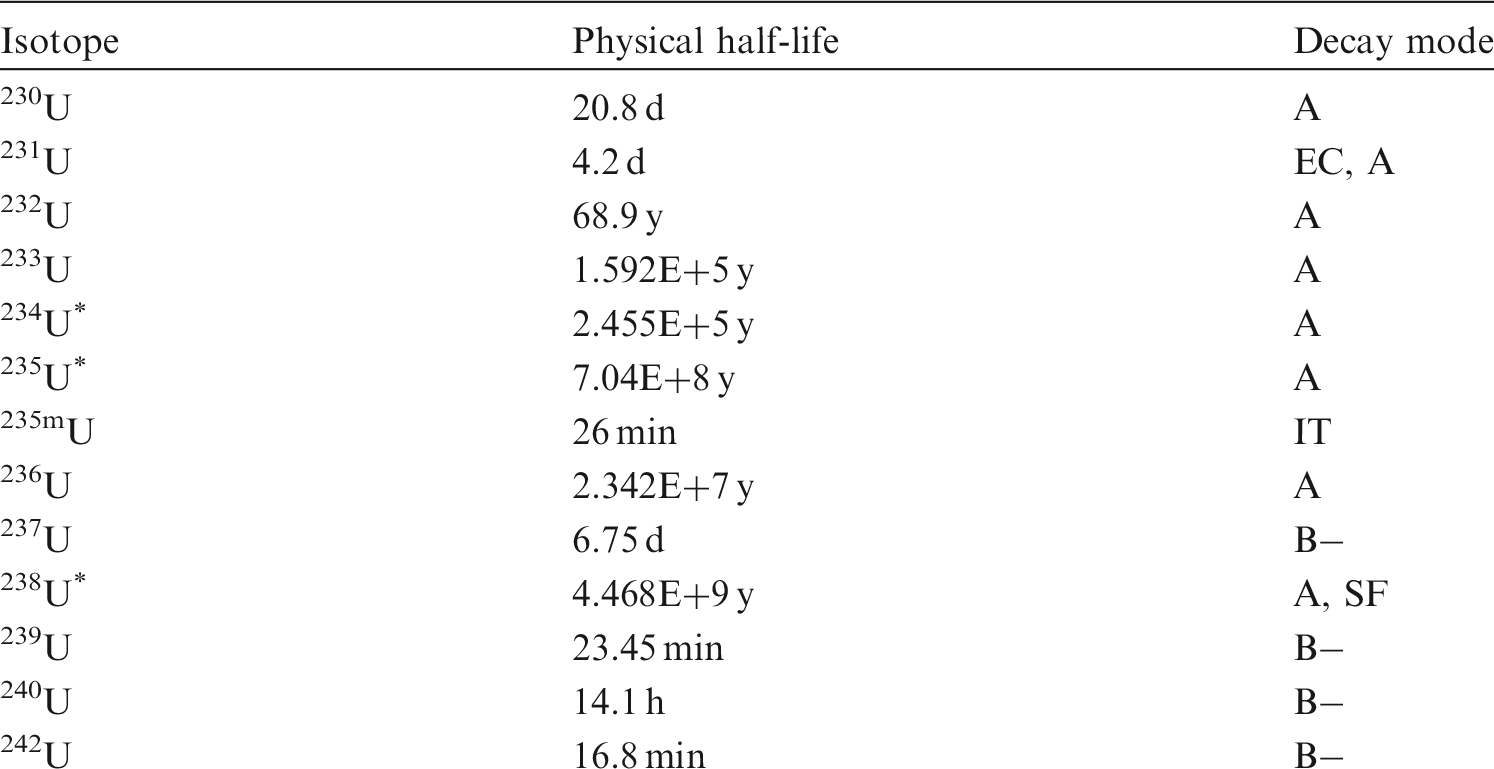
15.2. Routes of intake
15.2.1. Inhalation
(827) There is extensive information available on the behaviour of uranium after deposition in the respiratory tract from animal experiments (mainly in rats), in-vitro dissolution studies, and some accidental human intakes. Much of this information has been obtained since the issue of Publication 30 (ICRP, 1979). Absorption parameter values have been derived from the results of animal and in-vitro studies for a wide range of compounds encountered in the nuclear fuel industry. Ansoborlo et al. (2002) and Stradling et al. (2002) compiled absorption parameter values derived from the results of a large number of in-vivo and in-vitro studies carried out on materials from French and UK nuclear fuel fabrication facilities. More recently, Davesne and Blanchardon (2014) compiled published values of HRTM absorption parameters and aerosol size distributions for uranium compounds in different workplaces. (828) As described below, specific parameter values based on in-vivo data could be derived for several materials. Four of them – uranium nitrate, peroxide, trioxide, and ammonium diuranate – are relatively soluble, and their behaviour is intermediate between that represented by Type F and Type M defaults. The values derived were sufficiently different from either Type F or Type M to justify providing specific values. However, the values for the four materials were similar to each other, and analysis here (i.e. by the Task Group) showed that dose coefficients and bioassay functions calculated from them were also similar. Given the uncertainties in the parameter values, a single set ‘Intermediate Type F/M' is provided for these four materials. Similarly, dose coefficients and bioassay functions calculated from the parameter values derived for the relatively insoluble materials uranium octoxide and dioxide were similar, and intermediate between those of Types M and S. A single set ‘Intermediate Type M/S' is therefore provided for these two materials. (829) Absorption parameter values and types, and associated fA values for particulate forms of uranium are given in Table 15.2. Observations and model predictions of cumulative urinary uranium in human subjects as a function of time after intravenous injection with uranium isotopes (Leggett, 1994). The three study groups indicated in the legend are described in the text.

15.2.1.1. Particulate materials
(a) Uranium hexafluoride (UF6)
(830) Uranium hexafluoride exists in vapour form, but it is converted to uranyl fluoride (UO2F2) aerosol in the presence of water in the atmosphere and in the respiratory tract. Generally, any exposure would be to both chemical forms simultaneously, and also to hydrogen fluoride fumes. Hence, the mixture is treated here as an aerosol rather than a vapour. In experiments with beagle dogs (Morrow et al., 1982), 80% ILD of uranium was absorbed into blood within 20 min. The rapid urinary excretion observed after accidental inhalation exposures by humans (Boback, 1975; Beau and Chalabreysse, 1989; Fisher et al., 1991) indicates assignment to default Type F. The rapid absorption half-time was estimated here to be 45 min (sr = 22 d−1) from the data of Fisher et al. (1991). Absorption parameter values derived here from urinary excretion data presented by Beau and Chalabreysse (1989) are fr = 1 and sr = 1.6 d−1. Bailey and Davis (2002) derived absorption parameter values of fr = 1 and sr = 1.5 d−1 from daily urinary excretion data presented by Moore and Kathren (1985) for an accidental intake by a worker (Case G) described by Boback (1975). However, the detailed data for the first 2 d after exposure reported by Boback (1975) show faster absorption (sr∼100 d−1) of much of the uranium. Avtandilashvili et al. (2015) reported post-mortem measurements of uranium concentration and isotopic atom ratios in tissues taken from a US Transuranium and Uranium Registries donor (Case 1031) who died 65 y after acute inhalation exposure to uranium hexafluoride. The case history and early urine measurements were described by Moore and Kathren (1985, Case B) and Kathren and Moore (1986, Case 4). The post-mortem measurements indicated some long-term retention of slightly enriched uranium in the lungs and lymph nodes. The authors analysed the tissue measurements and historical urine data using the HRTM and the Publication 69 (ICRP, 1995) uranium systemic model. Maximum-likelihood analysis gave a mixture of 86% Type F and 14% Type S. Bayesian analysis (assuming sr∼100 d−1) gave median values of fr of approximately 0.7 and ss of approximately 2 × 10⁻⁴ d−1, but with wide ranges, especially for fr. These values are not adopted here because they come from a single case and there was respiratory tract damage associated with the exposure. Similarly, in view of the wide range of values of sr derived from the other studies above, the data are judged to be an insufficient basis to provide specific absorption parameter values, and UF6 is therefore assigned to Type F. (b) Uranyl tri-butyl-phosphate (831) Tri-n-butyl-phosphate is used extensively as an extractant during fabrication of nuclear fuel, and for the separation of uranium and plutonium during reprocessing. After administration of uranyl tri-butyl-phosphate to rats by intratracheal instillation, 80–90% of the uranium was absorbed into blood by approximately 1 d after exposure (Pellow et al., 1996, 1997). Absorption parameter values derived from the results by Stradling et al. (2002) were fr = 0.97, sr = 12 d−1, and ss = 0.0021 d−1, giving assignment to Type F. (832) These data (only one instillation study) are judged to be an insufficient basis to provide specific absorption parameter values, and uranyl tri-butyl-phosphate is therefore assigned to Type F. (c) Uranyl nitrate (UO2(NO3)2) (833) Uranyl nitrate in aqueous solution is widely encountered in nuclear fuel fabrication and reprocessing. Ballou et al. (1986) followed the biokinetic of 232U and 233U in rats for 200 d after inhalation of aerosols of aqueous uranyl nitrate solution; 15–45% ILD was retained in the lungs at 30 d, depending on particle size, supporting assignment to default Type M. Measurements made after intratracheal instillation into rat lungs are consistent with assignment to default Type F (Cooper et al., 1982; Ellender, 1987; Stradling et al., 2005). Ballou et al. (1986) reported that 1 h after instillation of 232U or 233U nitrate, only 22% ILD remained in the lungs, with systemic uptake of at least 40% ILD. Hodgson et al. (2000) derived absorption parameter values of fr = 0.93, sr = 3 d−1, and ss = 0.005 d−1 from the results of the study by Ellender (1987), in which the biokinetic of uranium were followed for 30 d after intratracheal instillation of uranyl nitrate. (834) As noted above, these values are similar to those derived for other relatively soluble materials, and specific parameter values for ‘Intermediate Type F/M' (fr = 0.8, sr = 1 d − 1, and ss = 0.01 d−1) are used here for uranyl nitrate. (d) Ammonium diuranate [(NH4)2U2O7] (835) Ammonium diuranate is a basic product in the uranium fuel cycle. Stradling et al. (1987) followed the biokinetic of uranium for 360 d after inhalation of ammonium diuranate by rats. At 7 d, 11% ILD remained in the lung and 70% ILD was absorbed into blood. From these results, Hodgson et al. (2000) derived parameter values of fr = 0.85 and sr = 0.78 d−1; the value of ss was too low to be determined and was taken to be 0.005 d−1. Ansoborlo et al. (2002) derived parameter values of fr = 0.71, sr = 0.61 d−1, and ss = 0.019 d−1 (consistent with assignment to default Type M) from the results of a study in which the biokinetic of uranium were followed for 30 d after intratracheal instillation of ammonium diuranate into rats. (836) As noted above, these values are similar to those derived for other relatively soluble materials, and specific parameter values for ‘Intermediate Type F/M' (fr = 0.8, sr = 1 d−1, and ss = 0.01 d−1) are used here for ammonium diuranate. (e) Uranium peroxide hydrate (UO4.nH2O) (837) Uranium peroxide hydrate, also expressed as UO3.H2O2.H2O, is very similar to uranium trioxide UO3.nH2O. The dissolution and biokinetic behaviour of both compounds are very sensitive to the hydration state (n can vary between 0 and 2.5). One main characteristic of UO4.nH2O is that it consists of small needles with an average AMAD of approximately 1.1 µm. Assessments of the physico-chemical and biokinetic properties of UO4, both in vitro and in vivo, have been carried out (Ansoborlo et al., 1998a). The biokinetic of uranium were followed for 90 d after intratracheal administration to rats. By 7 d after exposure, 3–10% of uranium remained in the lungs, whereas approximately 65% was absorbed into blood. The calculated absorption parameter values were fr = 0.87, sr = 0.93 d−1, and ss = 0.024 d−1 (Ansoborlo et al., 1998a). (838) As noted above, these values are similar to those derived for other relatively soluble materials, and specific parameter values for ‘Intermediate Type F/M' (fr = 0.8, sr = 1 d−1, and ss = 0.01 d−1) are used here for uranium peroxide hydrate. (f) Uranium trioxide (UO3.nH2O) (839) In the fuel fabrication cycle, uranium trioxide is formed by heating uranyl nitrate and is then reduced to form UO2. The biokinetic behaviour of UO3.nH2O is very sensitive to the hydration state, and its solubility depends on the value of n. (840) Harris (1961) measured excretion of uranium following repeated inhalation of UO3 by a volunteer. There was considerable clearance to urine and faeces over the first few days after each intake, indicating rapid absorption from the lower, but not from the upper, respiratory tract. The reported measurements are not straightforward to interpret, but a reasonable fit to the excretion data in the 2 d following the first intake was obtained here with fr = 0.5 and sr = 0.15 d−1. Morrow et al. (1972) followed the biokinetic of uranium for 218 d after inhalation of UO3 by dogs. Clearance from the airways was mainly to faeces in the first day, while subsequent lung clearance was rapid, with predominantly urinary excretion. Parameter values derived here from lung retention were fr = 0.82, sr = 0.15 d−1, and ss = 0.019 d−1 (consistent with assignment to default Type F). (841) Hodgson et al. (2000) derived absorption parameter values from the results of a study by Stradling et al. (1985b) in which the biokinetic of uranium were followed for 168 d after inhalation of UO3 by rats: fr = 0.92, sr = 1.4 d−1, and ss = 0.0036 d−1 (consistent with assignment to default Type F). Ansoborlo et al. (2002) derived absorption parameter values from the results of a study in which the biokinetic of uranium were followed for 30 d after intratracheal instillation of UO3 into rats: fr = 0.71, sr = 0.28 d−1, and ss = 0.0011 d−1 (consistent with assignment to default Type M). ICRP (2002a), as a worked example, derived absorption parameter values from the results of a study by Moody et al. (1997), in which the biokinetic of uranium were followed for 42 d after intratracheal instillation of UO3 into rats: fr = 0.77, sr = 9.2 d−1, and ss = 0.0017 d−1 (consistent with assignment to default Type M). (842) As noted above, these values are similar to those derived for other relatively soluble materials, and specific parameter values for ‘Intermediate Type F/M' (fr = 0.8, sr = 1 d − 1, and ss = 0.01 d−1) are used here for UO3. (g) Uranium tetrafluoride (UF4) (843) Uranium tetrafluoride is an intermediate product in the uranium fuel cycle. It can be reduced to uranium metal or oxidised by fluorine to form UF6. The reported biokinetic behaviour of UF4 is complex. Measurement of urinary excretion after inhalation by workers (Chalabreysse et al., 1989) and experiments in rats and baboons (Stradling et al., 1985a; André et al., 1989; Ansoborlo et al., 1990) showed that a large fraction (35–40%) of the lung deposit was absorbed to the blood by 7 d after administration. However, considerable variations in behaviour were observed, with some experiments indicating assignment to default Type F and others to default Type M. (844) Zhao and Zhao (1990) reported measurements of urinary excretion of uranium made for 3 y after an accidental inhalation of UF4 powder by a worker. The excretion rate, initially very low, increased to a peak at approximately 2 months, and then declined. To represent this behaviour, the alternative HRTM representation of dissolution was applied here, in which material is deposited in a compartment representing ‘particles in initial state’, in which it dissolves at a rate sp, and is simultaneously transferred at a rate spt to a compartment representing ‘particles in transformed state’, in which material dissolves at a rate st. Material-specific parameter values were derived here: sp = 2 × 10⁻⁶ d−1, spt = 0.02 d−1, and st = 0.04 d−1, with fA = 2 × 10⁻⁴. However, it was not possible to fit a peak as sharp as that observed. The unusual behaviour may have been caused, in part, by the size of the intake, which was sufficient to give rise to biochemical indications of kidney dysfunction. (845) Hodgson et al. (2000) derived absorption parameter values from the results of a study by Stradling et al. (1985a) in which the biokinetic of uranium in rats were followed for 360 d after inhalation and 168 d after intratracheal administration of two forms of UF4: (i) fr = 0.51, sr = 0.10 d−1, and ss = 0.0074 d−1; and (ii) fr = 0.52, sr = 0.11 d−1, and ss = 0.0039 d−1. Chazel et al. (2000a) derived parameter values of fr = 0.58, sr = 0.21 d−1, and ss = 0.026 d−1 from the results of a study in which the biokinetic of uranium were followed for 30 d after intratracheal instillation of UF4 into rats. (846) Although specific parameter values have been derived for UF4 from several in-vivo studies, in view of the variability in its behaviour, UF4 is assigned to Type M. (h) Uranyl acetylacetonate (847) Uranyl acetylacetonate is an organic complex of uranium with military applications. In-vitro dissolution tests in simulated lung fluid led to the classification of 50% Class D and 50% Class W (Fisher and Briant, 1994). Absorption parameter values calculated here are fr = 0.52, sr = 2.5 d−1, and ss = 0.026 d−1, corresponding to default Type M. These data (in-vitro only) are judged to be an insufficient basis to provide specific absorption parameter values, and uranyl acetylacetonate is therefore assigned to Type M. (i) Uranium aluminide (848) As part of an epidemiological study, Leggett et al. (2005a) estimated doses for workers exposed to airborne uranium aluminide (UAlx) during the fabrication of reactor fuel plates. Occupational monitoring data included air concentrations, and urinary, faecal, and lung measurements with observation periods exceeding 2 y in several cases. In workers who were removed from exposure, the rate of urinary excretion of uranium increased for a few months, peaked, and then declined at a rate consistent with moderately soluble uranium. To represent this behaviour, the authors applied the alternative HRTM representation of dissolution, in which material is deposited in a compartment representing ‘particles in initial state’, in which it dissolves at a rate sp, and is simultaneously transferred at a rate spt to a compartment representing ‘particles in transformed state’, in which material dissolves at a rate st. They derived material-specific parameter values: sp = 1 × 10⁻⁴ d−1, spt = 0.004 d−1, and st = 0.004 d−1, with fA taken to be 0.002. These parameter values are adopted here for uranium aluminide. (j) Uranium octoxide (U3O8) (849) Uranium octoxide can be present at various stages in the uranium fuel cycle. Human data from accidental intake of U3O8 (Saxby et al., 1964; West et al., 1979; Eidson, 1990); and from monitoring data for workers in processing facilities (Chalabreysse et al., 1989; Barber and Forrest, 1995); animal studies using rats, dogs, and monkeys (Stradling et al., 1989; Métivier et al., 1992); and in-vitro studies (Eidson, 1994; Ansoborlo et al., 1998a; Chazel et al., 1998) have shown that the biokinetic behaviour of this compound depends on the particular process of manufacture. A study of the influence of specific surface area (Chazel et al., 1998) demonstrated the importance of this parameter on dissolution characteristics. When the specific surface area increased from 0.7 to 16 m2 g−1, the rapidly dissolved fraction, fr, increased from 0.01 to 0.20. At 30 d after intake by rats and baboons, lung retention and total urinary excretion were 50–90% and 2–10%, respectively, of ILD. (850) Ansoborlo et al. (2002) derived absorption parameter values from the results of studies in which the biokinetic of uranium were followed for 90 d after intratracheal instillation into rats of two forms of U3O8: (i) fr = 0.046, sr = 2.25 d−1, and ss = 0.0012 d−1; and (ii) fr = 0.03, sr = 2.07 d−1, and ss = 3.8 × 10⁻⁴ d−1. Hodgson et al. (2000) derived absorption parameter values from the results of a study by Stradling et al. (1987) in which the biokinetic of uranium were followed for 360 d after inhalation by rats of uranium ore concentrate (95% U3O8, 5% UO2): fr = 0.044, sr = 0.49 d−1, and ss = 3.5 × 10⁻⁴ d−1. (851) As noted above, analysis here showed that dose coefficients and bioassay functions calculated from these parameter values were similar to those calculated from values derived for uranium dioxide below, and were intermediate between those of Type M and Type S. Specific parameter values for ‘Intermediate Type M/S' (fr = 0.03, sr = 1 d−1, and ss = 5 × 10⁻⁴ d−1), based on values derived for both materials, are used here for U3O8. (k) Uranium dioxide (UO2) (852) Uranium dioxide is the final product in the manufacture of nuclear fuel pellets, and is also present as depleted uranium in mixed oxide fuel. Manufacturing processes of UO2 differ from one industry to another. Human studies have shown that UO2 can be very insoluble (Pomroy and Noel, 1981; Schieferdecker et al., 1985; Price, 1989). Experiments in rats, dogs, monkeys, and baboons (Leach et al., 1973; Stradling et al., 1988; Métivier et al., 1992) also support the assignment of UO2 to default Type S. At 30 d after intake by rats and baboons, the total urinary excretion was 1–4% ILD and lung retention was 60–90% ILD. The effect of specific surface area on dissolution has been investigated (Chazel et al., 2000b), but in contrast to U3O8 (see above), no clear effect was observed. For compounds with specific surface area varying from 1.0 to 4.4 m2 g−1, fr values were from 0.003 to 0.004. (853) Ansoborlo et al. (2002) derived absorption parameter values from the results of studies in which the biokinetic of uranium were followed for 75 or 90 d after intratracheal instillation into rats of three forms of UO2: (i) fr = 0.03, sr = 1.25 d−1, and ss = 0.0015 d−1; (ii) fr = 0.01, sr not determined, and ss = 4.9 × 10⁻⁴ d−1; and (iii) fr = 0.01, sr not determined, and ss = 5.8 × 10⁻⁴ d−1. Hodgson et al. (2000) derived absorption parameter values from the results of a study by Stradling et al. (1988) in which the biokinetic of uranium were followed for 315 d after inhalation by rats of two forms of UO2: (non-ceramic) fr = 0.011, sr = 0.95 d−1, and ss = 6.1 × 10⁻⁴ d−1; and (ceramic) fr = 0.008, sr = 1.3 d−1, and ss = 2.6 × 10⁻⁴ d−1. All but the first of these five sets of parameter values are consistent with assignment to default Type S. (854) As noted above, analysis here showed that dose coefficients and bioassay functions calculated from these parameter values were similar to those calculated from values derived for uranium octoxide above, and were intermediate between those of Types M and S. Specific parameter values for ‘Intermediate Type M/S' (fr = 0.03, sr = 1 d−1, and ss = 5 × 10⁻⁴ d−1), based on values derived for both materials, are used here for UO2. (l) Vaporised uranium metal (855) A method for uranium enrichment, based on laser isotopic separation, can produce three different types of aerosol identified as variable mixtures of Umetal + UO2 + U3O8, with different particle size distributions. Ansoborlo et al. (1998b, 2002) derived absorption parameter values from the results of studies in which the biokinetic of uranium were followed for 126 or 168 d after intratracheal instillation into rats of three such materials: (i) fr = 0.36, sr = 1.44 d−1, and ss = 0.0046 d−1; (ii) fr = 0.20, sr = 0.68 d−1, and ss = 9.4 × 10⁻⁴ d−1; and (iii) fr = 0.12, sr = 1.45 d−1, and ss = 0.0026 d−1 (all consistent with assignment to default Type M). (856) In view of the wide range of values of ss derived in the study above, these data are judged to be an insufficient basis to propose specific absorption parameter values, and vaporised uranium metal is therefore assigned to Type M. (m) Uranium ore dust (857) Duport et al. (1991) measured the dissolution in simulated lung fluid of long-lived radionuclides in uranium ore dust from Canadian mines (and in other forms of uranium) (for further information, see Section 15.2.1.2). Factors including ore grade (uranium content), particle size, and solution pH were investigated. For high-grade ore, measurements were made for up to 60 d on particles in size ranges that included respirable particles. Results were presented as undissolved fractions as functions of time, and showed two components that were expressed as Class D (rapid) and Class Y (slow) fractions. For 238U, the rapidly dissolved fraction was approximately 0.25, indicating assignment to Type M. No effect of size was observed in total dissolution over 40 d for particles in size ranges 7–10, 3–7, 1–3, and less than 1 µm. For low- and medium-grade ores, measurements were made for 12 d, but only on samples of relatively coarse dust, the smallest fraction being less than 37 µm. For 238U, rapidly dissolved fractions were greater than those measured in the high-grade ores; approximately 0.33 and 0.5 for low- and medium-grade ores, respectively. (858) Bečková and Malátová (2008) measured dissolution for 26 d of 238U, 234U, and 230Th in simulated serum ultrafiltrate of uranium ore dust collected on personal air filters in a mine in the Czech Republic. Retention (undissolved) was represented by a two-component exponential function, giving parameter values for 238U of fr = 0.14, sr = 0.49 d−1, and ss = 0.004 d−1, and assignment to Type M. Dissolution of 234U was somewhat faster, as expected due to recoil phenomena: fr = 0.18, sr = 0.49 d−1, and ss = 0.006 d−1 (for further information, see Sections 14.2.1 and 15.2.1.2). (859) Marsh et al. (2012) estimated the following parameter values for dissolution of uranium from ore dust, based on the results of both Duport et al. (1991) (high-grade ore) and Bečková and Malátová (2008): fr = 0.2, sr = 0.8 d−1, and ss = 0.0014 d−1. (860) For a summary of in-vivo and autopsy studies relating to uranium ore dust, see Section 15.2.1.2. (n) Depleted uranium (861) Depleted uranium, a by-product of the manufacture of enriched uranium for nuclear reactor fuel, has found a number of applications resulting mainly from its high density, such as in antitank munitions, counterweights for aircraft control surfaces, and radiation shielding. Depleted uranium, typically alloyed with 0.75% titanium, is used in ‘kinetic energy penetrators’, with rods of the metal fired at very high speed (∼1.5 km s−1). On impact with a hard object such as armour plate, a significant fraction of the penetrator mass may be converted to an aerosol that could be inhaled by persons in the vicinity or downwind. In-vitro tests have shown considerable variability in that 1–50% of the respirable material dissolves rapidly, and the rest dissolves very slowly, while x-ray analyses indicate that the uranium is present as a mixture of oxides including U3O7, U3O8, U4O9, and UO2, but also in combination with other metals (Glissmeyer and Mishima, 1979; Scripsick et al.,1985a,b; Chazel et al., 2003; Mitchel and Sunder, 2004). In-vitro dissolution tests carried out by Chazel et al. (2003) gave dissolution parameter values in the following ranges: fr = 0.47–0.57, sr = 0.06–0.07 d−1, and ss = (1.8–3.4) × 10−4 d−1, giving assignment to Type M. (862) In the comprehensive Capstone Depleted Uranium Aerosol Study, aerosols formed when depleted uranium rounds penetrated armoured vehicles were used in studies of dissolution in simulated lung fluid, making measurements over 46 d on a total of 27 samples (Parkhurst et al., 2004a,b; Guilmette and Cheng, 2009; Parkhurst and Guilmette, 2009). Dissolution was fitted by two- or three-component exponential functions. Based on the two-component fits, there was a rapidly dissolving fraction of 1–28% (geometric mean 12.5%), with an associated rapid dissolution rate of 0.1–30 d−1 (geometric mean 6 d − 1, t1/2 = 0.12 d). The remaining fraction dissolved at a slow rate of 0.0004–0.0095 d−1 (geometric mean 0.0026 d−1, t1/2 = 268 d). Thus, there was considerable variation between samples, especially in the fraction that dissolved rapidly. There appeared to be some correlation between the initial and final dissolution rates; the greater the dissolution in the first day, the faster the long-term dissolution rate. Based on extrapolation of the three-component exponential function where available (two-component otherwise), 24 samples would be assigned to Type M and three to Type S. Several sets of measurements were made on different stages from the same cascade cyclone. However, there was no clear trend of dissolution with particle size, and in some cases, the back-up filter, with the smallest particles, showed the slowest dissolution. Two confounding factors were noted: (1) cyclone cut-offs are not sharp, so there was considerable overlap in size distribution between stages; and (2) scanning electron microscope examination showed great heterogeneity of particle composition, shape etc. (863) Mitchel and Sunder (2004) followed urinary excretion of uranium for 7 d after intratracheal instillation into rats of the <50-µm fraction of dust obtained from impact of depleted uranium munitions on armour plate. Results indicate that approximately 10% ILD dissolved during 7 d, approximately half of it within 1 d. However, the large size suggests that the material was from surface deposits rather than air samples, and may not be representative of dust that might be inhaled. (864) If large pieces of uranium metal are subjected to fire (e.g. in a burning vehicle or aircraft crash – depleted uranium is generally used in applications that require only the non-fissile properties of uranium), they will gradually oxidise and some of the oxide may be dispersed and inhaled. In-vitro tests have shown that 0.5–10% of the respirable material dissolves rapidly, and the rest dissolves very slowly, while x-ray analyses indicate that most of the uranium is present as U3O8 (Elder and Tinkle, 1980; Mishima et al., 1985; Scripsick et al., 1985a). Default Type M should be assumed. (865) Overall, the available data show that the dissolution and lung absorption of particulate depleted uranium, whether formed by the impact of kinetic energy penetrators or in fires, is very variable. It is therefore judged to be inappropriate to propose specific absorption parameter values, and depleted uranium is therefore assigned to default Type M. (o) Irradiated fuel fragments (866) Following an accidental release from a nuclear reactor, fission and activation products may be present in fragments of irradiated fuel, of which the matrix is predominantly uranium dioxide (Devell, 1988; Begichev et al., 1989; Toivonen et al., 1992). In studies of the in-vitro dissolution of particles released from the Chernobyl accident, seven out of 10 of which consisted mainly of uranium (Cuddihy et al., 1989), the data obtained were consistent with assignment of all the gamma-emitting radionuclides to Type M.
15.2.1.2. Progeny radionuclides of uranium formed in the respiratory tract
(867) Decay schemes of uranium isotopes in the natural decay series – 234U, 238U, and 235 U – are described in Figs. A.1 and A.2. The 232Th decay series is shown in Fig. A.3. It is relevant to 232U, which decays to 228Th, a descendent of 232Th. (868) The general approach to treatment of progeny radionuclides formed in the respiratory tract is described in OIR Part 1, Section 3.2.3 and Annex A (ICRP, 2015). In summary, it is expected that the rate at which a particle dissociates is generally determined by its matrix, and hence the physico-chemical form of the inhaled material. It is recognised that for progeny radionuclides formed within particles by alpha emission, recoil of the progeny nucleus from the alpha emission expels some of the progeny from the particles. In the case of decay chains, this will result in successively lower activities of members compared with the parent retained in relatively insoluble particles. Experimental evidence relating to this is described in Section 14.2.1.2 (Part b). However, it was considered impractical to implement loss of progeny radionuclides by alpha recoil in the calculation of dose coefficients and bioassay functions in the OIR series [for further information, see OIR Part 1, Section 3.2.3. and Annex A (ICRP, 2015)]. Nevertheless, this phenomenon should be borne in mind, especially when using progeny radionuclides to monitor intakes and doses of the parent, which can be applicable to uranium. (869) Exceptions are made for noble gases formed as progeny radionuclides which are assumed to escape from the body directly, in addition to other routes of removal. For calculation purposes, it is assumed that radon formed as a progeny within the respiratory tract escapes from the body at a rate of 100 d−1, in addition to other routes of removal [for further information, see Section 14.2.1.2 (Part b)]. (870) It is expected that the behaviour of soluble (e.g. Type F) material in the respiratory tract would depend on its elemental form (i.e. that of the progeny radionuclide). Nevertheless, for simplicity, in the OIR series, the absorption parameter values of the parent are, by default, applied to all members of the decay chain formed in the respiratory tract. (871) The formation of thorium as a progeny can be of particular importance in this context because there can be significant long-term retention of thorium in the lungs following its deposition in soluble form (see Section 14.2.1). Conversely, important progeny radionuclides of thorium, notably radium and lead, in soluble forms are (like uranium) absorbed relatively readily from the respiratory tract into the systemic circulation. Studies specifically comparing the behaviour of uranium with that of its progeny radionuclides are summarised here, although it should be noted that the thorium was mainly administered with the uranium, rather than formed from decay of uranium in the respiratory tract. For more information, see also the sections in this publication on thorium (14.2.1.2), radium (13.2.1.2), lead (9.2.1.4) and bismuth (10.2.1.3), relating to the behaviour of their progeny radionuclides formed in the respiratory tract. (a) Relatively soluble (Type F) forms (872) As noted above, Ballou et al. (1986) studied the biokinetic of 232U and 233U in rats after inhalation of uranyl nitrate aerosols. For the main studies, the uranium was freshly separated from its progeny radionuclides, and measurements were not made of progeny radionuclides formed within the body. 233U has a long half-life (1.6 × 10⁵ y), but that of 232U is only 74 y, and the authors recognised that assessment of doses from occupational exposure to 232U needed to take account of the behaviour of its progeny radionuclides, especially 228Th. A complementary experiment was carried out in which tissue distributions of 232U, 228Th, 224Ra, 212Pb, 212Bi, and 208Tl were measured at 24 h after intratracheal instillation of 232U nitrate with its progeny radionuclides into rats. Although measurements of 228Th, 224Ra, and perhaps 212Pb were mainly of material administered with the parent 232U, rather than formed from its decay in the lungs, it is reasonable to assume similar behaviour. The physical half-lives of 212Bi and 208Tl are so short (61 min and 3 min, respectively) that measurements made at 24 h would mainly be of activity formed in situ. Lung retention was 7.9% ILD for 232U, 52% ILD for 228Th, and approximately 2–3% ILD for the other progeny radionuclides measured, reflecting the high lung retention of thorium, and relatively rapid lung clearance of radium and lead observed in other studies in which soluble forms were administered. Similarly, the distribution between liver, skeleton, and kidneys of 232U, 228Th, 224Ra, and 212Pb reflected the elemental forms. The distributions of 212Bi and 208Tl were similar to those of 212Pb, presumably because of their short physical half-lives; whatever their distribution in vivo, they would tend to equilibrium between dissection and measurement. Ballou et al. (1986) noted that the greater retention of 228Th in the lungs and deposition of 228Th in the skeleton compared with 232U suggested that assessments based on the assumption of shared kinetics would significantly underestimate doses. (873) Stradling et al. (2005) followed the biokinetic of uranium and thorium for 3 months after intratracheal instillation of the nitrates into rats, given separately or together at uranium:thorium mass ratios of 5 × 10⁶:1 or 50:1. Their behaviour when administered separately was as expected from other studies: by 1 d, approximately 80% ILD of uranium but only approximately 30% ILD of thorium had been absorbed into blood. The behaviour of thorium was not significantly affected by the presence of uranium when they were administered together (for further information, see Section 14.2.1). (b) Relatively insoluble (Type M or S) forms (874) Hill (1962) noted the disequilibrium between the early long-lived members of the uranium decay series measured in a lung sample from a uranium miner, although they were probably close to equilibrium in the uranium ore to which he was exposed. The concentration of 230Th was approximately twice, and that of 226Ra was approximately half, that of 238U or 234U, suggesting selective removal of radium and uranium compared with thorium. (875) Stuart and Beasley (1967) followed the biokinetic of uranium (238 U + 234U) and thorium (228Th) for up to 4 months after repeated inhalation by rats of uranium ore dust (pitchblende, 25% U3O8, with uranium and thorium in secular equilibrium) over an 8-week period. Faster clearance of uranium than thorium from the lungs was observed: at 1 week after the end of exposure, the thorium activity was two to three times that of 238U or 234U. Stuart and Jackson (1975) similarly found 230Th concentrations were several times those of 238U in the lungs and lymph nodes of dogs at 2 weeks or 15 months after repeated inhalation of the same uranium ore (Cross et al., 1982). They also reported that thorium concentrations in the lungs were approximately twice those of uranium in hamsters 1 y after repeated inhalation of carnotite ore dust (4% U3O8, with uranium and thorium in secular equilibrium), and several times higher in dogs after several years of daily inhalation exposure. Thus, even though the material was relatively insoluble, and the thorium was present as a minor component by mass, its slower absorption from the lungs than that of uranium could be observed. (876) Fisher et al. (1983) measured significantly higher activity levels of 234U and 238U than of the progeny 230Th in both urine and faecal samples obtained from active uranium millers, indicating that uranium in the inhaled ore dust was cleared from the body with a shorter biological half-time than the progeny 230Th. Assessment of lung clearance from the results is not straightforward, especially given the chronic and continuing exposures. Higher urinary excretion of uranium than of thorium would be expected even if absorption from the lung were at similar rates because of the higher urinary excretion of systemic uranium. For both elements, faecal clearance dominated, and given the high urinary excretion of systemic uranium, this suggests greater lung clearance by particle transport than by absorption to blood. The lower faecal excretion of thorium than of uranium suggests a lower particle transport rate, and hence that there is binding of thorium released in the lungs by dissolution. However, it was recognised by the authors that other sources of faecal excretion of uranium (e.g. dietary intakes, exposure to refined uranium which is depleted in thorium) could not be excluded. (877) In contrast, Wrenn et al. (1983) measured 230Th concentrations similar to those of 234U in the lungs of five uranium miners (average 230Th/234U ratio 1.1, range 0.54–2.6). They noted that this was surprising in view of the results of the reported disequilibrium in dogs chronically exposed to carnotite (see above). An interlaboratory comparison was conducted, which showed that the difference was not due to differences in radiochemical methods (Singh et al., 1986). In a later study (Singh et al., 1987), the same group found ratios of 1.5–3.5 in the lungs of three uranium miners and 1.1–1.3 in the lungs of two uranium millers; they concluded that, overall, dissolution in the human lungs of uranium and thorium in uranium ore dust was similar. (879) For these radionuclides, no effects of size were observed in total dissolution over 40 d for particles in size ranges 7–10, 3–7, 1–3, and less than 1 µm. For low- and medium-grade ores, measurements were made for 12 d, but only on samples of relatively coarse dust, the smallest fraction being less than 37 µm. For 238U, rapidly dissolved fractions were higher (0.33 and 0.5 for low- and medium-grade ores) than those measured in the high-grade ores. However, for other radionuclides, the fractions were lower: 0.07 for 226Ra and less than 0.01 for 210Pb. Measurements were also made for 232Th in low-grade ore and 210Po in low- and medium-grade ores, and much lower fractions were obtained: 0.01, 0.00, and 0.005, respectively. Consistent differences in dissolution between uranium and its progeny radionuclides were not apparent. (880) As noted above, Bečková and Malátová (2008) measured dissolution for 26 d of 238U, 234U, and 230Th in simulated serum ultrafiltrate of uranium ore dust collected on personal air filters in a mine in the Czech Republic. Moderate dissolution of both uranium isotopes was observed, with fr = 0.14 for 238U and 0.18 for 234U, but no dissolution of 230Th was detected. (881) Griffith et al. (1980) developed a model to describe the retention of 232U and its progeny radionuclides in the lungs following inhalation in ThO2 or UO2 particles. In addition to chemical dissolution, they considered recoil emanation of progeny nuclei by alpha-particle decay, and diffusion emanation of 220Rn from particles. In complementary experiments, Coombs and Cuddihy (1983) measured the fraction of 228Th escaping by recoil and the fraction of 220Rn escaping by diffusion from size-fractionated samples of ThO2 and uranium oxide (mixture of UO2.2 and U3O8) containing 1% 232U. For further information on these and other studies relating to recoil emanation of progeny radionuclides and to loss of radon formed in the respiratory tract, see Section 14.2.1.2.

15.2.1.2. Rapid dissolution rate for uranium
(882) Studies on the uranium compounds which are absorbed most rapidly from the lungs (uranium hexafluoride and uranyl tri-butyl-phosphate) give values of sr of approximately 10 d−1, which is applied here to all Type F forms of uranium in the absence of material-specific data.
15.2.1.3. Extent of binding of uranium to the respiratory tract
(883) Experimental evidence suggests that there is little binding of uranium to the respiratory tract. Cooper et al. (1982) and Ellender (1987) followed the behaviour of 233U after instillation of uranyl nitrate and bicarbonate into the pulmonary region of the lungs of rats. Cooper et al. (1982) found that less than 2% ILD remained at 7 d. Ellender (1987) gave more information for the nitrate, for which approximately 8% ILD remained at 1 d and 3% at 30 d. Detailed analysis, however, indicates that clearance over this period was mainly by particle transport, and that the results did not provide evidence for binding of uranium (Hodgson et al., 2000). It is therefore assumed that the bound state can be neglected for uranium (i.e. fb = 0.0).
15.2.2. Ingestion
(884) Data on the absorption of uranium have been reviewed by Wrenn et al. (1985), Harrison (1991), Leggett and Harrison (1995), and in Publication 69 (ICRP, 1995). (885) In the first controlled human study involving more than one subject, Hursh et al. (1969) administered uranyl nitrate to four hospital patients. The data obtained were taken to suggest fractional absorption in the range 0.005–0.05. Leggett and Harrison (1995) have interpreted the data as suggesting absorption of 0.004, 0.01, 0.02, and 0.06, respectively, for the four subjects. Wrenn et al. (1989) estimated absorption in 12 normal healthy adult volunteers given drinking water high in uranium. On the basis that 40–60% of absorbed uranium was excreted in urine in the first 3 d, rather than the author’s assumption of 79%, Leggett and Harrison (1995) concluded that mean absorption was 0.01–0.015, maximum absorption was in the range 0.02–0.04, and that six subjects absorbed less than 0.0025. Harduin et al. (1994) reported results for the absorption of uranium from drinking water either administered on 1 d or over 15 d. The data for acute administration suggested absorption of 0.005–0.05, with an average value of 0.015–0.02. The data for 15 d of administration suggested absorption of 0.003–0.02 and average absorption of 0.01–0.015. In another in-situ study, the gastrointestinal absorption factor was determined for 50 participants ingesting uranium at natural levels in drinking water and food. The participants (age range 13–87 y) were selected from either a Canadian area with naturally high (2–780 µg L−1) or low (<1 µg L−1) uranium levels. The distribution of f1 values obtained was non-Gaussian with a range of 0.001–0.06 and a median of 0.009 (Zamora et al., 2002). These values were not sex sensitive, and were independent of age at the time of the study, duration of exposure, and total uranium intake. Similar results have also been obtained in a number of dietary balance studies (Larsen and Orlandini, 1984; Wrenn et al., 1989; Spencer et al., 1990; Leggett and Harrison, 1995). (886) Data from animal studies provide information on the relative uptake of uranium ingested in different chemical forms, showing that absorption is strongly dependent on the solubility of the compound. Measurements have been made in rats, hamsters, rabbits, dogs, and baboons (Wrenn et al., 1985; Harrison, 1991; Leggett and Harrison, 1995). Absorption appears to be greatest for uranium ingested as UO2(NO3)2.6H2O, uranyl tri-butyl-phosphate, UO2F2, or Na2U2O7; approximately half as great for UO4 or UO3; and one to two orders of magnitude lower for UCl4, U3O8, UO2, and UF4. It should be noted, however, that the solubility of some poorly soluble uranium compounds can vary substantially with thermal history as well as particle size (Cooke and Holt, 1974). Thus, greater absorption as UO2 in hamsters, compared with rats and dogs, could reflect solubility of the preparation of UO2 rather than just species differences. A number of studies have shown that absorption is substantially greater in fasted animals compared with fed animals. For example, Bhattacharyya et al., (1989) found that uptake was increased by an order of magnitude in mice and baboons deprived of food for 24 h prior to uranium administration. Sullivan (1980) reported a two- to four-fold increase in uranium absorption in rats given uranium nitrate after a 24-h fast. (887) In Publication 30 (ICRP, 1979), an f1 of 0.05 was recommended for water-soluble inorganic forms of U(VI) and a value of 0.002 for U(IV) in relatively insoluble compounds, such as UF4, UO2, and U3O8. In Publication 69 (ICRP, 1995), an f1 of 0.02 was adopted for dietary intakes of uranium on the basis of human data, as reviewed by Wrenn et al. (1985), Harrison (1991), and Leggett and Harrison (1995). The available human and animal data indicate that a value of 0.02 is also appropriate for occupational exposures to more soluble inorganic forms, including UO2(NO3)2.6H2O, UO2F2, and Na2U2O7. (888) In this publication, an fA value of 0.002 is adopted for the fractional absorption of relatively insoluble compounds (e.g. UO2, U3O8), and an fA value of 0.02 is adopted for all other more soluble chemical forms (Table 15.2). Absorption parameter values for inhaled and ingested uranium. It is assumed that the bound state can be neglected for uranium, i.e. fb = 0.0. The value of sr for Type F forms of uranium (10 d–1) is element-specific. The values for Types M and S (3 d–1) are the general default values. See text for summary of information on which parameter values are based, and on ranges of parameter values observed for individual materials. For uranium, specific parameter values are used for dissolution in the lungs, and in most cases, where information is available, for absorption from the alimentary tract. However, for ammonium diuranate, the default value of fA is used (Footnote §). See text: sp = 1 × 10⁻⁴ d–1, spt = 0.004 d–1, st = 0.004 d–1, with fA taken to be 0.002. For inhaled material deposited in the respiratory tract and subsequently cleared by particle transport to the alimentary tract, the default fA values for inhaled materials are applied; i.e. the (rounded) product of fr for the absorption type (or specific value where given) and the fA value for ingested soluble forms of uranium (0.02). Materials (e.g. UF6) are listed here where there is sufficient information to assign to a default absorption type, but not to give specific parameter values (see text). Default Type M is recommended for use in the absence of specific information on which the exposure material can be assigned to an absorption type; for example, if the form is unknown, or if the form is known but there is no information available on the absorption of that form from the respiratory tract. Activity transferred from systemic compartments into segments of the alimentary tract is assumed to be subject to re-absorption to blood. The default absorption fraction fA for the secreted activity is the highest value for any form of the radionuclide (fA = 0.02).

15.3. Systemic distribution, retention, and excretion
15.3.1. Summary of the database
15.3.1.1. Controlled studies on human subjects
(889) The systemic biokinetic of uranium have been investigated in three human injection studies: the Boston study, the Rochester study, and the Terepka study. (890) The Boston study (Struxness et al., 1956; Bernard and Struxness, 1957; Luessenhop et al., 1958) involved 11 hospital patients (age range 26–63 y) in the terminal phases of diseases of the central nervous system. Most of the subjects were comatose at the time of injection. Uranyl nitrate solutions enriched with 234U and 235U were administered to Subjects 1–6 and Subjects 9–11 by intravenous injection. Subjects 7 and 8 received intravenous injections of tetravalent uranium as UCl4. The mass of administered uranium was varied from one subject to another, but ranged up to approximately 1 mg kg−1. The mass of injected uranium is known only approximately for Subjects 2, 9, 10, and 11. In some cases, several bone biopsy samples were taken from the anterior tibia during the first day or two after injection. Extensive measurements of uranium in blood and excreta were made over the first several weeks or months after injection. Urinary uranium measurements were made over several months in some subjects, and extended to times exceeding 1 y for one subject. Autopsy samples were obtained from various bones and soft tissues of subjects dying at times from 2.5 d to 4.5 months after injection, and from one subject dying 566 d after injection. (891) Selected data from the Boston study are summarised in Table 15.3. The range of values given for bone indicate the lower and upper bounds derived from different assumptions regarding the portion of the skeleton represented by samples collected at autopsy. (892) The poor physical condition of the Boston subjects limits the confidence with which the data can be taken to represent the typical biokinetic of uranium. Struxness et al. (1956) pointed out that the bed-ridden condition of these subjects indicated a negative calcium balance, which might ‘hasten the removal of uranium from the skeleton’. Also, the subjects were given relatively high masses of uranium. Animal studies indicate that administration of high masses of uranium will result in elevated uptake and retention in kidneys, among several potential effects on biokinetic (Bernard and Struxness, 1957; Leggett, 1989, 1994). A third difficulty is that the post-mortem data are not sufficiently detailed in some cases to allow a close determination of the total uranium content of some organs or tissues, particularly the skeleton. (893) The Rochester study involved two female and four male subjects (ages 24–61 y), chosen because they had reasonably good kidney function and their urine was free of protein (Bassett et al., 1948). These subjects were hospital patients but were ambulatory. Subjects 1–6, respectively, suffered from rheumatoid arthritis, cirrhosis of the liver, chronic undernutrition, alcoholism, unresolved pneumonia, and pulmonary fibrosis plus gastric ulcer. The subjects received intravenous injections of uranyl nitrate solutions enriched with 234U and 235U. Administered masses ranged from 6.3 to 70.9 µg uranium kg−1. Total urine and faecal collection was made for up to 16 d, and several blood samples were taken. (894) Terepka et al. (1964) and Hursh and Spoor (1973) investigated the possibility of evaluating bone disorders based on the level of retention of intravenously injected uranium. They injected hexavalent uranium (30 µg kg−1) into three control patients and seven patients with various bone disorders (Paget's disease, hyper- or hypoparathyroidism, osteomalacia, or senile osteoporosis). Some patients were investigated before and after oestrogen or parathyroid extract treatments. Urinary excretion of uranium was measured for at least 6 d in each subject. Subjects with osteomalacia and Paget’s disease showed radically reduced urinary uranium compared with controls, presumably due to radically increased uptake of uranium by the skeleton. Cumulative urinary uranium over 6 d was similar in controls and subjects with osteoporosis or hyper- or hypoparathyroidism. Daily urinary and faecal excretion of 234U following inhalation of 1 Bq Type F/M.

15.3.1.2. Occupational and environmental studies
(895) Additional information on the biological fate of uranium in humans is provided by post-mortem measurements of uranium in tissues of occupationally and environmentally exposed subjects (Donoghue et al., 1972; Campbell, 1975; Roberts et al., 1977; Igarashi et al., 1985; Fisenne and Welford, 1986; Sing et al., 1986, 1987; Kathren et al., 1989; Russell and Kathren, 2004). Such studies provide information on the long-term distribution of uranium in the human body. For example, the collective data from these studies suggest that the skeleton typically contains 15–50 (median ∼30) times as much uranium as the liver, and the kidneys typically contain 0.2–0.6 (median ∼0.5) times as much uranium as the liver at times remote from the start of exposure. Some limitations of the post-mortem data for modelling purposes are the small numbers of subjects examined in most studies; uncertainties in the exposure histories of those subjects; uncertainties in estimates of total organ contents of the subjects based on small samples of tissue, particularly skeletal tissues; and, in some cases, unreliable techniques for determining low concentrations of uranium in tissues or fluids.
15.3.1.3. Animal studies
(896) The biokinetic of uranium have been studied in baboons, dogs, rabbits, rats, mice, monkeys, sheep, and other animal species (Durbin, 1984; Leggett, 1994; ICRP, 1995). As indicated in the following discussion of model parameter values, data from several animal studies were used in the development of parameter values for the systemic model described below. The animal data helped to fill gaps in the human data, and in selection of some parameters, animal data were given greater weight than questionable data for human subjects. In addition to uncertainties regarding interspecies extrapolation of results, the animal data have many of the same problems that complicate the human studies. For example, most animal studies involved administration of relatively high masses of uranium; there was often limited sampling of tissues, particularly bone and massive soft tissues such as muscle, fat, and skin; and some studies involved small numbers of animals. When potentially significant differences in numerical results were indicated by results of different animal studies, preference was generally given to baboons or dogs over rats or other small animals, and to results involving uptake of relatively low masses of uranium.
15.3.2. Biokinetic model for systemic uranium
(897) The biokinetic model for systemic uranium used in this publication is the model for adults adopted in Publication 69 (ICRP, 1995) and applied in Publication 68 (ICRP, 1994) to workers. The model structure (Fig. 15.1) is the generic structure for elements that follow the movement of calcium in bone. Although the chemical analogy between UO22+ and Ca2+ is not strong in terms of affinity constants for mineral ligands (Ansoborlo et al., 2006), the behaviour of uranium in the skeleton shows qualitative similarities to that of calcium. (898) Parameter values for the worker are listed in Table 15.4. Primary databases and assumptions underlying parameter values are summarised below. Additional details and references can be found in an article by Leggett (1994). (a) Blood clearance (899) There is rapid loss of uranium from the circulation in the first few minutes after injection due to high rates of filtration by the kidneys and diffusion into extracellular fluid. The rate of disappearance declines as uranium returns from the extracellular spaces to blood, and some uranium attaches to red blood cells. In human subjects given uranyl nitrate intravenously, median retention in blood was approximately 25% at 5 min, 10% at 2 h, 5% at 5 h, 1% at 20 h, and less than 0.5% at 100 h, but intersubject variation was high (Bassett et al., 1948; Bernard and Struxness, 1957). Blood clearance rates observed in baboons (Lipsztein, 1981) and dogs (Rowland and Farnham, 1969) are similar to those determined in human subjects. (900) Limited measurements on human blood containing environmental levels of uranium indicate that a substantial portion of uranium in blood is associated with red blood cells. Measurements of intravenously injected uranium in plasma and red blood cells of baboons showed that red blood cells contained, on average, approximately 10% of circulating uranium after 2 h, 25% after 6 h, 80% after 1 d, and at least 50% from 1 to 49 d (Lipsztein, 1981). These data indicate that approximately 0.5–1% of outflow of uranium from plasma attaches to red blood cells, and that uranium is lost from red blood cells to plasma with a half-time of approximately 1 d. (901) Morrow et al. (1982) estimated that soft tissues of beagles given intravenous injections of UO2F2 contained approximately 24% of the administered amount after 24 h and 4% after 48 h. This presumably reflects a high rate of transfer of uranium from blood to extracellular fluids, and subsequent return to the circulation over a period of hours. (902) The kinetics of circulating uranium are based, in part, on data for dogs and baboons, but residence times in plasma and red blood cells were lengthened to improve agreement with blood clearance data for the Boston subjects and limited data on other human subjects (Leggett, 1994). Plasma is taken to be a uniformly mixed pool from which uranium is removed at a rate of 35 d−1, with 30% going to a soft tissue compartment called ‘ST0’ that returns uranium to blood with a half-time of 2 h. Thus, the transfer coefficient from plasma to ST0 is 35 d−1 × 0.3 = 10.5 d−1 and from ST0 to plasma is ln(2)/2 h = 8.32 d−1. In the following, uranium that transfers to compartments other than ST0 is regarded as ‘leaving the circulation’, and deposition fractions refer to uranium that ‘leaves the circulation’. (903) A deposition fraction of 0.01 is assigned to red blood cells. Thus, the transfer coefficient from plasma to red blood cells is 0.1 × (35−10.5) d − 1 = 0.1 × 24.5 d − 1 = 0.245 d−1, where 35 d−1 is the total outflow rate from plasma and 10.5 d−1 is the transfer coefficient from plasma to ST0. The assigned removal half-time from red blood cells to plasma is 2 d, which corresponds to a transfer coefficient from red blood cells to plasma of ln(2)/2 d=0.347 d−1. (904) Resulting model predictions are in reasonable accord with data for blood clearance in the Boston subjects, animal data on binding of uranium to red blood cells (Lipsztein, 1981), and the early rise and fall of uranium in soft tissues of beagles (Morrow et al., 1982). (b) Urinary excretion and renal retention (905) Data from the human injection studies indicate that, typically, approximately two-thirds of intravenously injected uranium is excreted in the first 24 h and a further 10% over the next 5 d. Similar results were obtained for baboons and beagle dogs. The human and animal data indicate that most of the remaining uranium is excreted over a period of a few months, but a few percent of the amount injected may be retained for a period of years (Struxness et al., 1956; Bernard et al., 1957; Luessenhop et al., 1958; Stevens et al., 1980; Sontag, 1984). (906) A substantial fraction of uranium filtered by the kidneys is temporarily retained in the renal tubules before passing in urine to the urinary bladder. Morrow et al. (1982) estimated that the kidneys of beagle dogs contained 44% of rapidly absorbed uranium at 6 h after inhalation of UO2F2 and 16% after 24 h. At 1–3 d after inhalation or injection of soluble forms of uranium, the kidneys of humans, dogs, and rats contained 12–25% of the amount entering blood (Bernard and Struxness, 1957; Muir et al., 1960; Jones, 1966; Stevens et al., 1980; Morrow et al., 1982). Durbin (1984) reviewed data on the retention of uranium in the kidneys of humans, beagles, rats, and mice and concluded that 92–95% of the renal content at 1 d was lost with a half-time of 2–6 d, and the remainder was lost with a half-time of 30–340 d. Interpretation of the data is complicated by indications that retention in the kidneys depends on the mass of uranium administered. (907) In the present model, urinary excretion is assumed to occur, in part, from direct transfer from plasma to urinary bladder contents, accounting for 63% of uranium leaving the circulation, and, in part, after temporary retention in a compartment called ‘urinary path’ (representing the renal tubules), accounting for 12% of uranium leaving the circulation. The half-time of retention in urinary path is assumed to be 7 d. The model also includes a compartment called ‘other kidney tissue’, which is assumed to receive 0.05% of uranium leaving the circulation and to lose uranium back to blood with a half-time of 5 y. These parameter values were chosen to be consistent with data on urinary excretion and renal retention of uranium, including data for the relative retention in kidneys and liver in occupationally and environmentally exposed humans. Parameter values for urinary path were based largely on retention data on baboons injected with tracer quantities of uranium (Neton et al., 1979; Lipsztein, 1981; Bhattacharyya et al., 1989) and data on dogs administered low to moderate masses of uranium (Tannenbaum, 1951; Fish and Bernard, 1961). However, the model was required to remain broadly consistent with data on humans and dogs exposed to relatively high masses of uranium. (908) Model predictions of short-term urinary excretion of uranium are compared in Fig. 15.2 with data from the human injection studies. Model predictions of daily urinary uranium during the first week are within the wide range of observations at all times, but are generally higher than central values from the injection studies at times greater than a few days after injection. Essentially, predictions of urinary uranium at remote times are driven by parameter values for uptake and removal of uranium by individual tissues, particularly the skeleton, which is expected to contain most of the retained uranium by a few weeks after uptake. The model was not designed to reproduce the central values of the observations for the human subjects at later times, due to the poor physical condition of most of the subjects and the high variability of the data. (c) Faecal excretion (909) Faecal excretion accounted for less than 1% of total excretion in the human injection studies discussed above (Leggett, 1994; ICRP, 1995). Similar results were obtained for baboons (Lipsztein, 1981). In beagles, an estimated 2–5% of injected uranium was excreted in the faeces in the first 2 weeks (Stevens et al., 1980; Morrow et al., 1982). In the present model, it is assumed that 0.5% of activity leaving the circulation enters the right colon contents and is subsequently excreted in faeces. (d) Liver retention (910) The assumptions for uranium retention in the liver in the ICRP model are based on the available experimental data for humans, baboons, and dogs, and data for chronic exposure of humans. Liver compartments (Liver 1 and Liver 2) are used to model the short-term retention of uranium shown by the experimental data and the long-term retention indicated by the environmental data. It is assumed that 1.5% of uranium leaving the circulation deposits in Liver 1 and that the retention half-time for this compartment is 7 d. Outflow from Liver 1 is divided between Liver 2 and plasma in the ratio 7:93. The half-time of retention in Liver 2 is assumed to be 10 y. (e) Other soft tissues (911) The high initial uptake of uranium by soft tissues is discussed above. This is modelled by assuming that 30% of outflow from plasma enters the soft tissue compartment ST0. Soft tissue compartments ST1 and ST2 are used to model intermediate- and long-term retention of uranium in soft tissues. Parameter values for these compartments were set for consistency with data for the Boston subjects and data for chronic exposure, suggesting that there may be significant long-term retention of uranium in soft tissues (Igarashi et al., 1985; Fisenne et al., 1988; Gonzales and McInroy, 1991). For example, post-mortem data for two non-occupationally exposed persons indicate that muscle and skin accounted for approximately 25% of retained uranium, with 70% in the skeleton (Gonzales and McInroy, 1991). (912) ST1 and ST2 are assumed to receive 6.65% and 0.3%, respectively, of uranium leaving the circulation. Removal half-times from these compartments to plasma are assumed to be 20 d and 100 y, respectively. The model predicts that chronic soft tissues (ST0 + ST1 + ST2) contain approximately 20% of total body uranium in chronically exposed adults. (f) Retention in the skeleton (913) There is evidence that UO2++ exchanges with Ca++ at the surfaces of bone mineral crystals, although UO2++ apparently does not participate in crystal formation or enter existing crystals. Also, the early gross distribution of uranium in the skeleton is similar to that of calcium. Like calcium, uranium is initially present on all bone surfaces but is most concentrated in areas of growth. Studies on dogs demonstrated that uranium on bone surfaces diffuses into bone volume, although at a slower rate than calcium (Rowland and Farnham, 1969; Stevens et al., 1980). Such diffusion was absent or less pronounced in rodents (Kisieleski et al., 1952; Priest et al., 1982). Autoradiographic studies of 233U in mice at 1 d and 224 d after injection indicate an initial deposition of uranium on bone surfaces and subsequent burial of lines of activity, as well as some evidence of diffuse activity within bone mineral (Ellender et al., 1995). In all species for which there are data, there is evidence of similarity to calcium in that return of uranium from bone to plasma occurs at rates that are greater than could be attributed to bone resorption alone. (914) Parameter values for uptake and retention in the skeleton were based on data from the Boston study, animal data, post-mortem measurements on environmentally and occupationally exposed humans, analogy with the alkaline earth elements, and considerations of bone metabolism. Each of the data sets has important limitations to their usefulness for the prediction of the skeletal kinetics of uranium in healthy humans. The Boston subjects were terminally ill, and their calcium metabolism may have been abnormal. Extrapolation of biokinetic data from laboratory animals to man is prone to error, particularly data for rodents. Baboon data for uranium are limited, and dog data are subject to uncertainties resulting from the use of high masses of uranium, small number of animals, and small bone samples. Some investigators have reported much higher early accumulation of uranium in the skeleton than assumed in the model. For example, Sanotskii et al. (1963, 1964) reported high initial deposition of uranium in the skeleton (25–40% of the administered amount) in dogs, rabbits, and rats after subcutaneous or intratracheal administration of uranyl nitrate, although only 3–4% was retained after 6 months. (915) It is assumed in the model that 15% of uranium leaving the circulation deposits on bone surfaces. By analogy with the alkaline earth elements (ICRP, 1993), the ratio of the amount deposited on trabecular surfaces to that deposited on cortical surfaces is assumed to be 1.25 in the mature skeleton (after 25 y of age). The value of 1.25 is derived from an average six-fold greater rate of turnover of trabecular bone divided by a four-fold greater cortical bone mass (Leggett et al., 1982; Leggett, 1992). The rate of removal of uranium from bone surfaces cannot be estimated with much certainty, but reasonable lower and upper bounds can be determined. Uranium apparently leaves bone surfaces much more slowly than calcium (Rowland and Farnham, 1969; Stevens et al., 1980), but a half-time longer than approximately 5–10 d would be difficult to reconcile with the relatively rapid loss of uranium from bone seen in human and most animal studies. The assumption made is of a removal half-time of 5 d, compared with a value of 1 d for calcium (Leggett, 1992). Due to recycling, the apparent retention time on bone surfaces will be greater than 5 d. For consistency with the available experimental data for the first few weeks after injection, it is assumed that 50% of uranium from bone surfaces returns to plasma and 50% transfers to exchangeable bone volume. (916) The removal half-time assigned to the exchangeable bone volume is 30 d. This value was derived for radium and lead (Leggett, 1992, 1993). From exchangeable bone volume, 75% of uranium is returned to bone surfaces and 25% transfers to non-exchangeable bone volume. Removal from non-exchangeable bone volume to plasma is assumed to occur at the rate of bone turnover [reference values given in ICRP (2002b)]. (917) The model predicts that the uranium content of the skeleton is approximately 30 times greater than that of the liver following constant chronic exposure to uranium, in reasonable agreement with most autopsy data for occupationally or environmentally exposed subjects. The model predicts that the adult skeleton contains approximately 75% of the body content of uranium after chronic exposure, consistent with autopsy data (Gonzales and McInroy, 1991).
15.3.3. Treatment of radioactive progeny
(918) The radioactive progeny of uranium isotopes addressed in the derivation of dose coefficients for the uranium parents are isotopes of actinium, thorium, protactinium, uranium, neptunium, plutonium, radium, radon, polonium, lead, bismuth, thallium, francium, and astatine. (919) The models for actinium, thorium, radium, radon, polonium, lead, bismuth, thallium, francium, and astatine as radium or thorium progeny are applied to these elements as uranium progeny. The models for protactinium and uranium as thorium progeny are applied to protactinium and uranium, respectively, as uranium progeny. (920) A modified version of the characteristic model for neptunium applied in Publication 67 (ICRP, 1993) and a later part of the OIR series is applied to neptunium as a uranium progeny. Two compartments, one representing spleen and the other representing skin, are added to the explicitly identified source regions in the characteristic model for neptunium. Skin and spleen are taken from the intermediate soft tissue compartment ST1; that is, the deposition fraction for ST1 is reduced by the deposition fractions assigned to spleen and skin, and the removal half-time from ST1 to blood is assigned to spleen and skin. Deposition in skin is calculated as its mass fraction of other soft tissues times its deposition fraction in other soft tissues, excluding deposition in the fast-turnover compartment ST0. The deposition fraction for spleen is set at one-third of the deposition fraction for skin, considering the relative masses of these tissues and the typically higher concentrations of actinides in spleen than skin observed in laboratory animals and human subjects. If neptunium is produced in a compartment that is not identifiable with a compartment in its characteristic model, it is assumed to transfer to neptunium’s central blood compartment at the rate 1000 d−1 if produced in a blood compartment, at the rate of transfer from the fast-turnover soft tissue compartment ST0 to blood (0.693 d−1) if produced in a soft tissue compartment, and at the rate of bone turnover if produced in a bone volume compartment. (921) The model for plutonium as a uranium progeny is a simplification of the characteristic model for plutonium applied in a later part of the OIR series (also see Leggett et al., 2005b). The model structure applied to plutonium as a uranium progeny is the generic model structure for bone-surface-seeking radionuclides (see Fig. 14.2) with two added compartments representing spleen and skin. It is assumed that the outflow rate from blood to all destinations is 1 d−1, that 30% of outflow deposits in a compartment of other soft tissues with relatively fast turnover (ST0, considered as part of the circulation), and that 70% of the outflow leaves the circulation. It is assumed that 60% of plutonium that leaves the circulation deposits in Liver 1, 18% on trabecular bone surfaces, 12% on cortical bone surfaces, 2.1% in right colon contents, 2% in urinary bladder contents, 1% in Kidneys 1 (urinary path), 0.05% in Kidneys 2 (other kidney tissue), 0.035% in testes, 0.011% in ovaries, 0.1% in spleen, 0.3% in skin, 3% in a compartment of other soft tissues with relatively slow turnover (ST2), and the remaining 1.404% in a compartment of other soft tissues with intermediate turnover (ST1). Plutonium leaves Liver 1 with a half-time of 1 y, with 1% moving to the small intestine contents via biliary secretion, 80% returning to blood, and 19% depositing in Liver 2. Plutonium transfers from ST0 to blood with a half-time of 7 d; from spleen, skin, and ST1 to blood with a half-time of 500 d; from Liver 2, Kidneys 2, and ST2 to blood with a half-time of 15 y; from Kidneys 1 to urinary bladder contents with a half-time of 40 d; and from testes and ovaries to blood with a half-time of 5 y. Plutonium depositing on bone surfaces follows the generic model for bone-volume-seeking radionuclides. Plutonium produced in a compartment that is not identifiable with a compartment in the plutonium model is assumed to transfer to the blood compartment of the plutonium model at the rate 1000 d−1 if produced in a blood compartment, at the rate of bone turnover if produced in an exchangeable bone volume compartment, and at the rate 0.099 d−1 (t1/2 = 7 d) for remaining unidentifiable or ambiguous compartments. Summary of results for eight of the Boston subjects, based on data of Struxness et al. (1956) and Bernard and Struxness (1957), and logbooks from the Boston study (after Leggett, 1994).

15.4. Individual monitoring
(922) As 234U and 238U are naturally present in the environment and in the diet, excretion rates of natural uranium are expected and should be evaluated for the population in the region of residence of the workers. The monitoring results of 234U and 238U in excreta samples of occupationally exposed personnel should be compared with the background excreta uranium concentrations by statistical techniques. A baseline might be established for an individual or for the bioassay monitoring programme.
15.4.1. 234U
(923) 234U intake is determined by measuring the nuclide concentration in urine and faeces. Daily urinary and faecal excretion of 234U following inhalation of 1 Bq Type M/S.
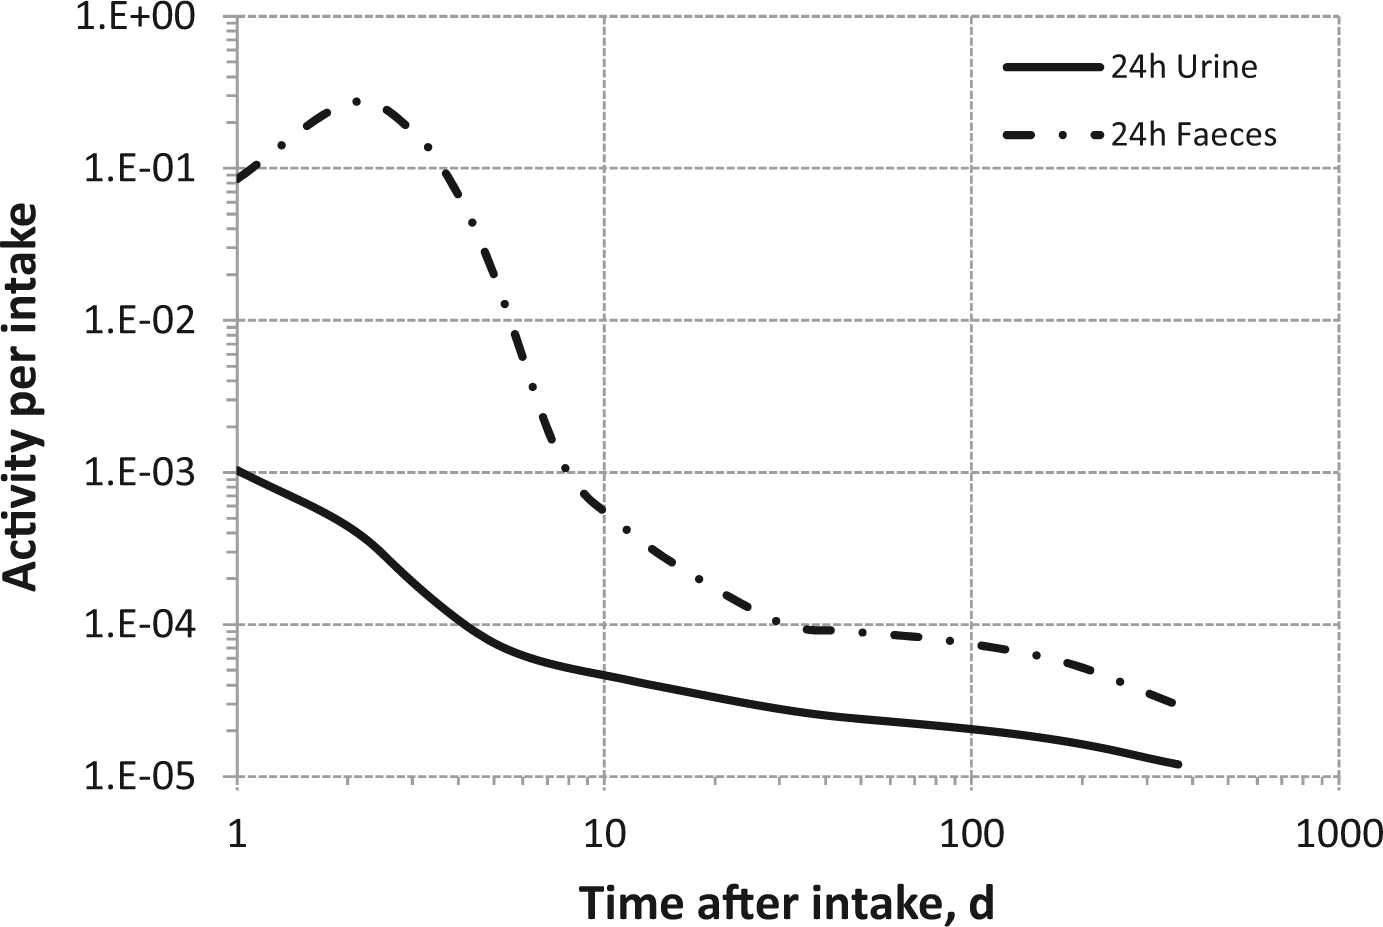
15.4.2. 235U
(924) Measurements of 235U concentrations in urine and faeces are used to determine intakes of the nuclide. The main techniques used for urinalysis are alpha spectrometry and ICP-MS with capacity to determine the isotopic composition of uranium in urine. 235U may also be monitored by in-vivo lung counting. Whole-body measurement might be used as a complement.
15.4.3. 238U
(925) Measurements of 238U concentrations in urine are used in the monitoring of workers exposed to uranium. Several techniques are used for urine bioassays, alpha spectrometry, ICP-MS, kinetic phosphorescence analysis, and fluorimetry. The use of ICP-MS has increased in recent years, and several variations of the technique and instrument may be used, such as quadrupole, sector field, multi-collector, and high-resolution ICP-MS. Some of these techniques may be used to identify and quantify the isotopic composition of uranium excreted in urine. 238U concentrations in faeces may also be used as a monitoring tool to complement the results from urine bioassay. 238U may also be monitored by in-vivo lung counting. 238U detection is based on the 62.8- and 92.3-keV photons emitted by its progeny 234Th. Transfer coefficients in the model for systemic uranium. RBC, red blood cells; exch, exchangeable; nonexch, non-exchangeable. ST0, ST1, and ST2 represent soft tissues with fast, intermediate, and slow turnover, respectively.

15.5. Dosimetric data for uranium
Daily urinary and faecal excretion of 234U following inhalation of 1 Bq uranium aluminide. Monitoring techniques for 234U. Monitoring techniques for 235U. ICP-MS, inductively coupled plasma mass spectrometry. Monitoring techniques for 238U. ICP-MS, inductively coupled plasma mass spectrometry; TrKPA, kinetic phosphorescence analysis. 1.6 × 10⁻⁶ mg L − 1 = 0.02 mBq L−1. 8.1 × 10⁻⁸ mg L−1 = 0.001 mBq L−1. This is a historical method, and is no longer used. Detection limit refers to 234Th measurement. Committed effective dose coefficients (Sv Bq−1) for the inhalation or ingestion of 234U, 235U, and 238U compounds. AMAD, activity median aerodynamic diameter. Dose per activity content of 234U in daily excretion of urine and faeces (Sv Bq−1); 5-µm activity median aerodynamic diameter aerosols inhaled by a reference worker at light work. Dose per activity content of 235U in total body, lungs, and in daily excretion of urine and faeces (Sv Bq−1); 5-µm activity median aerodynamic diameter aerosols inhaled by a reference worker at light work. Dose per activity content of 238U in lungs (234Th measured) and in daily excretion of urine and faeces (Sv Bq − 1); 5-µm activity median aerodynamic diameter aerosols inhaled by a reference worker at light work. Daily urinary and faecal excretion of 234U following inhalation of 1 Bq Type F. Daily urinary and faecal excretion of 234U following inhalation of 1 Bq Type M. Daily urinary and faecal excretion of 234U following inhalation of 1 Bq Type S. Total body and lung contents, and daily urinary and faecal excretion of 235U following inhalation of 1 Bq Type F/M. Total body and lung contents, and daily urinary and faecal excretion of 235U following inhalation of 1 Bq Type M/S. Total body and lung contents, and daily urinary and faecal excretion of 235U following inhalation of 1 Bq uranium aluminide. Total body and lung contents, and daily urinary and faecal excretion of 235U following inhalation of 1 Bq Type F. Total body and lung contents, and daily urinary and faecal excretion of 235U following inhalation of 1 Bq Type M. Total body and lung contents, and daily urinary and faecal excretion of 235U following inhalation of 1 Bq Type S. Lung content (234Th measured) and urinary and faecal excretion of 238U following inhalation of 1 Bq Type F/M. Lung content (234Th measured) and urinary and faecal excretion of 238U following inhalation of 1 Bq Type M/S. Lung content (234Th measured) and urinary and faecal excretion of 238U following inhalation of 1 Bq Type uranium aluminide. Lung content (234Th measured) and urinary and faecal excretion of 238U following inhalation of 1 Bq Type F. Lung content (234Th measured) and urinary and faecal excretion of 238U following inhalation of 1 Bq Type M. Lung content (234Th measured) and urinary and faecal excretion of 238U following inhalation of 1 Bq Type S.


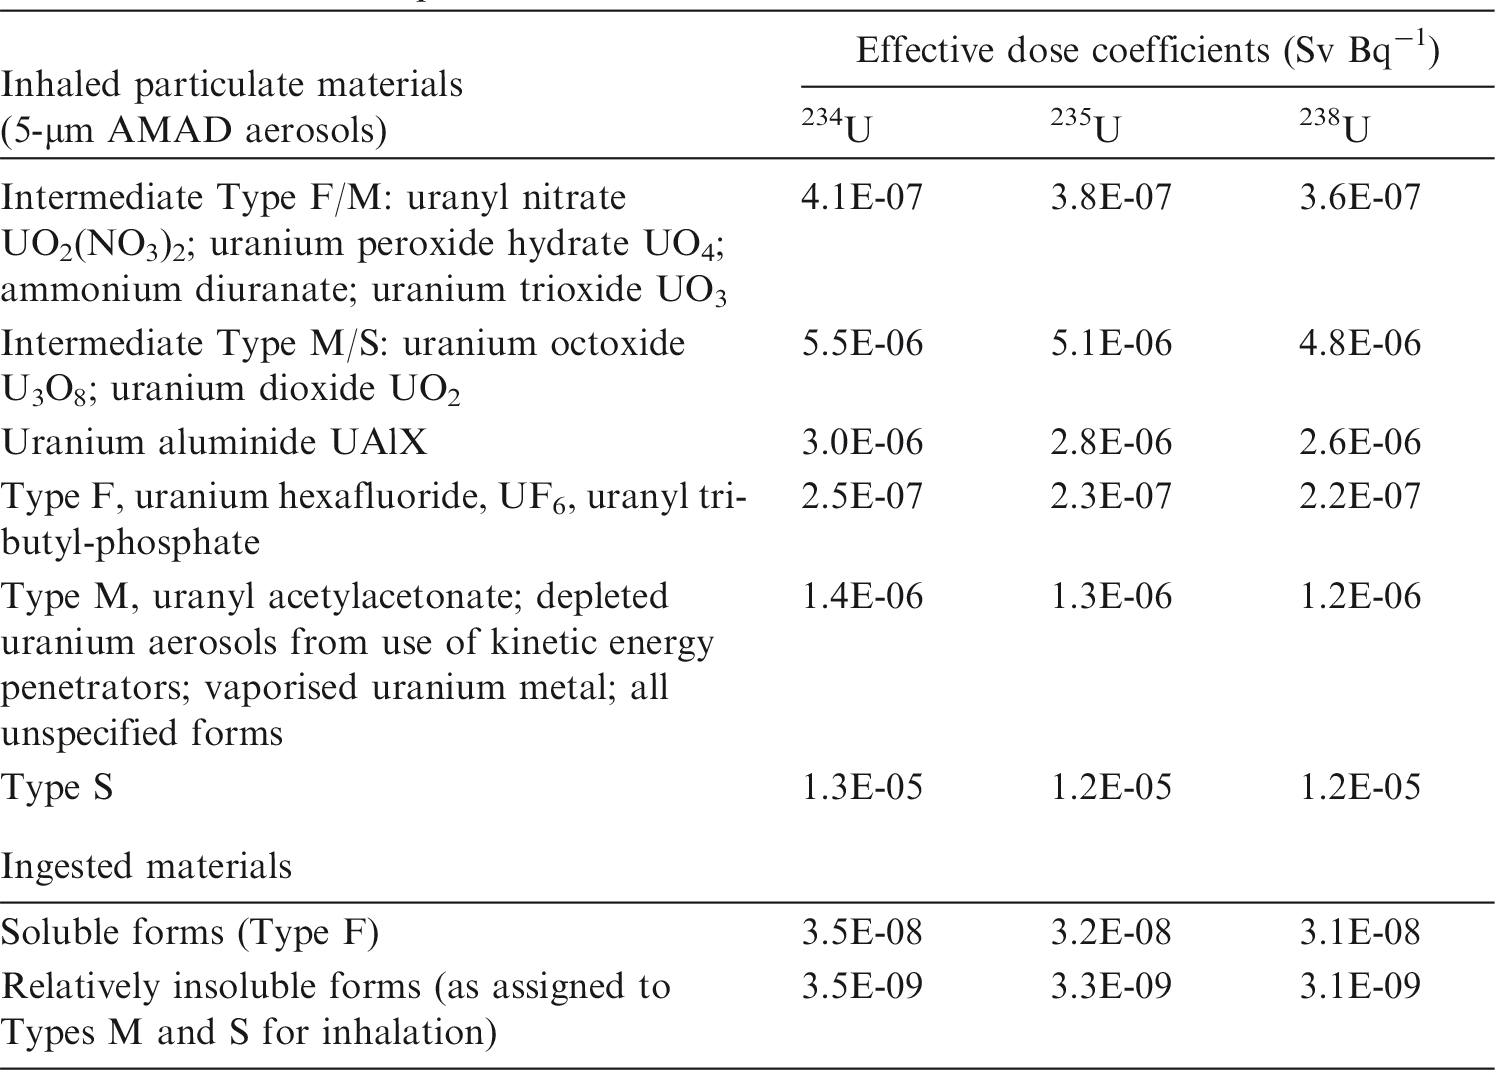


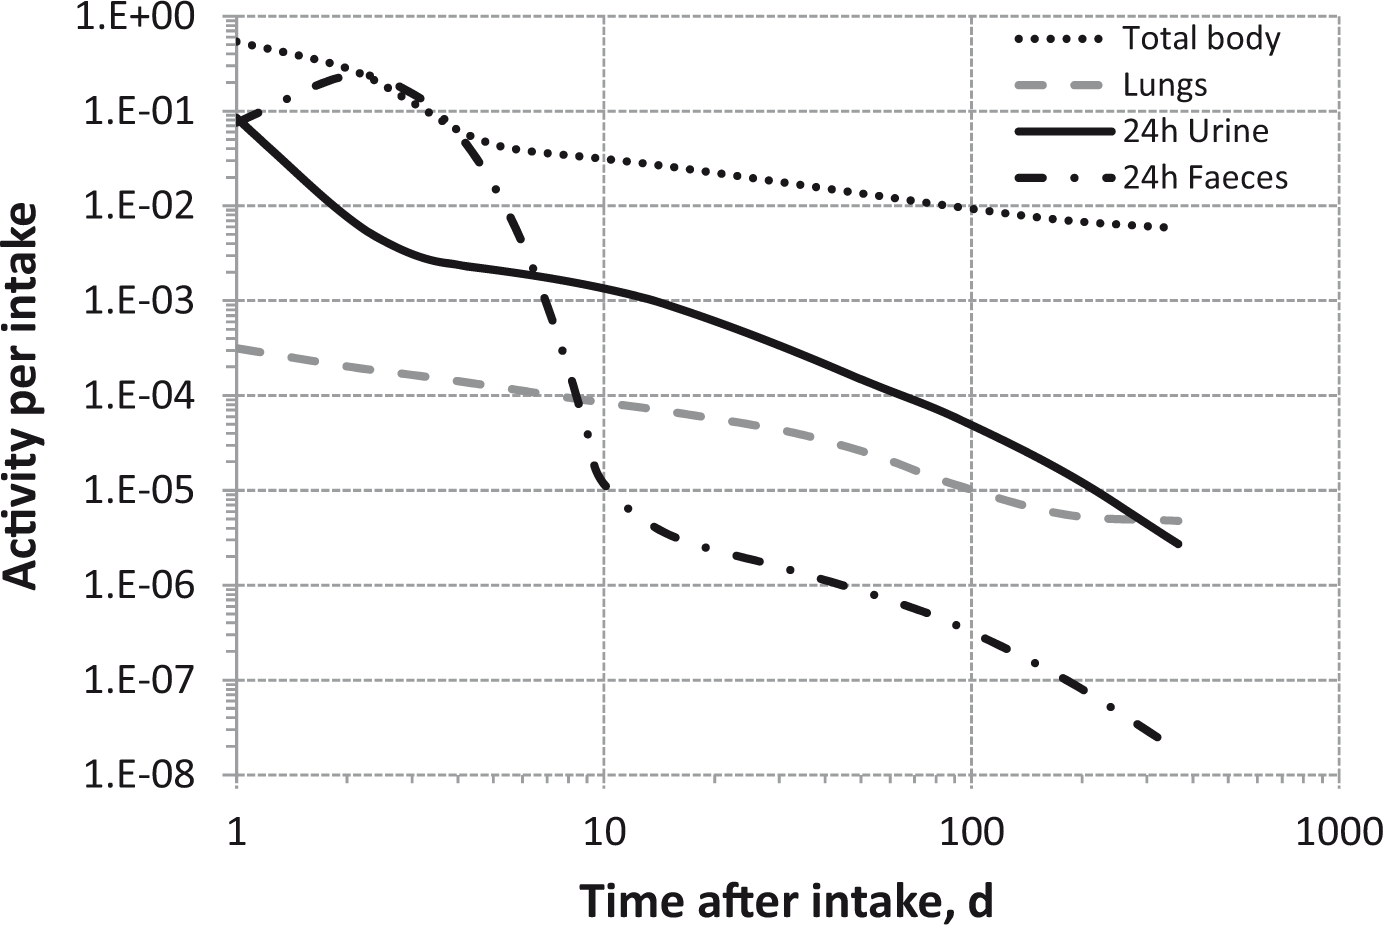

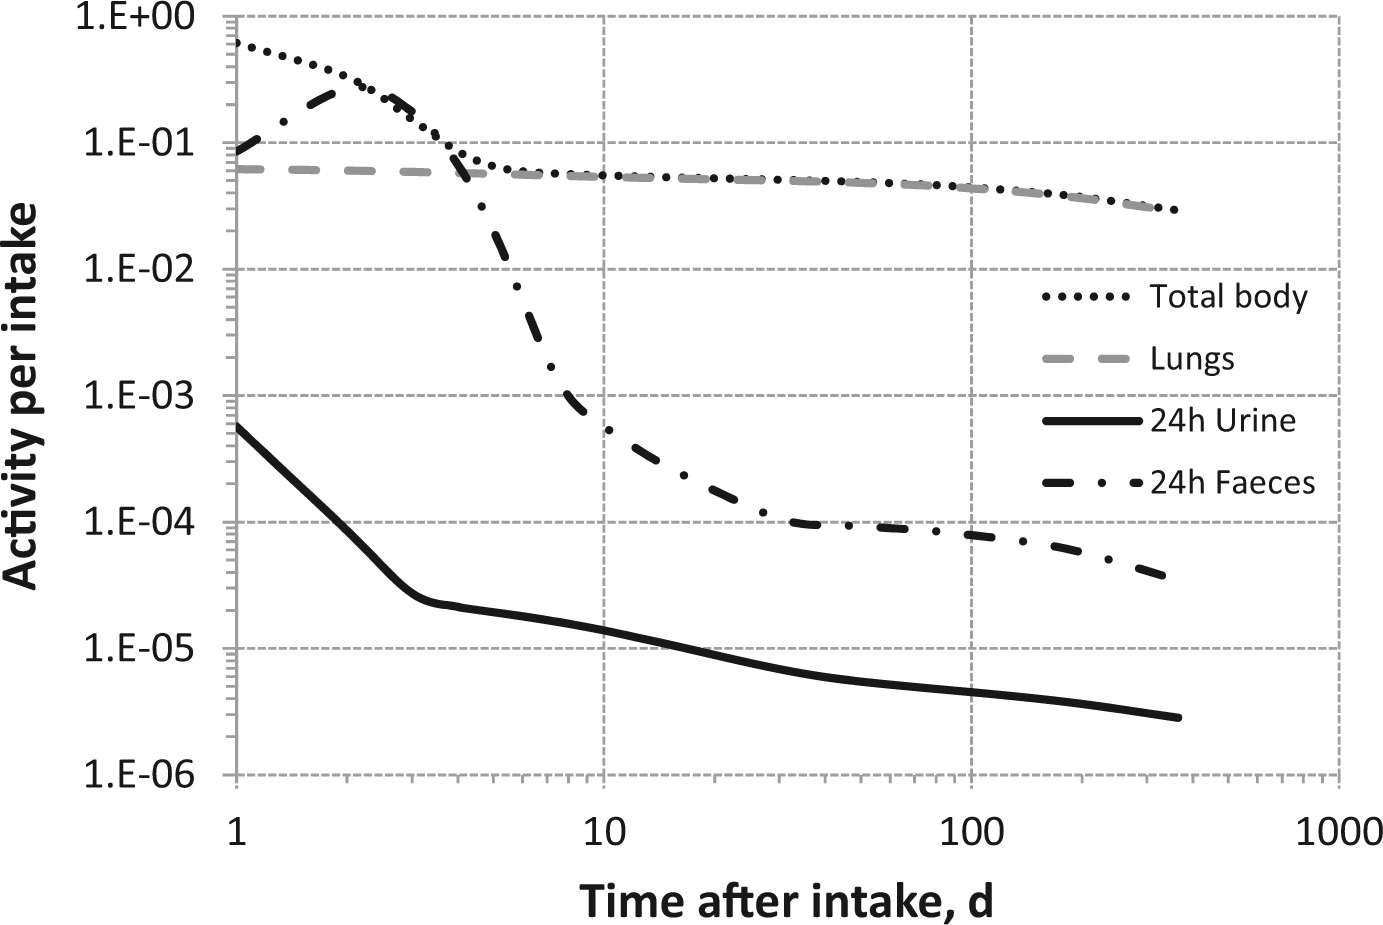


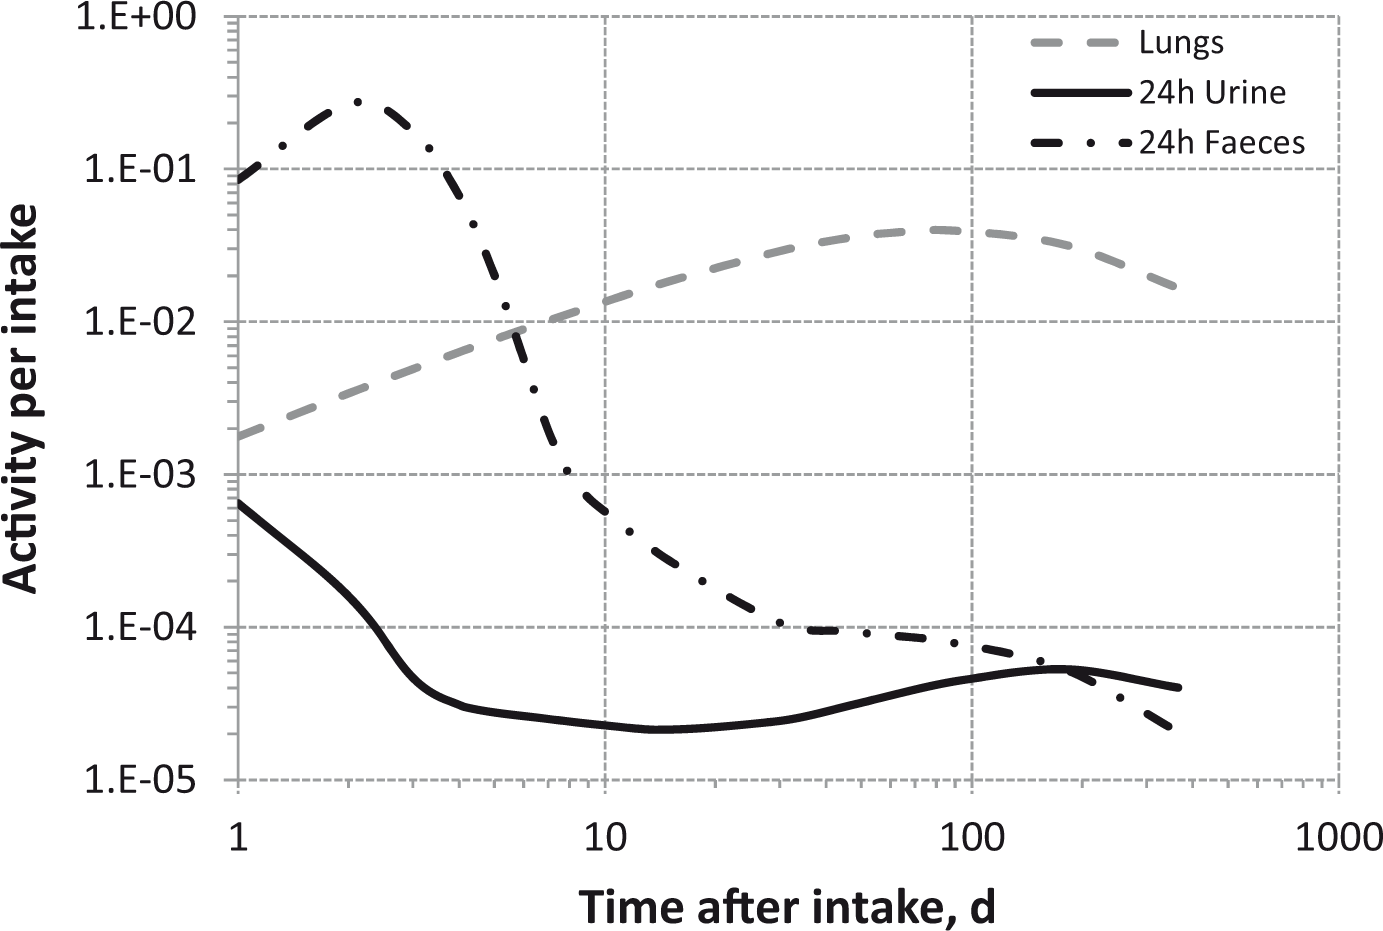

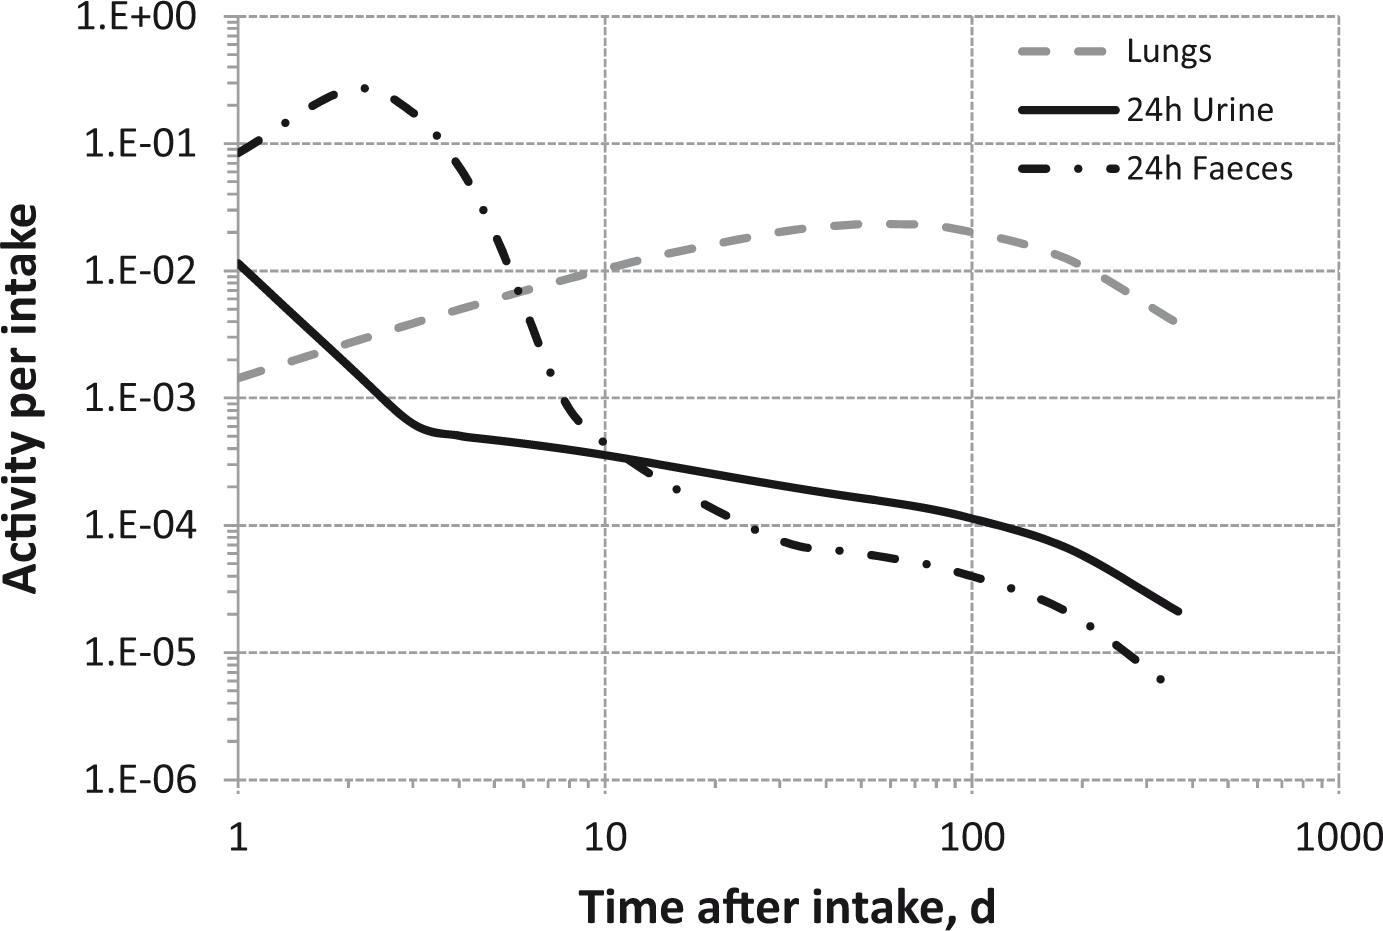

15.6. References
ANNEX A. AEROSOL DATA AND DOSE COEFFICIENTS FOR RADON PROGENY
A.1. Introduction

Natural decay series: 238U.
(A1) Radiation doses associated with exposure to radon are generally due primarily to inhalation of the accompanying short-lived progeny. Effective dose coefficients for the inhalation of progeny of 222Rn and 220Rn are given in this annex, based on the standard dosimetric methodology applied in the OIR series, as described in Publication 130 (ICRP, 2015). That is, these dose coefficients are derived from biokinetic models for radon or thoron progeny and dosimetric models describing transport of radiations emitted by these radionuclides. (A2) This annex provides a detailed treatment of the dosimetry of radon progeny, including a review of empirical data on the physical properties of airborne radon progeny, and a description of quantities and units that characterise the concentrations of radon and radon progeny in the air. Effective dose coefficients are provided for inhalation of short-lived progeny of 222Rn or 220Rn in indoor workplaces and mines. Effective dose coefficients are also calculated for inhalation of 222Rn progeny in tourist caves. The dose coefficients are expressed in units of mSv per working level month (WLM), mSv per mJ h m − 3, or mSv per Bq h m−3. In addition, this annex also provides dosimetric data to support calculations of site-specific dose coefficients based on aerosol data. (A3) Organ and tissue equivalent dose coefficients for exposures to radon and thoron progeny are given in the accompanying electronic annex. Effective dose coefficients for the inhalation of actinon (219Rn) progeny are also given in the accompanying electronic annex.
A.2. Use of dosimetric data for radon progeny
(A4) For the radioisotopes of most elements, dose coefficients are given in the OIR series for different exposure conditions (mainly different chemical forms) with the advice that site-specific dose coefficients may be calculated in situations where more specific data are available and estimated doses warrant more detailed consideration. (A5) Radon (222Rn) represents a special case because there is now good and consistent information on risks of radon-induced lung cancer derived from epidemiological studies of underground miners and from residential pooled analyses (ICRP, 2010). In Publication 65 (ICRP, 1993), a nominal risk coefficient of 8 × 10⁻⁵ per mJ h m−3 (2.8 × 10⁻⁴ WLM−1) for a mixed adult population of smokers and non-smokers was derived from the epidemiological data for exposures in underground mines available at the time. By comparing this nominal risk coefficient with the detriment per unit effective dose values of Publication 60 (ICRP, 1991), dose conversion convention values of effective dose of 1.4 mSv per mJ h m−3 (5 mSv WLM−1) for adults (i.e. workers) and 1.1 mSv per mJ h m−3 (4 mSv WLM−1) for all ages (ICRP, 1993) were obtained. In Publication 115 (ICRP, 2010), more recent epidemiological data were reviewed, focusing on low levels of exposure and low exposure rates in mines, and a revised nominal risk coefficient of 1.4 × 10⁻⁴ per mJ h m−3 (5 × 10⁻⁴ WLM−1) was proposed and endorsed in the accompanying Statement on Radon. Comparisons of lung cancer risk estimates derived from residential and miner epidemiological studies showed good agreement (ICRP, 2010). A more recent study of a large cohort of German uranium miners showed slightly lower but broadly consistent results for the risk of lung cancer at lower levels of exposure (Kreuzer et al., 2015). (A6) With the revised nominal risk coefficient of 1.4 × 10⁻⁴ per mJ h m−3 (5 × 10⁻⁴ WLM−1), and the Publication 103 detriment values (ICRP, 2007), dose conversion convention values of effective dose of 3.4 mSv per mJ h m−3 (12 mSv WLM−1) for adults and 2.6 mSv per mJ h m−3 (9 mSv WLM−1) for all ages (Marsh et al., 2010) were derived. The value of 2.6 mSv per mJ h m−3 was obtained in the absence of any reliable information on risks of exposure to radon and progeny during childhood. (A7) Dosimetric calculations using the aerosol parameter values summarised in Table A.3 give effective dose coefficients of 3.1 mSv per mJ h m−3 (11 mSv WLM−1) for mines, 5.6 mSv per mJ h m−3 (20 mSv WLM−1) for indoor workplaces, and 6.6 mSv per mJ h m−3 (23 mSv WLM−1) for tourist caves, considering the dose from radon progeny (Table A.11). These values were calculated assuming the breathing rate for a reference worker of 1.2 m3 h−1 (2.5 h d−1 sitting and 5.5 h d−1 light exercise; i.e. approximately one-third of time spent sitting and two-thirds of time spent in light exercise). For sedentary occupations such as office work, this reference breathing rate is likely to be an overestimate. Assuming a lower breathing rate of 0.86 m3 h−1 (two-thirds of time spent sitting, one-third of time spent in light exercise) would reduce the dose coefficient from 5.6 mSv per mJ h m−3 to approximately 3.9 mSv per mJ h m−3 (20 mSv WLM−1 to approximately 14 mSv WLM−1) (Harrison and Marsh, 2012). For dwellings, the dose coefficient was calculated to be 3.6 mSv per mJ h m−3 (13 mSv WLM−1) (Marsh and Bailey, 2013). Each of these dose coefficients applies to inhalation of radon progeny, and does not include the small additional contributions (<5%) from radon gas which are considered in Section 12. While the effective dose from inhaled progeny is dominated by dose to the lungs, inhaled radon gas is distributed around the body, and only approximately one-third of the effective dose is contributed by lung dose. (A8) In considering the consistency between dose coefficients obtained by dosimetric calculations and by epidemiological comparisons, the underlying uncertainties in both approaches should be recognised. Taking account of both approaches, the Commission recommends the use of a single rounded dose coefficient of 3 mSv per mJ h m−3 (approximately 10 mSv WLM−1) for the calculation of doses following exposure to radon and radon progeny in underground mines and in buildings, in most circumstances. The Commission considers this dose coefficient to be applicable to the majority of circumstances with no adjustment for aerosol characteristics. However, for indoor workplaces where workers are engaged in substantial physical activities, and for workers in tourist caves, a dose coefficient of 6 mSv per mJ h m−3 (approximately 20 mSv WLM−1) is considered to be more appropriate. Furthermore, in cases where aerosol characteristics are significantly different from typical conditions, where sufficient, reliable aerosol data are available and estimated doses warrant more detailed consideration, calculation of site-specific dose coefficients can be carried out using the dosimetric data provided in this publication and in the accompanying electronic annex. (A9) In terms of measurements of 222Rn gas exposure, the dose coefficient of 3 mSv per mJ h m−3 corresponds to 6.7 × 10⁻⁶ mSv per Bq h m−3 assuming an equilibrium factor, F, of 0.4. With an occupancy of 2000 h y−1 for a worker (ICRP, 1993, 2010) and F = 0.4, the effective dose corresponding to annual exposure at the upper reference level of 300 Bq m−3 recommended in Publication 126 (ICRP, 2014) is 4 mSv. (A10) Dose coefficients following the inhalation of thoron progeny were calculated for two situations of exposure: indoor workplaces and mines (Table A.11). On the basis of these calculations, it is recommended that a single value of 1.5 mSv per mJ h m−3 (5 mSv WLM−1) is used for all situations of occupational exposure. As in the case of inhalation of radon progeny, if sufficient, reliable aerosol data are available and estimated doses warrant more detailed consideration, calculation of site-specific dose coefficients can be carried out using the dosimetric data provided in this publication and the accompanying electronic annex. Natural decay series: 235U. Potential alpha energy per atom and per activity for radon and thoron progeny. 212Bi decays into 212Po and 208Tl with branching ratio of 64% and 36% (Fig. A.3). Absorption parameter values for inhaled radon progeny.


A.3. Physical properties of airborne radon progeny
(A11) 222Rn, 220Rn (thoron), and 219Rn (actinon) gases decay into a series of solid short-lived radionuclides (Figs. A.1–A.3). The resulting aerosol is created as follows (Fig. A.4). After decay of the radon gas, the freshly formed radionuclides react rapidly (<1 s) with trace gases and vapours, and grow by cluster formation to form particles approximately 1 nm in size. These are referred to as ‘unattached progeny’. The unattached radionuclides may also attach to existing aerosol particles in the atmosphere within 1–100 s, forming the so-called ‘attached progeny’. The attached progeny can have a trimodal activity size distribution, which can be approximated by a combination of three lognormal distributions (Porstendörfer, 2001). These consist of the nucleation mode with an activity median thermodynamic diameter (AMTD) between 10 nm and 100 nm, the accumulation mode with AMTD values of 100–450 nm, and a coarse mode with activity median aerodynamic diameter (AMAD) of more than 1 µm. Generally, the greatest activity fraction is in the accumulation mode. (A12) The activity concentrations of the short-lived radon progeny in the air are, in practice, less than that of the parent radon gas, because radon progeny in the air can be removed by ‘plate-out’ (i.e. by deposition on surfaces), and because ventilation reduces the time available for the radon gas to decay (i.e. for the radon progeny to grow-in). This is quantified by the equilibrium factor, F, which is a measure of the degree of disequilibrium between the radon gas and its progeny (see below). If the activity concentrations of the short-lived radon progeny were equal to the activity concentration of the radon gas (i.e. secular equilibrium had been reached), F would be 1. However, because of plate-out and ventilation, F is, in practice, always less than 1; typically for 222Rn, F is 0.4 for indoor air and 0.2 for force-ventilated mines (Section A.5). (A13) For exposures to radon and thoron gas, inhalation of their short-lived progeny radionuclides (Figs. A.1–A.3) generally gives much higher contributions to effective dose than inhalation of the gas itself. Following inhalation of the short-lived progeny, most of their decay takes place in the lungs before clearance can occur, either by absorption into blood or by particle transport to the alimentary tract. As a consequence, the lung dose contributes more than 95% of the effective dose. Due to the importance of this route of exposure, detailed consideration is given below to exposures to radon and thoron progeny. Dose coefficients are given here for simultaneous intakes of short-lived radon and thoron progeny under exposure conditions representative of two different types of workplace: indoor workplaces and mines. Dose coefficients are also calculated for tourist caves following exposure to 222Rn progeny. Dosimetric data are also given to support calculations of specific dose coefficients for use in cases where aerosol conditions are significantly different from typical conditions, and where sufficient and reliable aerosol data are available to warrant an adjustment to the reference dose coefficients (Section A.2; A.8.2). Natural decay series: 232Th. Reference aerosol parameter values for different exposure scenarios for 222Rn progeny. fp, unattached fraction in terms of the potential alpha energy concentration; fpi, fraction of attached potential alpha energy concentration for mode i; AMTD, activity median thermodynamic diameter; σgi, geometric standard deviation of mode i; hgfi, hygroscopic growth factor for mode i. The unattached progeny are assumed to have AMTD of 1.0 nm with σg = 1.3, and unit density and shape factor. Indices i = ‘n’ and ‘a’ represent the nucleation and accumulation modes, respectively. The values chosen for density (ρ) and shape factor (χ) for a diesel-powered mine aerosol are based on the measurements of effective density (i.e. ρ/χ) of diesel exhaust particles, assumed to be ρ/χ = 0.7 g cm−3 (Park et al., 2003; Olfert et al., 2007). It is assumed that AMTD increases by hgf instantaneously as the particle enters the nose or the mouth. For simplicity, the hygroscopically enlarged particles are assumed to have unit density and shape factor.
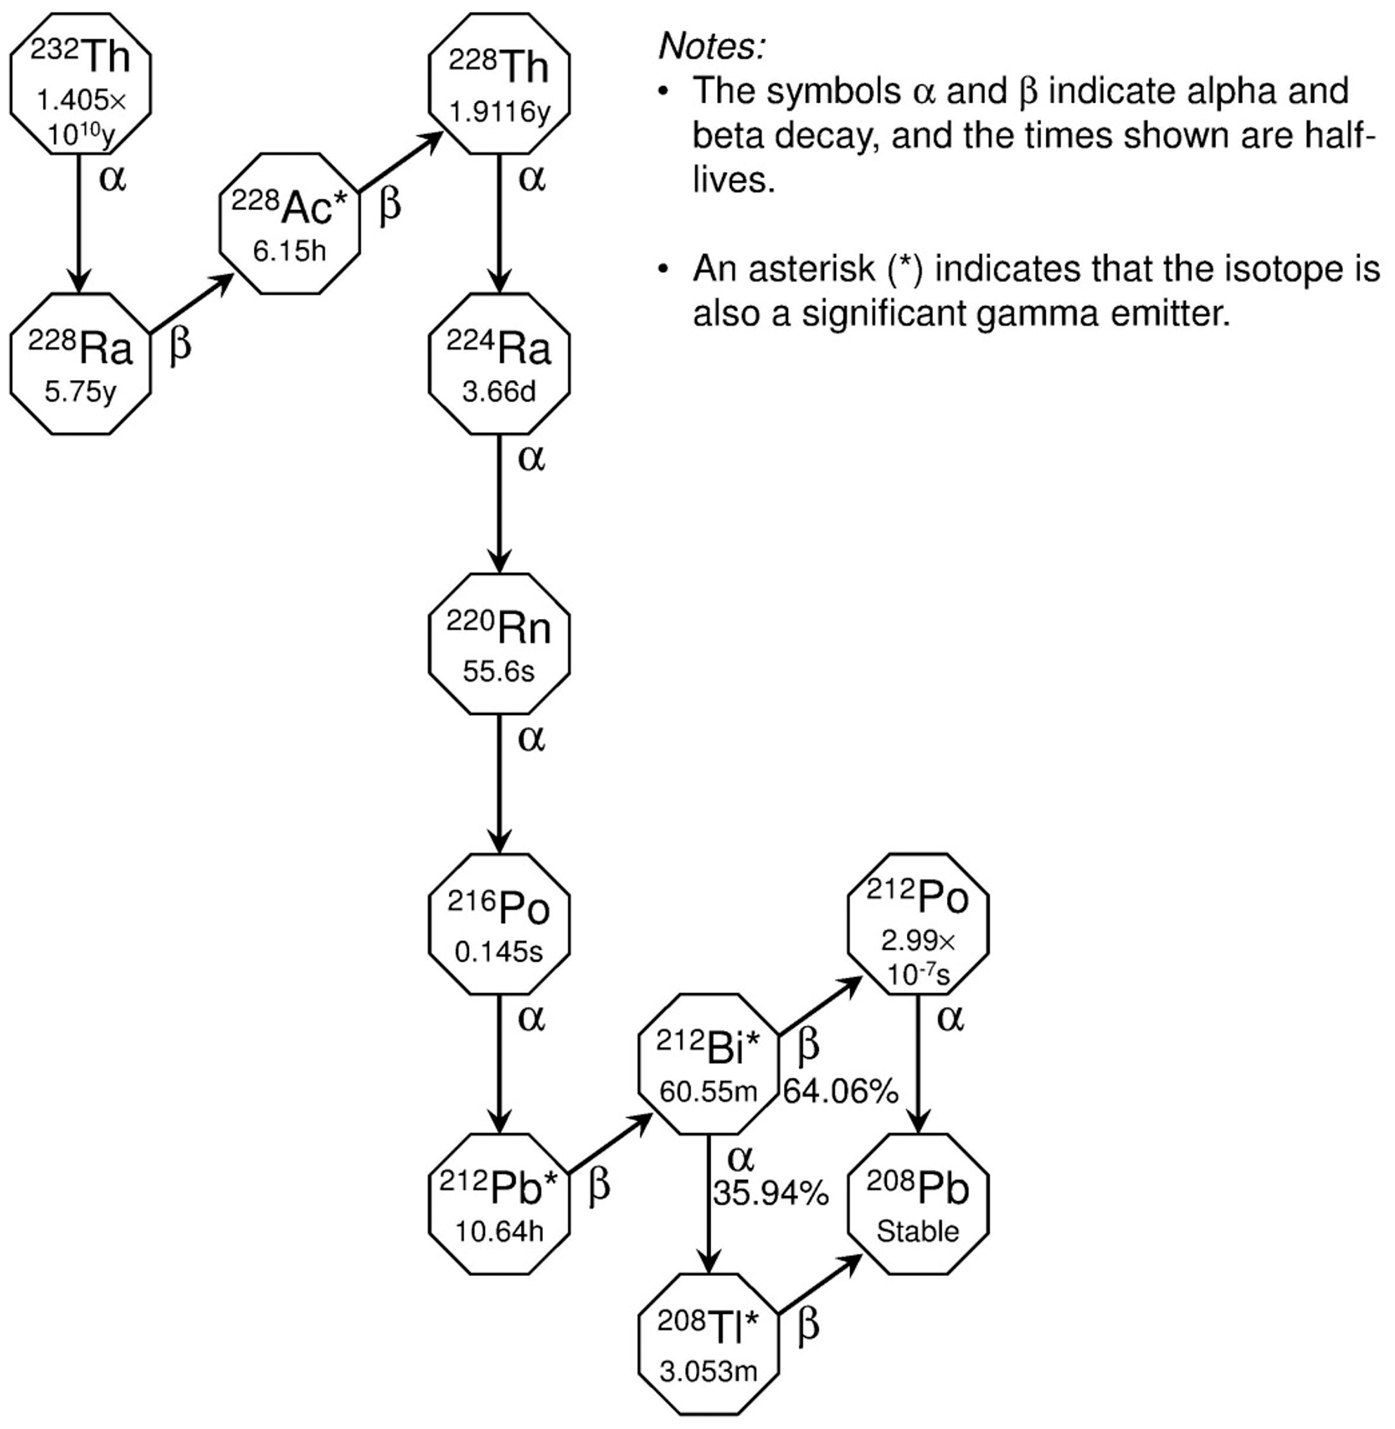

A.4. Special quantities and units
(A14) Special quantities and units are used to characterise the concentration of radon and its short-lived progeny in the air, and the resulting inhalation exposure. Schematic representation of the behaviour of radon progeny in an enclosed space (NRC, 1991; Porstendörfer, 1994). Reference aerosol parameter values for different exposure scenarios for thoron (220Rn) progeny. fp, unattached fraction in terms of the potential alpha energy concentration; fpi, fraction of attached potential alpha energy concentration for mode i; AMTD, activity median thermodynamic diameter; σgi, geometric standard deviation of mode i; hgfi, hygroscopic growth factor for mode i. The unattached progeny are assumed to have AMTD of 1.0 nm with σg = 1.3, and unit density and shape factor. Indices i = ‘n’ and ‘a’ represent the nucleation and accumulation modes, respectively. The values chosen for density (ρ) and shape factor (χ) for a diesel-powered mine aerosol are based on the measurements of effective density (i.e. ρ/χ) of diesel exhaust particles, assumed to be ρ/χ = 0.7 g cm−3 (Park et al., 2003; Olfert et al., 2007). It is assumed that AMTD increases by hgf instantaneously as the particle enters the nose or the mouth. For simplicity, the hygroscopically enlarged particles are assumed to have unit density and shape factor.


A.4.1. Concentration
(A15) The dose to the lungs mainly arises from inhalation of radon progeny and alpha particles emitted during their decay and that of their short-lived progeny. The quantity ‘potential alpha energy concentration (PAEC)’ of the radon progeny mixture was historically used as a measure of concentration that was an indicator of dose and risk. The potential alpha energy (PAE), ɛp,i, of an atom, i, in the decay chain of radon is the total alpha energy emitted during the decay of this atom to stable 210Pb. PAE per activity (Bq) of radionuclide, i, is ɛp,i/λr,i, where λ
r
(in s−1) is the radioactive decay constant. PAE per atom and per activity are listed in Table A.1 for the short-lived progeny of radon and thoron. PAEC, cp, of any mixture of short-lived radon progeny in air is the sum of PAE of these atoms present per volume of air. Thus, if ci (in Bq m−3) is the activity concentration of progeny nuclide i, PAEC of the progeny mixture is:
(A16) The historical unit of PAEC that was used in the mining industry is the working level (WL). A concentration of 1 WL is defined, in Publication 65 (ICRP, 1993), as any combination of the short-lived radon progeny in 1 m3 of air that will result in the emission of 1.300 × 10⁸ MeV of alpha energy (i.e. a PAEC of 1.300 × 10⁸ MeV m−3). (A17) The so-called ‘equilibrium equivalent concentration’ (EEC) is defined as the activity concentration of radon gas, in equilibrium with its short-lived progeny, which would have the same PAEC as the existing non-equilibrium mixture. It can therefore be calculated as follows for a given radon progeny mixture:

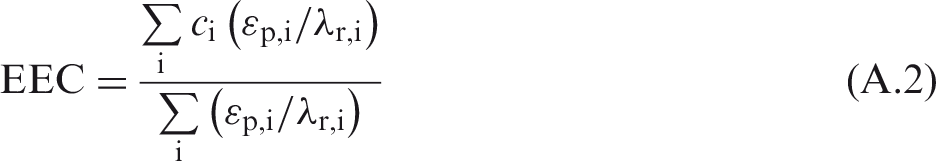
One working level equals approximately 3750 Bq m−3 of EEC of 222Rn (radon gas) or approximately 275 Bq m−3 of EEC of 220Rn (thoron gas). EEC is therefore a measure of the radon progeny concentration or, more precisely, PAEC.
A.4.2. Equilibrium factor, F
(A18) The equilibrium factor, F, is defined as the ratio of EEC to the radon gas concentration. In other words, it is the ratio of PAEC for the actual mixture of radon progeny to that which would apply at radioactive equilibrium.
A.4.3. Exposure
(A19) PAE exposure is defined as the time integral of PAEC in air. The SI unit of PAE exposure is J h m−3, and the historical unit applied to uranium mining is the WLM. The WLM is defined as the cumulative exposure from breathing an atmosphere at a concentration of 1 WL for a working month of 170 h. The relationship between the historical and SI units is as follows: (A20) One WLM equals approximately 6.37 × 10⁵ Bq h m−3 of EEC of 222Rn (radon gas) or approximately 4.68 × 10⁴ Bq h m−3 of EEC of 220Rn (thoron gas). In terms of SI units, 1 J h m−3 equals approximately 1.80 × 10⁸ Bq h m−3 of EEC of 222Rn gas or approximately 1.32 × 10⁷ Bq h m−3 of EEC of 220Rn gas. For 222Rn, if the exposure is expressed in terms of the radon gas concentration, the two units are related via the equilibrium factor: 1 WLM = (6.37 × 10⁵/F) Bq h m − 3 or 1 J h m − 3 = (1.80 × 10⁸/F) Bq h m−3. (A21) Due to its short half-life, the gas activity concentration of thoron can vary substantially across an enclosed space, and so it is not possible to use the thoron gas concentration in dose evaluation. Therefore, for control purposes, PAEC of the thoron progeny should be determined; that is, EEC of thoron should be controlled. In Publication 65 (ICRP, 1993), it was stated that ‘for protection against thoron, it is usually sufficient to control the intake of the decay product, 212Pb, which has a half-life of 10.6 h’. This is because PAE per activity inhaled is approximately 10 times higher for 212Pb than for other thoron progeny (Table A.1). However, in this publication, doses are calculated for exposures to thoron and its progeny, considering intakes of 212Pb as well as 212Bi and 220Rn.
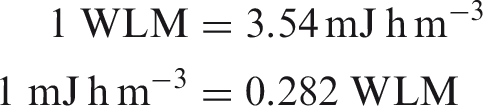
A.4.4. Unattached fraction, fp
(A22) The unattached fraction, fp, is defined as the fraction of PAEC of the short-lived progeny that is not attached to the ambient aerosol. The magnitude of fp primarily depends on the concentration of particles of ambient aerosol, Z. Porstendörfer (2001) assessed the unattached fraction by measuring the fraction of radon and thoron progeny penetrating a single screen diffusion battery with 50% penetration for 4-nm-diameter particles. A condensation nuclei counter was used to measure Z for particle diameters of more than 5 nm. Porstendörfer (2001) showed that the unattached fraction, fp, can be approximated with the semi-empirical equations:
(A23) Eq. (A.3) agrees fairly well with data for 2000 < Z < 7 × 105 cm−3 (Porstendörfer, 2001). At lower particle concentrations (Z < 400 cm−3), the agreement with data is poor (Cheng et al., 1997). The above equation may also underestimate fp in situations where the radon progeny are far from equilibrium, as is the case in some modern mines, which are ventilated at a high rate to reduce radon concentrations (Cavallo et al., 1999). Due to the relatively long radioactive half-life of the thoron progeny nuclide 212Pb (10 h), the fp value for the thoron progeny is lower than that for the radon progeny under the same conditions. Tschierch et al. (2007) obtained reasonable agreement between their data and Eq. (A.4) for 900 < Z < 3 × 104 cm−3.


A.4.5. Correlation between F and fp
(A24) For indoor air, F is negatively correlated with fp (Vanmarcke et al., 1989; NRC, 1991; Porstendörfer and Reineking, 1992; Tokonami et al., 1996a; Chen et al., 1998; Vargas et al., 2000; Huet et al., 2001a; Marsh et al., 2002; Vaupotič and Kobal, 2006; Vaupotič, 2007). This negative correlation between F and fp has also been observed in a tourist cave (Vaupotič, 2008a). The correlation can be explained as follows for conditions where the ventilation rate is relatively low: when the aerosol particle concentration is high, fp is low, and F is relatively high as more of the radon progeny are attached and stay in the air. More progeny stay in the air when fp is low because plate-out rates (i.e. deposition rates) for the aerosol-attached nuclides are significantly lower than those for the unattached nuclides (Porstendörfer, 1994). Taking account of this negative correlation between F and fp, it has been shown that, for indoor air, the radon gas concentration is a better index of dose than PAEC under a range of aerosol conditions normally encountered (James et al., 1988; Vanmarcke et al., 1989; Marsh and Birchall, 1998; Vargas et al., 2000). On this basis and because of practical considerations, radon gas measurements are generally carried out in homes and indoor workplaces. However, in mines with forced ventilation, a consistent correlation between F and fp is unlikely, so control of radon progeny exposure in mines is typically based on PAE exposure.
A.5. Inhalation of short-lived radon progeny
(A25) Absorption parameter values for radon progeny are addressed in Sections 9.2.1, 10.2.1, and 11.2.1, and are summarised in Table A.2. As described in OIR Part 1, Section 3.2.3 (ICRP, 2015), shared kinetics are assumed in the respiratory tract. (A26) Aerosol characteristics need to be defined in order to calculate doses from inhaled radon progeny. The activity size distribution of the radon progeny aerosol can be very variable, and depends upon the exposure scenario. For the purposes of dose calculation, aerosol parameter values are given for indoor workplaces, mines, and tourist caves (Table A.3). However, for completeness, measured values of aerosol parameters for water supply facilities and thermal spas are also discussed. (A27) The relative activity size distribution of unattached radon progeny depends on the concentration of water vapour, trace gases, and the electrical charge distribution of the radionuclides in the air. Porstendörfer (2001) found that under ‘normal’ conditions of humidity and radon concentration, the activity size distribution of the unattached progeny can be approximated with three lognormal distributions. AMTD values measured were 0.6 nm, 0.85 nm, and 1.3 nm with σg of approximately 1.2. In places with high radon concentrations, the fraction with the greatest AMTD value (1.3 nm) was not observed. The neutralisation rate of the unattached clusters increases with radon concentration, and so it is likely that modes below 1 nm are mainly associated with neutral clusters, whereas modes above 1 nm are charged clusters (Porstendörfer et al., 2005). Huet et al. (2001b) also measured the size distribution for the unattached radon progeny, and found a unimodal distribution with diameters between 0.5 and 1.5 nm and values of σg between 1.2 and 1.4. Other workers have also measured a unimodal distribution with median diameters in the range 0.7–1.7 nm (Cheng et al., 1997; El-Hussein et al., 1998; Mohammed, 1999; El-Hussein, 2005). For the purposes of dose calculation and for simplicity, a unimodal distribution with an AMTD of 1.0 nm and a σg of 1.3 is assumed here for all exposure scenarios. (A28) The size of the unattached radon progeny is assumed to remain constant in the lung (NRC, 1991). However, some of the ambient aerosols to which radon progeny attach are unstable in saturated air (i.e. hygroscopic), and are assumed to grow very quickly on inhalation (Sinclair et al., 1974; NRC, 1991; Li and Hopke, 1993; Dua and Hopke, 1996; Pagels et al., 2001). Computed growth curves of sodium chloride particles show that hygroscopic particles reach their equilibrium diameter within the nose or mouth (Ferron et al., 1988). Therefore, for modelling purposes and simplicity, it is assumed that AMTD increases by the hygroscopic growth factor instantaneously as the particle enters the nose or mouth. Assumed values for hygroscopic growth factor are given in Table A.3 for different exposure scenarios. (A29) Porstendörfer (1996) pointed out that results of experimental studies show that the differences between the activity size distribution of the individual progeny attached to aerosol particles are negligible. Therefore, for simplicity and for dosimetric purposes, the aerosol distribution of each of the short-lived 222Rn progeny (i.e. 218Po, 214Pb, and 214Bi) is assumed to be the same. (A30) Diffusion is the dominant mechanism of deposition in the respiratory tract for particles with diameters less than approximately 300 nm, which corresponds to most of the attached progeny size range. The thermodynamic diameter is the parameter that characterises deposition by diffusion. For larger particle sizes, deposition by gravitational sedimentation and inertia impaction are more important, and these mechanisms of deposition are characterised by the aerodynamic diameter. (A31) Low-pressure cascade impactors have been used to measure the activity size distribution of the attached progeny. By operating the impactor at low pressure, particles with very small diameters can be classified on the basis of their inertia. As this inertial separation is an aerodynamic process, the results from low-pressure impactor measurements have generally been expressed in terms of ‘aerodynamic diameter’ with AMAD and σg reported for a given mode of the attached size distribution (Reineking et al., 1988, 1994; Porstendörfer and Reineking, 1992; El-Hussein et al., 1998; Mohammed, 1999; Kranrod et al., 2009). However, this use of ‘aerodynamic diameter’ relates to particle dynamics under conditions of low pressure, and may not correspond to the definition of ‘aerodynamic diameter’ in the glossary [OIR Part 1 (ICRP, 2015)]. The definition in the glossary is based on sedimentation under gravity, at ambient pressure and relatively low velocity, and mainly applies to particles with diameters greater than 300 nm. The results of low-pressure impactor measurements are therefore reported here as activity median diameters (AMD). (A32) Porstendörfer (2001) mainly carried out activity size measurements of the attached progeny with a low-pressure cascade impactor. However, some measurements in closed rooms without additional aerosol sources were carried out with both a low-pressure cascade impactor and a diffusion battery, which measures the thermodynamic diameter (Reineking et al., 1988, 1992a). Comparisons of these measurement results show that the value of AMTD was similar to that of AMD measured with the low-pressure cascade impactor, with the differences being less than approximately 10%. Such differences are small compared with the uncertainties of the data evaluation procedure and the normal variation in the size distribution under realistic working or living conditions. For indoor measurements, it is therefore assumed here that the measured values of AMD with low-pressure cascade impactors are good approximations to the corresponding values of AMTD. (A33) Activity size measurements in the range from approximately 0.5 nm to 300 nm or more can be performed with multi-stage diffusion batteries operated in series or parallel, and applying mathematical algorithms to deconvolute the data (e.g. Solomon et al., 1993, 1994; Porstendörfer, 1996; Cheng et al., 1997; Wu-Tu et al., 1997; Huet et al., 2001b; Vargas et al., 2005). The fraction of PAEC in each mode, including the unattached fraction, can be derived from such data. (A34) To measure the unattached fraction directly, it is necessary to separate the unattached clusters, which have diameters less than approximately 5 nm, from the aerosol-attached fraction. Measurements of the unattached fraction and the size distributions of unattached radon progeny are based on their diffusion properties. Due to their small size, unattached progeny plate-out more readily on surfaces than the aerosol-attached progeny. Therefore, the unattached progeny can be separated from the attached fraction by their preferential deposition on to walls of a tube, parallel plates, or wires of a wire screen. Single-stage diffusion batteries with 50% penetration for particles with 4–6-nm diameters have been applied to measure the unattached fraction (Porstendörfer, 1996). For practical reasons, single-stage wire screen batteries are commonly used (e.g. Reineking and Porstendörfer, 1990; Vargas et al., 2000; Guo et al., 2012). However, they do have some disadvantages, such as resuspension of deposited unattached radon progeny by recoil effects, and collection of part of the attached fraction. Reineking and Porstendörfer (1990) developed a method for correcting for the latter, and noted that the correction is more significant if the nucleation or coarse modes are present. In addition, annular diffusion channel (ADC) batteries have been used to measure the unattached fraction (Huet et al., 2001a). The ADC geometry allowed better selection of the particle size compared with the wire screen (Michielsen and Tymen, 2007). Effective dose per working level month (WLM) as a function of particle size of a monodispersed aerosol for a reference worker with an average breathing rate of 1.2 m3 h−1 following exposure to radon (222Rn) progeny. Unit density and unit shape factor were assumed and hygroscopic growth was not taken into account. Reference attached aerosol characteristics in the respiratory tract for 222Rn progeny. AMTD, activity median thermodynamic diameter; σgi, geometric standard deviation of mode i; AMAD, activity median aerodynamic diameter. Indices i = ‘n’ and ‘a’ represent the nucleation and accumulation modes, respectively.


A.5.1. Indoor workplaces
(A35) Published data on activity size distributions in indoor workplaces other than homes are relatively sparse. Reichelt et al. (2000) carried out activity size measurements of radon progeny at several workplaces including offices, workshops, factories, kitchens, agricultural facilities, and public buildings including schools, hospitals, and art galleries. Porstendörfer (2001) summarised their results and suggested dividing indoor workplaces into two categories: workplaces in rooms without coarse particles, and workplaces with coarse particles generated by human activities and dispersion processes. Calculated values of the equivalent dose to the lung per unit exposure for the two categories differed by less than 10% (Porstendörfer, 2001). In this publication, workplaces in rooms without coarse particles are considered. (A36) The parameter values of the activity size distribution for the attached radon progeny assumed for indoor workplaces (Table A.3) are based primarily on the measurement results of Porstendörfer (2001) and on results published for homes. Marsh et al. (2002) summarised measurement results for homes published in the literature since 1980. (A37) For an aged aerosol (i.e. without additional aerosols), the presence of a nucleation mode is not always measured but can be observed when additional aerosols are introduced into the air (NRC, 1991; Tu et al., 1991; Huet et al., 2001b; Marsh et al., 2002). For an aged aerosol, Huet et al. (2001b) found that the attached size distribution consisted of the accumulation mode alone. However, intercomparison measurements performed in a house in Germany, without additional aerosols, showed nucleation and accumulation modes with the fraction of the attached PAEC in the nucleation mode (fpn) being approximately 0.2 (Reineking et al., 1994). Measurements of the activity size distribution of the attached progeny in a dwelling in Okinawa, Japan also showed a nucleation mode with an activity fraction of 0.14 (Kranrod et al., 2009). The mean AMD of the nucleation mode was approximately 30 nm with σg of 1.6. Porstendörfer (2001) reported values of fpn between 0.2 and 0.5 for workplaces. AMD of the nucleation mode was reported to be between 15 and 40 nm with σg ranging between 1.6 and 2.2. A fpn value of 0.2 is assumed here for indoor workplaces. AMD of 30 nm with σg of 2.0 is assumed for the nucleation mode. (A38) Indoor measurements of AMD of the accumulation mode show a wide range of values, typically between 100 and 400 nm (Tu and Knutson, 1988; Tu et al., 1991; Tokonami et al., 1997; El-Hussein et al., 1998; Mohammed, 1999; Huet et al., 2001b; Porstendörfer, 2001; Kranrod et al., 2009). A central value of 250 nm is assumed here with σg of 2.0. This agrees with the values measured by Porstendörfer (2001) for homes (200 nm, range 120–350 nm) and workplaces (300 nm, range 150–450 nm). (A39) Sinclair et al. (1974) found that atmospheric particles in their laboratory increased in diameter by approximately a factor of 2 when the relative humidity increased from zero to 98%. The ambient aerosol originated from an industrial area close to the sea, and the authors expected it to consist of a mixture of sodium chloride (NaCl) and ammonium sulphate [(NH4)2SO4] salts, with a mixture of acids (HNO3, H2SO4, and HCl). Measurements of growth factors of a background continental aerosol had two modes, with values of 1.5 for the low hygroscopic mode and 2.9 for the more hygroscopic mode (Pagels et al., 2001). Li and Hopke (1993) measured hygroscopic growth factors of indoor combustion aerosols including cigarette smoke, incense smoke, candle flame, natural gas flame, and propane fuel flame. The average hygroscopic growth factor ranged from 1.5 to 1.9. In contrast, radon progeny attached to an aerosol produced from cooking oil, for example, are hydrophobic (Dua and Hopke, 1996). For indoor workplaces, a hygroscopic growth factor of 2.0 is assumed here for the ambient aerosol. The density (g cm−3) and the shape factor of these hygroscopically enlarged particles are taken to be unity. (A40) As described in Para. A24, the value of the unattached fraction, fp, depends inversely on the ambient particle concentration. This depends on ventilation rate and whether or not additional aerosol sources are present. Mean values of fp measured in dwellings range between 4% and 20%, with some values greater than 40% (Chen et al., 1998; Kojima and Abe, 1988; Reineking and Porstendörfer, 1990; Hopke et al., 1995; Tokonami et al., 1996a; Yu et al., 1996; Vargas et al., 2000; Huet et al., 2001a,b; El-Hussein, 2005; Mohammed, 2005; Kranrod et al., 2009; Guo et al., 2012). Measurements of fp in indoor workplaces, such as schools and offices, also show a wide range of values, typically between 3% and 15%, and with some values greater than 20% (Hattori and Ishida, 1994; Hattori et al., 1995; Tokonami et al., 1996b; Yu et al., 1998; Porstendörfer, 2001; Vaupotič, 2008b; Guo et al., 2012). For indoor workplaces, Porstendörfer (2001) recommends fp = 0.05 (range 0.02–0.14). This agrees with measurements made in offices by Tokonami et al. (1996b) (fp = 0.06, range 0.04–0.1) and Hattori et al. (1995) (fp = 0.026, range 0.017–0.035). However, higher values of approximately 0.1 or more have also been measured in offices [Guo et al. (2012): fp = 0.11, range 0.08–0.16; Yu et al. (1998): fp = 0.13] and in schools/kindergartens [Vaupotič and Kobal (2006): fp = 0.12, range 0.03–0.19; Vaupotič (2007): fp = 0.14, range 0.03–0.24]. A value of fp = 0.08 is chosen here for indoor workplaces. (A41) The value of the equilibrium factor, F, depends mainly on the indoor ventilation rate due to opening/shutting of windows, and use of electric fans, air conditioners, and dehumidifiers (Chen et al., 1998; Iimoto, 2000; Iimoto et al., 2001; Iyogi et al., 2003). Typically, mean values of F ranged from 0.3 to 0.6 for schools, kindergardens, offices, nuclear power plants, factories, and cafés (Hattori and Ishida, 1994; Hattori et al., 1995; Yu et al., 1998, 2000; Iyogi et al., 2003; Misdaq and Flata, 2003; Tokonami et al., 1996b, 2003; Misdaq and Amghar, 2005; Maged, 2006; Vaupotič, 2008b; Labidi et al., 2010). In its 2000 report, UNSCEAR assumed an F value of 0.4 for indoor exposures, based mainly on measurements in dwellings in the USA (Hopke et al., 1995) and in India (Ramachandran and Subba Ramu, 1994). Publication 65 (ICRP, 1993) also assumed a F value of 0.4 for indoor exposures. For continuity, a F value of 0.4 is assumed here for indoor workplaces.
A.5.2. Mines
(A42) Characterising the aerosol parameters for mines is difficult because of the highly variable conditions, and because of the different types of mining conditions such as use of diesel- or electric-powered equipment, different ventilation rates, and the type of heating used during the winter months (Cavallo, 2000; Marsh et al., 2008). (A43) Measurements were made of the activity size distribution in two mines in the USA in Colorado and New Mexico (Cooper et al., 1973). As the measurements were made during winter, it is likely that the incoming ventilation air was heated by burning propane gas. However, it is not clear from the report whether the heaters were being used when the measurements were made. Both mines used diesel engines. The measurements were carried out with a low-pressure impactor having five stages and a back-up filter. However, its resolution was relatively poor. These data were re-analysed by Cavallo (1998) using modern unfolding techniques. The re-analysed data showed that AMD of the principal mode ranged from 111 nm to 303 nm, with a mean of 200 nm, for the Colorado mine. The mean value of σg was 2.0. Four of the nine spectra had a secondary mode with a peak at approximately 30 nm containing approximately 20–25% of PAEC. However, given the poor resolution of the impactor, the authors did not consider this secondary mode in their dose calculations. For the New Mexico mine, the mean values of AMD and σg of the accumulation modes were 140 nm and 2.9, respectively (Cavallo, 1998). (A44) Measurements were carried out in four uranium mines in New Mexico, USA during the summer of 1971 (George et al., 1975). All four mines were diesel powered, with one of the mines being much less active than the others. The activity size measurements obtained with a diffusion battery were re-analysed by Knutson and George (1990). Twenty-six spectra were obtained; nine of the spectra were unimodal with mean AMTD of 150 nm (80–210 nm) and σg of approximately 2.7, and 11 spectra had both unattached and accumulation modes. The remaining six spectra showed one activity peak at 100–200 nm and another at 5–10 nm. The average value of the equilibrium factor was 0.17. (A45) During the summer of 1978, measurements were carried out with a diffusion battery in a Canadian diesel-powered uranium mine (Busgin et al., 1981). AMTD of approximately 100 nm with σg of 1.9 was measured in an exhaust ventilation area of the mine. The unattached fraction of 218Po was estimated to be less than 2%. Based on the measured particle concentration (105 cm−3), fp is calculated to be approximately 0.4%. The same group also carried out a second set of measurements during the winter of 1985 in two mines in Canada; one mine used diesel equipment and the other used electric-powered equipment (Kahn et al., 1987). In the diesel-powered mine, AMTD was approximately 90 nm with σg of 1.8, whereas in the electric-powered mine, AMTD was approximately 50 nm with σg of 1.8. The measurements were carried out with a set of diffusion batteries which had relatively poor resolution. (A46) Activity size measurements have been performed at a diesel-powered uranium mine in France at the Bellezane mining centre during the summer of 1989 (Boulaud and Chouard, 1992). The gallery cross-section was 10 m2 with mean air velocities of approximately 1 m s−1. A combination of a cascade impactor in series with a diffusion battery was used to carry out the measurements. AMTD ranged from 150 nm to 210 nm, with a mean of 178 nm. The aerosol concentration was also measured; mean values per half day varied from 6 × 10⁴ to 9 × 104 cm−3. This indicates fp values of less than approximately 1%. (A47) Butterweck et al. (1992) carried out activity size measurements in underground mines in Germany with a low-pressure cascade impactor and a high-volume impactor. The unattached fraction was also measured with wire screens. Their results showed that with diesel engines, the diesel aerosol dominates the mine aerosol, resulting in a very low unattached fraction (0.1–2.5%, mean 0.7%). In the diesel-powered slate mine, during working hours, AMD of the accumulation mode was approximately 200 nm with σg of approximately 2.0. During non-working hours, AMD increased to approximately 350 nm. For the other active mines in Germany (barite: Dreislar, Bad Lauterberge; iron: Salzgitter; uranium: Groβ-Schloppen), the mean values of AMD ranged from 180 to 270 nm during working hours. The equilibrium factor value ranged from 0.3 to 0.6, with a mean of 0.45. (A48) Solomon et al. (1993, 1994) carried out activity size distribution measurements in an underground uranium mine at Olympic Dam, South Australia. Measurements were carried out with a serial graded screen array and a diffusion battery. In areas of the mine where there were large diesel-powered vehicles, AMTD of the accumulation mode ranged from 200 to 300 nm. The average value of AMTD was 250 nm with σg of approximately 2.5. In the areas of the mine where there were no vehicles or the ventilation intakes were close by, AMTD values were smaller, in the range 90–200 nm with a mean of 150 nm. The mean value of the unattached fraction throughout the mine was approximately 3–4% and the mean value of the equilibrium factor was approximately 0.2. (A49) Measurements have been carried out to characterise the aerosol in a wet underground uranium mine in northern Saskatchewan, Canada (Cavallo, 1997, 2000; Wu-Tu et al., 1997; Cavallo et al., 1999). This mine employed state-of-the art mining technology, and used diesel-powered equipment extensively. Due to the exceptionally high-grade ore, the mine ventilation rate was very high, approximately 3.6 × 10⁴ m3 min−1, which was estimated to be approximately one air change per 3 min. The average air velocity in the main decline was approximately 5 m s−1 (12 mph). Measurements were carried out in the winter of 1995 and in the summer of 1996. An impactor with a graded screen array was used to determine the size distribution over a range of particle sizes of 0.6–5000 nm. During the winter months, the temperature inside the mine was maintained at 5℃ by burning propane gas to heat the ventilation air. As a result, the mine aerosol consisted of particles from the combustion of propane gas as well as diesel particles. The winter time measurements carried out at a stope and a drilling area where miners were working showed predominately a two-modal distribution for the attached progeny. The fractions of the attached PAEC associated with the nucleation and accumulation modes were approximately 65% and 35%, respectively, and the mean values of AMD were approximately 60 nm and 330 nm, respectively. The unattached fraction (fp) was approximately 1%. Winter time measurements were also carried out at a bolt-storage bay next to a major mine exhaust. Most of these measurements showed that the attached progeny consisted of the nucleation mode containing approximately 97% of the attached PAEC, on average, with AMD values between 55 and 75 nm. The coarse mode accounted for the remaining 3% of attached PAEC with AMAD between 2 and 8 µm. Typically, fp was less than 2% and the mean value of AMTD of the unattached progeny was less than 1 nm. The results of the summer time measurements of 1996 showed that, throughout the mine, AMD values ranged from 50 nm to 120 nm with a mean value of 85 nm and σg of approximately 2.0. The average value of fp was approximately 6%, whereas the expected value based on particle concentration was 0.3%. This unexpectedly high value of fp was theoretically shown to occur under conditions when the radon progeny are far from equilibrium, as was the case in this Canadian mine, which was ventilated at a high rate (Cavallo et al., 1999). The average value of the equilibrium factor was 0.08. (A50) Tokonami et al. (2005) measured the activity size distribution in an underground mine located in the Gifu prefecture region of Japan. A cascade impactor with 10 stages and a graded screen array were used for the measurements. AMTD of the unattached progeny was 0.8 nm with σg of 1.5. The activity size distribution of the attached progeny was represented by a single mode with AMD of 162 nm and σg of 3.1. (A51) Based on the measurements of Cooper et al. (1973) in US mines and the measurements of Bigu and Kirk (1980) in Canadian mines, a panel of experts from the National Research Council (NRC, 1991) recommended AMTD of 250 nm in areas of active mining, and fp of 0.5%. In areas of transport and maintenance work (i.e. haulage drifts), fp of 3% was assumed. In these areas, a lower AMTD value of 150 nm was assumed based on the measurement data of George et al. (1975), which were re-analysed by Knutson and George (1990). (A52) Aerosol parameter values are given for a diesel-powered mine with medium to good ventilation (Table A.3). These chosen values are mainly based on the measurements carried out in mines in Australia (Solomon et al., 1993, 1994), France (Bouland and Chouland, 1992), and Germany (Butterweck et al., 1992). For diesel-powered mines, it is assumed that the aerosol does not increase in size in the respiratory tract because diesel aerosols are hydrophobic (Weingartner et al., 1997; Dua et al., 1999; Cavallo, 2000). (A53) For a diesel-powered mine, it is assumed that the aerosol is mainly dominated by the diesel aerosol. Several workers have calculated the effective density of diesel exhaust particles from measurements of thermodynamic diameter (dth) and aerodynamic diameter (dae) of the exhaust particles (Park et al., 2003; Olfert et al., 2007). The effective density is the ratio of particle density (ρ) and shape factor (χ). Results indicate that effective density decreases with increasing dth in the size range from 50 nm to 300 nm. This mainly occurs because particles become more highly agglomerated as size increases. The smaller particles are more compact than the larger particles, and therefore have a higher effective density. Typically, the effective density varies from 1.2 to approximately 0.3 g cm−3 depending on size and fuel composition; higher effective densities are observed for high sulphur fuel. The chosen values for the effective density of the aerosol in diesel-powered mines are based on the measurements of Park et al. (2003) and Olfert et al. (2007). (A54) The chosen reference aerosol parameter values in Table A.3 are based on published data more than 20 years old. There are no published data on aerosol characteristics in modern mines at the current time. However, while modern mining practices may lead to conditions in some mines that could be different from the reference aerosol parameters, there is insufficient information at this time to provide alternative sets of parameters.
A.5.3. Tourist caves
(A55) Typically, there is no additional ventilation in tourist caves as forced ventilation may alter the humidity inside the cave, affecting some of the geological formations that attract tourists. As a result, radon concentrations can reach high levels of several thousand Bq m−3 (Butterweck et al., 1992; Sainz et al., 2007). Several measurements have been carried out in natural caves to characterise the aerosols. (A56) Butterweck et al. (1992) carried out activity size measurements in a natural tourist cave in Postojna, Slovenia with a low-pressure cascade impactor and a high-volume impactor. The unattached fraction was also determined from wire screen measurements. AMD of the accumulation mode ranged from 120 nm to 290 nm, with a mean of 230 nm. The mean σg value of the accumulation mode was 2.2. The fp value varied from 6% to 16%, with a mean of 10%. The average value of the particle concentration was approximately 3000 cm−3. The F value ranged from approximately 0.3 to 0.5, with a mean of 0.4. (A57) Solomon et al. (1992) used a parallel wire screen diffusion battery and a serial graded screen array battery to measure the activity size distribution of the radon progeny in a limestone cave in Victoria, Australia. Measurements were carried out over a 3-day period during October 1990 at different sites in the cave. The accumulation mode had AMTD of 170 nm and the unattached mode had AMTD of 1.1 nm. The fp value throughout the cave varied from 11% to 18%, whereas the F value varied from 0.2 to 0.5. The average fp value weighted by the occupancy of the tour guides in each sampling site was 14%. Measurements of the radon concentration carried out during June and October indicated that the radon concentration is relatively constant throughout the year. (A58) Measurements have been carried out over a 3-day period during the summer of 1994 in the Carlsbad Caverns in southern New Mexico to determine air exchange rate, aerosol characteristics, and radon progeny activity size distributions (Cheng et al., 1997). During the summer months, the outside air temperature is much greater than inside the cave, which keeps the cave air stagnant. The mean ventilation rate was measured to be 0.002 h−1, which was estimated to be one air exchange every 18 d. The measured particle concentration was very low; average daily values were between 280 and 385 cm−3. As a result, the measured fp values were high; values ranged from 25% to 60%, with a mean of 44%. The average value of F was 0.4. The activity size measurements were carried out with a graded diffusion battery. AMTD of the unattached particles was between 0.6 and 0.8 nm, and the attached mode had a peak of more than 50 nm. It was noted that the particle concentration measurements made in the same area of the cave during summer months by Wilkening and Romero (1981) were more than twice as high, indicating fp values lower by a factor of 2 or more. (A59) Sainz et al. (2007) carried out radon concentration and particle concentration measurements in tourist caves located in the region of Cantabria, Spain. The results of the particle concentration measurements were 464 cm−3 in the Castillo cave and 1514 cm−3 in the Monedas cave. This indicates fp values of 86% and 26%, respectively. (A60) Measurements of the unattached fraction and equilibrium factor have been carried out in the Postojna cave, Slovenia for 10–15 d during summer and winter months of consecutive years from 1998 to 2001 (Vaupotič, 2008a). Measurements were carried out at the railway station in the cave and at the lowest point of a walking tour. There is no forced ventilation in the cave; however, during the winter months, there is a natural draught of air from the cave to the outdoors as the temperature in the cave is greater than the outdoor temperature, whereas in the summer months, this draught is minimal. Also, moisture in the rocks, which tends to be higher in the winter, inhibits the release of radon from the rocks. As a consequence, the radon concentration in the cave is higher in the summer than in the winter. Measurements also showed that fp is higher in the summer than in the winter. At the lowest point of the cave, mean values of fp were approximately 60% in the summer and approximately 12% in the winter; the mean values of F were approximately 0.3 in the summer and 0.6 in the winter. Values of F were negatively correlated with fp. At the railway station, during the summer, mean values of fp and F were 17% and 0.6, respectively. (A61) Rosvenská et al. (2008) measured fp, F, and the particle size spectrum in the Bozkov dolomite cave, Czech Republic. The fp value was low and varied between 1% and 3%. The F value was approximately 0.7. The activity size distribution was theoretically determined from the particle size distribution. For the attached progeny, AMD and σg of three modes were calculated: 140 nm with σg = 1.7; 720 nm with σg = 1.4; and 1.9 µm with σg = 1.9. The fraction of PAEC associated with each mode was not given. (A62) The aerosol parameter values chosen to represent a tourist cave are given in Table A.3. The values of AMTD and σg for activity size distribution of the accumulation mode are based on the measurements of Butterweck et al. (1992) and Solomon et al. (1992). As the relative humidity in a tourist cave can be quite high at 70–99% (Cheng et al., 1997; Vaupotič, 2008a), it is assumed that the attached aerosol does not grow in the respiratory tract. (A63) Choosing a represented value for fp proved to be problematic as a large range of values have been measured. Mean values of fp measured in caves typically varied from 10% to 60% (Butterweck et al., 1992; Solomon et al., 1992; Cheng et al., 1997; Vaupotič, 2008a). Higher values of fp were observed in the summer compared with the winter (Vaupotič, 2008a). The values chosen here for fp and F are 0.15 and 0.4, respectively, and are mainly based on measurements of Butterweck et al. (1992) and Solomon et al. (1992).
A.5.4. Water supply facilities and thermal spas
(A64) Information on exposure conditions in water supply facilities and thermal spas is given here for completeness. Reference parameter values for water supply facilities and thermal spas are not given in this publication. (A65) High levels of 222Rn gas concentrations in indoor air have been measured at water supply facilities where ground water with a high radon concentration is treated or stored (Trautmannsheimer, 2003). Porstendörfer and Reineking (1999) measured the activity size distribution at a water supply station in Germany. Approximately 84% of the attached PAEC was associated with the accumulation mode, having AMD of 300 nm with σg = 1.8. The remaining 16% of the attached PAEC was associated with the nucleation mode, having AMD of 50 nm with σg = 1.5. They reported an fp value of 0.05. The relative humidity at a water supply station was reported to be close to 100% (Porstendörfer, 2001). (A66) Thermal spa facilities have been used for medical therapy and rehabilitation centres as well as for recreational purposes. Radon emanating from the thermal waters is an additional source of radiation exposure to the working personnel as well as the bathers. Measurements of 222Rn in air in thermal spas have shown that the dominant mechanism by which 222Rn is released from water to air is during bath filling, and to a lesser extent during bathing as a result of water agitation (Lettner et al., 1996; Vogiannis et al., 2004a). During bathtub filling, F is initially low but then increases gradually and reaches a peak with a time delay preceding a 222Rn peak. Correspondingly, fp is initially high but then decreases and reaches a minimum. Average values of F and fp have been reported for measurements carried out in treatment/bath rooms, rest rooms, and reception rooms of thermal spas in Greece (Vogiannis et al., 2004b,c); average values of fp range from 0.06 to 0.12, and F values range from 0.2 to 0.4. However, Geranios et al. (2004) reported higher values of fp of approximately 0.23 in a treatment room and a reception room of the thermal spa of Loutra Eipsou, Greece. Values of F measured in treatment rooms of thermal spas in Slovenia and Austria range from 0.14 to 0.45 (Lettner et al., 1996; Vaupotič and Kobal, 2001). In two Spanish thermal spas, the estimated average F value was 0.6 (Soto and Gómez, 1999).
A.6. Inhalation of short-lived thoron progeny
(A67) Thoron decays into the short-lived progeny 216Po, 212Pb, and 212Bi (Fig. A.3, Table A.1). As can be seen from Table A.1, PAE per activity of 212Pb is approximately 10 times higher or more than for other thoron progeny. As a consequence, Publication 65 (ICRP, 1993) states that, ‘For protection against thoron, it is usually sufficient to control the intake of the decay product, lead-212, which has a half-life of 10.6 h.’ In this publication, the intake of 212Bi is also considered, but most of the dose arises from the intake of 212Pb. The activity size distribution of 212Bi attached to aerosols is assumed to be the same as that for 212Pb. (A68) Published data on the activity size distributions of the thoron progeny, 212Pb, are relatively sparse. It has been suggested that, because of the longer radioactive half-life of 212Pb compared with those of 222Rn short-lived progeny, the aerosol size of attached 212Pb is likely to be larger than that of 222Rn progeny (Kahn et al., 1987). The longer half-life means that atoms of 212Pb can spend more time in the vicinity of aerosols, leading to increased coagulation of aerosols and larger particle sizes. However, measurements show that the median diameters of the accumulation mode for 212Pb and the radon progeny, 214Pb, are similar, at least for ‘typical’ indoor air (Becker et al., 1984; Reineking et al., 1992b). Aerosol parameter values for thoron progeny are given in Table A.4 for indoor workplaces and mines. (A69) The size distribution of the unattached thoron progeny is assumed to be the same as that for 222Rn progeny. A unimodal lognormal distribution with AMTD of 1.0 nm with σg of 1.3 is assumed for all exposure scenarios. This is in agreement with what is measured for indoor and mining environments, where the unattached 212Pb was found to have particle sizes of approximately 1 nm (Chen et al., 1997). Measurements carried out in a radon test chamber, as part of an intercomparison exercise, also showed median diameters less than 1 nm for unattached 212Pb (Cheng et al., 2000). Deposition of inhaled 222Rn progeny aerosols in respiratory tract regions. Values are given for each mode of the assumed aerosol distribution for indoor workplaces, mines, and tourist caves. ET1, anterior nasal passage; ET2, posterior nasal passage, pharynx, and larynx; BB, bronchial; bb, bronchiolar; AI, alveolar-interstitial. Indices i = ‘u’, ‘n’, and ‘a’ represent the unattached, nucleation, and accumulation modes, respectively. The degree of precision of the values is given for computational purposes and does not reflect the certainty with which they are known.

A.6.1. Indoor workplaces
(A70) Becker et al. (1984) measured the activity size distribution of 212Pb in different buildings in the city of Göttingen, and in the countryside of Germany. Measurements were carried out with a high-volume cascade impactor. The size distribution of the attached aerosol could be approximated by a log-normal distribution. Values of AMD ranged from 120 nm to 290 nm, with a mean of 200 nm. The mean value of σg was 2.9. The mean value of AMD for the city results was similar to that of the countryside results, but σg for the countryside results was larger. (A71) Reineking et al. (1992b) measured the activity size distribution of 212Pb in seven rooms of different houses in Germany. Measurements were performed with a low-pressure cascade impactor. For separating unattached from aerosol-attached thoron progeny, a single screen with 50% penetration for 4-nm diameter particles was used. AMD of the accumulation mode was approximately 200 nm with σg of 1.8. Between 6% and 20% of the attached activity was associated with the nucleation mode, with a mean of 14%. The nucleation mode had AMD less than 80 nm. These results were also reported by Porstendörfer (2001). Porstendörfer reported that the nucleation mode has AMD between 30 and 50 nm with σg of approximately 2. Porstendörfer noted that the fraction of the attached 212Pb activity associated with the nucleation mode is lower than the corresponding values for radon (222Rn) progeny. The unattached fraction (fp) of thoron progeny for ‘typical’ indoor air with aerosol particle concentration of (5 – 15) × 103 cm−3 is between 0.01 and 0.03. (A72) Zhang et al. (2010) measured activity size distributions of 212Pb in countryside and city dwellings of China. There were no appreciable differences among the particle size distributions from dwellings within the same area and under the same climate conditions. However, the particle size distributions measured in countryside dwellings were smaller than in city dwellings. In city dwellings of Beijing, AMD of 212Pb was approximately 150 nm with σg of 2.0, and in the suburbs of Beijing AMD was approximately 110 nm with σg of 2.0. For some of the countryside dwellings of Yangjiang, Guangdong Province, which were mainly made of brick, mean AMD was 80 nm with σg of 2.9. For the cave dwellings of Datong, Shanxi Province, mean AMD was 50 nm with σg of 3.1. (A73) The aerosol parameter values assumed for thoron progeny for indoor workplaces are based on the measurements of Reineking et al. (1992a) and on the values recommended by Porstendörfer, 2001 (Table A.4). It is assumed that the measured ‘aerodynamic diameter’ determined with a low-pressure cascade impactor in indoor air is a good approximation to the thermodynamic diameter (see Para. A32).
A.6.2. Mines
(A74) The activity size distribution of 212Pb was measured with a diffusion battery in a Canadian diesel-powered uranium mine during the summer of 1978 (Busgin et al., 1981). Measurements were carried out in an exhaust ventilation area of the mine where there was no work in progress. The average value of AMTD was found to be approximately 90 nm with σg from 1.5 to 2.3. The same group also carried out a second set of measurements during the winter of 1985 in a diesel-powered mine and in an electric-powered mine (Kahn et al., 1987). The mean AMTD of 212Pb was approximately 100 nm with σg of 1.7 in the diesel-powered mine, and approximately 70 nm with σg of 2.0 in the electric-powered mine. The value of the thoron (220Rn) WL was similar to the 222Rn WL in the electric-powered mine, but less than the 222Rn WL in the diesel-powered mine. (A75) Butterweck et al. (1992) carried out activity size measurements in underground mines in Germany with a low-pressure cascade impactor and a high-volume impactor. Measurements were made at a uranium mine (Groβ-Schloppen), an iron mine (Salzgitter), and a barite mine (Bad Lauterberge). The activity size distribution of 212Pb could be approximated by a unimodal log-normal distribution described by AMD and σg. Mean values of AMD of 212Pb during working hours ranged from 150 to 290 nm, with σg ranging from 2 to 3.1. For the barite mine of Bad Lauterberge, the mean AMD of 212Pb was 290 nm during working hours, but increased to 400 nm outside working hours. Measurements were also carried out at a disused silver mine at Lautenthal which was open to tourists; mean AMD was 310 nm (range 270–340 nm) and σg was 2.4 (range 2.1–3.6). In most of these mines, the activity size distributions of the accumulation mode of 212Pb were broadly similar to the corresponding size distribution of the 222Rn progeny, 214Pb/214Bi. (A76) The activity size distribution for thoron (220Rn) progeny assumed for the mining environment is given in Table A.4. These values are the same as those assumed for radon (222Rn) progeny for mines (Table A.3), apart from assuming a lower unattached fraction. Due to the longer half-life of 212Pb, more of the lead is likely to be attached. However, the value of fp also depends upon the ventilation rate; higher unattached fractions are expected for high ventilation rates.
A.7. Reference values for regional deposition of inhaled 222Rn and 220Rn aerosols
A.7.1. Radon progeny
(A77) The reference aerosol distributions for the attached 222Rn progeny (218Po, 214Pb, and 214Bi) in the ambient air are given in Table A.3 for indoor workplaces, mines, and tourist caves. Taking account of hygroscopic growth, the assumed aerosol characteristics of the attached progeny in the respiratory tract are given in Table A.5. The unattached mode of the short-lived 222Rn progeny (i.e. 218Po and 214Pb) is assumed to have AMTD of 1.0 nm with σg of 1.3, and unit density and shape factor for both exposure scenarios (Section A.4, Para. A27). Table A.6 gives the corresponding regional depositions in the respiratory tract for each mode of the assumed aerosol distribution of 222Rn progeny. Reference attached aerosol characteristics in the respiratory tract for 220Rn progeny. AMTD, activity median thermodynamic diameter; σgi, geometric standard deviation of mode i; AMAD, activity median aerodynamic diameter. Indices i = ‘n’ and ‘a’ represent the nucleation and accumulation modes, respectively.

A.7.2. Thoron progeny
(A78) The reference aerosol distributions for the attached thoron progeny (212Pb and 212Bi) in the ambient air are given in Table A.4 for indoor workplaces and mines. Taking account of hygroscopic growth, the assumed aerosol characteristics of the attached progeny in the respiratory tract are given in Table A.7. The unattached mode of the short-lived 220Rn progeny, 212Pb, is assumed to have AMTD of 1.0 nm with σg = 1.3, and unit density and shape factor for both indoor workplaces and mines (Section A.5, Para. A69). Table A.8 gives the corresponding regional depositions in the respiratory tract for each mode of the assumed aerosol distribution of 220Rn progeny.
A.8. Dosimetric data for radon progeny
A.8.1. Calculation of dose conversion quantities for inhaled radon or thoron progeny
(A79) The effective dose per exposure to airborne short-lived radon (or thoron) progeny is calculated in terms of Sv per PAE exposure (i.e. in units of Sv per J h m−3 or in units of Sv per WLM). The intakes of activity of the radon progeny, Ii (in Bq), for a subject exposed to 1 WLM are given by the following equation: (A80) In practice, the activity concentrations of radon progeny will vary with the particular environmental conditions of exposure. However, Marsh and Birchall (1998, 2000) showed that for intakes of short-lived 222Rn progeny, the equivalent dose to the lung per WLM is relatively insensitive to the equilibrium factor, F (i.e. to the activity ratios of the radon progeny). This is because WL is defined in terms of PAEC, and because the fraction of alpha energy absorbed by the target tissues in the lung is similar for 218Po and 214Po per disintegration. Based on measurements of the activity concentration of 218Po, 214Pb, and 214Bi carried out indoors (Kojima and Abe, 1988; Reineking and Porstendörfer, 1990), the following activity ratios of 222Rn progeny are assumed here for dosimetry:
(A81) For thoron progeny, the activity ratios assumed here are those proposed by the Committee of the National Research Council (NRC, 1991); activity ratios of 212Pb:212Bi of 1.0:0 and 1.0:0.25 were assumed for the unattached and attached modes, respectively. As 216Po contributes less than 0.001% to PAEC, it can be ignored for dosimetric purposes. (A82) The activity concentrations of radon progeny that correspond to a radon progeny mixture of 1 WL for either the unattached or the attached progeny can be calculated by assuming the above activity ratios and by applying Eq. (A.1). These values are given in Table A.9. (A83) For the average breathing rate, B, the ICRP default value for a reference worker of 1.2 m3 h−1 is assumed for all exposure scenarios (ICRP, 1994). Regarding exposures in mines, this value is similar to the average breathing rate of 1.3 m−3 h−1 estimated from a study of 620 underground miners carrying out heavy work in a gold mine in South Africa (ICRP, 1994, Para. B76). It is also consistent with the breathing rates derived by Ruzer et al. (1995) for personnel (0.9 ± 0.4 m−3 h−1), assistant drillers (1.1 ± 0.5 m−3 h−1), and drillers (1.4 ± 0.5 m−3 h−1) working underground in a metal mine in Tadjikistan. (A84) The effective dose per WLM arising from the inhalation of the short-lived radon progeny is calculated by combining the intakes, Ii (derived from Eq. A.5) with the effective dose coefficients (Sv Bq−1) for the individual radon progeny (Table A.10). The following equation is applied:
(A85) Table A.11 gives calculated values of the effective dose per exposure for indoor workplaces, mines, and tourist caves in terms of PAE exposure (mSv WLM−1 or mSv per mJ h m−3) and in terms of radon gas exposure (mSv per Bq h m−3). For exposures to 222Rn progeny, the units mSv WLM−1 were converted to mSv per Bq h m−3 of 222Rn gas exposure by multiplying by (F/6.37 × 105) WLM per Bq h m−3. For exposures to thoron, the units mSv WLM−1 can be converted to mSv per Bq h m−3 of EEC of 220Rn by multiplying by (1/4.68 × 104) WLM per Bq h m−3 of ECC of 220Rn. (A86) The committed equivalent doses per exposure to organs arising from the inhalation of 222Rn progeny and from 220Rn progeny are given in the accompanying electronic annex. (A87) The effective dose per PAE exposure as a function of the unattached fraction is given in Table A.12 for indoor workplaces, mines, and tourist caves. Deposition of inhaled 220Rn progeny aerosols in respiratory tract regions. Values are given for each mode of the assumed aerosol distribution for indoor workplaces and mines. ET1, anterior nasal passage; ET2, posterior nasal passage, pharynx, and larynx; BB, bronchial; bb, bronchiolar; AI, alveolar-interstitial. Indices i = ‘u’, ‘n’, and ‘a’ represent the unattached, nucleation, and accumulation modes, respectively. The degree of precision of the values is given for computational purposes and does not reflect the certainty with which they are known.


A.8.2. Calculation of site-specific dose coefficients for radon or thoron progeny
(A88) In cases where aerosol conditions are significantly different from typical conditions and where sufficient, reliable aerosol data are available to warrant an adjustment, calculation of site-specific dose coefficients can be carried out using the dosimetric data in this section and in the accompanying electronic annex. (A89) Site-specific dose coefficients for a given activity size distribution can be calculated by applying Eq. (A.6) if the activity size distribution is expressed as a combination of lognormal distributions. Calculated values of the effective dose per WLM for unimodal lognormal activity size distributions with different geometric means are given in Tables A.13 and A.14 following exposure to 222Rn and 220Rn progeny, respectively. These values are given by the following equation:
(A90) Therefore, the effective dose per WLM following exposure to 222Rn or 220Rn progeny can be calculated for a given activity size distribution by applying Eq. (A.6) with the values in Tables A.13 or A.14. (A91) The variation in the effective dose per WLM with particle size is given in Fig. A.5 for a reference worker following exposure to radon progeny. An alternative approach to calculate the ‘size-weighted’ effective dose per WLM is to multiply this size-dependent effective dose factor (Fig. A.5) with the measured relative activity size distribution of PAEC, and integrate over all particle diameters (Porstendörfer, 1996); in other words, by convoluting the activity size distribution with the size-dependent effective dose curve. However, this does not take account of hygroscopic growth. The units mSv WLM−1 can be converted to mSv per mJ h m−3 with the conversion of 1 WLM = 3.54 mJ h m−3.

A.8.3. Inhalation of short-lived progeny radionuclides of 219Rn
(A92) As actinon (219Rn) has a very short half-life (4 s), it is generally less able to escape from the point where it is formed than radon (t1/2 = 3.8 d) or thoron (t1/2 = 56 s). As a consequence, exposures to 219Rn and its progeny in the workplace are generally low and can be ignored. However, there are situations where doses from inhaling 219Rn and its progeny should be considered. For example, Crawford (1980) reported that radiological surveys at former uranium ore processing facilities identified sites with high levels of airborne 219Rn progeny. These sites had been used for the storage of a precipitate, formed during processing pitchblende ore, which was found to have a relatively high content of 227Ac and a low content of 226Ra. Stabin and Siegal (2015) assessed the possible dosimetric consequences of contamination events involving the radiopharmaceutical 223Ra dichloride, including inhalation of 219Rn and its progeny. In such cases, for radiation protection purposes, it is normally sufficient to control exposures on the basis of the intake of 211Pb. This is because PAE per activity of 211Pb is approximately 15 times higher or more than for other actinon progeny radionuclides. However, for completeness, dose coefficients (Sv Bq−1) are given for both 211Pb and 211Bi (Table A.15). To the authors’ knowledge, there have been no activity size measurements of actinon progeny. Dose coefficients have been calculated separately for the unattached, nucleation, and accumulation modes with size characteristics (AMTD, σg) equal to those assumed for 222Rn progeny in indoor work places (Tables A.3 and A.5), because the half-life of 211Pb (36 min) is much closer to that of the 222Rn progeny 214Pb (27 min) than that of the 220Rn progeny 212Pb (11 h). The regional deposition fractions in the respiratory tract for these modes are given in Table A.6. Activity concentrations, Ci of a mixture of short-lived radon (222Rn) or thoron (220Rn) progeny that give 1 working level for either the unattached or the attached progeny. For simplicity, it is assumed that the activity ratios of the radon progeny for each of the attached modes are the same. Activity ratios of 218Po:214Pb:214Bi of 1.0:0.1:0 and 1.0:0.75:0.60 are assumed for the unattached and attached modes, respectively. Activity ratios of 212Pb:212Bi of 1.0:0 and 1.0:0.25 are assumed for the unattached and attached modes, respectively. Effective dose coefficients (in Sv Bq−1) for inhaled radon (222Rn) or thoron (220Rn) progeny. Values are given for each mode of the assumed aerosol distribution for indoor workplaces, mines, and tourist caves.* Assumed aerosol distributions are given in Tables A.3 and A.4. The corresponding regional distributions in the ICRP Human Respiratory Tract Model are given in Tables A.6 and A.8 of Section A.7 for 222Rn and 220Rn progeny, respectively. Indices i = ‘u’, ‘n’, and ‘a’ represent the unattached, nucleation, and accumulation modes, respectively. Calculated values of effective doses per exposure to radon and thoron progeny for indoor workplaces, mines, and tourist caves. Dose from inhaling 222Rn or 220Rn gas is excluded. Calculations apply to a reference worker with an average breathing rate of 1.2 m3 h−1. fp, unattached fraction in terms of the potential alpha energy concentration; F, equilibrium factor; WLM, working level month. For radon, 1 WLM = (6.37 × 10⁵/F) Bq h m−3; for thoron, 1 WLM = 4.68 × 10⁴ Bq h m−3 of equilibrium equivalent concentration of 220Rn; 1 WLM = 3.54 mJ h m−3. In terms of mSv per Bq h m−3 of equilibrium equivalent concentration of 220Rn. Effective doses per potential alpha energy exposure to radon and thoron progeny as a function of the unattached fraction, fp, for indoor workplaces, mines, and tourist caves. Dose from inhaling 222Rn or 220Rn gas is excluded. Calculations apply to a reference worker with an average breathing rate of 1.2 m3 h−1. fp, unattached fraction in terms of the potential alpha energy concentration; WLM, working level month. 1 WLM = 3.54 mJ h m−3. Size-dependent effective doses per working level month (WLM) for unimodal lognormal activity size distribution following exposure to radon (222Rn) progeny. Calculations apply to a reference worker with an average breathing rate of 1.2 m3 h−1. σg, geometric standard deviation; AMTD, activity median thermodynamic diameter; AMAD, activity median thermodynamic diameter. 1 WLM = 3.54 mJ h m−3. Unit density and unit shape factor were assumed for the unattached, nucleation and accumulation modes. For the coarse mode, the ICRP reference values were assumed for density (3 g cm−3) and shape factor (1.5). Hygroscopic growth was not taken into account in these calculations. Size-dependent effective doses per working level month (WLM) for unimodal lognormal activity size distribution following exposure to thoron (220Rn) progeny. Calculations apply to a reference worker with an average breathing rate of 1.2 m3 h−1. σg, geometric standard deviation; AMTD, activity median thermodynamic diameter; AMAD, activity median thermodynamic diameter. 1 WLM = 3.54 mJ h m−3. Unit density and unit shape factor were assumed for the unattached, nucleation and accumulation modes. For the coarse mode, the ICRP reference values were assumed for density (3 g cm−3) and shape factor (1.5). Hygroscopic growth was not taken into account in these calculations. Effective dosecoefficients (Sv Bq-1) for inhaled actinon (219Rn) progeny. Values are given for each mode of the assumed aerosol distribution for indoor workplaces. The size characteristics (AMTD, σg) of each of the modes are assumed to be equal to those for 222Rn progeny in indoor work places (Tables A.3 and A.5).