
Abstract
Test-retest reliability is often estimated using naturally occurring data from test repeaters. In settings such as admissions testing, test takers choose if and when to retake an assessment. This self-selection can bias estimates of test-retest reliability because individuals who choose to retest are typically unrepresentative of the broader testing population and because differences among test takers in learning or practice effects may increase with time between test administrations. We develop a set of methods for estimating test-retest reliability from observational data that can mitigate these sources of bias, which include sample weighting, polynomial regression, and Bayesian model averaging. We demonstrate the value of using these methods for reducing bias and improving precision of estimated reliability using empirical and simulated data, both of which are based on more than 40,000 repeaters of a high-stakes English language proficiency test. Finally, these methods generalize to settings in which only a single, error-prone measurement is taken repeatedly over time and where self-selection and/or changes to the underlying construct may be at play.
Keywords
Reliability of a psychological or educational assessment is critical to the valid use and interpretation of the scores it produces (AERA, APA, and NCME, 2014). Reliability generally refers to the consistency of scores across multiple instances of assessment and is typically measured on a scale from 0 to 1. This originates from classical test theory, where the correlation across two parallel forms of assessment, ρXX′, is defined as the proportion of true score variance,
Reliability depends on properties of both the assessment itself (i.e., items) and the target population of individuals for that assessment (i.e., persons). For a given target population, reliability tends to increase as the number of items on the assessment increases because there is less opportunity for idiosyncratic variation in a given observed score with many items (i.e., less measurement error), or
Although there are more technical definitions and related estimation methods for quantifying reliability (see, e.g., Crocker & Algina, 1986, Chapters 6–7), we focus on test-retest reliability. Test-retest reliability corresponds to a hypothetical experiment in which a large random sample of individuals from a target population is administered an assessment, and then quickly after, is administered a second parallel version of the assessment. 1 The sample correlation of the two sets of observed scores for the same people from this hypothetical experiment is a common definition of reliability.2,3 This definition is useful because it refers to only observable quantities rather than latent variables, aiding communication to broader audiences. It also applies to complex assessments for which analytical standard errors of measurement may be intractable. More generally, test-retest reliability can be used for any error-prone measurement that is taken repeatedly over time.
Unfortunately, the hypothetical experiment described above may not be possible for some assessments. Rather, it may be more common to rely on naturally occurring data from people who self-select whether and when to retake an assessment (Monfils & Manna, 2021; Raymond et al., 2007). We refer to such people as repeaters.
Relying on observational samples of repeaters leads to two key challenges when estimating the reliabilities of scores and subscores for the full population. The first is that repeaters tend to differ in consequential ways from the full population (Zhou & Cao, 2020). For instance, people who repeat a high-stakes test tend to represent a more homogeneous, lower-ability subpopulation than the full population because high-achieving individuals often do not need to take the test more than once (e.g., to meet admission cutoffs). Secondly, repeaters not only self-select whether to repeat the assessment, but also when to repeat. For example, the Duolingo English Test (DET; Settles et al., 2020) is an online, high-stakes assessment of English language proficiency that is available on demand; some repeaters may thus take the twice test on the same day, whereas others may wait more than a year to take the test again. The more time that elapses between sessions, the more opportunity there is for heterogeneity across people in true proficiency change (e.g., through differential learning or test practice). Unless these forms of self-selection bias are addressed, estimates of test-retest reliability computed from observational data on repeaters can be biased.
In this article, we develop approaches for mitigating this bias and reducing estimation variance. We account for individual differences in whether and when to repeat using a weighting approach known as entropy balancing (EB; Hainmueller, 2012) or minimum discriminant information adjustment (MDIA; Haberman, 1984; Haberman & Yao, 2015), which weights an observed sample so that moments (e.g., means and variances) of test-taker characteristics match those of a target population. We account for variance inflation due to such weighting, as well as the impacts of heterogeneous change among repeaters, by using a combination of polynomial regression and an approximation to Bayesian model averaging (BMA; Raftery, 1995). We demonstrate the value of these methods for reducing bias and improving precision of estimated reliability using a case study of the DET and a simulated data analysis.
Model Framework
This section provides notation and a description of the inference problem.
Notation for Observed Data
Suppose we have data from a random sample of first-time test takers from the target testing population. Let test takers in the sample be indexed by i = 1, …, N. Let
Consider the subset of these N first-time test takers who choose to take the test again (i.e., the repeaters). We assume that the time between the first and second tests is measured in days 4 denoted by d, where d = 0 means that an individual took the second test on the same day as the first test, d = 1 means that an individual took the second test the day after the first test, and so on. We refer to the repeaters who retook the test d days after their first test as lag-d repeaters, and we let N d < N be the number of such individuals. The decision about the maximum value of d to consider in any given analysis, denoted by dmax, depends on the specific application.
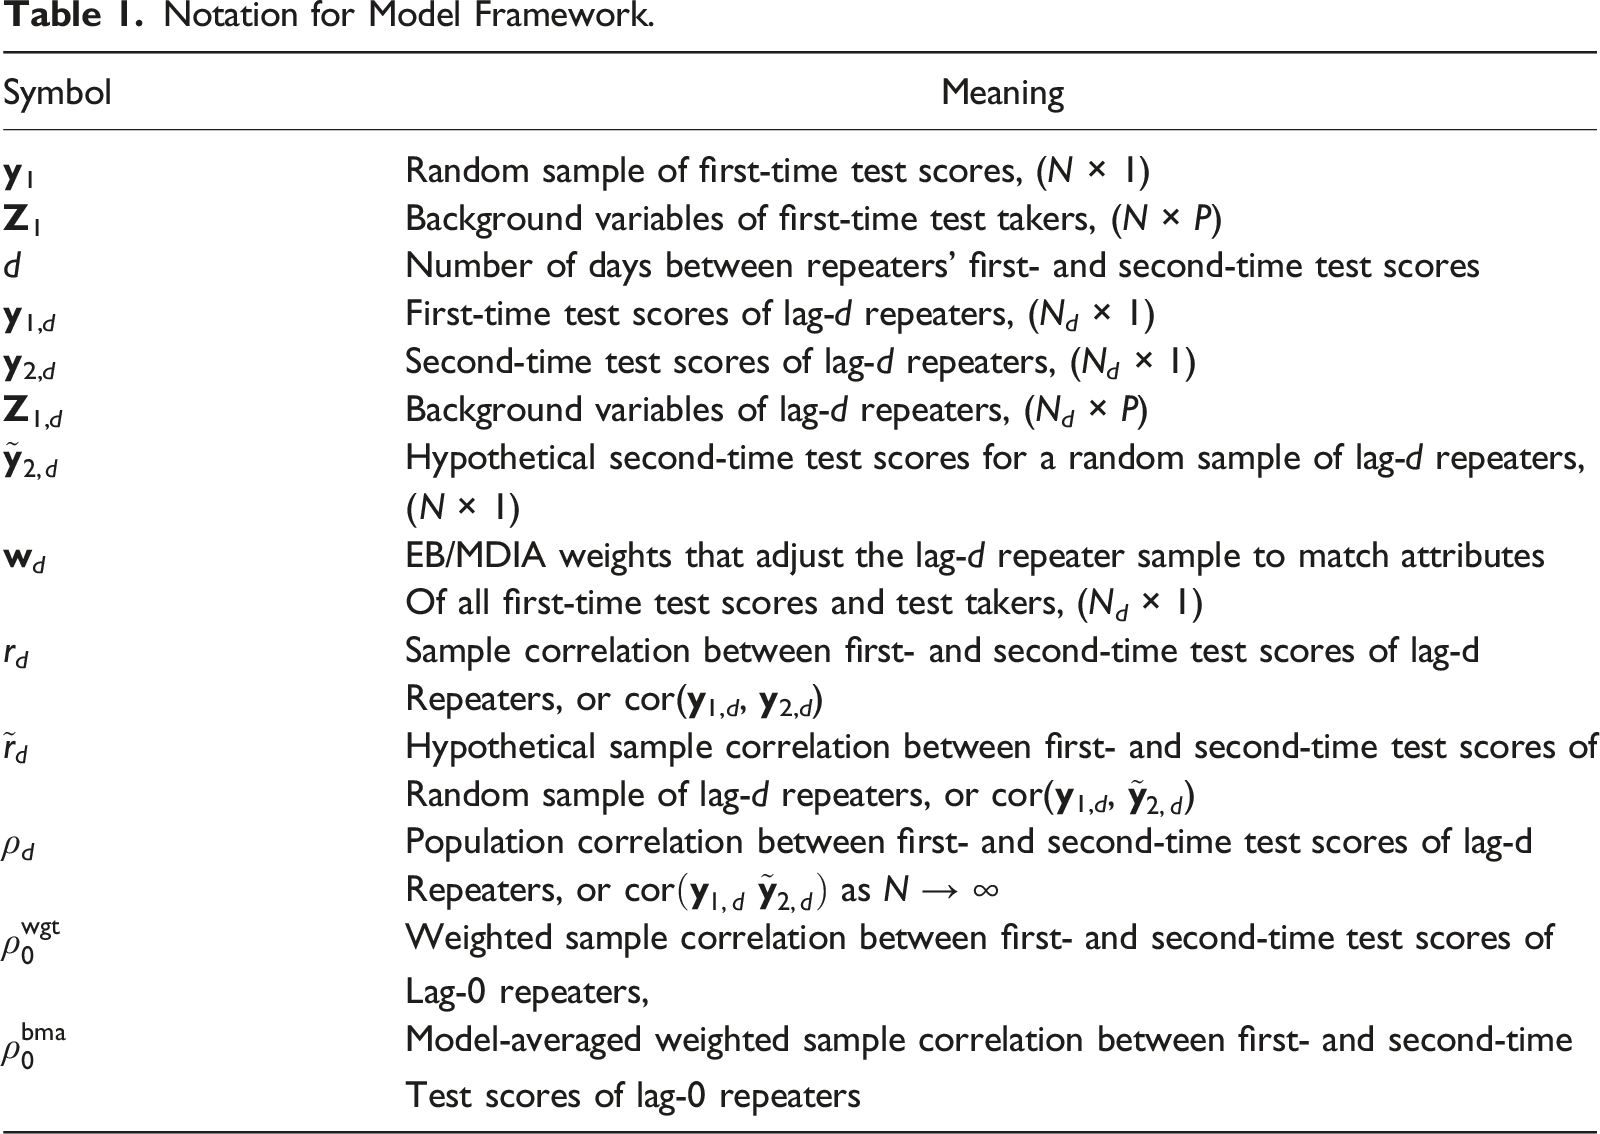
Notation for Model Framework.
Inference Problem
We describe the inference problem by first defining r
d
= cor(
The problem we are trying to address is that the observed test-retest correlations r
d
for d = 0, 1, …, dmax may be inconsistent (asymptotically biased) estimators of ρ
d
for each d = 0, 1, …, dmax. This bias can occur because not all people choose to retest, and the decision about whether and when to retest may be related to latent proficiency, test scores, background variables, or all three. This can cause sample moments of the observed data from each lag-d repeater sample to differ from those that would be obtained if all first-time test takers retested after d days. Consequently, we expect differences between r
d
and
We define the target estimand by ρ0, the vector of test-retest correlations for test scores that would be observed in an arbitrarily large random sample of first-time test takers who were retested again on the same day. Although any d could be used to define the target estimand, we choose d = 0 because the risk of carry-over effects in a high-stakes testing environment is minimized if test takers repeat on the same day.
Estimation Methods
In this section, we develop two methods for estimating ρ0 from the observed data. Both rely on weighting, which we describe first. We then discuss the two estimators.
Weighting
One approach for estimating ρ
d
for a given value of d is to weight the test takers in the lag-d repeater sample so they resemble all first-time test takers with respect to initial scores
We adopt the weighting method called entropy balancing (Hainmueller, 2012) or minimum discriminant information adjustment (Haberman, 1984), referred to as EB/MDIA. This method produces a set of case weights for an observed sample such that (1) the weighted moments (e.g., means and variances) of the observed sample are identical to a given set of target moments, and (2) the weights are as close to uniform (i.e., equal weights) as possible as defined by a distance metric. The latter constraint helps to mitigate variance inflation due to weighting.
For a given value of d, we consider the observed background variables and the observed first- and second-time test scores of lag-d repeaters, {
These constraints imply that the weights sum to one and the weighted first and second moments of the first-time scores, as well as the weighted first moments of background variables for the lag-d repeaters, equal the corresponding moments for all first-time test takers. Technical details on how these constraints are implemented to compute
Given the weights 
We now present two estimators of ρ0 based on this weighting approach.
Method 1: Weighting Lag-0 Repeaters
An estimator of ρ0 using only the lag-0 repeater sample is 
Method 2: Model Averaging
A potential shortcoming of
Specifically, this method assumes that the unobserved sequence
We use 
We then compute the model-averaged estimate of ρ0 by
The intent of the model-averaged estimate is to improve precision by pooling information across multiple lags, while simultaneously mitigating bias arising from misspecification of the functional form of the regression.
Empirical Example
We demonstrate these procedures for reliability estimation using data from the DET. For the data analyzed here, the assessment consisted of seven sections (five computer adaptive sections and two interview sections). Scores from these seven sections were used to compute an overall score and four subscores (comprehension, conversation, literacy, and production), each reported on a scale of 10–160 in increments of five points (LaFlair, 2020; LaFlair & Settles, 2020). We consider reliabilities of the five scores reported on this scale. Where applicable, we provide standard deviations of these scores to aid interpretation.
Data Details
We use data from N = 293, 229 unique test takers who received certified DET scores (i.e., no rule violations or technical difficulties invalidated their test sessions). We define the target population for which we want to estimate DET overall and subscore reliabilities as first-time test takers. We thus treat the first test session from each of these unique test takers as a random sample of sessions from this target population. We refer to this sample as the target sample. Among test takers in the target sample, 40,757 (14%) took the DET a second time within dmax = 30 days of the initial assessment. 6 We refer to these test takers as the 30-day repeater sample.
Descriptive Statistics
Figure 1 provides counts of repeaters for each lag-d repeater sample (N
d
). There is large variability in the number of test takers across lags, with lags of two to seven days being most frequent. Number of test takers for each lag-d repeater sample for d = 0, …, 30.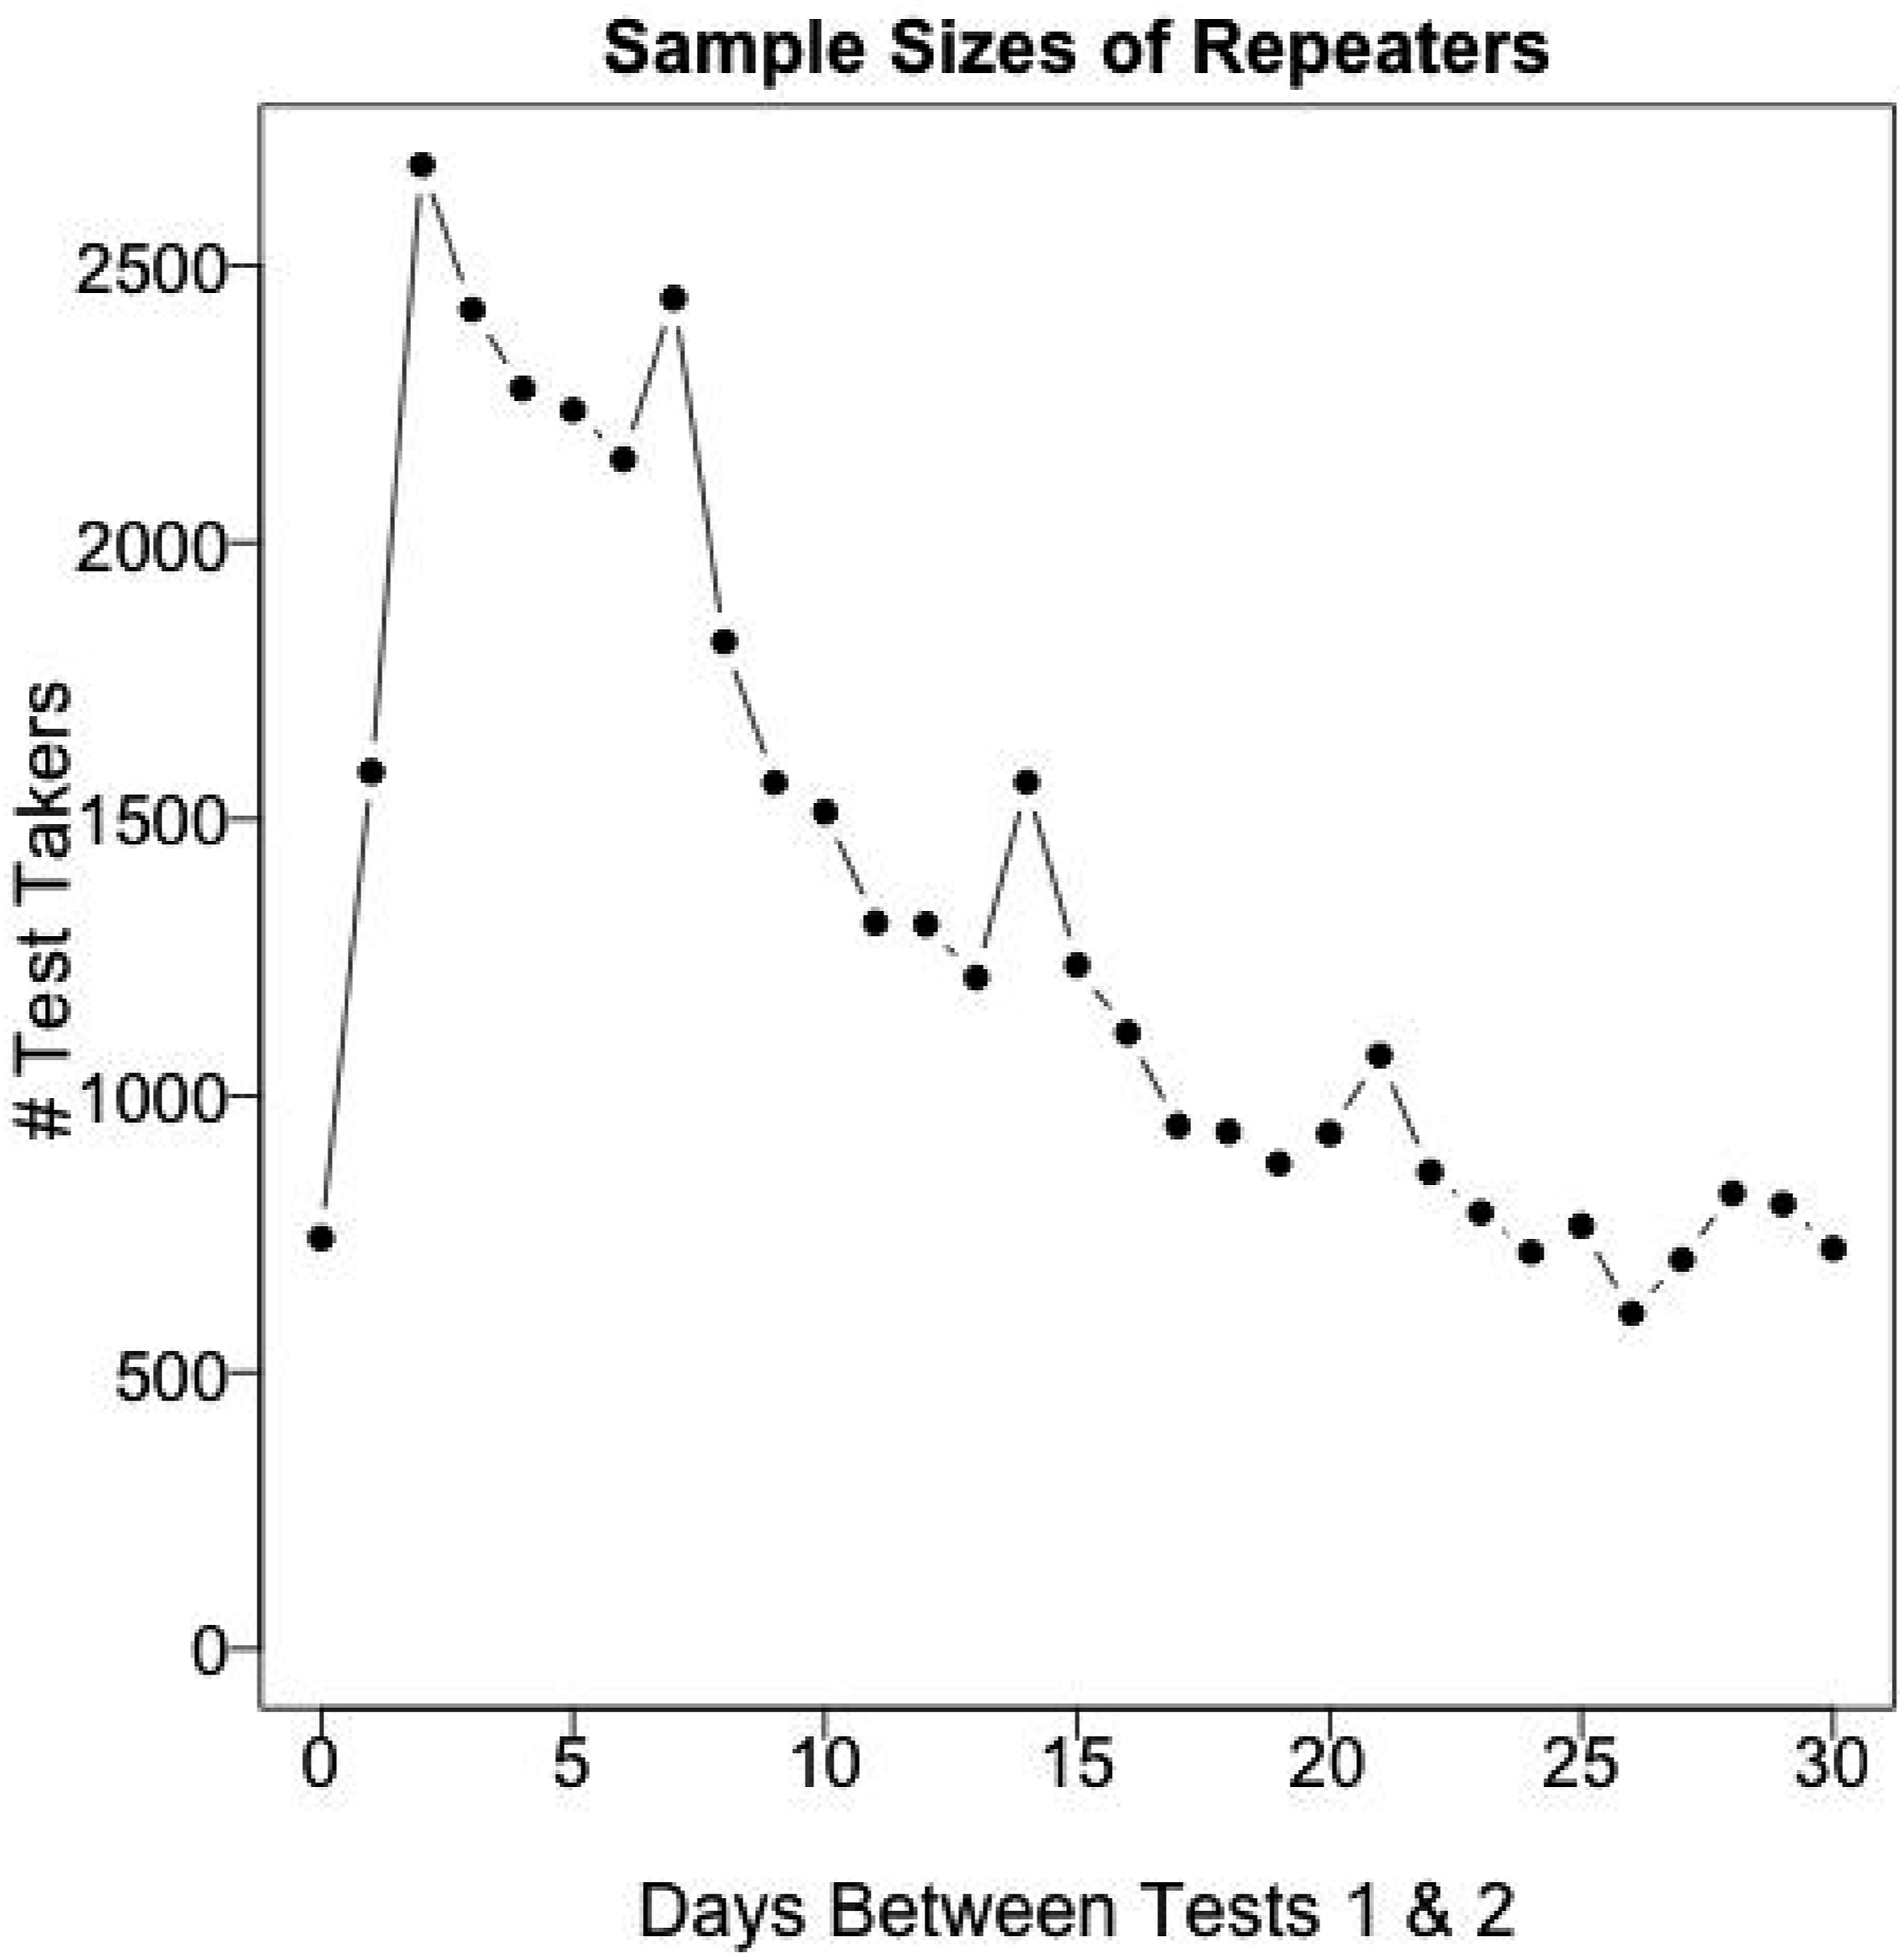
The background characteristics of the 30-day repeater sample as a whole are substantially different from those of the target sample, and within the 30-day repeater sample, there are large differences in background characteristics across the lag-d repeater samples. These differences are demonstrated in Figure 2 for DET scores (e.g., mean and standard deviation of first-time DET overall scores) and Figure 3 for select background variables (e.g., percentage of test takers from China and India). The horizontal dotted gray line in each sub-figure shows the corresponding average for test takers in the target sample, or all first-time test takers. Mean and standard deviation (SD) of first-time DET overall score and means of first-time DET subscores in SD units of the target population (all first-time test takers). Gray dotted lines represent target population means/SD. Means of select test-taker background variables for each lag-d repeater sample. Gray dotted lines represent target population (all first-time test taker) means. TOEFL and IELTS scores are in SD units of the target population.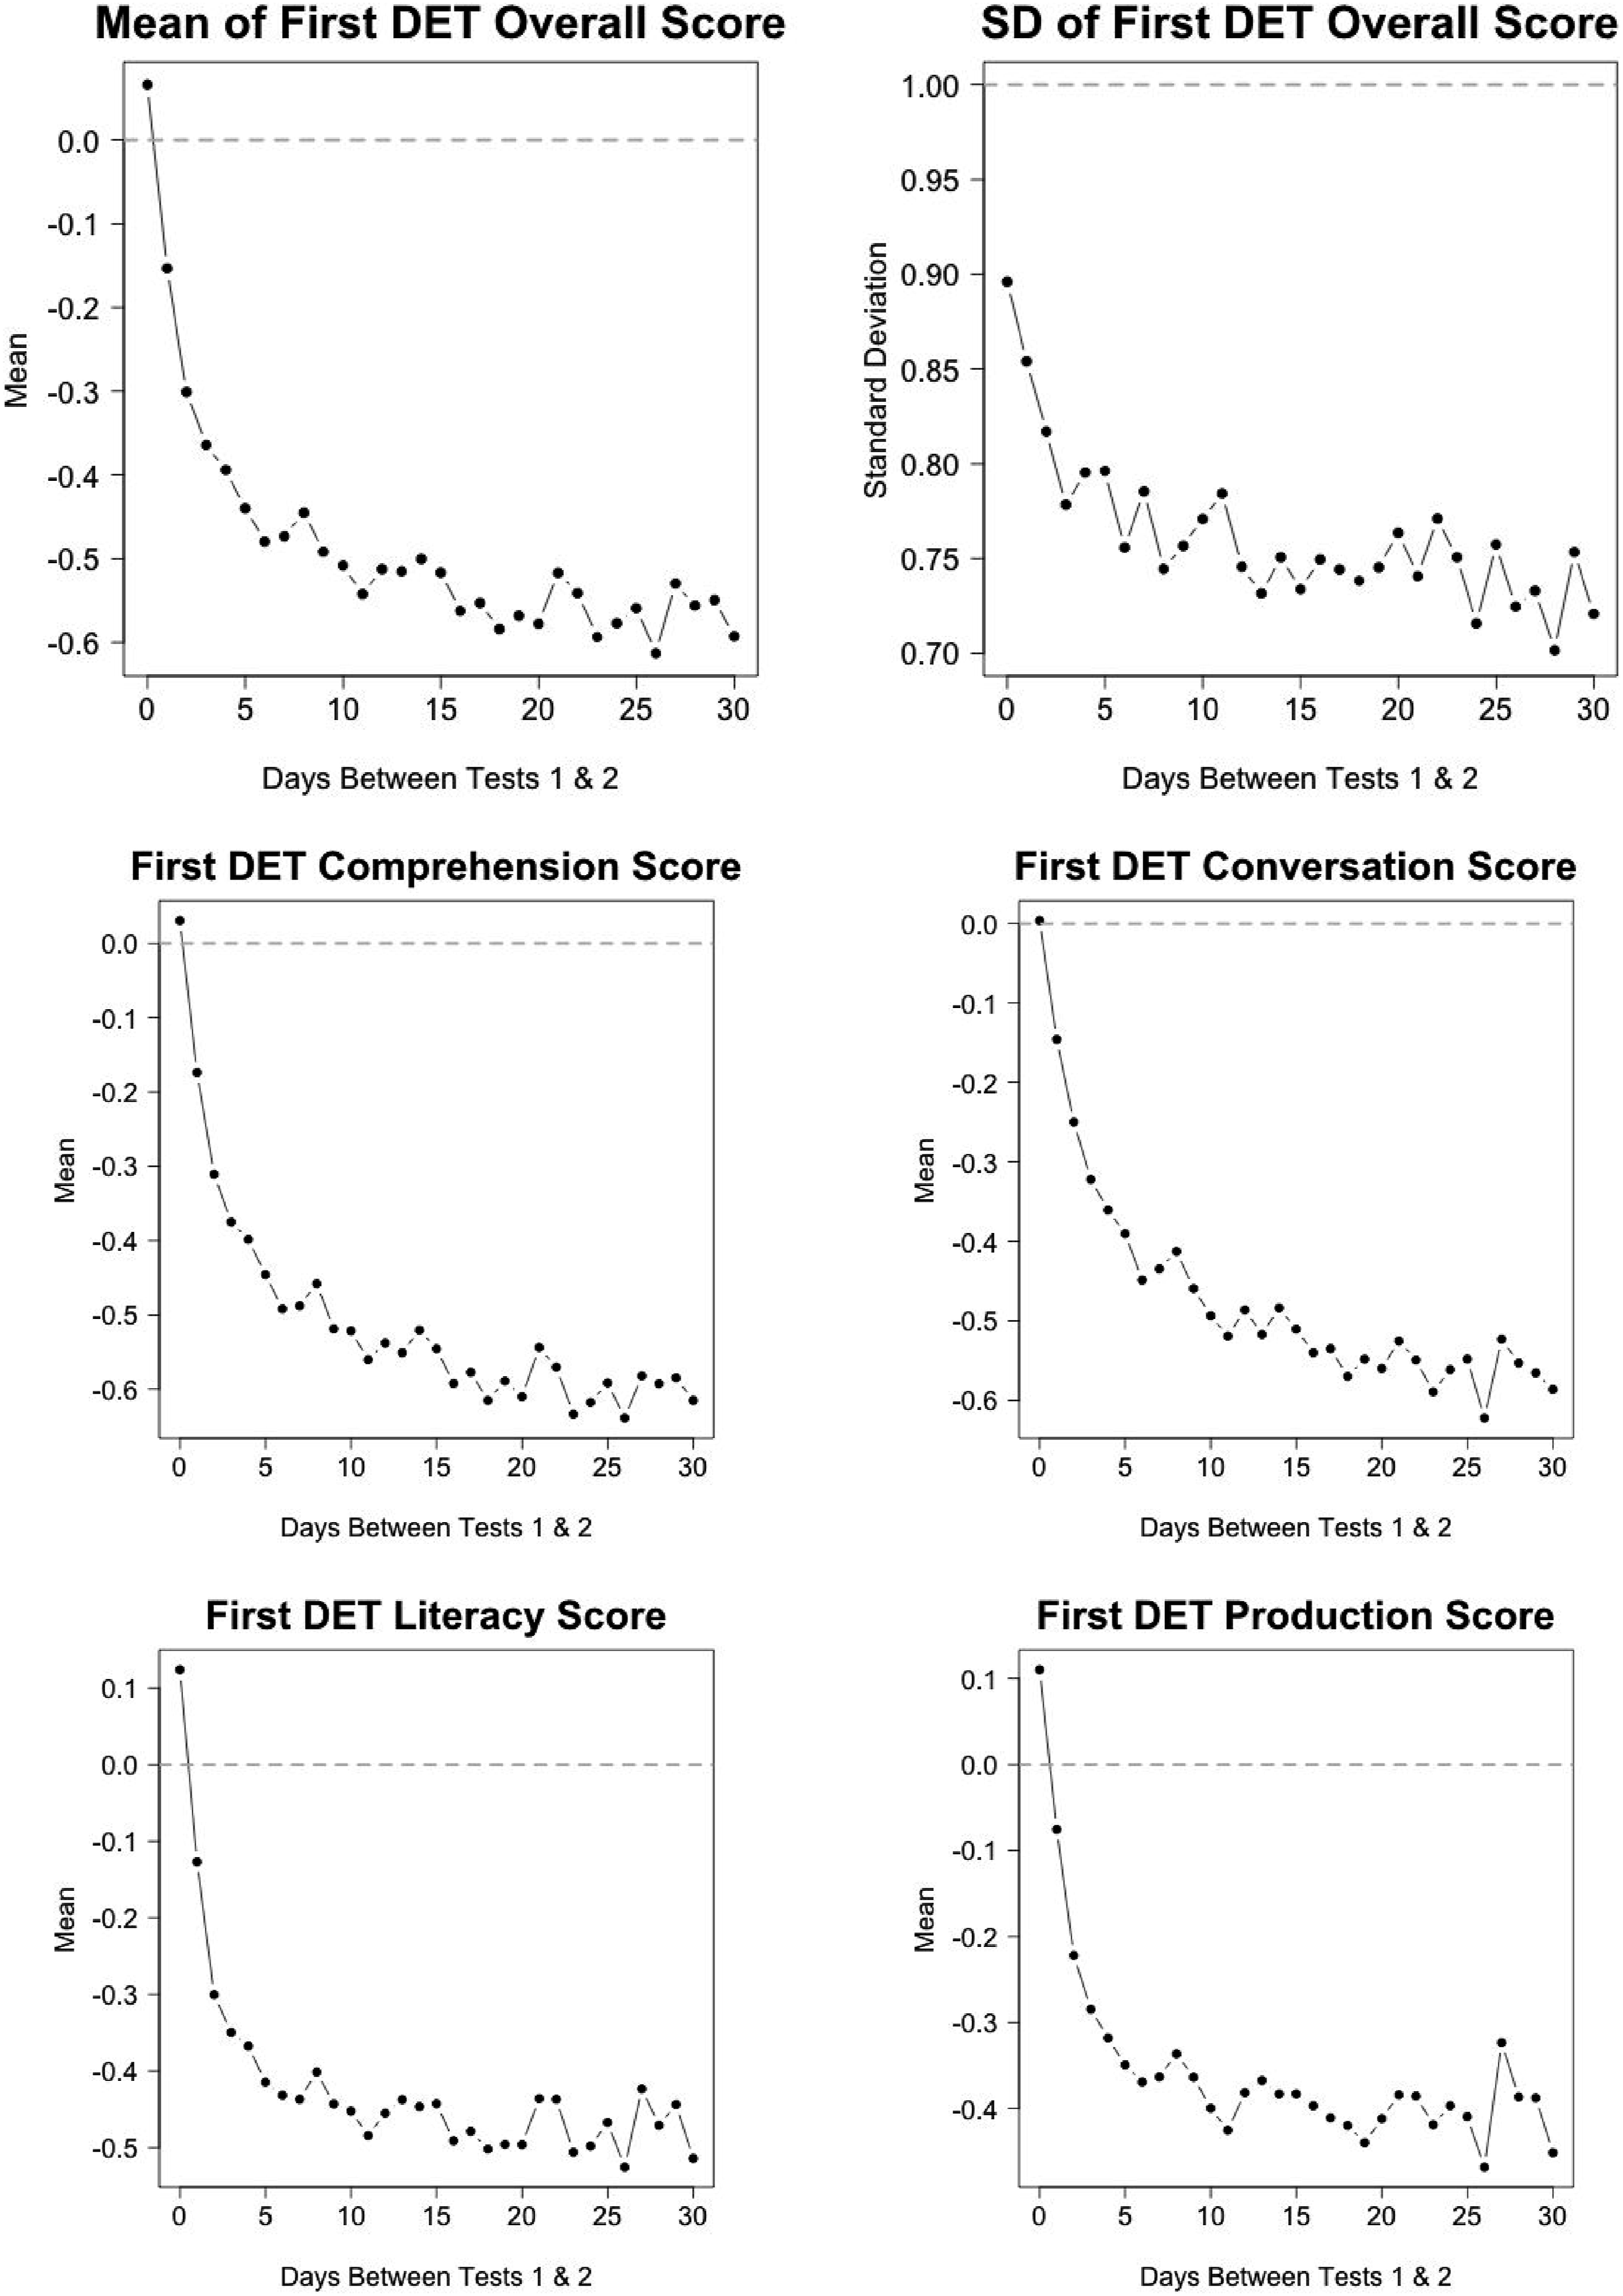
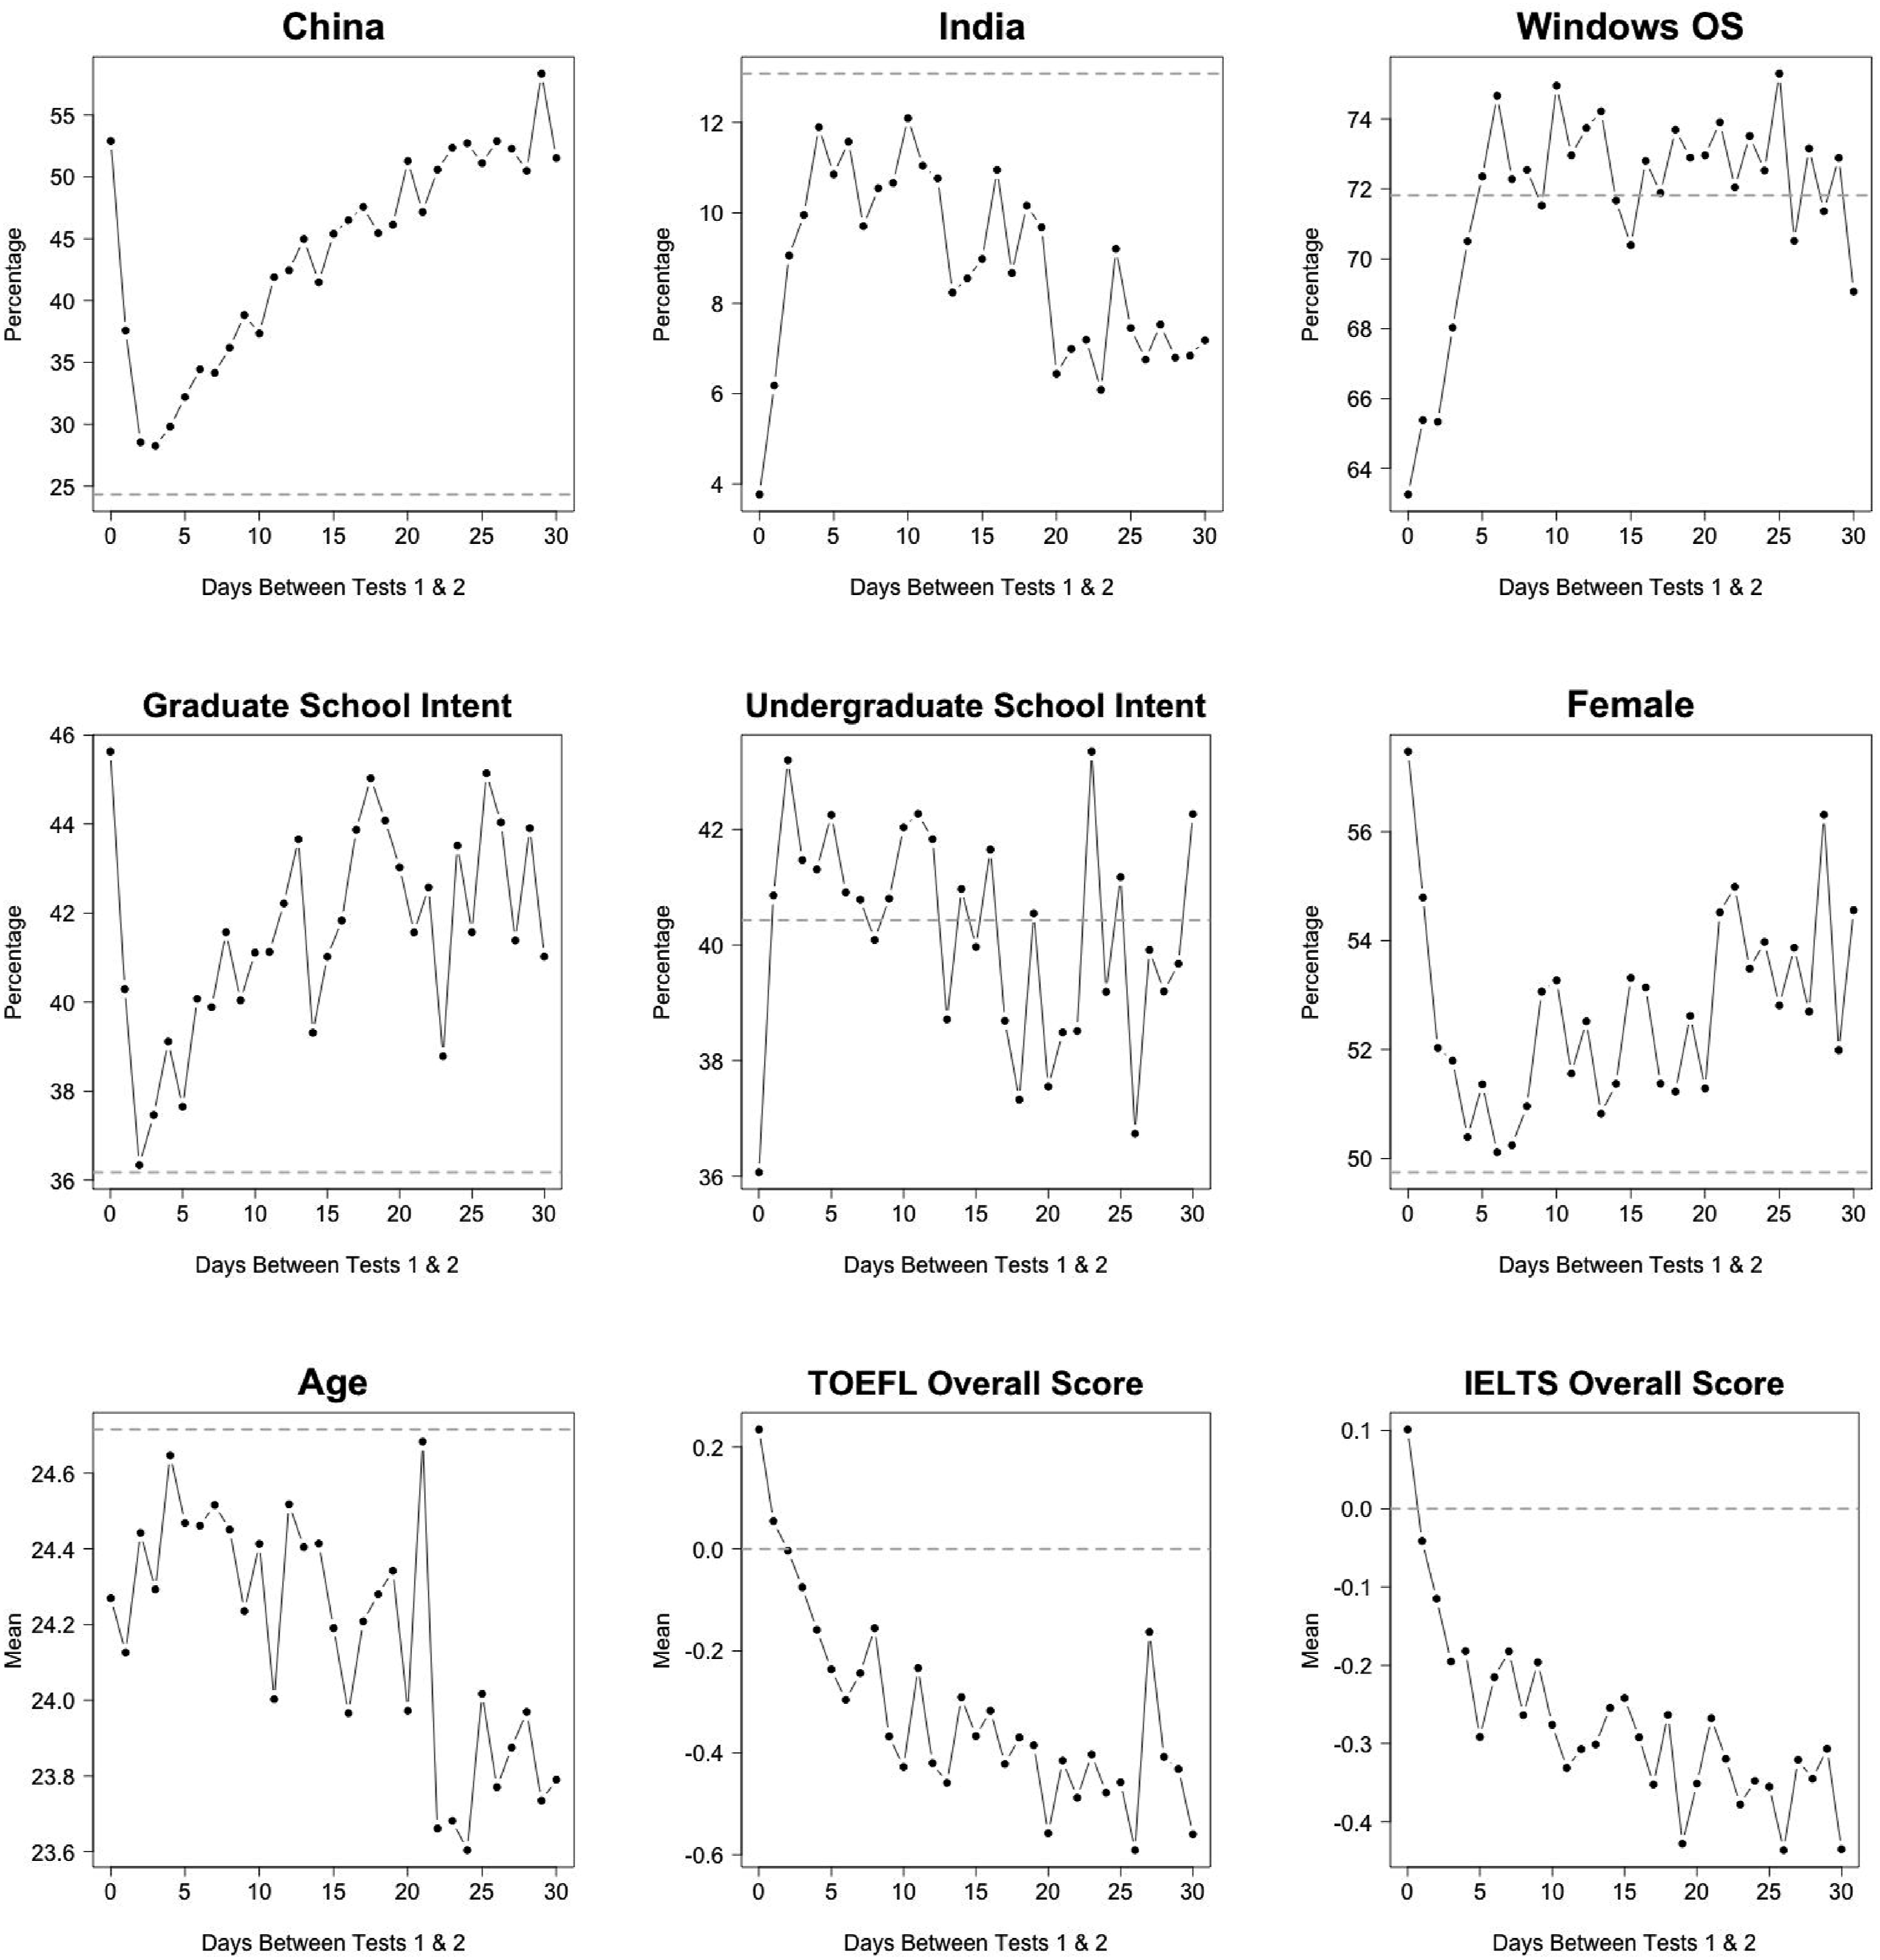
In particular, the 30-day repeater sample consists of test takers who have substantially lower DET, self-reported TOEFL, and self-reported IELTS scores compared to the target sample, and thereby lower DET score variance. They are also more likely to come from China and not from India, to take the DET for graduate school admission, and to be young and female. Across the 30-day repeater sample, test takers who repeat rapidly such as on the same day or within a couple days tend to be most different from other repeaters.
Test-Retest Correlations
Among test takers in the 30-day repeater sample, the unadjusted correlation between the first- and second-time overall scores is 0.84. The corresponding unadjusted correlations for the comprehension, conversation, literacy, and production subscores are 0.81, 0.83, 0.80, and 0.81, respectively. Because the 30-day repeater sample is a more homogeneous, lower-achieving subpopulation than the target sample, these correlations are likely to be negatively biased estimates of overall and subscore reliabilities. Specifically, the first-time scores for the 30-day repeater sample have means ranging from 0.34 to 0.46 standard deviation units below the corresponding means in the target sample, and have standard deviations that are between 78% and 83% as large as the corresponding standard deviations in the target sample.
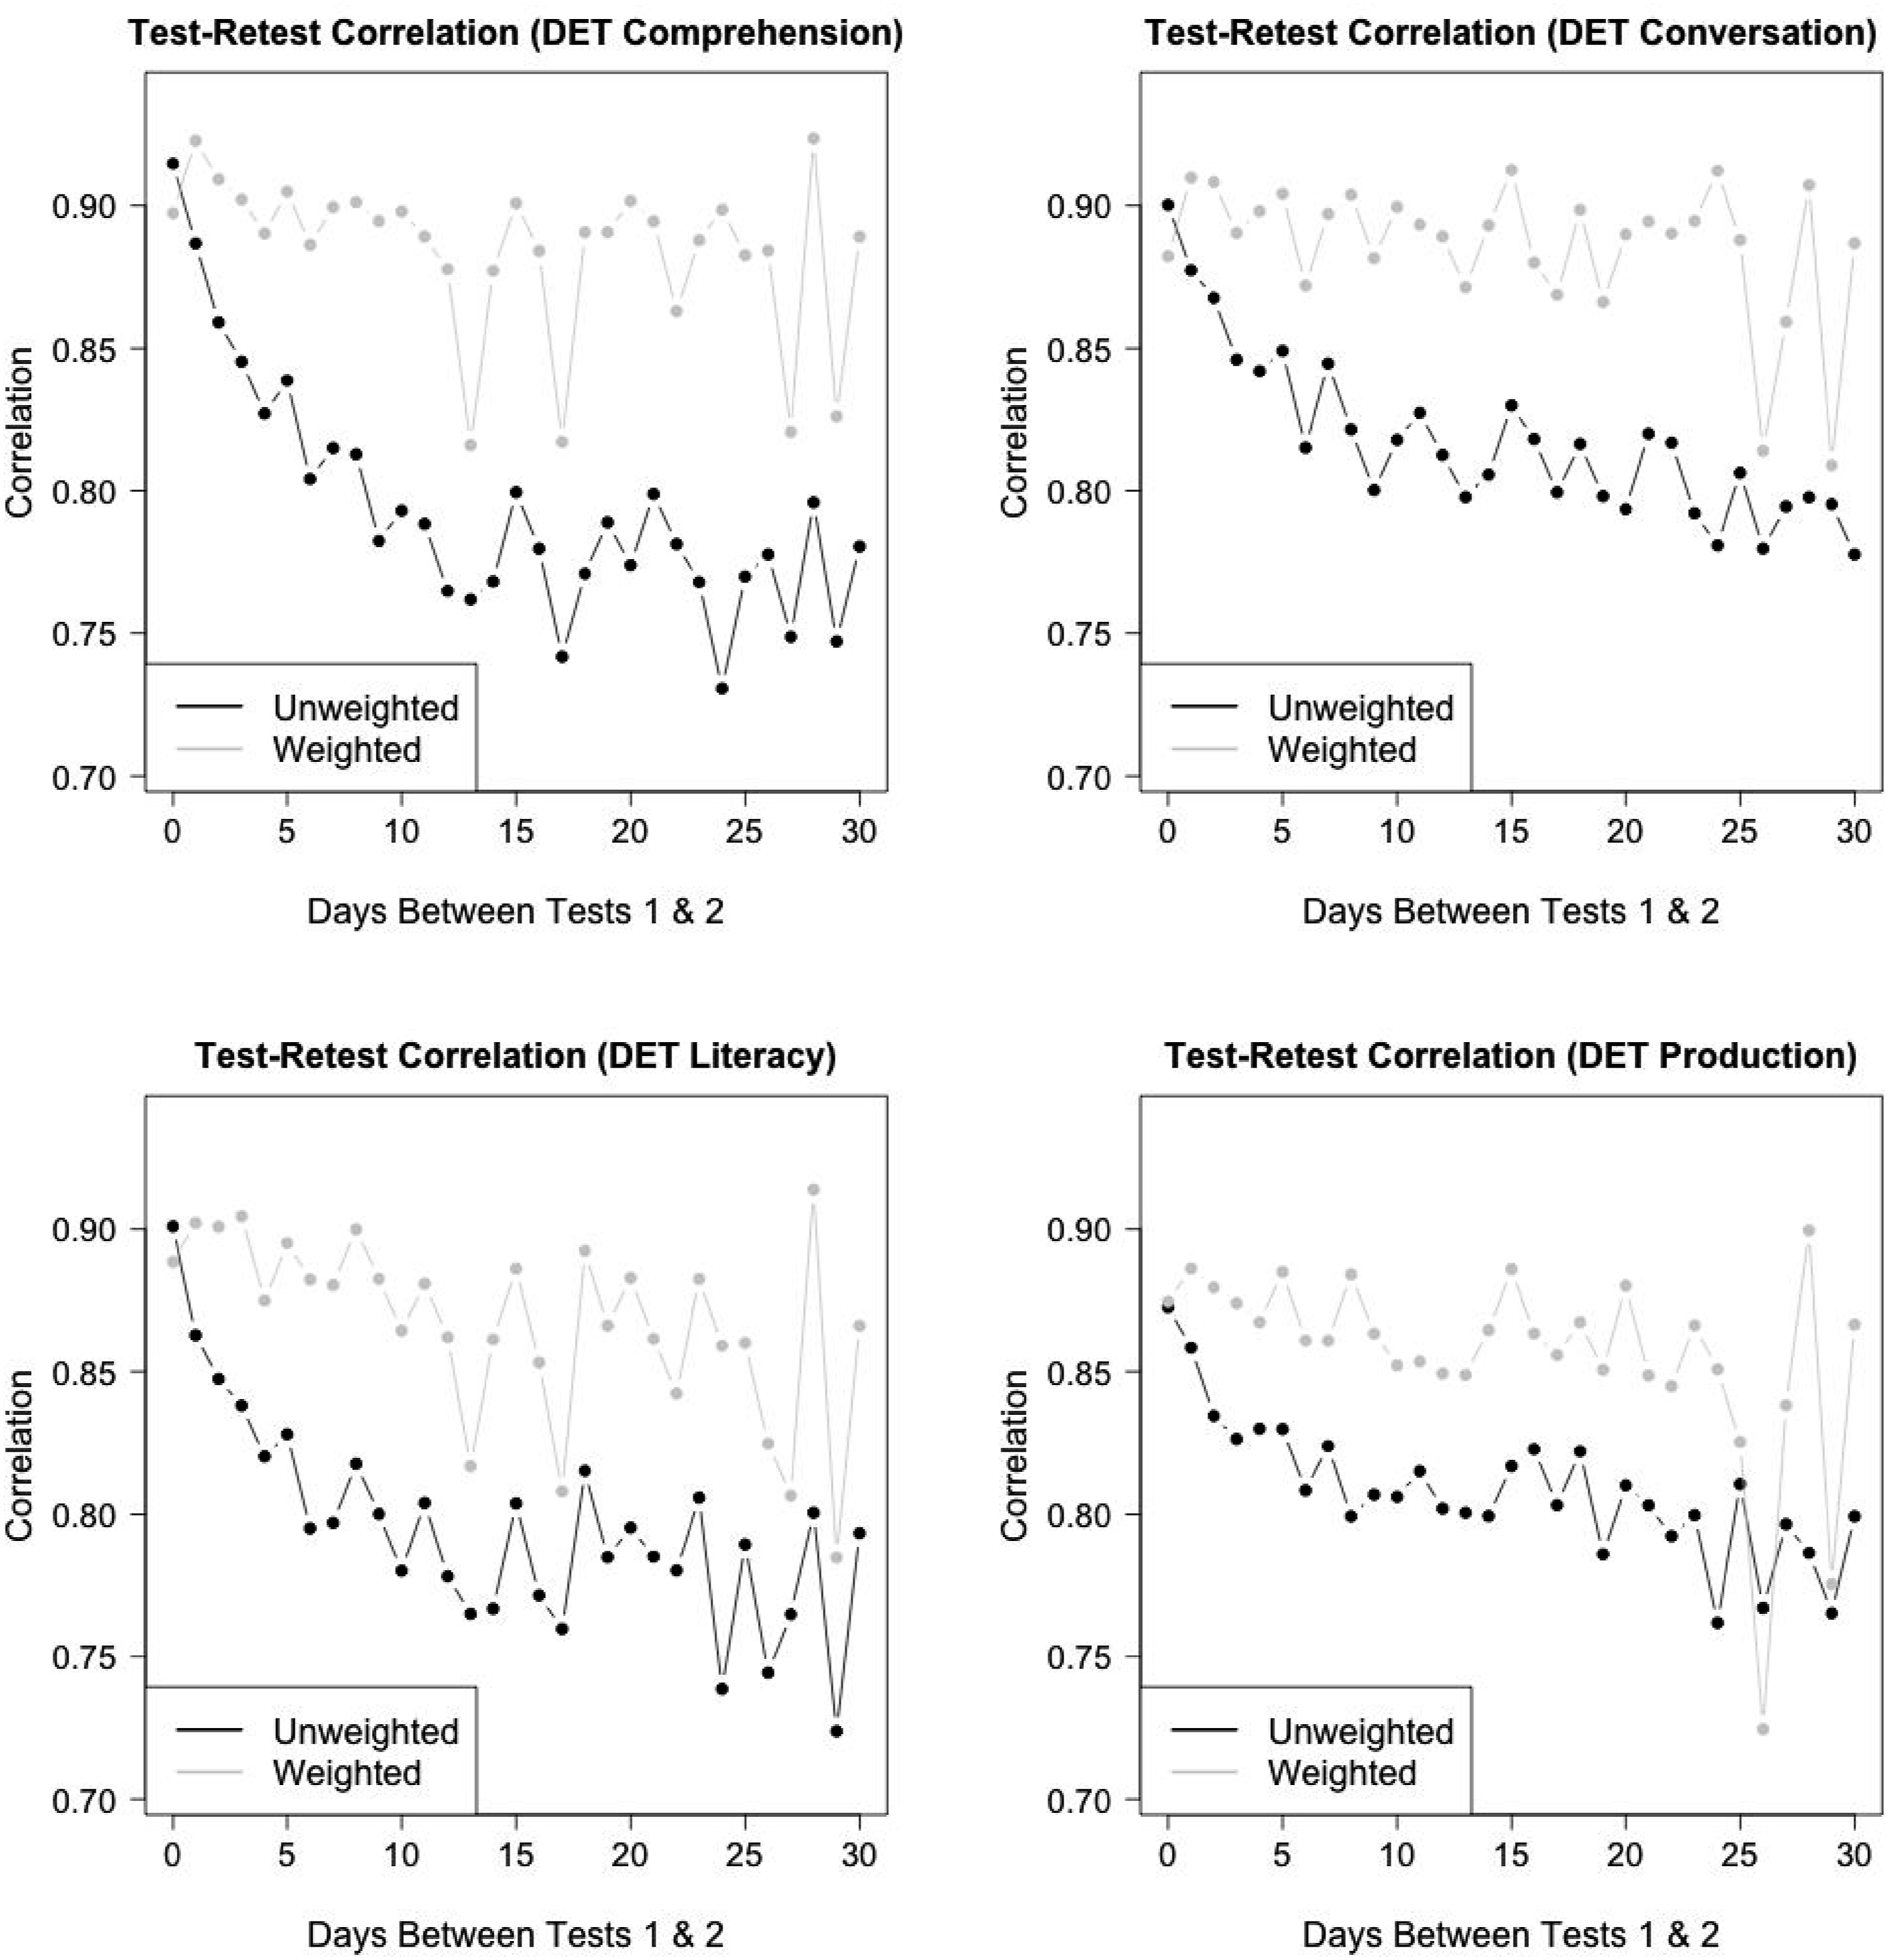
The black curve in Figure 4 provides the unadjusted test-retest correlation for the overall DET score, for each of the lag-d repeater samples. The correlation is highest for people who took the test twice on the same day and then rapidly decays as d increases. Similar patterns occur for all DET subscores (black curves in Figure 5). Weighted and unweighted test-retest correlations for each lag-d repeater sample for d = 0, …, 30. Unweighted (black) and weighted (gray) test-retest correlations for each lag-d repeater sample, separately by DET subscore.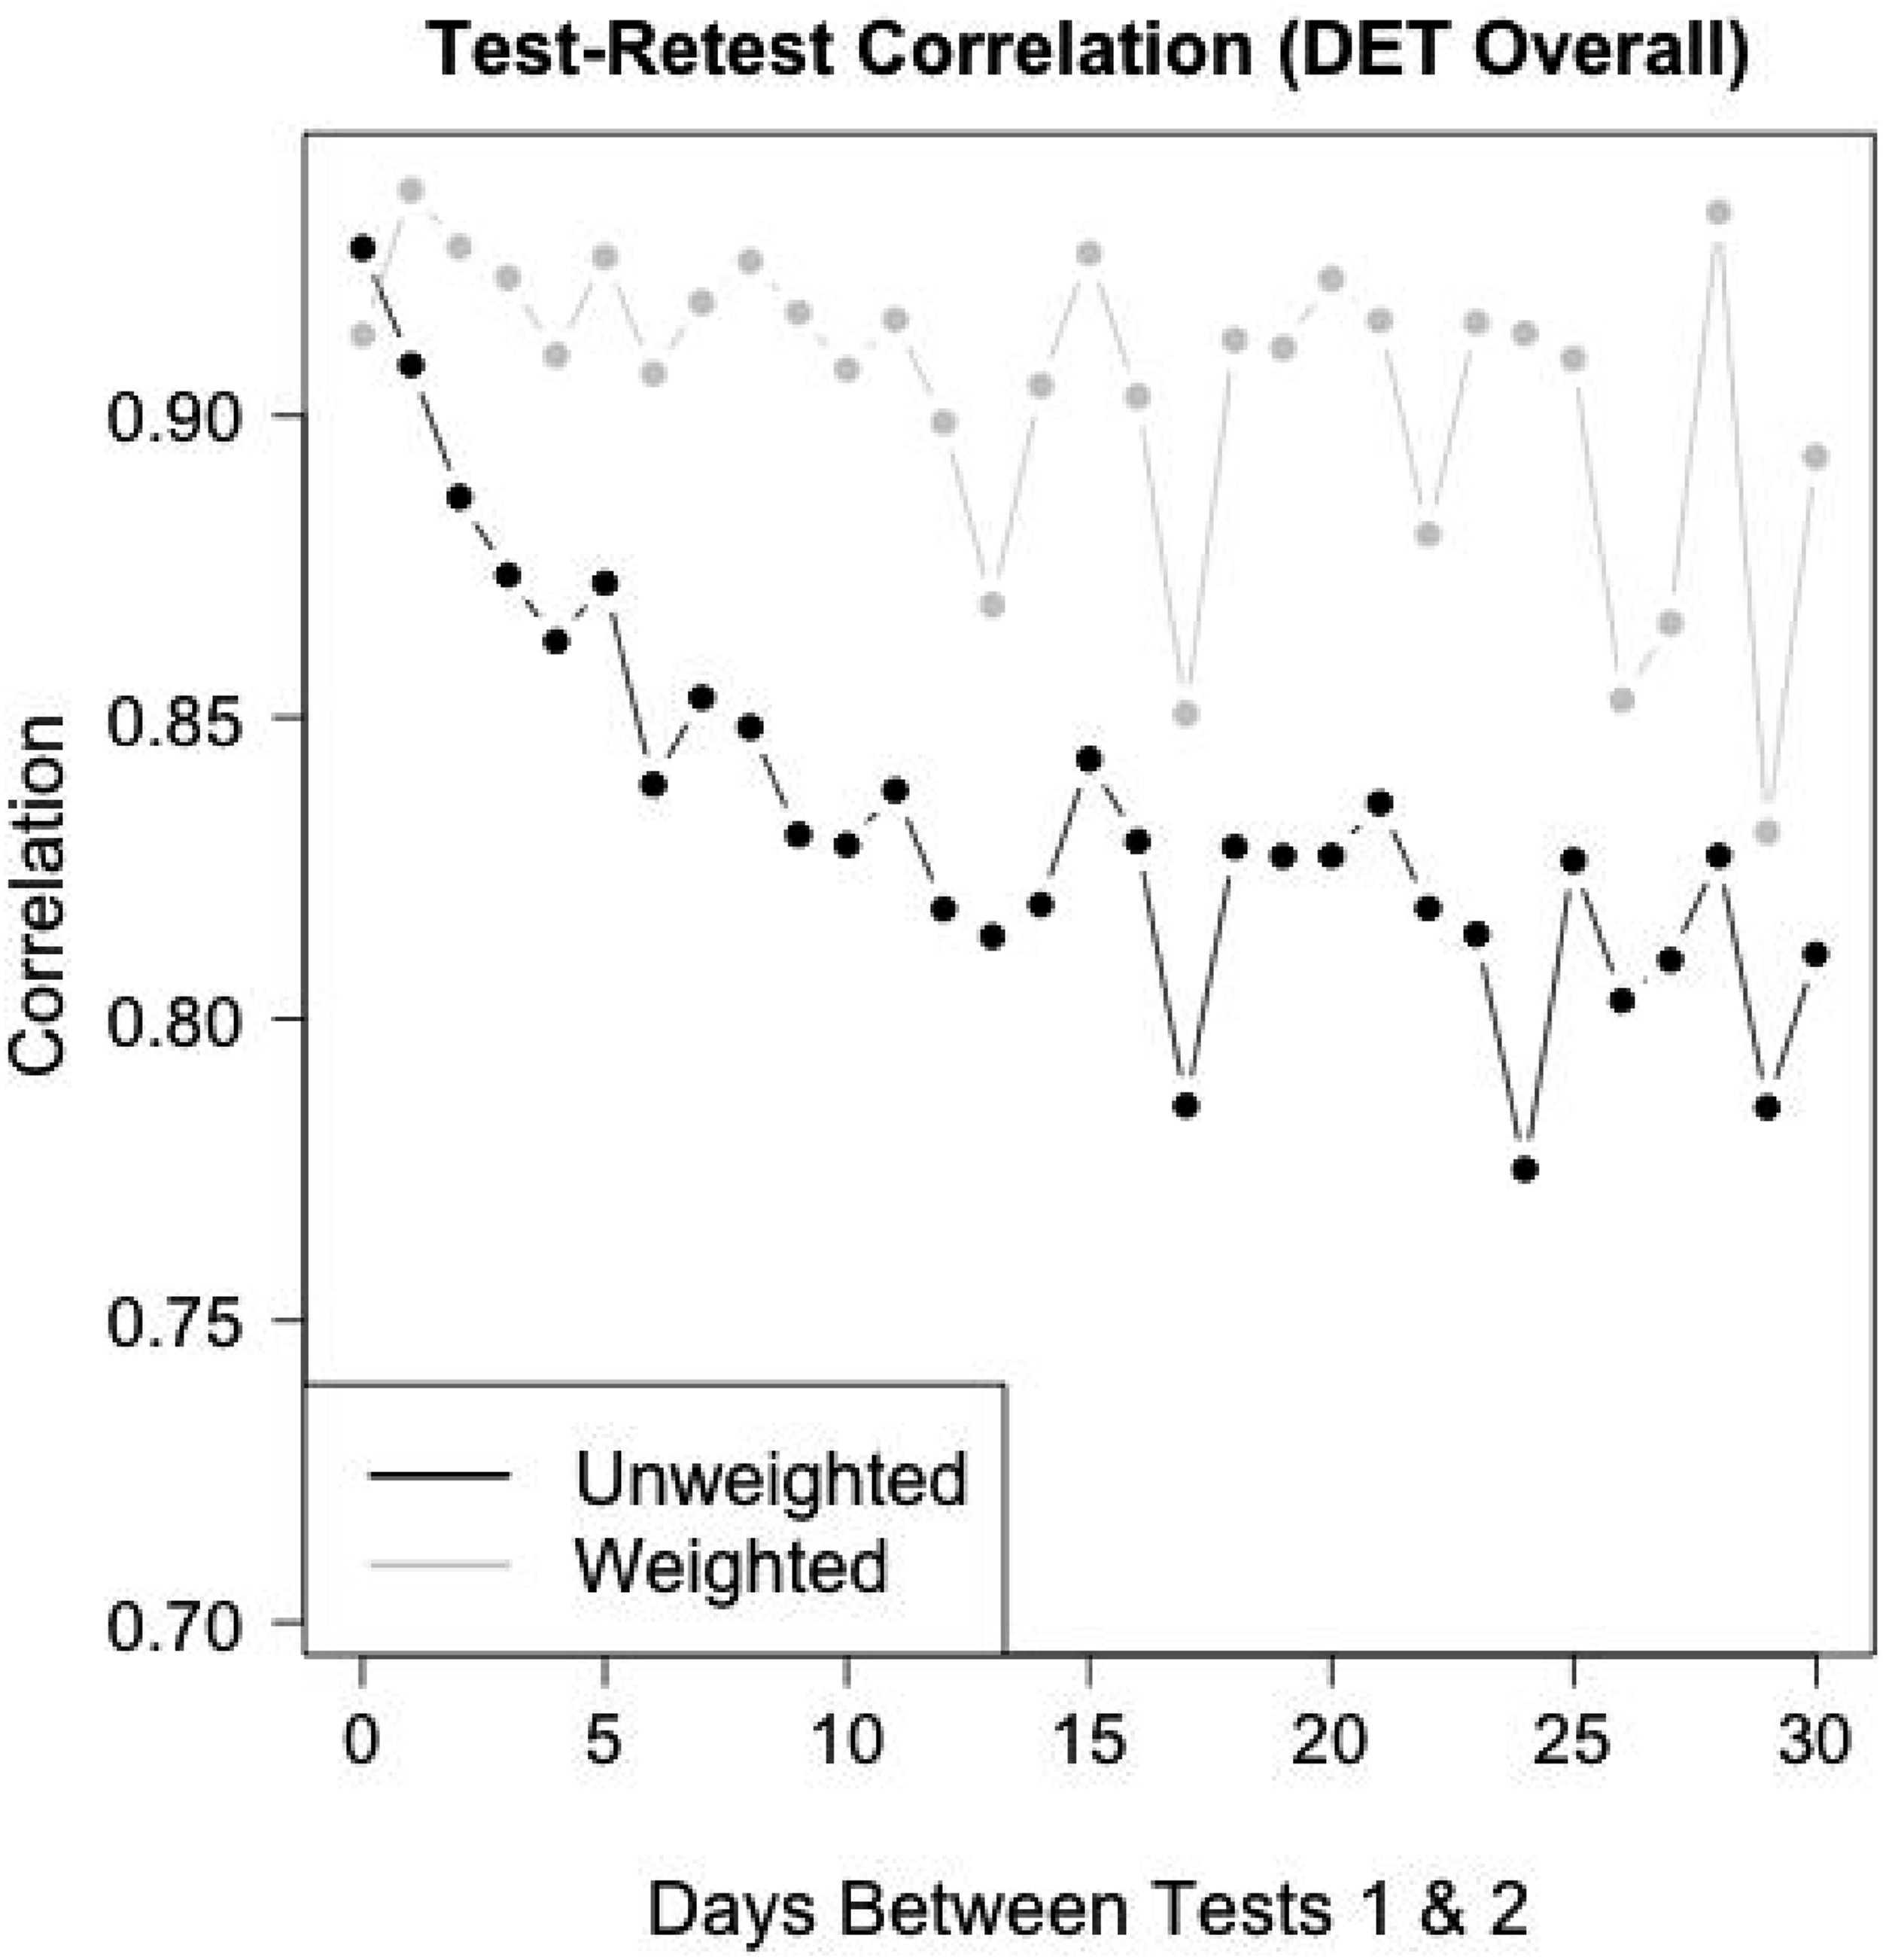
Reliability Estimation
For each lag-d sample, we computed EB/MDIA weights to make the sample match 38 attributes of the target sample. The variables in
The remaining 19 adjustment variables are based on test-takers’ DET scores from the first administration. Although we are interested in the reliability of the overall score and four subscores, each of these reported scores is a linear combination of all or a subset of the seven DET section scores. Weights that match the first moments of these section scores also match the first moments of all reported scores because the reported scores are linear functions of the section scores. The 19 adjustment variables consist of the first and second moments of the section scores (14), and the second moments of the reported scores (5). We note that all adjustment variables were based on their marginal moments.
After computing the EB/MDIA weights for each lag-d sample, we computed
While weighting mitigates the rapid decline in correlations as the time between tests increases, there is still evidence of a slight decline in the weighted correlations for the DET overall score in Figure 4 and the subscores in Figure 5. Such decline may be consistent with heterogeneous ability changes among test takers, with variability that increases with the time between tests.
A straightforward way to avoid bias due to heterogeneous changes is to focus on lag-0 repeaters by applying the estimator in equation (3). Unfortunately, the lag-0 repeater sample size is relatively small (N0 = 743), and the MDIA weights required to make this sample more closely resemble the target sample have a relatively large design effect (DEFF; Kish, 1965). A DEFF greater than 1 tends to cause larger sampling variance of the weighted statistic than would exist for a statistic based on a random sample of the same size from the target population. For instance, the DEFF of weighting the lag-0 repeater sample is 2.01 (see Figure 6), such that the sample of N0 = 743 repeaters at lag-0 has sampling variability of the weighted test-retest correlation that is approximately the same as that of a random sample from the target population of size 743/2.01 ≈ 370 people. This leads to a relatively wide confidence interval for the test-retest correlation in the target population as estimated by the weighted sample of lag-0 repeaters. Design effects for MDIA weights. A design effect greater than 1 indicates a smaller effective sample size when using each set of weights. Presumably, larger design effects are observed with more days between tests because of learning/practice effects.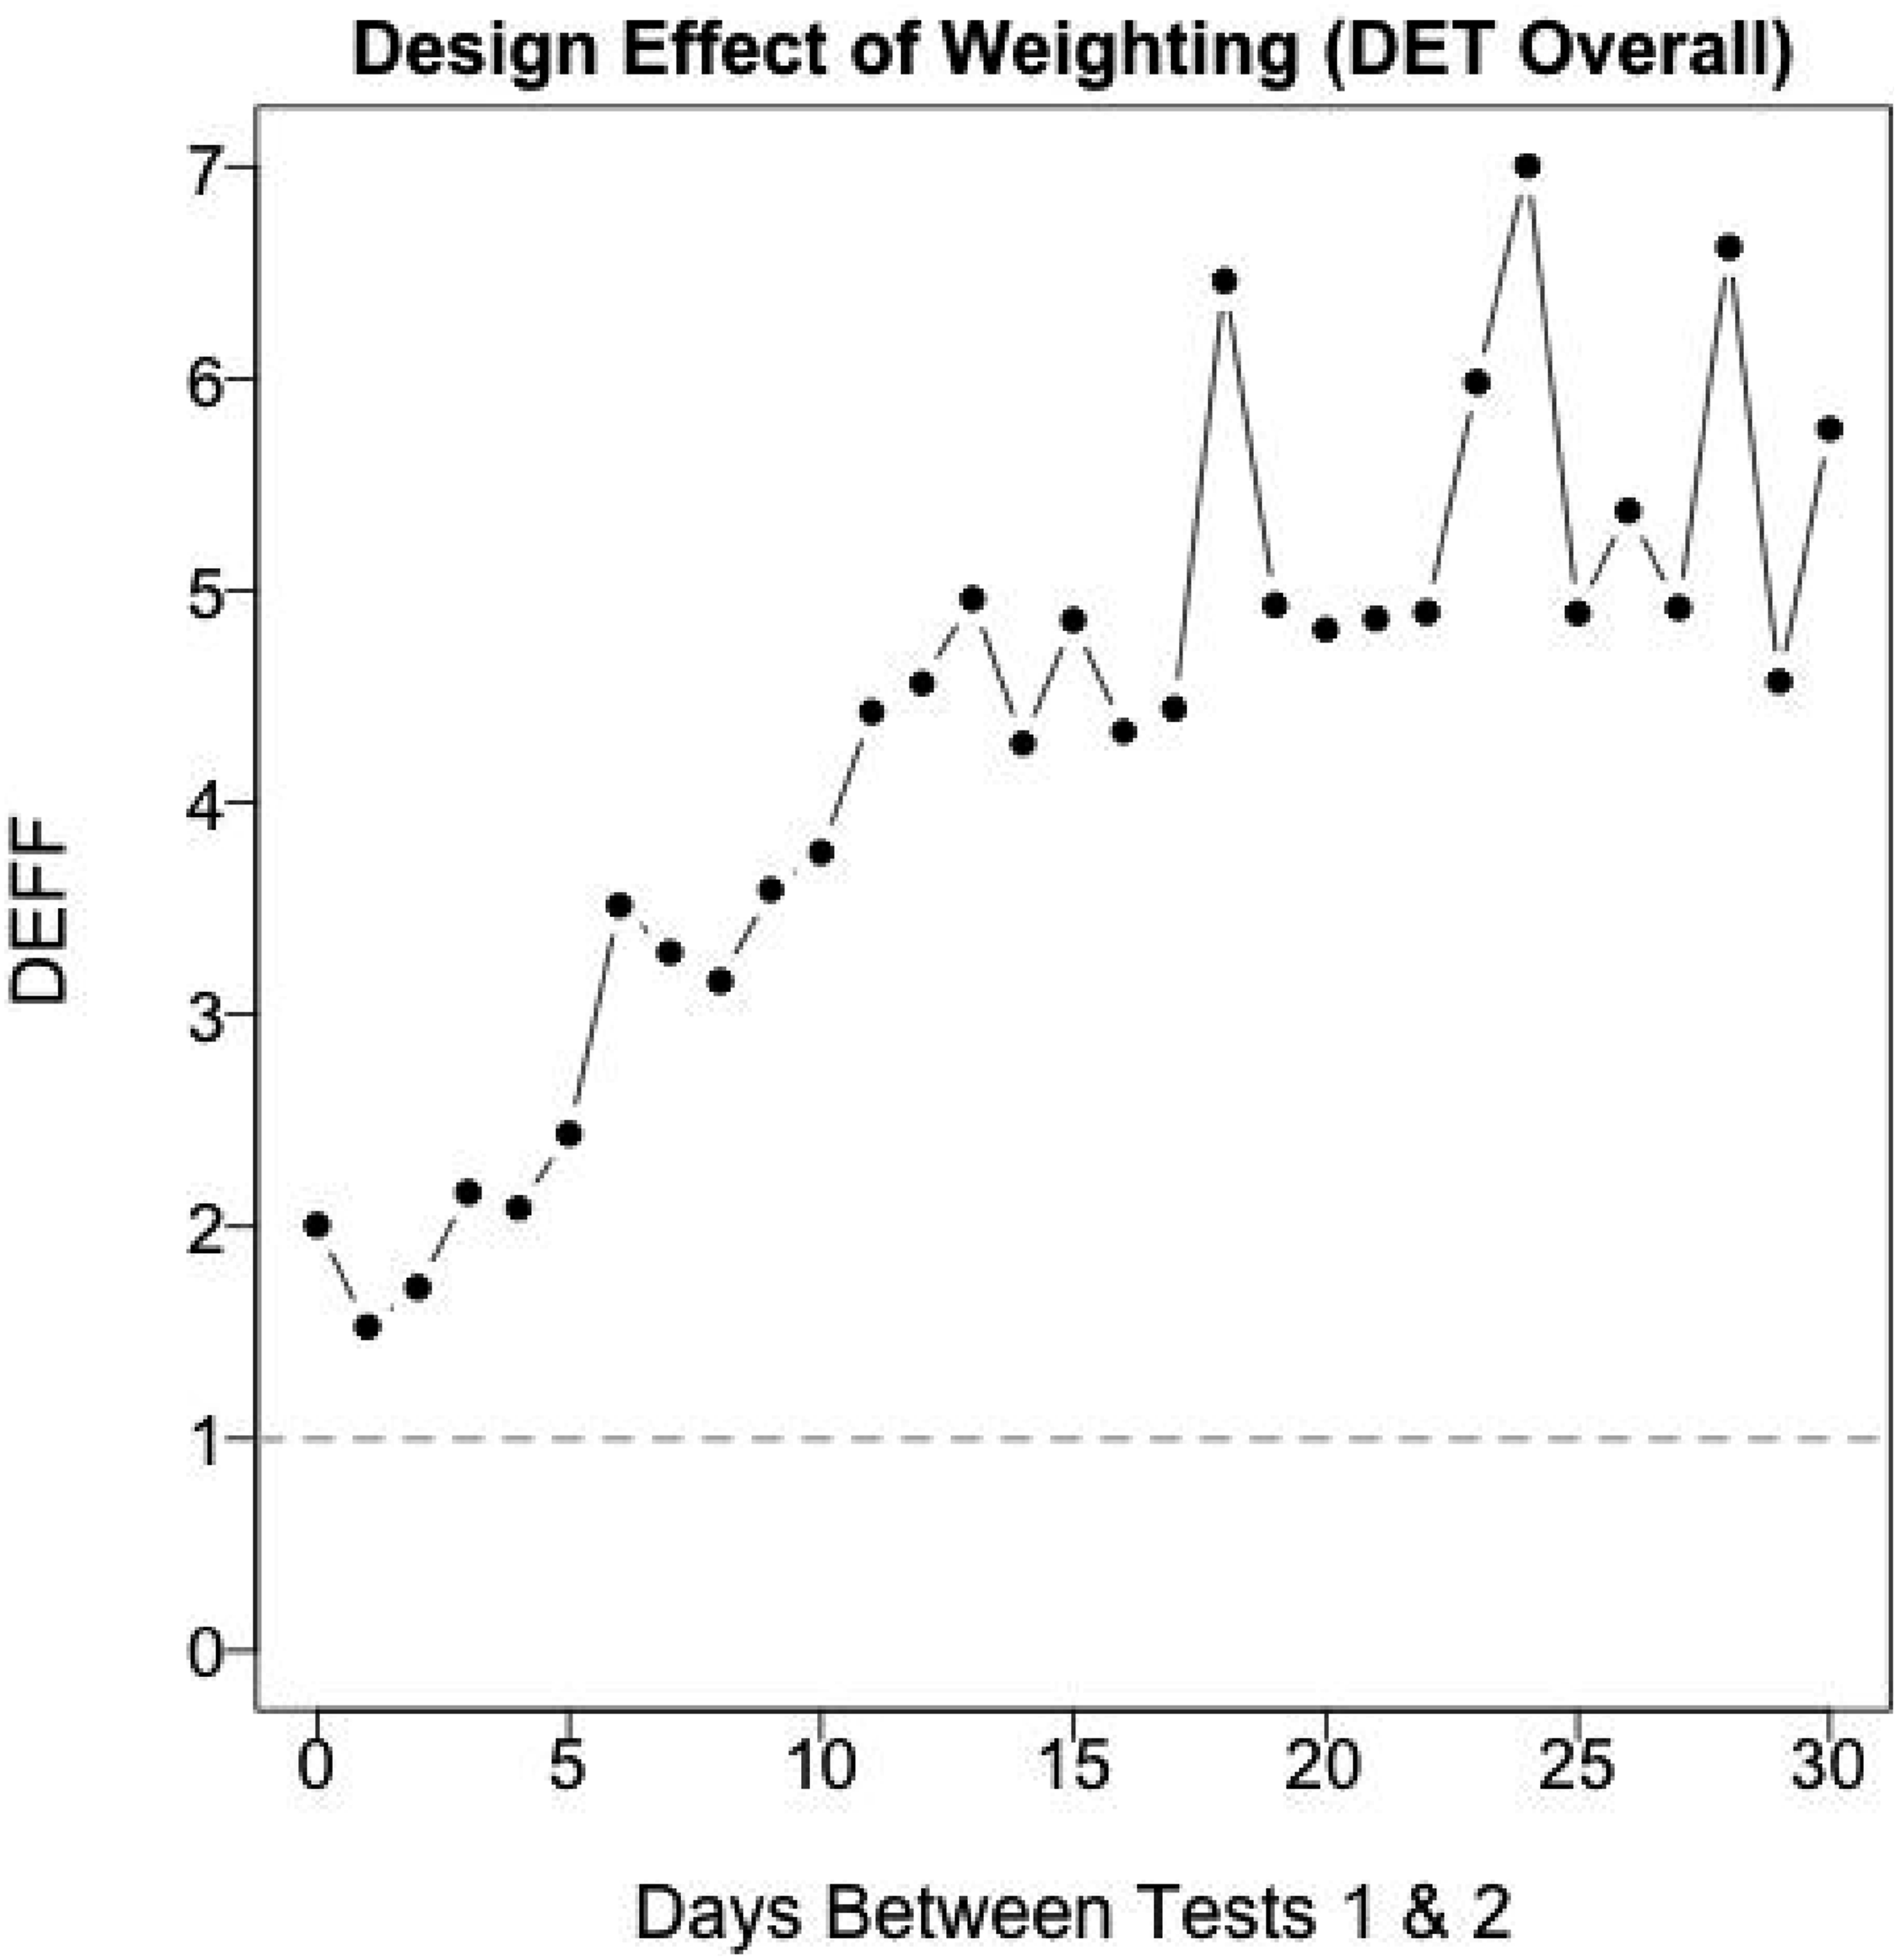
To improve precision, we pool data across lags using the model averaging procedure described previously. Figure 7 depicts the procedure. We focus on the lag-d repeater samples for d = 0, 1, …, 15, using dmax = 15 to avoid the influence of potential learning/practice effects, and then regress the weighted test-retest correlations on d using four different polynomial regression models: linear (degree 1), quadratic (degree 2), cubic (degree 3), and quartic (degree 4). Each of the k = 1, 2, 3, 4 regression models are estimated using weighted least squares, with weights proportional to the repeater sample size at each lag. Each of the four fitted models is then used to estimate the correlation at d = 0, and the fitted values are averaged by BIC according to equation (4). Polynomial regression models fitted to the weighted correlations of the lag-d repeater samples for d = 0, 1, …, 15.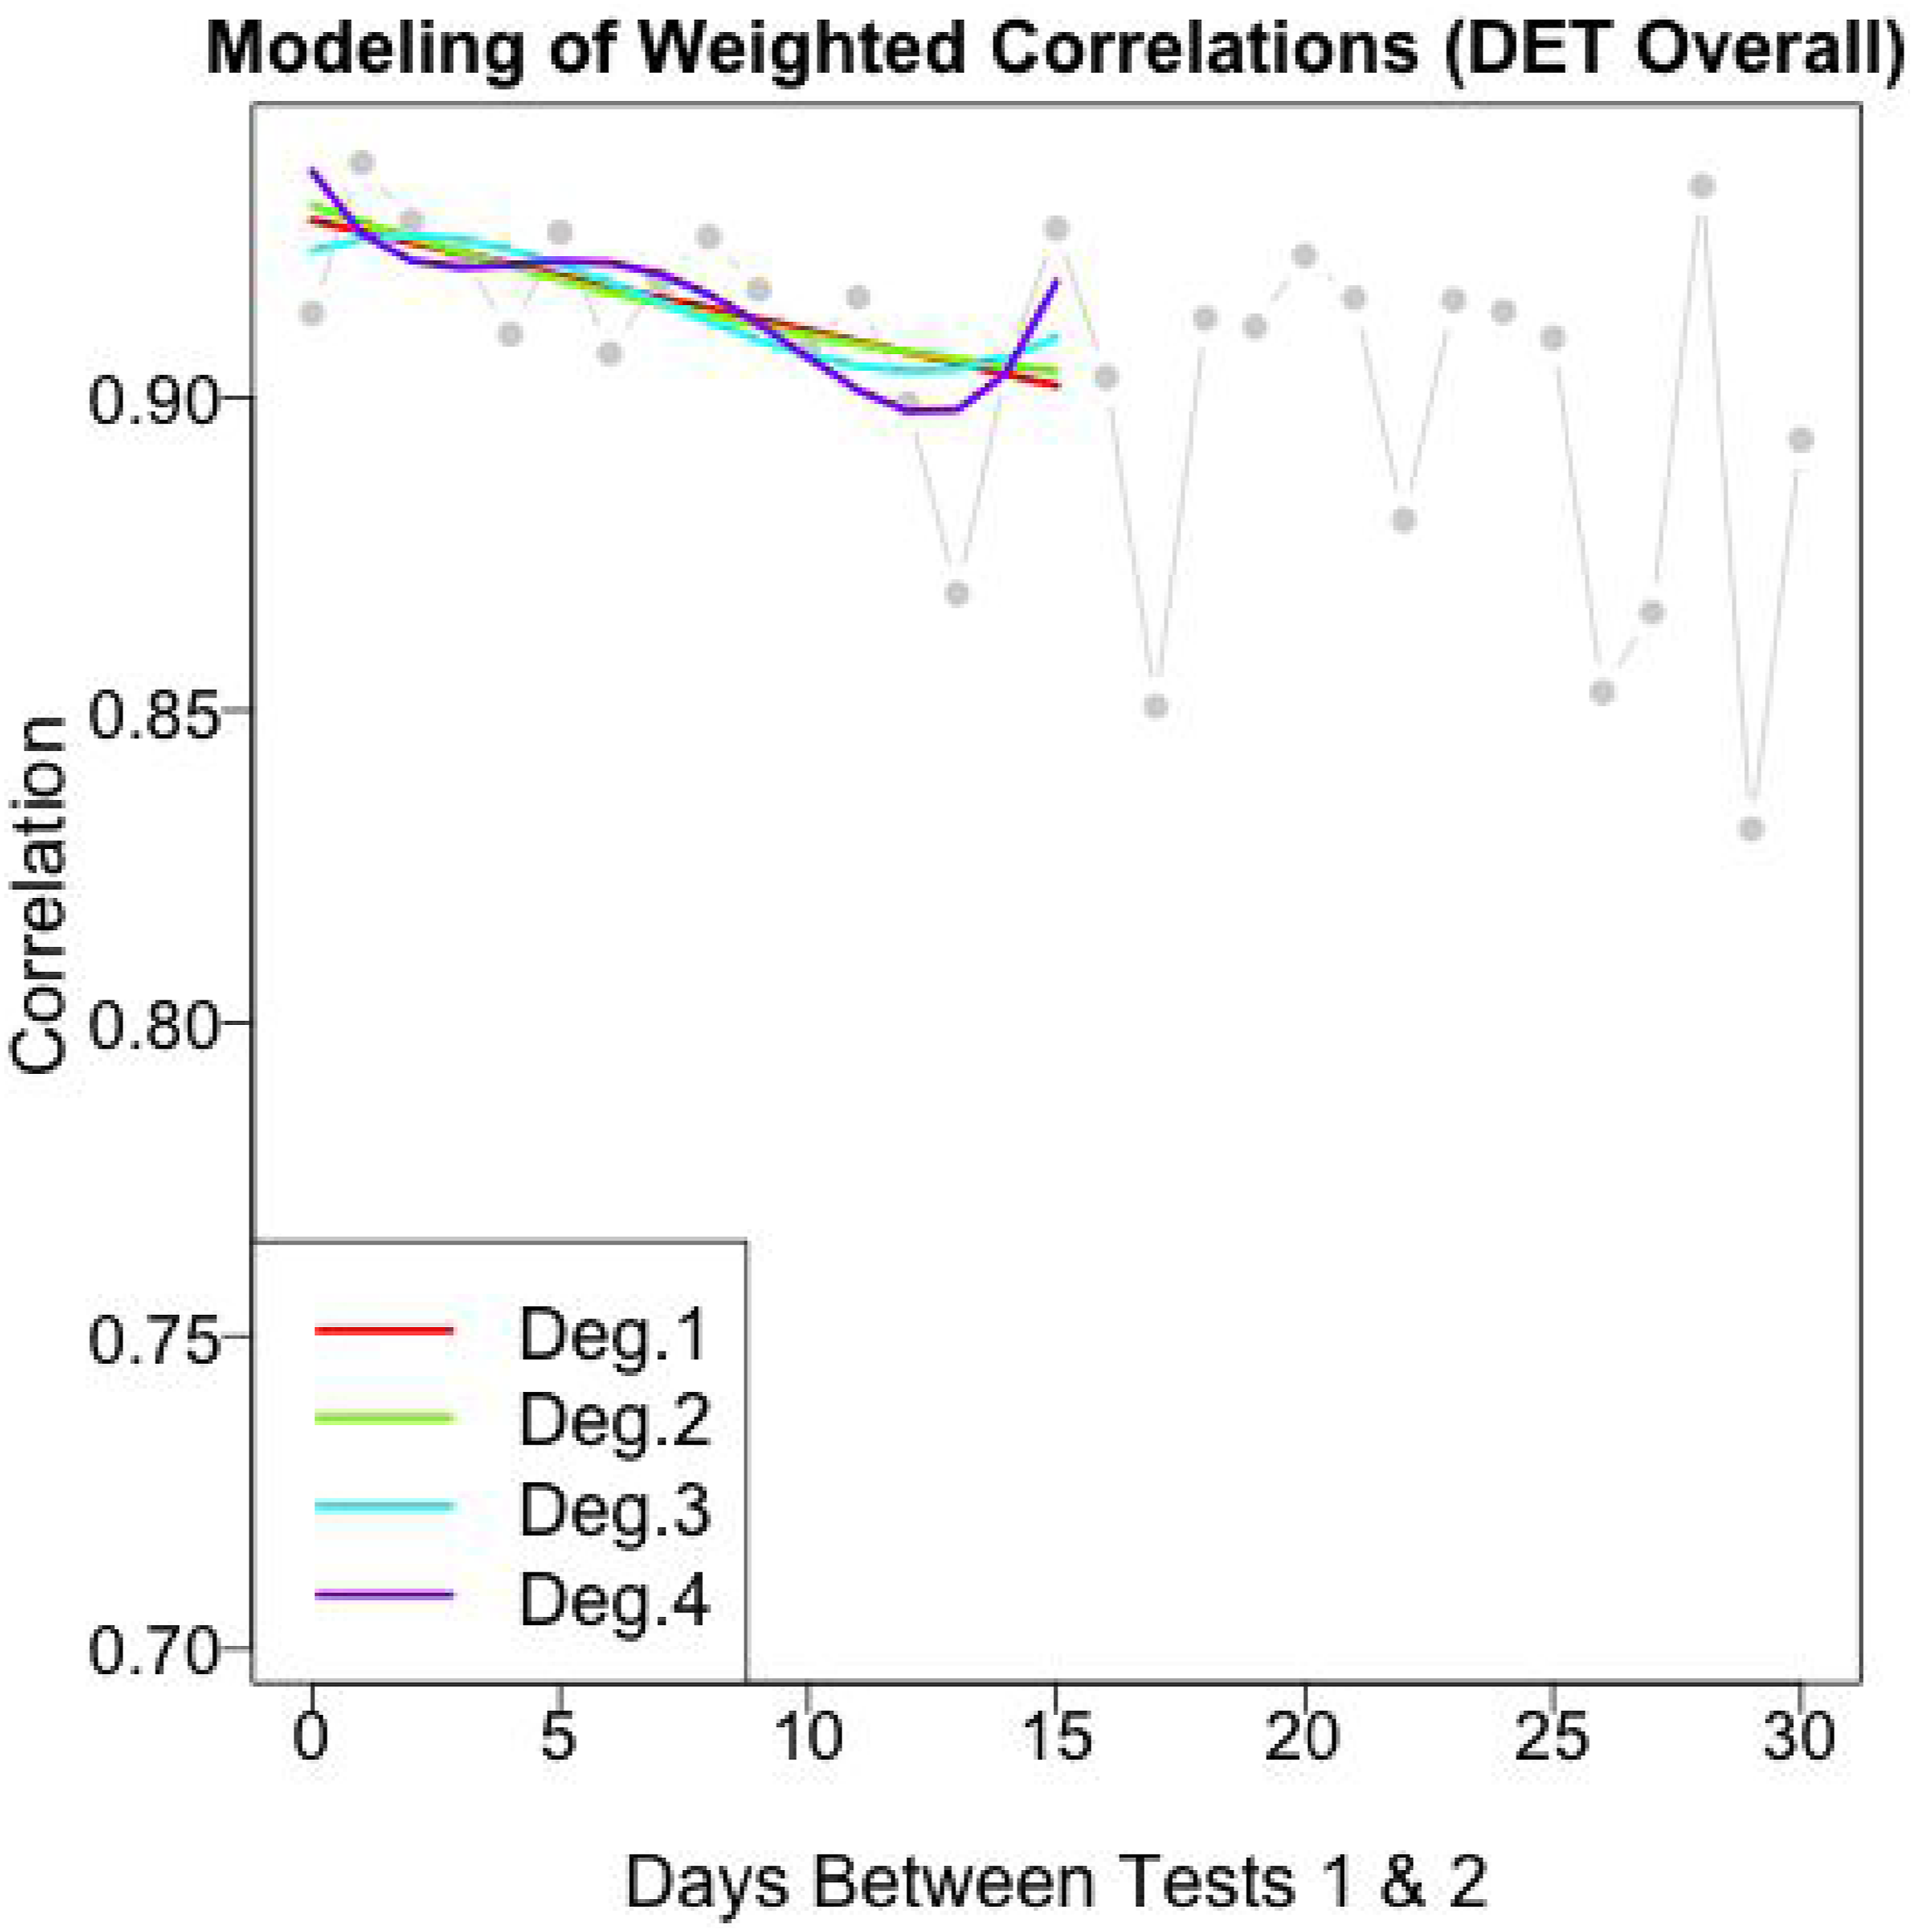
Results
Estimated test-retest reliabilities are summarized in Figure 8. For each of the five DET scores (the overall and four subscores), three estimates are provided: (a) the weighted test-retest correlation for the lag-0 repeater sample; (b) the model-averaged estimate using lags 0, 1, …, 15; and (c) the model-averaged estimate using lags 0, 1, …, 10 (as a sensitivity check). The vertical bars around each estimate are 95% confidence intervals based on standard errors estimated using 2500 independent bootstrap samples of test takers (Efron & Tibshirani, 1993) and applying the entire estimation procedure to each sample.
7
Confidence intervals of test-retest coefficients for DET overall and the four subscores (comprehension, conversation, literacy and production). Lag 0 refers to the weighted correlation of the lag-0 repeater sample. Lags 0–15 and Lags 0–10 refer to the model-averaged weighted correlations across the first 15 or 10 lags, respectively.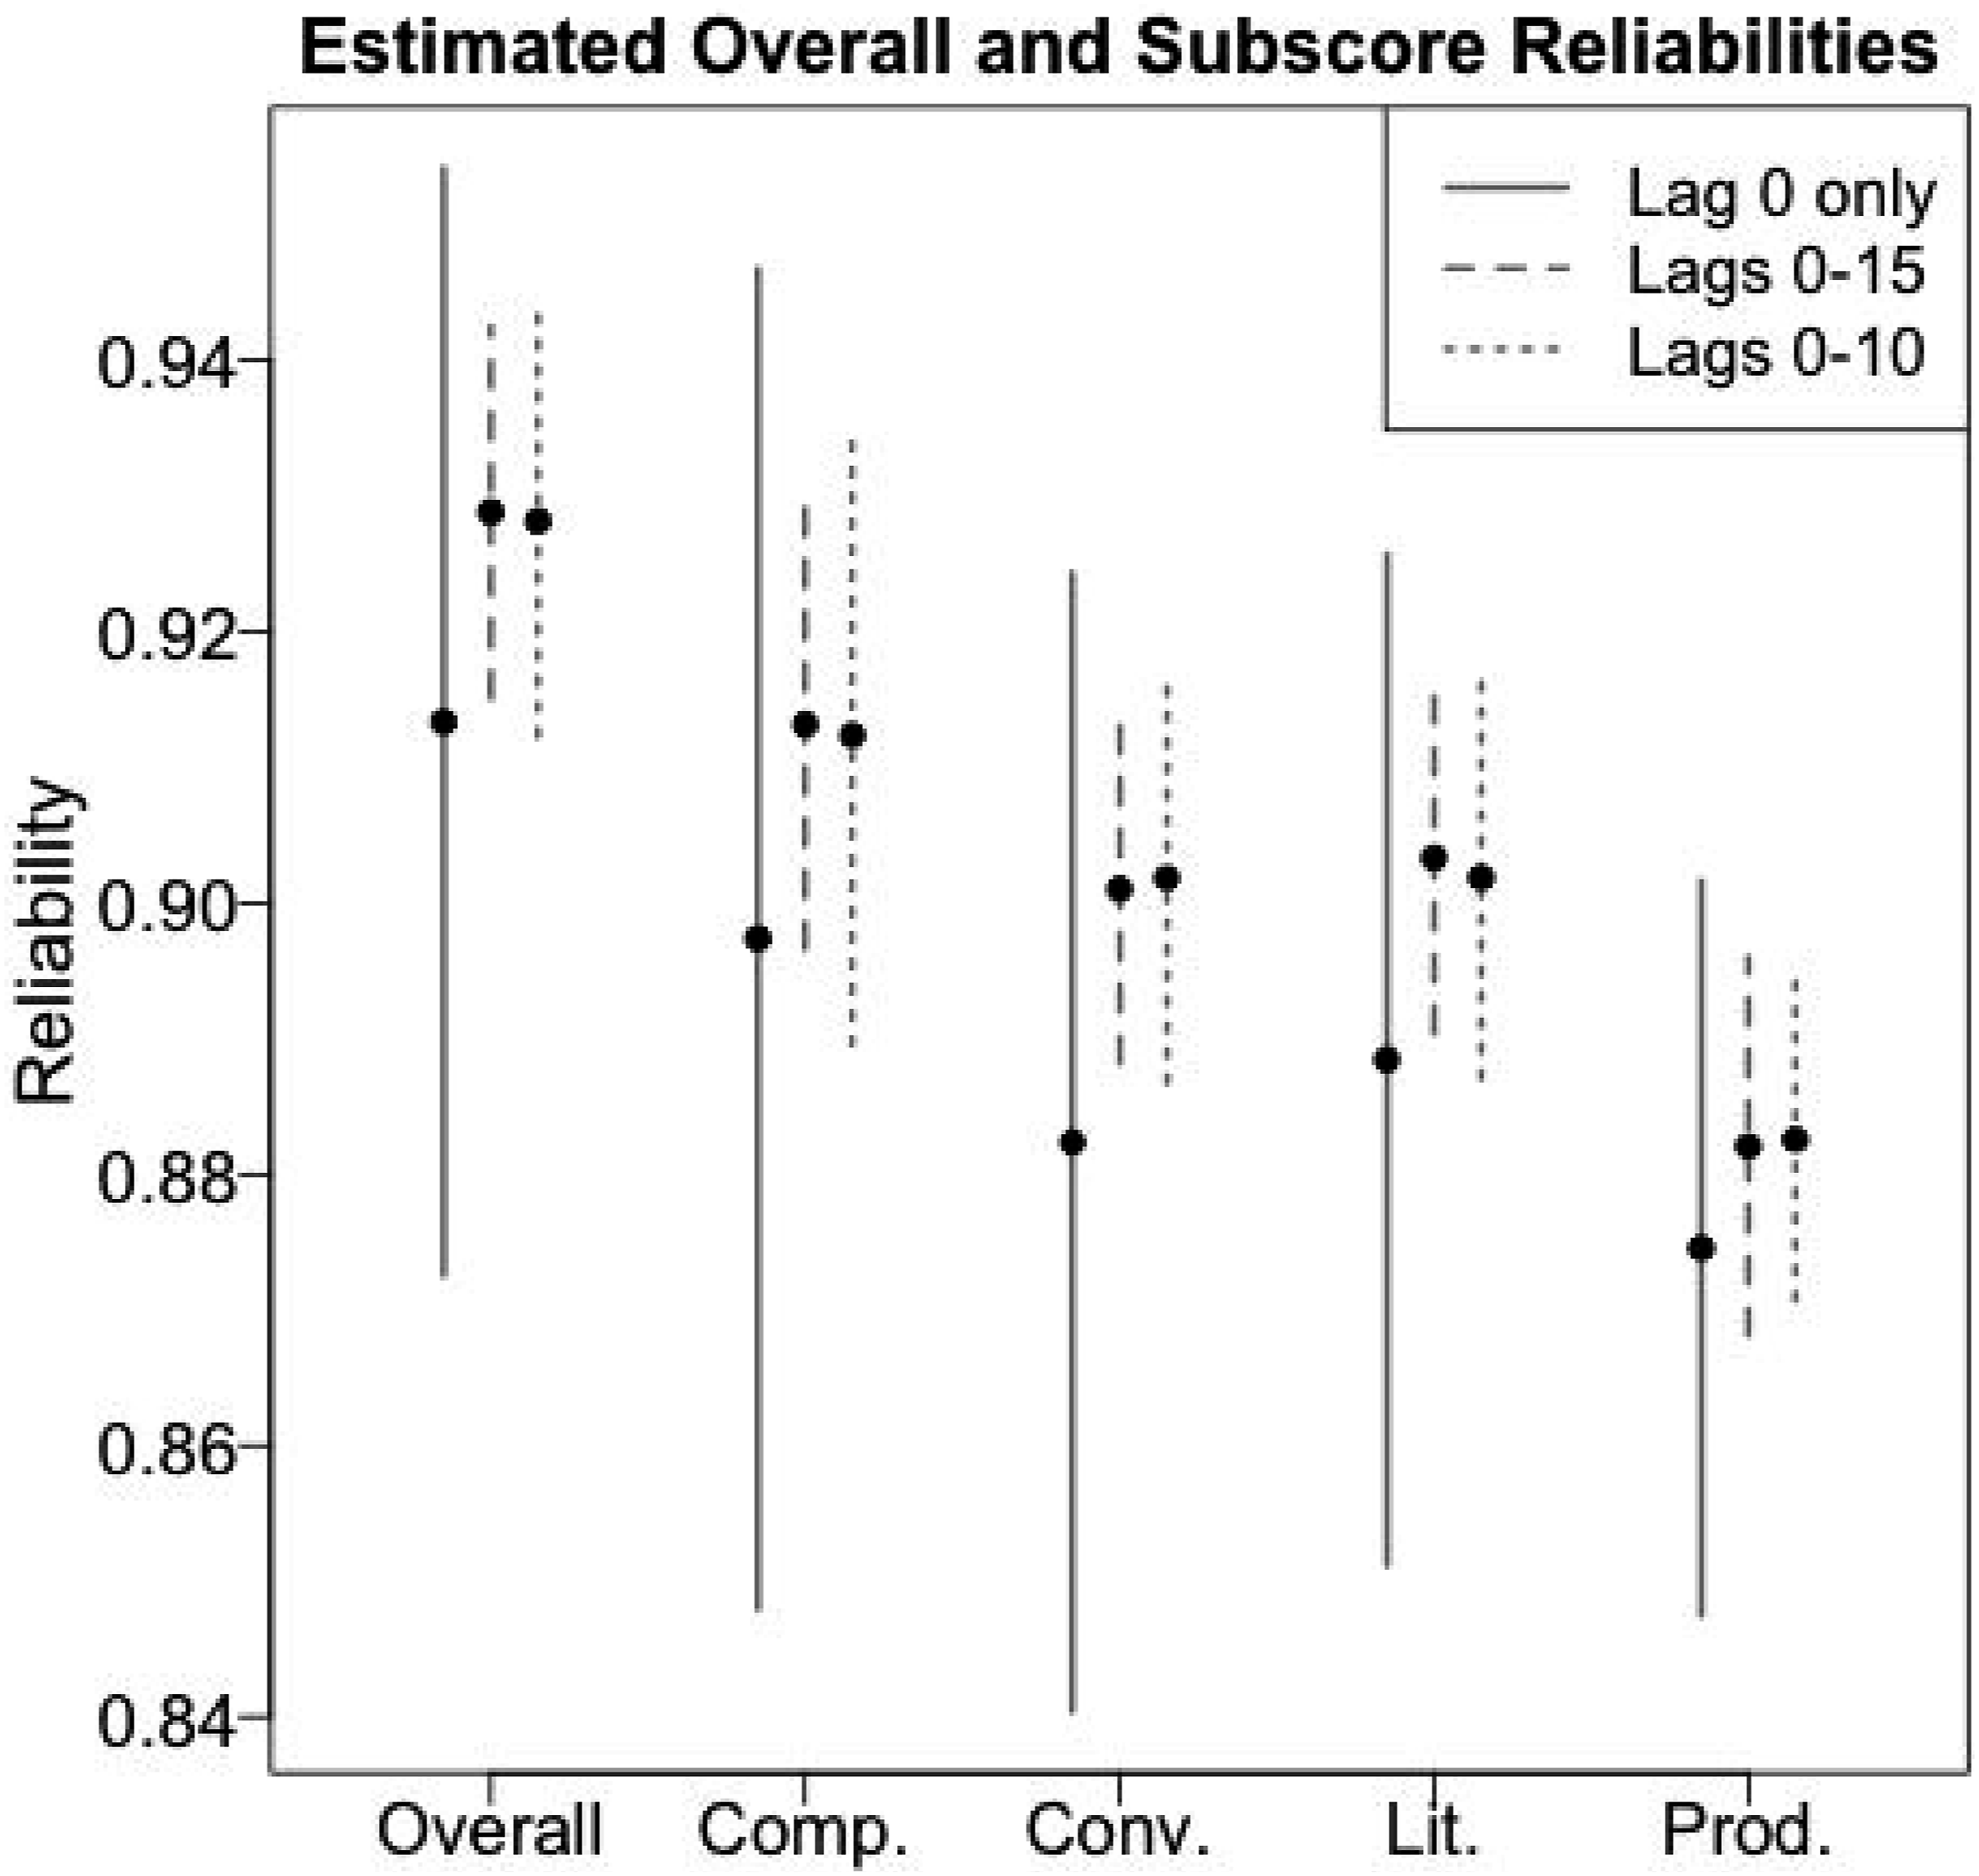
Consistent with previous discussion, the confidence intervals using only the weighted lag-0 repeater sample are relatively wide. Using regression models to pool data across multiple lag-d repeater samples substantially improves precision. Restricting the data used in these models to d ≤ 15 or d ≤ 10 has little impact on the estimated reliabilities. The fact that the regression-based estimates are higher than the estimates based only on lag-0 data is not necessarily evidence of bias of the former, as all scores are derived from the same seven component scores and thus have correlated estimation errors.
Sensitivity Analysis
The estimated reliabilities were robust to an application of the methods using different time scales to measure the lag between the first and second tests. For example, we could define “lag-0” repeaters to be those who took the second test 0 or 1 days after the first, “lag-1” repeaters to be those who took the second test 2 or 3 days after the first, etc. This measures the time between tests in two-day increments. We considered such aggregation of the data into d-day increments for d = 2, …, 10. We restricted the data to repeaters who took the second test within 60 days of the first for all of these analysis. This implies that the number of lags in the analysis depends on how many days are bundled into a single lag. For example, when defining time in two-day increments, the 60-day repeaters provide 30 lags of data, whereas when defining time in ten-day increments, they provide only 6 lags of data. To simplify the analysis and accommodate such small numbers of lags, we applied the BMA procedure to all conditions using only linear and quadratic models. For the DET overall score, the estimated reliability ranged from 0.92 to 0.93 as lags ranged from two-day increments up to ten-day increments, consistent with the values using one-day increments in Figure 8. Results for the subscores were similarly robust: estimates of 0.90 were obtained for both comprehension and conversation across two-day to ten-day increments, estimates of 0.89 were obtained for literacy, and estimates ranging from 0.87 to 0.88 were obtained for production.
Simulation
The empirical example suggests that the proposed methods can be useful for reducing bias and imprecision in estimated reliabilities. However, it is impossible to know whether these methods work as intended with empirical data alone. In this section we evaluate performance of the methods with simulated data.
Setup
We based key elements of the simulation on the empirical example to improve authenticity. Using notation from the Model Framework section (see Table 1), the following elements were fixed in the simulation: d (number of days between first- and second-time test scores), d ≤ dmax = 30 (maximum lag-d considered was 30), N (number of first-time test takers), N
d
(number of second-time test takers for each lag-d),
We then simulated N true scores,
Next, we simulated N first-time test scores,
The final step before applying the reliability estimation methods to the simulated data was to remove the (simulated) second-time test scores for cases in which the corresponding empirical test scores were absent. That is, the simulated data set included the same number of repeaters, in the same positions, at each lag d.
Results
Figure 9 presents weighted and unweighted test-retest correlations of the simulated data as well as the polynomial-fitted models. Notably, the EB/MDIA-adjusted correlations hover around the true test-retest correlations at each lag-d (ρ
d
= .9), whereas the unweighted correlations decline from .88 to .81. At lag-0, the weighted test-retest correlation On the left: unweighted, weighted, and true test-retest correlations for each lag-d simulated sample for d = 0, …, 30. On the right: polynomial regression models fitted to the weighted correlations of the lag-d simulated samples for d = 0, 1, …, 15.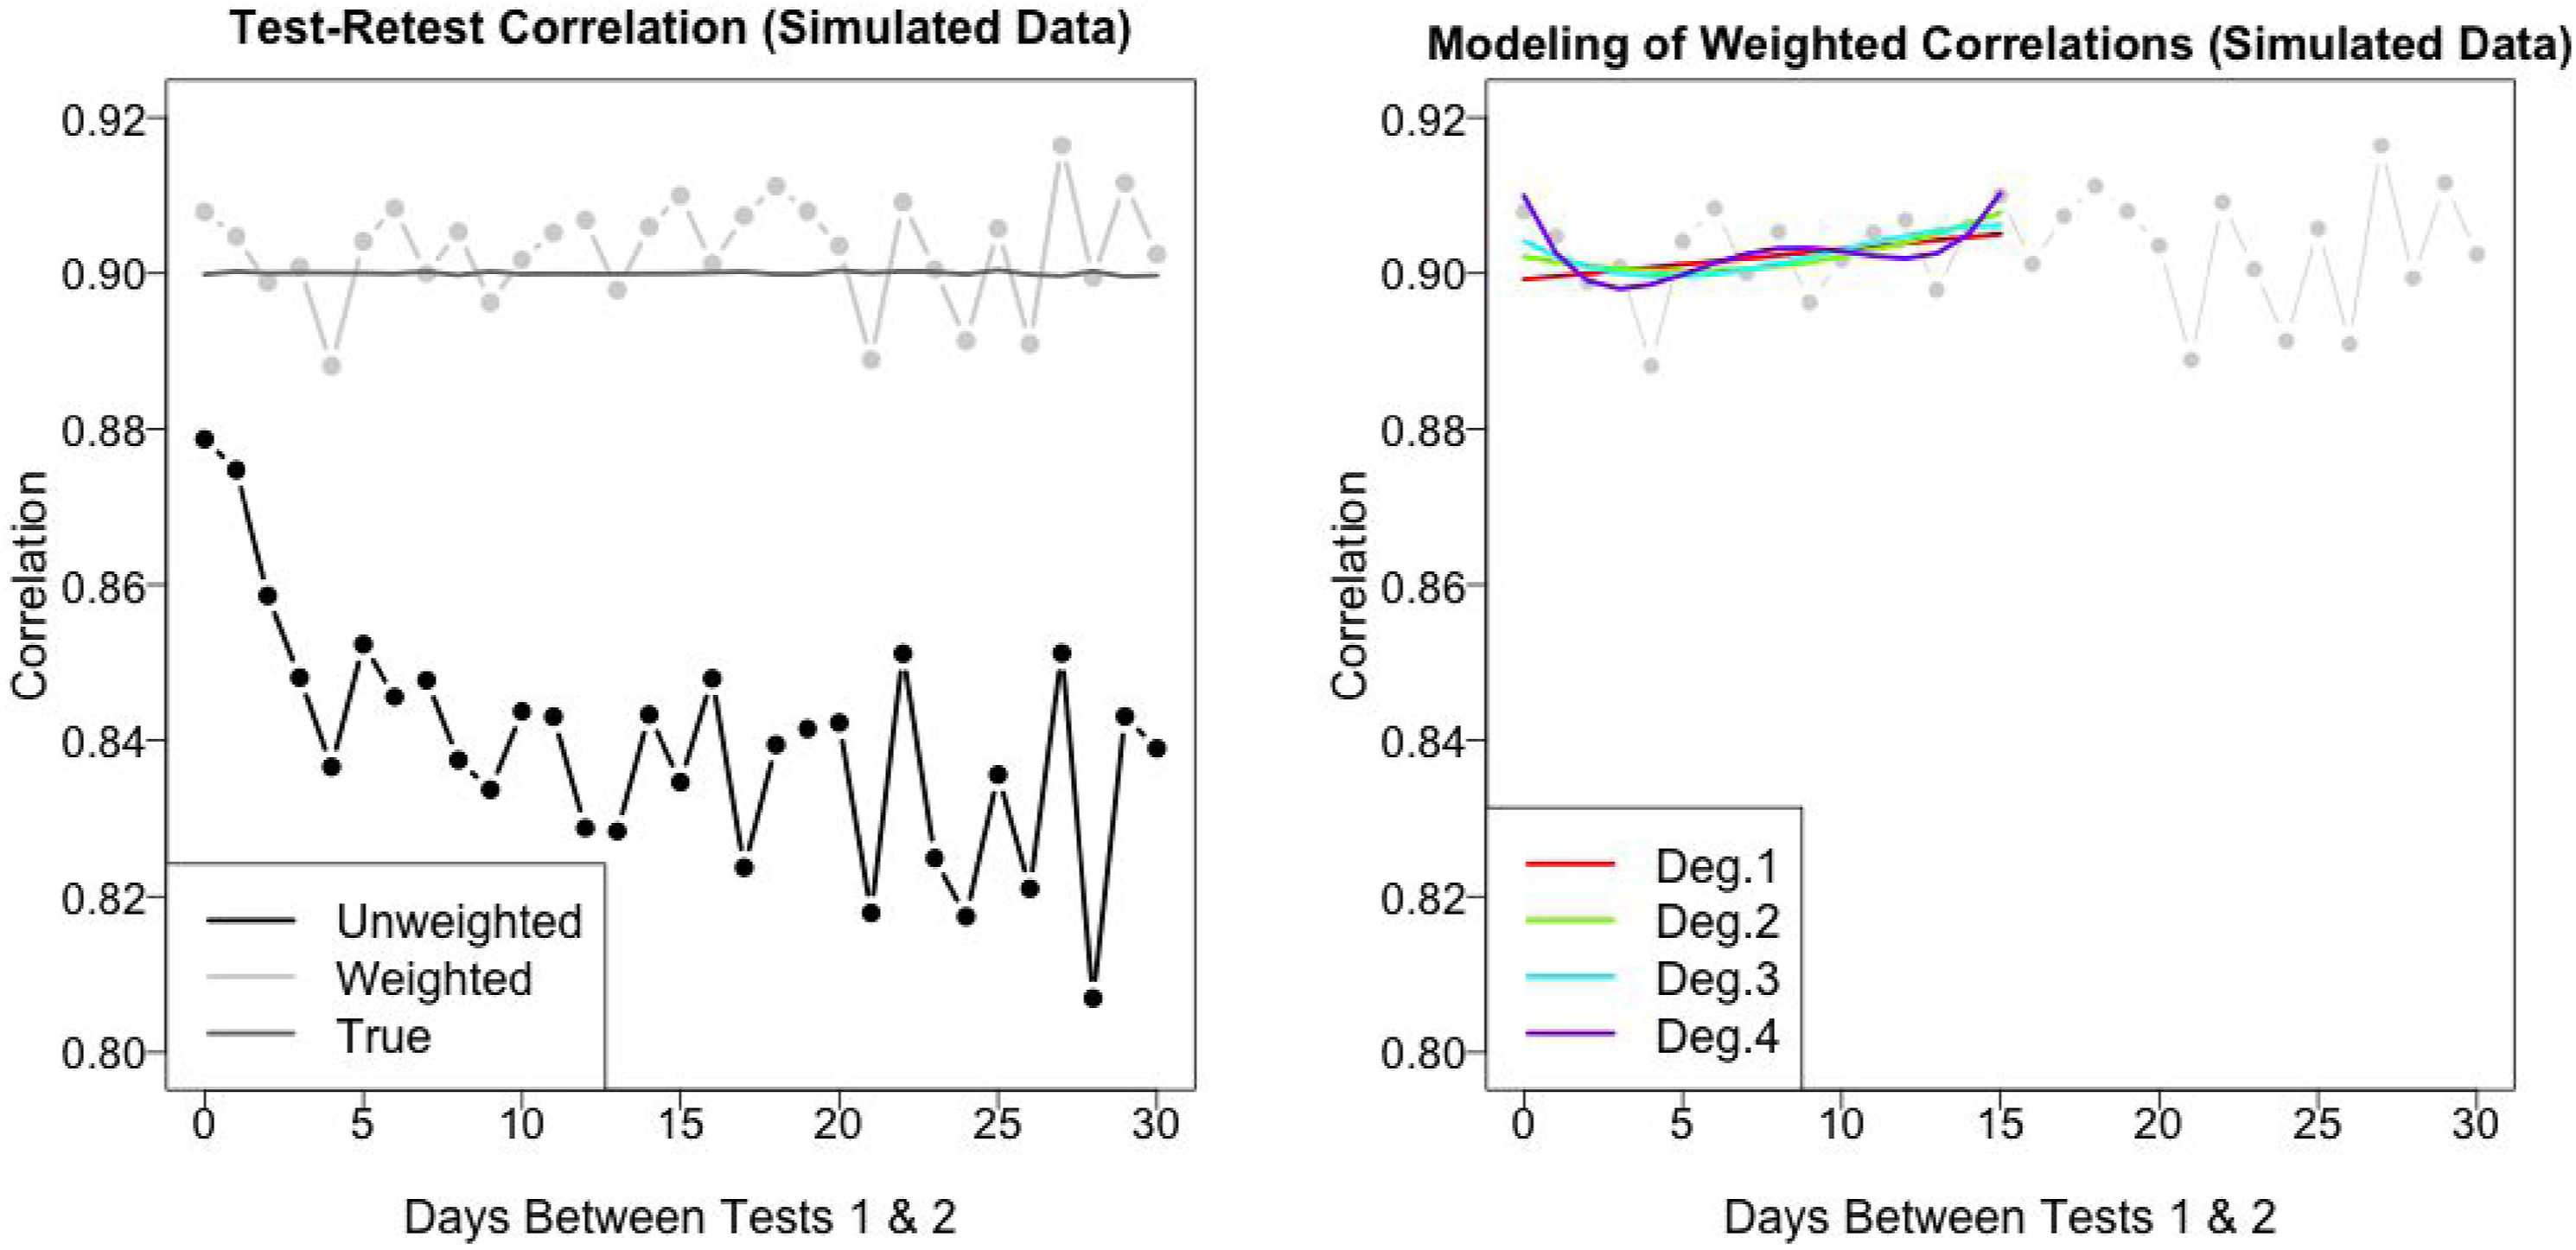
Discussion
The empirical analysis showed that test-retest correlations using 30-day repeater samples, with no adjustment for either sample selection or heterogeneous skill changes, appear to be negatively biased estimates of test-retest reliability. The unadjusted correlations for the five reported DET scores are all less than the least-favorable 95% confidence interval produced using our methods. This finding is consistent with the idea that adjusting repeater samples to account for sample selection and learning/practice dynamics can provide more realistic estimates of test-retest reliability. The reliability estimators proposed above provide one straightforward way for accomplishing this adjustment, a claim further supported by the simulated data analysis.
Choosing among the different reliability estimators presented in Figure 8 is less straightforward. Estimates based on the weighted lag-0 repeater samples are compelling, but the estimation errors are large enough to greatly limit their value. For the DET, however, we believe that the model-based estimates, which pool repeater data across multiple day-lags, provide more credible estimates given the available data and evidence.
Although our empirical example and simulation focused on scores from the DET, the proposed framework and reliability estimation methods generalize to any error-prone measure taken repeatedly over time for the same individuals, of whom choose whether and when to be assessed on a measure in which the true value may change over time. For instance, these methods could be applied to measures (e.g., blood pressure readings) that do not typically consist of aggregating information across discrete items and thus cannot use internal consistency (e.g., Cronbach’s alpha) or item response theory to estimate reliability.
Limitations
The ability of the proposed methods to produce accurate reliability estimates depends on the ability of the weighting step to properly account for selection bias. In our application to DET data, we used 34 test-taker background variables that were plausibly related to a test-taker’s decision to retest and when to retest. These variables were available through a combination of actively and passively collected data. However, other variables which were not collected and thus omitted from the weighting function could have affected our ability to recover the true target moments. Some uncollected variables were (1) test-takers’ perceptions of whether they could achieve a better score if they retook the test, (2) test-takers’ submission deadlines relative to their first test date, (3) average cut scores of test-takers’ target institutions relative to their first test score, and (4) test-takers’ socioeconomic status with respect to their ability to purchase another test credit. Without having access to these variables, among other unknown confounders, it is difficult to determine whether our approach accounted for all possible sources of omitted variable bias.
Another limitation of the paper is that we focused on one empirical application and a simulation analysis based on that same data. Additional applications and a more thorough simulation study would provide stronger evidence about possible benefits and pitfalls of the methods across settings. Some questions that could be evaluated include (1) What are the effects of omitted background variables on the recovery of suitable weights to match the observed moments to the target moments? (2) Does the magnitude of self-selection bias and learning/practice effects affect the ability of weighting to recover target moments? (3) How robust are inferences to alternative methods for computing weights, such as general calibration weighting from the survey sampling literature (Deville & Särndal, 1992), propensity score methods (Imai & Ratkovic, 2014; Rosenbaum & Rubin, 1983), and DEFF-minimizing weights (Zubizarreta, 2015)?
Conclusion
Given that the “need for precision [of measurement] increases as the consequences of decisions and interpretations grow in importance” (AERA, APA, and NCME, 2014), it is critical for high-stakes assessments to estimate test-retest reliability as accurately as possible. We believe the methods developed here, despite the aforementioned limitations, are a promising way to estimate reliability using observational data from test repeaters.
Footnotes
Declaration of Conflicting Interests
The author(s) declared the following potential conflicts of interest with respect to the research, authorship, and/or publication of this article: Both authors work at Duolingo on the Duolingo English Test.
Funding
The author(s) received no financial support for the research, authorship, and/or publication of this article.