
Abstract
The estimates of reliability are usually attenuated and deflated because the item–score correlation (
Keywords
Introduction—Attenuation and Deflation in Correlation and Reliability
The reliability of a test score variable has interested scholars for more than a century and for good reasons. Reliability serves four main purposes: it is used in estimating error in the score of an individual test taker, that is, in indicating the (overall) measurement error in the test score (Gulliksen, 1950), in assessing the (overall) quality of the measurement (e.g., Metsämuuronen, 2017), in correcting the attenuation of the estimates of regression or path models (e.g., Cole & Preacher, 2014), and in correcting the attenuation in correlations in validity studies and meta-analyses (e.g., Schmidt & Hunter, 2015). In all cases, we want to obtain as accurate estimate of reliability as possible.
Two terms related to correlation and reliability are worth highlighting here: attenuation and deflation. Usually, attenuation refers to underestimation as a natural consequence of random errors in the measurement, and deflation refers to underestimation caused by artificial systematic errors during the estimation (see the discussion of the terms in, e.g., Chan, 2008; Gadermann et al., 2012; Metsämuuronen, 2022a; Revelle & Condon, 2018). These are not always easy to separate from each other and, hence, both terms are used during the article. Although deflation may be closer the focus in this article, the term attenuation is mainly used. These concepts are connected to a new concept called here “mechanical error in estimates of correlation” (MEC), that is, a characteristic of estimators of correlation to underestimate the true correlation because of technical or mechanical reasons.
This article discusses, first, how the attenuation and deflation in correlation and in reliability are intertwined and exacerbated: attenuation and deflation in correlation are seen to be the reasons for the attenuation and deflation in reliability. Second, some conceptual and practical options are discussed about how to reduce the deflation in the estimates of reliability.
Attenuation, Deflation, Restriction in Range, and MEC in Correlation
Attenuation in correlation has been discussed for more than a century starting from Pearson (1903) and Spearman (1904). The phenomenon has been studied, specifically, by scholars working on restriction of range (RR; see the literature in Sackett & Yang, 2000; Sackett et al., 2007; Schmidt et al., 2008). RR is phenomenon that when only a portion of the range of values of the variable is actualized in the sample, such as when only the best performing students from the population apply to a very demanding study program causing that the variance in the entrance test is reduced remarkably, this leads to inaccuracy of the estimates used in prediction the performance (see illustrations of different patterns of RR in Sackett & Yang, 2000). Another area where the attenuation of correlation is considered in detail are validity studies and meta-analytic studies (see literature in, e.g., Schmidt & Hunter, 2015; Schmidt et al., 2008). Many options to correct attenuation have been offered, specifically, related to concurrent validity of the scores (see a typology and history in Sackett & Yang, 2000; Sackett et al., 2007; see also Schmidt et al., 2008).
Deflation or inaccuracy in the estimates of correlation has been noticed in several simulations (see, e.g., in Martin, 1973, 1978; Metsämuuronen, 2021a, 2022b; Olson, 1980). Even if there is no traditional manifestation of RR in a test, the product-moment correlation coefficient itself (PMC; Pearson, 1896) is deflated because PMC is very vulnerable to several sources of MEC (see Metsämuuronen, 2021a, 2022b). It is known that PMC cannot reach the ultimate perfect correlation unless the variables have equal number of categories (see algebraic reasons in, e.g., Metsämuuronen, 2017); this is the technical reason for attenuation. This obvious attenuation or deflation is simple to observe if we have two identical continuous variables which are truncated such that one is dichotomized (g) and the other is polytomized (X). The magnitude of the estimates of the correlation between these different manifestations of the same variable by PMC cannot reach the obvious (latent) perfect correlation but, instead, the highest value depends on several factors even without RR. Some of these sources of MEC are well-known such as the number of categories in g and X and the cut-off where the dichotomization and polytomization has been made (see simulations, e.g., in Metsämuuronen, 2020a, 2022b).
Attenuation and deflation in correlation has a strict relevance in measurement modeling settings where the dimensions of items (g) and score (X) differ from each other in an obvious manner. Specifically, Schmidt and Hunter (1999) have pointed out that we should try to embed corrections of attenuation as part of our estimations of measurement error. This is an understandable and relevant point because the obvious attenuation in PMC has a strict and remarkable effect on the estimates of reliability. This is illustrated later by empirical examples. Although the issue has been known for tens of years, and some solutions have been offered for the practical use, the conceptualization of MEC in the measurement models is somewhat undeveloped (see an attempt in Supplement Appendix 1). This article aims to illustrate the effect of attenuation and deflation in the estimators of reliability and to offer some practical solutions for the problem.
Attenuation and Deflation in Reliability
Brown (1910) and Spearman (1910) may be the first scholars to connect attenuation of the estimates of correlation with the estimates of reliability—although in an opposite way to the interest in this article. Originally, the first estimator of reliability, Brown–Spearman parallel reliability coefficient (BS; of the reasoning for the unconventional order of the inventors, see Cho & Chun, 2018), was invented to get a better approximation of correlation in the case of “faulty data” (see also Guttman, 1945). In this article, the viewpoint is flipped: the flaws in correlation coefficient are, factually, the elementary reason for the mechanical underestimation in reliability. Although flipping the viewpoint, we note Brown’s and Spearman’s remarkable role in initiating the discussion of measurement error and reliability as we have today.
Another important scholar in the history pointing to the mechanical error in the estimates of reliability was Louis Guttman whose seminal study of different lower bounds of reliability (Guttman, 1945) is still valid: the true population reliability is always higher than the observed reliability by the coefficient we know today as coefficient alpha (α; chronology, Guttman, 1945; Jackson & Ferguson, 1941; Kuder & Richardson, 1937) or Cronbach’s alpha (Cronbach, 1951). Novick and Lewis (1967) continued Guttman’s work and showed that underestimation is caused by deviation of the (essential) tau-equivalency: if all items have (essentially) identical true value (tau), alpha will not underestimate reliability (see the discussion also in Raykov & Marcoulides, 2017).
Since Guttman (1945) and Novick and Lewis (1967), numerous studies have handled the underestimation in reliability and, specifically, in α. Attenuation in α has been connected to a simplified assumption of the classical test theory including violations in tau–equivalence, unidimensionality, and uncorrelated errors (e.g., Green & Yang, 2009; Trizano-Hermosilla & Alvarado, 2016). Among others, Gadermann et al. (2012), Metsämuuronen (2017, 2020a, 2021a, 2022b), Zumbo et al. (2007) have discussed a different type of reason for the underestimation in reliability: technical underestimation of correlation by PMC discussed above.
Notably, PMC is embedded in most of the widely used estimators of reliability. PMC in the form of item–score correlation
(Lord et al., 1968) where PMC is visible.
PMC is embedded in such estimators as Armor’s theta (
(e.g., Cheng et al., 2012). Relation of
Attenuation and Deflation in Reliability in Practical Testing Settings
The consequence of the attenuation in
The first example comes from Metsämuuronen and Ukkola (2019). They used a very easy sub-test of preconditions in mother language at the beginning of the first year in school as a part of a National level assessment of learning outcomes (n = 7770); 72% of the test takers got the highest possible score in 8-item, 11-point screening test for basic skills of understanding auditive instructions. The magnitude of the estimate by coefficient alpha was α = 0.25 and by maximal reliability
The obvious reason for the remarkably higher estimate by
Research Question
Seeking the most accurate estimate of reliability is important for all four main uses of reliability discussed above. Attenuation and deflation in reliability is technical and caused, mainly, by the mechanical error in
While there are some MEC-corrected estimators available based on changing the whole estimator of correlation (see Gadermann et al., 2012; Metsämuuronen, 2020b, 2021a, 2021b, 2022a; Zumbo et al., 2007; some are discussed below), this article studies the option of a relevant attenuation correction for
Attenuation- and Other Deflation-Corrected Estimators of Reliability
In what follows, estimators of reliability based on MEC-corrected measurement model (see Supplement Appendix 1) are divided into two categories as discussed above. Estimators based on replacing
Selected MEC-Corrected Estimators of Reliability as Benchmarks
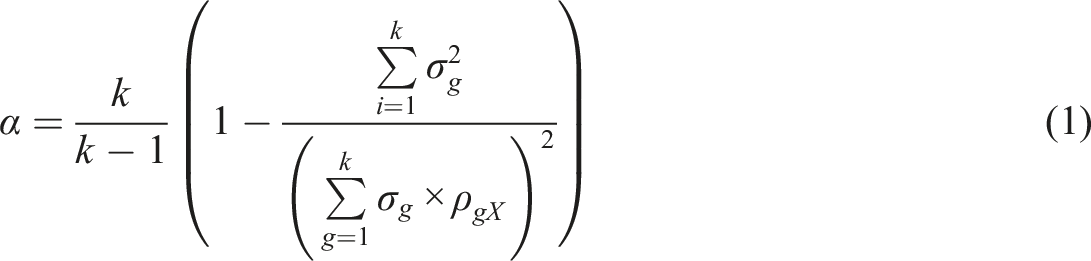
Metsämuuronen (2021a, 2022a, 2022b), specifically, discuss using the formula (1) as a basis of estimating MEC-corrected alpha where the error-causing
Let us denote a general weight factor between an item g
i
and the latent variable θ by w
i
. If we apply the estimator based on alpha (equation (1)), select the raw score (X) as the manifestation of θ, and vary w
i
, a theoretical form of MCERs based on the formula of alpha is
Attenuation-Corrected Correlation as a Substitute of
in the Estimators of Reliability
Specific types of DCERs are obtained if, in the estimators, PMC is replaced by an attenuation-corrected PMC. Attenuation in correlation have been studied since the dawn of estimators as discussed above. The well-known corrections based on works of Pearson (1903 with notes by Aitken, 1934 and Lawley, 1943) and Thorndike (1949) are based on correcting attenuation when restriction occurs in one variable, that is, in the score variable. This kind of attenuation correction is used, specifically, when selecting personnel or students based either directly or indirectly (that is, as a part of some other criteria) on their performance in a test. The idea is to enhance the concurrent validity of the test score of this restricted sample by altering it either by knowing or modeling the behavior of unrestricted population variance (see the mechanics in, e.g., Sackett & Yang, 2000; Schmidt et al., 2008). These approaches to attenuation correction do not seem usable in item analysis settings. Hence, another logic is proposed as an option for measurement modeling settings.
To propose another type of attenuation correction, we recall that the correlation between an item and a score given the dataset cannot exceed the limit specified by the observed responses in the item and the score. Namely, given the score and the observed response pattern in the item, the score variance

R AC proposed here is not restricted to measurement modeling settings; g and X refer to general variables with a narrower and wider scale, respectively. Calculation of R AC is illustrated later with numerical examples.
Attenuation-Corrected Estimators of Reliability
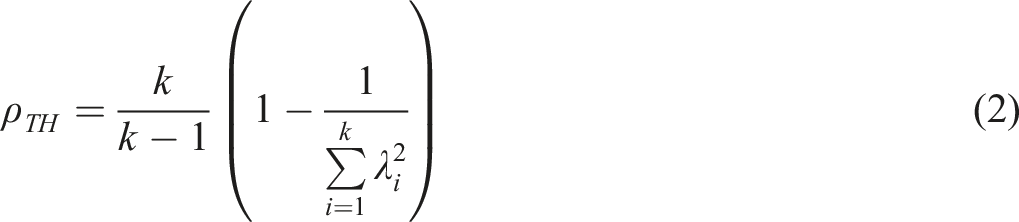
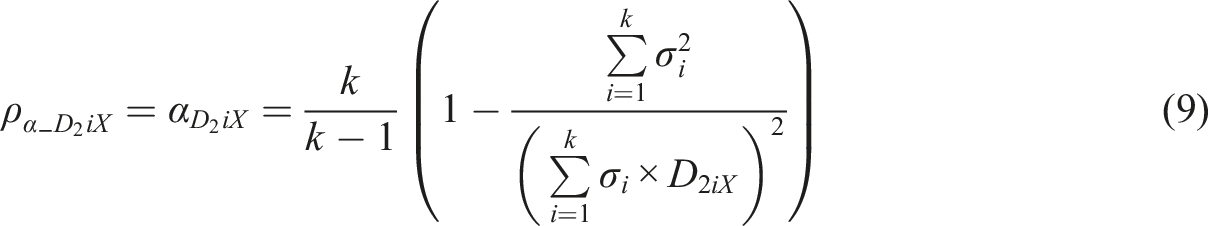
If we apply the estimators (1), (2), (3), and (4), and we use R
AC
as the manifestation of the linking element w
i
, but we do not fix the manifestation of θ, we get (a theoretical) attenuation-corrected alpha.
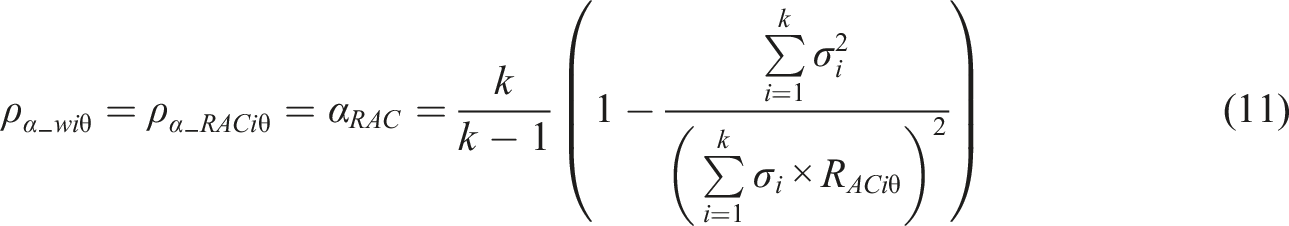
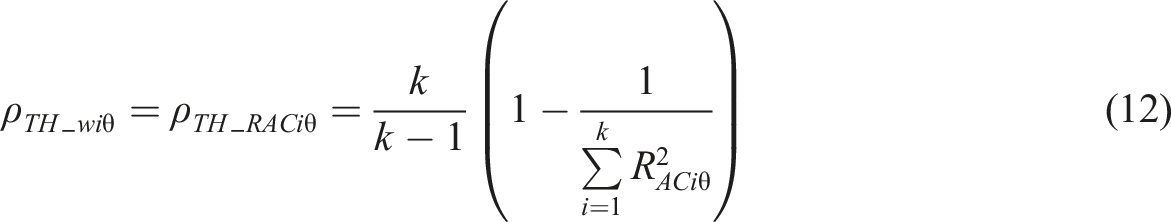
attenuation-corrected theta
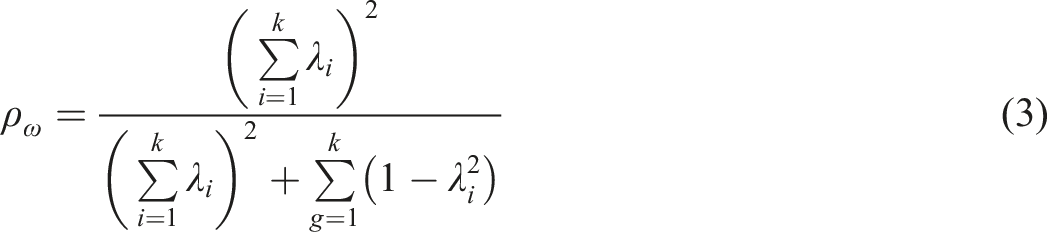
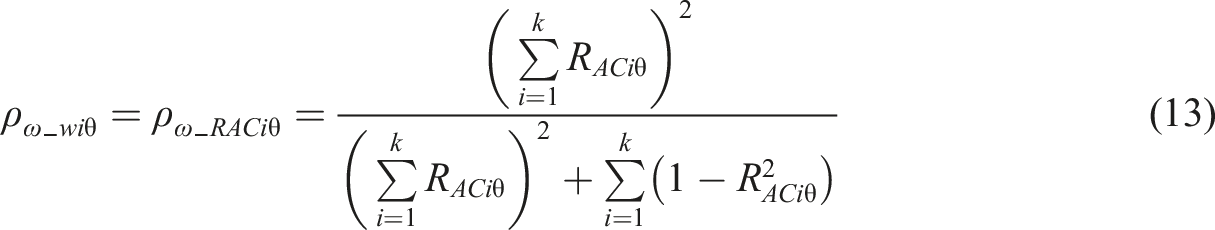
attenuation-corrected omega
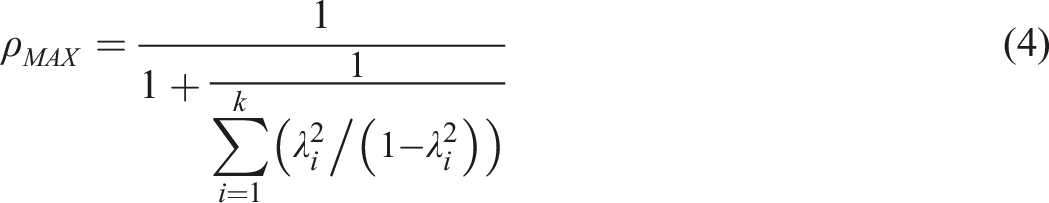
and attenuation-corrected
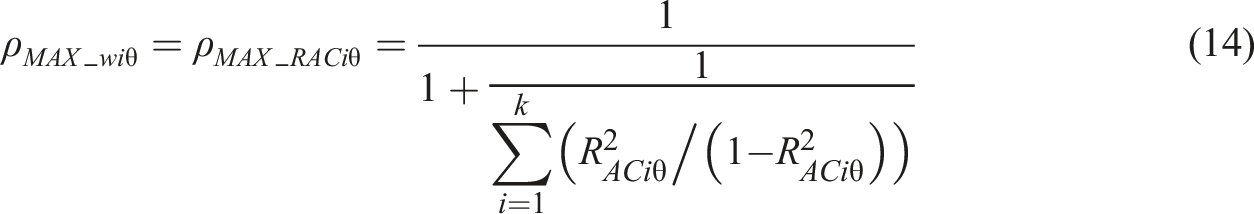
Using the estimators (2), (3), and (4) outside of their original context is, obviously, debatable; here a stand is taken that they could be used as stand-alone estimators even without their original contexts related to principal component- and factor analysis. Alternatively, the estimators (12), (13), and (14) may be taken as outputs of renewed procedures in the factor- and principal component analysis where λ i is an attenuation-corrected loading. In all cases, the magnitude of the attenuation-corrected correlation is higher than the observed loading and, consequently, the attenuation-corrected reliability is expected to be higher than the reliability obtained by using traditional estimator.
If we apply equation (10) to estimators (11) to (14), we get ACERs based on R
AC
. In the extreme cases where all items can discriminate the test takers in a deterministic manner, that is, in the case of R
ACi
= R
ACj
= 1, the ACERs based on the forms of theta (equation (12)) and omega (equation (13)) would lead to perfect reliability irrespective of item variances:
Numerical Examples of Attenuation-Corrected Correlation and Reliability
Two hypothetical numerical examples illustrate how attenuation correction (10) affects reliability when applied in different estimators: Case 1 represents tests with extreme difficulty level causing radical attenuation in reliability; this case is comparable with the real-life case by Metsämuuronen and Ukkola (2019) discussed above. Case 2 represents tests with incremental difficulty levels in items comparable with the traditions in the achievement testing. The examples are created to highlight the differences between the traditional estimator and the ACERs. Third example comes by a larger simulation of 1440 real-life datasets.
The numerical tables and in-depth discussion in seen in Supplement Appendix 2. Here, only the outlines of the results are discussed. Obviously, in-depth studies are needed to confirm the behavior of the used estimators in real-world datasets as well as in the controlled situations.
Case 1: A Test of Extreme Difficulty Level
Assume a hypothetical dataset of five items with 0–2 points (Tables A1a–A1c in Supplement Appendix 2). This could be a screening test of understanding instructions where all native speakers are expected to get full marks while second language speakers or those with some learning difficulty may make some mistakes in the test items.
Four points highlighted from Case 1 are relevant also later in Case 2. First, using equation (1), the traditional coefficient alpha underestimates the reliability in an obvious manner:
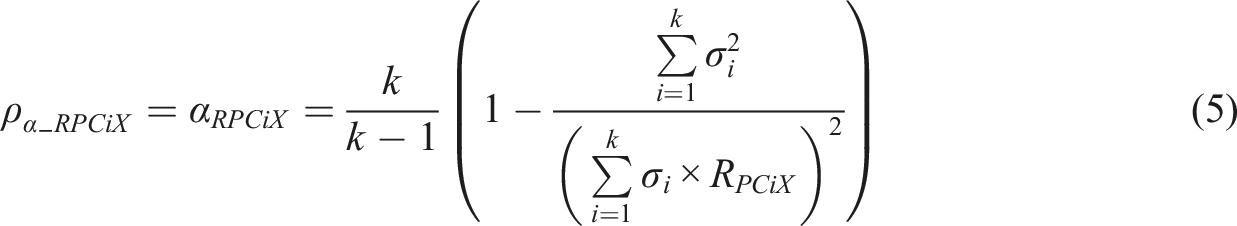
Second, because some of the MCERs based on changing the entire coefficient have concrete interpretations, their estimates may be valuable benchmarks to the deflation in the traditional alpha. The estimator based on R
PC
(equation (5)) gives the estimate
Third, that the magnitude of the estimates by
Fourth, to outline, because
Case 2: Incrementally Structured Dataset
Assume a hypothetical dataset as in Tables A2a–A2c (Supplement Appendix 2) of five items with 0 –2 points with incremental difficulty level of items. This could be a short-ish sub-test of “Algebra” as a part of a longer achievement test of mathematics.
Basically, the main result is the same as in Case 1: reliability estimated by the traditional coefficient alpha (
Case 3. Larger Simulation of the Behavior of RAC and Attenuation-Corrected Estimator of Reliability
A real-life dataset of 4022 nationally representative test-takers of a mathematics test with 30 binary items (FINEEC, 2018) is used as the “population” in simulation of the behavior of R AC and ACERs in the real-life testing settings. The characteristic of the dataset is discussed in Supplement Appendix 2. The dataset of individual items including several indicators of item–score association is available at http://dx.doi.org/10.13140/RG.2.2.17594.72641. The dataset of reliabilities is available at http://dx.doi.org/10.13140/RG.2.2.27971.94241. The main results of the simulation are collected in what follows.
First note to make is that, with very small sample size (n = 25), both Rit and R AC seem to tend to underestimate the population correlation in an obvious manner although R AC less than Rit (Figure A1 in Supplement Appendix 2). Second, except the smallest sample size in the simulation, the R AC in the samples tends to be overestimate the R AC in population mildly with small sample sizes and when the scale in the item is wide. This is understood by the fact that, with small sample sizes, the probability to obtain near-deterministic patterns leading to high magnitudes of R AC is higher than in the (larger) population. With items with a narrow scale (df(g) < 4) and with sample sizes around n = 100 or higher, the possible overestimation is nominal (see Table A3 in Supplement Appendix 2).
Third, in the simulation dataset, the average estimates of reliability by DCERs are 0.04–0.07 units of reliability higher than those by the traditional estimators using their traditional linking factor and score variable (Table A4 in Supplement Appendix 2). This follows strictly from the fact that magnitude of the estimates by R AC and R PC tend to be higher than of those by Rit. That the difference in the magnitude of the estimates in the simulation by the traditional estimators and DCERs is not as dramatic as in Cases 1 and 2 is caused by the fact that the tests in simulation do not allow to prepare tests of extreme difficulty. In the simulation, obtaining tests with extreme difficulty level would have required very short tests using only items with extreme difficulty levels.
Fourth, the estimates using R
AC
and R
PC
tend to give estimates with largely the same magnitude (see Figure 1; Figure A2 in Supplement Appendix 2) and systematically higher than those by the traditional estimators. This seems to refer to the phenomenon that both DCERs refer to the same latent reliability which is underestimated around 5–8 % by the traditional estimators regardless of the difficulty level of the test items. It seems that, with extreme datasets, the magnitude of the estimates by R
AC
are mildly higher than those by R
PC
. This difference is nominal though. Simulation of more extreme datasets would shed more light in this matter. Average estimates of reliability by selected DCERs by the test difficulty.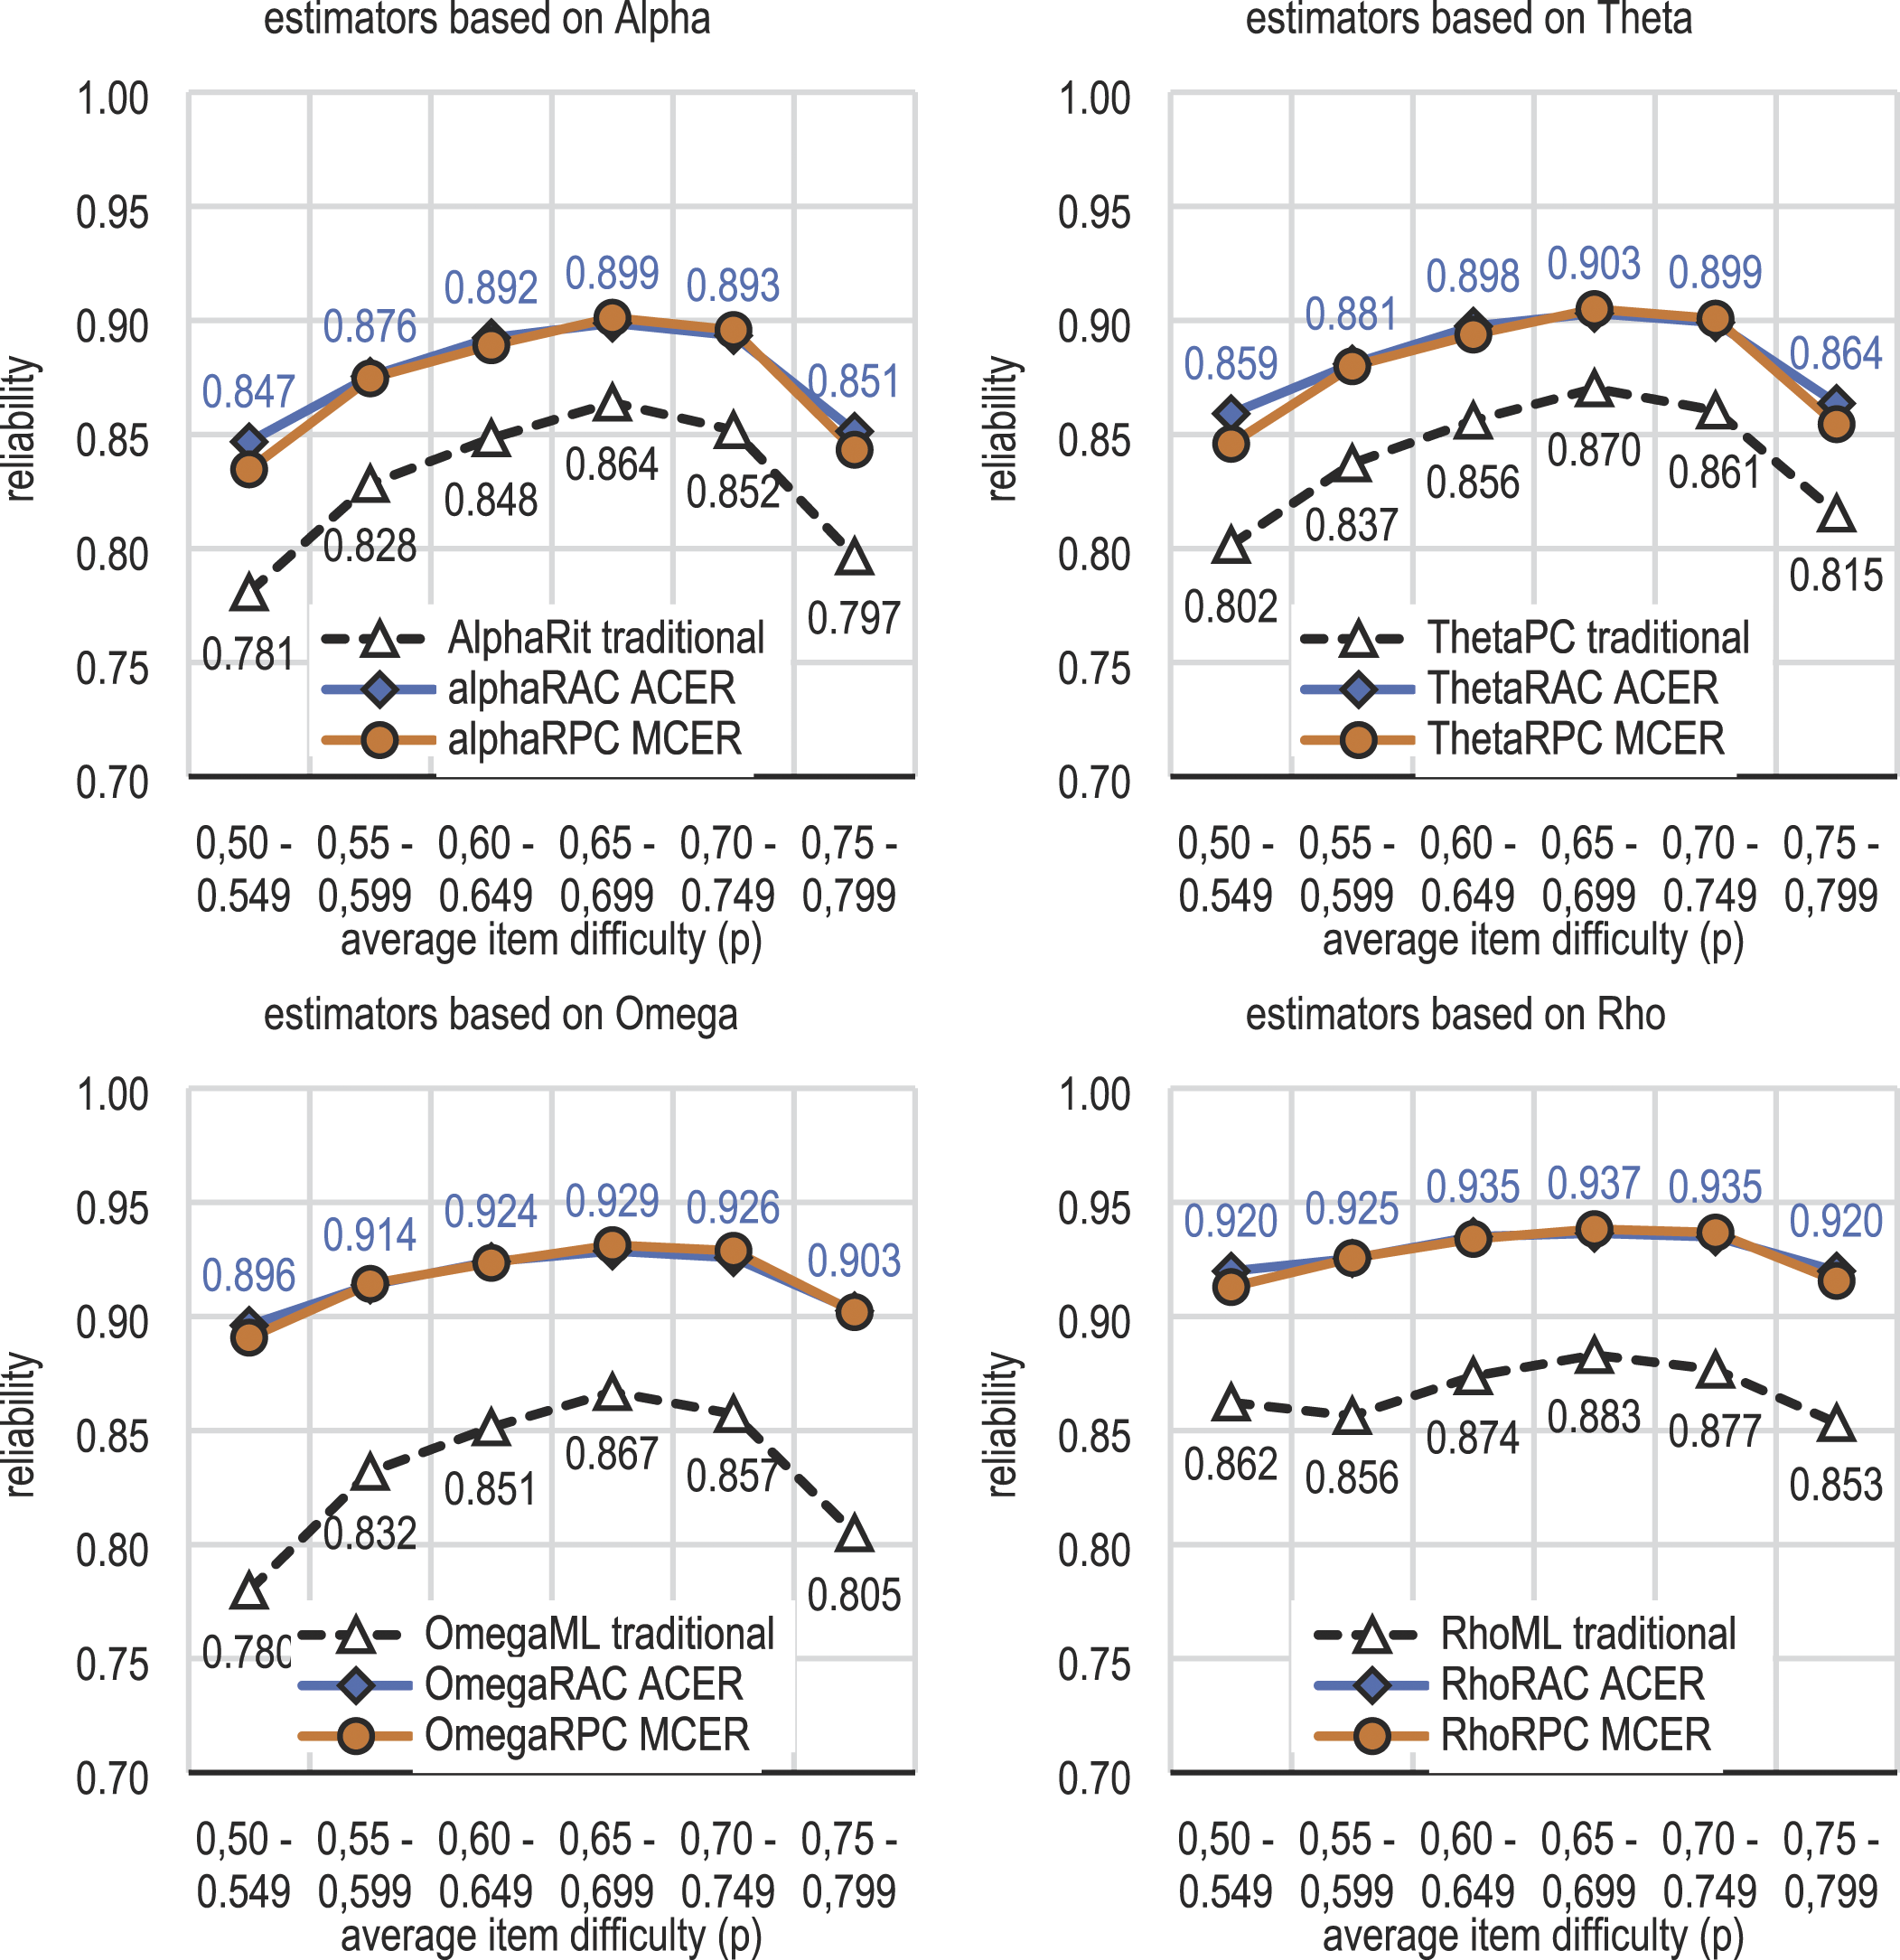
Fifth, when it comes to the difference between the sample and population estimates, except the smallest sample size, the ACERs give stable estimates; the differences between the sample and population estimates are subtle. As an example, when using alpha as the base and R AC as the linking factor, the deviance between the sample and population estimates is, on average, 0.001–0.003 units of reliability depending on sample size (Table A5 in Supplement Appendix 2). If the sample size is n = 200 (or higher), difference is less than 0.001 units of reliability.
Sixth, because of mild overestimation of population R AC , the ACERs seem to give mild overestimation of the population reliability, specifically, with small sample sizes, polytomous items, and if using rho as the base (Figure A3 in Supplement Appendix 2). The last is expected because rho alone is known to give overestimations with finite sample sizes (Aquirre-Urreta et al., 2019; see also Supplement Figure 3); R AC and rho combined seems to lead to greater overestimation than the other combinations. From this viewpoint, the MCERs based on alpha, theta or omega and using R PC as the linking factor tend to lead to more conservative estimates. However, from the factual estimate viewpoint, R AC and R PC seem to lead largely to estimates of same magnitude (see Figure 1 above).
Seventh, regardless of the width of the scale in the items, the estimates by ACERs seem to bring us nearer the population value than the other estimators except if rho would be selected as the base (Figure A4 in Supplement Appendix 2). When the scale is very wide (more than seven categories), ACERs tend to overestimate reliability mildly, but the values are still nearer the population value in comparison with traditional estimators and MCERs in comparison. Using rho as the base for ACER is not recommendable because of tendency to produce overestimates with finite samples.
Conclusion of Numerical Examples
As a conclusion from Cases 1, 2, and 3, it is known that, first, the proposed R AC and ACERs using R AC as the linking factor may be advantageous in reflecting the true reliability, specifically, when the test includes item with extreme difficulty levels. These types of tests are common in educational settings where the tests are often constructed so that both very easy and very demanding items are included in a test. In these cases, the traditional item–score correlation may be radically attenuated and deflated while R AC gives a plausible alternative to quantify the true association between the item and score variable. Second, a larger simulation based on a real-world dataset suggests that R AC gives estimates that are nearer the population value than PMC with small sample sizes although it seems to overestimate mildly the population R AC when the number of categories in the item exceeds 5. Simulations in this regard would be beneficial. All in all, the larger simulation (Case 3) did not include very extreme datasets. Simulation with datasets of extreme difficulty levels would be beneficial.
Notably, the advance of ACERs in estimating the standard error of the measurement (S.E.m) may be notable in the datasets where the item difficulties are extreme leading to an ultimately non-normal score (see Case 1 above). Supplement Appendix 3 shows an example of a comparison of estimates of S.E.m by using traditional estimators and ACERs. It is seen that, because of technical reasons, a magnitude of a rough general estimate of the measurement error may decrease by 36% or more if we use a deflation-corrected alpha instead of the traditional alpha. It seems that, in comparison with other types of DCERs, ACERs combined with R AC give conservative estimate in the case of tests with extreme item difficulty (see Metsämuuronen, 2022a). In any case, selecting wisely estimators of reliability that produce estimates being nearer the true reliability value may give us a notable advance in assessing the accuracy of the test scores.
All in all, ACERs discussed in this article are part of a larger family of deflation-corrected estimators of reliability. Comparing different weight factors used in these estimators as well as comparing ACERs with other DCERs (see Metsämuuronen, 2022a), would be beneficial in finding the best combinations of the base and the weight factor. For instance, some estimators may be more usable or recommendable with binary items and some with polytomous items. Systematic comparisons of different estimators and weight factors in different conditions such as varying the test length, test difficulty, sample sizes, item types, and distributions of the latent variables would be beneficial.
Conclusions and Limitations
Main Results in a Nutshell
The intention in the article was to illustrate the phenomenon of attenuation and deflation in the estimates of reliability and to offer some practical solutions for the problem. The root reason for the attenuation in reliability is the item–score correlation embedded in most of the traditional and widely used estimators of reliability. Because the estimates of correlation by PMC between items and the test score are always attenuated and deflated, this causes attenuation in the estimates of reliability when using the traditional estimators such as coefficient alpha, theta, omega, and maximal reliability. Examples show that, in the extreme cases, the estimates by alpha may be radically deflated to the extent of 0.40–0.50 units of reliability and, in real life-settings, even more than 0.60 units of reliability (see Gadermann et al., 2012; Metsämuuronen & Ukkola, 2019). As a specific solution for the attenuation in the reliability, a new kind of attenuation correction is proposed to replace PMC in the formulas: the attenuation-corrected PMC (R AC ) as the proportion of observed correlation of the maximal possible correlation with the given variables. Although the numerical examples in the article were given in the context of measurement modeling, R AC is not restricted to settings related to items and score variable.
Simulations suggest that R AC could be a useful coefficient to describe the association between two variables with scales with a notable difference in width: RAC strictly refers to the proportion we obtain of the maximal possible correlation with the given dataset. However, if the sample size is small (n < 200), the proportion may be mildly smaller in the population. This is caused by the fact that the probability to obtain deterministic or near-deterministic patterns in a small sample is much higher than in a large population. Deterministic and near-deterministic patterns lead to values R AC ≈1 which are rarely obtained with large sample sizes and wider populations.
The characteristics of the R
AC
were not studied in the article in-depth; some limits are discussed here. R
AC
reaches the value 1 when the maximum possible value of PMC is achieved, that is, when the item and the score are in the same order. Value 0 is obtained when the observed correlation is 0. R
AC
can also reach negative values; because the maximum possible value is always positive the value of R
AC
is negative when the observed PMC is negative. Hence, R
AC
reaches the limits of correlation
After the R
AC
s are calculated, when applied to different base-forms of reliability, attenuation-corrected alpha (
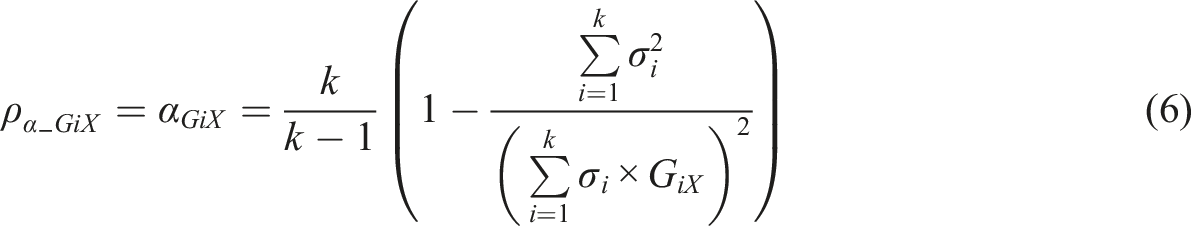
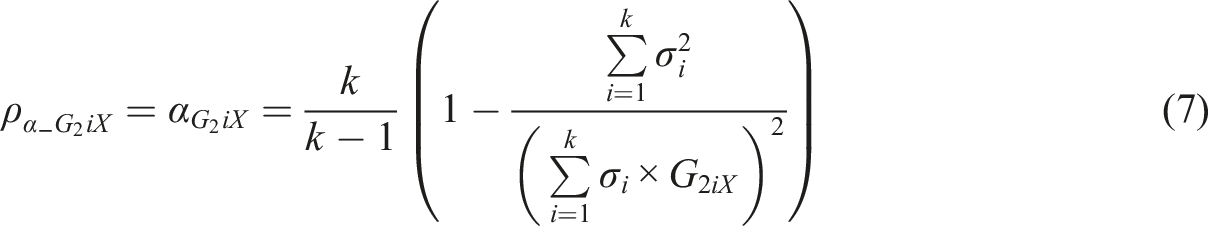
Of the initiated ACERs, attenuation-corrected alpha seems to give conservative estimates of the reliability in the case of tests with extreme difficulty level. However, with the tests of incrementally structured difficulty level, the magnitude seems to be at the same level of magnitude as with MEC-corrected estimates of reliability based on R
PC
, G and G2. Because
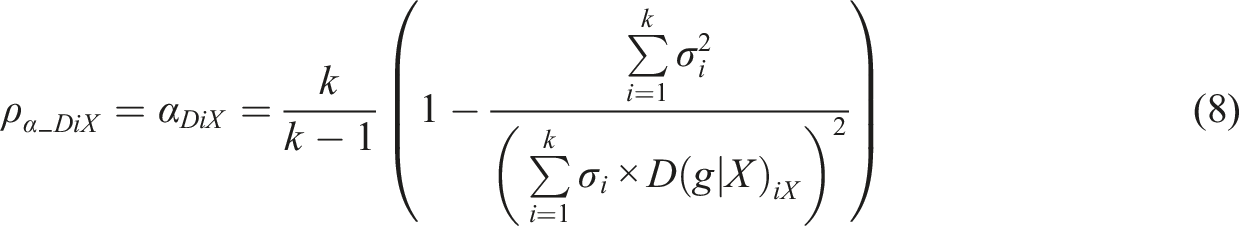
Known Limitations of the Study
The study did not discuss varying interpretations and limitations of different coefficients. However, it is known that the estimators based on G and D have concrete interpretations in reflecting the proportion of logically ordered test takers in the dataset (see Metsämuuronen, 2021b). It is also known that estimators based on R PC do not refer to the observed score but something unreachable and theoretical (see the discussion in Chalmers, 2017). However, as an indicator of theoretical maximum correlation, R PC could be used as a benchmark to R AC . From this viewpoint, the ACERs (11), (12), (13), and (14) seem to lead us to more practical interpretations of the observed score than those using R PC . Using the latter estimators outside of their original context of principal component- and factor analysis may be debatable though; here, it was assumed that the formulas of theta, omega, and rho could be used also as stand-alone estimators without their original contexts.
The study did not tackle the question of possible overestimation of reliability if using attenuation- and MEC-corrected estimators of reliability. However, as a benchmark, if we think that R PC do not overestimate the true correlation, it may be relevant to conclude that a MEC-corrected estimator based on R PC such as equation (5) would not overestimate reliability. A relevant question is, what would be the mechanism for overestimation in attenuation-corrected estimator? From this viewpoint, we recall the results by Aquirre-Urreta et al. (2019) that maximal reliability may overestimate the true reliability with finite samples familiar in real-world testing settings. Hence, DCERs based on rho, in general, may tend to overestimate the population reliability with small and smallish sample sizes. Theoretical and empirical studies in the area would be beneficial.
All in all, this article intended to promote discussion of attenuation in reliability and to offer possible practical solutions in the spirit of Schmidt and Hunter (1999) who suggested incorporating the knowledge from attenuation studies to the estimation of measurement error. The closer we can reach the deflation-free estimates of reliability the more accurately we can evaluate the overall quality of the measurement, describe the error in the test scores, correct the estimates in regression and path modeling as well as correct the attenuation in the validity studies and meta-analysis. Hopefully, the attenuation correction in correlation and ACERs proposed in this article are found useful in this endeavor.
Supplemental Material
Supplemental Material - Attenuation-Corrected Estimators of Reliability
Supplemental Material for Attenuation-Corrected Estimators of Reliability by Jari Metsämuuronen in Applied Psychological Measurement
Footnotes
Declaration of Conflicting Interests
The author(s) declared no potential conflicts of interest with respect to the research, authorship, and/or publication of this article.
Funding
The author(s) received no financial support for the research, authorship, and/or publication of this article.
Supplemental Material
Supplemental material for this article is available online.
References
Supplementary Material
Please find the following supplemental material available below.
For Open Access articles published under a Creative Commons License, all supplemental material carries the same license as the article it is associated with.
For non-Open Access articles published, all supplemental material carries a non-exclusive license, and permission requests for re-use of supplemental material or any part of supplemental material shall be sent directly to the copyright owner as specified in the copyright notice associated with the article.