
Abstract
Reliability is usually estimated for a total score, but it can also be estimated for item scores. Item-score reliability can be useful to assess the repeatability of an individual item score in a group. Three methods to estimate item-score reliability are discussed, known as method MS, method
Keywords
Introduction
This article discusses the practical usefulness of item-score reliability. Usually, reliability of test scores rather than item scores is considered, because test scores and not individual item scores are used to assess an individual’s ability or trait level. The test score is constructed of item scores, meaning that all the items in a test contribute to the test-score reliability. Therefore, individual item-score reliability may be relevant when constructing a test, because an item having low reliability may not contribute much to the test-score reliability and may be a candidate for removal from the test. Item-score reliability (Wanous, Reichers, & Hudy, 1997, cited 2000+ times in Google Scholar, retrieved on July 27, 2017) is used in applied psychology to assess one-item measures for job satisfaction (Gonzalez-Mulé, Carter, & Mount, 2017; Harter, Schmidt, & Hayes, 2002; Nagy, 2002; Robertson & Kee, 2017; Saari & Judge, 2004; Zapf, Vogt, Seifert, Mertini, & Isic, 1999) and burnout level (Dolan et al., 2014). Item-score reliability is also used in health research for measuring, for example, quality of life (Stewart, Hays, & Ware, 1988; Yohannes, Willgoss, Dodd, Fatoye, & Webb, 2010) and psychosocial stress (Littman, White, Satia, Bowen, & Kristal, 2006), and one-item measures have been assessed in marketing research for measuring ad and brand attitude (Bergkvist & Rossiter, 2007). However, the psychometric theory of item-score reliability appears not to be well developed, and because of this and its rather widespread practical use, we think item-score reliability deserves further study.
Currently, instead of item-score reliability researchers use several other item indices to assess item quality, for example, the item-rest correlation (Nunnally, 1978, p. 281), also known as the corrected item-total correlation, the item-factor loading (Harman, 1976, p. 15), the item-scalability coefficient (Mokken, 1971, pp. 151-152), and the item-discrimination parameter (Baker & Kim, 2004, p. 4). Although useful, these indices are not specifically related to the item-score reliability. Therefore, we also investigated the relation between these item indices and item-score reliability in empirical-data sets.
Let
Little is known about the item-score reliability values one can expect to find in empirical data and which values should be considered acceptable for an item to be included in a test. We estimated MS,
This article is organized as follows: First, we discuss item-score reliability methods MS, λ6, and CA, and the item-rest correlation, the item-factor loading, the item scalability, and the item discrimination. Second, the different sets of empirical data for which the seven item indices were estimated are discussed. Third, we discuss the results and their implications for the practical use of the three item-score reliability methods.
Method
Item-Score Reliability Methods
The following definitions (Lord & Novick, 1968, p. 61) were used. In the population, test score X has variance
Using the definition of parallel tests, test-score reliability is defined as the product-moment correlation between test scores X and

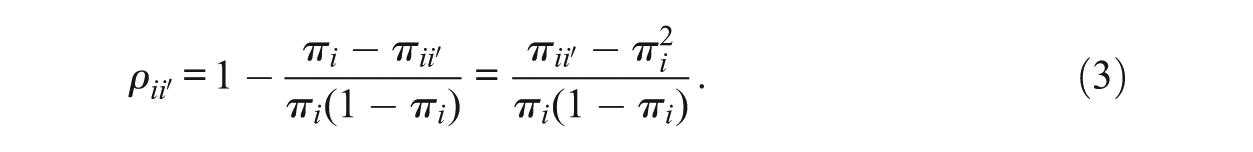
Considering Equation (1) for an item score produces the item-score reliability, defined as

The two terms on the right-hand side of Equation (2) each contain an unknown. We briefly discuss three methods to approximate item-score reliability based on one test administration. Approximations to Equation (1) are all lower bounds, meaning they have a negative discrepancy relative to reliability (Sijtsma & Van der Ark, 2015). For Equation (2) the situation is less obvious. Method λ6 appears to be a strict lower bound, but for methods MS and CA in some situations positive bias cannot be ruled out and more research is needed (Zijlmans et al., 2017). If the item response functions coincide, method MS equals the item-score reliability (Zijlmans et al., 2017); and for method CA particular choices, not to be outlined here, lead to the conclusion that items must be essentially
Method MS
Let
One estimates proportion
Let

Next,

We refer to Mokken (1971, pp. 142-147) for the choice of the constants a, b, and c. His Method 1 uses only one neighbor item to item i and his Method 2 uses both neighbor items. Let

Equation (6) contains only observable quantities and can be used to approximate item-score reliability in Equation (3) for items that adhere to the double monotonicity model. Sijtsma and Molenaar (1987) proposed method MS as an alternative to Mokken’s Methods 1 and 2 to obtain statistically better estimates of test-score reliability, Molenaar and Sijtsma (1988) generalized all three methods to polytomous items and Meijer, Sijtsma, and Molenaar (1995) proposed the item-score reliability version. The method for estimating item-score reliability of polytomous items is similar to the method for dichotomous items and hence is not discussed here. Item-score reliability based on method MS for both dichotomous and polytomous items is denoted
Method
Guttman (1945) proposed test-score reliability method

Method CA
Method CA is based on the correction for attenuation (Lord & Novick, 1968, pp. 69-70; Nunnally & Bernstein, 1994, p. 257; Spearman, 1904). The method correlates an item score and a test score both allegedly measuring the same attribute (Wanous & Reichers, 1996). The item score can be obtained from the same test on which the test score was based, but the test score may also refer to another test measuring the same attribute as the item. The idea is that by correlating two variables that measure the same attribute or nearly the same attribute, one approximates parallel measures; see Equation (2). Let

Item Indices Currently Used in Test Construction
Well-known item-quality indices used in test construction are (a) the item-rest correlation, also known as the corrected item-total correlation (Lord & Novick, 1968, p. 330); (b) the loading of an item on the factor which it co-defines (Harman, 1976, p. 15), in this study called the item-factor loading; (c) the item scalability (Mokken, 1971, pp. 148-153); and (d) the item discrimination (Baker & Kim, 2004, p. 4; Hambleton & Swaminathan, 1985, p. 36). For each of these four indices, rules of thumb are available in the psychometric literature that the researcher may use to interpret the values found in empirical data and make decisions about which items to maintain in the test.
Item-Rest Correlation
The item-rest correlation is defined as the correlation between the item score
Item-Factor Loading
To obtain the item-factor loading

We assume a monotone relation between
Item Scalability
The

Dividing both the numerator and denominator of the ratio in Equation (10) by

Hence,
Item Discrimination
Many parametric IRT models define an item-discrimination parameter. For example, the graded response model (Samejima, 1969, 1997) contains discrimination parameter
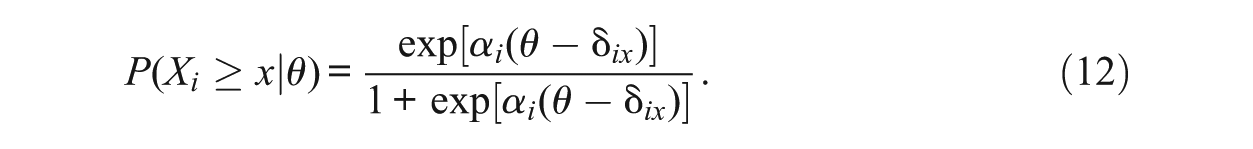
Equation (12) represents the cumulative category response function, and an item scored
Several authors (e.g., Culpepper, 2013; Gustafsson, 1977; Nicewander, 2018) proposed reliability in the context of an IRT framework. The relationship of item-score reliability versions based on these proposals to discrimination parameters in several IRT models may not be clear-cut or at least rather complex. Lord (1980) argued that the relationship between item discrimination and IRT-based item-score reliability is far from simple and differs for most IRT models.
Empirical-Data Sets
We selected 16 empirical-data sets collected by means of different tests and questionnaires and representing a wide variety of attributes. In each data set, for each item we estimated item-score reliability by means of each of the three item-score reliability methods. The two goals were to compare the values of the different methods to find differences and similarities, and to derive guidelines for reasonable values to be expected in the analysis of empirical data. We also compared the values for the three item-score reliability methods with the item-rest correlation, the item-factor loading, the item scalability, and the item discrimination. The goal was to investigate whether the item-score reliability and the other four item indices identified the same items as weak or strong relative to the other items in a scale.
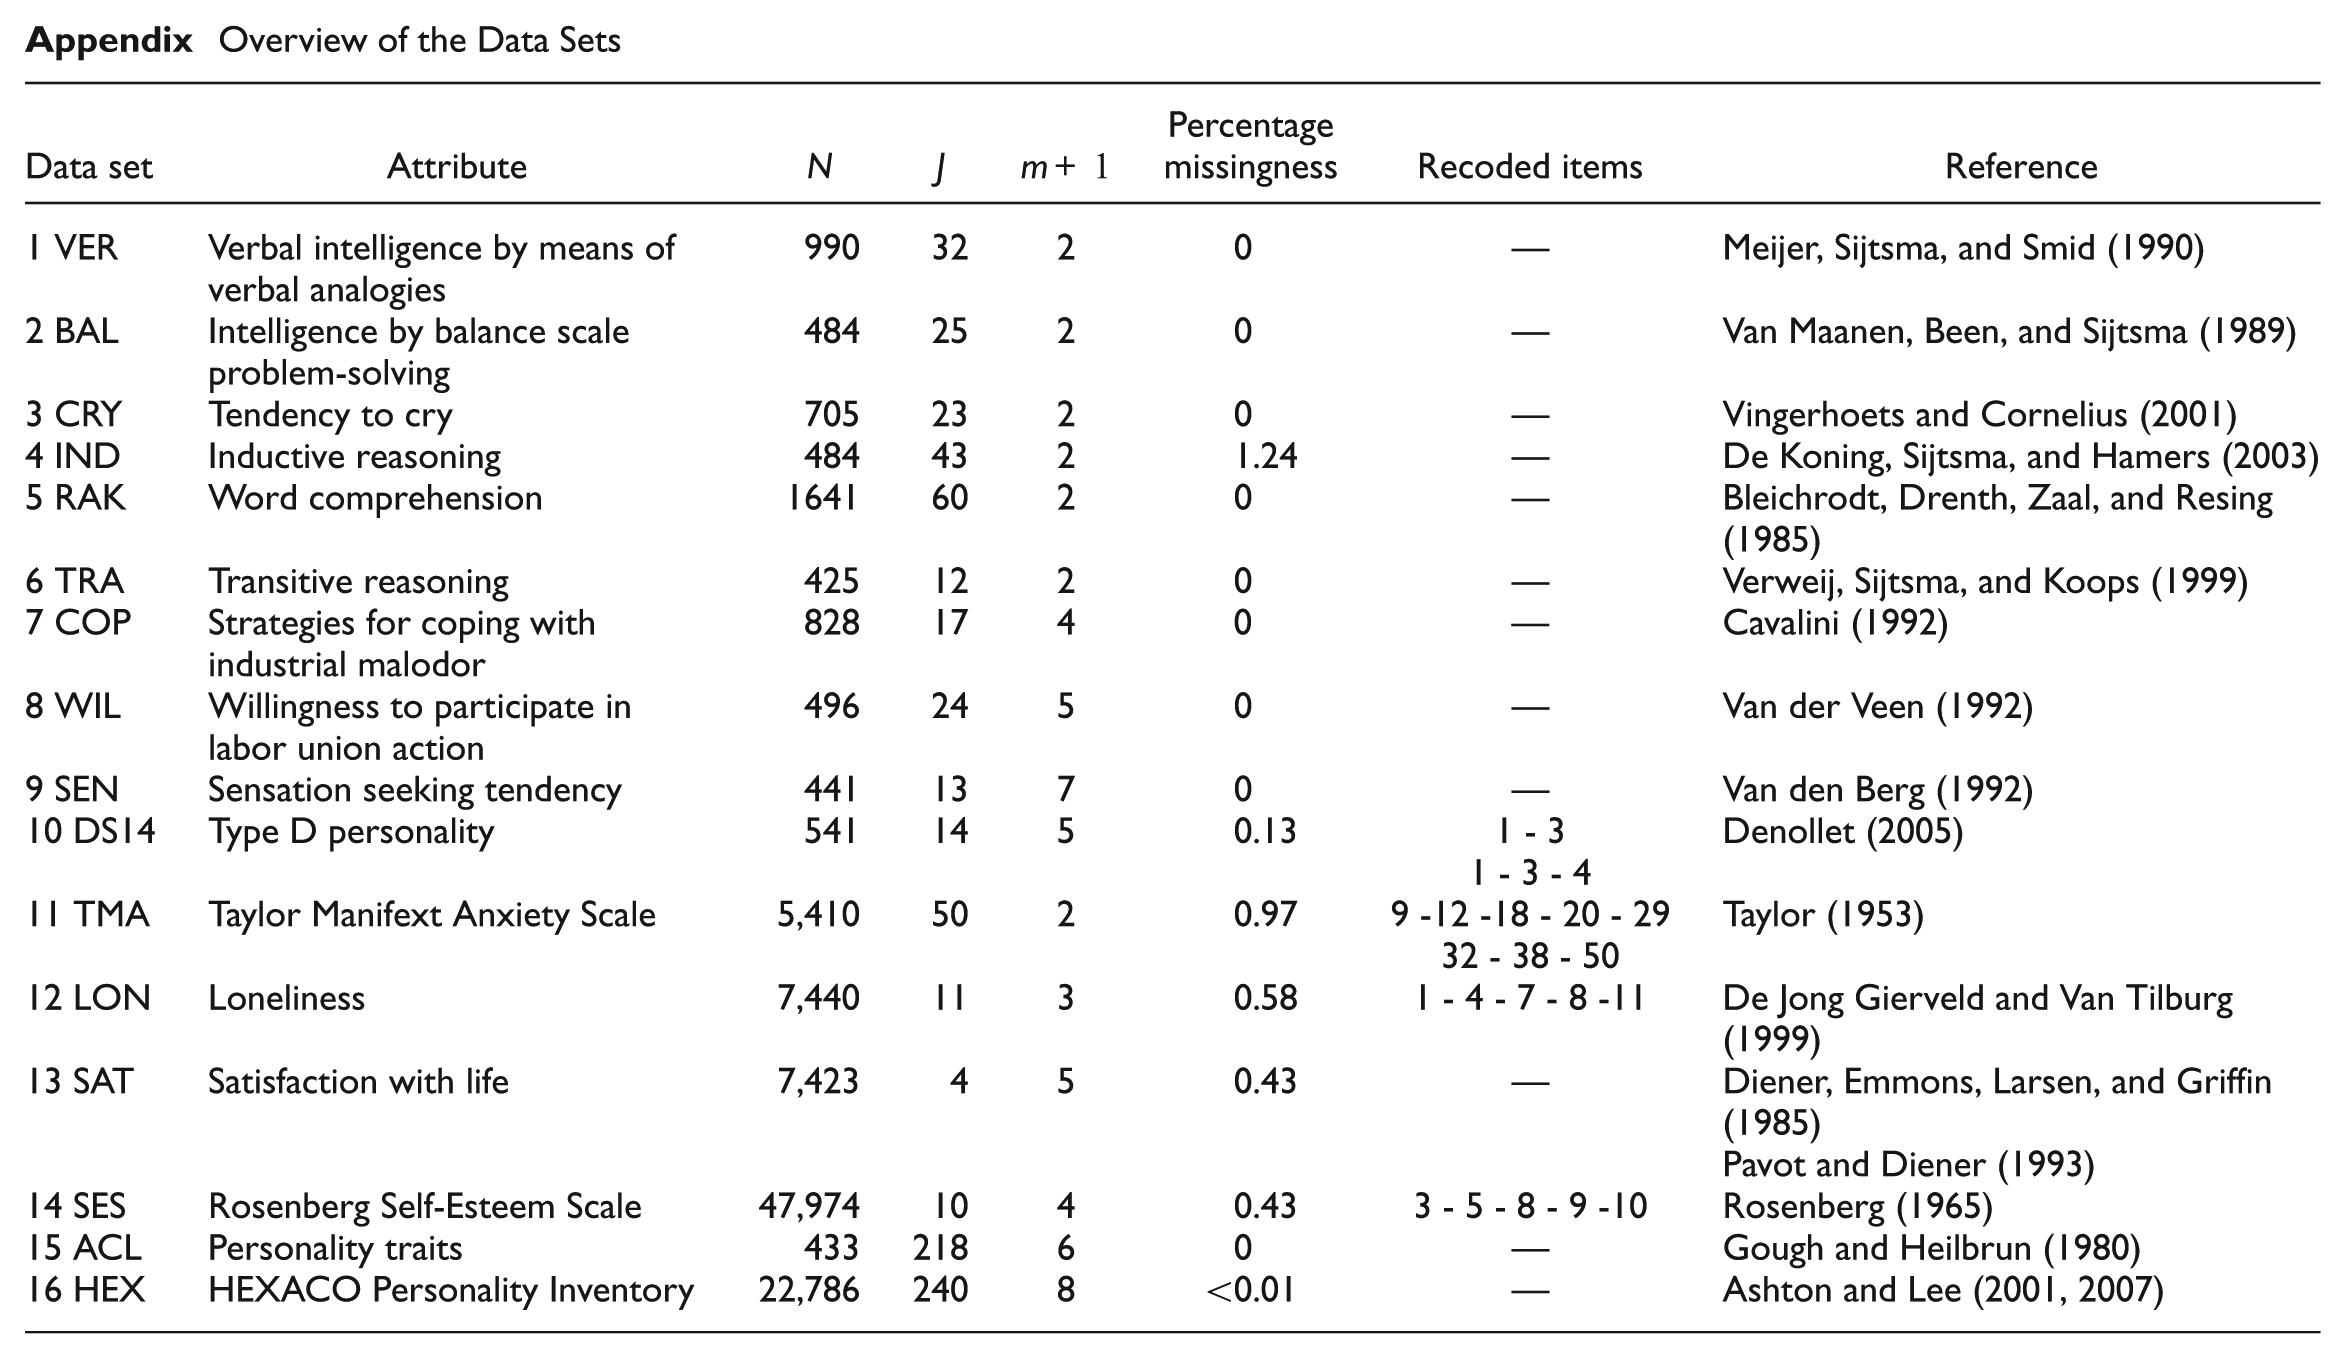
Five data sets came from tests measuring maximum performance and 11 data sets came from questionnaires measuring typical behavior. A detailed overview of the data sets can be found in the Appendix. Table 1 provides a classification of the tests and questionnaires by maximum performance and typical behavior, and also by number of items and number of item scores. It was impossible for the authors to get a hold on a typical data set for each cell in Table 1, basically because several combinations of test properties are rare in practice. For example, maximum performance is usually measured using tests containing more than 10 dichotomously scored items, but not by means of shorter tests and rarely by means of tests containing polytomously scored items or the combination of both properties. Hence, for the maximum-performance category we were unable to find data sets with fewer than 10 items or containing polytomous item scores. For the typical-behavior category, we were unable to obtain dichotomous-item data sets with fewer than 20 items. Such data sets are expected to be rare in practice, and because they are rare we did not consider their absence damaging to the conclusions of this study. Tests and questionnaires for which we were able to obtain data sets differed with respect to number of items, number of answer categories (and number of item scores), and sample size. The adjective checklist (ACL; Gough & Heilbrun, 1980) and the HEXACO personality inventory (abbreviated HEX; Ashton & Lee, 2001, 2007) contained scores from 22 and 24 subscales, respectively. We considered the ACL and the HEX different data clusters and within each cluster we analyzed the subscale data separately. The other 14 data sets all referred to a single scale, and were considered a third data cluster, denoted the various-data cluster.
Overview of the Empirical-Data Sets Arranged by Number of Items and Number of Item Scores.
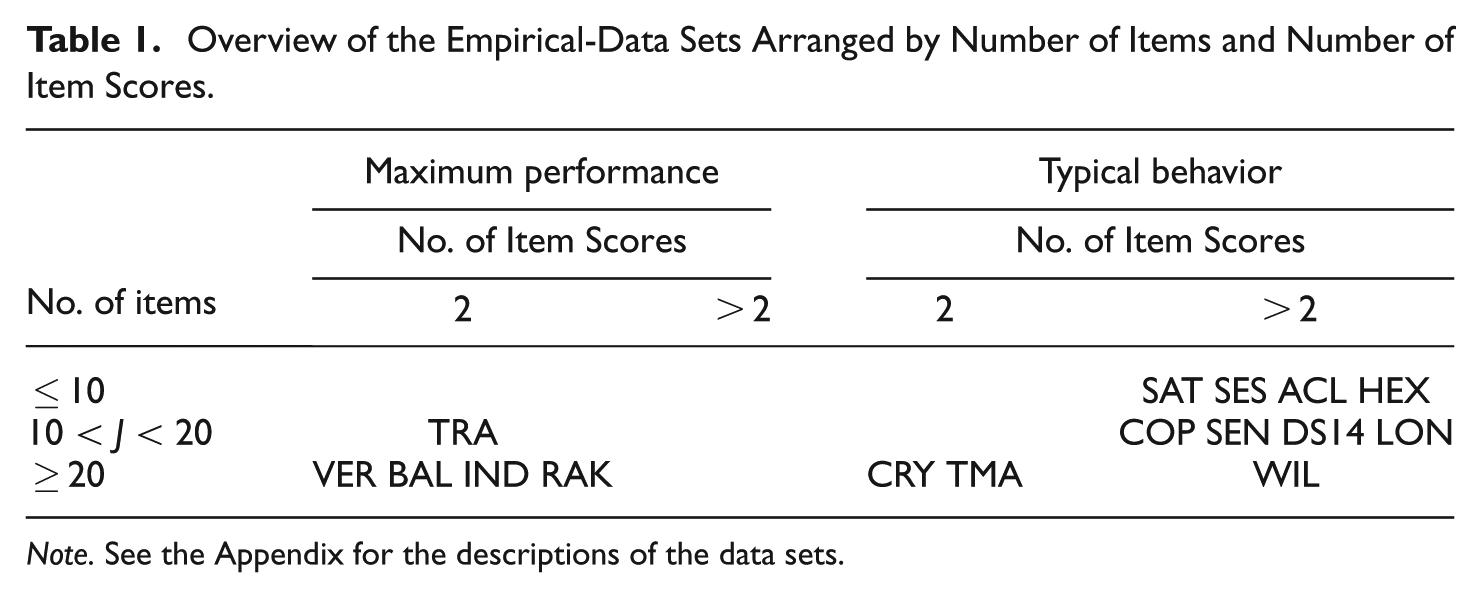
Note. See the Appendix for the descriptions of the data sets.
Analysis
The three item-score reliability methods and the four accepted item indices were estimated for each data set. Listwise deletion was used to accommodate missing values. Within the three data clusters scatter plots were generated for each combination of the seven item indices, showing the relationship between all possible pairs of item indices.
The three item-score reliability methods use different approaches, but are all intended to approximate true item-score reliability in Equation (2). Hence, we were interested to know the degree to which the three methods produced the same numerical values. Numerical identity was expressed by means of the coefficient of identity (Zegers & Ten Berge, 1985), which runs from −1 to 1, with higher positive values meaning that the values of the two indices studied are more alike, and the value 1 meaning that they are numerically identical. The product-moment correlation provides identity up to a linear transformation, thus it does not provide the exact information we were interested in but it was also given because it is well known and provides approximately, albeit not precisely, the information required. When assessing the relationship between an item-score reliability method and each of the other four item indices or among the latter four indices, one needs to realize that indices in each pair estimate a different parameter. Hence, in considering the degree to which two different indices suggest item quality is in the same direction, an ordinal association measure is sufficient. We used Kendall’s
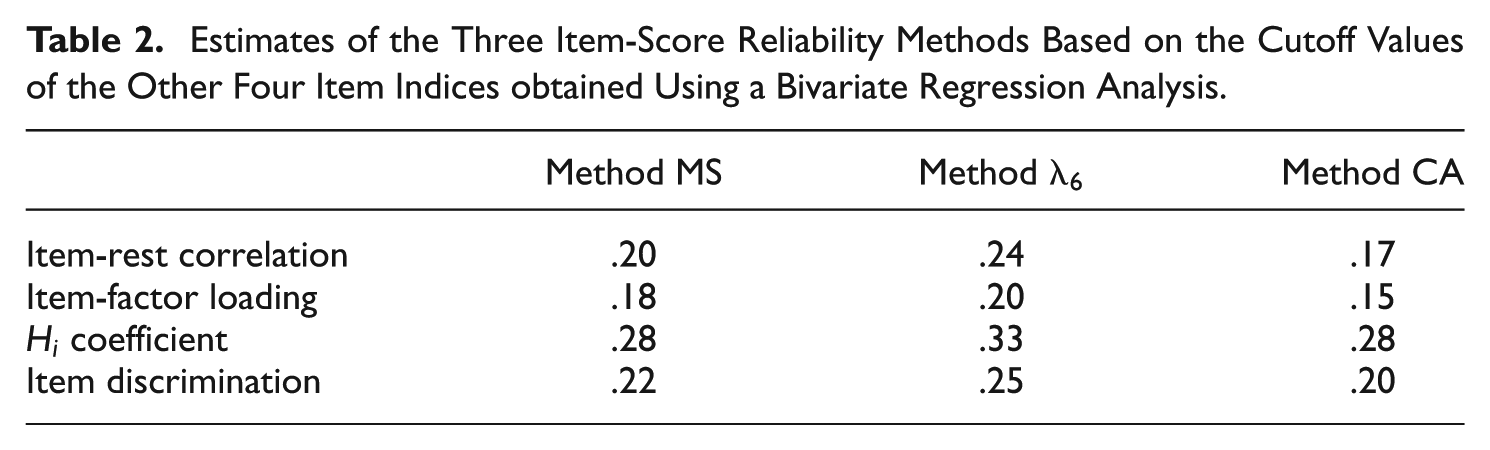
To investigate what values can be expected for the item-score reliability methods at the cutoff values for the other item indices, we regressed each of the three item-score reliability methods on each of the four item indices, thus, producing 12 bivariate regression equations. This enabled us to estimate the item-score reliability at the cutoff value of the item index (.3 for item-rest correlation, .3 for item-factor loading, .3 for item scalability, and .7 for item discrimination), for every combination of item-score reliability method and item index giving an indication of what a good cutoff value would be for the values estimated by the item-score reliability methods.
For estimating the item-score reliability methods, R code (R Core Team, 2016) was used, which was also employed by Zijlmans et al. (2017). The package
Results
For method MS, the values of the item-score reliability estimates ranged from .00 to .70 (mean .29), for method
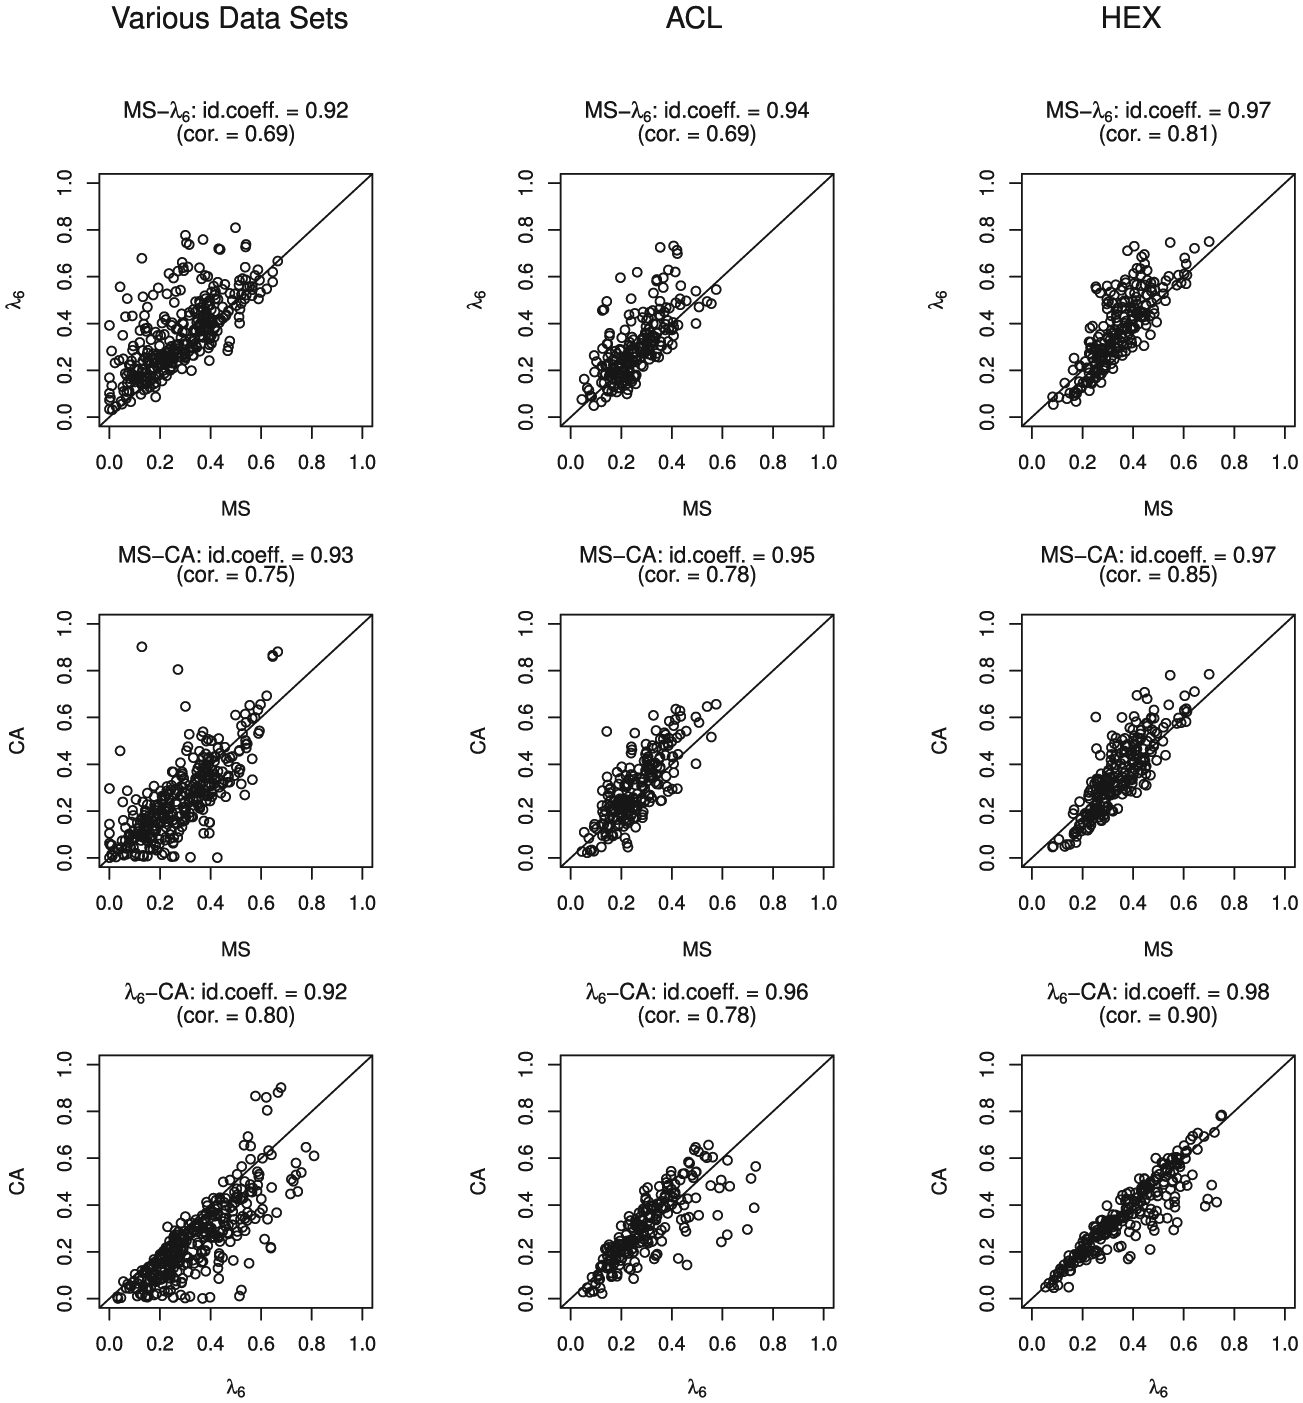
Scatter plots for the three data clusters comparing the item-score reliability estimates for methods MS,
Figure 2 shows the scatterplots comparing item-rest correlation with the three item-score reliability methods. Method CA produced positive values when item-rest correlations were negative. The positive values resulted from squaring the item-rest correlation, see Equation (8). Kendall’s
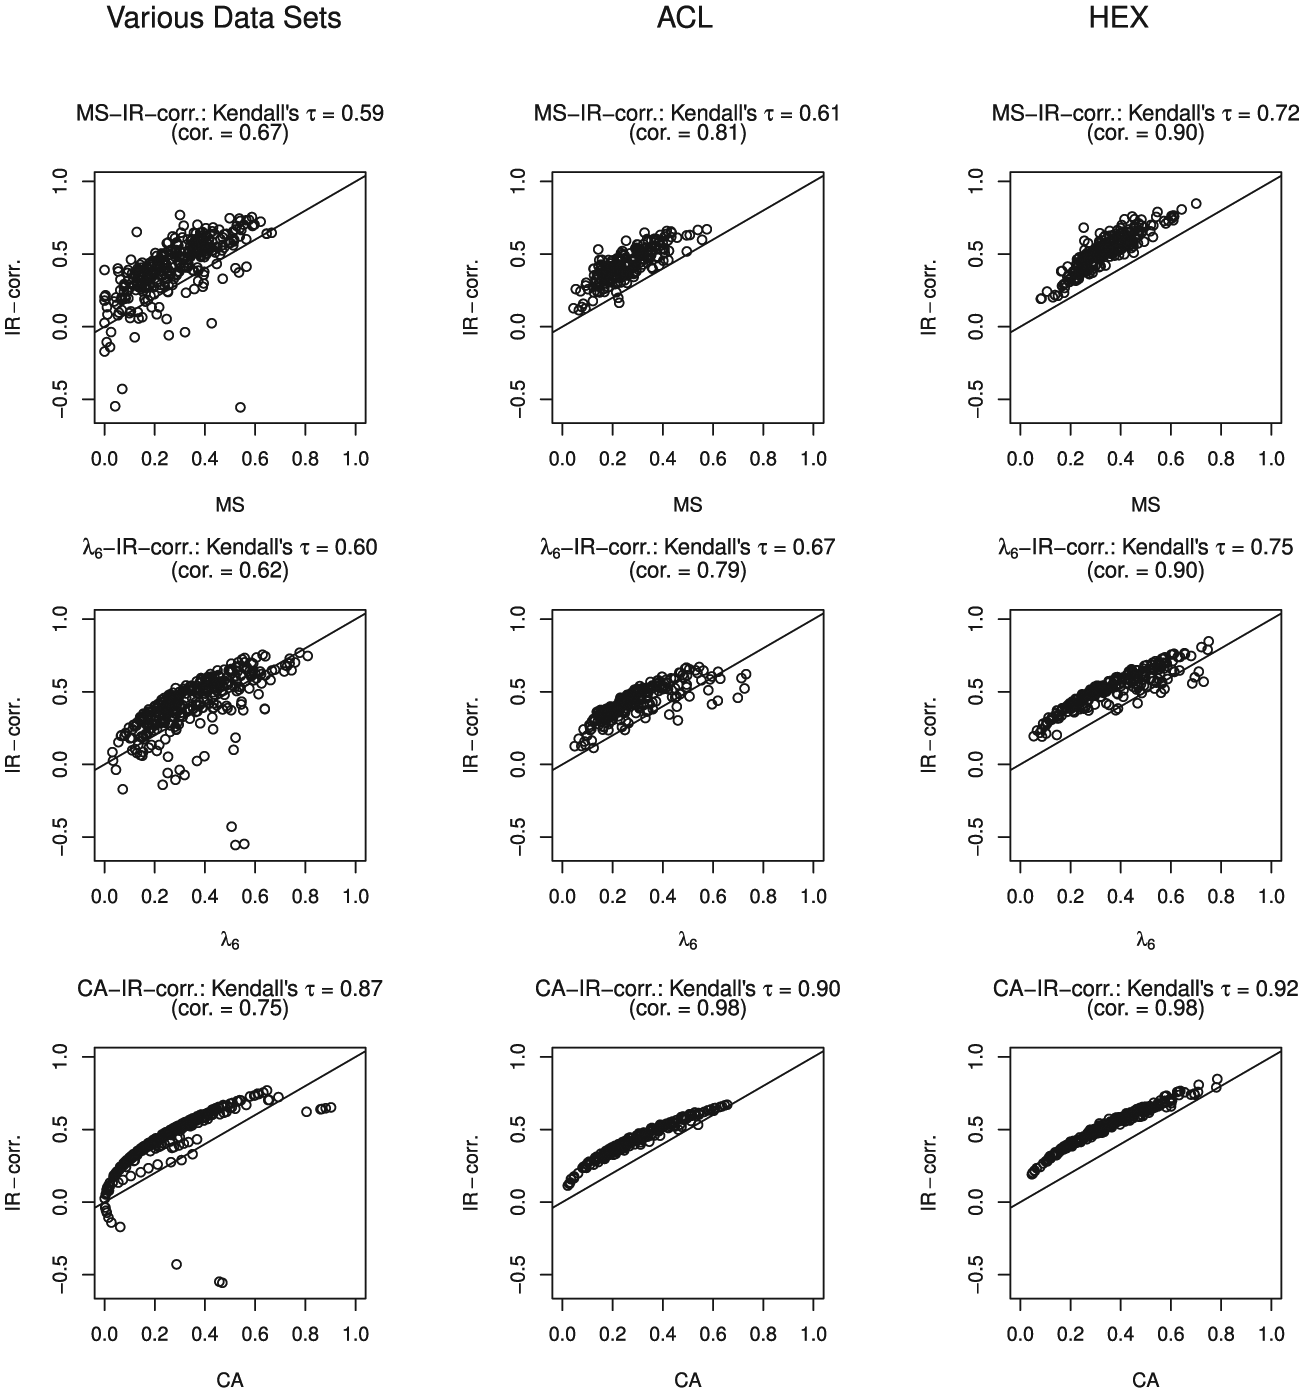
Scatter plots for the three data clusters comparing the item-score reliability methods with the item-rest correlation (IR-corr.).
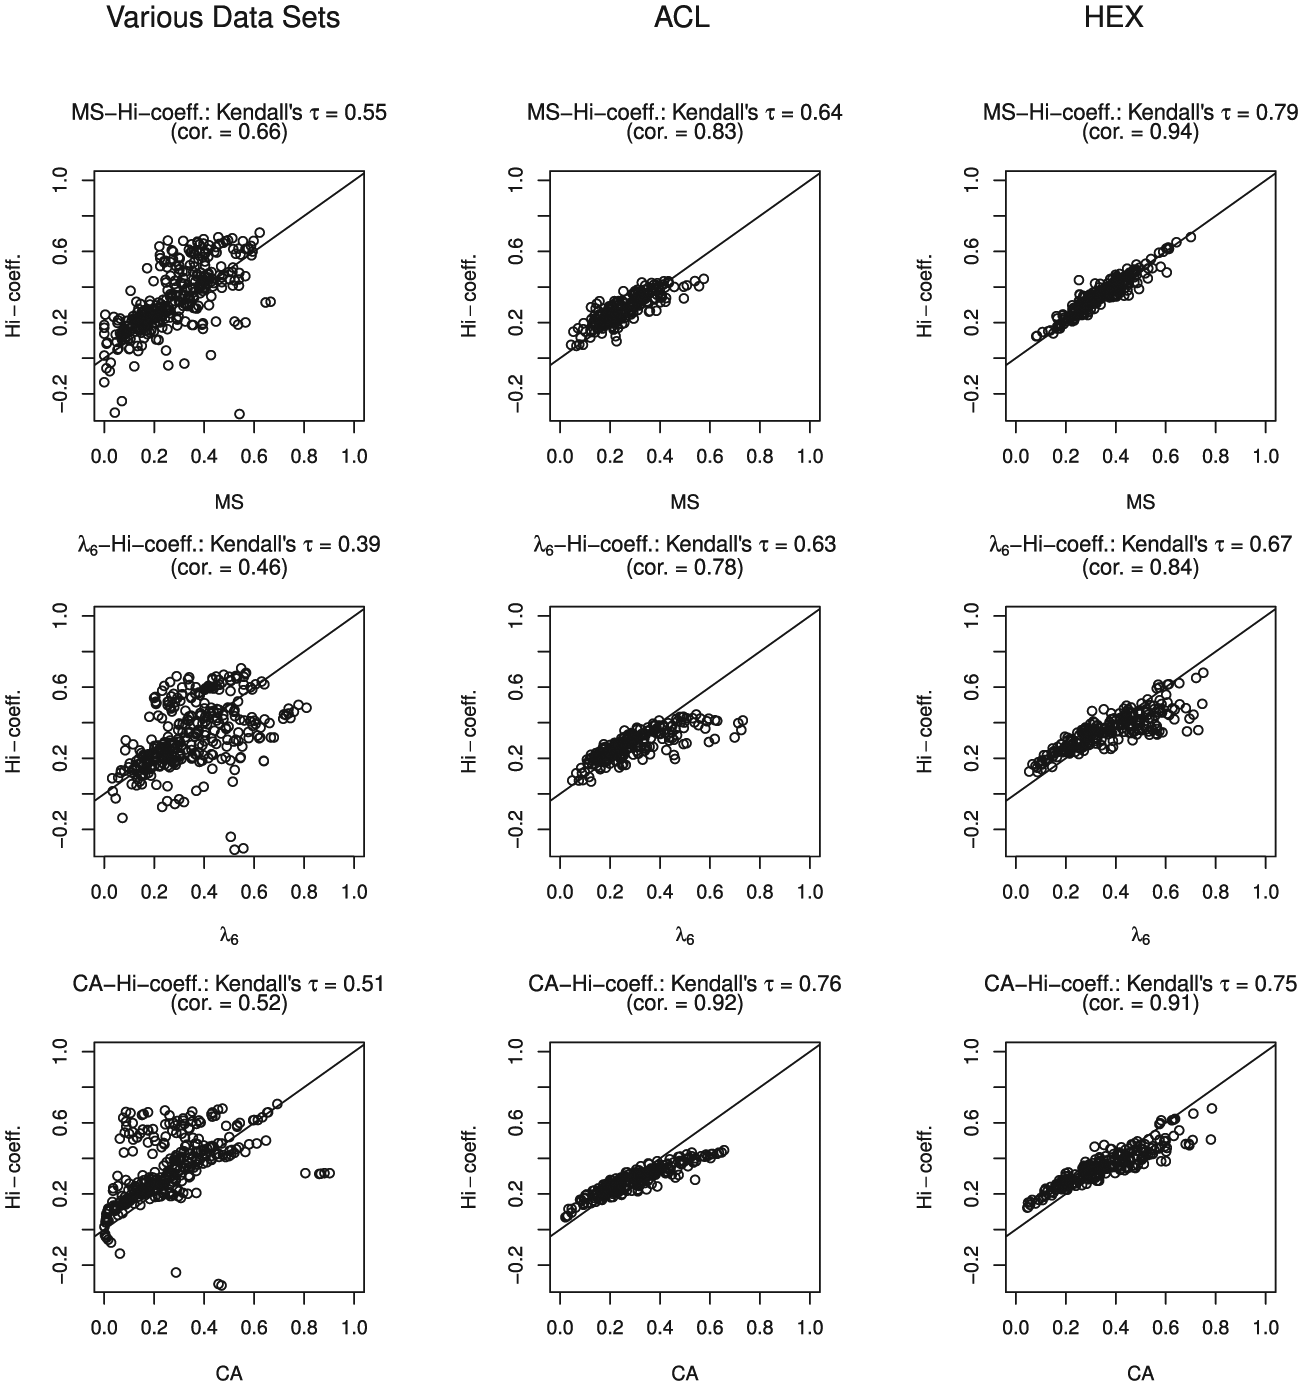
Figure 3 shows the relationship between the item-factor loadings and the three item-score reliability methods. Because most of the scatter lies above the 45-degree line, in many cases the item-factor loading was higher than the three item-score reliability estimates. In the ACL and HEX data clusters, Kendall’s

Scatter plots for the three data clusters comparing the item-score reliability methods with the item-factor loading (FL).
Figure 4 shows the relationship between item scalability
Scatter plots for the three data clusters comparing the item-score reliability methods with the
Figure 5 shows the relationship between item discrimination and the three item-score reliability methods. A discrimination value equal to 10.77 in data set RAK was assessed to be an outlier and was removed from the scatter plot. The next largest discrimination value in this data cluster was 5.7 and the mean estimated discrimination was 1.5. Kendall’s
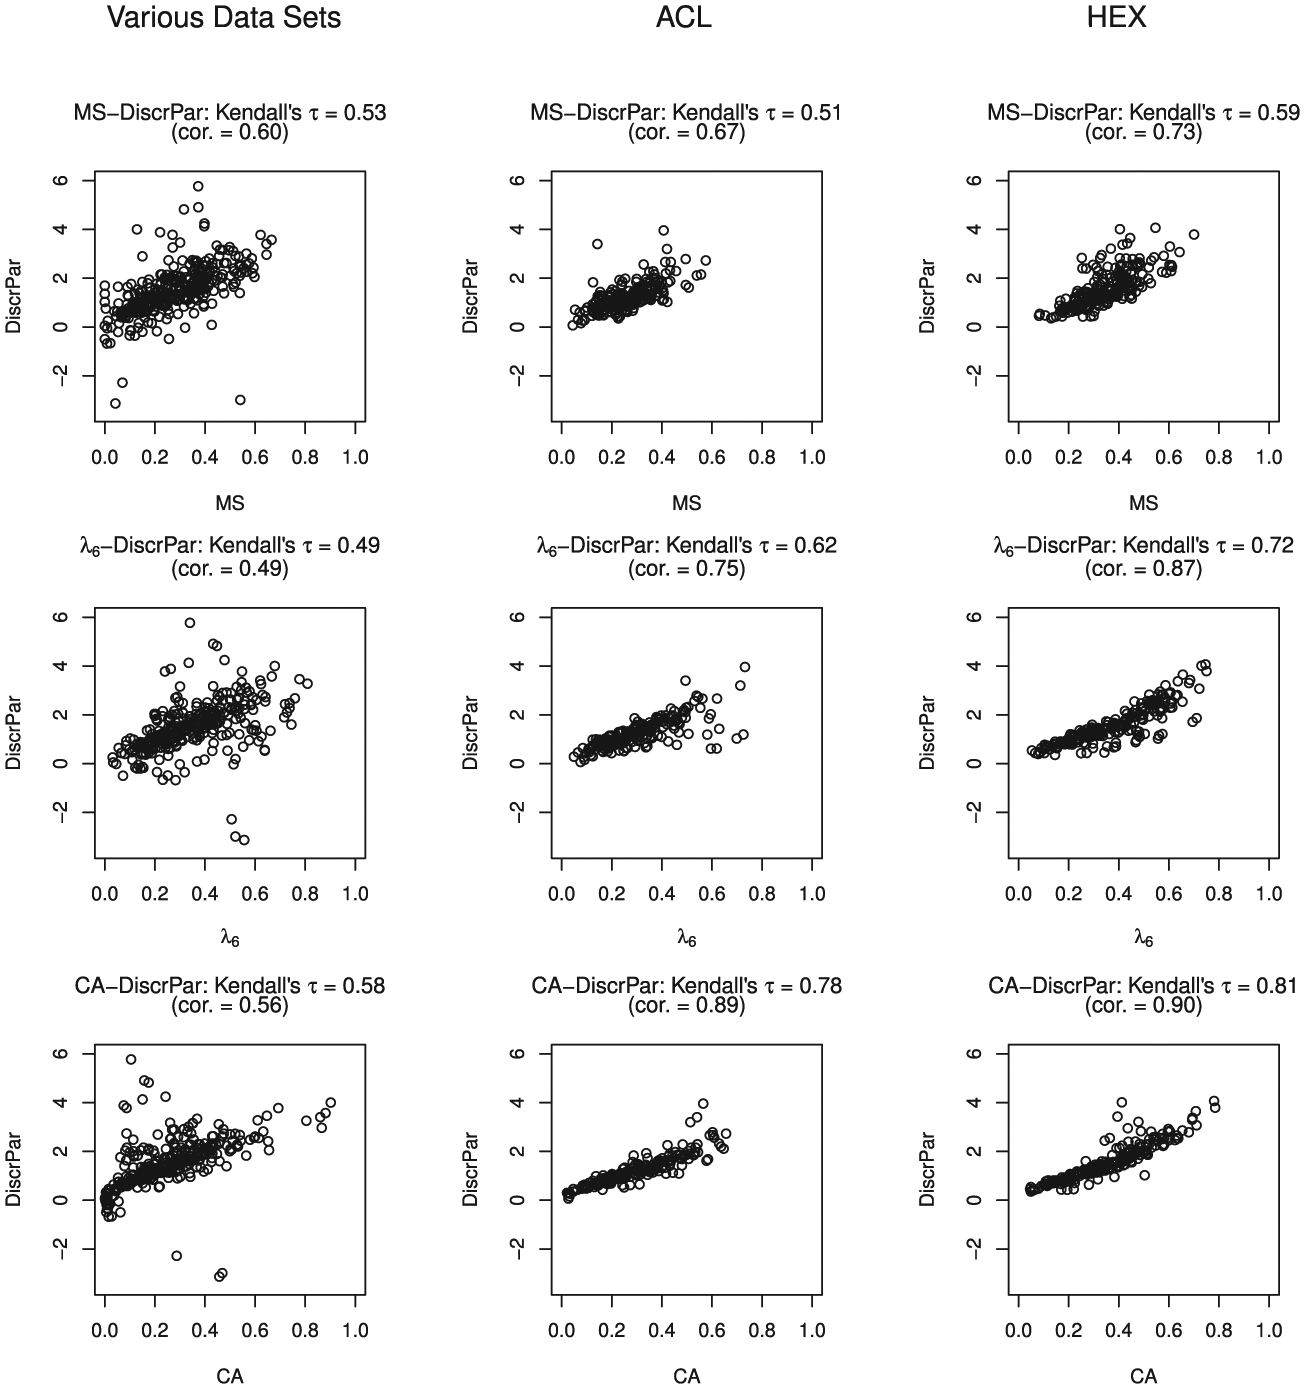
Scatter plots for the three data clusters comparing the item-score reliability methods with the discrimination parameter (DiscrPar).
Figure 6 shows the relationship between item-rest correlation, item-factor loading, item scalability, and item discrimination. Kendall’s
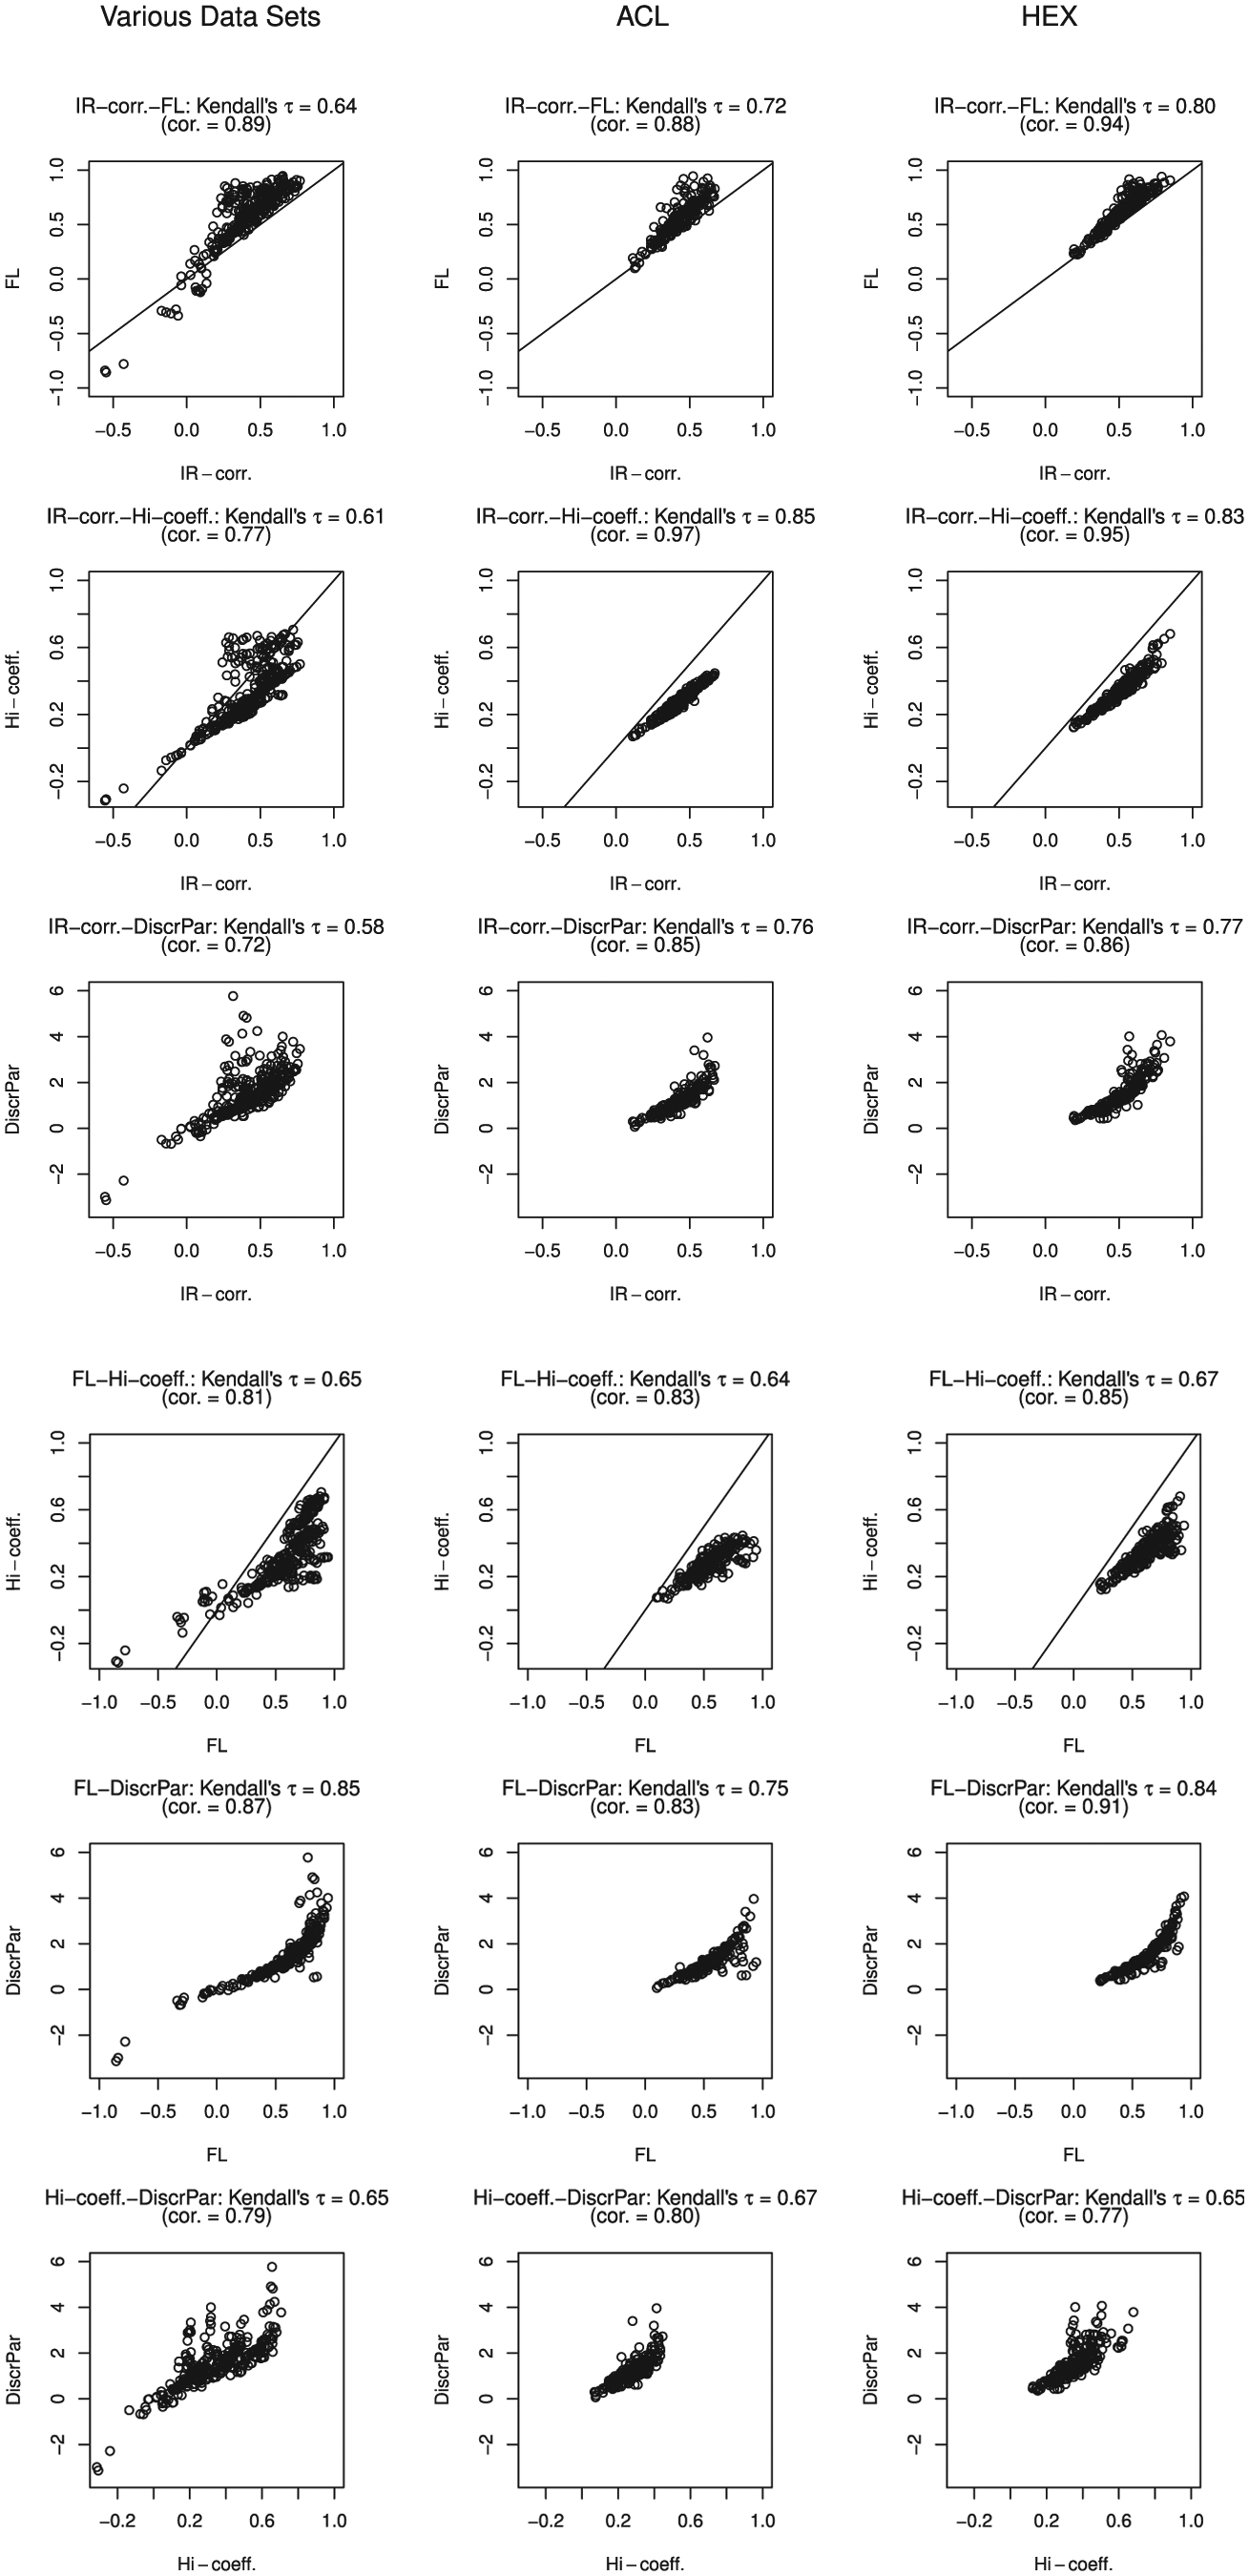
Scatter plots for the three data clusters comparing the item-rest correlation (IR-corr.), item-factor loading (FL), the
Table 2 provides the results for the bivariate regression estimating the three item-score reliability coefficients by the cutoff values of four other item indices. The item-factor loading estimated the lowest item-score reliability values: .18 for method MS, .20 for method
Estimates of the Three Item-Score Reliability Methods Based on the Cutoff Values of the Other Four Item Indices obtained Using a Bivariate Regression Analysis.
Discussion
We estimated item-score reliability methods MS,
The relationships between the three item-score reliability methods and the four accepted item indices showed a strong association between the item-rest correlation and the item-score reliability methods, especially method CA. This result can be explained by the relation between method CA and the item-rest correlation (Equation 8). The other associations between the item-score reliability methods and the other item indices are weaker. For the other four item indices, the researcher can use available rules of thumb to decide when an item is a candidate for revision or for elimination from a test. Based on investigating a polytomous single-item measure with five response categories, Wanous et al. (1997) suggested using a lower bound of .7 for the item-score reliability. Given the values that were obtained for the items in the empirical-data sets we selected, and given the results from the bivariate linear regression, we conjecture that this requirement may be too stringent in practice: Instead, a value of .3 would be a realistic lower bound for item-score reliability.
We found that
Values we found for accepted item indices in empirical data could serve as a starting point for a simulation study that further investigates the relationship between item-score reliability and accepted item indices. Furthermore, little knowledge about the relation between item-score reliability and test-score reliability is available, rendering the investigation of this relationship urgent. Also, the effect of omitting items with low item-score reliability on the total-score reliability should be investigated.
Footnotes
Appendix
Overview of the Data Sets
| Data set | Attribute | N | J | m+ 1 | Percentage missingness | Recoded items | Reference |
|---|---|---|---|---|---|---|---|
| 1 VER | Verbal intelligence by means of verbal analogies | 990 | 32 | 2 | 0 | — | Meijer, Sijtsma, and Smid (1990) |
| 2 BAL | Intelligence by balance scale problem-solving | 484 | 25 | 2 | 0 | — | Van Maanen, Been, and Sijtsma (1989) |
| 3 CRY | Tendency to cry | 705 | 23 | 2 | 0 | — | Vingerhoets and Cornelius (2001) |
| 4 IND | Inductive reasoning | 484 | 43 | 2 | 1.24 | — | De Koning, Sijtsma, and Hamers (2003) |
| 5 RAK | Word comprehension | 1641 | 60 | 2 | 0 | — | Bleichrodt, Drenth, Zaal, and Resing (1985) |
| 6 TRA | Transitive reasoning | 425 | 12 | 2 | 0 | — | Verweij, Sijtsma, and Koops (1999) |
| 7 COP | Strategies for coping with industrial malodor | 828 | 17 | 4 | 0 | — | Cavalini (1992) |
| 8 WIL | Willingness to participate in labor union action | 496 | 24 | 5 | 0 | — | Van der Veen (1992) |
| 9 SEN | Sensation seeking tendency | 441 | 13 | 7 | 0 | — | Van den Berg (1992) |
| 10 DS14 | Type D personality | 541 | 14 | 5 | 0.13 | 1 - 3 | Denollet (2005) |
| 1 - 3 - 4 | |||||||
| 11 TMA | Taylor Manifext Anxiety Scale | 5,410 | 50 | 2 | 0.97 | 9 -12 -18 - 20 - 29 | Taylor (1953) |
| 32 - 38 - 50 | |||||||
| 12 LON | Loneliness | 7,440 | 11 | 3 | 0.58 | 1 - 4 - 7 - 8 -11 | De Jong Gierveld and Van Tilburg (1999) |
| 13 SAT | Satisfaction with life | 7,423 | 4 | 5 | 0.43 | — | Diener, Emmons, Larsen, and Griffin (1985) |
| Pavot and Diener (1993) | |||||||
| 14 SES | Rosenberg Self-Esteem Scale | 47,974 | 10 | 4 | 0.43 | 3 - 5 - 8 - 9 -10 | Rosenberg (1965) |
| 15 ACL | Personality traits | 433 | 218 | 6 | 0 | — | Gough and Heilbrun (1980) |
| 16 HEX | HEXACO Personality Inventory | 22,786 | 240 | 8 | <0.01 | — | Ashton and Lee (2001, 2007) |
Declaration of Conflicting Interests
The author(s) declared no potential conflicts of interest with respect to the research, authorship, and/or publication of this article.
Funding
The author(s) received no financial support for the research, authorship, and/or publication of this article.