
Abstract
It is currently not entirely clear to what degree the research on multidimensional computerized adaptive testing (CAT) conducted in the field of educational testing can be generalized to fields such as health assessment, where CAT design factors differ considerably from those typically used in educational testing. In this study, the impact of a number of important design factors on CAT performance is systematically evaluated, using realistic example item banks for two main scenarios: health assessment (polytomous items, small to medium item bank sizes, high discrimination parameters) and educational testing (dichotomous items, large item banks, small- to medium-sized discrimination parameters). Measurement efficiency is evaluated for both between-item multidimensional CATs and separate unidimensional CATs for each latent dimension. In this study, we focus on fixed-precision (variable-length) CATs because it is both feasible and desirable in health settings, but so far most research regarding CAT has focused on fixed-length testing. This study shows that the benefits associated with fixed-precision multidimensional CAT hold under a wide variety of circumstances.
Keywords
Introduction
In the last decade, the item response theory (IRT) framework has taken the field of health measurement by storm. IRT offers special advantages, such as facilitating the evaluation of reliability conditional on the latent trait value, scale linking, differential item functioning (DIF) analysis, and computerized adaptive testing (CAT; e.g., Cook, O’Malley, & Roddey, 2005; Reise & Waller, 2009). CAT offers many advantages over traditional testing formats; a CAT could be seen as a flexible short form that is tailored to the individual person, so that a highly efficient test can be achieved that is optimally informative for a given person.
Currently, most CATs used for health measurement are based on unidimensional IRT models. However, multidimensional IRT (MIRT) models (Reckase, 2009) and multidimensional CAT (MCAT; Luecht, 1996; Segall, 1996, 2010) are becoming increasingly popular in health measurement; this is especially true for between-item multidimensional models (Smits, Paap, & Boehnke, 2018). In recent years, several authors have shown that taking into account the correlation among health-related dimensions, when estimating patient scores in CATs, offers potential benefits (e.g., Nikolaus et al., 2015; Paap, Kroeze, Glas, et al., 2018). The overall message seems to be that MCAT improves measurement efficiency as compared with using separate unidimensional CATs (UCATs) for each latent dimension, especially, if latent dimensions are highly correlated (e.g., Makransky & Glas, 2013; Segall, 1996; Wang & Chen, 2004).
While recognizing the advantages of IRT, several authors have drawn attention to the fact that a transition to the IRT framework in the field of health measurement also poses a number of challenges (Bjorner, Chang, Thissen, & Reeve, 2007; Fayers, 2007; Reise & Waller, 2009; Thissen, Reeve, Bjorner, & Chang, 2007). Since IRT was first applied in educational testing and attainment/intelligence tests used in military contexts, the lion’s share of IRT and CAT research is devoted to models for dichotomous data (modeling correct and incorrect responses). In contrast, patient-reported outcomes (PROs) are often scored using polytomous items. Another important contrast between the educational and clinical context is that cognitive tests and educational examinations are typically lengthy tests, whereas clinicians may prefer a relatively short questionnaire due to time constraints and to keep the response burden to a minimum (e.g., Fayers, 2007). Item parameters have also been shown to follow different distributions for the two fields; discrimination parameters in health measurement are often much higher than in educational testing, and, threshold parameters either cover the entire trait range or are clustered in the trait range indicative of clinical dysfunction (Reise & Waller, 2009). Finally, in educational testing, fixed-length tests are typically favored for a number of practical reasons, whereas fixed-precision (also known as variable-length) tests may be favored in many health measurement settings—be it in combination with an additional termination rule, such as a maximum test length or change in θ score (e.g., Sunderland, Batterham, Carragher, Calear, & Slade, 2016). To date, fixed-precision CATs have received significantly less attention compared with fixed-length CATs. Aforementioned differences between health measurement and educational testing have direct implications for the development of item banks and CATs.
In sum, it is currently not entirely clear to what degree the research on MIRT and MCAT conducted in the field of educational testing can be generalized to fields such as health measurement, where CAT design factors may differ considerably from those typically used in educational testing. Therefore, a set of simulations with differing item bank properties that are thought to typify the two scenarios will be performed. Typical for the educational testing field are dichotomous items, large item banks, and small to moderately sized discrimination parameters; whereas polytomous items, small to medium item bank sizes, and high discrimination parameters are more typical for the health measurement field. Item parameters will be sampled from distributions that are informed by empirical data typical for the two respective fields. Since MCAT is gaining momentum, the main focus will be on exploring whether the efficiency gain associated with MCAT that is observed in the field of educational testing is also found in health measurement. We focus on fixed-precision CATs because this type of testing is both feasible and desirable in health measurement, but so far most research regarding MCAT has focused on fixed-length testing (see, e.g., Wang, Chang, & Boughton, 2013).
Method
Constructing Item Banks
To ensure realistic CAT simulations, two-parameter logistic (2PL) or graded response model (GRM) item parameters were extracted from widely known empirical item banks used in health measurement (Patient-Reported Outcomes Measurement Information System [PROMIS]) and educational testing (Trends in International Mathematics and Science Study [TIMSS] and Progress in International Reading Literacy Study [PIRLS]). Empirical item banks for health contained highly discriminating polytomous items, whereas for education, they contained dichotomous items with moderate discrimination. Hence, any comparison between the two types of item banks would be, to some extent, confounded by the response type and discrimination level. To disentangle the two impact sources, artificial dichotomous versions of the health item banks were created by collapsing the original five categories to two. Thus, in the end, this resulted in item banks under the following three scenarios: health polytomous (HEPO), health dichotomous (HEDI), and education dichotomous (EDDI), with the middle scenario serving as comparison link between the two main scenarios.
For each scenario, the distributions of item parameters from the empirical item banks were synthesized into an average distribution, which we refer to as the average item bank. These average item banks then served as models to generate realistic simulated item banks that would be used in the CAT simulations. This procedure is illustrated in Figure 1 (a more detailed explanation can be found in the online supplement).
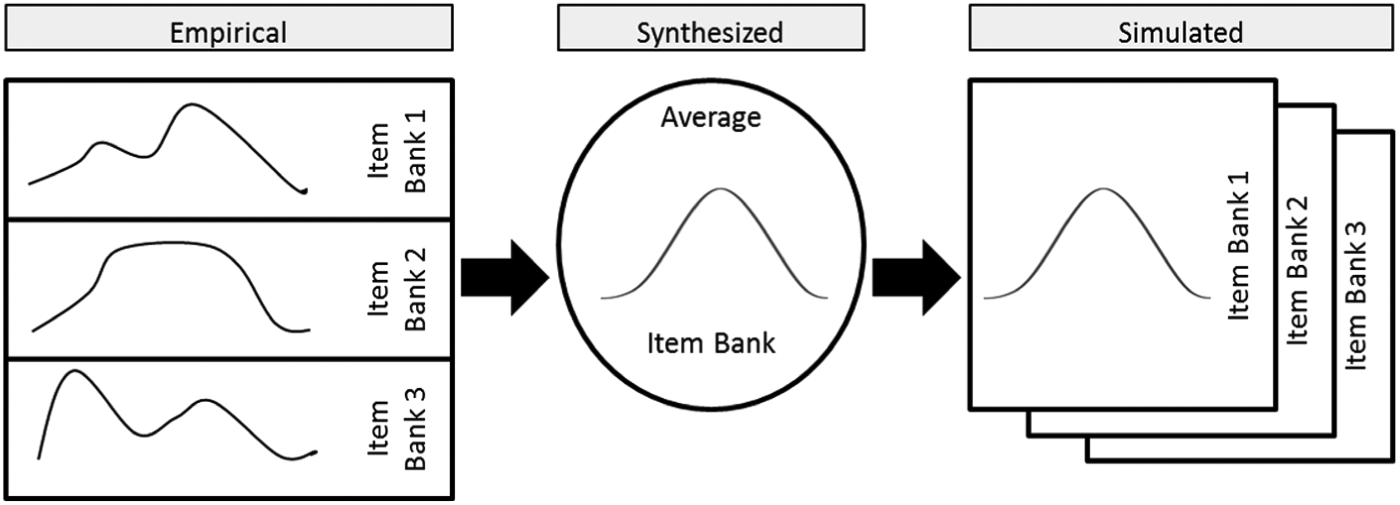
Visual representation of the procedure used for item bank construction.
We do not claim the simulated item banks to be representative for all conceivable item banks in their respective measurement field. Hence, it is important to inspect the psychometric properties of the simulated item banks to understand the scenario labels that are used.
Psychometric Properties of the Item Banks
A Tukey five-number summary of the distribution of the item parameters in the synthesized average item banks is presented in Table 1 for the three scenarios (i.e., HEPO, HEDI, and EDDI). In short, EDDI is characterized by moderately discriminating dichotomous items with a symmetric nonextreme item difficulty distribution, and HEPO is characterized by highly discriminating polytomous items with well-spread within-item category thresholds and an item difficulty distribution skewed toward the lower middle trait levels of the latent scale. The linking scenario HEDI has discrimination parameters that are comparable with the HEPO scenario, but the item difficulty distribution is more skewed toward the lower levels of the latent scale. The correlations between the discrimination parameter ai and the threshold bi1 were substantially larger for the health measurement scenarios compared with the educational testing scenario. The mean (SD) correlations were as follows: .02 (.21) for EDDI, .41 (.11) for HEDI, and .53 (.12) for HEPO.
Distribution of Item Parameters in the Synthesized Average Item Banks for Three Scenarios: EDDI, HEDI, and HEPO.
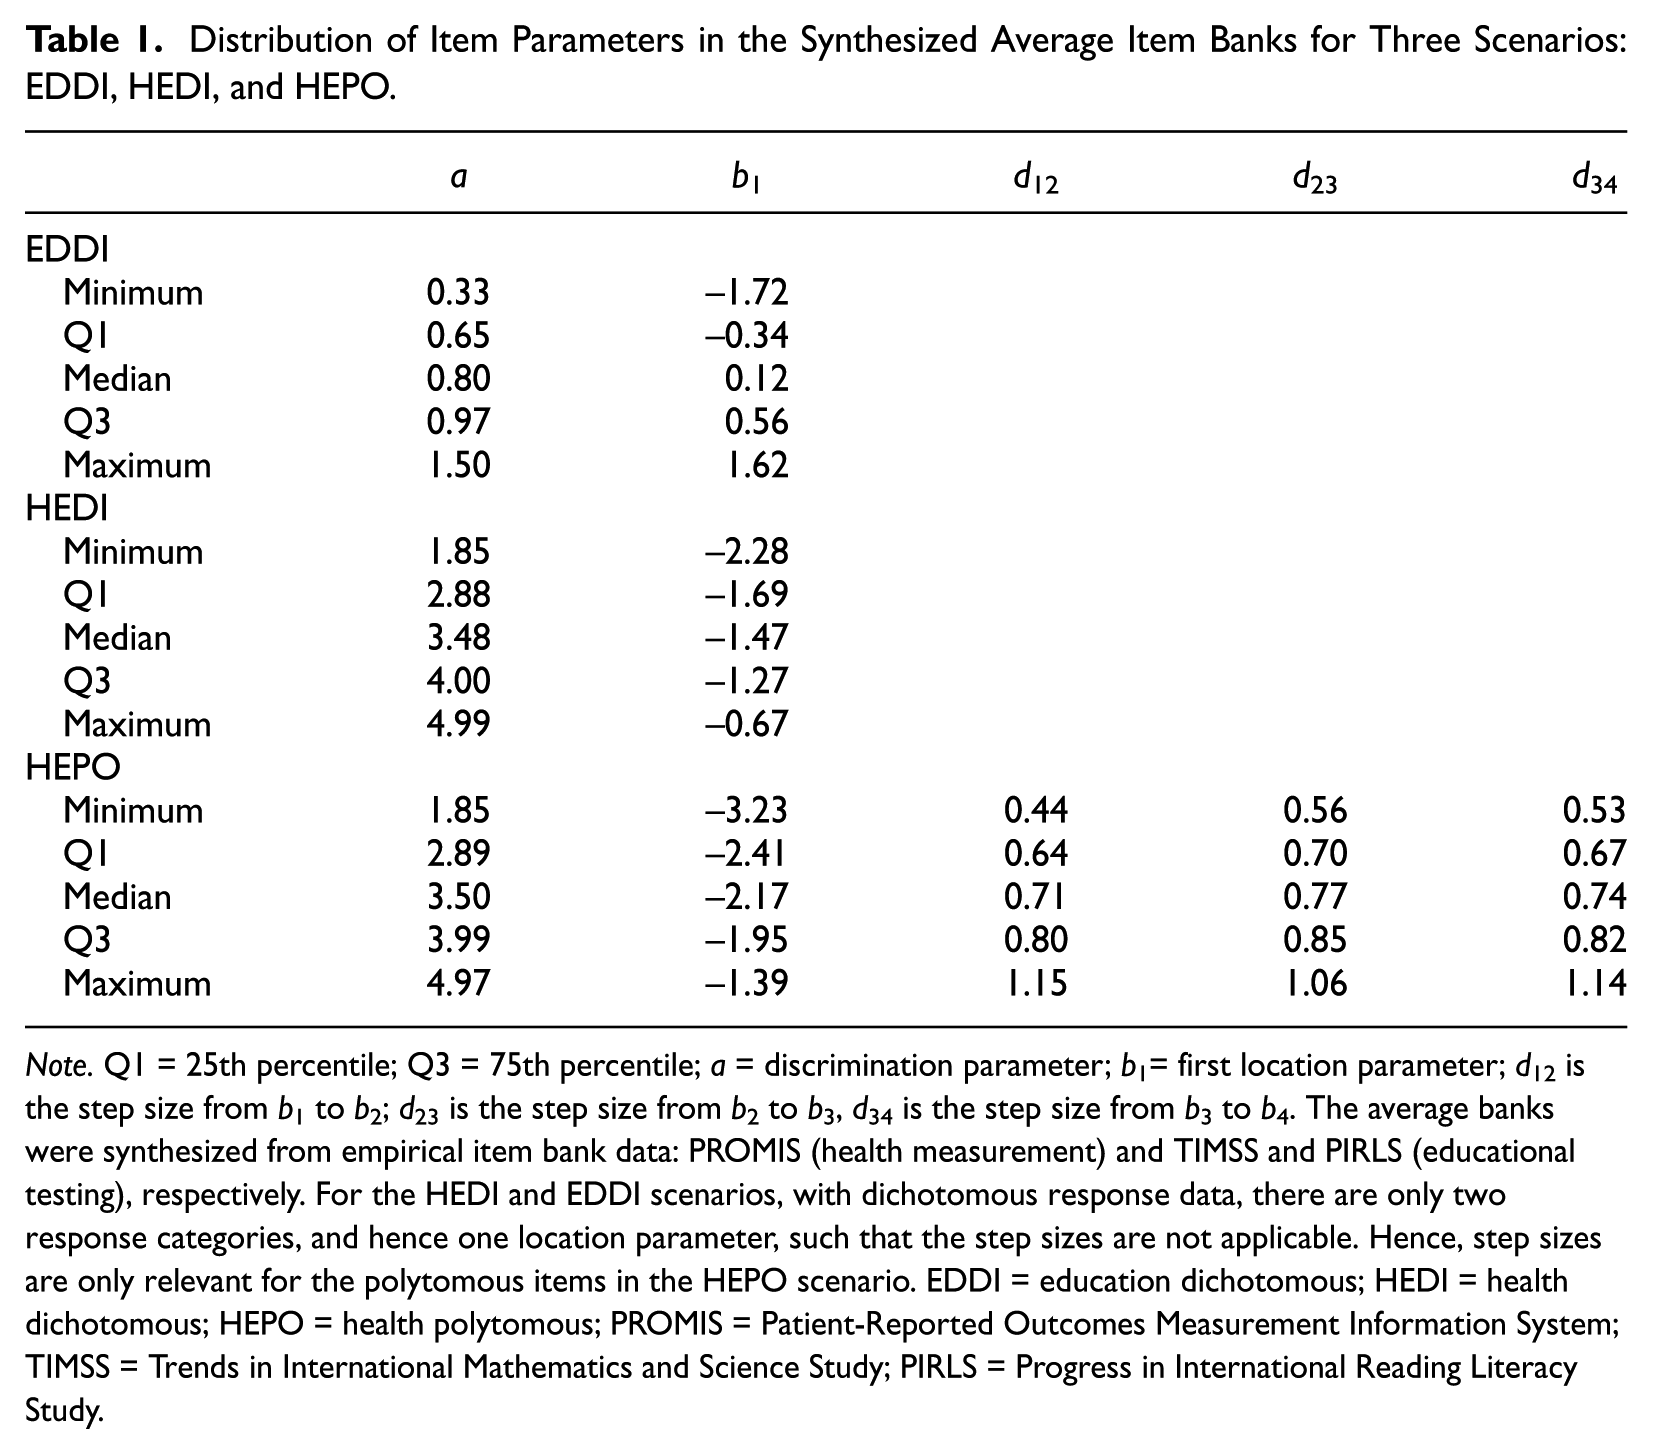
Note. Q1 = 25th percentile; Q3 = 75th percentile; a = discrimination parameter; b1= first location parameter; d12 is the step size from b1 to b2; d23 is the step size from b2 to b3, d34 is the step size from b3 to b4. The average banks were synthesized from empirical item bank data: PROMIS (health measurement) and TIMSS and PIRLS (educational testing), respectively. For the HEDI and EDDI scenarios, with dichotomous response data, there are only two response categories, and hence one location parameter, such that the step sizes are not applicable. Hence, step sizes are only relevant for the polytomous items in the HEPO scenario. EDDI = education dichotomous; HEDI = health dichotomous; HEPO = health polytomous; PROMIS = Patient-Reported Outcomes Measurement Information System; TIMSS = Trends in International Mathematics and Science Study; PIRLS = Progress in International Reading Literacy Study.
The resulting information and reliability profiles of item banks under each scenario are illustrated in Figure 2. The HEPO and HEDI scenarios with their highly discriminating items not only contained a large amount of information but also showed a clear ceiling effect not covering the higher end of the latent scale (i.e., high quality of life). For a given bank size, the HEDI scenario was, due to the collapsing of categories to obtain a dichotomous response type, always less informative and contracted to a smaller range compared with the HEPO scenario. The EDDI banks were more symmetrically and centrally targeted on the latent scale, but had much lower information values than the health banks, which is a direct effect of the EDDI banks containing fewer highly discriminating items.
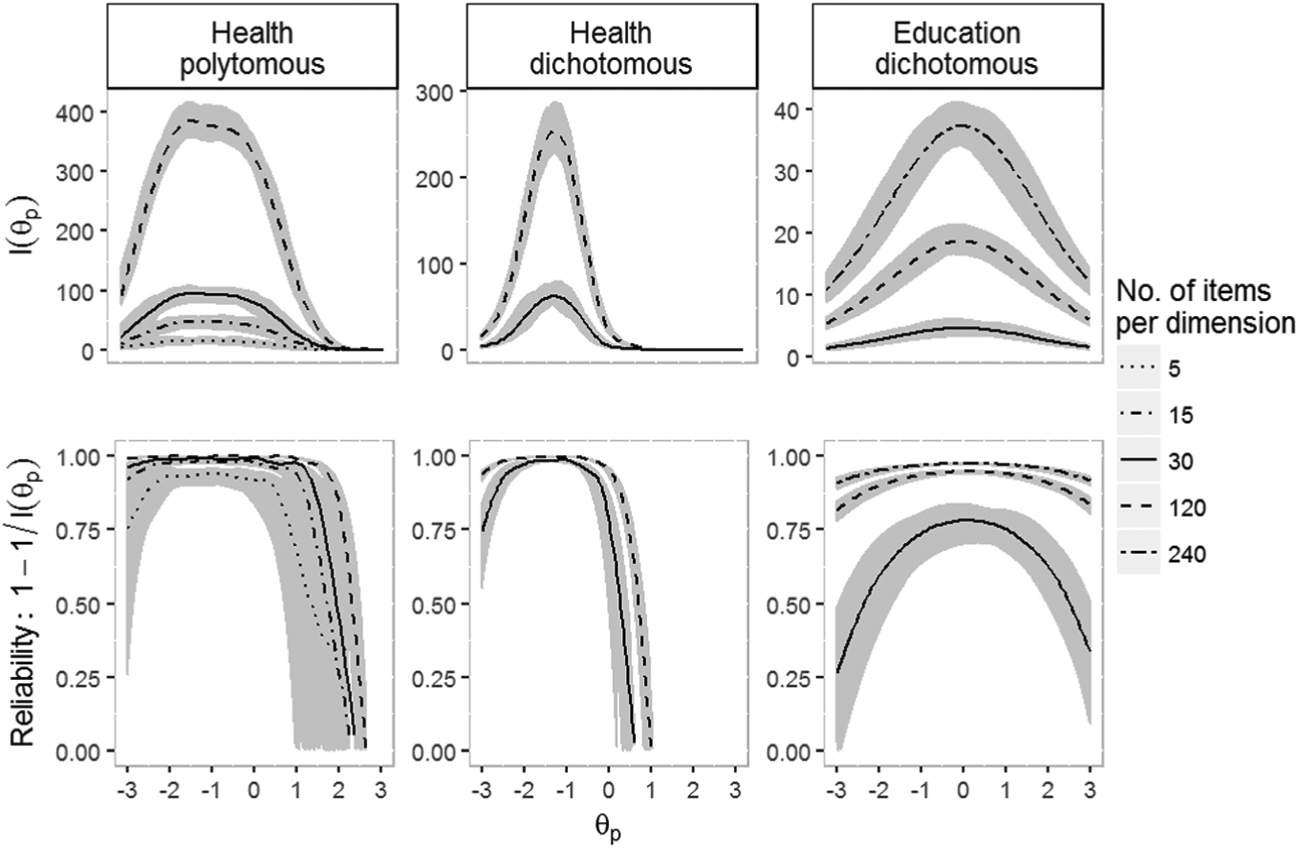
Item bank information and local reliability as a function of the number of items per dimension for the three scenarios: HEPO, HEDI, and EDDI.
Experimental Design of the CAT Simulation
The simulated item banks were generated in line with an experimental design (Figure 3) in which the following item bank design factors were manipulated: research field of the underlying bank (health or education), the response type (dichotomous or polytomous), and the number of items. For each cell in the design, 100 replications were generated. The number of latent dimensions was kept constant and set to D = 3.
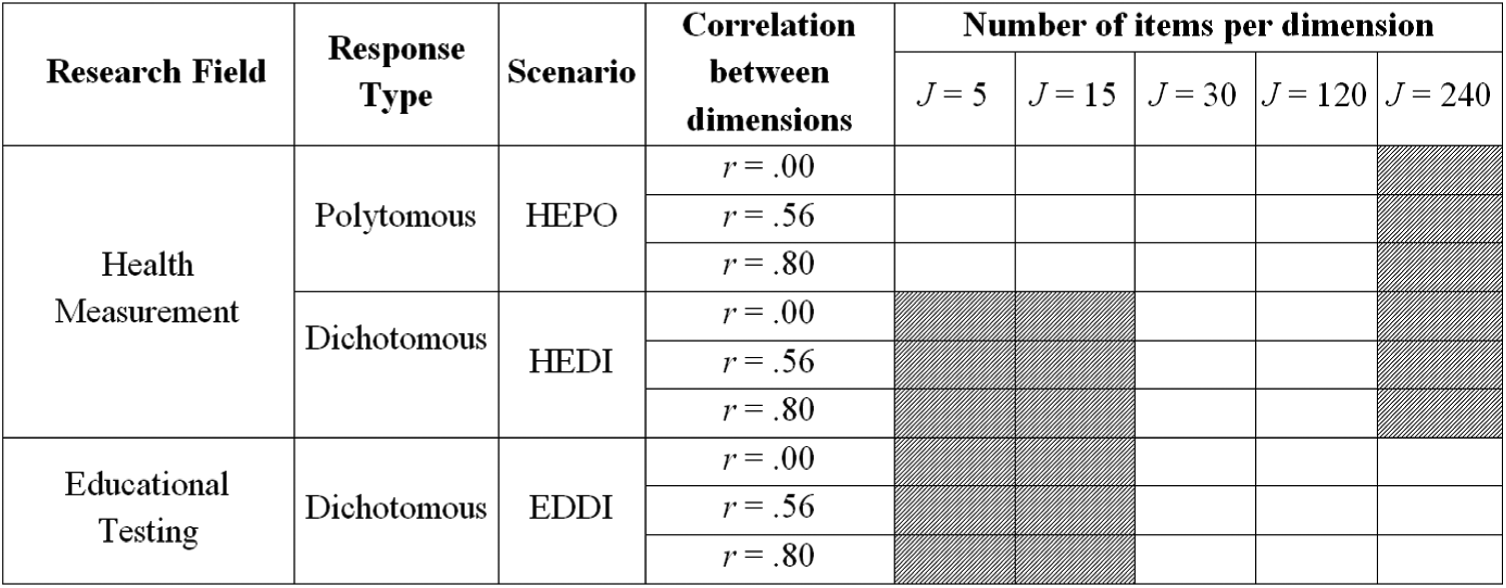
Experimental design for the CAT simulation study.
For each scenario, a multidimensional item bank with three dimensions (sub-banks) was simulated. The sub-banks were of equal size J = {5, 15, 30, 120, 240}, such that the multidimensional bank size I equaled J× 3. The design was not fully crossed; since smaller bank sizes are atypical for educational testing and—conversely—larger bank sizes are atypical for health measurement, the level J < 30 in the EDDI scenario and the level J = 240 in the HEPO scenario were not covered. The HEDI scenario contained the levels J = 30 and J = 120, thus creating overlap with both HEPO and EDDI. This overlap among conditions facilitates disentangling the impact of measurement field from the impact of response type.
For each replication, a new multidimensional bank was simulated and used to generate a data set
where Ypi represents the response on item i by person p, N(
In this study, the correlation matrix of the multivariate normal prior distribution for the latent dimensions was set to be homogeneous with the correlation among each pair of dimensions fixed to a value r:
CAT Simulations
The performance of the fixed-precision CATs was evaluated in terms of efficiency of the test administration procedure and quality of the latent trait estimation. For each replication (100 in total) within a cell of the experimental design, both an MCAT and a UCAT approach were applied to the same pregenerated item response data set and corresponding item bank. This means that CAT algorithm (UCAT/MCAT) is a within-subjects factor in the simulation design.
CAT Algorithm
In setting up a CAT, a few choices have to be made with respect to the specific algorithm that will be implemented to run the CAT. Here, the most commonly used setup for an MCAT as proposed by Segall (1996) was chosen: item selection and latent trait estimation were based on a maximum a posteriori (MAP) procedure using a multivariate normal prior with mean vector equal to zero and covariance matrix equal to
If, for a certain iteration, the fixed-precision threshold had been reached for a particular dimension, the remaining items pertaining to that dimension could no longer be selected for the following iteration (this could be seen as a constraint preventing the selection of items pertaining to dimensions for which the fixed-precision threshold has already been reached). The MCAT was terminated as soon as one or more of the following criteria had been met: (a) All three estimated latent trait values
For the UCAT conditions, separate CATs were run for each dimension; the starting, item selection, and stopping procedures were equivalent to those used in the MCATs, but adapted to a unidimensional setting (e.g., a univariate normal prior with mean equal to zero and variance equal to 1 was used). Note that given these settings, the MCAT and combined UCATs will produce equivalent results for conditions with latent trait population prior correlations of r = 0 (i.e., identical θ values and standard errors, differently ordered but same set of selected items, and equal total test length across the three dimensions).
The CAT simulations under these algorithmic settings were run in R (R Development Core Team, 2012) version 3.4 with the package mirtCAT (Chalmers, 2012) version 1.6.1.
CAT Evaluation Criteria
Feasibility of the CAT administration procedure was evaluated using two variables: (a) the percentage of simulees for whom the CAT reached SE termination on all three dimensions and (b) maximum obtained SE of the latent trait estimates across the three dimensions. Quality of CAT-based trait recovery was evaluated using the average absolute bias across the three dimensions. Bias was calculated as the difference between the true data-generating θ values and the corresponding CAT-based estimates. To study the efficiency of the CAT administration procedure, total test length across the three dimensions was evaluated. To facilitate the direct comparison of MCAT with UCAT conditions, relative efficiency of MCAT was computed for each simulee: 100(1 – MCAT [total test length] / UCAT [total test length]), with positive and negative values indicating gain and loss percentages in efficiency on the UCAT test length scale, respectively.
We were not merely interested in total average CAT performance but also in CAT performance conditional on θ values. For this purpose, four mutually exclusive θ-score groups were defined based on their location and Mahalanobis distance from the center of the latent three-dimensional hyperspace: (a) a middle group, (b) a concordant high group with persons located on the higher side of the scale on all three dimensions, (c) a concordant low group with persons located on the lower side of the scale on all three dimensions, and (d) a discordant group with persons located on mixed sides of the scale across the three dimensions (e.g., high, low, high). Additional details regarding group assignment can be found in the online supplement.
Results
CAT Simulation Results
The CAT simulation results are displayed in Tables 2 and 3 and Figures 4 to 6. First, the feasibility of using CAT is evaluated for each cell in the simulation design, along with the quality of CAT-based trait recovery. Second, results on measurement efficiency in terms of CAT length are presented.
Percentage of Tests That Was Terminated Successfully (i.e., the Fixed Precision Was Reached).
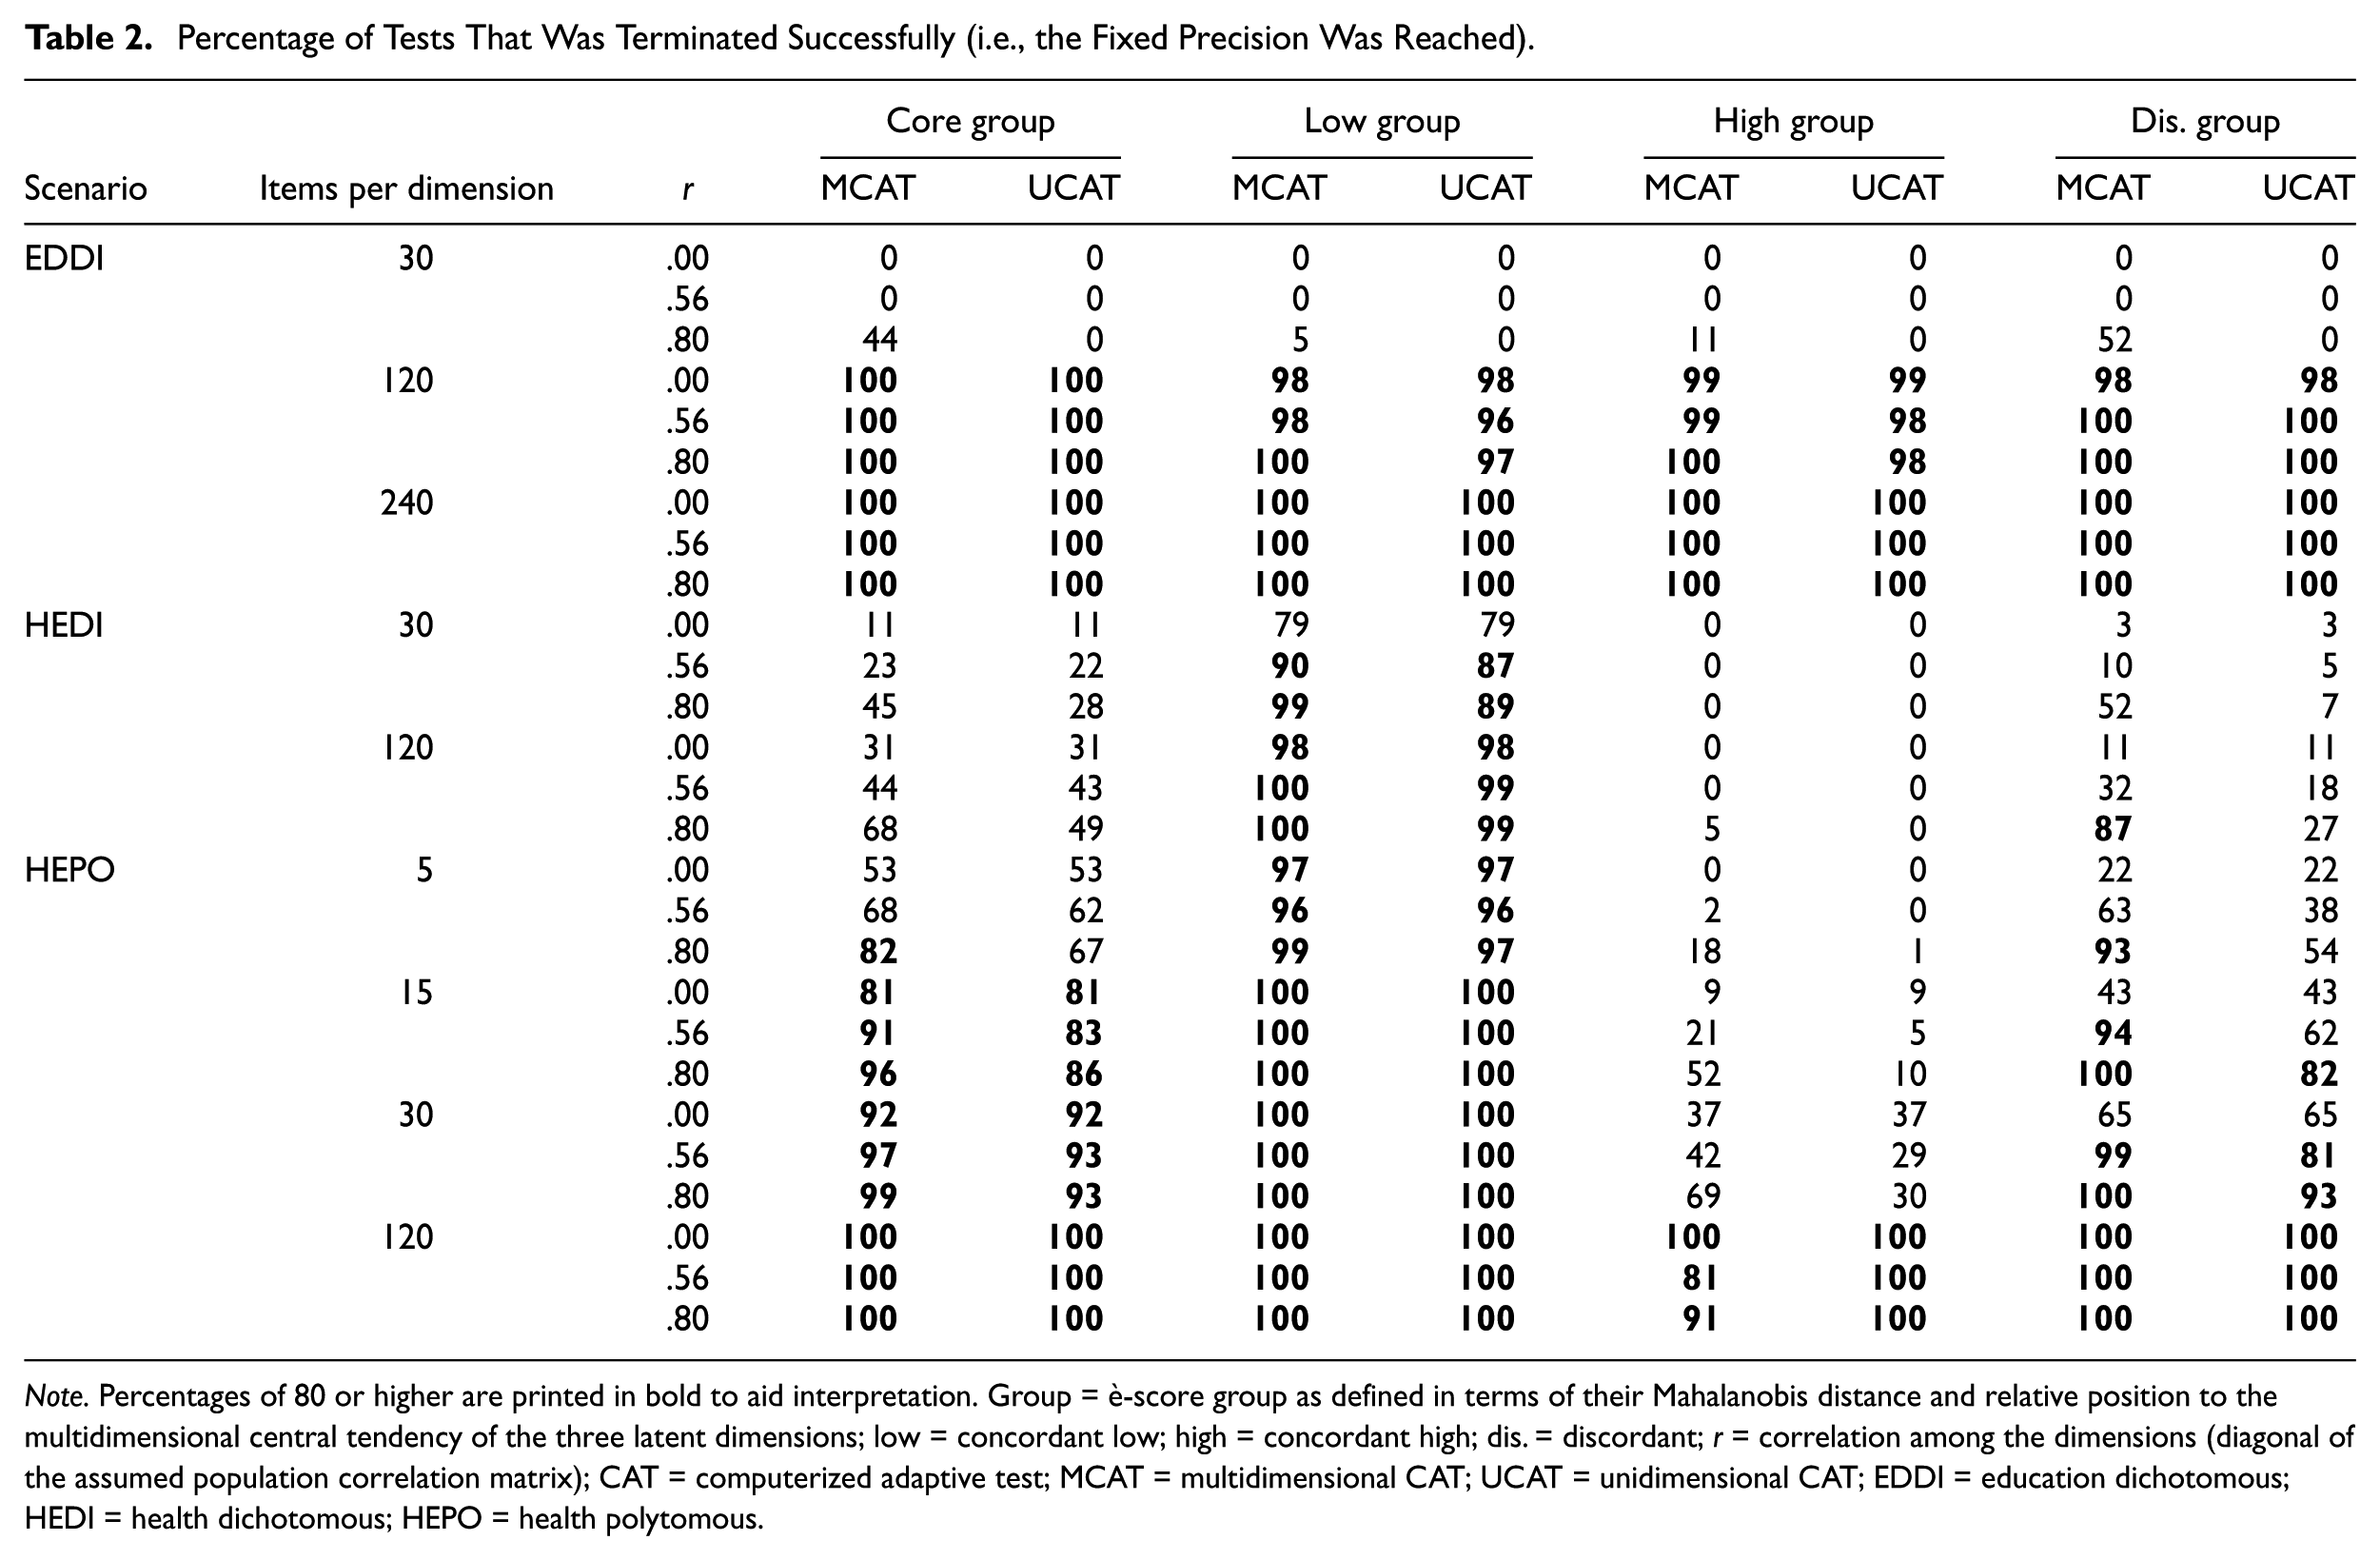
Note. Percentages of 80 or higher are printed in bold to aid interpretation. Group = è-score group as defined in terms of their Mahalanobis distance and relative position to the multidimensional central tendency of the three latent dimensions; low = concordant low; high = concordant high; dis. = discordant; r = correlation among the dimensions (diagonal of the assumed population correlation matrix); CAT = computerized adaptive test; MCAT = multidimensional CAT; UCAT = unidimensional CAT; EDDI = education dichotomous; HEDI = health dichotomous; HEPO = health polytomous.
Median Total Test Length.
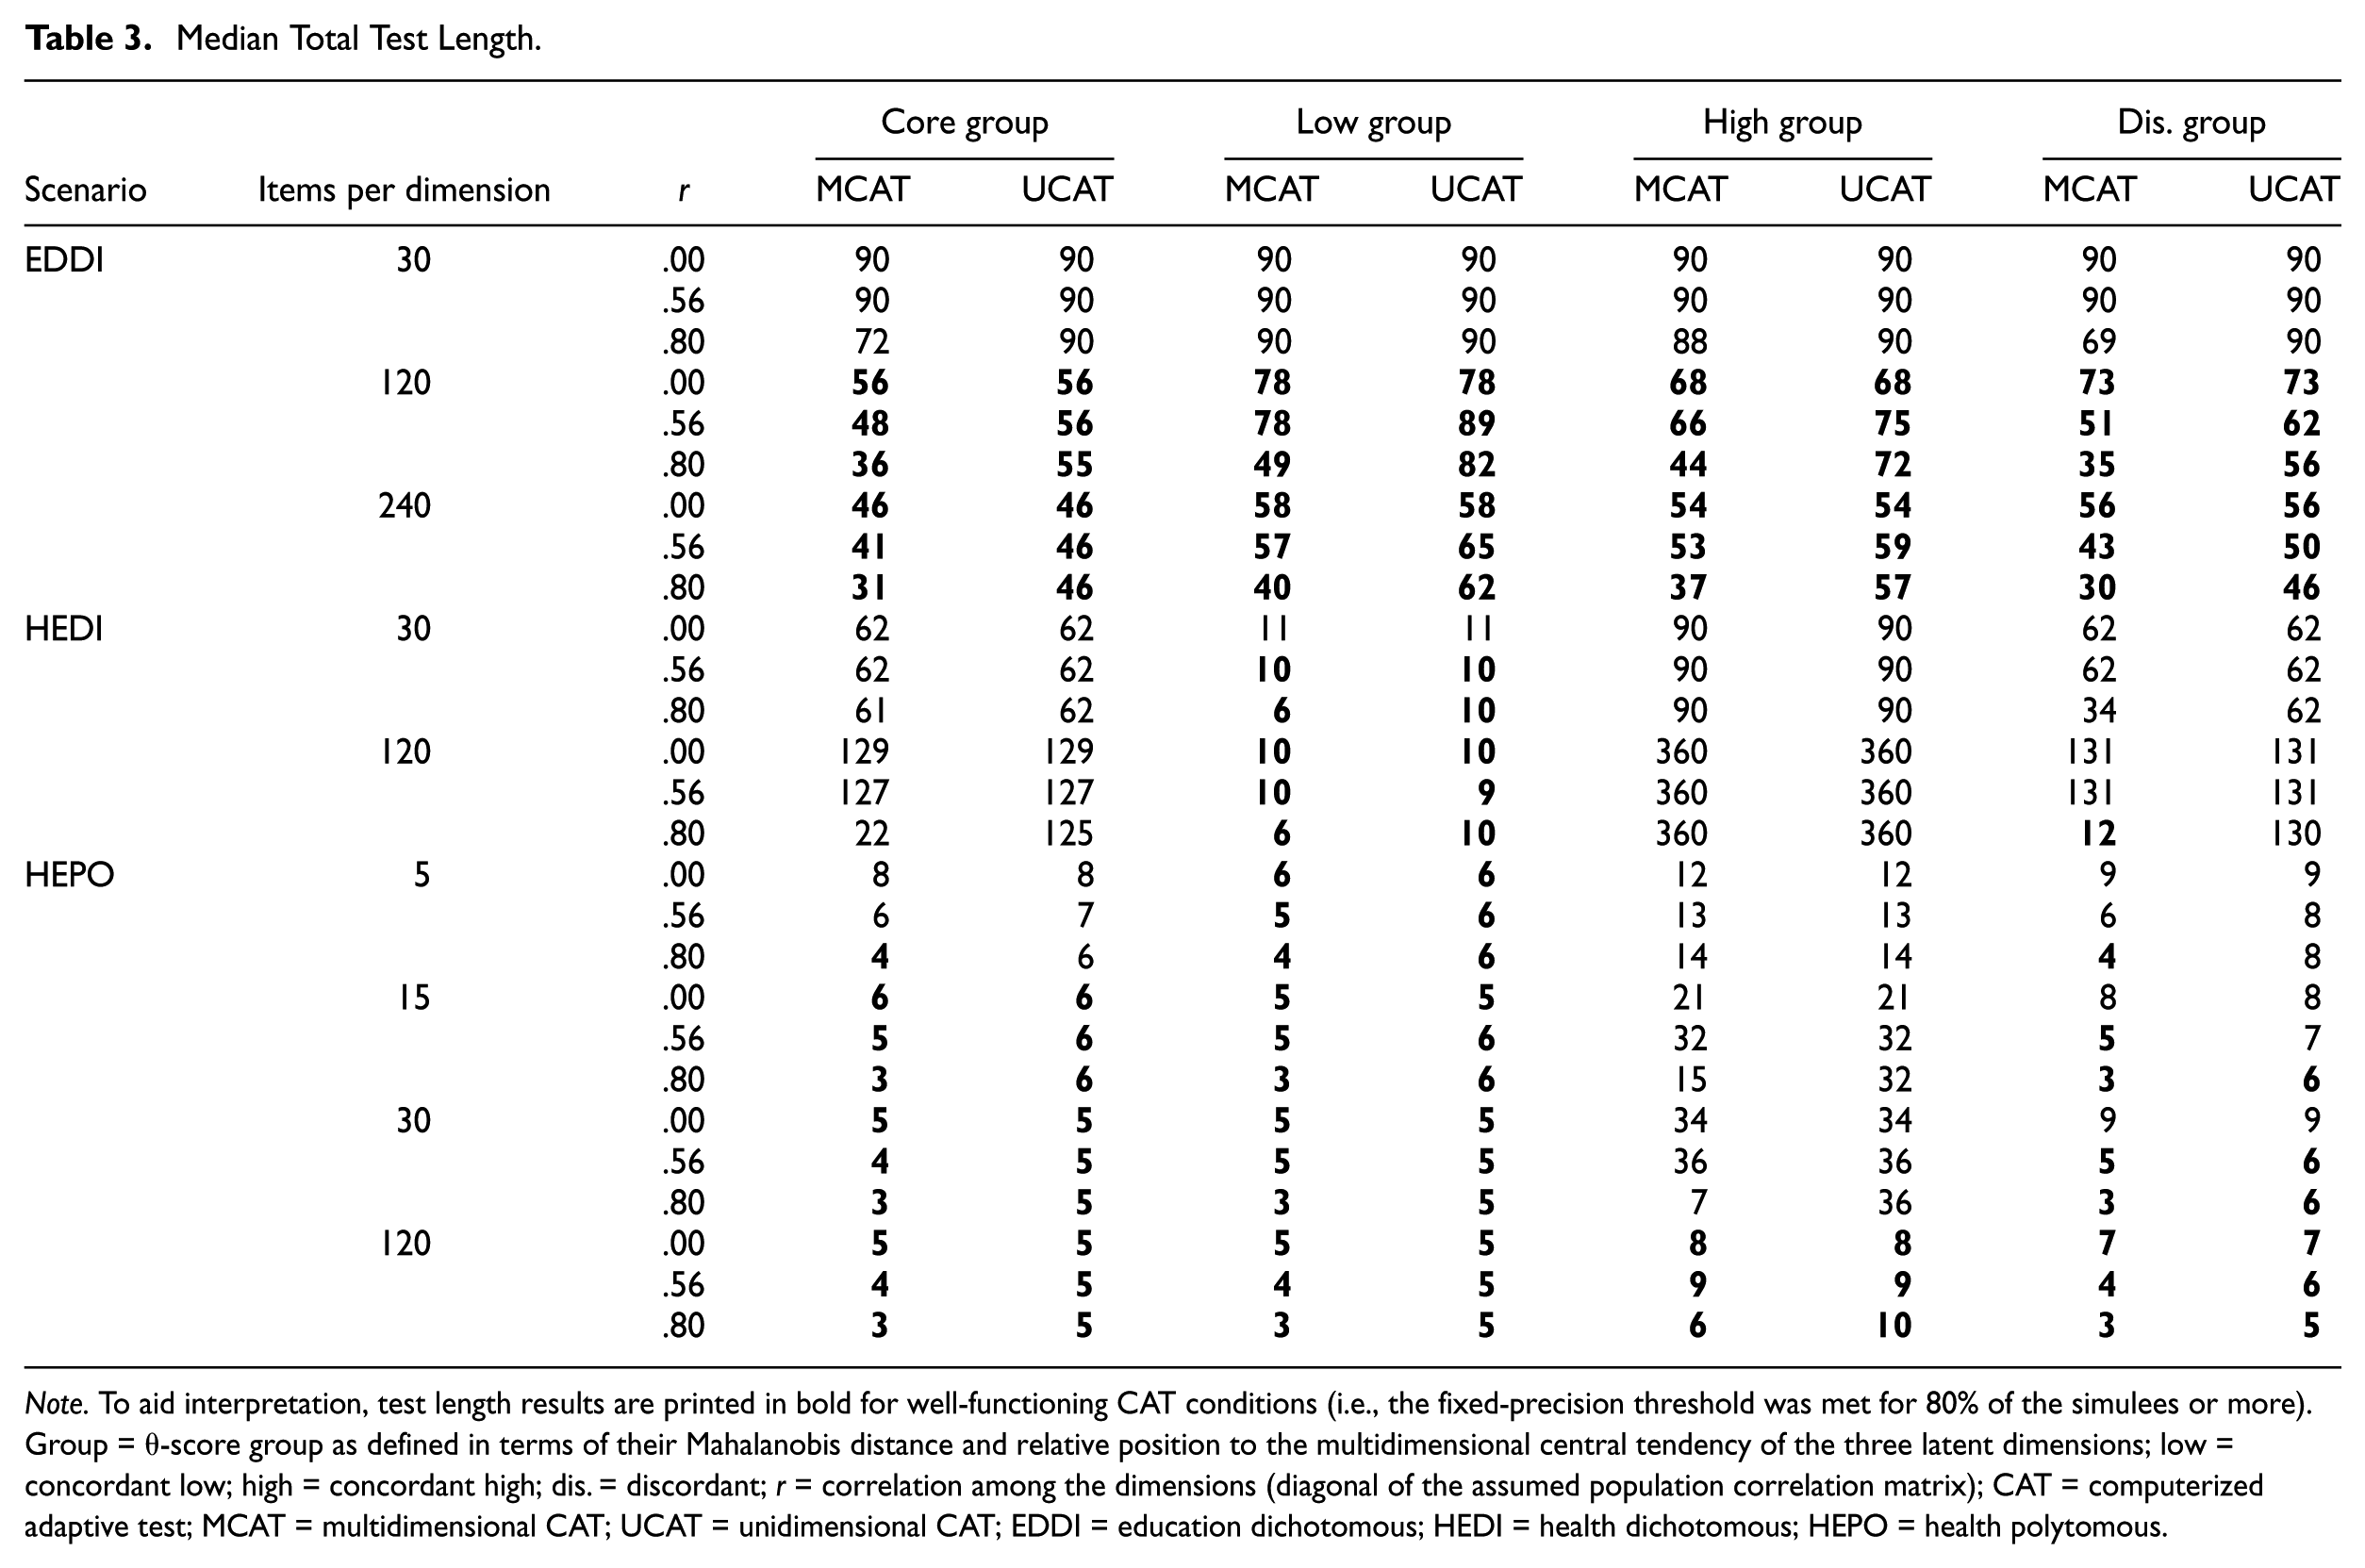
Note. To aid interpretation, test length results are printed in bold for well-functioning CAT conditions (i.e., the fixed-precision threshold was met for 80% of the simulees or more). Group = θ-score group as defined in terms of their Mahalanobis distance and relative position to the multidimensional central tendency of the three latent dimensions; low = concordant low; high = concordant high; dis. = discordant; r = correlation among the dimensions (diagonal of the assumed population correlation matrix); CAT = computerized adaptive test; MCAT = multidimensional CAT; UCAT = unidimensional CAT; EDDI = education dichotomous; HEDI = health dichotomous; HEPO = health polytomous.
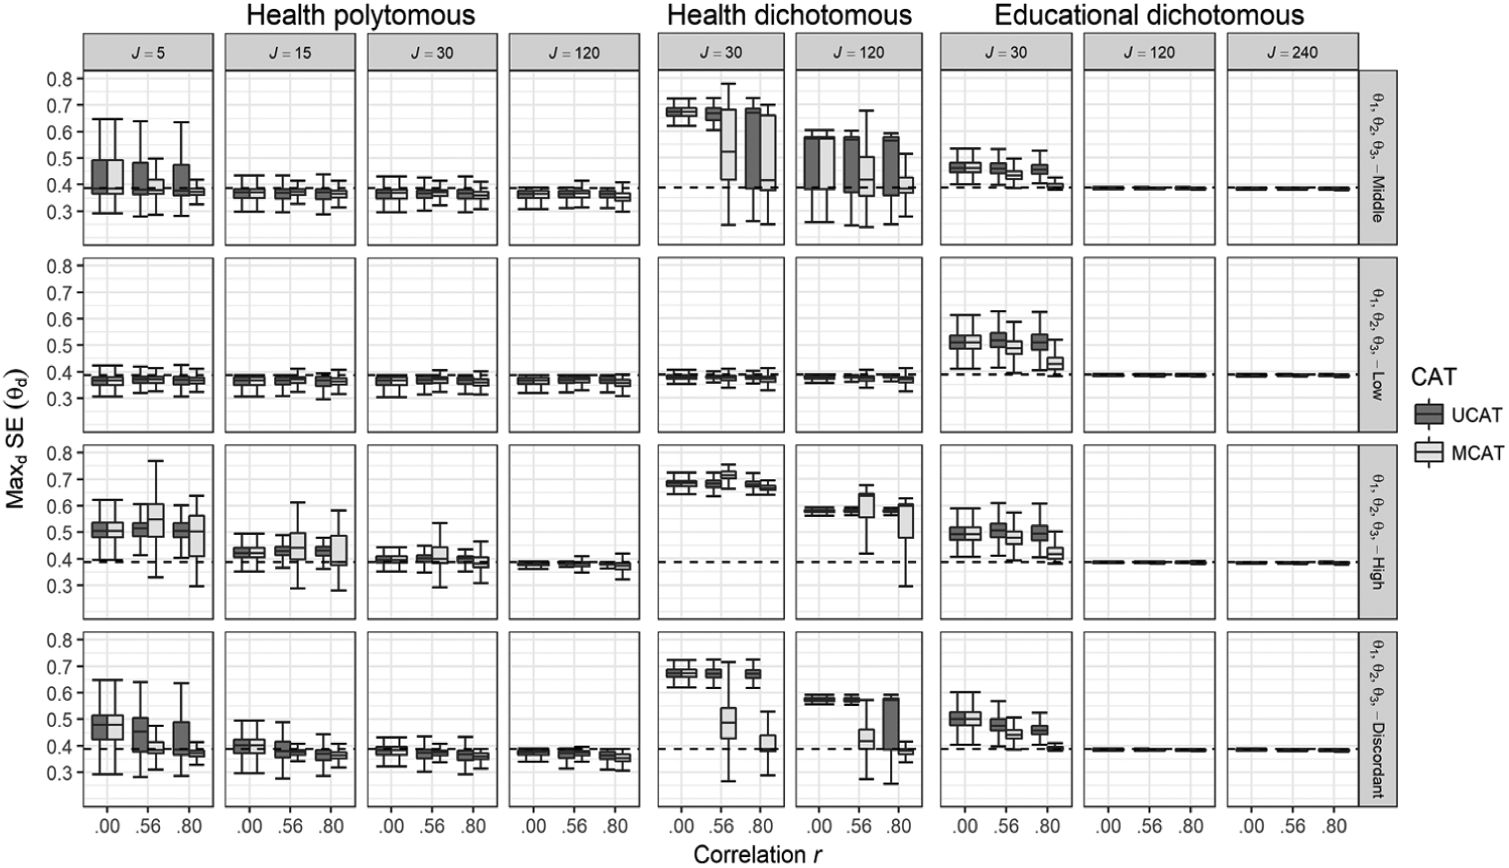
The maximum observed standard error (SE) across the latent trait dimensions as a function of number of items per dimension and correlation among the dimensions for the three scenarios and the four θ groups.
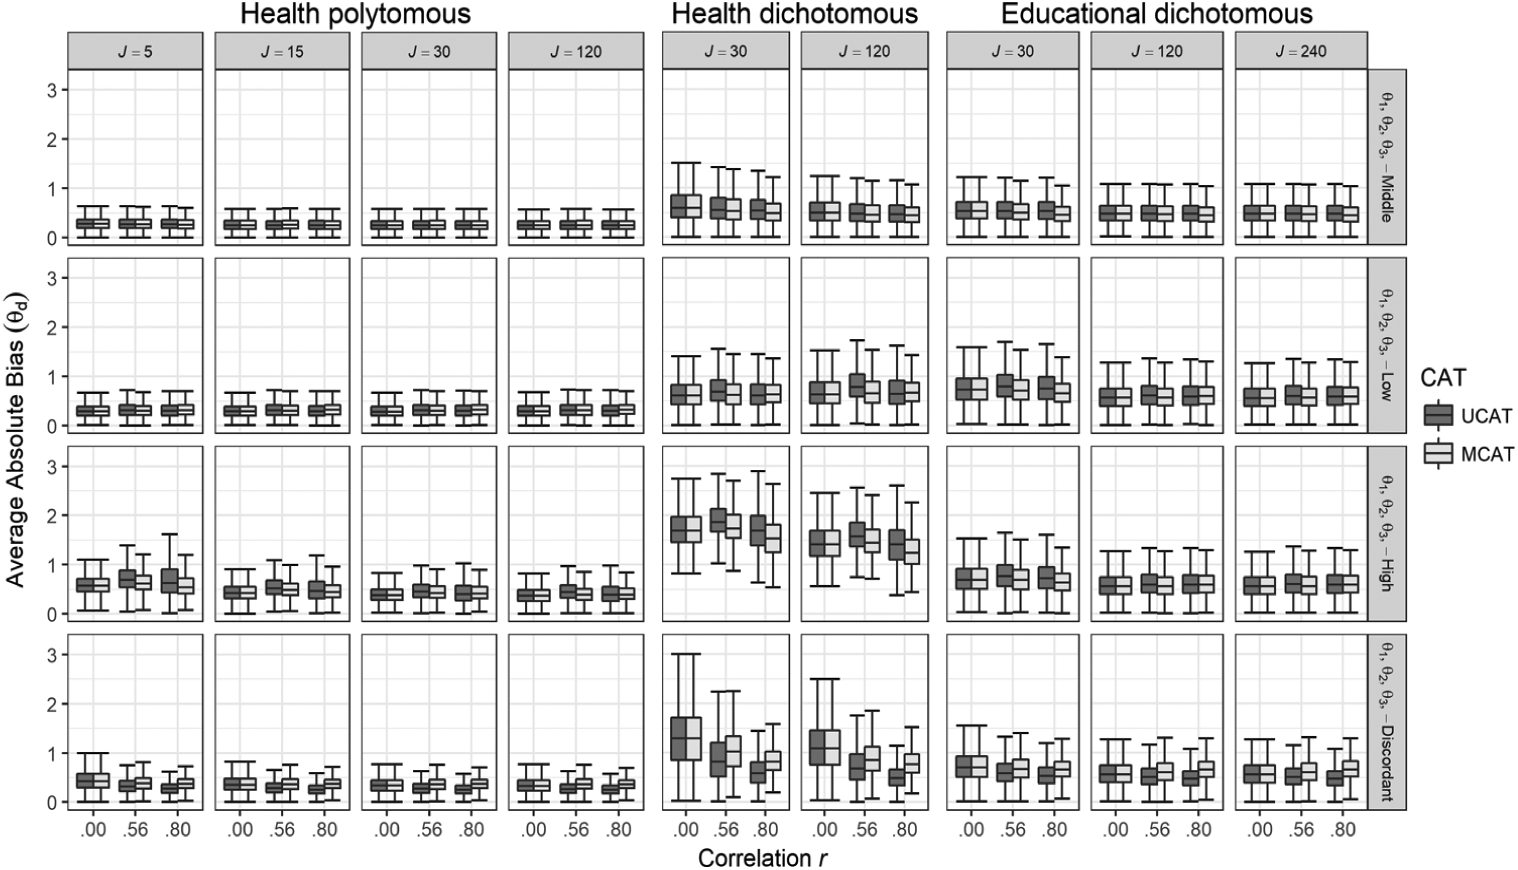
Average absolute bias of the latent trait estimation as a function of number of items per dimension and correlation among the dimensions for the three scenarios and the four θ groups.
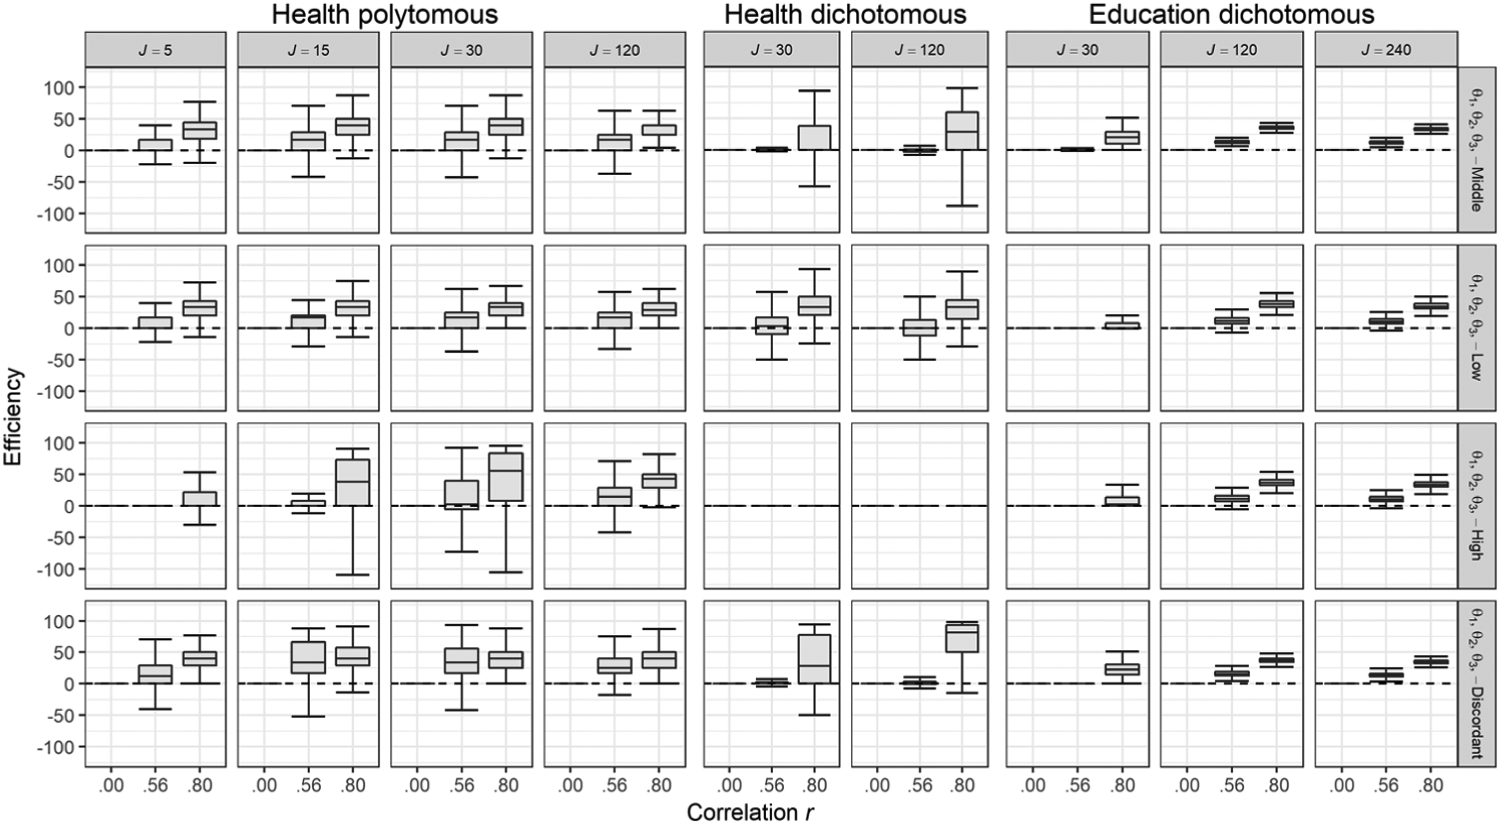
Relative efficiency gain associated with MCAT.
Feasibility of the CAT administration procedure and quality of CAT-based trait recovery
CAT termination
Table 2 shows the percentage of simulees for whom the CATs reached SE termination. To facilitate interpretation, we suggest that design cells with a percentage that falls below 80% for both MCAT and UCAT simulations should be disregarded when evaluating bias and measurement efficiency, because the conditions in these cells were not adequate for supporting fixed-precision CAT with the prespecified SE threshold. By focusing on the cells that could effectively support CAT (Table 2), it can be seen that MCAT results in a higher percentage of successful termination in 39% of the cases. This MCAT-associated increase in successful termination was larger for HEDI and HEPO than for EDDI. For four design cells, UCAT failed to reach the 80% successful termination criterion, whereas MCAT did result in meeting this criterion. All four cells pertained to the health scenarios, and three of these four cells concerned the discordant θ-score group.
For the EDDI scenario, the maximum obtained SE of the latent trait estimates across the three dimensions fell just below the fixed-precision threshold of 0.387 for most design cells (Figure 4). This is what you would expect to see for a well-functioning fixed-precision CAT. However, it also became clear that a sub-bank size J = 30 was too small to reach the fixed-precision threshold under the EDDI scenario. This was the case for both UCAT and MCAT; although—for the population with prior correlation r = .80—the MCAT did result in substantially lower maximum SEs (which for two groups got very close to the desired precision level).
In the HEPO scenario, the location of the simulees in the latent trait space (θ-score group) had a substantial impact on whether or not the fixed-precision threshold could be reached. For the well-targeted concordant low θ-score group, SE termination was even feasible for the smallest sub-bank size under study (J = 5). As bank size increased, the number of θ-score groups that could be adequately measured went up. This was true for both MCATs and UCATs.
The HEDI scenario was included in the design to link the EDDI and HEPO scenarios. This scenario can help disentangle the effects of item type and size of the discrimination parameters. The results from the HEDI scenario indicate that the differences between the EDDI and HEPO scenarios with respect to the impact of sub-bank size on CAT feasibility cannot be explained by a difference in item discrimination alone. The HEDI results showed that having highly discriminating dichotomous items restricted the measurement range considerably, such that, in contrast to HEPO, CAT was only feasible for the well-targeted concordant low θ-score group. Comparing the results under the EDDI and HEDI scenarios with those under the HEPO scenario shows that having polytomous items with well spread out thresholds is crucial in making CAT feasible for both a wider measurement range and relatively small sub-bank sizes.
Bias
The average absolute bias across the three dimensions is shown in Figure 5. Bias was slightly larger for groups that were less well targeted (i.e., both concordant θ-score groups in EDDI and the concordant high θ-score group in HEPO and HEDI). Bias was generally comparable between UCAT and MCAT across the three scenarios. The minor differences that occurred were in the expected directions. UCAT was associated with smaller bias for the discordant θ-score group. In that group, the θ vectors contained values that are dissimilar. The prior used in the MCAT conditions will pull the θ estimates of the different dimensions closer together; whereas that was not a desirable effect for these types of score patterns. Conversely, MCAT was found to result in more accurate θ estimates for the concordant θ-score groups, especially for smaller sub-bank sizes. Here, the θ vectors contained values that were rather similar, and borrowing information across the dimensions had a positive effect on measurement accuracy; the incremental value of borrowing information across dimensions was most pronounced for the ill-targeted concordant high θ-score group.
Efficiency of the CAT administration procedure: Total test length
An efficient fixed-precision CAT would need to administer only a small number of items to reach the SE stopping criterion. For the well-functioning CATs under the EDDI scenario, median total test length ranged from 31 to 89 (Table 3). For HEDI, test length was substantially shorter for well-functioning CATs: six to 12. However, CAT was not feasible for the majority of HEDI cells, so the comparison is severely hampered. For HEPO, the shortest median test length was found: three to nine items. These results show that CATs were clearly substantially shorter for the scenarios with high discrimination parameters.
As item banks grow larger and more high-quality items are available to choose from, test efficiency can be expected to increase. The results were indeed in line with this expectation: Overall, for the well-functioning CATs, test length diminished as item bank size increased (Table 3). The main focus in this article is on comparing MCAT with UCAT. The results showed that MCAT still had a substantial impact on test efficiency over and above the size of sub-banks and discrimination parameters. Figure 6 displays the relative efficiency of MCAT as compared with UCAT for each design cell (based on median test length). For feasible CATs in the EDDI scenario, MCAT was, on average, 11% shorter than UCATs for the r = .56 population and 35% shorter for the r = .80 population. For feasible CATs in the HEPO scenario, MCAT was 17% shorter than UCATs for the r = .56 population and 38% shorter for the r = .80 population. In short, the test length reduction associated with MCAT was substantial in many cases, for dichotomous and polytomous conditions alike. As could be expected, this reduction was larger for r = .80 than for r = .56.
Since polytomous items are typically richer in information than dichotomous items, the added benefit of using MCAT rather than separate UCATs may be smaller for polytomous items than for dichotomous ones. The results did not support this conjecture. For HEDI, a relative gain of MCAT over UCAT was only found for the r = .80 population and at levels similar to those observed for HEPO (and EDDI). This again underlines that it is not the item discrimination factor that was decisive for the MCAT efficiency gains in the HEPO scenario, but rather the wider θ-range coverage associated with well-functioning polytomous items (as compared with the narrower coverage by the dichotomous but equally discriminating items in the HEDI scenario).
Discussion
This study shows that the benefits associated with fixed-precision MCAT hold under a wide variety of circumstances. Overall, MCATs resulted in more frequent successful SE termination and shorter test length as compared with using separate UCATs per dimension. This trend was found for both educational testing and health measurement, medium and high correlations, dichotomous and polytomous items, across different item bank sizes, and for four types of θ-score patterns.
The first studies comparing MCAT with UCAT performance focused on measuring ability; these studies showed that fixed-length MCATs were 25% to 33% shorter and resulted in more accurate ability estimates (Li & Schafer, 2005; Luecht, 1996; Segall, 1996). A recent study comparing MCAT with UCAT in the context of health measurement showed that MCATs were, on average, 20% to 25% shorter compared with using separate UCATs (Paap, Kroeze, Glas, et al., 2017). Although it may be tempting, it is difficult to compare these figures across studies directly. In this study, we explicitly chose to evaluate fixed-precision MCAT performance under various circumstances, to facilitate direct comparisons across conditions and to be able to paint a more detailed picture regarding the potential benefits of MCAT. We were curious to see whether the incremental value of MCAT found for item banks typical for educational testing would generalize to item banks typical for health measurement.
Although the main trend was comparable across conditions, some differences emerged. First of all, CAT was not feasible for short (30 items per dimension) educational banks. This was not entirely surprising, given the dichotomous nature of the items. When it comes to polytomous items, previous studies have shown that item banks as small as 20 to 30 items per dimension may be adequate in supporting CAT when exposure control is not an issue (Boyd, Dodd, & Choi, 2010; Dodd, De Ayala, & Koch, 1995; Paap, Kroeze, Terwee, van der Palen, & Veldkamp, 2017). Overall, this study showed support for these findings, but it also allowed for refinement: Feasibility in the HEPO scenario was dependent on the observed θ-score pattern (for banks with 30 items or fewer per dimension). CAT was feasible for three out of four θ-score groups for banks with as few as 30 items per dimension. Although the number of θ-score groups that could be adequately measured with CAT decreased as the item bank size diminished, the well-targeted θ-score group could still be measured well with a CAT based on an item bank containing only five items per dimension. For four design cells, only MCAT resulted in acceptable frequencies of successful SE termination. Three of these cells concerned the health (HEDI or HEPO)/high correlation/discordant θ-score group combination. Some authors have speculated that MCAT may have little to add if polytomous items are used, because polytomous items are generally considerably richer in information than dichotomous items (e.g., Paap, Kroeze, Glas, et al., 2017). Our results did not support this conjecture: Although UCATs based on polytomous items were already very short, MCATs were shorter still. It should be noted, however, that measurement efficiency and/or successful SE termination may come at the expense of accuracy for persons with θ-score combinations that have a low probability of occurring given the prior correlation matrix. In such instances, the prior will pull the θ estimates of the different dimensions closer together, which may not be a desirable effect for these types of score patterns.
On the basis of our results, we recommend that item bank developers using polytomous items in the field of health measurement evaluate whether the polytomous items perform as they should (adequate coverage in each category, well spread out thresholds) and explicitly check whether targeting is adequate in the θ range of interest, before settling on a small item bank. They could further consider using MCAT rather than separate UCATs, because using MCAT may result in a higher percentage of successfully terminated CATs as well as increased test efficiency.
Although we went to great lengths to design as comprehensive a comparative study as possible, more research is needed to ascertain to what degree the findings presented here can be generalized beyond the included design factors; for example, a different number of dimensions, other scenarios, content balancing, or using different item selection methods and stopping criteria (possibly in combination with exposure control methods).
Supplementary Material
Supplementary Material, onlinesupplement_APM-17-08-151.R1 – Measurement Efficiency for Fixed-Precision Multidimensional Computerized Adaptive Tests: Comparing Health Measurement and Educational Testing Using Example Banks
Supplementary Material, onlinesupplement_APM-17-08-151.R1 for Measurement Efficiency for Fixed-Precision Multidimensional Computerized Adaptive Tests: Comparing Health Measurement and Educational Testing Using Example Banks by Muirne C. S. Paap, Sebastian Born and Johan Braeken in Applied Psychological Measurement
Footnotes
Acknowledgements
The authors thank two anonymous reviewers for their careful reading of the article and their helpful comments.
Authors’ Note
The simulations were performed on the Abel Cluster, owned by the University of Oslo and the Norwegian metacentre for High Performance Computing (NOTUR), and operated by the Department for Research Computing at USIT, the University of Oslo IT Department.
Declaration of Conflicting Interests
The author(s) declared no potential conflicts of interest with respect to the research, authorship, and/or publication of this article.
Funding
The author(s) disclosed receipt of the following financial support for the research, authorship, and/or publication of this article: This research was supported by a Gustafsson & Skrondal visiting scholarship for the second author, awarded by the Center for Educational Measurement at the University of Oslo (CEMO).
Supplemental Material
Supplemental material is available for this article online.
References
Supplementary Material
Please find the following supplemental material available below.
For Open Access articles published under a Creative Commons License, all supplemental material carries the same license as the article it is associated with.
For non-Open Access articles published, all supplemental material carries a non-exclusive license, and permission requests for re-use of supplemental material or any part of supplemental material shall be sent directly to the copyright owner as specified in the copyright notice associated with the article.