
Abstract
We investigate how the complexity of the social environment (more vs. less groups) influences attitude formation. We hypothesize that facing a larger number of groups renders learning processes about these groups noisier and more regressive, which has two important implications. First, more-complex social environments should lead perceivers to underestimate actual group differences. Second, because most people usually behave positively, more-complex social environments produce negatively biased attitudes and cause perceivers to overestimate the frequency of “negative” individuals among groups. We tested these predictions in five attitude formation experiments (N=2,414). Participants’ attitudes and learned base rates of positive and negative group members proved more regressive in complex social environments, that is, with multiple groups, compared with less-complex environments, that is, with fewer groups. In a predominantly positive social environment, this regression caused participants to form more negative group attitudes and more strongly overestimate negative individuals’ prevalence among groups.
A central task of the human mind is to form attitudes toward individuals and groups to select whom to approach and whom to avoid. Psychological research has long been interested in the systematic biases that arise when people form attitudes about individuals or groups (e.g., Fiske & Taylor, 1991; Yzerbyt & Demoulin, 2010). These phenomena have been investigated from different theoretical perspectives. Some approaches rely on people’s self-serving motives to explain the formation of negative attitudes toward out-groups or minority groups (Abrams & Hogg, 1988; Brewer, 1991; L. Gaertner & Insko, 2000; Tajfel & Turner, 1979). Others have identified causes within basic cognitive principles such as evaluative learning and within the structure of the external information ecology (Hamilton & Gifford, 1976; Kutzner & Fiedler, 2017). Specifically, the latter cognitive-ecological perspective emphasizes that negatively biased attitudes emerge because cognitive principles of information processing interact with characteristics of the external information ecology, such as information salience, frequency, or order (Alves et al., 2018, 2023), leading to predictable biases and errors (e.g., Walasek & Stewart, 2015).
Following this cognitive-ecological perspective, we investigated how the complexity of social learning environments influences attitude formation. We define complexity as the number of social groups that (subjectively) exist in a social environment. For example, people may live in a relatively homogeneous environment with few religious, ethnic, cultural, or ideological groups, or a more heterogeneous environment comprising many different groups. In the latter case, forming attitudes toward the various groups is cognitively more demanding than in the former; tracking more categories is more difficult than tracking a few categories. Likewise, people may categorize their fellow citizens into more superordinate groups, reducing social complexity. Alternatively, they may form more subordinate groups, making attitude-formation processes more challenging. While there are other ways to define complexity (e.g., ease of categorizing group members), we start with a basic approach and investigate how the number of groups in a given social environment influences attitude formation.
We predict that more-complex social environments render attitude formation noisier. This should result in more regressive attitudes that underestimate existing differences between groups. In addition, because most social environments are predominantly positive, more-complex social environments should produce more negative attitudes as implied by regression. We derive our predictions and assumptions in detail in the following and then present results from five attitude formation experiments that tested these predictions.
Regression in Learning
Attitude formation, like any form of learning, is a noisy process. When people form impressions about social groups and their members, systematic as well as random errors will occur. For example, perceivers forget or mix up certain pieces of information related to social groups (Klauer & Wegener, 1998). Random errors cause regression to the mean (Campbell & Kenny, 2002; Fiedler & Unkelbach, 2014; Furby, 1973), which means that people overestimate the number of infrequent events and underestimate frequent events (Erev et al., 1994; Fiedler & Armbruster, 1994). Regression to the mean is a statistical term that Campbell and Kenny (2002) defined as the difference between a perfect correlation (here: of subjective frequency and actual frequency across people) and the actual correlation. This definition implies two constituents for regression. First, it depends on how noisy the learning process is. For example, consider a case where perceivers observe a group’s friendly and unfriendly members. Let us assume that the actual probability (i.e., the normed frequency) of friendly group members is .75 and that of unfriendly members is .25. Due to errors in encoding and retrieval, there is noise in the learning process. Noisy learning results in a nonperfect correlation (r < 1) between the actual and the learned probability. In the case of relatively weak noise, this correlation may be r = .8, and in the case of strong noise, it may be r = .3. In both cases, learned probabilities will regress toward the mean but to different degrees. Figure 1 illustrates this point for the case of weak (r = .80) and strong noise. (r = .30). In case the of weak noise, an actual probability of .75 (i.e., the normed frequency) will regress to plearned = .70; in the case of strong noise, it regresses to plearned = .58.
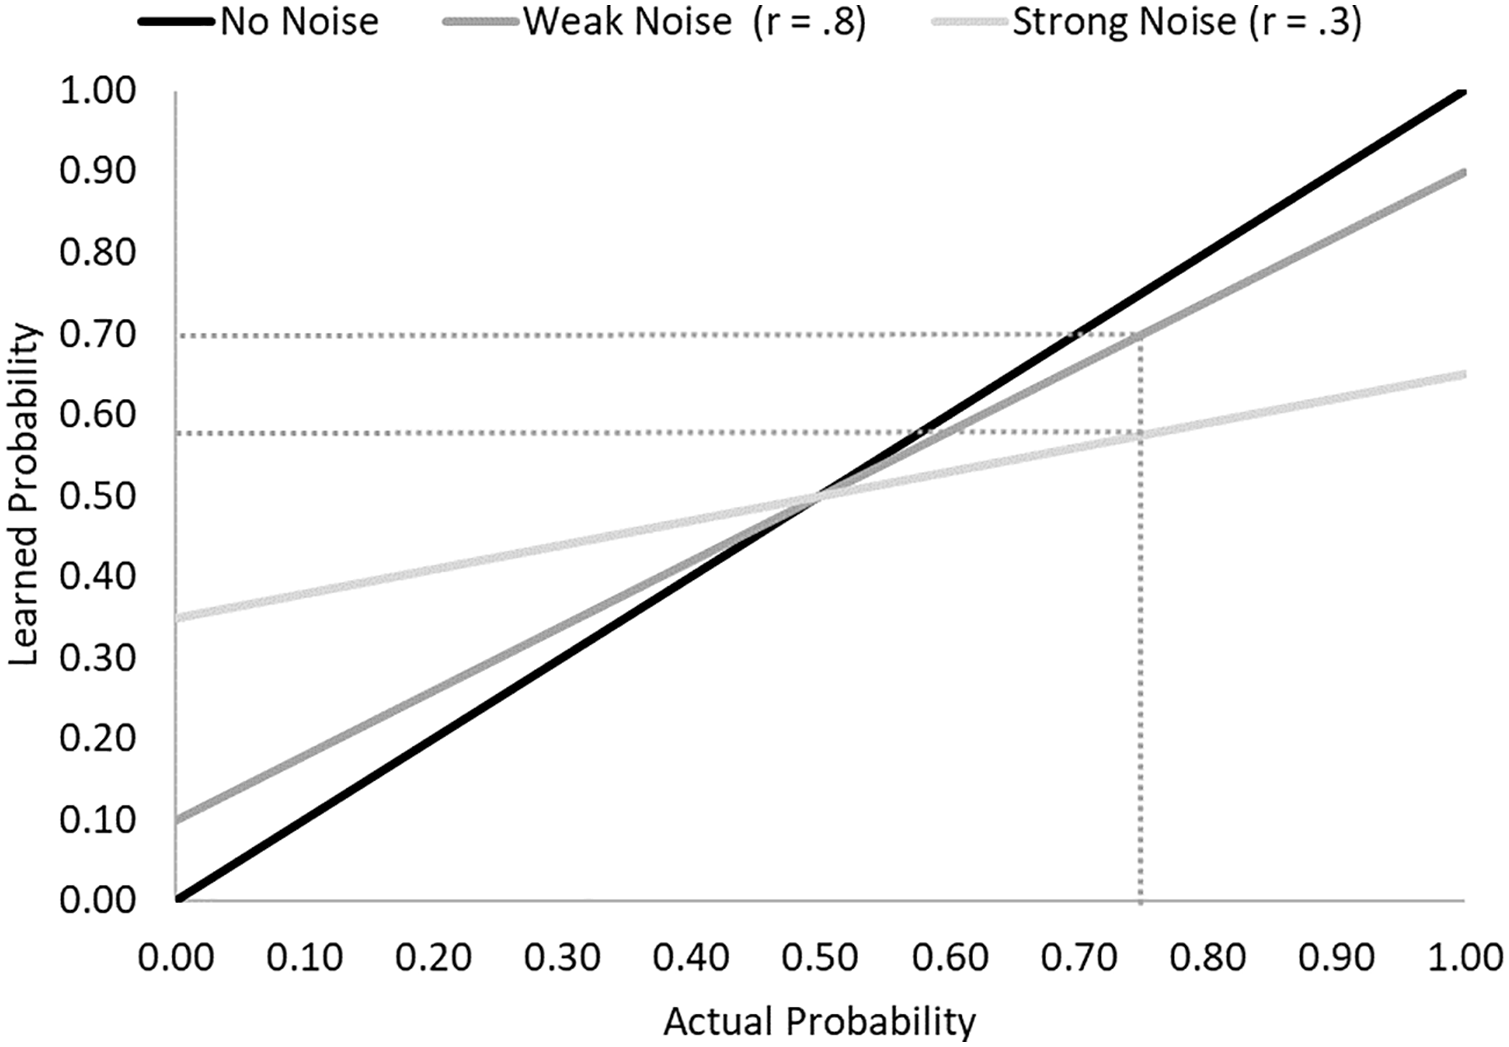
Illustration of Regressive Learning.
The second constituent of regression to the mean effects is the extremity of the probability (or: frequency). The learned probability (plearned) is given by the actual probability (pactual) minus its deviation from the scale mean (pactual—Mp) multiplied by noise (1—r [pactual, plearned]). Thus, more-extreme probabilities (i.e., very low and very high) will regress more than less-extreme probabilities. For example, for weak noise (r = .80), an actual probability of pactual = .90 will lead to learned probabilities of plearned = .82, while a less-extreme probability of pactual = .60 will only shrink to plearned = .58.
When attitudes derive from experiences, whether factual, symbolic, or imagined, noise may lead not only to regressive base rate judgments but also to regressive attitudes. When perceivers form attitudes about social groups by observing and evaluating group members and their behaviors or traits, resulting attitudes are likely a function of the relative frequencies of positive and negative observations. If the attitude formation process was noise-free, perceivers’ attitudes should correspond to the groups’ objective prevalence of positivity and negativity. In other words, people should form more positive attitudes toward more friendly groups than toward less-friendly groups. However, if attitude formation is imperfect and thereby noisy, attitudes will become regressive, and people’s attitudes toward friendly and less-friendly groups will become more similar.
The degree to which learning and attitude formation are regressive depends on the degree of noise during learning. The degree of noise is determined by factors within the perceiver (e.g., motivation, cognitive resources, etc.) and external characteristics of the task environment. In the following, we hypothesize that the complexity of the learning environment constitutes one such characteristic that determines the degree of noise in attitude formation.
Categorization, Complexity, and Attitude Formation
Categorization mitigates the informational environment’s intricacy by segmenting multiple stimuli into fewer categories (Mervis & Rosch, 1981; Rosch & Lloyd, 1978). In the social realm, individuals are grouped based on various characteristics, a method that facilitates an economical representation of the social landscape (e.g., Crisp & Hewstone, 2007; Fiske & Neuberg, 1990). Yet, categorization can lead to perceptual inaccuracies in the form of overgeneralized stereotypes and prejudices. Thus, the dichotomy of (social) categorization lies between its beneficial role in cognitive resource management and its inherent information loss.
At first sight, information loss through categorization is particularly strong when categories are broad, lumping many exemplars (e.g., individuals) into a few categories (e.g., groups). However, forming more categories (i.e., allowing higher complexity) does not necessarily decrease information loss. Sometimes, a more complex category structure may result in less-accurate perceptions. This happens when categories (i.e., groups) are redundant regarding an attribute (e.g., likeability). To illustrate, the prevalence of friendly people may be similar among different religious groups, such as Christians, Muslims, Jews, Buddhists, Hindus, and so on. By subsuming these categories into the single category of “religious people,” no information regarding the friendliness of group members is lost. Instead, the broader categorization into “religious people” may even render more accurate perceptions than the more fine-grained categorizations. As described earlier, learning processes are regressive, and the degree of regression depends on the noisiness of the learning process. Assuming that a more complex learning environment that is comprised of more groups renders the attitude formation process more difficult and thus more regressive, resulting group representations will be less accurate. Forming attitudes toward six religious groups provides more opportunities for error than forming attitudes toward a single group of “religious people.” Consequently, people’s attitudes should more accurately reflect the actual friendly behaviors of the encountered group members when the learning environment hosts only a few groups compared with many groups.
An even more significant implication is that attitudes should generally be more negative in complex social learning environments. This latter implication requires that most groups have mostly positive group members or show mostly friendly behaviors, an assumption which we will spell out in the following section.
Most People Are “Good”
In the evaluative information ecology, positive attributes and behaviors have been shown to be more prevalent than negative ones (Alves et al., 2017a, 2017b; Koch et al., 2016; Unkelbach et al., 2019, 2020). Most people behave positively most of the time, and social groups usually have more members with desirable than undesirable attributes (Alves et al., 2018). This is reflected in people’s tendencies to evaluate others positively (e.g., Rothbart & Park, 1986) and to expect positive behaviors from others (Sears, 1983). The positivity prevalence in social interactions has several contributing factors. Evolutionary, cooperative behavior among members of social groups has survival advantages and thereby “lays down a fundamental basis for all social life” (Axelrod & Hamilton, 1981, p. 1391; see also Hardin, 1968; Sally, 1995). Relatedly, the social environment typically reinforces positive behavior and sanctions negative behavior. Following the “law of effect” (Thorndike, 1898), people can be expected to repeat reinforced behaviors and avoid sanctioned behaviors. For example, people are likely to meet again with a friendly person but avoid spending more time with someone who behaved negatively in the past (Denrell, 2007; Denrell & Le Mens, 2007). In addition, as positive behaviors are reinforced, people acquire positive attributes over time and lose negative attributes (up to a certain point; M. Baldwin et al., 2024). Consequently, in most social environments, most people do not constitute a threat to one another, and encountering a harmful person remains a rare event. Conversely, we can assume that the social environment comprises people with mostly positive attributes or who show mostly friendly behaviors.
The Overestimation of Bad People in Complex Environments
Given that positive behaviors are prevalent and noisy learning processes lead to regression, perceivers should overestimate the frequency of negative individuals in the environment and underestimate the frequency of positive individuals (Erev et al., 1994). This basic idea is illustrated in the left part of Figure 2, where a simple environment hosts one group with 18 positive individuals (gray dots, i.e., people who generally behave positively) and only three negative individuals (black dots, i.e., people who generally behave negatively). Perceivers can learn these frequencies rather accurately with weak noise, and the overestimation of negative group members in perceivers’ subjective representations will be moderate.
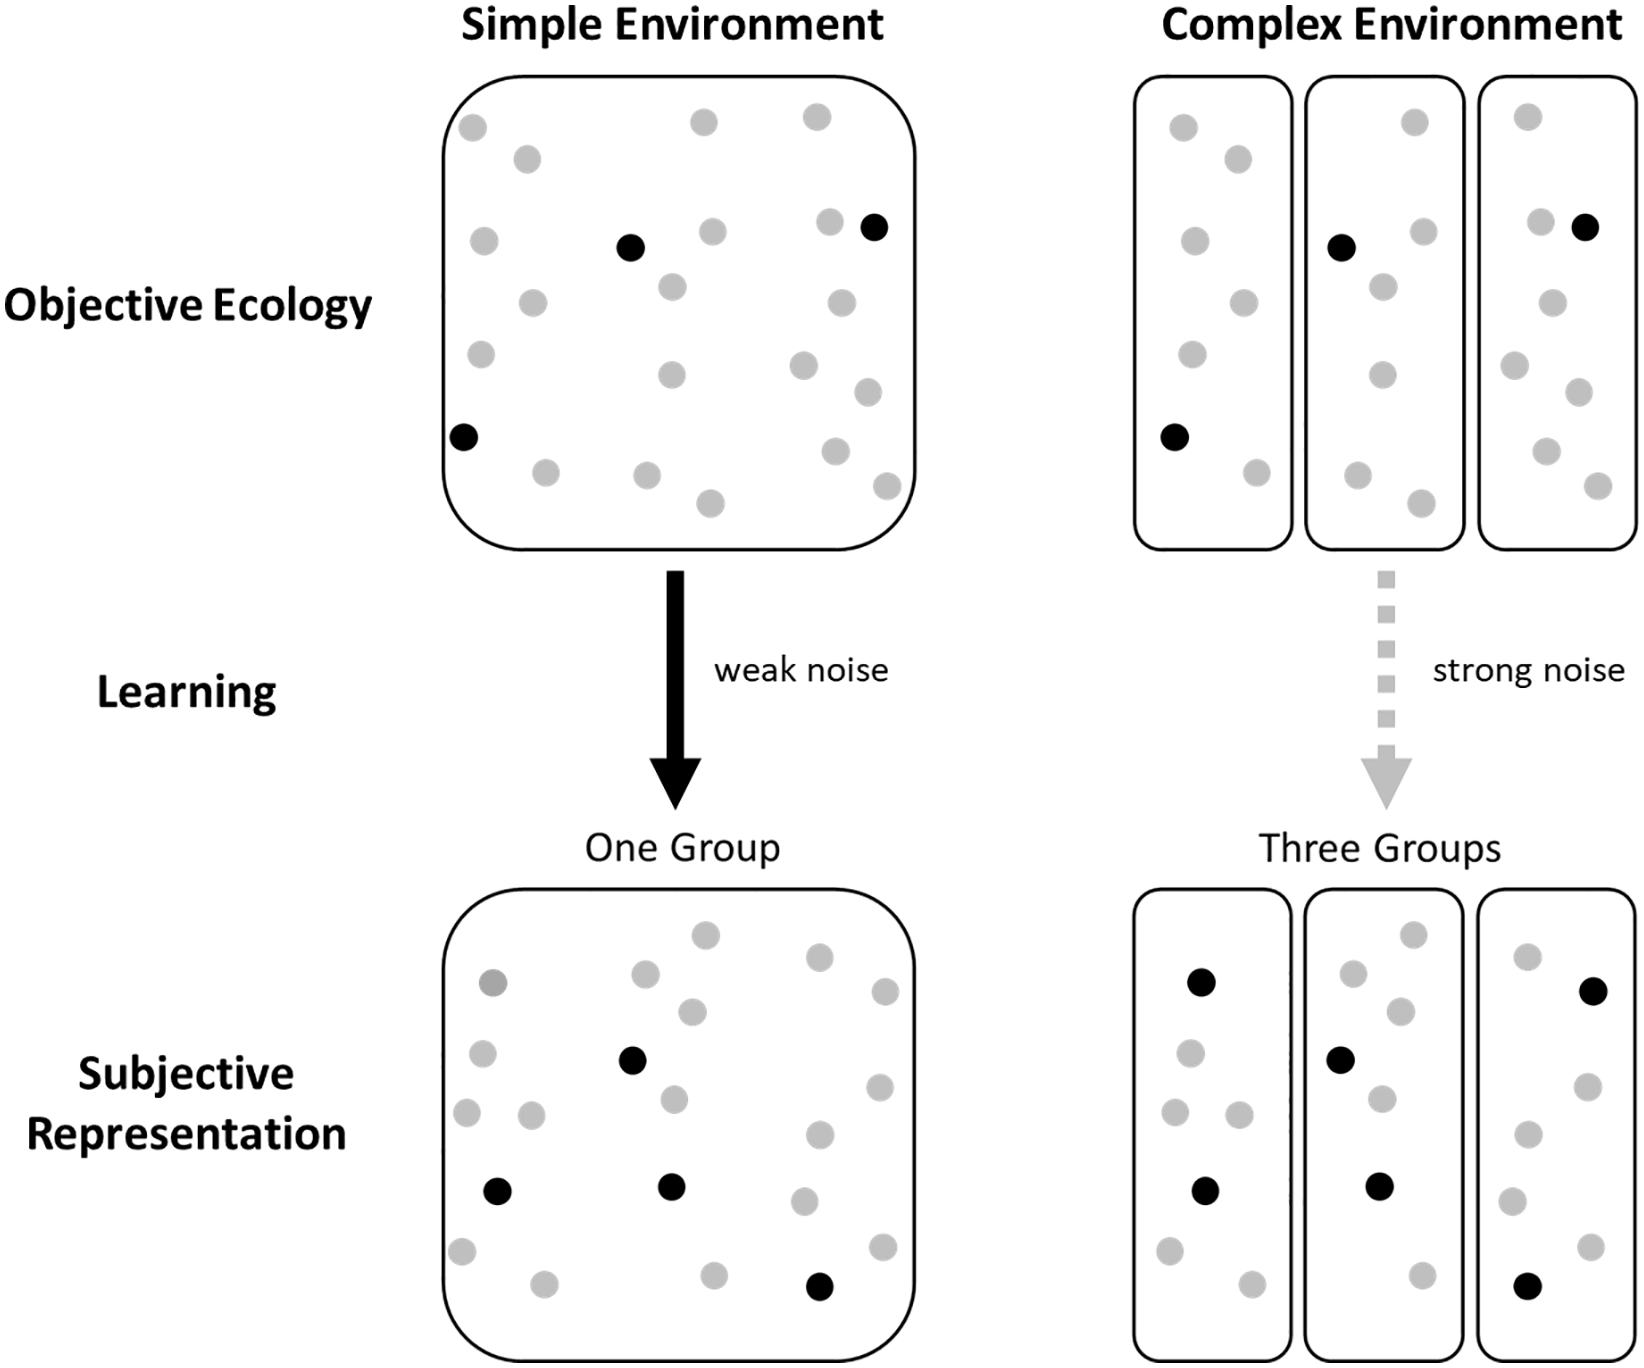
Illustration of the Relation Between Social Complexity and Regression.
Adding our assumption that increasing complexity renders learning noisier and, therefore, more regressive, we expect an increase in the overestimation of the number of negative individuals when people form attitudes toward three instead of one group. The right part of Figure 2 illustrates this consequence. Here, the social environment is more complex as the population is split into three subgroups, each hosting six positive and one negative individual. The higher complexity will render learning noisier. In perceivers’ subjective representation, regression due to stronger noise leads to people overestimating the number of negative group members. Therefore, perceivers will arrive at more negative group attitudes than perceivers in a less-complex environment.
Overview of Experiments
To summarize, we assume that complexity increases noise in learning, leading to regression. Hence, more-complex social environments should lead perceivers to underestimate actual group differences. In addition, we assume that most groups show a prevalence of positive behaviors. These assumptions lead to the prediction that when social environments are more complex, attitudes should become more negative. We tested our predictions under well-controlled experimental conditions. We conducted five experiments that manipulated our model’s causal variables, namely, the complexity of the environment (i.e., few vs. many groups) and group valence (i.e., positivity prevalence low or high). We used a simple attitude formation paradigm in which participants imagined traveling to a remote planet where they encountered members of different alien groups. We assigned some participants to a low-complexity environment consisting of only one or two alien groups. In contrast, we exposed others to a high-complexity environment consisting of three or six different alien groups, respectively. Participants encountered all group members individually and learned their task was to form an impression about the alien groups. Afterward, participants had to recall the number of friendly and hostile members of each group and/or rate each group’s likeability.
All Experiments were preregistered; the preregistrations, materials, and data are available on the Open Science Framework (https://osf.io/823gr/?view_only=62def61e014b4580ac6f6e234f1ad514). We report all manipulations and measures used in all five experiments and all data exclusions (if any).
Experiment 1
Experiment 1 tested the prediction that attitudes and recalled frequencies of friendly and hostile group members are more regressive when the learning environment comprises more groups. This should result in an underestimation of existing group differences. Participants in all conditions encountered 24 aliens, all of whom were either described as friendly or hostile. We manipulated the number of groups participants encountered as the aliens belonged to two or six groups (i.e., alien “tribes”). We manipulated the valence of the groups within participants, which was either predominantly positive (75% friendly members – 25% hostile members) or predominantly negative (75% hostile members – 25% friendly members). In the end, we asked participants to recall the number of friendly and hostile members of each group and to rate the likeability of each group.
Method
To ensure sufficient statistical power (>.80) to detect small- to medium-sized effects (ηp2 = .02) in the present design, we aimed for a sample size of 400. We recruited participants through Prolific Academic and obtained data from 401 U.K. participants. Each received £0.45 for compensation. We assigned participants to either a two-group or six-group condition. In both, half the groups were mainly positive, p(friendly) = .75, p(hostile) = .25, while the other half were mainly negative, p(friendly) = .25, p(hostile) = .75. All participants encountered 24 cartoon aliens one-by-one (sourced from Gupta et al., 2004). Table 1 details the number of friendly and hostile members in each condition.
Frequencies of Friendly and Hostile Group Members in Experiment 1.
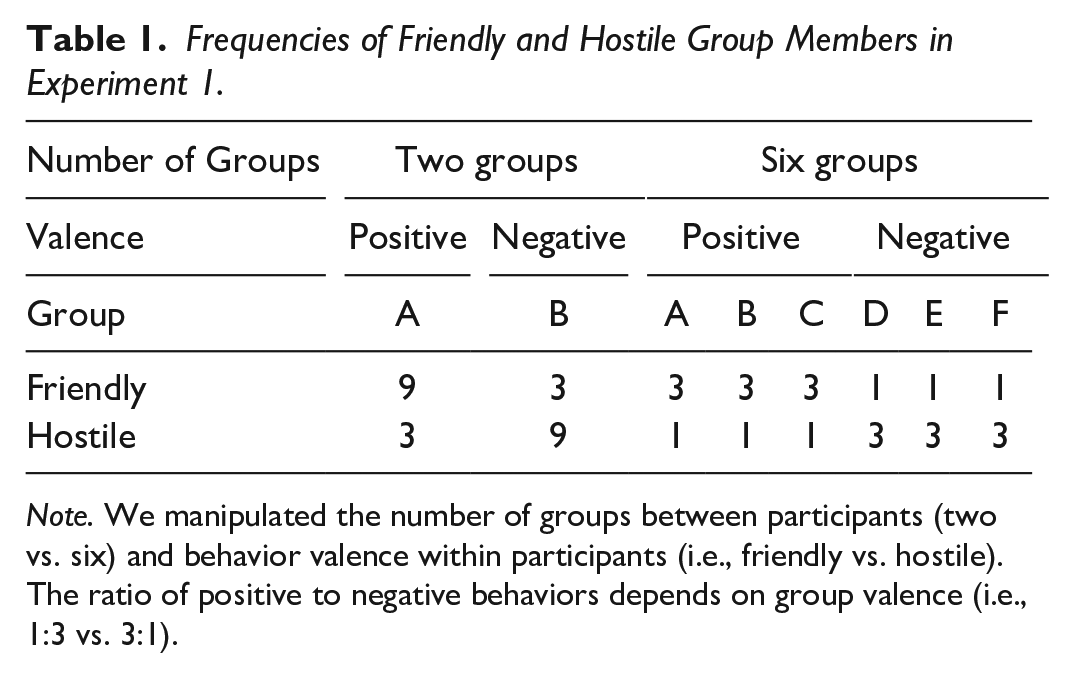
Note. We manipulated the number of groups between participants (two vs. six) and behavior valence within participants (i.e., friendly vs. hostile). The ratio of positive to negative behaviors depends on group valence (i.e., 1:3 vs. 3:1).
After participants had encountered all 24 aliens, they had to recall how many members of each group were friendly and how many were hostile. Participants entered each of these numbers into separate text boxes. Participants also had to rate the likeability of each alien group. Participants provided these ratings on a Likert-type scale that ranged from 1 (very unlikeable) to 7 (very likable). In the end, participants were debriefed and received their completion code.
Results
Recalled Frequencies
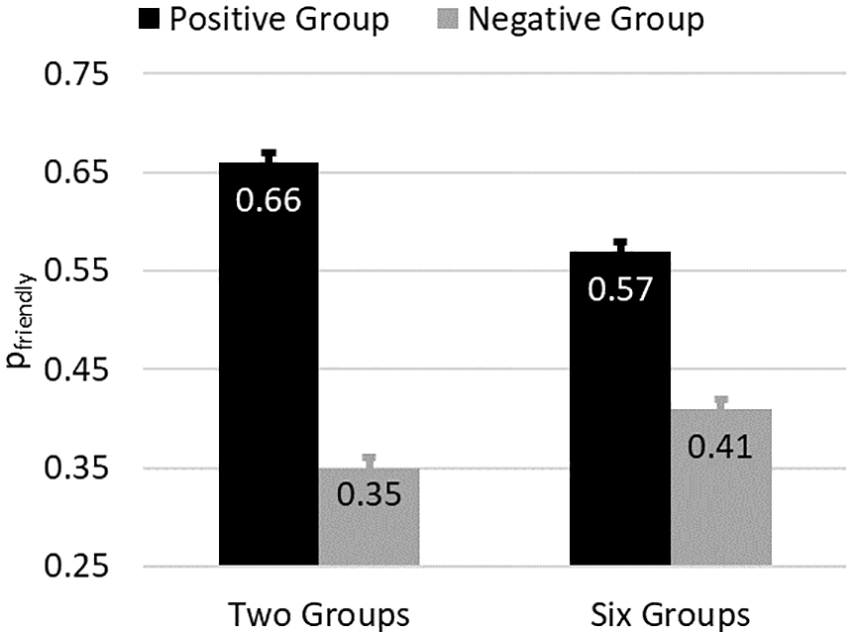
From the recalled frequencies that participants provided, we separately calculated the overall subjective probability of friendly members (pfriendly) for the positive and negative groups. Specifically, we divided the recalled number of friendly members among positive (negative) groups by the total number of aliens recalled for that group; pfriendly = nfriendly/(nfriendly + nhostile). Figure 1 depicts the subjective probabilities of friendly members in the different conditions, as recalled by participants. Note that the actual probabilities were pfriendly = .75 among the positive groups and pfriendly = .25 among the negative groups. We submitted the subjective probabilities to a 2 (number of groups: two groups vs. six groups) × 2 (group valence: positive vs. negative) repeated-measures analysis of variance (ANOVA). One participant failed to provide a numerical character for one of the frequency estimates and was therefore removed from this analysis.
The ANOVA found no significant main effect of the number of groups, F(1, 398) = 1.46, p = .228, ηp2 = .001. Unsurprisingly, the ANOVA found a large main effect of group valence, as participants recalled a larger proportion of friendly relative to hostile members for the positive groups (pfriendly = .61, SD = 0.14) than for the negative groups (pfriendly = 0.38, SD = 0.14), F(1, 398) = 458.90, p < .001, ηp2 = .42. Hence, participants were sensitive to the actual base rates of friendly and hostile members. However, as illustrated in Figure 3, participants’ recalled frequencies were regressive as they underestimated the probability of friendly members among the positive groups, t(399) = 19.58, p < .001, d = .98, and overestimated this probability among the negative groups, t(400) = 18.88, p < .001, d = .94.
Subjective Probabilities of Friendly Group Members in Experiment 1.
More importantly, participants showed the expected regression effect due to increased complexity: participants’ recalled frequencies were more regressive in the six groups compared with the two groups conditions, as shown by the significant interaction between the number of groups and valence, F(1, 398) = 46.39, p < .001, ηp2 = .04. Specifically, participants underestimated the probability of friendly aliens among positive groups more strongly, when they encountered three as opposed to one positive group, t(398) = 6.31, p < .001, d = .63. Likewise, participants overestimated the probability of friendly members among negative groups more strongly, when they encountered three as opposed to only one negative group, t(398) = 4.81, p < .001, d = .48.
Likeability
We calculated mean likeability ratings for the positive and negative groups separately for the two groups and six groups conditions. We submitted them to a 2 (number of groups: two groups vs. six groups) × 2 (group valence: positive vs. negative) repeated-measures ANOVA.
The number of groups had no significant main effect, F(1, 399) = 0.04, p = .841, ηp2 = .001. We found a significant main effect of group valence, as participants rated the positive alien groups as more likable (M = 4.85, SD = 1.03) than the negative alien groups (M = 3.34, SD = 1.11), F(1, 399) = 367.49, p < .001, ηp2 = .33. Hence, as illustrated in Figure 4, participants’ attitudes were sensitive to the actual base rates of friendly and hostile members.
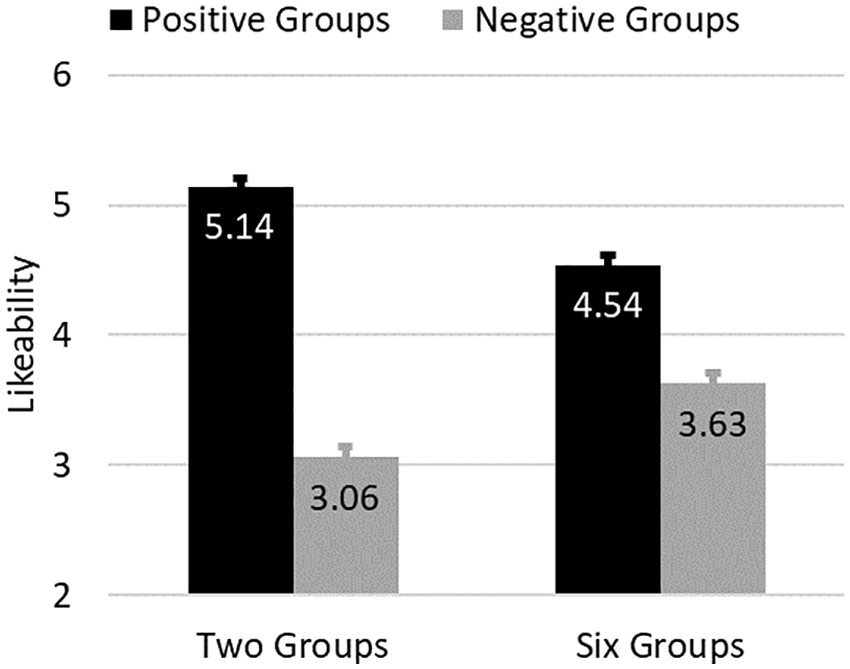
Mean Likeability Ratings in Experiment 1.
Similar to the pattern observed for frequency estimates, and as predicted, there was a significant interaction between the number of groups and group valence, F(1, 399) = 55.20, p < .001, ηp2 = .05. Participants formed more positive attitudes toward one positive alien group than toward three positive alien groups, t(399) = 6.00, p < .001, d = .60. Likewise, participants formed more negative attitudes toward one negative alien groups than toward three negative alien groups, t(399) = 5.29, p < .001, d = .53.
Discussion
Experiment 1 showed that learned frequencies of friendly and hostile group members and resulting group attitudes are more regressive when the learning environment comprises more groups. To the best of our knowledge, these findings are the first to show that attitude formation and base rate learning become less accurate when perceivers are confronted with more categories (here: groups). Yet, Experiment 1 has several limitations, which we empirically address in the subsequent experiments.
First and foremost, Experiment 1 presented participants with both overall positive and overall negative groups, while our ecological assumption is that most groups are overall positive, to begin with. It is unclear whether the same regression effects would occur if all the encountered groups had predominantly friendly members. To test this, the following experiments manipulated group valence between and not within participants, presenting half of our participants with a positive evaluative ecology and the other half with a negative one.
Second, while Experiment 1 found regression in participants’ frequency estimates and their attitudes, it is possible that these measures influenced each other. For example, even if regression only impacts attitude formation, participants may provide their frequency judgments consistent with the attitude judgments they provided beforehand, or vice versa. Hence, the following Experiments, 2a and 2b, manipulated the type of dependent variable between participants so that ratings on one dependent variable could not influence ratings on the other dependent variable.
Experiment 2a
Experiments 2a and 2b tested whether the same regression effects could be found when all the encountered groups were either predominantly friendly or hostile. We predicted that participants would overestimate the number of hostile alien members in a predominantly positive ecology. This overestimation would be stronger when alien members belonged to three instead of only one group. Conversely, in a predominantly negative alien ecology, we predicted that participants would more strongly overestimate the number of friendly aliens when these belonged to three as opposed to one group. Participants in all conditions encountered 24 aliens, and each alien was either described as friendly or hostile. We manipulated the number of groups (one vs. three) to which these aliens belonged between participants. We also manipulated the valence of the ecology between participants, which was either predominantly positive (75% friendly members – 25% hostile members) or predominantly negative (75% hostile members – 25% friendly members). In the end, we asked participants to recall the number of friendly and hostile members of each group. We predicted that participants’ frequency estimates would be more regressive in the three-group condition than in the one-group condition.
Method
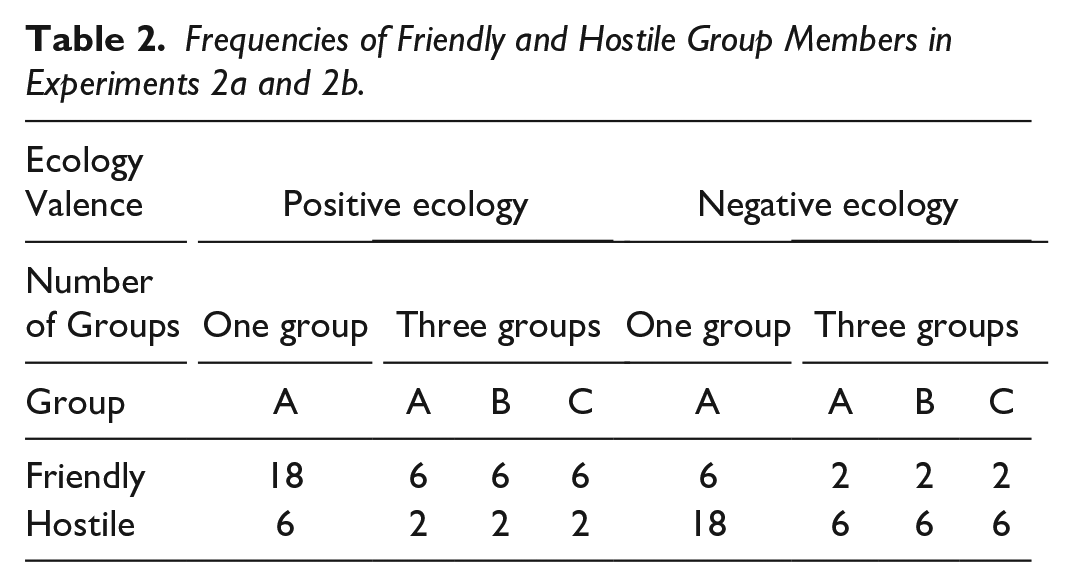
We aimed for a sample size of 200 which ensured sufficient statistical power (>.80) to detect an effect size of ηp2 = .04, like the predicted interaction effect found in the recalled frequencies data in Experiment 1. We recruited participants via Prolific Academic, which returned data from 205 participants. All participants were located in the United Kingdom and received a compensation of 0.60 £. Participants were randomly assigned to one of four conditions, resulting from the orthogonal manipulation of complexity (i.e., low—one group vs. high—three groups) and ecology (i.e., positive: p(friendly) = .75 and p(hostile) = .25 vs. negative; p(friendly = .25 and p[hostile] = .75). Participants in all four conditions encountered 24 aliens. Table 2 shows the number of friendly and hostile group members in the different conditions.
Frequencies of Friendly and Hostile Group Members in Experiments 2a and 2b.
After participants had encountered all 24 aliens, they had to recall how many members of each group were friendly and how many were hostile. Participants entered each of these numbers into separate text boxes. In the end, participants were debriefed and received their completion code.
Results
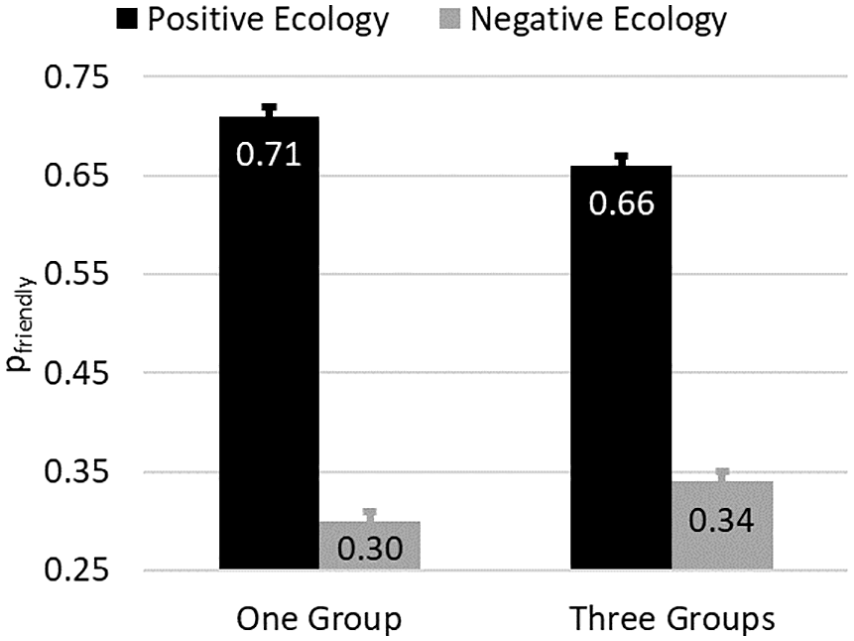
From participants’ recalled frequencies, we calculated the overall subjective probability of friendly members (pfriendly) by dividing the recalled number of friendly members by the total number of recalled aliens; pfriendly = nfriendly/(nfrienldy+nhostile). Figure 5 depicts the subjective probabilities of friendly members in the different conditions, as recalled by participants. We submitted participants’ subjective probabilities to a 2 (number of groups: one group vs. three groups) × 2 (ecology: positive vs. negative) ANOVA.
Subjective Probabilities of Friendly Members in Experiment 2a.
The ANOVA found no significant main effect of the number of groups, F(1, 201) = 0.21, p = .647, ηp2 = .001. Again, the ANOVA found a large main effect of ecology, as participants recalled a larger proportion of friendly relative to hostile members in the positive ecology (pfriendly = 0.68, SD = 0.10) than in the negative ecology (pfriendly = 0.32, SD = 0.09), F(1, 201) = 780.22, p < .001, ηp2 = .80. Hence, participants were again sensitive to the actual base rates of friendly and hostile members. As illustrated in Figure 5, participants’ recalled frequencies were also regressive as they underestimated the relative frequency of friendly members in the positive ecology, t(103) = 7.42, p < .001, d = .73, and overestimated it in the negative ecology, t(100) = 7.89, p < .001, d = .79.
Most relevant and in line with our predictions, Figure 5 shows that regression was stronger in the three groups than in the one-group condition. This was evident from the significant interaction between the number of groups and ecology, F(1, 201) = 11.86, p < .001, ηp2 = .06. Participants in the positive ecology more strongly underestimated the relative frequencies of friendly members when they belonged to three as opposed to one group, t(102) = 2.78, p = .006, d = .55. In the negative ecology, participants more strongly overestimated the relative frequencies of friendly members when they belonged to three as opposed to one group, t(99) = 2.10, p = .039, d = .42.
Discussion
Experiment 2a confirmed that frequency estimates of friendly and hostile group members are more regressive when all encountered groups are predominantly friendly or hostile; the regression effect does not depend on available comparisons. Thus, even in a primarily positive ecology (without groups with predominantly negative behaviors), more social groups increased the perceived prevalence of negative individuals and vice versa for a predominantly negative ecology. Experiment 2b tested whether the same effect applies to forming group attitudes.
Experiment 2b
Experiment 2b was similar to Experiment 2a but asked participants to rate the likeability of the alien groups instead of recalling frequencies of hostile and friendly individuals. We predicted that attitudes in an environment that hosts three instead of one group are more regressive.
Method
Like Experiment 2a, we again aimed for a sample size of 200, which ensured sufficient statistical power (>.80) to detect an effect size of ηp2 = .04. We recruited 202 participants from Prolific Academic, all from the U.K., each compensated with 0.60 £. Experiment 2b mirrored 2a’s design, but participants rated alien group likability on a 1 (“very unlikeable”) to 7 (“very likable”) scale instead of recalling alien frequencies. Table 1 displays the frequencies for both friendly and hostile group members across the four conditions.
Results
In the one-group condition, we used the rating for the one group and averaged participants’ ratings in the three-group condition. We submitted participants’ mean likeability ratings to a 2 (number of groups: one group vs. three groups) × 2 (ecology: positive vs. negative) ANOVA.
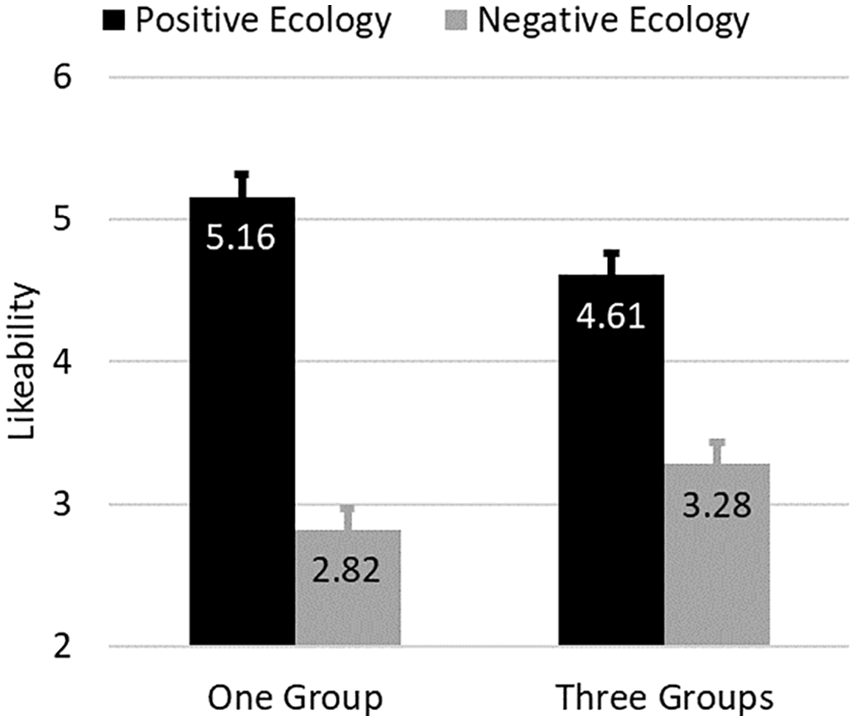
The ANOVA found no significant main effect of the number of groups, F(1, 198) = 0.08, p = .773, ηp2 = .001. Similar to Experiment 2a, the ANOVA found a large main effect of ecology, as participants rated the alien groups in the positive ecology as more likable (M = 4.88, SD = 1.08) than in the negative ecology (M = 3.05, SD = 1.09), F(1, 198) = 151.66, p < .001, ηp2 = .43. As illustrated in Figure 6, participants’ attitudes were again sensitive to the actual base rates of friendly and hostile members.
Mean Likeability Ratings in Experiment 2b.
Similar to Exp. 2a and in line with our predictions, there was a significant interaction between the number of groups and ecology, F(1, 198) = 11.61, p < .001, ηp2 = .06. Participants in the positive ecology formed more positive attitudes toward the aliens when these belonged to one as opposed to three groups, t(100) = 2.66, p = .009, d = .53. In contrast, in the negative ecology, participants formed more negative alien attitudes when these belonged to one as opposed to three groups, t(98) = 2.17, p = .033, d = .43.
Discussion
While Experiment 2a found that a larger number of groups renders more noise frequency estimates, Experiment 2b confirmed that perceivers’ attitudes are affected by a larger number of groups in a similar way. In a predominantly positive social ecology, perceivers formed more negative attitudes when the social environment comprised three instead of one group. At the same time, the reverse was true for a predominantly negative social ecology (which rarely occurs in the real world).
Experiments 2a and 2b support our idea that a more-complex social environment leads to more negative attitudes toward groups as long as the ecology is predominantly positive. When a given social group is split into an increasing number of subgroups, people can be expected to perceive an increasing number of negative individuals among groups and form more negative group attitudes.
Although we suggest that the present effects emerge because the larger number of groups renders learning noisier, it is important to note that our manipulation also varied the number of group members per group. In the one-group condition, participants could rely on observing 24 members, while participants in the three-group condition could only rely on eight observations per group. Thus, the difference in group size may have caused the regression effects instead of the number of groups. Several arguments can be made in favor of such a sample-size explanation.
Empirically, research on illusory correlations (IC; Hamilton & Gifford, 1976) has found that when perceivers encounter members of one larger and one smaller group, they produce less-extreme likability judgments for the smaller group. Fiedler (1991) and Smith (1991) have introduced feature-based and exemplar-based models of IC that predict more regressive judgments for smaller groups. Related research suggests that the distinctiveness of negative group members in a predominantly positive ecology could decrease with an increasing number of group members (e.g., Hamilton & Trolier, 1986). In addition, group attitudes could be a function of the summed group member frequencies instead of their relative frequencies (e.g., McGarty et al., 1993), in which case attitudes toward larger groups can be expected to be more extreme. Laplace’s rule of succession even suggests that it is normatively correct to provide less-extreme judgments for smaller samples as long as the task is to infer a latent variable from an observed sample (Costello and Watts, 2019). Finally, perceivers may experience more uncertainty in the face of smaller samples as would be expected from a Bayesian approach.
Note, however, that the empirical evidence favoring more regressive attitudes resulting from smaller group sizes is confined to the illusory correlation paradigm. In this paradigm, participants encounter a larger and a smaller group within the same learning session. In contrast, our paradigm varies group sizes between participants, and it is unclear whether group size similarly influences attitude regressiveness in that case.
To determine whether the effects of increased complexity found in Experiments 1 and 2b are driven by the number of groups or by group size, Experiment 3 realized an orthogonal manipulation of both factors.
Experiment 3
Experiment 3 again tested whether the number of groups in the environment influenced the recalled frequencies of friendly and hostile group members and perceivers’ respective group attitudes. However, Experiment 3 independently manipulated the two facets of a more- or less-complex social ecology: the number of groups and group size. As both may influence the noisiness of learning, both are potential causes of the effects observed in the previously reported experiments.
Method
Experiment 3 introduced an additional between-participants factor (group size), potentially allowing a three-way interaction. Consequently, we increased our sample size to 800, ensuring statistical power (>.80) to detect even a small interaction effect (ηp2 = .01). We recruited 800 U.K.-based participants from Prolific Academic, compensating them with 0.63 £ each.
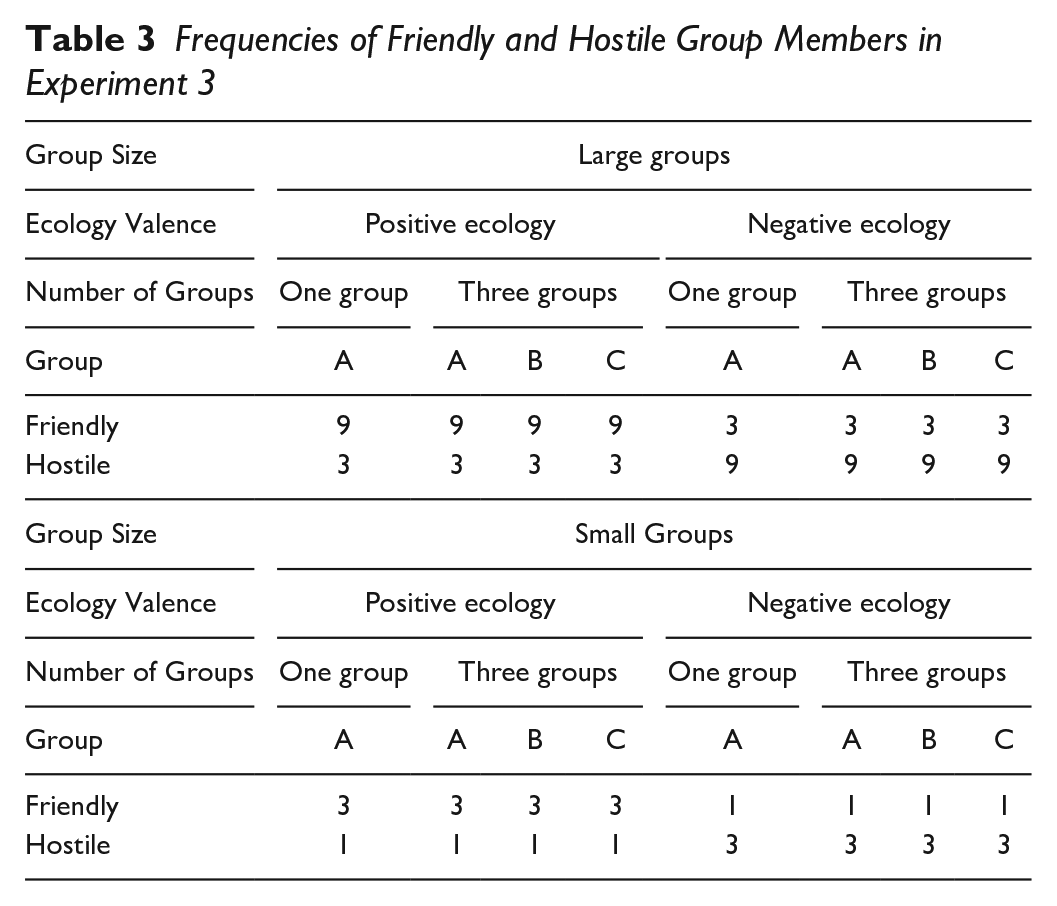
Experiment 3’s design paralleled Experiments 2a and 2b but had notable differences. We collected both recalled frequencies and liking data from participants, as in Experiment 1, randomizing their sequence. Participants were then allocated to one of eight conditions based on three factors: number of groups (one vs. three), ecology (positive vs. negative), and group size (small vs. large). Table 3 lists the frequencies of friendly and hostile members in each condition.
Frequencies of Friendly and Hostile Group Members in Experiment 3
Results
Recalled Frequencies
Using the recalled frequencies that participants provided, we again calculated the overall subjective probability of friendly members (pfriendly). Figure 7 shows the mean subjective probabilities for the eight different conditions. We submitted these means to a 2 (number of groups: one group vs. three groups) × 2 (ecology: positive vs. negative) × 2 (group size: large vs. small) ANOVA.
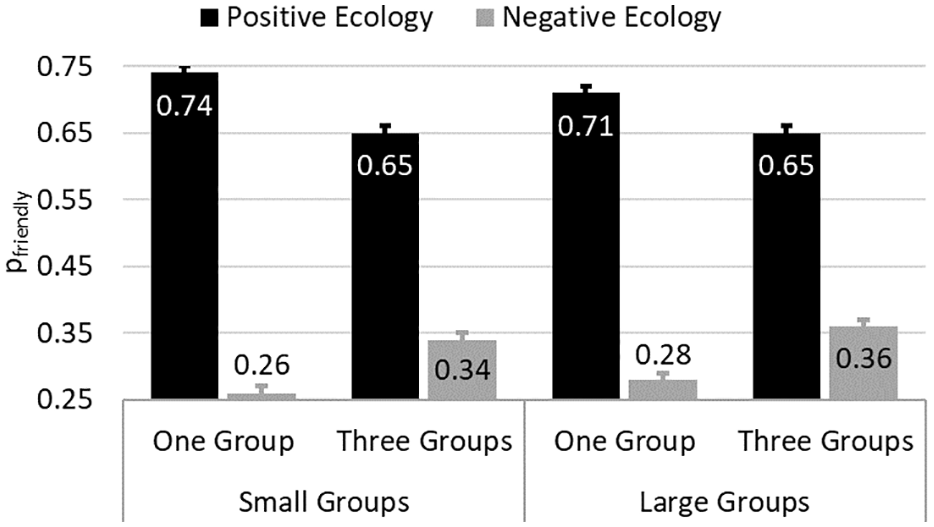
Subjective Probabilities in Experiment 3.
The ANOVA revealed no significant main effect of number of groups, F(1, 792) = 0.01, p = .961, ηp2 = .001. The main effect of group size was not significant either, F(1, 792) = 0.05, p = .824, ηp2 = .001. Again, there was a large main effect of ecology, as participants recalled a larger proportion of friendly relative to hostile members in the positive ecology (pfriendly = 0.68, SD = 0.10) than in the negative ecology (pfriendly = 0.31, SD = 0.10), F(1, 792) = 3652.46, p < .001, ηp2 = .82.
As predicted, the interaction between the number of groups and ecology was significant, F(1, 792) = 147.77, p < .001, ηp2 = .16. Participants in the positive ecology condition more strongly underestimated the relative frequencies of friendly members belonging to three as opposed to one group, t(396) = 8.58, p < .001, d = .86. In the negative ecology, participants more strongly overestimated the relative frequencies of friendly members belonging to three as opposed to one group, t(400) = 8.54, p < .001, d = .85. Hence, a larger number of groups rendered recalled relative frequencies more regressive.
There was also a small but significant interaction between ecology and group size, F(1, 792) = 9.84, p = .002, ηp2 = .01. In the positive ecology, participants descriptively underestimated the relative frequencies of friendly members more strongly among the larger groups while this effect did not reach conventional levels of significance, t(396) = 1.90; p = .058, d = .19. In the negative ecology, participants tended to overestimate the relative frequencies of friendly members more strongly among the larger groups, t(400) = 2.14, p = .03, d = .21. Hence, larger and not smaller group sizes rendered recalled relative frequencies more regressive. The interaction between the number of groups and group size was not significant, F(1, 792) = 1.46, p = .228, ηp2 = .002, and neither was the three-way interaction, F(1, 792) = 1.36, p = .244, ηp2 = .002.
Likeability
We analyzed participants’ mean likability ratings in the eight conditions with the same ANOVA as the recalled frequencies (see Figure 8). The results mostly replicate the pattern of the frequency estimates.
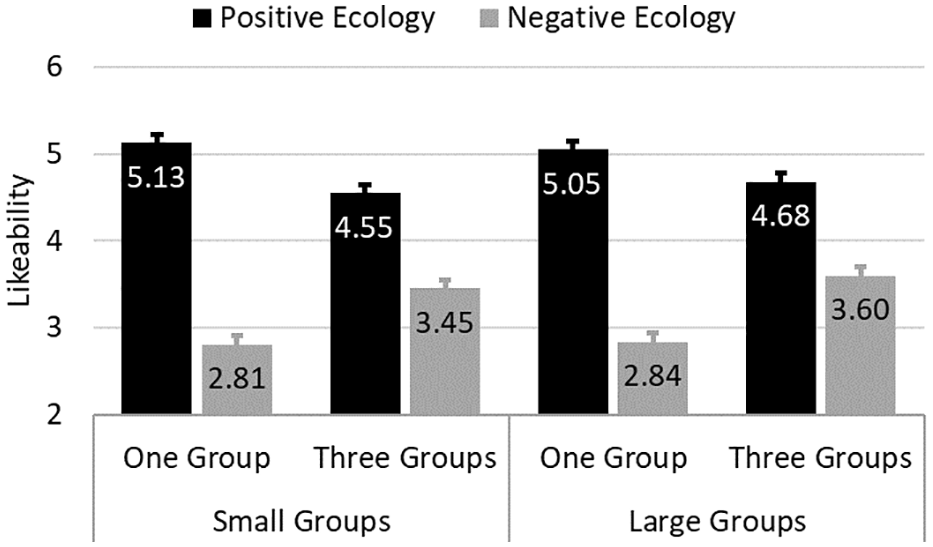
Mean Likeability Ratings in Experiment 3.
The ANOVA revealed no significant main effect of the number of groups, F(1, 792) = 2.31, p = .129, ηp2 = .003, nor of group size, F(1, 792) = 0.64, p = .424, ηp2 = .001. Again, there was a large main effect of ecology, as participants found the alien groups in the positive ecology (M = 4.85, SD = 0.99) more likable than the groups in the negative ecology (M = 3.17, SD = 1.13), F(1, 792) = 53.41, p < .001, ηp2 = .40.
As predicted, there once again was a significant interaction between ecology and the number of groups, F(1, 792) = 65.91, p < .001, ηp2 = .08. Participants in the positive ecology formed more positive attitudes toward the aliens belonging to one as opposed to three groups, t(396) = 4.98, p < .001, d = .50. In contrast, in the negative ecology, participants formed less-negative attitudes toward aliens belonging to three as opposed to one group, t(400) = 6.47, p < .001, d = .65. Hence, a larger number of groups rendered more regressive group attitudes.
There was no significant interaction between ecology and group size, F(1, 792) = 0.16, p = .690, ηp2 = .001. Hence, group sizes per se did not influence group attitudes. The interaction between the number of groups and group size was also non-significant, F(1, 792) = 1.28, p = .258, ηp2 = .002, and neither was the three-way interaction, F(1, 792) = 0.12, p = .732, ηp2 = .001.
Discussion
Experiment 3 again confirmed that recalled frequencies of friendly and hostile group members and attitudes toward the groups are more regressive in a more complex learning environment. In a predominantly positive ecology, increasing complexity increases the negativity of recalled frequencies and attitudes. Experiment 3 clearly showed that the effects of complexity are driven by the larger number of groups and not by the smaller group sizes. These results align with our hypothesis that attitude formation is noisier and more regressive when more groups are involved. Attitudes were not substantially influenced by the number of observations per group perceivers could rely on, and subjective probabilities were even less regressive for smaller groups—as evident from the small but significant interaction between ecology and group size.
The latter finding seemingly contradicts previous research that has claimed that learned base rates are less regressive with increasing sample size. Fiedler (1991) relied on this idea to explain the illusory correlation effect, which describes perceivers’ tendencies to form more favorable attitudes toward majority groups than minority groups, if positive members are prevalent in both groups (e.g., Hamilton & Gifford, 1976). However, empirical investigations of the illusory correlation effect have been confined to within-participant designs in which perceivers simultaneously form attitudes toward majorities and minorities within the same learning context. In Experiment 3, we manipulated group size between participants. Our findings suggest that group size influences the regressiveness of attitude formation only when perceivers simultaneously encounter a larger and a smaller group in the same learning context as is the case in research on illusory correlation. However, when group sizes vary between learning contexts, they do not influence attitudes’ regressiveness, and frequency judgments may be more accurate for smaller groups. At the same time, the number of encountered groups does determine the degree of regression.
In sum, the previous experiments suggest that a more-complex social environment that comprises more groups creates more negative attitudes toward these groups as long as the social environment is predominantly positive.
One question that remains unanswered is whether a more complex environment also renders attitudes toward the superordinate (alien) “population” more negative or whether this effect is confined to the subordinate group level. Suppose perceivers form attitudes toward the superordinate population by averaging their group-level attitudes. In this case, we can expect that the whole population is also negatively perceived in a more-complex social environment. Alternatively, perceivers may form an attitude toward the superordinate population somewhat independent of their subordinate group attitudes, resulting in less-negative attitudes toward the population. The latter case would imply that people will perceive superordinate groups as more positive than the subordinate groups they comprise. In Experiment 4, we addressed whether the present attitude and memory asymmetries apply only to the subordinate group level or extend to the superordinate population level, in which case judgment level would constitute a boundary condition of complexity-induced regression.
Experiment 4
Experiment 4 replicated Experiments 2a and 2b, adding another condition where participants encountered members of three alien groups. Different from the original three-group condition, participants in this condition were asked to provide frequency estimates and attitudes regarding the superordinate alien population and not for each group separately. The resulting three conditions in Experiment 4 allowed us to test whether complexity-induced regression at the subordinate group level is different from regression at the superordinate population level and whether we can expect attitudes toward superordinate groups to be positive or negative than toward subordinate groups.
Method
Experiment 4’s design mirrored that of Experiments 2a and 2b but introduced a third complexity condition with three alien groups. Here, participants rated the entire alien population collectively. Our target sample size was N = 800, which ensured sufficient statistical power to detect even small interaction effects (ηp2 = .015), and we received 806 responses via Prolific Academic from U.K. participants, each compensated 0.60 £.
Procedure-wise, Experiment 4 resembled Experiments 2a and 2b, but with two changes. As in Experiments 1 and 3, we collected both recalled frequencies and likeability data, randomizing their sequence. In addition, this experiment included a new three-group condition where participants rated and recalled attributes of the entire alien population. The structure was thus a three (complexity) × two (ecology) design.
Results
Recalled Frequencies
We again calculated the subjective probabilities of friendly members (pfriendly) from participants’ recalled frequencies. We submitted these to a 3 (complexity) × 2 (ecology) ANOVA.
The ANOVA revealed no significant main effect of complexity, F(2, 800) = 0.08, p = .920, ηp2 = .001. There was a large main effect of ecology, as participants recalled a probability of friendly relative to hostile members in the positive ecology (pfriendly = 0.67, SD = 0.09) than in the negative ecology (pfriendly = 0.33, SD = 0.10), F(1, 800) = 2827.37, p < .001, ηp2 = .78.
The interaction between complexity and ecology was significant, F(2, 800) = 16.99, p < .001, ηp2 = .04. Figure 9 shows the mean subjective probabilities in the different conditions. As preregistered, we conducted three planned contrasts. The first contrast tested whether we replicated Experiment 2a and 2b’s effects and compared the ecology effects in the one-group and three-group conditions (group level). The contrast was significant, F(1, 800) = 32.43, p < .001, ηp2 = .04. As illustrated in the left part of Figure 9, the complexity effect at the individual groups level from Experiments 2a and 2b replicated as recalled frequencies in the three-group condition were more regressive than in the one-group condition.
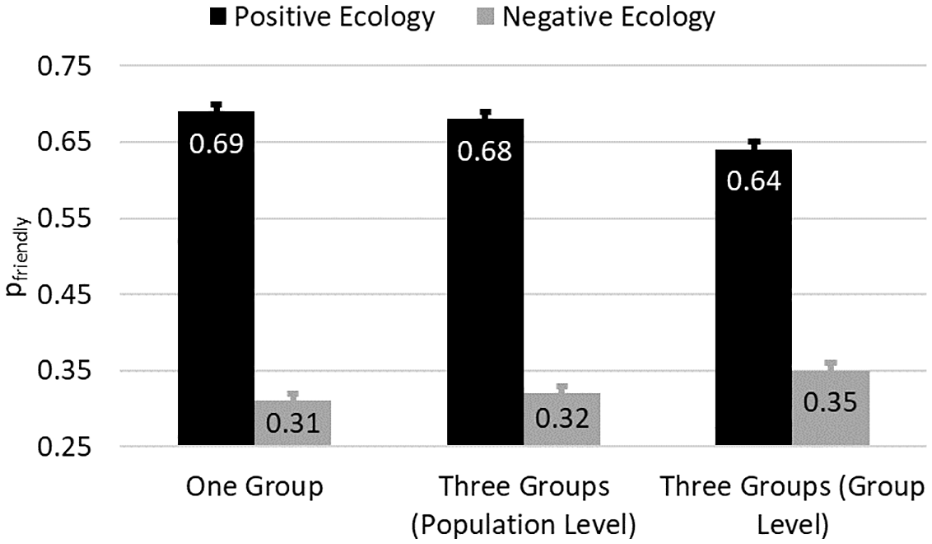
Subjective Probabilities of Friendly Group Members in Experiment 4.
The second contrast compared the ecology effects in the one-group and three-group (population level) conditions, and the effect did not reach conventional levels of significance, F(1, 800) = 3.07, p = .080, ηp2 = .004. Figure 9 shows that recalled frequencies in the three-group condition were not substantially more regressive than in the one-group condition when provided at the population level. Hence, complexity-induced regression in recalled frequencies did not extend to the population level.
The third contrast compared the ecology effect in the two three-group conditions (group level vs. population level) and was statistically significant, F(1, 800) = 15.73, p < .001, ηp2 = .02. As shown in Figure 9, recalled frequencies were more regressive at the group level than at the population level.
Likeability
We calculated mean likeability ratings for participants in the three-group conditions and submitted them to the same ANOVA as the recalled frequencies (see Figure 10).
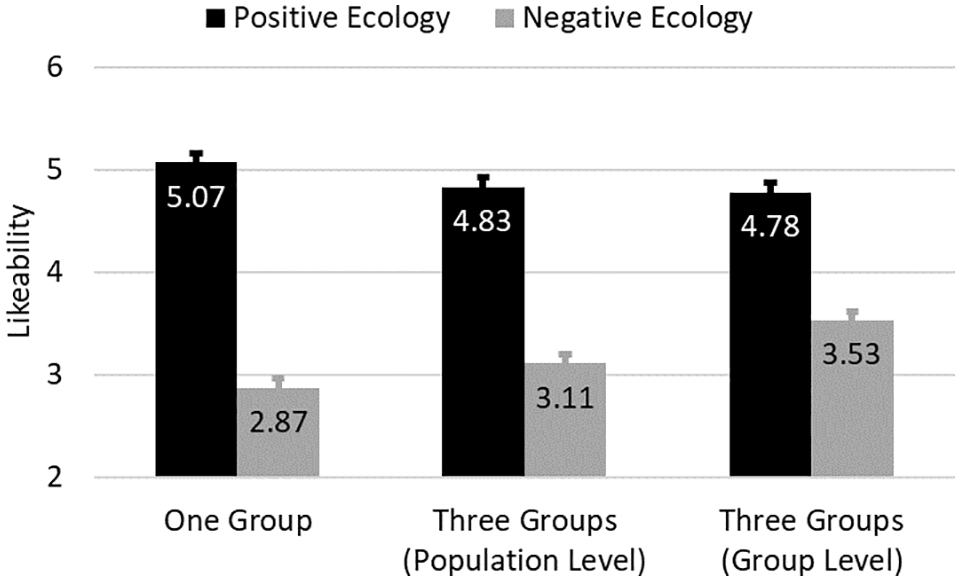
Likeability Ratings in Experiment 4
The main effect of complexity did not reach conventional significance levels, F(2, 800) = 2.71, p = .067, ηp2 = .007. There was again a large and significant main effect of ecology, as participants gave more favorable likeability ratings in the positive ecology (M = 4.89, SD = 0.97) than in the negative ecology (M = 3.16, SD = 1.18), F(1, 800) = 529.54, p < .001, ηp2 = .40.
The interaction between complexity and ecology was significant, F(2, 800) = 13.25, p < .001, ηp2 = .03. We conducted the same three preregistered contrasts as for the frequency estimates. The first contrast compared the ecology effects in the one-group and three-group conditions (group level) and was significant, F(1, 800) = 26.95, p < .001, ηp2 = .03. As illustrated in Figure 10, the complexity effect at the group level from Experiments 2a and 2b replicated as likeability ratings in three-group condition were more regressive than in the one-group condition.
The second contrast compared the ecology effects in the one-group and three-group (population level) conditions and was significant, F(1, 800) = 6.86, p = .009, ηp2 = .01. As Figure 10 shows, likeability ratings in the three-group condition were more regressive than in the one-group condition, even when provided at the population level. Hence, complexity-induced regression also extends to population-level attitudes.
The third contrast compared the ecology effect in the two three-group conditions (group level vs. population level) and was statistically significant, F(1, 800) = 6.55, p = .011, ηp2 = .01. As shown in Figure 10, likeability ratings were more regressive at the group level than at the population level.
Discussion
Experiment 4 replicated the effects of Experiments 2a and 2b, providing several insights. First, the stronger regressiveness in recalled frequencies and attitudes elicited by a more complex environment is mostly confined to the group level and only partially extends to the superordinate population level. Specifically, recalled frequencies of friendly and hostile aliens were mostly unaffected by the number of encountered groups as long as frequencies were provided for the alien population. Similarly, encountering more groups mostly led to regressive attitudes toward the individual groups but less toward the alien population. While the effect of complexity was still significant for population-level attitudes, the effect was smaller than for group-level attitudes.
These findings have two important implications. First, some undesirable effects of a more-complex social environment on social perception may be undone by re-framing members of different groups as members of the same superordinate group, a well-documented intervention called recategorization (e.g., S. L. Gaertner et al., 1989). Second, people’s attitudes toward superordinate groups can be expected to be more positive than attitudes toward subordinate groups.
General Discussion
The present work empirically confirmed that a more-complex social environment renders social learning more regressive. That is, people’s attitudes and memory content underestimate existing group differences. Further, in a social ecology characterized by a prevalence of positivity (e.g., Alves et al., 2017a; Unkelbach et al., 2019), higher complexity translates into a stronger overestimation of the frequency of negative group members and increasingly negative group attitudes.
Experiment 1 found that perceivers’ attitudes and memory content more accurately aligned with the base rates of friendly and hostile alien group members when these belonged to one mostly friendly and one mostly hostile group instead of three mostly friendly and three mostly hostile groups. Experiments 2a and 2b manipulated group valence between participants and confirmed that a more-complex social environment renders more regressive frequency estimates and attitudes even when all encountered groups have the same friendly to hostile member base rates. This translated into a stronger overestimation of hostile group members’ relative frequencies and more negative group attitudes in a predominantly friendly ecology. Experiment 3 then investigated the more specific cause of regression induced by our manipulations. By realizing an orthogonal manipulation of the number of groups and group size, we confirmed that regression was determined by complexity (i.e., the number of groups). Regression was not influenced by group size, which rules out the alternative explanations that a smaller number of observations renders attitude formation less accurate (e.g., Fiedler, 1991), that it increases the distinctiveness of rare events (e.g., Hamilton & Trolier, 1986), or that perceivers are sensitive to the summed frequencies of positive and negative group members instead of their relative frequencies (McGarty et al., 1993). Finally, Experiment 4 found that complexity-induced regression is mostly confined to the level of groups and does not fully extend to the superordinate population level. Even though population-level attitudes and frequency estimates were still somewhat more regressive in a more complex environment, this regression was significantly weaker than group-level attitudes. Hence, while we can expect people to form more negative attitudes toward social groups in a more complex environment, this does not translate into an equally negative attitude toward superordinate groups.
In sum, our findings confirm that a more-complex social environment causes more noisy learning and, therefore, more regressive attitudes and frequency judgments. It is important to note that noise can occur at various stages of information processing. For example, complexity likely decreases attention that a perceiver can denote to individual stimuli, leading to encoding errors. It may also increase the chance that pieces of information are forgotten or mixed up, and it may cause memory interference during decoding or greater uncertainty at the judgment stage. Note that these different psychological sources of noise all influence each other and are, therefore, difficult to disentangle. At this point, it remains unclear whether all stages of information processing are equally affected by increasing complexity or whether certain stages are especially error-prone.
Implications
Social contexts in which attitude formation occurs can vary in complexity regarding the number of groups that perceivers encounter. Some environments are dominated by only a few religious, ethnic, cultural, or ideological groups, while others comprise many different groups. In the latter case, forming attitudes toward the various groups is more complex. People may also choose to categorize their fellow citizens into more superordinate groups, reducing social complexity. Alternatively, they may form more subordinate groups, making the attitude formation process more complex. Our findings imply that attitudes formed in more-complex social environments will overemphasize negative group members. This may explain some of the reported adverse short-term reactions people show in response to increased diversity within their social environment (Ramos et al., 2019). These include decreasing cooperative participation (Abascal & Baldassarri, 2015; Alesina & La Ferrara, 2000; Putnam, 2007), decreasing provision of public goods (K. Baldwin & Huber, 2010), and increasing social conflict (Esteban et al., 2012). Of course, there may be many other reasons for these reactions toward increasing diversity. However, at least some part of this defiant stance may be explained by the fact that the higher complexity of the social environment makes it more difficult for people to accurately learn that most (if not all) groups are predominantly positive. Such a more demanding situation may indeed create the impression that the social environment has become more negative.
In addition, Experiment 4 suggests that attitudes toward broader groups like “U.S. citizens” may be more positive in a primarily positive environment than toward specific subgroups (e.g., Christians, Muslims). Future research can test this hypothesis. If validated, this would underscore the challenges posed by the complexity of more specific groups and their associated attitudes and offer insight into why recategorizing groups can reduce negative perceptions. While traditionally attributed to the emergence of a shared group identity (L. Gaertner & Insko, 2000), recategorization may also entail the consequence that it promotes accurate perceptions of positivity in broader groups.
More generally, the present cognitive-ecological model also predicts that any factor that increases noise during attitude formation will contribute to the emergence of negatively biased attitudes. Such factors may include stress, resource depletion, cognitive ability, or large amounts of information that perceivers encounter in a given environment.
In some intergroup contexts, encounters with members of other groups may not be positive but negative, for example, when groups compete for the same resources. For such cases, our findings suggest that attitudes toward outgroups are especially negative when there are few instead of many hostile groups. The formation of most negative attitudes can, therefore, be expected to arise among two rival groups that compete.
Our research indicates that complexity in social environments reduces the accuracy of perceiving group differences. Although most groups are generally positive, differences between groups certainly exist. For instance, males may present a greater threat than females based on crime rates. Accurately discerning these differences is crucial for evaluating trustworthiness. However, when the social setting divides into numerous subgroups accurate differentiation becomes more difficult.
Constraints on Generality
The real-world implications discussed earlier are speculative at this point. They hinge on the generalizability of our experimental findings to the multifaceted process of real-world impression formation, which is more intricate than noting “friendly” or “hostile” group members in a single learning instance (Abele et al., 2021; Koch et al., 2021). Real-life social evaluation unfolds over longer time periods, drawing from diverse sources like behavioral observations, conversations, or media, and the encountered groups often consist of more members than we implemented in our experimental designs. Also, group attitudes may be influenced by factors other than their member-based mean likability, such as the group leaders’ attributes, the group’s purpose, or the group’s ideological beliefs (e.g., Koch et al., 2016).
Another possible constraint on the generality of our findings concerns the alien stimuli we used. We deliberately chose artificial alien groups as stimuli to ensure that participants did not have existing stereotypes or expectations regarding the social stimuli they encountered. Admittedly, although this methodological approach has proven most helpful in a series of important lines of research (see Hoffman & Hurst, 1990), this may also limit our paradigm’s ecological validity.
Another restriction of our paradigm is the relatively small group sizes we implemented. Although encountering only a few members (e.g., six) of certain groups within a single time frame, like one day, is realistic, most real groups undoubtedly have more than six members. Perceivers repeatedly encounter these members over longer time periods, and it remains an open question how the observed regression effects play out in such cases. Experiment 3 found that regression effects were stronger for larger groups (e.g., 24 vs. 12), suggesting that it is more difficult to form impressions of larger groups. However, this effect likely reaches a plateau at some point.
Future research may investigate to what extent the finding that a more-complex social environment renders more regressive social attitudes applies to real-world impression formation. These constraints notwithstanding, the present work identifies minimal conditions under which people may arrive at negatively biased attitudes in complex social environments.
Footnotes
Declaration of Conflicting Interests
The author(s) declared no potential conflicts of interest with respect to the research, authorship, and/or publication of this article.
Funding
The author(s) disclosed receipt of the following financial support for the research, authorship, and/or publication of this article: This project was funded by the European Research Council (ERC) under the European Union’s Horizon 2020 research and innovation program (Grant agreement No. 947988).