
Abstract
We investigate the relationship between attitude instability and both party identity strength and ideology strength. We test the explorative hypotheses that higher party identity strength (H1) and ideology strength (H2) predict more attitude stability using intensive longitudinal data collected in the United States every 2 weeks over 1 year (Study 1, N = 552) and in the Netherlands over 6 months (Study 2, N = 1,670). We found mixed support for H1: In the United States, there was no association between party identity strength and attitude stability. In the Netherlands, people with stronger party identity had more stable attitudes. We found stronger support for H2: Individuals with a stronger ideology than average had more stable attitudes in the United States and the Netherlands. The context-dependent nature of relations is discussed.
Ideology, party identification, and political attitudes are important elements in the political belief systems of ordinary citizens (Brandt et al., 2019; Converse, 1964). Both political ideology (i.e., people’s left-wing/right-wing political orientation) and party identification (i.e., an individual’s strength of relation with or emotional attachment to a political party; Campbell et al., 1960; Postmes et al., 2013) are symbolic components of belief systems. In other words, although ideology and party identity are distinct concepts, they are similar in that they are both forms of affective attachments to political labels and groups, respectively. In contrast, political attitudes are operational components, as they are positions on specific issues (e.g., government spending). Party identity (Van Bavel & Pereira, 2018) and ideology (Jost, 2006) are typically strongly related to each other, and to political attitudes. In this way, both symbolic and operational components are interrelated within wider political belief systems 1 (i.e., networks of interconnected political beliefs; Boutyline & Vaisey, 2017; Converse, 1964; Gerring, 1997). However, research suggests that symbolic components of belief systems play a more important role shaping belief systems than do operational components. For example, symbolic components are more central to political belief systems than operational elements (Boutyline & Vaisey, 2017; Brandt et al., 2019; Fishman & Davis, 2022), and symbolic components also play an important role constraining operational components so they are consistent (Goren, 2005).
In this research we investigate if the strength of symbolic elements of belief systems (i.e., ideology and party identity) influences short-term attitude stability and instability in bi-weekly measurements over a long-term period of 1 year (Study 1; Brandt et al., 2021) and 6 months (Study 2). Research investigating the stability of political attitudes has focused either on few measurement occasions (i.e., low resolution) over a longer period (e.g., measures every couple of months over the course of a year/annual data collection over many years; Freeder et al., 2019; Goren, 2005; Kiley & Vaisey, 2020; Krosnick, 1988; Luttrell et al., 2016) or on many measurement occasions (i.e., high resolution) over a shorter period (e.g., 2- to 5-week lags over a few months; Prislin, 1996). The first (low resolution/long period) approach can capture broad patterns of change but may miss out on shorter term attitude changes. The second (high resolution/short period) approach captures shorter term changes, but it is unclear if these are temporary or durable. We examine attitude stability using data from two intensive longitudinal studies (i.e., with measurements every 2 weeks) in two countries to offer a high-resolution/long-period insight into the extent that variation in political attitudes is motivated by ideology and party identity strength.
Attitude Stability
Attitude stability over time is a key indicator of the strength of an attitude (Krosnick & Petty, 1995; Luttrell & Sawicki, 2020) and predicts a higher correspondence between an attitude and a behavior (Glasman & Albarracín, 2006). Luttrell and Sawicki (2020) review much of the prior work on attitude stability from an attitude strength perspective. They highlight work demonstrating that attitudes tend to be more stable when they are more accessible (Bassili, 1996), more certain and unambivalent (Bassili, 1996; Luttrell et al., 2016, 2020), more important (Krosnick, 1988), and more morally convicted (Luttrell & Togans, 2021). A key finding across work on attitude stability in social psychology is that attitude stability is predicted by characteristics of the attitudes themselves.
A core idea in the belief systems literature is that political attitudes are not independent of one another (Boutyline & Vaisey, 2017; Brandt & Sleegers, 2021; Converse, 1964; Gerring, 1997; Turner-Zwinkels & Brandt, 2022). Instead, for at least some people, political attitudes are interrelated and can influence one another. This raises the possibility that characteristics of other elements in the belief system can impact the stability of political attitudes. Although several possible features could potentially influence attitude stability, here we focus on the strength of people’s party identity and political ideology as symbolic components of people’s belief systems. From a belief system perspective, there is evidence that symbolic ideology and identity components of belief systems are more central to belief systems than operational attitudes (Boutyline & Vaisey, 2017; Brandt et al., 2019; Fishman & Davis, 2022). Central components of belief systems should have a greater impact on other components in the belief system (Brandt & Sleegers, 2021; Converse, 1964). The idea is that people adopt political attitudes consistent with their ideology and party identity, which in turn holds these political attitudes in place and keeps them stable. This idea is consistent with Peffley and Hurwitz’s (1993) finding that more abstract, general orientations (similar to symbolic components) in part contribute to the stability of operational attitudes. Ideology and identity may keep political attitudes stable by, for example, providing the motivation to engage in biased information processing when encountering attitude consistent and inconsistent information (Huddy & Bankert, 2017), by their connection with moralized attitudes (Ryan, 2014), or by keeping political issues and ideas particularly accessible (cf. Bassili, 1996). Although these reasons could apply equally well to party identity as to ideology, evidence currently suggests that party identity is more adept at constraining political attitudes, whereas ideology is less potent. First, we will review evidence concerning party identity, then political ideology.
The Relation Between Party Identity Strength and Attitude Instability
There is firm evidence that party identity strength should be related to attitude stability. Party identity is a potentially important group membership that can fulfill multiple important social functions (e.g., needs for belonging, morality, and status; Van Bavel & Pereira, 2018). As such, it may be particularly relevant for informing group processes (Turner et al., 1987), providing group norms to shape individual’s attitudes, beliefs (Goren et al., 2009), and behaviors (e.g., voting; Kinder & Kalmoe, 2017). In this way, party identity has been moderately strongly linked with political attitudes, as it offers a heuristic the public can use to inform political beliefs based on party loyalties (Kalmoe, 2020; Kinder & Kalmoe, 2017). Furthermore, trends of polarization between political parties mean that it is clearer to the public which party supports what attitudes (Baldassarri & Gelman, 2008). As such, although attitudes in the general public are not more strongly aligned, party identity and attitudes are (i.e., people who identify as Democrats tend to support attitudes that are supported by members of the Democrat Party; Baldassarri & Gelman, 2008). Although political identities are likely vary to some degree based on political events, they should on the whole be fairly durable, and more durable than most political attitudes (Converse, 1964; Goren, 2005; see Brandt & Morgan, 2022 for some exceptions). In line with this, party identity predicts attitudes (Cohen, 2003; Dancey & Goren, 2010; Goren, 2005; Goren et al., 2009; Kalmoe, 2020; Kinder & Kalmoe, 2017) and their stability, and does so more strongly than vice versa (Goren, 2005; although this is often the case, it is not always; Converse, 1964; Dancey & Goren, 2010).
The Relation Between Ideology Strength and Attitude Instability
Evidence concerning the relation between political ideology strength and attitude stability is weaker and less consistent. The political science and psychology literature has a long history of skepticism in the role of political ideology in structuring political belief systems, in part because the typical voter does not pay much attention to politics. In the 1960s, Converse (1964) demonstrated that U.S. citizens tend to endorse attitudes that are inconsistent ideologically (e.g., an individual endorses a position that is left wing on their abortion attitude but right wing on gun control) and inconsistent over time. This means that their political attitudes are not strongly organized around political ideology. More recent evidence has built on these ideas to further cement the idea that “ideological innocence” remains widespread in the United States (Kinder & Kalmoe, 2017). This empirical research has shown that although some members of the public use political ideology to structure consistent political attitudes (e.g., the politically knowledgeable and higher educated; Stimson, 1975), most do not (Freeze & Montgomery, 2016; Groenendyk et al., 2022; Malka et al., 2014). Moreover, some work suggests that people who are more knowledgeable about and aware of politics, the people most likely to use political ideology to structure their attitudes, also have more stable political attitudes (Bartle, 2000; Freeder et al., 2019). Combining these insights suggests that among the general public as a whole, ideological orientation (i.e., if an individual identifies as left wing or right wing) should be unrelated or only weakly related to their political attitudes (i.e., is the attitude position left wing or right wing) and the stability of these attitudes.
However, there is some evidence supporting the idea that political ideology constrains political attitudes. Most directly, some evidence finds that ideological extremity is associated with self-reported issue stability and with the stability of the ideology over time (Zwicker et al., 2020). This work, however, did not test how ideology is related to the stability of other political issues, nor was ideology compared to political identity. Arguably, literature from the motivated social cognition approach to ideology also supports the proposition that ideology constrains political attitudes. This approach suggests that people adopt political attitudes and beliefs that help them to satisfy psychological motivations (Jost & Amodio, 2012). Scholars from this perspective may point to ideology’s high degree of heritability (de Vries et al., 2021; Smith et al., 2011) and its consistent associations with personality (de Vries et al., 2021; Gerber et al., 2010; Jost et al., 2009) as evidence that ideology constrains political attitudes. Although there is some evidence that ideological strength will constrain political attitudes, the evidence supporting this expectation is arguably not as plentiful and there are no direct tests of the idea. In sum, the literature suggests that ideology strength should be weakly related or unrelated to political attitude stability, whereas party identity should be moderately related to political attitude stability.
Measuring Attitude Stability
An important contribution of our research is that we explore stability of attitudes longitudinally, within individuals. We use two intensive longitudinal datasets to test within-participant stability in attitudes every 2 weeks over the course of 6 months and a year. This avoids challenges of studying change, like regression to the mean, that is found in studies using a more limited number of measurement occasions. There are two key questions we need to address about attitude instability: What is it? and How do we measure it?
We are interested in any variation or change in political attitudes. Stephens (1976) highlighted three types of attitude instability that can results in variation in a person’s attitude across measurement occasions: (a) true change in a person’s attitudes where a person’s actual attitude shifts to become more left wing or right wing; (b) measurement error, where imprecision in the attitude scale or method results in a difference between the measured attitude and a person’s true attitude (see also Judd & Milburn, 1980); and (c) randomness within the target person themselves, where a lack of clarity in their thinking, lack of self-insight, or uncertainty on their actual position results in a difference between their reported attitude and their true attitude. We are interested in all three forms of instability. This is because actual change and randomness within the target constitute true instability and an individual’s experienced attitude instability, respectively. Furthermore, according to Converse (1964, 1980), measurement error captures a theoretically relevant form of attitude instability as variation in people’s responses due to lack of understanding or knowledge in responses to questionnaire items. Indeed, politically informed people’s attitudes often show more measurement error than do highly informed people’s responses (Converse 1964, 1980). As such, we define attitude instability as all forms of variation in political attitudes derived from either true attitude, within-person randomness, or measurement error.
We select a measure of attitude change that consists of all three forms of variation (i.e., true attitude, within-person randomness, or measurement error). According to Jahng, Wood, and Trull (2008), a comprehensive investigation of within-individual attitude stability should capture both the variability and temporal dependency of attitudes. Variability tells us how much a value changes on average. High variability denotes instability. Temporal dependency tells us about the amount of successive change between time points, or the persistence of participants’ attitudes and their moment-to-moment fluctuations. High dependency denotes low instability because each successive observation is highly dependent on the prior observation. Instability should consist of both frequent and large changes in attitudes. Focusing on one component of instability only gives part of the picture and may be misleading. For example, if a person’s attitude toward abortion would start as strongly liberal (e.g., strongly pro-choice), but gradually became more conservative linearly over time until they were strongly conservative (e.g., strongly anti-abortion), they would show a large variation in their attitude. However, this gradual shift from strongly liberal to strongly conservative would not be well captured by temporal dependency measures like auto-correlations, which would be consistently high throughout this gradual shift, denoting low attitude instability. In this example, if we would only account for variability we would conclude there was large instability. But, by also accounting for temporal dependency, we can see that this person’s attitude change occurred gradually and consequently they do not have a highly unstable attitude. Thus, attitudinal stability is a crucial combination of both variability (total changes over time) and temporal dependency (changes relative to prior measurement occasions).
Unfortunately, the two most well-known measures of within-person item stability only focus on variability or temporal dependency at the expense of the other (Jahng et al., 2008). (a) A within-person standard deviation focuses solely on variability. As such, it captures the range of a person’s attitude change, not the order in which changes occur. (b) Auto-correlations are a good measure of temporal dependency (i.e., the persistence of item scores), but they do not capture extremity or degree of fluctuations (i.e., it ignores variability). To address this, Jahng et al. (2008) recommend that scholars use the (mean) square of successive differences ((M)SSD; von Neumann et al., 1941). (M)SSD is a measure of instability that captures the extent that consecutive measures differ from each other by taking the average squared difference between adjacent observations. For example, if an individual would become more strongly conservative in their attitudes toward abortion between two time points, moving from somewhat supportive (=5) to strongly supportive (=7) of abortion, then the difference in score between these time points would be 2; this value would be squared and summed with other consecutive differences. As such, a high score indicates both high variability and low temporal dependency. The dispersion of scores around a trend line that systematically increases over time will not be overestimated (as it is with measures of variance; Jahng et al., 2008). Thus (M)SSD is ideal for capturing instability. (M)SSD has already been successfully applied in research on emotion stability (Koval et al., 2013). Building on this, we will use (M)SSD to operationalize the stability of 15 political attitudes in this research.
Study Overview
In this research, we investigate the relation between attitude instability and party identity strength and ideology strength. We test the explorative hypotheses that higher party identity strength (H1) and higher ideology strength (H2) will both predict more attitude stability. We use intensive longitudinal data collected in the United States every 2 weeks over the course of 1 year (Study 1; Brandt et al., 2021) and in the Netherlands over 6 months (Study 2) to test these hypotheses. For summary of hypotheses and results, see Table 1.
Summary of Hypotheses, Models, and Results Across Studies 1 and 2.
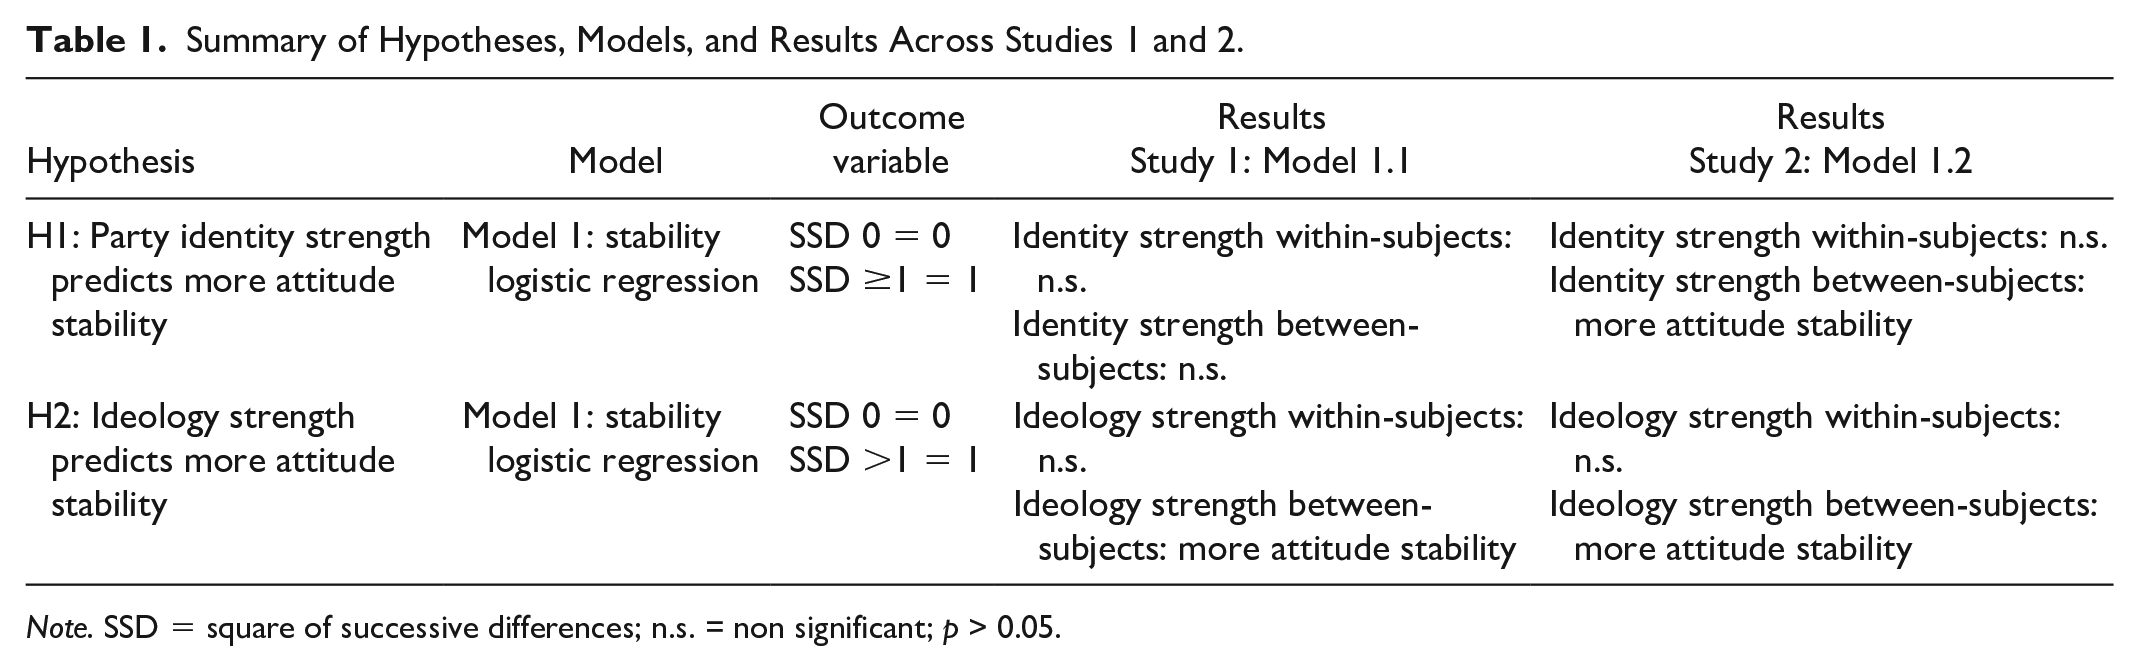
Note. SSD = square of successive differences; n.s. = non significant; p > 0.05.
Study 1
Method
The data and codebook applied in this study can be found in the study by Brandt et al. (2021). All scripts associated with this project can be found using the following link: https://osf.io/gbvyk/?view_only=fc7b3022d9f0401cadac524c1dc44ad1.
Sample
We conducted analyses using a 26-wave year long, longitudinal study (Brandt et al., 2021). The data were collected in the United States using Prolific. A total of 552 individuals (278 = female, 271 = male, 2 = not listed, 1 = missing) aged 18 to 73 years (M = 34.7, SD = 12.35) were recruited in April 2019 to complete a survey online at 2 weeks intervals over the course of a year (i.e., 26 time points). We recruited people in the first wave based on their self-reported vote in the 2016 election. We recruited 161 Trump voters, 168 Clinton voters, and 223 non-voters/prefer not to say. Each of the 26 surveys remained open for 1 week and consisted of a core set of measures. The average response rate across the waves was 75% (SD = 8%, range: 63%–93%).
Measures
The survey consisted of items assessing their political attitudes, values, and behaviors. We report all manipulations, measures, and exclusions in these studies. Relevant items are reported in the main text. A complete list of all items measured and the survey procedure are available in the study by Brandt et al. (2021). We selected relevant items as political attitude and identity items that were measured across all 26 waves of the study (except controls that were measured at T1 only). Most items were measured on a 7-point Likert-type scale (answer options 8 = Don’t know, 9 = I haven’t thought much about it, were coded as missing). Exceptions are noted below. For exact wording of items, see Supplemental Material.
Ideology
Ideology was measured with the item “When it comes to politics, do you think of yourself as liberal, conservative, moderate, or haven’t you thought much about this?” (1 = Strongly liberal, 4 = Middle of the road, 7 = Strongly conservative).
Identity
Party identity was measured using one item “Do you think of yourself as a Republican, a Democrat, an Independent, or haven’t you thought much about this?” (1 = Strongly Democrat, 4 = Independent, 7 = Strongly Republican).
Attitudes
Attitudes toward 13 different political issues—defense, crime, terrorism, aid for the poor, health care, economy, abortion, benefits to the unemployed, black aid, adoption, immigration, vaccines, and guns—were measured using single item. Most items were asked “Should federal spending [to issue] be increased, decreased, or kept the same?” (1 = Greatly decrease, 7 = Greatly increase), though there were four exceptions to this (abortion, adoption, vaccines, and guns). For full item wordings, see Brandt et al. (2021).
Controls
Gender, age, education, ethnicity, income, and political interest were measured. Education was measured as the highest completed level of schooling, using an 11-item scale from 1 = No schooling completed to 11 = Doctorate degree. Participants selected the ethnicity to which they identified from a drop-down list (e.g., Asian, Caucasian, Black/African, Native American). Total household income was measured from 1 = less than $20,000 to 6 = over $100,000. Political interest was measured with the item “How interested are you in politics?” (anchored at 1 = very uninterested, 7 = very interested).
Data Preparation
Attitude Instability
First, we generated an item-level measure of instability for all 15 attitudes separately per person. We calculated the MSSD (Jahng et al., 2008; von Neumann et al., 1941) of each item for each person over the waves that they were measured (maximum waves present = 26, minimum = 1, M = 19.80, SD = 7.71). MSSD is the average of the squared difference between an individual’s successive responses at adjacent measurement occasions i and i + 1 (e.g., the mean of (T1 − T2)2 + (T2 − T3)2 . . . + (T25 − T26)2); notably n = 12 participants only participated in one wave were coded as missing. MSSD’s minimum value is 0 (i.e., complete stability/no change), and higher values show more attitude instability. MSSD was calculated using the R package “psych” (Revelle, 2020). We use MSSD for descriptive purposes.
Second, we calculated our key measure of attitude instability at the time-point-by-item-level, per person. For this, we used the SSD of each consecutive attitude measure. SSD calculates the difference in each participant’s response at successive time points (e.g., (T1 − T2)2; (T2 − T3)2; etc.; if a person is absent at T2 it calculates T1 − T3). SSDs are the focus of our main analyses. Both MSSD and SSD measures of temporal instability capture both the item’s variability and temporal dependency over time. But only the SSD allows us to test group differences in attitude instability, taking individual error into account (Jahng et al., 2008).
Identity Strength and Ideology Strength
To create the variables identity strength and ideology strength we recoded the original identity and ideology items so that the most extreme values (i.e., 1 = Strongly Democrat/Strongly Liberal, 7 = Strongly Republican/Strongly Conservative) became the highest value on the strength scale (i.e., 3). The more central values of the original item (e.g., 3 = Independent, lean Democrat/Slightly Liberal, 5 = Independent, lean Republican/Slightly Conservative) became the lower value on the new scale (e.g., 1). The midpoint of the original item (i.e., 4 = moderate) became the lowest value (i.e., 0).
Party Identity and Ideological Affiliation
Given that our identity/ideology strength scales coded the strength of an individual’s party identity or ideology regardless of their position, we also generated a variable coding their party/ideological affiliation. Party identity was coded as Democrat (i.e., 0) if the participant reported their identity strength as 1 to 3 (i.e., Independent, lean Democrat to Strongly Democrat) more often than they reported their identity strength as 5 to 7 (i.e., Independent, lean Republican to Strongly Republican). Republicans were coded (i.e., 1) when the reverse was true. Participants’ ideological orientation across waves was coded as liberal (i.e., 0) if the participant reported their ideology as 1 to 3 (i.e., Slightly Liberal to Strongly Liberal) more often than they reported their ideology as 5 to 7 (i.e., Slightly Conservative to Strongly Conservative). Conservative orientation was coded (i.e., 1) when the reverse was true.
Analytical Approach
We estimated two models of attitude instability SSDs. We do so to address the issue of (non-normal) zero-inflated SSD data distributions (see Figure 1) that exhibited many 0 values indicating complete stability (range across items: 62.77%–94.66%). Typical zero-inflated modeling approaches (e.g., Poisson regression or negative binomial models) require count data and are therefore not appropriate for our continuous SSD variables (M = 0.96, SD = 3.69; range: 0–36).
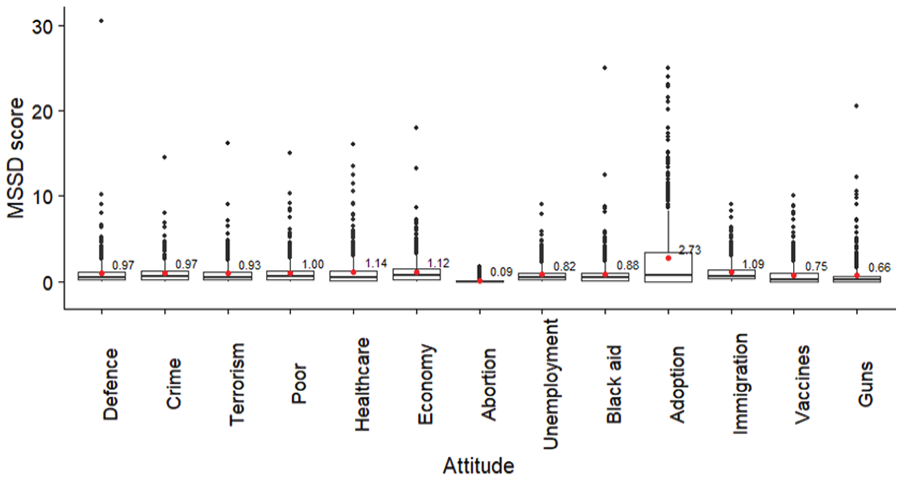
Boxplot of MSSD Variables of Attitudes in Study 1, With Mean Values Highlighted With the Red Dot and Reported in a Label.
Model 1: Attitude Stability
A logistic multilevel model is used to explain attitude stability by predicting whether the values of attitude SSD are 0 or >0. This tests whether ideology/identity strength is associated with complete attitude stability versus any amount of instability. The model is the closest fit to our key research questions so will be the main focus of this article.
Model 2: Attitude Instability
A generalized multilevel model with gamma error and log link (as advised by Jahng et al, 2008) is applied to explain attitude instability by predicting cases with non-zero values (range across items: 5.34%–37.22%) fitting gamma error and log link models which can only deal with positive and non-zero values. This model therefore predicts degree of instability on attitudes among respondents who indicated any instability, testing if ideology/identity strength is associated with the amount of observed instability in political attitudes. This model will be reported in Supplemental Material because (a) theoretically its focus on testing the amount of instability is somewhat less well tailored to testing our main hypothesis about attitude stability and (b) methodologically it uses a subsample of the data—respondents with attitude instability—as such results here are less well powered than Model 1.
Results
A descriptive analysis of attitude instability (see Figure 1) revealed that the attitude toward abortion exhibited most stability at the item-level (i.e., MSSD), followed by gun control and vaccines. Allowing same-sex couples to adopt children showed the most instability, followed by health care and economic attitudes.
The Association Between Identity Strength, Ideology Strength and Attitude Instability (SSD)
We ran a multilevel logistic model predicting attitude instability (SSD). We refer to the outcome variable (SSD) as attitude instability, with 0 = No instability (i.e., SSD = 0) and 1 = Any amount of instability (i.e., SSD > 0). The key predictors were identity strength and ideology strength. We also included control variables of gender, political interest, age (at T1), education level, income, and ethnicity. Models included random intercepts for participants, attitudes, and time points. The intraclass correlation showed that 12.6% variance was between-person, 10.2% was between-attitude, and 1.7% was between-wave. Models with (a) fixed effects for attitude and time point and (b) controls excluded are reported in Supplemental Material and show that results as comparable to those reported in the main text, so these modeling decisions did not have practical implications for results. We conducted a sensitivity analysis using the package simr (Green & MacLeod, 2016) on the smallest effect size in our model; this reveals that with our sample we can detect a minimum exponent of 0.85 with 80% power.
In Step 1 the key predictors of ideology strength and identity strength were centered both within-participants (i.e., using the participant’s mean across time points) and between-participants (i.e., the participant’s mean across time points minus the grand mean). Centering within-participants allows us to test for associations with changes in an individual’s identity/ideology strength (i.e., if an individual’s ideology increases in strength). Centering between-participants allows us to test for associations with a participant’s average ideology/identity strength in comparison to other people (i.e., subject A has a stronger ideology on average than subject B). In Step 2, we also explored if ideology position/party affiliation is related to attitude stability or moderated the relation between identity/ideology strength and attitude stability. We code left/Democrats support as 0 and Right/Republican support as 1.
Control variables of gender (coded −1 = female, 1 = male), political interest, age (at T1), education level, income, and ethnicity (coded −1 = white, 1 = non-white) were also included in this step. All continuous controls were mean centered (except education which was centered to the median = bachelor’s degree). We ran these models using the package lme4 (Bates et al., 2015) in R (R core Team).
An inspection of correlations (see Table 2) reveals that ideology strength and identity strength are strongly correlated (r = .68, p < .001), but it is particularly ideological affiliation and party identity that are almost completely overlapping (r = .94, p < .001). VIFs are low for all parameters (VIF < 3.35) except the main effects of ideological affiliation and party identity (10.22 < VIF < 10.65). This means that interpretations of the full model with all interactions included should be made carefully. As such, we also report Model 1 Step 2 with only ideology position interactions (Step 2.1) and party position interactions (Step 2.2), separately in a Supplemental Material. These analyses show that some interaction effects emerge in Study 1 when ideology strength and identity strength interactions are modeled separately. Thus, the data suggest that observed main effects may not be universal but may characterize Democrats/Republicans and Liberals/Conservatives differently, for more details see the Supplemental Material. Because these effects do no replicate in Study 2, we do not focus on them here.
Pearson Correlations With Pairwise Complete Observations, Between Party Strength (Between and Within Person Centered), Ideology Strength (Between and Within Person Centered), and Attitude Stability for Studies 1 and 2.
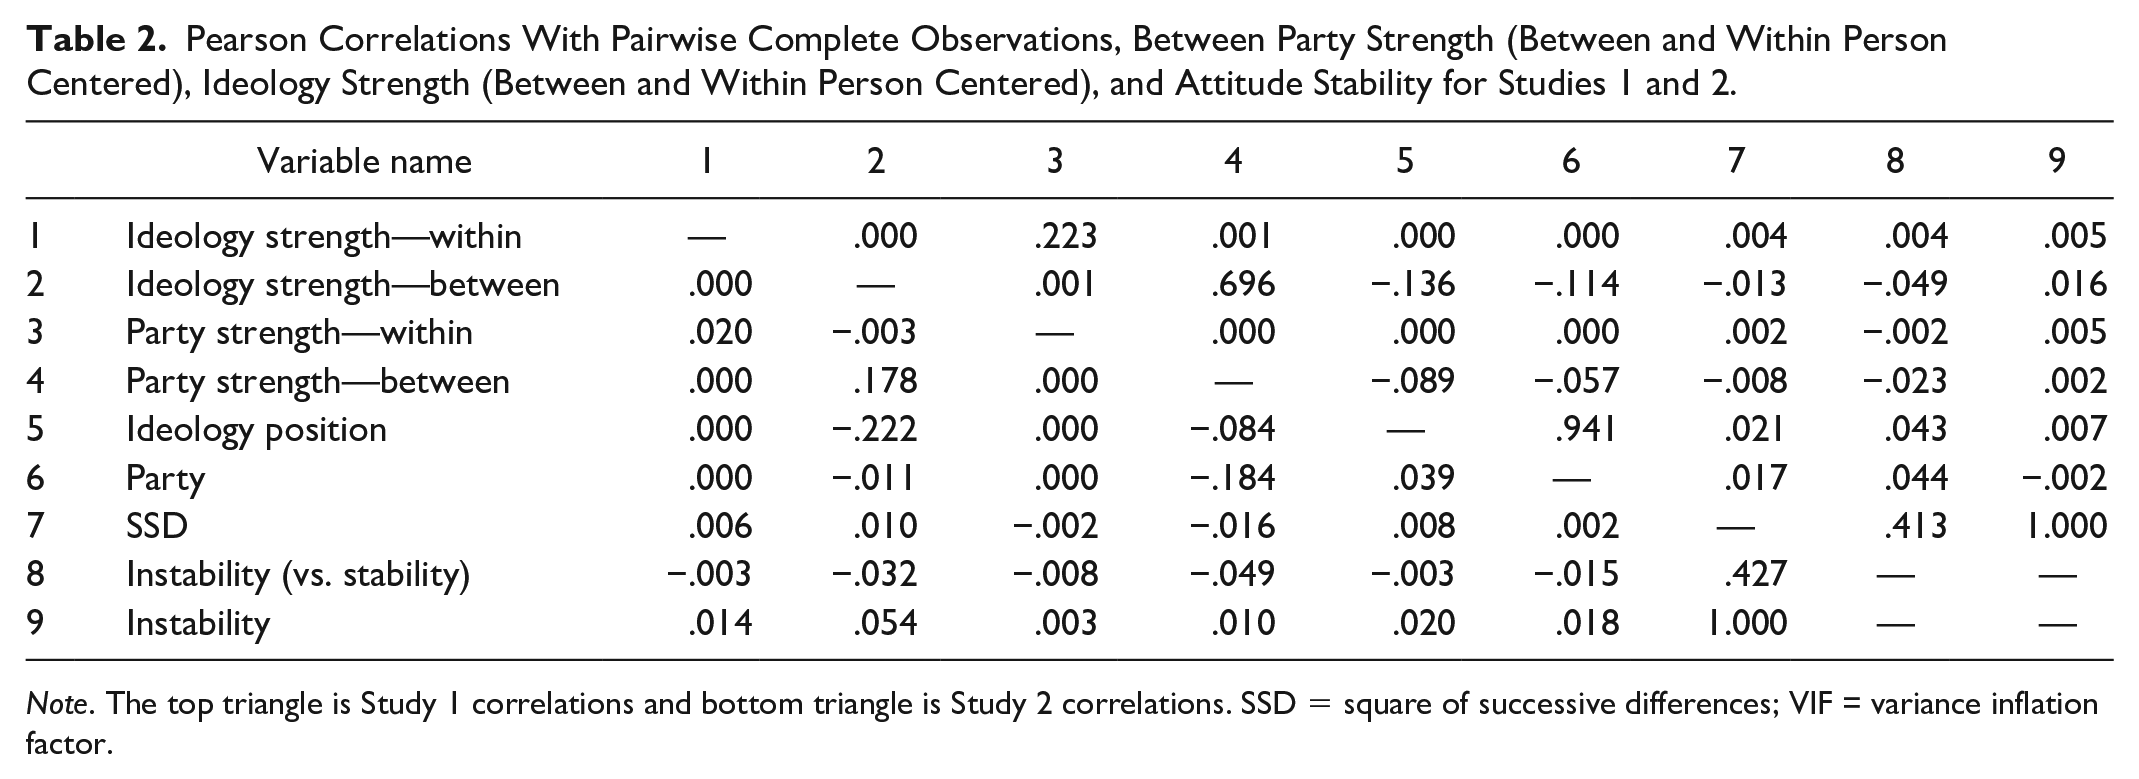
Note. The top triangle is Study 1 correlations and bottom triangle is Study 2 correlations. SSD = square of successive differences; VIF = variance inflation factor.
Main Analyses
We used multilevel logistic regression models to test if identity strength and ideology strength predicted having complete attitude stability (SSD = 0) versus any degree of attitude instability (SSD = 1). Our explorative hypotheses predicted that higher identity strength (H1) and higher ideology strength (H2) will be associated with attitude stability. This translates to expecting a negative association between the identity/ideology strength variables and attitude instability.
Model 1.1, Step 1 (see Table 3) identity strength had no association with attitude instability once ideology strength was accounted for (inconsistent with H1). Strength of political ideology was the only significant predictor of attitude instability. Supporting H2, this shows that between-person ideology strength was a significant negative predictor of attitude instability. This was a robust effect that remained in all steps in this model. This shows that people with stronger ideological identities are more likely to have stable attitudes, whereas people with weaker ideological identities are more likely to have some amount of attitude instability.
Binomial Multilevel Regression Model Predicting Attitude Stability (0 = Complete Stability, 1 = Any Instability) From IS and PS (Model 1.1, Study 1).
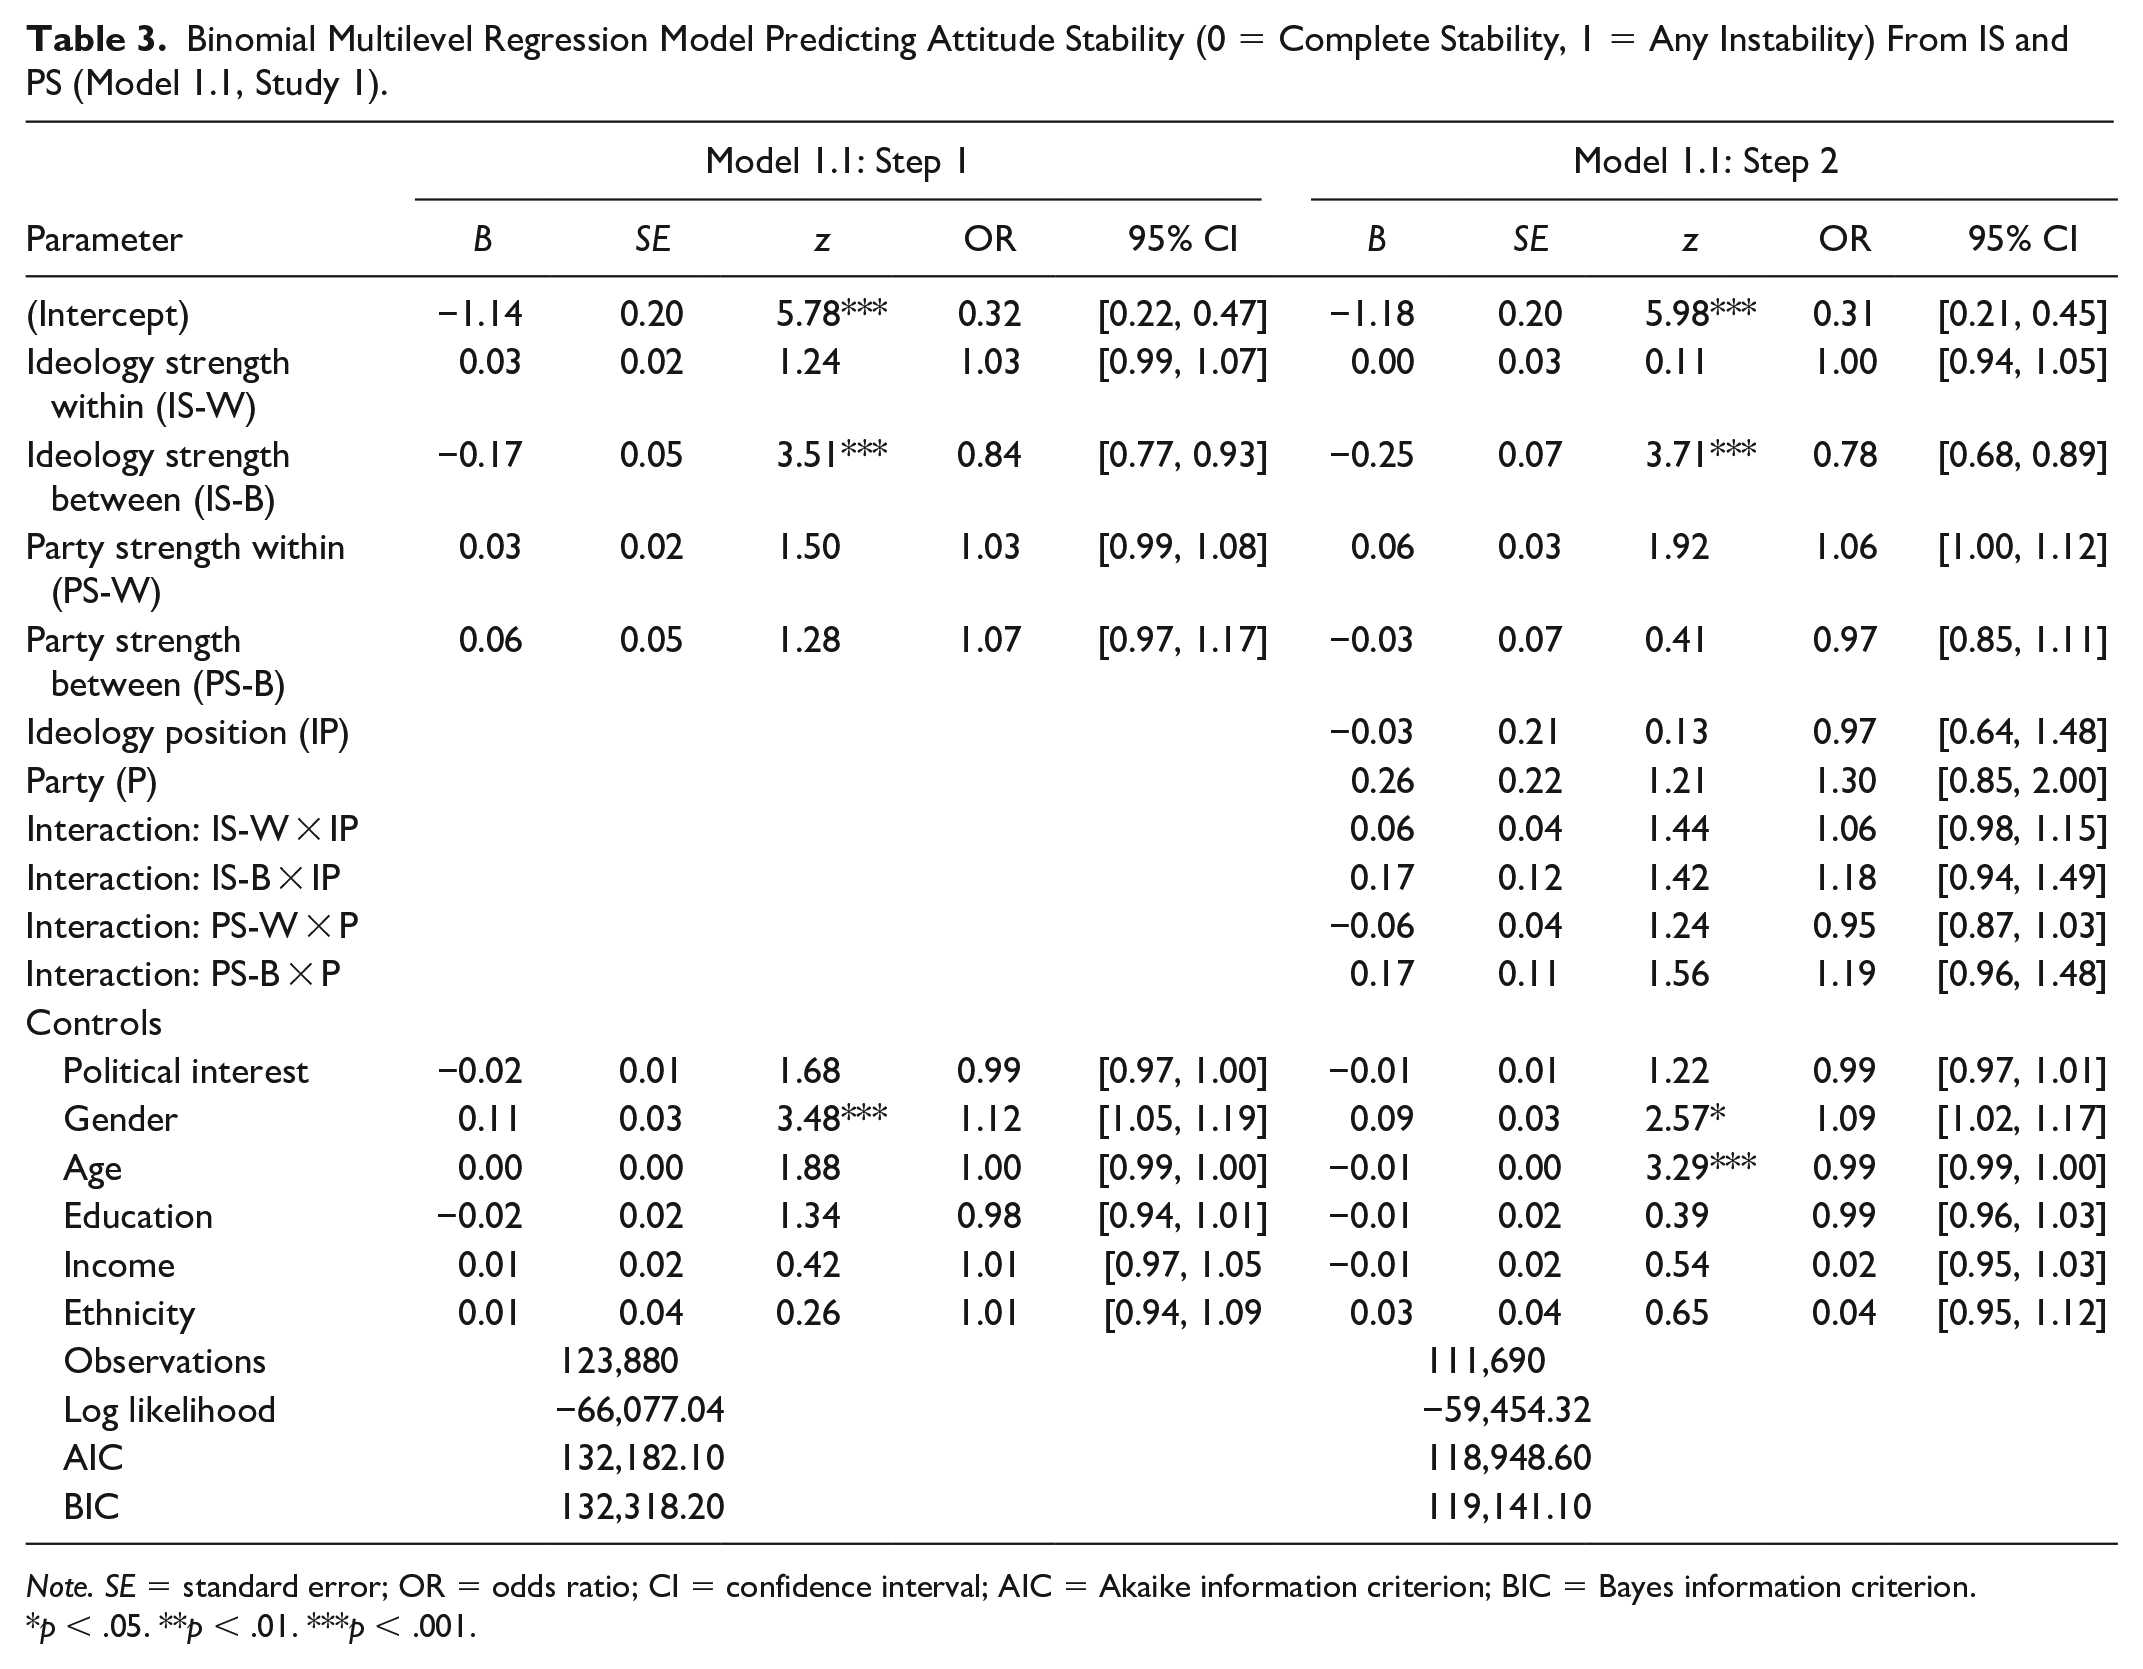
Note. SE = standard error; OR = odds ratio; CI = confidence interval; AIC = Akaike information criterion; BIC = Bayes information criterion.
p < .05. **p < .01. ***p < .001.
In Model 1.1 Step 2, we added interactions with ideology and party position. We found small, non-significant, interactions between party and position/ideology and position on both within- and between-subjects-centered parameters (zs <|1.44|).
Discussion
Overall, we found strongest support for H2. People with higher ideology strength on average showed more attitude stability than individuals with lower ideology strength. Ideology strength’s association with attitude stability was only at the between-person level (i.e., not within-person). This shows that individuals with stronger ideology on average have more stable attitudes than individuals in our sample with a weaker ideology, but when a person’s ideology increases in strength this does not necessarily mean their attitudes became more stable too. Unexpectedly, we did not find any support for H1. Party strength was unrelated to attitude instability (either within-person or between-person centered).
Study 2
To test if results replicate in another political context, we analyzed the data from an intensive longitudinal study into political attitudes in the Netherlands. The Netherlands is an interesting case in which to test replication. Although the United States and the Netherlands are WEIRD (Western, educated, industrialized, rich, and democratic) and use the left-right ideological structure, the Netherlands is a more liberal leaning country with a multiparty system. In the elections prior to this study, 28 parties participated and 13 won seats in parliament. The Dutch study was a shortened version of the main U.S. study, which was run every 2 weeks over 6 months, focusing on a more selective group of five political attitudes. Our analysis approach and data management were pre-registered (https://osf.io/cuvwx/?view_only=39e61c00c734407abc72e95b8b11071c).
Method
Data and Sample
The data were collected every 2 weeks in a 12-wave, 6-month long, longitudinal study in the Netherlands. Data were collected within the LISS Panel data collection project, between September 2019 and February 2020 (for prior use of this same data see Brandt & Morgan, 2022). A total of 1,670 participants were contacted to participate in the survey. Between 1,161 (lowest response wave) and 1,377 (highest response wave) subjects participated in each wave (response rate 66.8%–77.7%).
Measures
All main variables of interest (i.e., ideology, party sympathy, and attitude items) were measured in all 12 waves of the survey. This allows us to test for the relation between changes in ideology, identity, and attitude in intensive longitudinal data.
Ideology was measured as “When it comes to politics, do you think of yourself as more left or right political orientation?” (1= Left, 10 = Right).
Party sympathy was measured toward 13 parties (i.e., VVD, PVV, Christian Democrat Party, D66, Green Party, Socialist Party, Labor party, Christian Union Party, Animal Welfare Party, 50+ Party, Christian Reformed Party, DENK, Forum for Democracy) with the item “How sympathetic do you think political parties are?”
Attitudes were measured toward five political issues, using single item. Attitudes toward euthanasia, income inequality, immigration, and European unification were measured by asking participants to identify their stance toward two possible positions on that issue, for example: “Euthanasia should be forbidden or allowed?” (1 = Euthanasia should be forbidden, 5 = Euthanasia should be permitted). Attitude toward policing was measured by asking “It should be possible for police and investigation officers to search people, vehicles, or objects if they simply suspect that a crime or terrorist act is being planned” (1 = Fully disagree, 7 = Fully agree).
Controls of political interest, income, education, age, and gender were also measured. Political interest was measured as “How interested are you in politics?” (1 = very uninterested, 7 = very interested). Education was measured from 1 = primary school to 6 = university. Income was measured as net household income in euros.
Variable Construction
Ideology strength was calculated as in Study 1. For party strength we first needed to select the party sympathy item for the party that the individual was closest to. We did so by calculating the individual’s mean level of party sympathy for the 10 parties across the full 6-month period and selecting the party with the highest mean (there were no ties for the highest mean). Next, we recoded the selected party sympathy item so that the most extreme values (i.e., 0 and 10) become the highest value on the new strength item (i.e., 5) and the center point of the original items (i.e., 5) becomes the lowest point on the strength item (i.e., 0).
Ideology orientation across waves was coded as Left (i.e., 0) if the participant reported their ideology as 1 to 4 (i.e., left) more often than they reported their ideology as 6 to 10 (i.e., right). If the reverse was true, they were coded as Right (i.e., 1).
Party was coded as 0 if the participant was closest to (i.e., had the highest mean level of sympathy for) the VVD (i.e., the ruling party at the time of data collection) and 1 otherwise.
Attitude stability was constructed as the squared sum of successive differences and its mean (i.e., MSSD), as in Study 1.
Analytical Approach
Following Study 1 and our pre-registration we ran two multilevel models. Model 1.2 (i.e., Model 1 now run with Study 2 data) was a multilevel logistic regression model testing if identity strength and ideology strength predicted complete attitude stability versus any attitude instability (i.e., SSD = 0 vs. SSD > 0). Model 2.2 (i.e., Model 2 now run with Study 2 data) is a generalized multilevel model with gamma error and log link which predicts degree of instability on attitudes among respondents who indicated any instability. Model 1.2 is the key focus of the results; Model 2.2 can be found in Supplemental Material.
Results
Looking at the boxplots of attitude MSSD in Figure 2 we can see that distributions are substantially more right/positive skewed within the Dutch context in comparison to the U.S. context, and thus demonstrate less change in attitudes in this Dutch data. Indeed, four or five attitudes had over 70% stability over the 6-month measurement period (max = 85.33%, min = 62.14%). This may be because the Dutch study was shorter (i.e., 6 months) than the U.S. study (i.e., 12 months).
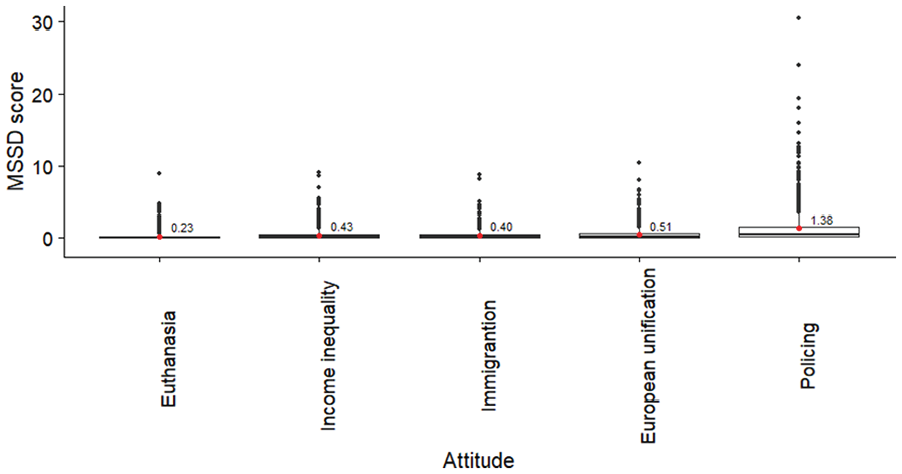
Boxplot of MSSD Variables of Attitudes in Study 2, With Mean Values Highlighted With the Red Dot and Reported in a Label.
Main Analyses
We ran a logistic multilevel model with random intercepts for participants’ attitudes and time points. The intraclass correlation showed that there was 14.5% between-person variation, 1.6% between-wave variation, and 5.1% between-attitude variation. The outcome variable was attitude stability (SSD) and key predictors were identity strength and ideology strength (Step 1). We also included interactions between ideology position and ideology strength, and party and identity strength (Step 2). The key predictors of ideology strength and identity strength were centered both within- and between-participants. Control variables of gender, political interest, age (at T1), education level, income, and ethnicity were also included in the models. A sensitivity analysis in simr on the smallest detected effect shows that we can detect a minimum exponent of 1.07 with 80% power. We use this model to test our explorative hypotheses that both higher identity strength (H1) and higher ideology strength (H2) will be associated with attitude stability.
Model 1.2 Step 1 (see Table 4) shows that identity strength between-person centered is significantly and negatively associated with attitude stability (supporting H1). The stronger an individual’s party identity on average, the more stable their attitudes are. This is the strongest and most robust effect in the model, emerging consistently across all steps in Model 1.2. Furthermore, the between-person-centered ideology strength is significantly and negatively associated with attitude stability, supporting H2 and replicating Study 1. This means that individuals with a stronger political ideology are more stable in their attitudes than individuals with weaker political ideology.
Binomial Multilevel Regression Model Predicting Attitude Stability (0 = Complete Stability, 1 = Any Instability) From IS and PS (Model 1.2, Study 2).
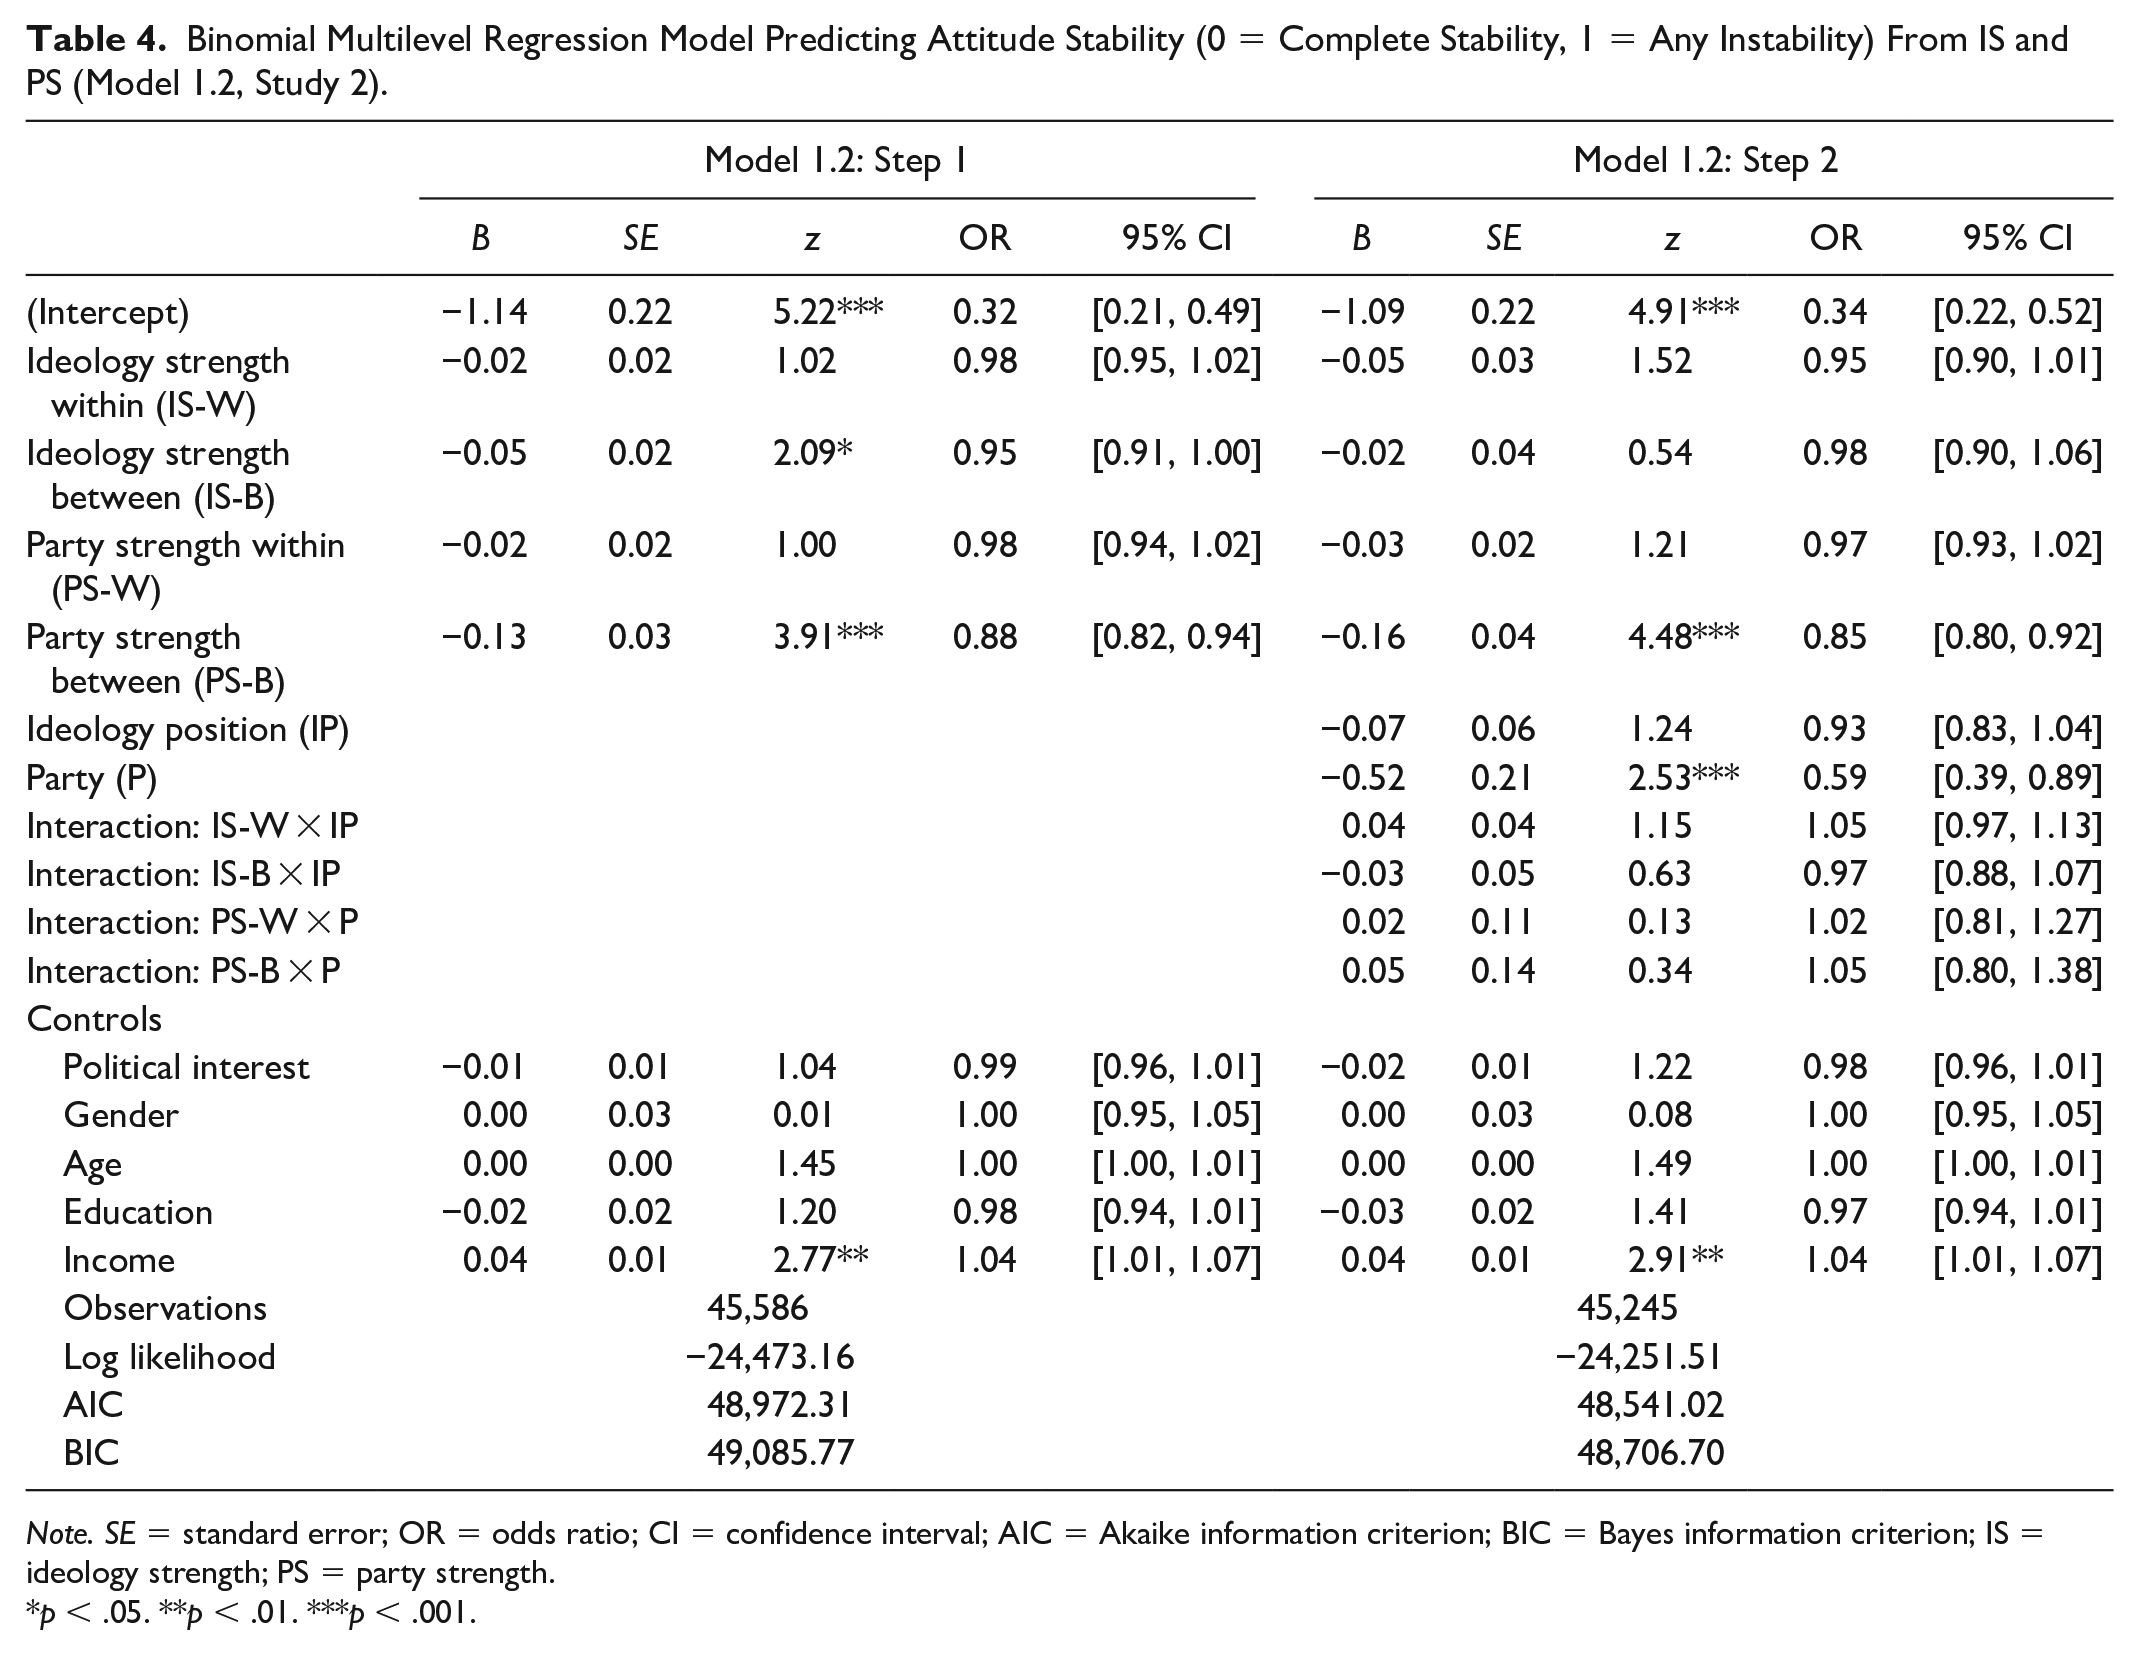
Note. SE = standard error; OR = odds ratio; CI = confidence interval; AIC = Akaike information criterion; BIC = Bayes information criterion; IS = ideology strength; PS = party strength.
p < .05. **p < .01. ***p < .001.
No interactions between ideology or identity strength and ideology or party position were found in Model 1.2 Step 2. This suggests that these negative trends are relatively consistent across people with different party support/ideology position. The main effect of party is also significant and negative, this means that people who identify as supporters of the majority party (i.e.,VVD) have more stable attitudes than the supporters of other parties. Overall, Model 1.2 supports H1 showing that individuals with greater party identity strength also have greater attitude stability. This effect appeared to be relatively consistent across political parties. Our model also presents somewhat weaker support for H2 (as this effect drops out in Step 2), showing that individuals with greater ideology strength show greater attitude stability.
Discussion
Results show support for both hypotheses. Consistent with H1 and H2, Model 1.2 shows that individuals with higher identity and ideology strength also had more attitude stability than individuals with lower identity and ideology strength, respectively. There was no association between within-subjects identity or ideology strength and attitude instability (i.e., a change in identity or ideology was not associated with instability in attitudes).
Study 2 replicated the Study 1 finding that between-subjects ideology strength was associated with more attitude stability. Interestingly, in the Netherlands, we also observed a relation between party identity strength and attitude stability. Moreover, this relation was stronger and more positive than the relation between ideology strength and attitude stability (something we did not observe in the United States).
An important qualification of these results is that we had to utilize party sympathy as our measure of identity strength. Although party sympathy captures an affective component of party affiliations rooted in social identity (Harteveld, 2021), and it is therefore strongly positively related to party identification, party sympathy and identification are distinct concepts. As such, Study 2 is likely to underestimate the relation between party identity strength and attitude stability.
General Discussion
We tested if people’s party identity and ideology strength were associated with the stability of their policy attitudes in longitudinal panel studies in the United States and the Netherlands. Evidence for H1 was mixed: Party identity strength between-subjects was strongly associated with attitude stability in the Netherlands (Model 1.2; consistent with H1) but was not associated in the United States (Model 1.1; inconsistent with H1). Our most consistent result across two studies was support for H2: In both the United States and the Netherlands we found that stronger ideology between-subjects was associated with stable attitudes (though more weakly in the Netherlands than in the United States). Also consistent across both studies, we did not find any within-subjects effects of identity or ideology strength on attitude stability in Model 1 (note that some relations did emerge for Model 2 in Supplemental Material where we modeled attitude instability).
Theoretical Implications
Our hypotheses were based on the idea that stronger ideologies and party identities would have a constraining influence on political belief systems, holding political attitudes in place and making them more stable over time. Across studies, the most consistent result was that individuals with a stronger ideology also had more attitude stability. As such, results align with this idea: Individuals with stronger ideology are more consistent in their attitudes and therefore fluctuate less in their beliefs over time. A practical implication of this is that scholars will have reduced error when measuring attitudes in individuals with a stronger ideology than those with a weaker ideology (cf. Kalmoe, 2020). Although it is possible that ideology strength was more strongly related to attitude stability due to their heightened conceptual similarity (in comparison to the similarity of party identity and attitude stability), this finding may come as a surprise to some scholars. Theoretically, this stands in contrast to prior research which argues that people do not use ideology much (e.g., Kinder & Kalmoe, 2017). However, most prior work has typically focused on whether ideology is associated with consistency or constraint between attitudes (i.e., do left-wing identifiers also have left-wing attitudes). Our analyses focused on a slightly different question—What is the association between ideology strength and the consistency of attitudes over time (i.e., their stability)? Our findings suggest that ideology may help people maintain stable attitudes, which is broadly consistent with perspectives arguing for the psychological potency of ideology in the mass public (e.g., Jost, 2006).
Results for party identity strength were more mixed across countries. In the United States, there was not a positive association between identity strength and attitude stability. In contrast, in the Netherlands, people with stronger party identification had more stable attitudes. The inconsistency in these results is surprising, given that the literature is predominantly populated with research that shows that party identity strength is associated with attitude constraint, which would imply more attitude stability (Dancey & Goren, 2010; Goren, 2005; Goren et al., 2009; Kalmoe, 2020; Kinder & Kalmoe, 2017). It is unclear why we did not find this in the United States. The results may suggest that the meaning of the political identity can change under different leadership in different contexts (see also Steffens et al., 2014), and influence the subsequent relation between identity strength and other psychological variables, such as attitude stability (Turner-Zwinkels & van Zomeren, 2021). As such the relation between party identity strength and attitudes may be contingent on events and the meaning of the identity at the time.
In hindsight, it is perhaps unsurprising that we primarily find support for our hypotheses on the between-participant-centered ideology/identity strength variables. These variables test if individuals with stronger ideology or identity overall also have more stable attitudes. Our results suggest that having a stronger ideology (the United States and the Netherlands) and stronger party identity (the Netherlands) may help to maintain stable political attitudes. The within-person-centered variables test if people who experience wave-to-wave changes in identity strength (the United States) or ideology strength (the Netherlands) also show attitude instability. Wave-to-wave changes in strength may not be substantial enough to consistently impact other attitudes; however, for the rare person who changes in identity strength and remains at the new level, their other attitudes may change. That is, we may only expect to find more stable attitudes among people whose identity/ideology becomes consistently stronger, whereas attitude stability should not be expected among people who experience a short-term fluctuation in their identity/ideology. Nevertheless, we believe that this statistical approach of disaggregating within- and between-person effects of identity and ideology strength is worth mentioning as a strength of this research. It gave us the opportunity to identify relationships that hold within persons as well as relationships that hold across persons, to allow more insight into processes of change within political belief systems.
It is worth noting that Model 2 analyses in Supplemental Material suggest that the relation between identity strength, ideology strength, and attitude instability is not as straight forward as suggested by Model 1. Our analysis of attitude instability (Models 2.1 and 2.2), although less consistent and less well-powered, showed that within-subjects changes in identity strength (Study 1) and between-subjects ideology strength (Study 2) were associated with attitude instability. There are at least two possible explanations. First, people with stronger ideology and party identity have more strongly interconnected attitudes (e.g., Brandt, 2022), so if there is change, the change may be more extensive because changing one attitude has implications for changing other attitudes (cf. dynamic constraint; Turner-Zwinkels & Brandt, 2022). Second, people with a strong identity (Morton et al., 2007) or ideology (Skitka et al., 2002) can be more likely to change their beliefs because they care the most about having appropriate attitudes that fit with their ideology/group. An interesting implication of these findings is that they highlight that distinct processes may be involved in (a) maintaining the stability of political attitudes and (b) evolution and change of attitudes. The typical idea in the literature, and that we also tested in this article, is that party identity strength and ideology strength are a “glue” that keeps things together. But in this view, strength does not move around a lot, which is why it works as a glue. In Model 2 we predominantly found effects on the within-person-centered variables suggesting that change in identity/ideology strength is associated with change in attitudes. In many ways it is perfectly logical that in conditions where people get more extreme in their identity or ideology they should also get more extreme on connected attitudes. In this way, our findings highlight that seeing identity strength and ideology strength as a glue should not be mistaken as implying stationarity. In a dynamic world, if the glue changes, then what is stuck to it is likely to change too.
Limitations
Our studies are subject to at least three key limitations. First, we use single-item measures of attitudes, which makes it impossible to disentangle true attitude change from individual error. Such an approach was necessary to allow us to tap into multiple different attitudes in different domains in such an intensive study. Nevertheless, it would be valuable for future research to run another intensive study employing multiple measures (Ansolabehere et al., 2008). Second, it is important to note that, overall, we found relatively little attitude change in our samples (and especially in the Dutch sample), and this may be responsible for some of the relations observed in our data. For example, we found predominantly between-person differences in the relation between ideology strength/identity strength and attitude stability in our data. However, this does not rule out the potential importance of within-person changes in ideology or identity for attitude change. It may be that within-person relations only emerge when a minimal amount of attitude change is satisfied. Third, although this research explores the association between symbolic components (i.e., identity and ideology strength) and the stability of operational components (i.e., attitudes) the opposite direction of influence is also plausible. Changing attitudes, especially important or moralized attitudes, are also likely to influence ideology/identity. Although there were strong theoretical reasons to prioritize the causal ordering investigated in this research, the opposite causal ordering should also be tested in future research.
Conclusion
This research tested if ideology strength and party identity strength were associated with attitude stability in intensive longitudinal data. First, we found mixed evidence for the association between party identity strength and attitude stability (H1): In the United States, there was no association between party identity strength and attitude stability. In the Netherlands, people with stronger party identification had more stable attitudes. Second, we found strongest evidence for the association between ideology strength and attitude stability: Individuals with a stronger ideology than average had more stable attitudes in both the United States and the Netherlands (supporting H2). This suggests that ideology strength and identity strength do function to some extent as a glue holding belief systems together, but this association may not be universal. More research is needed to understand when and under what circumstances ideology strength and identity strength imply attitude stability.
Supplemental Material
sj-docx-1-psp-10.1177_01461672231189015 – Supplemental material for Ideology Strength Versus Party Identity Strength: Ideology Strength Is the Key Predictor of Attitude Stability
Supplemental material, sj-docx-1-psp-10.1177_01461672231189015 for Ideology Strength Versus Party Identity Strength: Ideology Strength Is the Key Predictor of Attitude Stability by Felicity M. Turner-Zwinkels and Mark J. Brandt in Personality and Social Psychology Bulletin
Supplemental Material
sj-docx-2-psp-10.1177_01461672231189015 – Supplemental material for Ideology Strength Versus Party Identity Strength: Ideology Strength Is the Key Predictor of Attitude Stability
Supplemental material, sj-docx-2-psp-10.1177_01461672231189015 for Ideology Strength Versus Party Identity Strength: Ideology Strength Is the Key Predictor of Attitude Stability by Felicity M. Turner-Zwinkels and Mark J. Brandt in Personality and Social Psychology Bulletin
Supplemental Material
sj-docx-3-psp-10.1177_01461672231189015 – Supplemental material for Ideology Strength Versus Party Identity Strength: Ideology Strength Is the Key Predictor of Attitude Stability
Supplemental material, sj-docx-3-psp-10.1177_01461672231189015 for Ideology Strength Versus Party Identity Strength: Ideology Strength Is the Key Predictor of Attitude Stability by Felicity M. Turner-Zwinkels and Mark J. Brandt in Personality and Social Psychology Bulletin
Supplemental Material
sj-docx-4-psp-10.1177_01461672231189015 – Supplemental material for Ideology Strength Versus Party Identity Strength: Ideology Strength Is the Key Predictor of Attitude Stability
Supplemental material, sj-docx-4-psp-10.1177_01461672231189015 for Ideology Strength Versus Party Identity Strength: Ideology Strength Is the Key Predictor of Attitude Stability by Felicity M. Turner-Zwinkels and Mark J. Brandt in Personality and Social Psychology Bulletin
Supplemental Material
sj-docx-5-psp-10.1177_01461672231189015 – Supplemental material for Ideology Strength Versus Party Identity Strength: Ideology Strength Is the Key Predictor of Attitude Stability
Supplemental material, sj-docx-5-psp-10.1177_01461672231189015 for Ideology Strength Versus Party Identity Strength: Ideology Strength Is the Key Predictor of Attitude Stability by Felicity M. Turner-Zwinkels and Mark J. Brandt in Personality and Social Psychology Bulletin
Footnotes
Acknowledgements
The authors would like to thank Tornike Korkotashvili for his help in developing research ideas and writing the analysis script for Study 1.
Declaration of Conflicting Interests
The author(s) declared no potential conflicts of interest with respect to the research, authorship, and/or publication of this article.
Funding
The author(s) disclosed receipt of the following financial support for the research, authorship, and/or publication of this article: This work is financially supported by the NORFACE Joint Research Programme on Democratic Governance in a Turbulent Age and co-funded by NOW and the European Commission through Horizon 2020 under grant agreement No. 822166.
Supplemental Material
Supplemental material is available online with this article.
Notes
References
Supplementary Material
Please find the following supplemental material available below.
For Open Access articles published under a Creative Commons License, all supplemental material carries the same license as the article it is associated with.
For non-Open Access articles published, all supplemental material carries a non-exclusive license, and permission requests for re-use of supplemental material or any part of supplemental material shall be sent directly to the copyright owner as specified in the copyright notice associated with the article.