
Abstract
People prefer to form relationships with people like themselves—a tendency that extends even to facial appearance, resulting in groups whose members look alike. Here, we investigated the mechanisms underlying homophilic resemblance using facial photos of fraternity/sorority members from two time points: before joining the group and after belonging to the group for three years. Analyses of both subjective trait impressions and objective face-shape measurements revealed that not only did group members look alike, they resembled one another even before joining the group. Moreover, photos of potential fraternity recruits revealed that facial appearance predicted both the group that individuals sought to join and the group’s likelihood of accepting them. Individuals, therefore, seek to join groups consisting of people who look like them, and the groups preferentially accept new members who resemble those already in the group. This bidirectional preference for homophily likely perpetuates intragroup homogeneity, suggesting potential implications beyond appearance.
People have a strong and well-documented tendency to affiliate with others like them. This phenomenon, termed homophily, illustrates that people form relationships and associate with other people that they perceive to hold beliefs, interests, and values similar to their own (Byrne, 1971; see McPherson et al., 2001, for review). People show homophily across a broad array of characteristics, including demographics (e.g., gender, ethnicity, education; Shrum et al., 1988; Skopek et al., 2010) and psychological characteristics (e.g., political beliefs, preferences, values; Knoke, 1990; Mark, 1998; Richardson, 1940). Homophily, furthermore, exists across different types of social relationships, including individual relationships (romantic relationships, friendships, social ties at work; for example, Ibarra, 1992; Kalmijn, 1998; Verbrugge, 1977) and social groups and networks (e.g., Kovanen et al., 2013; Partridge, 1933; Rivera, 2012), demonstrating its pervasiveness.
Importantly, perceived self-similarity leads to affiliation and liking (Graves & Powell, 1995; Huston & Levinger, 1978; Lee & Bond, 1998). Perceptions of similarity can come from appearance, as people use appearance—particularly facial appearance—to infer socially relevant information about others, including their personality traits and important preferences (e.g., political affiliation; Penton-Voak et al., 2006; Tskhay & Rule, 2013) in addition to attributes such as race, gender, and age (e.g., Ito & Urland, 2003). Indeed, people appear to seek others who physically resemble them (Mackinnon et al., 2011), and recent work shows that ingroup members’ faces resemble one another in established social groups. Specifically, members of friend groups, sports teams, and university fraternities convey similar trait impressions and have similar facial morphology as their fellow group members (Hehman et al., 2018). The process by which members of such elective groups come to resemble one another remains unclear, however (cf. heritable or otherwise predetermined groups). Delineating this process could reveal how groups develop and maintain their boundaries over time. Accordingly, we aimed to identify these mechanisms in the present research.
Several possibilities compete to explain why ingroup members might physically resemble each other. First, individuals may join groups whose members already resemble them—that is, selection may explain facial appearance homophily. This could occur through two processes: (a) new members self-selecting a particular group and (b) existing members gatekeeping who joins. In self-selection, individuals seek and form social groups with people who resemble them, akin to assortative mating (e.g., Silventoinen et al., 2003). In gatekeeping, the existing members decide who can join and might admit only people who resemble those already in the group (e.g., Erickson, 1975, 1976; Hunt & Pendley, 1972). Both the individual (via which groups they attempt to join) and the group (via which individuals they admit) can, therefore, drive selection.
Previous homophily research has demonstrated that people seek, and groups admit, similar others in terms of personality traits, interests, and even genotypes (Christakis & Fowler, 2014; McPherson et al., 2001). Both processes could, therefore, contribute to ingroup facial resemblance and each would result in members resembling one another before they join their groups. Thus, we should be able to predict future group membership from appearance prior to group selection. That is, individuals seeking to join a group should physically resemble the group, and groups should select group members that physically resemble the group as a whole.
The second possibility is that individuals come to resemble their ingroup members after group formation, suggesting a Dorian Gray effect in which appearance changes over time to reflect one’s states and behaviors (see Zebrowitz et al., 1998). For instance, some research has found that spouses come to resemble one another over time through shared environment and habits and that individuals coupled longer resemble each other more (Little et al., 2006; Zajonc et al., 1987 see also Zebrowitz et al., 1998). But other recent research casts doubt on the Dorian Gray effect among spouses, finding facial resemblance at the start of marriage instead of convergence over time (Tea-makorn & Kosinski, 2020). Spouses moreover tend to share more aspects of their lives and remain together longer than social group members do. It is, therefore, unclear whether Dorian Gray-like effects could apply to social groups.
We hypothesized that subjective impressions and objective facial measurements would show that social group members share facial resemblance (as in previous work; Hehman et al., 2018), testing whether this might vary before versus after group formation. Facial resemblance among group members before joining the group would support selection as the mechanism underlying ingroup resemblance. Resemblance only after group formation would alternatively implicate the Dorian Gray effect. In Study 1, we began by measuring ingroup resemblance among preexisting groups to replicate previous work. We then investigated resemblance among the same individuals prior to group formation, thereby testing selection. Next, we collected photos of individuals during a group application process in Study 2, testing the role of appearance in attempts to join a group and in acceptance into a group, allowing us to separately examine the role of the group and the individual in the selection process. Finally, in Study 3, we investigated whether the same aspects of appearance predicted group membership among future and existing group members. We preregistered these research questions, hypotheses, methods, and planned analyses on the Open Science Framework (Study 1: https://osf.io/735fe, Study 2: https://osf.io/v4m27, Study 3: https://osf.io/svap2). 1
Study 1
We tested the possibility of selection explaining ingroup resemblance in Study 1. But we first sought to replicate previous work that found facial resemblance among ingroup members after group formation had occurred (i.e., Hehman et al., 2018) with a larger sample and in a different context. We then extended this research by comparing intragroup facial resemblance in male versus female groups using university fraternities and sororities, respectively. Most important, by using photographs from before the start of their undergraduate studies (incoming freshman portraits), we could test whether the same individuals resembled their ingroup members even before joining the groups. Finding that targets resemble their future ingroup members would provide evidence for selection into self-resembling groups. Alternatively, resemblance among the individuals’ senior portraits but not freshman portraits would suggest that the individuals adopted the appearance of their group over time. We measured facial appearance in two ways: with morphological measurements and with subjective trait ratings (which correspond to similar morphology across perceivers; Hensel et al., 2020).
Method
Exact wording for all measures and data for all studies are available on the Open Science Framework (https://osf.io/hnxgs/).
Stimuli
We collected two sets of facial photographs of 487 individuals (227 female, 260 male; all White) belonging to 26 university fraternities and sororities (17 fraternities, 6 sororities, 3 co-ed societies) photographed between 2004 and 2007. 2 We obtained the first set of photos from senior yearbooks from a northeastern U.S. university, collecting the photos of all White individuals 3 who faced the camera in their photos, did not have glasses or facial hair, belonged to a fraternity or sorority (as listed in the yearbooks), and also had photos available in their freshman yearbooks. Because these were senior-year portraits, targets had belonged to their fraternity or sorority for 2–3 years at the time of photography. For the second set of photos, we collected facial photographs of the same 487 targets from their freshman yearbooks, which consisted of self-submitted portraits from incoming freshmen—targets, therefore, did not yet belong to any university fraternity or sorority at the time of photography.
We scanned the photos from the yearbook pages and cropped them around the top of the head, bottom of the chin, and around the ears. All photos were grayscale and we standardized their size. Consistent with previous work (Hehman et al., 2018), we additionally matched the photos’ luminance, contrast, and spatial frequency using the SHINE toolbox in MATLAB (Willenbockel et al., 2010) so that these lower level visual properties would not confound the data.
Procedure
Trait ratings
Participants rated the faces from one of the two photo sets on one of four traits central to impression formation: attractiveness, competence, dominance, or trustworthiness (Fiske et al., 2007; Oosterhof & Todorov, 2008; Perrett, 2010; Sutherland et al., 2013). Participants viewed targets individually in random order, rating them from 1 (not at all) to 7 (very). They rated either the female or male targets, viewing a random subset of half of the targets within one gender to avoid rater fatigue. Estimates based on simulations of alpha indicated that 30 participants would provide acceptable reliability in ratings of all traits (DeBruine & Jones, 2018). Accordingly, we recruited 30 perceivers from Amazon’s Mechanical Turk to rate each photo on each trait, resulting in a total of 960 participants. After rating the targets, participants provided demographic information and reported whether they experienced any trouble viewing the images or had provided any ratings without waiting for stimuli to appear on-screen.
Morphological measurements
We imported the target photos into the software FaceGen Modeller (Singular Inversions, 2016). Using the PhotoFit tool, we created a three-dimensional digital model of each face. These models yield 130 orthogonal measurement parameters available to form linear combinations quantifying face shape and texture, extracted using the software development kit. We focused our investigation on the face shape linear combination parameters because artifacts from the photos could influence the texture parameters (e.g., ink dots visible in the printed photos).
Analytic Approach
Following Hehman et al.’s (2018) method, we used discriminant function analysis (also known as linear discriminant analysis) to test the resemblance among ingroup members. Discriminant function analysis predicts a categorical variable (in this case, group membership) by creating linear combinations of predictors (here, either trait ratings or morphological measurements) that best discriminate which observations belong to which category (Fisher, 1936). These linear combinations serve as the discriminant functions to classify the targets’ group membership.
Cross-validation
We used cross-validation to test whether these discriminant functions usefully classified the targets. Namely, the discriminant functions were developed on a portion of the data (i.e., the training set) and then tested on a separate portion (i.e., the test set). Should the discriminant functions derived from the training set successfully classify targets in the test set, it would suggest that the solution generalizes beyond the sample. This approach aims to ensure that any solution does not result from overfitting in this data-driven technique. In the present research, we used two types of cross-validation: hold-out (which randomly splits the data in half to form training and test sets) and leave-one-out (or “jacknife,” which iteratively uses data for all but one stimulus as a training set and the excluded stimulus as the test case), each of which has its own advantages (see Online Supplemental Material [OSM] for greater detail).
Testing classification accuracy
To determine whether these classification models successfully identified which targets belonged to which social group, we compared classification error rates to chance. Following previous research (Hehman et al., 2018), we tested accuracy in two ways: Press’s Q statistic (Q) and the more conservative maximum chance criterion (MCC). Press’s Q follows a chi-square distribution with one degree of freedom, allowing estimates of critical- and p-values. Here, we adopted α = .01 as the significance threshold for Q (critical value: χ2 = 6.63) to reject the null hypothesis that the classification matrix represents chance. For the MCC, in contrast, significance is determined by exceeding a critical value (see OSM for further details on both tests). Both tests are specific to the hold-out approach; with leave-one-out, only descriptive comparisons apply.
In sum, we performed two types of cross-validation with three different tests of the classification accuracy of the discriminant functions. Furthermore, we performed these procedures separately for the trait ratings and morphological measurements. Therefore, each analysis presents six different tests of the hypotheses. Because these different cross-validation approaches, tests, and target information (trait ratings, morphological measurements) have different advantages and disadvantages, consistency across all of them would signal the strongest support for the hypothesis (i.e., of resemblance among group members). Throughout, we first examine overall classification accuracy and then follow with targeted analyses comparing classification accuracy for male and female targets.
Results
Senior photos (conceptual replication)
We first removed the data of 6 participants who did not provide complete data and 15 participants who reported trouble viewing the images or having provided ratings before stimuli loaded, resulting in 459 participants (273 female, 184 male, 2 other; Mage = 39.00 years, SD = 12.69; 336 White/Caucasian, 37 Black/African American, 26 Hispanic/Latinx, 21 mixed-race, 14 East Asian, 10 South Asian, 6 Native American/First Nations, 6 Southeast Asian, 3 unreported ethnicity). Perceivers demonstrated high interrater reliability (average ICCs range: .88–.95), allowing us to average the trait ratings for each target across perceivers. Targets, therefore, functioned as the unit of analysis. We also extracted the 62 linear combination parameters relating to face shape and excluded those relating to texture from FaceGen’s output for each target, as noted.
Classification accuracy
We first tested our hypotheses by examining overall classification accuracy. Four discriminant functions emerged from the analysis using trait ratings, with the first explaining 62.1% of the variance (see Table 1 for composition and Figure S1 in the OSM for results for each group).
Composition of the Four Functions Created by the Discriminant Function Analysis of Trait Ratings of Senior Photos in Study 1.
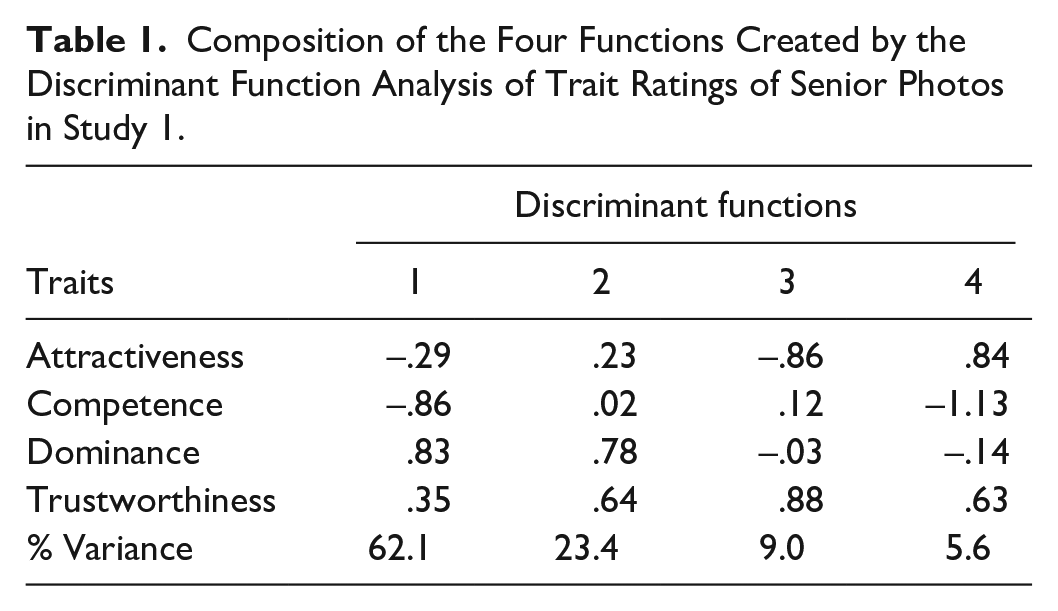
Because there were 26 different groups (group size range: 3–46), chance classification was 3.8%. The leave-one-out approach accurately classified 12.7% of targets, however. Evidence from hold-out cross-validation affirmed these results: 12.8% of the targets in the test set were accurately classified. Both tests of whether 12.8% was greater than 3.8% supported this conclusion (Press’s Q = 52.90, p < .001; 12.8 > MCC critical 11.8). Thus, all tests indicated that the individuals belonging to each group could be classified more accurately than chance based on perceivers’ ratings of the targets’ appearance; in other words, the individuals in each group looked similar to one another.
We next turned to classification using the morphological measurements (i.e., the shape components in the digital face models). 4 Analyses with these data revealed 24 discriminant functions based on the 62 shape parameters. Using the leave-one-out approach, 18.5% of targets were accurately classified. Again, results from the hold-out approach were consistent: 18.6% of these targets were accurately classified, which the tests indicated exceeded chance (i.e., 3.8%; Press’s Q = 143.60, p < .001; 18.6 > MCC critical 11.8). 5
Classification by target gender
To compare classification accuracy by target gender, we performed the analyses separately for female and male targets. For female targets (k = 9, group size range: 3–46), chance was 11.11%. Classification accuracy based on the trait ratings using the leave-one-out approach found four discriminant functions accurately classifying 19.8% of women. Analysis of the trait ratings using the hold-out approach showed that 20.5% of the women were accurately classified but the tests did not agree about whether the solution generalized from the training set to the test set: The Q test indicated that classification exceeded chance (Press’s Q = 10.26, p = .002) but the MCC did not (20.5 < MCC critical 25.0).
Classification based on the morphological measurements showed greater success, however. Eight discriminant functions were identified. Using the leave-one-out approach, 30.4% of the women were accurately classified. Likewise, 30.4% of women were accurately classified using the hold-out approach (Press’s Q = 41.60, p < .001; 30.4 > MCC critical 25.2).
For male targets (k = 20, group size range: 3–34), chance was 5%. Analysis of the trait ratings also identified four discriminant functions, with 12.3% of the men accurately classified using the leave-one-out approach and 9.2% accurately classified using the hold-out approach, though neither test indicated that this exceeded chance at the conservative α = .01 threshold (Press’s Q = 4.80, p = .029; 9.2 < MCC critical 16.5).
Classification based on the morphological measurements again showed greater success, similar to the results for female targets. Fifteen discriminant functions were identified, with 12.4% of men correctly classified using the leave-one-out approach and 11.5% of men correctly classified using the hold-out approach. Whereas the Q test indicated that classification exceeded chance (Press’s Q = 11.56, p < .001), the MCC did not (11.5 < MCC critical 16.4).
We, therefore, observed mixed evidence for accurate classification when dividing the groups by gender, which necessarily reduced sample sizes. The classification was more successful for female versus male targets, and the more conservative MCC test never indicated that classification exceeded the chance for men. Society’s greater emphasis on appearance among women might have contributed to this (e.g., Silverstein et al., 1986; Strahan et al., 2006); see the General Discussion.
Freshman photos
We first excluded nine participants who did not provide complete data and eight participants who reported experiencing trouble viewing the stimuli or providing ratings without waiting for stimuli to load, resulting in 463 participants (268 female, 195 male; Mage = 38.91 years, SD = 12.35; 332 White/Caucasian, 53 Black/African American, 25 Hispanic/Latinx, 19 East Asian, 18 mixed-race, 6 Southeast Asian, 5 South Asian, 1 Native American/First Nations, 4 unreported ethnicity). We then extracted the 62 face shape parameters from FaceGen’s measurement output and averaged the trait ratings across participants for each target (average ICCs range: .90–.94).
Classification Accuracy
As with the senior photos, we first tested our hypotheses by examining overall classification accuracy based on the consensus trait ratings. Four discriminant functions again emerged from the analysis, though their composition slightly varied from the senior photos (see Table 2 and Figure S2 in the OSM)—note that the particular composition of the discriminant functions is not our focus, as the aspects of appearance predicting group membership vary by group and likely also by context. Correlations between targets’ perceived traits in the freshman and senior photos showed a medium-to-large relationship, .34 ≤ rs ≤ .53.
Composition of the Four Functions Created by the Discriminant Function Analysis of Trait Ratings of Freshman Photos in Study 1.
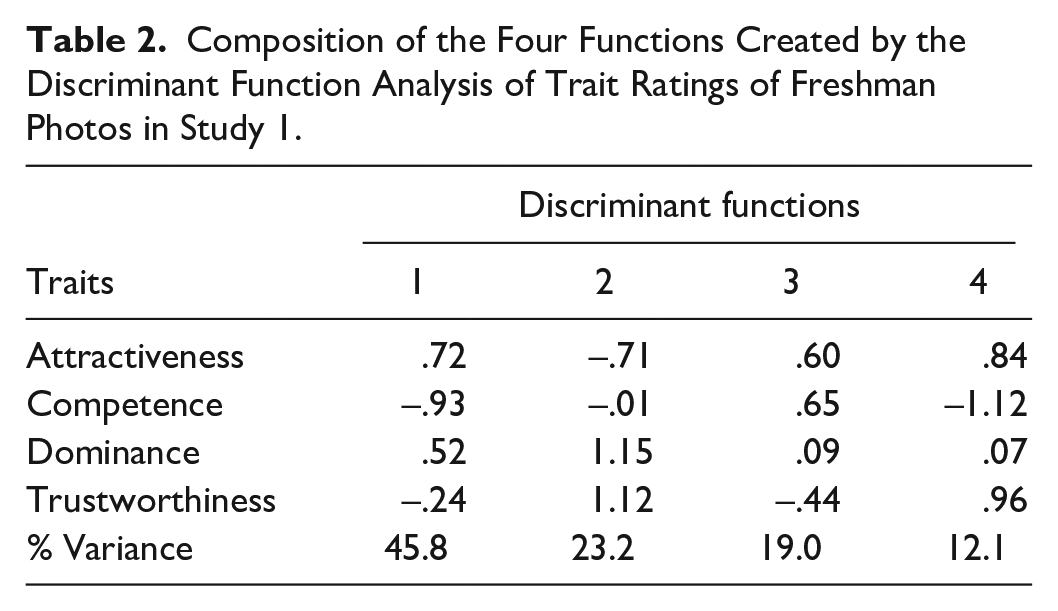
Chance classification was again 3.8% (k = 26). Evidence from leave-one-out cross-validation of the trait ratings showed that 13.8% of targets were accurately classified into their future group. The hold-out approach similarly showed that 15.4% of targets were classified more accurately than chance using both tests (Press’s Q = 87.00, p < .001; 15.4 > MCC critical 11.9). The morphological measurements likewise classified 13.7% of targets into their future groups using the leave-one-out approach and 12.8% of targets using the hold-out approach based on 24 discriminant functions; both tests showed that this exceeded chance (i.e., 3.8%; Press’s Q = 52.70, p < .001; 12.8 > MCC critical 11.8). All trait-rating and morphology-based models, therefore, classified the individuals into their future groups more accurately than chance, echoing our findings for the senior year photos.
Classification by target gender
We again separately examined performance within male and female target groups. For the women, 20.7% of targets were accurately classified based on the trait ratings when using the leave-one-out approach and 26.3% when using the hold-out approach from four discriminant functions, with both tests for the latter indicating that this value exceeded chance (i.e., 11.11%; k = 9, group size range: 3–46; Press’s Q = 26.30, p < .001; 26.3 > MCC critical 25.4). Classification accuracy based on morphology was 21.6% using leave-one-out cross-validation and 23.7% using the hold-out approach from eight discriminant functions, exceeding chance in the Q test (Press’s Q = 18.10, p < .001) but not the MCC (23.7 < MCC critical 25.4).
For the men, trait ratings led to 11.5% accurate classifications using leave-one-out cross-validation and 11.4% using the hold-out approach from four discriminant functions. The latter exceeded chance (i.e., 5%; k = 20, group size range: 3–34) in the Q test (Q = 11.00, p < .001) but again not in the more conservative MCC (11.4 < MCC critical 16.6). Parallel results emerged based on morphology: Leave-one-out cross-validation accurately classified 9.3% of the men and the hold-out approach accurately classified 11.6% of the men from 16 discriminant functions, which exceeded chance in the Q test (Q = 11.90, p < .001) but not the MCC (11.6 < MCC critical 16.4). Similar to the senior photos, then, classification was again more successful for female than male targets, and the more conservative MCC test never indicated that classification exceeded chance among the men.
Discussion
Using a large and novel stimulus set, we replicate Hehman et al.’s (2018) previous findings that the members of social groups share facial resemblance according to both subjective trait impressions and objective measurements of face shape. The models for the senior year photos successfully classified which individuals belong to which group more accurately than chance, indicating that people within the groups look similar to one another. As in the previous work, however, targets already belonged to their groups at the time of those photos, thereby not clarifying whether members resemble their groups before joining.
The freshman year photos addressed this question. Using these stimuli, we provide the first evidence that group members physically resemble one another before joining their groups, lending support to the idea that selection drives homophily in group members’ facial appearance. We found this for both of our measures of facial resemblance (subjective impressions of social traits and objective measurements of facial morphology), indicating the robustness of this ingroup resemblance. One exception was when we split our analyses by target gender, which showed inconsistent evidence for above-chance categorizations of men. Overall, however, classification accuracy was generally comparable for the freshman and senior photos.
Study 2
The results of Study 1 support ingroup similarity in appearance via selection rather than via increased resemblance over time. Yet the nature of the data in Study 1 cannot distinguish between whether individuals only attempt to join self-resembling groups (self-selection), whether existing social groups allow only similar new members to join (gatekeeping), or both. We tested this in Study 2 by evaluating whether individuals’ appearance predicts their acceptance into a fraternity group, as well as which group they attempt to join. We did so by collecting photos of individuals after they had chosen to try to join a group but before the groups had decided whom to accept. Studying this timepoint was critical to our goal of partitioning the mechanisms because it eliminates self-selection as a possible explanation of ingroup similarity among those accepted: All individuals had selected the group; thus, differences in acceptance could only be due to gatekeeping.
We used trait ratings of men’s faces as predictors of their acceptance into a fraternity. If trait ratings significantly predict acceptance, this would indicate that existing group members play a gatekeeping role, only allowing others similar in appearance to join. In contrast, if trait ratings do not predict acceptance but do predict which group individuals try to join, it may be that people self-select into self-resembling groups but that other factors affect their acceptance.
Method
Stimuli
Photos of potential recruits to two fraternities from a U.S. mid-Atlantic university were collected in 2010–2011. All targets were male undergraduates who agreed to share their photos (N = 315; 94% White). The fraternities collected these photos during their recruitment events to aid the process of evaluating which new members to accept. These same photos of each recruit were projected on a screen while the group discussed and voted on acceptance. For our purposes, we standardized all photos’ height but otherwise left them as-is to maintain a high level of external validity. The sample afforded over 80% power in a logistic regression with α = .05 and anticipating a medium effect size.
Procedure
We randomly assigned 240 participants from MTurk to rate either targets’ attractiveness, competence, dominance, or trustworthiness from 1 (not at all) to 7 (very) in response to the question “How attractive [competent, dominant, trustworthy] is this person?” as in Study 1. Participants rated a random subset of 158 targets (roughly half of the total target sample) to manage fatigue. After rating the photos, participants provided demographic information, reported any trouble viewing the photos, and indicated whether they provided any ratings without waiting for stimuli to load. This resulted in an average of 30 participants rating each target on each trait, ensuring acceptable interrater reliability (average ICCs range: .68–.88). Unlike in Study 1, we did not additionally measure these faces in FaceGen due to their variable (i.e., unstandardized and noisy) nature.
Results
We began by removing the data of 27 participants who reported trouble viewing the images or providing ratings before stimuli had loaded (remaining n = 213; 92 female, 120 male, 1 other; Mage = 38.00 years, SD = 11.57; 159 White/Caucasian, 33 Black/African American, 12 Hispanic/Latinx, 4 East Asian, 2 South Asian, 1 mixed-race, 1 Native American/First Nations, 1 Southeast Asian). We then averaged the targets’ trait ratings across perceivers, entering these attractiveness, competence, dominance, and trustworthiness ratings as predictors of acceptance (coded as 0 or 1) in a target-level logistic regression. Logistic regression requires more statistical power than ordinary least squares because it uses maximum likelihood estimation. Moreover, person perception variables frequently correlate at least moderately (Jones et al., 2021). To maximize statistical power, we, therefore, employed a modern regularization-based model selection technique, LASSO (see OSM), to determine the model’s variables prior to testing the hypotheses.
Using LASSO suggested keeping only attractiveness in the model. 6 When regressing group acceptance on attractiveness in logistic models, attractiveness significantly predicted acceptance into a fraternity, B = 0.98, SE = 0.27, z = 3.61, p < .001 (Figure 1). This was equally the case in each fraternity, as fraternity group (i.e., which of the two fraternities the targets attempted to join) did not moderate the association, B = 0.13, SE = 0.31, z = 0.43, p = .67. More attractive individuals were, therefore, more likely to be accepted into fraternities.
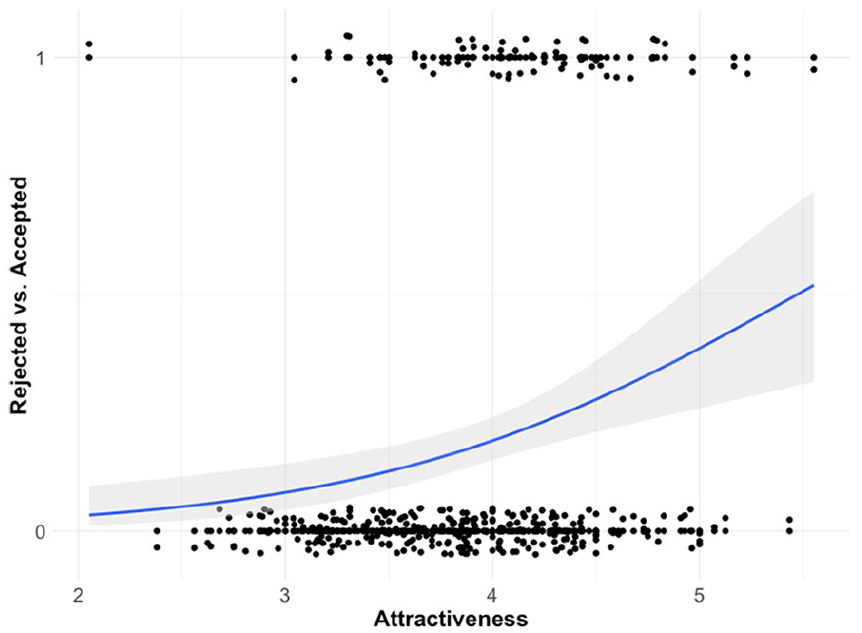
Attractiveness ratings predicting potential fraternity recruits’ acceptance into a fraternity.
We also compared whether the potential recruits from the two fraternities differed along any of the trait ratings as an unplanned, exploratory test of self-selection by entering the attractiveness, competence, dominance, and trustworthiness ratings as predictors of fraternity recruit group (coded 0 or 1). This revealed competence as a significant predictor, B = 1.34, SE = 0.49, z = 2.74, p = .006, indicating that individuals applying to one fraternity appeared more competent than the individuals applying to the other fraternity. No other traits significantly predicted fraternity recruit group, all Bs ≤ .60, zs ≤ 1.47, ps ≥ .14.
Discussion
Here, we found that appearance predicted acceptance into a fraternity group, suggesting that existing group members play a gatekeeping role in maintaining homophily. Furthermore, the appearance of the potential recruits to the two fraternity groups also differed, implicating self-selection. It, therefore, appears that the facial resemblance observed among social ingroup members results from selection driven by both groups and individuals.
In the groups used in this study, competent appearance predicted the group into which individuals self-selected, and attractiveness predicted their acceptance into that group. We do not believe that these specific traits would necessarily generalize as criteria for acceptance into other types of groups or even into other fraternities (just as the composition of the discriminant functions in Study 1 are specific to those particular groups). The traits valued are likely specific to a particular context and set of social groups. Yet we do believe that the broader pattern of appearance predicting social group formation would generalize to other social groups, regardless of which specific trait might predict acceptance. Indeed, previous work demonstrated that a pattern of facial resemblance among social ingroup members appears across a variety of social groups (including fraternities, sports teams, and friend groups; Hehman et al., 2018). The current results suggest that the mechanisms driving this resemblance (i.e., self-selection and gatekeeping) could also generalize across groups.
Study 3
In Study 1, we found resemblance among group members both before and after group formation and, in Study 2, we found that facial appearance predicted both acceptance into a group and which group individuals attempted to join. In the final part of our investigation, we unified these two lines of inquiry and tested whether the same aspects of facial appearance would predict group membership among existing group members and future group members.
Method
Stimuli
Here we used a subset of the photos from Study 2, namely only those of recruits who were later accepted into one of the fraternities (N = 58). We also collected photos of the existing members of each fraternity at the time of recruitment (N = 143). All targets were male undergraduates (total N = 201; 98% White/Caucasian). This sample size afforded over 80% power in a logistic regression, anticipating similar effect sizes to those observed in Study 2. Because of differences between the photos of recruits (taken at recruitment events) and existing members (official photos of the members posted on the fraternities’ websites), we standardized them to minimize these differences. Specifically, we cropped all target photos around the limits of the head, grayscaled them, and standardized them in size. We then ran the images through the SHINE toolbox in MATLAB to standardize luminance, contrast, and spatial frequency (as in Study 1; Willenbockel et al., 2010).
Procedure
We randomly assigned 241 participants recruited from Prolific Academic to rate either targets’ attractiveness, competence, dominance, or trustworthiness, as in Studies 1 and 2. Participants rated a random subset of 100 targets to minimize rating fatigue. An average of 30 participants thus rated each target on each trait, resulting in good interrater reliability (average ICCs range: .84–.92). Participants then provided demographic information and reported whether they had trouble viewing any images or provided any of their ratings without waiting for images to load.
Results
We removed the data of 15 participants who reported problems viewing stimuli or providing ratings without waiting for the stimuli to load (remaining n = 226; 95 female, 129 male, 2 other; Mage = 24.69 years, SD = 6.62; 181 White/Caucasian, 25 Hispanic/Latinx, 4 South Asian, 4 mixed-race, 3 Middle Eastern, 2 East Asian, 1 Black/African/Caribbean, 1 Pacific Islander, 1 Southeast Asian, 4 other or unreported ethnicity). We averaged target trait ratings across perceivers, entering these attractiveness, competence, dominance, and trustworthiness ratings as predictors of the fraternity group (coded as 0 or 1), with targets’ member status (accepted, existing) as a moderator, in a target-level logistic regression.
In line with Study 2, we used LASSO as a model selection technique to maximize power. This method suggested keeping only competence in the model. Regressing fraternity group on competence in a logistic model revealed that competence significantly predicted the fraternity to which targets belonged, B = 2.96, SE = 0.49, z = 5.99, p < .001 (Figure 2). 7 Targets’ membership status moderated this relation, however, B = 1.16, SE = 0.49, t = 2.35, p = .02. Decomposing this interaction revealed competence as a significant positive predictor of group membership among the accepted recruits, B = 1.78, SE = 0.69, z = 2.60, p = .009, and among the existing members, B = 4.13, SE = 0.71, z = 5.83, p < .001, though the pattern was stronger among the latter. The same aspect of appearance (i.e., competence) thus predicted group membership among both future and existing group members, albeit more strongly for existing members, indicating that existing group members resembled their fraternity members to a greater degree than future members did.
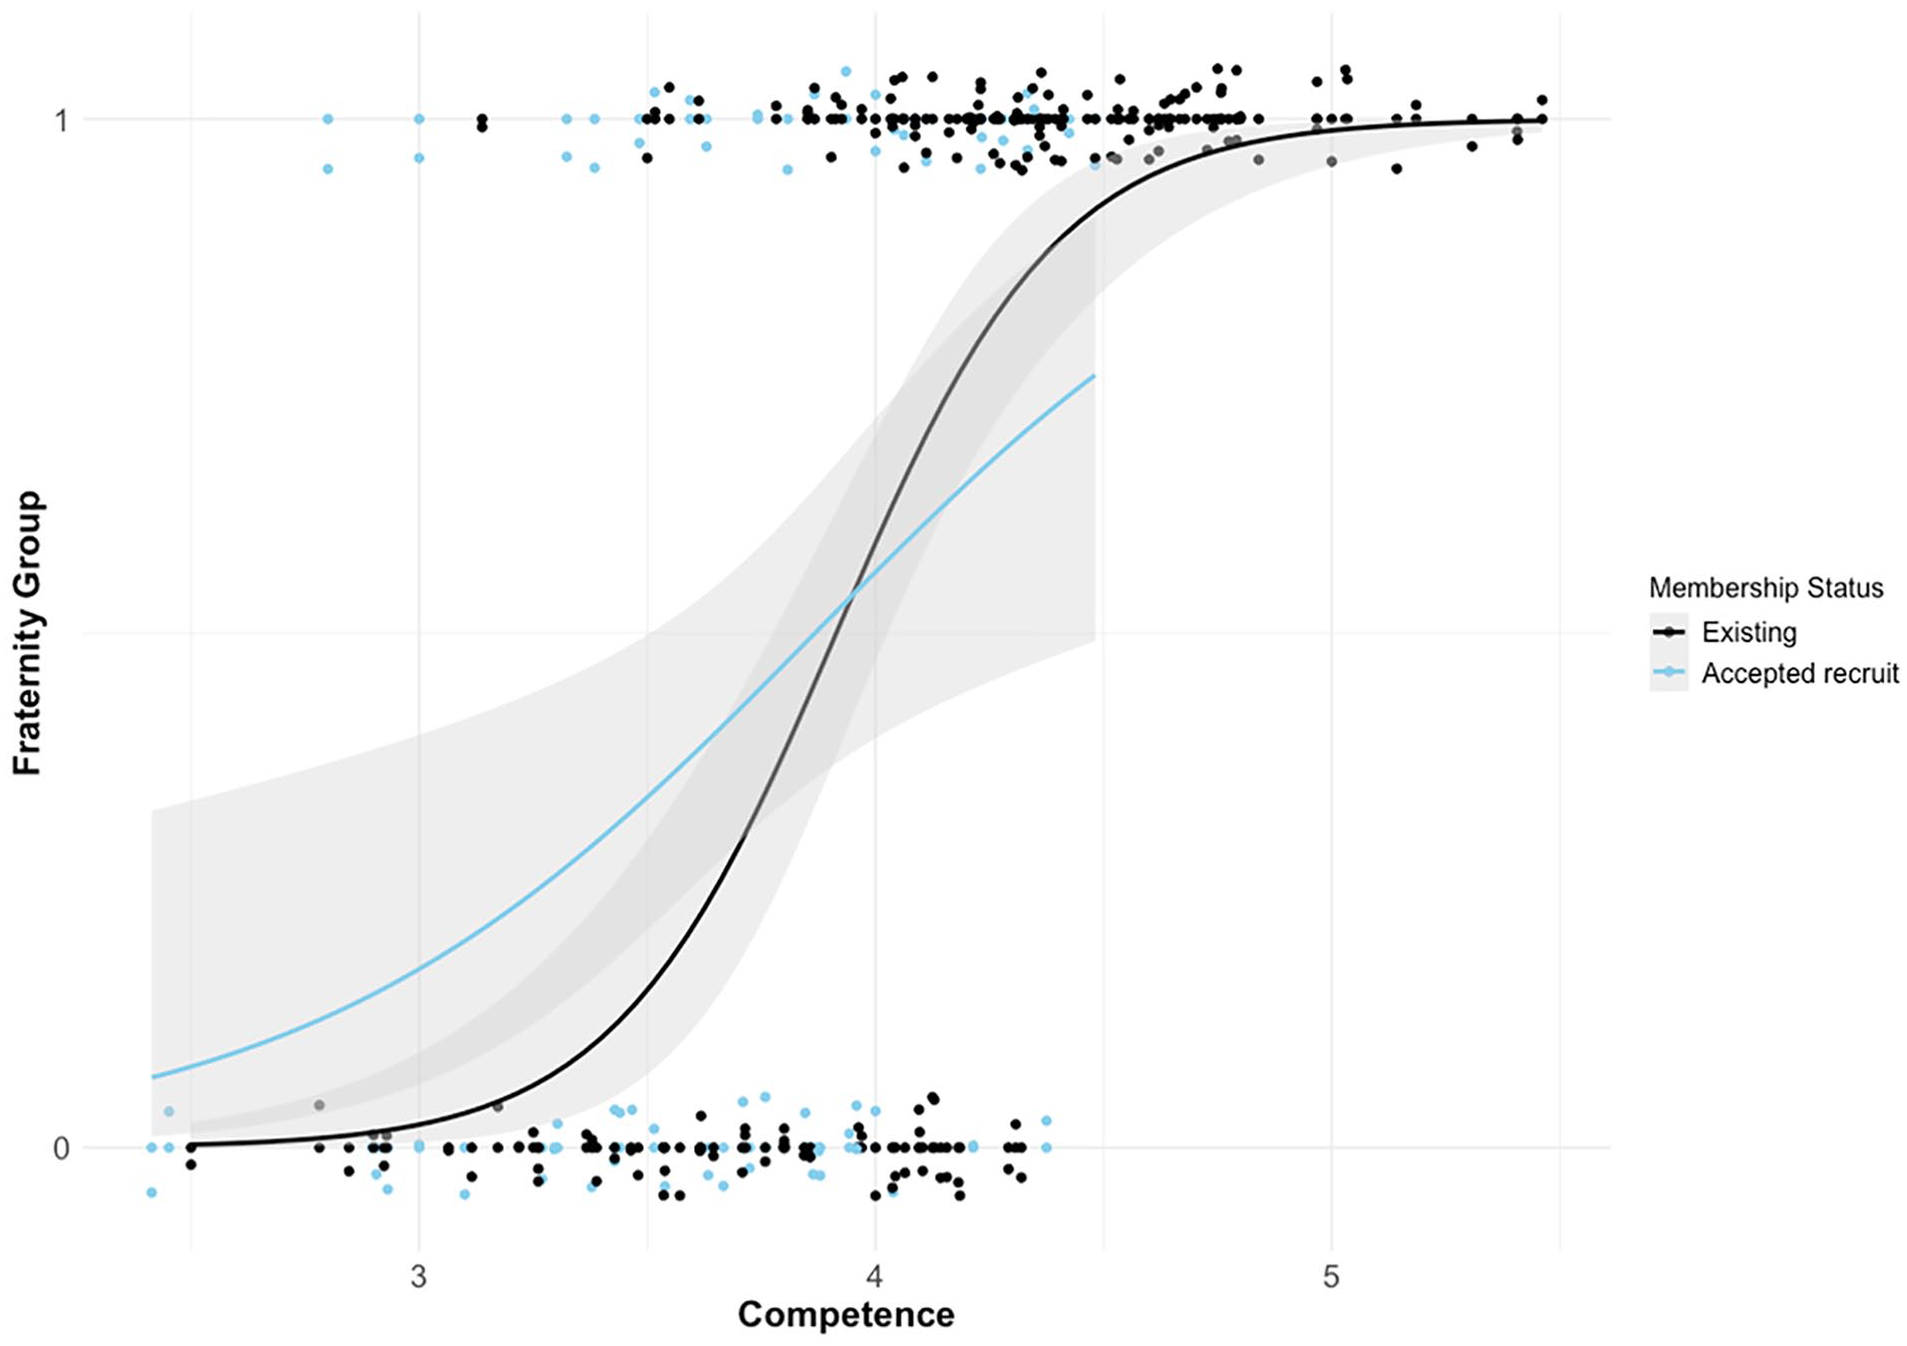
Competence ratings predicting which fraternity targets belong to.
Finally, as an unplanned exploratory step, we tested whether the accepted recruits and existing members differed from one another in terms of their attractiveness—the aspect of facial appearance that predicted recruits’ acceptance in Study 2. Attractiveness did not significantly predict targets’ membership status (i.e., whether they were current members or accepted recruits), B = 0.19, SE = 0.26, z = 0.72, p = .47, suggesting that the gatekeeping observed in Study 2 indeed maintained the groups’ homophily.
Discussion
Here, we found that the same aspects of facial appearance predicted targets’ group membership regardless of whether targets already belonged to the group or would be accepted into the group in the future, further implicating self-selection in homophilic facial appearance. Specifically, members of one fraternity appeared more competent than members of the other fraternity. This pattern was stronger for existing fraternity members, however. This finding may be attributable to the much larger sample of photos of existing members compared with accepted recruits, or perhaps to the somewhat higher quality of the existing members’ photos.
These findings extend the results of Study 2, demonstrating that potential recruits to different social groups differ from one another in terms of their facial appearance and that these same differences apply to the existing group members. Thus, individuals do indeed self-select into self-resembling groups. These results also complement our finding in Study 1 that group members resemble one another even before joining the group. Importantly, we specifically show that future group members also resemble the existing members of the group, not just one another. Our exploratory analysis also lends further support to the idea that gatekeeping also plays a role in maintaining group homophily, as attractiveness distinguished rejected from accepted recruits in Study 2 but did not distinguish accepted recruits from existing members here. As noted in Study 2, the predictive value of these particular aspects of appearance (competence, attractiveness) are likely specific to these groups and to this particular context, but the predictive value of facial appearance and the patterns of self-selection and gatekeeping observed here should generalize to other social groups.
General Discussion
The present work helps to isolate the various mechanisms by which members of social groups might resemble one another (Hehman et al., 2018). Evidence demonstrates strong support for a selection-based account, as individuals resemble their ingroup members before joining their social groups. Consistent with previous findings that friends share genotypes (Christakis & Fowler, 2014), our results suggest that people’s bias to seek self-resembling others goes beyond personality and values, extending to appearance.
We, furthermore, found that facial appearance predicted both acceptance into a group and which group individuals attempted to join, clarifying the processes by which ingroup members come to resemble one another. Our findings indicate that individuals not only seek groups whose members resemble themselves, but that existing members of the group also admit new members who already resemble the group (indeed, we found that facial appearance similarly predicted group membership for hopeful recruits, future members, and existing members). That is, both individuals and groups contribute to the process of selection into self-resembling groups. Self-selection and gatekeeping, therefore, appear to both contribute to the facial resemblance observed among social group members, aligning with evidence that selection into relationships with similar others explains homophily in a variety of domains (e.g., attitudes, behavior, interests; Aral et al., 2009; Kandel, 1978; Lewis et al., 2012). Yet the present research extends this to broader group formation as well.
We tested these questions using the faces of fraternity and sorority members. This is, of course, a very specific type of social group—and one that may place a particular emphasis on appearance. But these groups also provide a unique opportunity to track the faces of individuals before, during, and after a formal process of group formation—impossible to do with most types of social groups. Hehman et al.’s (2018) previous work, which found facial resemblance across various kinds of social groups (fraternities, friend groups, and sports teams), nevertheless suggests that the current findings should generalize to other kinds of groups as well. Because members of very different kinds of social groups resemble their ingroup members, it seems tenable that similar selection processes explaining this resemblance should operate across various groups. This certainly remains a question worth testing with other kinds of social groups (e.g., tracking children’s friend groups across their years of schooling). Because these mechanisms echo findings in other areas of resemblance (e.g., beliefs, interests; see McPherson et al., 2001, for review), however, we currently believe that they apply beyond the groups we tested here. Furthermore, the particular aspects of appearance that predicted group membership, group selection, and admission to a group were not the focus of the current studies because we expect that they will vary by group and context. Rather, the broader conclusion that facial appearance predicts which group’s individuals join and whether those groups accept them should generalize to a variety of social groups.
These findings, therefore, have implications beyond university fraternities and sororities. Self-selection and gatekeeping processes suggest that ingroups may maintain very specific boundaries based on appearance, potentially leading to group polarization and exclusivity. This could influence hiring outcomes in employment contexts, because perceived fit in an organization could partly depend on superficial resemblance to the existing members of the group, rather than on individuals’ qualifications. Indeed, existing research points to the emphasis on cultural fit in hiring, which undoubtedly draws partly from appearance cues (e.g., Bjornsdottir & Rule, 2017; Rivera, 2012; Rule et al., 2016). Appearance-based self-selection and gatekeeping might therefore constitute one set of mechanisms whereby organizations fail to hire employees from diverse backgrounds, despite the documented benefits of diversity (e.g., Herring, 2009).
Several factors also limit these studies. First, classification accuracy in Study 1 was notably lower than what Hehman et al. (2018) observed in fraternities. Methodological and theoretical differences may be responsible. Methodologically, we used a larger number of targets with much greater variability in group size, which increases the statistical threshold required for exceeding chance. Theoretically, the large number of groups may have introduced more intergroup redundancy (e.g., group A and group B recruiting similar “types” of people), leading to greater difficulty differentiating group members who could have tenably belonged to more than one group. Future work using more balanced group sizes and more distinctive groups (e.g., specific interest groups) could help to clarify this.
We also found greater classification accuracy for female versus male targets in Study 1. This aligns with previous findings in the homophily literature, with greater heterogeneity in male than female groups (e.g., Shrum et al., 1988). Furthermore, though speculative, we wondered whether appearance might play a greater role in determining sorority group membership compared with fraternity group membership; simply because of the strict appearance-based expectations of women in society (and particularly in Greek-letter organizations; Basow et al., 2007). Other research indicates that appearance informs impressions of women more than for men (Xie et al., 2019). Having more male groups also limits our capacity to directly compare the categorization accuracy of the two genders. In Studies 2 and 3, we could only examine fraternities, leaving open the possibility that the relative contribution of self-selection or gatekeeping may differ by gender. Future work examining ingroup resemblance should, therefore, attend to possible gender differences.
Most important, using social groups in which the targets only belonged for a few years did not allow for a strong test of one mechanism previously shown to influence facial resemblance among married spouses: The Dorian Gray effect, whereby individuals come to resemble one another over time through shared habits and environment (Zajonc et al., 1987; similar to the idea of “influence” in sociological work on homophily; see Lewis et al., 2012). Romantic couples share more aspects of their lives than typical members of a social group and remain together longer, however. Social groups formed in the university context nonetheless often command substantial importance to their members during a particularly formative period of people’s lives. Members often live together with their fraternities or sororities (and may therefore share common eating and sleeping habits, much like romantic couples) and organize their social lives around the group, suggesting that these group memberships might have an outsized impact on appearance. Yet we observed no marked increase in the resemblance between targets’ freshman- and senior-year photos in Study 1, suggesting that the timescale of a few years in this critical period may not suffice to produce any Dorian Gray effect—if such effect plays a role in ingroup facial resemblance at all. Indeed, recent evidence that even spouses’ facial resemblance does not increase over time (Tea-makorn & Kosinksi, 2020) suggests that the Dorian Gray effect may not, in fact, meaningfully influence facial homophily. Regardless, our current conclusions regarding self-selection and gatekeeping are fully independent of any potential Dorian Gray effects.
Overall, the current work provides insight into intragroup resemblance, implicating the processes of self-selection and gatekeeping. Individuals resembled their group members before joining their groups (Study 1, Study 3), and their appearance predicted both their acceptance into the group and which group they attempted to join (Study 2). People, therefore, seem to gravitate toward similar others, not only in terms of personality and values (as other work has found; for example, McPherson et al., 2001) but also in terms of facial appearance.
Supplemental Material
sj-docx-1-psp-10.1177_01461672211025206 – Supplemental material for Parsing the Mechanisms Underlying Ingroup Facial Resemblance
Supplemental material, sj-docx-1-psp-10.1177_01461672211025206 for Parsing the Mechanisms Underlying Ingroup Facial Resemblance by R. Thora Bjornsdottir, Eric Hehman, Darren Agboh and Nicholas O. Rule in Personality and Social Psychology Bulletin
Supplemental Material
sj-docx-2-psp-10.1177_01461672211025206 – Supplemental material for Parsing the Mechanisms Underlying Ingroup Facial Resemblance
Supplemental material, sj-docx-2-psp-10.1177_01461672211025206 for Parsing the Mechanisms Underlying Ingroup Facial Resemblance by R. Thora Bjornsdottir, Eric Hehman, Darren Agboh and Nicholas O. Rule in Personality and Social Psychology Bulletin
Footnotes
Author Contributions
R.T.B., E.H., and N.O.R. designed Studies 1 and 3. E.H. and D.A. designed Study 2. R.T.B. and D.A. collected the data. R.T.B. and E.H. analyzed the data. All authors wrote the manuscript.
Declaration of Conflicting Interests
The author(s) declared no potential conflicts of interest with respect to the research, authorship, and/or publication of this article.
Funding
The author(s) disclosed receipt of the following financial support for the research, authorship, and/or publication of this article: This research was supported by a Social Sciences and Humanities Research Council grant to N.O.R.
Supplemental Material
Supplemental material is available online with this article.
Notes
References
Supplementary Material
Please find the following supplemental material available below.
For Open Access articles published under a Creative Commons License, all supplemental material carries the same license as the article it is associated with.
For non-Open Access articles published, all supplemental material carries a non-exclusive license, and permission requests for re-use of supplemental material or any part of supplemental material shall be sent directly to the copyright owner as specified in the copyright notice associated with the article.