
Abstract
Objective:
To evaluate whether the neutrophil-to-lymphocyte ratio (NLR), platelet-to-lymphocyte ratio (PLR), and lymphocyte-to-monocyte ratio (LMR) are associated with disease severity in pediatric patients with lymphatic malformations (LMs).
Methods:
We performed a retrospective review of patients with LM treated at a tertiary pediatric hospital from 2008 to 2022. Exclusion criteria included absence of a complete blood count (CBC; n = 80), age ≥18 years (n = 34), insufficient LM documentation (n = 9), and Congenital Lipomatous Overgrowth, Vascular Malformations, Epidermal Nevis, Spinal/Skeletal Anomalies/Scoliosis syndrome (n = 1). Demographics, LM characteristics, treatments, emergency department (ED) visits, and hospitalizations were correlated with biomarker ratios derived from CBCs obtained throughout each patient’s disease course. Statistical analyses included Wilcoxon rank-sum tests, Spearman correlations, and multivariable linear regression.
Results:
The cohort included 104 patients, of whom 48 (46.2%) were female. Median age at diagnosis was 1.1 years (range: birth-15.3), and median age at last follow-up was 9.3 years (range: 0.2-19.8). Patients with extremity LM demonstrated lower peak NLR (1.70 vs 3.40, P = .01), lower average NLR (1.11 vs 1.96, P = .02), lower peak PLR (124.21 vs 156.32, P = .04), and higher average LMR (5.29 vs 4.39, P = .046) compared with other locations. Those with LM involving multiple body segments had higher peak NLR (84.61 vs 3.09, P = .009), higher average NLR (5.53 vs 1.81, P = .009), and higher peak PLR (1537.04 vs 146.00, P = .03). Patients treated with sirolimus had higher peak LMR (11.15 vs 6.00, P = .001). Greater numbers of surgeries were independently associated with higher peak NLR, peak and average PLR, and lower average LMR. Higher average NLR was associated with increased ED visits, controlling for follow-up duration.
Conclusion:
Elevated inflammatory biomarkers (NLR, PLR, and LMR) correlate with greater LM disease severity, reflected by increased ED utilization, surgical interventions, and need for sirolimus therapy.
Introduction
Lymphatic malformations (LMs) are congenital vascular lesions that result from abnormalities of endothelial cells and occur in 1 in 2000 live births. 1 According to the International Society for the Study of Vascular Anomalies, these errors in vascular development result in 3 categories of LMs, macrocystic (>1 cm), microcystic (<1 cm), or mixed. 2 Macrocystic LMs manifest as large, fluid-filled cavities that commonly localize to the neck, while microcystic and mixed cystic LMs contain small cysts and diffuse, vessel-like lesions. 3 LMs occur in lymphatic-rich areas, with up to 75% localized to the head and neck. 4 Depending on the size and location of such cysts, symptoms can range from minimal swelling to impaired oral feeding, macroglossia, mandibular overgrowth, loss of vision, pain, disfigurement, and life-threatening airway obstruction.5,6
Management of LMs involves a multimodal approach involving surgical resection, sclerotherapy, pharmacological therapies, and laser therapy. While surgery and sclerotherapy were the mainstay treatment for LMs in the past, updated understanding of the genetics of LMs has provided another avenue for treatment. mTOR inhibitors such as rapamycin (sirolimus) and PI3K inhibitors such as alpelisib have been shown to improve outcomes in PIK3CA-driven LM overgrowth.7,8 Such advancements have led to multiple prospective clinical trials which demonstrated improved symptom relief and quality of life.9-12
Though understanding of the genetic etiology of LMs has improved, there remains potential for identifying factors to better predict severity of disease. Biomarkers have been demonstrated in other disease processes to influence disease screening, diagnosis, characterization, and monitoring. Additionally, they have been used as prognostic indicators for developing personalized therapeutic interventions, for predicting and treating adverse drug reactions, and for predicting disease outcomes. 13 However, there is scarce data investigating biomarkers in LM.
Neutrophil-to-lymphocyte ratio (NLR), platelet-to-lymphocyte ratio (PLR), and lymphocyte-to-monocyte ratio (LMR) have recently been reported as potential novel biomarkers of baseline inflammatory processes in cancer diagnoses. 14 In pediatric otolaryngology, NLR has been used as an inflammatory marker in chronic tonsillitis 15 and predicted prognosis in parotid cancer 16 and sinonasal rhabdomyosarcoma. 17 Furthermore, patients with acute tonsillitis with deep space neck infections (DSNI) had higher NLR than those with acute tonsillitis without DSNI. 18 Higher NLR and PLR also were associated with more severe LM after total cavopulmonary connection surgery. 19
The objective of this study was to explore the association of NLR, PLR, and LMR with disease severity in patients with LM. The hypothesis was that increased NLR, PLR, and LMR would be associated with more severe LM disease as measured by more procedures and hospitalizations.
Materials and Methods
A retrospective review was conducted of patients with an ICD-9 code of 74489 or ICD-10 code of Q899 for congenital face/neck anomalies or congenital malformations treated at a tertiary pediatric hospital from 2008 to 2022. Patients were included if they were diagnosed with an LM and if they were <18 years old. We included pediatric patients only, as it has been shown that inflammatory markers change with increasing age. 20 Patients were excluded if there was no complete blood count (CBC) count (80/124, 64.5%), there were no details regarding LMs (9/124, 7.3%), if they were ≥18 years old (34/124, 27.4%), or if they had Congenital Lipomatous Overgrowth, Vascular Malformations, Epidermal Nevis, Spinal/Skeletal Anomalies/Scoliosis (CLOVES) syndrome (1/124, 0.8%; Figure 1).
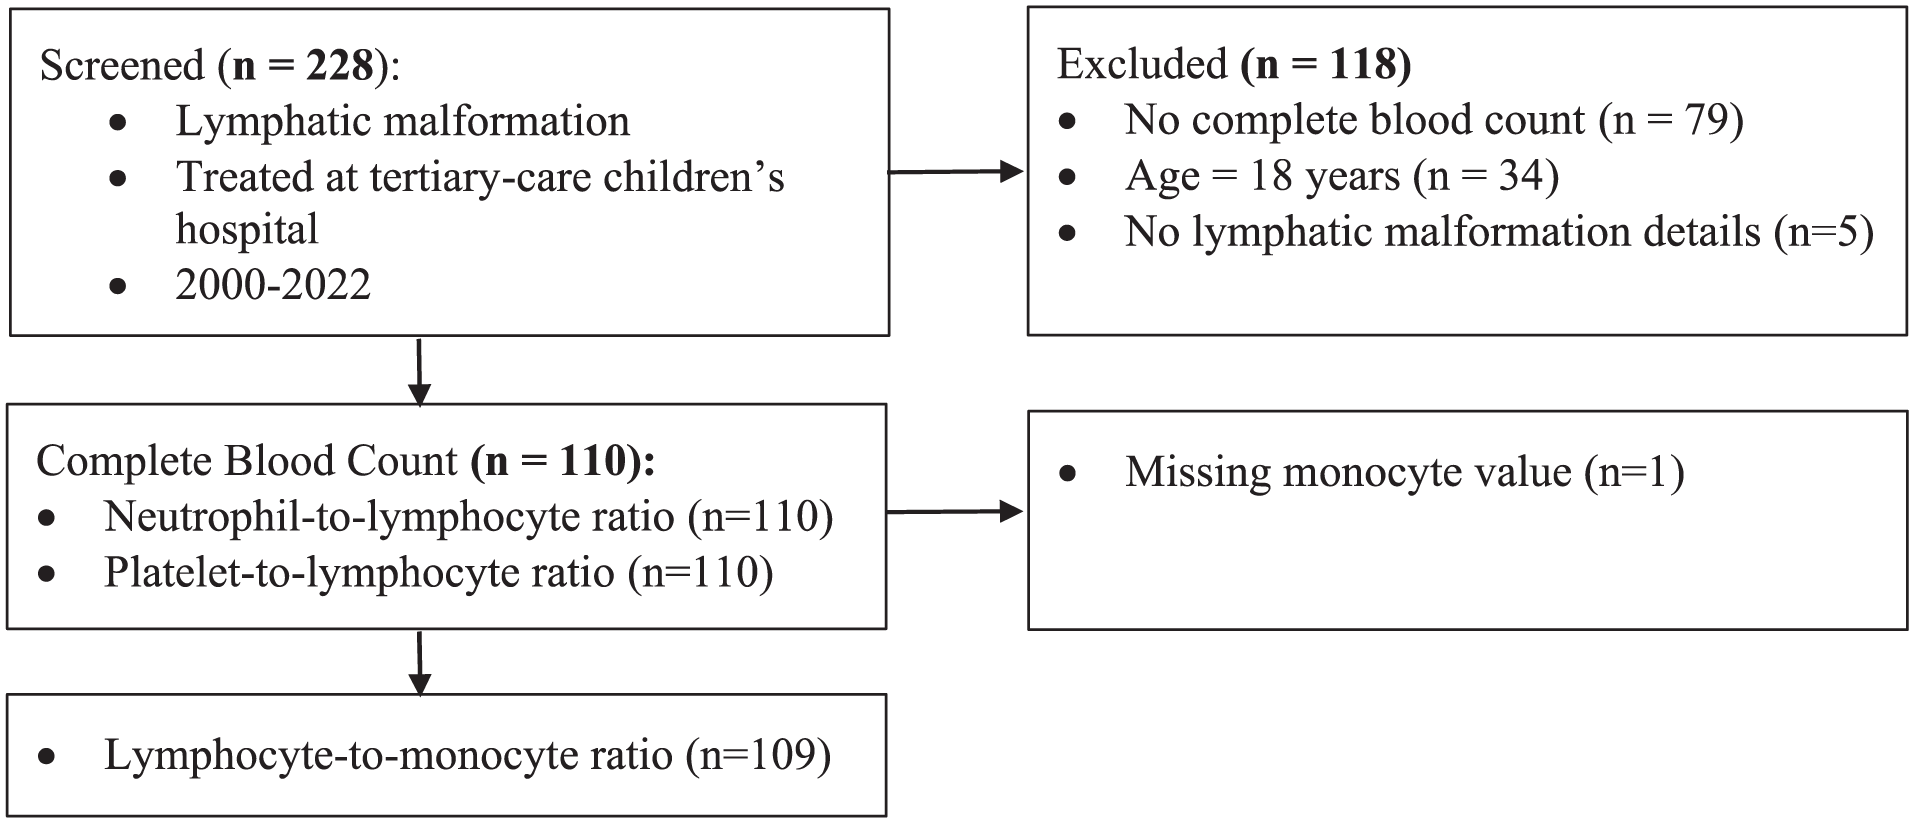
Flow chart of inclusion/exclusion criteria and outcome measures.
This study was approved by the Institutional Review Board (STUDY19100247). Patients who fulfilled the inclusion criteria had demographics, LM characteristics, treatment received, emergency department (ED) visits for LM, and hospitalizations correlated with biomarker ratios from CBCs across the patient’s disease course. Documentation of indication for CBC was inconsistent; therefore, labs drawn during acute infection or inflammation were not excluded. PLR, NLR, and LMR were calculated by dividing each inflammatory marker over the other each time the patient’s laboratory values were analyzed. Higher PLR, higher NLR, and lower LMR indicated higher inflammation status.
Statistical Analysis
Continuous characteristics were not normally distributed (Shapiro-Wilk, P < .05) and are summarized as median (range). Categorical characteristics are summarized as frequency (percentage). The highest (peak) and average PLR, NLR, and LMR observed were calculated for each patient. The impact of dichotomous patient characteristics and interventions on ratios were assessed using Wilcoxon rank-sum tests. Spearman rank correlation was used to assess the relationship between continuous characteristics and CBC ratios. Some CBC’s were drawn after initiation of sirolimus therapy, which is a known immunosuppressant. To account for this potential confounder, secondary analyses were conducted with sirolimus-treated patients excluded. Patients were also divided into age cohorts (newborn: ≤28 days old; infant: 28-364 days old; child: 1-17 years) based on age at first CBC. CBC ratios were compared between age groups by Kruskal-Wallis tests followed by pairwise Wilcoxon rank-sum comparisons. The reliability of these values in infants is unclear. Therefore, an additional secondary analysis was conducted with newborns and infants excluded. All analyses were performed using Stata/SE 16.1 (StataCorp, College Station, TX, USA). P < .05 was considered significant.
Results
Demographics and CBC
Demographic characteristics are summarized in Table 1. Females comprised 48/104 (46.2%) patients. Median age at diagnosis was 1.1 years (range birth-15.3 years), median age at first CBC was 1.9 years (range birth-17.9 years), and follow-up (age at last visit with any specialty at our institution) was 9.3 years (range 80 days-19.8 years). At first CBC, 26/104 (25.0%) were newborns and 10/104 (9.6%) were infants. The most common LM location was head and neck (49/104, 47.1%). LM type was identified for 73 patients; 35/73 (48.0%) were microcystic, 30/73 (41.1%) were macrocystic, and 8/73 (11.0%) were both. Largest dimension of the lesion was available for 80 patients; the median largest dimension was 4.1 cm (range 0.7-20.0 cm). Extensive lesions (>2 cm largest dimension and/or spanning multiple anatomic regions) were documented for 91/104 (87.5%) patients. Relevant interventions included sclerotherapy for 64/104 (61.5%) of patients, surgeries for 43/104 (41.4%), and sirolimus for 16/104 (15.4%). Approximately 1/3 (37/104, 35.6%) of patients presented to the ED for an LM-related complaint. NLR, PLR, and LMR values from CBC are summarized in Table 2.
Patient Characteristics.
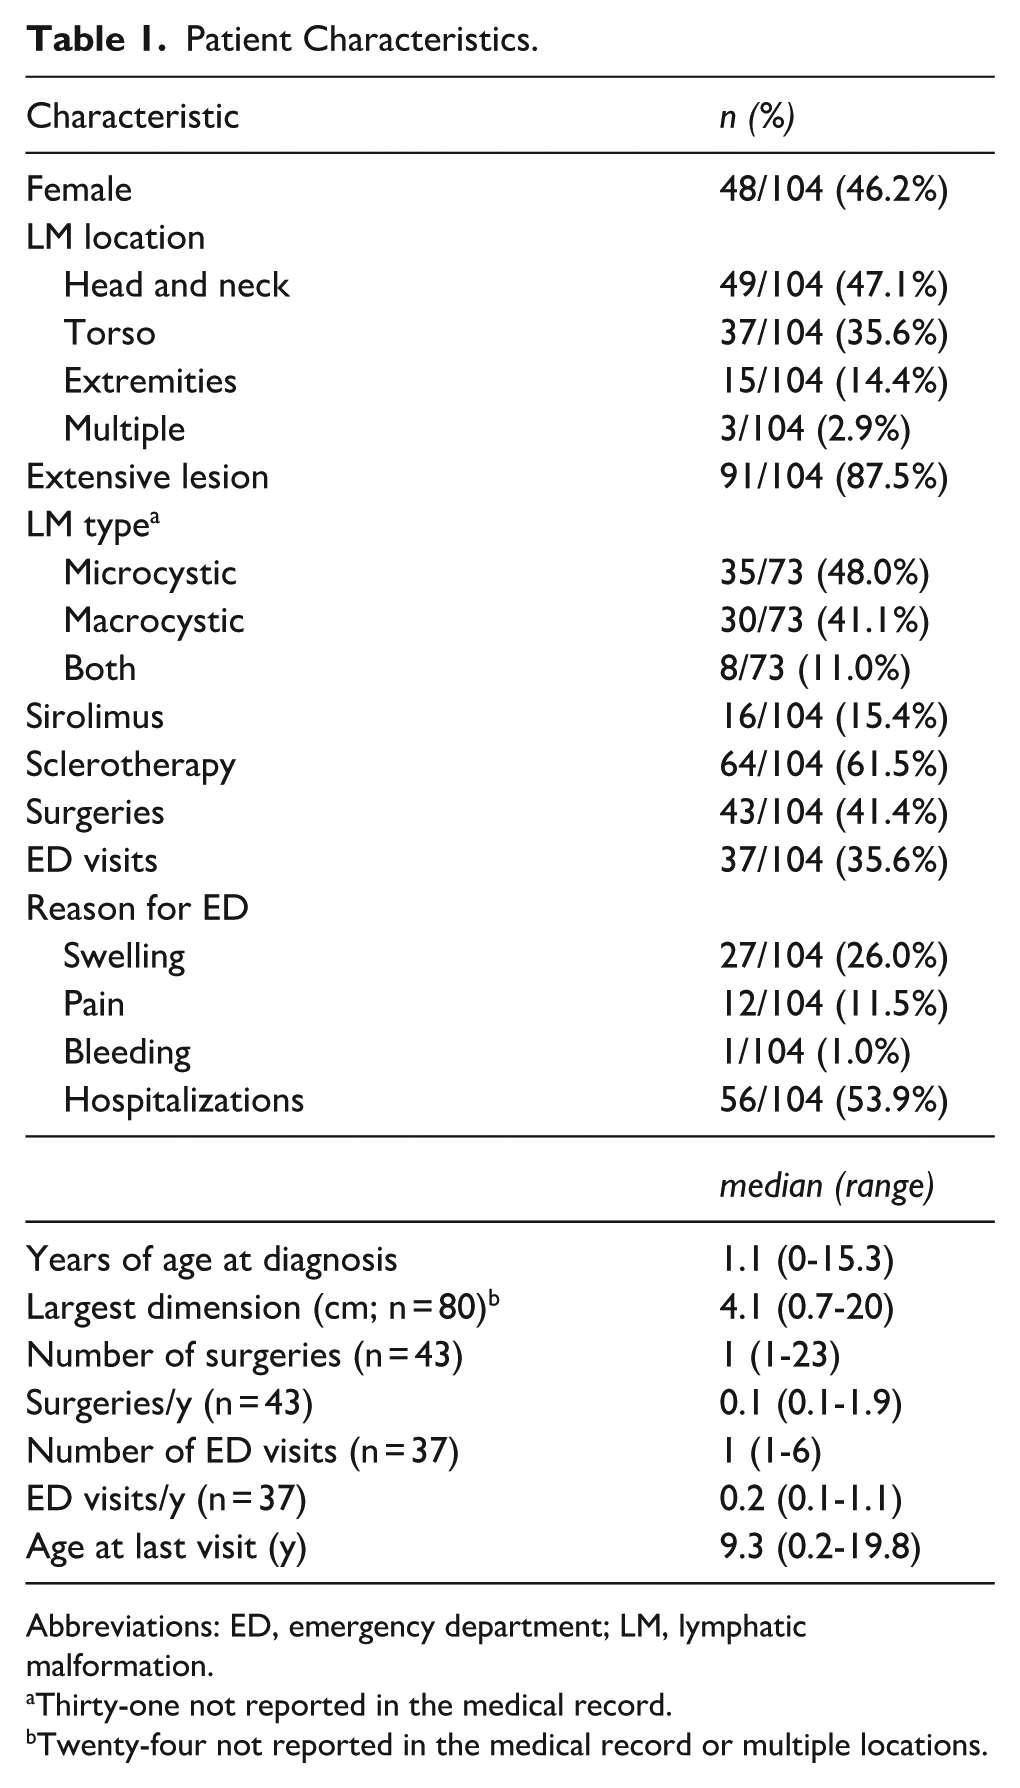
Abbreviations: ED, emergency department; LM, lymphatic malformation.
Thirty-one not reported in the medical record.
Twenty-four not reported in the medical record or multiple locations.
CBC Values.
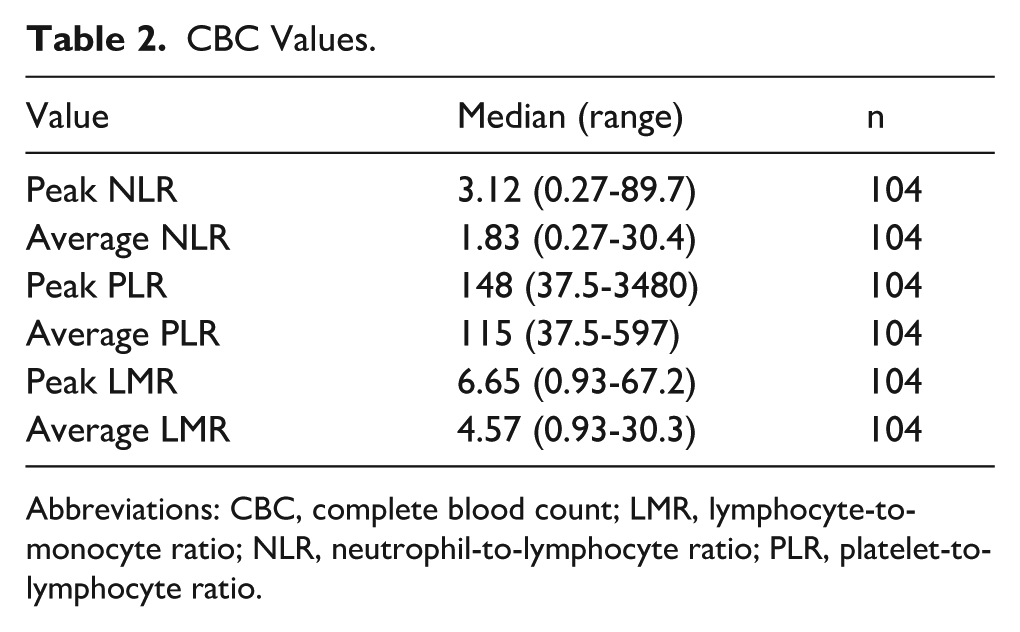
Abbreviations: CBC, complete blood count; LMR, lymphocyte-to-monocyte ratio; NLR, neutrophil-to-lymphocyte ratio; PLR, platelet-to-lymphocyte ratio.
Associations Between CBC and Lesion Characteristics
The impact of age on laboratory values was investigated by dividing patients based on age at first CBC into newborn, infant, and child groups and comparing first CBC values between these groups. First PLR was greater in infants (median 12.83, range 0.75-96.50) compared with newborns (median 7.20, range 1.89-20.63, P = .04) and children (median 8.34, range 0.09-113.00, P = .01). Patients with extremity LM had lesser peak (median 1.70, range 0.48-8.63 vs median 3.4, range 0.27-89.67, P = .01) and average (median 1.11, range 0.48-5.38 vs median 1.95, range 0.27-30.41, P = .02) NLR (Table 3), lesser peak PLR (median 124.21, range 37.54-316.06 vs median 156.32, range 40.52-3475.00, P = .04; Table 4), and greater average LMR (median 5.29, range 3.42-11.86 vs median 4.39, range 0.93-30.26, P = .046; Table 5) compared with other locations. The association with peak NLR (P = .047; Supplemental Table 2), but not average NLR, peak PLR (Supplemental Table 3), or average LMR (Supplemental Table 4) remained significant when only including children ages ≥1 year old at first CBC. Associations with NLR (Supplemental Table 5), PLR (Supplemental Table 6), and LMR (Supplemental Table 7) were not significant when patients treated with sirolimus were excluded. Patients with LM at multiple body segments had a greater peak (median 84.61, range 6.56-59.67 vs median 3.09, range 0.27-87.35, P = .009) and average (median 5.53, range 3.93-14.67 vs median 1.81, range 0.27-30.41, P = .009) NLR (Table 3) and peak PLR (median 1537.04, range 170.09-3475.00 vs median 146.00, range 37.54-1540.00, P = .03; Table 4). Average NLR (P = .03; Supplemental Table 5) and LMR (P = .04; Supplemental Table 7) were significantly associated with LM at multiple body segments when patients treated with sirolimus were excluded. No children ≥1 year old at first CBC had LM at multiple segments. Patients with mixed microcystic/macrocystic LM had greater peak NLR (median 10.89, range 1.18-87.35 vs median 3.09, range 0.27-89.67, P = .03; Table 3) and peak PLR (median 535.52, range 54.19-1303.57 vs median 132.21, range 37.54-3475.00, P = .047; Table 4), and lesser average LMR (median 3.78, range 1.11-5.19 vs median 4.80, range 0.93-30.26, P = .049; Table 5) than other LM types. LM type was associated with peak (P < .001) and average (P < .001) NLR (Supplemental Table 2) and peak (P < .001) and average (P < .001) PLR (Supplemental Table 3) when only including children ≥1 year old. When patients with sirolimus treatment were excluded, peak (P = .04) and average (P = .03) LMR (Supplemental Table 7) were less in patients with mixed LM compared with other types. Patients who underwent sirolimus treatment had greater peak LMR compared with those who did not (median 11.15, range 5.10-28.37 vs median 6.00, range 0.93-67.17, P = .001; Table 5), even when those <1 year old were excluded (P = .007; Supplemental Table 4).
Bivariate Regression of Factors Associated With Peak and Average NLR.
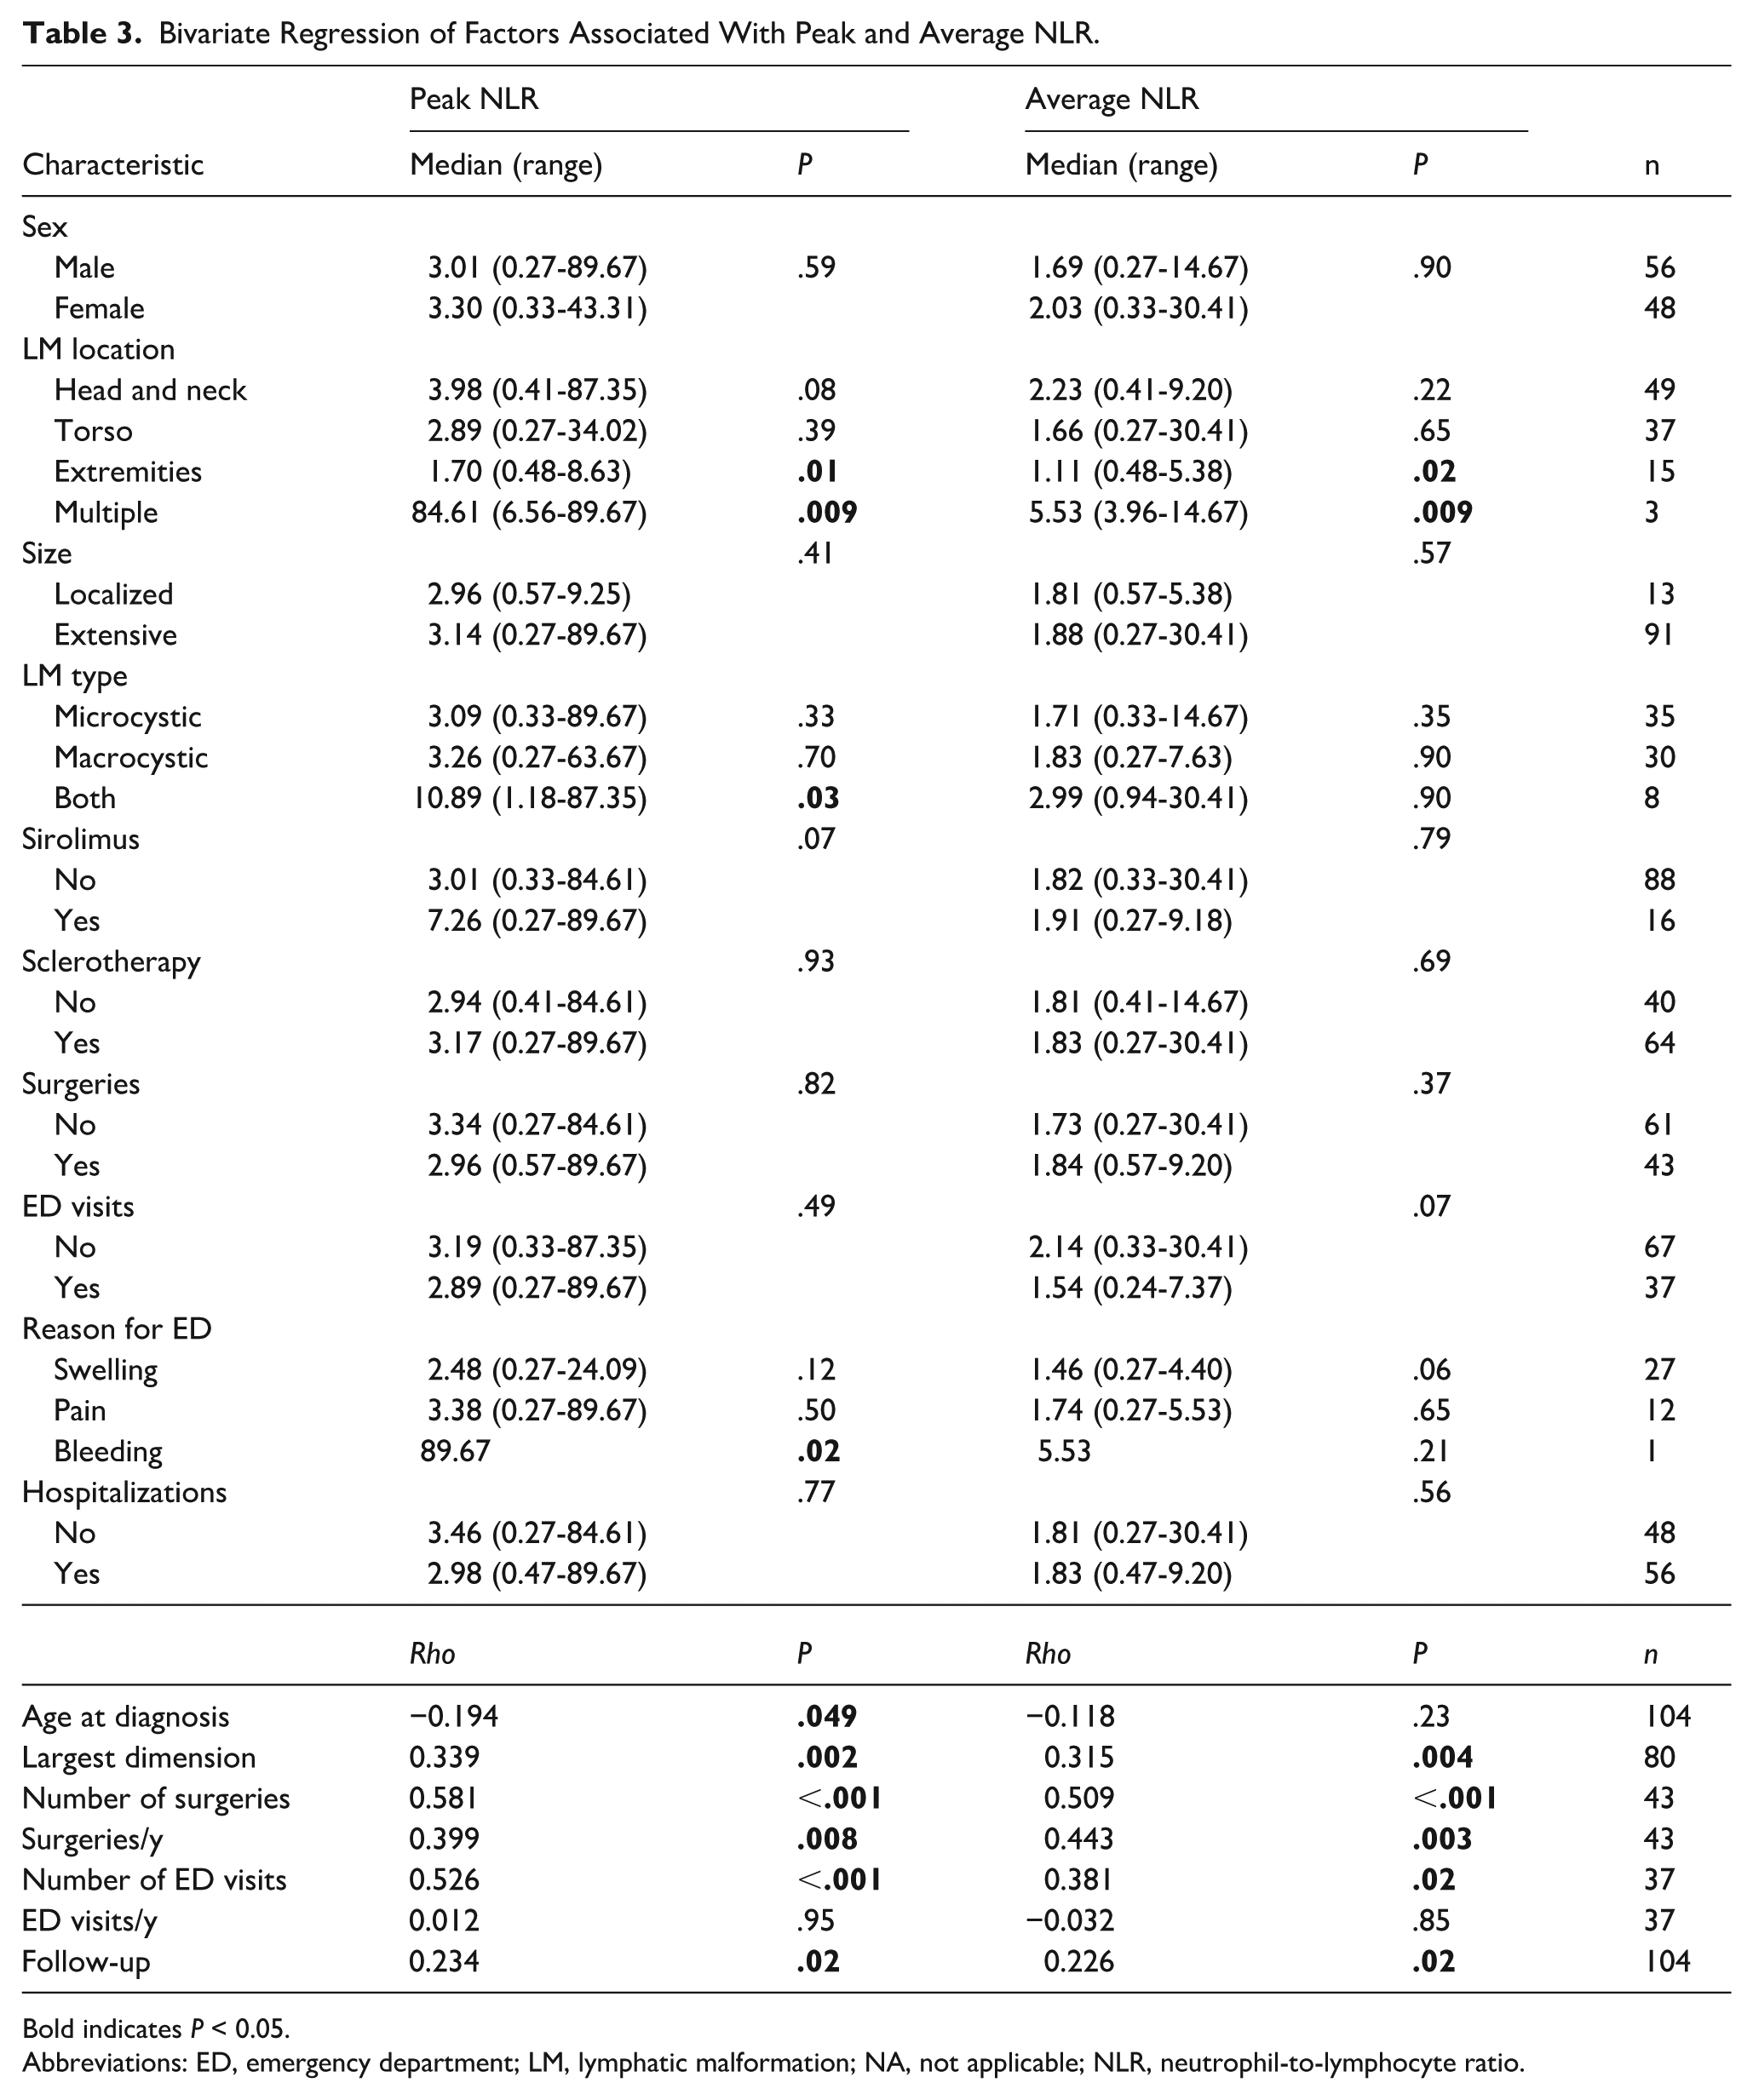
Bold indicates P < 0.05.
Abbreviations: ED, emergency department; LM, lymphatic malformation; NA, not applicable; NLR, neutrophil-to-lymphocyte ratio.
Bivariate Regression of Factors Associated With Peak and Average PLR.
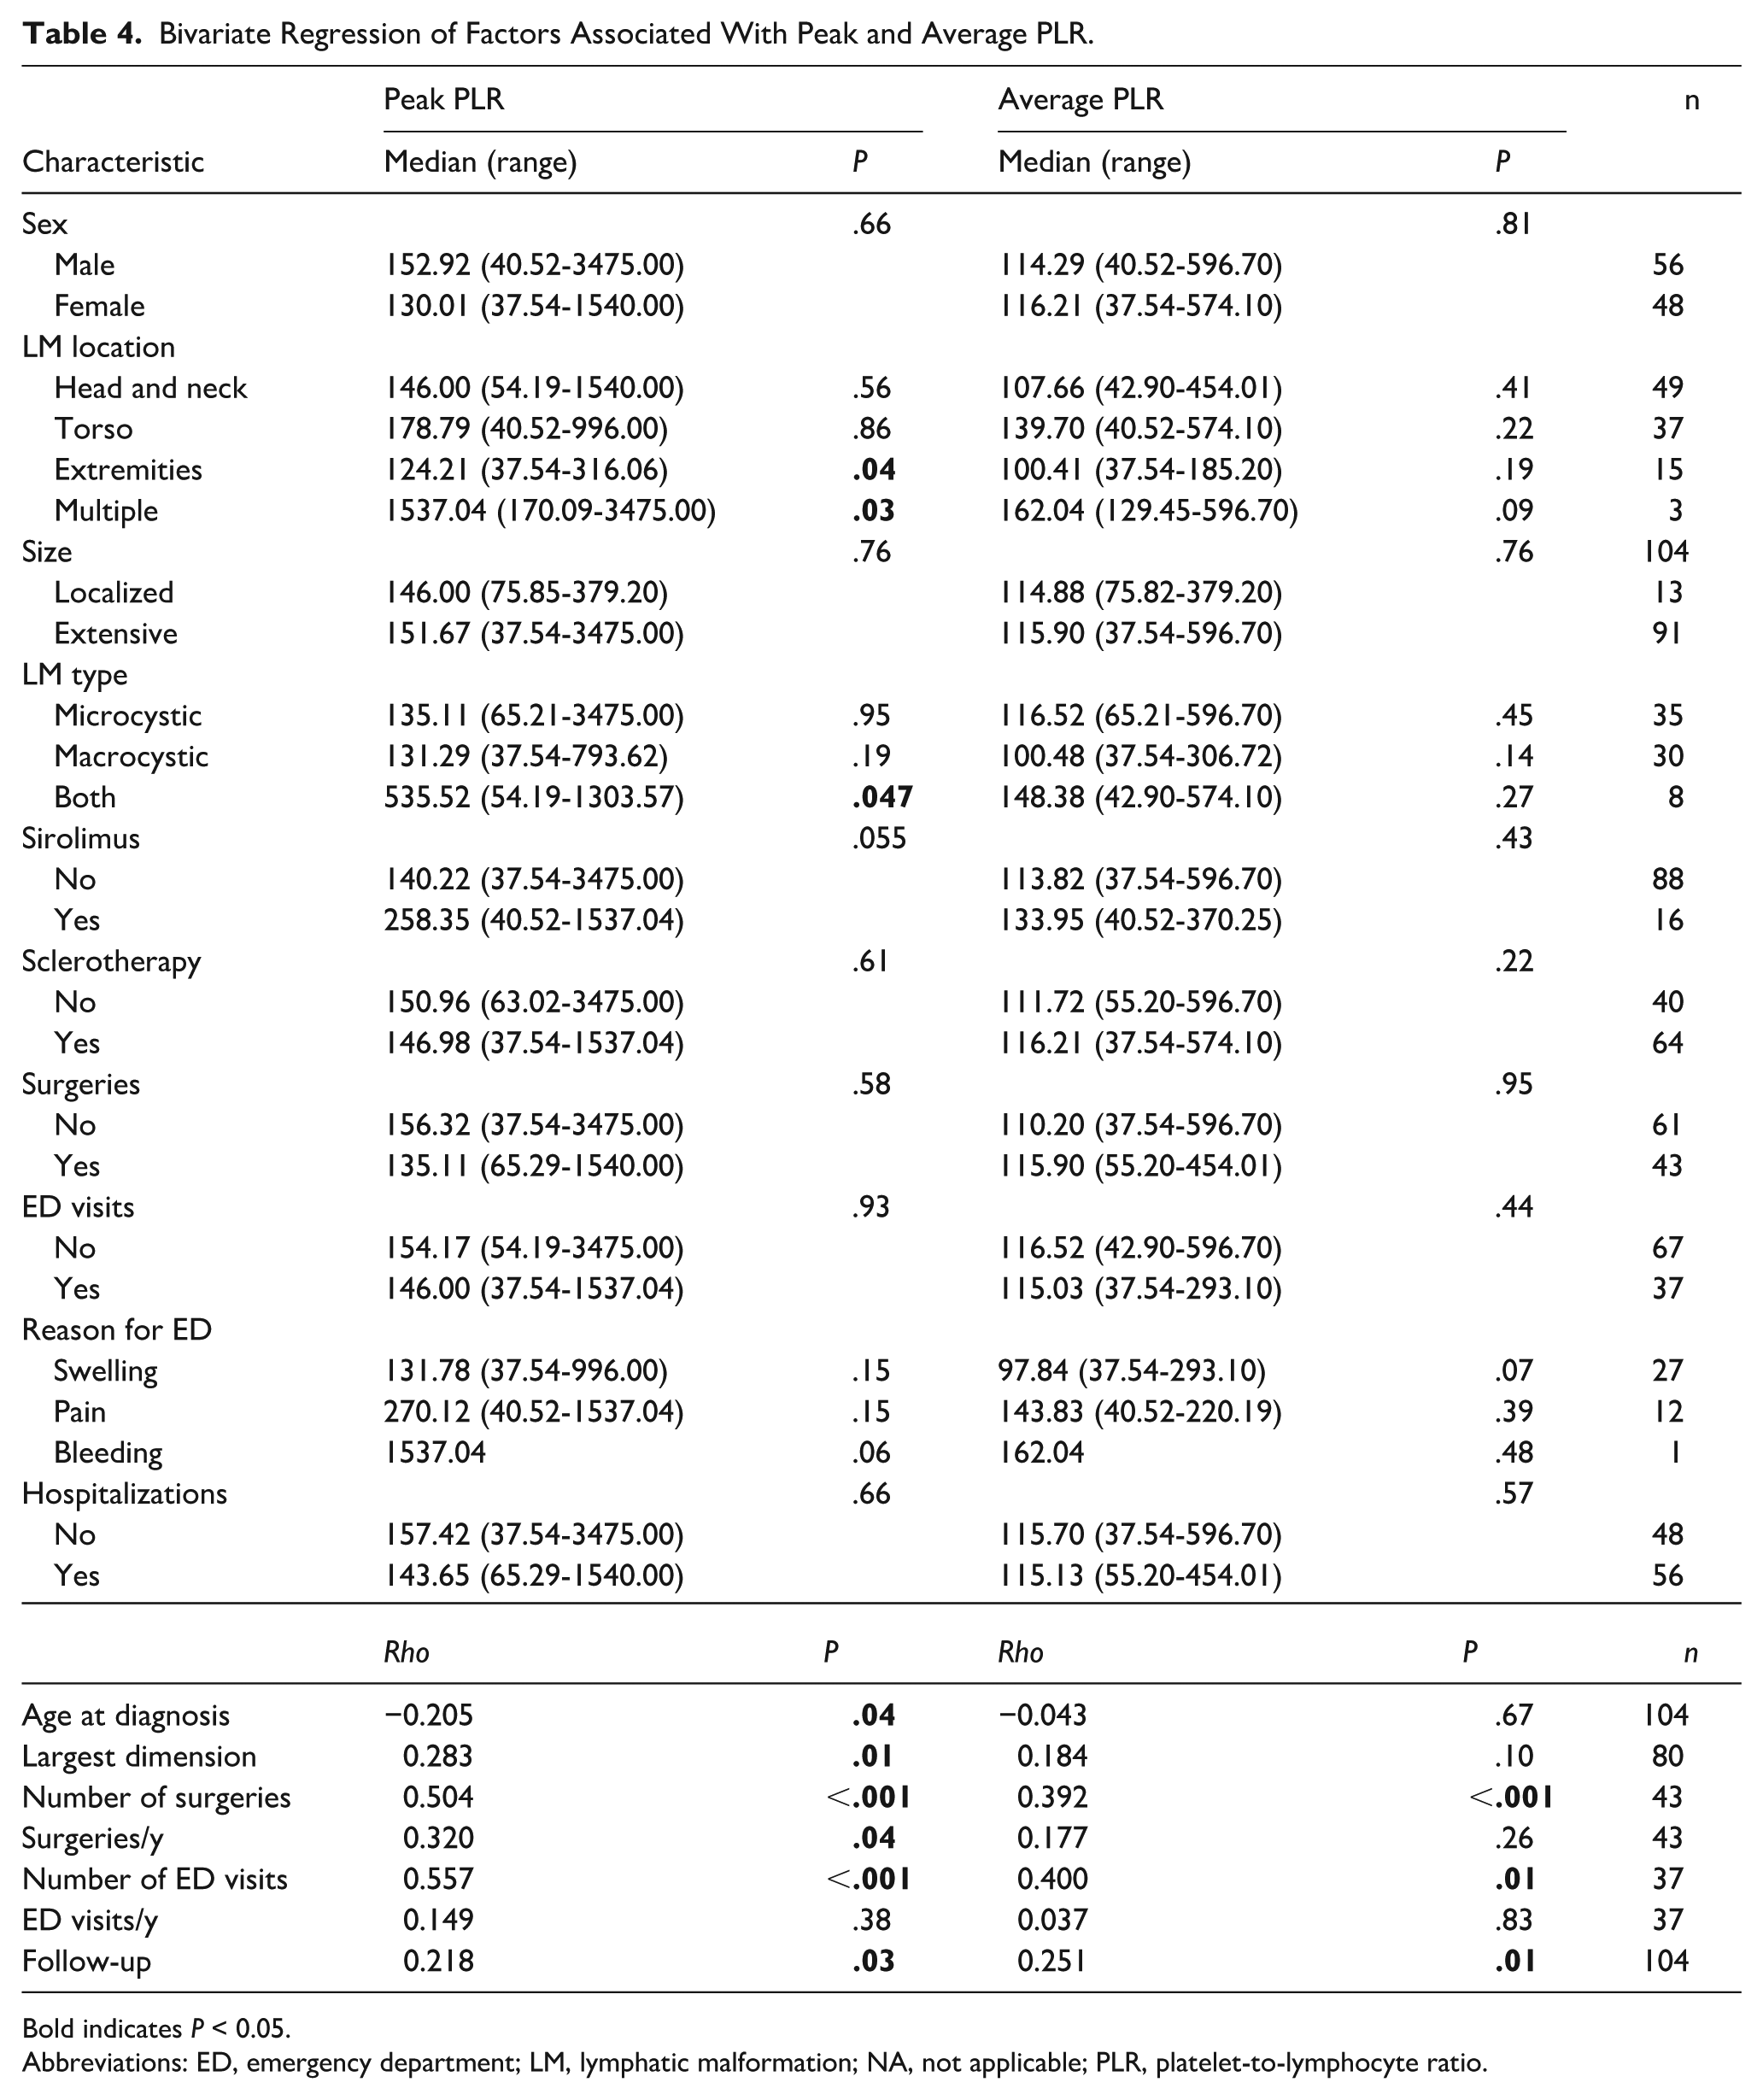
Bold indicates P < 0.05.
Abbreviations: ED, emergency department; LM, lymphatic malformation; NA, not applicable; PLR, platelet-to-lymphocyte ratio.
Bivariate Regression of Factors Associated With Peak and Average LMR.
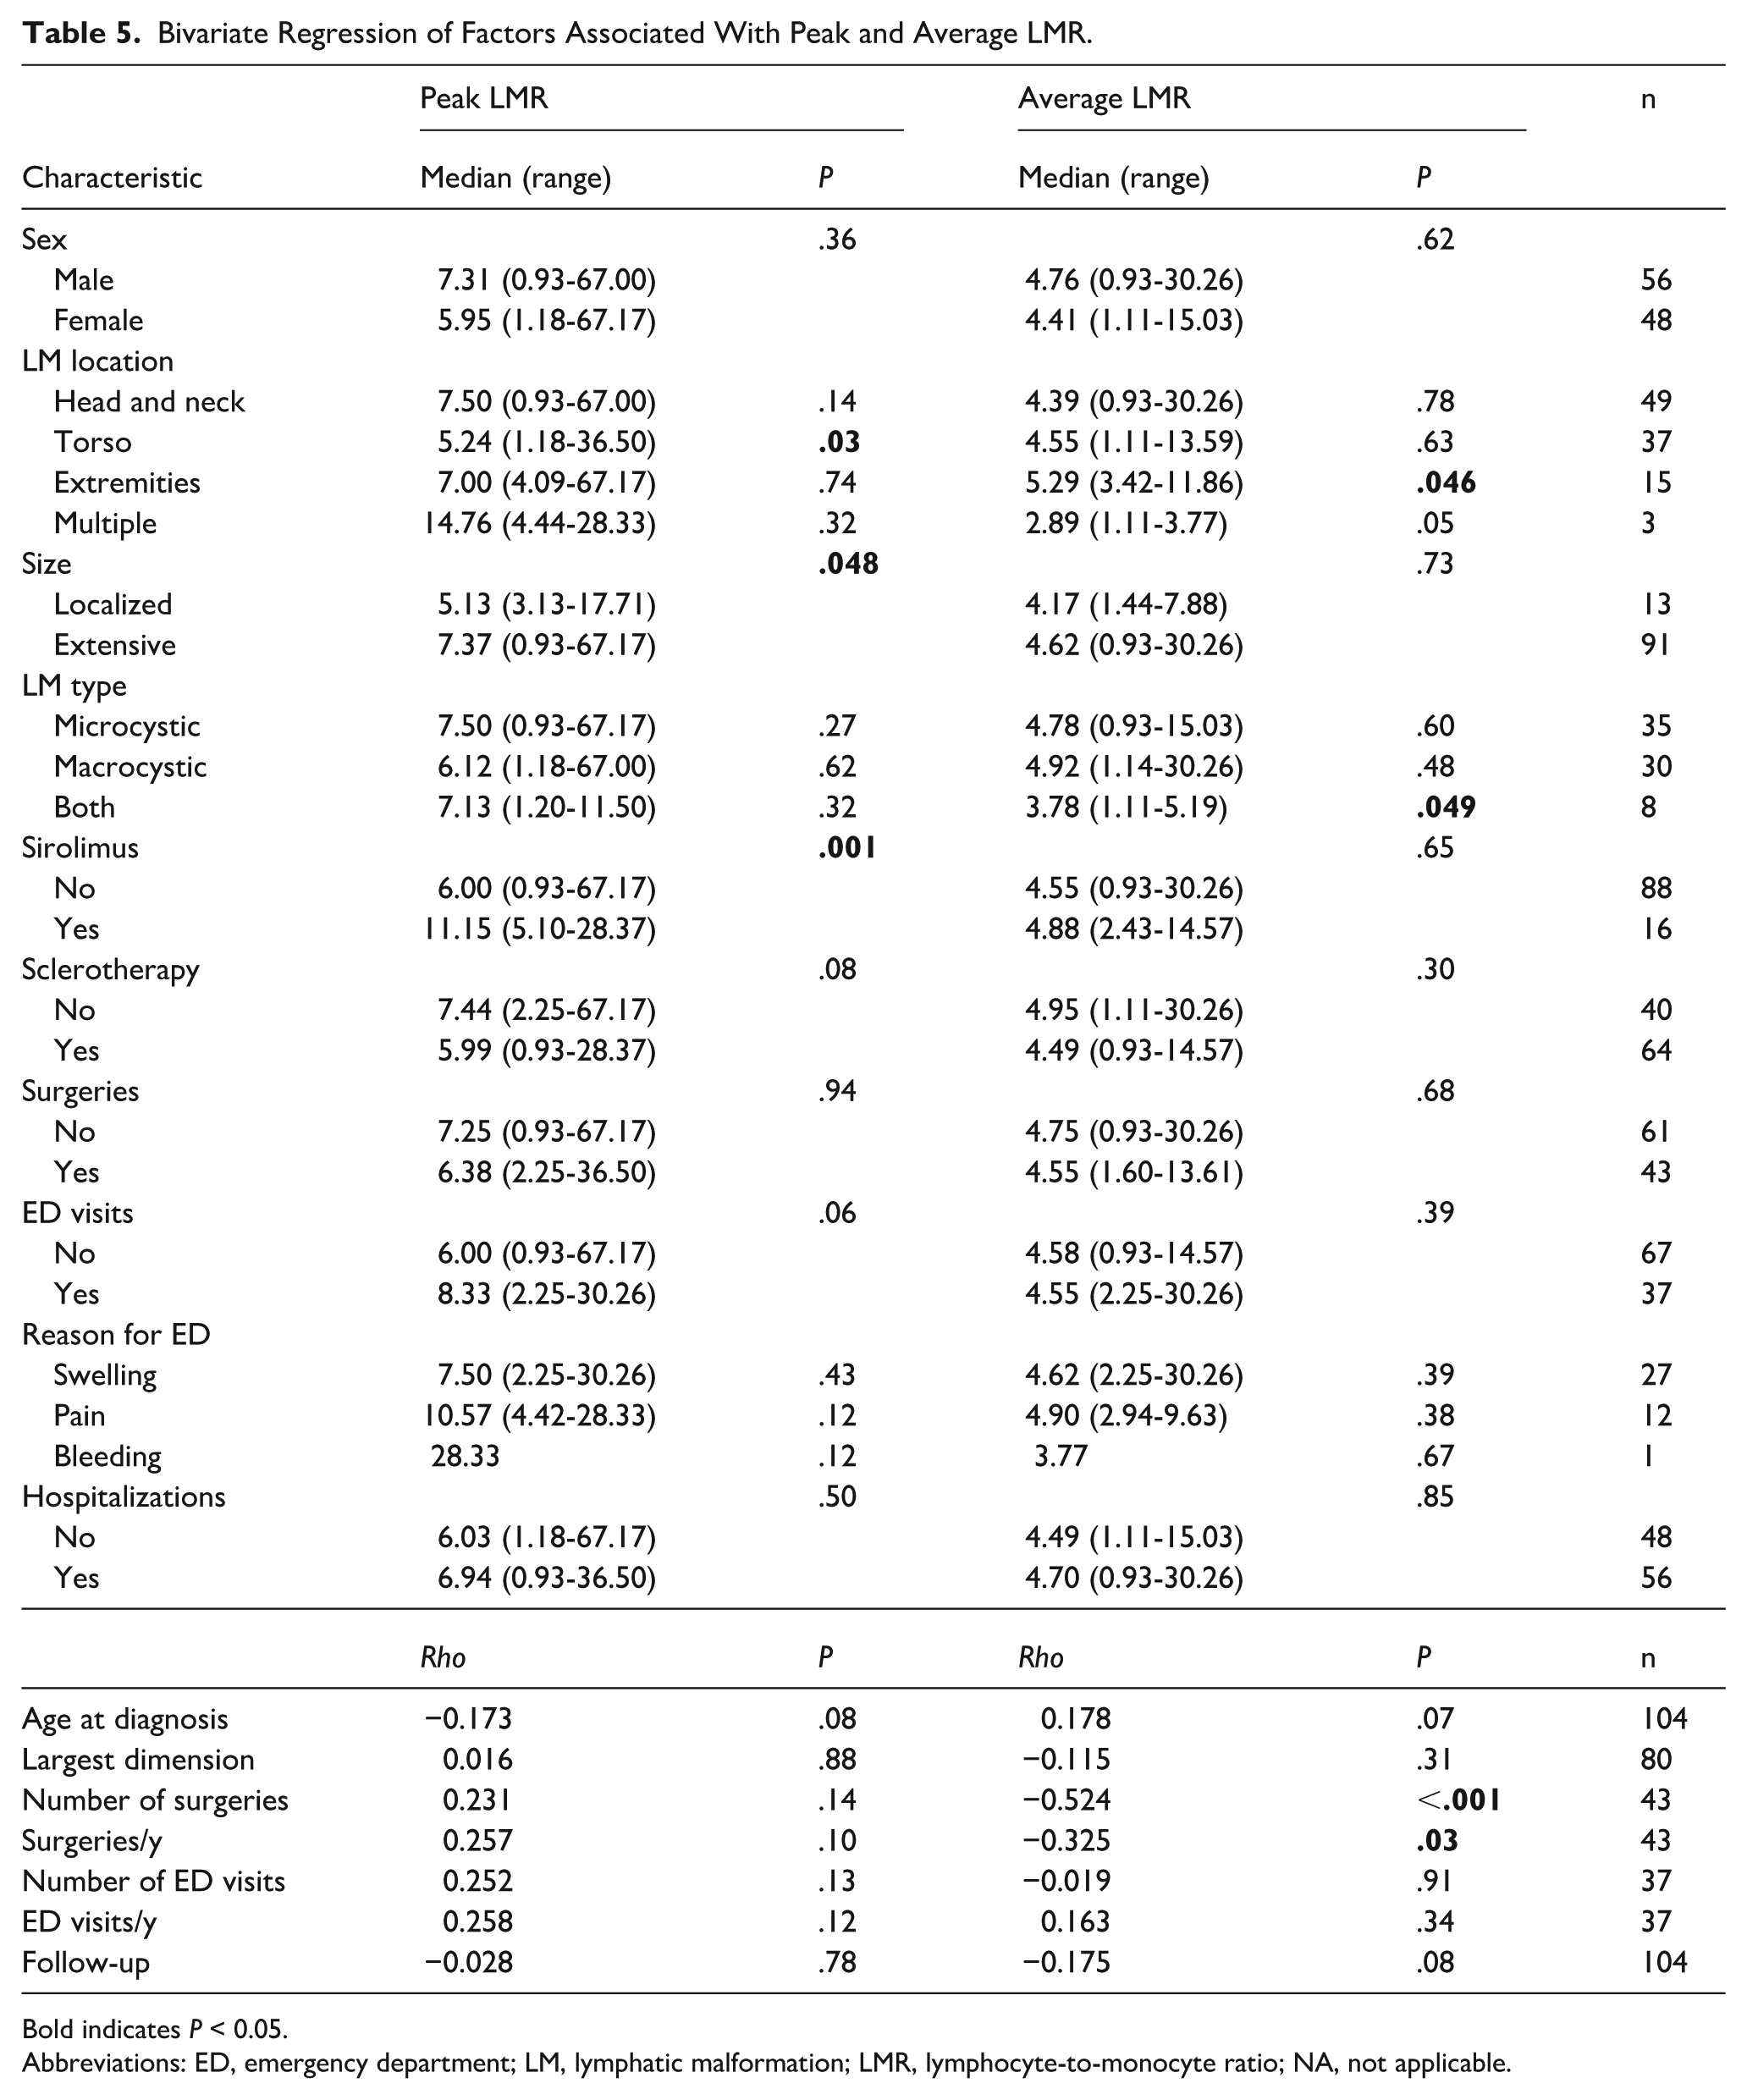
Bold indicates P < 0.05.
Abbreviations: ED, emergency department; LM, lymphatic malformation; LMR, lymphocyte-to-monocyte ratio; NA, not applicable.
Younger age at diagnosis was correlated with greater peak NLR (ρ = −0.194, P = .04; Table 3) and peak PLR (ρ = −0.205, P = .04; Table 4), but these associations were not significant when excluding infants or those who received sirolimus. Peak (ρ = 0.339, P = .002) and average (ρ = 0.315, P = .004) NLR (Table 3) and peak PLR (ρ = 0.283, P = .01; Table 4) increased with increasing lesion largest dimension. When excluding infants (peak: P = .01; average: P = .01; Supplemental Table 2) and those who received sirolimus (peak: P = .009, average: P = .02; Supplemental Table 5), NLR remained associated with LM size. Furthermore, greater peak PLR was associated with increasing lesion largest dimension when infants were excluded (P = .049; Supplemental Table 3). Number of surgeries was associated with greater peak (ρ = 0.581, P < .001) and average (ρ = 0.509, P < .001) NLR (Table 3), peak (ρ = 0.504, P < .001) and average (ρ = 0.392, P < .001) PLR (Table 4), and average LMR (ρ = −0.524, P < .001; Table 5). When excluding infants, no values remained significantly associated with number of surgeries. When excluding those who received sirolimus, peak NLR (ρ = 0.379, P = .03) was still associated with number of surgeries (Supplemental Table 5). When examining number of surgeries/year to account for length of follow-up, peak (ρ = 0.399, P = .008) and average (ρ = 0.443, P = .003) NLR (Table 3), peak PLR (ρ = 0.320, P = .04) (Table 4), and average LMR (ρ = −0.325, P = .03; Table 5) were significant. When excluding infants or those who received sirolimus, no values remained significantly associated with number of surgeries/year. Number of ED visits was associated with peak (ρ = 0.526, P < .001) and average (ρ = 0.381, P = .02) NLR (Table 3) and peak (ρ = 0.557, P < .001) and average (ρ = 0.400, P = .01) PLR (Table 4). Associations between the number of ED visits and peak NLR (P = .02; Supplemental Table 2) and peak (P = .005) and average (P = .03) PLR (Supplemental Table 3) remained significant when infants were excluded. No CBC values remained significantly associated with the number of ED visits when patients who received sirolimus were excluded. No values were significantly associated with ED visits/year, but peak (ρ = 0.234, P = .02) and average (ρ = 0.226, P = .02) NLR (Table 3) and peak (ρ = 0.218, P = .03) and average (ρ = 0.251, P = .01) PLR (Table 4) increased with longer follow-up.
Discussion
In this study, the inflammatory biomarkers NLR, PLR, and LMR were associated with increased LM disease severity. Specifically, patients with greater NLR and PLR have more presentations to the ED with LM-related flare-ups, patients with greater NLR and PLR and lesser LMR underwent more surgical interventions, and those initiated on sirolimus for refractory disease had greater LMR. When accounting for sirolimus treatment, greater NLR was associated with LM at multiple body segments, larger lesions, and more surgeries; lesser LMR was associated with lesions at multiple body segments, mixed LM type, and receiving sclerotherapy. Although sirolimus use was included as one of our severity indicators, standardized outcome measures were not available to directly assess treatment response. Future prospective studies should evaluate whether baseline or serial NLR, PLR, and LMR values can serve as predictors or monitoring tools for treatment efficacy in LM. Taken together, these findings suggest that such biomarkers may serve as inflammatory indicators for predicting prognosis in LM. Interestingly, some studies, particularly in the realm of hematology/oncology, have demonstrated that higher levels of these biomarkers are associated with a favorable response and positive prognosis.21,22
While our study focused on the relationship between inflammatory markers and disease severity, other studies have demonstrated how patients with complex LMs tend to have increased healthcare utilization.
For example, Truong et al’s study showed that, compared with patients with simple LMs, patients with complex disease had more office visits, outpatient imaging, hospitalizations, procedures, and hospital days per year. 23 Complex disease in Truong et al’s study was defined as involving the airway and/or more than 1 anatomic area from the head/neck to the extremities. 23 Further investigations into the relationship between biomarkers and LMs can provide a quantitative metric to track new interventions to reduce disease severity and rates of healthcare utilization.
Sirolimus has been shown to be effective for patients with extensive disease. Thus, the use of inflammatory biomarkers at baseline could potentially help stratify patients who need sirolimus at an earlier age and those who might not require such medication, as this medication is not without its potential side effects of anemia, leukopenia, thrombocytopenia, hypercholesterolemia, arthralgias, extremity edema and impaired wound healing. 24 To account for the intrinsic immunologic impact of sirolimus, significant associations in the present study were re-evaluated, excluding patients who had received this treatment. Without these patients, LM at multiple body segments, and therefore greater disease burden, was still significantly associated with elevated NLR. Additionally, alpelisib, which is a selective inhibitor of the PI3K pathway, has been FDA-approved as a targeted medication for LM. Studies have demonstrated that alpelisib decreased malformation size and locoregional overgrowth, improving patient symptoms.25,26 No patients in the present study received this treatment, but the impact of alpelisib on immunologic ratios is an important consideration in the design of future work.
The use of inflammatory markers to predict disease severity has been widely established in other disease processes such as cancer. Proctor et al analyzed 1413 colorectal cancer patients and found that NLR was a significant surrogate marker for overall survival (OS) and cancer-specific survival. 27 Additionally, Mandaliya et al confirmed a statistically significant association between NLR at baseline and OS in patients aged ≥70 years with stage IV non-small cell lung cancer. 28 Therefore, these biomarkers can provide a simple means of evaluating systemic inflammation and its resulting effects on the disease process. By quantifying LM disease burden, they may allow for early stratification of patients and selection of appropriate treatments.
Limitations of this study should be acknowledged. One limitation lies in this study’s retrospective design, which is subject to inherent biases and a limited ability to establish causality. The patients in our study also came from a single academic institution, potentially limiting generalizability of results. Additionally, there was no standardized timeline for obtaining lab work from patients. Future research should involve multiple institutions and a larger patient population to diversity the study cohort. Additionally, it should include a prospective study that evaluates these biomarker ratios at set intervals in patients with LM. The clinical course of these patients should then be associated with the observed biomarker ratios. Within this patient cohort, other inflammatory markers, including C-reactive protein and erythrocyte sedimentation rate, were not consistently available. Correlation of NLR, PLR, and LMR with these other commonly used markers is important in future studies. Furthermore, it was not possible to pinpoint the indication for CBC for all encounters; in these circumstances, results were available, but they were not directly attributable to an existing hospital or primary care visit or message in the electronic medical record system. However, when the reason for CBC was apparent, labs were generally drawn in the absence of acute infection or inflammation. Therefore, it is expected that the ratios reported in this study are reflections of the patient’s levels in the absence of acute infectious insult, but the authors acknowledge that it is possible that the NLR, PLR, and LMR may be impacted by common pediatric infections. The present study also did not include a control population with children without LM. In children, normal values for NLR and PLR increase with age, while normal values for LMR decrease with age. 29 Furthermore, these ratios are less reliable in infants and neonates.30,31 Sub-analyses were performed in the present study to determine which associations were significant when excluding those <1 year old at first CBC. However, it is important in future studies to include age-matched control patients and account for any acute disease processes to define the role of these ratios as biomarkers and prognostic factors for chronic, rare diagnoses such as LM. Although CBCs were generally drawn outside of acute infections when documented, we could not systematically exclude patients with concurrent inflammatory conditions such as pneumonia or upper respiratory infections. These conditions may transiently alter NLR, PLR, and LMR values, potentially confounding the observed associations. Future multi-institutional, prospective studies with standardized infection screening and inclusion of age-matched controls will be important to validate these findings and determine the prognostic utility of inflammatory ratios in LM. The timing of CBC collection was not standardized, and in many cases, it is unknown whether laboratory values were obtained at baseline, during LM-related flares, concurrent infections, ED visits, or perioperatively. This may be a critical confounder, as inflammatory ratios can be influenced by acute physiological stress or illness. Reactive thrombocytosis, which is common in children and most often secondary to infections, inflammatory exposures, or stress, could transiently alter NLR, PLR, and LMR values. Future prospective studies should aim to obtain CBC measurements at standardized time points and in the absence of acute illness to more accurately assess the relationship between these biomarkers and LM disease severity.
Conclusion
This study demonstrated that increased inflammatory/immunologic biomarkers such as NLR, PLR, and LMR are associated with increased LM disease severity as measured by increased number of ED visits and surgeries and use of sirolimus. Accordingly, such biomarkers may serve as inflammatory indicators for predicting prognosis of LM. However, the relationship between these biomarkers and genetic contributions in LM must be further elucidated to provide a comprehensive prognostic assessment.
Supplemental Material
sj-docx-1-ear-10.1177_01455613261434942 – Supplemental material for Inflammatory Biomarkers and Disease Severity in Patients With Lymphatic Malformations
Supplemental material, sj-docx-1-ear-10.1177_01455613261434942 for Inflammatory Biomarkers and Disease Severity in Patients With Lymphatic Malformations by Zainab Balogun, Amber D. Shaffer and Reema Padia in Ear, Nose & Throat Journal
Footnotes
Acknowledgements
The authors wish to thank The University of Pittsburgh School of Medicine Center for providing the necessary resources for this study.
Author’s Note
This project was presented at the 2024 American Society of Pediatric Otolaryngology Combined Otolaryngology Spring Meeting, Chicago, Illinois.
Ethical Considerations
This study was approved by our Institution’s review board under the number STUDY20060029.
Funding
The authors disclosed receipt of the following financial support for the research, authorship, and/or publication of this article: The project described was supported by the National Institutes of Health through grant number UL1 TR001857.
Declaration of Conflicting Interests
The authors declared no potential conflicts of interest with respect to the research, authorship, and/or publication of this article.
Data Availability Statement
The raw data used for this article are available upon reasonable request to the corresponding author.
Supplemental Material
Supplemental material for this article is available online.
References
Supplementary Material
Please find the following supplemental material available below.
For Open Access articles published under a Creative Commons License, all supplemental material carries the same license as the article it is associated with.
For non-Open Access articles published, all supplemental material carries a non-exclusive license, and permission requests for re-use of supplemental material or any part of supplemental material shall be sent directly to the copyright owner as specified in the copyright notice associated with the article.