
Abstract
Objective:
To analyze the pathophysiological changes in the inner ear in different hearing loss patterns by observing the magnetic resonance imaging (MRI) characteristics of patients with sudden sensorineural hearing loss (SSNHL) and to evaluate the diagnostic value of T1WI/T2WI combined with delayed enhanced intravenous 3D-FLAIR MR technique.
Methods:
In this single-center retrospective study, we performed T1WI, T2WI, and delayed enhanced intravenous 3D-FLAIR MR in 215 patients with SSNHL. Two radiologists independently assessed the MR image. Patients diagnosed with SSNHL were classified into 4 groups according to the audiogram of hearing loss: low-frequency group, flat audiogram group, high-frequency group, and profound deafness group. The MRI findings were classified into inner ear hemorrhage, endolymphatic hydrops (EH), labyrinthitis, or hemorrhagic labyrinthitis, and statistical analysis was performed.
Results:
A total of 215 cases (99 males/116 females; aged 46.69 ± 15.06) were included. Patients with the T1WI and T2WI scan accounted for 158 cases, patients with delayed enhancement accounted for 176 cases, and those with T1WI, T2WI, and delayed enhancements accounted for 118 cases. The abnormal MRI results’ rates in the low-frequency group, flat audiogram group, high-frequency group, and profound deafness group were 25.9%, 33.78%, 24.32%, and 97.82%, respectively. The profound deafness group exhibited significantly higher incidences of inner ear hemorrhage (28.26%), labyrinthitis (45.65%), and hemorrhagic labyrinthitis (23.91%) compared to the low-frequency group (0.00%, 6.90%, 0.00%; P < .001), flat audiogram group (2.70%, 13.51%, 1.35%; P < .001), and high-frequency group (5.41%, 13.51%, 0.00%; P < .001). EH were more prevalent in the low-frequency group (18.97%) and flat audiogram group (16.22%) than in the profound deafness group (0.00%; P = .007).
Conclusions:
MRI technology can show the pathological change process of the inner ear partially, patients with SSNHL may present with labyrinthitis, hemorrhagic labyrinthitis, EH, hemorrhage of the inner ear, which may be interrelated or mutually transformed, and may be related to the severity and prognosis of the disease.
Introduction
Sudden sensorineural hearing loss (SSNHL) is characterized by abrupt hearing impairment, often accompanied by tinnitus and vertigo. Pathogenesis involves the activation of inflammatory responses within the inner ear triggered by infection, hemorrhage, ischemia, or immune-mediated injury, leading to abnormalities of the blood-labyrinthine barrier (BLB), infiltration of inflammatory cells, and subsequent damage to hair cells. 1 A recent study of patients aged 15 to 40 years showed that magnetic resonance imaging (MRI) of 3D-FLAIR sequences showed endolymph edema or inflammatory status in more than 80% of patients. 2 On T1-weighted MRI (T1W1), the labyrinth shows high signals due to extravasation of methemoglobin or proteins. Delayed enhanced 3D-FLAIR sequences (3-dimensional fluid-attenuated inversion recovery) leverage differential gadolinium permeation between the endolymph and exolymph space, allowing the diagnosis of endolymphatic hydrops (EH) while simultaneously reflecting microvascular permeability through contrast agent distribution patterns,3,4 and it has enabled us to visualize histopathological changes in inner ear diseases. The aim of this study is to distinguish different pathophysiological mechanisms through T1WI/T2WI imaging combined with delayed enhanced 3D-FLAIR imaging in patients with SSNHL.
Materials and Methods
This was a single-center retrospective imaging study from the Benq Medical Center of Nanjing Medical University. The MR imaging data come from hospitalized patients diagnosed with SSNHL between October 2021 and June 2024. The diagnosis criteria and 4 types of audiogram classification were based on the 2015 Chinese Medical Association guidelines for SSNHL. The patients were classified into low-frequency hearing loss group, high-frequency hearing loss group, flat audiogram group, and profound deafness group. 5 The patients performed T1WI, T2WI, or/and delayed intravenous Gd-enhanced 3D-FLAIR MRI.
Inclusion criteria: (1) MRI examination on the day of onset to 2 weeks after onset; (2) images met the judgment criteria.
Exclusion criteria: (1) exclude patients with acoustic tumor or pontocerebellar region; (2) exclude large vestibular aqueduct; (3) acute and chronic otitis media; and (4) the image has severe artifacts and poor quality.
Methods
Hearing Assessment
Pure tone thresholds were measured using a noise meter (Madsen, Denmark). Background noise was set not more than 30 dB, and thresholds for 250 Hz, 500 Hz, 1 kHz, 2 kHz, 4 kHz and 8 kHz air conduction and bone conduction were determined using the ascending and descending staircase method.
Magnetic Resonance Imaging of Inner Ear
A 3.0 T MRI scanner (Discovery 750W; GE, Inc.) with a combined 24-channel head and neck phased array coil was used for bilateral ear imaging.The scanning protocol included pre-contrast T1-weighted imaging (T1WI) and T2-weighted imaging (T2WI), followed by delayed-phase three-dimensional fluid-attenuated inversion recovery (3D-FLAIR) acquired 8 hours after the intravenous administration of a single dose of Gadoterate Meglumine(0.1 mmol/kg body weight, flow rate 2.0 mL/s).
T1WI: repetition time (TR), 800 ms; echo time (TE), 15.2 ms; inversion angle, 111°; slice thickness, 1.5 mm; echo train length (ETL), 4; bandwidth (BW), 50 kHz; number of excitations (NEX), 4; field of view (FOV) 240 × 240 mm, matrix 288 × 288, scan time 2 minutes 26 seconds.
T2WI: TR 3499 ms, TE 68 ms, inversion angle 111, slice thickness 1.5 mm, ETL 16, BW 41.67 kHz, NEX 2, FOV 240 × 240 mm, matrix 320 × 256, scan time 1 minute 59 seconds.
Delayed 3D-FLAIR: TR 9000 ms, TE 315 ms, TI 2500 ms, ETL 140, BW 35.7 kHz, NEX 2, FOV 210 × 168 mm, matrix 256 × 256, slice thickness 1.60 mm, scan time 5 minutes 46 seconds.
Image Analysis
Standardize and normalize the image to ensure the symmetry between the lateral ear and the contralateral ear. Two radiologists assessed the signal display of the labyrinth on plain T1WI, T2WI, and enhanced delayed 3D-FLAIR sequences on the affected side. In case of conflict, a consensus was reached after discussion.
Criteria for Evaluating EH
After enhancement, the contrast agent is distributed in the external lymphatic space of the inner ear, resulting in a high signal intensity in the external lymphatic space and a low signal intensity in the internal lymphatic space; when EH occurs, it compresses the external lymphatic space, causing its size to decrease, with the area of high signal intensity decreasing and the area of low signal intensity increasing in MR images. EH was classified as mild, moderate, and severe according to the results of semi-quantitative evaluation.
Semi-Quantitative Assessment of EH
The 3-point method for visualizing cochlear EH: (1) Normal, with minimal visible in the middle frequency range, forming a septum between the vestibular and tympanic segments; (2) I hydrops, with a black nodule-shaped septum formed in the middle frequency range; (3) II hydrops, compressed by the middle frequency range, with the vestibular segment completely invisible. The 4-point method for visualizing vestibular EH: (1) Normal, with the sacculus and utricle distinguishable, and their combined area less than half of the vestibule; (2) I hydrops, with the sacculus area ≥ the utricle area, and they can be distinguished; (3) II hydrops, with the sacculus and utricle fused, and the external lymph of the vestibule visible; (4) III hydrops, with the sacculus and utricle enlarged and fused, and the invisible image of the external lymph of the vestibule. 4
Visual and Quantitative Assessment of Perilymphatic Enhancement
Damage to the blood-labyrinth barrier leads to delayed post-contrast labyrinthine enhancement. In severe cases, blood cells and proteins leak out, which can be observed as high signal intensity on T1W1 imaging. The affected ear exhibits a higher intensity of visual perilymph signal compared to the asymptomatic contralateral ear.6,7 Measure the signal intensities on T1WI imaging and the abnormal high signal intensity in the labyrinth separately, then determine the presence or absence of enhancement based on the specific reference signal ratio calculation method. At the base turn of the cochlea, vestibule, and the maximum cross-section of the horizontal semicircular canal, as well as at the corresponding level of the brainstem, a 0.5 mm2 region of interest analysis was delineated. The intensity of the signal of each region was measured 3 times, and the average value of the region of interest was taken. The signal intensity ratio was calculated. The central region of interest of the brain stem can eliminate the influence of cerebrospinal fluid and vascular signal intensity.8 -10
Statistical Analysis
Using SPSS (version 26.0; IBM, Armonk, NY, USA) statistical software, categorical data were described with n (%) and tested with χ2 test or Fisher exact probability method. Further pairwise comparisons were made using the Bonferroni correction (α′ = α/m, where m = k(k − 1)/2, k represents the number of independent samples; in this study, k = 4, α′ = α/m = 0.05/6 = 0.0083). Normal measurement data were expressed as (X–±S), and inter-group comparisons were performed using ANOVA, followed by pairwise comparisons using the Least Significant Difference (LSD) method. Non-normal distribution data were represented as (M [P25, P75]), and intergroup comparisons were performed using the Kruska-Wallis test, followed by pairwise comparisons using the Dunn’s test. P < .05 indicates statistically significant differences.
Results
A total of 215 eligible subjects were included in the study, with 99 males and 116 females, aged 46.69 ± 15.06 years. Among them, 120 had left ear hearing loss and 95 had right ear hearing loss. The onset time at admission was 4 (1, 10) days, and the MRI examination time after onset was 8 (4, 13) days. There were 58 cases in the low frequency group, 74 in the flat audiogram group, 37 in the high frequency group, and 46 in the profound deafness group. There was no difference between the groups in terms of the time for the MRI examination after onset.
The differences in age of onset, time of onset, time of MRI examination after onset, and distribution of hypertension, diabetes, cerebral infarction, and abnormal thyroid function between different groups were statistically significant. Further pairwise comparisons revealed that the age of onset in the low-frequency group (37.27 years) was significantly lower than that of the flat audiogram group (47.95 years), the high-frequency group (48.14 years), and the profound deafness group (52.84 years). Regarding the time of onset, the median time of onset in the profound deafness group (2 days) was significantly lower than in the low-frequency group (4 days), the flat audiogram group (5 days), and the high-frequency group (7 days). For the examination time, the median examination time in the profound deafness group (5 days) was significantly lower than in the low-frequency group (8 days), the flat audiogram group (9 days), and the high-frequency group (11 days). The prevalence of hypertension in the low-frequency group (6.90%) was lower than in the profound deafness group (30.43%). The prevalence of diabetes in the low-frequency group (1.72%) was lower than in the profound deafness group (19.57%). The prevalence of abnormal thyroid function in the low-frequency group (13.79%) was lower than that of the flat audiogram group (36.49%), with no statistically significant differences between the other groups (Table 1).
Analysis of Clinical Demographic Characteristics of Patients with SSNHL.
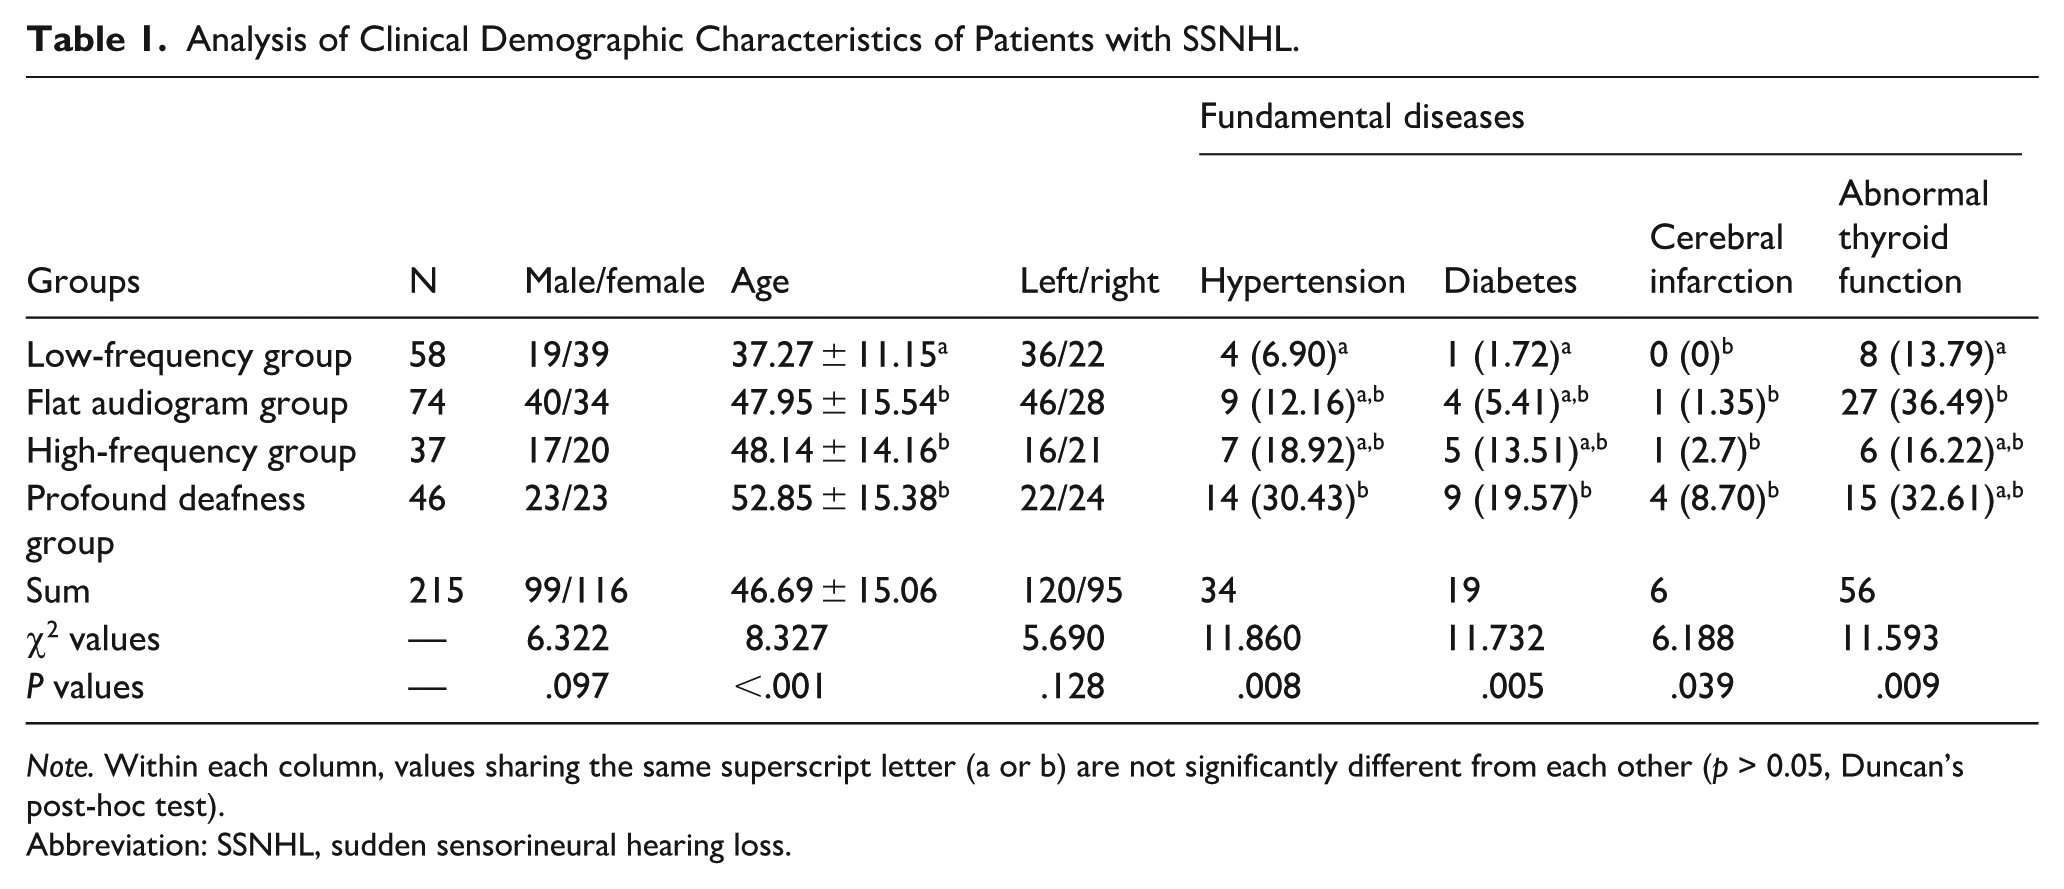
Note. Within each column, values sharing the same superscript letter (a or b) are not significantly different from each other (p > 0.05, Duncan’s post-hoc test).
Abbreviation: SSNHL, sudden sensorineural hearing loss.
A total of 158 patients underwent T1W1/T2W1 scan, 176 patients received delayed enhancement, and 118 patients received both plain and delayed enhancement. The abnormality rate in the low-frequency group was 25.9%, with 18.97% (11/58) of the patients having EH and 6.90% (4/58) having labyrinthitis, without cases of inner ear hemorrhage or hemorrhagic labyrinthitis; the abnormality rate in the flat audiogram group was 33.78%, including 2.70% (2/74) of the patients with inner ear hemorrhage, 13.51% (10/74) with labyrinthitis, 1.35% (1/74) with hemorrhagic labyrinthitis, and 16.22% (12/74) with EH; the abnormality rate in the high-frequency group was 24.32%, including 5.41% (2/37) of patients with inner ear hemorrhage, 13.51% (5/37) with labyrinthitis, 5.41% (2/37) with EH, and no patients with hemorrhagic labyrinthitis; the abnormality rate in the profound deafness group was 97.82%, including 28.26% (13/46) of patients with inner ear hemorrhage, 45.65% (21/46) with labyrinthitis, 23.91% (11/46) with hemorrhagic labyrinthitis, and 69.57% with both labyrinthitis and hemorrhagic labyrinthitis, with no patients found to have EH. There were statistically significant differences in the incidence of inner ear bleeding, labyrinthitis, hemorrhagic labyrinthitis, and EH between the different groups. Further pairwise comparisons revealed that for inner ear bleeding, the incidence in the profound deafness group (28.26%) was significantly higher than in the low-frequency group (0.00%), the flat audiogram group (2.70%), and the high-frequency group (5.41%). For labyrinthitis, the incidence in the profound deafness group (45.65%) was significantly higher than in the low-frequency group (6.90%), the flat audiogram group (13.51%), and the high-frequency group (13.51%). For hemorrhagic labyrinthitis, the incidence in the profound deafness group (23.91%) was significantly higher than in the low-frequency group (0.00%), the flat audiogram group (1.35%), and the high-frequency group (0.00%). For EH, the incidence in the low-frequency group (18.97%) and the flat audiogram group (16.22%) was significantly higher than in the profound deafness group (0.00%). Except for the profound deafness group, there were a few cases with reverse enhancement, but these differences were not statistically significant (Table 2).
The Clinical Symptoms and 3D-Fliar MRI Findings of Patients with SSNHL.
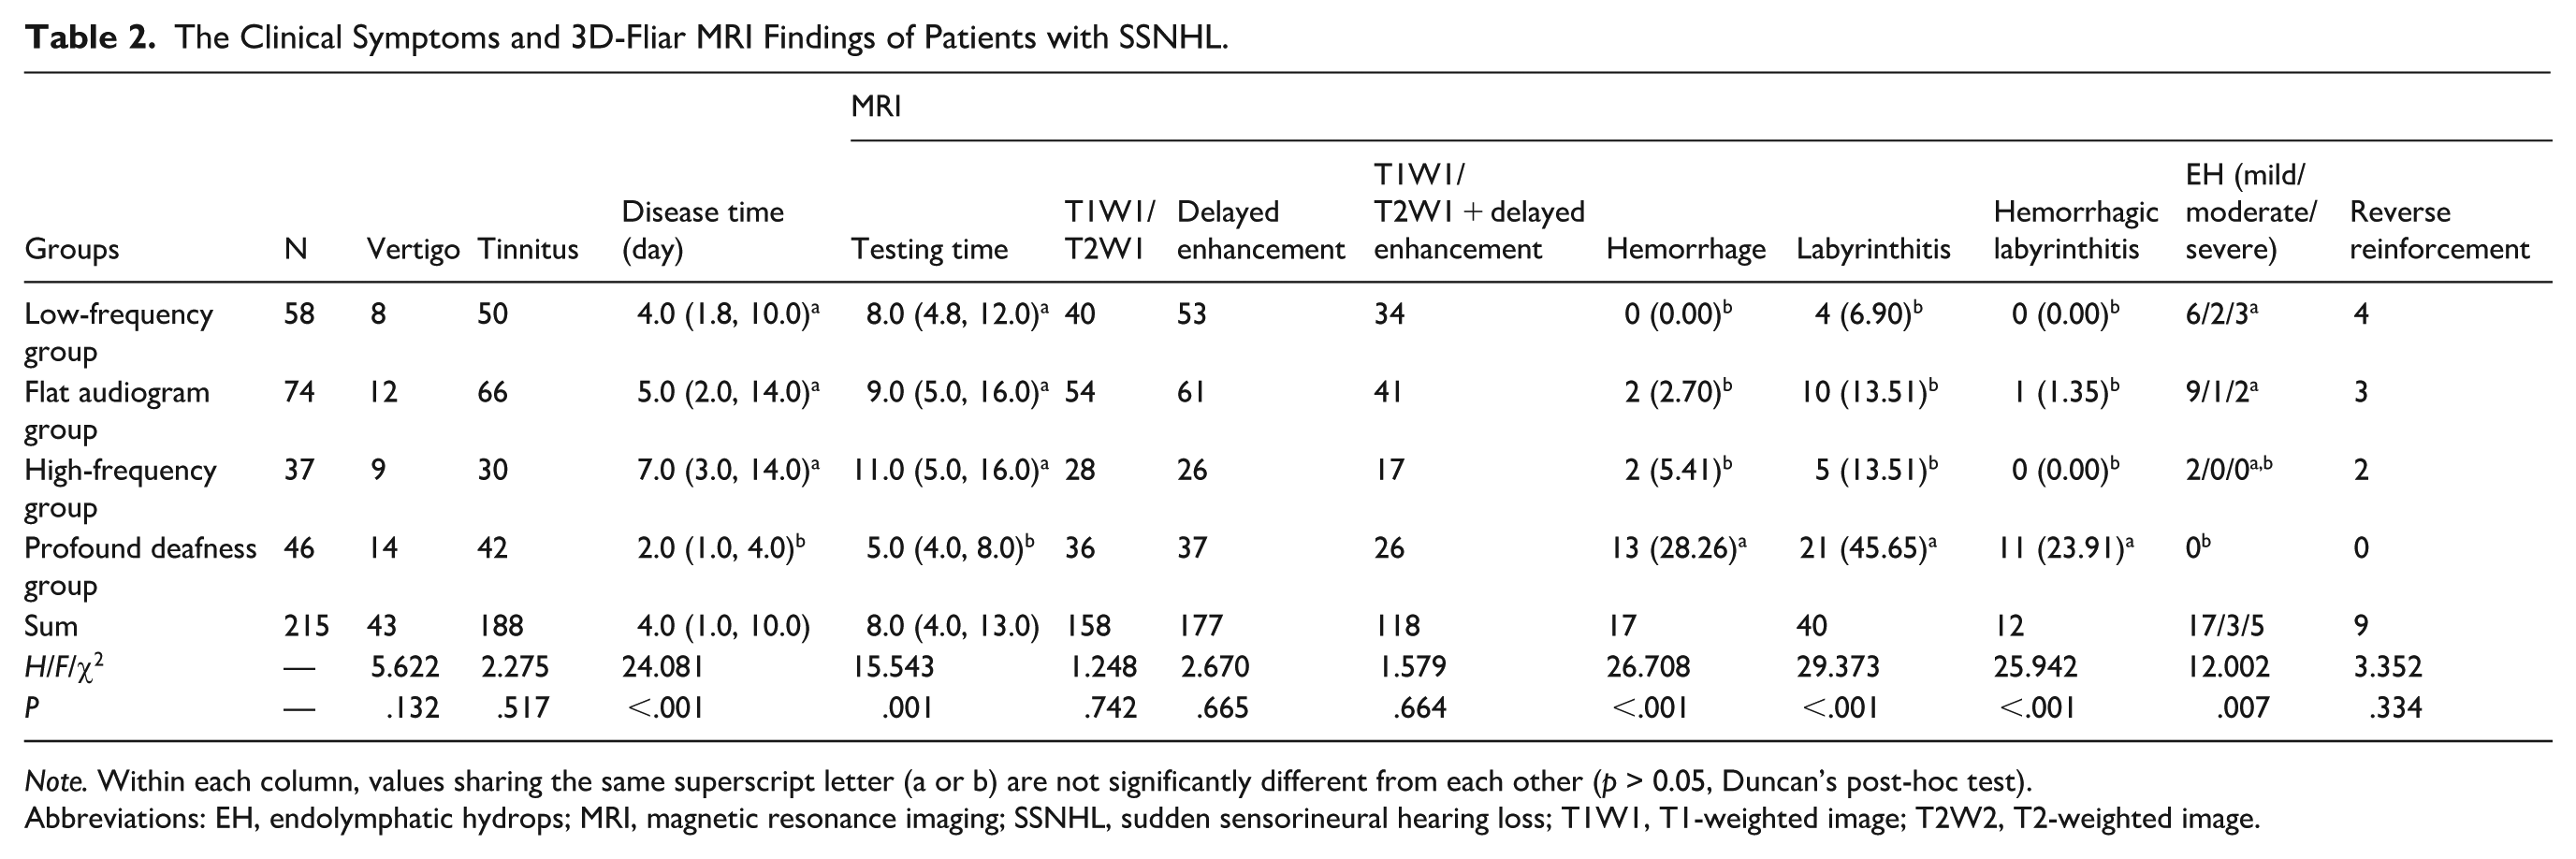
Note. Within each column, values sharing the same superscript letter (a or b) are not significantly different from each other (p > 0.05, Duncan’s post-hoc test).
Abbreviations: EH, endolymphatic hydrops; MRI, magnetic resonance imaging; SSNHL, sudden sensorineural hearing loss; T1W1, T1-weighted image; T2W2, T2-weighted image.
Discussion
The causes of sudden deafness are complex, including viral infections, ototoxic drugs, inner ear blood supply disorders, autoimmune diseases, and noise damage, whether accompanied by dizziness and tinnitus or not. Low-frequency SSNHL is considered to be associated with EH, while severe deafness may be commonly associated with vascular blockages or viral infections. The otologist can assess the condition of the SSNHL patient by audiological examination, balance function examination, and temporal bone computed tomography, but the pathological process in the inner ear is still difficult to observe, such as changes in microvascular permeability and ion channels, abnormalities in BLB, oxidative stress injuries, and EH. Fortunately, we have a window to look into the inner ear with the development of delayed-enhanced 3D-FLAIR MR techniques.3,6,11 -12
In the T1WI sequence, fat, protein-rich fluids, minerals, and methemoglobin show high signals, while fluids such as endolymph, perilymph, and cerebrospinal fluid exhibit low signals. In the T2WI sequence, both fluid and edema show high signals, whereas bleeding can be high or low depending on the time point. The T1WI sequence is commonly used to detect inner ear bleeding and protein leakage; the T2WI sequence can show the continuity and morphological abnormalities of inner and outer lymph fluids in the inner ear. The commonly used enhanced 3D-FLAIR sequence for delayed scan (3-dimensional fluid-attenuated inversion recovery) eliminates simple fluid signals using inversion pulses, improving spatial resolution, and visualizing subtle changes in inner ear fluid associated with various diseases related to abnormalities of the BLB or changes in microvascular permeability. This technique compensates for the limitations of conventional MRI in displaying structural and compositional changes in the membranous labyrinth, playing an irreplaceable role in etiological inference.
In 2007, Nakashima et al applied the enhanced delayed 3D-FLAIR scan technique to image the inner ear labyrinth in patients with Meniere’s disease. 3 The apical endolymphatic membrane is 4 times wider than the basal endolymphatic membrane and has a 200-fold increase in flexibility. Therefore, once cochlea EH occurs, the apical expansion is most pronounced; Yu et al analyzed patients with EH who underwent gadolinium-enhanced magnetic resonance imaging and found that EH primarily affects the vestibule, often presenting as morphological abnormalities, which has the largest capacity and the largest space for external lymph without bony interferences. 13 Therefore, comparing the spherical and oval vesicles in the vestibule allows good observation of the EH state. If the patient undergoes one more scan, heavily T2-weighted-3D-FLAIR with different inversion time fusion display endolymph low signal and perilymphatic bone gray signal more clearly, this can detect EH that are difficult to find with conventional 3D-FLAIR sequences.
Gadodiamide, an ionic macrolide, exhibits better kinetic and thermodynamic stability compared to conventional linear gadolinium contrast agents. It can help assess the permeability of the BLB by observing the signal intensity of the external lymph after enhancement. It appears as a high labyrinthine signal in the T1WI sequence if there is bleeding or protein exudation. In the labyrinth of a single-sided patient with SSNHL, there is natural contrast between the 2 ears, enhanced delayed 3D-FLAIR MRI is very sensitive to change in microvascular permeability of BLB. If it shows high signals in the labyrinth in both the T1W1 and enhanced delayed 3D-FLAIR sequence, it is considered exudative labyrinthitis with hemorrhage or a large amount of protein leaked out. If it shows high signals only in the T1W1 sequence, it is considered hemorrhage.
The labyrinthine artery enters the labyrinth and branches into the cochlea, vestibule, and semicircular canals for blood supply. Damage to the membranous labyrinthine artery can lead to impaired ion exchange functions in the endolymphatic sac and the stria vascularis, leading to pathological changes such as EH.14,15 Temporary blood supply impairment can easily damage the vestibular hair cell and lead to vertigo. The horizontal and semicircular canals are more affected than the posterior semicircular canal, the inferior vestibular nerve, possibly due to terminal arterial branches and narrow bony passages of the anterior vestibular organs.16,17 Recent transmission electron microscopy analysis of normal human ventricular interstitial capillaries has revealed differential ultrastructural pathological changes in Meniere’s disease specimens, suggesting that alteration of the blood-labyrinth barrier permeability may be one of the main causes of endolymphatic effusion in Meniere’s disease. 15 . It can cause vertigo symptoms due both to indirect blood supply obstruction (EH) and direct blood supply impairment to vestibular organs. In this study, there were no significant differences in the incidence of vertigo between different groups of hearing loss SSNHL groups; in the low frequency group, vertigo may be caused by EH, while in the profound deafness group, it is more likely due to direct damage to the blood supply of the inner ear and hair cell injury.
In the early stage of labyrinthitis, like inflammation in other tissues, it can cause mild edema or bloody exudation. Transudate has few cellular components and is clear and transparent, with a protein content generally <25 g/L; the exudate has more cellular components, is turbid, and the protein content is usually greater than 30 g/L, often accompanied by red blood cell leakage. The hemorrhage in the inner ear was found to lead to the formation of blood accumulation and fibrous reticular structures, as well as corresponding hair cell damage in animal experimental study. 18 As the condition progresses, it can also manifest itself as swelling of the soft tissue and the formation of granulation tissue; T1WI shows a slightly higher signal, with significant enhancement after contrast administration. 19 When tissue fibrosis and labyrinth ossification can occur, negative T2W1 imaging or ossification imaging of the cochlea and semicircular canals.
This study found that the prevalence of hypertension and diabetes in the profound deafness group was significantly higher than in the low-frequency group. Hemorrhagic labyrinthitis accounted for 23.91% in the profound deafness group, while in the other 3 groups, only 1 case was found in the flat audiogram group. Systemic vascular endothelial injury and fluctuations in blood pressure can lead to disorders in the blood supply of the inner ear. This etiology may be more prominent in the profound deafness group of SSNHL. Labyrinthitis after viral infection is similar to an excessive inflammatory response after labyrinth vascular occlusion, often presenting as severe or total deafness. We found that 45.65% of the profound deafness group had labyrinthitis, 23.91% had labyrinthitis with inner ear hemorrhage, and 28.26% had inner ear hemorrhage, totaling 97.82% (Figures 1 and 2). This result is significantly higher than the abnormal rates in the other 3 groups, with an MRI abnormality rate of 33.43% in the flat audiogram group, including 13.51% with labyrinthitis; and 18.97%, of which 13.51% were labyrinthitis. In fact, it is difficult to establish the relationship between EH and BLB damage, as well as the pathological state of labyrinthine enhancement.
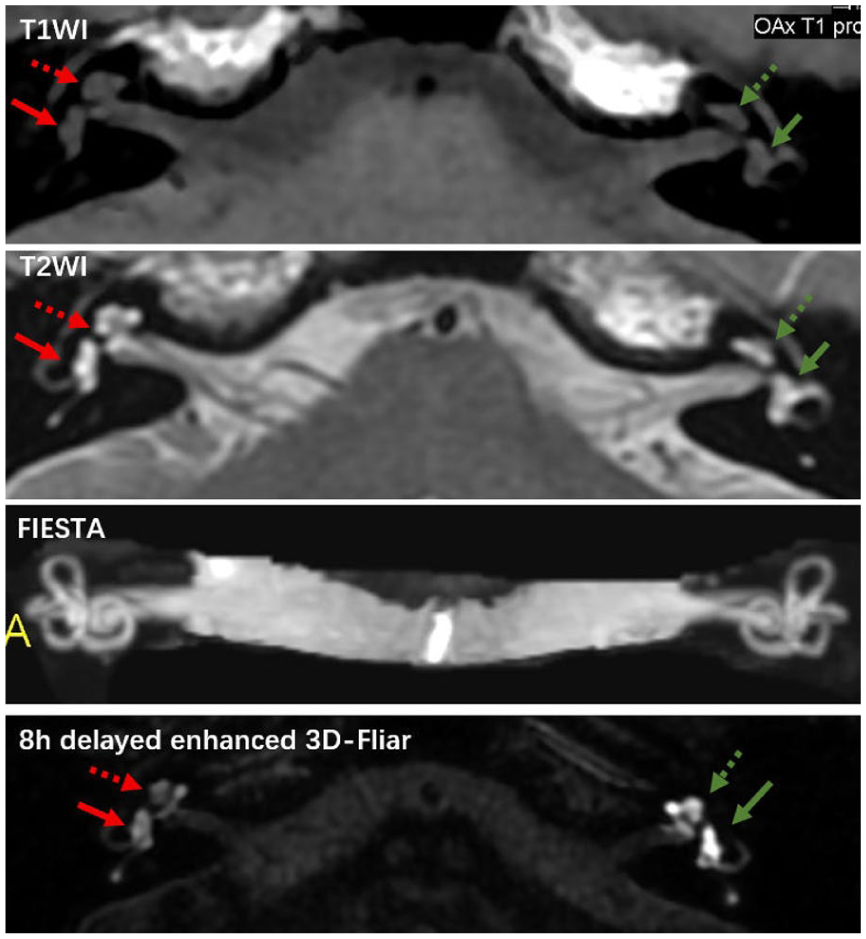
T1W1/T2W1 scan and delayed enhanced 3D-Fliar MR imaging of SSNHL with labyrinthitis. Cochlea: hollow arrow. Vestibule: solid arrow. MRI, magnetic resonance imaging; SSNHL, sudden sensorineural hearing loss; T1W1, T1 weighted image; T2W2, T2 weighted image.
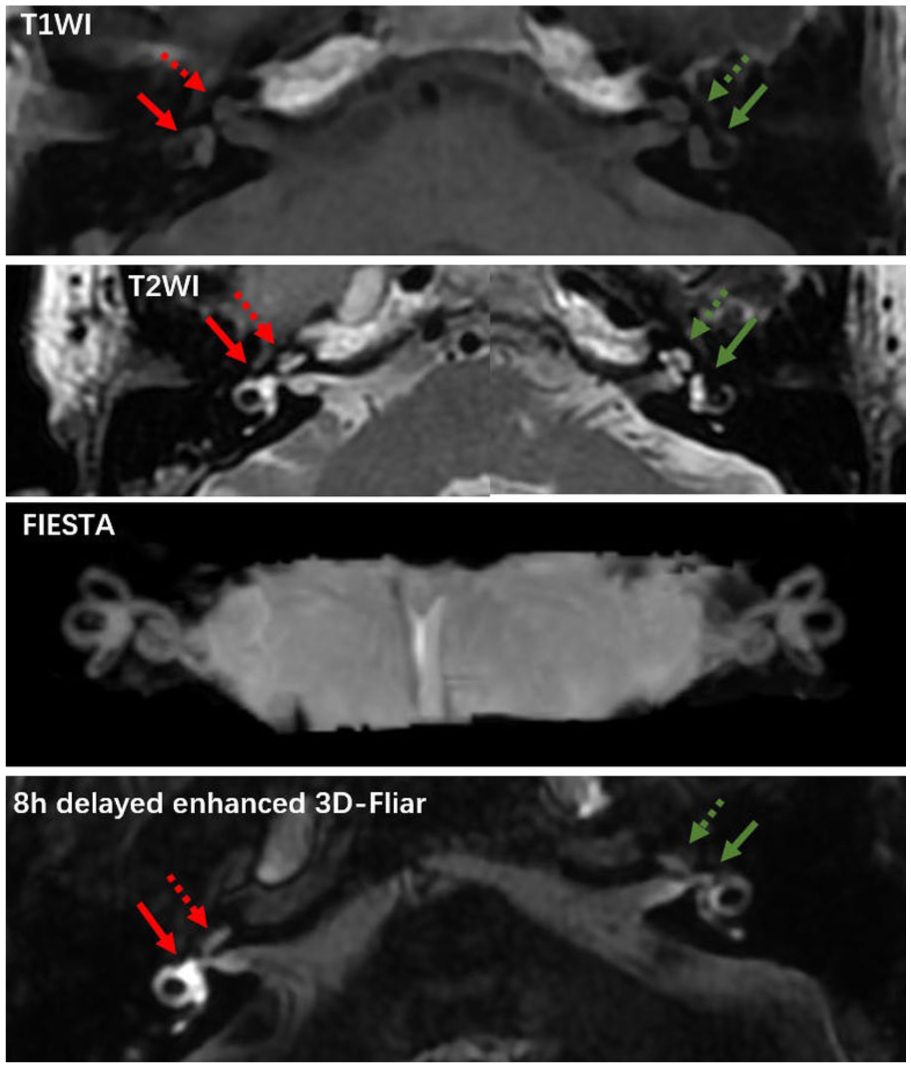
T1W1/T2W1 scan and delayed enhanced 3D-Fliar MR imaging of SSNHL. with hemorrhagic labyrinthitis, Cochlea: hollow arrow. Vestibule: solid arrow. MRI, magnetic resonance imaging; SSNHL, sudden sensorineural hearing loss; T1W1, T1-weighted image; T2W2, T2-weighted image.
The previous study shows that EH and perilymphatic enhancement (PE) were present in 137 (91.9%) and 122 (81.9%) ears with definite Ménière disease ears. 6 The results of combined EH + PE observation are very interesting in SSNHL as well. In the low frequency group, EH (19.0%) was the primary manifestation, with a labyrinthitis incidence of 6.9%, and the clinical prognosis was also the best. Inner ear diseases characterized by EH often have chronic and recurrent features, such as Ménière disease and recurrent low-frequency hearing loss, which can be self-cured by the body; however, those manifested primarily by labyrinthitis on imaging, especially patients with labyrinthitis accompanied by hemorrhage, have extremely poor prognoses. Theoretically, when the contrast agent enters the inner ear, the blood-endolymph barrier is damaged, leading to enhanced visualization with a signal increase of the dynamic enhancement curve, eventually reaching a plateau before weakening. High-intensity signals have been reported to disappear within 90 to 150 days after an episode of idiopathic SSNHL. 20 However, due to irreversible damage to hair cell function caused by labyrinthitis, hearing cannot return to normal.
In summary, inflammatory pathological processes may be the common end-stage pathology leading to inner ear damage. The associated BLB injury can manifest as labyrinthitis, hemorrhagic labyrinthitis, inner ear bleeding, and EH, each with distinct imaging characteristics, accompanied by corresponding symptoms such as hearing loss, tinnitus, and vertigo. If EH, inner ear bleeding, or labyrinthitis, and bleeding labyrinthitis represent the severity of the disease, and if these types of pathological conditions may have a certain degree of correlation or continuity, then it becomes possible to estimate the prognosis of the disease from MRI images.
Footnotes
Ethical Considerations
The study protocol was reviewed and approved by the Institutional Review Board of Nanjing Medical University (Grant number YKK22250).
Informed Consent
Written informed consent was obtained from all subjects (patients) in this study.
Author Contributions
The clinical and MR data were collected by Qingyu Zhang and Yating Wang, Jie Huang analyzed all the clinical data.
Funding
The authors disclosed receipt of the following financial support for the research, authorship, and/or publication of this article: Project supported by Nanjing Medical Science and Technology Development Fund (2022).
Declaration of Conflicting Interests
The authors declared no potential conflicts of interest with respect to the research, authorship, and/or publication of this article.
Data Availability Statement
The data used to support the findings of this study are available from the corresponding author upon request.