
Abstract
Introduction
The use of mobile phones, one of the telecommunication systems, is increasing every day in the world. Mobile phones operate with radiofrequency waves (450-900 MHz analog and 1.8-2.2 GHz digital systems), a non-ionized electromagnetic radiation. 1 Mobile phones remain very close to the user’s parotid gland, inner ear, cochlear nerve, and the brain’s temporal lobe during use. The parotid gland is the largest salivary gland in the body and is located 4 to 10 mm under the skin, just in front of the ear. Depending on its location, the parotid gland is the tissue closest to and in contact with the mobile phone. 1
Since electromagnetic radiofrequency waves, which are nonionizing radiation, have low energy, they cannot directly destabilize electrons or break DNA bonds in the body like X-rays or gamma radiation. However, RF waves are known to have thermal, electrical, and chemical effects on cells.2-4
In this study, biochemical, histopathological, and immunohistochemical methods investigated the effects of an 1800-MHz electromagnetic field created by a generator on the parotid gland in rats.
Materials and Methods
Ethical Approval
The Animal Ethics Committee of Recep Tayyip Erdoğan University Faculty of Medicine approved the study protocol (protocol number 2015/40).
Animals and Study Protocol
Twenty-one 3- to 5-month-old male Sprague–Dawley Albino rats (250-350 g) were obtained from the experimental animal center of our institution. Rats were cared for in an environment with 50% to 55% relative humidity between 21°C and 23°C, in a 12-hour light and dark cycle, and were given free food and water as much as they wanted. Animals were always treated according to the criteria set out in the Declaration of Helsinki.
This study used a generator (Anritsu MG3670 B type, Japan) that produces microwave radiation at 1800 MHz radiofrequency to create exposure in mobile communion. The generator peak power was fixed at 2 W during exposure. In the digital signal generator used in this study, the carrier frequency was 1800 MHz, the modulation frequency was 217 Hz, there was a pulse of 577 µseconds, and the maximum peak power was 2 W. The average specific absorption rate (SAR) of the whole body was 0.117 W/kg. The study was carried out on a total of 21 rats divided in 3 groups (n = 7).
Groups 1, 2, and 3 were exposed to microwave radiation for 0 (control group), 6, and 12 hours, respectively. A generator with an external antenna was placed in the lower middle part of the cages. 5 The rats in the study group were exposed to microwave radiation for the specified hours in the mobile phone conversation mode. At the end of 30 days, blood was taken from the rats.
Rats were anesthetized by intraperitoneal injection of 50 mg/kg ketamine hydrochloride and 10 mg/kg xylazine HCl (Alfamine®, Alfazyne®; Alfasan International BV, Woerden, Holland). The rats were then sacrificed by intracardiac blood collection. The parotid gland was excised with an incision and dissection appropriate to the region. Specimens were prepared for histopathological study.
Histological Analysis
Parotid gland tissues taken from rats of all the groups were assigned code numbers and were placed in bottles containing 10% neutral formaldehyde. After 72 hours, the following procedures were carried out with these tissues: dehydrating in a series of alcohols with increasing concentrations, clearing in a series of xylenes, immersing in liquid paraffin, and placing in paraffin blocks. Using a microtome (Leica RM2125RT, Nussloch, Germany), four 5-μm thick sections were made at 50 μm intervals from paraffin blocks created separately for each rat.
After deparaffinization, the obtained sections were washed with water and stained with hematoxylin and eosin (H&E). The covered sections were then photographed with a camera attached to a light microscope (Nikon Eclipse E600, Japan). The same lighting system was maintained for the photographing process to ensure bias-free evaluation, especially for histochemical analysis.
TUNEL Painting
Sections prepared for immunohistochemical staining were left in xylene twice for 10 minutes each. The sections were then passed through an alcohol series at 70% to 99% concentrations for 5 minutes each and kept in a 3% H2O2 solution for 10 minutes. Sections washed with phosphate-buffered saline (PBS) solution were heated in citrate-buffered solution at 800 W for 4 to 5 minutes and left in a secondary blocking agent for 20 minutes. Using the TUNEL primary antibody (Apoptosis Detection Set, ab2063861/150 dilution ratio) and the biotinylated secondary antibody (Universal LSAB Kit-K0690; DAKO), the sections were incubated with primary antibodies for 60 minutes at room temperature (22°C-24°C). The horseradish was then incubated with streptavidin (Streptavidin-Horseradish Peroxidase; Universal LSAB Kit-K0690, DAKO) added to peroxidase. Diaminobenzidine solution was used as chromogen. Counterstaining was performed by keeping it in Mayer’s hematoxylin for 3 to 5 minutes. PBS solution was used as a negative control. The sections that underwent this process were coated with Entellan (Code 107960; Merck, Darmstadt, Germany).
Semiquantitative Analysis
Histopathological and histochemical examinations were performed using a light microscope. Sections of each rat were scored and graded by semiquantitative analysis. Each section randomly selected 5 microscopic regions of approximately 100 μm2. TUNEL-positive acini cells were counted with an ×20 objective. The median of histopathological evaluations was semi-quantitatively ranked. Scoring: Labeled as none = −(0), mild = + (1), moderate = ++ (2), severe = +++ (3).
Quantitative Analysis
Stereological Analysis
In this study, the mean value of the serous acinar regions was calculated using a closed polygonal probe, a stereological method. Olympus DP2-BSW (Ver. 2.2; Build 6212, Tokyo, Japan) was used for Version 2.1. This system consisted of a camera connected to a light microscope. Sections stained with H&E were placed on a microscope tray, and the sections and boundaries were determined using this program. Then, serous acini were measured in all groups in 20 selected areas, following the method described by Boyce et al. 6
Histopathological Evaluation With Transmission Electron Microscopy
The parotid gland samples were cut into 1 mm blocks and soaked in 2.5% glutaraldehyde added to 0.1 mol/L of phosphate buffer (pH 7.2). Then, secondary fixation (postfixation) was performed in 1% osmium tetroxide in 0.1 mol/L of phosphate buffer (pH 7.4). Sections were dehydrated in a graded ethanol series and embedded in Epon 812. Ultrathin sections with 40 to 60 nm thickness were placed on 200 mesh copper grids, and double staining was applied on these sections with uranyl acetate and lead citrate. The sections were examined and photographed using a JEOL 1010 transmission electron microscope.
Biochemical Analysis Procedure
Parotid Homogenization
The tissues were washed in PBS and cooled to ice level. All tissue samples were weighed and homogenized in PBS (pH 7.4) for 1 minute. The ratio of tissue weight to homogenization buffer was 1:10. The homogenates were centrifuged at 4500 rpm at 4°C for 20 minutes.
Measurement of the Total Calcium Level
Blood samples to measure the amount of calcium (Ca+2) electrolytes by the standard auto-analysis method (Architect c16000 <Autoanalyzer; Abbott Diagnostics, Waltham, MA, USA) were collected from the left ventricles of the animals.
Measurement of the Total Antioxidant Level
The total antioxidant Status (TAS) of the samples was measured using commercial kits of the Rel Assay brand. The measurement method is based on the principle that all antioxidant molecules in the sample reduce the colored 2,2′-azino-bis(3-ethylbenzothiazoline-6-sulfonic acid), ABTS cationic radical, causing the colored radical to lose its color proportionally to the total concentration of antioxidant molecules. The results were expressed as mmol Trolox equivalent/L. 7
Measurement of the Total Oxidant Level
The total oxidant Status (TOS) of the samples was measured using Rel Assay brand commercial kits. The colorimetric method was used on the basis of the principle that the oxidant molecules in the samples cumulatively oxidize the ferrous ion to the ferric ion. The results were expressed as μmol H2O2 equivalent/L. 8
Statistical Analysis
Statistical analysis of the mean area of serous acini in all groups was performed using SPSS (IBM SPSS Statistics 21.0; IBM Corporation, Somers, NY, USA). Differences between groups were evaluated using one-way analysis of variance (ANOVA) followed by the Tukey Honest Significant Difference (HSD) test. The numerical values of the groups were analyzed, and P < .05 was determined as significant. Values were determined as mean ± standard deviation.
The obtained TUNEL-positive values were compared using “IBM SPSS Statistics 20 (IBM, USA)” program. The Kruskall–Wallis test was used to compare the histopathological examination data. A P-value below .05 was considered to indicate a statistically significant result. The results were tabulated and graphs were created.
Results
Stereological Results
In the analysis of the average area in the acinus region, there was not a significant difference between the Electromagnetic Field (EMF) 6-hour (P = .16) and the EMF 12-hour (P = .953) groups compared to the control group (Table 1 and Figure 1). No difference was seen between the EMF 6-hour and the EMF 12-hour groups (P = .532).
Evaluation of Serous Acini Areas in All Groups.
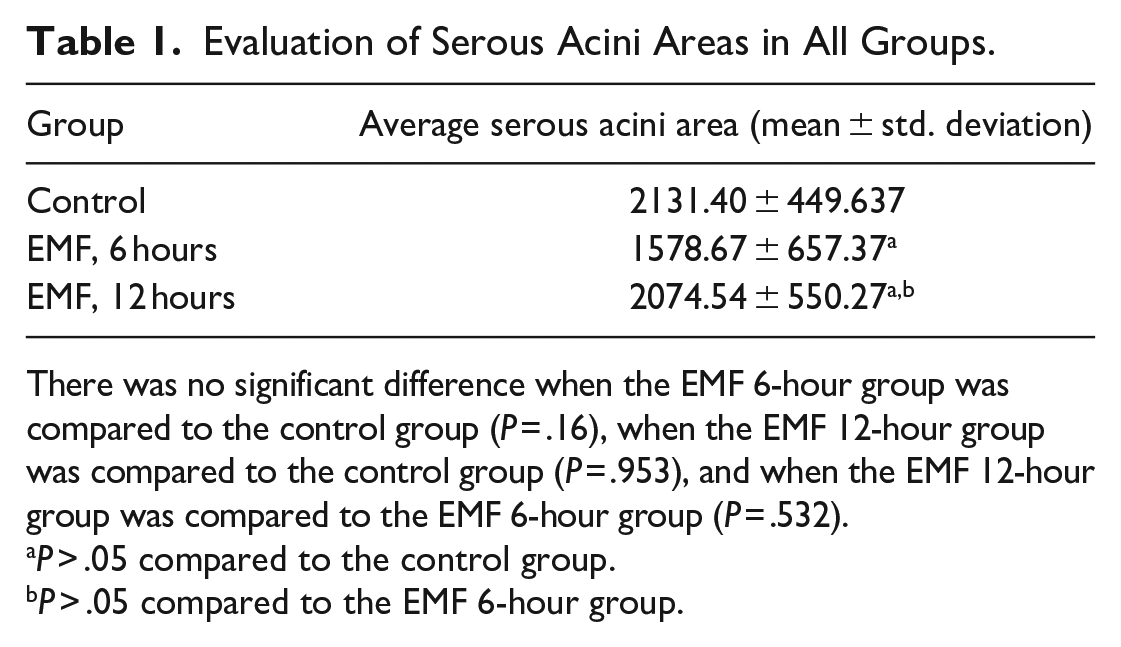
There was no significant difference when the EMF 6-hour group was compared to the control group (P = .16), when the EMF 12-hour group was compared to the control group (P = .953), and when the EMF 12-hour group was compared to the EMF 6-hour group (P = .532).
P ˃ .05 compared to the control group.
P ˃ .05 compared to the EMF 6-hour group.
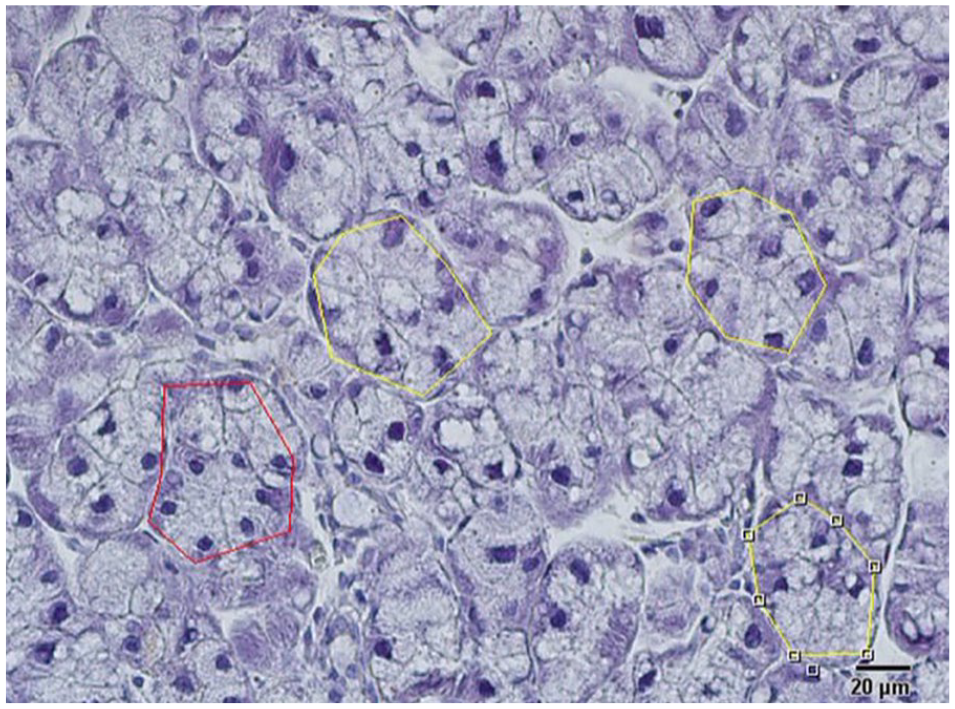
Acinus surface area measurement method.
Histopathological Results Obtained by Light Microscope
The tissue samples taken from the parotid glands of the control group showed normal serous acini, secretory ducts, and connective tissue structures (Figures 1 and 2A and B). In the EMF 6-hour group, intense acini atrophy with irregular edges and darkly stained nuclei was observed. Additionally, neutrophil infiltration in connective tissue was enhanced.
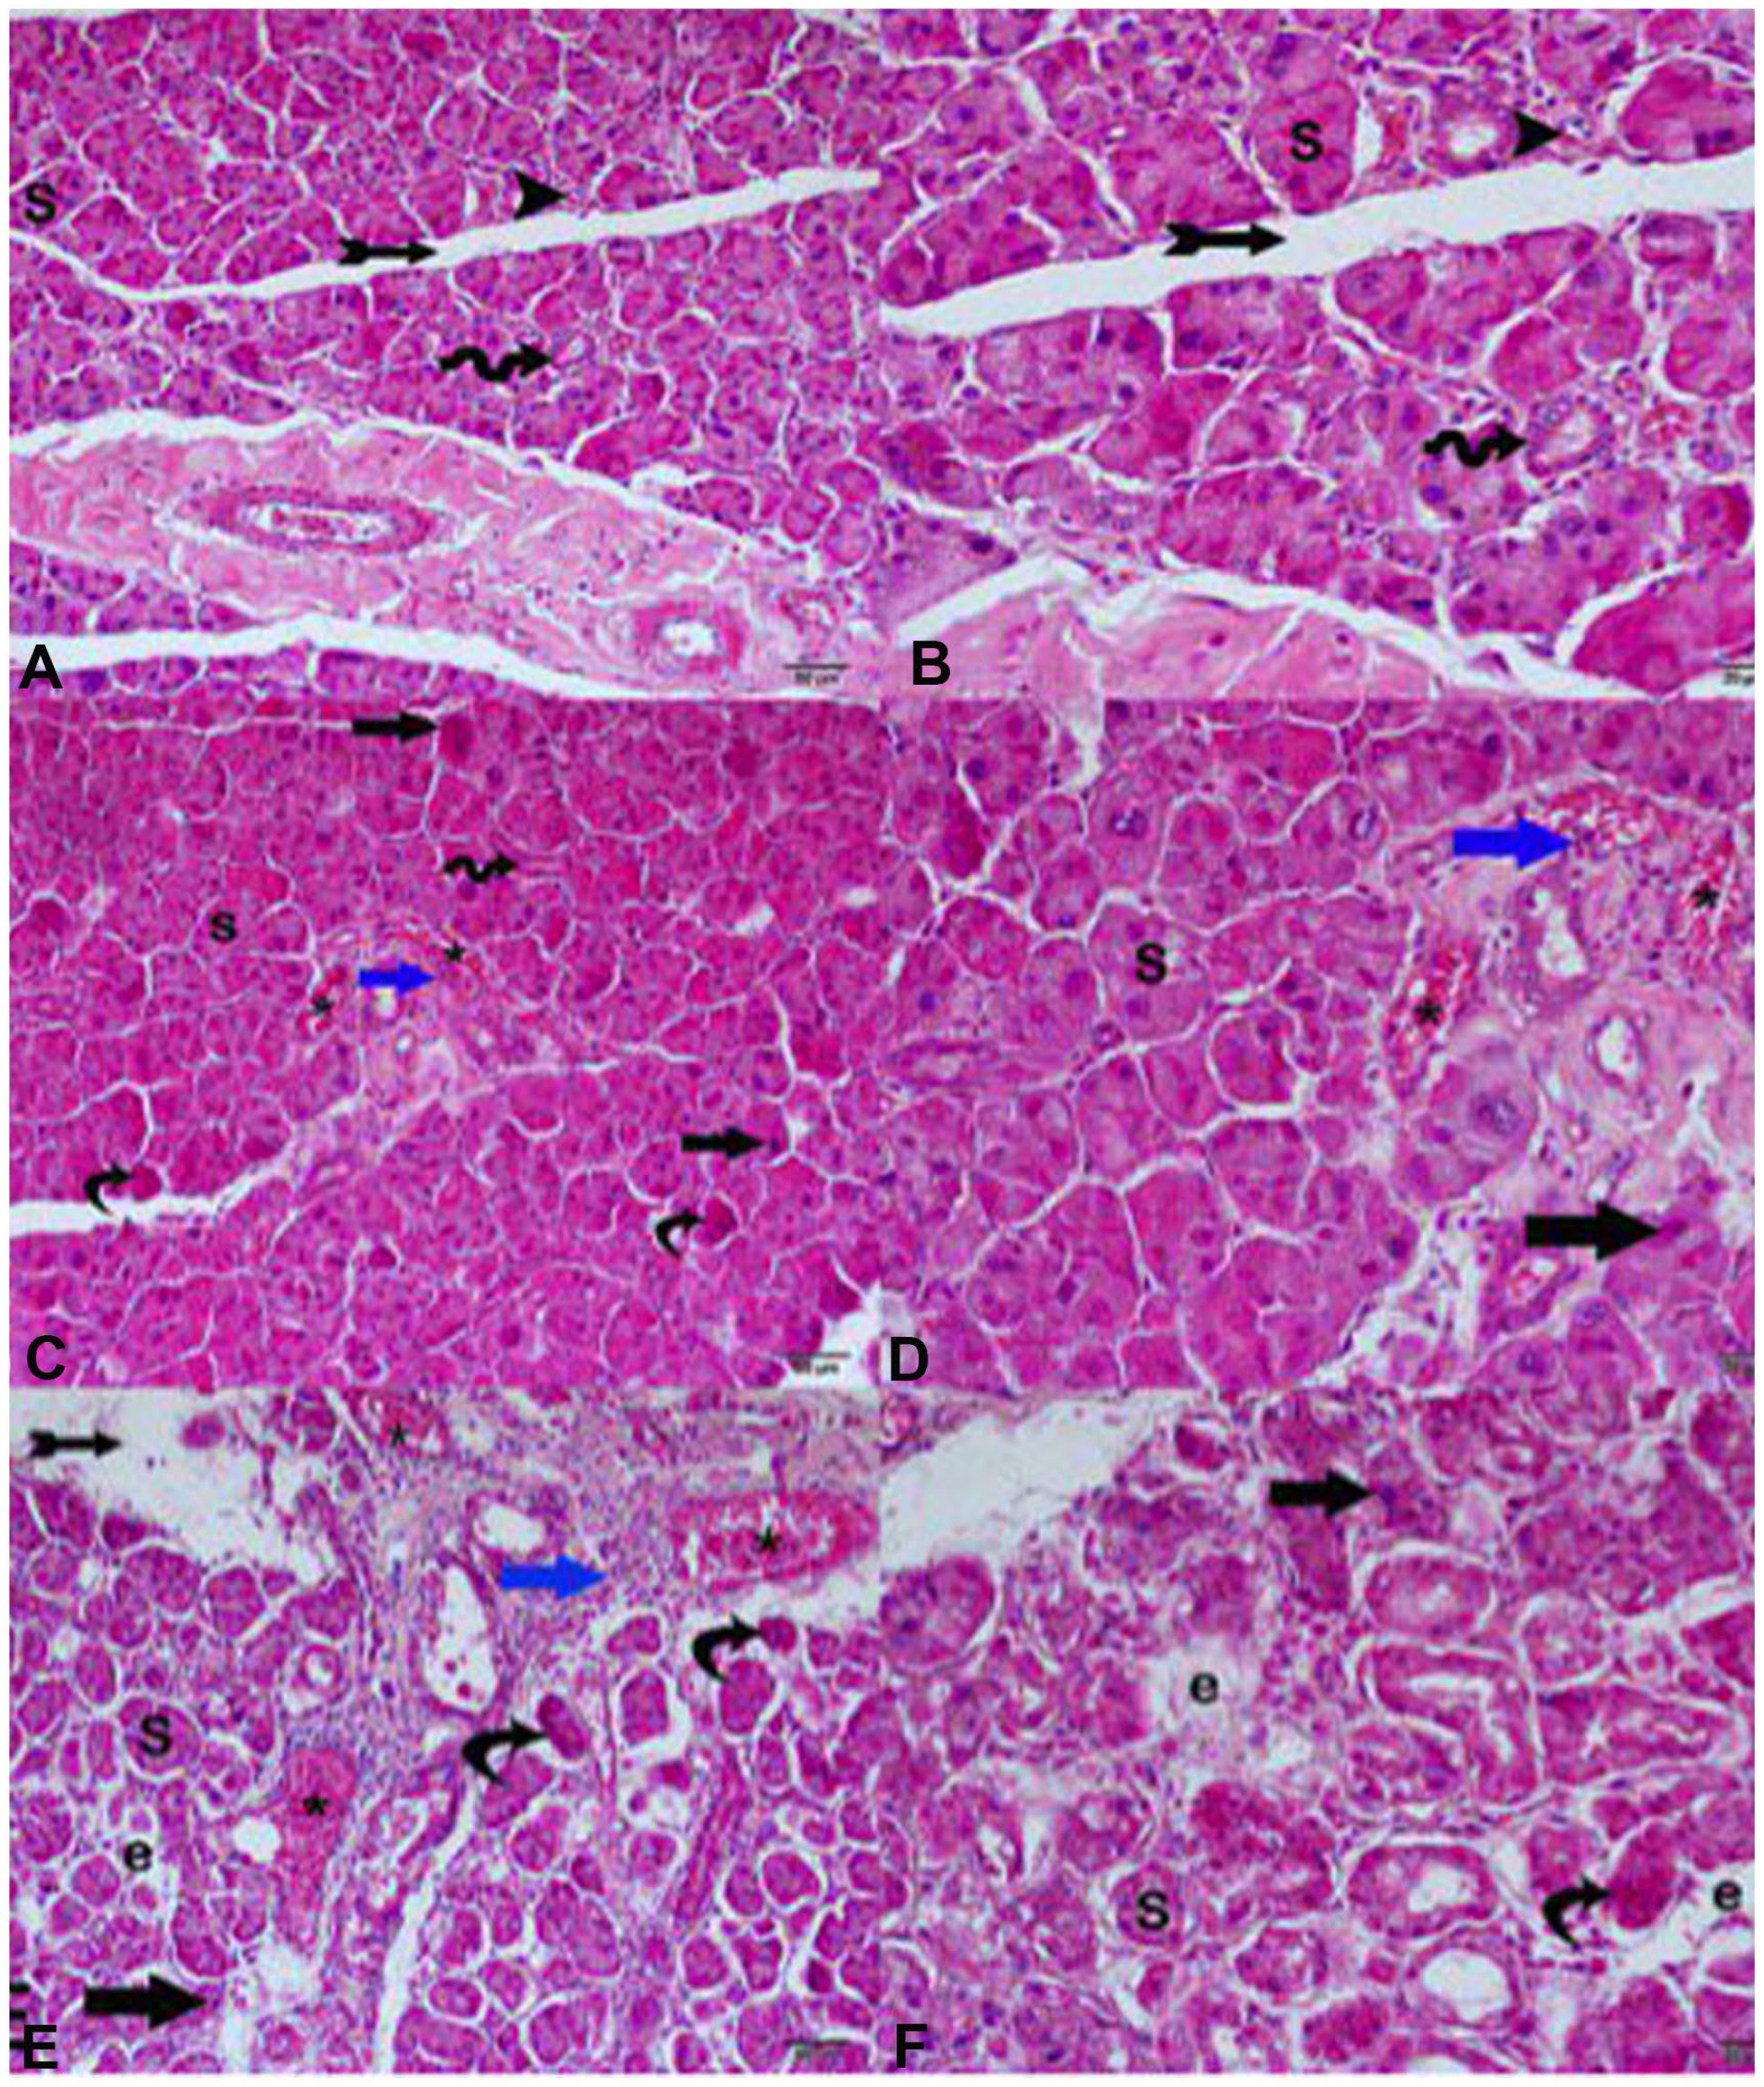
Sectional photographs of the parotid gland stained with H&E. (A, B) Control group: It shows typical parotid tissue structure, serous acini (S), intercalated lumen (arrowhead), thin connective tissue septa (tailed arrow), striated lumen (curved arrow). (C, D) EMF 6-hour group: acini atrophy (curved arrow), irregular outline and dark stained nucleus (arrow), and interstitial inflammatory cell infiltration (blue arrow), illustrating the profound effects of EMF on the parotid gland, dilated congested blood vessels (*). (E, F) EMF 12-hour group: (Curved arrow) acini with irregular outlines and dark-colored nucleus (arrow), interstitial inflammation with an edematous area (blue arrow), (e) dilated congested blood vessels (*). Thin connective tissue septa (tailed arrow). (A, C, and E) ×200. (B, D, and F) ×400. H&E, hematoxylin and eosin.
It was observed to be at the lowest level and was accompanied by complete, dilated (congested) blood vessels (Figure 2C and D). EMF 12 hours. Sections taken from the animals in the group and stained with H&E showed structural changes, inflammation, and capillary fullness in the connective tissue. Microscopically, serous acini cells showed irregularities in parotid gland tissue sections taken from the EMF 12-hour group. The findings obtained in the 12-hour EMF group were similar to the conclusions of the 6-hour EMF group (Figure 2E and F). However, in the 12-hour EMF group, serous acini edema and extensive neutrophil infiltration in connective tissue increased.
Histopathological Results Obtained With TUNEL Staining
The TUNEL label revealed that there was no cell staining in the control group (Figure 3A and B), but there was positive staining in the EMF 6-hour group (Figure 3C and D) and the EMF 12-hour group (Figure 3E and F). TUNEL-positive acinus cells: It was found to be 0.00 ± 0.5 in the control group, 2.5 ± 0.53 in the EMF 6-hour group, and 3 ± 0.35 in the EMF 12-hour group (median ± standard deviation; Table 2 and Figure 3). Compared to the control group, TUNEL-labeled acini cells were observed more frequently in the EMF 1 and 2 groups (P = .001; P < .001; Figure 3). When the EMF 6-hour group was compared with the EMF 12-hour group, the number of TUNEL-positive acini cells was not significantly different (P = .327; Figure 3 and Table 2).
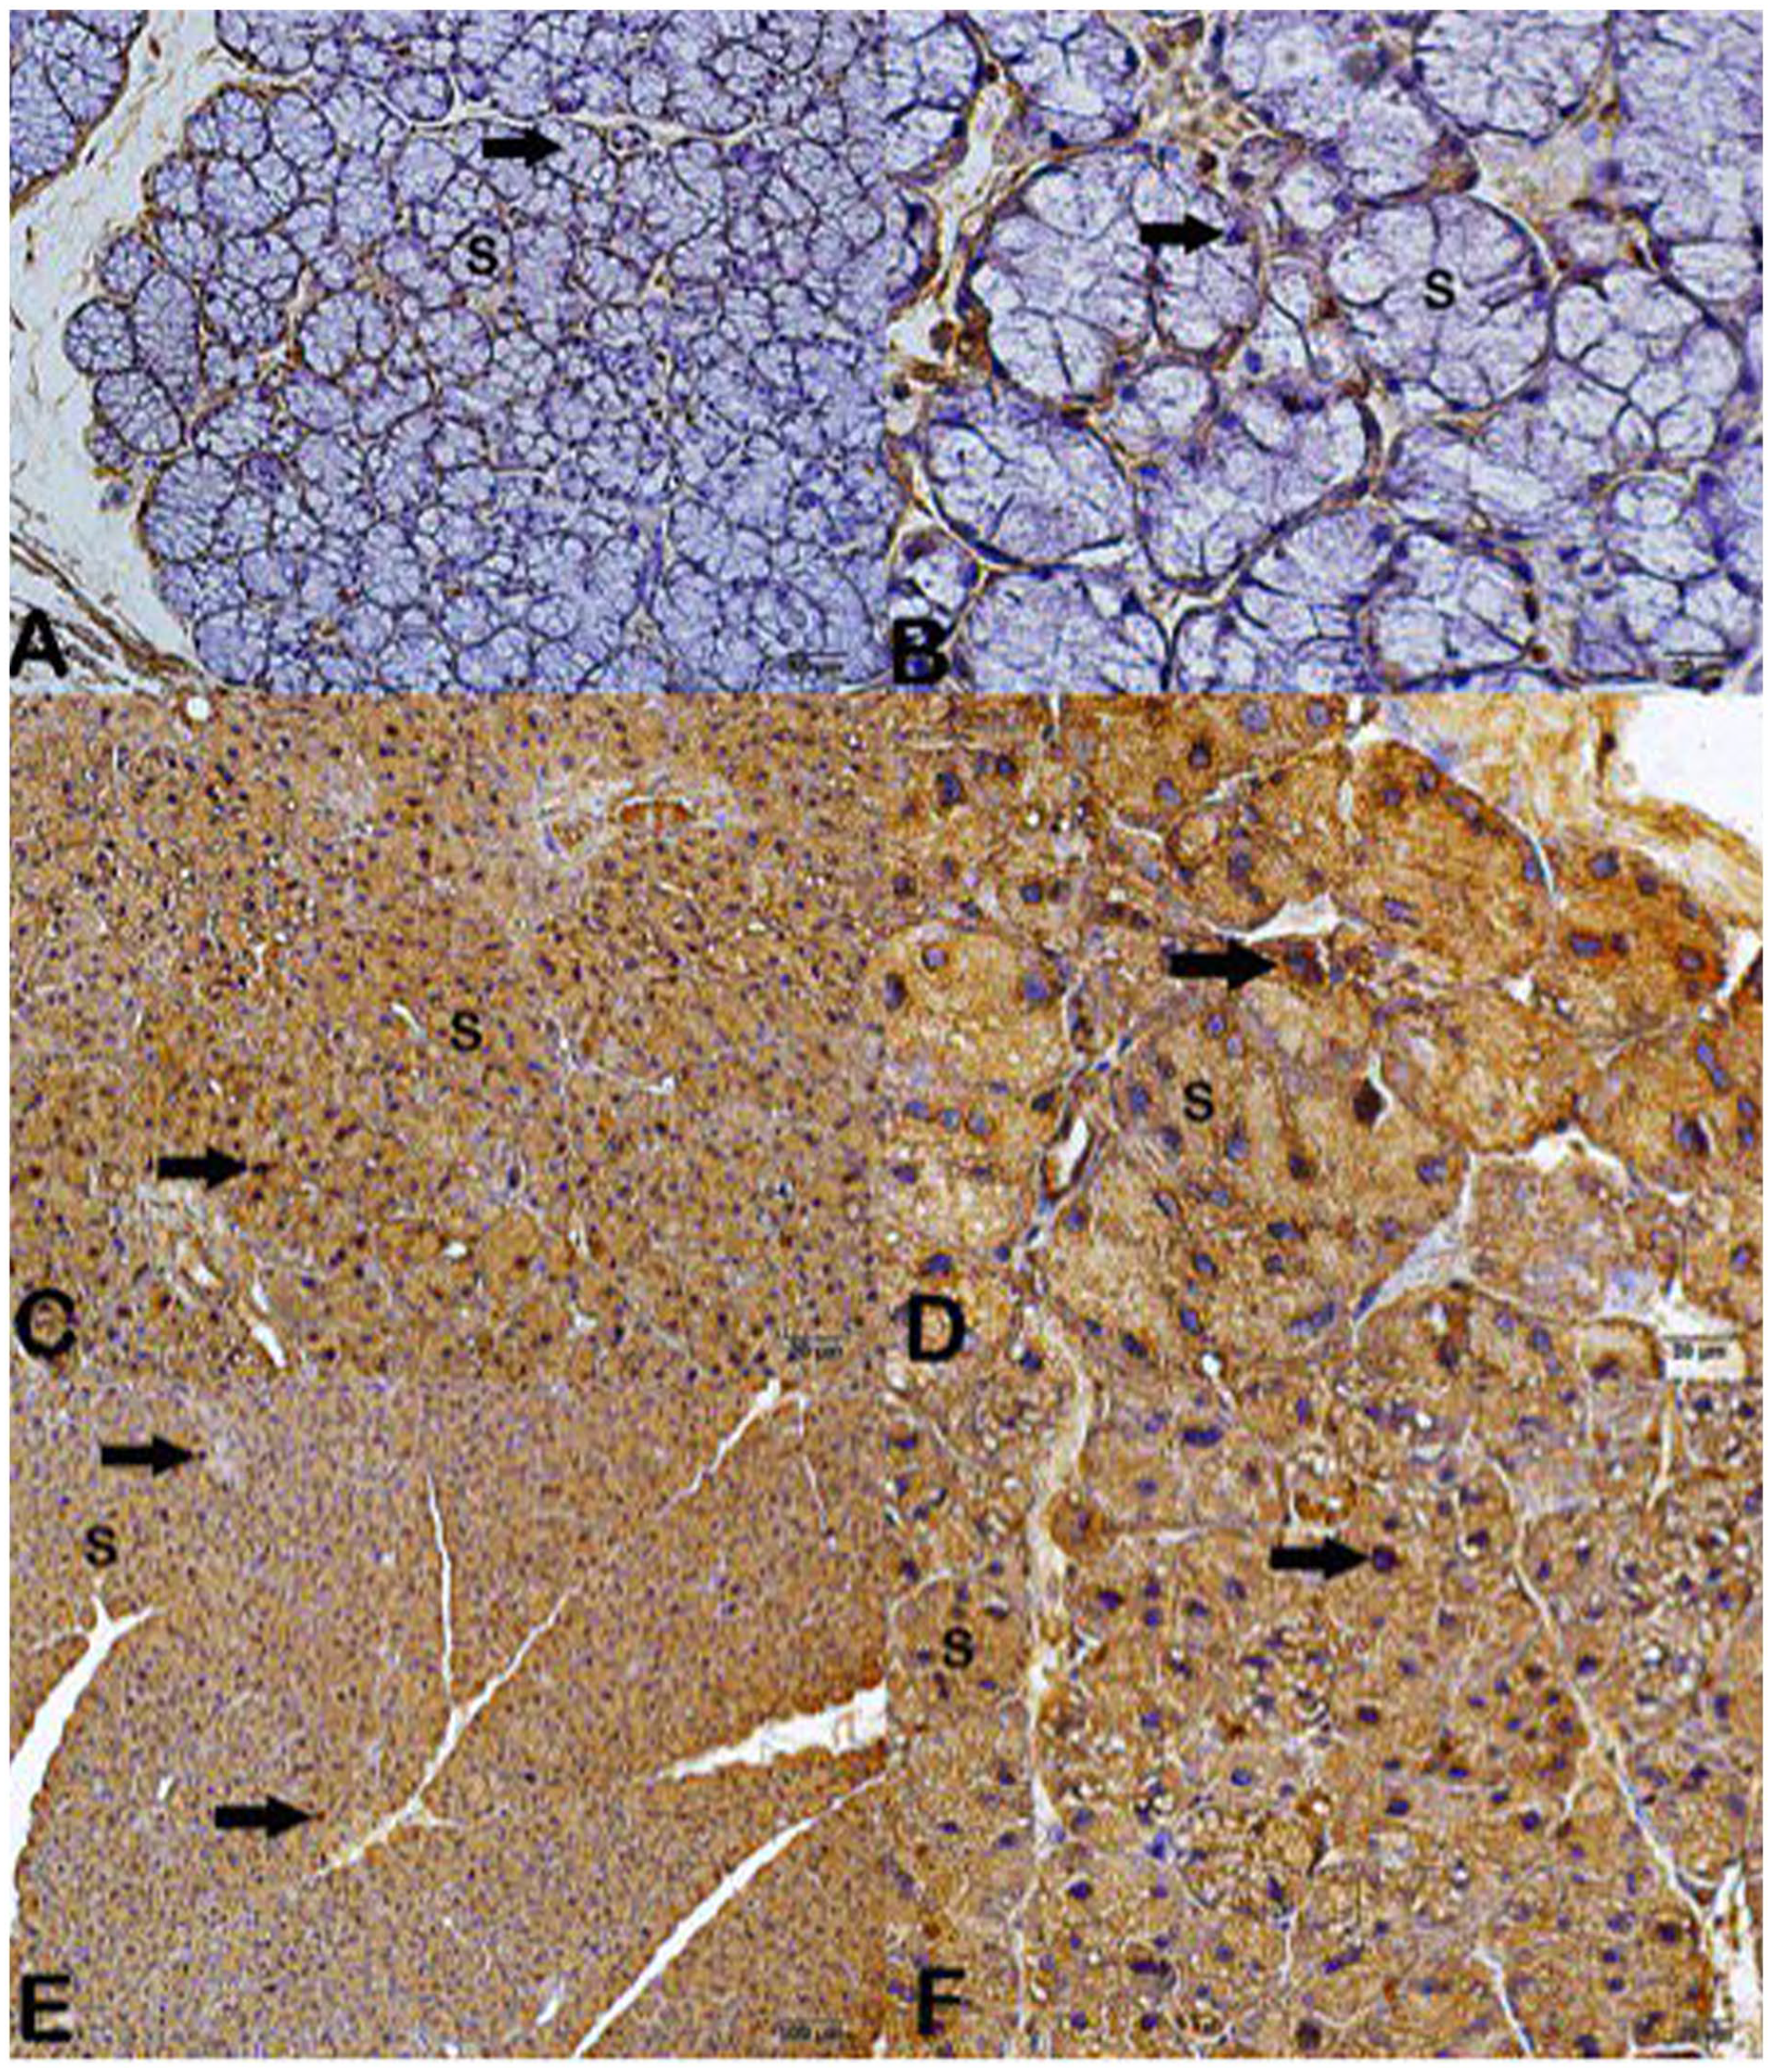
Immunohistochemically stained parotid gland photographs with TUNEL. (A and B) Standard structure of parotid gland cells (control group). (C, D) EMF 6-hour group: TUNEL-positive cells (arrow). (E, F) EMF 12-hour group: TUNEL-positive cells (arrow). (A, C, and E) ×200. (B, D, and F) ×400.
Evaluation of TUNEL Positivity in All Groups.
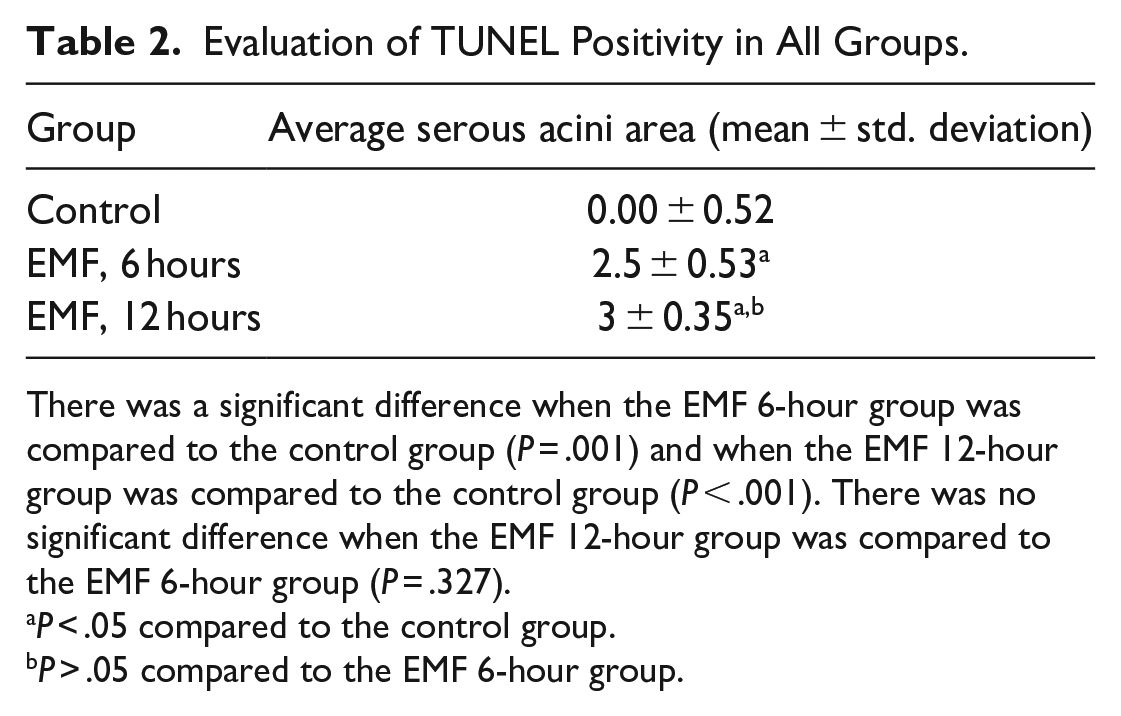
There was a significant difference when the EMF 6-hour group was compared to the control group (P = .001) and when the EMF 12-hour group was compared to the control group (P < .001). There was no significant difference when the EMF 12-hour group was compared to the EMF 6-hour group (P = .327).
P ˂ .05 compared to the control group.
P ˃ .05 compared to the EMF 6-hour group.
Histopathological Results Obtained by Electron Microscope
In the histopathological electron microscopic examination of the parotid tissue of one of the rats in the EMF 12-hour group, inclusion bodies consisting of cytoplasmic fragments containing endoplasmic reticulum were observed within the nucleus (Figure 4). No such change was observed in the nucleus on the electron microscopic examination of the parotid tissue of any of the rats in the control group.
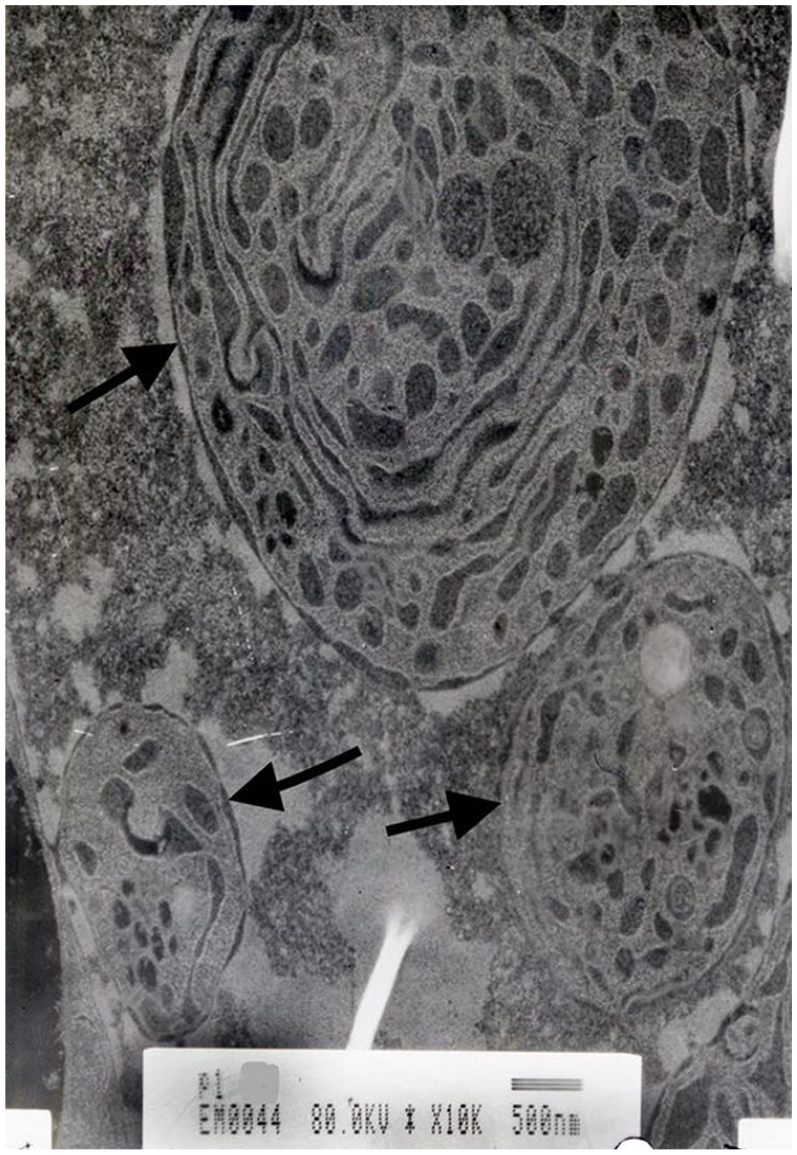
Photograph of the parotid tissue cell nucleus in the transmission electron microscopic image. Inclusion bodies consist of cytoplasm particles containing endoplasmic reticulum in the cell nucleus (black arrow).
Total Calcium Levels
The total calcium levels of the EMF 6-hour and EMF 12-hour groups (9.18 ± 0.1 and 9.32 ± 0.24 mg/dL) were significantly higher than those of the control group (8.85 ± 0.27 mg/dL). It was found that it increased (P = .049, P = .005; Table 3).
TAS and TOS Levels in the Parotid Gland Tissue of the Groups and Ca+2 Levels in the Blood of the Groups.
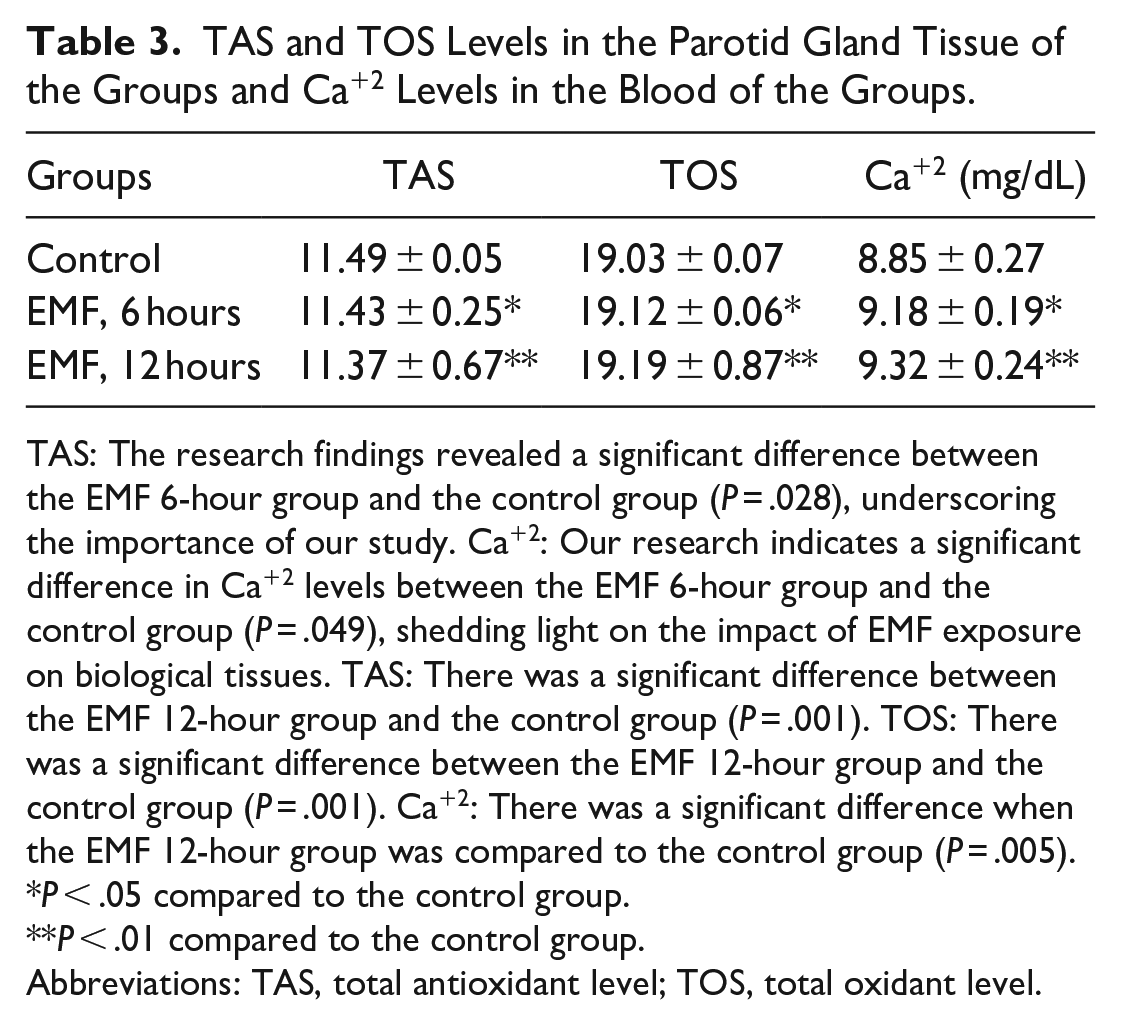
TAS: The research findings revealed a significant difference between the EMF 6-hour group and the control group (P = .028), underscoring the importance of our study. Ca+2: Our research indicates a significant difference in Ca+2 levels between the EMF 6-hour group and the control group (P = .049), shedding light on the impact of EMF exposure on biological tissues. TAS: There was a significant difference between the EMF 12-hour group and the control group (P = .001). TOS: There was a significant difference between the EMF 12-hour group and the control group (P = .001). Ca+2: There was a significant difference when the EMF 12-hour group was compared to the control group (P = .005).
P < .05 compared to the control group.
P < .01 compared to the control group.
Abbreviations: TAS, total antioxidant level; TOS, total oxidant level.
TAS and TOS
The TAS levels of the EMF 6-hour and EMF 12-hour groups (11.43 ± 0.25 and 11.37 ± 0.67) were found to be significantly lower than those of the control group (11.49 ± 0.05; P = .028; P = .001; Table 3).
The TOS of the EMF 6-hour and EMF 12-hour groups (19.12 ± 0.06 and 19.19 ± 0.87) were found to increase significantly compared to the control group (19.03 ± 0.07; P = .026; P = .001; Table 3).
Discussion
This study showed that the 1800 MHz electromagnetic field emitted by mobile phones had many histopathological and biochemical effects on rats’ parotid glands.
Immunohistopathologically, increased degeneration and increased apoptotic index were observed in the parotid tissues of rats exposed to electromagnetic fields for 6 and 12 hours a day. In the biochemical study, decreased TAS, increased TOS, and increased Ca+2 levels were detected in the tissues of the parotid gland of rats.
In histopathological examination of the parotid tissues of the EMF 6- and 12-hour groups, acini atrophy was observed with irregular edges and dark stained nuclei. Neutrophil infiltration was severe in connective tissue and was accompanied by dilated, complete, and complete (congested) blood vessels (Figure 2 C, D). In the 12-hour EMF group, neutrophil infiltration and edema increased slightly among serous acini. In the electron microscopic histopathological study, inclusion bodies consisting of cytoplasm fragments within the nucleus were observed in the parotid tissue of one of the rats in the EMF 12-hour group. It is known that the cell cannot survive without a healthy nucleus, and this has been shown in different studies.9,10 It is reported in the literature that in papillary thyroid cancer tissue samples, cytoplasmic organelles can be seen as inclusion bodies in the nucleus due to the disruption of the nuclear membrane in the cell.11,12 Although the change in the nucleus of parotid cells was observed in a single rat in our study, this is a significant change.
Radiofrequency in the electromagnetic field has been reported to cause changes in biological systems in the radiation rate absorbed by the tissue. 13 The rate at which radiofrequency energy is absorbed into body tissues is called the SAR. SAR is one of the key points regarding the degree to which a tissue is biologically affected by radiation. Different tissues have different SARs in biological systems. 13 In previous studies, a head patch was placed before the ear.
The parotid tissue has been reported to absorb 40% of the electromagnetic energy emitted by mobile phones on phones held in place. This absorbed energy can cause thermal and nonthermal effects in the parotid tissue. 14 Another study has shown that even thermal energy alone can cause structural changes in the submandibular gland and the other salivary glands in rats. 15
Studies are carried out in different tissues on the effects of the electromagnetic field emitted from mobile phones.16-19 However, there are still some points that still remain to be clarified. The electromagnetic field causes an increase in lipid peroxidation in cells, an increase in free radicals, and a decrease in the level of antioxidants.20-22 In our study, consistent with the literature, TAS decreased and TOS increased in parotid tissues of rats exposed to electromagnetic fields. As a marker of cell death and apoptosis, calcium levels in the blood of both groups of rats exposed to an electromagnetic field were higher than in rats not exposed to an electromagnetic field. 23
Conclusion
In light of our knowledge of the literature, this is the first study to investigate the effects of an 1800-MHz electromagnetic field on the parotid gland of rats with biochemical tests, immunohistochemically in light microscopy and histopathologically in electron microscopy. This study observed that an 1800-MHz electromagnetic field causes undesirable adverse histopathological and biochemical effects on the parotid gland of rats. Histopathological and biochemical findings were detected with increasing contact and exposure time. This study will lead other studies on this topic and contribute to the literature in this area.
Footnotes
Author’s Note
The Scientific Research Projects Unit of Recep Tayyip Erdoğan University supported the project and study.
Authors’ Contributions
All authors contributed to the planning, design, literature survey, experiment, and active intellectual support.
Availability of Data and Materials
All data for this study are presented in this paper.
Declaration of Conflicting Interests
The author(s) declared no potential conflicts of interest with respect to the research, authorship, and/or publication of this article.
Funding
The author(s) disclosed receipt of the following financial support for the research, authorship, and/or publication of this article: The Scientific Research Projects Unit of Recep Tayyip Erdoğan University supported the project and study.
Ethical Approval
The Animal Ethics Committee of Recep Tayyip Erdoğan University Faculty of Medicine approved the study protocol (protocol number 2015/40).
Informed Consent
For this study, informed consent is not required.