
Abstract
Keywords
Introduction
Obstructive sleep apnea (OSA) in children refers to a series of pathophysiological changes caused by complete or partial obstruction of the upper airway during sleep that may interfere with children’s normal ventilation and sleep structure. 1 Clinical manifestations of OSA are snoring, apnea, sleep restlessness, and other symptoms. The 2012 American Academy of Pediatrics guidelines state that the prevalence of OSA ranges from 1.2% to 5.7%. 2 The leading cause of upper airway obstruction in children is adenoid and/or tonsil hypertrophy. According to the etiology, adenoidectomy and tonsillectomy is the first recommended treatment for children with OSA. 3 Furthermore, children with long-term uncorrected OSA can develop problems 4 such as growth and development delays, neurocognitive defects, decreased learning ability, cardiovascular disease, endocrine and metabolic disorders, and recurrent respiratory tract infections.
Previous reports have described the effect of OSA on the growth hormone (GH) axis and the increased release of inflammatory markers by chronic hypoxia. 5 However, because of the low number of cases, the correlation between the GH axis and inflammatory factors in children with OSA remains unclear. In addition to adenoid and tonsil hypertrophy, obesity is also an independent risk factor for childhood OSA. Obesity has shown an increasing, country-specific tendency in the last 3 decades. The increasing tendency to obesity leads to a dynamic increase in the prevalence of OSA, which can also be observed in the inflammation and dysfunction of the subcutaneous adipose tissue resulting from intermittent hypoxia. 6 In fact, OSA is highly prevalent among children with obesity, affecting up to 60% of these children. 7 Besides, bronchial asthma is also commonly considered risk factor. 8 There are proposed mechanisms for predisposition to having OSA in asthmatic patients. Asthma is associated with chronic inflammation, which could affect the force generation properties of the respiratory muscles, including the upper airway dilator muscles predisposing patients to have OSA. 9 Asthma associated with type 2 cytokines interleukin-4 (IL-4), IL-5, and IL-13, which promote airway eosinophilia, mucus overproduction, bronchial hyperresponsiveness, and immunoglobulin E synthesis. 10 In our study, we excluded obese children using the diagnostic criteria for obesity in Chinese children. 11 Besides, we asked the parents whether their child has been diagnosed as asthma, and whether the recent disease was combined with acute inflammation. Therefore, the present study was performed to compare the differences in insulin-like growth factor 1 (IGF-1) and inflammatory factors between children without OSA and children with different degrees of OSA after excluding the interference of obesity and asthma. The obstructive apnea hypopnea index (OAHI), minimum oxygen saturation, height, serum IGF-1 level, and 12 cellular inflammatory factors were evaluated in this study. The correlations between GH levels, inflammatory factors, and other indicators associated with OSA in children were also explored.
Materials and Methods
Participants
We prospectively recruited children admitted to the Head and Neck Surgery Department of Beijing Children’s Hospital from October 1, 2021 to April 1, 2022. During this period, 402 children with adenoid and/or tonsil hypertrophy were recruited. The study was approved by the Medical Ethics Committee of Beijing Children’s Hospital (2021-205-Y), and the guardians of all participants provided written informed consent.
The inclusion criteria for the study were (1) an age of 2 to 12 years; (2) symptoms of upper airway obstruction such as mouth breathing, snoring, and breath holding; (3) adenoid and/or tonsil hypertrophy; and (4) the guardian’s agreement to participate in the study and assist in the questionnaire. The exclusion criteria were (1) childhood obesity; (2) previous medical or surgical treatment for OSA; (3) other serious diseases such as asthma bronchiale, craniofacial abnormalities, genetic syndromes (such as Down syndrome), endocrine disorders (such as hypothyroidism), or cardiopulmonary dysfunction; (4) neurological, psychiatric, and sleep disorders such as insomnia, epilepsy, cerebral palsy; and (5) an inability to cooperate with blood collection and polysomnography (PSG) monitoring.
Study Procedure
Physical examination
All patients underwent a routine medical history and physical examination by an otolaryngologist. The patients’ demographic indicators, such as height, weight, age, medical history, and clinical symptoms, were collected using a clinical trial medical record report form. Tonsil size was graded by otolaryngology experts from 0 to +3 according to the standardized score. Adenoid tissue was examined by nasopharyngoscopy, and obstruction was graded on a 4-point scale from 0 (0%-25%) to 3 (75%-100%). Additionally, allergic rhinitis was screened by mixed allergen testing, and its effects on asthma, duration of symptoms, and comorbidities were assessed.
Nocturnal PSG
Standard overnight attended PSG was performed using a Compumedics E-series system (Compumedics, Abbotsford, VIC, Australia), Alice 5 system (Respironics, Murrysville, PA, USA), and SOMNO screen Plus PSG+ V5 system (SOMNO medics GmbH, Rander sacker, Germany). During monitoring, the children were accompanied by one of their parents in the same room. Monitoring lasted >7 hours for each child. The following parameters were measured: 6-channel electroencephalography with bilateral frontal, central, and occipital leads; electrooculography; electromyography with submental electrodes; electrocardiography; airflow measured through the nose via bilateral nasal pressure cannulas and a thermistor; and respiratory effort measured by thoracic and abdominal inductive plethysmography. Oxygen saturation was measured with pulse oximetry via a finger probe. Two technicians and 1 pediatrician interpreted the PSG results. Sleep stages and respiratory events were scored on the basis of the criteria of the 2020 American Academy of Sleep Medicine manual. 12 The OAHI was defined as the average number of obstructive, mixed apnea, and obstructive hypopnea events per hour of total sleep time. The oxygen desaturation index was defined as the average number of oxygen saturation drops of ≥3% per hour. Children with an OAHI of >1 to 5, >5 to 10, and >10 events/hour were defined as having mild, moderate, and severe OSA, respectively.
Assessment of GH levels
Fasting blood samples were collected the day before admission and allowed to clot for 30 minutes after collection. The samples were then centrifuged, and the serum was frozen at −70°C until the experiments were conducted. The serum level of IGF-1 was measured using a commercially available Siemens IGF detection kit (chemiluminescence method) (SIEMENS IMMULITE 2000 XPi automatic chemiluminescence immunoanalyzer; Siemens Healthineers, Erlangen, Germany). Testing was performed after the samples were entirely thawed and restored to room temperature. For each sample, multiple measurements were averaged.
Inflammatory cytokine assessment
All blood samples were collected at 6:00
Statistical Analysis
In the descriptive statistical analysis, data are reported as proportion (%) for categorical variables and as mean (with standard deviation) or median (with interquartile range) for continuous variables, depending on the distribution of values (the Kolmogorov–Smirnov test was employed to assess the normality of the data). A comparative analysis was conducted using one-way analysis of variance and the Kruskal–Wallis test, and pairwise comparisons within the group were assessed using Bonferroni-adjusted P-values. A multiple linear regression for ordinary least squares was applied to investigate the factors affecting IGF-1.
Univariable and multivariable quantile regression analyses were then performed to assess factors associated with IGF-1, particularly variables with significant associations at different IGF-1 quantiles. For quantile regression analysis, the response variable, IGF-1, was defined as the quantile of the concentrations at the measurement time points for each individual patient over the study period. Additionally, quantile regression modeling was chosen because of the non-parametric distribution of the outcome variable relative to covariates, its flexibility in assessing the relationship between blood biochemistry parameters and IGF-1 at the upper and lower tails, and the lack of stringent model assumptions required for valid inference. The 10th, 25th, 50th (median), 75th, and 90th quantiles were selected to describe covariate associations across the range of the distribution of IGF-1. These percentiles corresponded to IGF-1 cutoff values of Q1 = 53 nmol/L, Q2 = 75.1 nmol/L, Q3 = 108 nmol/L, Q4 = 150 nmol/L, and Q5 = 186 nmol/L, respectively, while avoiding the effect of extreme outliers. Bootstrapping was used to calculate the 95% confidence intervals around the estimates. Notably, univariate and multivariate models were constructed separately for each of the selected IGF-1 quantiles to determine if there were differential covariate associations across the distribution. Data analysis was performed using Stata 17.0 (StataCorp, College Station, TX, USA). A P value of <.05 was considered statistically significant.
Results
Patients’ Baseline Characteristics
The data of 402 children were collected. However, the data of 141 children were missing because of COVID-19. Moreover, 35 patients were diagnosed with obesity according to childhood obesity criteria and were hence excluded. Finally, 226 children were included in the study. These patients were divided into 4 subgroups. We analyzed the study indicators among the 4 subgroups, as shown in Table 1.
Comparison of General Characteristics of Children With and Without OSA.
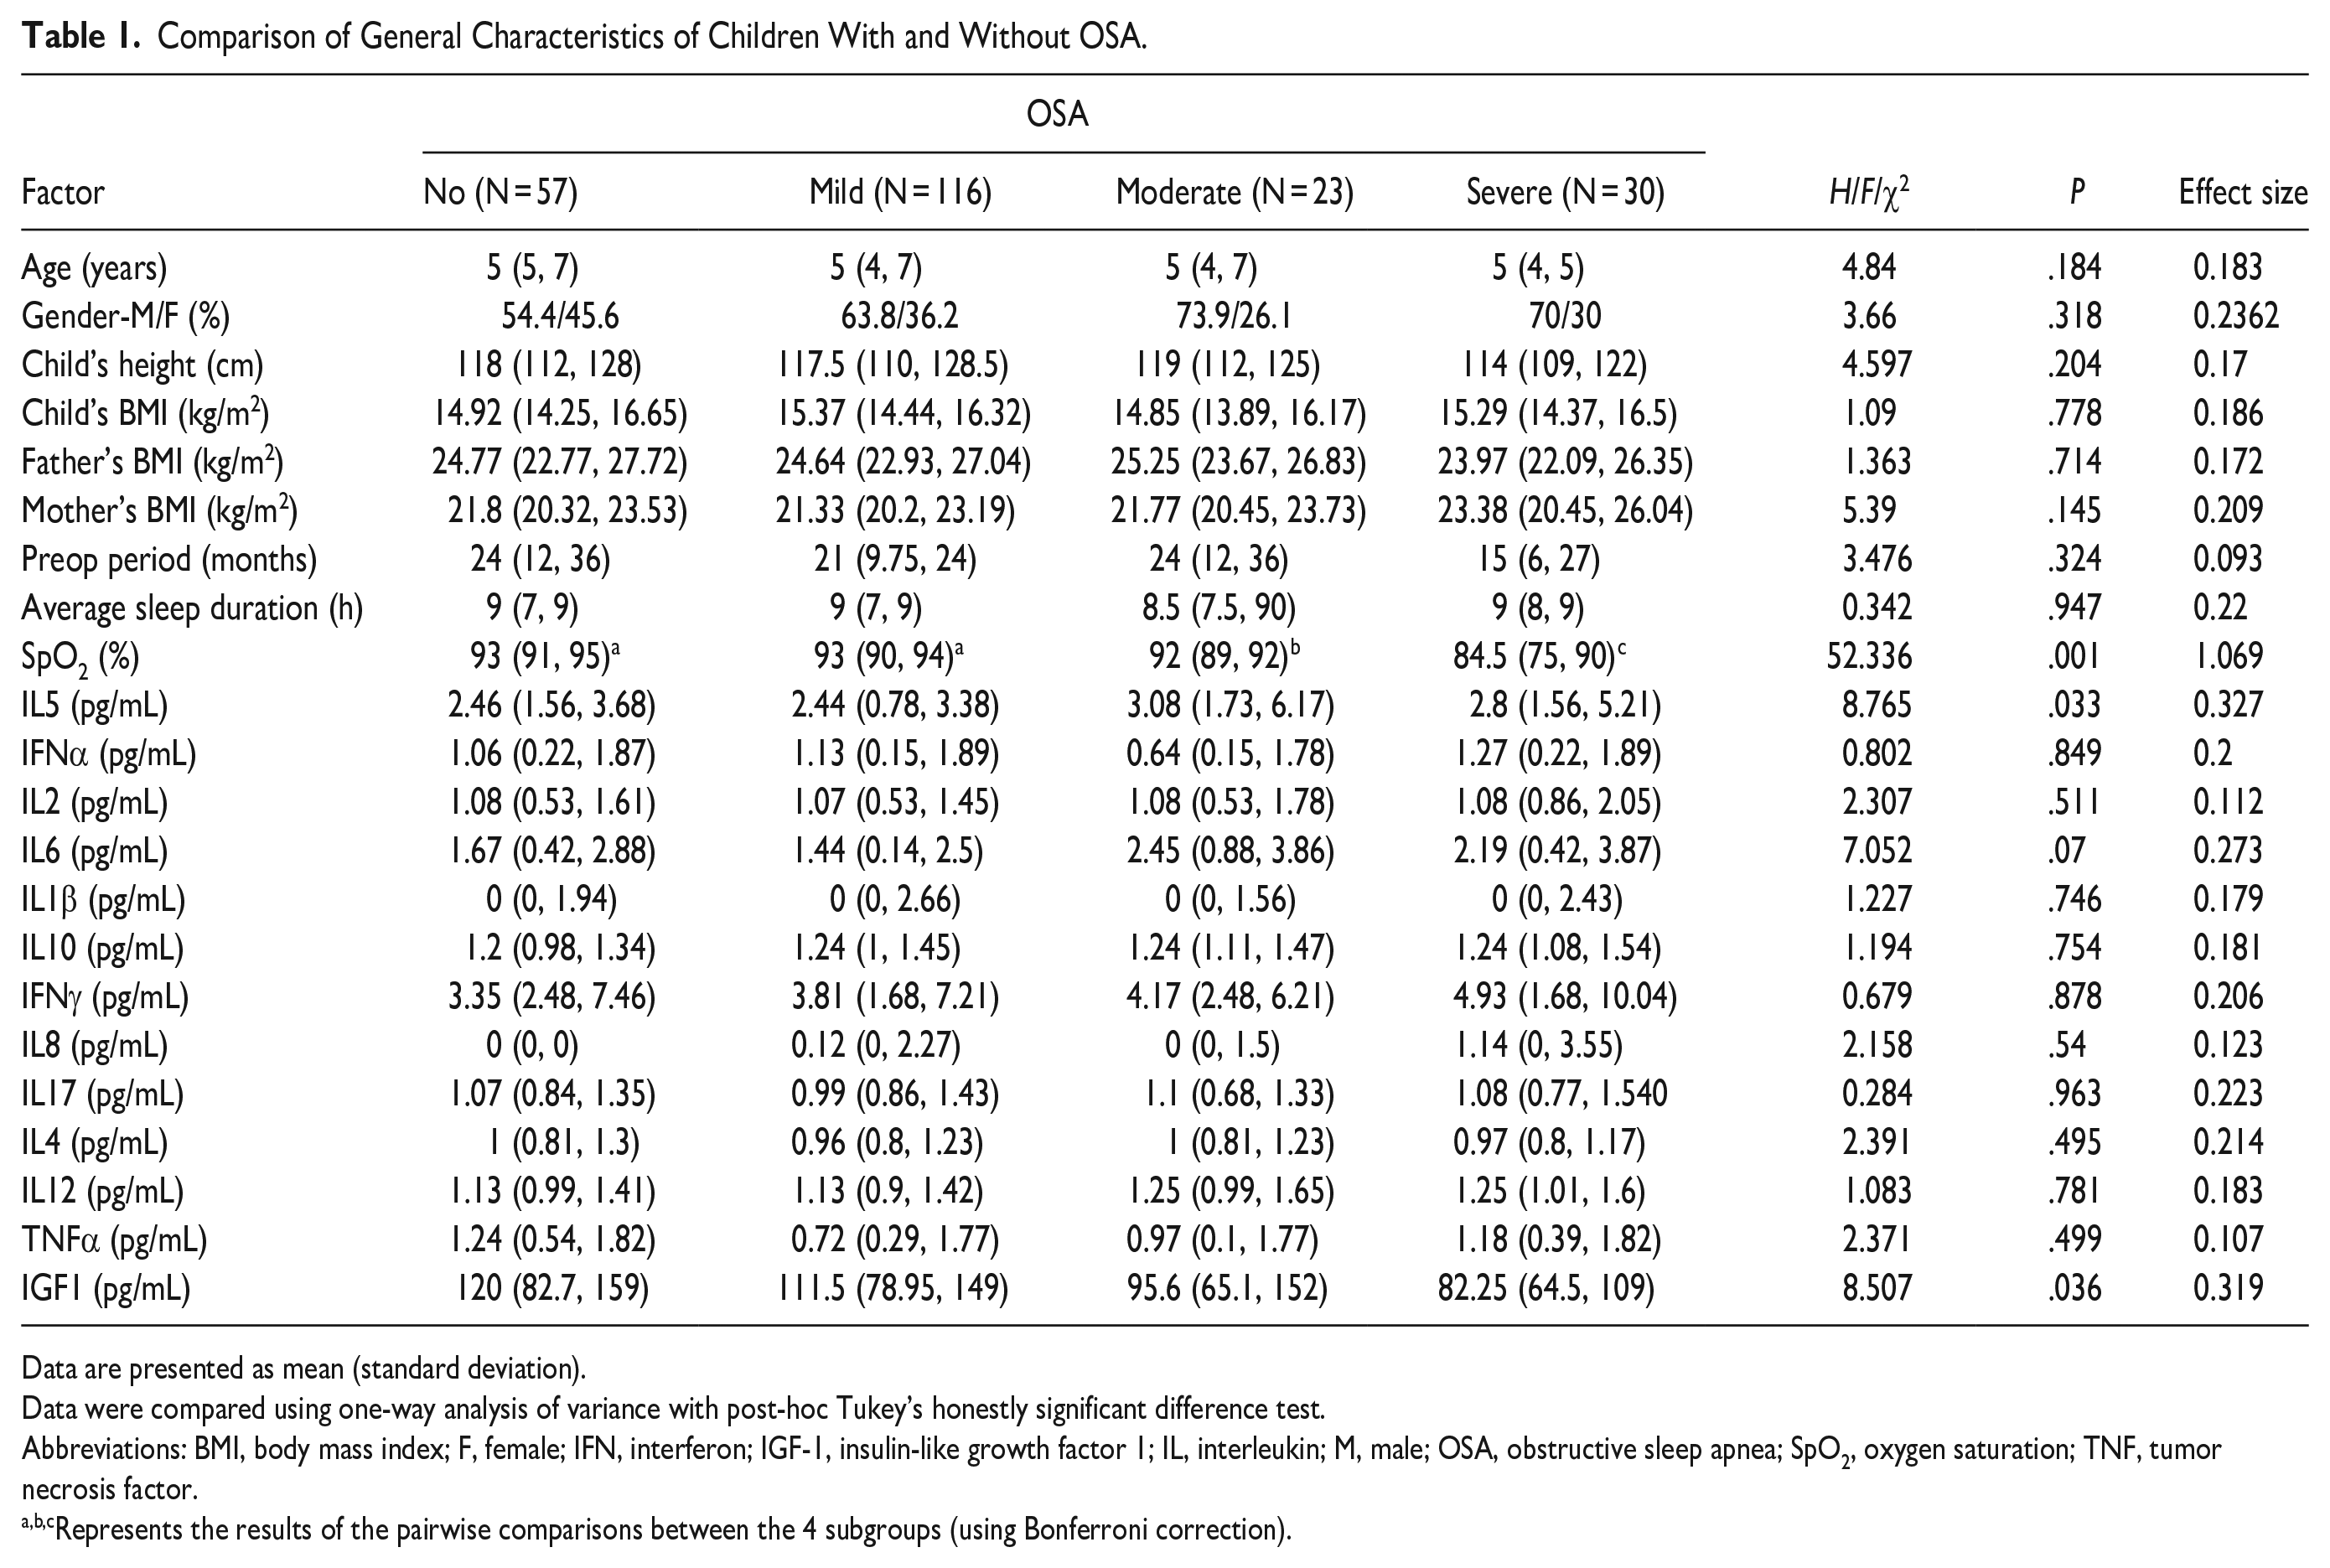
Data are presented as mean (standard deviation).
Data were compared using one-way analysis of variance with post-hoc Tukey’s honestly significant difference test.
Abbreviations: BMI, body mass index; F, female; IFN, interferon; IGF-1, insulin-like growth factor 1; IL, interleukin; M, male; OSA, obstructive sleep apnea; SpO2, oxygen saturation; TNF, tumor necrosis factor.
Represents the results of the pairwise comparisons between the 4 subgroups (using Bonferroni correction).
The children’s height was not significantly different among the 4 subgroups. The minimum SPO2 showed no significant difference between the non-OSA group and the mild OSA group, but it was significantly lower in both the moderate and severe OSA subgroups (P < .05). The results of IGF-1 and IL-5 are shown in Figures 1 and 2.
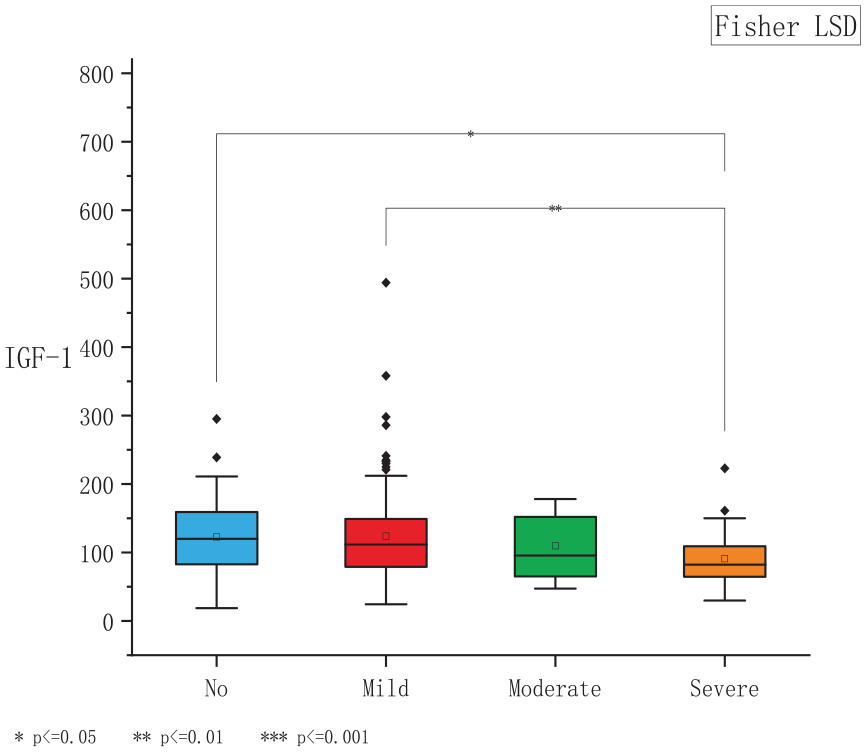
Boxplot shows that the IGF-1 level was significantly higher in the non-OSA group than in the severe OSA group (P < .05). Additionally, the IGF-1 level was significantly higher in the mild OSA group than in the severe OSA group (P < .01). IGF-1, insulin-like growth factor 1; OSA, obstructive sleep apnea.
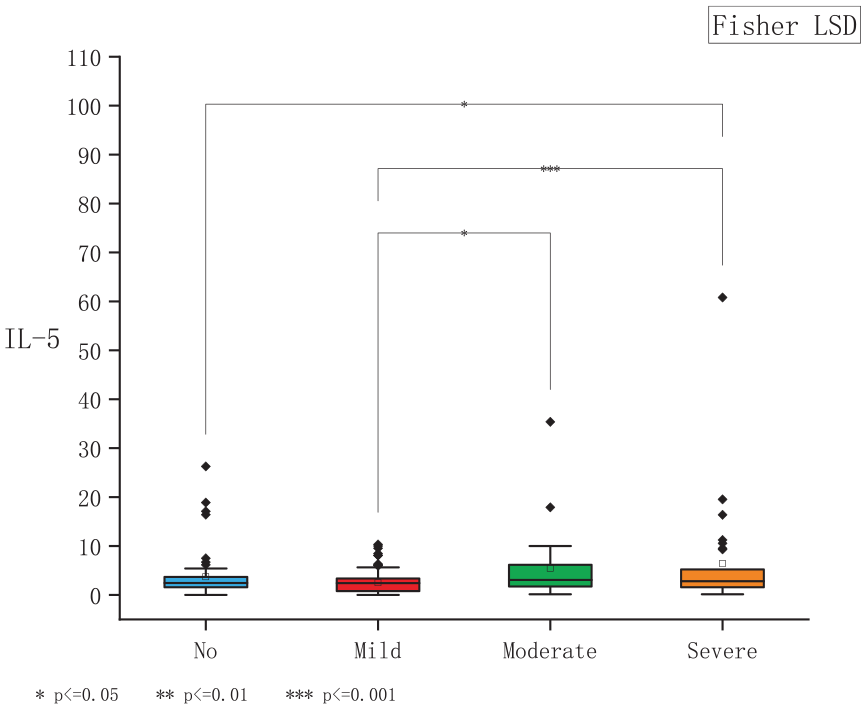
Boxplot shows that the IL-5 level was significantly different between the non-OSA and severe OSA subgroups (P < .05), and different between mild and moderate OSA subgroups (P < .05), and different between mild OSA and severe OSA subgroups (P < .001). IL-5, interleukin 5; OSA, obstructive sleep apnea.
Analysis of correlation between IGF-1 and various indicators
Results of ordinary least squares (OLS) regression between IGF-1 and associated factors
In the analysis of the IGF-1 distribution, IGF-1 was right-skewed and did not conform to a normal distribution. Therefore, a univariate quantile regression of IGF-1 was conducted to analyze its association with related variables. The results are shown in Table 2. IGF-1 was associated with age, sex, height, IL-5, severity of OSA, SpO2, and preop period. Higher IGF-1 was associated with older age, female sex, greater height, lower IL-5, less severe OSA, and higher SpO2.
Univariate Quantile Regression Analysis of IGF-1.
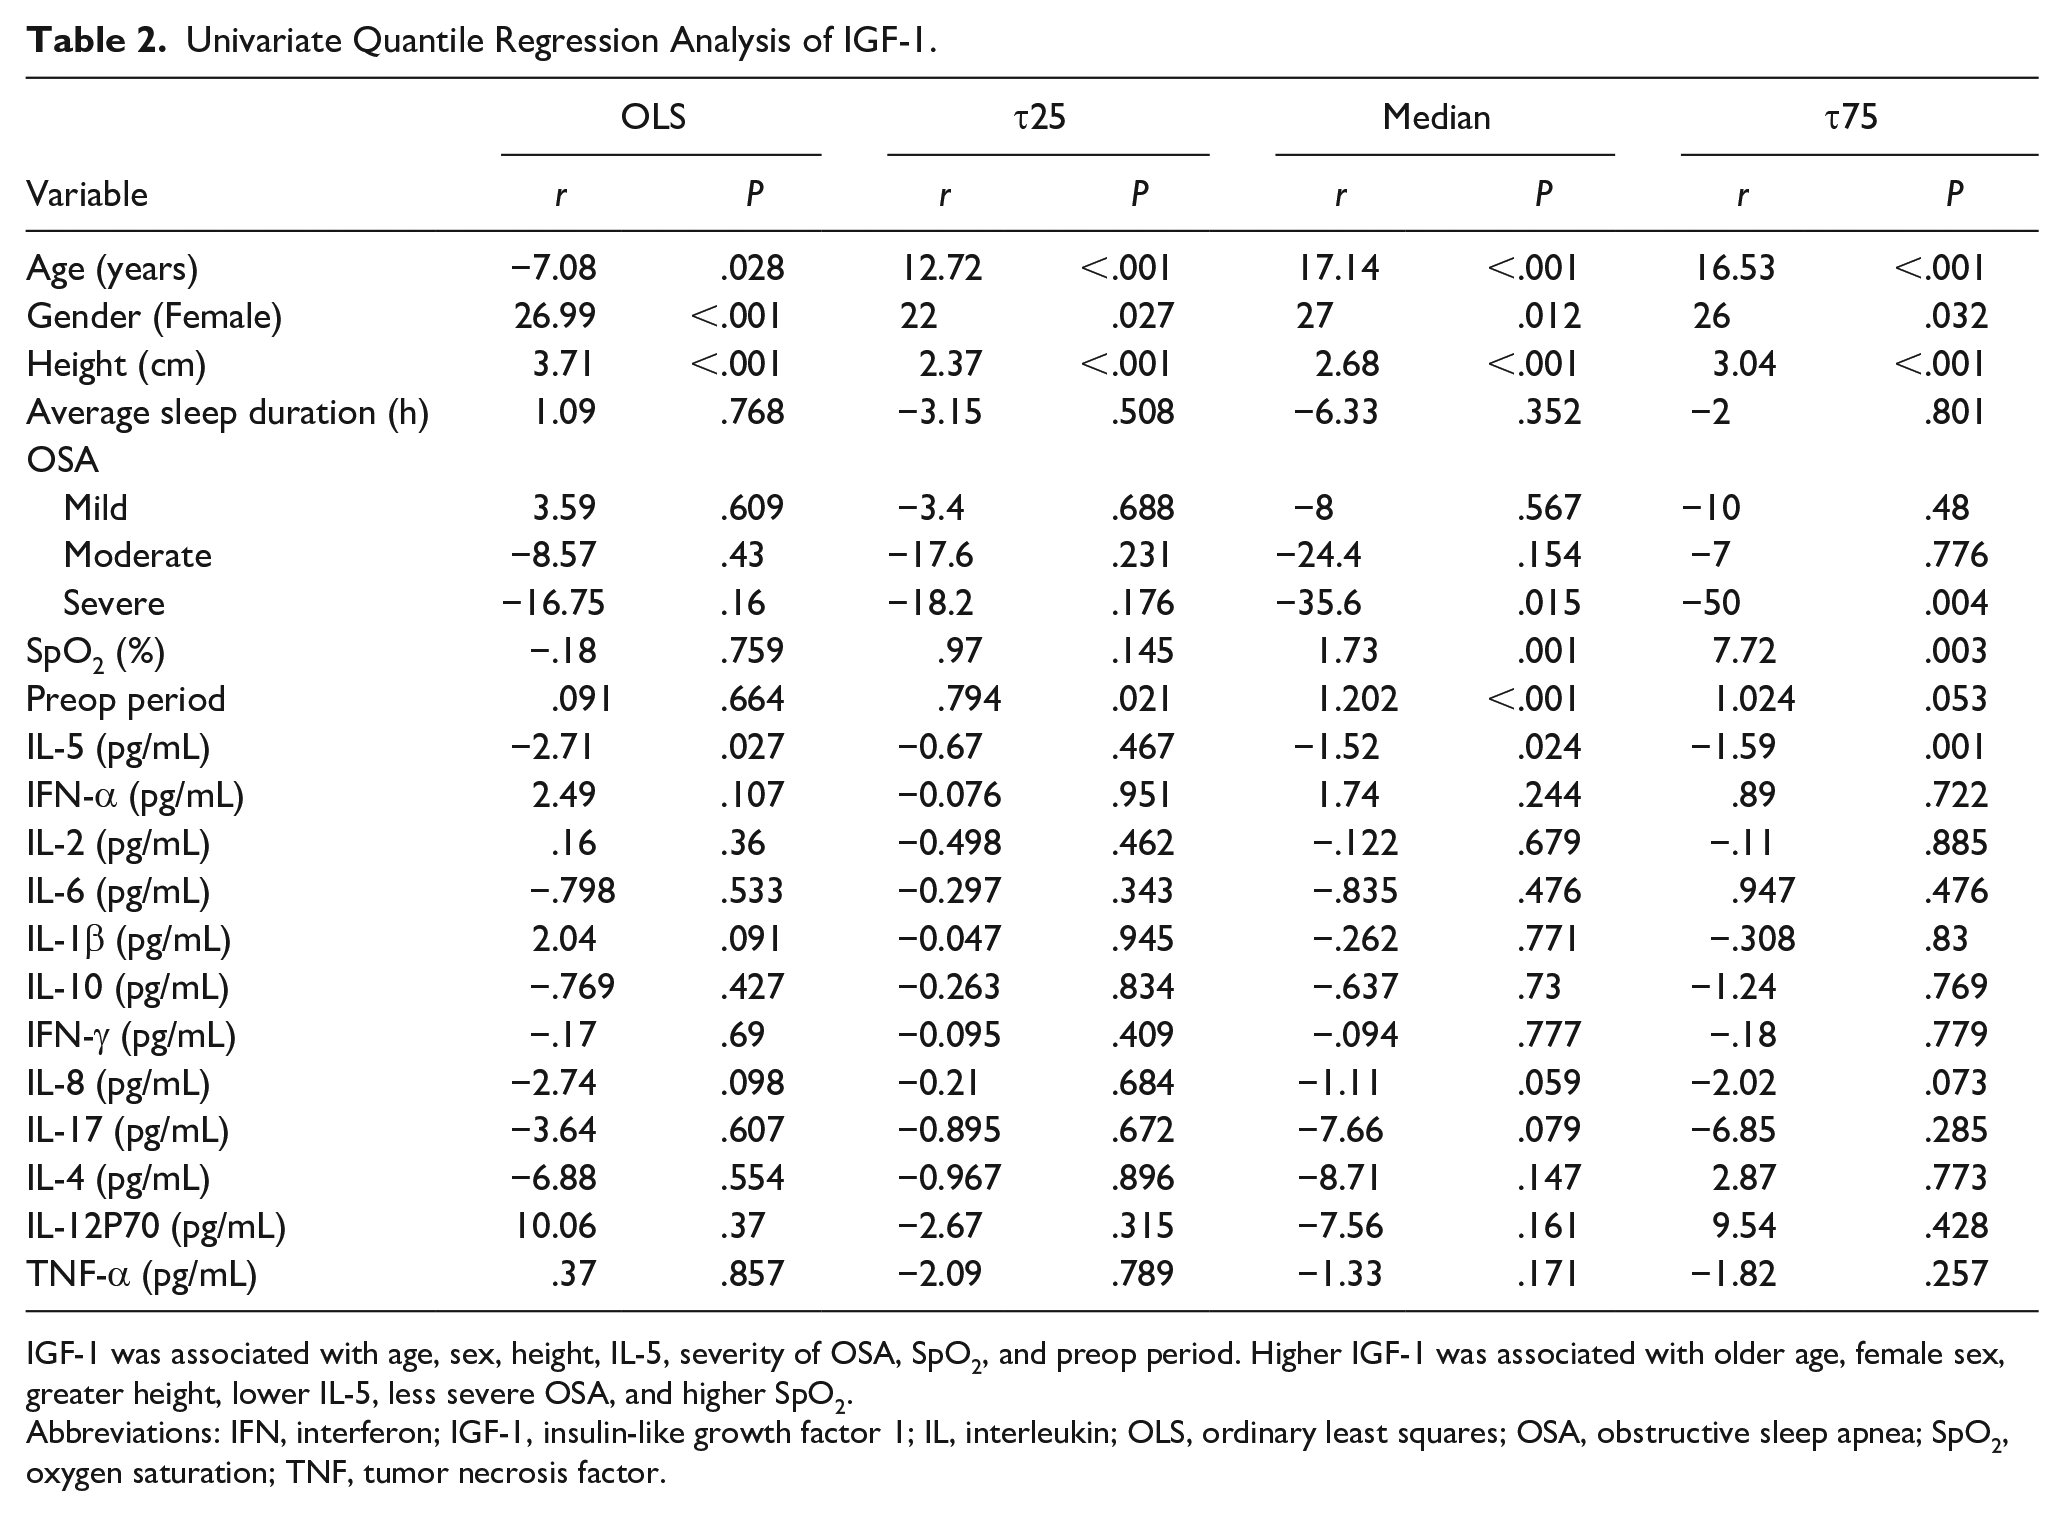
IGF-1 was associated with age, sex, height, IL-5, severity of OSA, SpO2, and preop period. Higher IGF-1 was associated with older age, female sex, greater height, lower IL-5, less severe OSA, and higher SpO2.
Abbreviations: IFN, interferon; IGF-1, insulin-like growth factor 1; IL, interleukin; OLS, ordinary least squares; OSA, obstructive sleep apnea; SpO2, oxygen saturation; TNF, tumor necrosis factor.
Multivariate quantile regression analysis between IGF-1 and statistically significant indicators
This was followed by a multivariate quantile regression analysis of the variables associated with IGF-1. The results are shown in Table 3. Among the various factors, the effect of sex on IGF-1 was observed at all quantiles, indicating that the IGF-1 level was significantly higher in females than in males. The relationship between height and IGF-1 showed a significant positive relationship in all quantiles, indicating a strong relationship between height and IGF-1 levels. Conversely, the nighttime OAHI and IGF-1 level were inversely associated in the quantile regression analysis, suggesting lower IGF-1 levels in children with more severe OSA. Notably, there was no significant correlation of IGF-1 with SpO2, IL-5, or IFN-α.
Multivariable Quantile Regression of IGF-1.
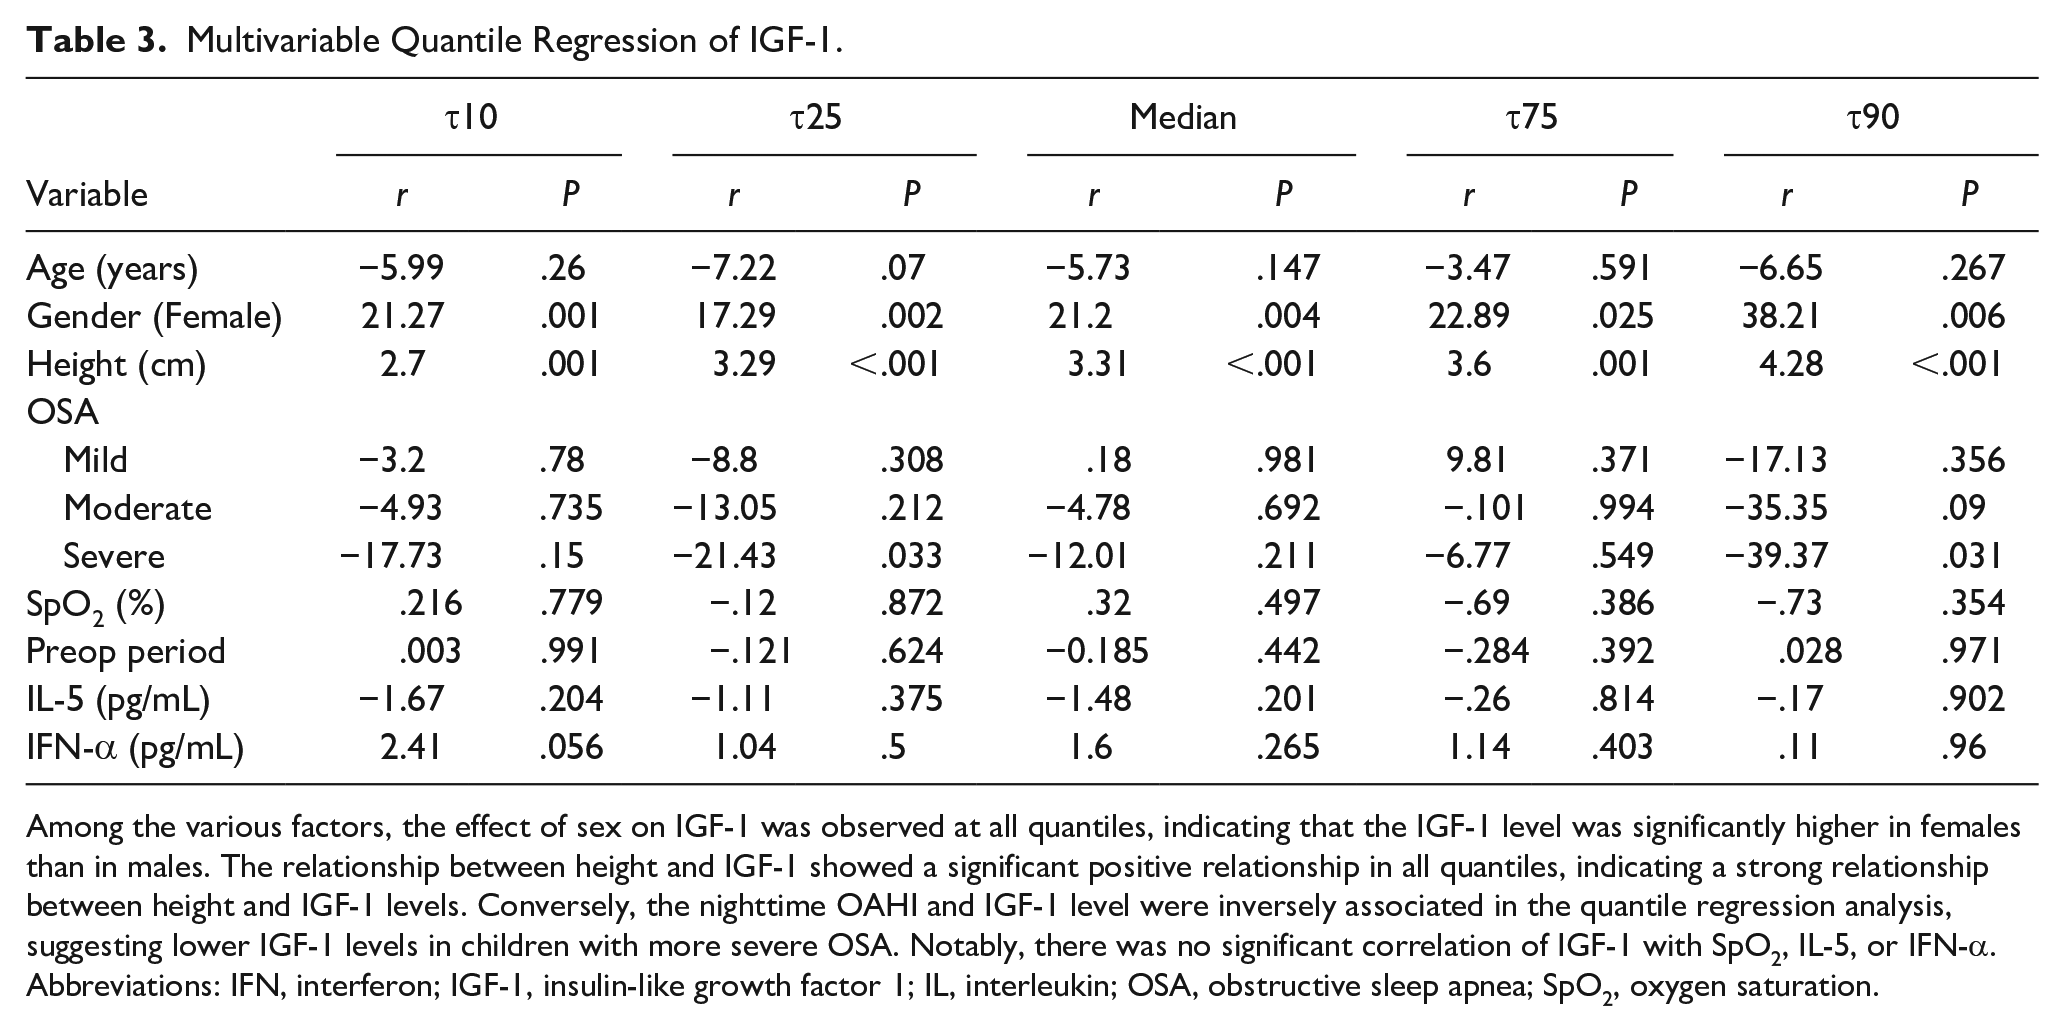
Among the various factors, the effect of sex on IGF-1 was observed at all quantiles, indicating that the IGF-1 level was significantly higher in females than in males. The relationship between height and IGF-1 showed a significant positive relationship in all quantiles, indicating a strong relationship between height and IGF-1 levels. Conversely, the nighttime OAHI and IGF-1 level were inversely associated in the quantile regression analysis, suggesting lower IGF-1 levels in children with more severe OSA. Notably, there was no significant correlation of IGF-1 with SpO2, IL-5, or IFN-α.
Abbreviations: IFN, interferon; IGF-1, insulin-like growth factor 1; IL, interleukin; OSA, obstructive sleep apnea; SpO2, oxygen saturation.
Discussion
Sleep plays a vital role in the development of both the body and the brain and helps to improve memory, regulate metabolism, repair tissue, and control inflammation. 13 Additionally, sleep is accompanied by a significant increase in the release of GH and prolactin. Moreover, sleep deprivation or sleep disorders can lead to changes in hormone secretion and the release of inflammatory factors. OSA may be associated with the GH/IGF-1 axis and inflammation levels.5,14
The primary role of GH is to promote postpartum linear growth in children and adolescents. Its effects on childhood and pubertal growth are partly directed and mediated by IGF-1, whereby GH stimulates the synthesis of IGF-1 in the liver and other target tissues. Additionally, IGF-1 levels reflect the daily mean GH levels and correlates with physiological changes in GH secretion. 15 IGF-1 levels are also considered a major mediator of the growth-promoting effects of GH. The GH level is challenging to accurately monitor because of its pulsatile nature, and IGF-1 levels are significantly more stable than GH. 16 Therefore, in our study, IGF-1 levels were selected as a key indicator of the GH level. Intermittent hypoxia due to OSA has been demonstrated to cause lower GH and IGF-1 concentrations. 17 In the current study, as the severity of OSA increased, the minimum oxygen saturation and IGF-1 levels significantly decreased in different OSA subgroups. The results of this study are consistent with the reports in the literature. The sample size of this study was sufficient. We were thus able to interpret the changes in IGF-1 levels between different groups more intuitively. Among the patient groups, IGF-1 levels were significantly higher in the non-OSA group than in the severe OSA group and significantly higher in the mild OSA group than in the severe OSA group. So, we supposed that as the severity of OSA increases, the secretion of IGF-1 levels is gradually inhibited, thus affecting children’s growth and development.
The relationship between OSA and inflammatory factors has also been recently established. Previous studies showed that the levels of IL-6 and IL-8 were high in patients with OSA and associated with the apnea–hypopnea index. 18 In addition, some studies have examined several interleukins, such as IL-1β, IL-10, and IL-18, as well as IFN-α, IFN-γ, and TNF-α in OSA. 19 However, there is still no consensus in this field. In the current study, we selected 12 inflammatory cytokines including ILs, IFNs, and TNF as key indicators. Among them, IL-5 was significantly different among the OSA subgroups. As the severity of OSA increased, the minimum oxygen saturation gradually decreased and the IL-5 level gradually increased, demonstrating an independent relationship. These findings suggest that a progressive upregulation of IL-5 levels occurs as the degree of OSA-induced hypoxia increases, thus activating systemic atopic inflammation. Notably, this is the first report of this independent correlation. IL-5 plays a key role in regulating almost all aspects of eosinophil activity. Its overexpression under intermittent hypoxia can directly affect the allergic reaction in the nasal cavity and adenoids, thus aggravating the pathogenic factors directly related to OSA and thus the severity of OSA, resulting in a vicious circle. In patients with atopic disease, IL-5 is mainly driven by cytokines associated with type 2 T-helper cells; however, its overexpression can increase type 2 T-helper cell activity to release more inflammatory factors, thus proving the idea that OSA is a type of chronic systemic inflammation. 20
Although the IL-6 and TNF-α levels were not significantly high in the children with OSA in this study, we cannot exclude the role of IL-6 and TNF-α in OSA-associated inflammation. 21 IL-6 and TNF-α also play an essential role in lipid metabolism and energy expenditure. This may lead to weight gain 22 in children with OSA, which is a common risk factor for obesity and metabolic disorders. In our study, the impact of obesity on OSA was excluded, and the proportion of children with moderate and severe OSA was small, which may have affected the results.
Few relationships between GH levels and inflammatory factors have been reported; in most cases, such studies have involved animal models. 23 The current study is a preliminary exploratory clinical analysis of GH levels and inflammatory factors in children with OSA. In the univariable quantile regression analysis of IGF-1, there was a clear negative correlation between IGF-1 and IL-5; that is, a higher IL-5 level was associated with a lower GH level. Consistent with previous reports, elevated inflammatory factors such as TNF-α in the articular fluid of patients with osteoarthritis can be induced by overexpression of IGF-binding protein 3, thus downregulating IGF-1 expression. 24 Our univariate quantile regression analysis of IGF-1 showed a clear positive correlation of IGF-1 with age, sex, height, and minimum oxygen saturation. The results showed that older children secreted higher levels of IGF-1. Additionally, we found that girls had higher IGF-1 levels than boys. Higher IGF-1 levels were associated with greater height, and lower IGF-1 levels were associated with lower minimum oxygen saturations. There was also a negative correlation between IGF-1 and the severity of OSA; that is, more severe OSA was associated with lower IGF-1 levels. This is consistent with the effects of OSA-induced hypoxia on children’s growth. We performed a quantile regression analysis on the multivariate analysis of the IGF-1 association, and the results demonstrated that height, sex, and OSA severity were significantly correlated with IGF-1. The secretion of IGF-1 is strongly affected by height, sex, and the severity of hypoxia, and height is a key indicator of children’s growth and development. This implies that the secretion of IGF-1 is suppressed in children with severe hypoxia, thus impairing their height.
This study has some limitations. First, this study included 226 children including 23 (10.18%) with moderate OSA and 30 (13.27%) with severe OSA, which are small proportions. However, we still found significant differences in IGF-1 and inflammatory factors. In addition, the key index IGF-1 was non-normally distributed. In future studies, the sample size should be increased, especially for children with moderate and severe OSA, and we should continue verifying the regulatory mechanism between IL-5 and IGF-1.
Conclusion
Our study shows that the severity of OSA in children is closely related to GH level (IGF-1) and systemic inflammation level (IL-5). The release of inflammatory factors also regulates GH levels to different degrees, thus affecting the growth and development of children. These key indicators may be potential early markers of growth and development and/or neurocognitive complications in children with OSA.
Footnotes
Author Contributions
J.T. designed and wrote the manuscript. Z.X. and J.Z. drafted and revised the manuscript. L.Z. acquired the data. P.L., Y.W., and J.T. analyzed the data of patients. X.N. designed the surgical procedure and approved the final version of the article. All authors contributed to the final manuscript. All authors read and approved the final manuscript.
Data Availability Statement
The data used to support the findings of this study are available from the corresponding author upon request.
Declaration of Conflicting Interests
The author(s) declared no potential conflicts of interest with respect to the research, authorship, and/or publication of this article.
Funding
The author(s) disclosed receipt of the following financial support for the research, authorship, and/or publication of this article: This study was supported by Beijing Natural Science Foundation (7212033), National Natural Science Foundation of China (82070092), and National Clinical Research Center for Respiratory Diseases (HXZX-20210401).