
Abstract
Objectives
This study aims to explore how patients’ hearing loss developed with the progression of endolymphatic hydrops and the characteristics of hearing loss at different stages.
Materials and Methods
We collected 73 patients with definite or possible unilateral Meniere’s disease or sudden hearing loss who underwent magnetic resonance imaging after intravenous contrast agent injection. There were 25 cases of isolated cochlear hydrops, 24 cases of isolated vestibular hydrops, and 24 cases of cochlear and vestibular hydrops. Primary outcome analyses included their evaluation of endolymphatic hydrops and hearing thresholds at low and high frequencies.
Results
The overall hearing threshold of patients with vestibular and cochlear hydrops was significantly higher than that of patients with isolated cochlear hydrops and patients with isolated vestibular hydrops. There was a significant correlation between low-frequency hearing loss and cochlear hydrops, and the low-frequency hearing threshold was proportional to the grade of cochlear hydrops. At low frequency, the hearing threshold of patients with isolated vestibular hydrops was lower than that of patients with isolated cochlear hydrops and patients with both cochlear and vestibular hydrops. The audiogram configurations of patients with isolated cochlear hydrops consist largely of flat type and up-sloping type. The audiogram configurations of patients with isolated vestibular hydrops and patients with both cochlear and vestibular hydrops are mainly flat type and down-sloping type.
Conclusions
Patients present with low-frequency hearing loss in the early stage of endolymphatic hydrops. When the hydrops involves the whole cochlea and vestibule, the patients’ hearing is impaired at both low and high frequencies.
Introduction
As early as 1983, C. S. Hallpike observed endolymphatic hydrops (EH) in temporal bone pathological specimens of Meniere’s disease (MD) patients. 1 In 2007, a team from Nagoya University reported for the first time the visualization of EH in MD patients using magnetic resonance imaging (MRI). 2 In this study, researchers observed gadolinium in parts of the perilymph after intratympanic injection of diluted gadolinium. Then, around the theme of endolymphatic hydrops, contrast agent injection methods, new magnetic resonance imaging techniques, and different evaluation methods continue to develop. Patients with Meniere’s disease, sudden hearing loss, vestibular schwannoma, and other diseases have been confirmed to have endolymphatic hydrops, even in healthy individuals.3,4,5 Recently, many studies have shown that patients’ hearing loss is related to endolymphatic hydrops. Some scholars have proposed that there is a significant correlation between hearing loss and the extent of cochlear and vestibular endolymphatic hydrops, and the hearing threshold is proportional to the grade of endolymphatic hydrops. 6 Endolymphatic hydrops and hearing loss progress even with pharmacotherapy and intratympanic steroid therapy.7,8
This study aimed to explore how patients’ hearing loss developed with the progression of endolymphatic hydrops and the characteristics of hearing loss at different stages.
Methods
Patients
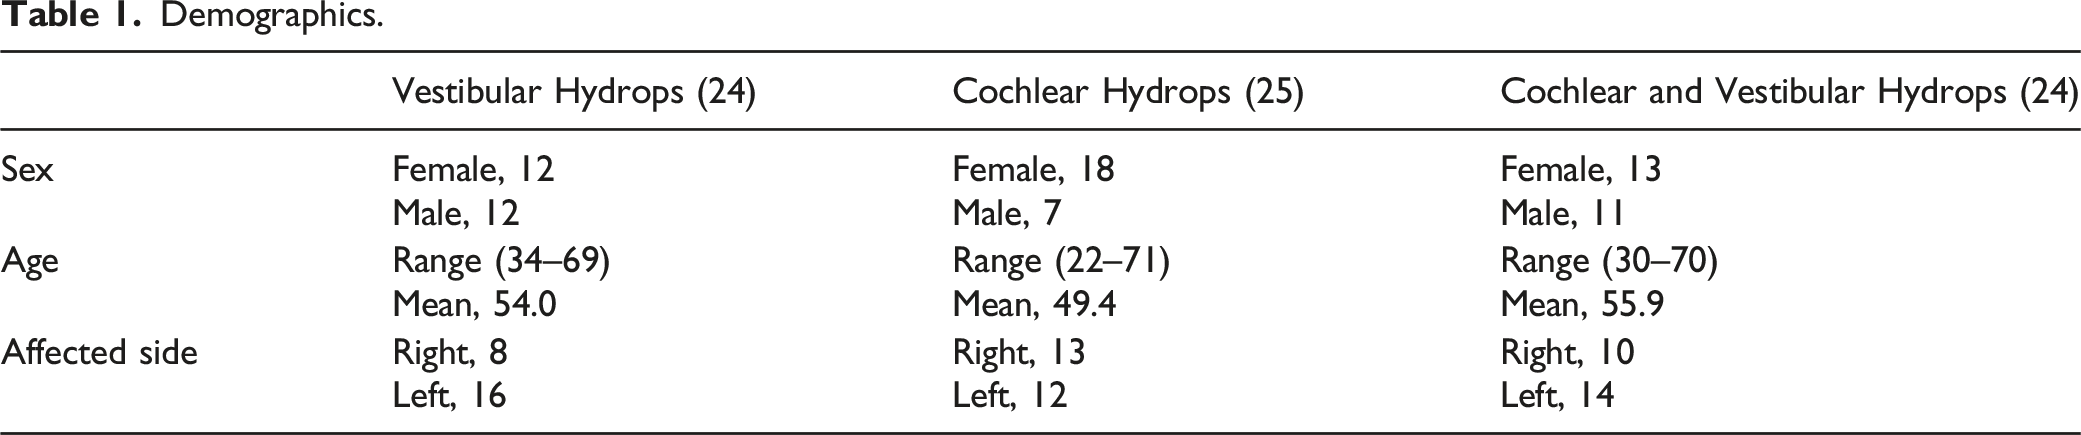
Demographics.
Pure-Tone Audiometry
Pure-tone audiometry thresholds were measured at all conventional frequencies (125–8000 Hz) using a GSI 61 audiometer (Grason Stadler). According to the frequency distribution of hearing loss, it was divided into low-frequency (125 Hz–1000 Hz) hearing loss and high-frequency (2000 Hz–8000 Hz) hearing loss. Audiogram configurations were classified as up-sloping (hearing loss affecting 125,250 Hz more), flat (less than 20 dB difference between the highest and lowest threshold), down-sloping (hearing loss affecting 4000, 8000 Hz more), and profound (thresholds of 90 dB or more in each test frequency) hearing loss. 11
Image Acquisition
All enrolled patients accepted MRI scans 4 hours later after the intravenous injection of gadolinium. To obtain satisfactory images, we used a double dose (.4 mL/kg body weight) of gadolinium (Magnevist, Bayer Health Care, Beijing, China). Both the ethics committee and the patients accepted this proposal. A 3.0 T MRI scanner (Magnetom Verio, Siemens Healthineers, Erlangen, Germany) and an 8-channel array coil were used for T2 SPACE (Sampling Perfection with Application-Optimized Contrasts by using different flip angle Evolutions) and 3D-real IR (3-dimensional inversion recovery sequence with real reconstruction) sequence scanning. The parameters of the T2 SPACE sequence included slice thickness (.6 mm), repletion time (1000 ms), echo time (132 ms), flip angle (120°), matrix(384 × 384), field of view (200 × 100 mm2), and scan time (2 minutes and 44 seconds). The parameters of the 3D-real IR sequence included slice thickness (.6 mm), repetition time (6000 ms), echo time (181 ms), inversion time (1850 ms), flip angles (180°), matrix size (768 × 768), field of view (160 × 160 mm2), and scan time (15 minutes and 20 seconds).
Evaluation of Endolymphatic Hydrops
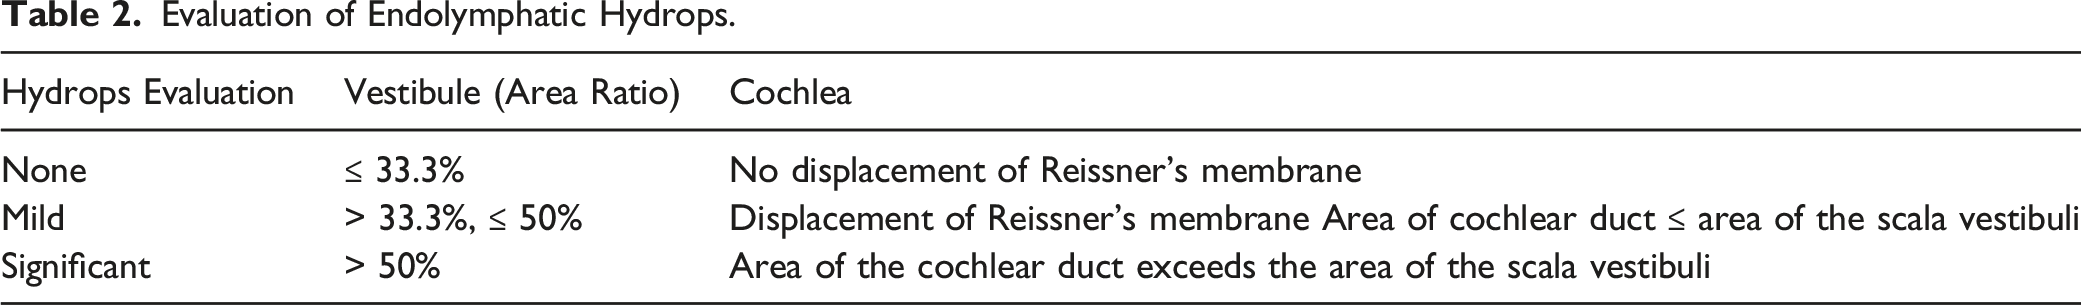
Evaluation of Endolymphatic Hydrops.
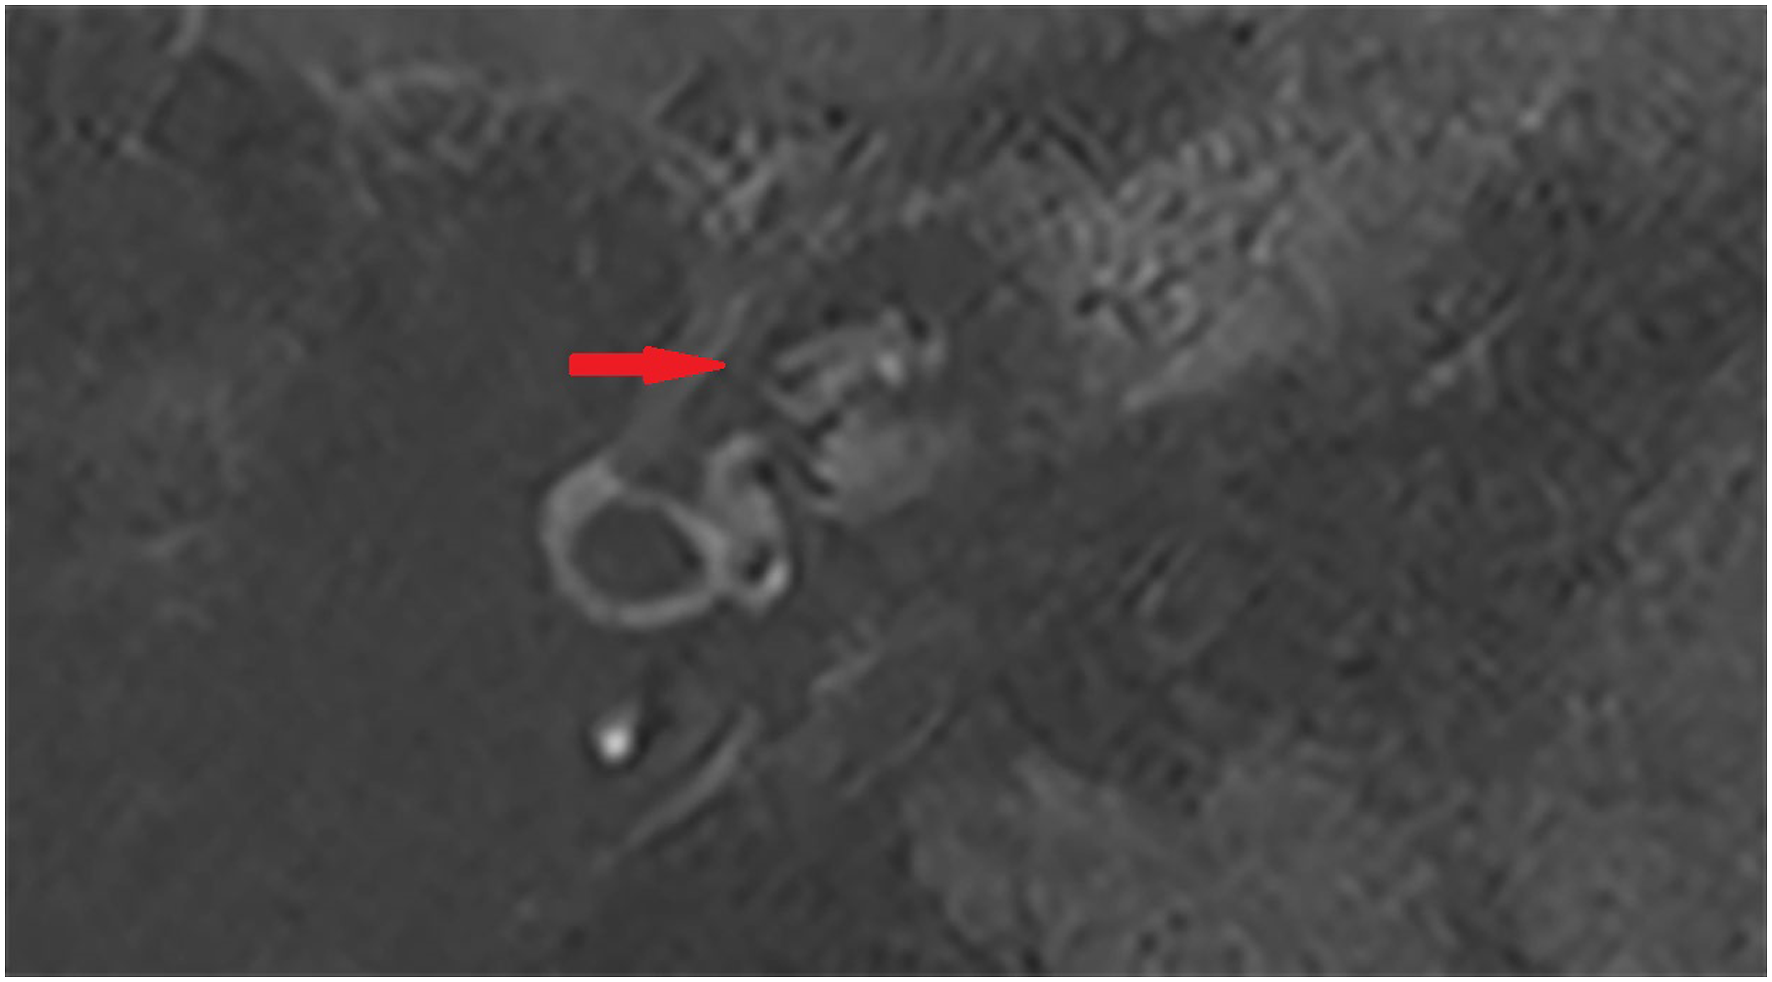
A patient with isolated cochlear hydrops (mild endolymphatic hydrops) on the right side.
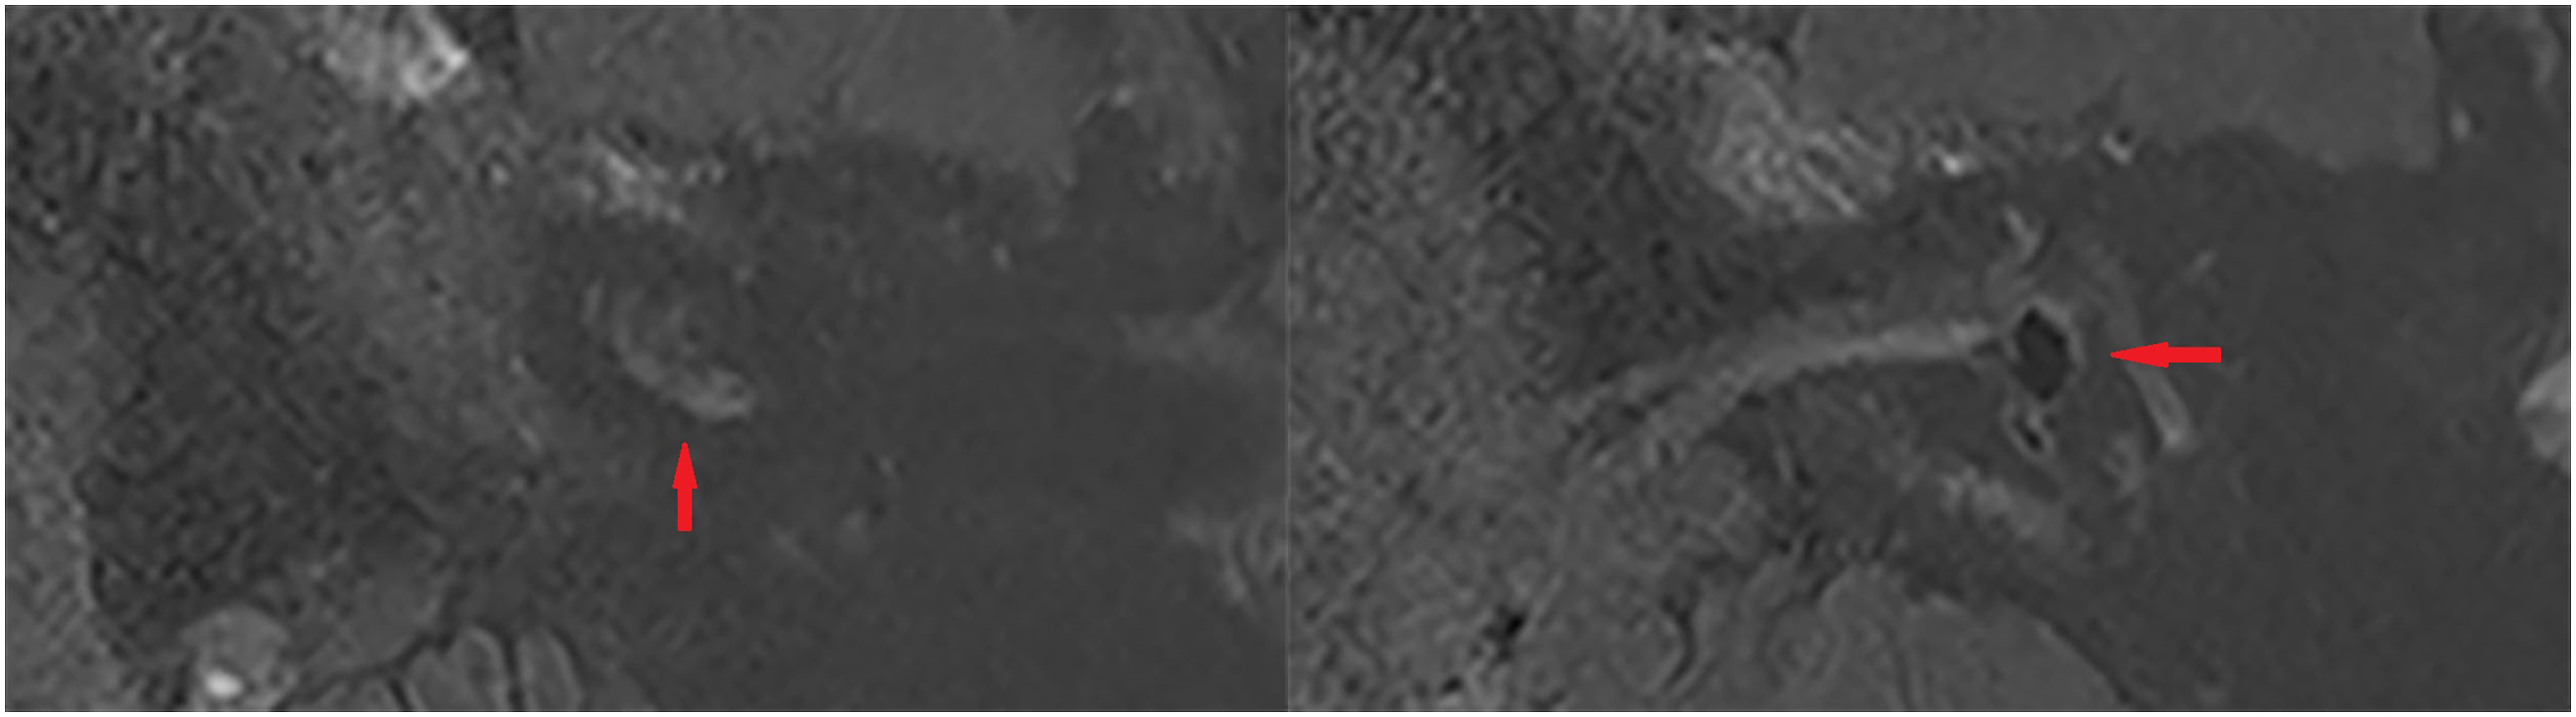
The left and right images showed the cochlea and vestibule of a patient with left isolated vestibular hydrops (significant endolymphatic hydrops).
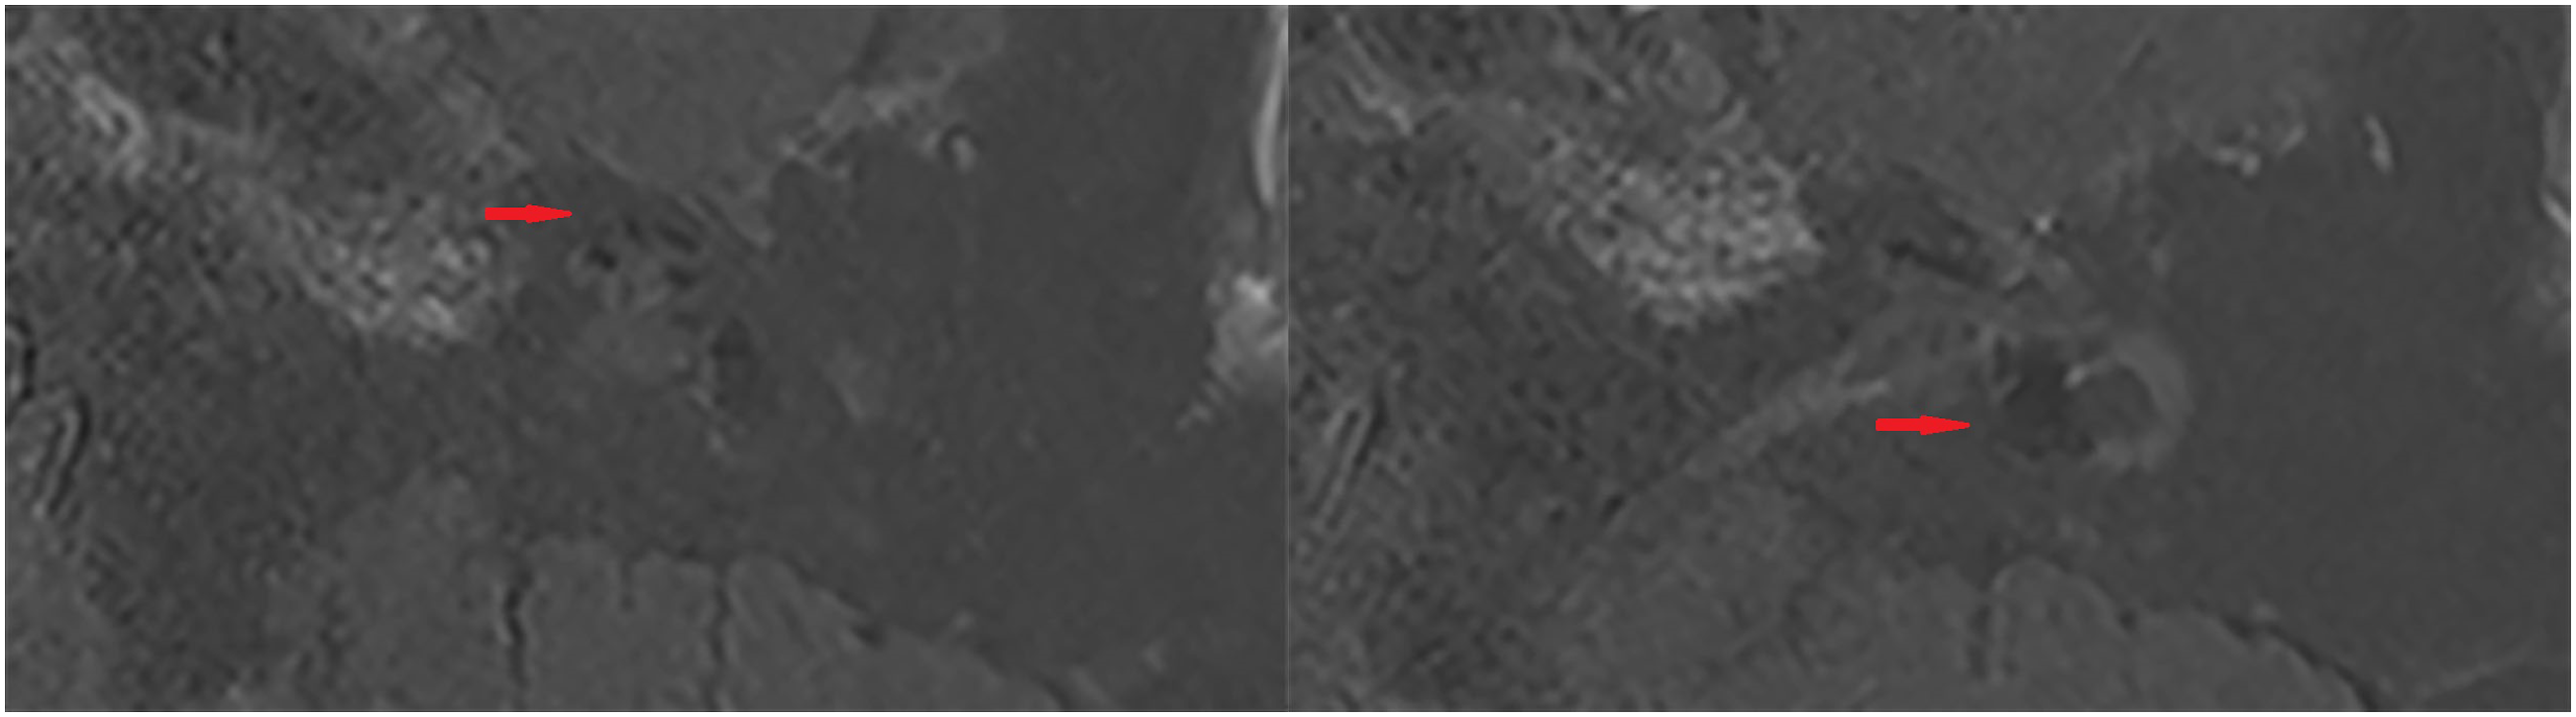
The left and right images showed the cochlea and vestibule of a patient with left cochlear and vestibular hydrops (significant cochlear and vestibular endolymphatic hydrops).
Statistical Analysis
We used SPSS (v.26; IBM, Armonk, NY) to analyze the statistical data. The chi-square test was used to compare the degree of endolymphatic hydrops. The Kruskal–Wallis test and one-way ANOVA were applied to compare the hearing loss of each group. The Spearman test was applied to explore the correlation between cochlear hydrops and low-frequency hearing loss. Fisher’s exact test was used to compare the distribution of audiogram configurations among 3 groups. P-value < .05 was considered statistically significant.
Results
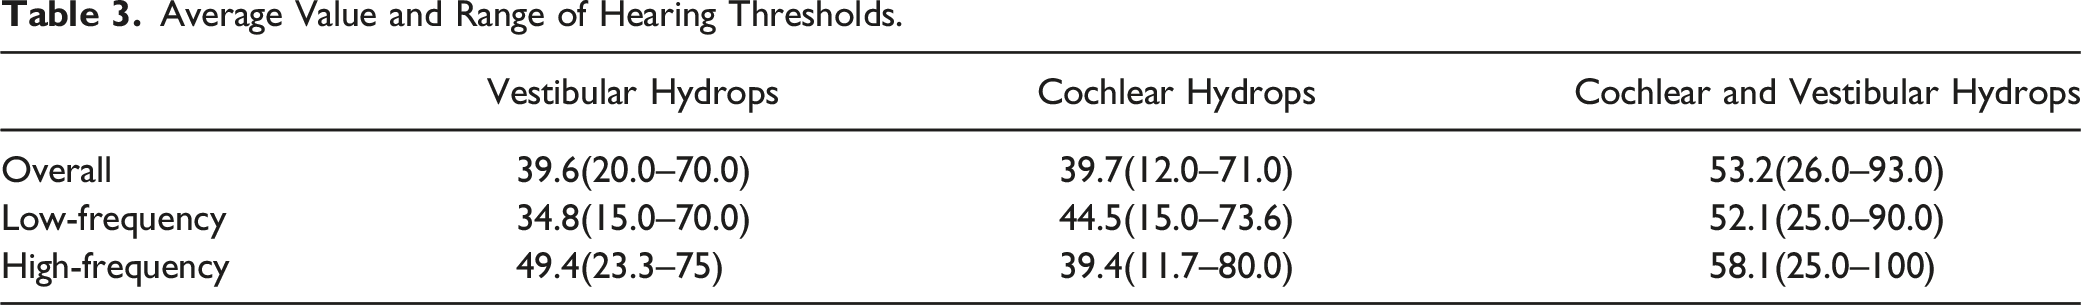
Average Value and Range of Hearing Thresholds.
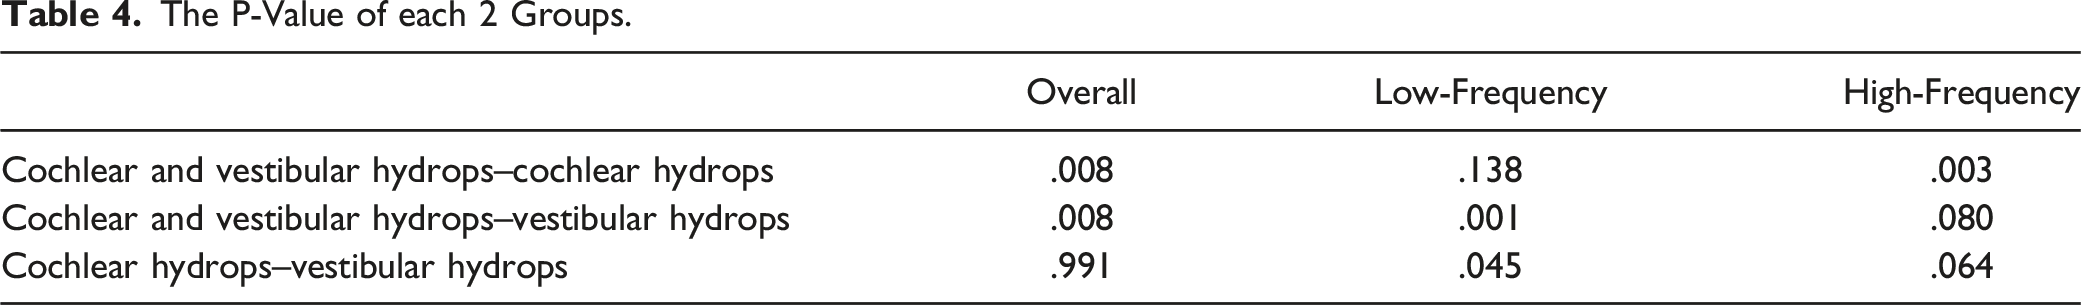
The P-Value of each 2 Groups.
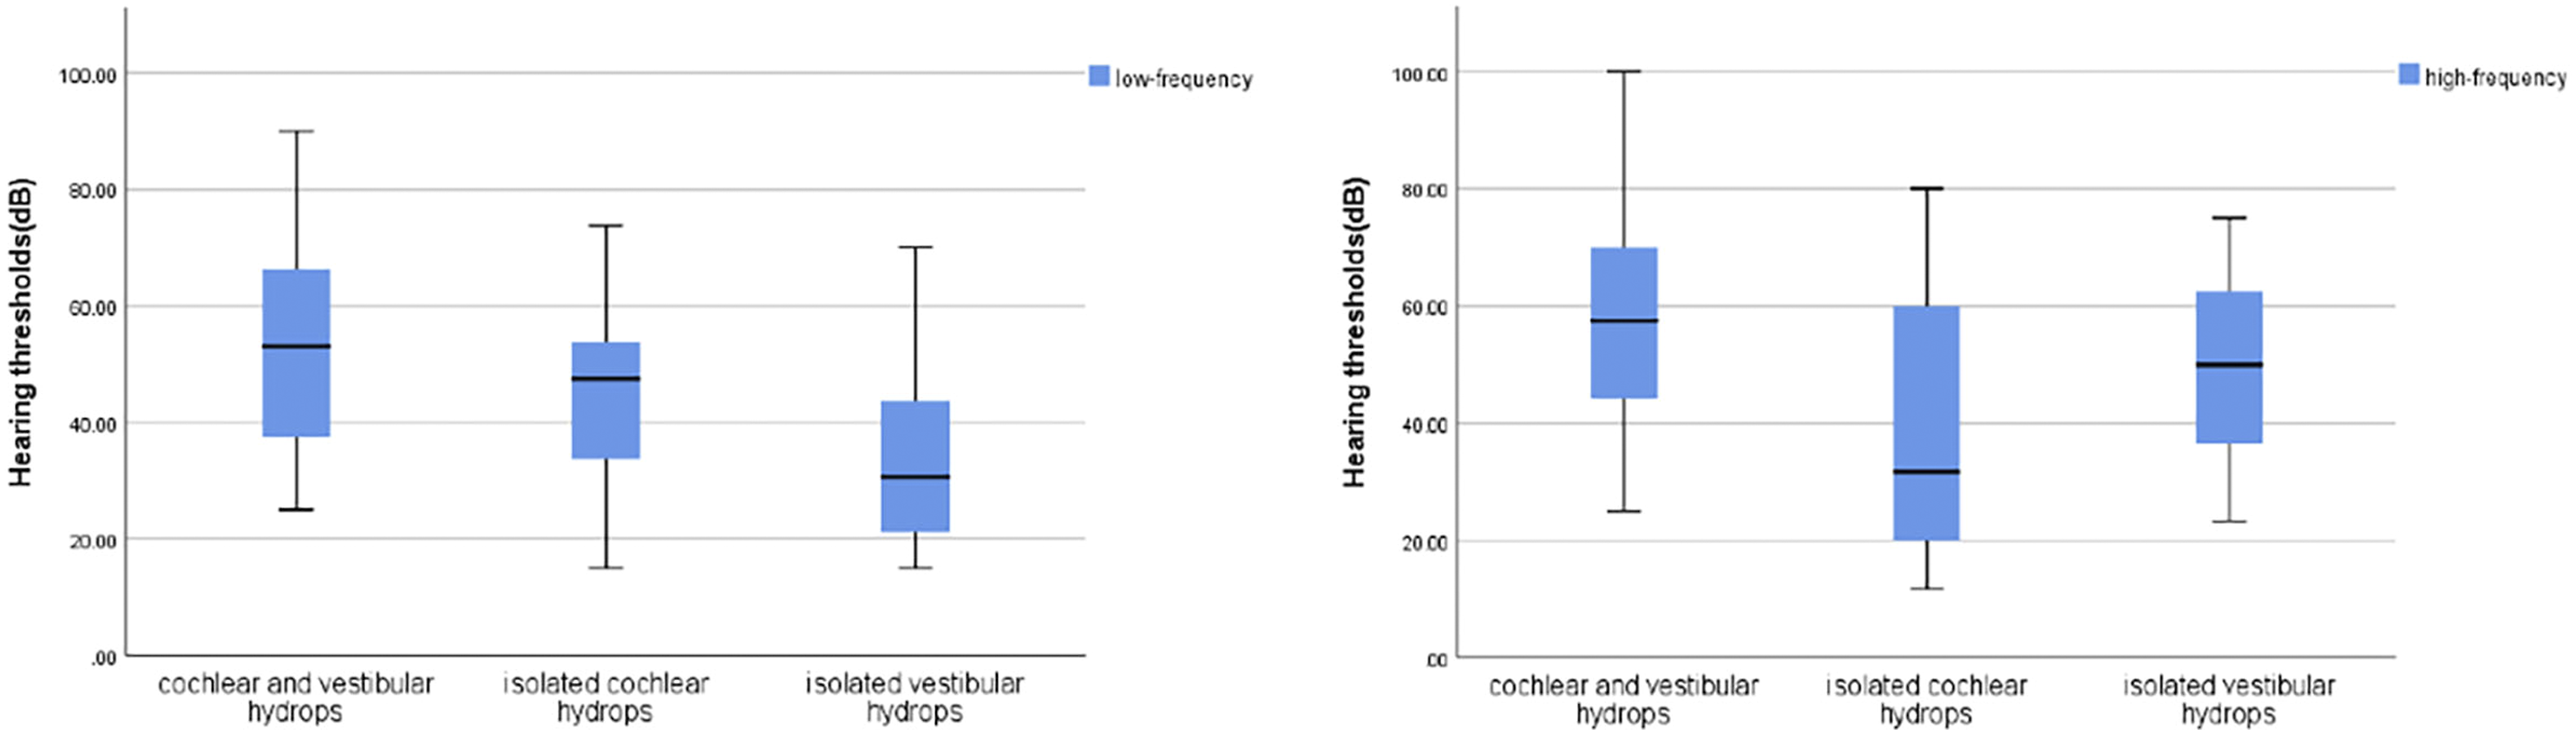
The distribution of hearing thresholds at low frequency and high frequency among 3 groups.
Of the patients with cochlear and vestibular hydrops, 12% (3/24) showed an up-sloping audiogram configuration, 29.2% (7/24) showed a flat audiogram configuration, and 58.3% (14/24) had a down-sloping audiogram configuration. Of the patients with isolated cochlear hydrops, 52% (13/25) showed an up-sloping audiogram configuration, 20% (5/25) showed a flat audiogram configuration, and 28% (7/25) had a down-sloping audiogram configuration. Of the patients with isolated vestibular hydrops, 4.2% (1/24) showed an up-sloping audiogram configuration, 8.3% (3/24) showed a flat audiogram configuration, and 87.5% (21/24) had a down-sloping audiogram configuration. No one had a profound hearing loss. The patient with the most severe hearing loss had cochlear and vestibular hydrops, and the hearing threshold at each frequency was 85, 95, 90, 90, 100, 95, 105, respectively. The distribution of audiogram configurations was significantly different among the 3 groups (P < .001).
Discussion
At present, there have been many studies on the relationship between EH and hearing loss. This paper focused on the hearing loss in 3 different stages of EH, which had not been explored in previous studies and was the innovation of this paper. In this study, we included patients with isolated cochlear hydrops, isolated vestibular hydrops, and both cochlear and vestibular hydrops to compare the differences in hearing loss among these 3 groups. Our objective was to reveal how patients' hearing loss developed with the progression of EH and the characteristics of hearing loss at different stages. Our results showed that the overall hearing loss of patients with cochlear and vestibular hydrops was worse than that of patients with isolated cochlear hydrops and patients with isolated vestibular hydrops. Moreover, the degree of cochlear hydrops in the cochlear and vestibular hydrops group was significantly higher than that of the isolated cochlear hydrops group. Among the patients enrolled in this study, the patient with the most severe hearing loss was in the cochlear and vestibular hydrops group. A previous study indicated that EH began at the apical turn of the cochlear and subsequently extended to the cochlear aqueduct and vestibular apparatus. 14 EH usually involved the inferior segment of the labyrinth, mainly in the cochlea and saccule. 15 As the disease progressed, the degree of EH gradually increased. Even after medical treatments, hearing loss and EH will develop longitudinally with the deterioration of inner ear function. 7
At low frequency, the hearing threshold of patients with isolated cochlear hydrops and patients with both cochlear and vestibular hydrops was higher than that of patients with isolated vestibular hydrops. There was a significant correlation between low-frequency hearing loss and cochlear hydrops. In 2017, some researchers created an endolymphatic hydrops model by injecting small volumes of artificial endolymph to explore frequency hearing loss. 16 Based on this model, they measured low-frequency hearing loss using the Auditory Nerve Overlapped Waveform (ANOW) technique. The ANOW originated from the response of the auditory nerve fibers that innervated the cochlear apex. 17 The cochlear apex was one of the most dilatable areas of the inner ear, which may result from the gradation of the width and hardness of the basilar membrane. 18 And this gradation made cochlear apex more prone to accumulation of endolymphatic fluid than other parts of the cochlea. 16 Our results showed that low-frequency hearing loss was predominant in patients with isolated cochlear hydrops. We think that isolated cochlear hydrops may be the early stage of the disease. EH developed from the apical turn of the cochlea and initially affected the apical turn of the cochlea, which caused the distension of cochlear apex and impairment of low-frequency hearing. Our results also showed that the low-frequency hearing threshold was proportional to the grade of cochlear hydrops, which was consistent with the previous results. The audiograms of patients with isolated cochlear hydrops consisted largely of up-sloping pattern and flat pattern, which was consistent with the outcomes of Jose E. Alonso. 19
In our study, the characteristics of hearing loss in patients with isolated vestibular hydrops and patients with cochlear and vestibular hydrops were different from those in patients with isolated cochlear hydrops. These patients had hearing loss at both low and high frequencies, with more severe hearing loss at high frequency. And their audiograms consisted mainly of flat pattern and down-sloping pattern. The previous study indicated that there were multiple gradients in the gene expression profile from the base of the cochlea to the apex.20,21 These gene expression gradients may be related to low- and high-frequency hearing loss. Carmen Martín-Sierra et al. found the expression profile of PKCB II and demonstrated the PRKCB gene was associated with low-frequency hearing. 22 In their study, PKCB II was strongly expressed in 2 types of cochlear supporting cells in the apical turn of the cochlea, followed by the cells in the middle and basal turn and, finally, vestibular hair cells. The gradient in gene expression demonstrated that hearing loss varied with the progression of EH. When the apical turn of the cochlea was involved in the early stage, the patients mainly presented with low-frequency hearing loss. And with the development of the disease, the later involvement of the middle and basal turn of the cochlea and vestibule led to the gradual impairment of high-frequency hearing. The viewpoint of Michael Hoa et al. that disease not only affected low-frequency hearing but was also accompanied by corresponding changes in high-frequency hearing was consistent with ours. 23
There are also limitations in this study. This study was retrospective, so we did not follow patients' disease progression in real time and obtain the corresponding imaging data. The sample size of these patients included in our study was small, and a larger sample size is needed in the future to prove our point of view.
Conclusions
Endolymphatic hydrops mainly involves the apical turn of the cochlea in the early stage of the disease, affecting low-frequency hearing. There is a significant correlation between low-frequency hearing loss and cochlear hydrops, and low-frequency hearing threshold is proportional to the grade of cochlear hydrops. In the stage of isolated cochlear hydrops, patients’ audiograms consist largely of flat type and up-sloping type. With the development of hydrops, hydrops involves the whole cochlea and vestibule, which not only affects low-frequency hearing but also high-frequency hearing. The audiograms of patients with isolated vestibular hydrops and patients with cochlear and vestibular hydrops are mainly flat type and down-sloping type.
Footnotes
Declaration of Conflicting Interests
The author(s) declared no potential conflicts of interest with respect to the research, authorship, and/or publication of this article.
Funding
The author(s) disclosed receipt of the following financial support for the research, authorship, and/or publication of this article: This study was supported by the Shanghai Municipal Science and Technology Commission Biomedicine Division Western Medicine Guidance Project under Grant [19411965700].