
Abstract
Objective
To explore the factors affecting postoperative hearing recovery in chronic otitis media (COM) patients, establish a clinical prediction model for hearing recovery, and verify the accuracy of the model.
Methods
Data of patients with COM who were admitted to our hospital between January 1, 2012 and September 30, 2020 were retrospectively analyzed. We collected data on relevant clinicopathological characteristics of patients. The patients were randomly divided into the development cohort and validation cohorts. A postoperative air-bone gap (ABG) ≤20 dB was defined as successful hearing recovery. Univariate and multivariable logistic regression analyses were used to investigate the association of several prognostic factors with hearing recovery. These factors were then used to establish a nomogram. The model was subjected to bootstrap internal validation and performance evaluation in terms of discrimination, calibration, and clinical validity.
Results
This study included 2146 patients with COM: the development cohort comprised 1610 patients (mean [standard deviation; SD] age, 44.1 [14.7] years; 733 men [45.5%]) and the validation cohort included 536 patients (mean [SD] age, 42.9 [14.4] years; 234 men [43.7%]). Multivariable logistic regression analysis showed that age, duration of onset, styles of surgery (tympanoplasty, canal wall up-CWU, or canal wall down-CWD), ossicular prosthesis, granulation or calcified blocks around the ossicular chain, ossicular chain integrity, duration of drilling, eustachian tube dysfunction, mixed hearing loss, semicircular canal fistula, and second surgery were associated with hearing recovery. A nomogram based on these variables was constructed. The area under the curve was 0.797 (95% confidence interval [CI], 0.778–0.812) in the development cohort and 0.798 (95% CI, 0.7605–0.8355) in the validation cohort.
Conclusions
This study demonstrated the various clinical factors correlated with hearing recovery in patients with COM. The nomogram developed with these data could provide personalized risk estimates of hearing recovery to enhance preoperative counseling and help to set realistic expectations in patients.
Introduction
Chronic otitis media (COM) commonly affects individuals of different ages, sexes, and regions. 1 The specific risk factors for COM include host-related and environmental factors, such as allergy, immunosuppression, upper respiratory tract infection, and socioeconomic status. The incidence of COM is >4% in some developing countries; however, in the United States, it is <1%. 2 COM manifests as long-term or intermittent ear discharge, hearing loss, and tinnitus, and can cause various intracranial and extracranial diseases. It is a global health challenge, and approximately 91% of patients may develop permanent hearing loss.3–5 Individuals continue to explore COM treatment options to prevent progressively worsening hearing loss in such cases. 6 COM-related hearing loss leads to deterioration in the quality of life, social communication impairments, and lower work performance. With advancements in medical technology and equipment, particularly the application of microscopes and otoscopes, ear surgery is becoming minimally invasive. Cleaning the lesion and performing tympanoplasty can improve hearing in most patients. Otologists constantly investigate hearing recovery after COM surgery; however, it is influenced by factors, such as preoperative hearing, different surgical methods, and different ossicular chain conditions.7,8 For example, many clinical investigations have indicated that reconstruction using a partial ossicular replacement prosthesis (PORP) leads to better hearing than reconstruction using a total ossicular replacement prosthesis (TORP). Conversely, some studies have shown that ossicular reconstructions to the stapes footplate with TORP leads to significantly better hearing recovery than reconstructions to the stapes superstructure with PORP. Determining the final postoperative hearing recovery status, that is, improved hearing, no change, or hearing loss, requires a long time.
With the advent of the era of precision medicine, clinical prediction models are increasingly being used in medical diagnosis and treatment decision-making, patient prognosis management, and public health resource allocation, and they have gained vital significance. A clinical prediction model is a complex system with various components, such as research questions, data sets, variables, models, and result reports.9–11
Some scholars have attempted to use computer modeling for medical purposes; however, no useful clinical prediction model for the postoperative hearing recovery of COM patients has been established. 12 We conducted a statistical analysis of multiple factors that may affect the postoperative hearing of patients, established a clinical prediction model, and validated the model. Based on our findings, we can predict postoperative hearing recovery in COM patients, provide them solutions for hearing recovery problems, and suggest the surgeon to focus more on the areas that may affect hearing during the operation. And the patients should understand that due to their own unfavorable factors for hearing, their hearing may not be able to recover well. Through the research on the factors affecting hearing, the factors that are beneficial to hearing recovery during surgery should be handled carefully and strive to achieve the best effect of hearing recovery.
Materials and Methods
Study Cohort and Data
This cohort study obtained patient data from January 1, 2012 to September 30, 2020 from the hospital clinical database of the Shandong Provincial Hospital affiliated to Shandong First Medical University. In total, 2370 patients were diagnosed with COM with or without cholesteatoma, of which, 224 were excluded. Thirty-three patients were diagnosed with otitis media with effusion or acute otitis media and 5 were completely deaf. A total of 106 patients were lost to follow-up, and 80 had COM in both ears. For statistical convenience, we excluded the 80 patients who underwent binaural surgery. Finally, 2146 patients were enrolled in this study. The study population included patients aged ≥8 years with a diagnosis of COM who underwent mastoidectomy with tympanoplasty or tympanoplasty alone. COM can occur with or without cholesteatoma (epithelial inclusion cysts). The final sample was divided into a development cohort (75% of the sample randomly selected) and a validation cohort (the remaining 25% of the sample) for the development of the nomogram and internal validation (Figure 1). Flow diagram of study subjects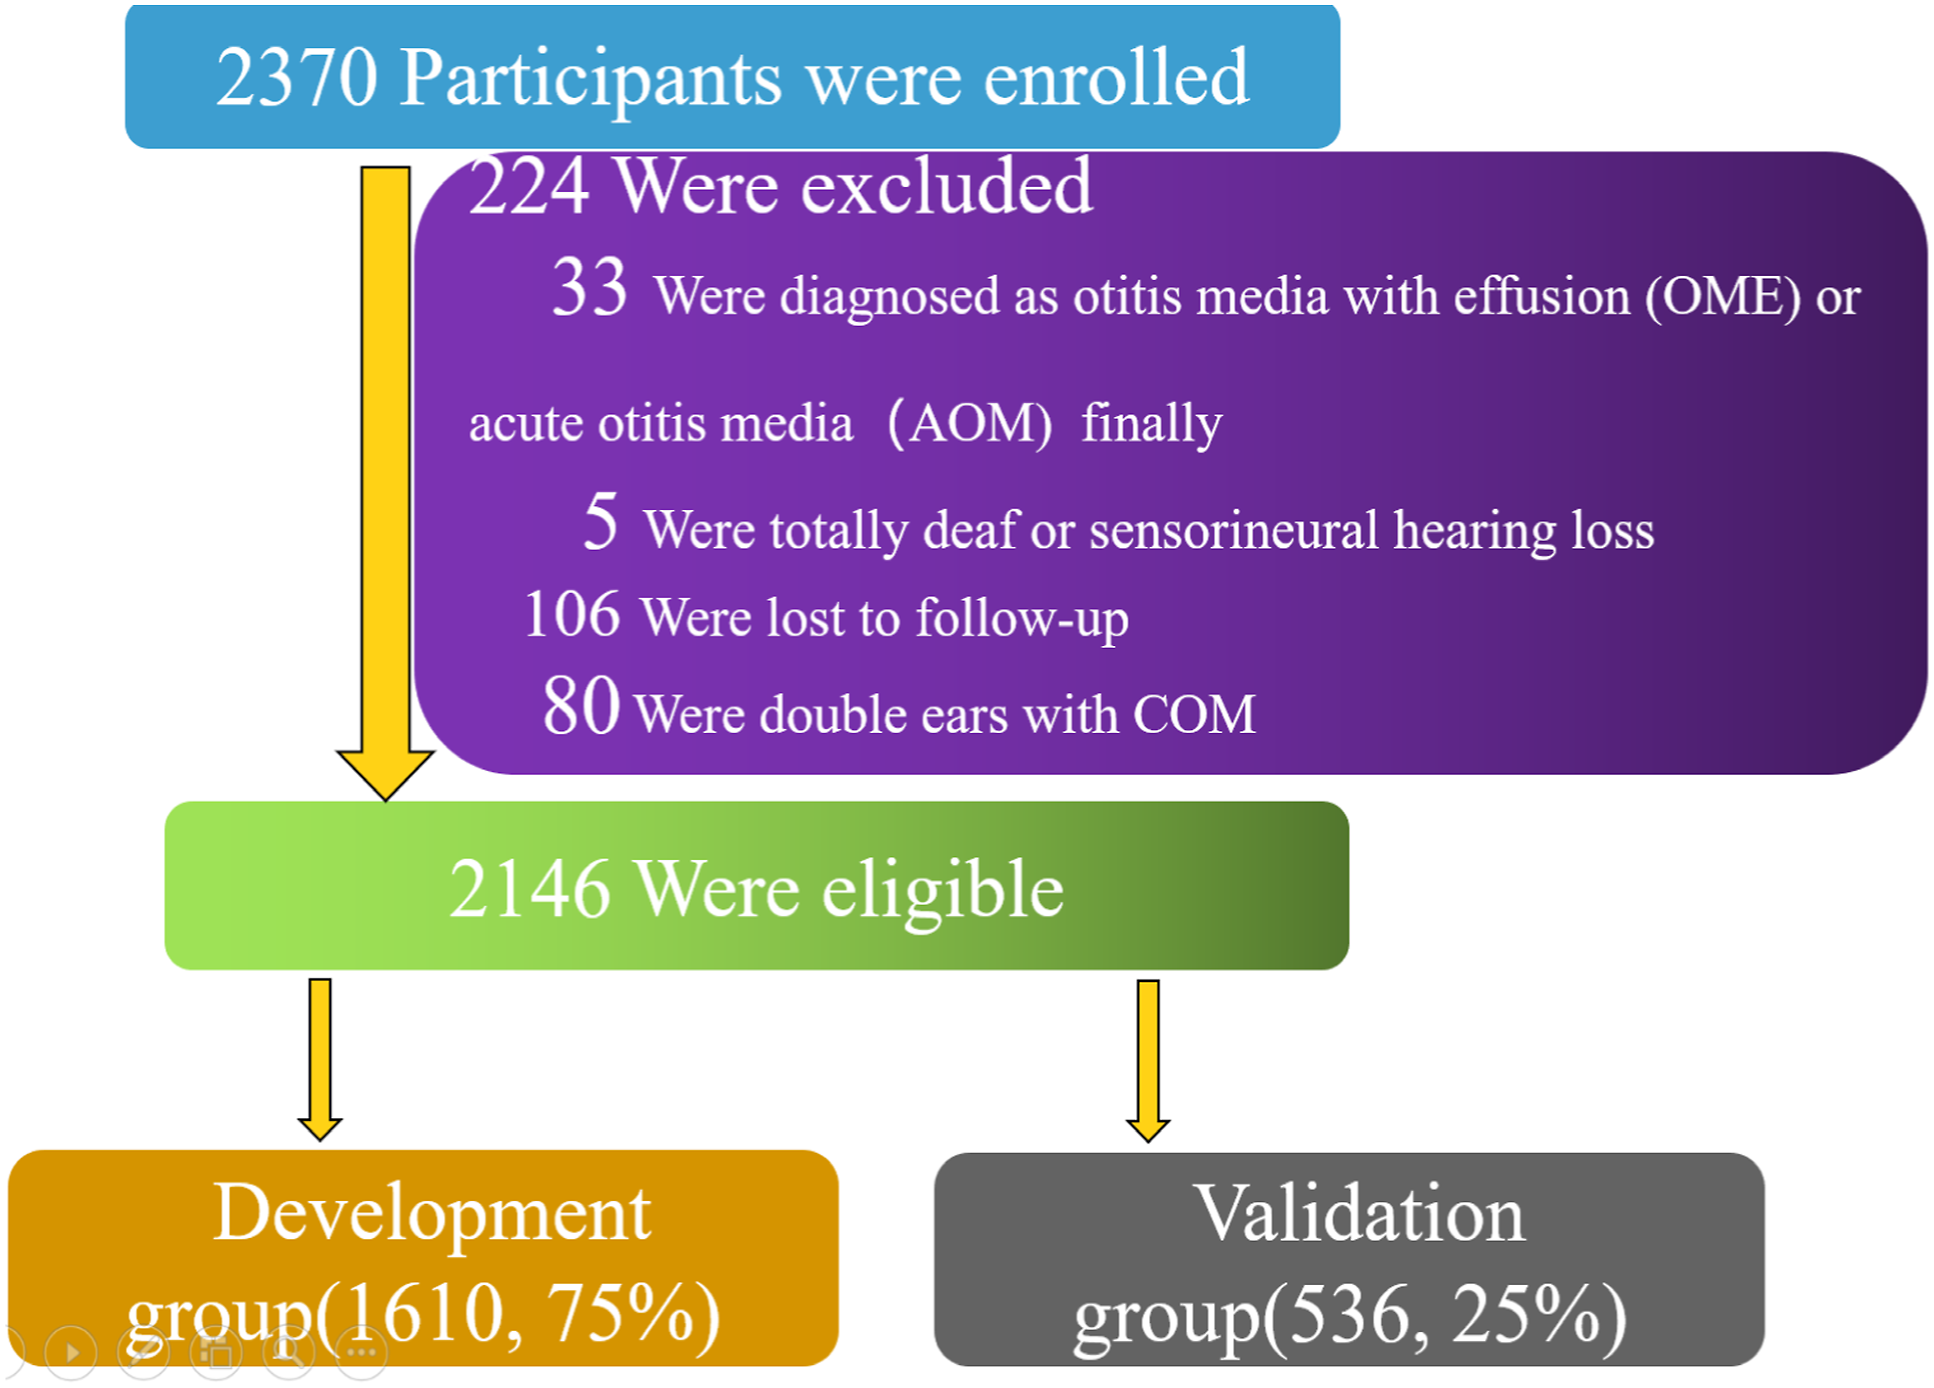
We retrospectively reviewed 16 clinical features including patient age, sex, duration of onset, duration of drilling, type of surgery, ossicular prosthesis, granulation or calcified plaques around the ossicular chain, ossicular chain integrity, eustachian tube dysfunction, mixed hearing loss, dry or wet ear before surgery, semicircular canal fistula, a second surgery, rhinosinusitis, diabetes, and efficacy of hearing recovery. The duration of drilling was the total time for which electric drill was used during the operation. The types of surgery included mastoidectomy with tympanoplasty, including canal wall up (CWU) and canal wall down (CWD), and tympanoplasty alone. We used EDTQ-7, Valsalva’s maneuver, otoscopy, tympanometry, or tubomanometry (TMM) to evaluate the eustachian tube function. Moreover, at least 2 of the 5 items were used for each patient in our study. If the patient’s eustachian tube is dysfunctional, with the patient’s consent, we have performed an eustachian tube balloon dilation operation at the same time.
Audiometry
We performed an audiometric test, as described previously.13,14 All audiological measurements were performed in a soundproof room. The audiologists were blinded to the patients. All patients were followed-up for 6 months after surgery.
According to the guidelines from the American Committee on Hearing and Equilibrium, preoperative and postoperative pure-tone audiometry (PTA) averaged at 0.5, 1, 2, and 4 kHz were calculated, respectively. A postoperative ABG ≤20 dB was defined as successful hearing recovery. 15
Development and Validation Sets
For the development of the nomogram and internal validation, all patients were randomly divided into 2 groups. A total of 1610 samples were assigned to the development group (75% of all the patients), and the remaining samples were assigned to the validation group (25%).
Ethical Standards
The study was approved on April 30, 2021 by the Institutional Review Board and Ethics Committee of the Shandong Provincial Hospital affiliated to Shandong First Medical University (approval no. 2021-150). All patients agreed to use medical records for clinical research when signing the surgical consent form.
Statistical Analyses
Descriptive characteristics were summarized using mean ± standard deviation (SD) for continuous variables and frequency and percentage (N [%]) for categorical variables. Univariate and multivariable logistic regression analyses were used to create models to estimate the risk. Odds ratios (ORs) for the role of each of the variables were presented in the models and are shown as 95% confidence interval (CI). Nomograms were constructed based on the outcomes of multivariable logistic regression analysis. Receiver operating characteristic (ROC) curves built using bootstrapping with 500 resamplings were used to determine the optimal cut-off values for hearing recovery. The ROC curve represents the sensitivity and specificity of the nomogram; however, the false positive and false negative rates cannot be ignored. Internal validation and calibration curves were used to evaluate the accuracy of the nomogram. In a perfect prediction model, the prediction rate falls on the diagonal of 45°. Data were analyzed using the statistical package R (The R Foundation: http://www.r-project.org; version 3.4.3) and Empower (R) (http://www.empowerstats.com, X&Y Solutions, Inc., Boston, Massachusetts).
Results
Patient Characteristics
The characteristics of the study sample.
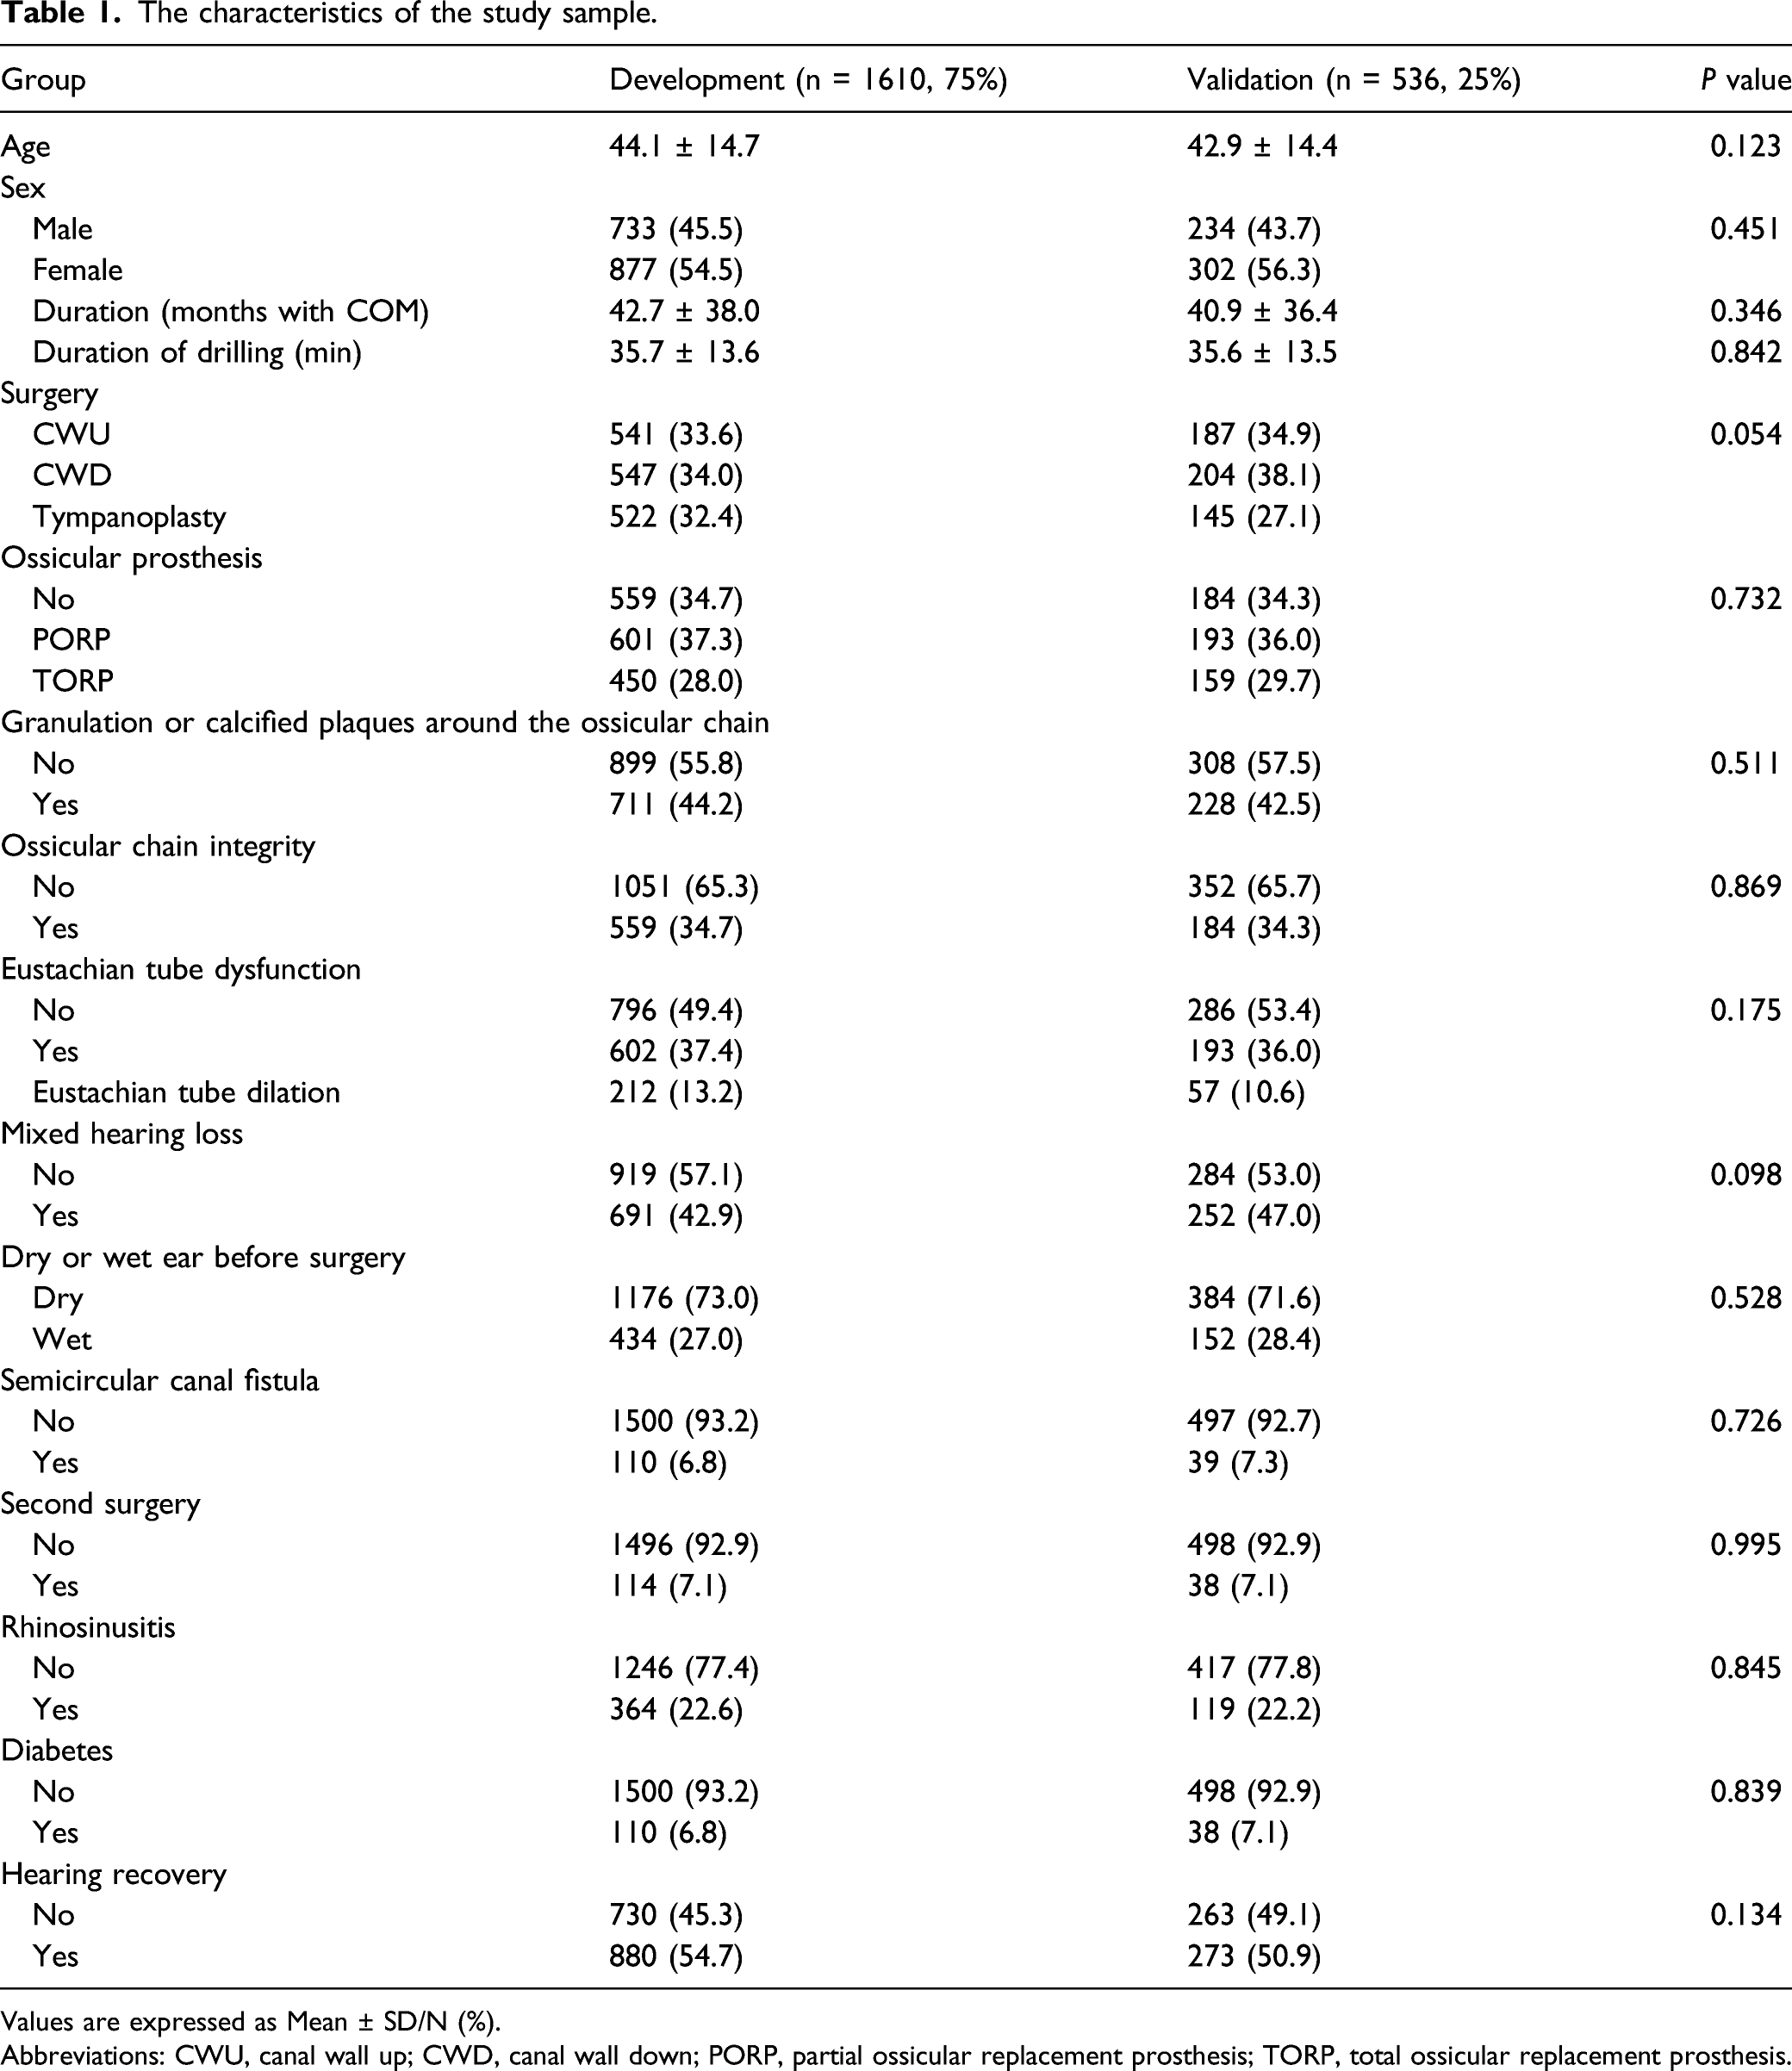
Values are expressed as Mean ± SD/N (%).
Abbreviations: CWU, canal wall up; CWD, canal wall down; PORP, partial ossicular replacement prosthesis; TORP, total ossicular replacement prosthesis.
Risk Factors and Prognostic Nomogram of the Development Model
Univariable and Multivariable Logistic Regression Models Using the Clinical Variables of the Development Group.
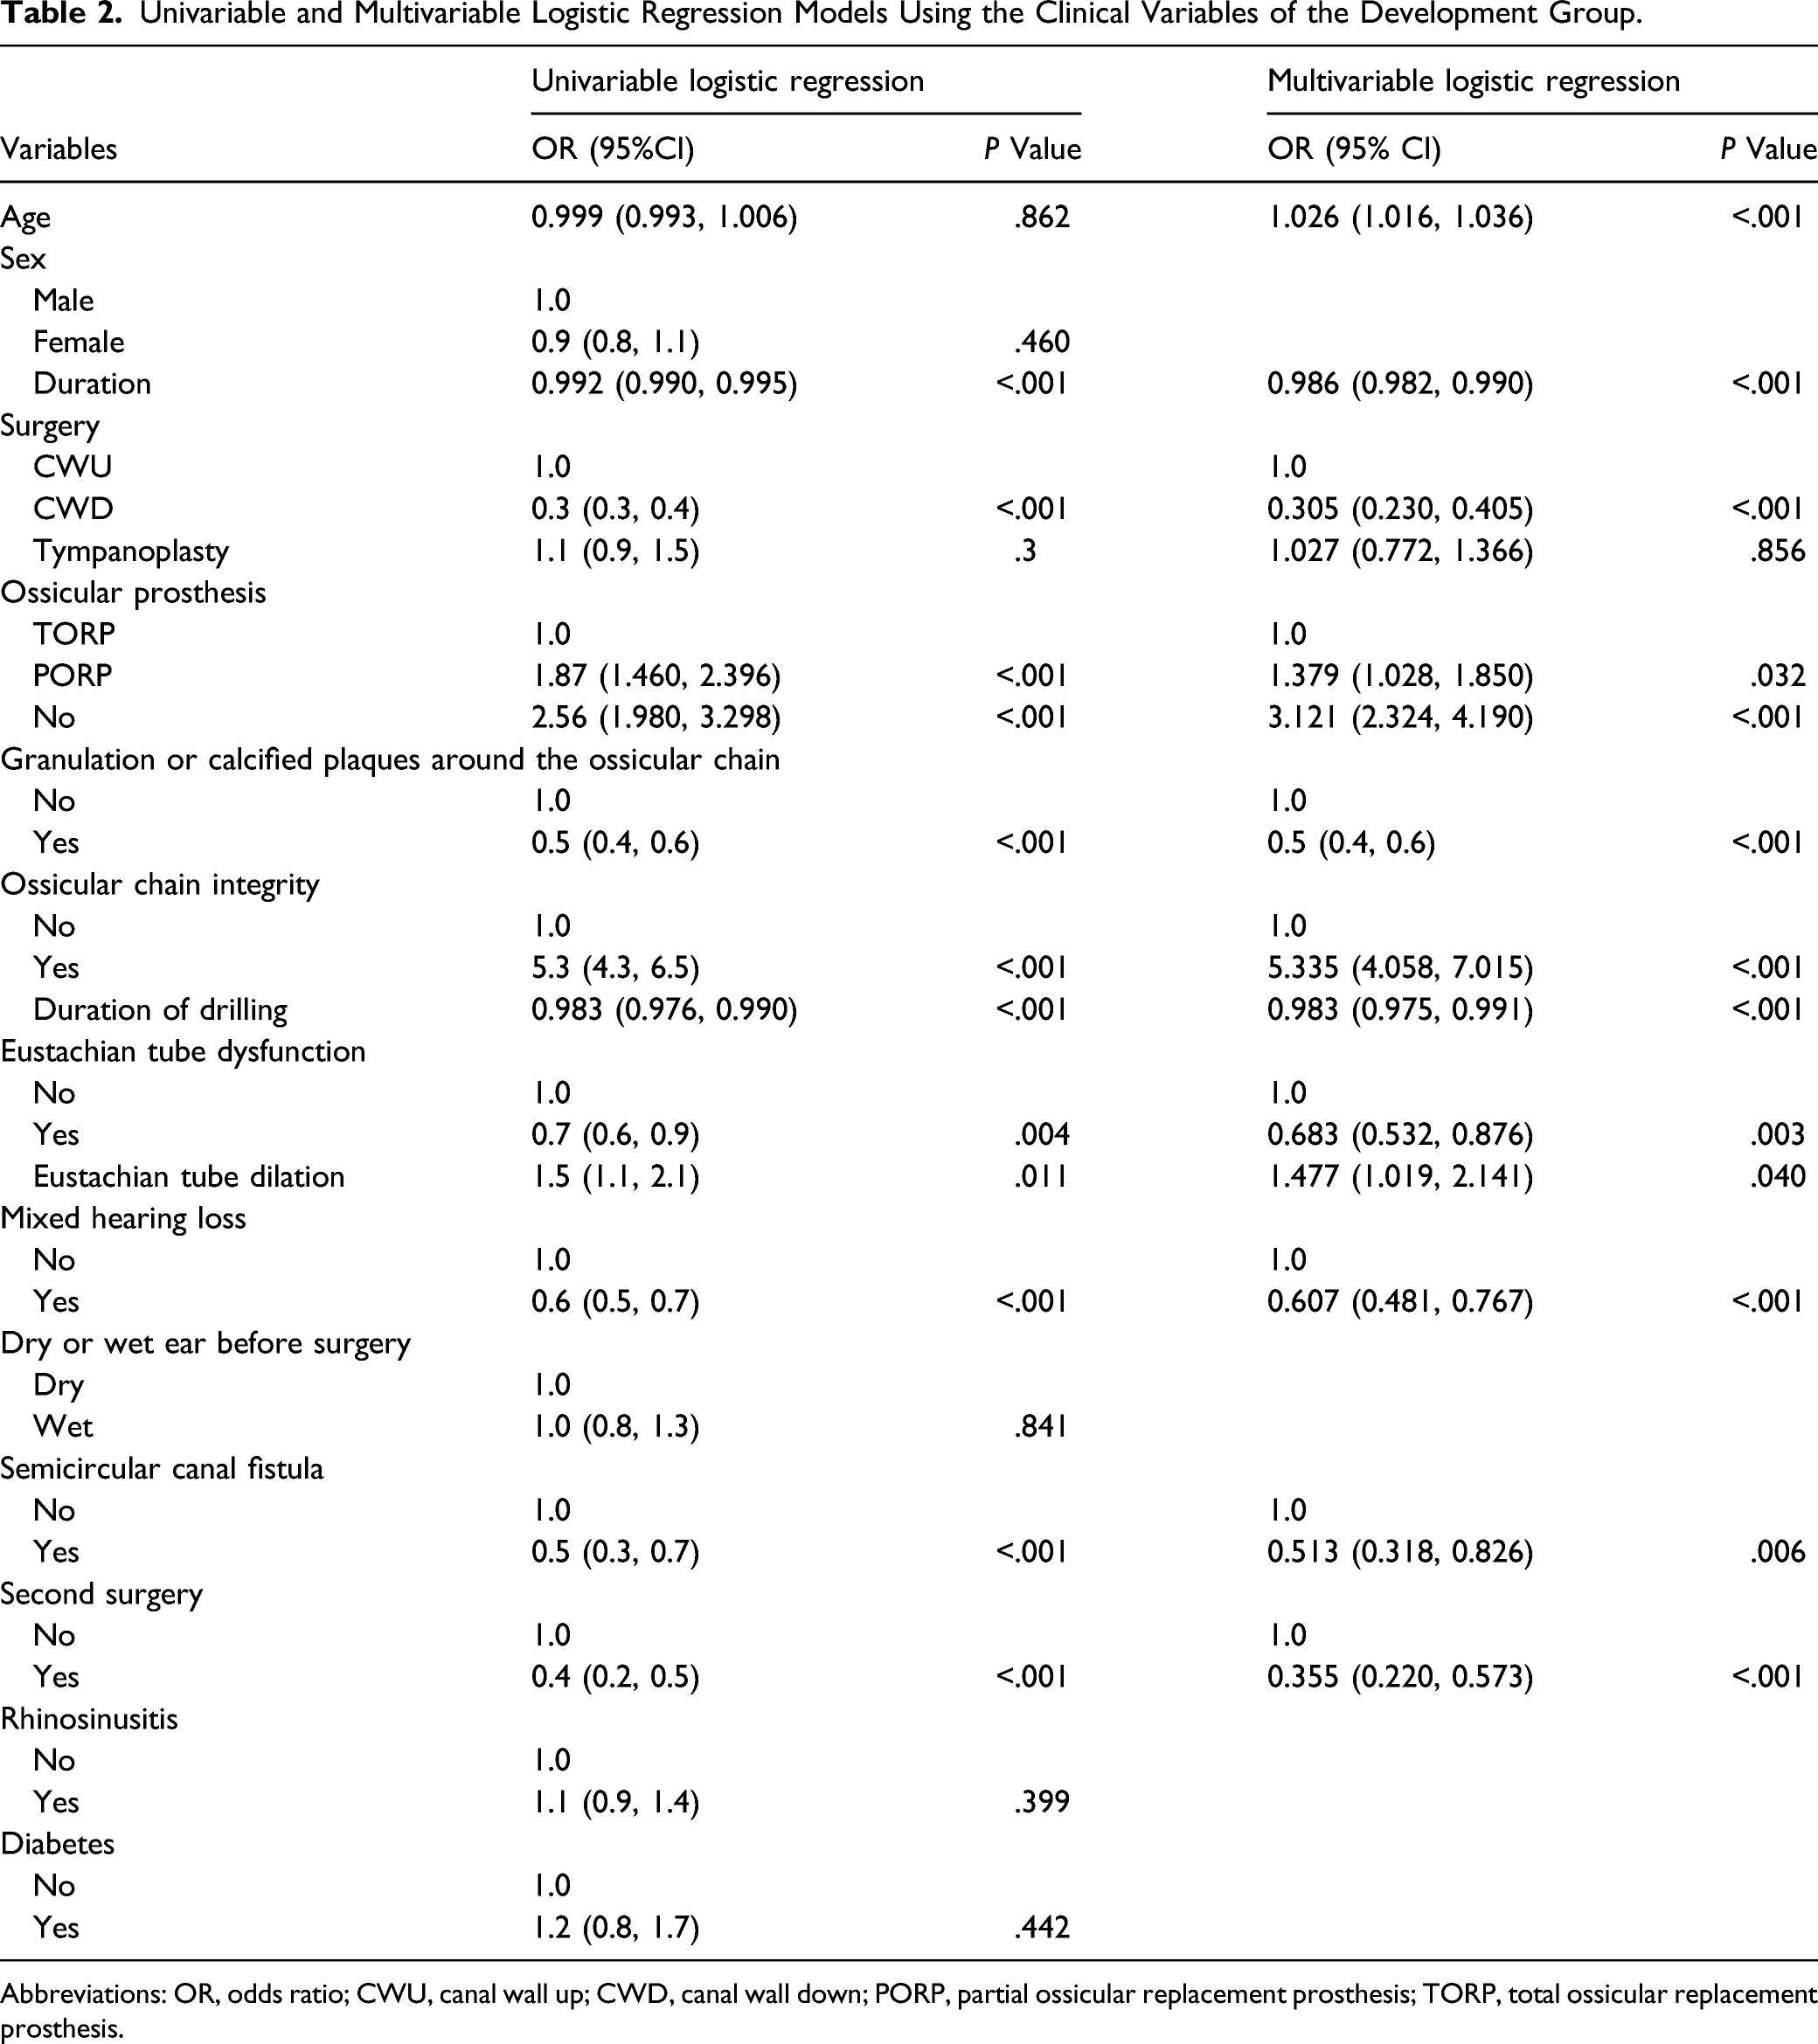
Abbreviations: OR, odds ratio; CWU, canal wall up; CWD, canal wall down; PORP, partial ossicular replacement prosthesis; TORP, total ossicular replacement prosthesis.
Multivariable logistic analyses were performed using the significant risk factors determined in the univariate analysis. Although age was not significant in the univariate analysis, there is sufficient evidence from previous literature that age is an important impact on hearing recovery. Therefore, age was also included in the multivariable analysis. All significant risk factors in the univariate analysis were also significant independent factors in the multivariable analysis(Figure 2). Multivariable logistic analysis of risk factors for hearing recovery in the development cohort.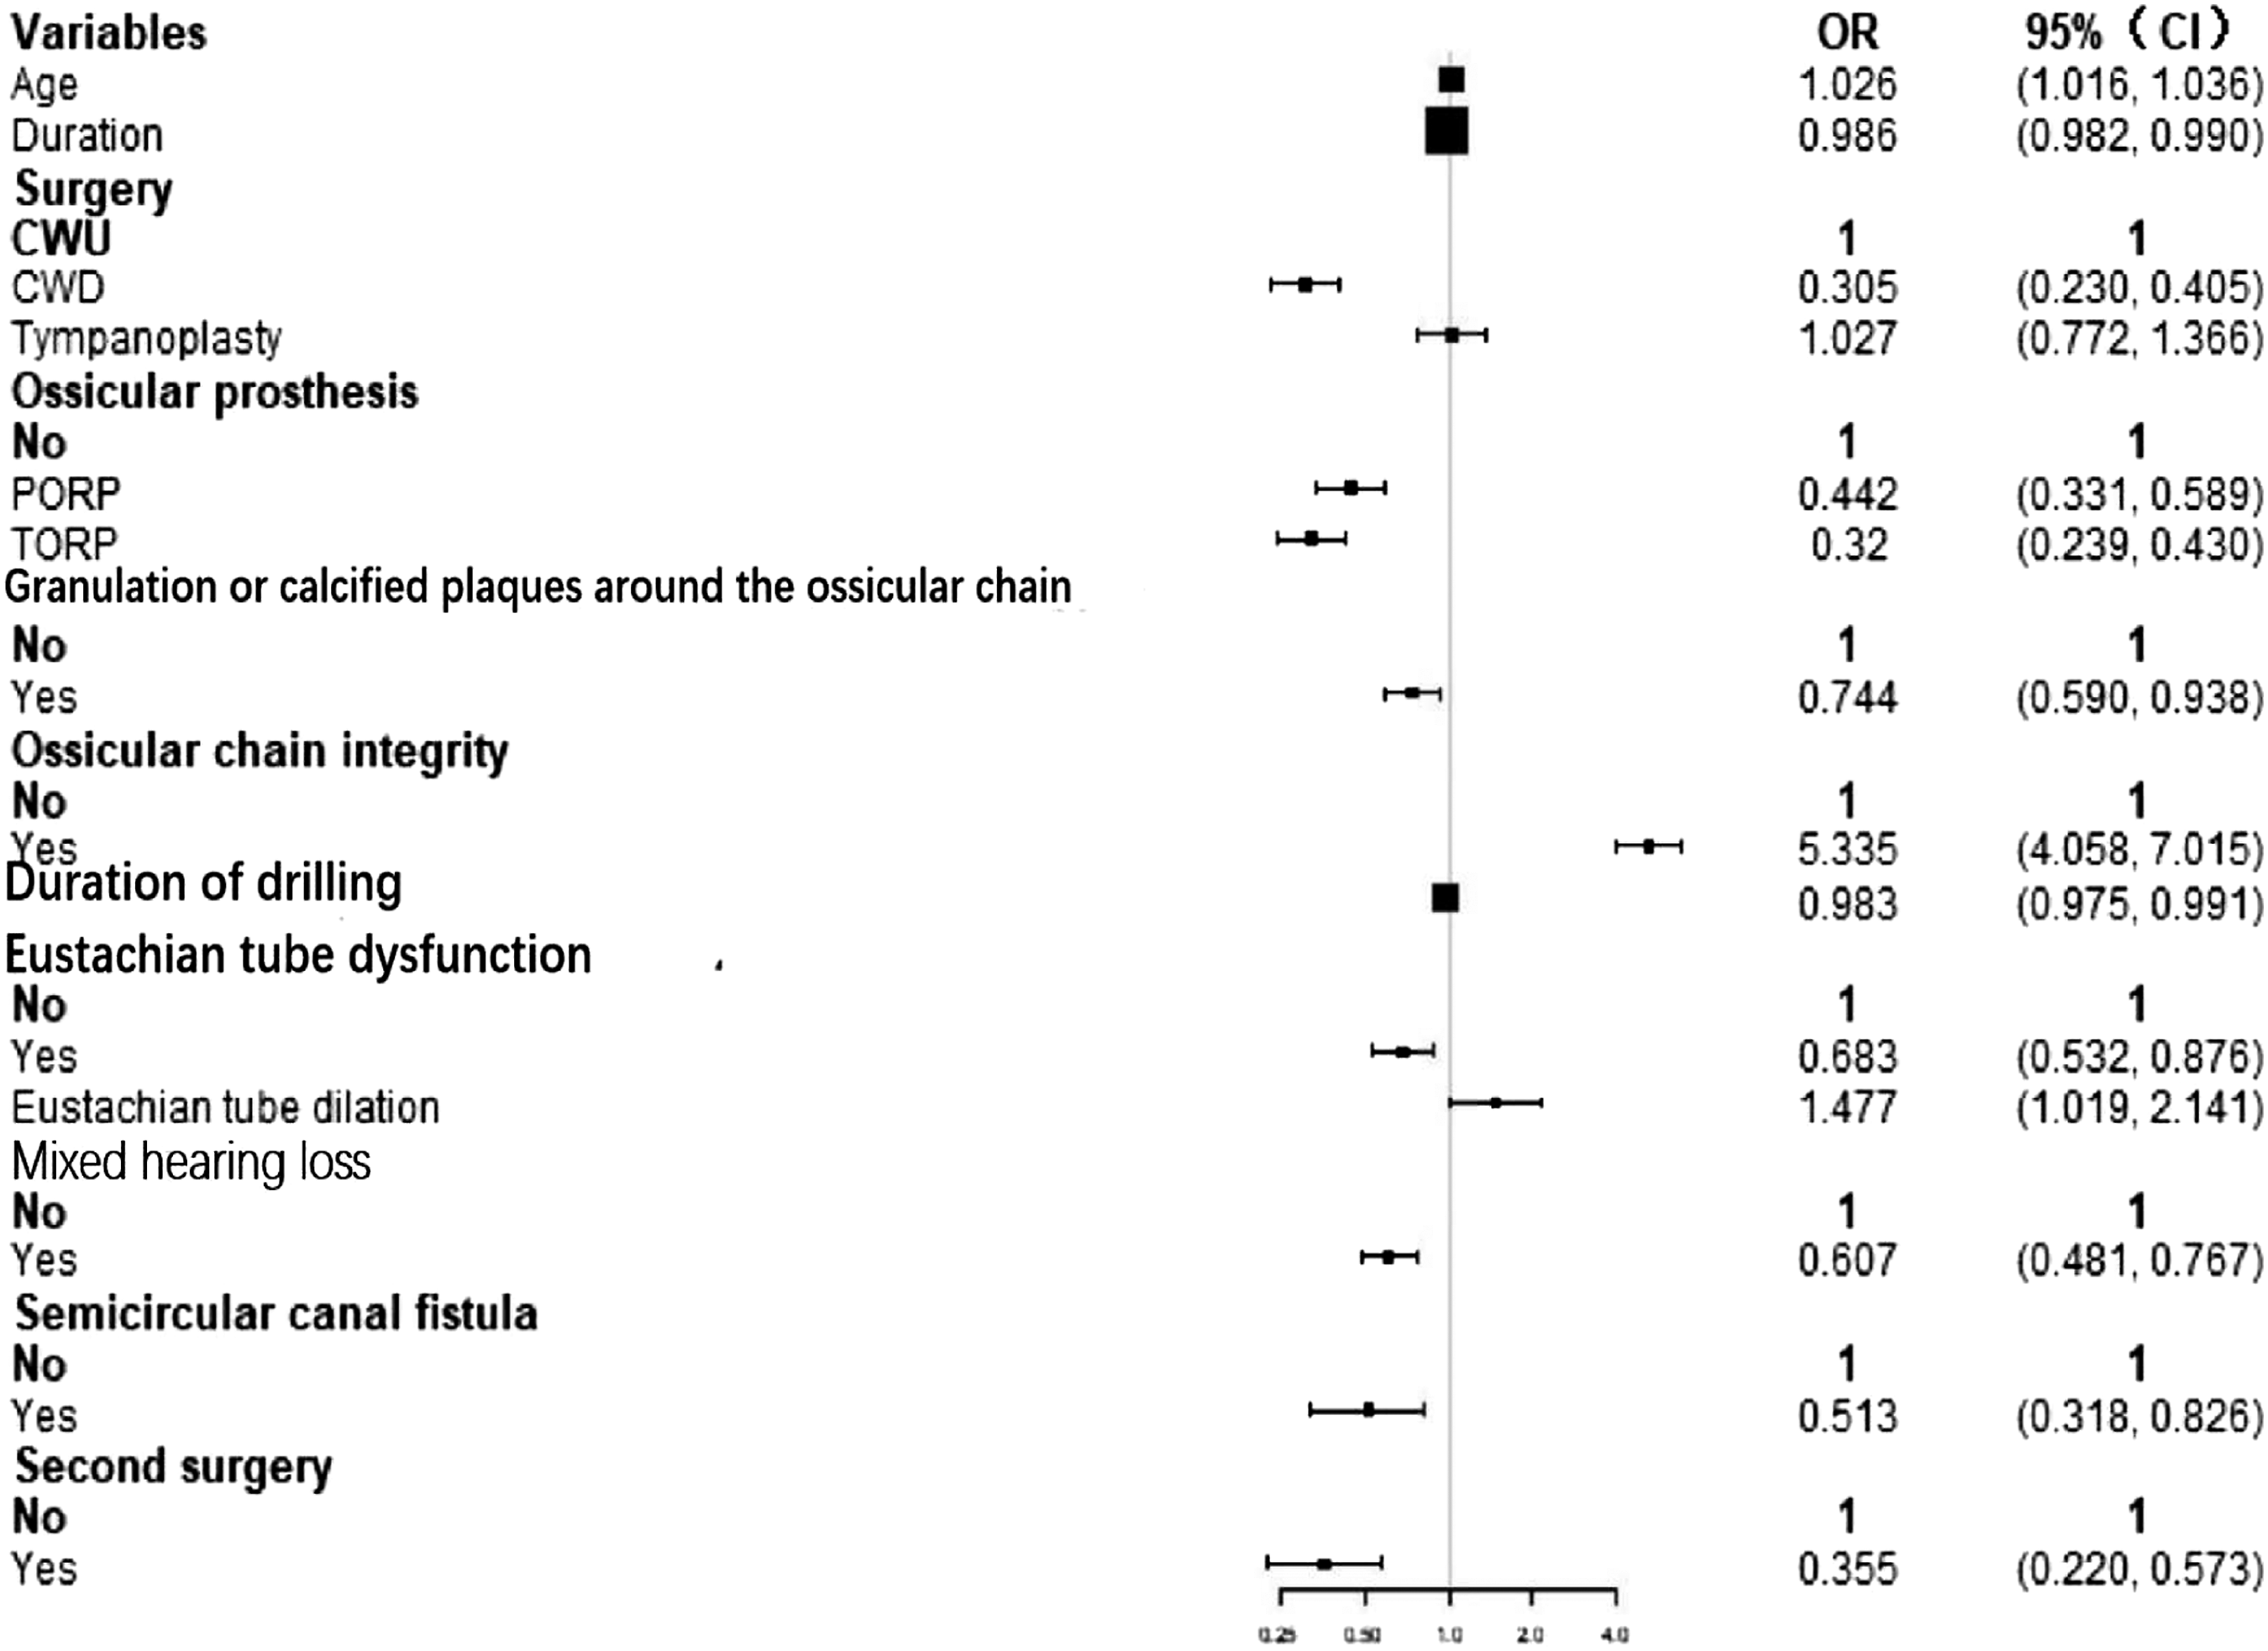
Based on these results, we developed a nomogram to predict the probability of hearing recovery (Figure 3). The score for each clinical factor is determined by drawing a line from the factor to the points axis. The sum of the points is located on the total points axis, sum represents the probability of hearing recovery by drawing straight down to the efficacy. Prognostic nomogram of the development model (A) and an example on how to use the nomogram (B). Each clinical variable has a certain number of points (top row), ranging from 0 to 100. These points are added to generate a total number of points, which then corresponds to the probability of efficacy. Age is in years. Duration is in months. Surgery (0-CWU, 1-CWD, 2-Tympanoplasty). Second surgery (0-No, 1-Yes). Abbreviations: OP, ossicular prosthesis (0-No, 1-PORP, 2-TORP); GCPAOB, granulation or calcified plaques around the ossicular chain (0-No, 1-Yes); OCI, ossicular chain integrity (0-No, 1-Yes); DOD, duration of drilling (minutes); ETD, eustachian tube dysfunction (0-No, 1-Yes, 2-Eustachian tube dilation); MHL, mixed hearing loss (0-No, 1-Yes); SCF, semicircular canal fistula (0-No, 1-Yes).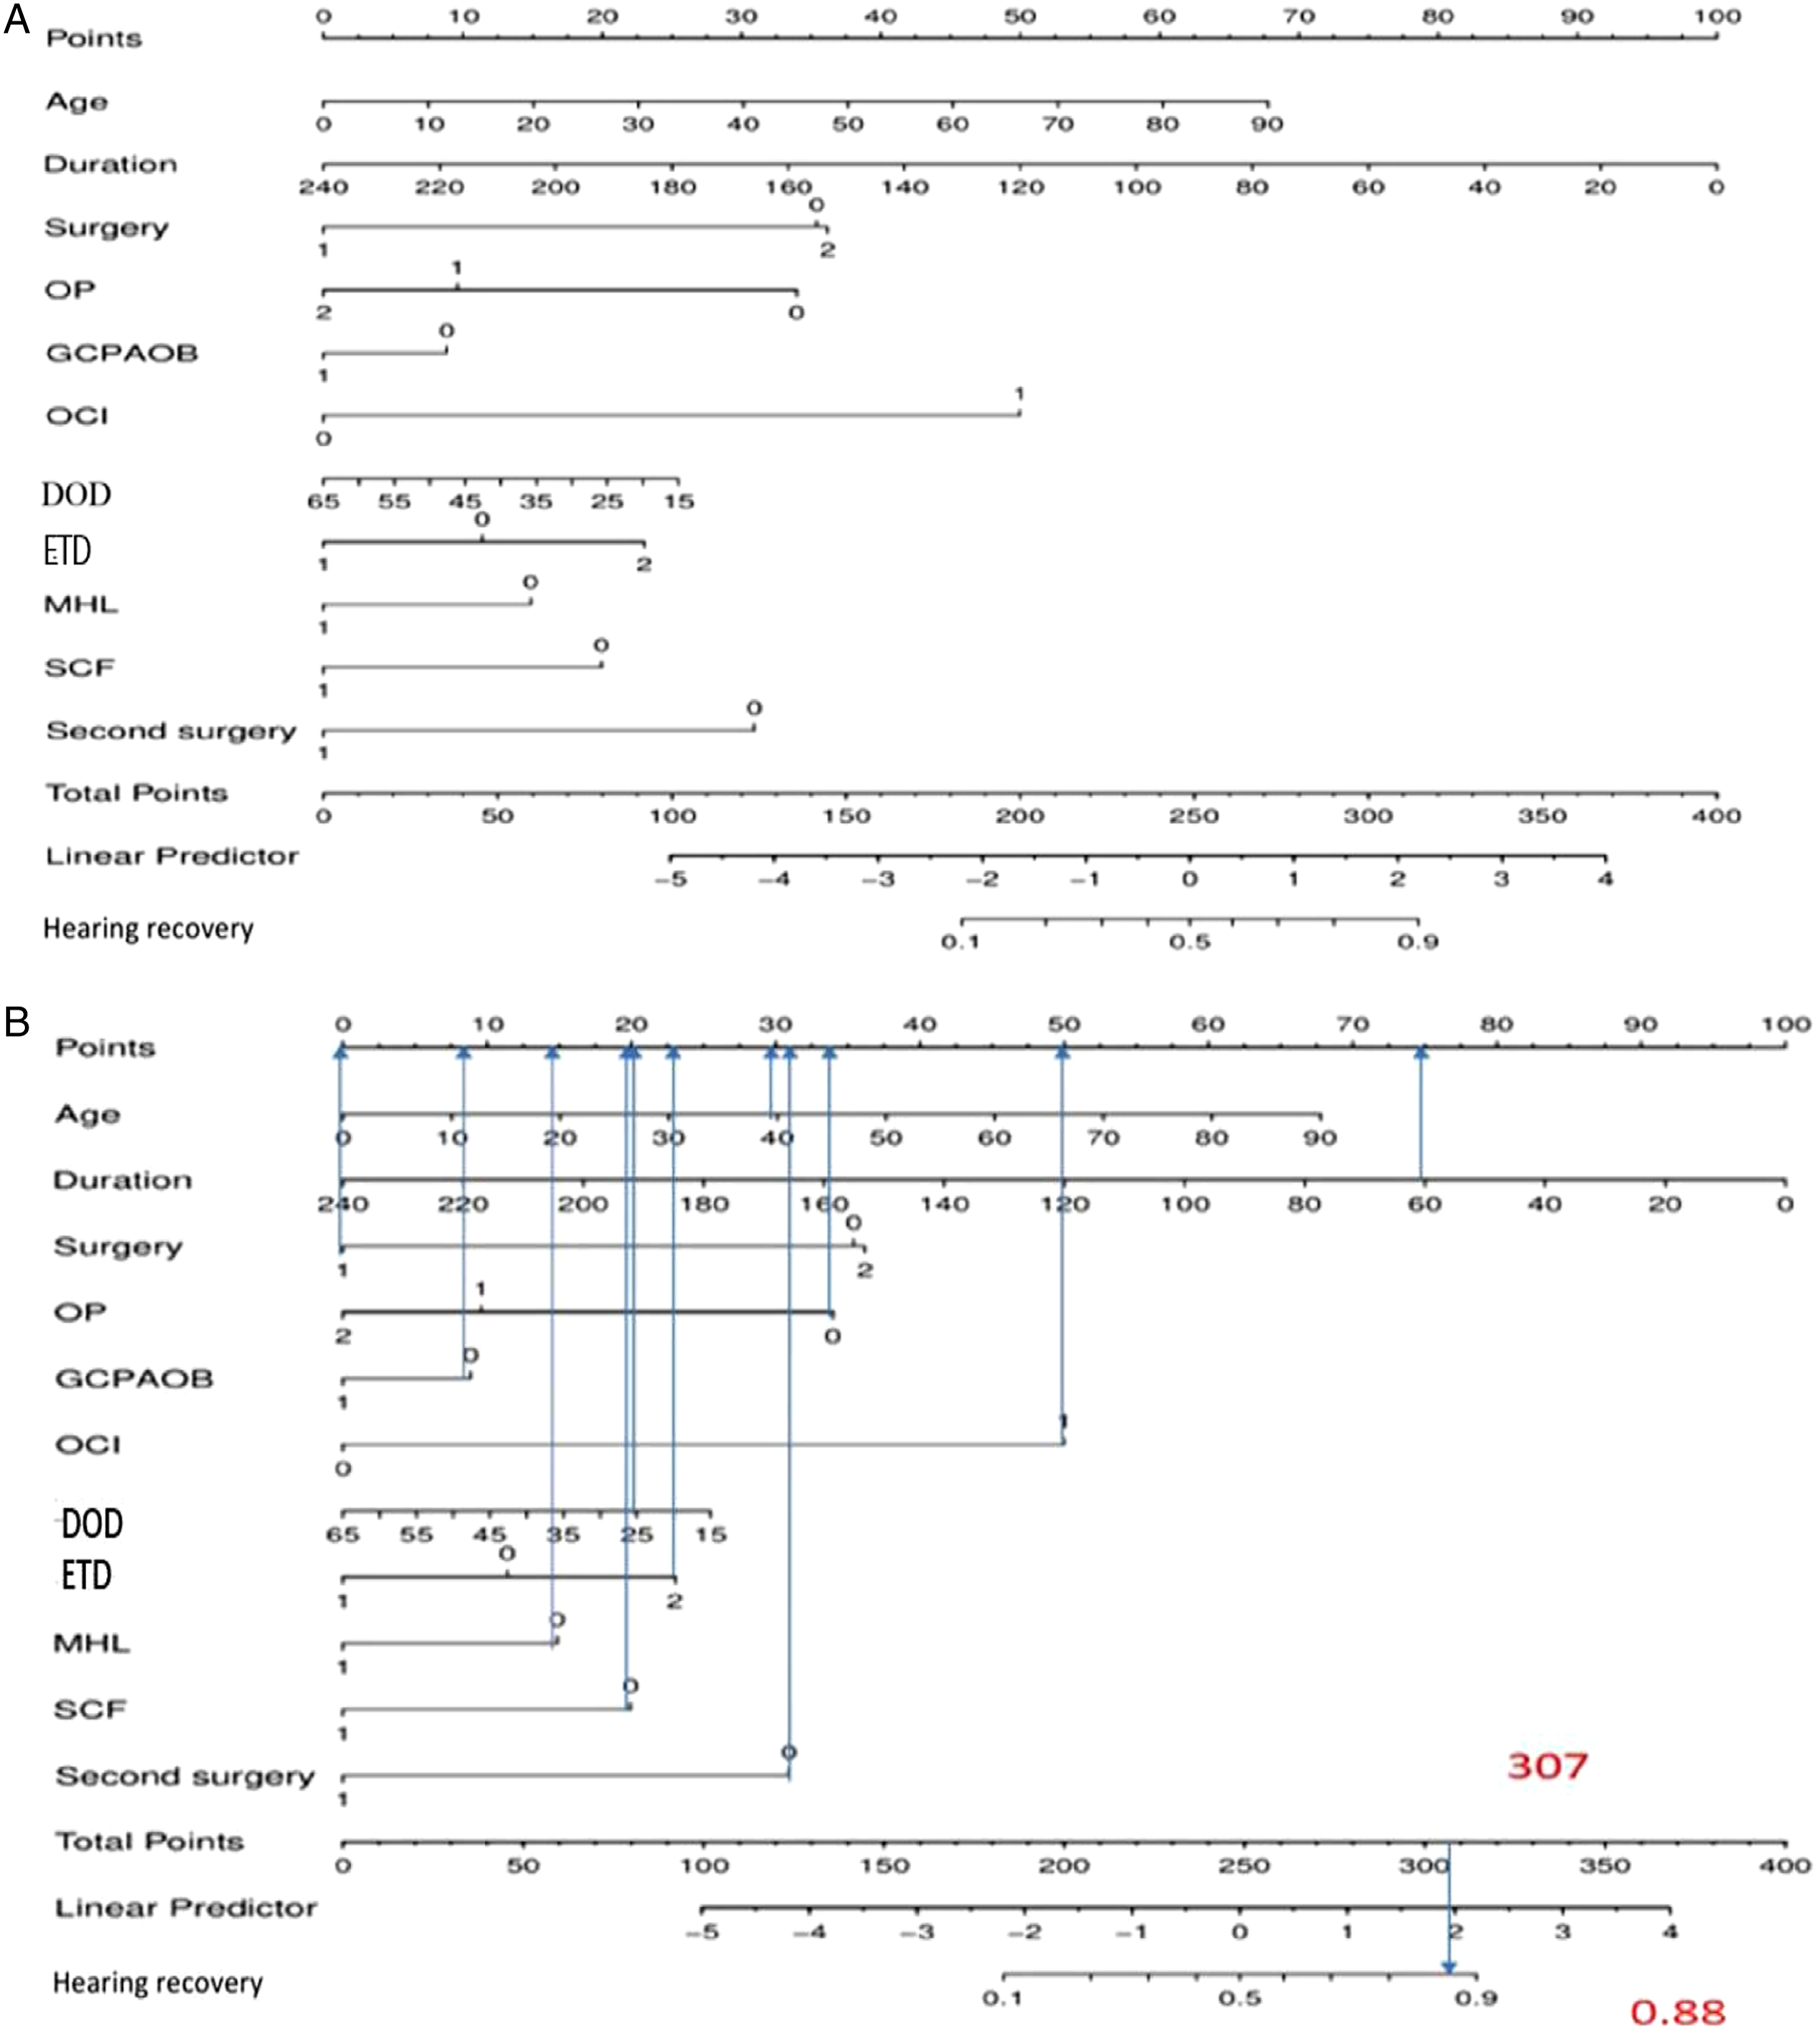
An example of the nomogram is shown in Figure 3B. A 40-year-old COM patient with COM who underwent CWD (0 points) had 30 points for age, 75 points for duration, 34 points for no ossicular prosthesis implant, 8 points for no granulation or calcified plaques around the ossicular chain, 50 points for the complete ossicular chain, 21 points for an electric drilling duration of 25 min, 23 points for eustachian tube dysfunction and dilation, 15 points for no mixed hearing loss, 20 points for no semicircular canal fistula, and 31 points for the first surgery, totaling 307 points. The total points correspond to a probability of hearing recovery of 88%.
Prediction of Nomogram Performance in the Development Model
ROC curves were formulated to assess the accuracy of the nomogram. Our nomogram showed good performance in hearing prediction, with an area under the curve (AUC) of 0.797 (95% CI, 0.778–0.812) (Figure 4). The calibration plot showed that the probability of hearing recovery predicted by the nomogram and the actual observed efficacy were relatively well matched, with a bootstrap-corrected C index of 0.802 (95% CI, 0.781–0.824) (Figure 5). The ROC curves in the development group on the basis of the nomogram, using Bootstrap resampling (times = 500). Plots describing the calibration of the nomogram of efficacy between predicted and observed in the development model. The model performance is shown by the curve, relative to the 45° line, which represents perfect prediction. The yellow shadow shows a bootstrap-corrected C index of 0.802 (95% CI, 0.781–0.824). Prediction of nomogram performance in the validation model.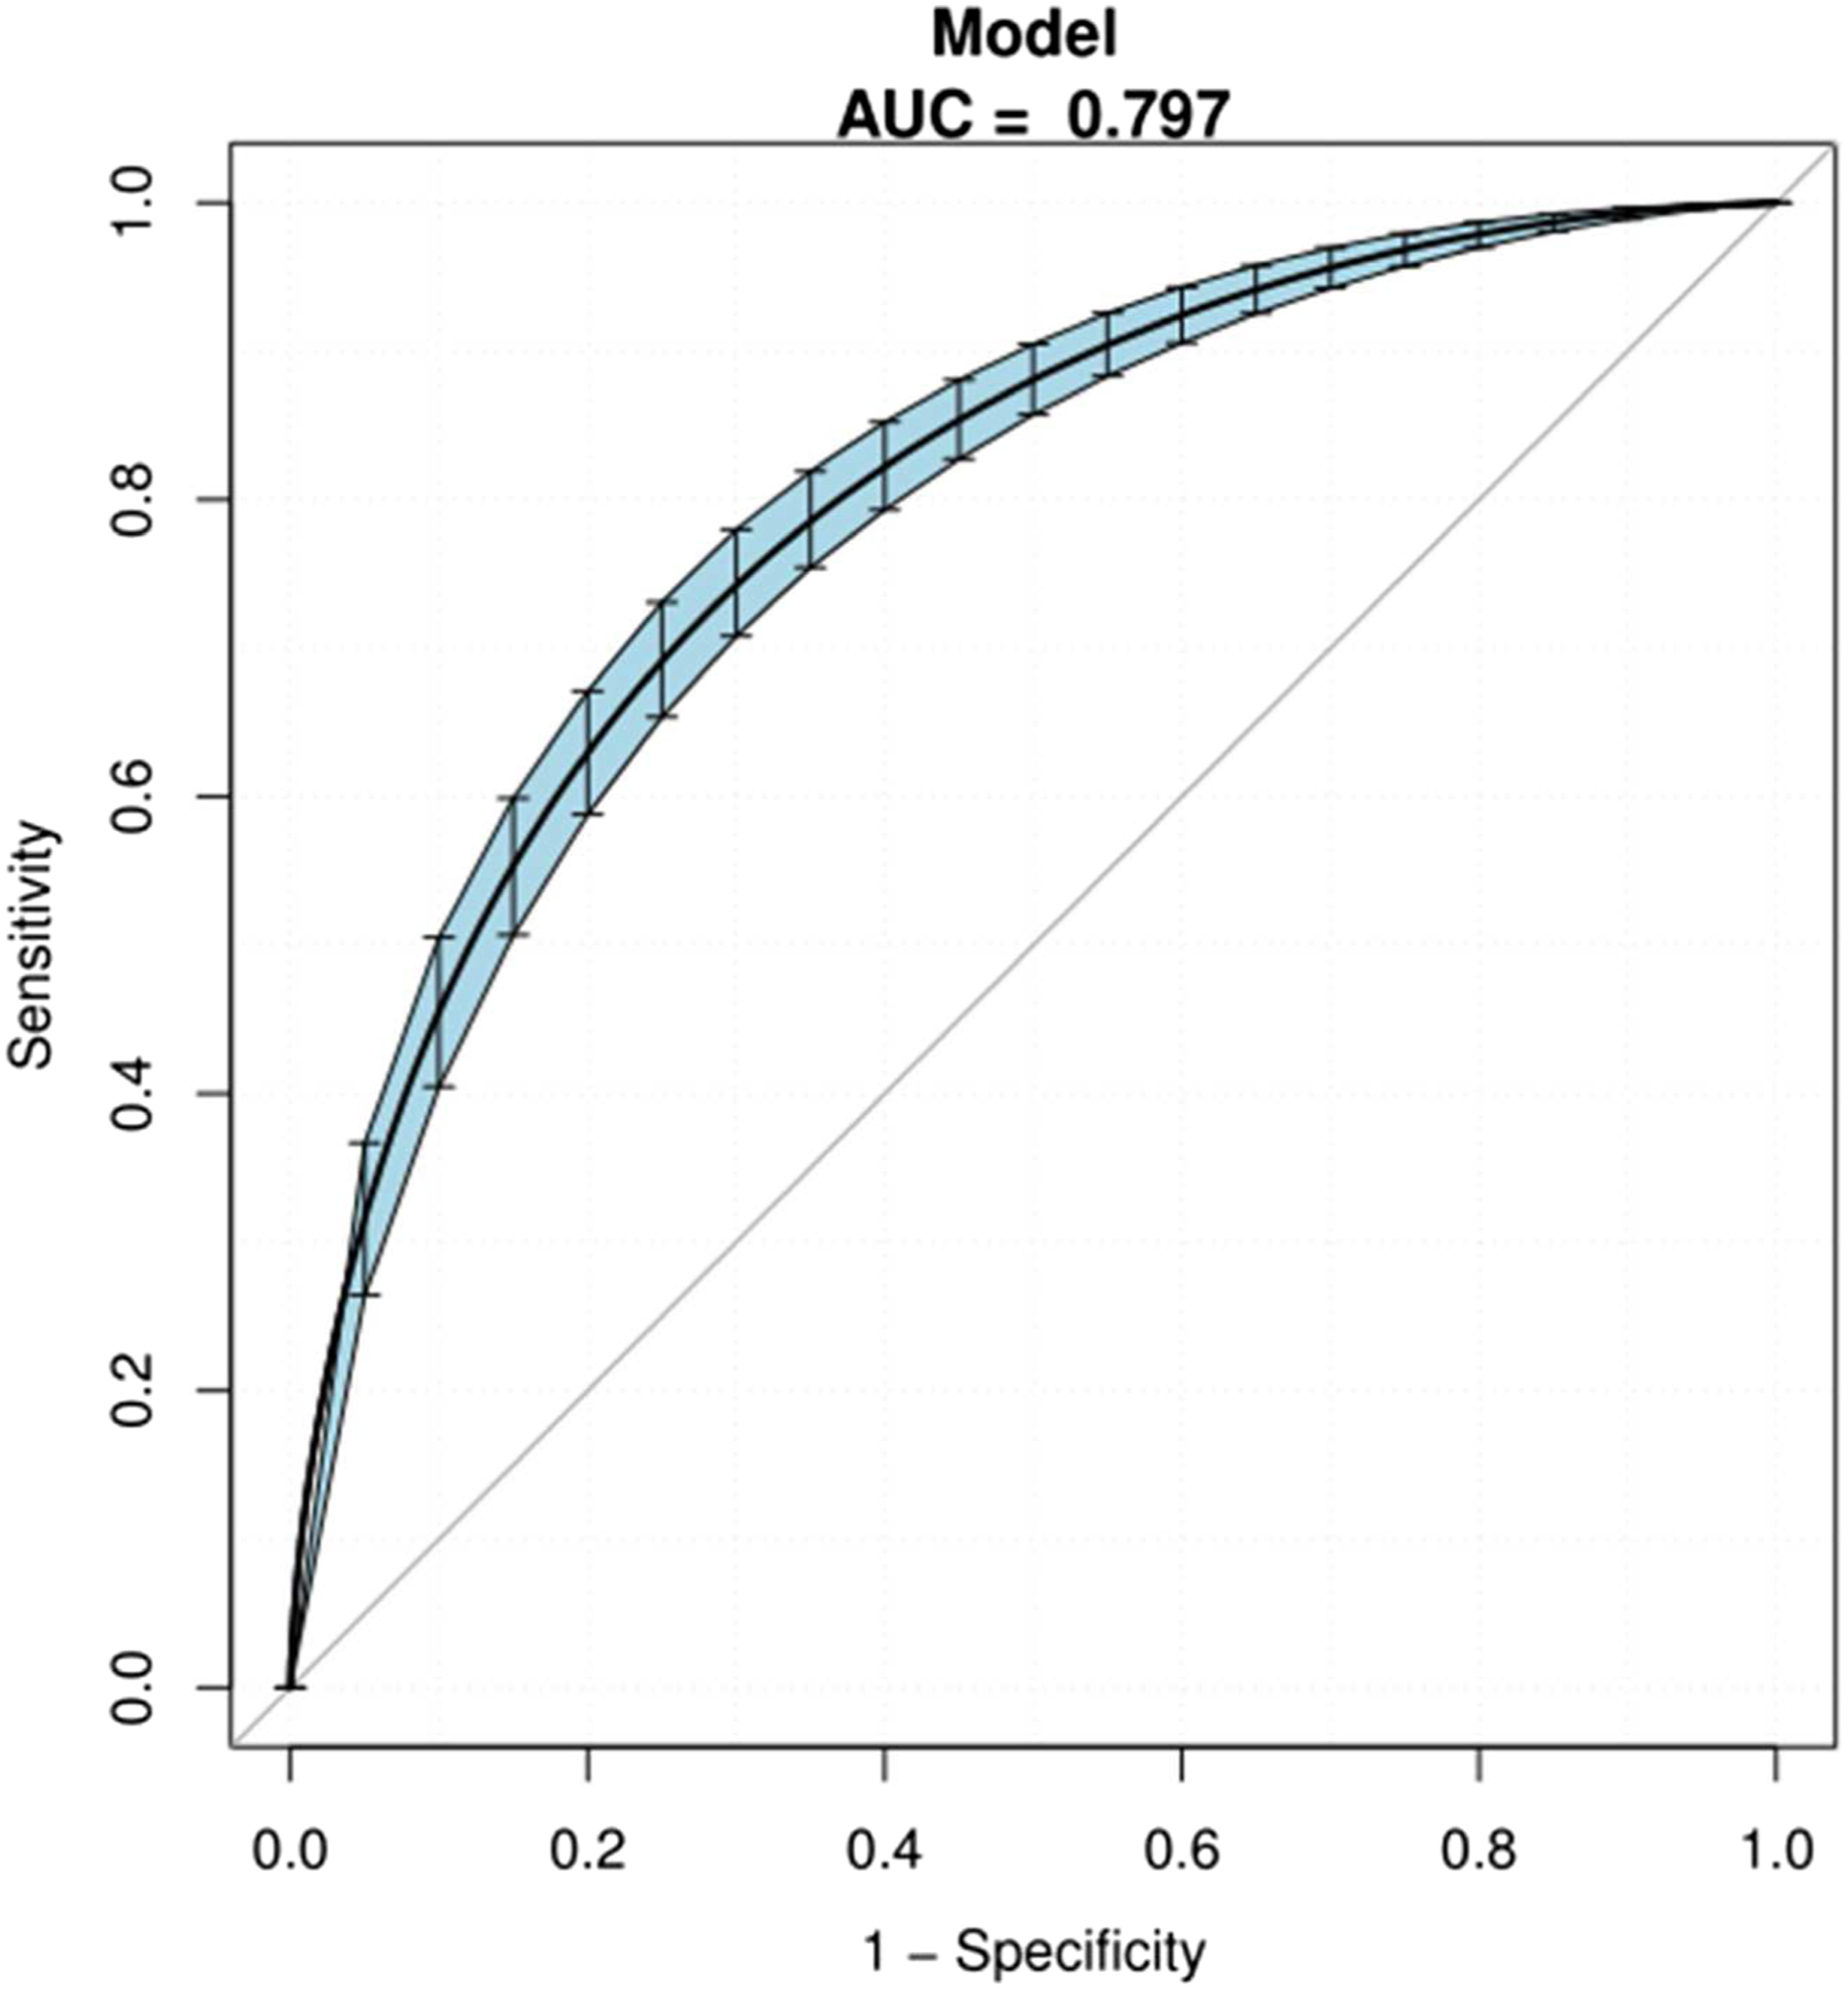
The AUC was 0.797 (95% CI, 0.778–0.817), and sensitivity and specificity were 74.3% and 74.3%, respectively. The blue shadow represented the 95% CI of the AUC curve. Abbreviations: ROC, receiver operator characteristic and AUC, area under the curve.
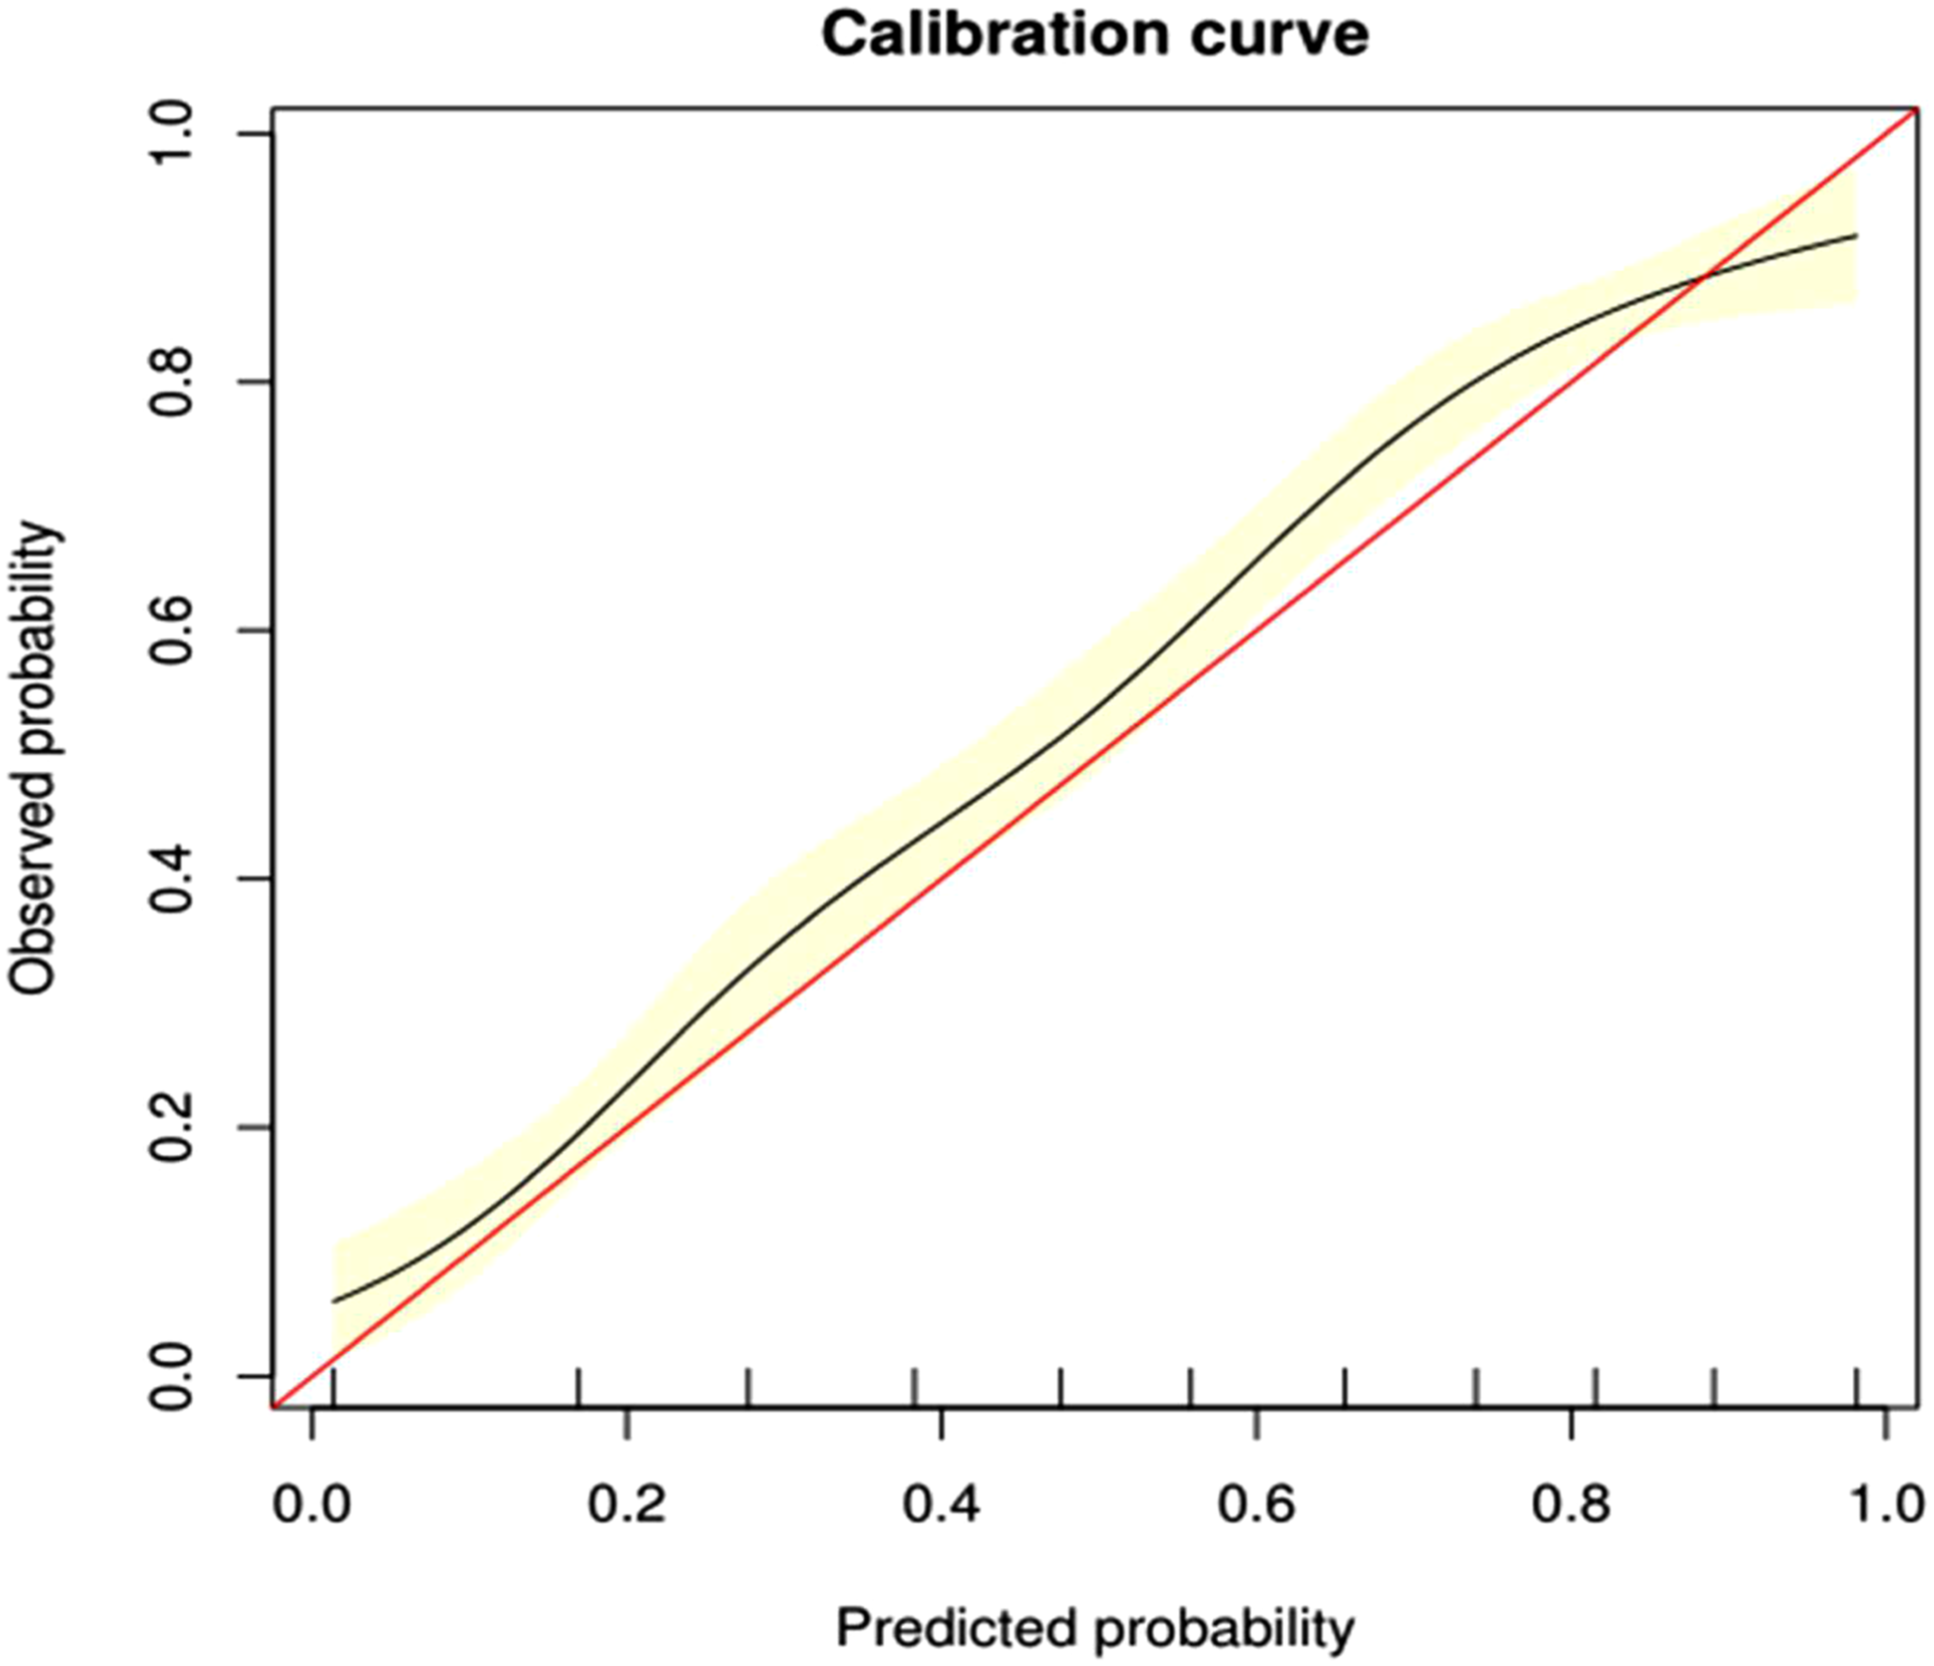
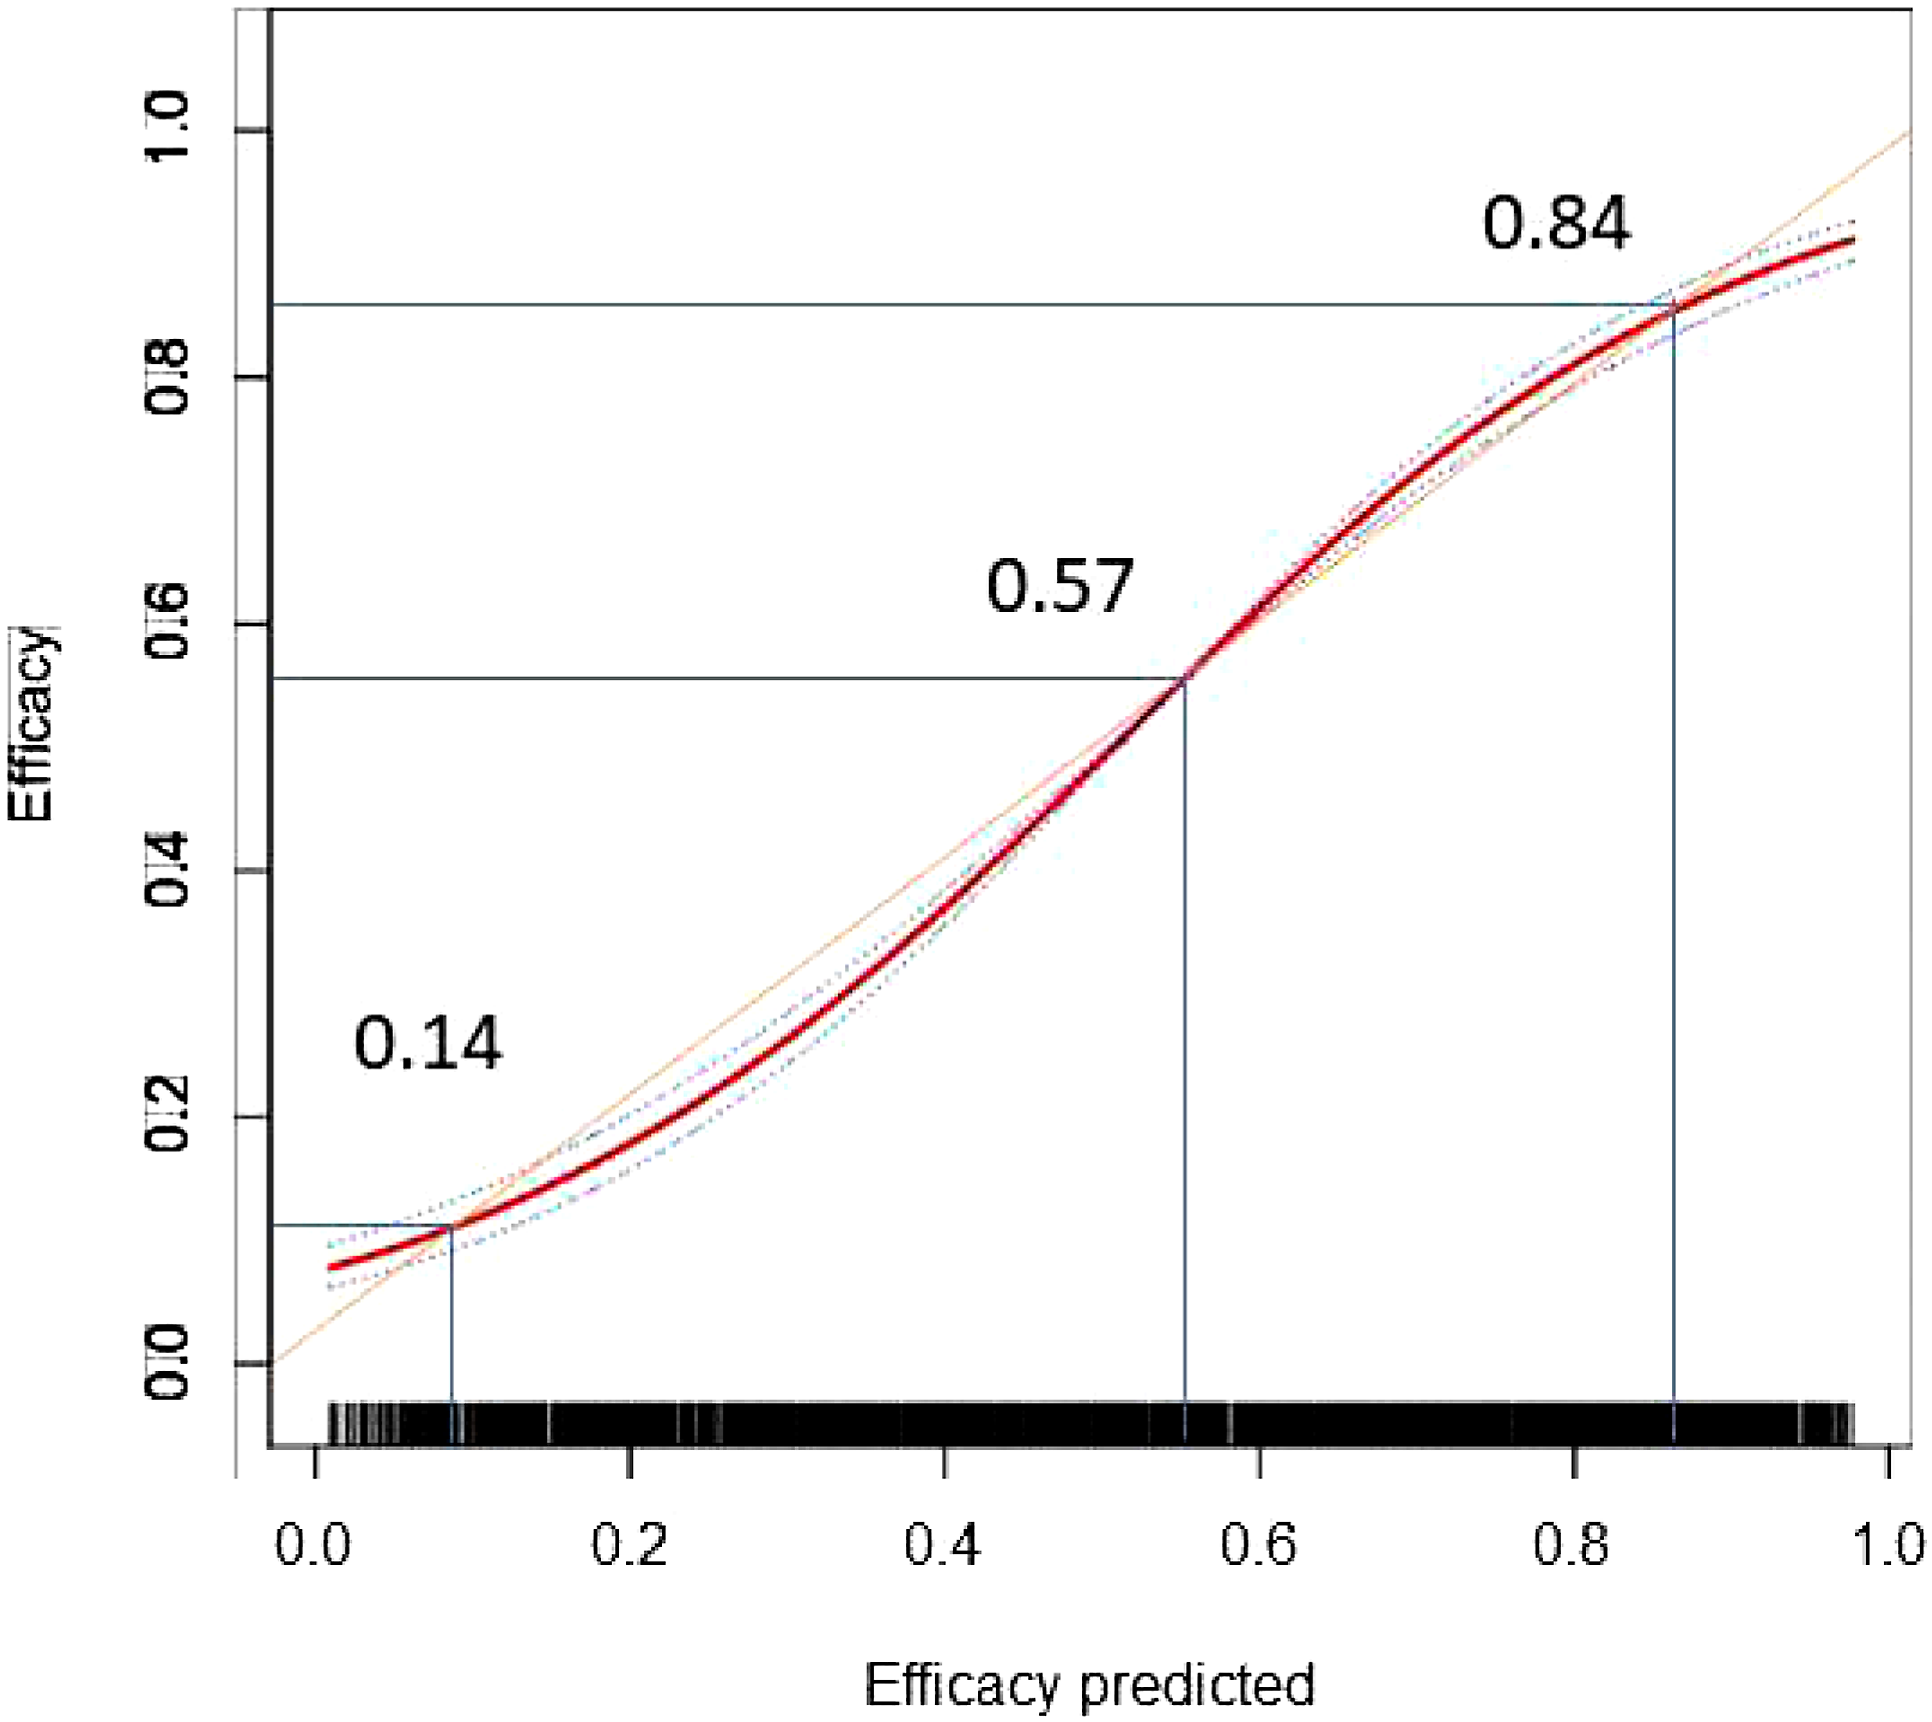
A total of 536 patients were included in the validation model. The accuracy of predicting hearing recovery in the validation model was high, with an AUC of 0.798 (95% CI, 0.7605–0.8355) (Figure 6). In the whole cohort (including development and internal validation models), the calibration plot for the probability of efficacy showed a good agreement between the predicted and actual observations (Figure 7). There were 3 cut-off points in the calibration plot: for values <0.14 and between 0.57 and 0.84, the predicted efficacy was slightly higher than the observed efficacy, whereas for values >0.84 and between 0.14 and 0.57, it was slightly lower than the observed efficacy. The calibration plot showed that the predicted risk in our model closely approximated the observed risk. Predictive performance of the development and validation model. Abbreviations: D, development model; V, validation model. Calibration plot of prediction in the whole cohort. The orange line is the diagonal of 45°representing the perfect model. There were 3 cut-off points. The curve below the orange line means that the predictive ability is lower than the actual efficacy, whereas the curve above the orange line means that the predictive ability is higher than the actual efficacy.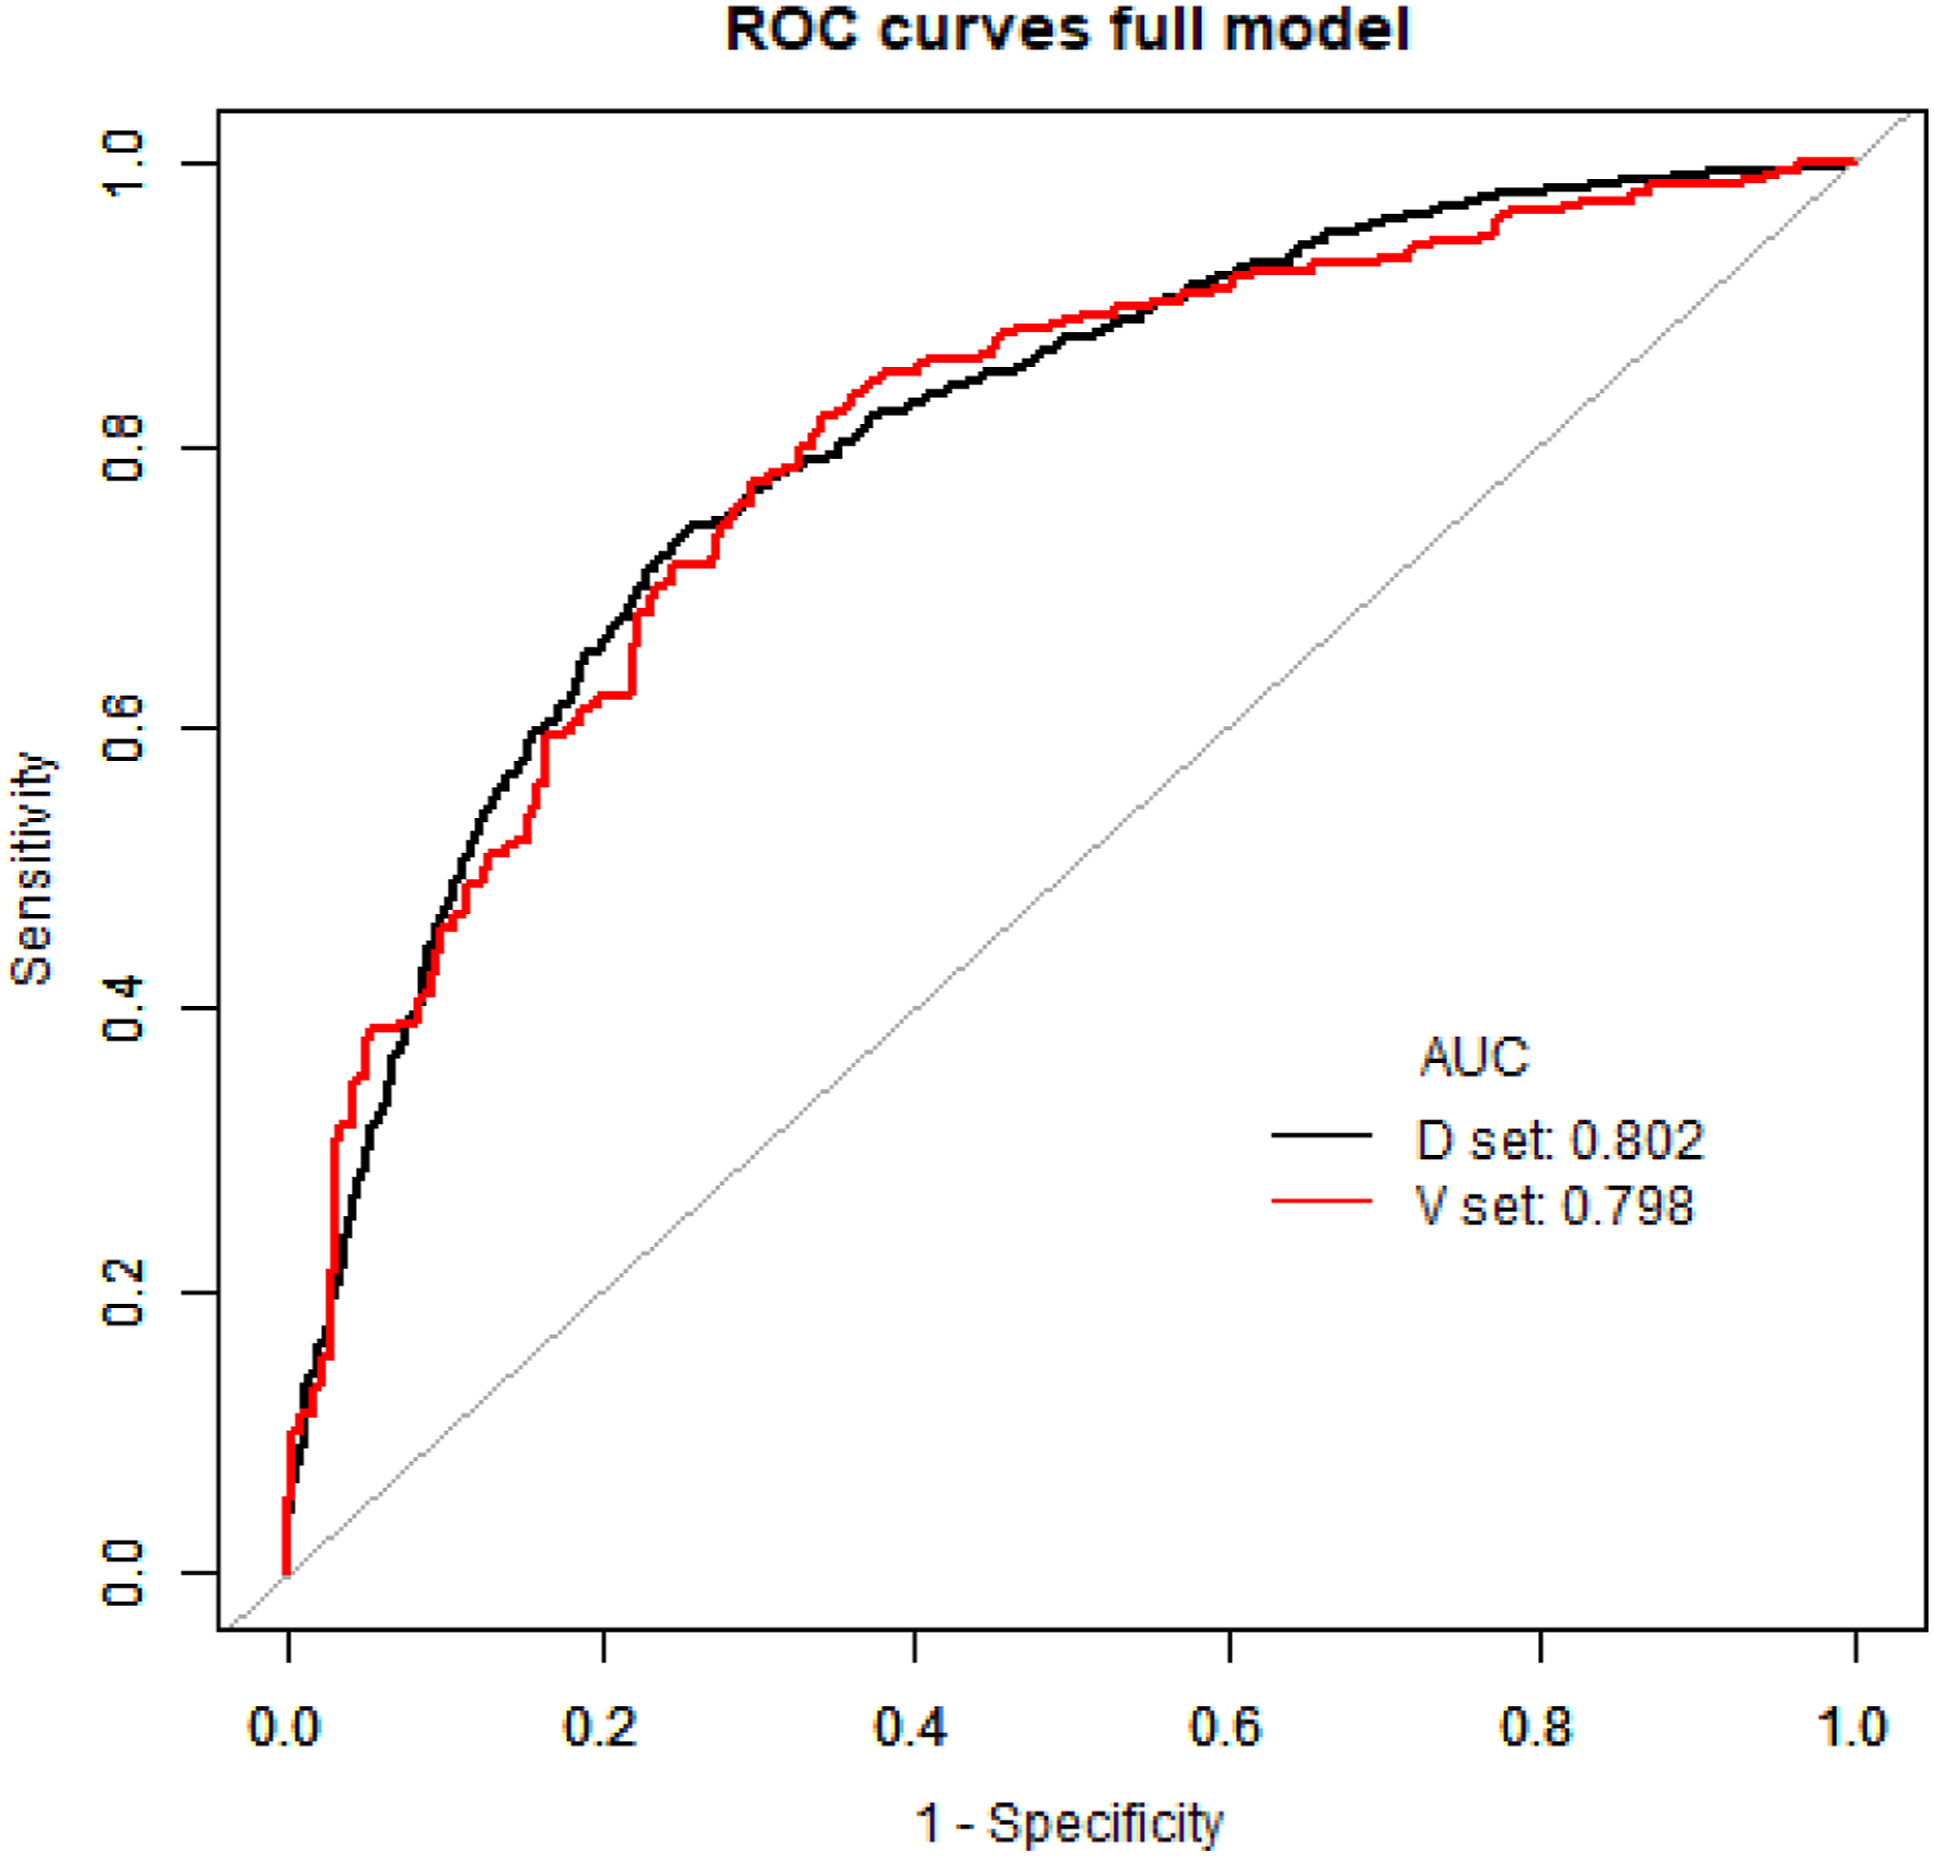
Discussion
In this cohort study, we identified various risk factors associated with hearing recovery after surgery. For the first time, we established and internally validated a nomogram for predicting hearing recovery, which is objective, accurate, and practical. The predictive nomogram can provide personalized estimates of hearing recovery to enhance preoperative counseling and guide interventions for patients. It could be used as an institutional measure to improve patients’ sense of gain in hospitals and to set realistic expectations.
The duration of COM affects postoperative hearing. The duration of COM onset influences postoperative hearing due to pathological changes in the middle and inner ears, tympanic membrane lesions, nonspecific osteitis and tympanic sclerosis, and degeneration of inner ear epithelial tissues and vessels caused by the prolonged course of the disease. 16 Additionally, long-term application of ototoxic drugs can damage the inner ear, resulting in hearing loss. Our study showed that duration was a risk factor for poor hearing recovery.
Tympanoplasty, CWU, and CWD are surgical techniques used for the treatment of COM with or without cholesteatoma. The main difference between these techniques is the preservation of the external auditory canal or mastoid. A study conducted by Karamert et al. 17 showed that auditory success in the CWU group (75%) was significantly higher than that in the CWD group (47.2%; P = .045). This is consistent with the results of our study, which showed that CWU and tympanoplasty had similar auditory success rates.
Mixed hearing loss affects postoperative hearing recovery. 16 Lee et al. 18 reviewed 34 patients with mixed hearing loss and compared the outcomes of middle ear implants. The results showed that the average bone conduction threshold did not change in the PORP group. 18 In our study, patients with mixed hearing loss were 60.7% as likely to have improved hearing than those without mixed hearing loss. This demonstrated that mixed hearing loss was a negative risk factor for improvement in hearing loss.
Unintentional drilling in the ossicular chain can produce strong cochlear stimulation which contributes to sensorineural hearing loss. 19 Drill-generated noise exposure may result in acoustic trauma and cause postoperative hearing loss. 20 A short operative drilling time may cause less hearing loss and be beneficial for postoperative hearing recovery. Our data showed that electric drill time was a risk factor for hearing recovery. In our nomogram (Figure 3B), a longer duration of drilling was associated with lower scores, indicating that the duration of intraoperative drilling should be minimized to recover postoperative hearing.
Lesions of the ossicular chain are critical in influencing patients’ hearing loss. 21 Akarcay et al. 22 reported that ossicular chain erosion was found in 31.8% of 915 patients in their study. In our study, 51.9% of all the patients did not have ossicular chain integrity. A Chinese COM study showed that ossicular chain integrity occurred in 54% of samples with cholesteatoma, 23 similar to our study. Our results showed that patients with an intact ossicular chain were 5.335 times more likely to have hearing recovery than those with an interrupted ossicular chain.
If the ossicular chain is damaged, an ossicular prosthesis can be implanted to improve hearing. A previous study showed that the prosthesis type (PORP vs TORP) did not have a significant effect on the mean change in the ABG. 24 However, some authors have reported better hearing outcomes in patients with PORP than in those with TORP.7,25,26 This is in line with the results of our study (OR, PORP 1.379 [95% CI 1.028–1.850] vs TORP1.0) that patients without ossicular prostheses had better hearing improvements, and patients with PORP had better hearing recovery than those with TORP.
A previous study reported that 31.8% of 66 patients had granulation tissue around the ossicular chain, 22 compared to 47.2% in our study. Although granulation or calcified plaques around the ossicular chain might be a prognostic factor for hearing improvement in COM, few studies have summarized its effects on hearing. Our study found that it was negatively associated with improved hearing.
Eustachian tube function could affect the success rate of the graft and the improvement of hearing following tympanoplasty.27–29 We used EDTQ-7, Valsalva’s maneuver, otoscopy, tympanometry, or tubomanometryTMM) to evaluate the eustachian tube function. Moreover, at least 2 of the 5 items were used for each patient in our study. Recently, balloon eustachian tuboplasty (BET) has been used to treat obstructive eustachian tube dysfunction and improve ventilation and clearance of the tympanic cavity. 30 If the patient’s eustachian tube is dysfunctional, with the patient’s consent, we have performed an eustachian tube dilation operation at the same time. Hsieh et al. 29 reported that the average ABG improvement in the BET group was better than that in the control group, with a statistically significant difference between the groups. However, the hearing loss significantly improved after dilation of the obstructed eustachian tube (Table 2). In the Eustachian tube dysfunction group, the hearing improvement of patients with eustachian tube dilation was significantly higher than that of those without eustachian tube dilation (OR1.477, P < .05).
To maximize the success rate and minimize the risk, surgery is generally performed only after the disappearance of discharge from the tympanum and resolution of inflammation. Eliades et al. 31 reported that the difference in the success rate of tympanoplasty was not significant between COM (76%–97%) and actively discharging ears (68%–92%). Another study conducted by Mishiro et al. 32 reported that the infected wet ears were not a statistically significant predictive factor for long-term success results after tympanoplasty with or without mastoidectomy. Other studies have also compared the surgical outcomes in dry and wet ears and found that the success rate was similar under both conditions.33–35 Moreover, our study was in line with the outcomes published above, which demonstrated that dry and wet ears were not critical conditions for the success rate of surgery.
A nomogram was built as a user-friendly personalized prognostic tool that is useful for patient consultation and treatment decisions. To our knowledge, this is the first nomogram to estimate hearing recovery in patients with COM. The model has good performance, an internally verified ROC curve, and a calibration curve, which provides reliable support for the accuracy of the model.
This cohort study had several limitations. Since this was a retrospective study, there was some bias in the data, and some data could not be discerned. The clinical use of the nomograms developed from a randomly selected sample and validated in an internal random cohort must be externally validated and evaluated for reliability. 36 Some potentially important data, such as smoking, alcohol consumption, history of mental illness, drug abuse, hypertension, absence or presence of the malleus handle, middle ear fibrosis, adhesive otitis, malleus tendon integrity, and type of ossicular chain lesion, were not collected; therefore, they could not be included in the nomogram. Although the AUC showed good performance, the inclusion of more parameters could result in a model with more precision. Further studies are required to develop better and more accurate models.
Conclusions
This cohort study found that duration of onset and drilling, styles of surgery, ossicular prosthesis implant, granulation or calcified plaques around the ossicular chain, eustachian tube dysfunction, ossicular chain integrity, eustachian tube dilation, mixed hearing loss, semicircular canal fistula, and the second surgery are associated with hearing recovery. Our validated nomogram, that incorporates different clinical data, can provide personalized risk estimates of hearing recovery to enhance preoperative counseling, help set realistic expectations in patients, and can be used to evaluate clinical hearing recovery. Future multicenter studies with more variables will help to improve the nomogram.
Footnotes
Author’s Contribution
Fengyang Xie and Xuanchen Zhou realized most experiments, compiled the data, and contributed equally to this work. Li Shi and Jie Han conceived the project. Fengyang Xie, XuanChen zhou, Haiyuan Zhu, and Changle Li were involved in research design. Haiyuan Zhu, Xiaoyue Zhen, and Yan Kou was involved in data analysis. Xiaoyue Zhen, Yan Kou, and Ling Guo prepared the figures, and Fengyang Xie and XuanChen Zhou wrote the manuscript. All authors provided feedback on the manuscript.
Declaration of Conflicting Interests
The author(s) declared no potential conflicts of interest with respect to the research, authorship, and/or publication of this article.
Funding
The author(s) disclosed receipt of the following financial support for the research, authorship, and/or publication of this article: This present study was supported by funds from the Shandong Provincial Medical and Health Science and Technology Development Project (Grant Nos. 2019WS500 to XCZ), the Key Technology Research and Development Program of Shandong (Grant Nos. 2019GSF108257 to JH and 2018GSF118192 to ZY). Funding agencies have no role in research design or manuscript writing.