
Abstract
Objective
This study aims to determine whether social media platforms (SMPs) can influence article impact as measured by citations.
Methods
This is a cross-sectional study that analyzed articles published in the top ten otolaryngology journals by the Eigenfactor score in January 2015. Total accumulated twitter mentions and citations were recorded in 2021. The main outcomes examined the difference in citations, tweets, article types, and author counts accumulated over a 5-year period for all articles that were either tweeted or non-tweeted.
Results
3094 articles were included for analysis. The average article was cited 11.2 ± 13.2 times and tweeted 2.10 ± 4.0 times. Sixty-four percent of the articles had at least one tweet. Over the study period, there was a statistically significant difference in mean number of citations between tweeted articles (12.1 ± 15.0) vs non-tweeted articles (9.6 ± 10.5) citations, representing a 26% difference (P < .001). Review articles had the highest mean citations (19.4 ± 23.4), while editorials had the lowest mean citations (2.8 ± 6.9). Tweets peaked in the year of publication, but citations continued to rise in the subsequent years. Tweeted articles’ peak citation rate change was +1.27 mean citations per year, compared to +.99 mean citations per year in non-tweeted articles. The mean author count in tweeted articles (5.40 ± 3.1) was not significantly different than mean author count in non-tweeted articles (5.19 ± 2.65, P = .0794).
Conclusion
These data suggest a moderate correlation between tweets and article citations, but a clear difference in the number of citations in articles tweeted vs those with no tweets. Thus, dissemination of knowledge may be impacted by social media platforms such as Twitter.
Introduction
With the expansion of the World Wide Web over the last few decades, more and more people rely on the internet as their primary source of information for health-related topics. Eighty-eight percent of Americans state they have searched for medical information online. Additionally, within that population it was found that 20% of Americans search for health-related topics on social media platforms (SMPs) such as Facebook, Twitter, and Instragram. 1 This has not only created a mechanism by which the general public can educate themselves and connect with others, but also an avenue for medical providers to both remain up to date and share information easily.
Although the scientific community itself has been relatively slow to fully grasp and utilize the potential of SMPs, a study from 2010 found that 93.5% of medical students, 79.4% of resident physicians, and 41.6% of practicing physicians reported usage of SMPs.2,3 No doubt those numbers have only increased in the decade since. In the setting of academic medicine, SMPs are often used to spread ideas and research, which promotes education, collaboration, and discussion among colleagues and the general public. 4 Such technology clearly has the potential to disrupt existing paradigms of how we both disseminate and value new knowledge.
Despite their increasing use by authors and publishers alike, little is known about the impact of SMPs. Do Facebook, Instagram, and Twitter (among others) actually influence academic impact? To determine this, any existing associations between the two must first be explored. As such, the primary aim of this study is to determine if initial social media posts correlate with future article impact. If such a correlation exists, the secondary aim is to determine which variables (e.g., journal, article type, and number of authors) may be contributing factors.
Methods
The top 10 journals in the field of otolaryngology—head and neck surgery (as measured by the Eigenfactor score) for the year 2015 were included (prior to 2015, utilization of SMPs for medical publications was less commonplace). The Eigenfactor score, which unlike the impact factor, gives more weight to citations in journals with higher readership and is considered by many to be a better bibliometric metric of true impact. 5 All articles published by these journals in 2015 were included, with the exception of previously published “historical interest” articles and book reviews. Articles were categorized as original research, single-case reports, reviews, editorials, and letters to the editor. Original research included basic science research, animal research, and clinical research articles. The total number of authors per article was recorded.
Each of the articles selected was entered into the web-browser software “Altmetric Bookmarklet” (www.altmetric.com) to obtain the primary tweets (without re-tweets) and their dates. 6 Secondary mentions, or “Re-Tweets,” were not collected. Article citations and author count were extracted from Clarivate Analytics’ Web of Science Core CollectionTM database v5.35 (Philadelphia, PA) by creating citations’ reports through searching the articles’ digital object identifier (DOI) or PubMed ID (PMID). 7 All data (citations and tweets) were collected in one sitting on January 5th, 2021, to avoid indexing mismatch. Any citations and tweets accumulated after December 31st, 2020, excluded from the analysis.
The collected variables were summarized using descriptive statistics for categorical variables, and means and standard deviation for continuous variables. Articles were further categorized based on whether they had (or had not) been tweeted at least one time. Two-tailed, two-sample Wilcoxon analyses were performed to examine the difference in citations between non-tweeted and tweeted articles. Kruskal–Wallis tests were performed to examine the difference in citations between publication types. Post-hoc analysis was completed with the Dwass–Steel–Critchlow–Fligner methodology. Finally, Spearman's rank correlation coefficient was used to examine the relationship between tweets and author count vs citations. These parametric tests were chosen due to the non-normal distribution (via the Shapiro–Wilk test for normality) of the data. The alpha value for all tests was .05. All statistical analyses and figure creation were performed with SAS v9.04 (Cary, NC).
Results
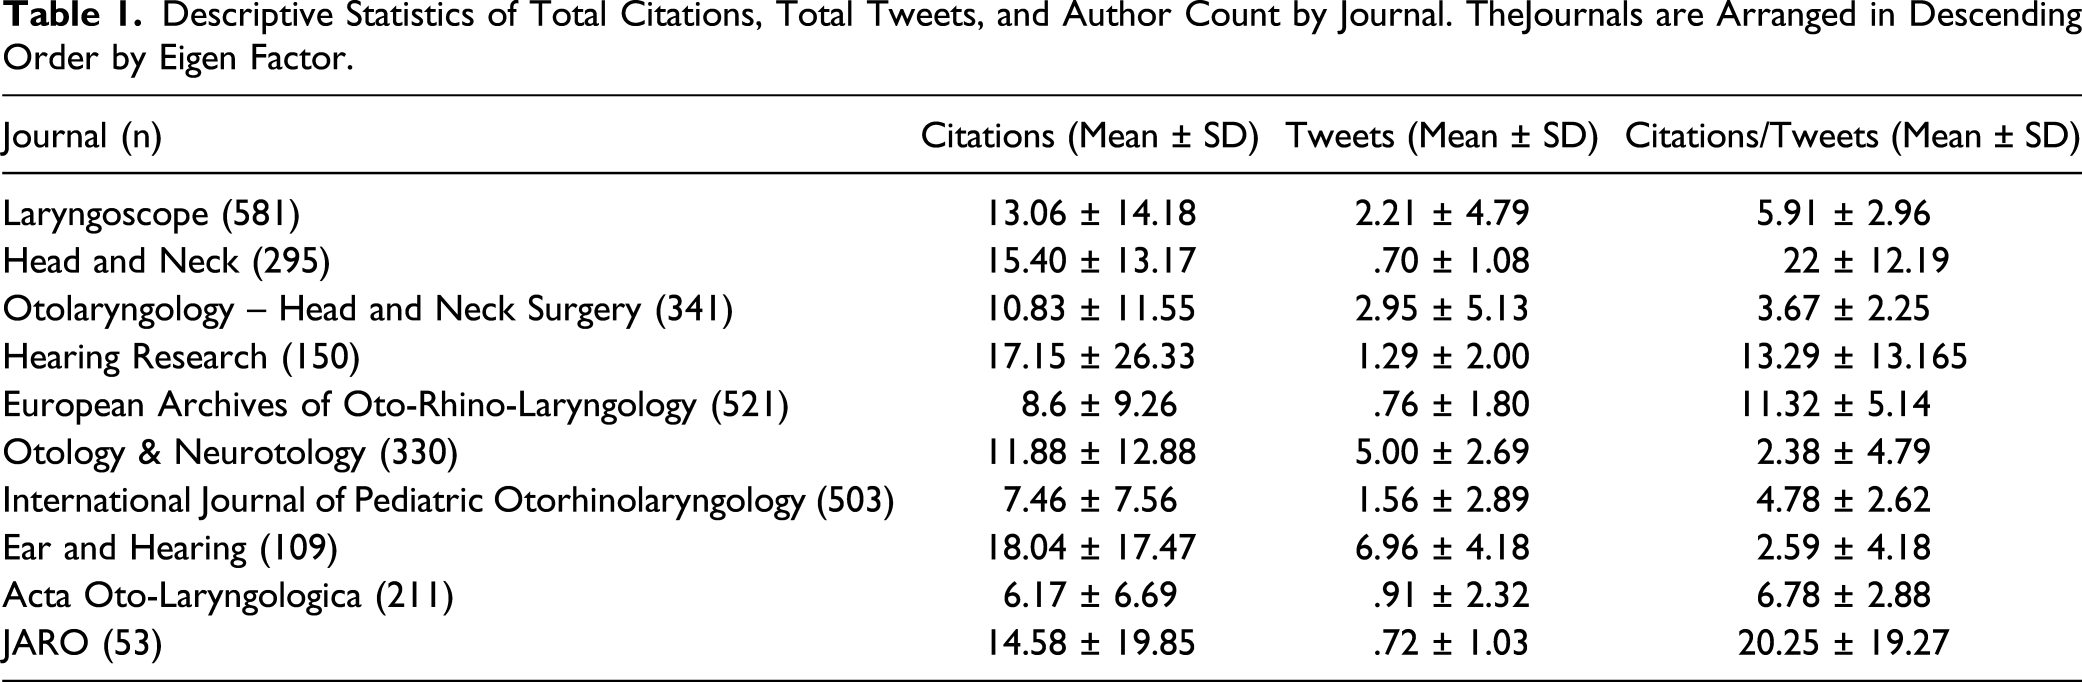
Ten journals met inclusion criteria, in which 3194 total articles were published in 2015.100 articles were excluded, leaving a final sample of 3094 articles. These articles accumulated 34,588 total citations and were tweeted 6513 times in the 5-year study period. Overall, the average article was cited 11.2 ± 13.2 times and tweeted 2.10 ± 4.0 times. The maximum number of citations, tweets, and authors was 265, 76, and 49, respectively. Figure 1 demonstrates the percent of total citations and total tweets for each of the journals, while Table 1 shows the mean number of tweets, citations, and tweets/citation for each of the 10 journals. The journal with the highest absolute number of tweets was Otology and Neurotology (1651 tweets). The journal with the highest absolute number of citations was Laryngoscope (7586 citations). The journal with the highest mean citations/tweet rate was Head and Neck (22 ± 12.19 mean citations/tweet). Distribution of citations and tweets as the percent of total by journal. Descriptive Statistics of Total Citations, Total Tweets, and Author Count by Journal. TheJournals are Arranged in Descending Order by Eigen Factor.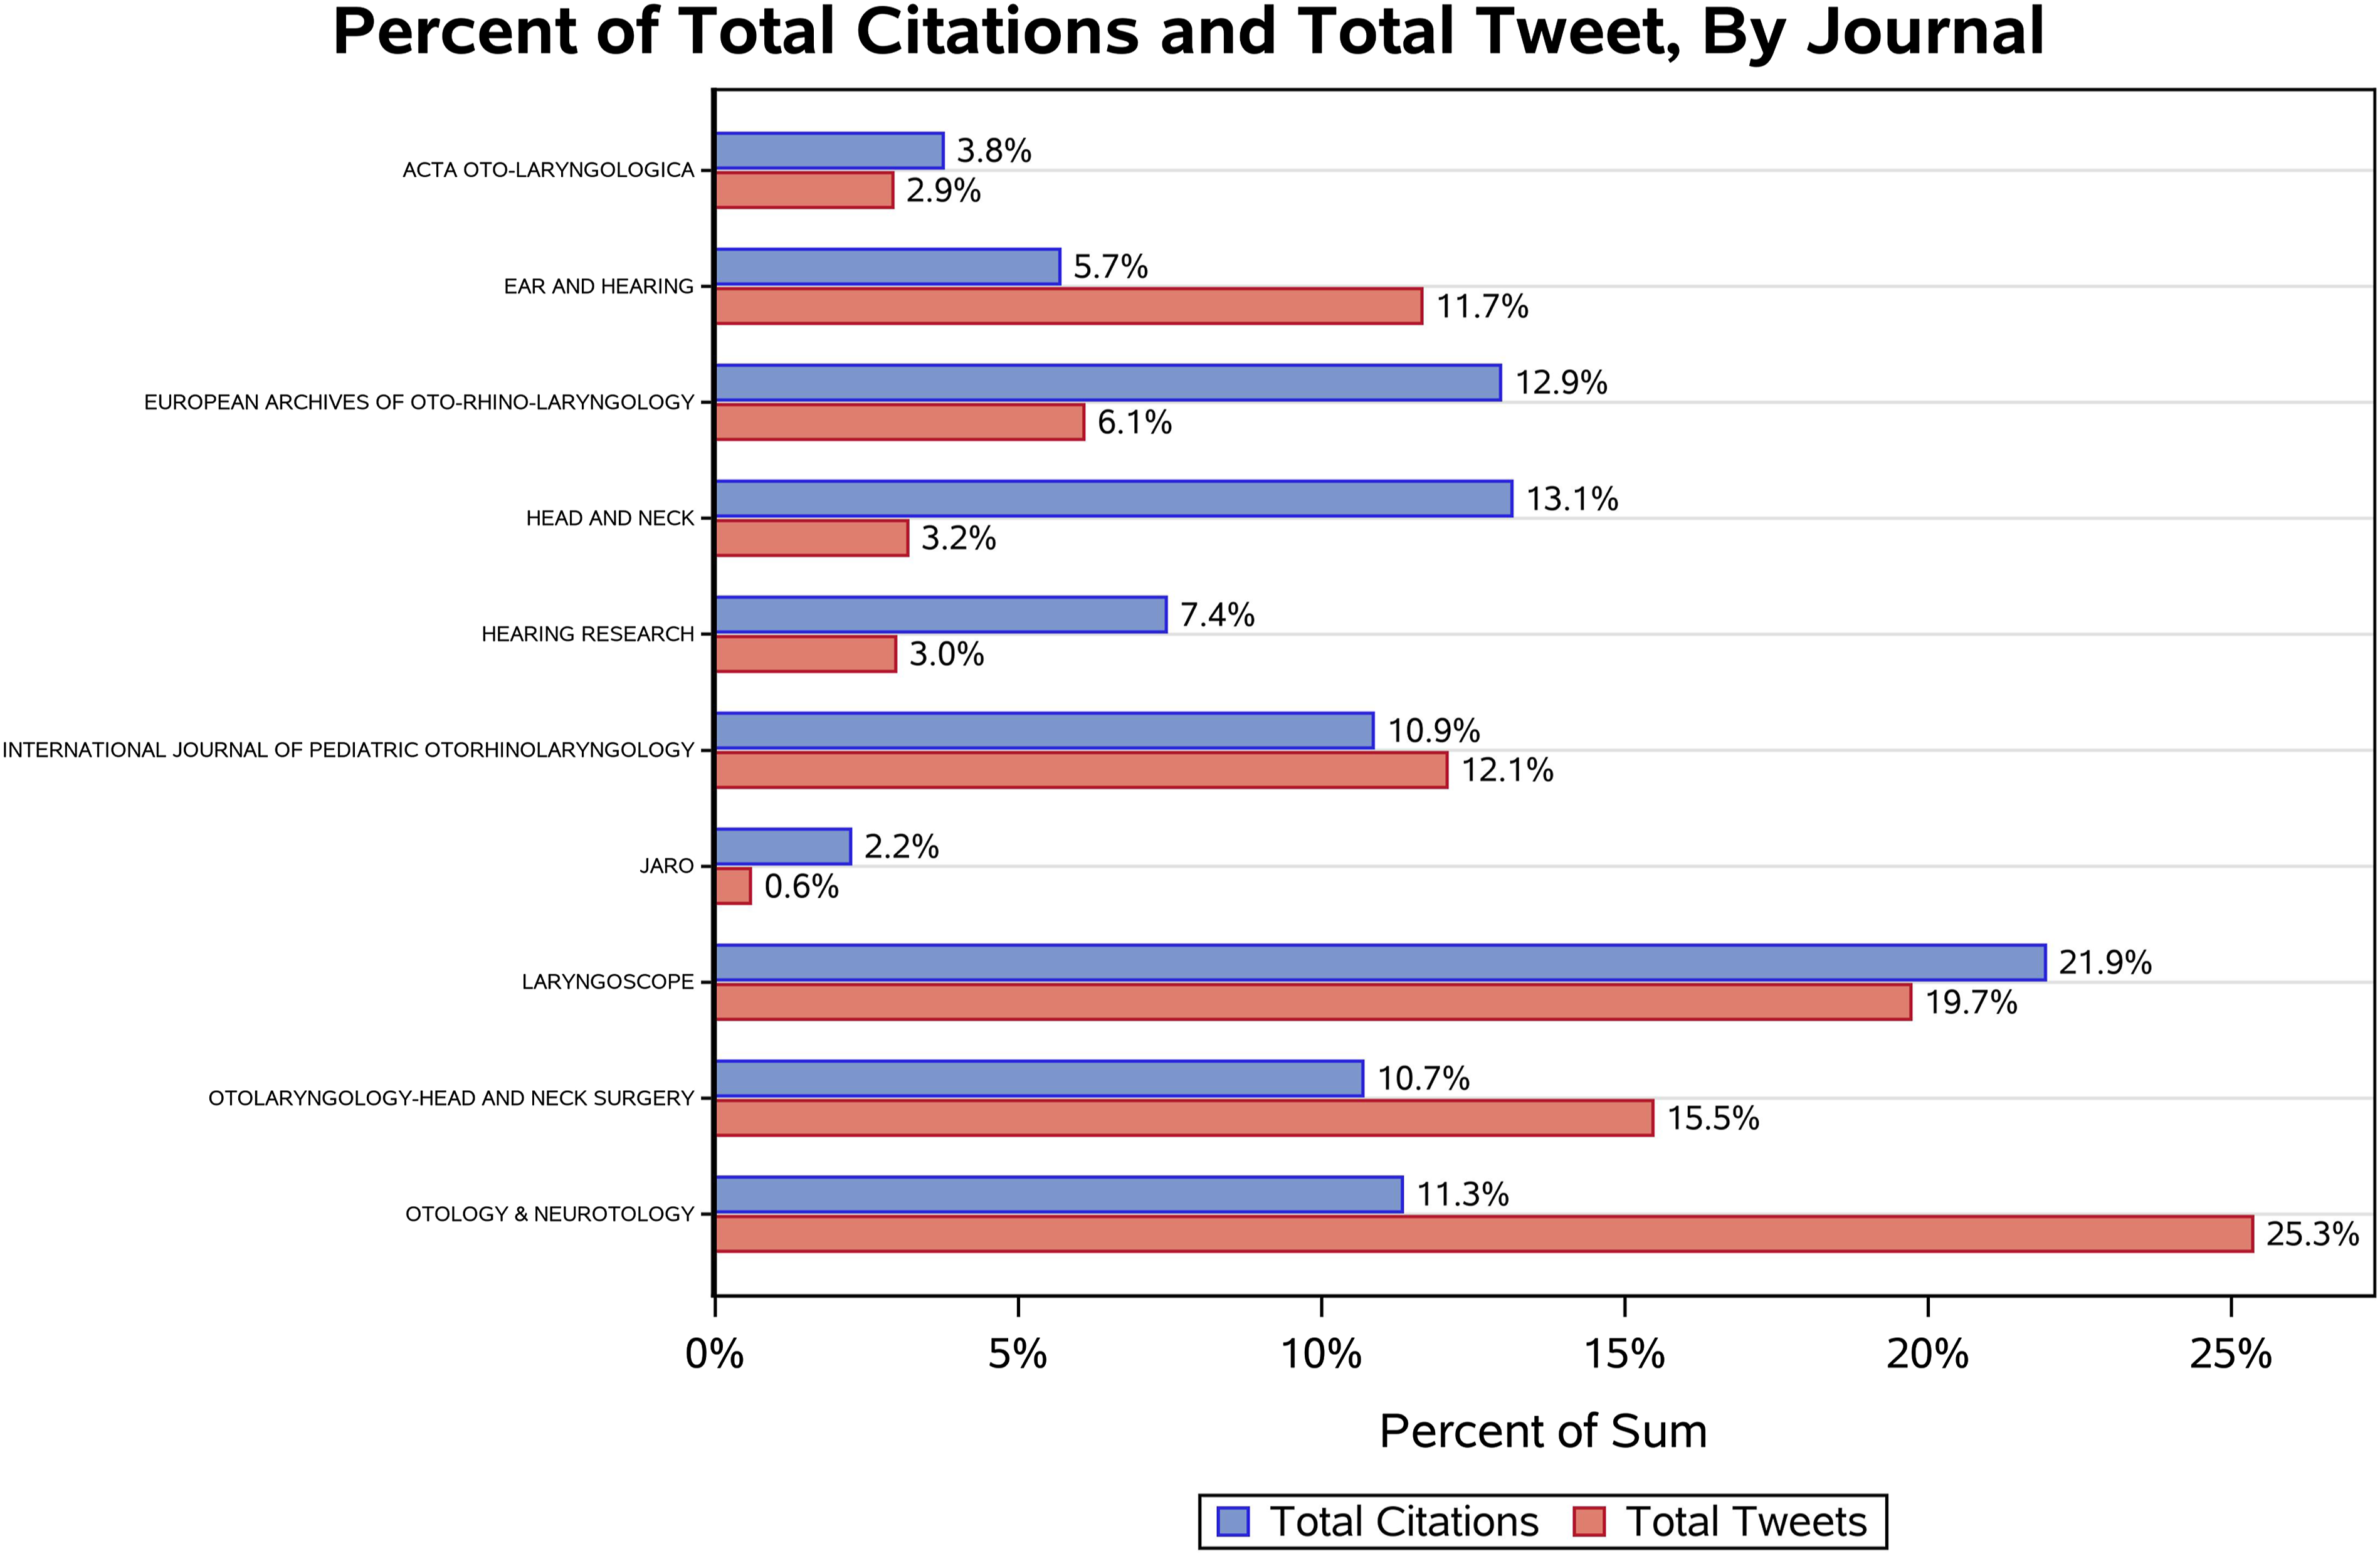
Sixty-four percent of the articles had at least one tweet. Over the study period, there was a statistically significant difference in mean number of citations between tweeted articles (12.1 ± 15.0) vs non-tweeted articles (9.6 ± 10.5) citations, representing a 26% difference (P < .001). Figure 2 displays the average citations each article accumulated annually, grouped by tweeted and non-tweeted articles. The peak tweets occur in 2015 and rapidly decreases within 1 year. Citations, however, steadily accumulate and plateau 2–3 years after publication. Tweeted articles had approximately .5 average citations higher than non-tweeted articles annually. Tweeted articles accumulated citations at a faster rate than non-tweeted articles every year from 2014 to 2020, except for 2017 to 2018. Tweeted articles’ peak citation rate change was +1.27 mean citations per year compared to +.99 mean citations per year in non-tweeted articles. Plot of average yearly citations (grouped by tweet status) and average yearly tweets over time.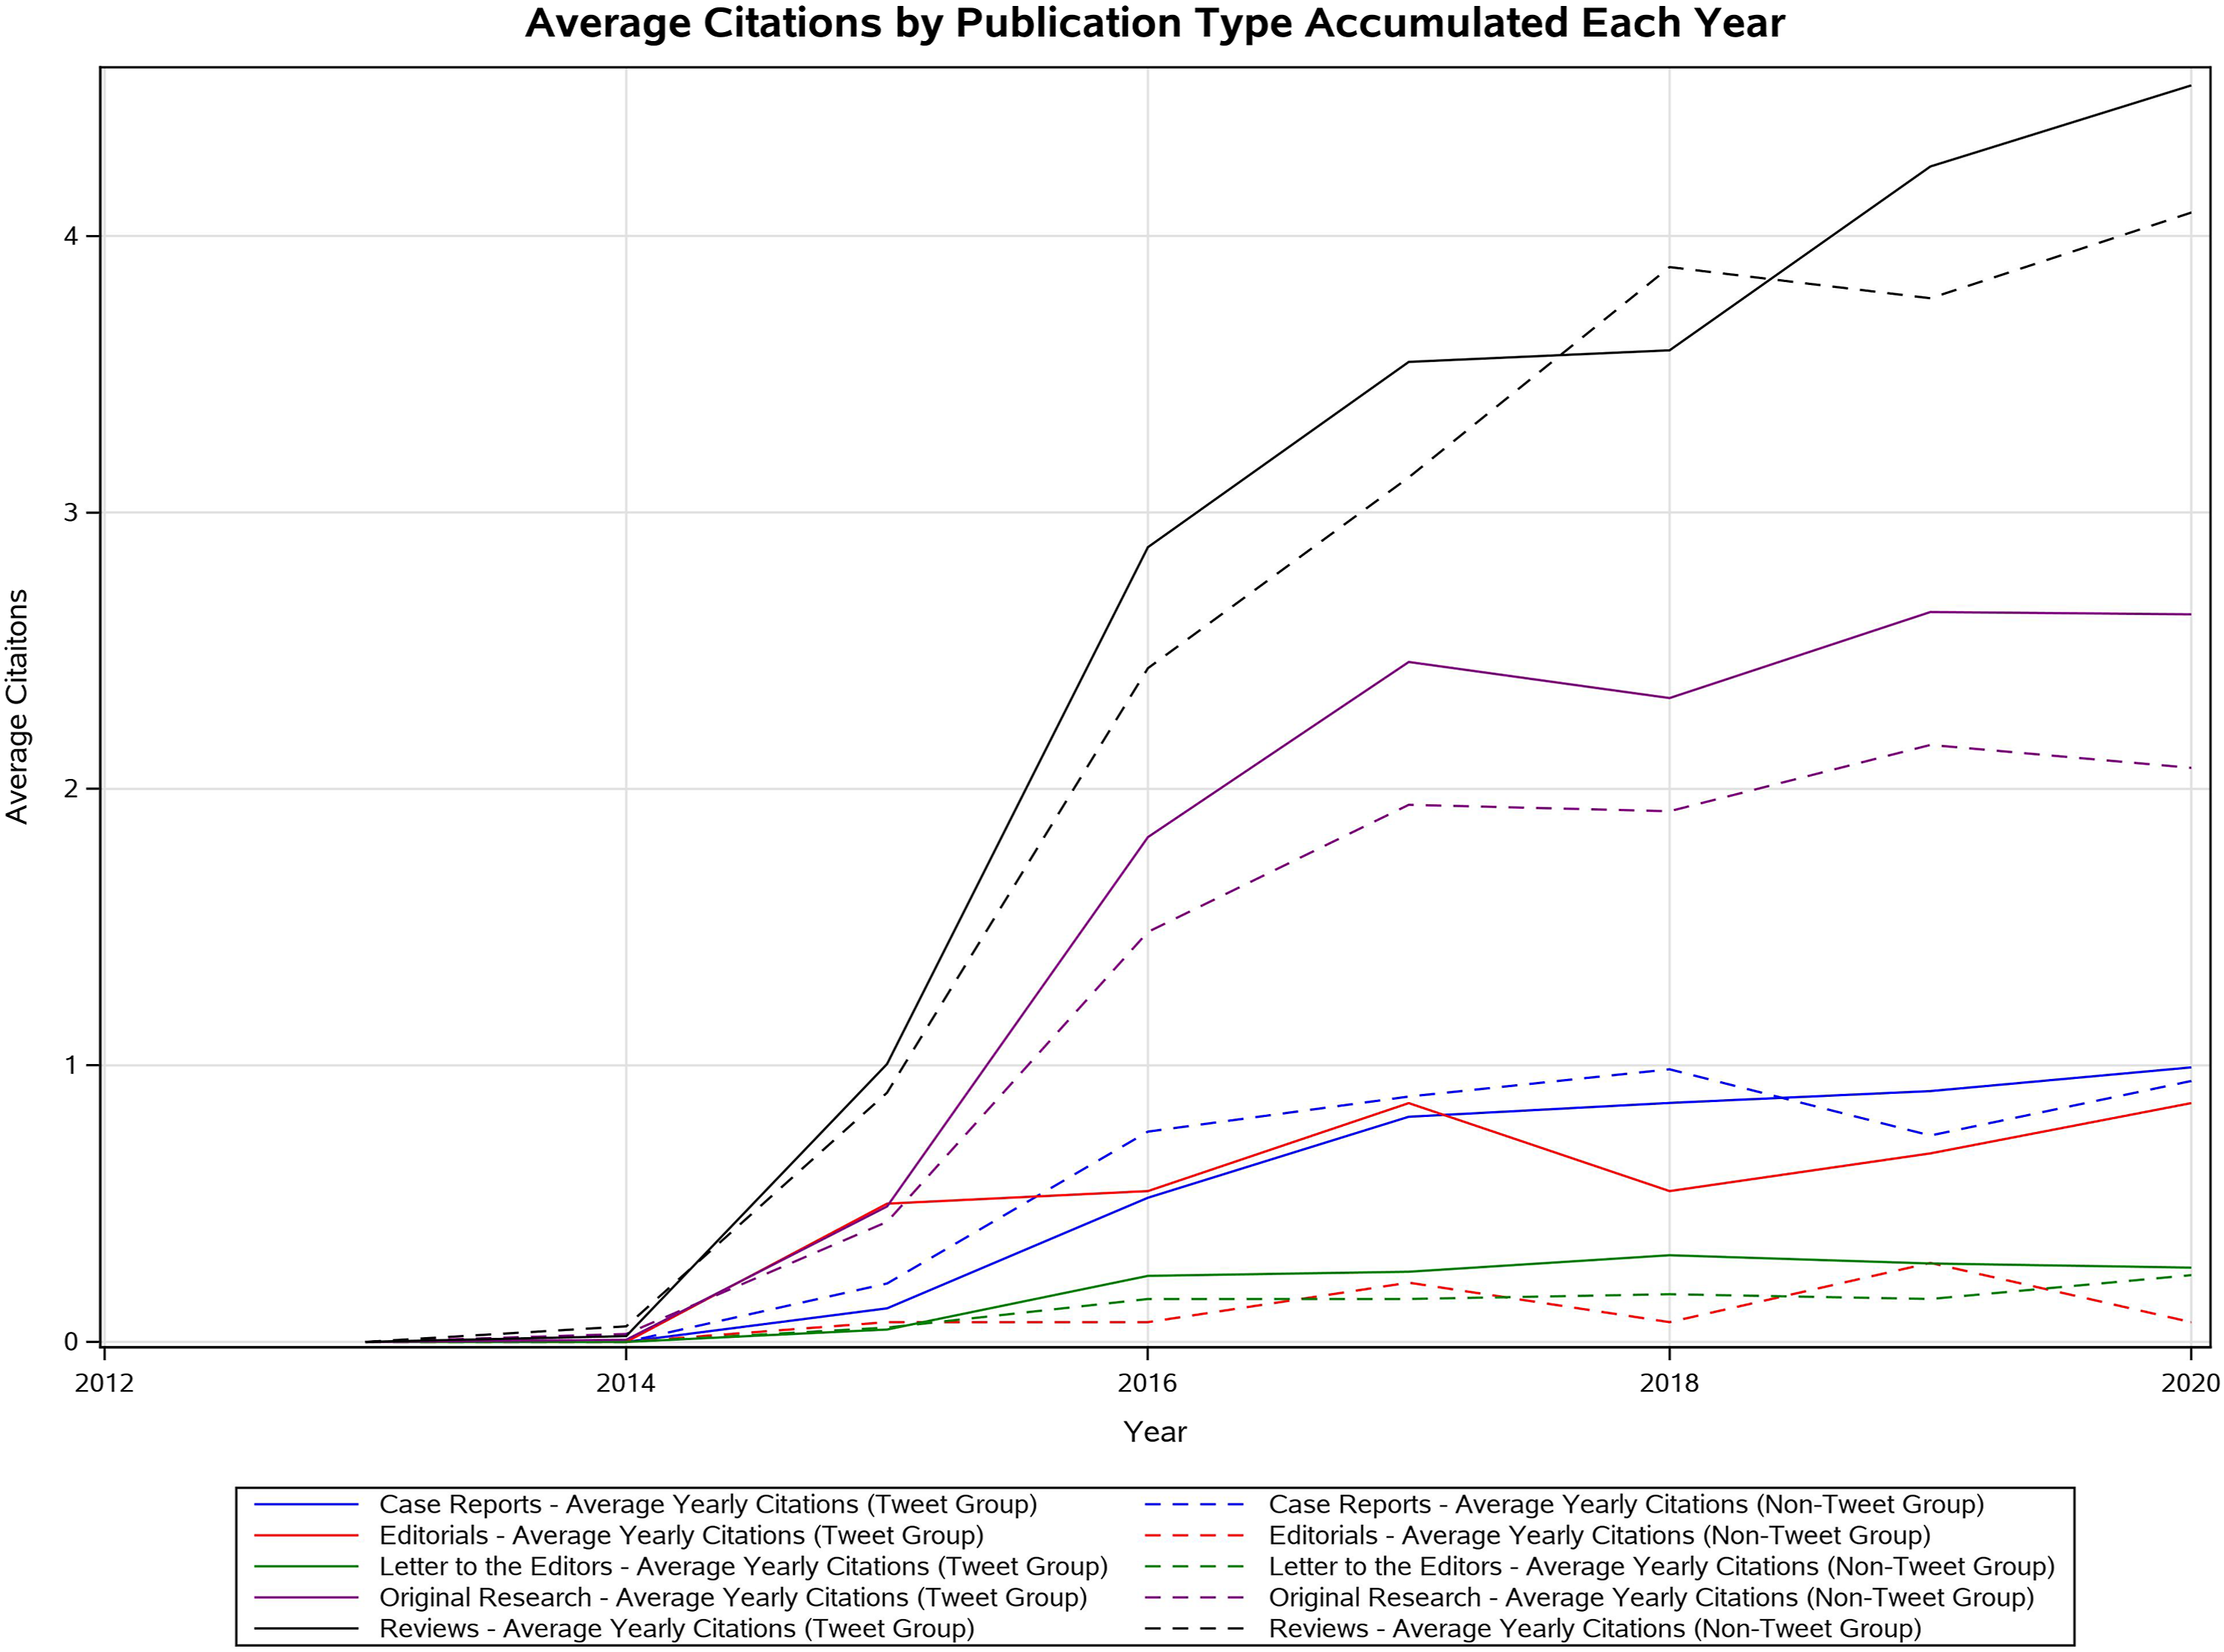
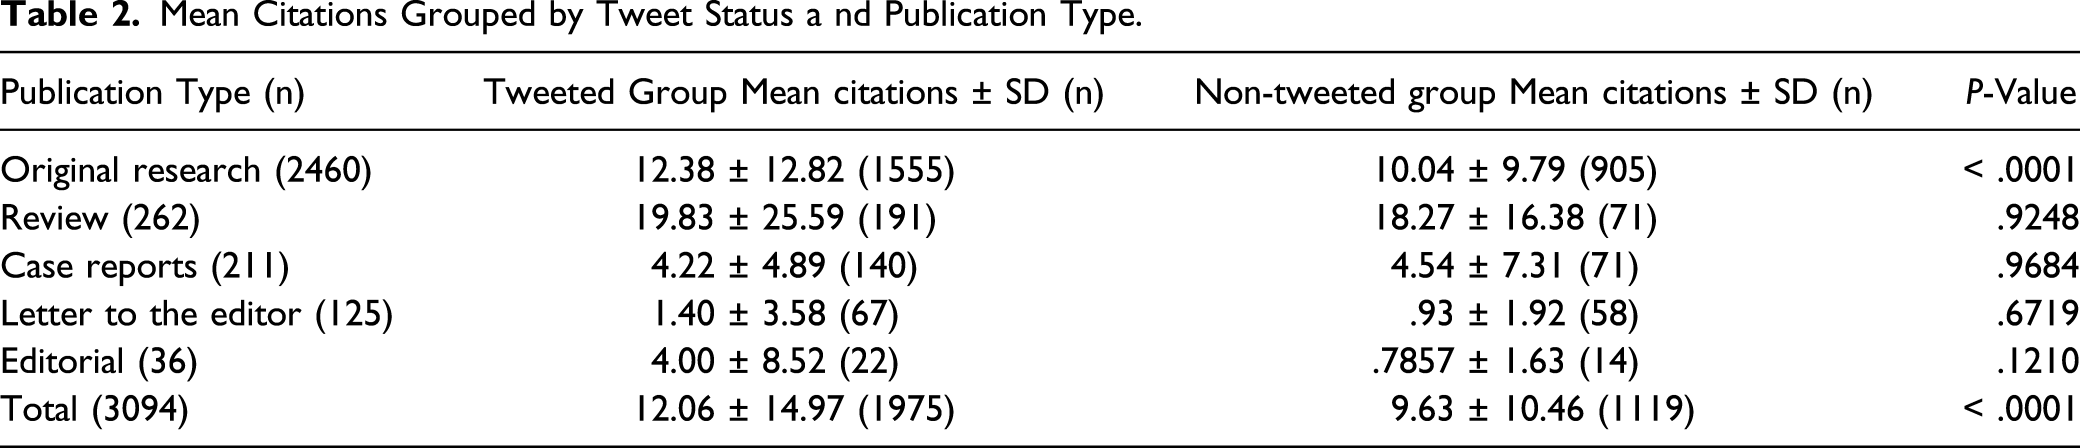
Mean Citations Grouped by Tweet Status a nd Publication Type.
The average article had 5.3 ± 2.8 authors. The mean author count in tweeted articles (5.40 ± 3.1) was not significantly different than mean author count in non-tweeted articles (5.19 ± 2.65, P = .0794). Author count and tweets showed a weakly positive, but significant (P <.0001), correlation with citations (r = .20 and .15, respectively). When only looking at tweeted articles, the correlation of author count and tweets remains weak, but significant (P<.0001), with citations (r = .20 and .19, respectively).
Discussion
Historically, the impact of a body of research or information had long been ascribed to the number of times the article was cited by future publications. However, there are numerous recognized flaws with this approach to measuring the impact or the importance of the information.8,9 For one, there is a fairly significant lag time between when research articles are published and when they are cited, leading to a delay in the recognition of article impact. 8 Secondarily, traditional citation only uncovers the scientific impact of an article without understanding the societal impact and implications. 9 With the rise of SMPs in academic medical literature, so too has interest in understanding how these alternative metrics (or Altmetrics) differ from traditional citations.10,11
The emergence and subsequent growth of SMPs has created new channels for individuals to swiftly disseminate and access information and communicate with others within their social and professional networks. 12 SMPs offer several distinct advantages over traditional forms of communication. Conversations on SMPs are not constrained by time or location, and they are customizable to the user’s interests and needs. Twitter, a SMP that boasts an active monthly user base of 321 million, allows users to share short messages called “tweets” that can be up to 280 characters in length. 13 One of the advantages of Twitter is that it allows for real-time social networking experiences for its users. The utility of Twitter to share and promote scientific content has been established in academic medicine, and its use by academic publishers has increased over the past decade.
Otolaryngologists and journal publishers alike have also recognized the potential of SMPs, and their use parallels journals of other surgical specialties. Yet, few studies have investigated the impact of SMPs and Altmetrics on our field. Some have broadly examined the integration of SMPs within the field of otolaryngology, showing that SMPs remain an underutilized avenue for information dissemination within our subspecialty.14,15 Others have found that although medical professionals have access and utilize these SMPs for personal use, they have struggled to integrate SMPs into professional practice. Previous studies have explored Facebook as it relates to otolaryngology residency applications and admissions. 13 However, to our knowledge, this is the first study to exclusively explore the relationship between Twitter and citations in the field of otolaryngology.
The findings of this study suggest that there is indeed a correlation, albeit a weak one, between primary Tweets and citations. This stands in contrast to earlier published literature from other fields.9,14 In a 2011 study with a limited scope in which only 55 articles from the Journal of Medical Internet Research were analyzed, Eysenbach et al found that more-frequently tweeted articles were 11 times more likely to be highly cited than less-frequently tweeted articles, with correlation coefficients ranging from .42 to .72. 9 More recently, Hayon et al, in the study of urologic surgery literature, found that the number of citations received up to 3 years after publication was positively associated with tweets, increasing citations up to 2.3-fold. 10 However, compared with the current study, these publications had relatively small sample sizes with different methodologies that may account for the stronger effect size. For instance, Eysenbach et al included 55 articles published within 1 year, while Hayon et al only included original research articles, removing editorials, reviews, opposing views, and surveys. More recently, Bardus et al conducted a systemic review on the impact of social media on healthcare journals and as of 2020, identified seven high-quality studies for inclusion. Of the 7 studies, 5 reported a correlation coefficient of moderate size and 2 reported no correlation. The authors also identified 4 randomized control trials of which only one demonstrated a significant positive correlation with citations. 16 More importantly, they established that a high-quality correlative study should adjust for confounders such as article type and time, report non-linear correlation tests, and log-linear relationship tests.
This study is also the first to examine other potential covariates that influence citations, namely, author count and publication type. Our data showed that in univariate analysis, both author count and publication type significantly (though weakly) affect citations. Multiauthor and multi-institutional studies tend to create high-quality publications, which ultimately become widely cited. Quality, as measured by level of evidence, is known to be correlated with citations in otolaryngology. 17 Second, because of the nature of academic literature reviews, original research and review articles are widely sought out by article authors and thus become highly cited compared to editorials or letters to the editors. For now, citation-based metrics are likely more accurate reflections of knowledge diffusion and should still be considered the gold standard over Altmetrics when it comes to academic impact.
This study is not without limitations. First, it should be made clear that the 26% increase in citations by tweeted articles is not necessarily causative. Although intuitive, to date, there is no evidence to suggest the act of tweeting is itself responsible for the desired effect of increased notoriety and citation. Journal staff may elect to promote via Twitter more interesting or relevant articles of higher scientific merit that very well may have been cited anyway. Moreover, we have no data on who is re-tweeting articles and therefore have no information on why articles may gain traction beyond the original article promotion by the publisher. For this analysis, re-tweets were intentionally not included in order to better understand the impact of those creating the initial tweets (usually publishers). Though, in many cases, the first tweet may theoretically not have even originated from the journal publishers or authors, but rather by automated Twitter accounts that are programed to tweet/re-tweet otolaryngology-related content.
This study was also limited by the fact that the use of SMPs, specifically Twitter, by the studied journals only began relatively recently and therefore precluded longer follow-up. Nonetheless, most tweets (and indeed most citations) generally occur within the first few years following publication, and therefore longer follow-up may not necessarily alter the results. Scientific articles are generally regarded as peaking in citation number around 2 years following publication. 15 Ongoing studies are needed to investigate the temporal relationship between timing of individual tweets and citations on a more granular level. As the use of Twitter and SMPs becomes more commonplace by publishers, researchers, and readers, this will be a relatively easy and worthwhile study to repeat in the coming years.
Conclusion
As SMPs such as Twitter continue to grow into more notable exchanges for communication in otolaryngology, it is essential to better understand this potentially disrupting technology.10,18 Our data suggest a roughly 25% increase in the number of citations for tweeted articles vs not tweeted articles. While such a relationship can only be described as associative (rather than causative), what remains clear is that Altmetrics have much to teach us about how we write, cite, publish, disseminate, and read about medical progress in our field.
Footnotes
Acknowledgments
Keighly Bradbrook, Department of Biostatistics, Virginia Commonwealth University School of Medicine, provided assistance in statistical analysis. She was not compensated for this work.
Declaration of Conflicting Interests
The author(s) declared no potential conflicts of interest with respect to the research, authorship, and/or publication of this article.
Funding
The author(s) received no financial support for the research, authorship, and/or publication of this article.