
Abstract
Objectives:
To evaluate the relationship between the loss of the cochleovestibular functions in Ménière’s disease (MD).
Methods:
Forty-three patients with definite MD underwent pure-tone audiometry (PTA) and caloric test. Canal paresis (CP%), dPTA (interaural difference), and average PTA results were contrasted. IBM SPSS V24 was used for statistical analysis.
Results:
According to PTA, most patients were in stage C, and caloric weakness was found in 29 patients. Linear (R2 = 0.06) and nonlinear correlation tests (rho = 0.245, P = .113) between canal paresis (CP%) and dPTA showed no correlation, as well as between CP% and PTA analysis (R2 = 0.007, rho = 0.11, P = .481). As per the categorial analysis, no correlation was detected between the groups either (κ = 0.174, 95% CI: 0.0883 - 0.431). Based on the results of the analysis, it was concluded that a more advanced stage determined by audiometry does not indicate increasing values in the CP% parameter.
Conclusions:
Audiometric changes do not directly correspond with the vestibular ones; therefore, no specific correlation exists between them. Thus, for therapy planning and diagnosis, both tests are necessary.
Introduction
Ménière’s disease (MD) is a disturbance in both the vestibular and the cochlear functions, whereas histopathological findings reported abnormal inner ear fluid dynamics. 1 The disorder is clinically characterized by episodes of vertigo (vestibular complaints), a gradual hearing loss, tinnitus (cochlear complaints), and vegetative symptoms. 2 According to the recommendation of the American Academy of Otolaryngology-Head and Neck Surgery (AAO-HNS) and the Bárány Society, MD diagnostic criteria include at least 2 cases of spontaneous episodes of vertigo, lasting 20 minutes to 12 hours. On the other hand, audiometrically documented low-to-medium frequency unilateral sensorineural hearing loss with fluctuating aural symptoms (hearing, tinnitus, or fullness) is required for the diagnosis on at least one occasion, excluding other causes. 3
The diagnosis depends on clinical features; therefore, cochlear and vestibular tests are crucial for differential diagnosis and treatment guidance as well as for follow-up. In daily practice, the 2 most common tests for such an evaluation of functions are pure-tone audiometry (PTA) and the caloric test. PTA is used for evaluating the sensorineural hearing loss in MD and is necessary for the differentiation of probable and definite MD. In the beginning, hearing loss is completely resolved between episodes, and in the early stages, low-frequency (200-600 Hz) hearing loss can be detected with fluctuating tendency using PTA. 4 Later, a progressive deterioration of the hearing loss is expected across the whole frequency spectrum (on 1500-2000Hz, too). 5 Caloric test is a neuro-otologic assessment tool for measuring the function of the vestibular-ocular reflex, which allows for the evaluation of each horizontal canal and the superior parts of the vestibular nerve separately. 6 The percentage of the unilateral weakness of the caloric response reflects the clinical progression of MD. 7
Based on the diagnostic guidelines for MD, for the diagnosis of definite MD, it is necessary to register a sensorineural type of hearing loss on at least one occasion. Besides analyzing the symptoms and the results of audiometry, vestibular tests such as caloric test are used in everyday clinical practice; therefore, it is of great importance to examine the correlation between their results.
The purpose of present investigation was to retrospectively study the topodiagnostic relationship between cochlear and vestibular function loss in MD using caloric test and PTA.
Patients and Methods
Patients
Forty-three patients (18 males and 25 females, mean age ± SD, 54.81 ± 13.35) admitted to the tertiary care referral center of the Department of Otolaryngology and Head Neck Surgery, Semmelweis University, were analyzed retrospectively from the onset of MD to the neurological examination. All participants had been diagnosed with definitive MD earlier according to the Bárány Society criteria and were evaluated using both caloric test and PTA.
Patients with an incomplete medical history or bilateral MD, patients who had been treated with intratympanic treatment, and patients suffering from other peripheral vestibular disorders were excluded. To exclude vestibular schwannoma, magnetic resonance imaging (MRI) was used. Conducting the study was permitted by the Regional and Institutional Committee of Science and Research Ethics at Semmelweis University: 48/2018.
Pure-Tone Audiometry
Audiometric examination was performed using PTA. Extended Fletcher Index was used to calculate hearing loss. The values indicate the average hearing loss detected on 500, 1000, 2000, and 4000 Hz frequencies. 8 Based on the AAO-HNS classification, the PTA stages are established as follows: stage A: ≤25 dB, stage B: 26-40 dB, stage C: 41-70 dB, and stage D: >70 dB. To rule out the effects of aging (ie, presbycusis) on hearing, the interaural difference in the hearing level (dPTA) was also calculated, defined as the difference between the values in the healthy and diseased PTA stages.
Caloric Test
Caloric testing is based on the principle of generating thermal variation within the external auditory canal 6 and as a result endolymph flow in the horizontal semicircular canals. Bithermal caloric test was used to assess the lateral semicircular canal function on both sides of the head separately, also with the function of the superior parts of the vestibular nerve. 9 The test was performed using a CHARTR air caloric stimulator: NCA-200. Air stimulus was used (with constant airflow at 25 °C and 50 °C, 5 L/min for 40 seconds), and eye movements were recorded by an electronystagmography system. After irrigation, the induced nystagmic response was characterized by its slow-phase velocity (SPV). We used a modified Jongkees’ formula to define canal paresis (CP%) and directional predominance (DP%) parameters. 10 The CP% parameter was calculated as the difference in the maximum SPV between the 2 labyrinths.
In this study, to facilitate the comprehension of the results in caloric test, the patients were grouped according to CP% values as normal: less than 20%, intermediate: 20% to 40%, and severe loss of function: >40%.
Both tests were performed under the same checkup to rule out the fluctuation characteristic of the disorder. None of the patients had an acute episode of MD during the examinations.
Statistical Analysis
The statistical analysis was completed using the IBM SPSS V24 software. As the parameters were not normally distributed (Shapiro-Wilk test), Mann-Whitney U test was applied. To detect a possible correlation between the parameters, simple linear correlation, Spearman correlation, and Pearson correlation were used. For categorical analysis, Cohen kappa test was performed. A P value of <.05 was considered significant.
Results
This study was made retrospectively, and the results of 43 patients with unilateral MD were investigated. The right ear was affected in 25 patients and the left ear in 18 patients.
Eight patients were classified into stage A, 11 patients into stage B, 19 into stage C, and 5 patients into stage D (Table 1). For each MD stage, the relationship between the PTA and responses of the caloric test was examined, too.
Summary of the Stages of MD, PTA, and Responses of calorie test (
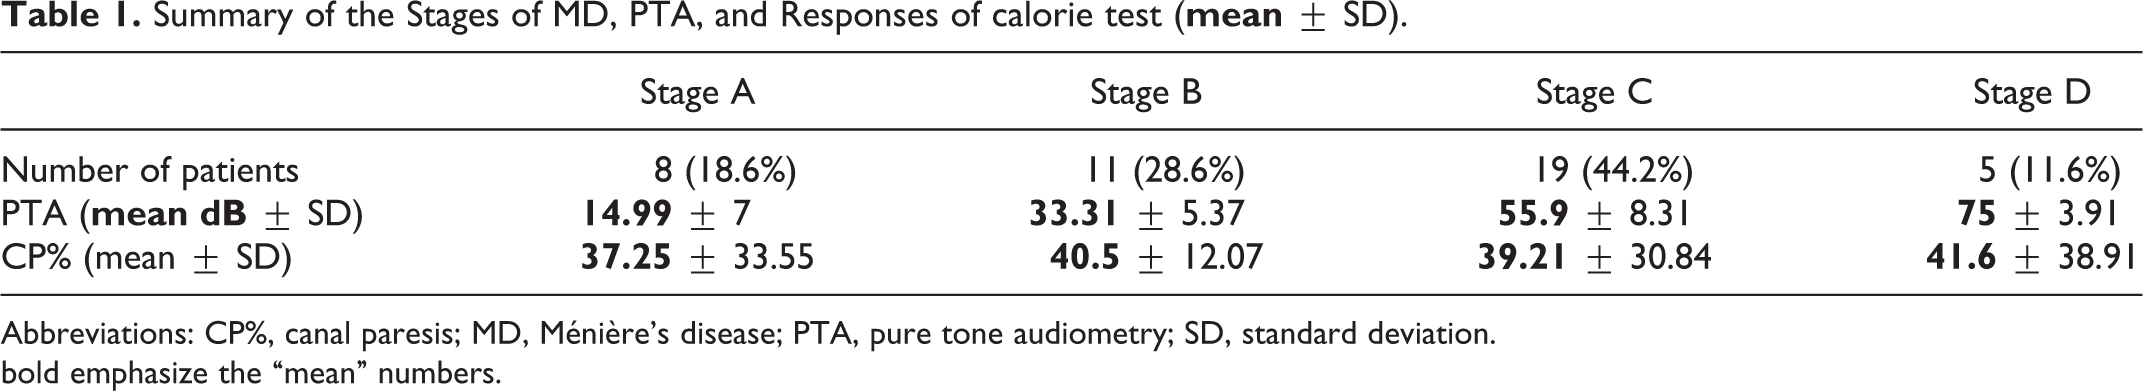
Abbreviations: CP%, canal paresis; MD, Ménière’s disease; PTA, pure tone audiometry; SD, standard deviation.
bold emphasize the “mean” numbers.
As shown in Table 1, most patients were included in stage C, and as the staging is based on the PTA, the average thresholds are increasing with the stage. However, such a correlation in case of CP% is not unequivocal.
To analyze further correlation between the parameters, dot diagrams were applied, and correlation tests were used. As shown in Figure 1, based on the linear correlation (R2 = 0.06), there is no correlation between the examined parameters, which is also supported by Pearson correlation (rho = 0.244, P = .115), indicating no significant linear correlation between the 2 parameters. Examining nonlinear correlation using Spearman test, no significant correlation was detected either (rho = 0.245, P = .113).
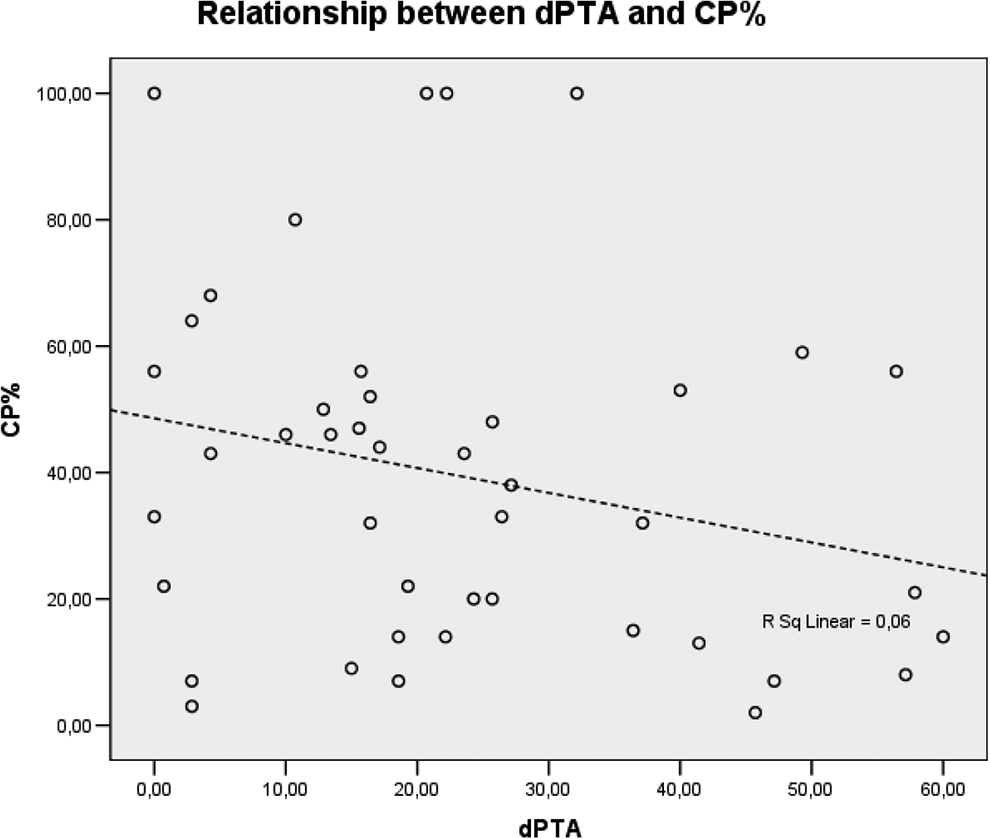
The analysis of correlation between CP% and dPTA. CP% indicates canal paresis; dPTA, interaural difference of the hearing level.
To perform categorical analysis using Cohen kappa test, the dPTA and CP% parameters were subcategorized into a smaller and into a greater range as shown in Table 2. Kappa test was performed for the achievement of the comparison of the CP% and dPTA, resulting in kappa = 0.174 (95% CI: 0.0883 - 0.431), indicating a slight correlation according to the interpretation of the test (slight: 0-0.2). Based on the categorical analysis, it also can be stated that increasing values in one of the parameters does not indicate an increasing tendency in the other one as well.
CP% and dPTA Comparison (Kappa Test).
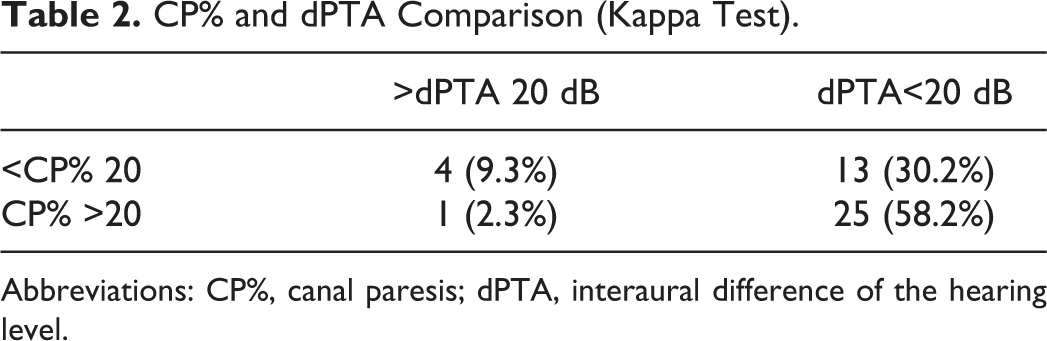
Abbreviations: CP%, canal paresis; dPTA, interaural difference of the hearing level.
Comparison between the PTA average of the diseased ear and the CP% was done. As shown in Figure 2, according to the linear correlation (R2 = 0.007), there is no correlation between the examined parameters. Pearson correlation (rho = 0.085, P = .586) also supported this statement. Examining the nonlinear correlation using Spearman test, no significant correlation was detected (rho = 0.11, P = .481).
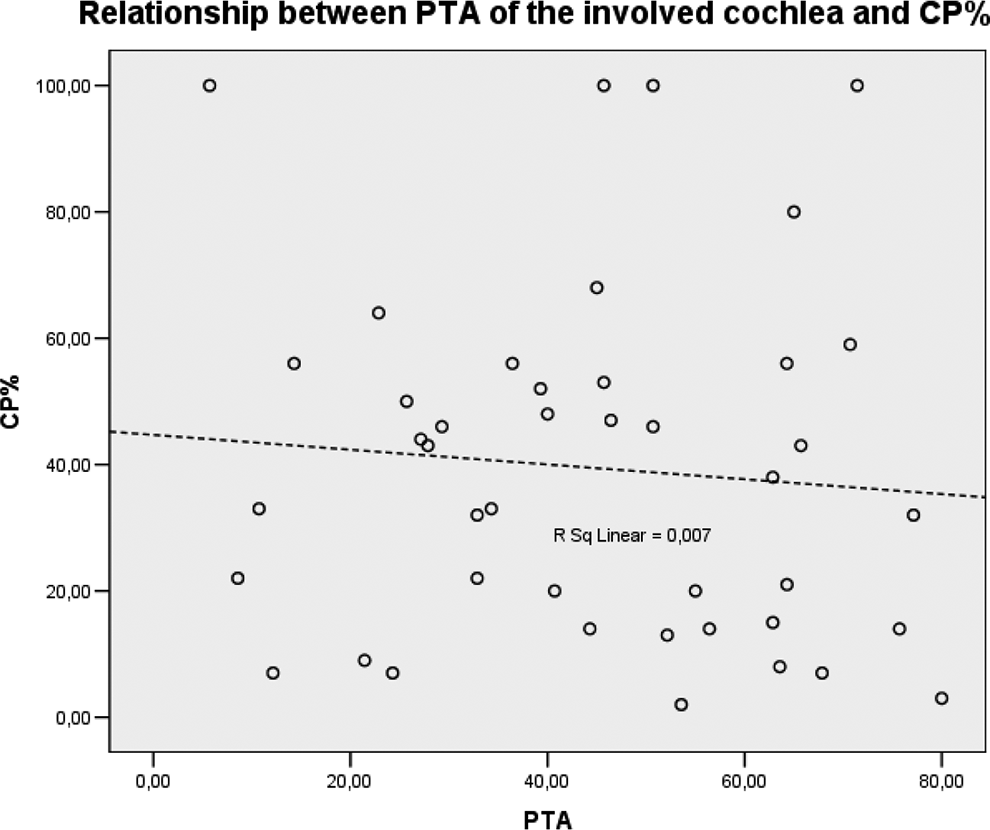
The analysis of correlation between CP% and PTA. CP% indicates canal paresis; PTA, pure-tone audiometry.
The distribution of CP% parameters in different stages of MD is shown in Figure 3. Based on the boxplot, it can be concluded that there is no significant difference between the parameters of the different stages, which was also confirmed by the statistical analysis. It can be concluded that a more advanced stage based on audiometry does not mean increasing values in a patient’s CP% parameter.
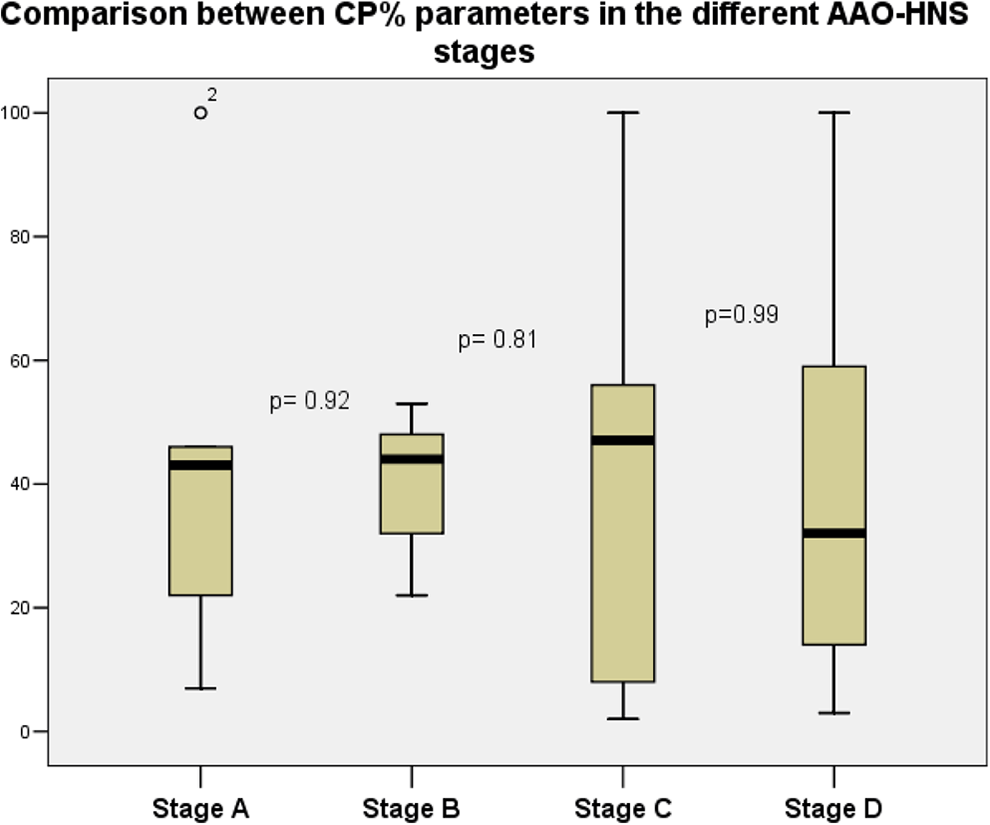
Comparison between CP% in the different AAO-HNS stages. Black line: median value, box: the middle 50% of the data, whiskers: upper and lower 25%. P values were determined based on the Mann-Whitney U test. AAO-HNS indicates American Academy of Otolaryngology-Head and Neck Surgery; CP%, canal paresis.
Through the usage of statistical analysis, it is stated that no distinguished association exists between hearing loss and the caloric reaction in the investigated frequencies. This means that reduced caloric response can develop, regardless of the degree of hearing loss in the recorded frequencies.
Discussion
In this study, both tests analyzed are common diagnostic methods used for the evaluation of the vestibular and cochlear functions, being adequate for the functional estimation of patients with MD and for characterizing the cochleovestibular relationship in this vertiginous population. Our sample includes a representative group of MD patients, and all studies were performed at the same time presented in our tertiary care referral center. We found that most patients were classified into later stages of MD; the most frequent category was stage C (44.2%). According to caloric test results, abnormalities were detected in 29 (67.4%) of the 43 patients demonstrating unilateral weakness, which is a characteristic of advanced unilateral MD.
The possible correlation between PTA and the caloric test results was also investigated in previously published studies. Based on the results of Enander and Stahle, 11 a retrospective study was made of 343 patients examining the correlation of these 2 tests, and it was concluded that the greater hearing loss was registered, the greater tendency to reduced caloric response was detected. Their statistical analysis showed a correlation coefficient of 0.27, which is only a partial of a perfect correlation. On the other hand, in the study mentioned previously, the hearing loss was determined by averaging only the lower and middle frequencies; however, a low- to medium-frequency hearing loss is typical only at the early stages of MD. In their study, the mean duration of the disorder was defined as 8 years, and most patients were found in the 40 to 59 dB and 60 to 79 dB groups, indicating later stages of MD. This finding contrasted with ours, as a reduced caloric response did not correlate with hearing loss, although in our study, hearing loss was expressed as an extended Fletcher index value. Brix and Ehrenberger 12 stated that no clear correlation exists between hearing loss and caloric reaction. By calculating the correlation between the hearing loss and the caloric response, no significant correlations were obtained at 500, 1000, and 2000 Hz, whereas at 4000 Hz, they found a substantial correlation (rho = 0.85), meaning that one can expect a normal caloric response when the hearing loss is less than 40 dB at 4000 Hz. Therefore, both tests should be performed to get a broader understanding of the status of the MD patient and for proper therapy planning.
Fukushima et al 13 found that caloric weakness depends on the endolymphatic hydrops (EH) and its volume. Rey-Martinez et al 14 supported this hypothesis, concluding that EH produces convective currents that cancel the hydrostatic effect, which is eventually responsible for the caloric test stimulus. The dissociation between the cochlear and vestibular functions could be explained by previous histopathological findings, that is, in the inner ear, the cochlea is mostly involved by EH, followed by the saccule, utricle, and the semicircular canals. 15 Having examined the temporal bone, Pender 1 supported this orderly lesion progression of MD, suggesting that the hydronic process staging begins in the cochlear apex, whereas the vestibular sensory cells were rarely affected. 12 Later, this fact was also strengthened by clinical investigations using MRI, and correlation was detected between hearing loss on low, medium, and high frequencies and the grade of hydrops, but it was not between vertigo attacks, tinnitus, and CP%. 16 In our study group, the distribution of the patients with dissociated audiometric and caloric test data was the following: in 25 patients (58.2%), CP% was in the normal range, but dPTA was over 20 dB, and only in 4 patients (9.3%) reversed. This fact also confirms the previous results, that is, the cochlear functions are more damaged than the vestibular ones, which results in dissociation between the parameters.
According to Basura et al, 17 the electrophysiological testing should not be used routinely for the diagnosis of MD, since the level of confidence in evidence is medium. This statement is in contrast to our study. In this study, the finding of 67.4% of abnormal caloric tests is also in accordance with other studies,7,18 indicating that caloric test can be used with relatively high sensitivity in the diagnosis of MD. Nonetheless, the correlation with the audiometric results is poor. In a recent study by Limviriyakul et al, 19 it was also concluded that weakness existed in 76.5%, concluding that the caloric test is capable of detecting abnormalities of the vestibular function in all stages of MD. Cerchiai et al 20 compared the frequency of the jerks and SPV and showed the dissociation correlation between the parameters. Based on their study, SPV characterized patients with very early stage and abnormal values of frequency parameter were common when a cochlear damage was established. Therefore, both tests should be applied to evaluate the changes in functions in both systems.
Our study showed that audiometric changes do not directly correlate with vestibular changes; therefore, no specific correlation exists between cochlear and vestibular function loss in MD. Consequently, for therapy planning and the diagnosis of the disorder, both tests are necessary. The caloric test can identify the function of the affected lateral canal as well as it gives an instrumental support for the diagnosis, and audiometry indicates the severity of the existing hearing loss in patients with MD. This study is limited, as it represents a retrospective review of a case series. First, the fluctuation of the complaints of the patients suffering from MD (being a progressive one) should be mentioned, too. Second, the results of other vestibular tests are not included in this study.
Footnotes
Authors’ Note
All procedures performed in studies involving human participants were in accordance with the ethical standards of the institutional and/or national research committee and with the 1964 Helsinki declaration and its later amendments or comparable ethical standards.
Declaration of Conflicting Interests
The author(s) declared no potential conflicts of interest with respect to the research, authorship, and/or publication of this article.
Funding
The author(s) received no financial support for the research, authorship, and/or publication of this article.