
Abstract
In this study, we aimed to investigate the relationship between the body mass index (BMI) and the morphometric properties of auricula and its acoustic gain characteristics. A total of 45 participants between 18 and 45 years of age were enrolled into the study. Participants’ height and weight measurements were recorded for the BMI calculation. On both sides, the morphometric properties of the auricula were measured and recorded. Additionally, the participants were subjected to multidirectional dynamic real ear measurements (REMs) to specify the intensity and frequency values of the maximum hearing gain. Participants consisted of 24 women and 21 men. The mean BMI was 23.42. The mean auricular area was 22.70 cm2. Statistically significant positive correlation was found between the auricular area and BMI (r = 0.427, P = .03). The mean postauricular sulcus angle was 20.99°. The mastoid-helix distance was 16.07 mm. There was no statistically significant correlation between BMI level and postauricular sulcus angle and mastoid-helix distance (P > .05). The mean dynamic REM measurement was evaluated. The maximum acoustic gain at anterior, lateral, and posterior vectorial stimulation was calculated as 20.9, 24.2, and 20.7 dB Sound Presure Level (SPL), respectively. Statistically significant negative correlation was found between the three directions acoustic gain level and BMI in the statistical examination (r = −0.365, r = −0.386, r = −0.453, respectively, and P < .05 for all). The results of acoustic gain frequency were 2967.4, 2963, and 2934 Hz, respectively. There was no statistically significant correlation between acoustic gain frequency and BMI (P > .05). When participants were grouped according to their BMI, participants with a BMI >25 had a statistically significantly bigger auricular area and lower maximum acoustic gain when compared with those with BMI <25 (P < .05). We found that the auricular area increased with BMI. We think that this is related to soft tissue thickening of the auricula related to high BMI. In addition, we found that the acoustic gain level decreased inversely with BMI. We believe that the decrease in acoustic gain is due to the increase of acoustic resistance after the increase of soft tissue thickness. In conclusion, we think that BMI has a negative effect on auditory function according to findings in our study.
Introduction
External ear consists of 2 parts, the auricula and the external auditory canal. External ear is basically effective in providing acoustic gain in hearing physiology. Additionally, it is affected by structural factors such as age, sex, race, as well as nutritional and environmental factors. 1 Several structural changes occur in the postnatal period. Such changes are life-long and vary according to sex and period of life. 2 The auricula of a newborn child is larger than other parts of the body. After birth, it continues to grow rapidly until the age of 8 to 10 years. 2 Growth of the auricula proceeds at a slower pace for the rest of a person’s life. 3 Anatomic growth of the auricula in males is generally a little more than females. Growth rates of the auricula in males and females are 0.24 mm/y and 0.17 mm/y, respectively. 4 According to the several studies that used morphometric measurements, the length of the auricula between the helix and inferior border of the lobule corresponds to 52 mm in newborn males and females. 5 -7 This length is to 61 mm and 65 mm in females and males aged 20 years, respectively. In participants older than 70 years, it is 72 mm in females, whereas it is 78 mm in males. 2 In general, the length of the auricula in males is approximately 6.5% longer than females. Additionally, the width of the auricula (helix to tragus) is about 50% to 60% of its length. The distance between the most protruding point of the mastoid and auricula is shown to be 1 to 2 cm, and the angle of the postauricular sulcus angles is suggested to be 15° to 30°. 8
The auricle is known to be influential on hearing function with respect to its structural features. 9 The roles of the auricula and external auditory canal in hearing functions are to increase the intensity of the sound stimulus through a resonator effect and to help the localization of sound stimuli. The resonator effect of the auricula is not identical for each frequency, and there are several varieties. It was detected that the resonator effect of the auricular in adults was within the range of 1.5 to 7 kHz and its mean value was 6 dB. 10
Body mass index (BMI) is the measurement of body fat in adult males and females. It is also an indication of soft tissue thickness at the same time. 11 Kg/m2 formula is used for the calculation of BMI. It was determined that the BMI values were not related to age and sex. 12 The normal BMI value is between 18.5 and 25. While <18.5 is underweight, ≥25 is overweight, and ≥30 is considered obese. 13 The functions of many organs and systems may be influenced by the changes in the BMI. Subdermal fat accumulation in the head and neck region is common, as in all organs and tissues with increased BMI. Subdermal intense fat content is present in auricula lobuli, first one-third of external ear canal, mastoid, preauricular, and subauricular area. Secondary to increased BMI, subdermal fat tissue is increased in these regions.
In this study, we hypothesized that the changes in BMI will affect the morphometric measurements of the auricula and result in variations in auditory functions. Therefore, we aimed to first reveal the relationship between morphometric measurements of auricula with BMI and secondly to investigate the relationship between BMI and auditory functions
Materials and Methods
The study was conducted at Otorhinolaryngology Department, between June 1 and December 1, 2016. Approval of the ethics committee was received to perform the study (approval date: May 06, 2016, number: 6909). Informed consent forms were obtained from all participants of the study.
The study was conducted with 45 healthy participants. All participants in the study were aged between 18 and 45 years. The exclusion criteria were hearing loss, developmental disorders of the auricle, previous ear operations, tumor, trauma, and history of additional disease. The external auditory canal was evaluated with microscopic examination and any cerumen found was removed. Participants with current exocytosis, osteoma, otomycosis, and chronic or acute external otitis were excluded from the study. Hearing thresholds of all participants were determined by applying pure-tone audiometry. The age, sex, weight, and height of all participants were recorded. Moreover, anatomic characteristics of the auricula were recorded using morphometric measurements to investigate the effects of the auricle on sound transmission. Additionally, the participants were subjected to dynamic real ear measurements (REMs) with the intention to specify the intensity and frequency values of maximum hearing gain that may hypothetically occur due to anatomy of the auricula.
Morphometric Measurements of the Auricle
As part of these measurements, both ears of all participants were measured at least twice and recorded as suggested by Bozkir et al.
1
Total ear length: distance between the top of the auricle and the bottom of the ear lobe Ear width: dstance from the tragus to the helix Area of the auricle: This was calculated by using the total ear length and ear width. Ear projection: distance between the helix and the mastoid process Postauricular sulcus angle: angle between the helix at the level of the tragus and mastoid process
Dynamic REM Evaluation
AURICAL Plus (Otometrics; Taastrup, Denmark) sound processor was used for measurement. White noise was administered to patients at a horizontal plan (0° elevated angles) from a distance of about 0.5 m for recording. Noise was applied from three directions: anterior (0°), lateral (90°), and posterior (180°). A Teflon microphone with 2-mm diameter and 10-cm length was placed just at the entrance (1-2 mm) of the external auditory canal to measure the resonance that formed in the auricle following the noise. Every record was repeated 10 times to ensure the reliability of the evaluation. The intensity and frequency values of the maximum hearing gain were recorded using the frequency and intensity curve, which was obtained via dynamic REM. By examining the intensity and frequency curve, the maximum gain level and the frequency level at the maximum gain level were recorded.
Body Mass Index Measurement
Body mass index measurements of participants were performed after height and weight measurements. Kg/m2 formula was used for BMI measurement.
Statistical analysis
IBM SPSS 20 version was used for statistical analyses. Descriptive statistical data were calculated. The relevance of the variables to normal distribution was analyzed through analytical methods (Kolmogorov–Smirnov/Shapiro–Wilk tests). Mann-Whitney U test was used for the comparison of nonparametric numerical data. Pearson test was used to examine the relationship between the variables of the different groups that conformed with normal distribution, and Spearman test was applied to examine the variables of different groups that were not normally distributed. The type 1 error level was identified as 5% for statistical significance.
Results
Demographic Results
The study was conducted with 45 participants; 24 (53.3%) and 21 (46.7%) of the participants were females and males, respectively. The mean age of the participants was 28.64 years (standard deviation [SD] = 7.66; Table 1).
Demographic Features of Participants (n = 45).
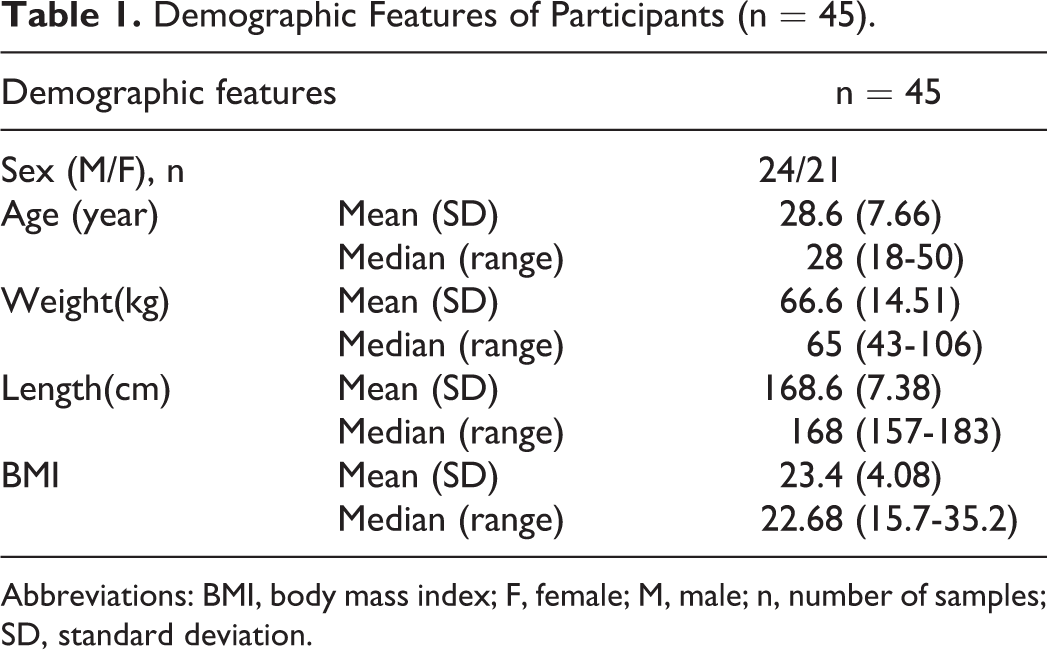
Abbreviations: BMI, body mass index; F, female; M, male; n, number of samples; SD, standard deviation.
The weights and heights of the participants were measured; the mean height and weight were 168.7 cm (SD = 7.38) and 66.6 kg (SD = 14.5), respectively. Body mass index measurements were made using weight and height measurements. The mean BMI was 23.4 (SD = 4.08) (Table 1). For further analysis of results, participants were grouped according to their BMI (BMI <25 and BMI ≥25).
Morphometric Measurement Results
Both ears of each participant were subjected to morphometric measurement. Thus, the measurement contained a total of 90 ears (of 45 participants).
The mean total ear length (distance between the upper helix and inferior border of the ear lobule) was 65.6 mm (SD = 4.22), and the auricle width (distance between the tragus and helix) was 34.5 mm (SD = 2.39; Table 2). The mean auricle area for all participants was 22.70 mm2 (SD = 3.49; Table 2).
Morphometric Measurements of Auricula.a
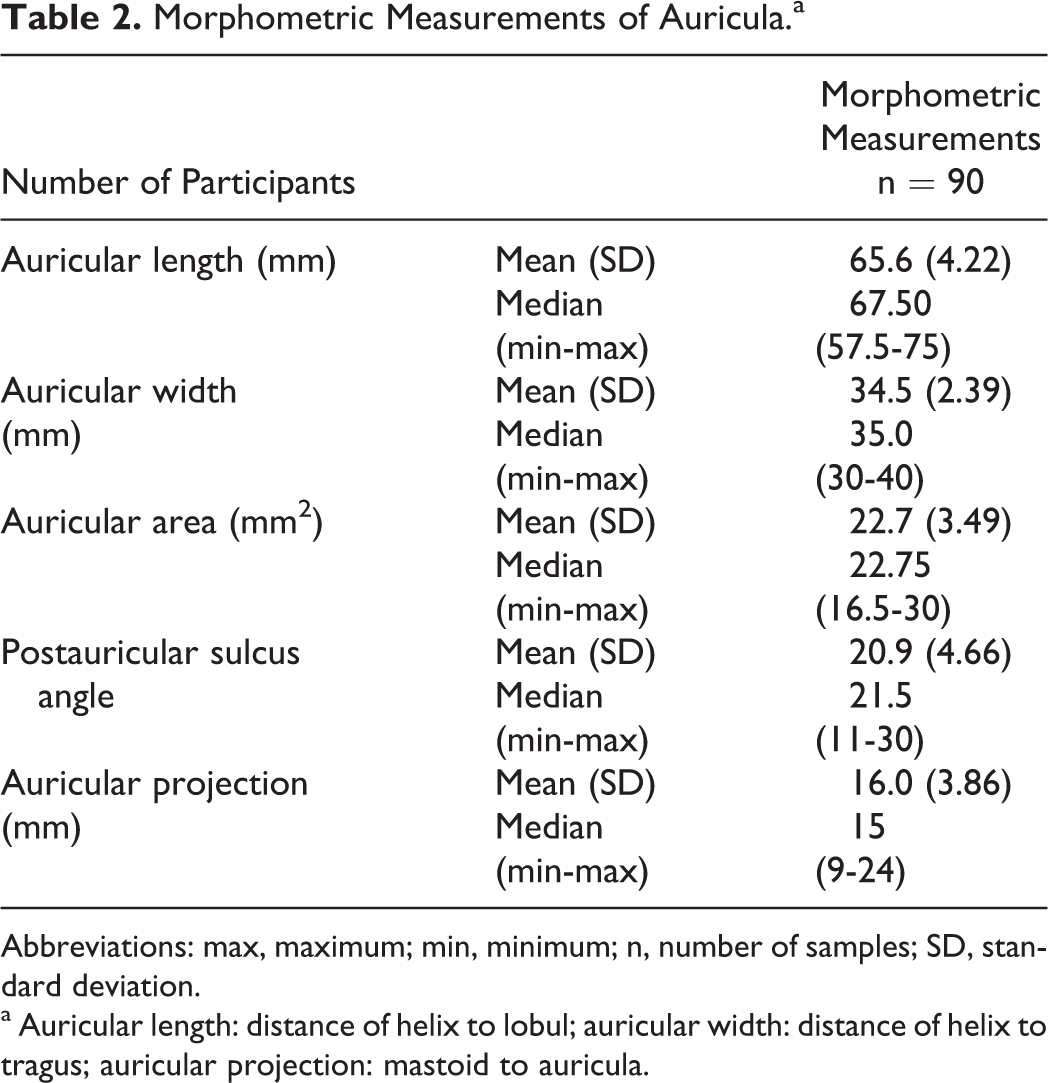
Abbreviations: max, maximum; min, minimum; n, number of samples; SD, standard deviation.
a Auricular length: distance of helix to lobul; auricular width: distance of helix to tragus; auricular projection: mastoid to auricula.
The mean auricular projection (distance between the helix and mastoid) of the participants was 16.03 mm (SD = 3.80). Calculations showed that the mean postauricular sulcus angle was 20.99° (SD = 4.66; Table 2).
Dynamic REM Results
During dynamic REM recording, which was performed with 3-directional sound stimulus, the maximum hearing level at anterior vectorial stimulation (0°), lateral vectorial stimulation (90°), and posterior vectorial stimulation (180°) were calculated as 20.9 dB SPL (SD = 3.16), 24.2 dB SPL (SD = 3.05), and 20.7 dB SPL (SD = 3.09), respectively (Table 3).
Analysis of Directions to Sound Stimulus.
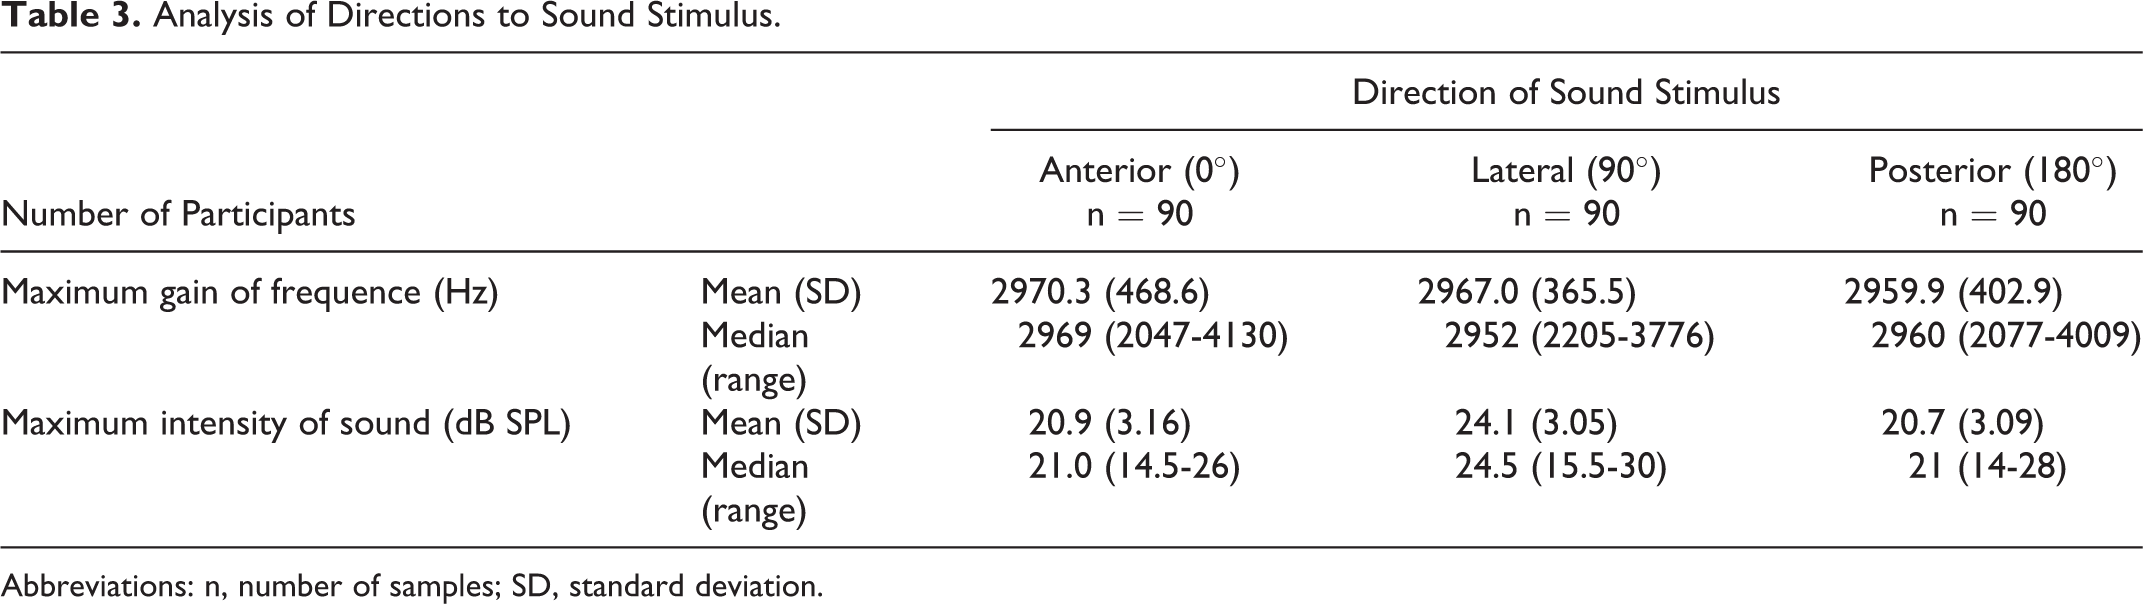
Abbreviations: n, number of samples; SD, standard deviation.
Body Mass Index–Morphometric Measurement, BMI-REM Relationship Analysis Results
When the relationship between morphometric measurement results of auricula and BMI was examined, it was shown that auricula area was statistically significantly correlated with BMI (r = 0.427 and P < .05; Figure 1). When the participants were divided into 2 groups according to their BMI (ie, BMI <25 and BMI ≥25), the area of the auricular was significantly bigger in participants with BMI ≥25 (P < 001; Table 4 and Figure 2). However, there was no correlation between postauricular angle and helix-mastoid distance and BMI (r = 0.244, r = 0.163, respectively, and P > .05 for all).
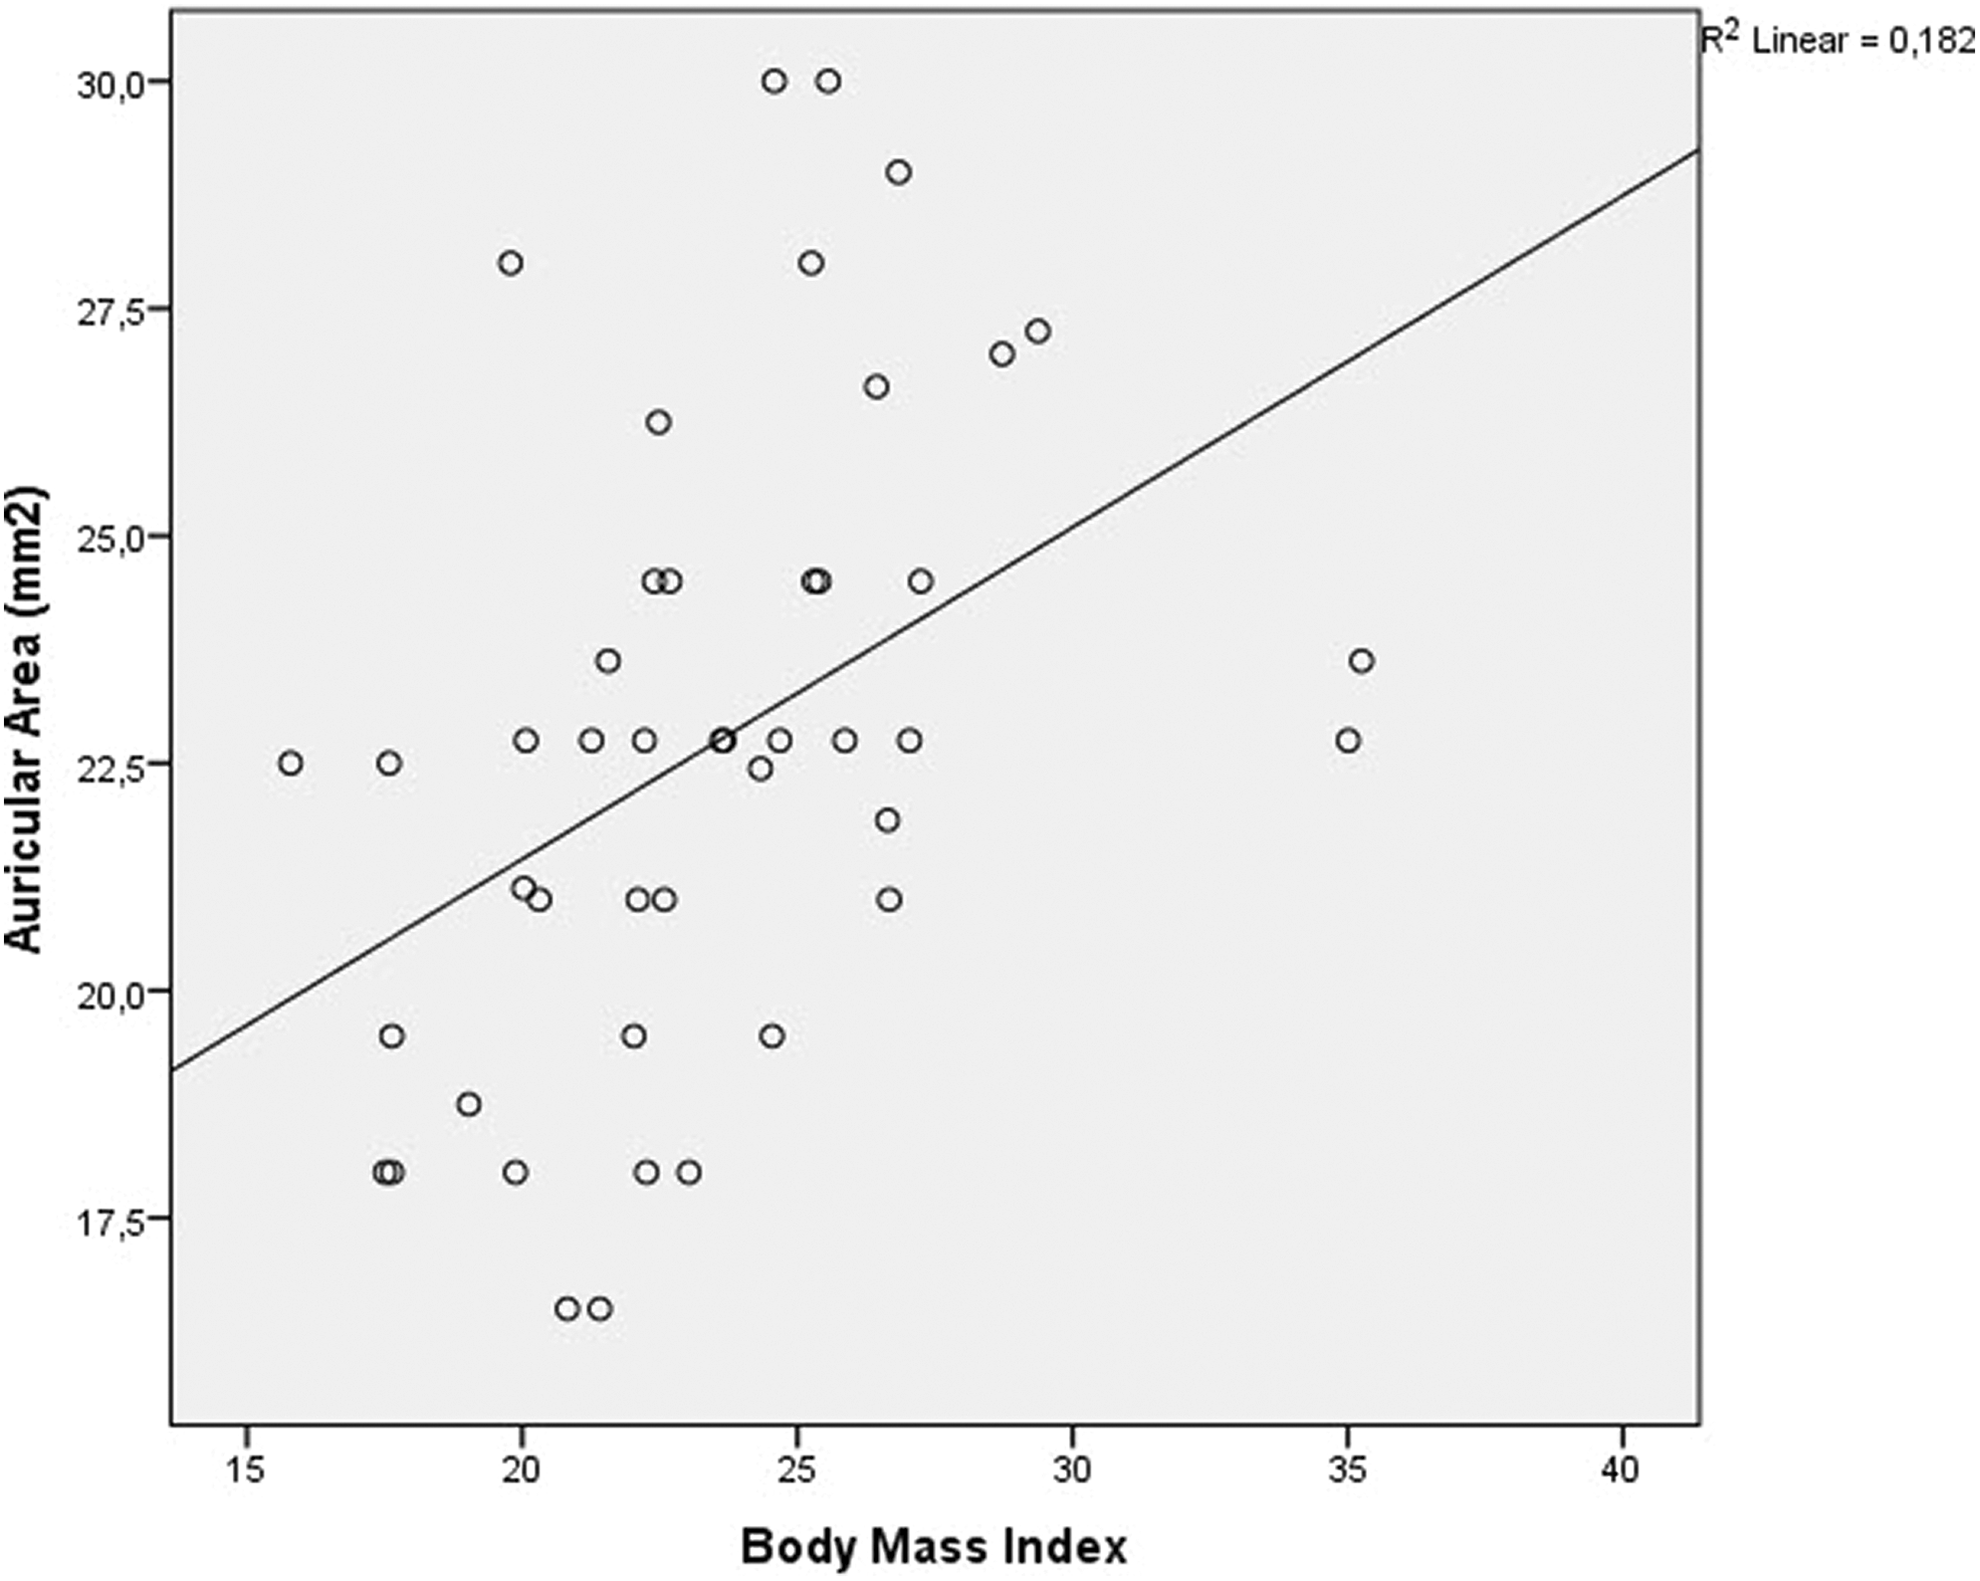
The relationship between body mass index (BMI) and the auricular area.
Comparison of Auricular Area and Maximum Intensity of Sound (dB) in Participants With BMI Value Smaller and Bigger Than 25.a
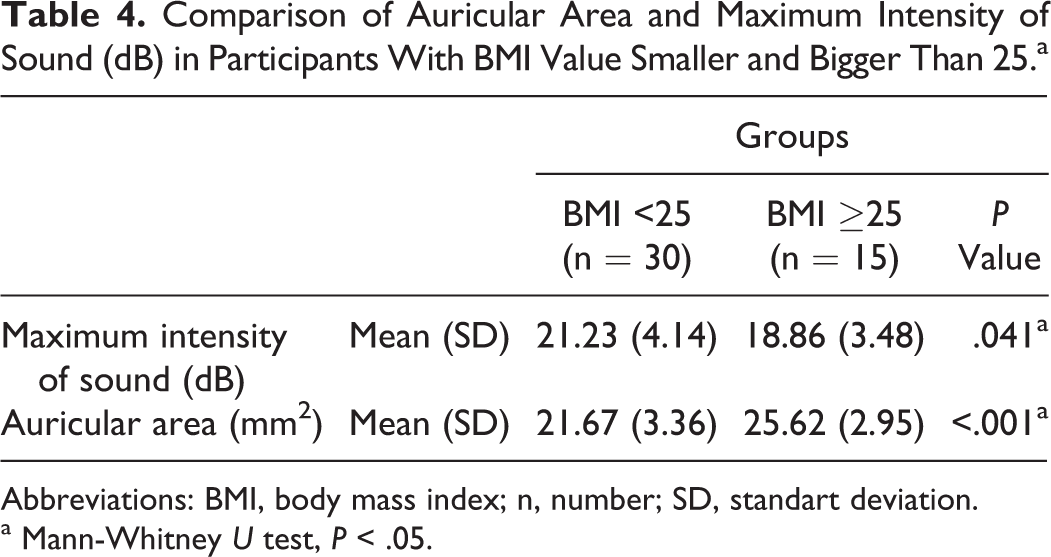
Abbreviations: BMI, body mass index; n, number; SD, standart deviation.
a Mann-Whitney U test, P < .05.
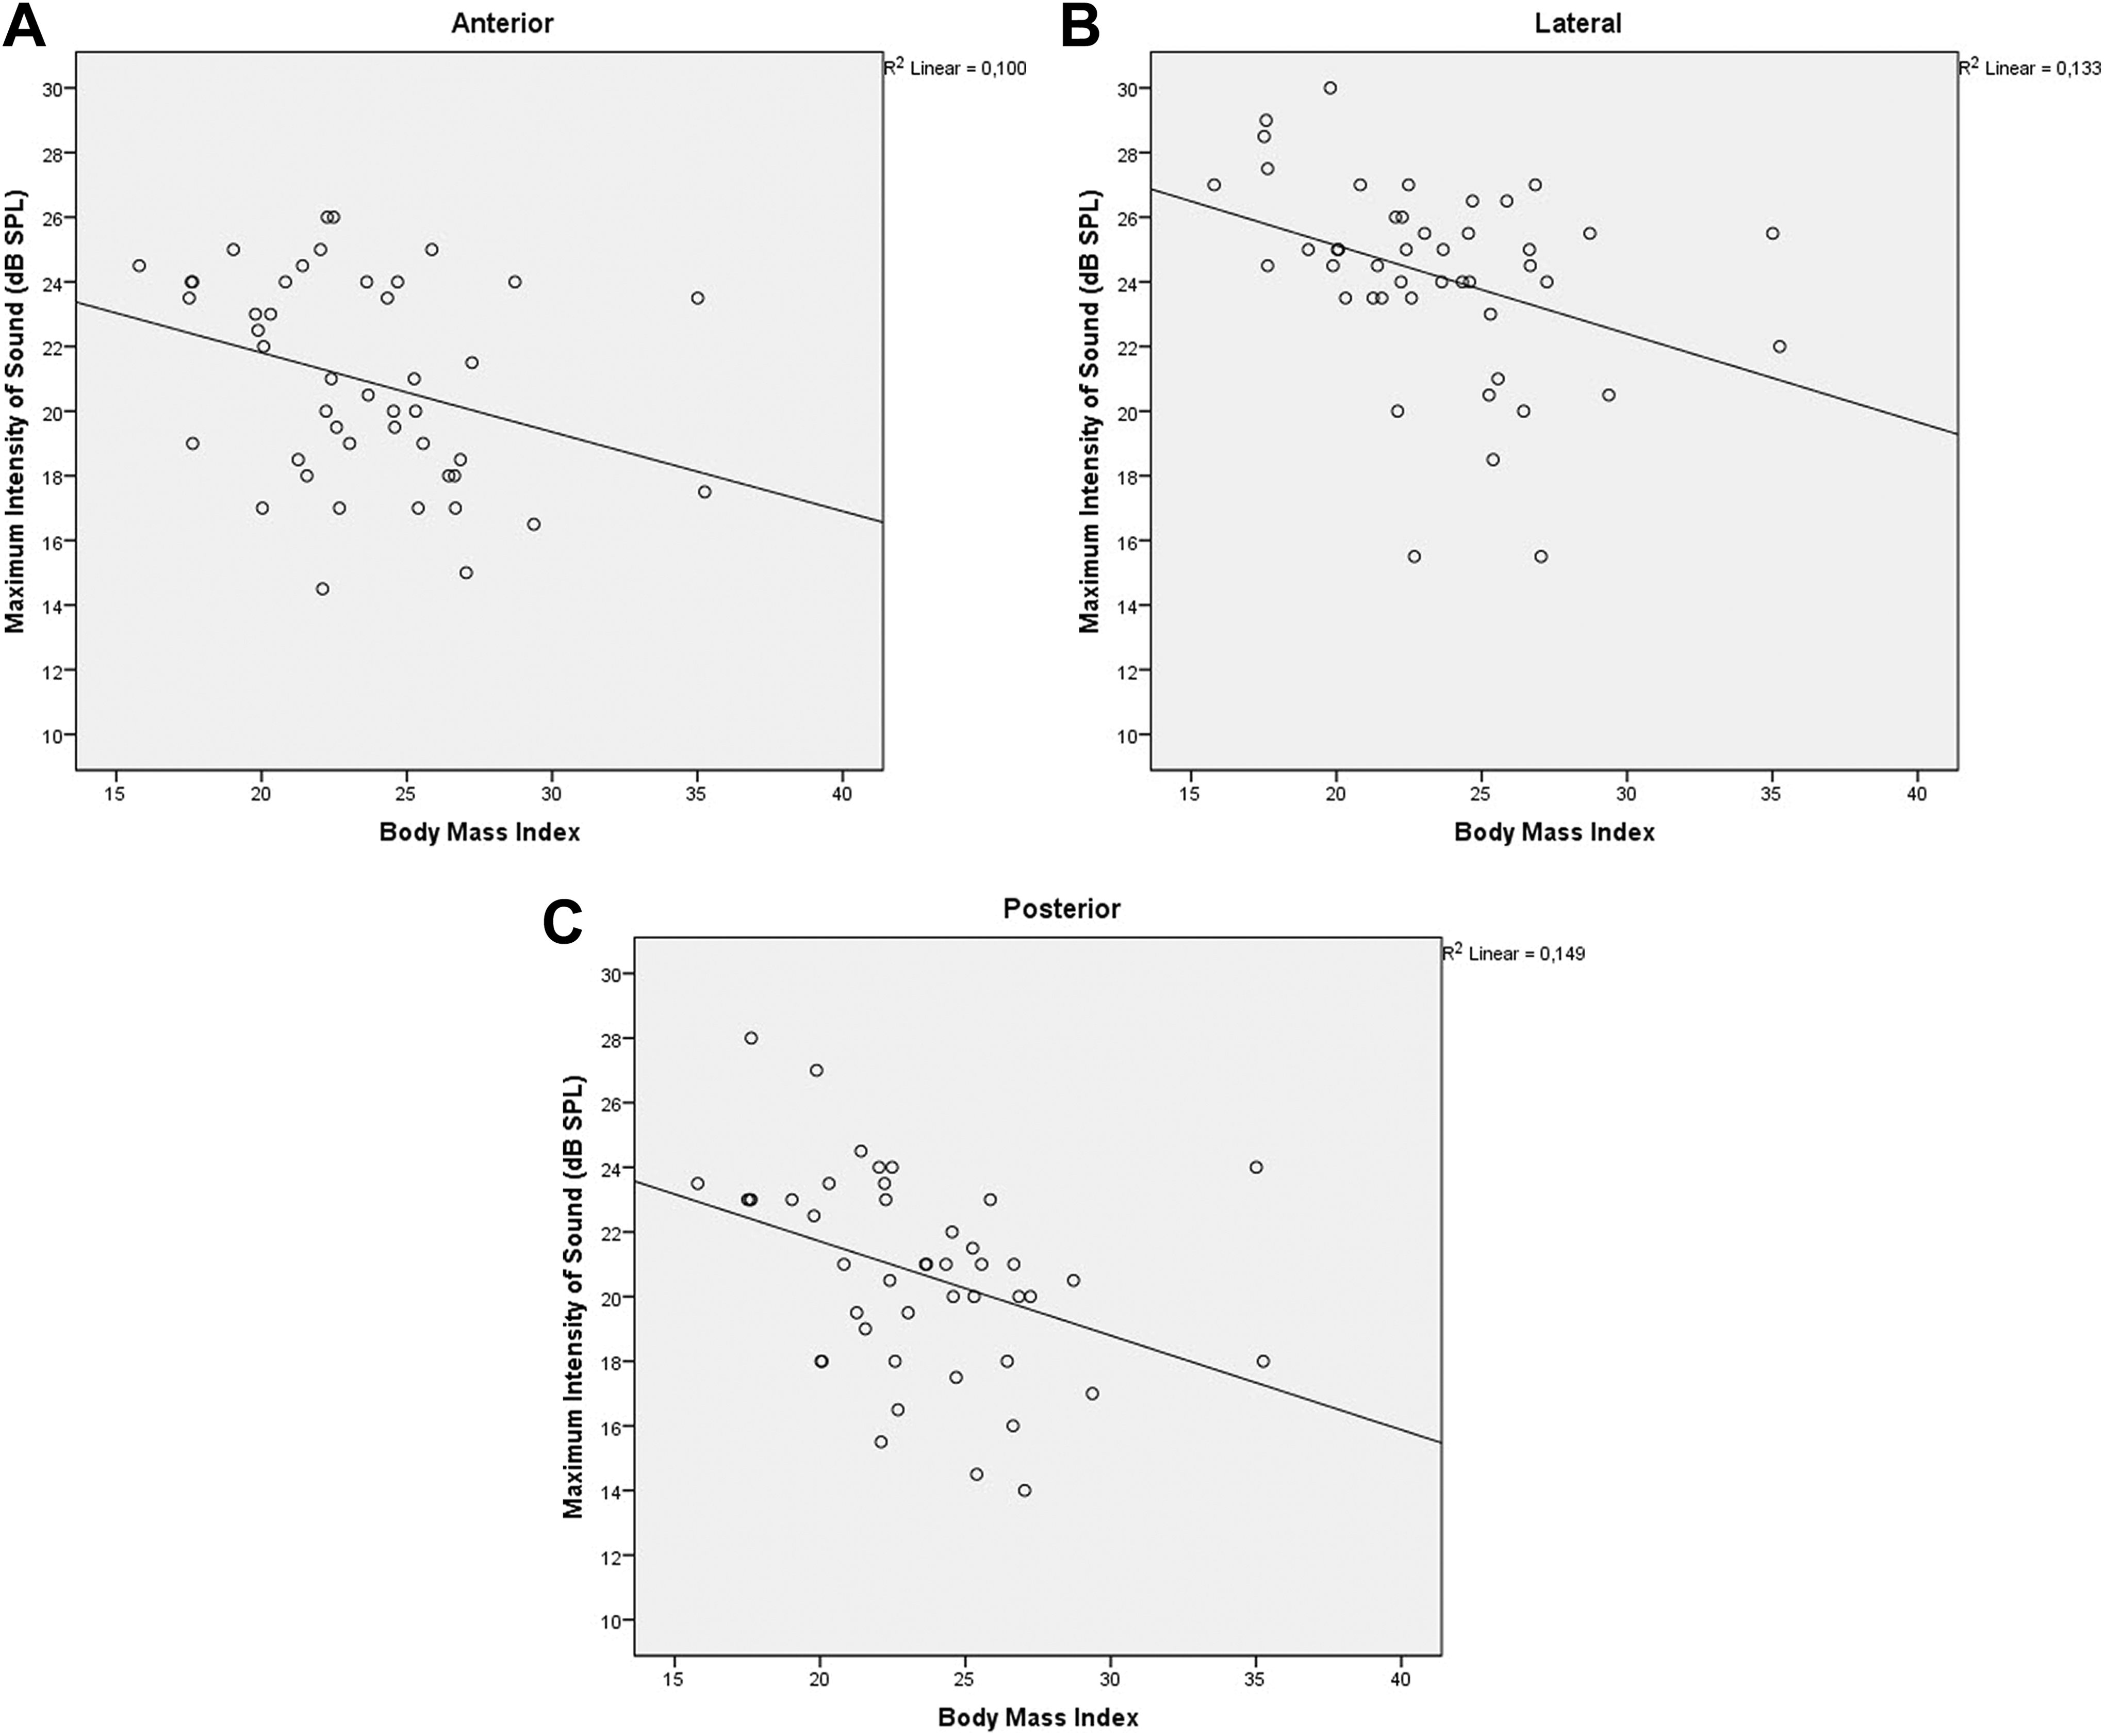
A-C, Effect of body mass index (BMI) on the amplifying effect of auricula on auditory stimuli given to the three direction (anterior, lateral and posterior).
The relationship between BMI and dynamic REM results was examined. The maximum gain intensity of the sound stimulus from anterior, lateral, and posterior vectors was inversely proportional to BMI (r = −0.365, r = −0.386, r = −0.453, respectively, and P < .05 for all; Figure 3A-C). When the participants were divided into 2 groups according to their BMI (ie, BMI <25 and BMI ≥25), the maximum gain intensity of the sound stimulus from all directions was significantly lower in participants with BMI ≥25 (P = .04; Table 4 and Figure 4).
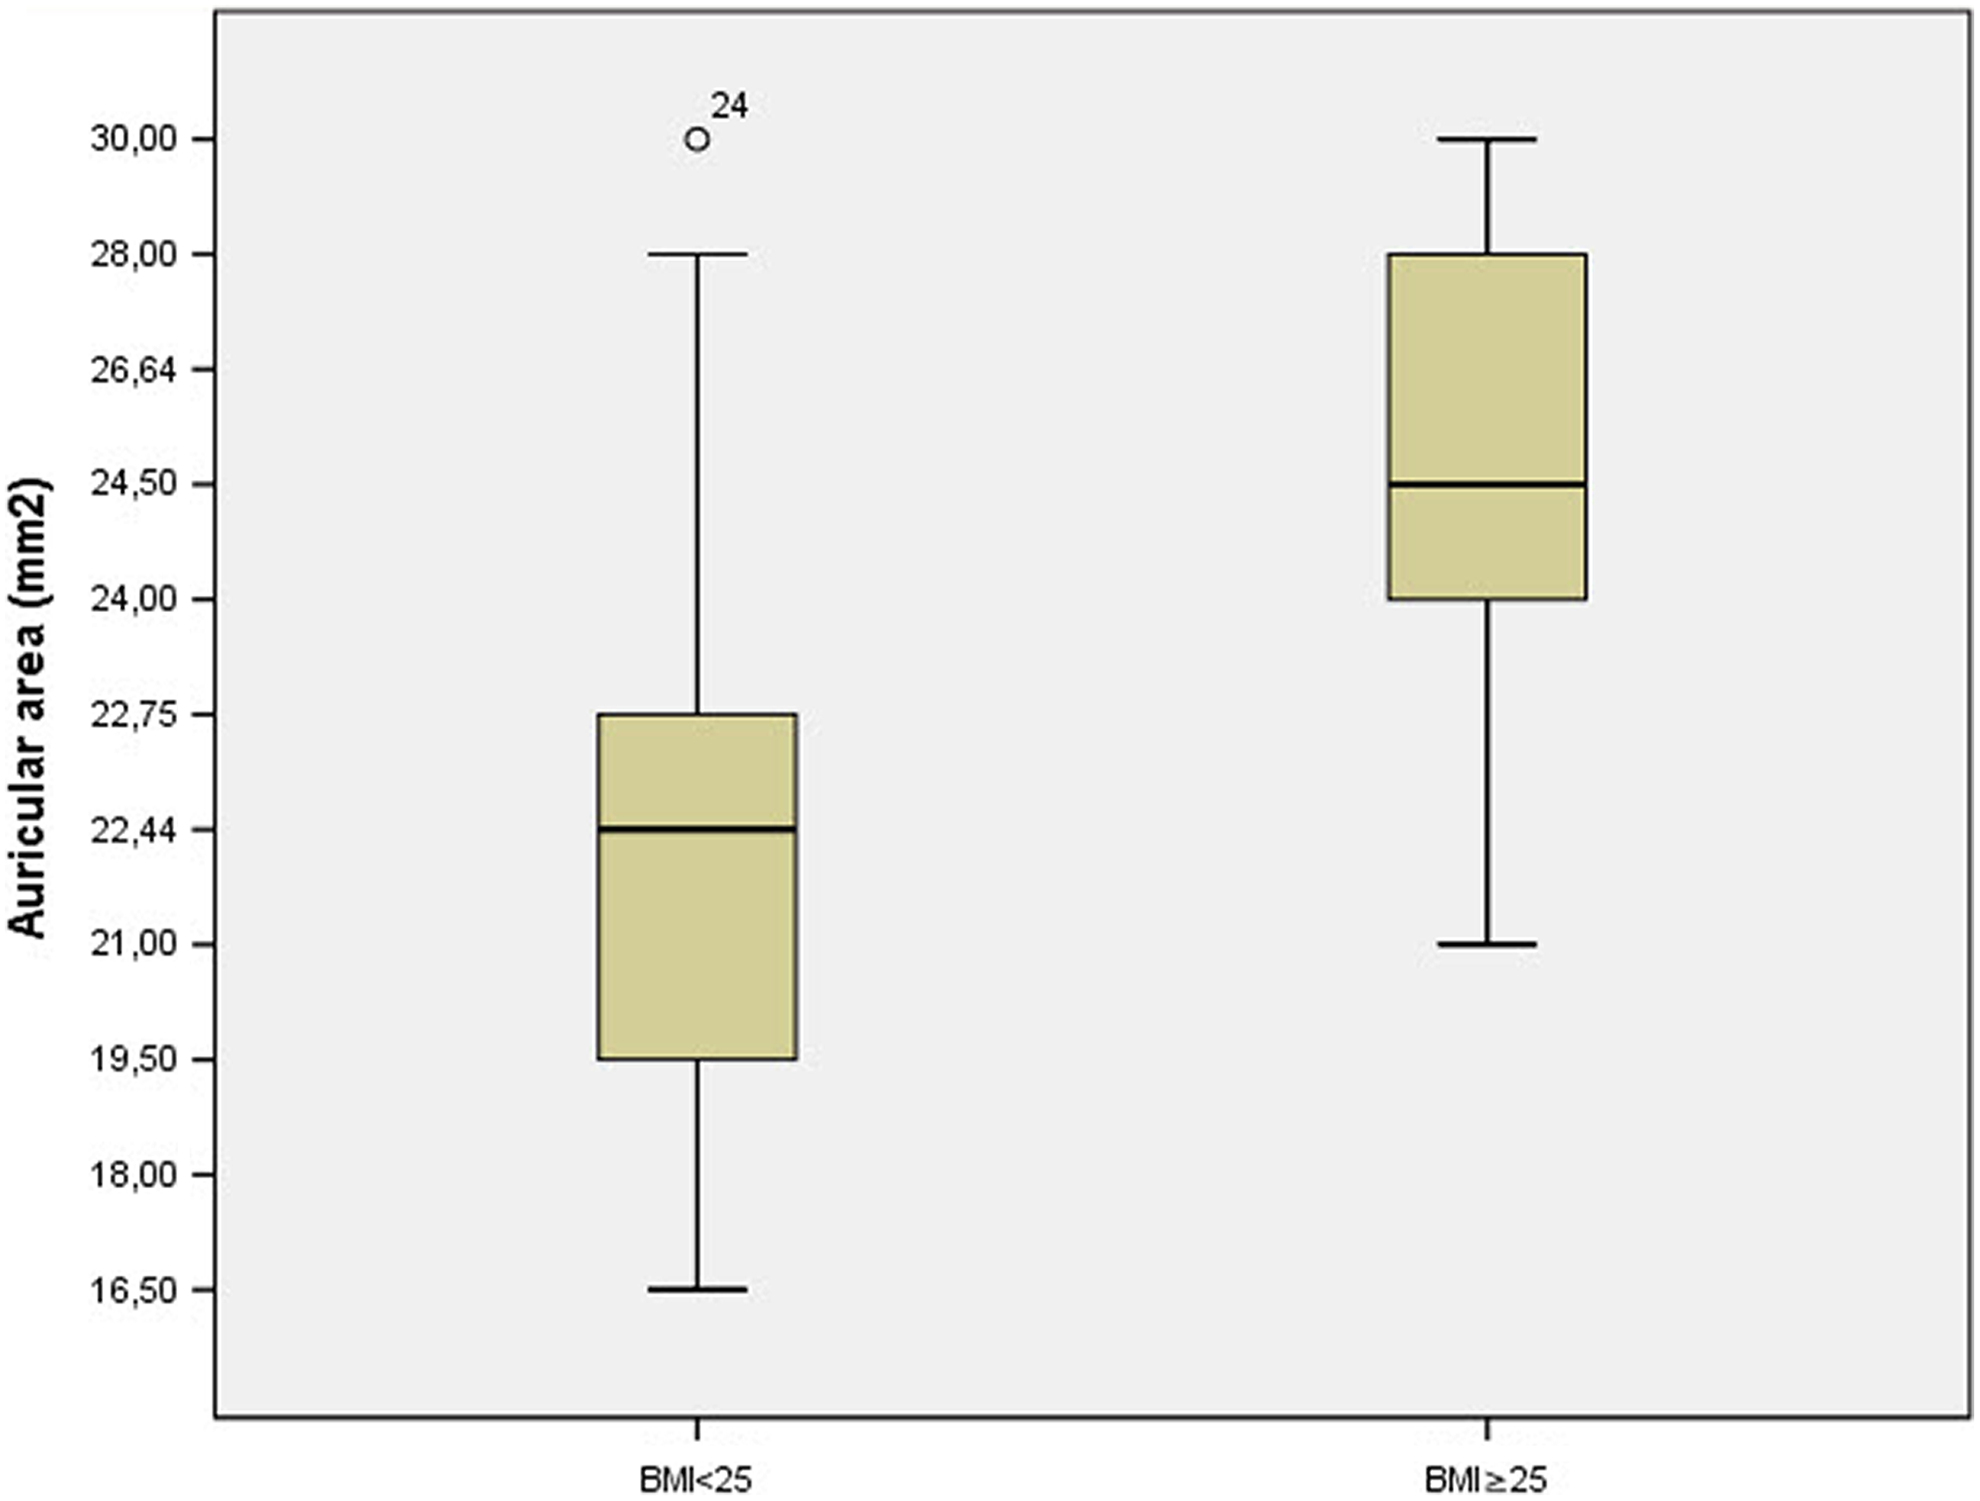
The auricula areas of body mass index (BMI) <25 persons were found to be smaller than ≥25 persons.
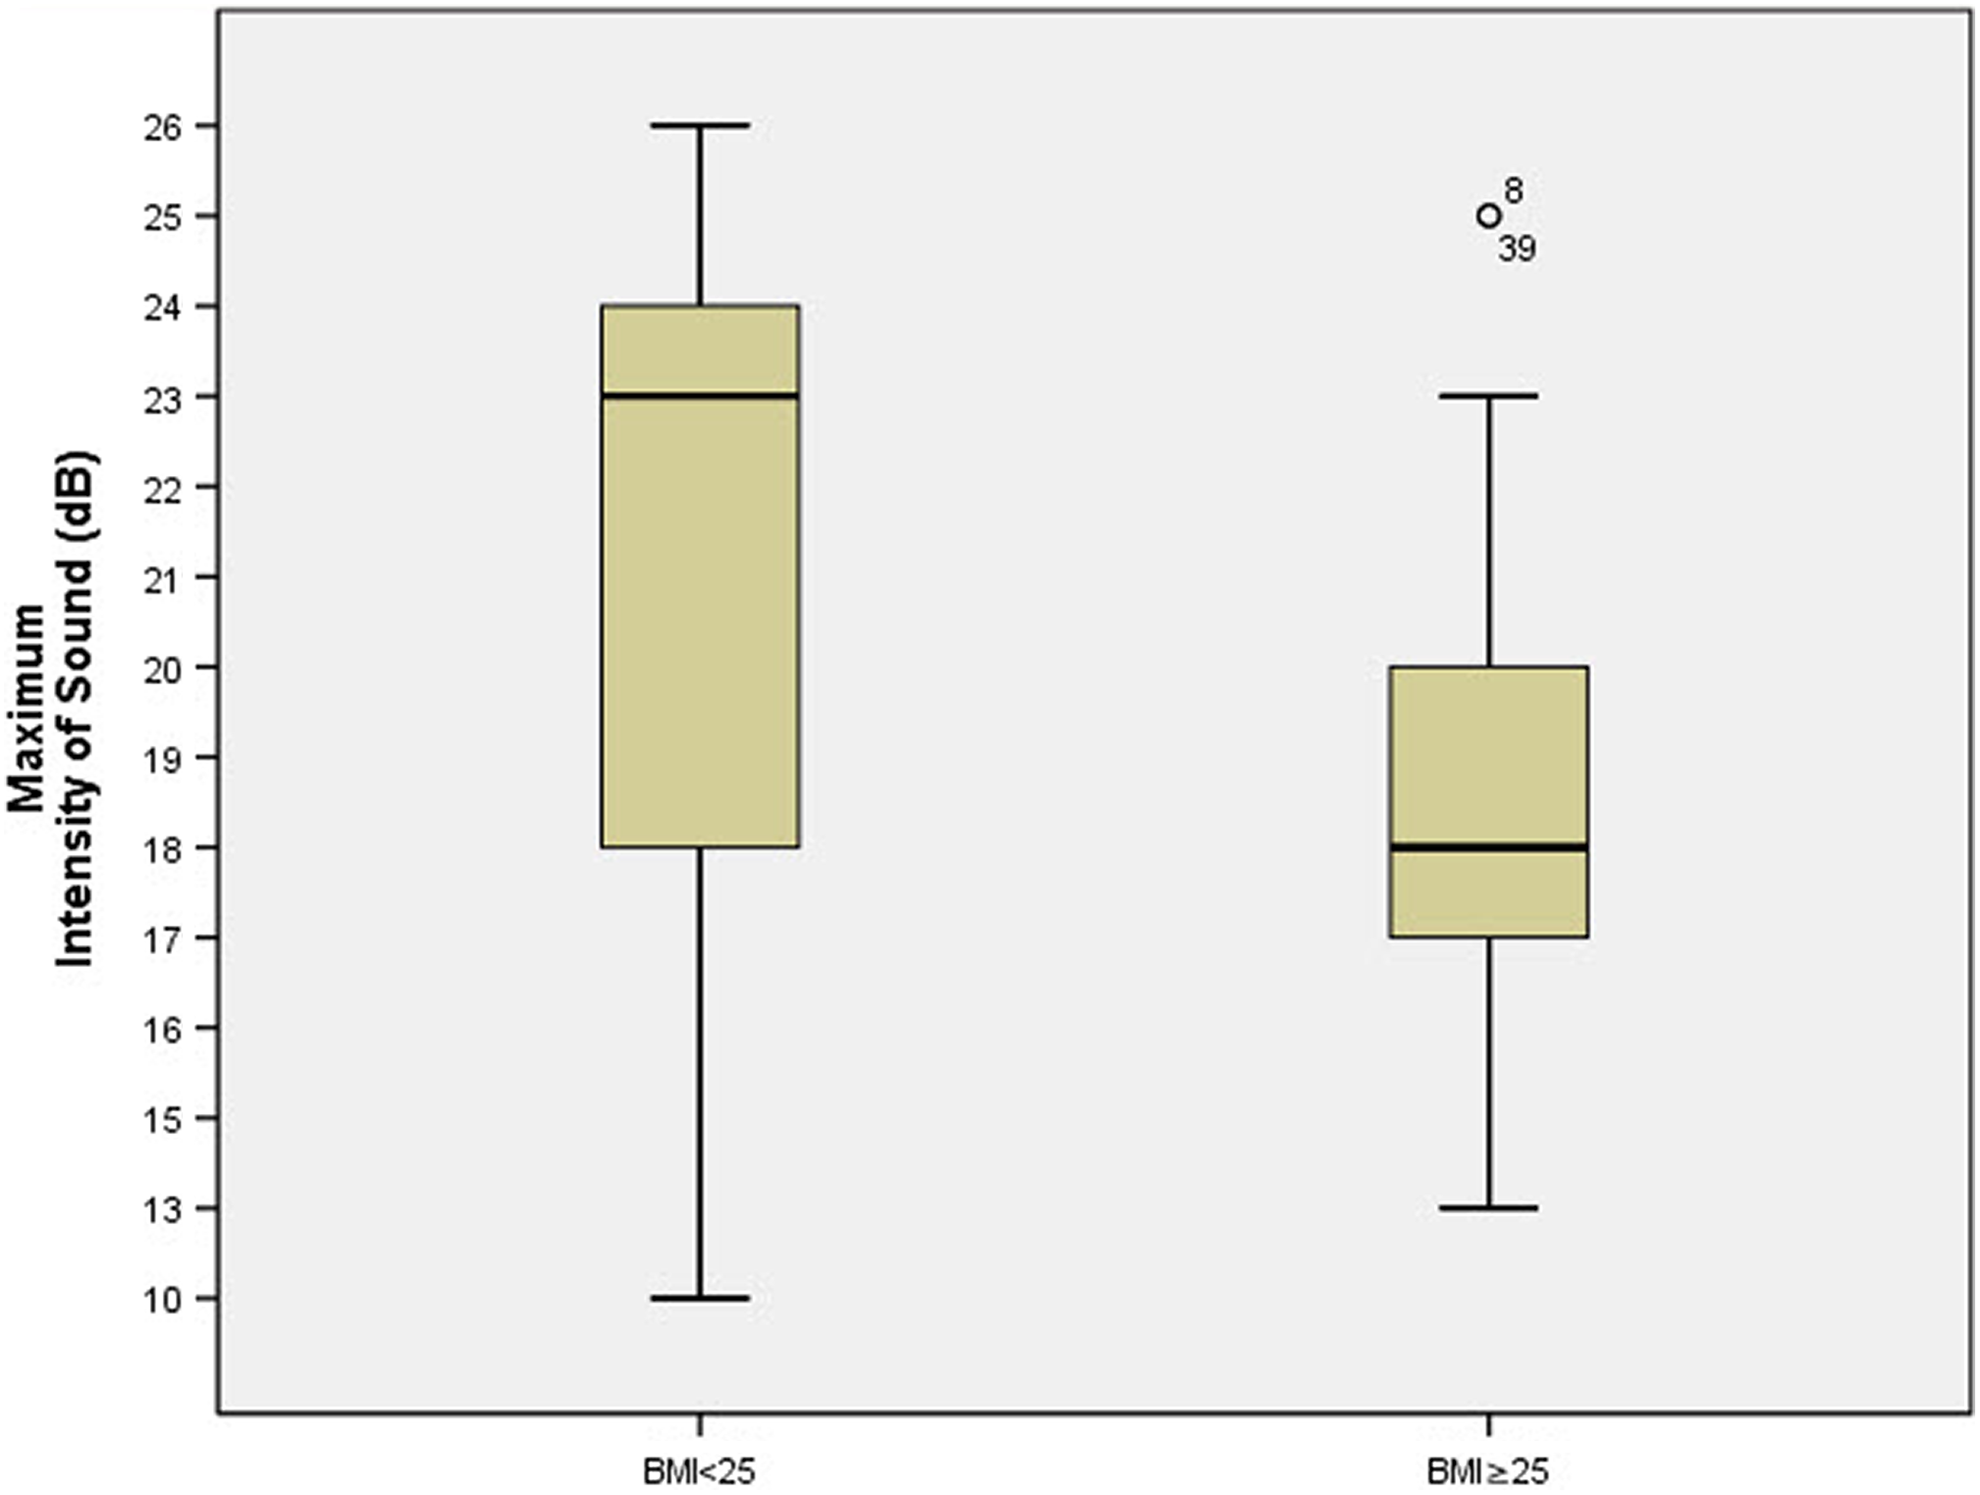
Maximum intensity of sound (dB) of body mass index (BMI) <25 persons were found to be bigger than ≥25 persons.
Discussion
The auriculae are important components of face. Their structural characteristics are affected by sex, age, and racial factors. The appearance of the auriculae reflects the age and sex of the person. 1 In addition, the structural characteristics of auriculae are thought to be influenced by various environmental and nutritional factors.
Body mass index is the determination of body fat level in relation to height and weight. This calculation is implicitly associated with soft tissue thickness. 14 In our study, we found that total ear length, ear width, and total ear area were positively correlated with the BMI. The auricular area of participants with BMI ≥25 was significantly bigger when compared with those with BMI<25. In our literature review, no study had ever examined the relationship of auricular anatomy with the BMI.
We have also investigated whether there was a relationship between BMI and the shape of the auricula in terms of the postauricular sulcus angle and auricular projection. Different studies discussed postauricular sulcus angle with regard to its morphometric characteristics. Farkas found that the mean postauricular sulcus angle in adults was 9° to 29°. 9 In our study, the mean postauricular sulcus angle was calculated as 20.9°. Ear projection refers to the distance between the most protruding point of the mastoid and helix. In a study by Tolleth, ear projection was measured to be between 1.5 and 2.0 cm. 15 Similarly, Bozkir et al calculated that ear projection of young males and females were 17.1 and 16.6 mm, respectively. 1 In our study, ear projection was measured as 15.9 mm (SD = 3.69). However, we failed to find an association between the BMI and the postauricular sulcus angle and auricular projection.
The auriculae ensure the amplification of sound waves that reach the ear at the spatial plane and enable them to be sent to the external auditory canal. Moreover, they play a role in the transmission of sound waves to the tympanic membrane. The mean amplification for all frequencies corresponds to 6 dB. In a study by Hellstrom and Axelsson, the resonator effect that formed after sound stimulus given from different locations exceeded 30 dB SPL. It was suggested that such an effect may arise from the morphologic characteristics of the external auditory canal and pinna. 16 However, the effects of BMI on hearing functions have not yet been studied.
In our study, we have tried to determine whether there was a significant relationship between the hearing gain from 3 different vectors in the horizontal plane and the BMI. The maximum acoustic gain was evaluated after the sound stimuli (0°, 90°, 180° azimuth angle) given by the 3 sides. There was an inverse relationship between the BMI and the hearing gain as measured by dynamic REM. Participants with BMI ≥25 had a significantly lower hearing gain when compared with those with BMI <25.
In our study, we examined the relationship between BMI and the morphometric properties of auricula and acoustical gain. We found that the total length of the auricula, width, and area increased with BMI. We believe that this is related to soft tissue thickening as a result of the increase in BMI. In addition, we found that the acoustic gain level was inversely related to BMI. We think that the decrease in acoustic gain is due to the increase of acoustic resistance after the increase of soft tissue thickness. In conclusion, we suggest that the increase in BMI has a negative effect on auditory functions.
Limitations of the Study
The study was performed in adult participants aged 18 to 45 years. This study does not examine the relationship between BMI and auricular parameters in children under the age of 18 (adolescents and children) and over 45 years. On the other hand, this study was carried out at 0°–90°–180° azimuth angles at 0° elevation angle. Further studies are needed to examine the correlation of BMI with other elevation angles.
Footnotes
Acknowledgments
The authors would like to thank Reza Doğan who made dynamic REM records in Science of Health University, Umraniye Research and Training Hospital, Odiology Department.
Declaration of Conflicting Interests
The author(s) declared no potential conflicts of interest with respect to the research, authorship, and/or publication of this article.
Funding
The author(s) received no financial support for the research, authorship, and/or publication of this article.