
Abstract
Introduction
The prevalence of depression among blind people is higher than in sighted populations. The purpose of this study was to investigate the associations between time-related characteristics of visual impairment (i.e., onset and duration), as well as depressive symptoms, fatigue, sleepiness, and stress, in the context of self-reported total blindness and the inability to perceive light exposure.
Methods
This study employed a cross-sectional design utilizing the combination of online survey and telephone survey. The Centre for Epidemiological Studies–Depression Inventory, the Fatigue Syndrome Inventory, the Epworth Sleepiness Scale, and the Perceived Stress Scale were selected for the self-reported questionnaires. For statistical analysis, independent t-tests, analysis of variance tests, Wilcoxon–Mann–Whitney tests, chi-square tests, multiple linear regression models, and multivariable ordinal logistic regressions were conducted using the R software program and its required packages.
Results
A total of 154 respondents completed the online and telephone surveys. Although the number of years of experiencing blindness showed negative correlations with the scores of fatigue (r = −.16, p < .05), stress (r = −.18, p < .05), and depressive feelings (r = −.21, p < .05) in Model 1, the impacts of the onset of blindness on the depressive symptoms (β = −.02, p = .570) and the presence of severe depressive symptoms, OR = 1.42, 95% CI [0.49, 4.19], p = .518, were insignificant in Model 2.
Discussion
Blindness seems to be regarded as a more severe chronic condition which affects individuals’ psychological status. Given the effects of the limited range of social activities and daily tasks and the dramatically reduced accessible visual information inputs, the severe depressive symptoms in this group can be understood.
Implications for Practitioners
Regular counseling and psychological services monitoring depressive symptoms, chronic fatigue, and severe distress should be continued even after the completion of rehabilitation programs.
Globally, among one billion people with disabilities, 40 million people live with blindness which significantly affects these individuals' physical, psychological, social, and spiritual well-being (Chava et al., 2021). Some individuals are born with blindness, known as congenital blindness, or acquire blindness mid-lifespan, referred to as acquired blindness. The most common causes of blindness in childhood are accidents, brain injuries, severe eye infection, and tumors. In adulthood, people can lose their vision from refractive errors, infectious causes, trauma, or nutritional and metabolic diseases (Congdon et al., 2003). Although low vision and blindness are expected to become more prevalent worldwide, there are currently no empirical data available to estimate differences in people with visual impairments based on vision-related characteristics, age, or geographic location (Flaxman et al., 2021).
Individuals’ adaptation or adjustment processes vary depending on the onset, severity, and duration of their disability (Boerner & Jopp, 2007). People who are born with blindness or those who became blind in the early years of their lifespan have no concept of “seeing” because they have no visual experiences about colors, contrasts, shapes, distance, depth, and proportion (Cuturi et al., 2016). They incorporate their visual limitations into their self-identity and daily routines as a normal part of growth and development. Therefore, people with congenital blindness have the advantage of early development of adaptive learning, coping strategies, and compensating abilities (Khimani et al., 2021). Conversely, individuals who have experienced acquired blindness are often confronted with the challenge of reconciling their “pre-disability” identity with their new “disability” identity (Bogart, 2014).
The psychological problems of people with disabilities are significantly correlated with extensive costs in healthcare systems and their inability to remodel new normal lives can lead to mild to severe depressive symptoms (Eide & Røysamb, 2002; Nierenberg et al., 2016). Significantly, discussions surrounding psychological issues in individuals with disabilities prominently feature depressive symptoms and major depressive disorder (Mitra et al., 2005). Previous studies have documented a greater prevalence of major depressive disorder among individuals with visual impairments compared to those without such impairments (Braich et al., 2016). Visual impairment, a major risk factor for the incidence of depression and depressive symptoms, can lead to a decline in physical and psychological well-being as well as quality of life.
To the best of our knowledge, no study has yet examined the relationship between onset of visual impairment, time elapsed since onset, and depression especially in the context of blindness. In this study, the onset of blindness and the number of years of living with blindness were assumed to be correlated to the severity of depressive symptoms. First, regarding the onset of blindness (i.e., congenital blindness vs. acquired blindness), compared to people born with blindness in nature, persons who lost their vision in the middle of lifespan were expected to report more severe depressive symptoms. Secondly, the number of years of experiencing blindness was expected to contribute to overcoming depressive symptoms among people with blindness. In sum, we discussed the following research questions in this study: What are the differences in depressive symptoms, fatigue, sleepiness, and stress, and between congenital blindness and acquired blindness? Are the number of years of living with blindness correlated to the depressive symptoms of people who are blind? What are the factors that influence depressive symptoms among people who are blind? Is there an association between the onset of blindness—acquired and congenital—and the probability of major depressive disorders, after adjusting for relevant confounders?
Methods
Participants and Procedures
In this study, the term blindness refers to the absence of both light perception and form perception, as defined by the terms and descriptions of low vision and legal blindness (Varadaraj et al., 2022). Participants were eligible if they met the following criteria: (1) self-reported total blindness without light perception, (2) aged 18 years or older, (3) resident of the United States, and (4) proficient in English. However, individuals diagnosed with cognitive impairment or mental illnesses were excluded from the study.
This cross-sectional study collected the data through a combination of online and telephone surveys. The survey that consisted of 74 questions was generated using Qualtrics software (Qualtrics, Provo, UI). Prior to distribution, the online survey was tested by an accessibility expert to verify whether all questions are readable and navigated by using screen reader software, which allows persons with visual impairments to read the text that is displayed on the computer or mobile telephone screen with a speech synthesizer or braille display (Bhowmick & Hazarika, 2017). The recruitment of participants was facilitated through online flyers distributed to individuals via the electronic discussion groups of the National Federation of the Blind (NFB). The participants were informed that continuing the survey implies that they consent to research participation. For the participants who preferred to participate in the survey through telephone calls, the investigator of the study scheduled the telephone survey date, read aloud the questions, and dictated the participants’ responses. The average amount of time for responding to 74 items of the online survey using screen readers was about 40 min. All participants were informed that they could withdraw the research participation at any time. Compensation in the form of Amazon e-code gift cards was provided through a raffle system, in which $50 awarded to six respondents and $20 awarded to 10 respondents. Approval for this study was granted by the Institutional Review Board of the University of Illinois at Urbana–Champaign (Approval No. 22514.).
Measures
The demographic and health-related characteristics included age, gender, race, education, marital status, working status, annual income, number of years of living with blindness, and other medical diagnosis except blindness. In addition to this baseline information, the validated self-reported questionnaires such as the Centre for Epidemiological Studies–Depression Inventory (CESD), the Fatigue Syndrome Inventory (FSI), the Epworth Sleepiness Scale (ESS), and the Perceived Stress Scale (PSS) were used.
The CESD (Radloff, 1977) is a self-reported scale consisting of 20 items, designed to assess the severity of depressive symptoms within the general population. Participants are required to report their feelings and behaviors over the past week. The scores of each item range from 0 (rarely or none of the time) to 3 (most or all of the time), with the higher the overall scores indicating the greater the depressive symptoms. The overall score ranges from 0 to 60: (1) scores below 15 are normal; (2) scores between 15 and 21 indicate some mild to moderate symptoms of depression; and (3) over 21 indicate a high level of depressive symptoms associated with major depression. Its reliability, validity, and test–retest repeatability have been verified by previous studies.
The FSI (Hann et al., 1998) is a self-report measure comprising 14 items, intended to evaluate the intensity (four items) and duration (two items) of fatigue, as well as its effect on an individual's daily lives (seven items). Thirteen items use an 11-point Likert scale (0–10) and one additional qualitative item is not scored. The scale was validated in cancer patients with high reliability (Cronbach's α = .94) and validity (Donovan & Jacobsen, 2011). A score of 3 or greater for FSI average or the FSI composite average is the optimal cutoff for discriminating clinically meaningful fatigue (Donovan & Jacobsen, 2011).
The ESS (Johns, 1991) is an eight-item self-report measure designed to assess daytime sleepiness in a straightforward manner. Respondents rate their usual chances of dozing off or falling asleep while engaged in eight different situations on a 4-point Likert scale (0–4). In general, an overall score of less than 10 indicates normal daytime sleepiness, scores between 11 and 12 indicate mild excessive daytime sleepiness, scores between 13 and 15 indicate moderate excessive daytime sleepiness, and scores ranged from 16 and 24 can be interpreted as severe excessive daytime sleepiness. From the previous studies, the reported reliability (Cronbach's α = .88–.94) and validity were acceptable (Kendzerska et al., 2014).
The PSS (Cohen et al., 1994) is a general appraisal tool for measuring the degree to which situations in one's life are perceived as stressful. Ten items ask one's feeling and thoughts during the last month and each item is scored from 0 (never) to 4 (very often). The overall score ranges from 0 to 40: (1) scores below 13 are normal, (2) scores between 14 and 26 indicate some moderate stress, and (3) scores that are over 27 indicate a high level of stress. The most previous studies reported a high reliability and validity (Lee, 2012).
Statistical Analysis
Collected data were analyzed by using R software (RStudio, Boston, MA), Version 4.2.1 and its required packages. The two-sided significance level was considered at p-value less than .05 (p < .05). The differences between mean and standard deviation among continuous variables were examined using independent t-tests, analysis of variance (ANOVA) tests, and Wilcoxon–Mann–Whitney tests. The differences in counts or frequencies of categorical variables were tested by chi-square tests. To investigate the correlations between continuous variables (e.g., FSI, ESSS, PSS, CESD), the Pearson correlation coefficients were calculated. A multiple linear regression (Model 1) and a multivariable ordinal logistic regression (Model 2) were developed to identify the significant factors of the presence of depressive symptoms and severe depression.
All continuous variables included in the regression models were rescaled so that they exist in a range between 0 and 1. For this data normalization, each value was subtracted by the minimum value for the variable and divided by its difference between maximum value and the minimum value: xnew = (xi − xmin)/(xmax − xmin). R automatically controlled the presence of perfect collinearity by deleting one of the variables from the model, leaving the best model where parameters are estimated. The final regression models’ homoscedasticity assumptions were tested by visualizing the diagnostic plots (i.e., Residuals vs. Fitted, Normal Q-Q, Scale-Location, and Residuals vs. Leverage). The outliers or influential values are confirmed by calculating the Cook's distance. For multivariable ordinal logistic models, the categorical variables were converted into dummy variables: (1) the time since becoming blind (0 = congenital, 1 = acquired); (2) gender (0 = male, 1 = female); and (3) working status (0 = employed, 1 = unemployed). The calculated minimum sample size required for the multiple regression models of this study were 49 with the large effect size (η2 = .35), p-value of .05, seven predictor variables (i.e., the onset of blindness, gender, age, working status, FSI, ESS, PSS), and 0.8 statistical power.
Results
Characteristics of Participants
A total of 160 participants completed the online survey; however, six participants with missing values were excluded from the data analysis. Thus, the data collected from 154 respondents were used for the statistical analysis. The demographic characteristics and psychological status of the participants were summarized in Table 1.
Demographic Characteristics and Psychological Symptoms.
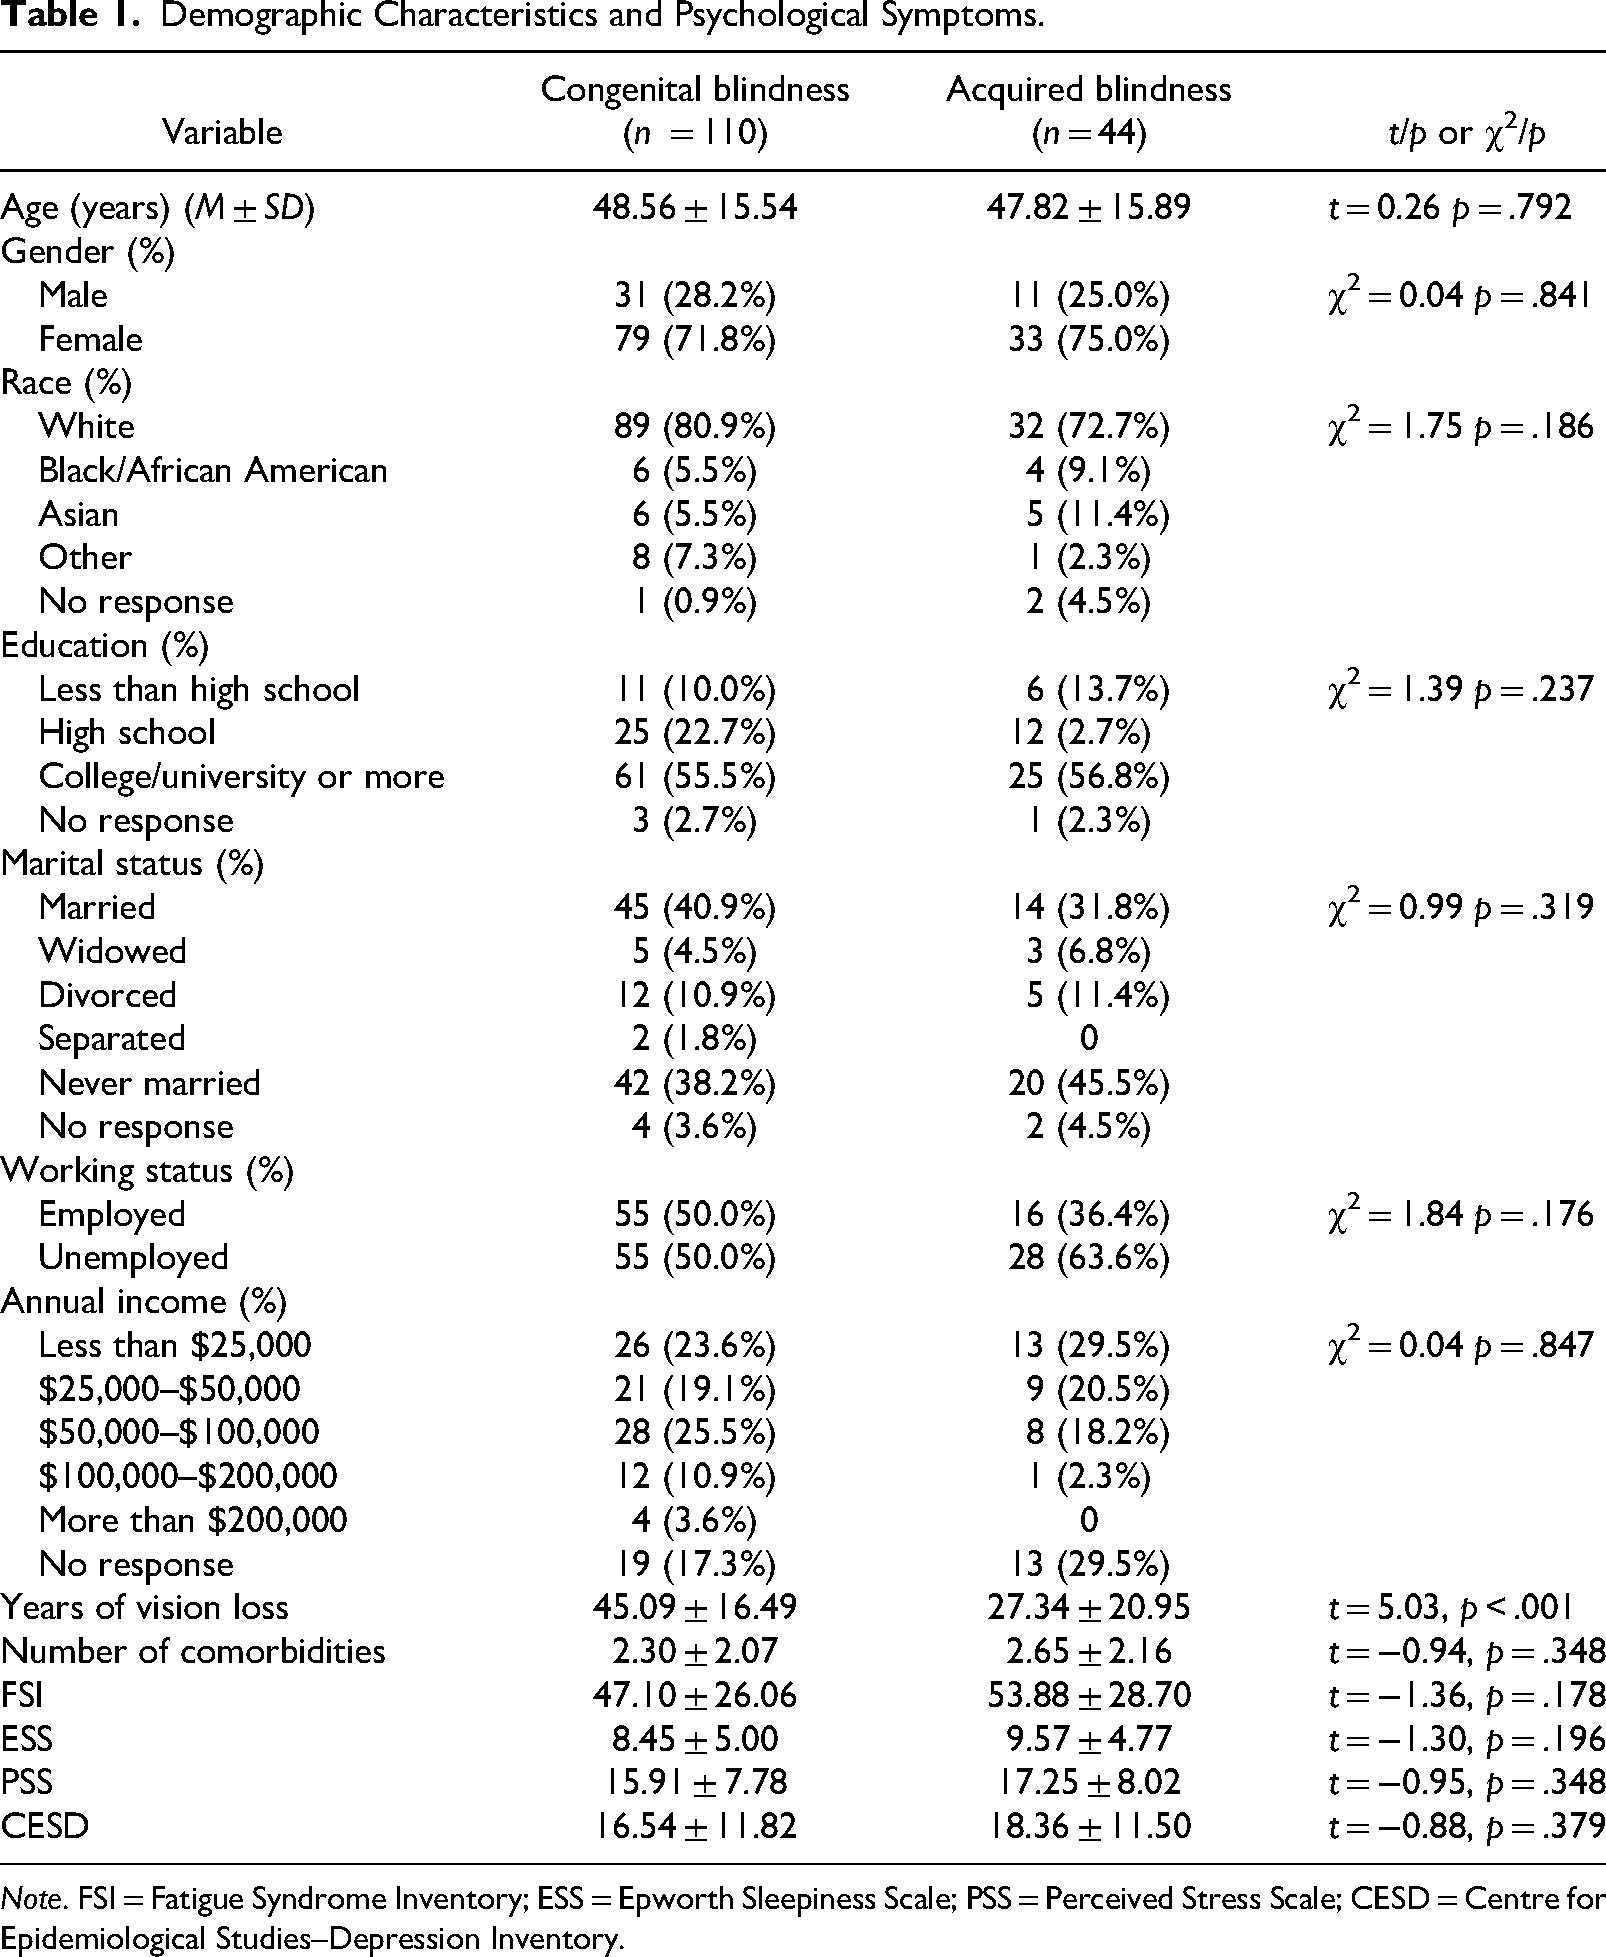
Note. FSI = Fatigue Syndrome Inventory; ESS = Epworth Sleepiness Scale; PSS = Perceived Stress Scale; CESD = Centre for Epidemiological Studies–Depression Inventory.
Research Question 1
Overall, the number of respondents with some mild to moderated depressive symptoms was 33 (21.4%) and the respondents who have a high level of depressive symptoms associated with major depression was 44 (28.6%). About 59.7% of respondents had clinically severe fatigue. Twenty-one (13.6%) respondents had mild excessive daytime sleepiness, 23 (14.9%) respondents had moderate excessive daytime sleepiness, and 12 (7.8%) respondents reported severe excessive daytime sleepiness. About 46% (n = 71) of respondents showed some moderate stress levels and 9% of them (n = 14) suffered from a high level of stress. In terms of the differences of psychological distress between the congenital blindness group and the acquired blindness group, no significant differences were observed between the means of overall scores of CESD, FSI, ESS, and PSS (see Table 1).
Research Question 2
A Pearson correlation coefficient was computed to assess the linear relationship between the number of years of blindness and CESD, FSI, ESS, and PSS (Table 2). There was a negative correlation between the number of years of living with blindness and fatigue scores, r(152) = −.16, p = .044. The Pearson correlation coefficient between the number of years of blindness and stress levels to be −.18 with a corresponding p-value of .028. Also, there was a negative correlation between the number of years of blindness and the severity of depressive symptoms, r(152) = .71, p = .010. It can be interpreted as the longer number of years of living with blindness reduces the levels of fatigue, stress, and depressive symptoms.
Correlations Between Main Variables.
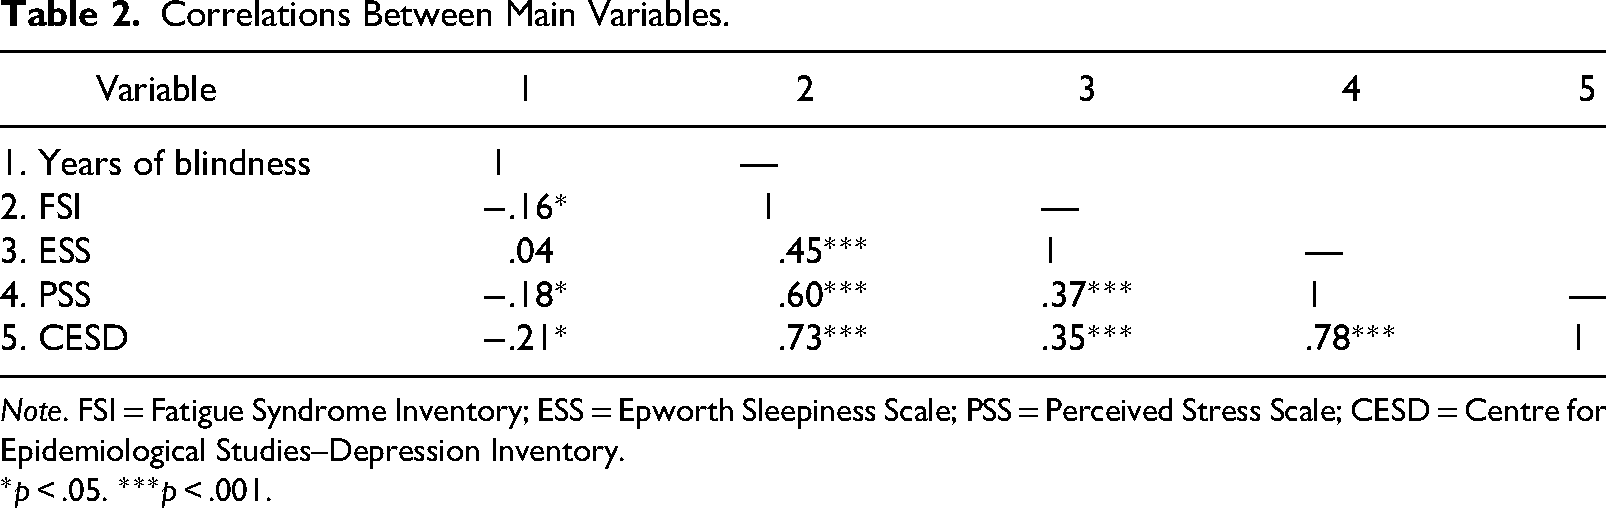
Note. FSI = Fatigue Syndrome Inventory; ESS = Epworth Sleepiness Scale; PSS = Perceived Stress Scale; CESD = Centre for Epidemiological Studies–Depression Inventory.
*p < .05. ***p < .001.
Research Question 3
Multiple linear regression was used to test if the onset of blindness (i.e., congenital blindness vs. acquired blindness), gender, age, working status, FSI, ESS, and PSS significantly predicted the scores of CESD. The fitted regression model (Table 3) was: CESD = −0.02 × Onset of blindness − 0.05 × Gender − 0.003 × Age + 0.06 × Working status + 0.46 × FSI − 0.05 × ESS + 0.63 × PSS − 0.08. The overall regression was statistically significant, R2 = .73, adjusted R2 = .72, F(7, 146) = 57.76, p < .001. It was identified that the onset of blindness did not significantly predict CESD (β = −.02, p = .507). However, the working status (β = .06, p < .01), FSI (β = .46, p < .001), and PSS (β = .63, p < .001) were significantly correlated to the CESD. Tests to see if the data met the assumption of collinearity indicated that multicollinearity was not a concern (age, VIF = 1.18; FSI = 1.81; ESS = 1.30; PSS = 1.73). The scatter plot of standardized predicted values showed that the data met the assumptions of homogeneity of variance and linearity.
Model 1: The Multiple Linear Regression Model.
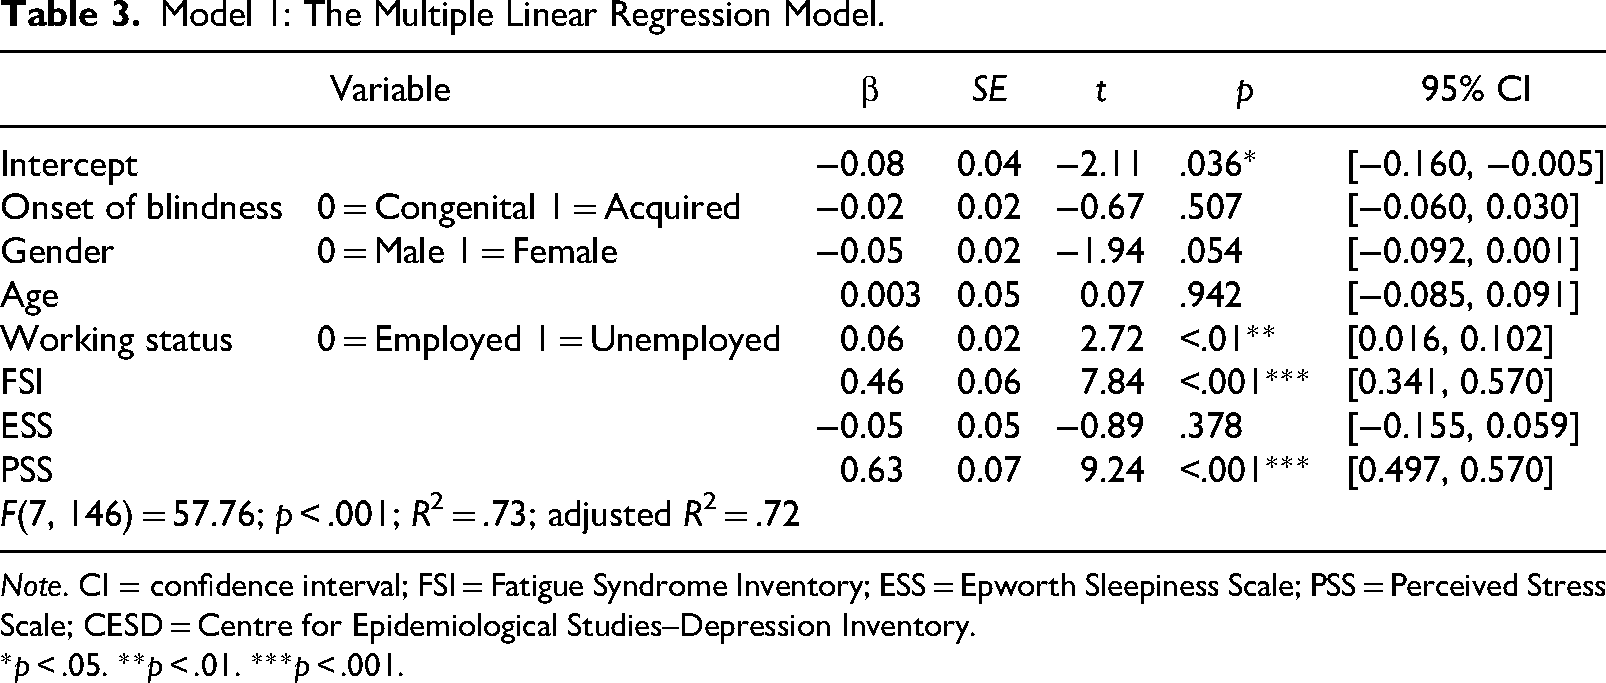
Note. CI = confidence interval; FSI = Fatigue Syndrome Inventory; ESS = Epworth Sleepiness Scale; PSS = Perceived Stress Scale; CESD = Centre for Epidemiological Studies–Depression Inventory.
*p < .05. **p < .01. ***p < .001.
Research Question 4
Multiple logistic linear regression was used to analyze the relationship between the onset of blindness (i.e., congenital blindness vs. acquired blindness) and the probability of having severe major depressive symptoms. The fitted regression model was (Table 4): Probability of major depressive disorder = 0.35 × Onset of blindness + 0.10 × Gender + 0.34 × Age + 0.37 × Working status + 6.03 × FSI + 1.09 × ESS + 7.45 × PSS − 6.47. It was found that, adjusting the gender, age, working status, FSI, ESS, and PSS, the odds of being severely depressed were not correlated to the onset of blindness: adjusted OR = 1.42, 95% CI [0.49, 4.19]. Among the confounders, the FSI score, adjusted OR = 4.17, 95% CI [2.77, 9.47] and PSS score, adjusted OR = 1.72, 95% CI [5.47, 9.91] were significantly associated with the presence of severe major depressive symptoms.
Model 2: The Multiple Logistic Regression Model.
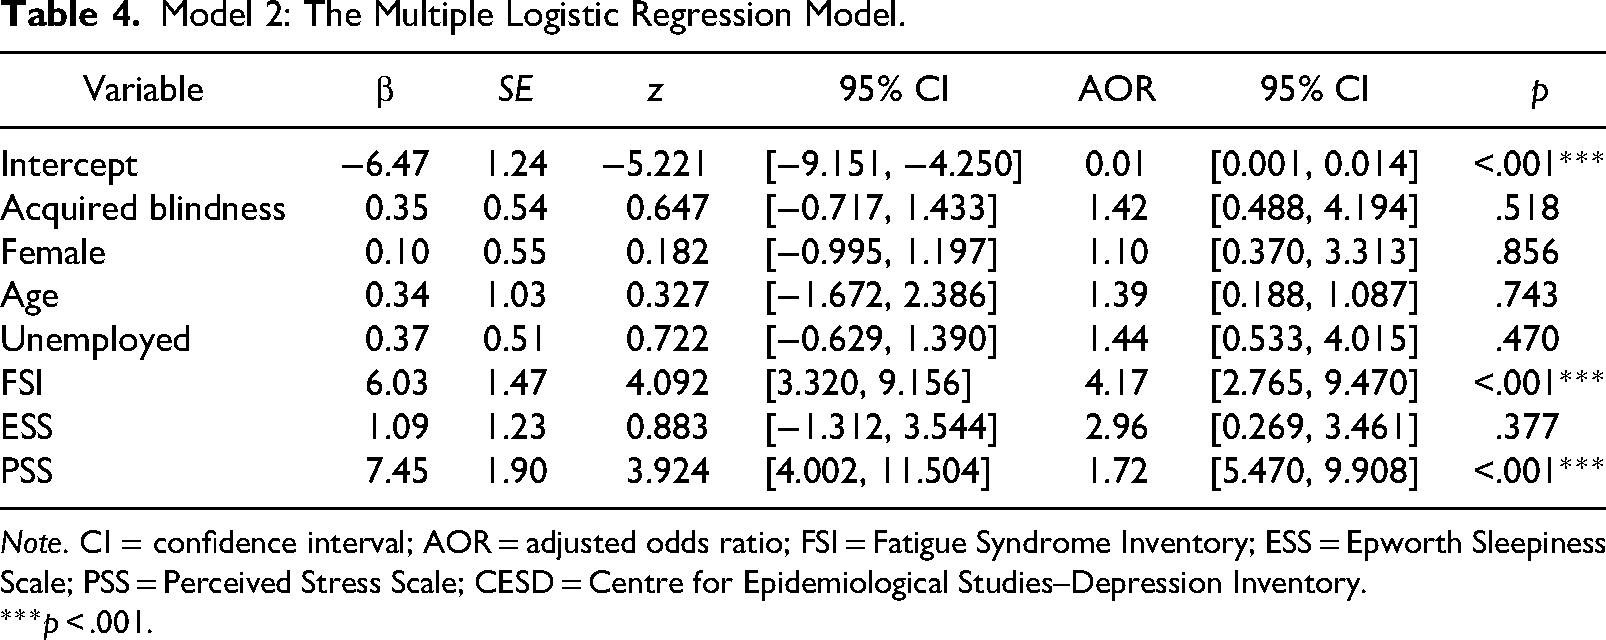
Note. CI = confidence interval; AOR = adjusted odds ratio; FSI = Fatigue Syndrome Inventory; ESS = Epworth Sleepiness Scale; PSS = Perceived Stress Scale; CESD = Centre for Epidemiological Studies–Depression Inventory.
***p < .001.
Discussion
Upon analyzing the descriptive findings regarding self-reported levels of depressive symptoms, fatigue, sleepiness, and stress, the participants in the present study exhibited clinically significant levels of depression when compared to individuals with various other types of disabilities. When it comes to depressive symptoms, the mean CESD of people with spinal cord injuries were 9.74 (Schulz & Decker, 1985), 10.9 (Miller et al., 2008), and 11.5 (Holicky & Charlifue, 1999) in the previous cross-sectional studies. The mean CESD score among individuals with multiple sclerosis was 16.0 (Chwastiak et al., 2002), a value akin to that of the respondents with congenital blindness in this study (16.54 ± 11.82). According to this finding, blindness seems to be regarded as a more severe chronic condition that affects individuals’ psychological status. Considering the effect of constrained social activities and daily tasks, along with significantly diminished access to visual information inputs, it becomes comprehensible to attribute the pronounced presence of severe depressive symptoms within this group.
The perceived levels of fatigue (mean FSI = 49.04), sleepiness (mean ESS = 8.77), and stress (mean PSS = 16.29) of the respondents of this study (n = 154) were also higher than other populations in the similar studies conducted in the United States. The mean FSI of cancer survivors undergoing chemotherapy was 13.64 (Brown et al., 2011) and its mean scores from chronic hemodialysis patients was 5.80 (Chao et al., 2016). Similarly, the reported mean daytime sleepiness (ESS) score closely resembled the mean scores observed in individuals with multiple sclerosis (Popp et al., 2017). Additionally, the mean PSS of people with multiple sclerosis was 14.90 (Wu & Amtmann, 2013) and the mean PSS of people with anxiety disorders was 20.78 (Panayiotou & Karekla, 2013). Although the potential covariates were not fully controlled in these comparisons, blind people seem to experience excessive levels of fatigue, sleepiness, and stress in their daily lives. Since all of these psychological aspects are highly correlated with each other and unsupportive environments and lack of social resources can result in poorer subjective health, secondary health outcomes, and higher rates of suicide, a variety of psychosocial interventions should be provided for people who are blind in an accessible format. Particularly, regular counseling and psychological services monitoring depressive symptoms, chronic fatigue, and severe distress should be continued even after the completion of rehabilitation programs.
One of the aims of this study was to examine the difference coming from the onset of blindness—acquired blindness versus congenital blindness—in depressive symptoms. However, the results from the t-tests and two regression models (Model 1 and Model 2) showed statistically insignificant differences. These insignificant findings can be interpreted into two different ways. Firstly, the psychological status of individuals with visual impairments may inherently exhibit more stability throughout their lifespan, even if the onset of visual impairments varies among individuals. Therefore, examining the influence of the onset of blindness (i.e., congenital blindness vs. acquired blindness) on psychological adaptation may not yield significant insights. To put it differently, the immediate effects of blindness can become entangled with subsequent accommodations and adaptations to visual impairment, making responses to blindness comparable between those with congenital blindness and those with acquired blindness (Bogart, 2014). Secondly, the respondents with acquired blindness in this study may have already passed the heightened periods overcoming vision loss and these changes have not been captured in the data analysis. The potential for omission of difference detection exists due to the cross-sectional nature of the data collection in this study. Similar findings were reported in the study by Galati et al. (1997), which find no significant difference in depression scores between teenagers with congenital and acquired blindness. Since responses to disability are a constant and ongoing process for individuals, to measure the effects of the onset of blindness on depressive symptoms, data should be longitudinally collected from research participants who have acquired blindness from the time of onset (Hamill et al., 2010). Beyond the two primary interpretations, a notable disparity in sample sizes—comprising 44 participants with acquired blindness and 110 with congenital blindness—has potential implications for the outcomes of the regression analyses. Specifically, such an imbalance can elevate the risk of Type I or Type II errors (Leon & Heo, 2009). Moreover, a pronounced difference in group sizes might predispose the regression model to overfitting in favor of the more substantial cohort, thereby undermining the model's external validity to broader samples (Leon & Heo, 2009). There is a need for additional research to comprehend thoroughly the association between depression and the onset of blindness (i.e., congenital blindness vs. acquired blindness).
One of the repeatedly mentioned significant factors influencing the depression or depressive symptoms of people with disabilities in a previous study is their working status or employment (Noh et al., 2016). This study also identified the significant influence of working status on the scores of CESD (β = .06, p < .01). Compared to the unemployed blind respondents, employed respondents showed lower scores on the CESD. Even if most experts in public health are aware of the importance of job opportunities for people with disabilities, only 19% of people with disabilities were employed in the United States (Houtenville et al., 2021) and 50% of people with disabilities were employed in Europe (Lawson et al., 2014). Since the emergence of the disability-inclusive employment paradigm in the late twentieth century, the disability-related stigma and discrimination in workplaces have been discussed and the long-term effects on the prevalence of mental health issues of people with disabilities have been highlighted (Blanck, 2022). Specifically, for people with blindness who have more limited job opportunities, opportunities for social engagements and social interactions are lacking. Recognizing this societal atmosphere, healthcare providers should pay more attention to the mental health problems of people who are blind.
Lastly, given the extra challenges faced by people with acquired blindness, we need to develop a predictive model using longitudinal datasets to successfully manage the depression and depressive symptoms of people who are blind (Forber-Pratt et al., 2017). However, little to nothing is known about how visual disability characteristics, aging processes, psychological functioning, and personal and environmental resources interact with each other. To develop a predictive model that can be utilized in rehabilitation centers and clinical settings, a concise and robust theoretical model explaining the patterns of psychological adjustment of blind populations is needed. At this point, the findings of this study can significantly contribute to identifying factors that influence depressive symptoms in individuals with blindness. However, to establish a solid theoretical foundation, further longitudinal studies examining the effects of aging on depression or depressive symptoms among individuals with blindness are warranted.
Limitations
Analyzing the effects of time since blindness on the scores of depressive symptoms and the presence of clinically significant negative affect were challenging in this cross-sectional study. Generally, in the field of psychology rehabilitation, the timing effects of disability are measured by longitudinal data and multilevel models (Kwok et al., 2008). To compensate for the limitation of this research design, the effects of time since blindness were replaced with the addition of two variables: “onset of blindness” and “age.” In other words, due to the high multicollinearity between “age” and “years of blindness,” these two variables were not included in the regression models concurrently. Moreover, since the number of years of living with blindness already include the aging effects, the findings from two regression models may be helpful for speculating on the timing effects on persons’ psychological adaptation. Nevertheless, to accurately measure the time effects of disability, more longitudinal research is highly recommended.
Conclusion
This study examined the relationships between age-related factors (i.e., onset of blindness, number of years of living with blindness) and psychological functioning among people who are blind. The findings of the study indicate that there were no significant differences in depressive symptoms between individuals with acquired blindness and congenital blindness. Nevertheless, in comparison to prior literature investigating depressive symptoms in individuals with spinal cord injuries, multiple sclerosis, cancer and chemotherapy treatments, hemodialysis, and anxiety disorders, the findings of this study showed that the symptoms of those who are blind are generally worse. Although the number of years of experiencing blindness showed significant negative correlations with the scores of depressive symptoms, fatigue, and stress; the effects of the onset of blindness on the scores of depressive symptoms and the presence of severe depressive symptoms were insignificant. To more fully understand the patterns of depressive symptoms among individuals with blindness throughout their lifespan, it is advisable to conduct longitudinal studies.
Footnotes
Acknowledgments
SYC contributed to conceptualization, research design, data collection, and data analysis, manuscript writing, and submission.
Declaration of Conflicting Interests
The author(s) declared no potential conflicts of interest with respect to the research, authorship, and/or publication of this article.
Funding
The author(s) disclosed receipt of the following financial support for the research, authorship, and/or publication of this article: This work was supported by the Wayland Smith Rehabilitation Research Fund.