
Abstract
This review evaluated single-case experimental design research that examined challenging behavior interventions utilizing punishment elements. Thirty articles published between 2013 and 2022 met study inclusion criteria. Study quality was also assessed. Through multiple levels of analysis (e.g., descriptive statistics, non-parametric statistics), we examined (a) participant and study trends, (b) differential outcomes related to temporal reinforcement approaches (antecedent, consequent, or combined reinforcement) applied alongside punishment element(s), (c) differential outcomes related to the punishment type (negative, positive) applied alongside reinforcement, and (d) effect sizes associated with study rigor across peer-reviewed and gray literature. Our results may tentatively suggest that, for certain situations, concurrently applying punishment with antecedent reinforcement approaches may coincide with significantly larger effect sizes compared to combined temporal reinforcement approaches, while positive punishment applied concurrently with reinforcement may coincide with larger but non-significant intervention effects. Most featured articles met rigor criteria, but larger effects were seen in peer-reviewed literature.
Keywords
Generally, behavior analysis describes punishment (i.e., decelerative procedures) as a change in the environment which results in a decrease in the future rate of operant behavior (Hineline & Rosales-Ruiz, 2013). As such, the application of events or stimuli, whether planned or not, that decrease the frequency of future behavior is a substantial part of how humans navigate their world. That is, organisms’ decisions are influenced by the punishment contingencies in effect (e.g., fines, demerit points). As Azrin and Holz (1966) stated: Whenever we interact with the physical world, there are many punishing contingencies awaiting us. . . Elimination of punishing contingencies by the physical world would appear to require the elimination of all behavior that involves interaction with the physical world. (p. 348)
In applied behavior analytic research, punishment contingencies are often directly adjusted to facilitate a socially significant change in participant responding (Pokorski & Barton, 2021). Behavior analytic interventions have included a variety of clinical and non-clinical populations. For example, in school settings to support autistic individuals (e.g., Foran et al., 2015), as well as to enhance sports performance (e.g., Schenk & Miltenberger, 2019). One clinical population wherein behavior analysis has been particularly impactful includes individuals with intellectual and developmental disabilities who engage in treatment-resistant or high-risk challenging behavior (Nunez Rodriguez et al., 2017). That is: Aggressive, self-injurious, or destructive behavior that poses a significant risk to the individual’s health and safety and to those around them. Challenging behavior limits an individual’s ability to effectively participate in their communities, reduces opportunities to learn new skills, poses a barrier to engagement in meaningful activities, and leads to a poorer quality of life. (Ontario Scientific Expert Task Force for the Treatment for Challenging Behavior [OSETT-CB], 2019, p. 84)
Early work showcased punishment efficacy administered in isolation (e.g., Gorman-Smith & Matson, 1985; Lerman & Iwata, 1996). As the field matured, contemporary behavior analytic work recommends combining punishment elements with other components such as reinforcement as informed by function-based assessments (e.g., Johnston, 2006; Lydon et al., 2015). Reinforcement elements are often applied to facilitate concurrently increasing adaptive behavior. As it stands, contemporary behavior analytic research has seen reinforcement-based and antecedent intervention research outpace that of works featuring punishment elements (Trump et al., 2018). There may be several reasons for this, commentary on which goes beyond the scope of the current paper. However, the fact remains that this outpacing may be problematic because ongoing punishment research may be vital in developing a fulsome understanding of the interactive effects between punishment processes and concurrent reinforcement strategies. That is, a comprehensive grasp of punishment effects may be necessary to develop a “highly systematic, effective technology of behavior change, including strategies for improving the efficacy of less intrusive procedures and for successfully fading treatment” (Lerman & Vorndran, 2002, p. 456). Neglecting this topic may also have clinical implications. That is, practitioners do not have the empirical support to inform their practice in situations wherein reinforcement and/or antecedent interventions alone are insufficient at reducing dangerous challenging behavior to clinically acceptable levels (e.g., Verriden & Roscoe, 2019; select participants in Rooker et al., 2013). As such, it may be argued that this research gap limits clinicians’ capacity to make evidence-based decisions in treating challenging behavior, which could lead to either applying prolonged ineffective behavioral treatments or using non-behavioral restrictive methods such as the concurrent application of multiple psychotropic medications, also called polypharmacy (see Charlot et al., 2020; Hilt et al., 2014).
Punishment in the Context of Behavior Analytic Theory
Punishment is an operant procedure and, therefore, should be distinguished by its functional definition from the topographical definition to avoid using the word colloquially (Graber & Graber, 2018; Pierce & Cheney, 2017). Generally, punishment is divided into two categories: positive and negative (Cooper et al., 2020; Lerman & Vorndran, 2002; Lydon et al., 2015). Positive punishment has been described as the addition of a stimulus following a response that decreases its operant rate in the future (Pierce & Cheney, 2017). Negative punishment may be described as the removal of a stimulus following a response that decreases the rate of that operant response in the future (Pierce & Cheney, 2017). Thus, the functional definition of punishment is informed by the outcomes it produces (i.e., decreasing behavior frequency). That is, if the outcome depicts a decrease in the rate of the operant response, then the stimulus has served as a punisher (Graber & Graber, 2018; Pierce & Cheney, 2017). As such, by definition, any stimuli can function as a punisher. For example, praising a teenager in front of their peers for timely homework completion may appear as reinforcement, but if it results in a decrease in future instances of timely homework submission, praise has functioned as a punisher. By contrast, a topographical definition of punishment entails the application or removal of a stimulus, often conceptualized as aversive, following a target response (e.g., challenging behavior) with the intention of reducing that behavior (Pierce & Cheney, 2017). Thus, a topographical definition typically excludes the effect a stimulus has on behavioral outcomes (Graber & Graber, 2018; Pierce & Cheney, 2017).
Limitations on Evaluating Punishment Research and Related Considerations
There may be situations where challenging behavior is high-risk, dangerous, and/or persistent enough to warrant the application of a punishment procedure to reduce the behavior quickly and safely. In such circumstances, it is important for practitioners to adhere to the Behavior Analyst Certification Board (BACB, 2020) Ethics Code for Behavior Analysts to minimize the risk of behavior-change interventions (see Code 2.15). Risk minimization in these situations may include leveraging strategies with decelerative properties. In fact, Gover et al. (2019) conducted a recent review investigating automatically maintained challenging behavior and found that when environmental enrichment (EE) was implemented alone, 59% of the cases failed to produce clinically significant behavior reductions. By contrast, when challenging behavior manipulations (i.e., punishment elements) were applied concurrently as a multi-component intervention, treatment success increased markedly.
Lydon et al. (2015) conducted the most recent review on this topic and highlighted several limitations. First, the authors did not examine the differential outcomes and efficacy in relation to the types of punishment applied (e.g., negative, positive, and combined). Second, they did not explore the differential efficacy of articles that met inclusion criteria related to study rigor. That is, the authors did not examine whether the articles featured in the review followed established guidelines and principles to demonstrate validity and reliability (e.g., treatment integrity, replication, reversals, interobserver agreement [IOA]; see Ledford et al., 2020). Finally, the authors excluded gray literature from their review. This practice has been listed as problematic because omitting gray literature in a systematic review may lead to publication bias and limit unique perspectives that can be drawn from select gray publications (see Paez, 2017).
The current review aimed to address the limitations described above and provide a contemporary evaluation of existing punishment research that featured single-case experimental designs (SCED) published between December 2013 and October 2022. Specifically, through descriptive analysis, including generating effect sizes, as well as conducting nonparametric statistics we endeavored to quantitively examine: (a) participant and study trends, (b) differential outcomes related to temporal reinforcement approaches applied (e.g., antecedent, consequent, or combined reinforcement approaches) applied alongside punishment element(s), (c) differential outcomes related to the punishment type (e.g., negative, positive punishment) applied alongside reinforcement, and (d) effect sizes associated with study rigor across peer-reviewed and gray literature (e.g., theses, dissertations). This project received no grant from any funding agency.
Method
This review was conducted by three researchers comprised of two master’s students and a faculty member. The authors enlisted the support of the University’s library research team (Jessie Robinson and Cal Murgu) to enact important elements of the review process such as formulation of the search string, search execution, and review management tools.
Search Procedure
We initiated this review by entering the search terms listed in Table 1 into the following databases: ERIC, PsychINFO, Proquest Sociology Collection, ScholarsPortal, and Proquest Dissertation and Thesis Global. Search strings were informed by Lydon et al. (2015) and Pokorski and Barton (2021) with some adjustments. For example, search strings across the articles were compared and redundant words eliminated. We applied filters to capture relevant articles across disciplines, including gray publications such as dissertations and theses. This initial search produced a total of 356 articles (see Figure 1).
Literature Search Procedures.
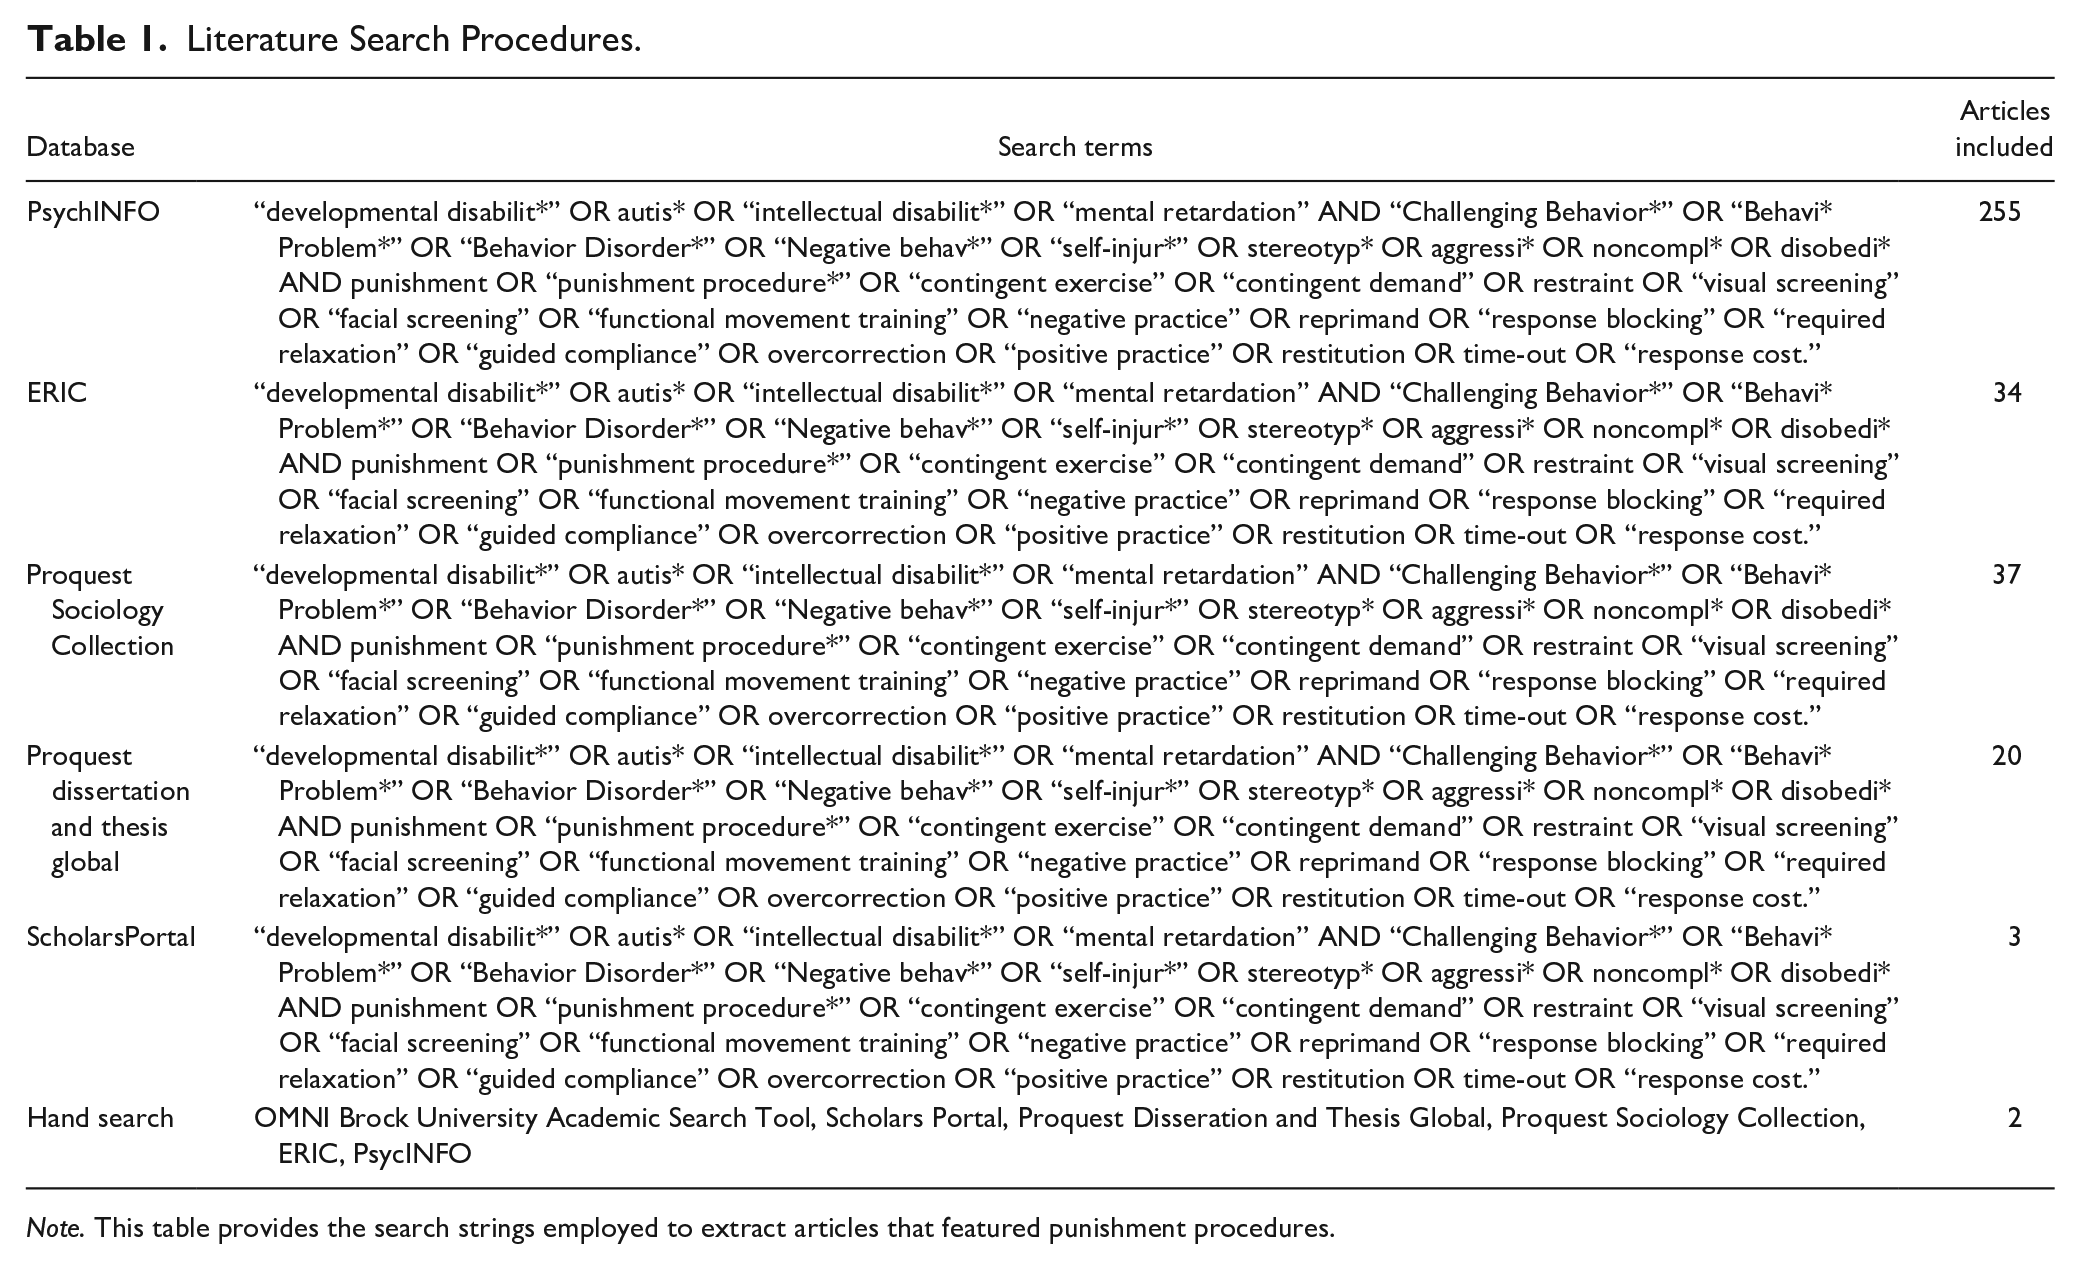
Note. This table provides the search strings employed to extract articles that featured punishment procedures.
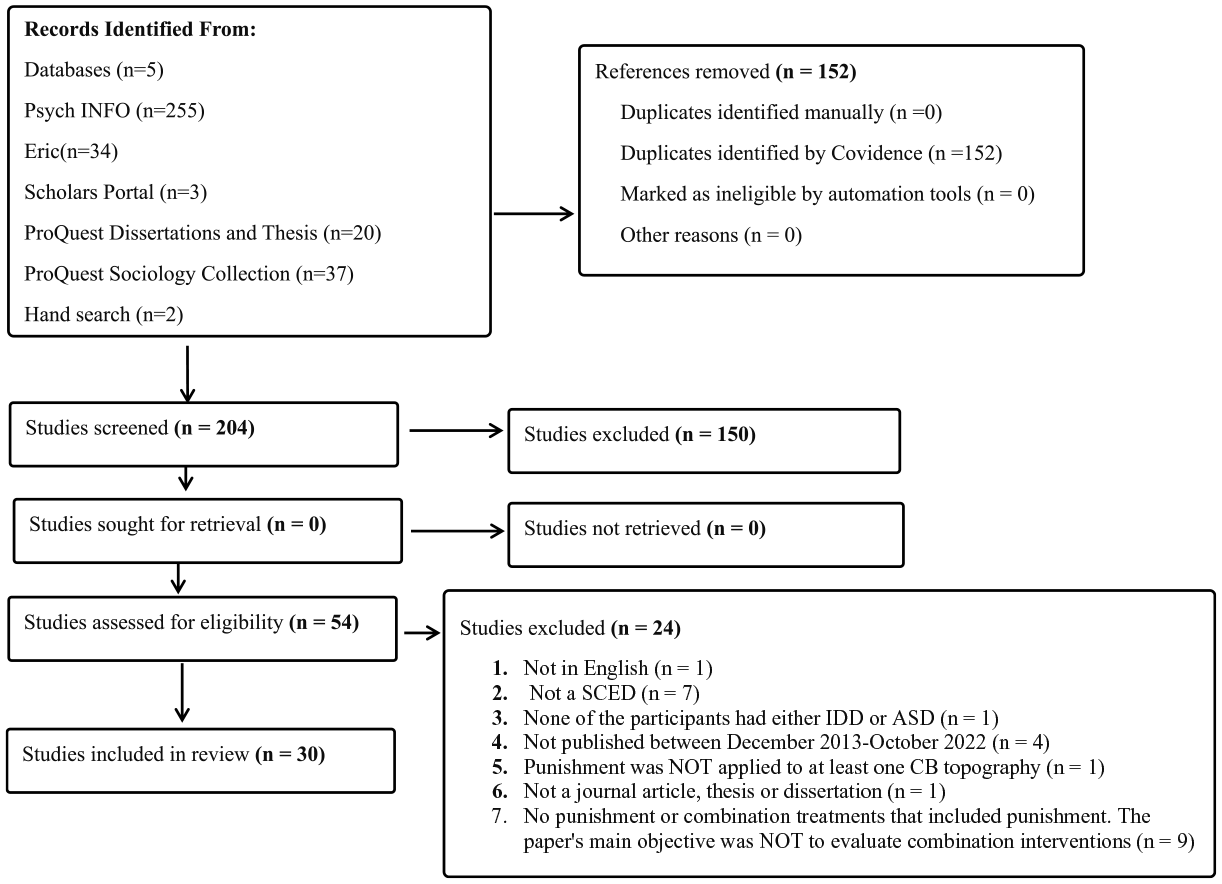
Preferred reporting items for systematic reviews and meta-analyses (PRISMA).
Inclusion Criteria
Inclusion criteria were informed by previous related work by Lydon et al. (2015) and Pokorski and Barton (2021), with some important adjustments to address the aims of this review. Studies were included if: (a) they were published between December 2013 and October 2022, (b) they were published in English, (c) they featured a SCED, (d) studies were peer-reviewed or considered gray publications (e.g., dissertations, theses), (e) the main objective was to evaluate behavioral interventions that included punishment elements (e.g., non-contingent reinforcement [NCR] and response blocking), (f) the behavioral intervention was applied to at least one targeted challenging behavior topography (e.g., time out was applied to reduce aggression; Dupuis et al., 2015), and (g) at least one participant featured in the study had a diagnosis of an intellectual and developmental disability and/or autism spectrum disorder (ASD).
Initial Screening and Full-Text Review
We followed the preferred reporting items for systematic reviews and meta-analyses (PRISMA) guidelines (see Page et al., 2021), as outlined in Figure 1. Overall, the initial search and the hand search yielded 356 articles. We applied a three-step process using Covidence to execute the screening and data extraction steps (see Covidence Systematic Review Software, 2022). In step one, raters removed 152 duplicates. In step two, raters conducted a title and abstract review of 204 articles, which led to the elimination of 150 articles. Thus, 54 articles progressed to the full-text review step (i.e., step 3). In step 3, raters created an exclusion hierarchy so that when articles were excluded, the rationale could be systematically identified and recorded. This process resulted in the exclusion of 24 more articles. In total, 30 articles advanced to the data extraction process. In total, the hand search mentioned above yielded two additional articles overlooked by the search string.
Data Extraction
In the data extraction process, relevant variables (e.g., participant characteristics, study characteristics, study rigor, effect size) were coded and entered into an Excel spreadsheet. Notably, some participants made multiple contributions to the effect size estimates. For example, if more than one challenging behavior topography was exposed to the target intervention and corresponding data recorded (e.g., Saini et al., 2016) or different interventions were compared across SCED phases (e.g., Greer et al., 2016), these were counted as separate cases. In these situations, the participant and study information associated with the case would only contribute once at the descriptives level (i.e., coding individual characteristics such as age) but would contribute more than once at the intervention level (i.e., effect size). For example, in Greer et al. (2016), Case 5 contributed three times to effect size estimates because the authors compared three intervention approaches, including (a) functional communication training (FCT) and time out, (b) FCT with time out and blocking, and (c) multiple schedule FCT with time out and blocking.
The raters executed data extraction in the following order: (a) coding participant and intervention characteristics into an Excel spreadsheet, (b) evaluating eligible articles using the single-case analysis and review framework (SCARF) tool to produce study rigor, quality, and primary outcomes, (c) transferring SCARF results obtained into an Excel spreadsheet, and (d) generating effect size via an online calculator (see Quantifying and Analyzing Intervention Outcomes section below for details).
Single response coding scheme
Except for reinforcement approach, all participant, intervention, and study characteristics (see Tables 2 and 3) were coded using only single response category (see Muharib & Gregori, 2022). That is, numeric values were assigned to each individual category. For example, if generalization were reported, a rater would code this as one (i.e., presence of generalization). To calculate results for a single response category, the frequency of a variable’s occurrence was summed. Percentage was produced by dividing the number of times a variable appeared (e.g., presence of generalization coded as one) by the total count (i.e., sample) within the category, multiplied by 100.
Participant and Intervention Characteristics Summarized.
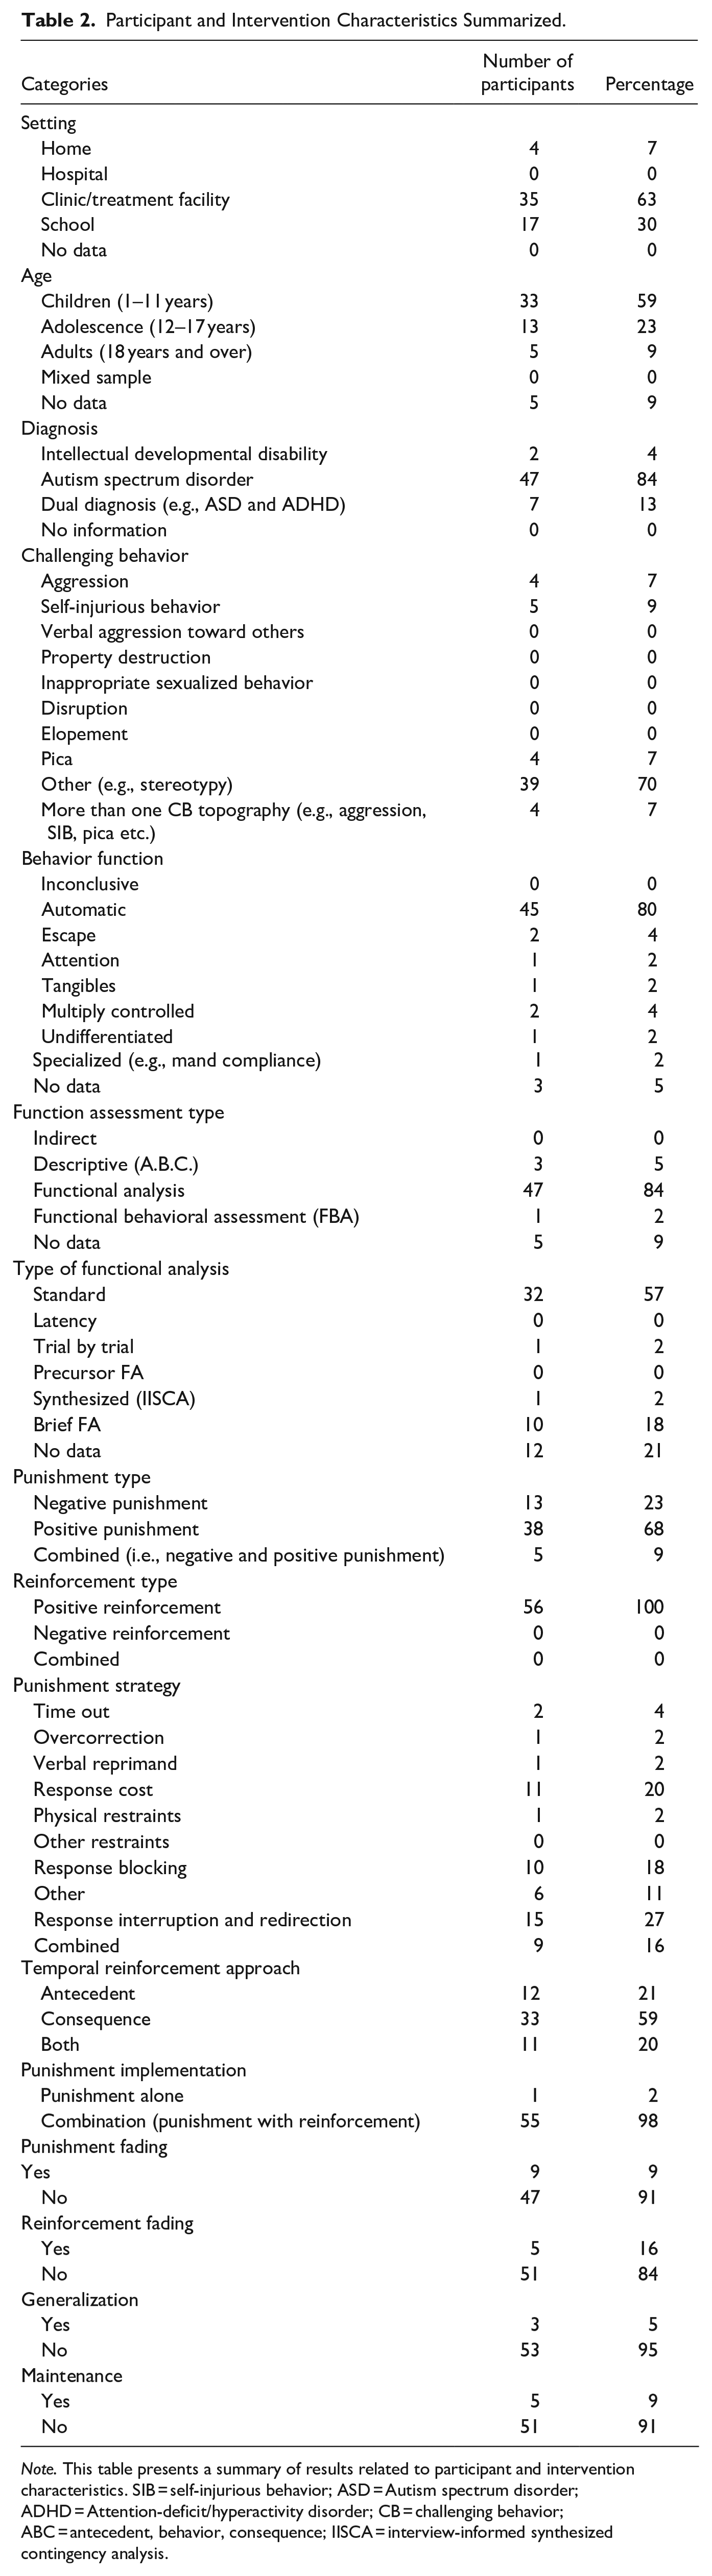
Note. This table presents a summary of results related to participant and intervention characteristics. SIB = self-injurious behavior; ASD = Autism spectrum disorder; ADHD = Attention-deficit/hyperactivity disorder; CB = challenging behavior; ABC = antecedent, behavior, consequence; IISCA = interview-informed synthesized contingency analysis.
Study Characteristics Summarized.
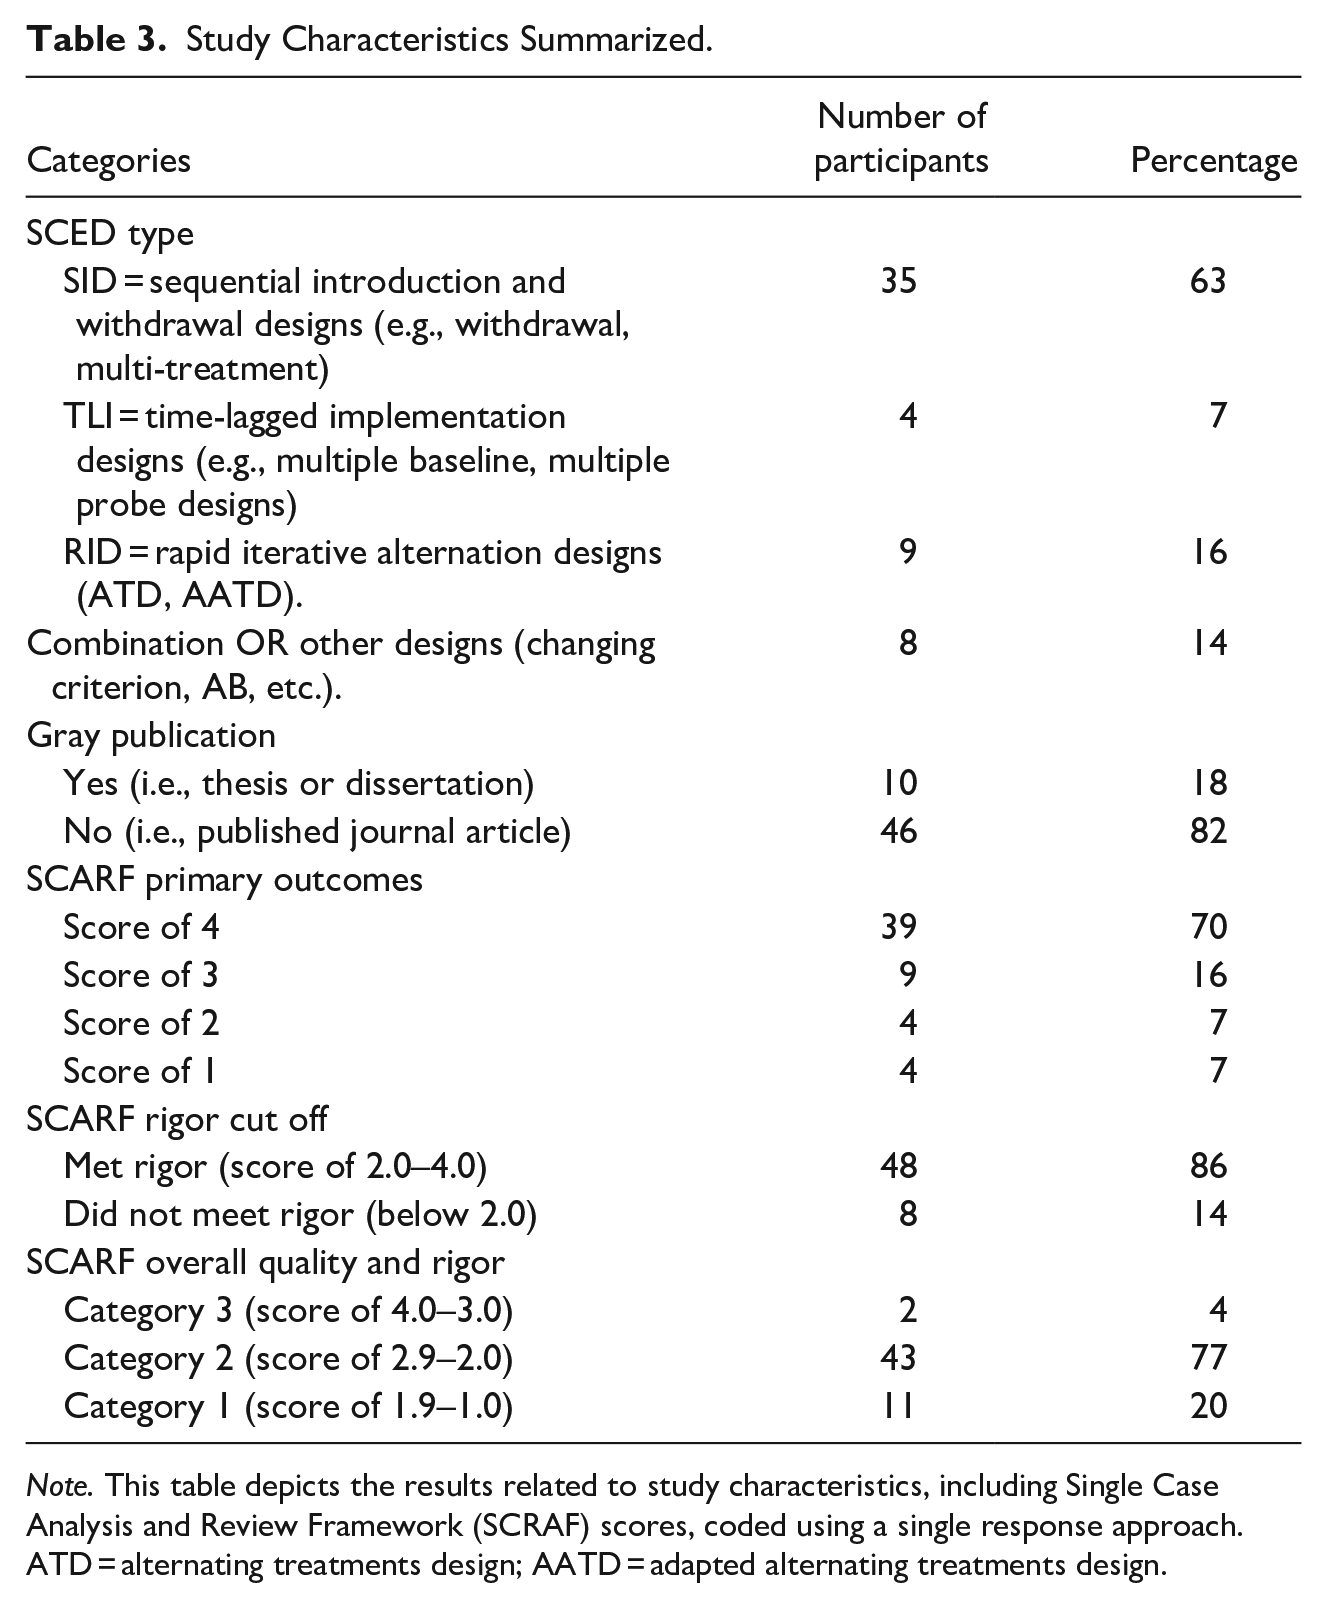
Note. This table depicts the results related to study characteristics, including Single Case Analysis and Review Framework (SCRAF) scores, coded using a single response approach. ATD = alternating treatments design; AATD = adapted alternating treatments design.
Participant and intervention characteristics
Participants
There were five participant age categories: (1) child (1–11 years), (2) adolescents (12–17 years), (3) adults (18 years and above), (4) mixed sample (i.e., the inclusion of participants from previous categories one, two, and three), and (5) no data (i.e., the study did not specify participant age).
Setting
There were five study setting categories: (1) home, (2) hospital, (3) clinic/treatment facility, (4) school, and (5) no data (the study did not specify the setting in which the study took place).
Diagnosis
Participant diagnosis was comprised of four categories: (1) intellectual and developmental disabilities, (2) ASD, (3) dual diagnosis (e.g., ASD and schizophrenia, etc.), and (4) no information (i.e., the study did not provide information regarding diagnosis).
Challenging behavior
Challenging behavior was defined as noted above (OSETT-CB) and coded in accordance with the categories and definitions outlined in Cox et al. (2021). Challenging behavior topographies included nine categories in accordance with the label (i.e., tact) the original study authors provided: (1) aggression (e.g., hitting, biting, or pushing others), (2) self-injurious behavior (e.g., eye poking, head hitting, hand mouthing), (3) verbal aggression toward others (e.g., screaming, threatening remarks towards others or self), (4) property destruction (e.g., breaking items, scrabbling on the table), (5) inappropriate sexualized behavior (e.g., touching others without consent, exposing body parts, masturbation in public), (6) disruption (e.g., flopping on the ground, non-cooperation, non-violent interruptions), (7) elopement (e.g., running away, hiding, leaving an area where one should be staying or told to stay), (8) pica (e.g., ingestion of non-edible items such as toys, beads, metal), and (9) other (i.e., any challenging behavior that does not meet the categories that were described above such as verbal and motor stereotypy).
Challenging behavior function
There were eight categories comprising challenging behavior function, including: (1) inconclusive, (2) automatic, (3) escape, (4) tangible, (5) multiply controlled (e.g., functional analysis [FA] results showed that behavior had more than one function), (6) undifferentiated (i.e., the FA results were undifferentiated), (7) specialized (e.g., mand compliance), and (8) no data (i.e., the authors did not report on the function of challenging behavior).
Functional Assessment Type
In the literature, functional assessment type often involves indirect assessments (e.g., questionnaires), descriptive (e.g., antecedent, behavior, and consequence data), and FA (i.e., experimental testing of functions; see Cooper et al., 2020; Iwata & Dozier, 2008; Melanson & Fahmie, 2023). In this review, we included six categories for functional assessment types: (1) indirect, (2) descriptive, (3) FA, (4) functional behavioral assessment or FBA (i.e., a combination of FA with one other method of assessment such as FA with an indirect or descriptive analysis), (5) none (i.e., no assessment was conducted to assess behavior function), and (6) no data (i.e., the function of the behavior was listed but no data was provided regarding the assessment procedure).
Functional analysis variation
Importantly, a FA was coded as traditional or standard (Iwata et al., 1994) if it was comprised of either three or four test conditions (e.g., tangible, attention, escape, and automatic or sensory) with a control condition administered via a multielement design (Cooper et al., 2020; Saini et al., 2020). As such, standard FA and other FA variations were observed and coded as: (1) standard, (2) latency (as seen in Thomason-Sassi et al., 2011), (3) trial-based FA (as seen in Bloom et al., 2013), (4) precursor FA (as seen in Fritz et al., 2013), (5) synthesized (as seen in Hanley et al., 2014), (6) brief FA (as seen in Northup et al., 1991), and (7) no data (i.e., the authors did not identify the type of FA conducted)—totaling seven distinct categories.
Punishment Type
This review applied the topographical definition of punishment to better align with the literature on this topic (Graber & Graber, 2018; Pierce & Cheney, 2017). As such, punishment was operationally defined as any stimulus applied or removed following a target response (i.e., challenging behavior) with an intent to reduce challenging behavior (Pierce & Cheney, 2017). Punishment elements were coded nominally as either negative punishment, positive punishment or combined (both negative and positive punishment applied).
Punishment strategy
Punishment strategy was comprised of eight categories, including: (1) time-out, (2) overcorrection, (3) verbal reprimand, (4) response cost, (5) physical restraints, (6) other restraints (e.g., medication to reduce challenging behavior), (7) response blocking, and (8) other (e.g., response interruption and redirection).
Punishment implementation
We coded whether punishment had been implemented (1) alone (the independent implementation of punishment procedures without reinforcement component), or (2) in combination (i.e., punishment was concurrently applied with reinforcement in a treatment package).
Punishment fading
Importantly, existing punishment literature suggests there may be some discrepancy around whether punishment should or can be faded in terms of magnitude or schedule of delivery (see Appel, 1961; Donaldson et al., 2013; Donaldson & Vollmer, 2012; Filby & Apple, 1966; Storms et al., 1962; J. Zimmerman & Fester, 1963). For our purposes, we elected to code for presence or absence of punishment fading.
Reinforcement type
We coded reinforcement elements as either (1) positive reinforcement, (2) negative reinforcement, or (3) both (negative and positive reinforcement).
Reinforcement fading
Raters coded whether reinforcement was faded or not.
Generalization
We defined generalization as behavior reduction seen in contexts and stimuli where treatment has not been applied (Cooper et al., 2020; Lydon et al., 2015). Generalization was coded into two categories: (1) yes (e.g., researchers reported generalization across context and stimuli when treatment had been removed) or (2) no (e.g., researchers did not report generalization across context and stimuli when treatment had been removed).
Maintenance
Maintenance was defined as the continuation of the intervention effect once the punishment-based procedure has been entirely removed (Cooper et al., 2020; Lydon et al., 2015). Maintenance was coded into two categories: (1) yes (e.g., researchers reported maintenance of treatment gains when intervention had been removed), (2) no (e.g., researchers did not report maintenance of treatment gains when intervention has been removed).
Study characteristics
Literature type
To offset publication bias (Sham & Smith, 2014), included articles were coded as either gray publications (e.g., dissertations, theses) or peer-reviewed literature.
SCED type
Drawing from Ledford and Gast (2018), we grouped SCED types into four categories: (1) sequential introduction and withdrawal designs (SID; e.g., withdrawal), (2) time-lagged implementation designs (TLI; e.g., multiple baselines, multiple probe designs), (3) rapid iterative alternation designs (RID; e.g., alternating treatments design, adapted alternating treatments design), (4) combination and other designs (e.g., designs that included more than one of the categories within one design or used a design that did not fit into the first three categories).
Study rigor assessment using SCARF
Raters evaluated and coded study rigor by applying SCARF (Ledford et al., 2020). SCARF was selected in part because unlike other rigor assessment tools (e.g., what works clearinghouse; Kratochwill et al., 2010), it evaluates participants’ data separately. For example, it explores whether fidelity data were collected per participant, assessing if the treatment is being applied as intended across participants and phases of the study. For this review, rigor results and primary outcomes were coded individually per participant.
Primary outcomes
Primary SCARF outcomes were coded as having: (1) a score of four, (2) a score of three, (3) a score of two, (4) a score of one, and (5) a score of zero.
Rigor criteria
Existing research utilizing SCARF has suggested that a score range of two to four may be considered adequately rigorous (Ledford et al., 2020; K. N. Zimmerman et al., 2018). It follows that, rigorous studies will have showcased at least three demonstrations of effect, have either reported IOA data or fidelity data, and have established stable baselines before introducing treatment (Barton et al., 2020; Chazin et al., 2020: Ledford & Gast, 2018). As such, cutoff scores were categorized into (1) yes, meets rigor criteria (i.e., rigor score is between two to four), (2) no, does not meet rigor criteria (i.e., rigor score is less than two).
Final overall quality and rigor criteria
Overall quality and rigor outcomes, as per SCARF scores obtained, were placed into one of three categories: (3) 4.0–3.0, (2) 2.9–2.0, and (1) 1.9–1.0.
Multiple response coding scheme
Reinforcement approach
For this item, we used multiple-response coding (see McBeath, 2020; Table 4). This was done because it permitted us to record (and report) accurately when the original authors applied more than one reinforcement approach. That is, we assigned a value of one to each reinforcement approach applied (per participant). For example, if a study applied both NCR and DRA concurrently with a punisher to reduce challenging behavior (e.g., Patrick; Ruckle et al., 2023), the presence of each reinforcement approach would be denoted by 1.
Percentage Base for Reinforcement Approach Coded using Multiple-Response.
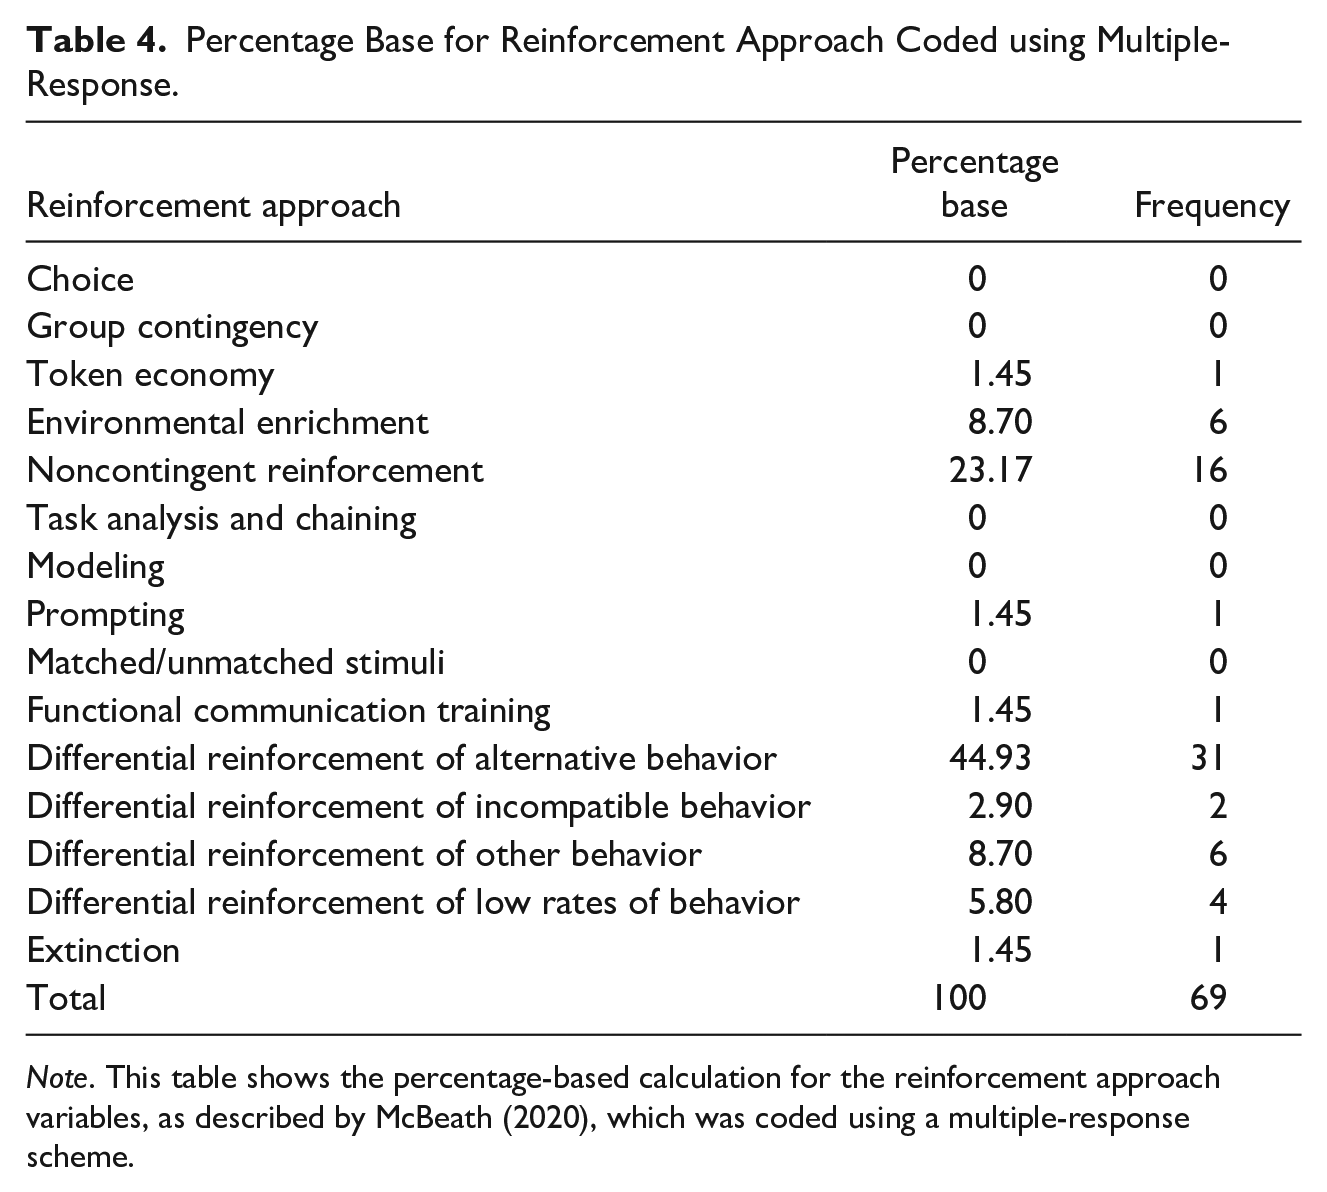
Note. This table shows the percentage-based calculation for the reinforcement approach variables, as described by McBeath (2020), which was coded using a multiple-response scheme.
Descriptive results for multiple-response coded items were generated by calculating the percentage base for each variable. This involved summing the frequency of each response, dividing it by the total count of all responses, and then multiplying by 100 (see Table 4). Interested readers may refer to McBeath (2020) for details on calculating percentage base for multiple-response coding. The reinforcement approach consisted of 15 categories: (1) choice, (2) group contingency, (3) token economy, (4) environmental enrichment, (5) NCR, (6) task analysis and or/chaining, (7) modeling, (8) prompting, (9) matched/ unmatched stimuli, (10) FCT, (11) differential reinforcement of alternative behavior (DRA), (12) differential reinforcement of incompatible behavior (DRI), (13) differential reinforcement of other behavior (DRO), (14) differential reinforcement of low rates of behavior (DRL), and (15) extinction.
Temporal reinforcement approach
Following multiple-response coding, we created a variable called temporal reinforcement approach. This was done so that we could categorize combination punishment interventions according to the temporal relation of the reinforcement element(s) of the treatment package (see Table 5). This resulted in three categories, including: (1) antecedent approach (i.e., environmental enrichment, modeling, prompting, matched/unmatched stimuli), (2) consequent approach (i.e., task analysis and/or chaining, token economy, FCT, DRA, DRI, DRO, DRL, extinction), or (3) combined (e.g., NCR plus DRA; Ruckle et al., 2023).
Temporal Reinforcement Approach.
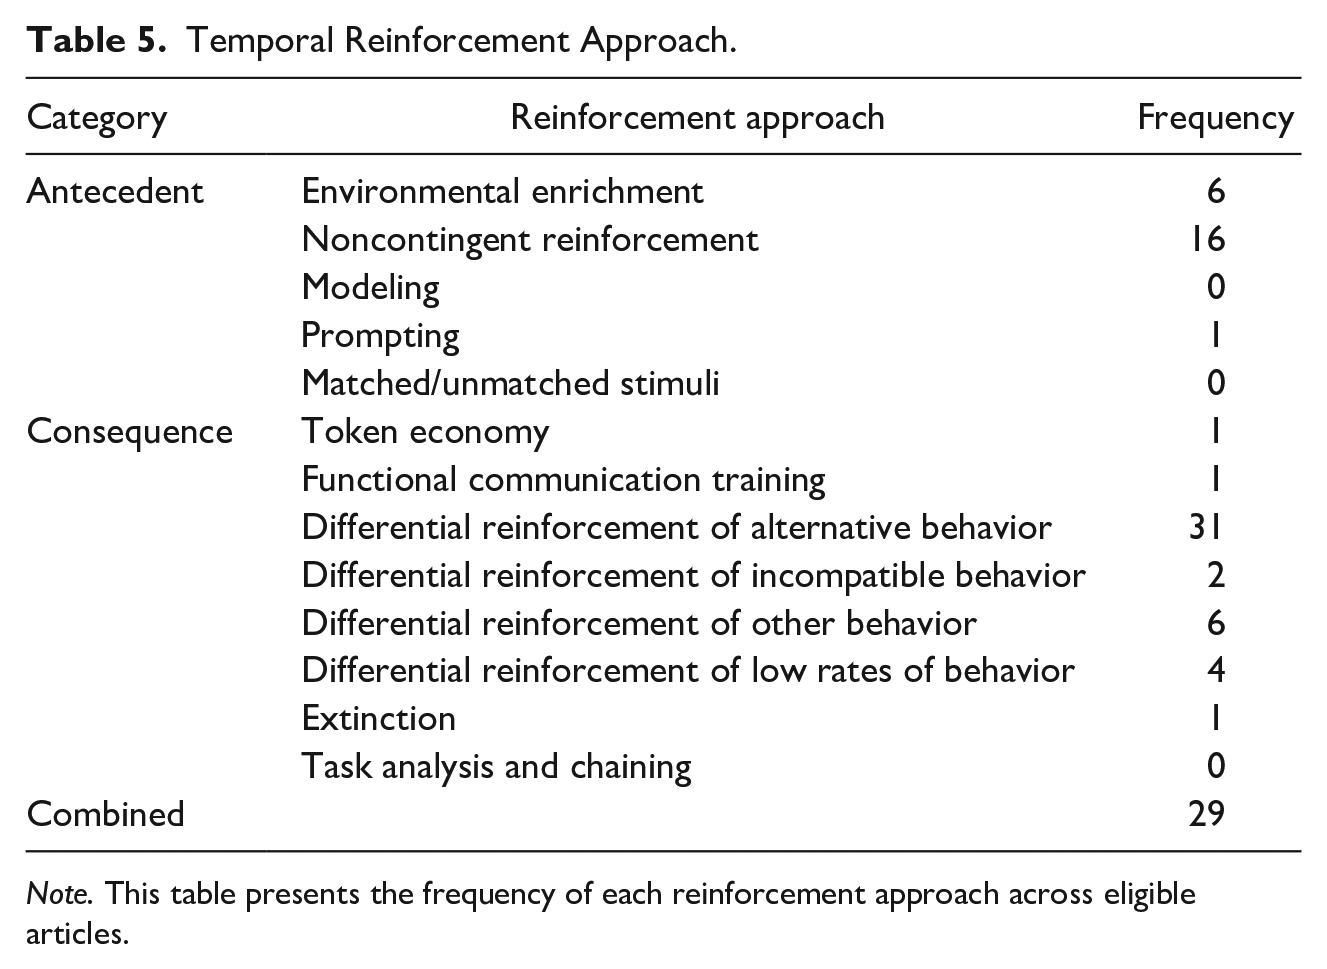
Note. This table presents the frequency of each reinforcement approach across eligible articles.
Quantifying and Analyzing Intervention Outcomes
Effect size
Effect size has been described as a standardized coefficient that enables an objective evaluation of the magnitude of effect within a study (Dowdy et al., 2021). Importantly, effect size allows for the comparison of effects across various studies that have used diverse measurement scales and variables (see Field, 2018). In SCED research, effect size estimates offer a way to quantify intervention effects within and across studies (Vannest & Sallese, 2021). There are several SCED effect size estimate options, each with its own advantages and disadvantages. Although a fulsome review goes beyond the scope of the current paper, interested readers may reference Dowdy et al. (2021) for a helpful introduction on the topic. For the current review, we elected to use Tau-U to examine treatment effects for several reasons. First, Tau variants are among the most used effect size estimates in SCEDs (Costello et al., 2022). Second, Tau-U may provide a conservative estimate of the treatment outcome observed (Dowdy et al., 2021). Third, this estimate can account for baseline trends and may be less likely to be impacted by ceiling effects (see Fingerhut et al., 2021). It also has minimal distributional assumptions and good statistical power (see Fingerhut et al., 2021; Parker et al., 2011). Finally, Tau-U offers flexibility as it can compute trends, non-overlap between phases, or a blend of both (Parker et al., 2011). For all these reasons, we felt it was an appropriate choice for the current review.
Effect size data extraction and tau-u calculation
As alluded to above, we calculated effect size by first extracting participant challenging behavior data using WebPlotDigitizer (Rohatgi, 2022). Baseline and final treatment phase data were entered into an Excel Spreadsheet. Following this, the values were entered into an online calculator (https://jepusto.shinyapps.io/SCD-effect-sizes/; Pustejovsky et al., 2023), which automated the process of generating a Tau-U coefficient for each case. Importantly, it is best to calculate Tau-U scores using datasets that feature a minimum of three data points in baseline (see Pustejovsky et al., 2023). The final step was entering each effect size into the master Excel Spreadsheet.
Nonparametric statistics
To conduct the statistical analysis, we used the Statistical Package for the Social Sciences (SPSS) software tool. We exported punishment type and temporal reinforcement approach, which were coded nominally, variables to SPSS, as well as corresponding effect size estimate coefficients. Following this, we enacted two separate Kruskal-Wallis tests to answer corresponding review questions (see Results section for details). Interested readers can refer to Field (2018) for more details on this, and other, non-parametric analysis.
Interobserver Agreement
Abstract and full-text screening
We computed IOA for each screening and data extraction step. A minimum of 80% rater agreement was required to proceed to the subsequent step (e.g., abstract to full-text screening). In the context of abstract and title screening, a second rater independently assessed 30% of the articles uncovered by the search string. Agreement was defined as both raters indicating that an article met review inclusion criteria. A disagreement (referred to as conflict; see Covidence Systematic Review Software, 2022) was defined as one rater indicating that an article met study inclusion and the other rater indicating that the article did not meet review inclusion criteria. We used total count IOA to generate outcomes for abstract screening. That is, we divided agreements by agreements plus disagreements, then multiplied by 100 (Cooper et al., 2020). Interobserver agreement for title and abstract screening was 80%. Disagreements were settled via consensus, led by the senior author (ADC). Most disagreements stemmed from uncertainty about whether the design qualified as a SCED, or if the primary focus of the study was to evaluate punishment applied to address challenging behavior. These uncertainties were the result of insufficient clarity communicated through the abstract or title.
Total count IOA was also used for full-text screening. We defined agreement as both raters selecting the same articles based on inclusion criteria and excluding the same articles for the same reasons in the exclusion hierarchy (see Figure 1). Disagreement was defined as raters selecting different articles or excluding an article for different reasons. For this phase, IOA was conducted across 100% of articles. The IOA for full-text screening was 96.20%. There were no disagreement patterns identified, and all disagreements were settled via consensus led by the senior author (ADC).
Data extraction variables
We used Google Randomizer to select the 33% of studies to be coded by a second, independent rater. That is, the second rater coded all participant and study characteristics, and independently applied SCARF to evaluate this samples’ rigor. To conduct IOA, we applied an item-by-item method. That is, dividing the total number of agreed-upon coded items by the total number of items rated, then multiplying by 100 (Cooper et al., 2020). Rater agreement was defined as both raters assigning the same value to the same variable. The IOA for variables coded via single response was 87.30% (range, 60%–100%). The IOA for variables coded via multiple response was 95.10% (range, 75%–100%). The IOA score for SCARF was 96.30% (range, 74%–100%). Reliable error patterns were largely absent, although our minimum IOA scores across single-response and SCARF coding coincided with coding the Brown (2021) article. Subsequently, the second rater independently extracted and calculated effect size coefficients across 30% of cases. Here, we applied exact count-per-item IOA (Cooper et al., 2020). To do this, each case was treated as an item. Interobserver agreement was calculated by dividing the summed exact agreement by the total number of cases, multiplied by 100. Agreement was defined as both raters producing the same effect size coefficient for each case. The agreement between raters for effect size was 100%. All disagreements were handled via consensus, led by the senior author (ADC).
Results
Supplementary Material Statement
To be transparent, coinciding Supplementary Materials include information regarding effect size calculations across all cases, mean effect size score outcomes, and mean SCARF outcomes, as well as the list of all 30 articles included in this review.
Descriptive Analysis Outcomes
Data from 56 participants (across both peer-reviewed and gray literature) informed the descriptive analysis.
Study and participant characteristics
Study characteristics
Featured studies primarily used SID, such as withdrawal or multi-treatment designs (63%). By contrast, RID was featured in 16% of the articles. Combination designs, such as multiple baselines with an embedded reversal, were featured across 14% of the sample, and TLI was observed 7% of the time. Most articles that met inclusion criteria were peer-reviewed journal articles (82%), while gray publications comprised 18% of the sample. Overall, most of the sample (81%) met the SCARF overall quality and rigor criteria (i.e., score equal to or greater than two; see Figure 2). Interestingly, the sample comprising the unmet overall quality and rigor cutoff did not exclusively consist of gray literature. That is, 46 participants were from peer-reviewed articles, and 10 participants were from the gray literature. Further, only 14% did not meet the SCARF rigor criteria (i.e., received a score of less than 2). Of this sample (14%), two articles were peer-reviewed, and three articles were gray literature.
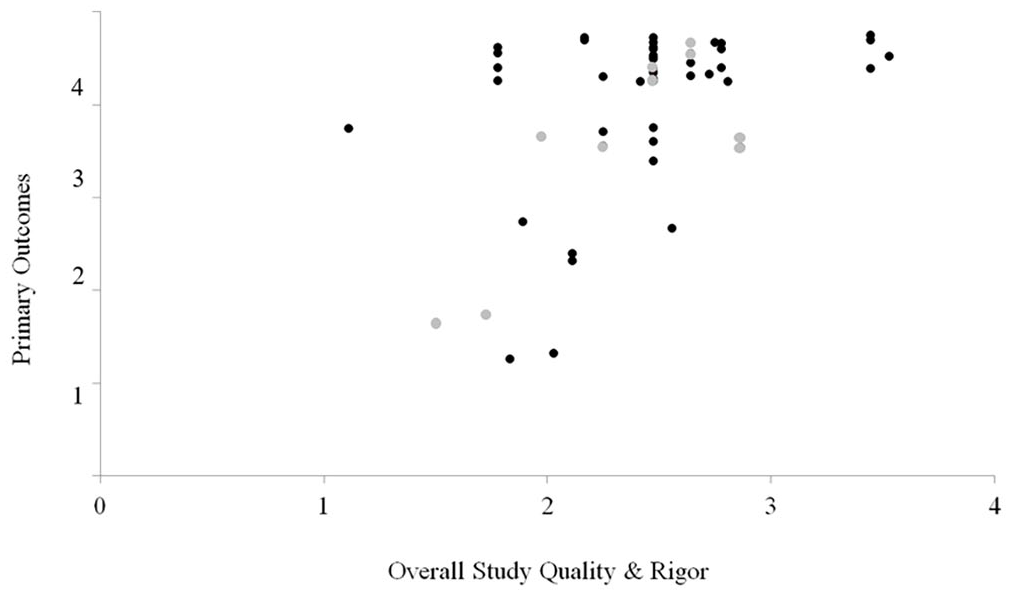
Single case analysis and review framework scatterplot (SCARF).
In reviewing SCARF primary outcome scores, more than half of the sample had a score of three or greater (86%). This meant that 86% of the sample showcased strong therapeutic effects. That is, raters observed a consistent level change (i.e., challenging behavior improvement) in treatment compared to baseline across data points showing low variability (Ledford et al., 2020). Only 7% of the sample was ranked as one, which communicates an inadequate score for interpreting results (Ledford et al., 2020).
Participant characteristics
Most participants in the included studies were children aged 1 to 11 (59%). Twenty-three percent were adolescents aged 12 to 17. Only five participants were 18 and over (9%). A few articles did not report participant age (9%; e.g., Watkins & Rapp, 2014). Participants comprising this reviews’ sample had been diagnosed with either ASD (84%), intellectual and developmental disability (4%), or were dually diagnosed (e.g., presence of ASD and attention-deficit/hyperactivity disorder; 13%). Further, the challenging behavior topography featured most often was stereotypy (e.g., motor, vocal; 70%). The prevalence of other challenging behavior reported was as follows: aggression (7%), self-injurious behavior (9%), pica (7%), and multiple challenging behavior topographies (7%).
Regarding, behavior function assessment type, none of the articles conducted indirect assessments, while 5% utilized descriptive methods (i.e., direct observation), 84% conducted a FA, and 2% conducted functional behavior assessment (i.e., indirect or direct method plus FA). Only 9% of the sample did not report behavior function assessment type (e.g., Chen & Traub, 2022; Sullivan et al., 2017). Out of all the articles that did conduct a FA, a standard FA was the most often applied (57%), followed by brief FA (18%). The FA variation applied least often included trial-based (2%) and synthesized FA (2%). Twenty-one percent of the sample appeared to have excluded specific FA data. That is, they reported conducting a FA but did not provide the specific data to exemplify their assessment outcome. Regarding challenging behavior function, most appeared to be maintained by automatic reinforcement (80%). Escape maintained and multiply controlled challenging behavior were reported in 4% of studies, while 2% reported challenging behavior maintained by attention, tangible, and mand compliance, respectively.
Treatment characteristics
Most (68%) articles applied positive punishment, while 23% applied negative punishment. Nine percent employed both positive and negative punishment concurrently (e.g., Greer et al., 2016; Hypse, 2021; Mitteer et al., 2015; Vascelli et al., 2022). Response interruption and redirection was most often observed (27%), followed by response cost (20%) and response blocking (18%). Other punishment strategies applied included: time out (4%), overcorrection (2%), verbal reprimand (2%), physical restraint (2%), and other (11%). Finally, a combination of strategies was applied across 16% of the sample. For example, in Vascelli et al. (2022) the authors applied both verbal reprimand and hand wiping. Regarding reinforcement type, 100% of the sample experienced positive reinforcement concurrently with punishment. Importantly, all punishment procedures (100%) featured in this study were applied concurrently alongside reinforcement (e.g., DR, NCR).
Multiple-response coding revealed DRA was applied most often (44.93%). DRO, DRL, and DRI were observed across 8.70%, 5.80%, and 2.90% of the sample, respectively. Non-contingent reinforcement was applied in 23.17% of the sample, and EE 8.70% of the time. The least often selected reinforcement approaches for participants were token economy (1.45%), FCT (1.45%), prompting (1.45%), and extinction in isolation (1.45%).
Regarding temporal reinforcement approach, consequence-based approaches were observed most often (59%), followed by antecedent approaches (21%). We observed their concurrent application in 20% of the sample. Additionally, most authors did not attempt to fade either reinforcement (84%) or the punishment procedures (91%). Regarding maintenance and generalization, only 9% conducted maintenance probes, while only 5% attempted to explore treatment generalization.
Effect Size (Tau-U) Results
Tau-U outcomes were informed by 55 participants (featured in both peer-reviewed and gray literature). Many participants contributed more than one effect size (i.e., case). As such, a total of 142 effect size scores were generated. Importantly, data from one participant was excluded (Ethan; Hypse, 2021) because his baseline had only two data points. To interpret the effect size outcomes, we adopted the Tau-U effect size cut-off criteria outlined by Vannest and Ninci (2015). These authors categorized effect sizes as small (<0.19), moderate (0.20–0.59), large (0.60–0.80), and very large (>0.81). The same cutoffs would be applied to negative (contra-therapeutic) effect sizes. We elected to apply these cutoffs because their generation was informed by disability-focused journals (see Vannest & Ninci, 2015 for further details).
The mean effect size across all cases (N = 142) was 0.62 (range, −0.82 to 1.38). We observed a positive intervention effect across 89.44% of the sample (M = 0.78; range, 0.01–1.38). Contra-therapeutic effects coincided with 10.56% of the sample (M = −0.39; range, −0.82 to −0.02). Finally, five out of 142 cases indicated no intervention effect (i.e., zero effect size; see Supplementary Material for a breakdown of effect size outcomes).
Temporal reinforcement approach
The application of an antecedent reinforcement plus punishment element(s) (e.g., NCR plus punishment) coincided with a large mean effect size of 0.74 (range, −0.60 to 1.38; N = 27). When a consequent reinforcement plus punishment element(s) was applied (e.g., DR plus punishment), we observed a large mean effect size of 0.65 (range, −0.76 to 1.32; N = 86). The concurrent application of antecedent and consequent reinforcement plus punishment element(s) (e.g., DRA and NCR plus punishment) coincided with a modest mean effect size of 0.46 (N = 29, range, −0.82 to 1.27; N = 29).
Punishment type
Regarding punishment type, cases involving only negative punishment, alongside reinforcement were associated with a large mean effect size of 0.69 (range, −0.60 to 1.38; N = 32). Cases with positive punishment, alongside reinforcement were associated with a mean effect size of 0.87 (range, −0.82 to 1.31; N = 100). The combined use of both negative and positive punishment types, alongside reinforcement resulted in a mean effect size of 0.58 (range, −0.33 to 1.2; N = 10).
Sample rigor
Regarding effect size outcomes as they relate to rigor and quality, the sample comprising SCARF scores between 4.0 and 3.0 coincided with a very large mean effect size of 0.85 (range, 0.79–0.90; N = 2). Those with scores ranging from 2.9 to 2.0 also coincided with a very large mean effect size of 1.05 (range, −0.82 to 1.38; N = 43). Articles comprising poor rigor and quality with scores ranging from 1.9 to 1.0 were associated with a modest mean effect size of 0.29 (range, −0.76 to 1.20; N = 11). Of note, the sample that fell below the rigor cutoff included both peer-reviewed and gray literature. On average, the peer-reviewed articles were associated with a large mean effect size of 0.68 (range, −0.82 to 1.38; N = 46), while gray literature was associated with a modest mean effect size of 0.22 (range, −0.82 to 0.75; N = 10).
Non-Parametric Statistical Analysis
As mentioned above, effect sizes for one participant (Ethan; Hypse, 2021) could not be calculated because there were only two data points in baseline. To fully examine differential patterns across punishment types and temporal reinforcement approaches, we reviewed the dataset, and it seemed that overall missing data was only about 5% (9/151 = 5.90%). To prioritize bolstering sample size, we enacted mean imputation—one of the most frequently applied methods of handling missing data (De et al., 2020). Thus, we imputed the value 0.58, which had been generated by using all effect size coefficients from cases comprising the same punishment type category (i.e., combined). This resulted in 151 cases, up from the 142 effect sizes that had informed the descriptive analysis.
Reviewing normality assumptions as applied to the dependent variable (effect size), mean imputation did not produce extremely different outcomes. In fact, skewness was slightly worse compared to the original dataset with missing values. In reviewing the QQ plot, there appeared to be some modest snaking. These deviations appeared primarily around the ends of the QQ plot, while much of the middle remained on the reference line. In considering the central limit theorem (N = 151), the absence of extreme outliers and other relevant potential biases, we were largely satisfied with the modest normality violations (Field, 2018). Thus, we did not pursue additional dependent variable dataset adjustments (e.g., transformation).
Temporal reinforcement approach
In exploring normality assumptions across the nominally coded groups (antecedent plus punishment, consequent plus punishment, combined plus punishment), we observed modest violations (heavier tails), while the antecedent group appeared to have one extreme outlier. As a result, we elected to use the Kruskal-Wallis test so that we could compare outcomes (i.e., effect size) across temporal reinforcement approach (e.g., antecedent, consequent, both). The results suggested that temporal reinforcement approach coincided with significantly different outcomes H (2) = 7.44, p = 0.024. Pairwise comparisons with adjusted p-values showed there was a significant difference in effect size between combination reinforcement plus punishment elements (i.e., antecedent and consequent reinforcement plus punishment) and antecedent reinforcement plus punishment (p = 0.03, r = 0.32). Specifically, antecedent reinforcement plus punishment element(s) interventions (e.g., NCR plus punishment) coincided with significantly larger effect sizes compared to when combination reinforcement plus punishment element(s) were applied (e.g., Verriden & Roscoe, 2019). There were no other significant differences across the remaining pairwise comparisons.
Punishment type
The distribution across punishment type (positive, negative, both; coded nominally) appeared to have more marked normality assumption violations. Specifically, we observed heavy tails, which communicated that most effect sizes were positive (i.e., treatment gains observed). Not surprisingly, all three groups featured substantial skewness. However, deviant kurtosis appeared to coincide with negative punishment data while kurtosis was relatively normal for the other two groups. Sample size variation was also admittedly different across groups, with 100 effect sizes comprising positive punishment group, 32 comprising negative punishment group, and 19 comprising combination punishment group. The QQ plots featured some deviation from the reference line, though more so for the combination punishment group.
As a result, we elected to use a Kruskal-Wallis test to compare outcomes across punishment type groups. Punishment type did not appear to significantly affect outcomes. Pairwise comparisons of course indicated no significant difference across groups. Admittedly, these results should be interpreted with caution given the dataset limitations described above. A detailed discussion on analysis limitations is provided below (Discussion Section).
Discussion
Review Outcomes
This review examined the punishment research conducted over the last decade. The articles uncovered through the comprehensive systematic review methodology enacted suggests applied literature over the last 10 years has primarily evaluated punishment effects in combination with reinforcement procedures (i.e., combination punishment interventions). It was also apparent that research on this topic continues to be in short supply (e.g., Lerman & Vorndran, 2002; Lydon et al., 2015). This relative dearth ultimately may have resulted in an over-representation of certain participant, setting, and intervention characteristics. For example, automatically reinforced challenging behavior was heavily featured across included studies, while autistic children comprised most of the review sample. Although the participant pool trends were not surprising (see Cox et al., 2021; Melanson & Fahmie, 2023), it may mean that conclusions drawn from the current paper may be more applicable to cases of automatic reinforcement for select participant profiles. That is, under certain conditions, incorporating a punishment element (e.g., positive punishment) concurrently with reinforcement (i.e., antecedent or consequent approach) may be effective in reducing target behaviors. Practically, it is possible that these participant trends may be due to the expanded insurance coverage for applied behavior analysis services for autistic children in the United States. One potential solution to improving participant diversity and ultimately representation across participant groups may include researchers partnering with community agencies tasked with supporting adults with intellectual and developmental disabilities who engage in truly severe challenging behavior. Through these partnerships, clinical research outcomes may be disseminated and thus facilitate a more balanced representation of challenging behavior and function (Cox et al., 2021). Relatedly, our outcomes may highlight the field’s relative inability to effectively address automatically maintained challenging behavior compared to socially mediated behaviors, which is not a new finding but certainly implores us to echo the call for more research on this topic featuring more variability in target behavior. Finally, we encourage readers to exercise caution given the wide variability apparent across outcomes, as evidenced by large effect size ranges that suggest a variety of outcomes were observed; from contraindicated (negative effect sizes) to largely impactful (positive effect sizes >0.81),
Another noteworthy outcome that both negative and positive punishment may be associated with large (0.69) or very large (0.87) intervention effects. Importantly, these outcomes were not significantly different. Thus, this could lead us to tentatively suggest that in certain situations it may not matter whether a positive or negative punishment element is applied; either may be a helpful element to include in a combination intervention targeting challenging behavior improvement. Therefore, if this is a point of concern for clinicians, they may be comforted by the fact that either type may facilitate equally favorable client outcomes.
Another outcome was that even though articles more often evaluated consequent reinforcement approaches (N = 86) compared to antecedent reinforcement approaches (N = 27), either temporal reinforcement approach (in combination with a punishment element) may be associated with large effect sizes and similar effect size ranges. That is, there was no significant difference between consequent plus punishment element interventions and antecedent plus punishment intervention elements. However, there may have been a significant difference between antecedent reinforcement plus punishment and combined temporal reinforcement plus punishment interventions. This was an interesting outcome, in that arguably more complex approaches (i.e., those that applied both antecedent, consequent reinforcement and a punishment element) did not appear to add value; suggesting in some contexts perhaps less is more. Although there were differences in sample sizes across these categories, the review outcomes could suggest if challenging behavior improvement is not observed when applying either antecedent or consequent reinforcement approaches alongside a punishment element, the next step might be to refine the existing elements in the treatment package rather than adding the other possible temporal reinforcement approach. It is true that existing empirical work directly comparing antecedent and consequent approaches suggest both may be equally effective (e.g., Allison et al., 2012; Kodak et al., 2003). However, this work is largely done in the context of applying interventions without a punishment element. Thus, their outcomes cannot necessarily be extrapolated to inform how these antecedent and consequent approaches would function when punishment elements are concurrently in effect. Therefore, future research directly comparing temporal reinforcement approaches when punishment elements are concurrently active may be recommended. This work could be accomplished by levering mixed design methodology (i.e., randomized crossover CCCS; Hagopian, 2020) to directly compare manipulating temporal reinforcement approaches versus punishment elements in cases where intervention effects are yielding unsatisfactory outcomes (i.e., less than 80% reduction in challenging behavior from baseline; Hagopian et al., 1998).
Finally, most articles did not explore maintenance. Thus, the current outcomes may only be applicable to short-term trends. Future research should include maintenance probes to examine treatment durability to begin to comment on whether the trends described above sustain over time, or whether they begin to change over time.
Research quality & publication bias
As evidenced by the impressive quality rating outcomes, we were encouraged by the fact that most research on punishment is generally high quality. Relatedly, the fact that we observed high-quality gray literature is interesting and may offer tentative evidence of the existence of publication bias. That is, there were high quality works that were not peer-reviewed as well as low-quality works that were peer-reviewed but, that showcased positive participant outcomes. Assessing this phenomenon in reviews featuring behavior analytic works is not yet considered commonplace (Tincani & Travers, 2019). Thus, we encourage future researchers consider incorporating this into their methodology. Perhaps even enhancing the work seen here by conducting a more exhaustive gray literature search, as well as enacting more advanced protocols such as those described by Dowdy et al. (2022). We also encourage those serving as editors and reviewers to consider incorporating mechanisms to aid in circumventing publication bias—especially on topics that may be considered more controversial.
Study Limitations and Strengths
This review had several limitations, which should be acknowledged. First, there is a difference of opinions regarding whether to include gray literature, such as theses and dissertations (Adams et al., 2016). Our decision to include gray literature was informed by the following: (a) the replication crisis in psychology (Malich & Munafò, 2022; Wiggins & Chrisopherson, 2019), (b) our desire to produce outcomes that may account for potential publication bias (Sham & Smith, 2014), and (c) augmenting the reviews’ sample size. Taken together, we felt it was not only prudent to include gray literature, but its inclusion may have enriched the systematic review with diverse perspectives, ultimately enhancing the report’s overall quality.
As mentioned previously, the scarcity of research on the topic in general was a prominent limitation that may have resulted in over-representation of certain study and participant characteristics. Specifically, a single category in age (i.e., mixed sample), and settings (i.e., hospital), and five of the 10 categories in the challenging behavior category (i.e., verbal aggression toward others, property destruction, inappropriate sexualized behavior, disruption, and elopement) had values of zero. This limited sample may translate to concerns related to external validity. Thus, the generalizability of the outcomes may be limited.
A third limitation is that the review’s search string may have missed some relevant articles due to the field’s reported reluctance in using the term punishment as a descriptor or keyword within their abstracts and/or manuscripts (see Graber & Graber, 2018). In other words, while a study may have incorporated a punishing element in its treatment approach, it is possible that the researchers did not explicitly label it as such in their titles and abstracts or purposely avoided using the term altogether. Regardless, by leveraging the university librarians’ expertise and other related reviews’ search strings—we suspect few relevant articles were overlooked. Next, participation bias may have also served as a potential study limitation wherein the individuals who decide to participate in a study differ from those who do not (Elston, 2021). This difference can stem from various factors, including participant access (e.g., funding available for autistic children). Participation bias can also lead to a non-representative sample, which we may have uncovered and, directly impacted the review outcome accuracy, reliability, and generalizability. Albeit, this limitation may be omnipresent across the behavior analytic research, as evidenced by similar participant trends uncovered in Cox et al. (2021) and Melanson and Fahmie (2023). Thus, it may be prudent to advise readers to consider this limitation across any challenging behavior intervention topic. Finally, it is possible that some may disagree with the way we categorized temporal reinforcement approaches. Nevertheless, we are confident that our approach was comprehensive and successfully aligned with the empirical requirements of the review.
Alongside study limitations, we felt the review boasted several important strengths. First, employing online tools (e.g., Webplot Digitizer, effect size calculators) likely minimized human error in data extraction and analysis. In addition, working with university librarians allowed us to leverage tools such as Covidence to streamline the review process and carefully craft search strings to ensure the retrieval of the most relevant search results.
Second, applying two distinct coding processes (single-response and multiple-response) facilitated a nuanced analysis of study characteristics. By utilizing these distinctive coding procedures, we ensured that as much information as possible was extracted from included articles. For instance, enacting multiple response coding allowed us to capture each specific reinforcement approach used alongside punishment in treatment packages across the articles included in this review. Had this approach been excluded, we would not have been able to comment on the frequency and proportion (i.e., percentage base) of specific reinforcement approaches utilized in the treatment packages (see Tables 4 and 5). As such, this approach enabled us to accurately represent the distribution of reinforcement approaches utilized concurrently with punishment in the included studies. Third, our high average IOA outcomes across each screening and coding step may have enhanced the credibility of the results. Lastly, we felt our three levels of analysis (e.g., descriptive, effect size, and nonparametric statistics) enhanced the evaluation of this topic. Specifically, by applying select statistical analyses, we were able to quantify the observed differences as indicated by descriptive statistics (e.g., effect size mean). That is, mean effect sizes indicated antecedent temporal approaches may have coincided with the largest effect size. In executing a Kruskal-Wallis, we were able to determine whether this observed difference translated to a statistically significant one across temporal reinforcement approaches, including clinical significance—as indicated by effect sizes associated with pairwise comparison tests. We encourage others interested in enacting review work to explore outcomes by applying a range of analytical approaches to facilitate comprehensive commentary on the phenomenon under review.
Supplemental Material
sj-docx-1-bmo-10.1177_01454455241262414 – Supplemental material for A Quantitative Systematic Literature Review of Combination Punishment Literature: Progress Over the Last Decade
Supplemental material, sj-docx-1-bmo-10.1177_01454455241262414 for A Quantitative Systematic Literature Review of Combination Punishment Literature: Progress Over the Last Decade by Asude Sumeyye Ayvaci, Alison Dorothea Cox and Andreas Dimopoulos in Behavior Modification
Footnotes
Declaration of Conflicting Interests
The author(s) declared no potential conflicts of interest with respect to the research, authorship, and/or publication of this article.
Funding
The author(s) received no financial support for the research, authorship, and/or publication of this article.
Supplemental Material
Supplemental material for this article is available online.
Author Biographies
References
Supplementary Material
Please find the following supplemental material available below.
For Open Access articles published under a Creative Commons License, all supplemental material carries the same license as the article it is associated with.
For non-Open Access articles published, all supplemental material carries a non-exclusive license, and permission requests for re-use of supplemental material or any part of supplemental material shall be sent directly to the copyright owner as specified in the copyright notice associated with the article.