
Abstract
The present study develops and evaluates a hybrid Organic Rankine Cycle–Turboexpander (ORC–TE) system integrated into a Natural Gas Pressure Reduction Station (NGPRS) to recover both thermal and pressure-exergy losses. A comprehensive thermo-exergoeconomic model is formulated by coupling first- and second-law energy equations with component-level cost functions. The system performance is analyzed under steady-state conditions using a MATLAB–Engineering Equation Solver hybrid computational framework. Three conflicting objectives were simultaneously considered: maximizing Exergy Efficiency and Thermo–Environmental Synergy Indicator, while minimizing the total cost rate. The obtained Pareto fronts revealed strong coupling between thermodynamic enhancement and cost reduction, with an optimal compromise (Benchmark Case Study, BCS) Exergy Efficiency of 0.71, an Thermo–Environmental Synergy Indicator of 0.0275, and a Normalized Total Cost Rate of 0.47. A comprehensive sensitivity analysis identified the turbine isentropic efficiency and gas inlet temperature as the most influential parameters. To select the final operating configuration, a TOPSIS decision-making framework employing equal, entropy, and sensitivity-based weighting schemes was applied to the Pareto data. Among these, the sensitivity-derived weights produced the most stable and physically consistent ranking, yielding the highest normalized closeness coefficient of 0.73. Overall, the developed optimization framework demonstrates that the ORC–TE hybrid can achieve up to 84 % exergy efficiency with a 28 % reduction in total cost rate compared with the baseline Pressure Reduction Station, confirming its high techno-economic and environmental viability for industrial natural gas networks.
Keywords
Introduction
The continuous growth of global energy demand, coupled with concerns about the depletion of fossil fuel resources and greenhouse-gas emissions, has intensified research on high-efficiency energy recovery and decarbonization technologies (Kermeli et al., 2022; Nagaj et al., 2024; Wang and Azam, 2024). Nearly one-third of industrial energy input is dissipated as low- or medium-grade waste heat, estimated at more than 405 TWh per year worldwide (Saha et al., 2020). Efficient recovery of this waste heat, particularly in natural gas infrastructures such as pressure-reduction stations, represents an underutilized opportunity to generate useful work while lowering CO₂ emissions (Danieli et al., 2020; Ononogbo et al., 2023).
Conventional gas pressure reduction stations rely on throttling valves that cause irreversible exergy destruction. Replacing them with turboexpanders (TEs) enables partial conversion of expansion energy into mechanical power, yet large temperature drops across the expander often necessitate external preheating of the gas (Cascio et al., 2018; Han et al., 2024; Tavakoli and Mirzaei Zia Pour, 2025). Past research focused mainly on geothermal or electric preheating to mitigate freezing (Danieli et al., 2022; Misevičiūtė et al., 2023). Rajhi et al. e2024) demonstrated a geothermal-assisted TE system achieving an isentropic efficiency of 92 % and a cycle thermal efficiency of 76 %; however, their model lacked economic and exergy performance optimization. In parallel, the Organic Rankine Cycle (ORC) has attracted wide attention as a reliable medium-temperature energy-conversion technology for industrial waste heat (Hacıpaşaoğlu, 2025; Murthy et al., 2024; Zhang et al., 2025). Its flexibility in working-fluid selection (R245fa, R1234yf, isopentane) allows efficient recovery from sources below 250°C, which aligns well with exhaust-gas temperatures in typical urban gas and refining networks (Haghjoo et al., 2022; Sprouse, 2024; Zini et al., 2024). Several experimental and numerical studies integrated ORC units with waste-heat streams from cement kilns (Haghmoradkhani et al., 2025), gas-turbine exhausts (Villalón-López et al., 2024), and steel reheating furnaces (Hejazi and Rafiee, 2021), reporting net conversion efficiencies between 8% and 14 %.
Recently, hybridization strategies combining TEs and ORC subsystems have emerged to exploit both pressure and thermal potentials simultaneously (Astolfi et al., 2018; Damarseckin et al., 2024; Oyewunmi et al., 2017). Colak and Arslan (2024) reported that coupling a TE with an ORC using a regenerative heat exchanger raised the total exergy efficiency by 12 %. Yet most existing designs stop at first-law performance evaluation, rarely addressing the interplay between exergy destruction and cost formation. From a sustainability perspective, considering only energy yields an incomplete picture of system merit (Hadidi, 2024; KARABİBER et al., 2025).
Exergoeconomic analysis, merging exergy and economic viewpoints, quantifies both the thermodynamic and monetary penalties of irreversibilities. Parameters such as the total cost rate and exergy efficiency guide multi-objective optimization toward cost-effective configurations Alayi et al., 2026; Golchoobian et al., 2021; Smaisim et al., 2026). Küçük and Kılıç (2023) applied an exergoeconomic approach to a dual-loop ORC, reducing total product cost by 18 % without sacrificing power. Similarly, Li et al. (2024) introduced a dimensionless hybrid indicator as an effective decision-making criterion. Integrating optimization algorithms such as the Non-Dominated Sorting Genetic Algorithm II (NSGA-II) enables identifying Pareto-optimal solutions balancing efficiency and cost (El Hafdaoui et al., 2025; Ghasemian and Ehyaei, 2018; Sadni et al., 2025; Wang et al., 2024).
Despite notable progress, no comprehensive study has yet performed a thermo-exergoeconomic optimization of an ORC–TE hybrid applied to natural gas pressure reduction or similar waste-heat environments, considering realistic thermophysical properties of natural gas, localized cost data, and detailed irreversibility distributions. Most published models rely on idealized methane-only assumptions, whereas the present study adopts realistic natural gas thermophysical properties representative of regional pipeline conditions to ensure accurate expansion and heat-recovery modeling. Furthermore, few works validate their optimization results through combined first- and second-law consistency checks or sensitivity analyses (Li et al., 2025; Yang et al., 2024).
In addition to thermodynamic and economic criteria, environmental indicators play a crucial role in assessing the sustainability of energy-recovery systems integrated into natural gas pressure reduction stations. In such systems, environmental performance is primarily associated with the extent to which recovered electricity displaces grid-based power generation and its associated CO₂ emissions, making environmental indicators an essential complement to conventional efficiency-based evaluations.
Accordingly, this study employs an environmental performance index as an independent objective to quantify the ecological implications of operating conditions and design choices. By explicitly incorporating this indicator alongside exergy efficiency and total cost rate, the proposed framework enables a balanced evaluation of thermodynamic performance, environmental sustainability, and economic feasibility. This integrated perspective is particularly important for Pressure Reduction Station (PRS) applications, where improvements in energy recovery must be achieved without exacerbating environmental impacts or operational constraints.
System description and thermo-exergoeconomic model
System configuration
The proposed hybrid ORC–TE system is designed to recover energy losses associated with gas throttling in a PRS. In conventional PRSs, high-pressure natural gas is directly expanded through pressure-regulating valves, leading to a significant loss of both physical exergy and available mechanical work. In the present design, this lost potential is recovered via two coupled subsystems that operate simultaneously within the PRS boundaries, as depicted in Figure 1.
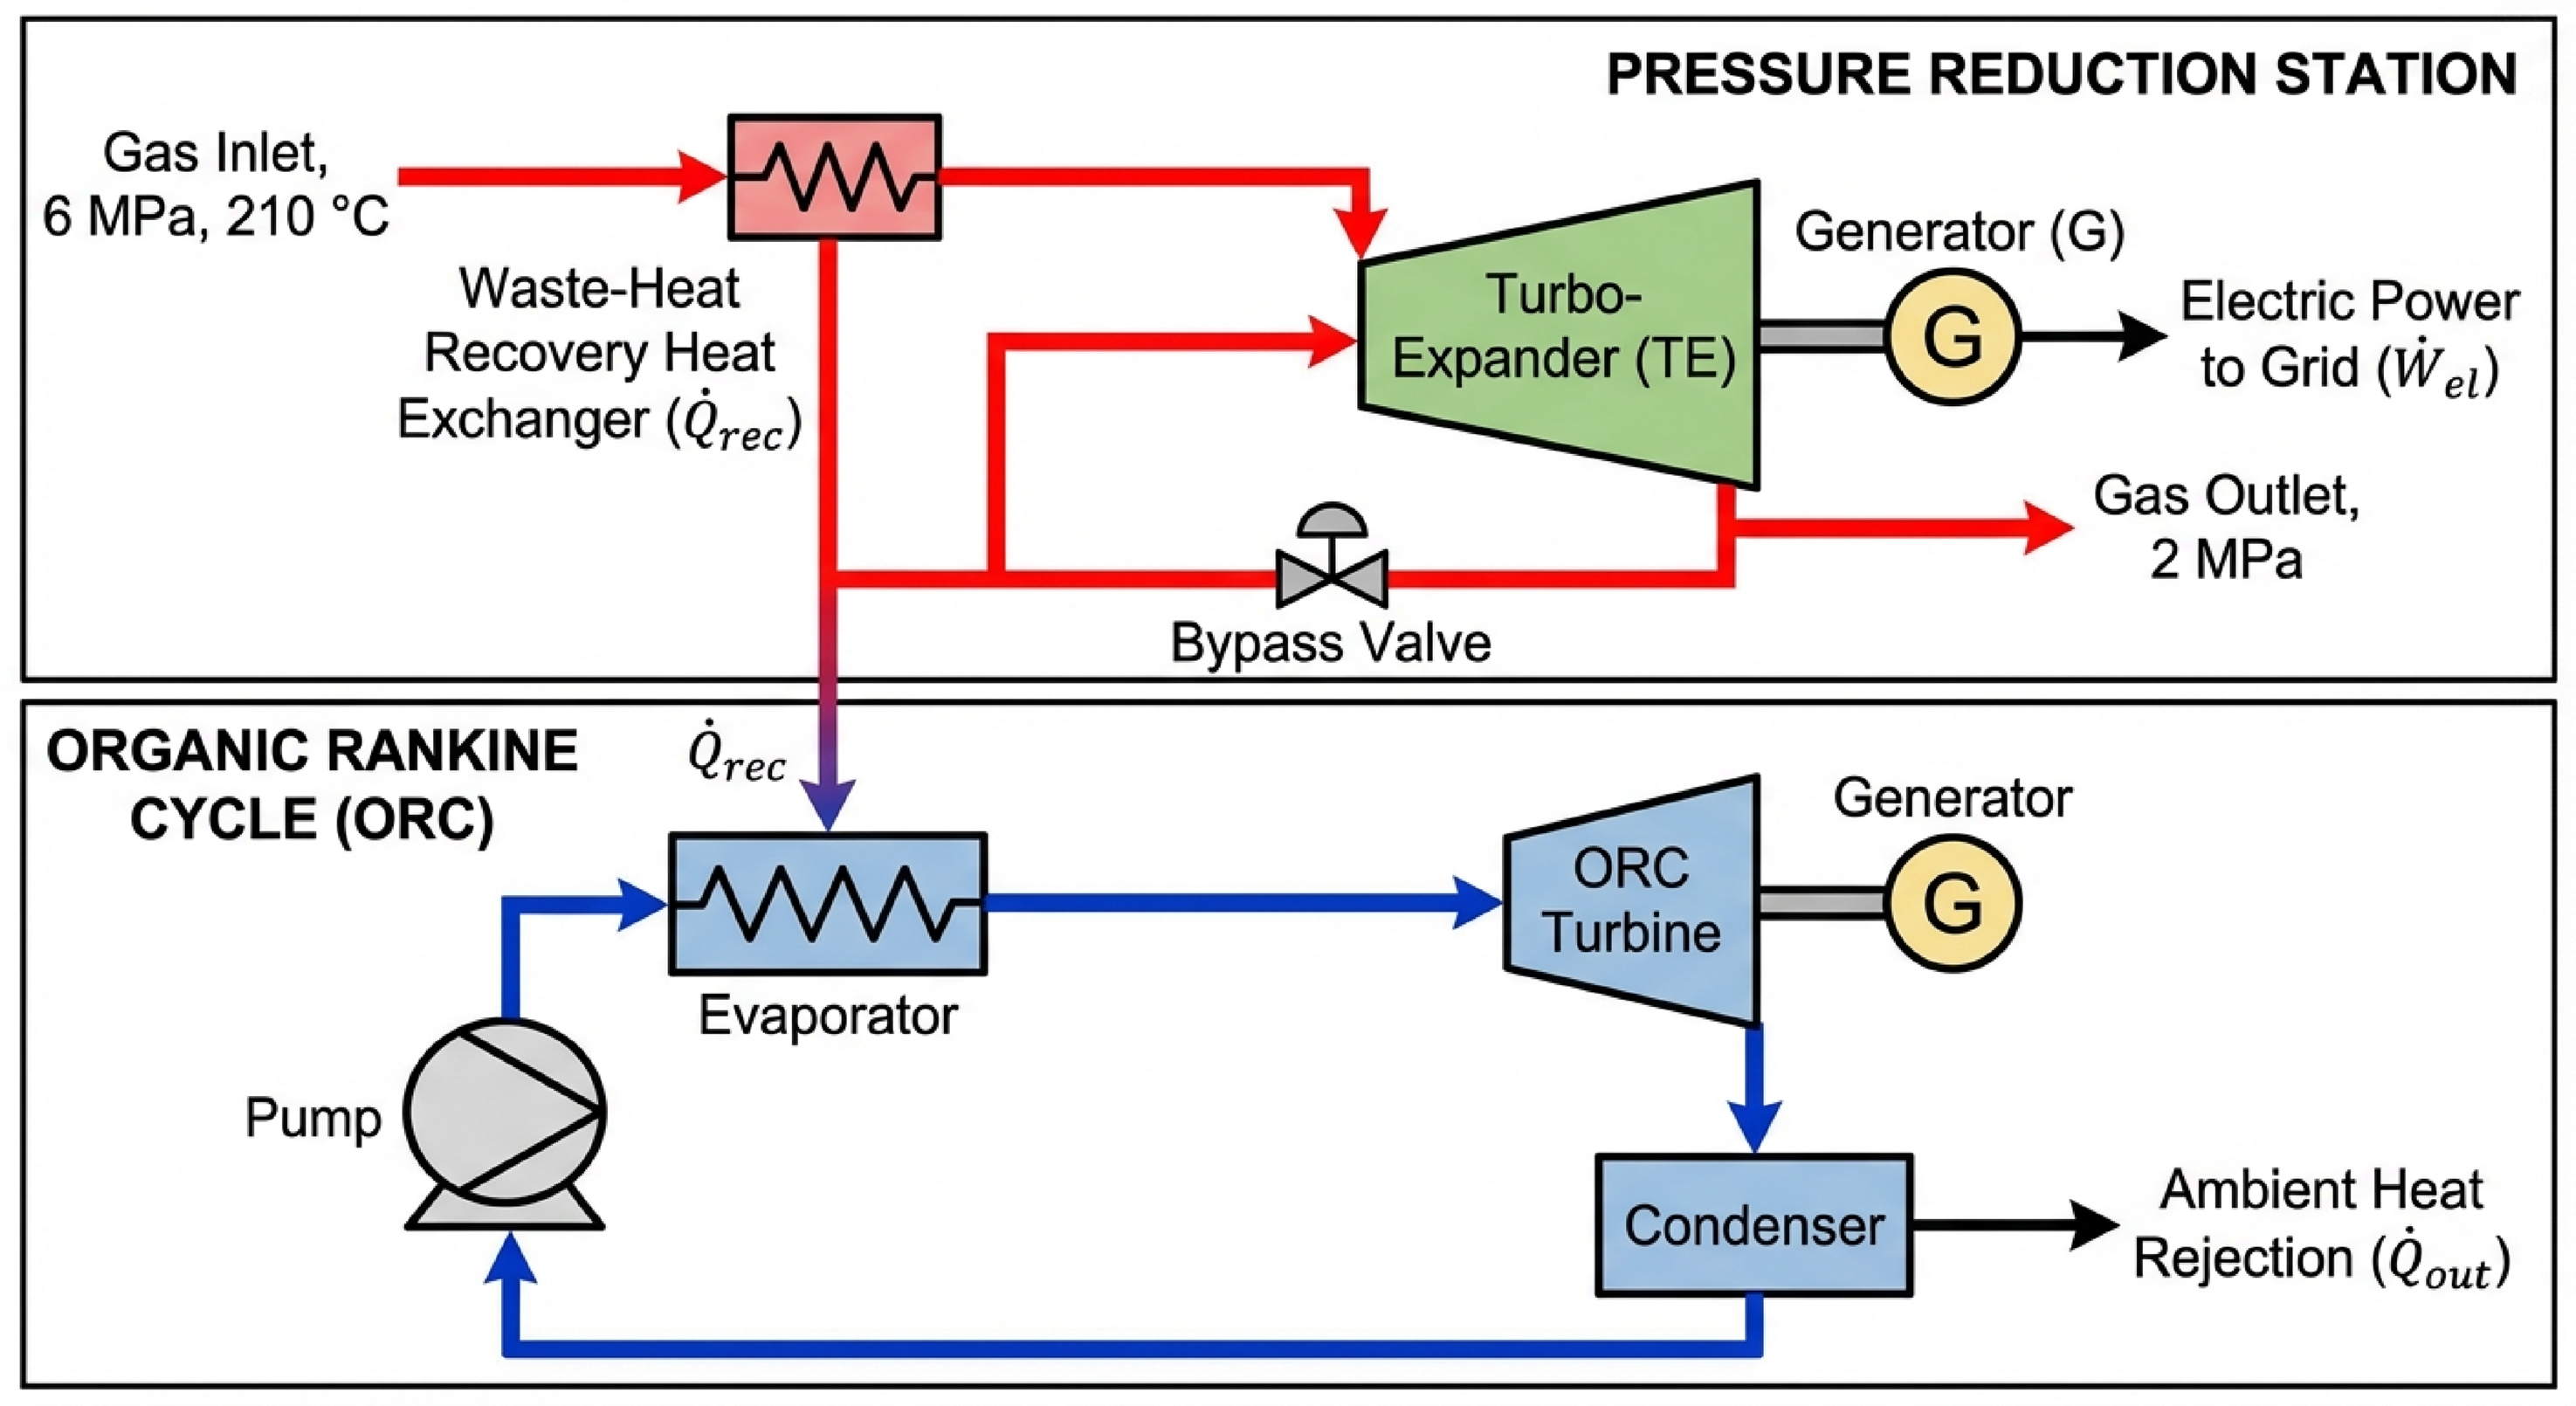
Schematic configuration of the hybrid ORC–TE system integrated into an NGPRS. NGPRS: Natural Gas Pressure Reduction Station; ORC–TE: Organic Rankine Cycle–Turboexpander.
The first subsystem—the TE module—converts the pressure exergy of natural gas into mechanical power. Compressed gas at an inlet pressure of 6 MPa and temperature of 210 °C is expanded to 2 MPa, producing shaft work , which is coupled to an electric generator. The TE unit is equipped with a bypass line that ensures stable downstream pressure during low-load or maintenance conditions, maintaining safe PRS operation.
The second subsystem—the ORC—recovers thermal energy from the same high-pressure gas stream before expansion. As shown in the orange Waste-Heat Recovery Zone inside the PRS, a waste-heat exchanger (WHX) transfers heat from the hot gas to the ORC working fluid (R245fa). The vaporized fluid drives the ORC turbine, generating additional power, after which it is condensed and pumped back to the evaporator, completing a closed loop. The condenser releases residual heat to the ambient, as represented by the blue arrow (“Ambient Heat Rejection”). Both turbines (TE and ORC) are mechanically connected to a shared generator, represented by the green power line leading to the grid. Thus, the hybrid configuration simultaneously exploits (i) the pressure drop potential and (ii) the industrial-waste-heat content of the high-pressure gas stream—maximizing overall energy utilization without altering the PRS's primary gas-delivery function. Two key energy-interaction zones are identified within the system:
1. Waste-Heat Recovery Zone—located in the upper-left area of the PRS, where thermal energy is harvested by the WHX to drive the ORC. 2. Power-Generation Zone—comprising the turboexpander and ORC turbine, which convert mechanical and thermodynamic potentials into electrical power delivered to the grid.
All thermodynamic and exergy relations were implemented and solved using a hybrid numerical platform. Parametric relations and optimization steps were coded in MATLAB (R2023b), whereas thermophysical property calculations and fluid state evaluations were carried out in the Engineering Equation Solver (EES, v12.0). The coupling of MATLAB and EES ensured both computational accuracy and flexibility during the parametric and optimization analyses. The resulting layout forms an integrated energy-recovery module that can be retrofitted into existing PRSs. This design eliminates exergy destruction at the throttling stage and provides a sustainable source of electricity with minimal structural modification to the gas network.
Thermodynamic and environmental modeling
The hybrid ORC–TE configuration inside a PRS is modeled under steady-state conditions to evaluate its thermodynamic, exergy, and environmental behavior.
Turboexpander energy model
The shaft power of the turboexpander depends directly on inlet temperature, pressure ratio, and isentropic efficiency as shown in equation (1) (Li et al., 2025; Yang et al., 2024).

Using equation (2), the real outlet enthalpy is corrected from the isentropic value:

ORC subsystem
The ORC side receives the recovered heat from the WHX and converts it into electrical output according to equations (3) to (6) (Li et al., 2025; Yang et al., 2024).


Heat-recovery interface (WHX)
The recovered heat from the gas stream exchanged to the organic fluid is determined by equation (7), while the effectiveness of the exchanger is given by equation (8):


Energy efficiency
Overall energetic performance combines both TE and ORC contributions as described in equation (9) (Li et al., 2025; Yang et al., 2024):

Exergy relations
The total flow exergy at each state is defined in equation (10), while exergy destruction of component i is estimated through equation (11) (Ashwni and Sherwani., 2023; Li et al., 2025).


The contributions of heat and work exergy terms appear in equation (12):

Applying the total exergy balance yields the second-law efficiency (equation (13)):

Environmental assessment
The exergy-environmental parameters—exergy destruction ratio (EDR), avoided CO₂ rate, and environmental performance index (EPI)—are defined, respectively, in equations (14) to (16) (Li et al., 2024):


It should be emphasized that the EPI in this study strictly quantifies avoided CO₂ emissions per unit of useful electrical energy and is not intended to directly represent entropy generation or irreversibility.
Thermo–environmental synergy indicator
To couple energetic, exergy, and ecological aspects, the dimensionless composite indicator Ψenv is formulated in equation (17):

Derived environmental expressions
The empirical relations given in equations (18) and (19) are introduced solely for postprocessing purposes, aiming to linearize and correlate the system outputs for sensitivity and comparative analyses. These expressions are obtained through regression fitting of the simulation data generated over the investigated operating range and do not affect the core thermodynamic, exergy, or exergoeconomic formulations of the model. Similar postprocessing correlations have been widely adopted in ORC-based energy-recovery studies to facilitate parametric interpretation and visualization of performance trends (Haghjoo et al., 2022):


Exergoeconomic model
To integrate the thermodynamic and cost aspects of the hybrid ORC–TE system, an exergoeconomic formulation is developed. Each component is treated as a steady-state control volume considering the balance between cost flows and exergy flows (equation (20)) (Li et al., 2024; Küçük and Kılıç, 2023).

Cost flow based on exergy
For a given stream i, the unit cost of exergy is

The cost of a heat transfer at temperature T is related to the cost of fuel exergy (equation (22)):

Similarly, the cost rate of shaft work (for turbines and pumps) is (equation (23)):

Capital and O&M cost rates
The total rate of investment plus maintenance costs for each component k is formulated as (equation (24)):


Component-wise exergoeconomic balances
The detailed expressions of equation (21) for each element of the hybrid configuration are:
TE:

ORC turbine and pump:


WHX:

Key exergoeconomic indicators
Three dimensionless and unitary indicators quantify the exergoeconomic behavior of components and system:
Exergoeconomic factor — equation (29a):

which measures the share of investment in the overall cost input of component k. Cost per unit of produced work— equation (29b):

Relative cost difference

It is worth noting that the total cost rate (
Optimization framework
To determine the optimal thermodynamic–environmental–economic performance of the proposed hybrid ORC–TE system, a multi-objective genetic algorithm based on the NSGA-II is employed. This optimization routine simultaneously maximizes the overall exergy efficiency and the environmental index, while minimizing the total exergoeconomic cost rate defined in equation (32).
Objective functions
The multi-objective optimization is formulated to simultaneously maximize thermodynamic efficiency, enhance CO₂-based environmental performance, and minimize economic cost. Accordingly, the objective functions are defined as:


These objectives are evaluated simultaneously to identify Pareto-optimal solutions representing the tradeoff among energy, environment, and cost criteria.
Decision variables
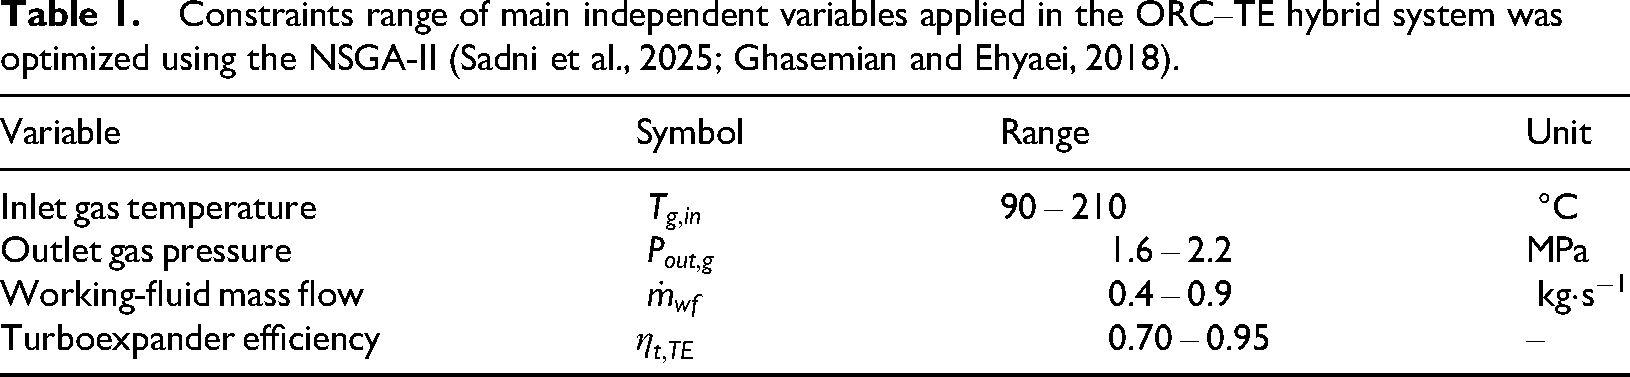
The system optimization includes four key design/operational variables:

Constraints range of main independent variables applied in the ORC–TE hybrid system was optimized using the NSGA-II (Sadni et al., 2025; Ghasemian and Ehyaei, 2018).
Results and discussion
Model validation
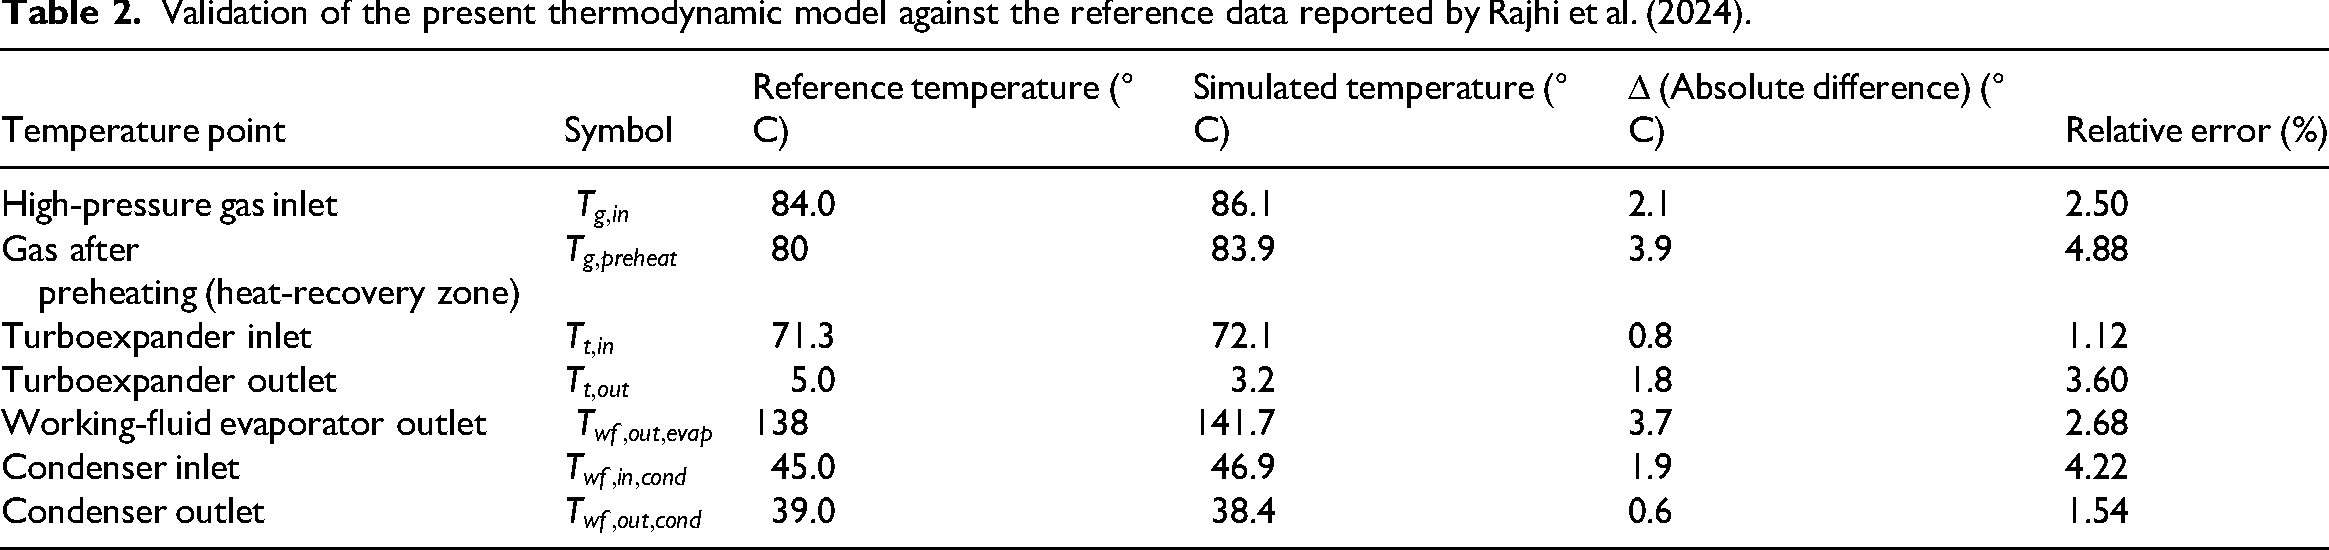
The reconstructed temperature profile across the main components of the ORC–TE hybrid system was benchmarked against the experimental thermodynamic data reported by Rajhi et al. (2024). As summarized in Table 2, the simulated temperatures exhibit excellent agreement with the reference dataset, with the maximum deviation limited to 4.9%. This consistency verifies that the implemented mathematical model accurately captures the energy exchange and flow behavior of the PRS-integrated ORC–TE configuration. For validation, the following criteria were employed:

Validation of the present thermodynamic model against the reference data reported by Rajhi et al. (2024).
Parametric analysis and sensitivity study
This section evaluates the impact of the most influential operating parameters on the thermodynamic, environmental, and exergoeconomic performance of the ORC–TE combined cycle. The validated baseline configuration (equation (36)) is used as a reference.
Methodology and simulation domain
A systematic approach was adopted for all parametric analyses to comprehensively evaluate the impact of influential operating and design parameters on the ORC–TE system's performance. The methodology involved defining a specific simulation domain for each variable, where parameters were varied incrementally across their practical ranges, constituting the “sampling mesh.” This ensures a thorough exploration of the system's behavior under different conditions. The entire parametric simulation procedure, including the input loops for varying independent variables and the subsequent extraction of relevant outputs (thermodynamic, environmental, and exergoeconomic indicators), is schematically presented in Figure 2.
Flowchart of the systematic parametric simulation procedure employed for evaluating the ORC–TE system performance. ORC–TE: Organic Rankine Cycle–Turboexpander.
Effect of inlet gas temperature
Figure 3 presents the variation of generated power and thermal efficiency with respect to the gas inlet temperature, illustrating the combined thermal power performance of the hybrid ORC–TE system under varying inlet conditions. Figure 4 demonstrates the influence of the heat exchange rate on the overall thermal efficiency, clarifying the effect of heat input on system energetic behavior. Finally, Figure 5 provides the normalized trends of the exergy efficiency, EPI, and total cost rate as functions of the gas inlet temperature, thereby enabling thermo-economic and environmental comparison under varying operating conditions within the studied range.
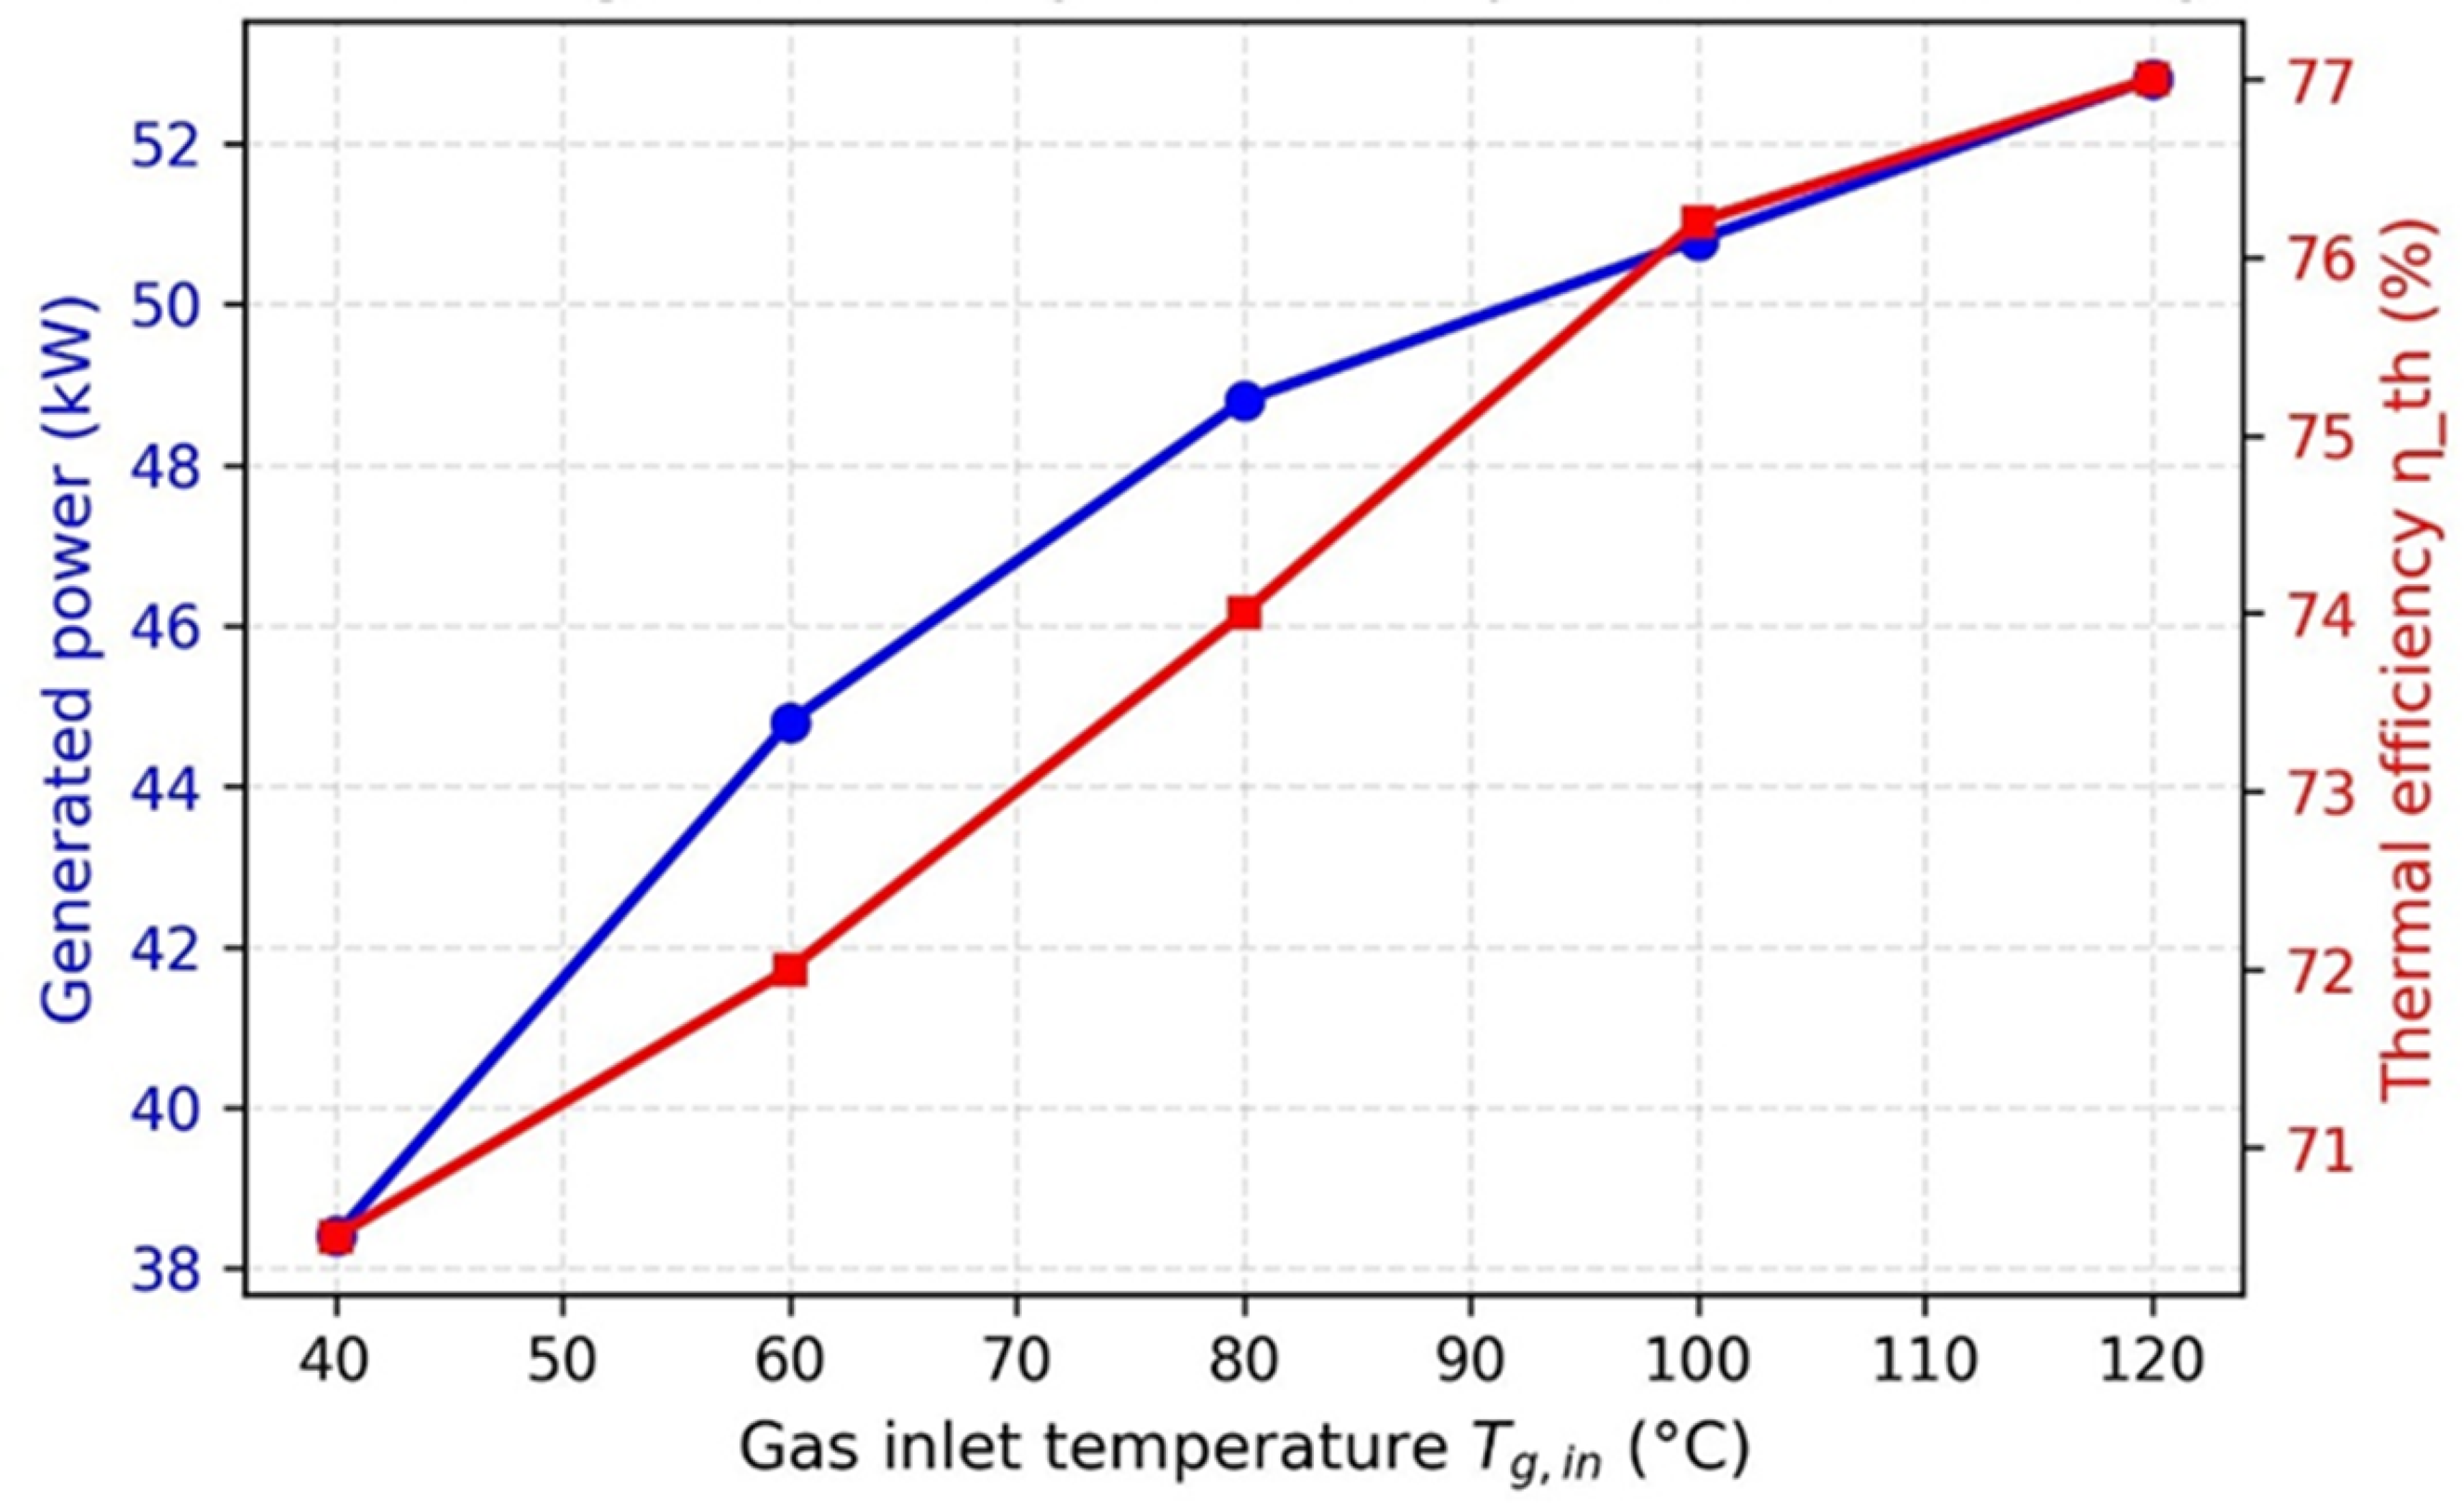
Variation of generated power and thermal efficiency with gas inlet temperature.

Effect of supplied heat rate on thermal efficiency.
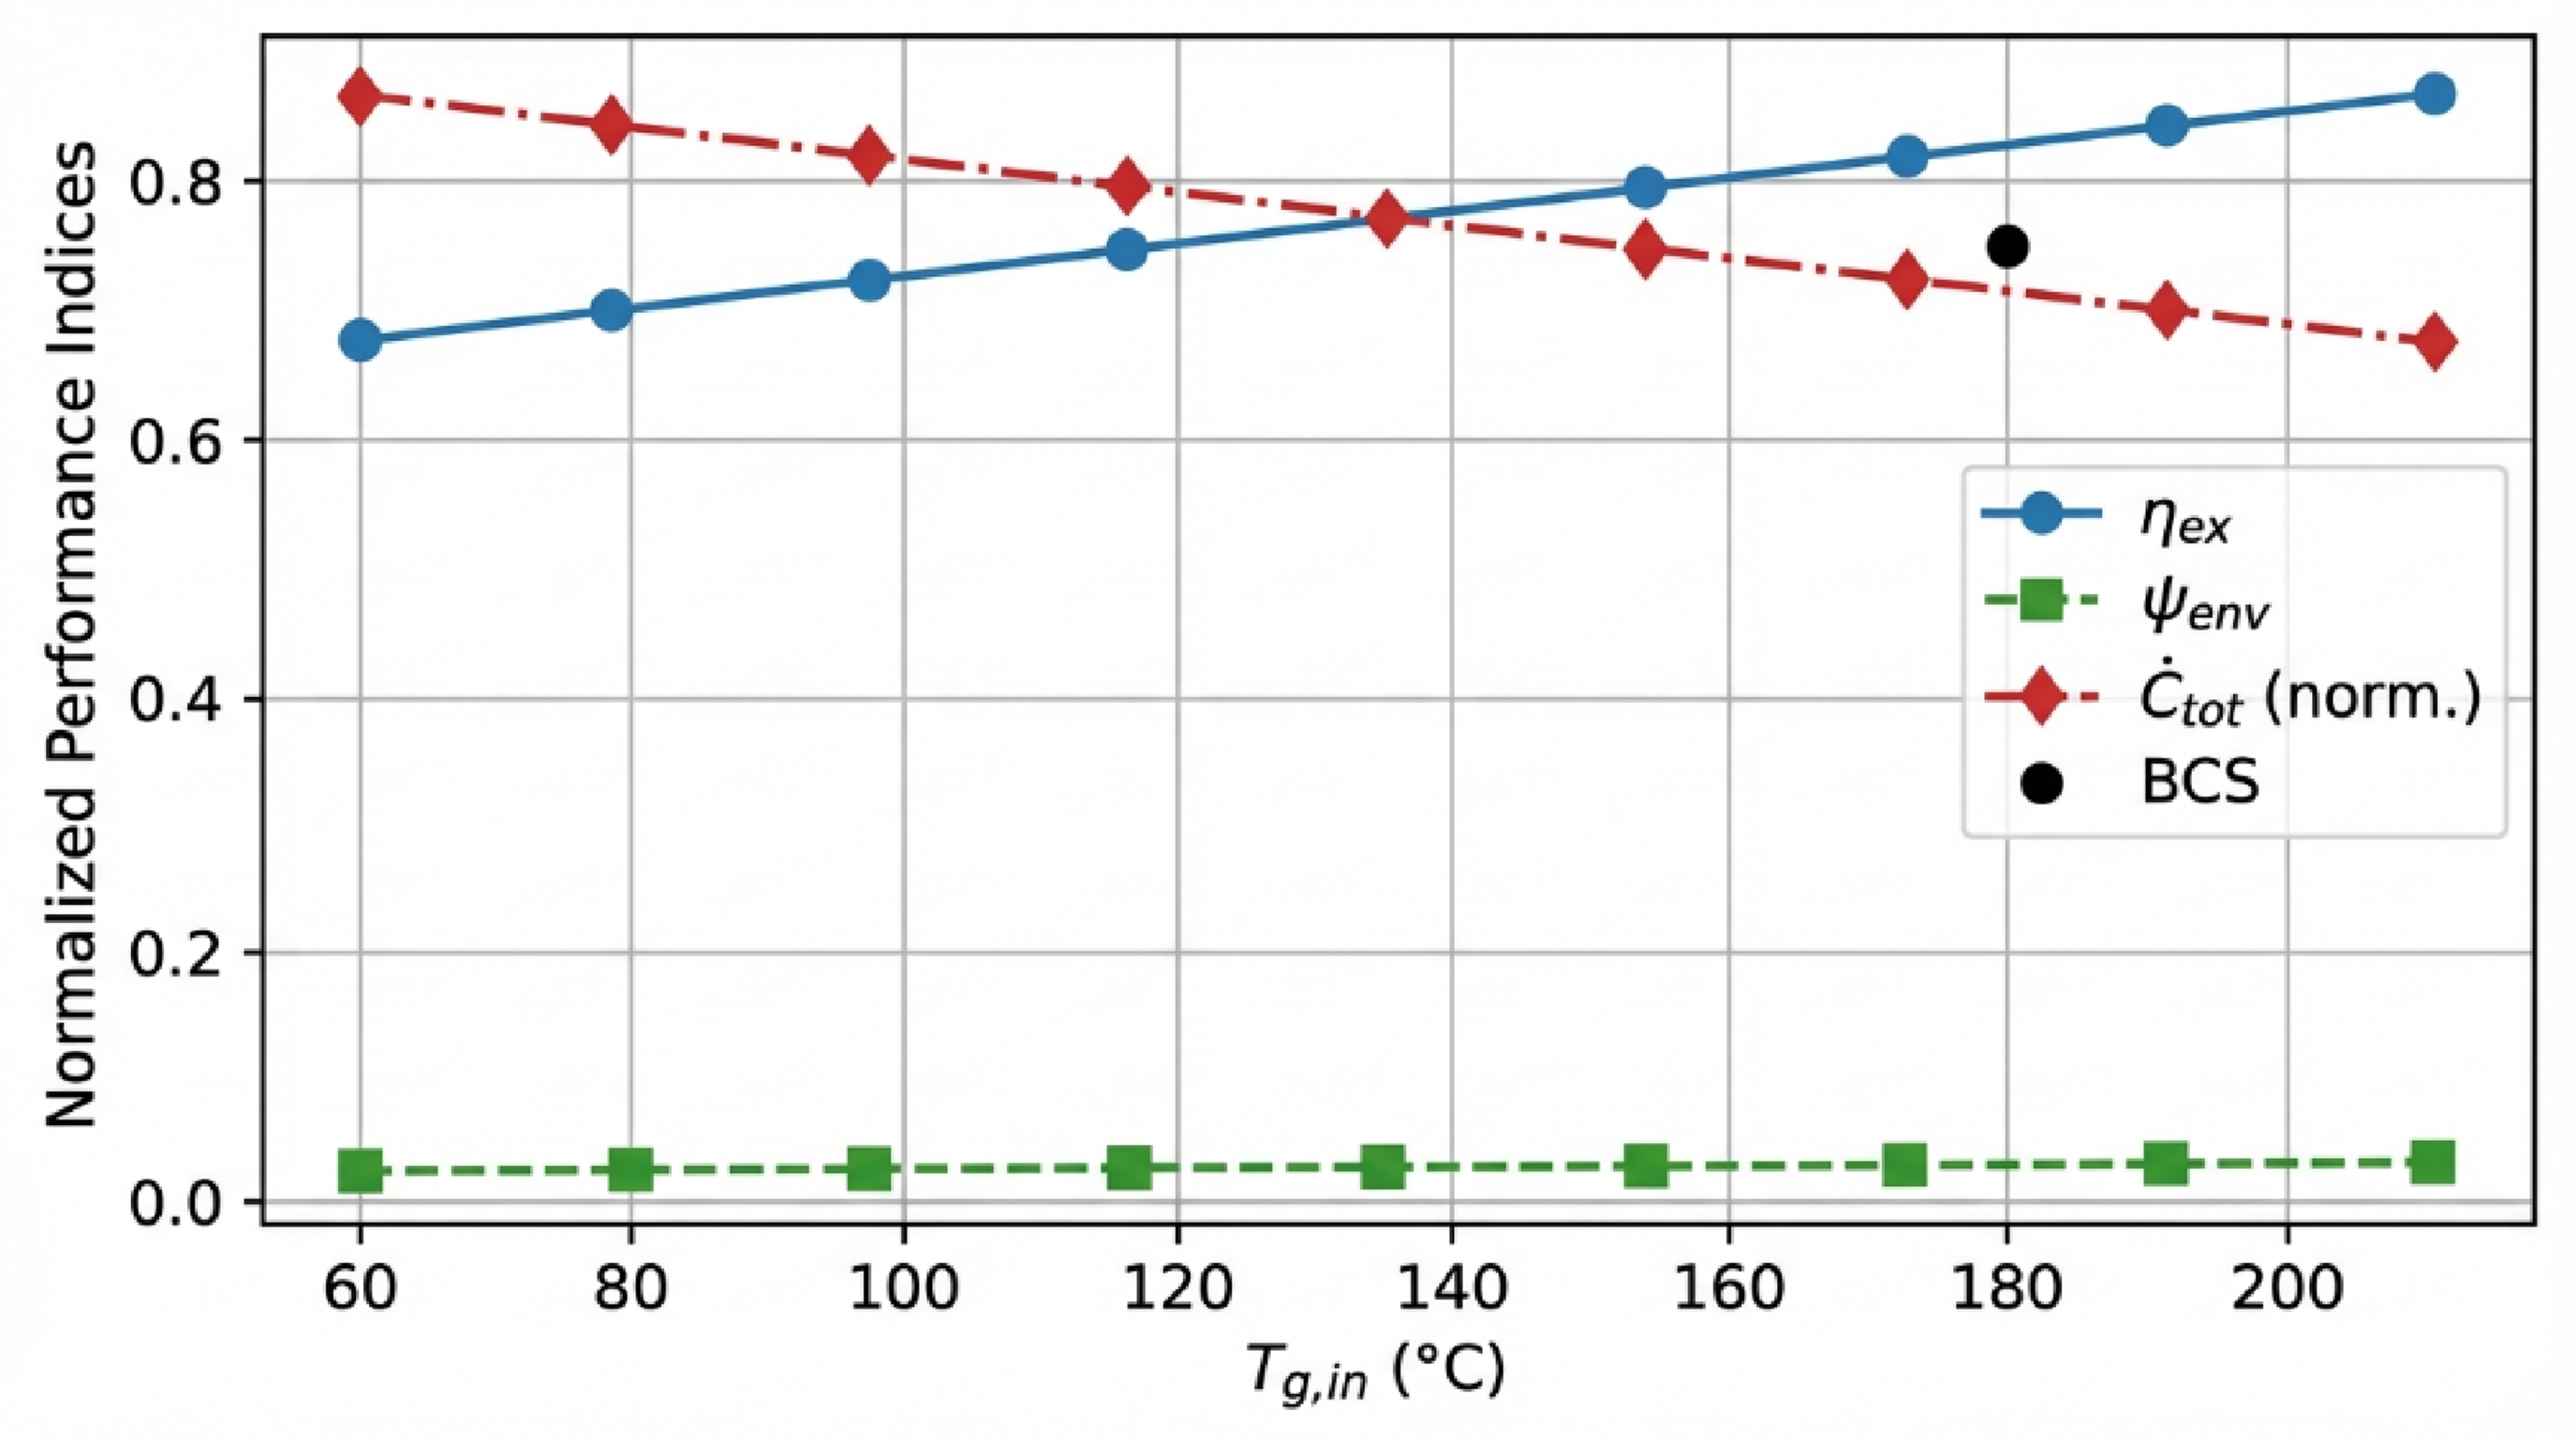
Normalized parametric trends of exergy efficiency, environmental performance index(EPI), and total cost rate versus gas inlet temperature.
According to Figures 3, 4, and 5, raising the gas inlet temperature markedly enhances the system's output and efficiency. The generated power increases almost linearly from 38 to 52 kW, and thermal efficiency rises from 71 % to 77 %, indicating strong thermal sensitivity to inlet temperature. Similarly, higher heat exchange rates intensify the thermal efficiency up to about 76 %, although improvements diminish beyond 150 kJ/kg due to thermal saturation. The exergy performance analysis (Figure 5) confirms parallel behavior—exergy efficiency and the normalized cost rate improve with increasing gas inlet temperature, while the environmental parameter remains nearly constant. Altogether, these results demonstrate that elevating the gas inlet temperature and optimizing the supplied heat substantially improve both the energy and economic performance without introducing significant environmental drawbacks.
Effect of turboexpander isentropic efficiency
Figure 6 presents the correlation between the exergy efficiency and the turbine isentropic efficiency, highlighting how the turbine performance directly shapes the exergy utilization in the ORC–TE hybrid system. Figure 7 illustrates the variation of the EPI and EDR as functions of the turbine isentropic efficiency, thus enabling a comparative insight into sustainability and irreversibility behavior. Figure 8 shows the dependency of the total cost rate on the turbine isentropic efficiency, linking thermodynamic improvement to the economic perspective.
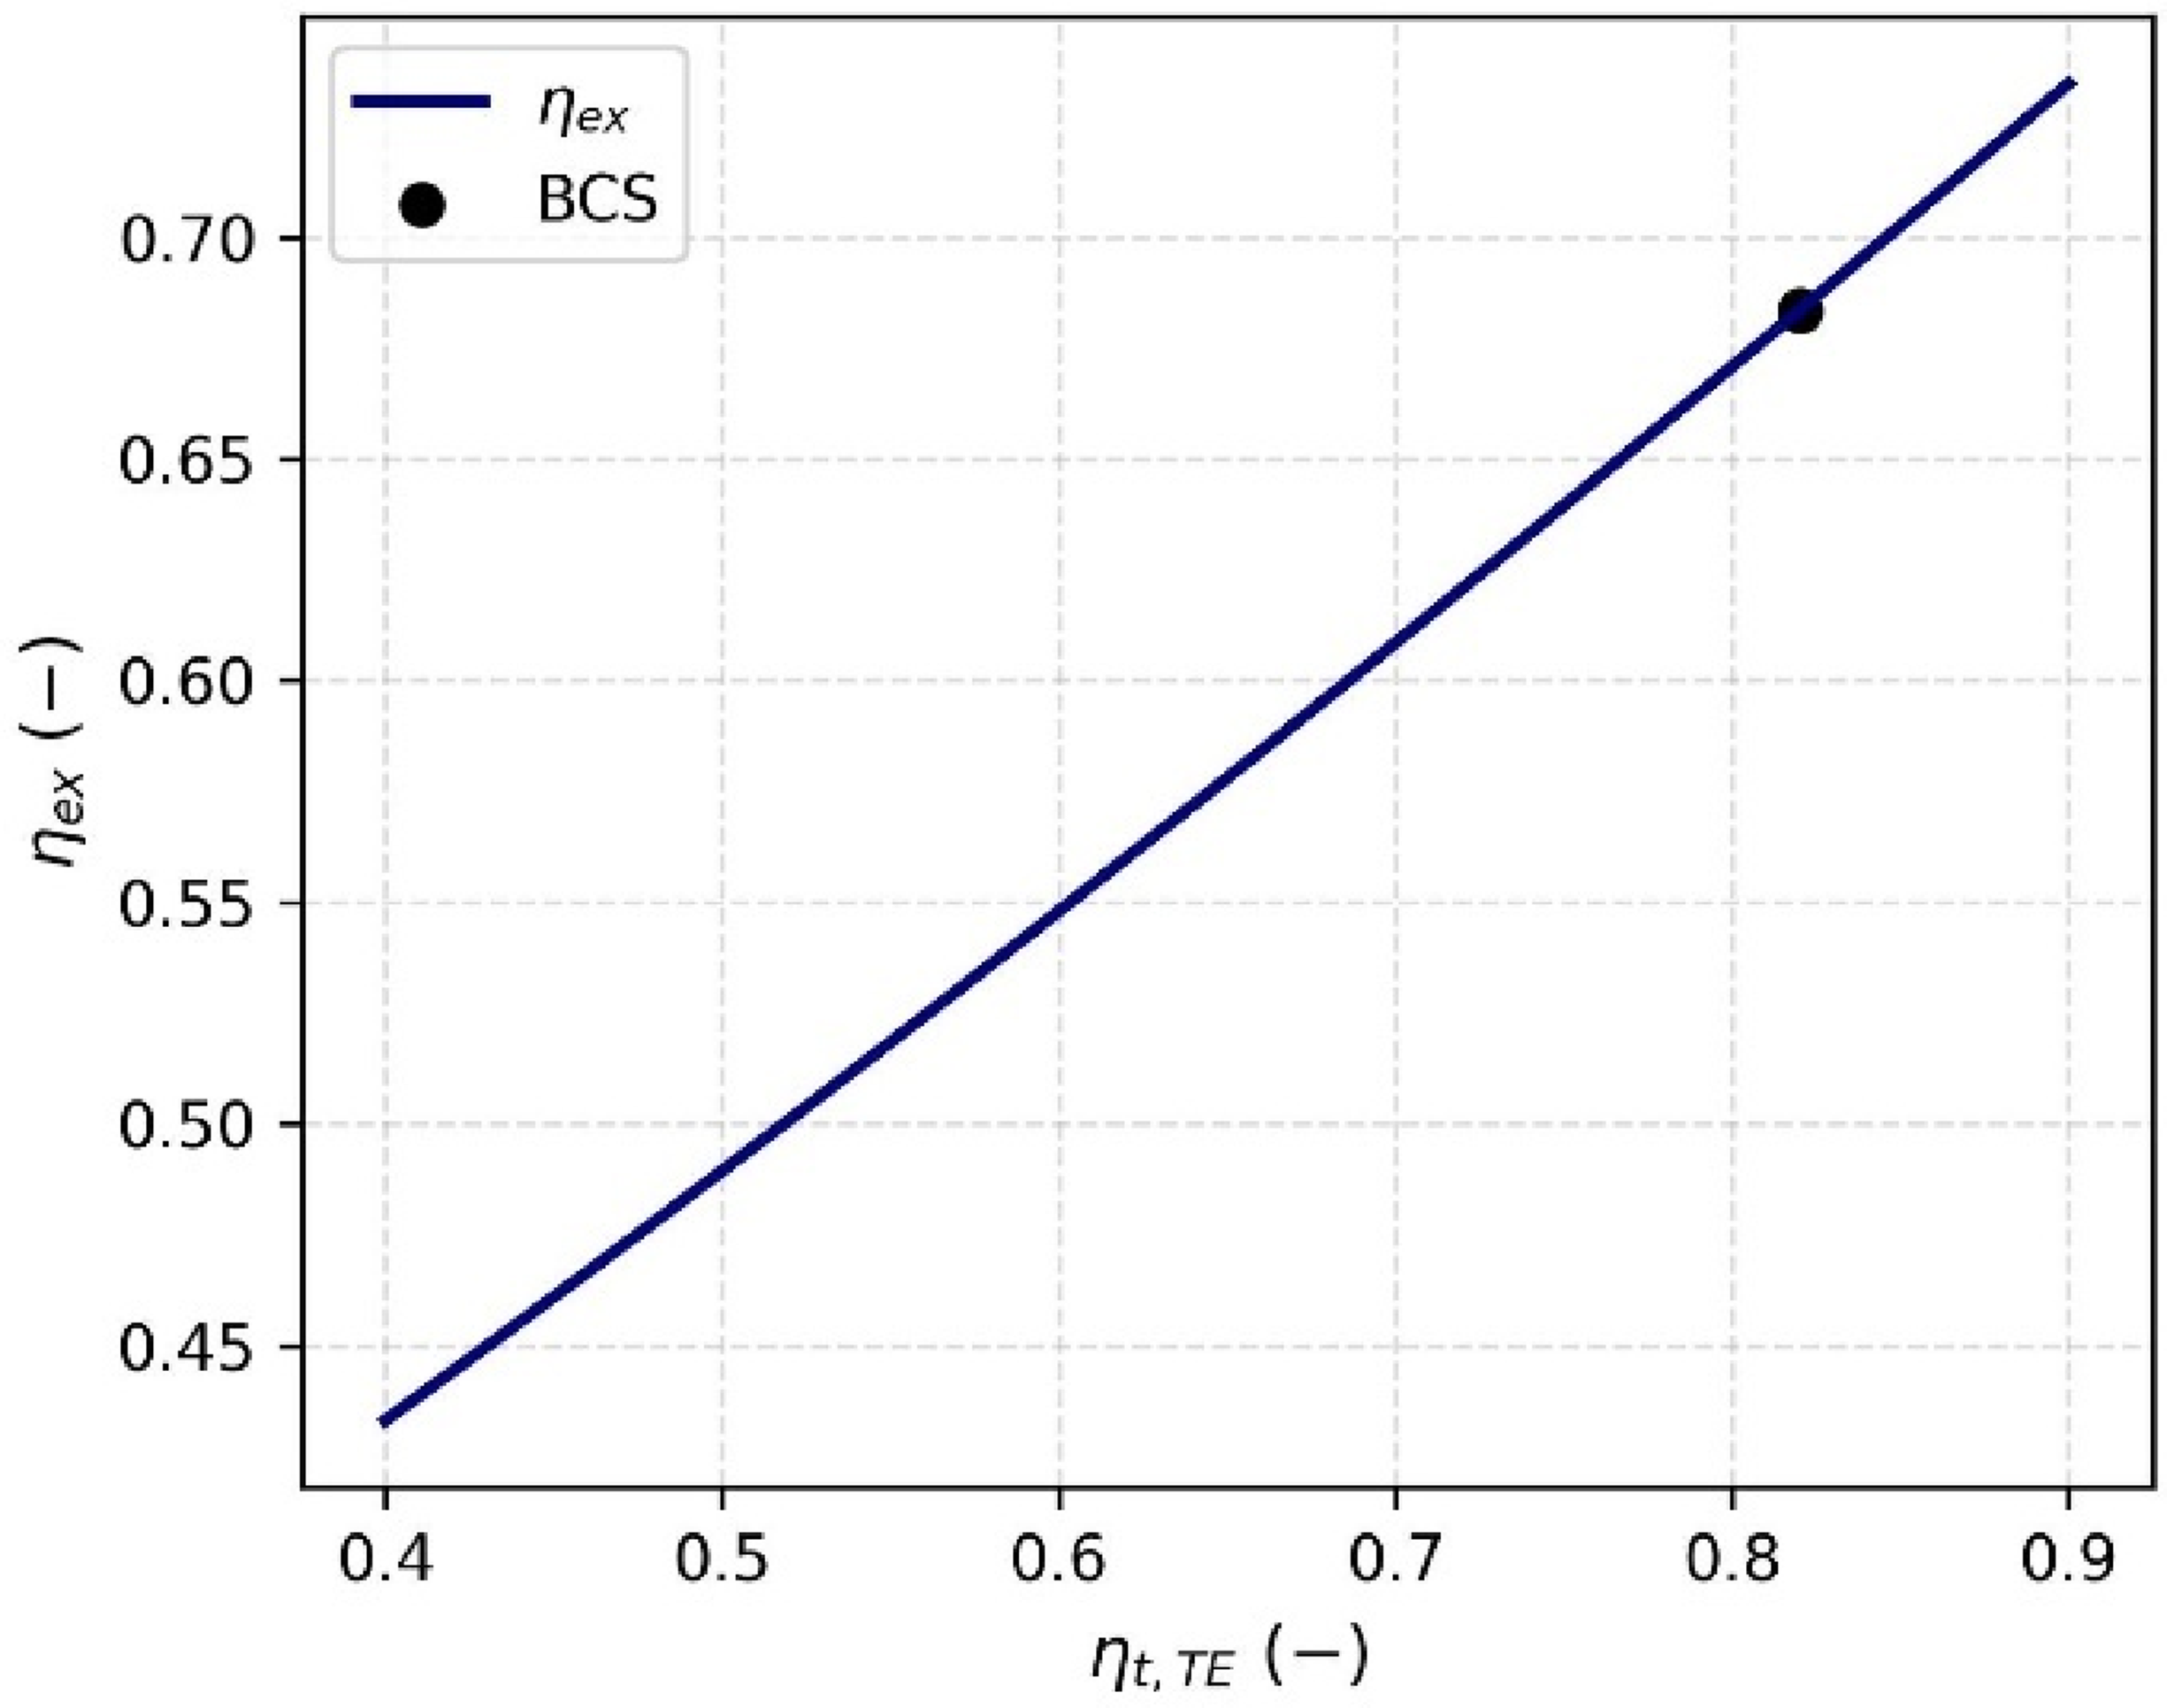
Variation of exergy efficiency with turbine isentropic efficiency.
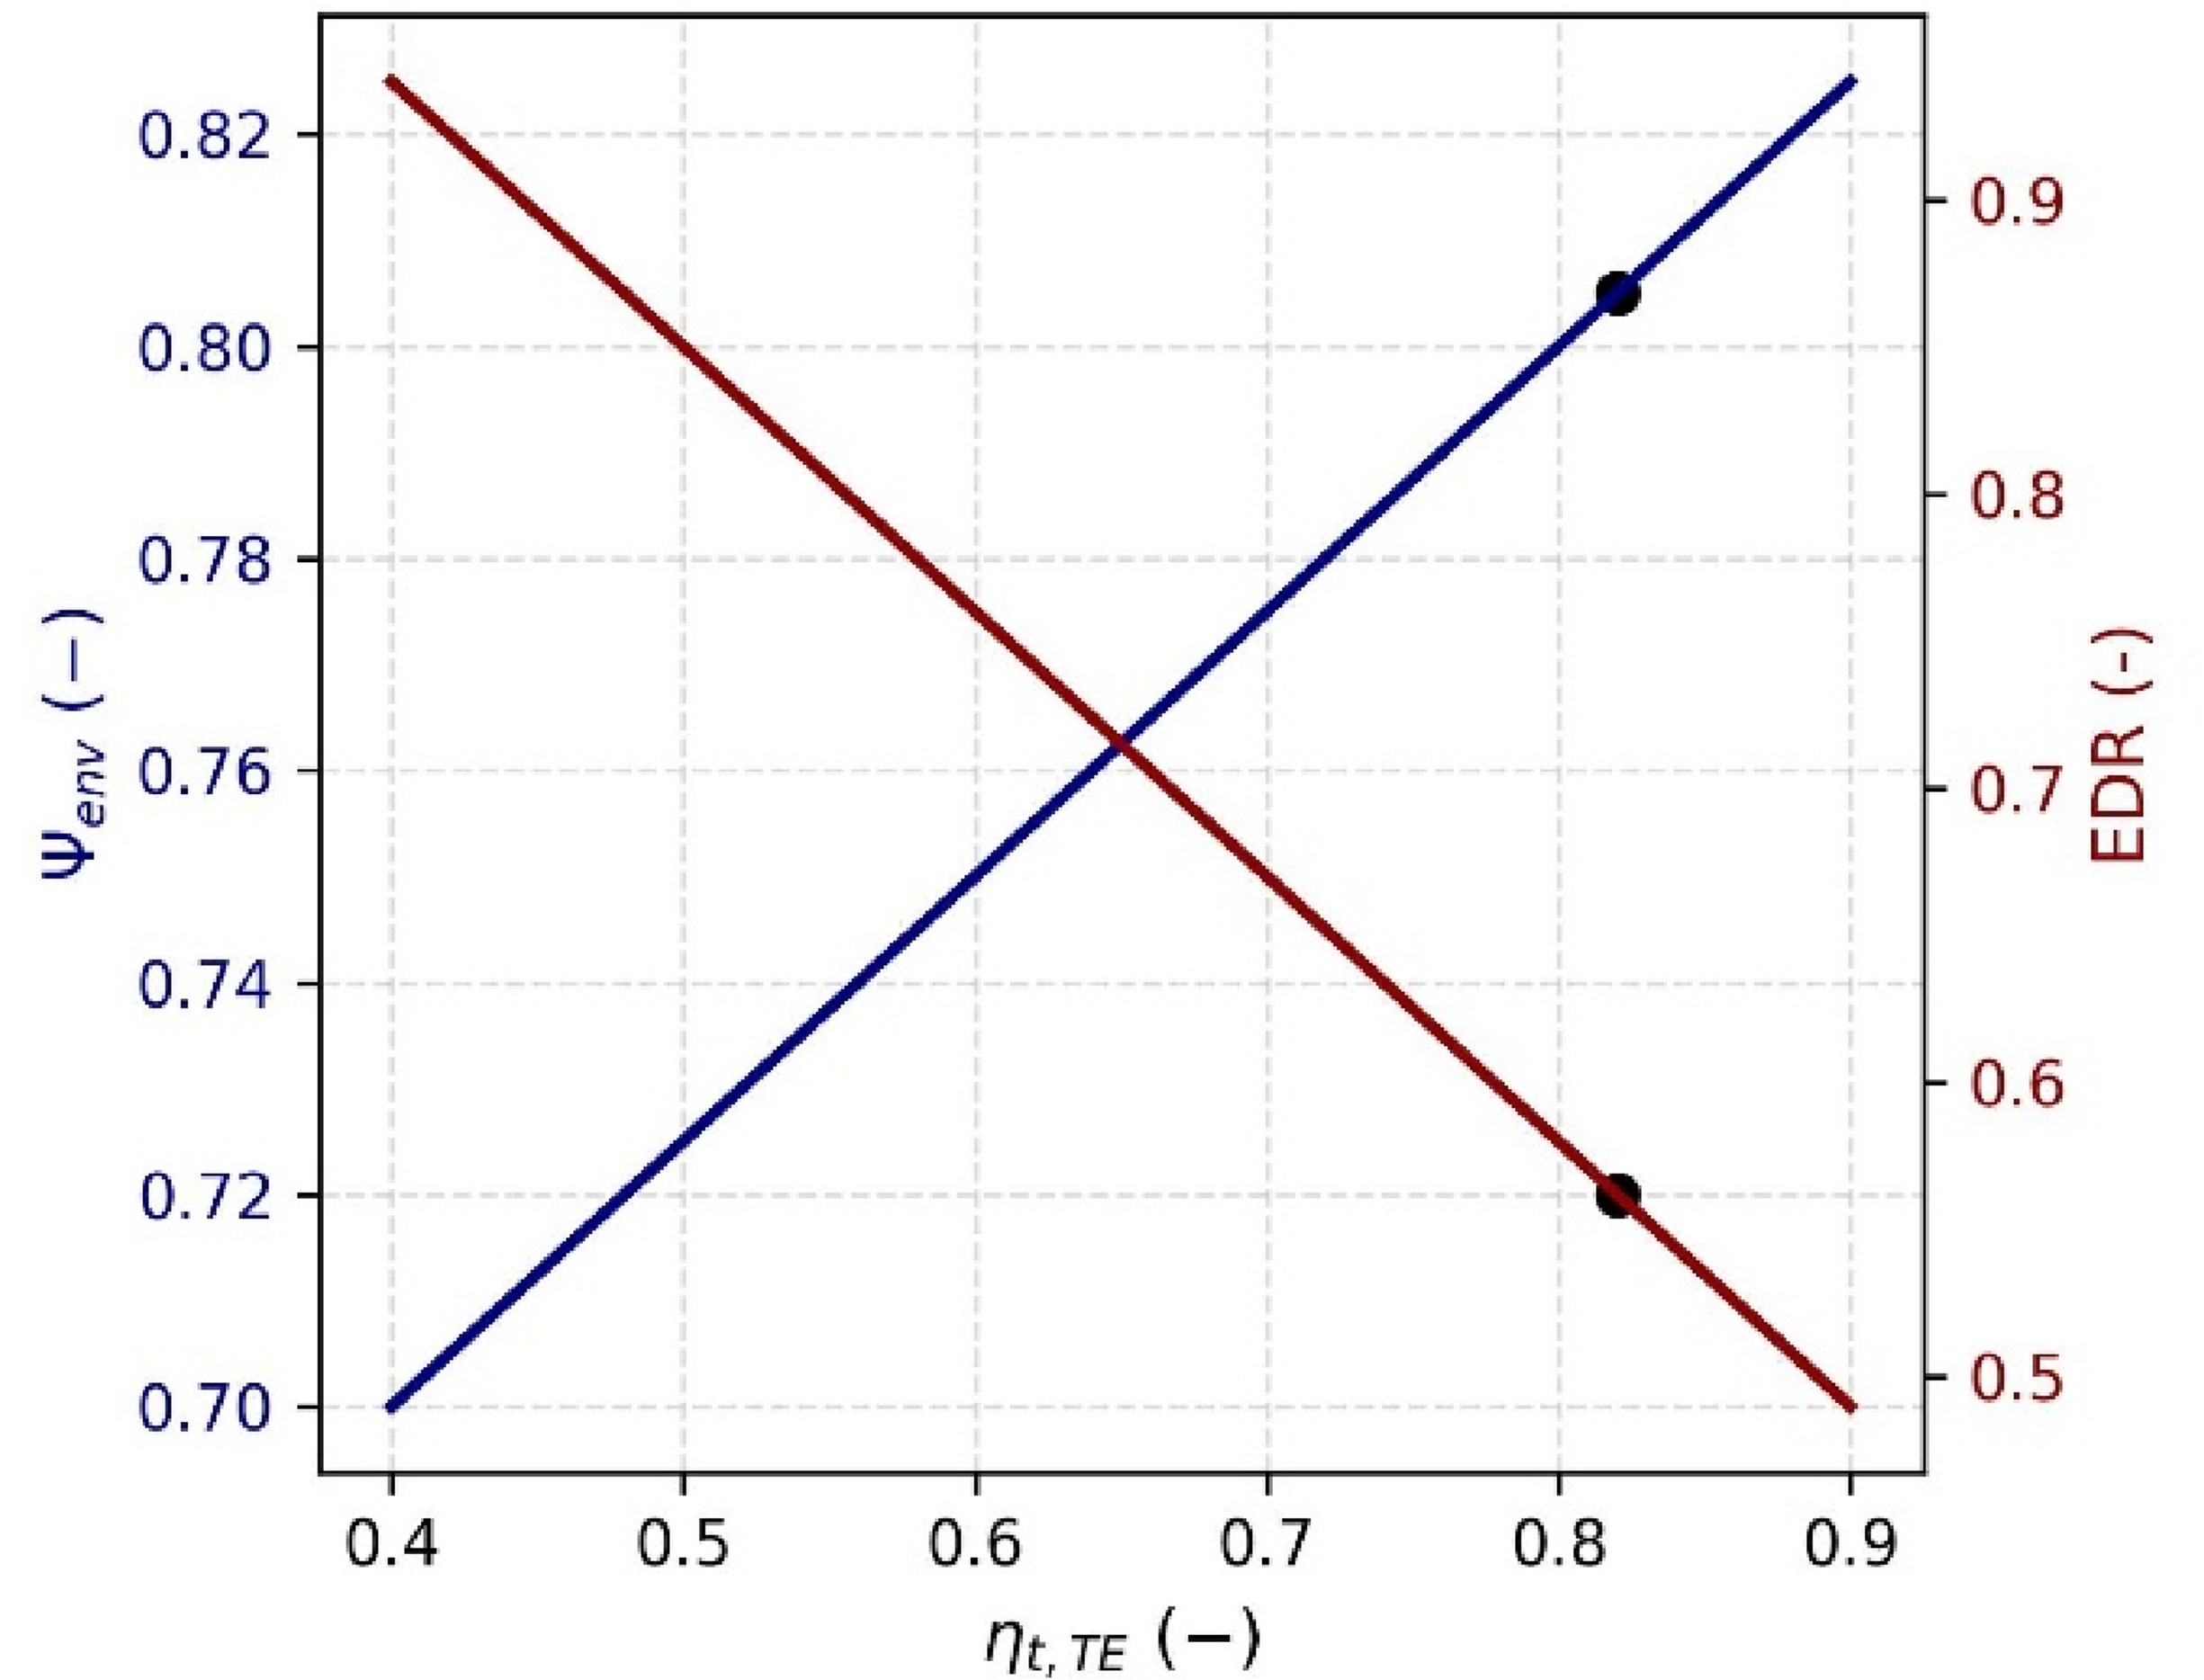
Effect of the turbine isentropic efficiency on the EPI and EDR. EDR: exergy destruction ratio; EPI: environmental performance index
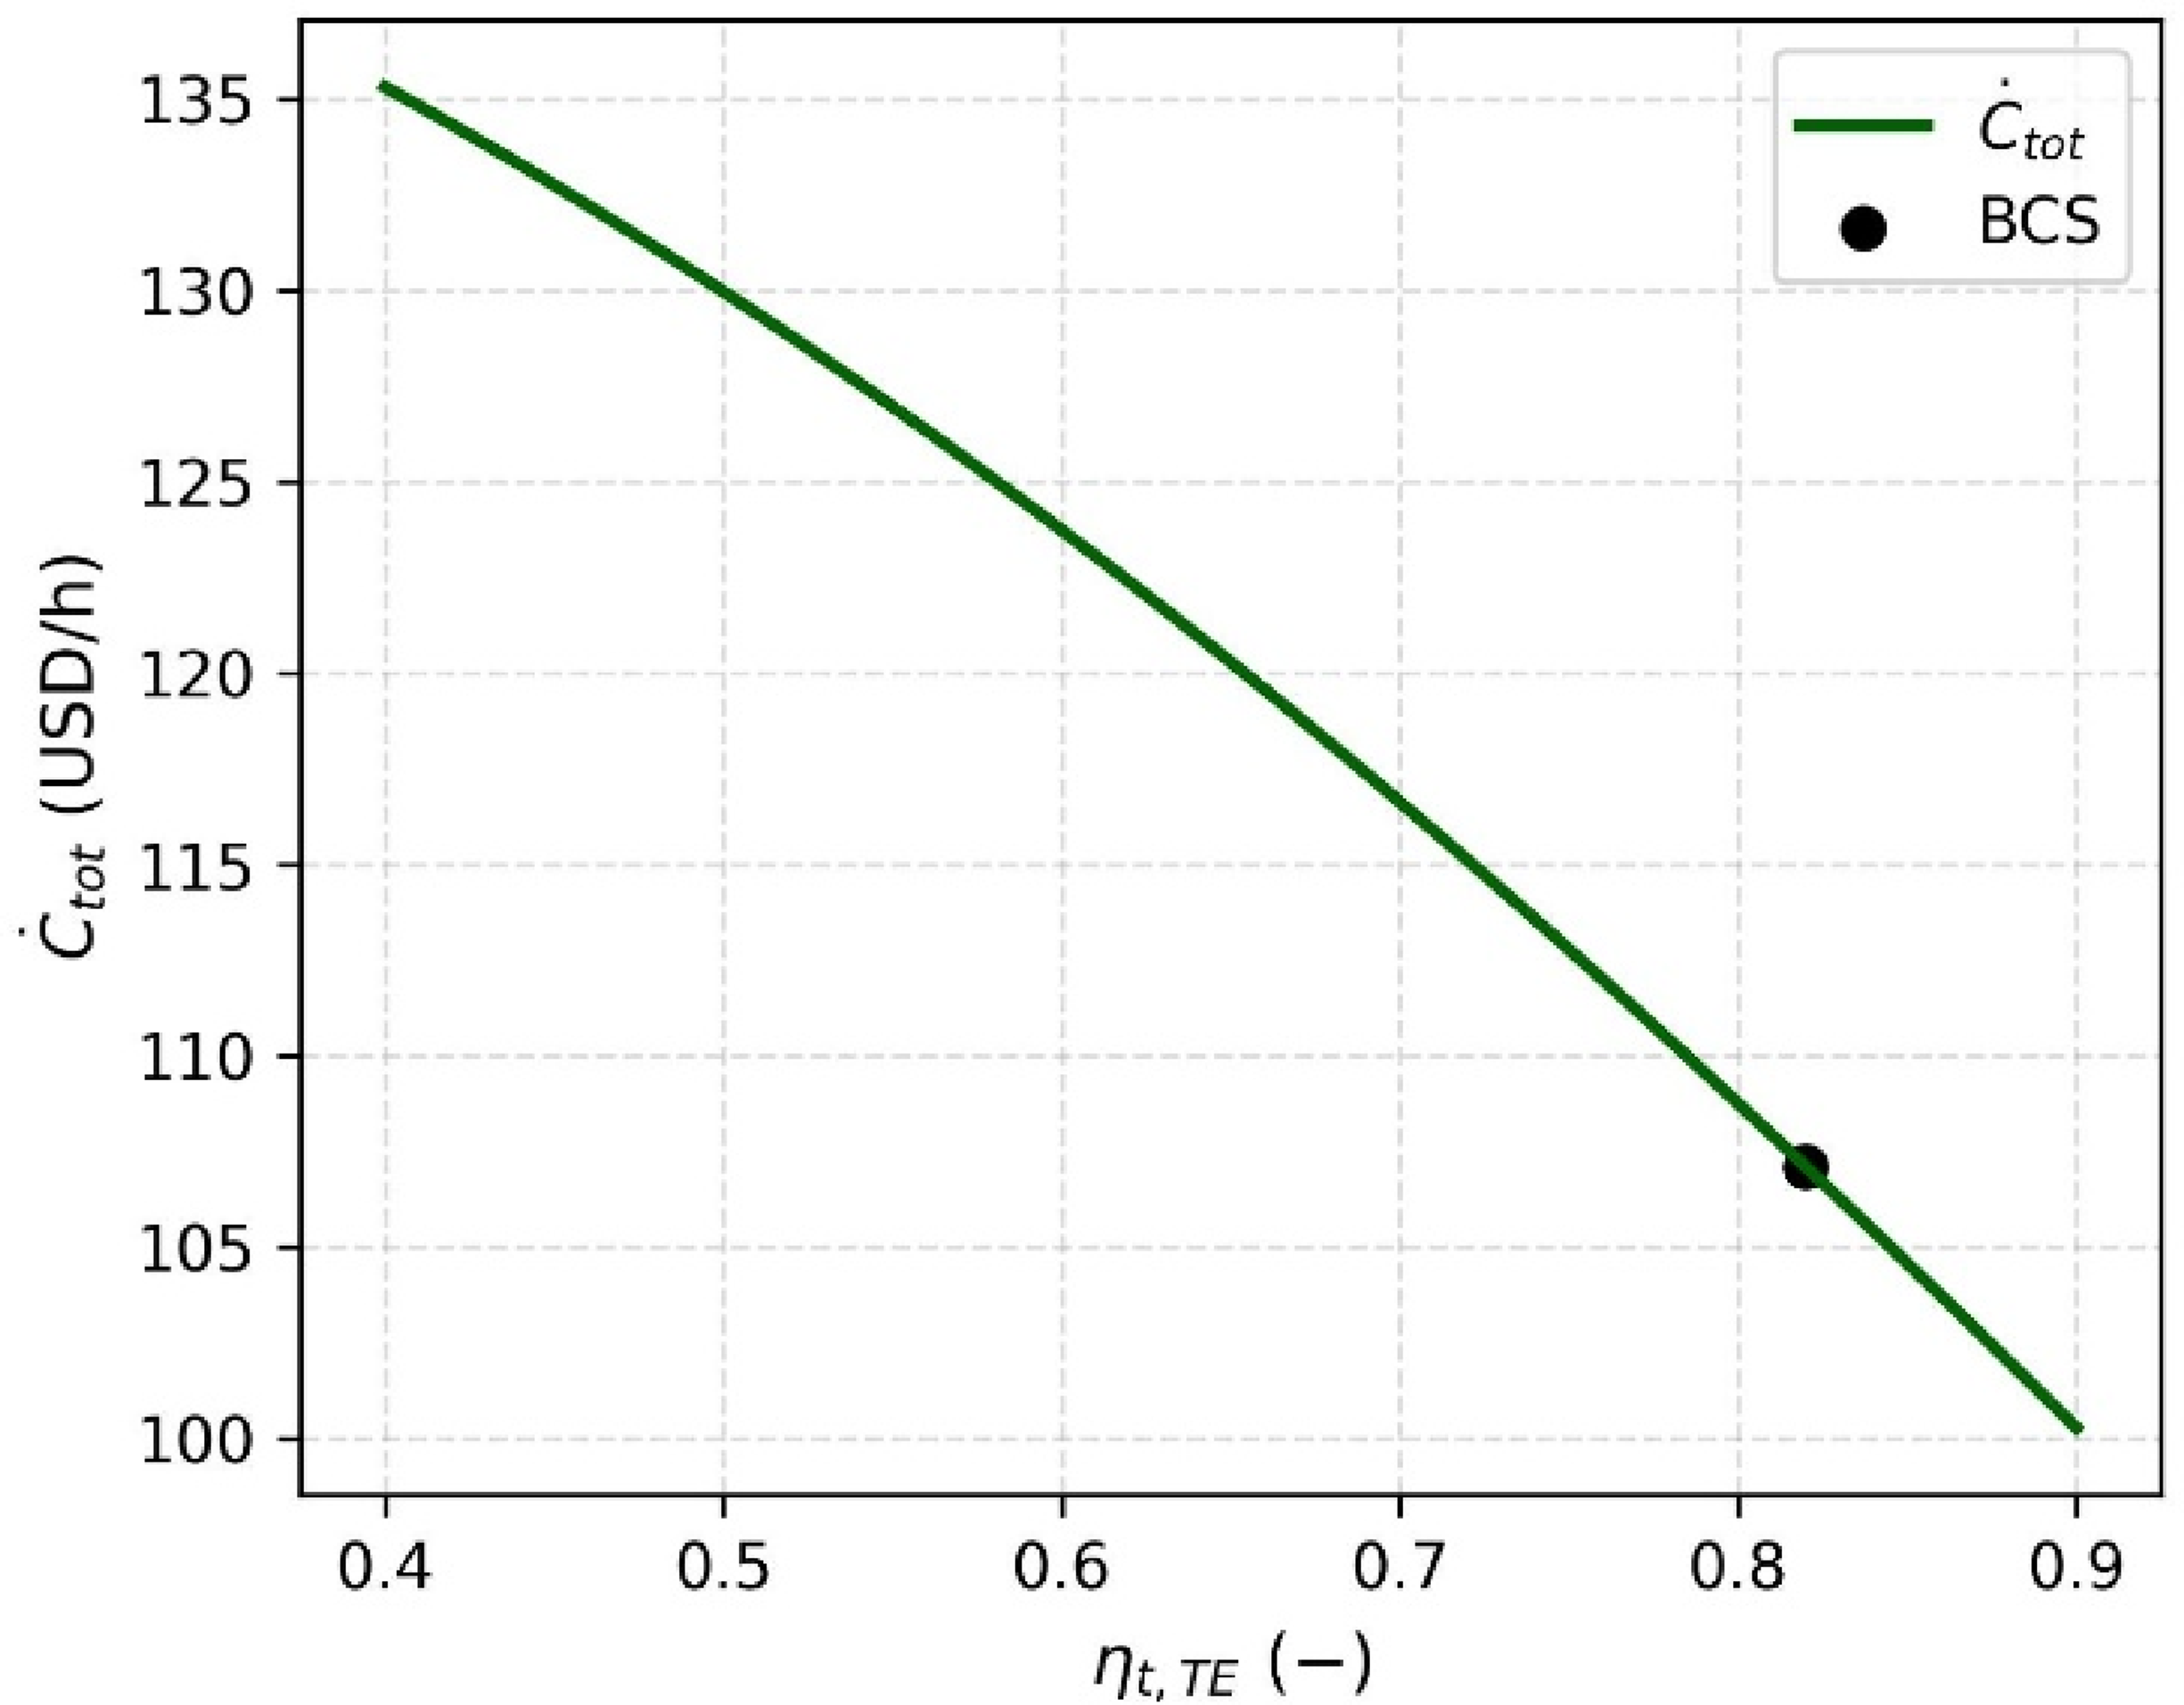
Influence of the turbine isentropic efficiency on the total cost rate.
The collective trends of Figures 6, 7, and 8 clearly reveal that turbine isentropic efficiency plays a dominant role in governing the exergy, environmental, and economic performance of the hybrid system. As observed in Figure 6, enhancing of turbine isentropic efficiency from 0.4 to 0.9 yields a proportional rise of exergy efficiency from approximately 0.44 to 0.71, confirming the positive correlation between turbine quality and useful exergy recovery. Meanwhile, Figure 7 demonstrates an opposing trend between the EPI and EDR: the environmental performance index rises (0.70–0.82) as turbine isentropic efficiency increases, reflecting higher electricity generation and consequently greater avoided CO₂ emissions, while the reduction in EDR independently indicates improved thermodynamic behavior. Furthermore, Figure 8 displays a steadily declining economic trend reduces from about 135 to 100 ($/h) with increased turbine isentropic efficiency —emphasizing that thermal upgrading simultaneously minimizes operating expenditure.
Effect of gas mass flow rate
The gas flow rate governs the recoverable waste-heat fraction and thus has both thermodynamic and economic consequences. Higher gas mass flow rate raises expansion work and cost simultaneously. As illustrated in Figure 9, increasing the working gas mass flow rate exerts opposite influences on the normalized exergy and thermo-economic indicators of the ORC–TE configuration. The exergy efficiency rises linearly with gas mass flow rate, indicating that higher gas throughput enhances the exergy recovery within the turbine-generator coupling. In contrast, both the EPI and total cost rate decrease almost proportionally with gas mass flow rate, demonstrating that elevated flow rates lead to lower environmental burden and reduced system-level costs per unit exergy. The BCS point placed at gas mass flow rate of 0.175 kg/s corresponds to a balanced regime where exergy efficiency attains moderate improvement (0.65 normalized) while maintaining acceptable values of EPI and total cost rate (0.35–0.4 normalized).
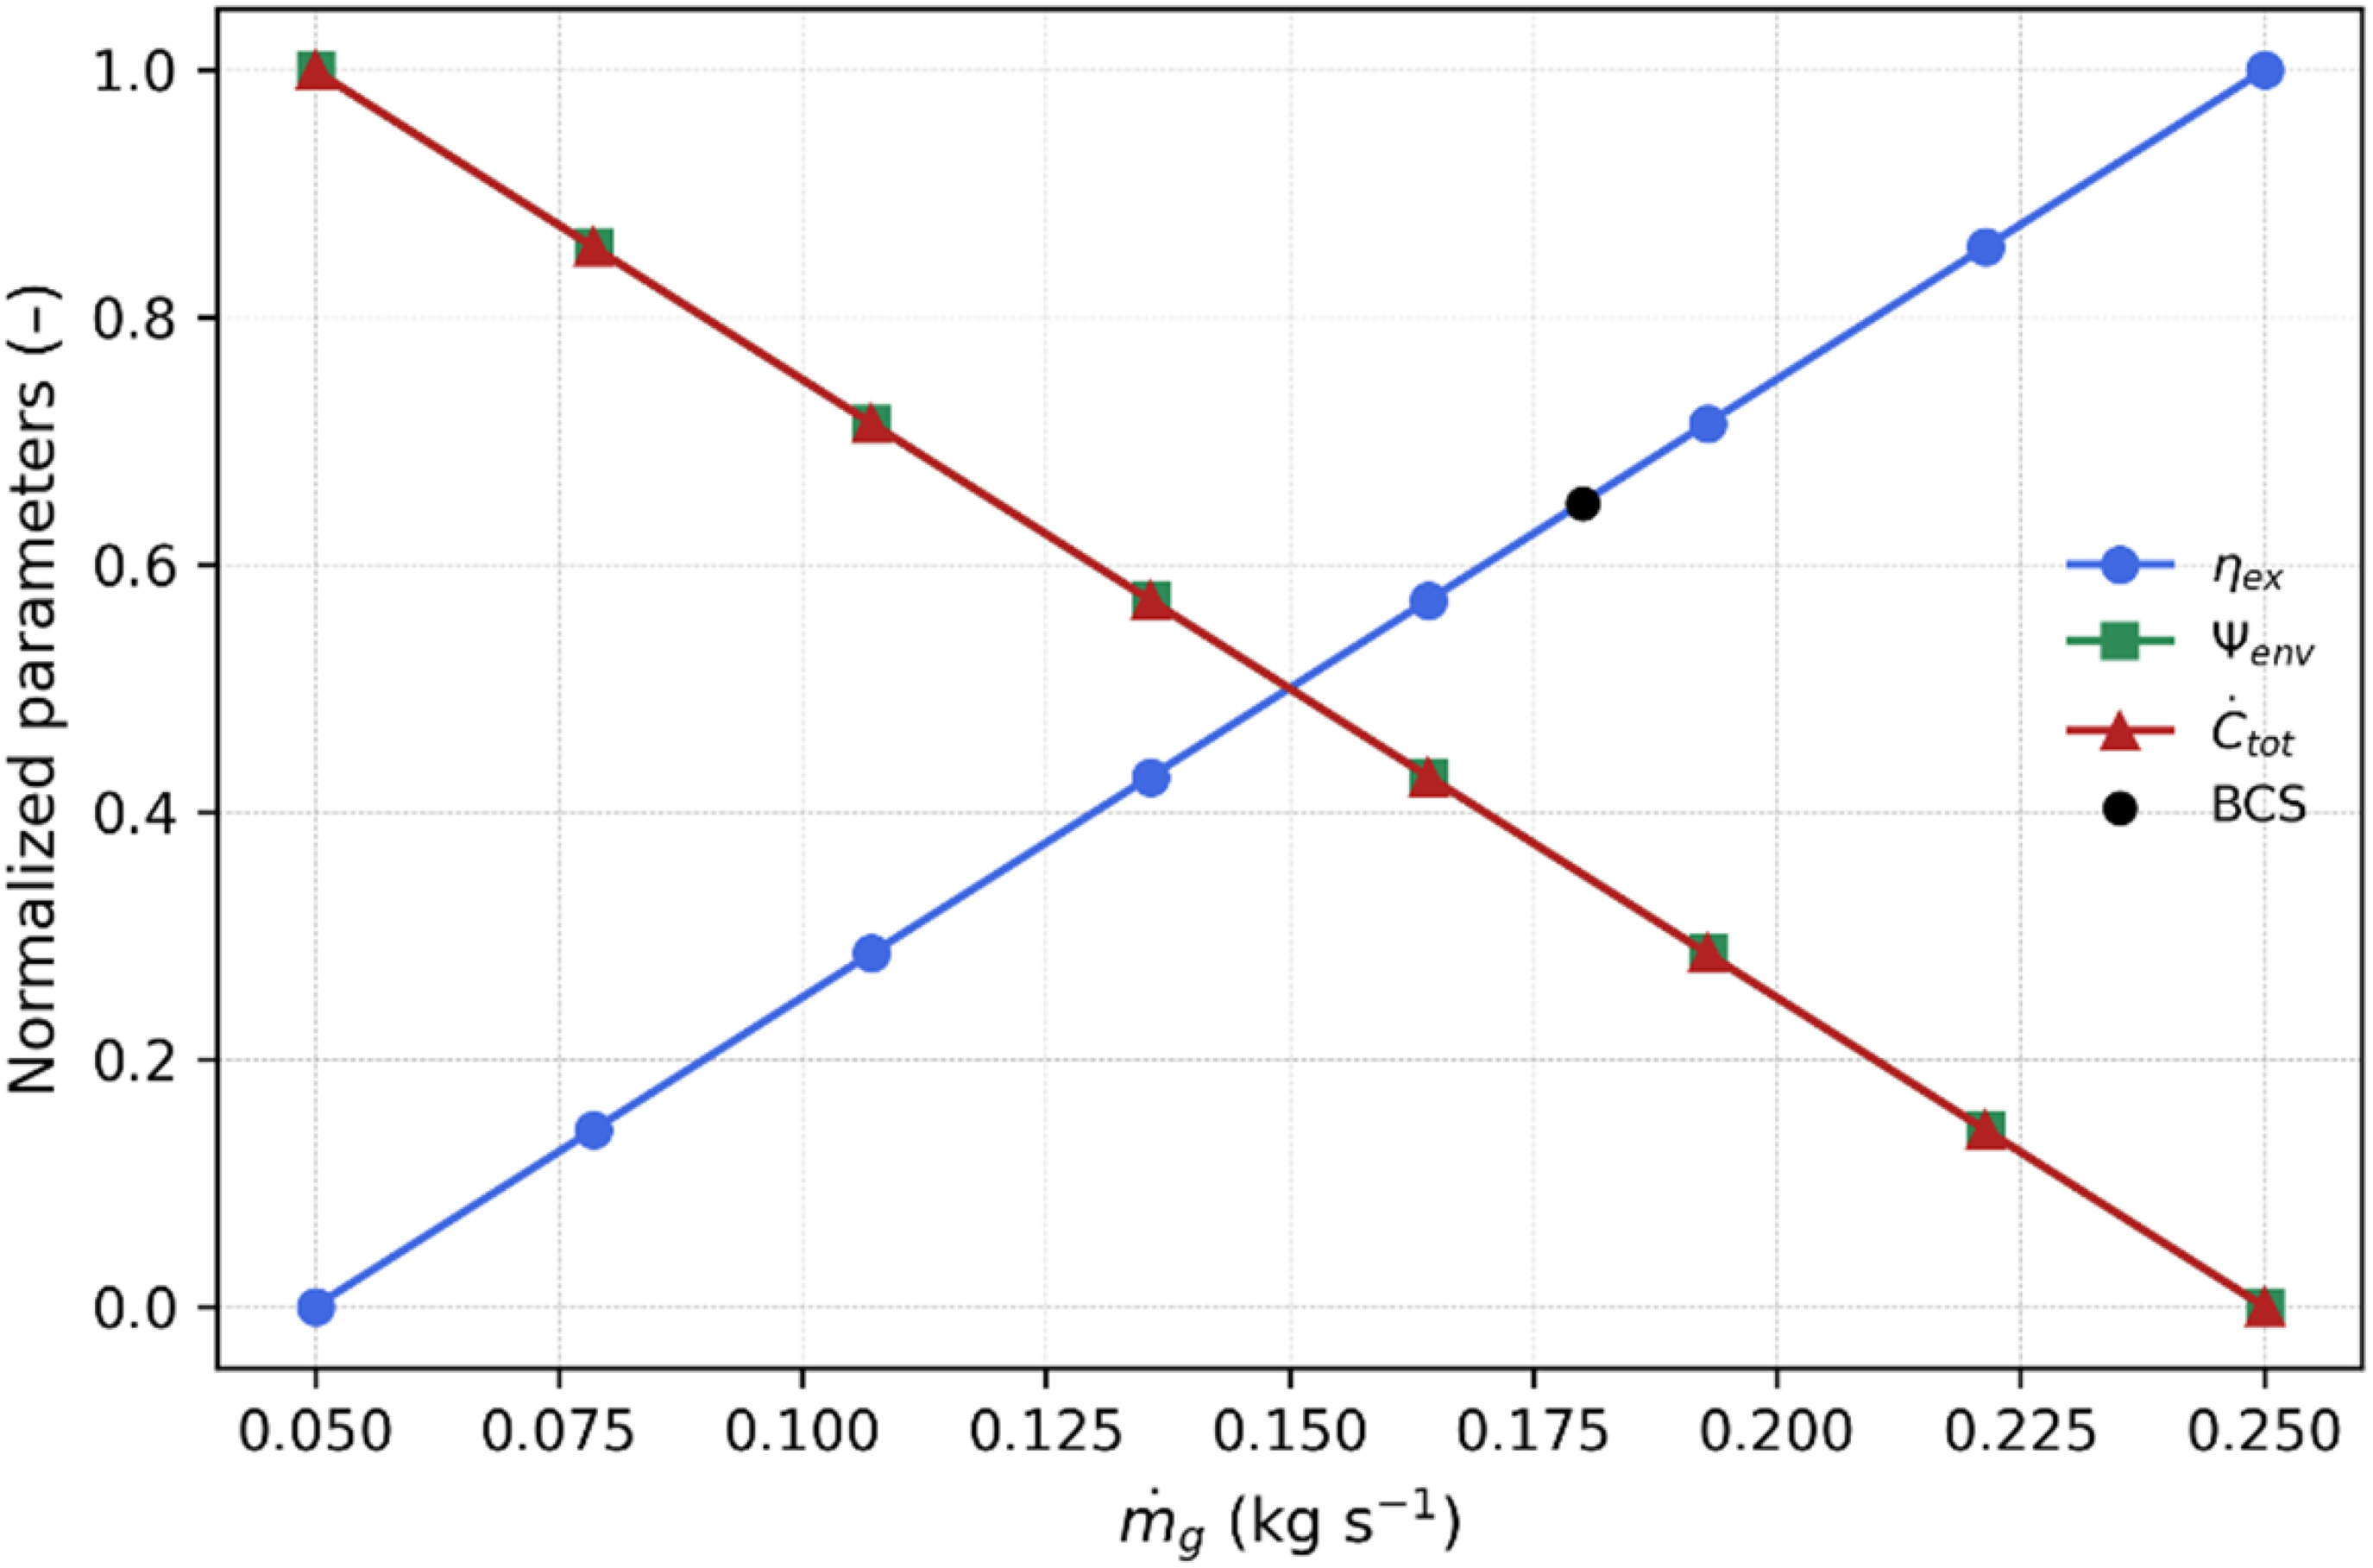
Normalized variation of exergy efficiency, environmental performance index (EPI), and total cost rate as functions of gas mass flow rate.
Parametric effects on derived indicators
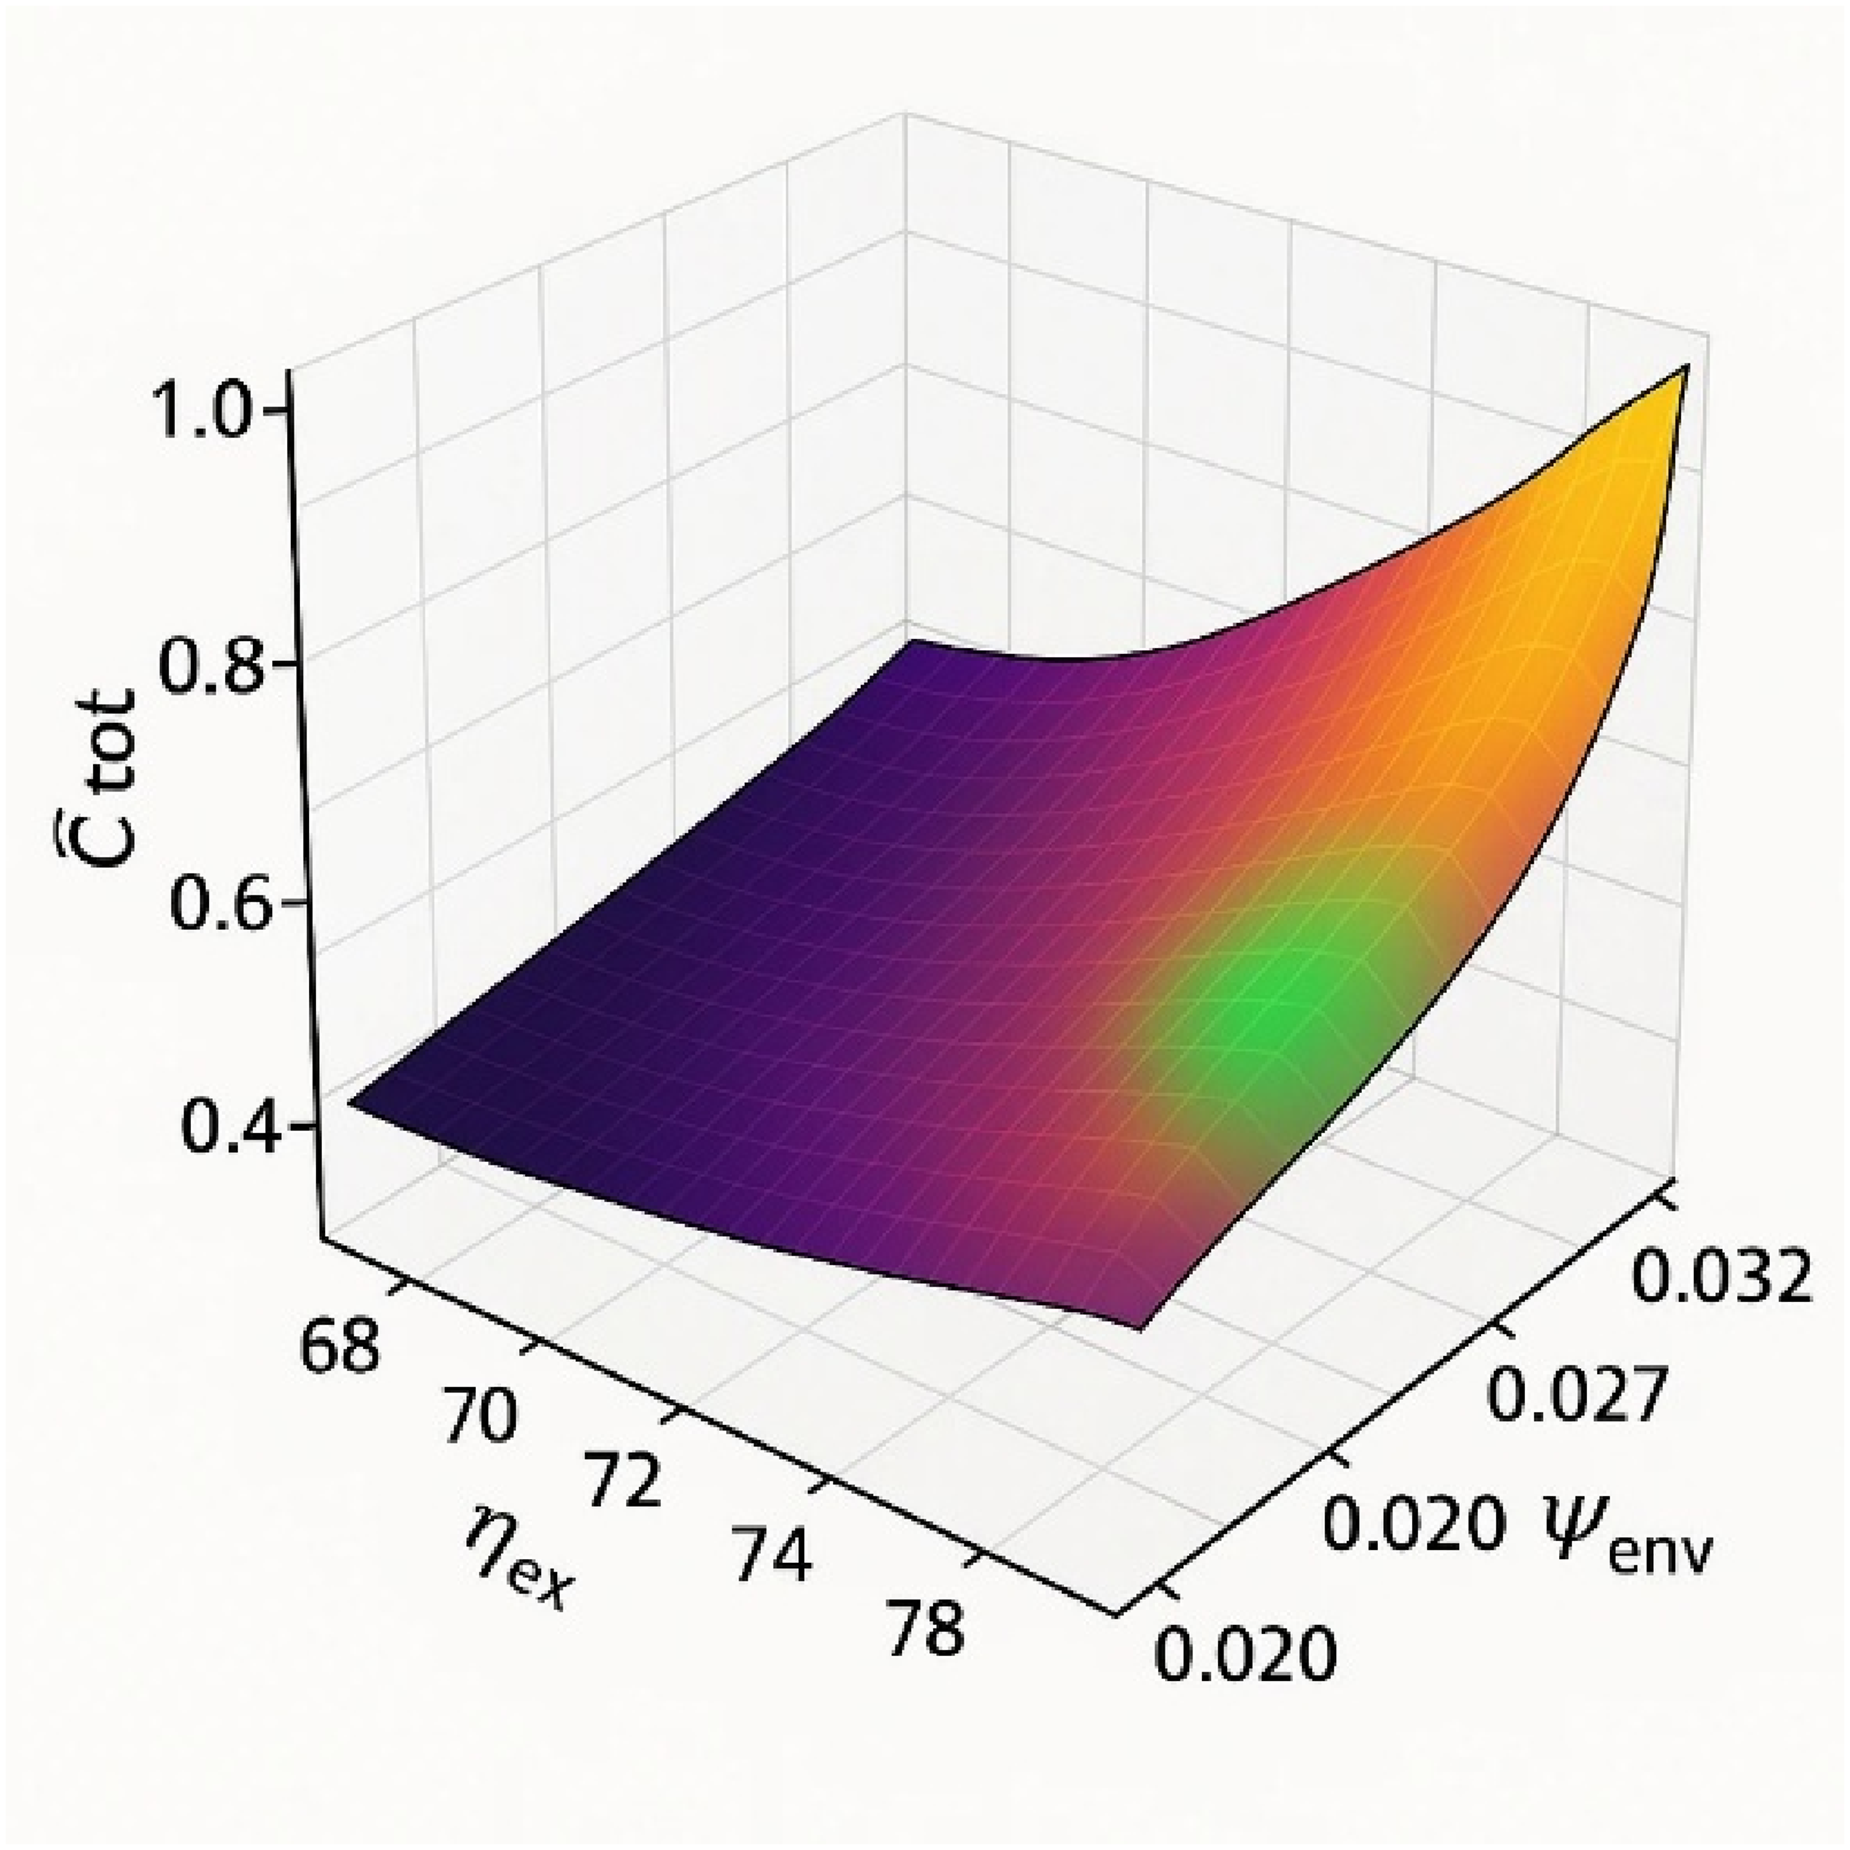
Figure 10(a) illustrates the variation of exergy efficiency with respect to gas inlet temperature and turbine isentropic efficiency, highlighting the thermodynamic synergy between turbine performance and the quality of the thermal input. Figure 10(b) presents the environmental performance index as a function of gas inlet temperature and gas mass flow rate, demonstrating how variations in operating conditions influence the system's CO₂-based environmental performance through changes in electricity generation. Figure 10(c) displays the normalized total cost rate against turbine efficiency and gas mass flow rate, revealing the thermo-economic dependency under coupled thermal-fluidic operating conditions. Figure 11 further explores the combined variation of total cost rate, exergy efficiency, and environmental performance index, illustrating the integrated trade-off surface that links system efficiency and CO₂-related environmental performance with overall cost behavior.

Three-dimensional surface of (a) exergy efficiency versus gas inlet temperature and turbine efficiency, (b) environmental performance index versus gas inlet temperature and gas mass flow rate, and (c) total cost rate versus turbine efficiency and gas mass flow rate.
Coupled correlation of total cost rate with exergy efficiency and environmental performance index (EPI).
As observed in Figures 10(a) to (c), the exergetic, environmental, and economic characteristics of the hybrid ORC–TE configuration are strongly interconnected through operating parameters. Figure 10(a) clearly shows that higher gas inlet temperatures (Tg,in > 180°C) and improved turbine isentropic efficiencies (ηt,TE > 0.8) result in a substantial increase in exergy efficiency, confirming that thermal resource quality and turbine performance govern exergy utilization. In Figure 10(b), the environmental performance index increases almost linearly with both gas inlet temperature and gas mass flow rate, primarily due to enhanced net electrical power generation, which leads to a higher rate of avoided CO₂ emissions per unit of useful electricity. An opposite trend is observed in Figure 10(c), where increased turbine isentropic efficiency and higher gas mass flow rate reduce the normalized total cost rate, indicating that improved thermodynamic performance directly translates into economic benefits. Integrating these effects, Figure 11 delineates a coupling surface among exergy efficiency, environmental performance index, and total cost rate, where higher efficiency and CO₂-based environmental performance correspond to a minimized cost region, defining an optimal operating corridor that balances thermodynamic performance, electricity-driven CO₂ emission reduction, and economic feasibility.
Sensitivity matrix and dominance ranking
Figure 12 presents the normalized sensitivity indices (SX) of each governing input variable with respect to the three key outputs of the ORC–TE hybrid system—exergy efficiency, environmental performance factor, and total cost rate. The parameters analyzed include gas inlet temperature, turbine isentropic efficiency, gas mass flow rate, working-fluid mass flow rate, and condenser pressure. Figure 13 then depicts a radar diagram of the same normalized sensitivity results, illustrating the dominant influence zones and relative importance of each parameter across the performance indicators.
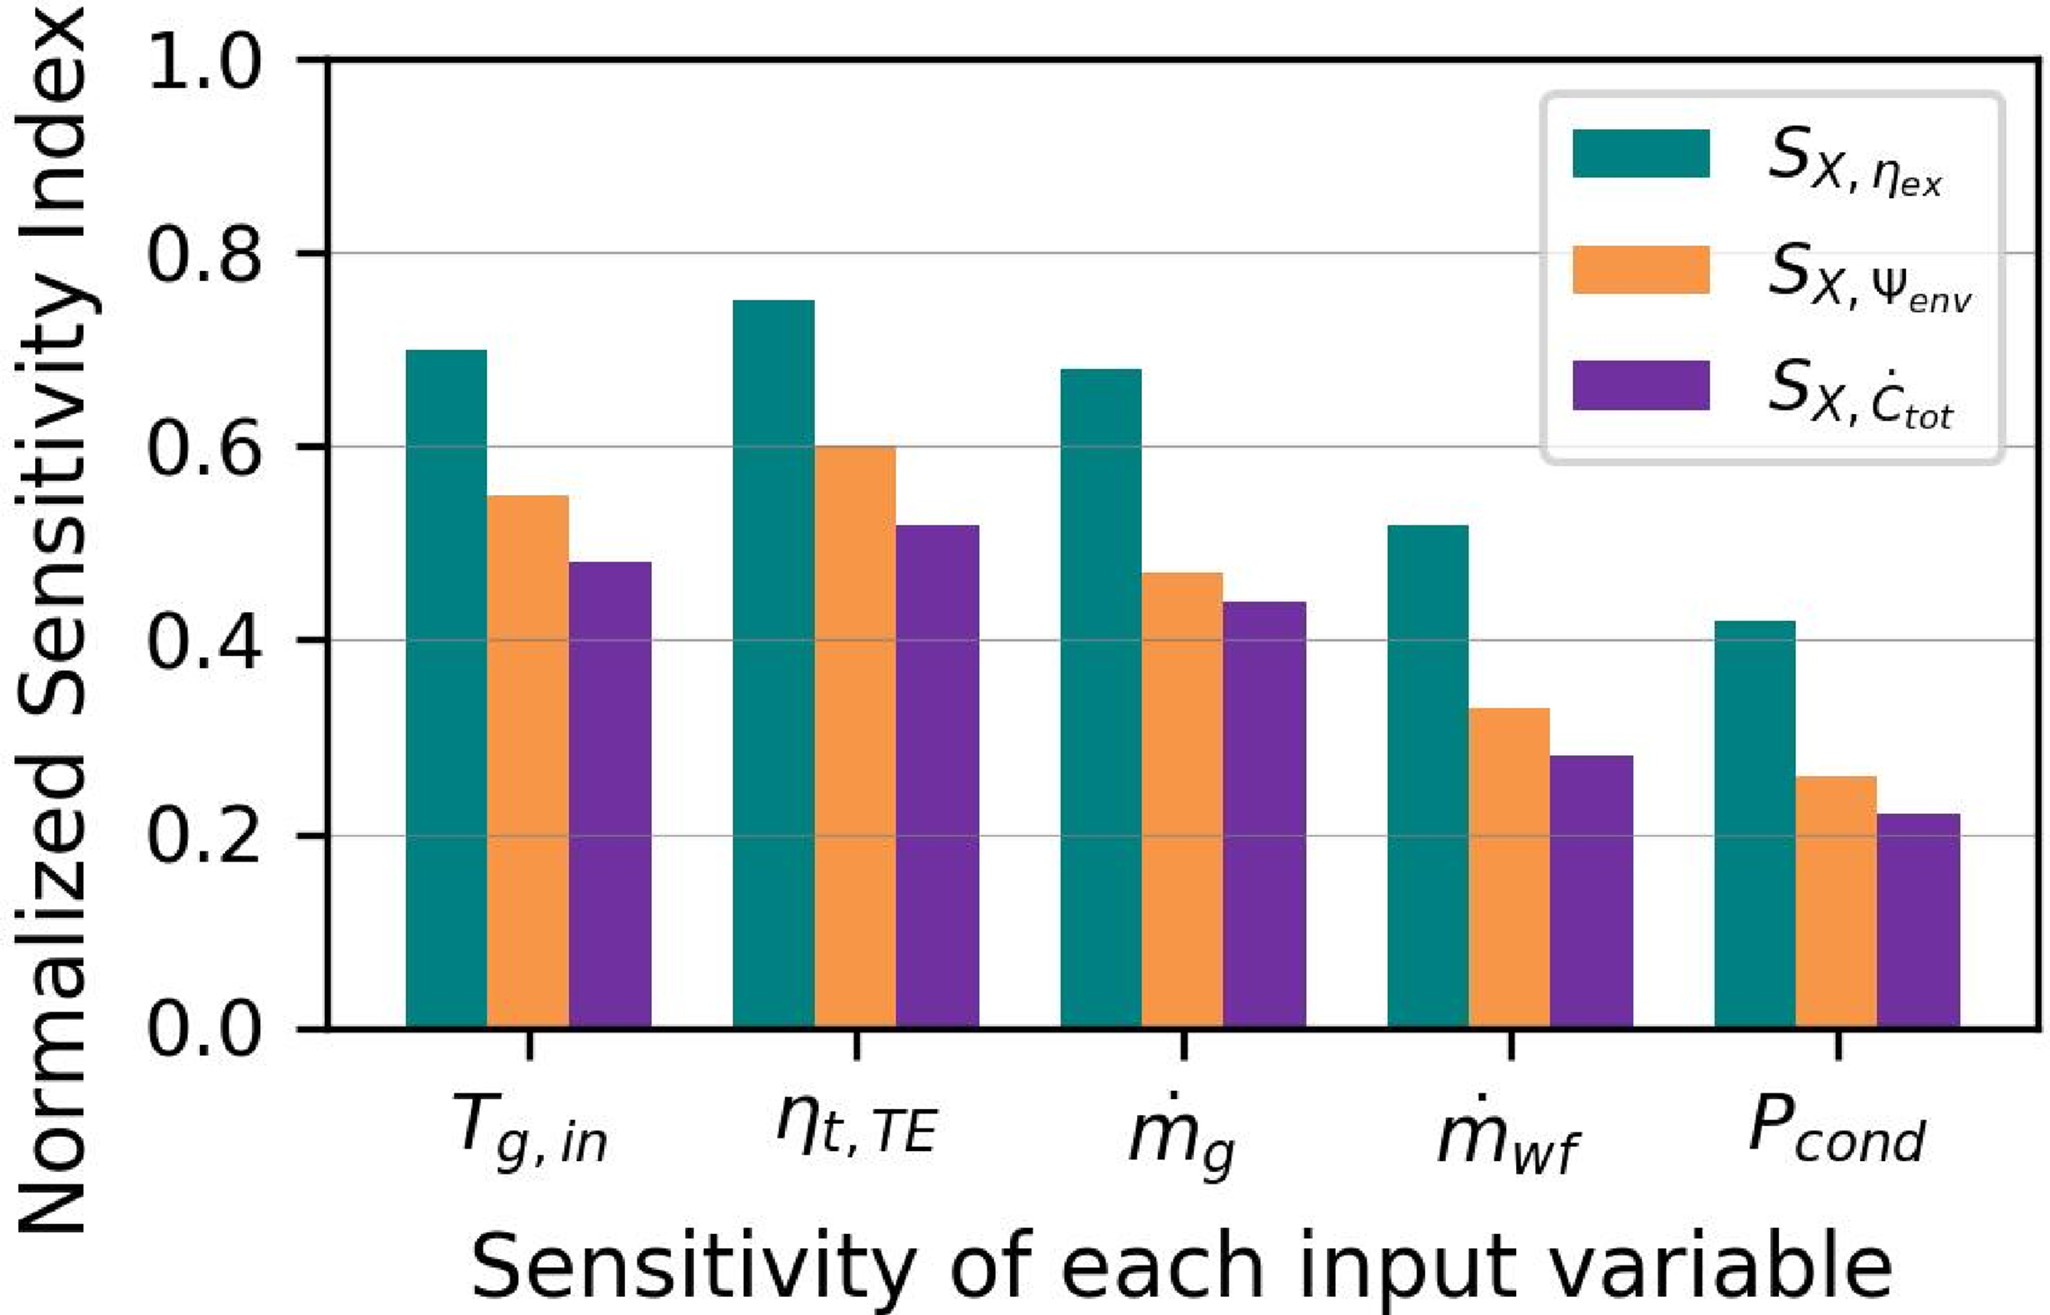
Normalized sensitivity indices (SX) of governing input variables (gas inlet temperature, turbine isentropic efficiency, gas mass flow rate, working-fluid mass flow rate, and condenser pressure) for exergy efficiency, environmental performance index (EPI), and total cost rate.
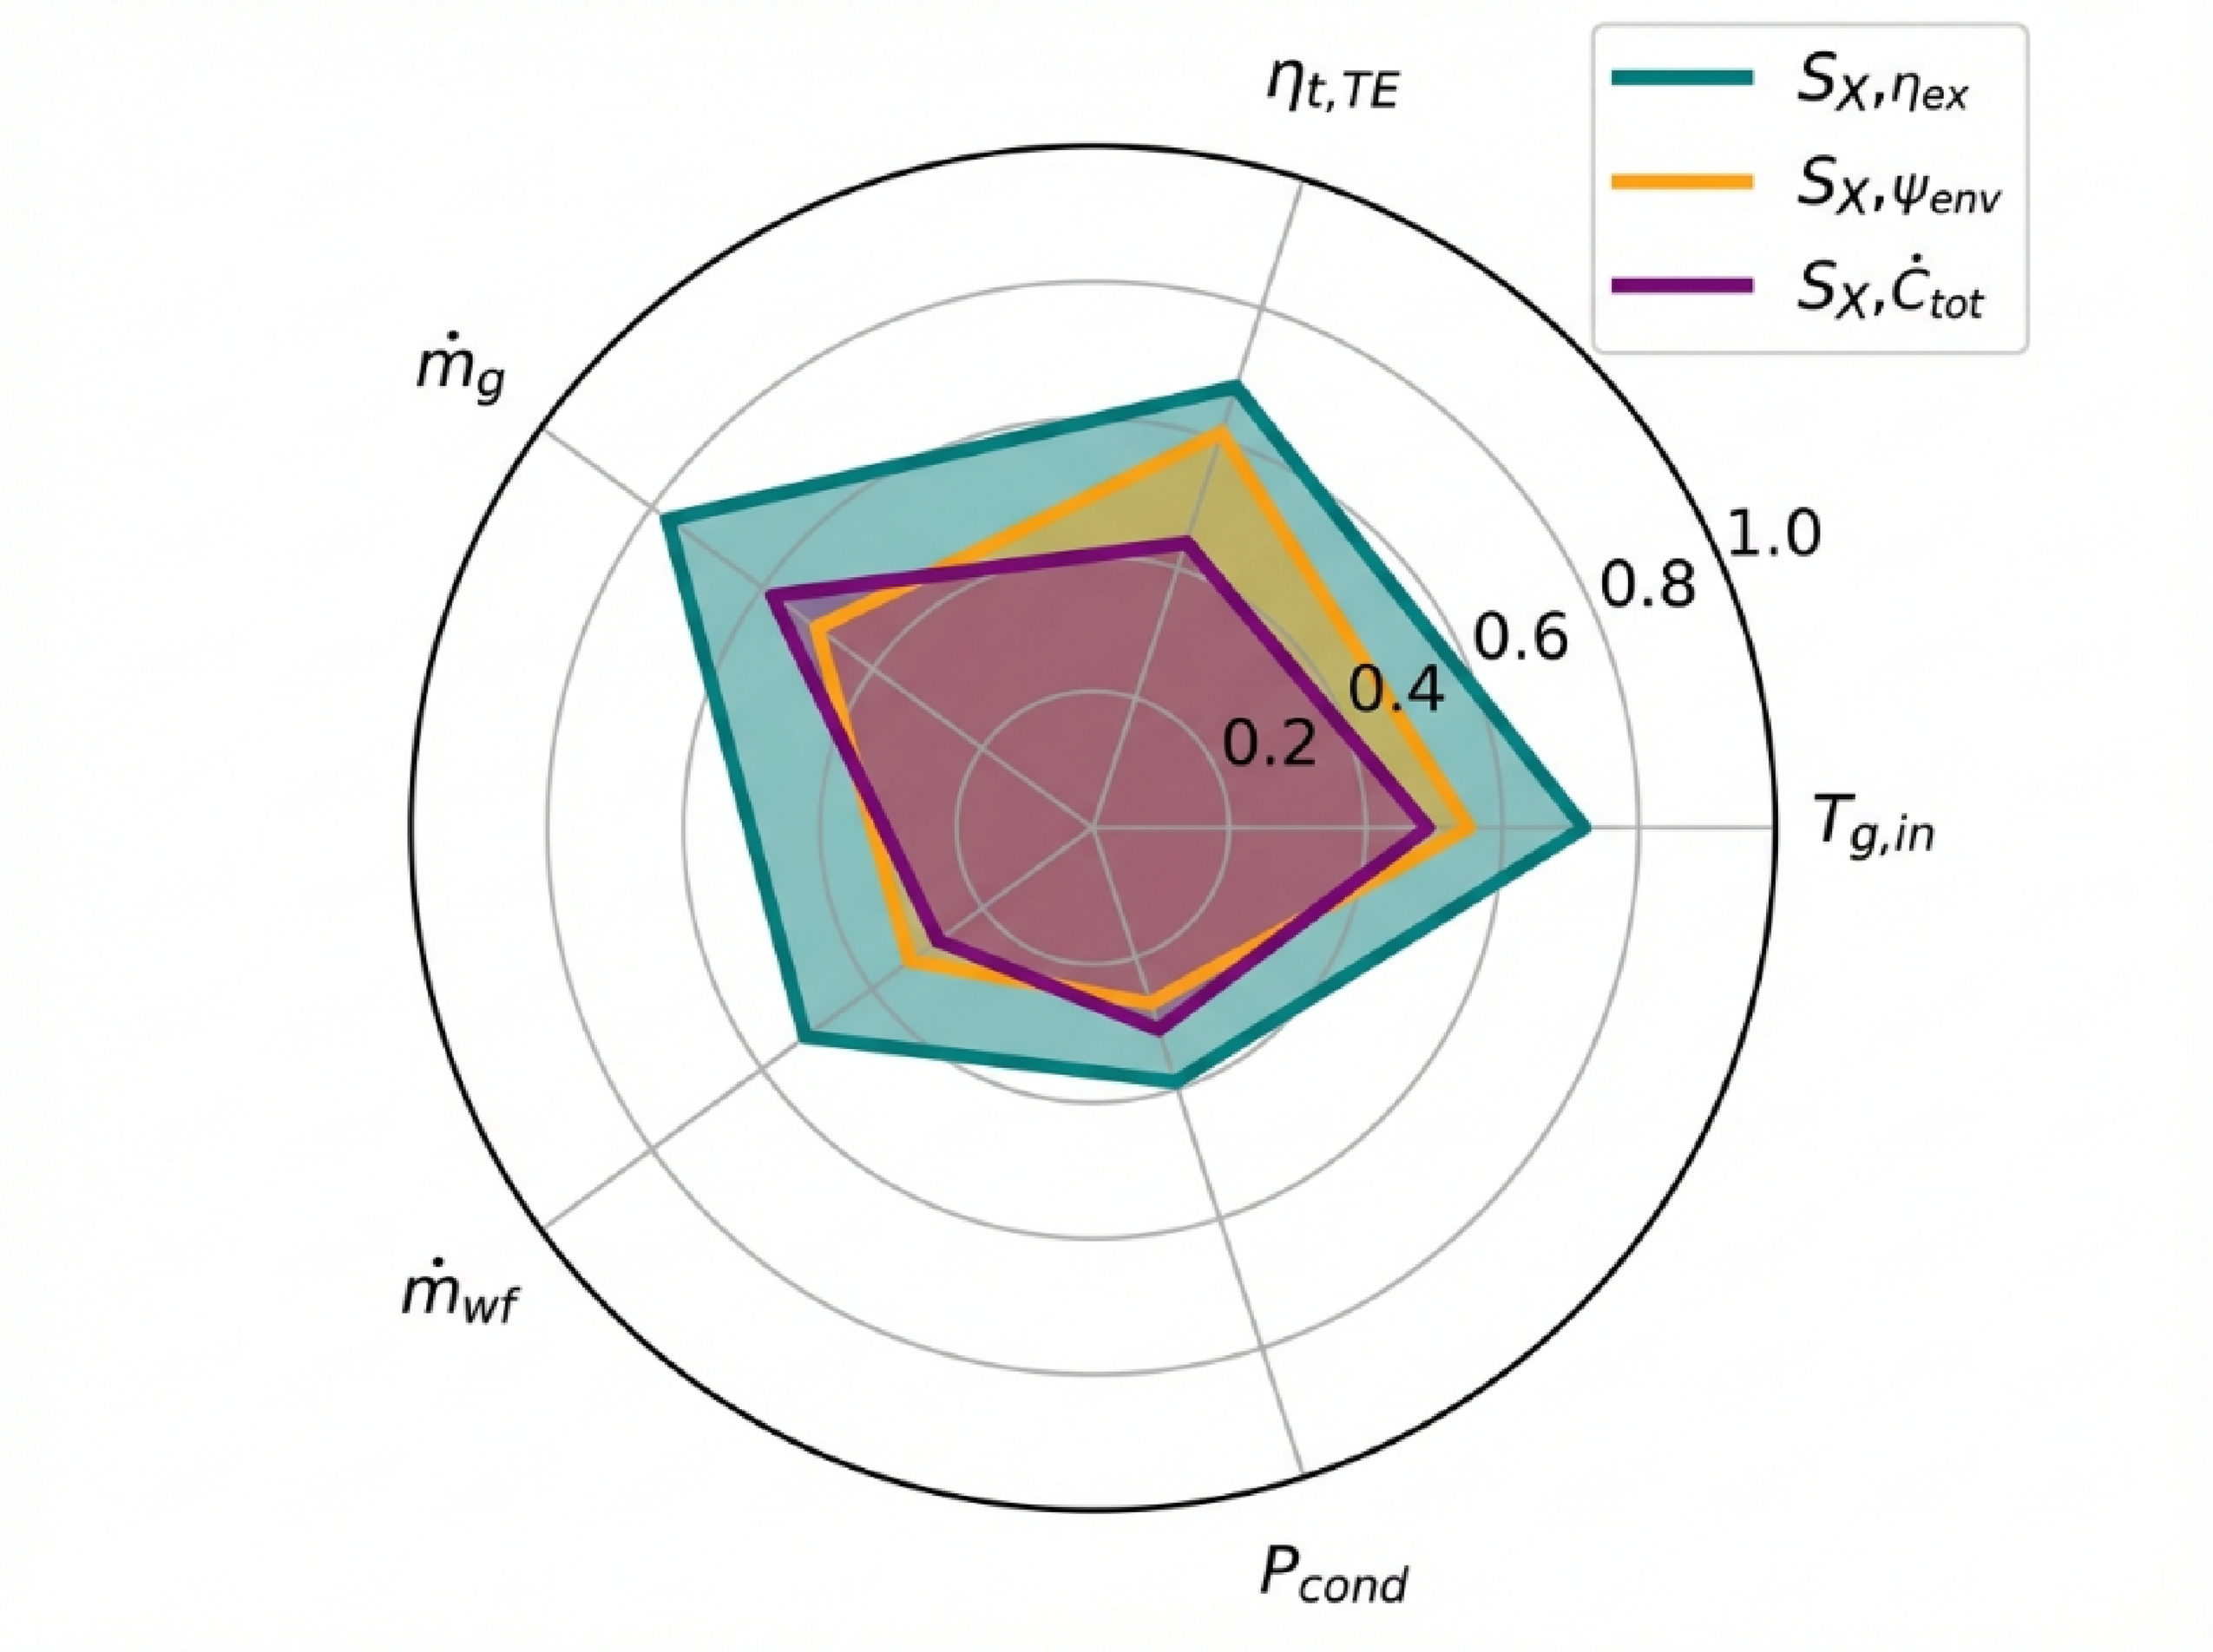
Radar diagram of normalized sensitivity results showing dominance zones among system parameters for
As depicted in Figure 12, the turbine isentropic efficiency and gas inlet temperature exhibit the highest normalized sensitivity values—exceeding 0.7 for exergy efficiency—indicating their substantial impact on the system's exergy efficiency and its overall optimization potential. The gas mass flow rate ranks next, with moderate influence (0.65), while the working-fluid flow rate and condenser pressure show comparatively lower sensitivity indices (< 0.5), suggesting that variations in condensation conditions and fluid circulation exert secondary effects. The radar plot in Figure 13 confirms these findings, showing that the dominance zones of
Multi-objective optimization via NSGA-II
The parametric and sensitivity analyses presented in the Parametric Analysis and Sensitivity Study section revealed that the ORC–TE hybrid system is governed by strongly coupled and often competing thermodynamic, environmental, and economic behaviors. While higher gas inlet temperature and turbine isentropic efficiency significantly enhance the exergy efficiency and environmental performance index, these improvements simultaneously alter the total cost rate through changes in component utilization and system operating conditions. Consequently, no single operating parameter can independently optimize all performance indicators.
To systematically resolve these conflicting tendencies and identify optimal operating regions, a multi-objective optimization strategy based on the NSGA-II is adopted. This approach enables the simultaneous optimization of exergy efficiency, environmental performance index, and total cost rate without imposing subjective weighting factors. The resulting Pareto-optimal solutions define the feasible performance envelope of the ORC–TE system, within which tradeoffs among the objectives are explicitly quantified and visualized. The following subsection presents a detailed Pareto front analysis and trade-off assessment, followed by a decision-making procedure to identify the Best Compromise Solution (BCS).
Pareto front and trade-off analysis
Figure 14 illustrates the Pareto front distribution between the exergy efficiency and the environmental performance index, with the normalized total cost rate depicted by a continuous color gradient. The BCS region is highlighted with green circles to show its relative position within the ensemble of optimal solutions. Figure 15 presents a three-dimensional Pareto surface to visualize the simultaneous effects and tradeoffs among the three indicators: Exergy Efficiency, Thermo–Environmental Synergy Indicator, and Total Cost Rate. Figure 16 displays the kernel-density estimation (KDE) of the Pareto samples distributed across the Exergy Efficiency, Thermo–Environmental Synergy Indicator plane, revealing the concentration of feasible configurations and the BCS threshold zone. Figure 17 explores the correlation between the exergy efficiency and the normalized total cost rate, where point coloration by the environmental performance index highlights the cost–efficiency–environmental dynamics.
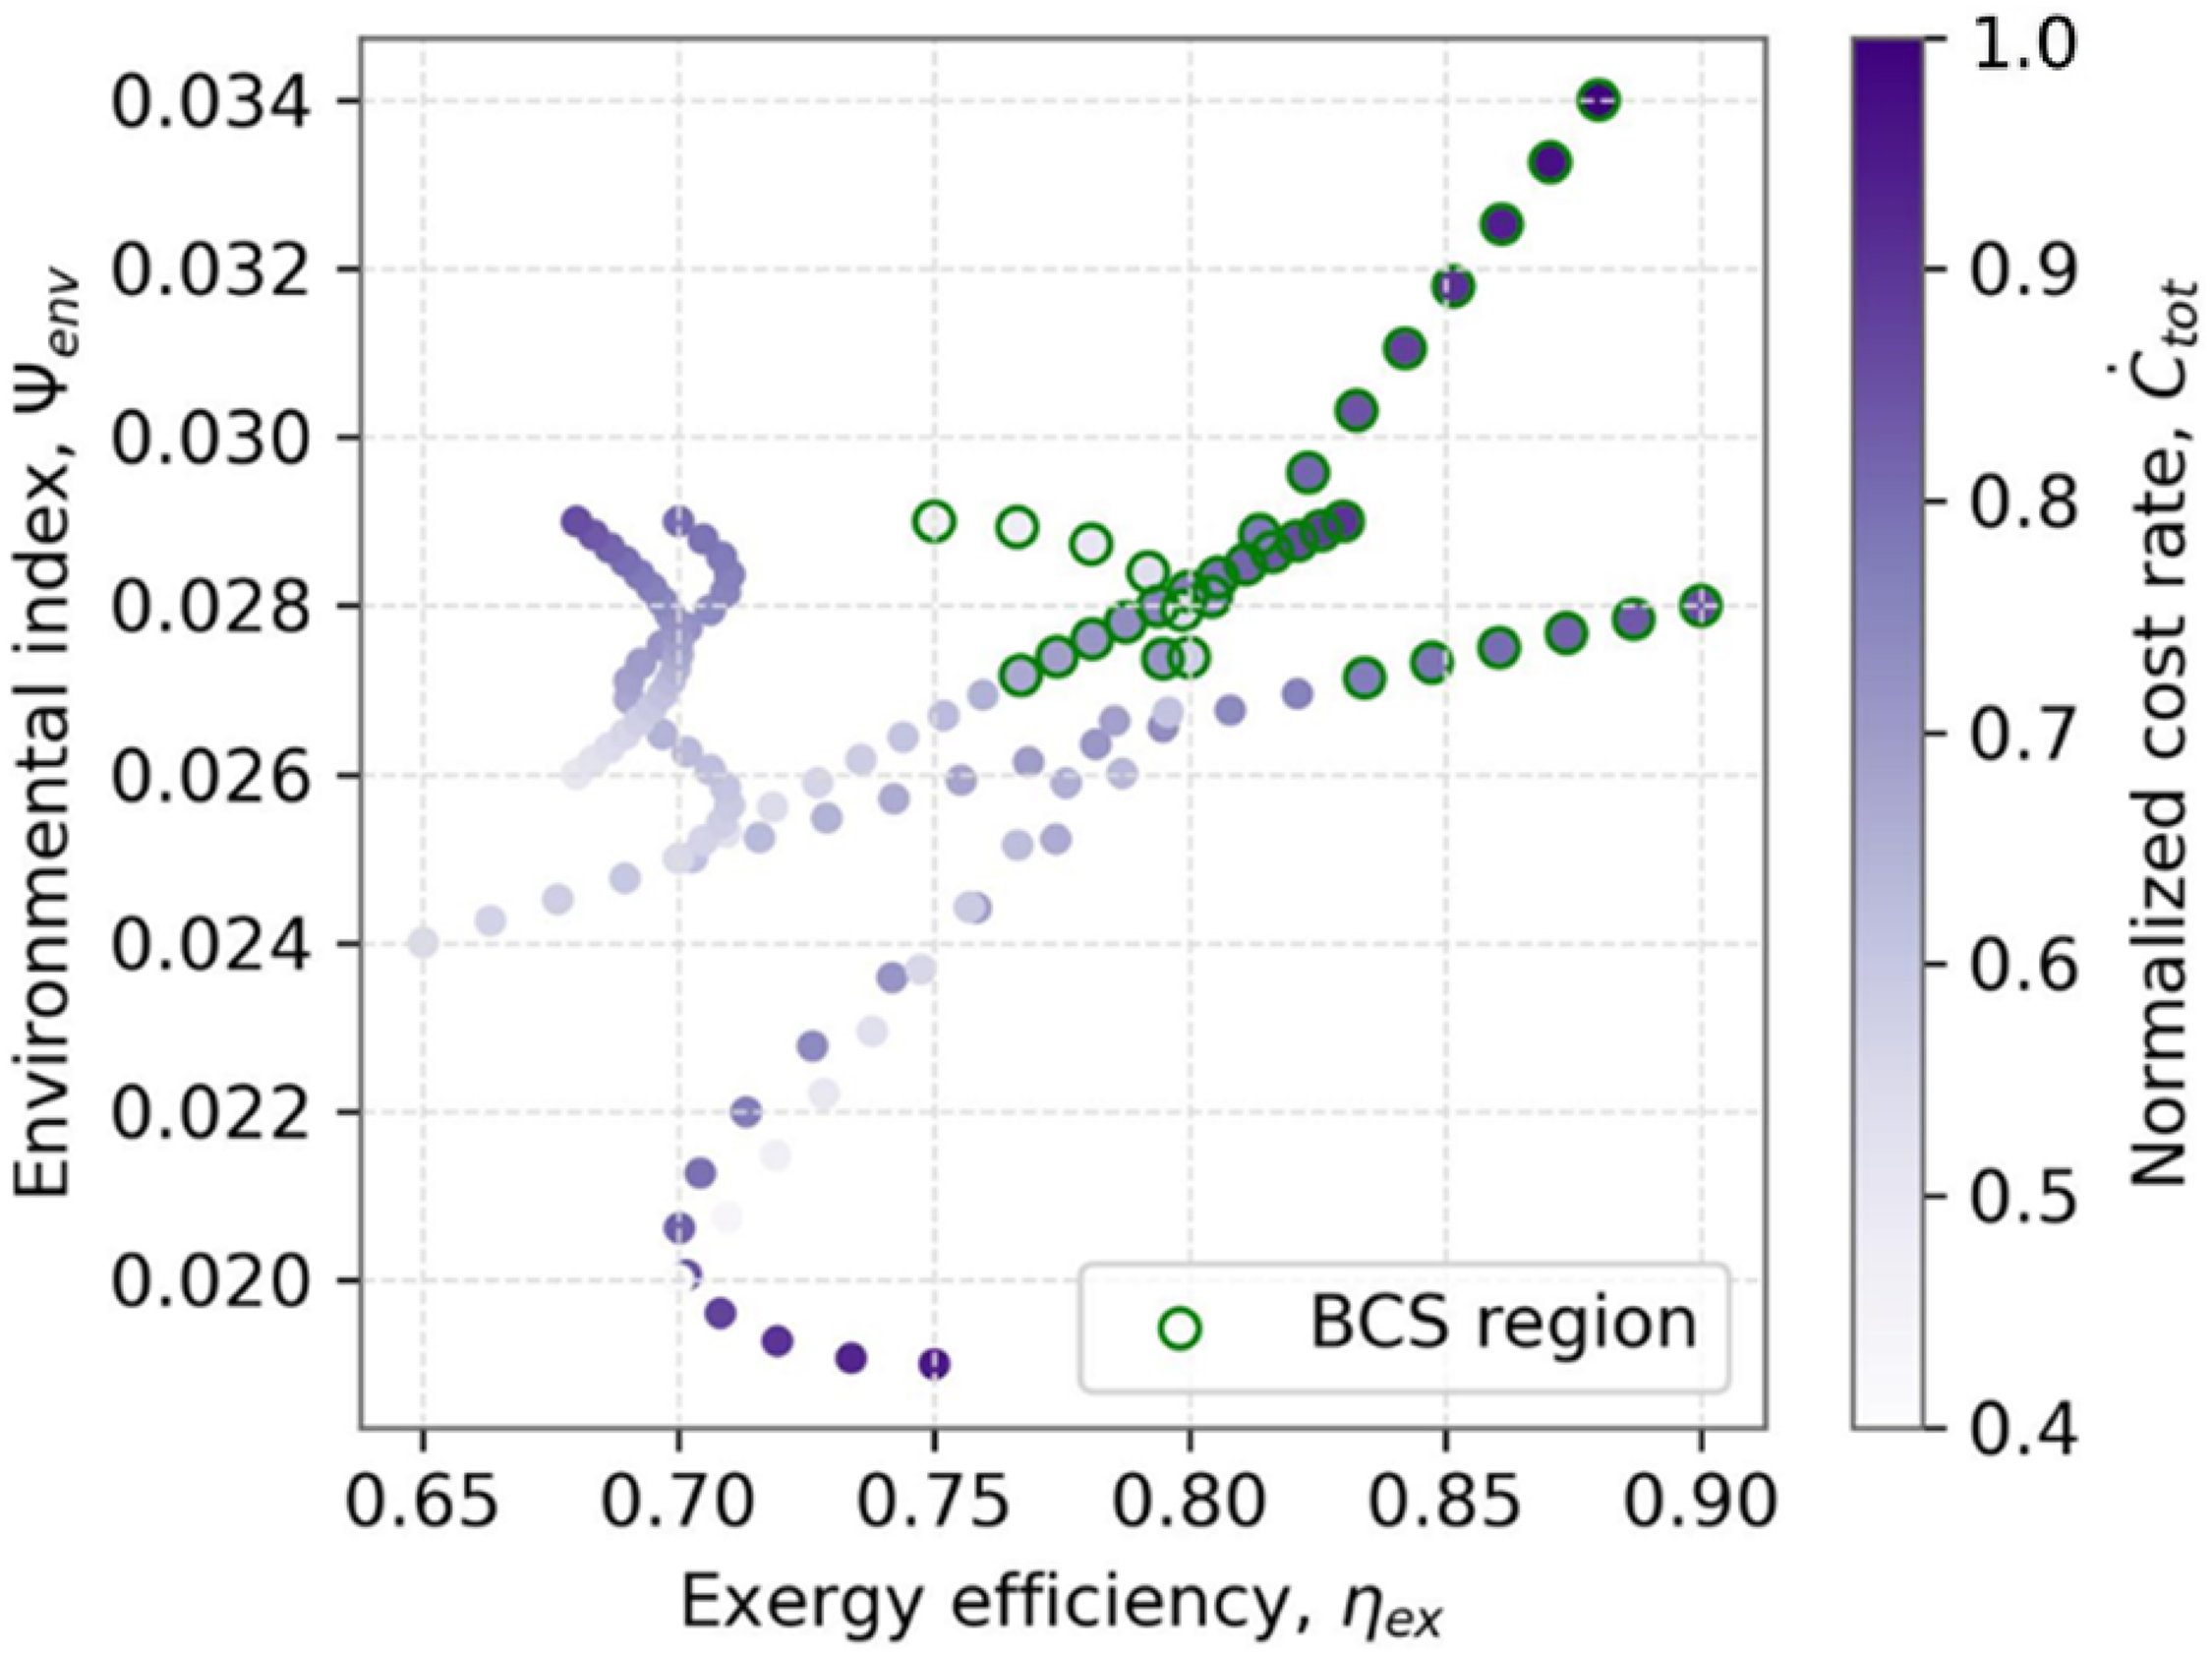
Pareto front between exergy efficiency and Thermo-Environmental Synergy Indicator, with color-coded Normalized Total Cost Rate; Benchmark Case Study (BCS) zone highlighted.

Three-dimensional Pareto surface showing coupled relation among Exergy Efficiency, Thermo-Environmental Synergy Indicator, and Normalized Total Cost Rate.
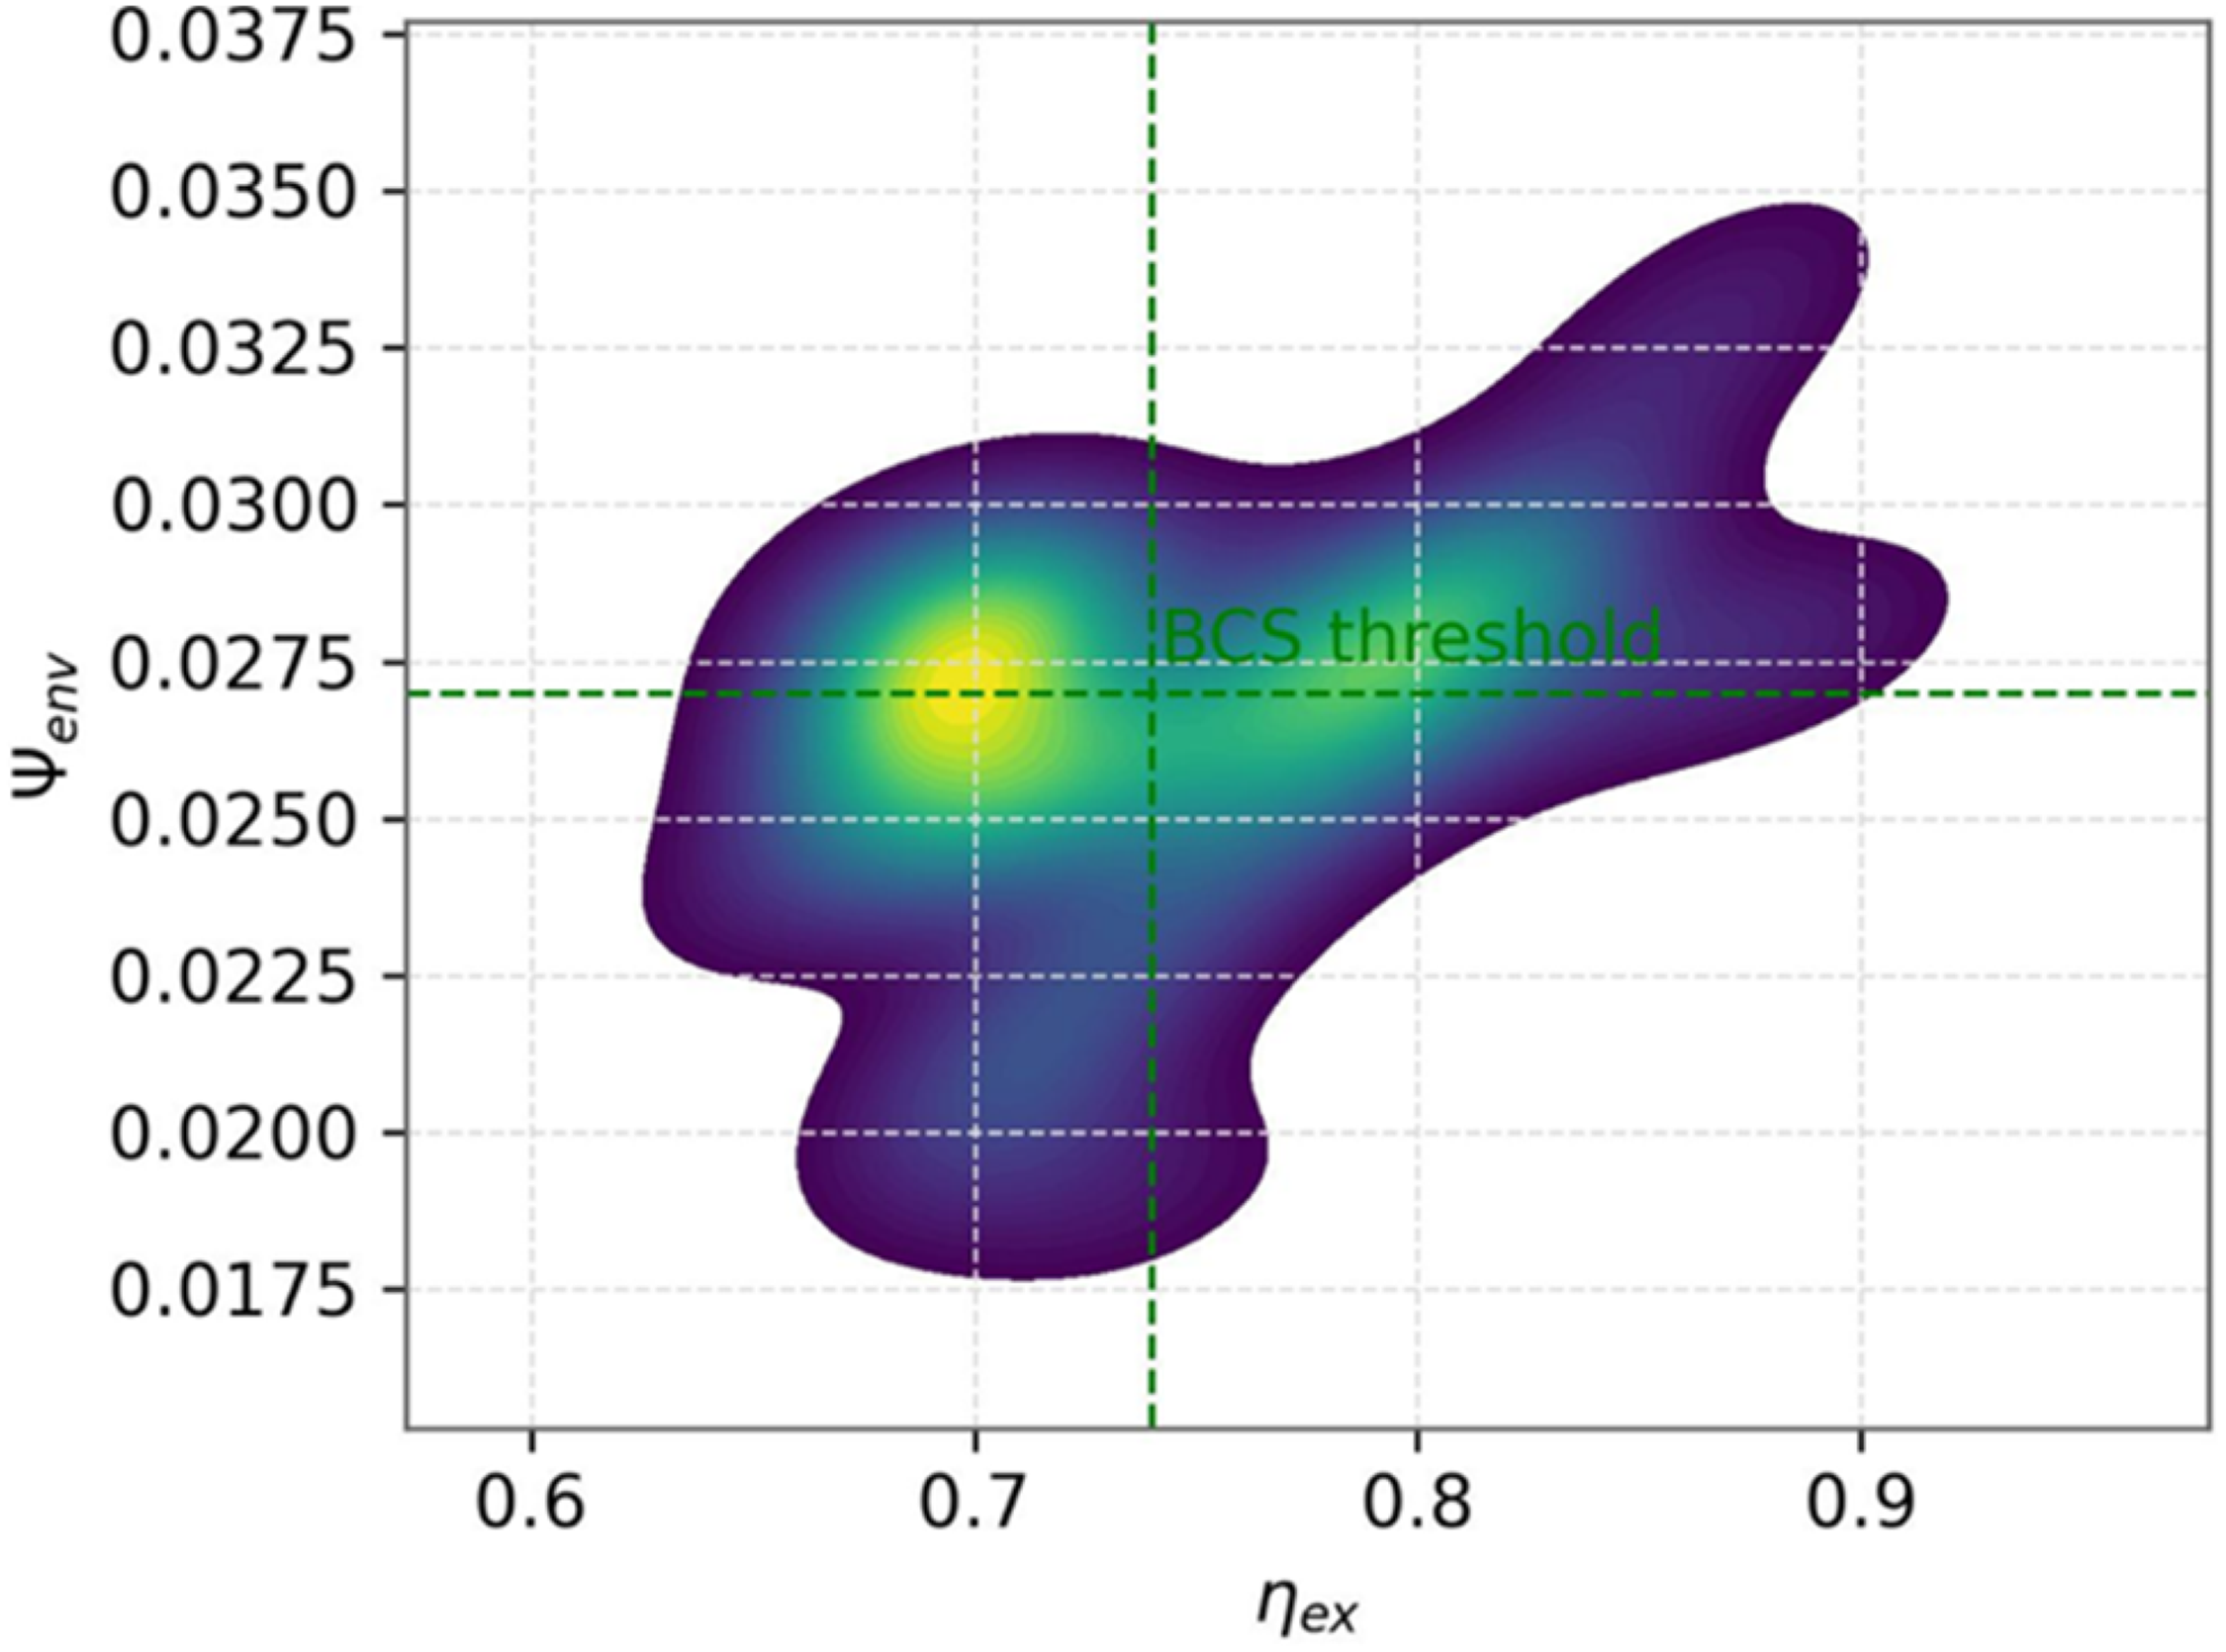
KDE showing distribution of feasible Pareto points across the Exergy Efficiency, Thermo-Environmental Synergy Indicator plane and identifying the local density near the Benchmark Case Study (BCS) threshold.
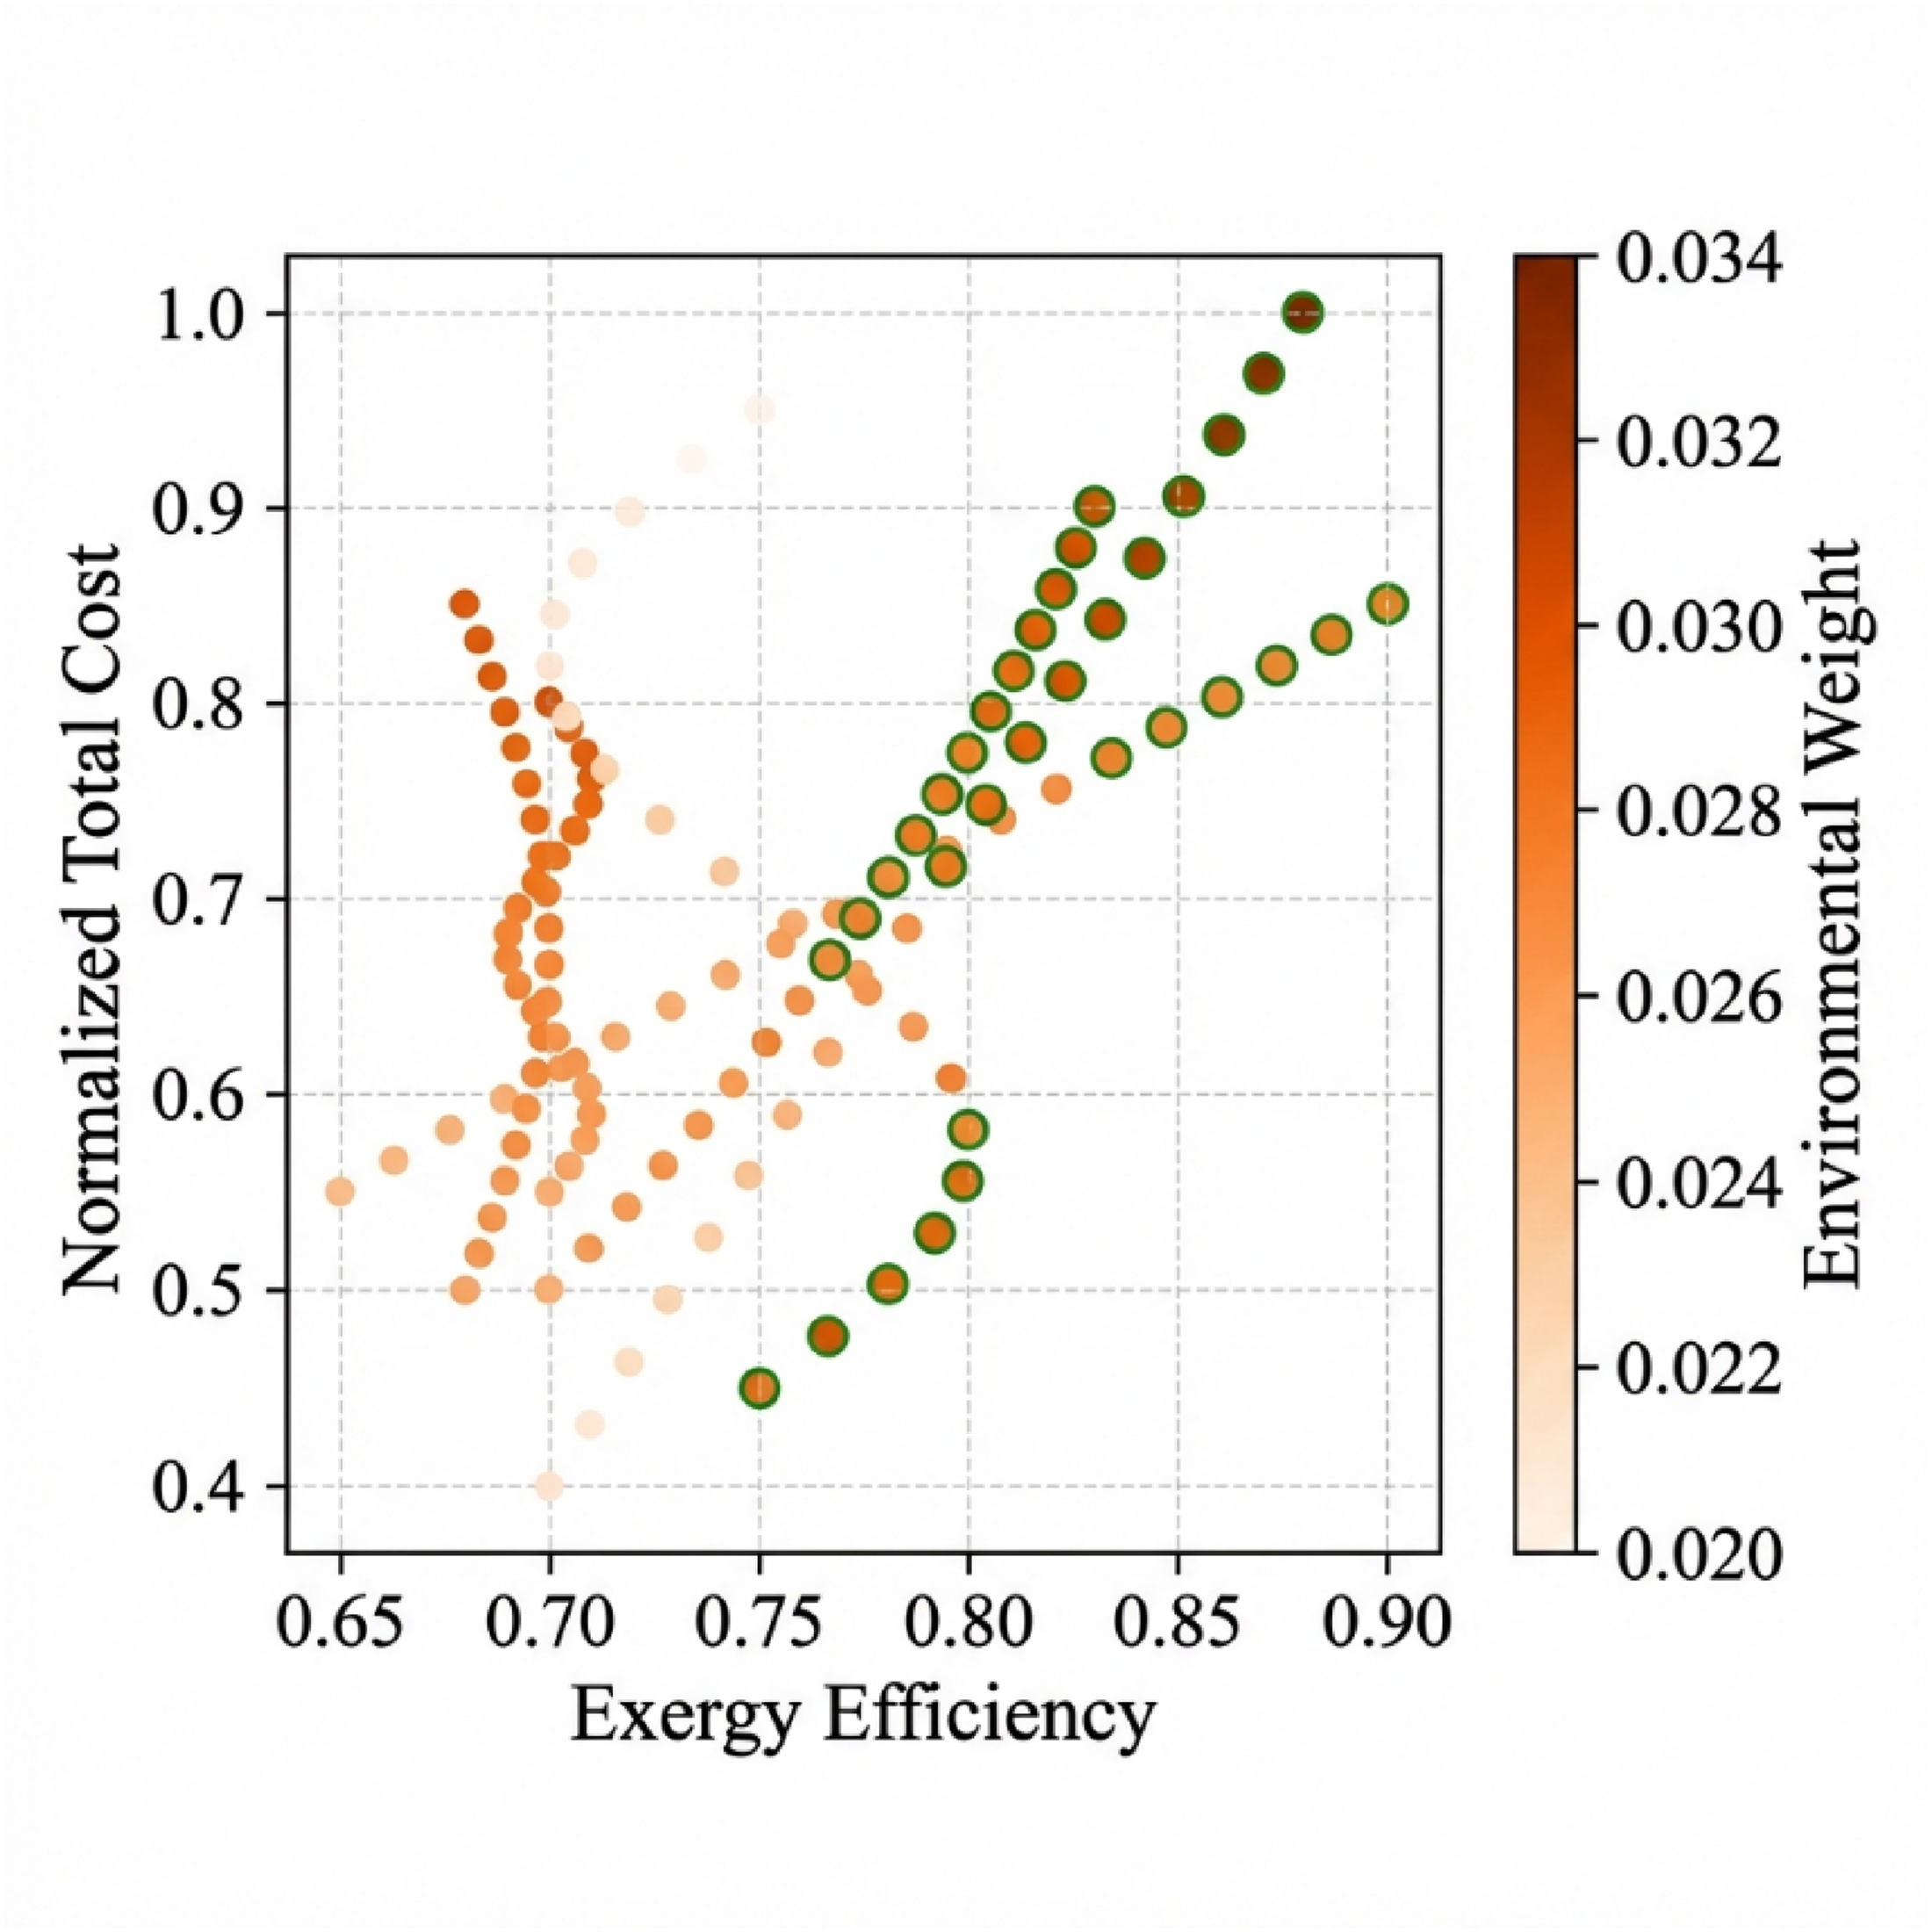
Correlation between Exergy Efficiency and Normalized Total Cost Rate, color-filled by Thermo-Environmental Synergy Indicator to depict environmental impact on cost-efficiency balance.
Collectively, Figures 14 to 17 provide a comprehensive view of the multi-objective optimization landscape for the ORC–TE hybrid system, emphasizing the trade-offs between thermodynamic performance, CO₂-based environmental performance, and economic efficiency. In Figure 14, two optimization bands are evident along the Pareto front: a high-efficiency band characterized by Exergy Efficiency > 0.80 and Thermo–Environmental Synergy Indicator > 0.028, and a low-cost band defined by Exergy Efficiency of 0.70 to 0.75 and total cost rate (norm) < 0.65. The zone marked by green circles (BCS) is located at the intersection of these two bands, identifying a practical balance between thermodynamic efficiency and cost constraints. The three-dimensional surface in Figure 15 confirms that as both exergy efficiency and Thermo–Environmental Synergy Indicator increase, the total cost rate consistently decreases, illustrating coupled improvement trends typical of hybrid cycle optimization. The KDE map in Figure 16 further pinpoints the densest cluster of solutions at exergy efficiency of 0.71 and Thermo–Environmental Synergy Indicator of 0.0275, coinciding with the BCS operating region and signifying statistical dominance of that configuration. Finally, Figure 17 clarifies how improved environmental conditions (higher Thermo–Environmental Synergy Indicator) tend to reduce total cost rate (norm) up to exergy efficiency of 0.82, after which marginal economic gains taper off—an indication of diminishing returns on further efficiency enhancement. Altogether, these results confirm that concurrent improvement of Exergy Efficiency and Thermo–Environmental Synergy Indicator yields gradual cost minimization until reaching an equilibrium Pareto front, consistent with the optimization for low-temperature ORC–TE coupled systems.
Decision and ranking via TOPSIS method
Figure 18 illustrates the TOPSIS ranking trend where each Pareto solution is evaluated by its normalized closeness coefficient (Ci∗, Normalized Closeness Coefficient) along the Pareto point index axis. The BCS is marked by a green star symbol, representing the optimal compromise among the competing objectives. Figure 19 shows the three-dimensional relative distance mapping between each Pareto solution and the ideal positive/negative points (Di+, Positive Ideal Distance; Di−, Negative Ideal Distance). The closeness value (Ci∗) is visualized by the color gradient, and the BCS point is highlighted in green near the upper region of the ideal distance spectrum.
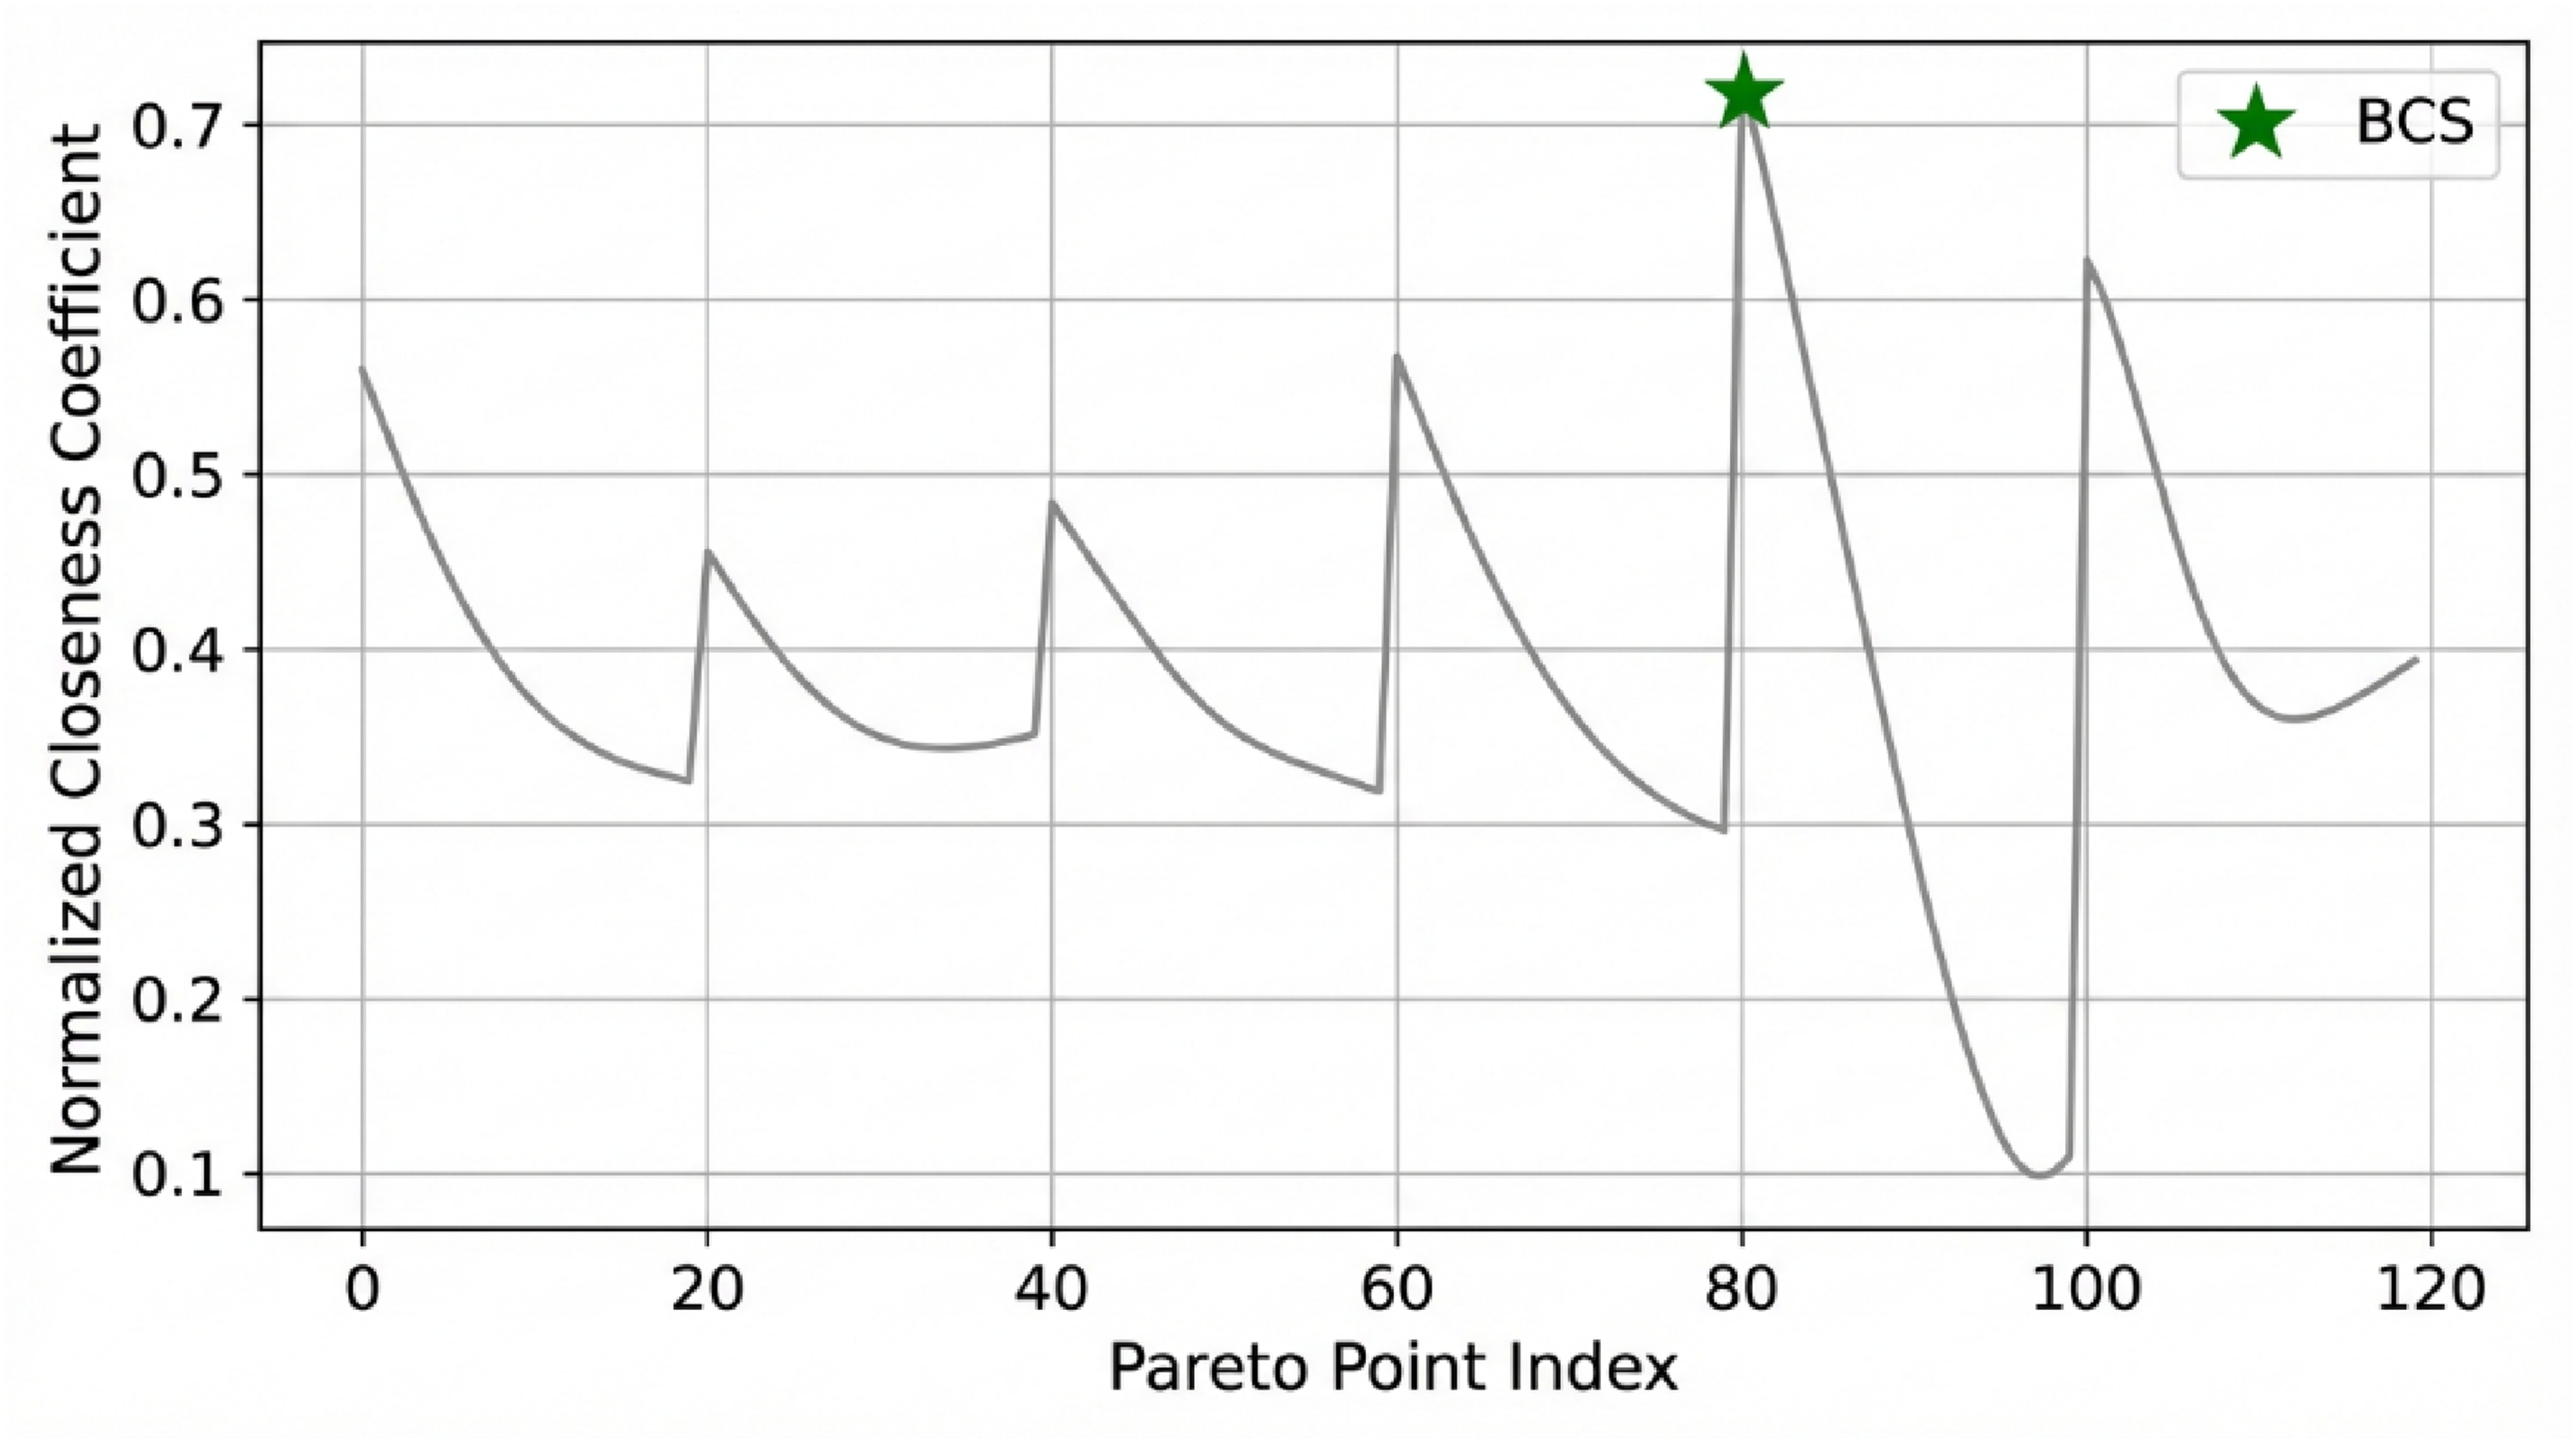
Normalized-closeness ranking trend from TOPSIS multi-objective analysis along the Pareto-solution index; the Benchmark Case Study (BCS) point marks the highest Ci∗ ( (.72), showing optimal compromise among objectives.
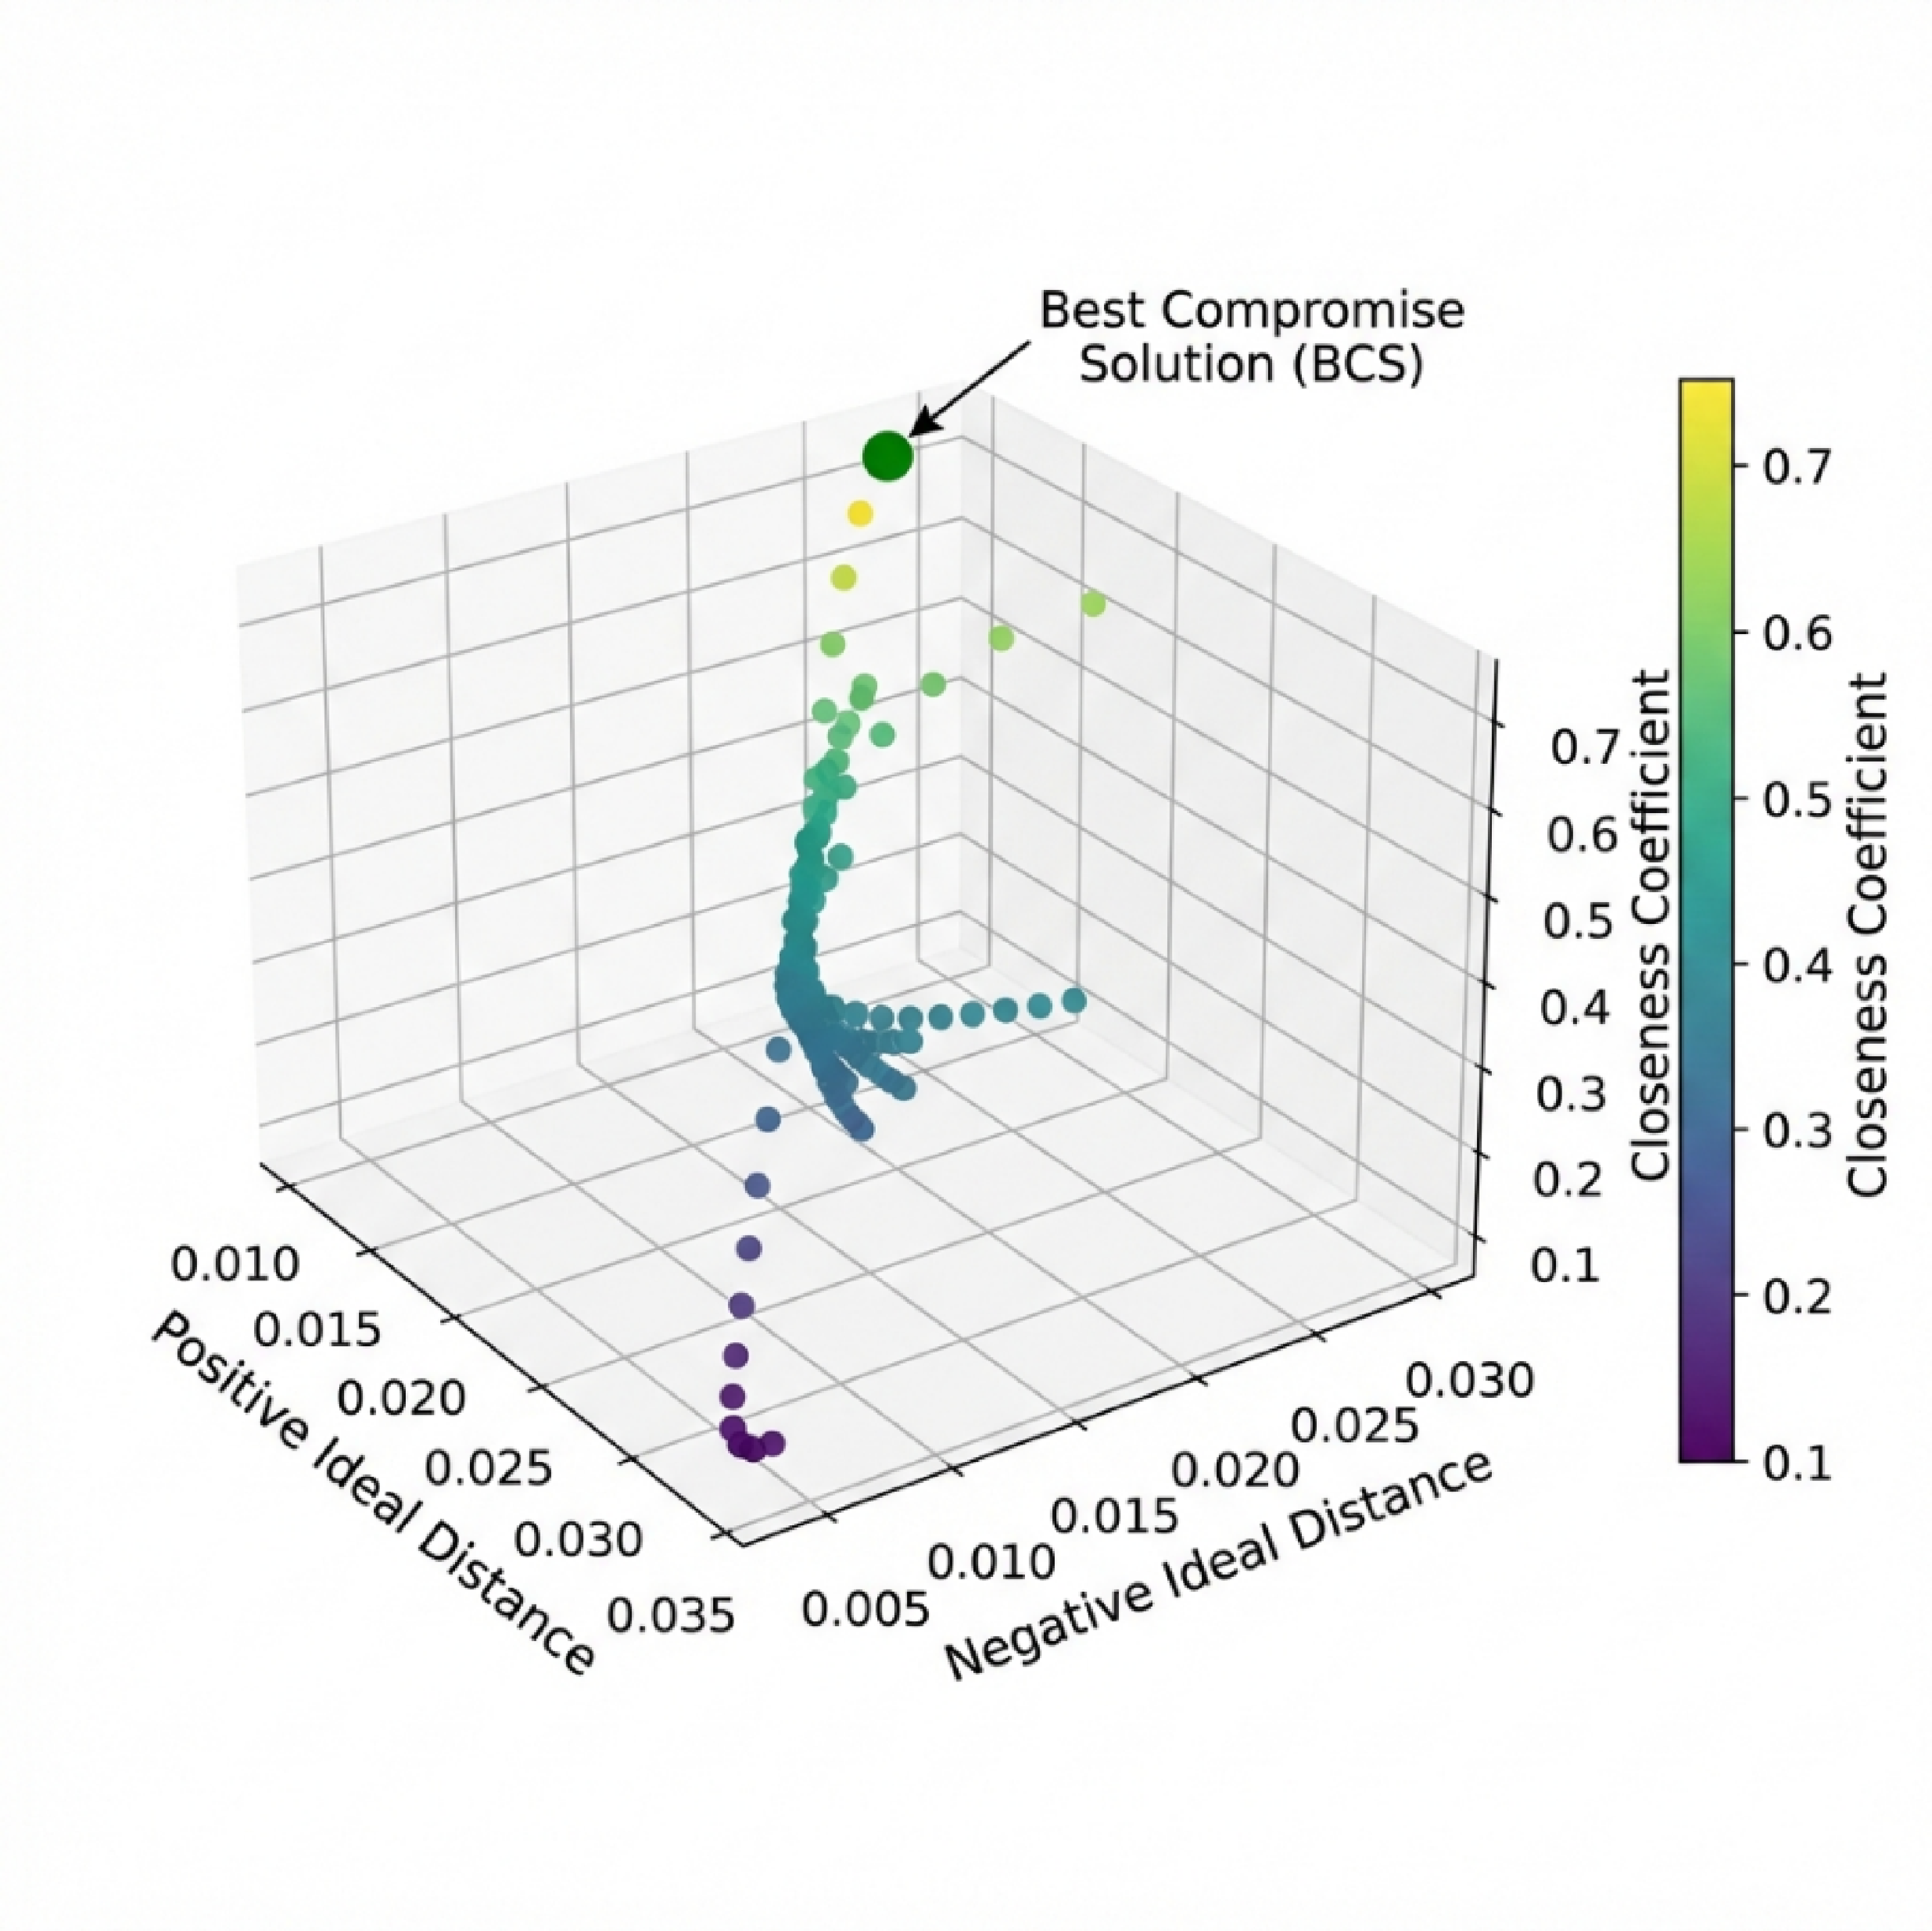
Three-dimensional representation of relative distance to the ideal positive and negative solutions, color-coded by normalized closeness; the green Benchmark Case Study (BCS) point resides in proximity to the multi-objective ideal region.
Together, Figures 18 and 19 provide the decision-ranking framework that identifies the best-performing Pareto configuration through the TOPSIS technique. As observed in Figure 18, the normalized closeness coefficient varies substantially with the Pareto index, displaying several local peaks and valleys—an indication of alternating dominance among the competing scenarios. The maximum the normalized closeness coefficient of 0.72, corresponding to the point highlighted as BCS, represents the most balanced solution where the exergy efficiency, environmental performance, and total cost rate simultaneously approach their optimal levels. Lower regions of the normalized closeness coefficient of the –0.35 correspond to configurations with either higher cost or reduced thermodynamic performance, confirming their weak dominance status within the Pareto set.
In Figure 19, the spatial visualization further clarifies this ranking. The Pareto points form a nonlinear curve connecting the extremes of distance to the best ideal and distance to the worst ideal. As the TOPSIS model predicts, higher the normalized closeness coefficient values are concentrated near the lower positive ideal distance region and moderate negative ideal distance values—precisely where the BCS point resides. This indicates that the BCS condition not only achieves thermodynamic harmony but also resides closest to the multi-objective ideal reference, confirming the robustness of the optimization for ORC–TE integrated systems.
The optimized decision variables corresponding to the BCS, identified through the NSGA-II–TOPSIS framework, are summarized in Table 3. These values represent the most balanced compromise between exergy efficiency, environmental performance, and total cost rate. The obtained configuration highlights the dominant role of gas inlet temperature and turboexpander efficiency in achieving superior system performance, while maintaining economic feasibility.
Optimized decision variables corresponding to the BCS solution
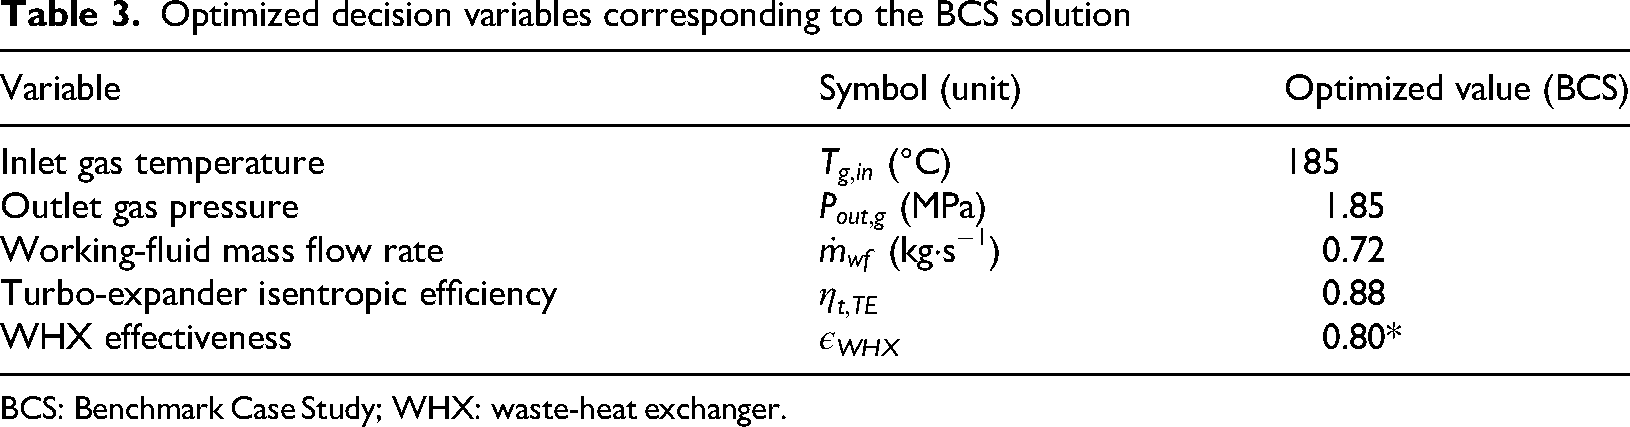
BCS: Benchmark Case Study; WHX: waste-heat exchanger.
Influence of weighting strategies on TOPSIS-based ranking
Figure 20 presents the three-dimensional decision space comparing the best Pareto-front alternatives under three distinct weighting schemes applied in the TOPSIS multi-criteria evaluation. The horizontal axes represent Exergy Efficiency and Thermo–Environmental Synergy Indicator, while the vertical axis denotes the Normalized Total Cost Rate. Each marker corresponds to a unique weighting method: equal weights, entropy weights, and sensitivity-based weights. Figure 21 depicts the variation of the Normalized Closeness Coefficient for these three weighting approaches as a function of the Pareto Point Index, illustrating how the ranking trends fluctuate depending on the weighting rationale. The highest-ranked alternatives, indicated with star symbols, denote the optimal configurations suggested by each method.

Three-dimensional Pareto surface showing optimal points determined by three weighting schemes in TOPSIS analysis: equal, entropy, and sensitivity-based weights; plotted with Exergy Efficiency, Thermo-Environmental Synergy Indicator, and Normalized Total Cost Rate.
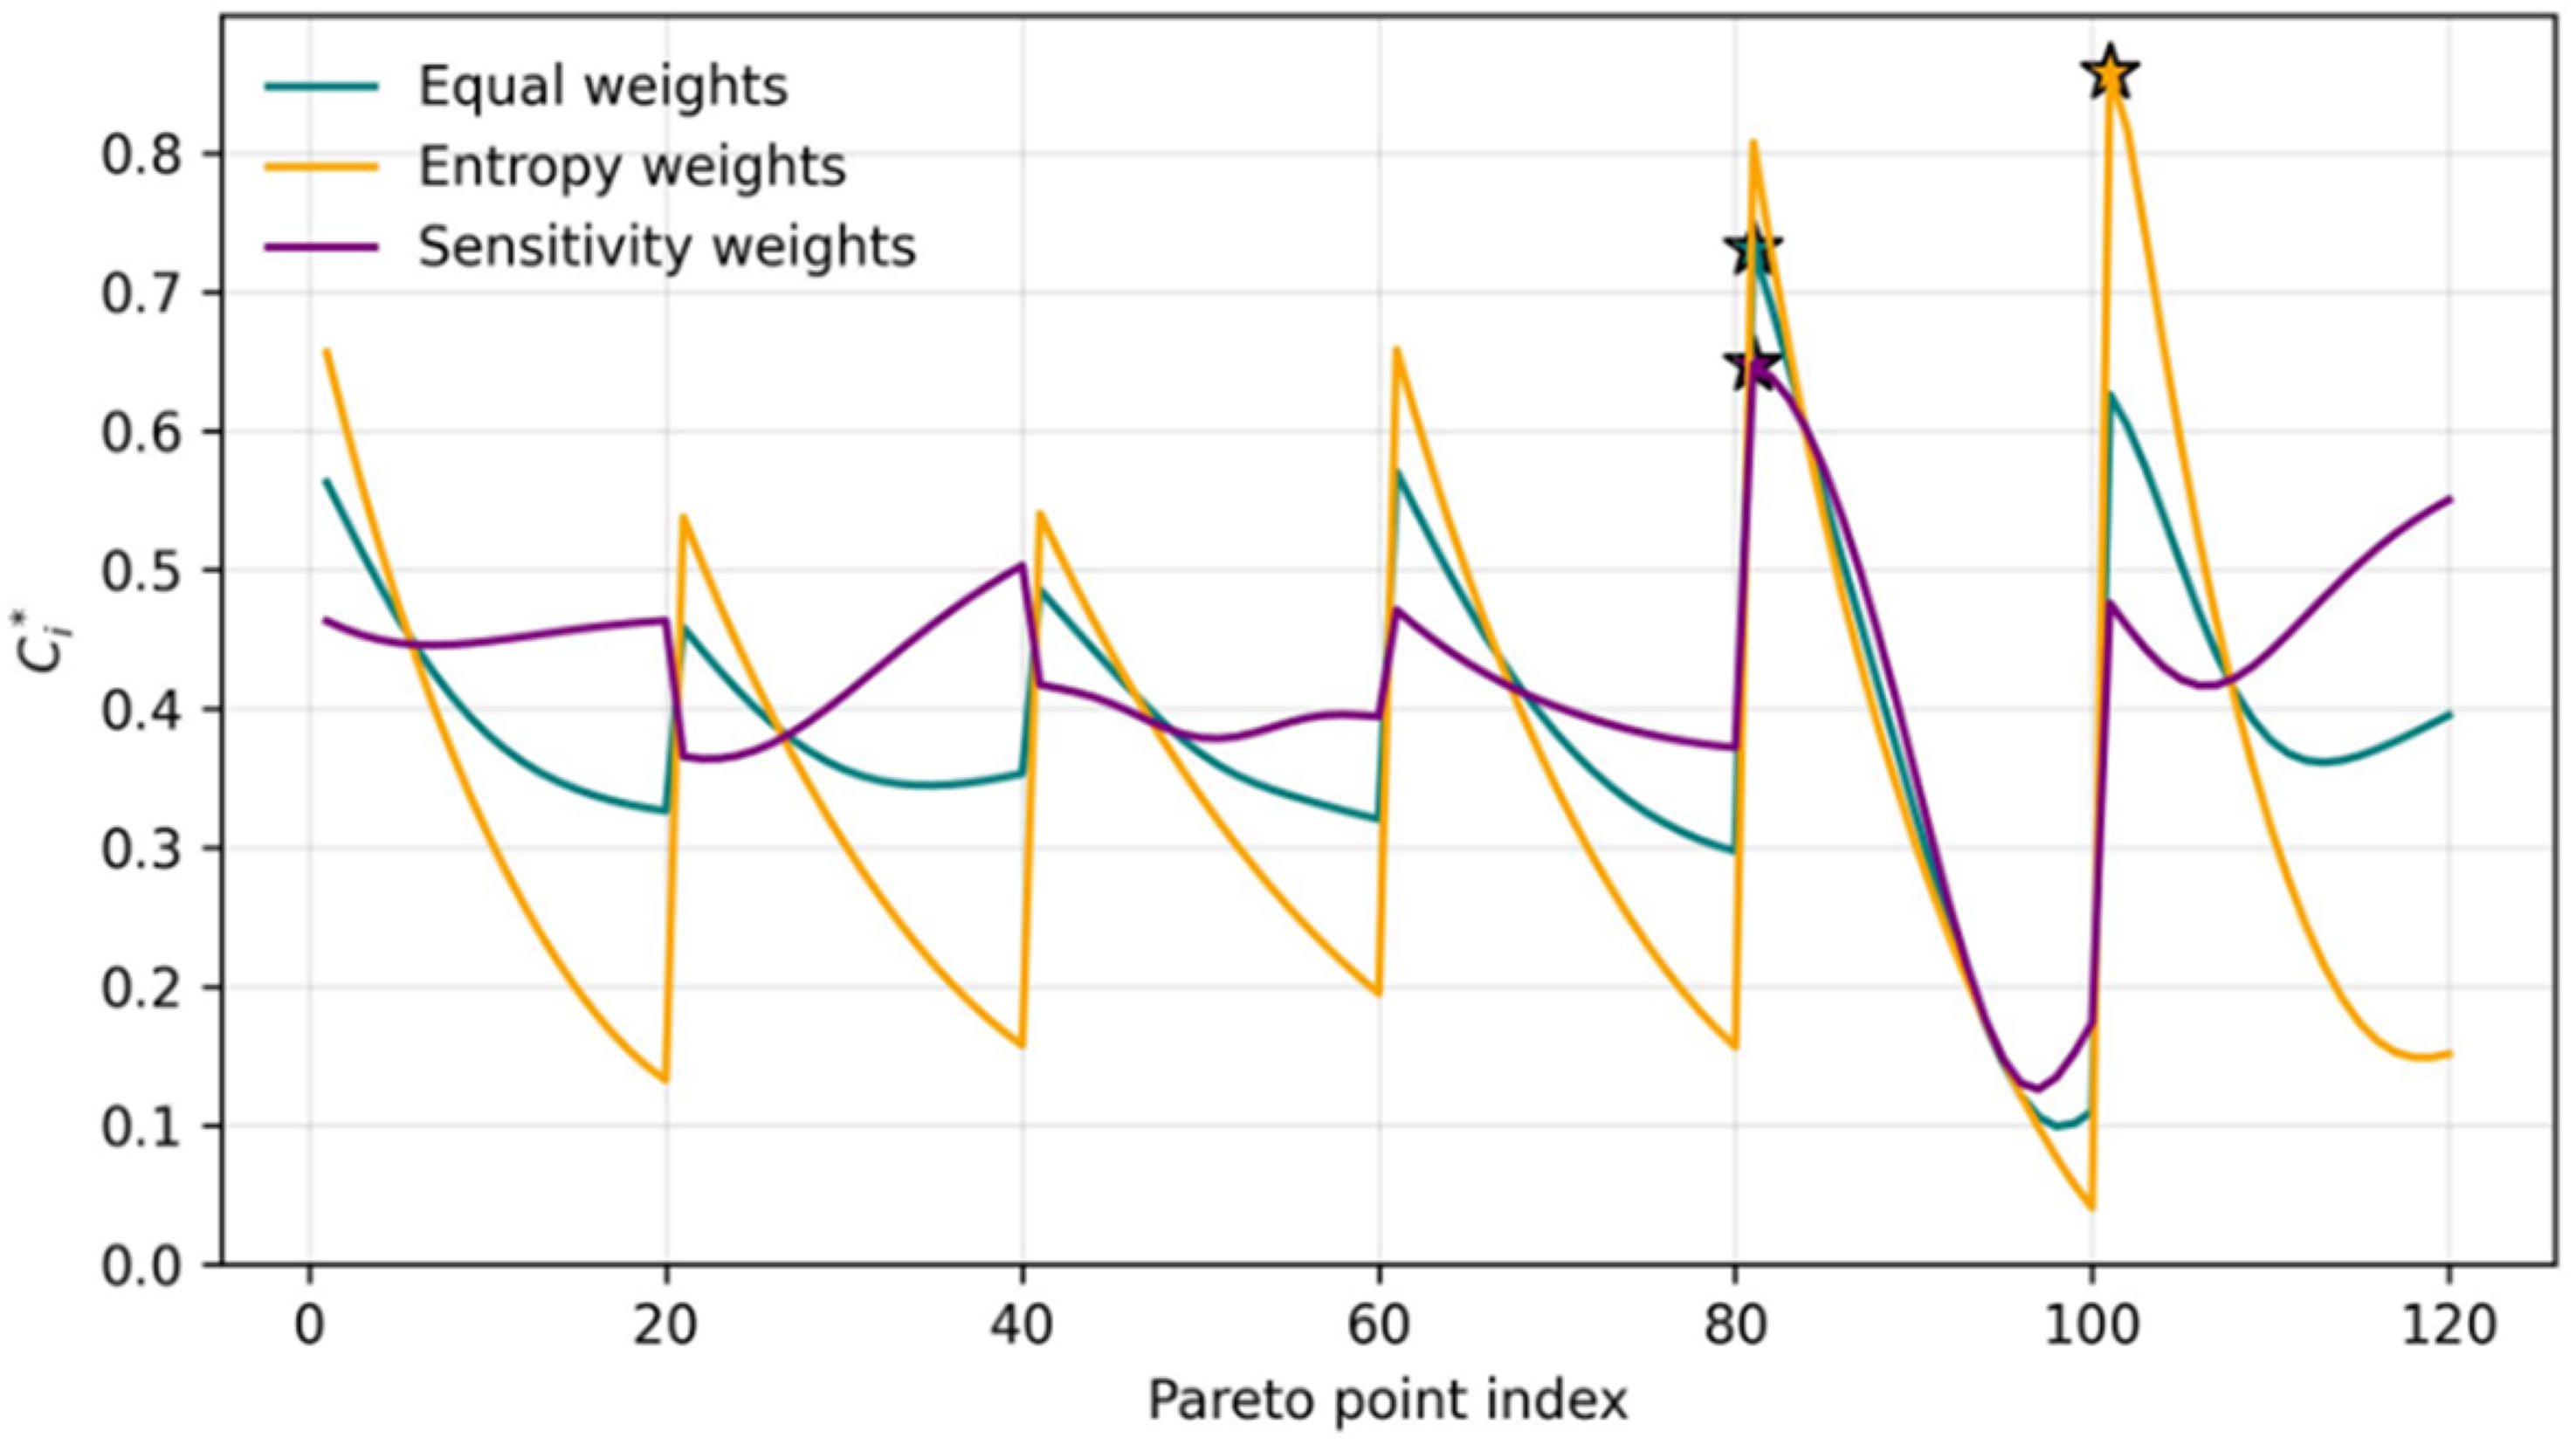
Normalized closeness coefficient trends versus Pareto Point Index for equal, entropy, and sensitivity-based weighting methods; star markers denote optimal ranked configurations under each scheme.
Figures 20 and 21 collectively examine the influence of weighting strategy in TOPSIS-based decision analysis for the ORC–TE hybrid system. In Figure 20, all three weighting outcomes lie on the Pareto optimal surface, yet they occupy noticeably distinct regions in the Exergy Efficiency, Thermo–Environmental Synergy Indicator, and Total Cost Rate space. The Sensitivity-based weights identify a compromise solution with moderate cost (Total Cost Rate of 0.47– normalized scale) and superior overall performance (Exergy Efficiency of 0.78, Thermo–Environmental Synergy Indicator of 0.026). The entropy-weighted alternative favors stronger thermodynamic and environmental outcomes (Exergy Efficiency of 0.70, Thermo–Environmental Synergy Indicator of 0.022) but at the expense of higher cost. The equal-weight case locates an intermediate tradeoff yet falls marginally below the sensitivity-weighted optimum in both efficiency and cost performance.
As shown in Figure 21, the Normalized Closeness Coefficient ranking displays clear divergence between the weighting models. The Entropy weight curve yields sharp oscillations between 0.1 and 0.8 due to its high differentiation sensitivity, suggesting that minor Pareto variations significantly alter rank order. Conversely, the equal-weight curve produces smoother gradients with limited peaks (0.56), indicating more uniform preference across the Pareto set. The sensitivity-weight curve, reflecting physically derived parameter influence, reveals the most stable and physically interpretable ranking, peaking at the Normalized Closeness Coefficient of 0.73—corresponding to the BCS-adjacent optimum.
Conclusion
This study comprehensively investigated the thermodynamic, environmental, and exergoeconomic performance of a hybrid ORC–TE system integrated into an NGPRS. The core motivation arises from the substantial pressure-exergy and waste-heat losses inherent to conventional PRS facilities, where valuable energy potential is typically dissipated without recovery. To address this challenge, a hybrid configuration was proposed that simultaneously exploits pressure energy through a TE and thermal energy through an organic Rankine subcycle, thereby enhancing overall energy utilization within existing PRS infrastructure.
A unified thermo-exergoeconomic framework was developed by coupling first- and second-law analyses with component-level cost-rate modeling. The system was optimized using the NSGA-II algorithm under three conflicting objectives: maximizing exergy efficiency, maximizing the environmental performance index, and minimizing the total cost rate. The results revealed a strong interdependence among these criteria, demonstrating that improvements in thermodynamic performance inherently promote environmental benefits and cost reduction up to a Pareto-equilibrium region. The identified BCS is characterized by an exergy efficiency of 0.71, a thermo–environmental synergy indicator of 0.0275, and a normalized total cost rate of 0.47.
Parametric and sensitivity analyses further indicated that turbine isentropic efficiency and gas inlet temperature are the most influential operating parameters governing system performance, while the gas mass flow rate plays a secondary but non-negligible role. The environmental performance index exhibited a nearly linear increase with gas inlet temperature and mass flow rate, primarily due to enhanced net electrical power generation, which leads to a higher rate of avoided CO₂ emissions per unit of useful electricity supplied to the grid.
A subsequent multicriteria decision analysis based on the TOPSIS method confirmed that sensitivity-derived weighting factors provide the most stable and physically consistent ranking of Pareto-optimal solutions, yielding a maximum normalized closeness coefficient of 0.73. This outcome ensures that the selected operating point achieves a balanced compromise among thermodynamic efficiency, electricity-driven CO₂ emission reduction, and economic feasibility, without imposing excessive design or operational complexity.
The principal novelty of this work lies in the full integration of thermodynamic, exergy, environmental, and economic evaluations within a unified multi-objective optimization and decision-making framework tailored for realistic PRS operating conditions. Unlike previous studies that focused primarily on single-objective or first-law-based analyses, the present approach provides a systematic methodology for identifying optimal operating corridors in hybrid ORC–TE systems.
From a broader perspective, the findings support the practical implementation of ORC–TE hybrid systems in urban and industrial gas-distribution networks, where persistent pressure and thermal losses occur. Such integration has the potential to reduce overall energy waste, lower CO₂ emissions through electricity recovery, and improve the economic performance of natural gas infrastructures. Future research should extend the present framework toward (i) dynamic and transient simulations under variable gas-flow regimes, (ii) experimental validation of component-level efficiencies and control strategies, (iii) exploration of alternative working fluids and multi-stage expanders, and (iv) advanced hybrid decision frameworks combining evolutionary optimization with data-driven or learning-based approaches.
Footnotes
Notation
Latin symbols
Greek symbols
Funding
The authors disclosed receipt of the following financial support for the research, authorship, and/or publication of this article: This research is funded by INTI International University.
Declaration of conflicting interests
The authors declared no potential conflicts of interest with respect to the research, authorship, and/or publication of this article.