
Abstract
This research presents a new method to reduce the environmental impact of reverse osmosis (RO) systems in solar farms. The concept involves enhancing the connection between water, energy, and the environment by utilizing an RO system that is powered by an organic Rankine cycle (ORC), which produces electricity using heat from a solar field. The study examines various ORC setups and operating fluids based on energy analysis (1E), exergy (2E), economic (3E), and environmental effects (4E) to create clean water. Important aspects of the optimization process include selecting the ORC setup, picking the working fluid for the ORC, and establishing the design parameters for the solar parabolic farm. These parameters are fine-tuned using a genetic algorithm technique. The findings show a 12% decrease in environmental impact and a 7.5% improvement in exergy efficiency due to this three-objective optimization strategy.
Introduction
The connection between water and energy is a crucial topic in regional system development (Li, 2018; Shahzad et al., 2017; Shayesteh et al., 2019). Recently, there has been a growing focus on the water–energy–environmental relationship, especially with advancements in desalination technologies (Alayi and Ebazadeh, 2025; Zhang et al., 2025). The direct impact of desalination systems on marine habitats has made their environmental effects more significant.
An increase in water salinity and the discharge of injected materials for pretreatment, as well as a reduction in dissolved oxygen in water, can directly impact the animal environment (Jamali Shakarab et al., 2025: Mohammad et al., 2025). Other factors, such as the production of foam, injection of after water (brine) with high temperature, and an increase in the concentration of heavy metals, also play a role in affecting the environment (Shayesteh et al., 2019). Additionally, energy consumption in desalination systems, particularly membrane systems, leads to fuel consumption and increased production of greenhouse gases to provide energy.
Increasing costs and environmental effects are one of the challenges in this field. For this purpose, extensive research has been done on desalination systems. The process of research carried out since 1980 until today regarding the desalination system can be seen in Jones et al. (2019). In recent years, the research process has doubled every 5 years, and this shows the importance of the issue. Most research has concentrated on the different types of water desalination technology, with over half of these studies examining the economic factors of producing fresh water (Ebazadeh et al., 2024: Haghmoradkhani et al., 2025; Rajhi et al., 2024). Recently, there has been an increase in publications analyzing the environmental impacts of water desalination. However, there has been less focus on the environmental effects of production wastewater compared to other aspects of water production in desalination plants (Jones et al., 2019).
Since the 1980s, membrane technology has played a major role in fresh water production. In 2000, around 11.4 million cubic meters of fresh water were produced using thermal systems alongside membrane technology. However, today, reverse osmosis (RO) systems have become the dominant method, accounting for approximately 69% of global fresh water production, which is equivalent to 65.5 million cubic meters (Jones et al., 2019).
Common thermal desalination systems consume more energy (heat and electricity) compared to RO systems (Burn et al., 2015; Lattemann et al., 2010; Troullaki et al., 2021). The primary expense associated with using an RO system is typically between 30% and 50% of the total cost, and it is directly tied to the system's operational expenses (Naminezhad and Mehregan, 2022; Voutchkov, 2018). The pressure supply section of the membrane system is the main source of energy consumption in the RO system. The amount of energy used and the cost of water produced through RO desalination depend on factors such as water salinity, concentration of fresh water produced, salt density index (SDI), and the type of energy recovery system used. When desalinating seawater, energy consumption is 12 kWh/m3 without a recovery device and 4 kWh/m3 with one. As RO technology has improved and become more efficient, the cost of producing fresh water has dropped from nearly 2$$/m3 to 0.8$$/m3 (Burn et al., 2015; Shalaby, 2017), with a large part of this cost reduction due to the use of energy recycling devices.
To reduce costs, greenhouse gas production, increase productivity, and minimize the environmental impact of RO systems due to their high energy consumption, solar energy can be utilized to produce fresh water. This article focuses on the use of thermal waste to address environmental concerns related to RO systems.
In different years, we can see the attention of authors to articles and topics related to solar energy and water desalination. The growing trend of attention to these two topics is due to factors such as reducing environmental impacts, increasing fossil fuel costs, and attention to remote areas. This growing trend can be seen in the research of Ahmed et al. (2019).
Reif and Alhalabi (2015) investigated the challenges of desalination and solar solutions to produce fresh water. In this article, based on the areas with water stress and the demand needed for desalination, and the matching of this information with the energy received from the sun in each region, the only solution to overcome the water challenge of using solar energy was introduced. In a study, Pugsley et al. (2016) determined the requirement for each country to utilize solar energy based on a specific index. Each country was ranked to identify those with high potential to produce fresh water affordably using solar energy. The study considered factors such as water stress, access to different water sources, solar radiation levels, future water needs, and climate conditions. Iran was identified as having a high potential for using solar energy to produce fresh water. Up until 2019, 130 billion cubic meters of water were extracted from renewable sources (Gorjian and Ghobadian, 2015), which, according to the research of Gorjian and Ghobadian (2015), is one way to decrease the extraction of underground and renewable water: by utilizing solar energy for water desalination. According to data from the Energy Agency, the CO2 production capacity in Iran rose from 41 million tons in 1970 to 532 million tons in 2012, and is projected to reach 925 million tons per year by 2020. The use of fossil fuels for desalination systems in Iran will only worsen this problem.
Ahmed et al. (2019) proposed using solar energy to create fresh water as a way to decrease carbon emissions. The article discusses the use of solar systems combined with reverse osmosis (PV-RO) and steam turbine systems combined with reverse osmosis (ST-RO) powered by solar energy, as well as the use of membrane technologies that can produce fresh water with little heat from the sun. In this article, it was determined which technologies are in the stage of commercialization and can be implemented to produce fresh water and combine it with renewable energies. The results showed that to produce fresh water on a large scale, it is necessary to use thermal technologies, RO, photovoltaic solar systems, and solar panels.
Bian et al. (2019) in India produced fresh water and heat for a small village using a solar system. This technical and economic feasibility study was done based on the prevailing laws in India. In the optimization, current costs were reduced to 10%, and in this system, using brackish water based on an RO system and with the help of an energy recovery system, fresh water was produced for different villages in India.
Saffarini et al. (2012) evaluated membrane distillation systems using solar energy. In this review, membrane systems were investigated as a technology that can be developed in the future. In this research, different structures of solar technology were investigated and evaluated. The study found that solar collectors can produce a large amount of fresh water.
A review of large-scale desalination projects has been developed since 1995. Tsilingiris (1995) investigated large desalination systems with solar energy. The development of these designs, especially with the help of the multi-stage distillation thermal system, introduced a solution to reduce water stress. Hoffman (1992) previously reviewed the different methods of combining solar systems in his article. This study compared the cost of producing fresh water using solar energy versus fossil fuels. Glueckstern (1995) explored the possibility of using solar energy to desalinate seawater. Through an economic analysis, it was determined that thermal systems and RO are viable technologies to combine with solar systems for this purpose. Kalogirou (1998) conducted a study on a solar water desalination system that utilized a parabolic collector and a multi-stage distillation system. The findings indicated that this system, covering an area of 2160 m2, could produce water for 0.89$$/m3. Trieb et al. (2008, 2003) conducted research on desalination technologies and their combination with solar energy in the Middle East and North Africa. They found that concentrating solar power (CSP) systems are cost-effective technologies for producing large amounts of fresh water. In a separate study from 2009, they looked at a sample study and discussed how it could be integrated with solar energy. The findings from these studies indicate that solar energy can enhance the production and versatility of existing power plants for cooling, heating, and water and electricity production (Trieb et al., 2009).
Different combinations of thermal power plants with CSPs for the Persian Gulf area were investigated by Palenzuela et al. (2015). Li et al. (2013a), in the review of the works done in this regard, finally investigated the cost of water according to production tonnage. The results show the use of MED and RO systems to reduce costs and increase production. The results showed that among solar technologies, concentrator systems have the ability to combine with desalination systems from an economic point of view. This study found that CSP systems combined with RO systems and multiple-effect distillation (MED) are the most efficient in producing fresh water. Several articles have explored the combination of solar and desalination systems, focusing on their energy and economic aspects (Li et al., 2013b; Qtaishat and Banat, 2013; Shatat et al., 2013; Suárez et al., 2014).
Yu et al. (2023) examined recent advances in interfacial solar vapor generation: clean water production and beyond. Elsheikh et al. (2019) investigated the solar energy system using a neural network. The advancement of various solar energy systems is crucial for addressing the current energy challenges. In this article, a neural network was introduced as a suitable system for comprehensive modeling of the solar system. Askari and Ameri (2018) used linear Fresnel mirrors and organic Rankine cycle (ORC) to drive an MED. In this system, saturated steam temperature of 70 °C and MED with a dimensionless production gain index of 9.8 were used. Economic analysis was also used to examine the system.
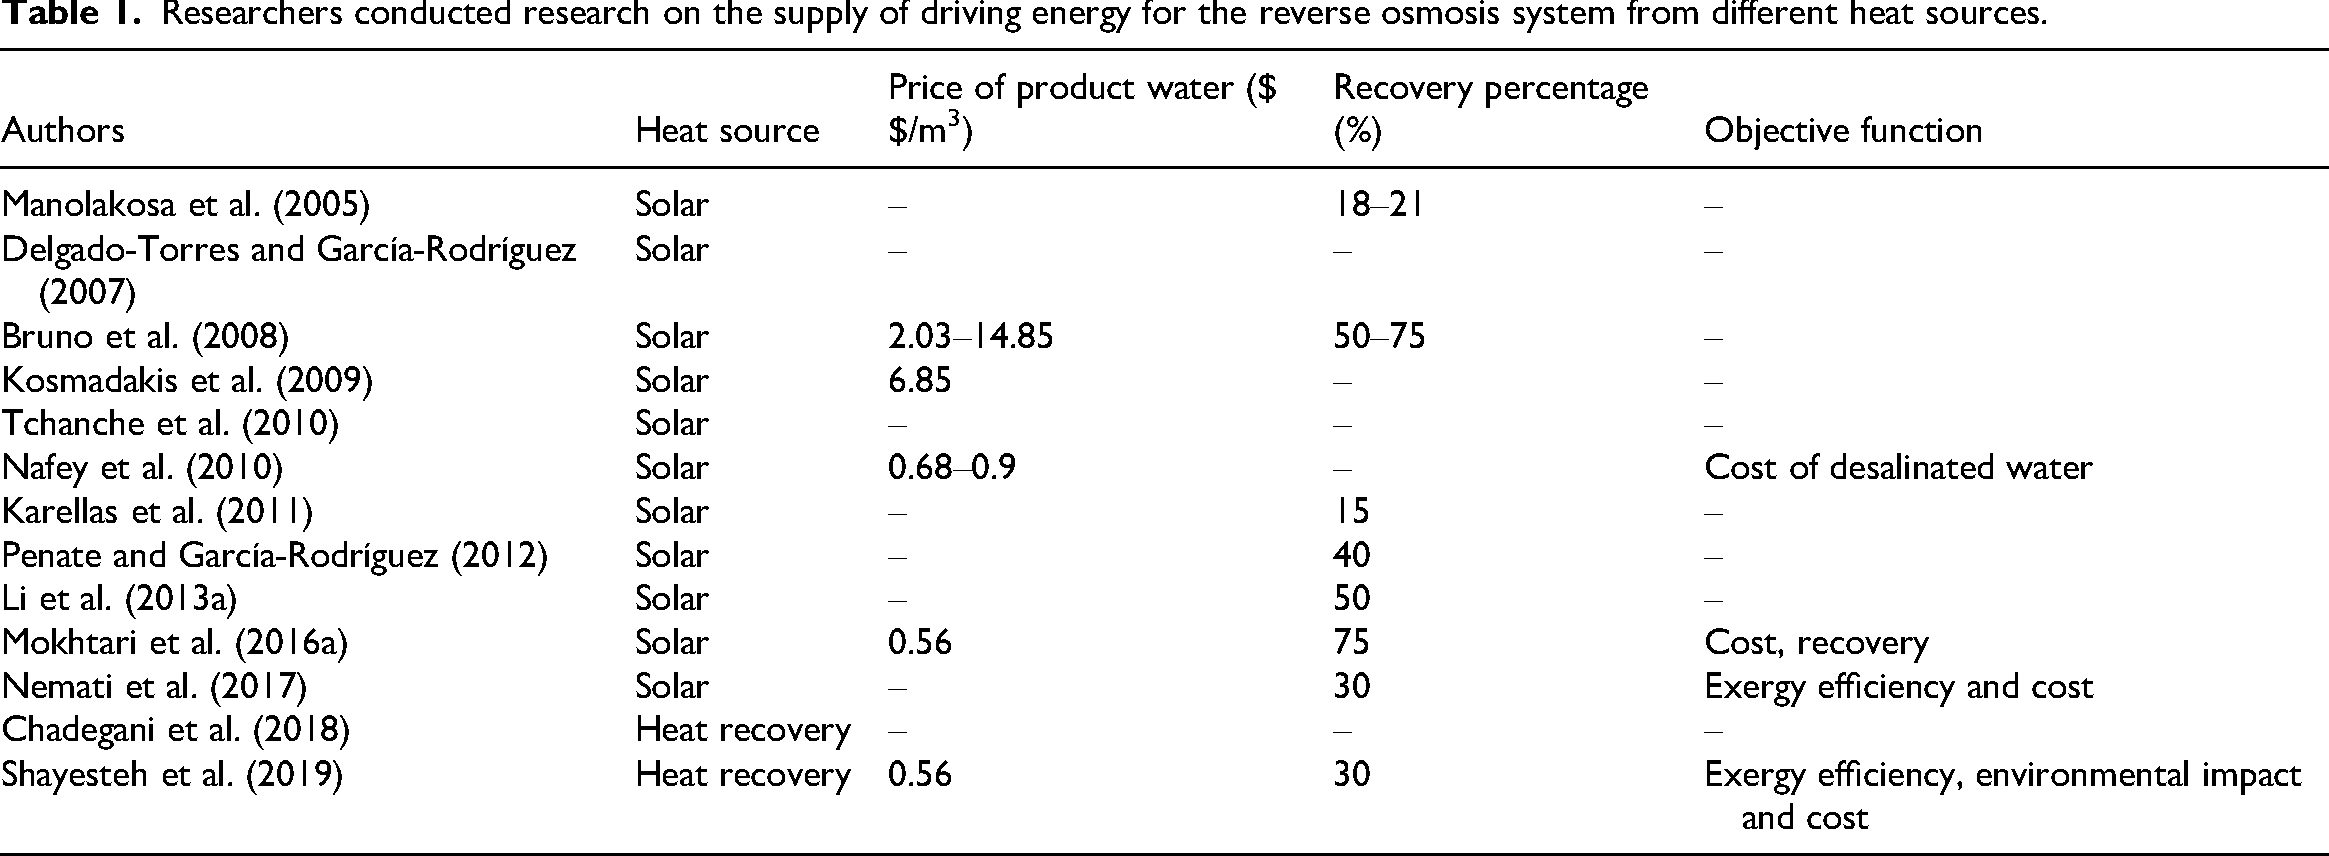
Improving the performance of the ORC in energy recovery depends on several factors. These include how the ORC is configured, the choice of working fluid based on heat source conditions, temperature source restrictions, and using the ORC system for simultaneous production. Many studies have been conducted on these parameters, particularly on configuring the system and selecting the working fluid based on heat source conditions. Some of these studies are listed in Table 1. Research has shown that the fluid with a critical temperature closer to the heat source has the highest thermal efficiency.
Researchers conducted research on the supply of driving energy for the reverse osmosis system from different heat sources.
Asayesh et al. (2017) produced electricity and fresh water simultaneously with a solar chimney. In this work, the mentioned system was optimized based on the bird algorithm. The selected technology in desalination is based on the production of electricity by the RO system, and the amount of water production is reported to be insignificant.
Du et al. (2017) investigated the absorption desalination system. In this system, which works based on silica gel material, it sweetens water in two stages: water absorption and removal. This system, which is a transitory system, does not continuously produce fresh water; rather, a set of the mentioned systems can produce a constant amount of water. In this article, the area of the heat supply collector for the absorption system was optimized and designed. This system can be operated at low temperatures and has a low ratio of energy consumption to produce fresh water. These results have been analyzed for different environmental conditions and the amount of solar radiation.
Depending on where a water desalination plant is located, different methods are used to dispose of wastewater. Typically, the waste is injected into the sea or oceans, affecting about 5 to 10 km of coastline and causing environmental issues in the area. Research by Jones et al. (2019) shows that a significant amount of brine is produced in the Middle East and North Africa, with more than a million barrels of wastewater being produced daily. The Middle East, specifically the United Arab Emirates, Saudi Arabia, and Qatar, is a major water producer, creating 72 million m3 of fresh water daily. Jones et al. (2019) also shows that the RO system, the primary technology for fresh water production, produces less brine compared to other systems. About 87.9% of this brine comes from systems using seawater, while the rest comes from various water sources.
Various studies have been conducted regarding the use of solar energy to produce fresh water. The current research has the following salient points, which are considered the strengths of the current research compared to other research:
Providing an index to investigate and analyze the environmental effects of desalination systems and their development to highlight the environmental analysis of desalination with solar energy. Modeling of a solar system with a desalination system based on three-objective optimizations. Determining the optimal ORC configuration for power generation through a solar farm. Investigating solar systems and desalination systems based on 4E analysis. Use of thermal losses to reduce environmental impacts. Selection of working fluid and energy recovery device (ERD) in the desalination section in a solar farm based on genetic algorithm.
Materials and methods
This study analyzes the ORC based on its energy, exergy, economic, and environmental impacts with different configurations. The costs increase from a simple Rankine cycle to RO to power the high-pressure pump in the system. Additional components like recuperators and heat exchangers are added to improve efficiency. The cycle configuration and operating fluid selection can be optimized using a genetic algorithm. The costs of membrane supply and system configuration design are considered goals. The solar system is optimized along with other cycles to determine parameters like absorber diameter and collector width. The genetic algorithm optimizes based on three-objective functions: exergy efficiency, fresh water unit product cost (UPC), and environmental effects. A dimensionless function is defined based on the density difference ratio of seawater and brackish water to minimize brackish water discharge and concentration.
In the explanation of the ORC–RO cycle section, it should be mentioned that the preheated water enters the pretreatment section. When the water passes through two media and carbon filters, it enters the RO system pump.
This research considers various indicators to design a system aimed at improving conditions. Parameters such as the number of stages, type of fluid, and membrane will be chosen in this review. In the RO system, feed water goes through stages to produce two concentrated and sweetened streams. The fresh water goes into a storage tank while the condensed flow enters a heat recovery system under high pressure. Different technologies, like a turbocharger or pressure converter, can be chosen for this system, with more detailed explanations available in Du et al. (2014).
Ultimately, the water from this outlet is combined with the water that was previously rejected from the system, as illustrated in the diagram. This is done to minimize the environmental impact, as well as to lower the salinity and temperature of the water before it flows into the sea.
Figure 1 illustrates the solar system setup used to power the RO system for generating fresh water. The design of the solar system focuses on efficiency, with the goal of optimizing the number of membranes to balance cost and environmental impact. Increasing water production results in higher brine salinity and more chemical injection materials. This means that simply producing more water does not necessarily reduce environmental effects. The concentration and volume of brine impact how quickly and extensively it mixes with seawater. Choosing an operating fluid that minimizes environmental impact is a key objective of this optimization process. To achieve the lowest cost for fresh water production, the solar farm must be designed for maximum efficiency while minimizing environmental impact. Several key factors need to be considered in this optimization process.
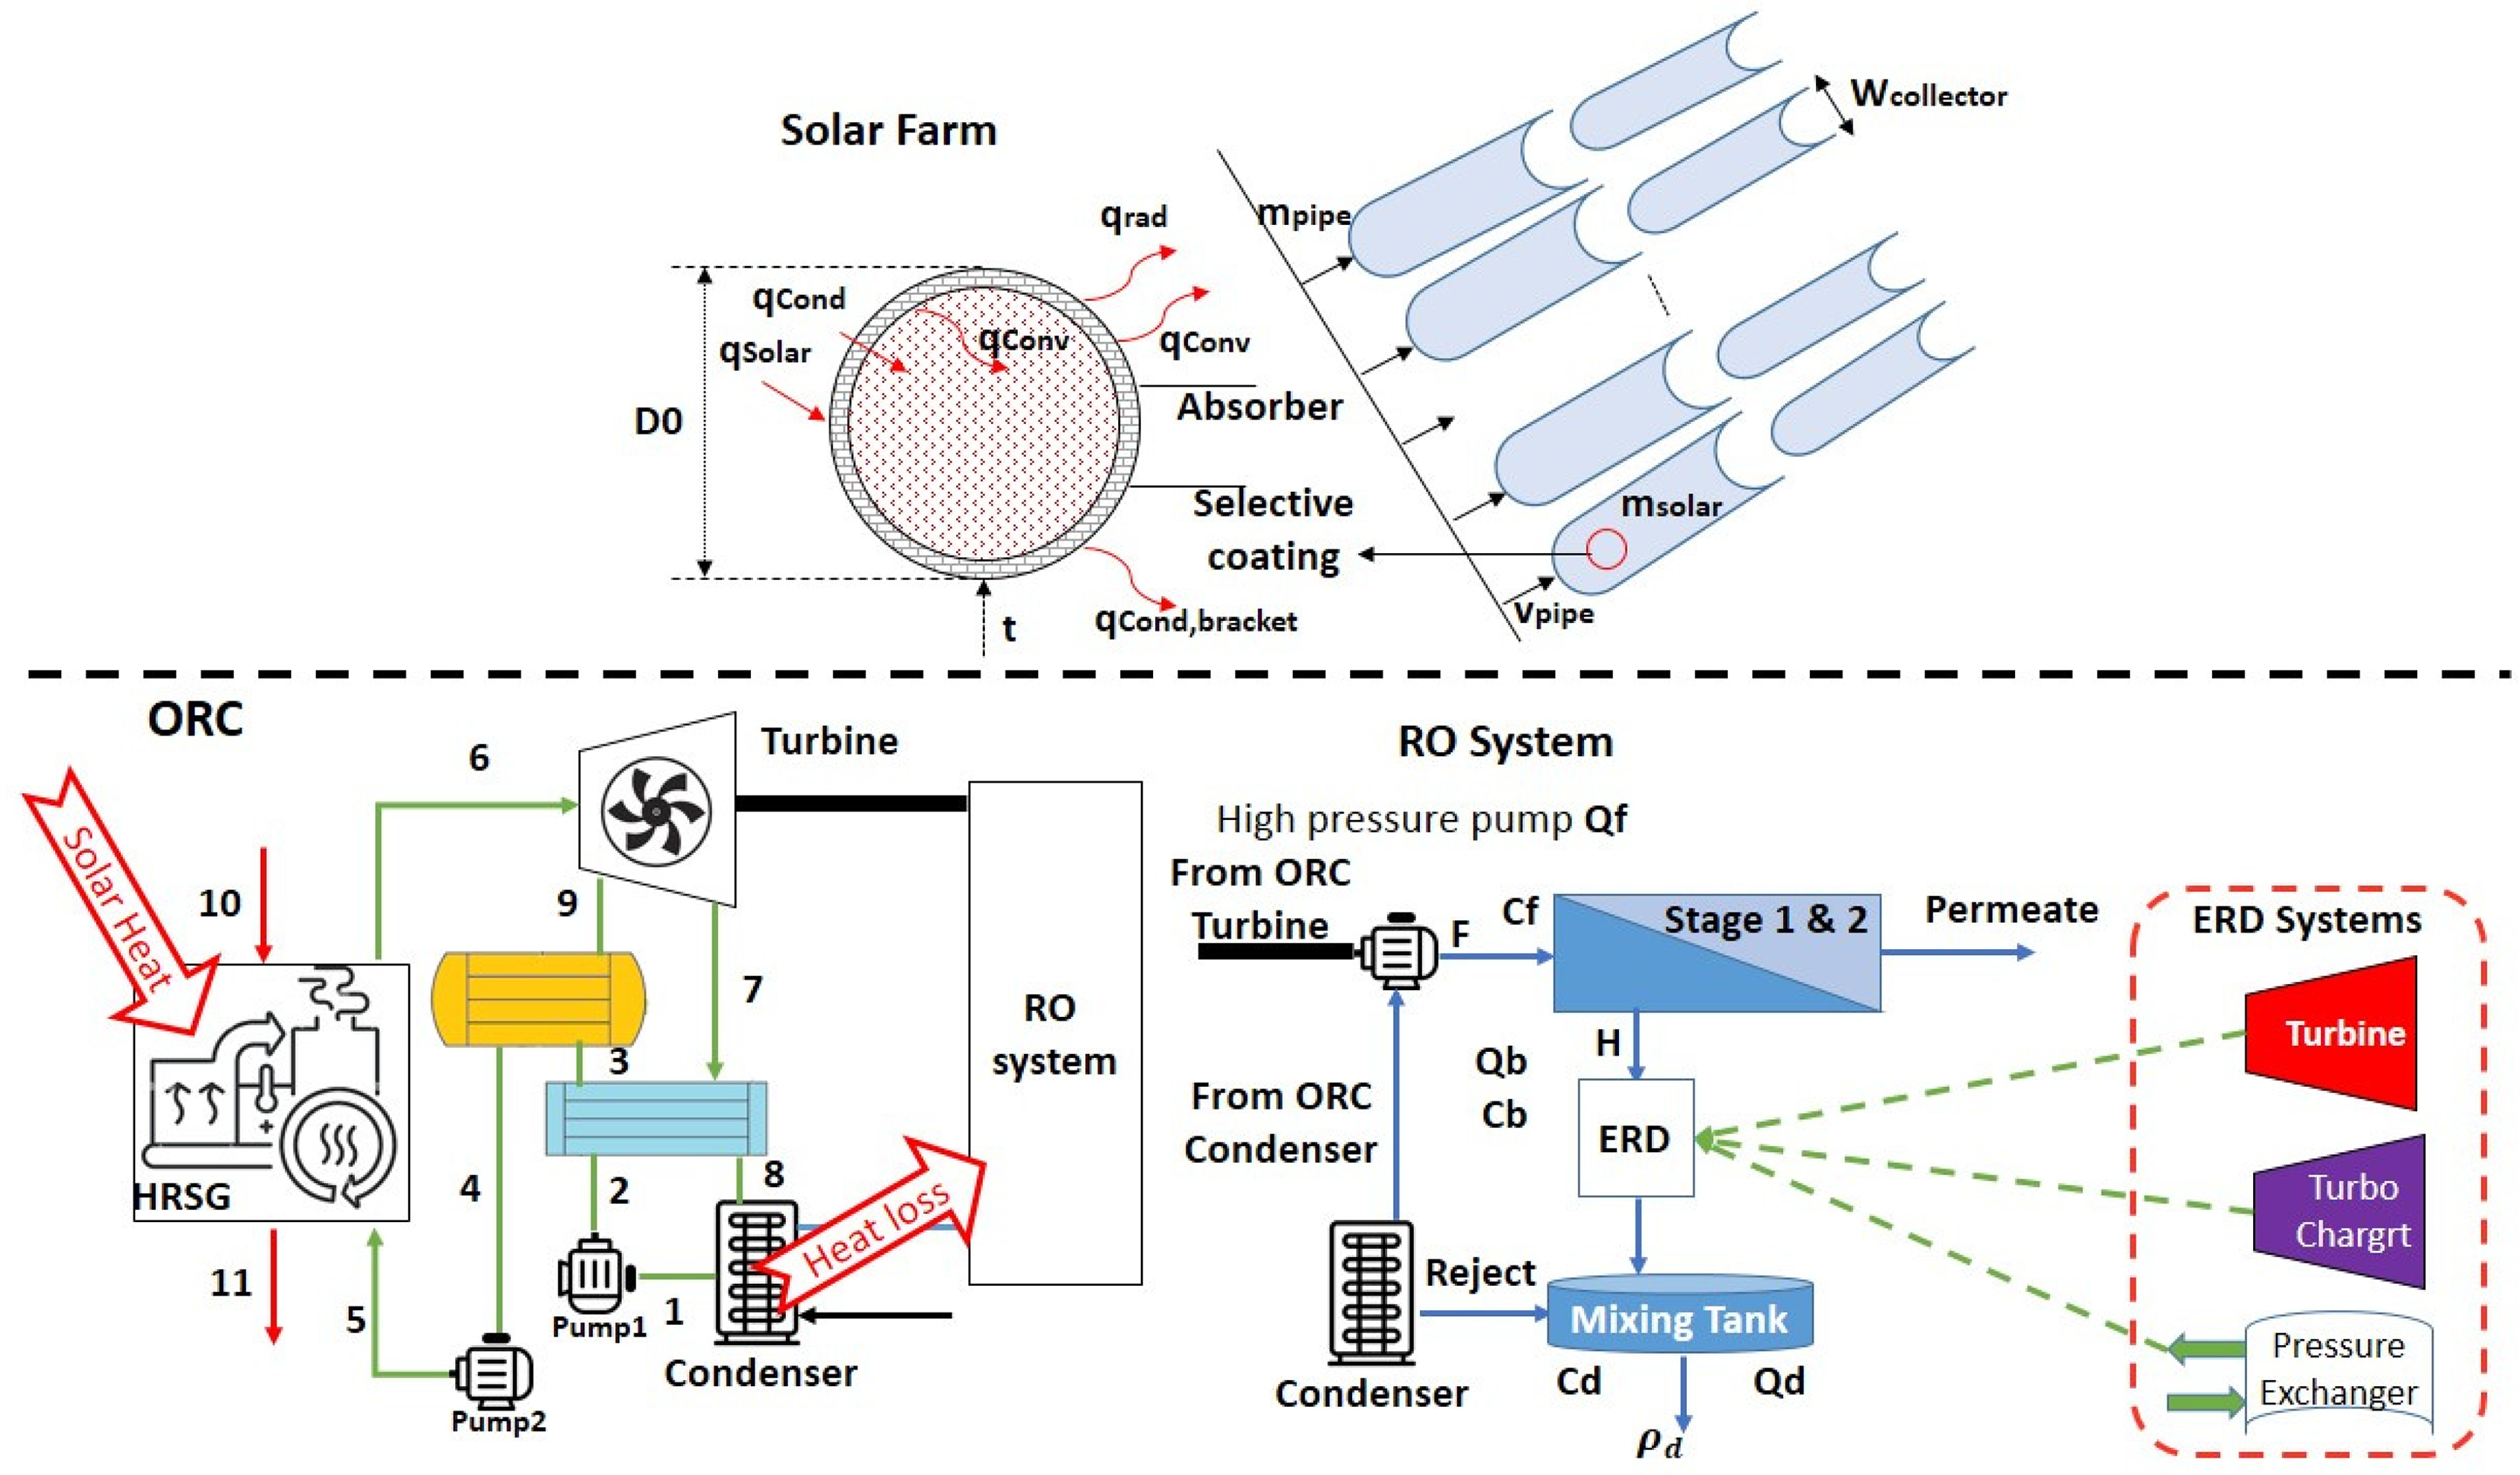
Schematic of the investigated cycle to produce power and fresh water with solar drive.
Modeling
In this part, energy, exergy, economic, and environmental effects of the system are analyzed.
Energy and exergy analysis
In this section, ORC and RO system modeling equations are presented.
ORC modeling
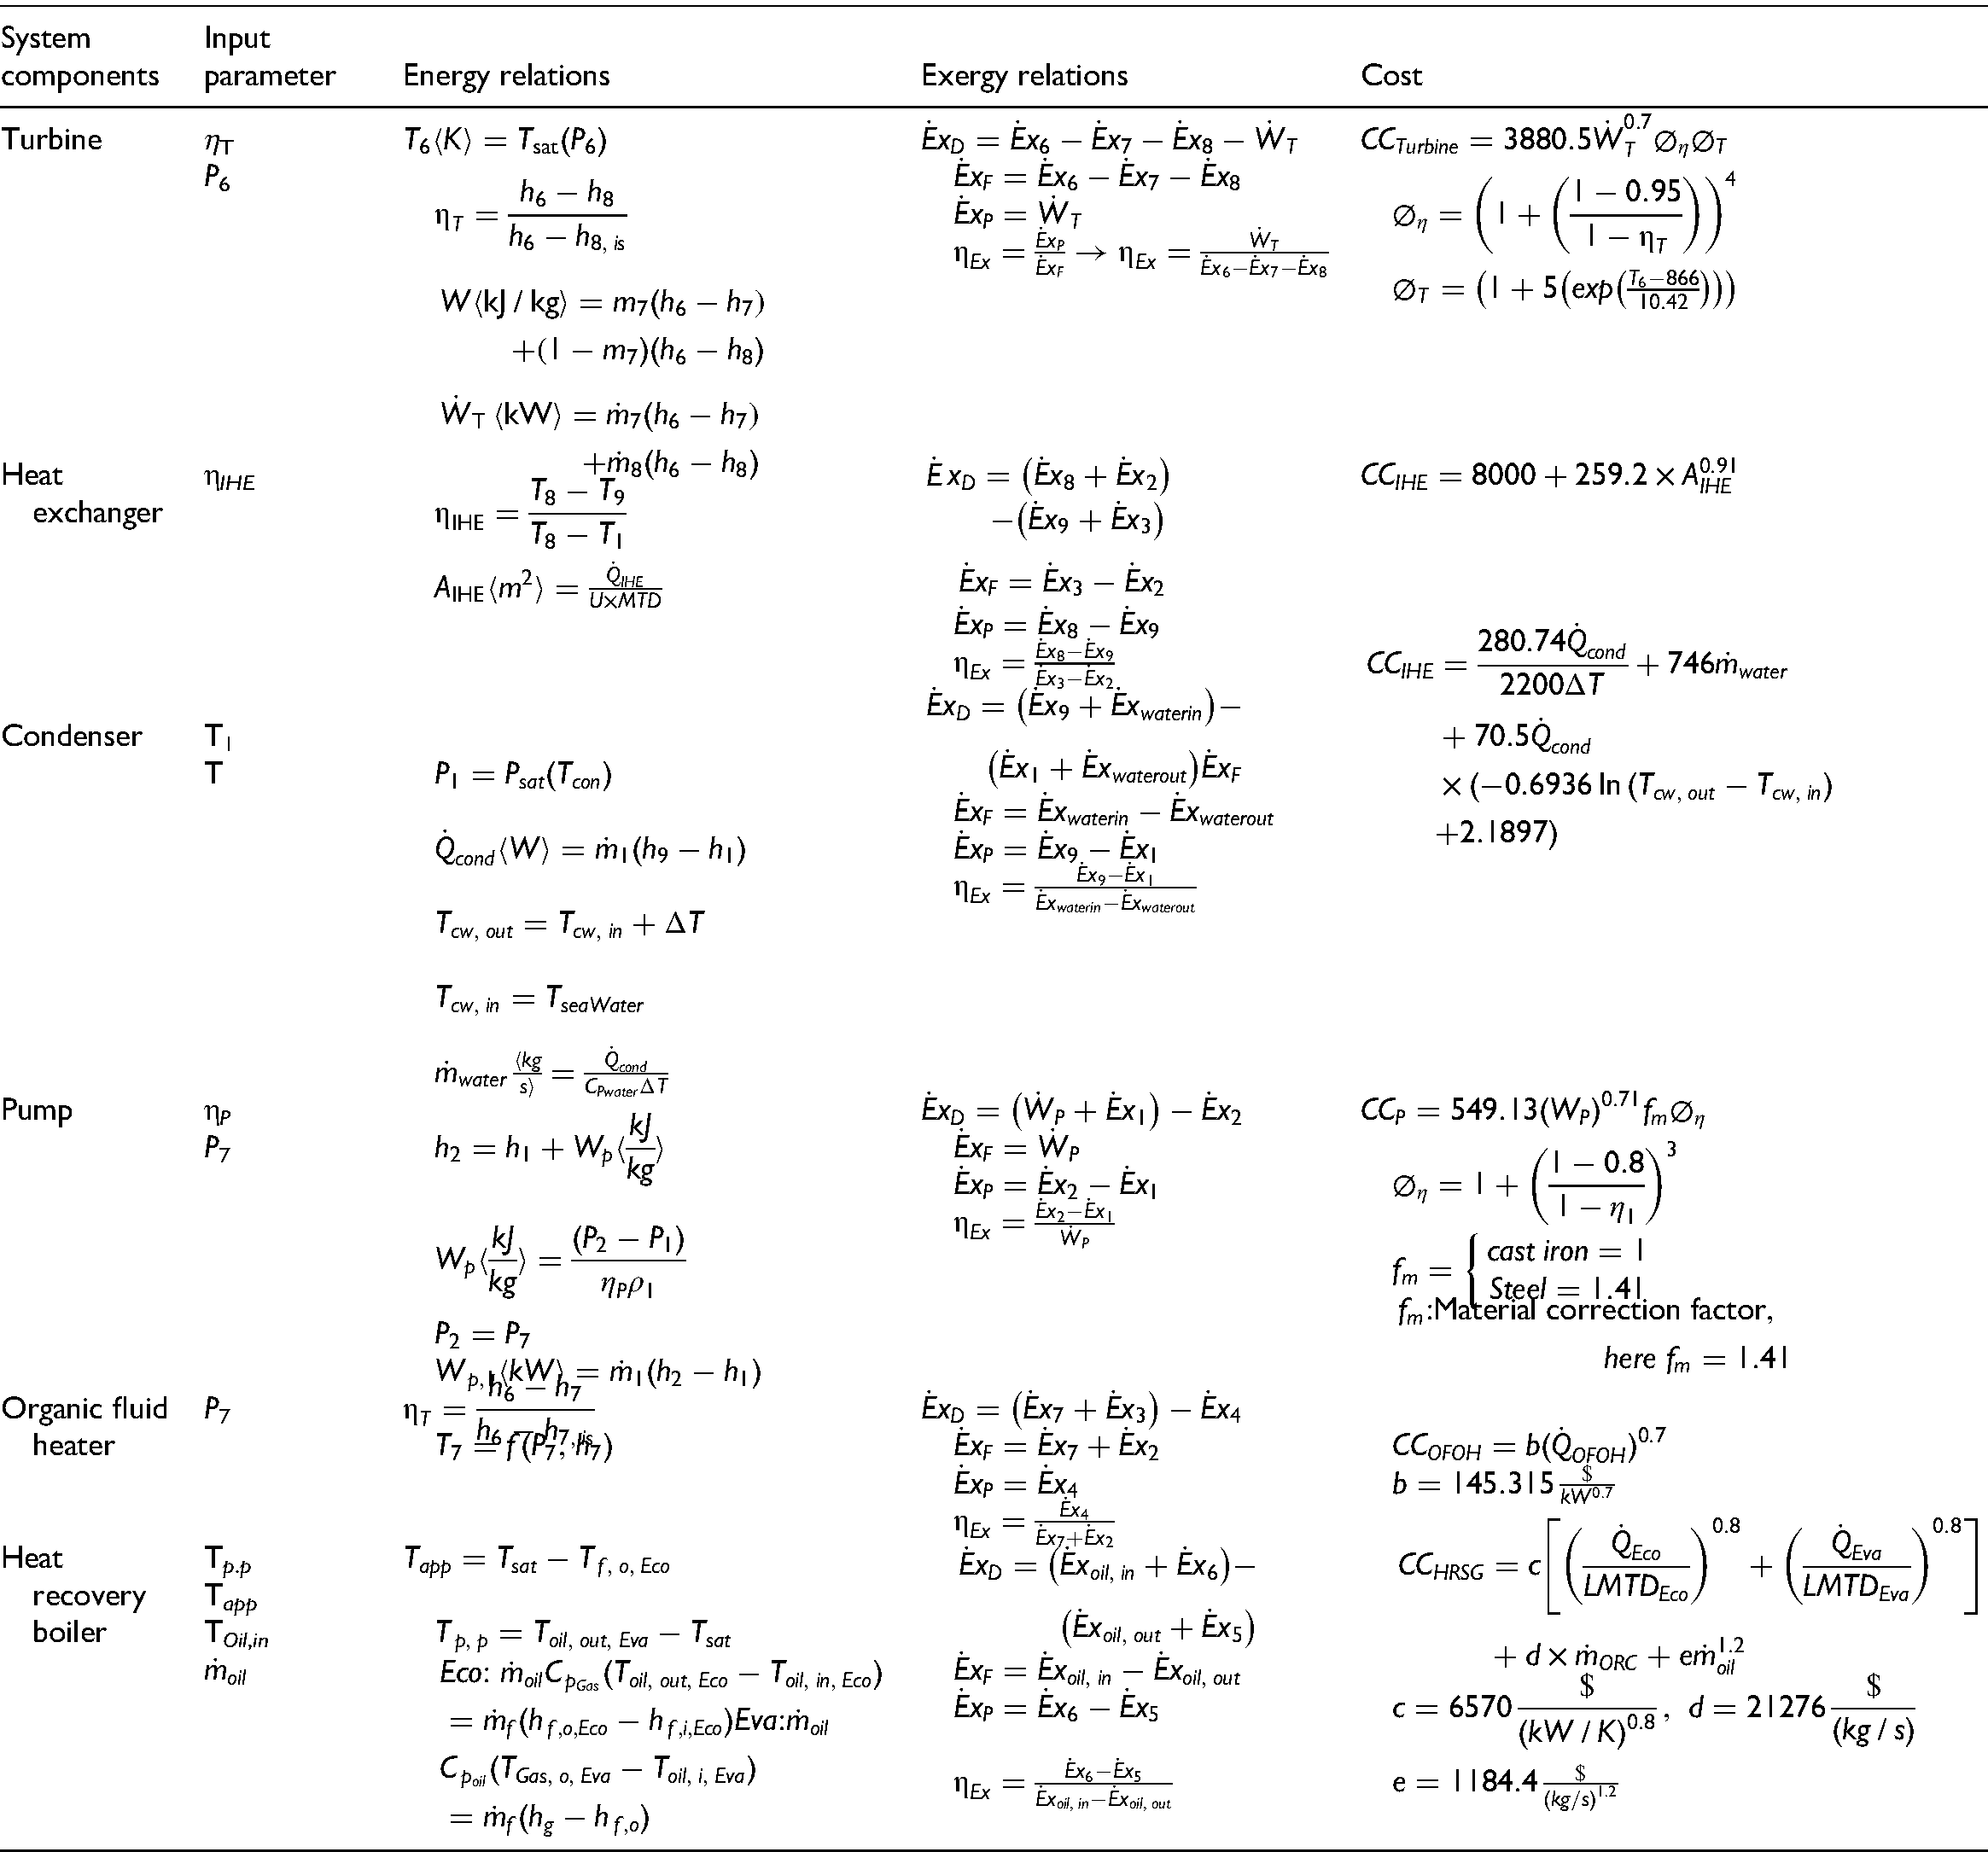
Table 2 presents the energy relations, exergy, and economic functions of this system. The pressure drop in the organic fluid path is minimal, and temperature losses in the cycle are not considered. The pinch temperature is the difference between the saturated state and the water exiting the evaporator, while the approach temperature is the difference between the saturation of the incoming organic fluid and the economizer.
The equations for the first and second laws of thermodynamics, as well as the functions used to calculate the cost of each component (Bejan et al., 1995; Du et al., 2017).
RO system modeling
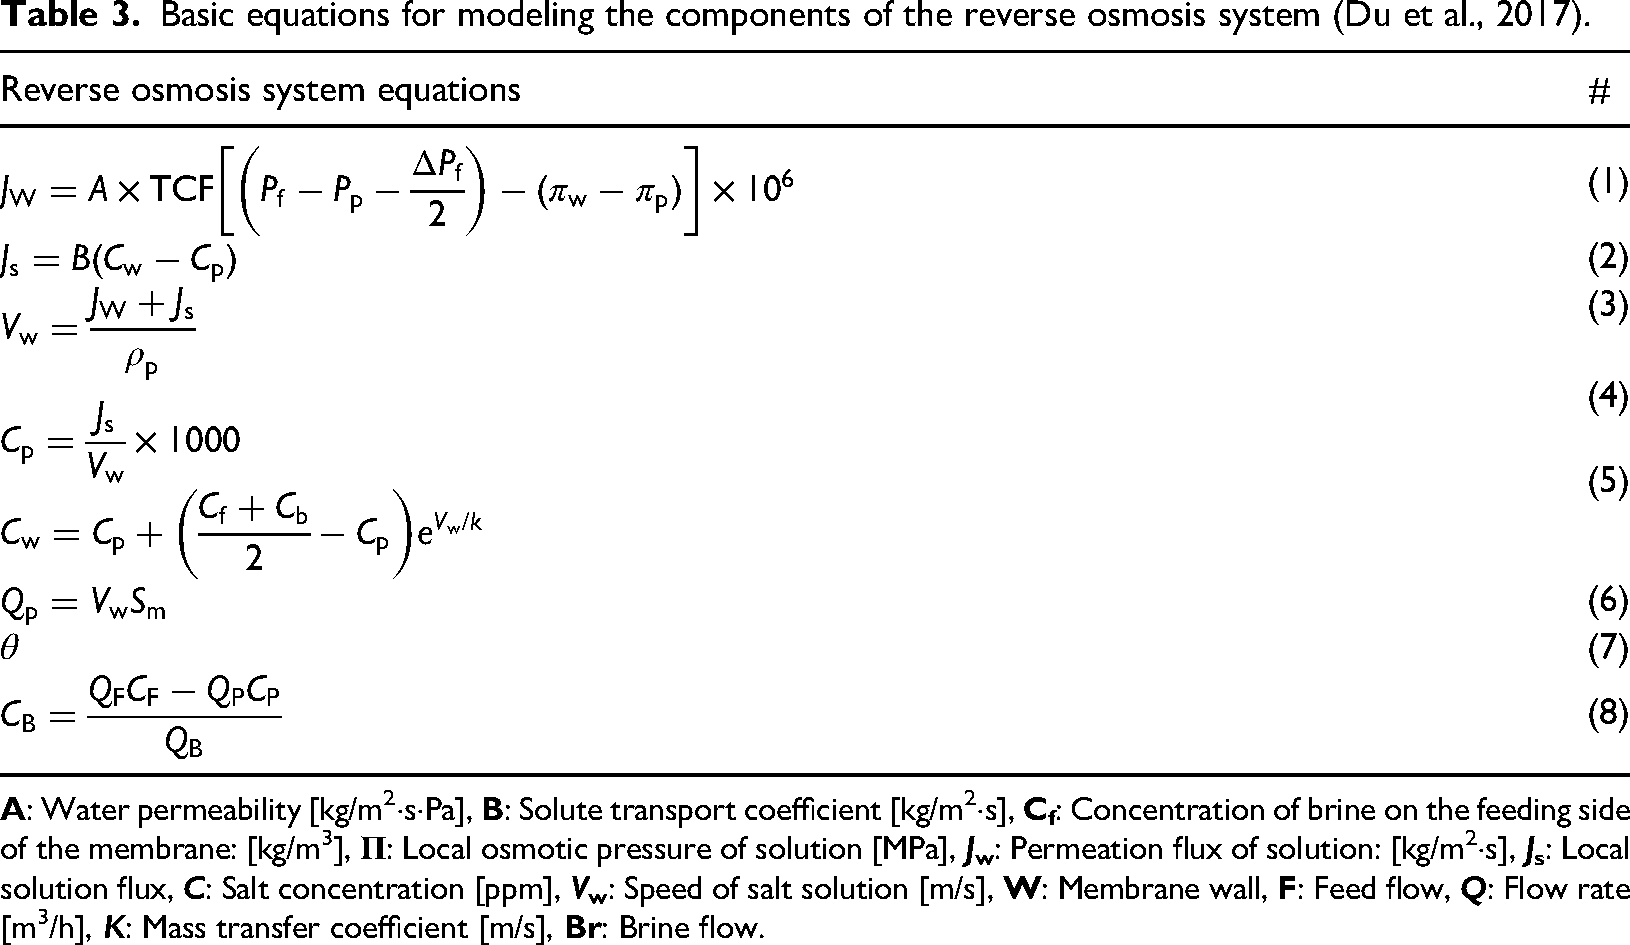
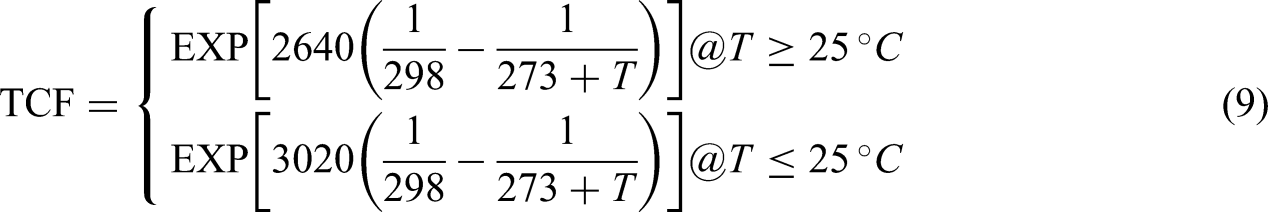
A RO system is utilized to create fresh water. The modeling of the RO section is divided into two parts. The initial part involves deciding on the number of stages and the type of membrane to be used. This modeling is based on Du et al. (2017) and is done using the element-by-element method. The fundamental equations can be found in Table 3. The temperature correction coefficient for DOW Company's membrane is determined based on the provided relationships.
Basic equations for modeling the components of the reverse osmosis system (Du et al., 2017).
Solar farm modeling
This model simulates the performance of a solar flux receiver by analyzing the energy balance between the heat transfer fluid and the atmosphere. It takes into account various factors such as the type of collector, receiver tube conditions, optical properties of the receiver, and environmental conditions to predict parameters. Using Newton's law of cooling, the heat transfer from the inner surface of the absorbent tube to the heat transfer fluid is calculated with specific equations (Forristall, 2003):
And to calculate the displacement heat transfer coefficient:


When the Reynolds number is less than 2300, the flow is considered slow. In this case, the Nusselt number remains constant at a value of 4.36 for flow inside a pipe. Heat transfer from the pipe to the atmosphere occurs through two mechanisms: convection and radiation. Convection can occur naturally or be forced, depending on wind speed. Radiant heat transfer also occurs due to the temperature difference between the pipe and the sky.
Convection heat transfer from the tube to the atmosphere (

To get the Rayleigh number, the following relationship is used: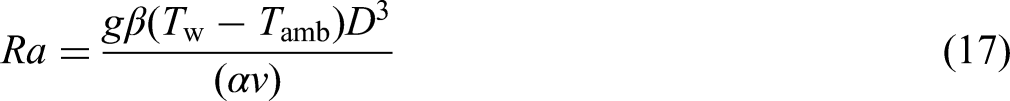
This relationship is true for certain values of Rayleigh's number (between 105 and 1012) and assumes a long horizontal pipe as monothermal. Also, fluid properties are calculated at the film temperature ((T w + T amb )/2).
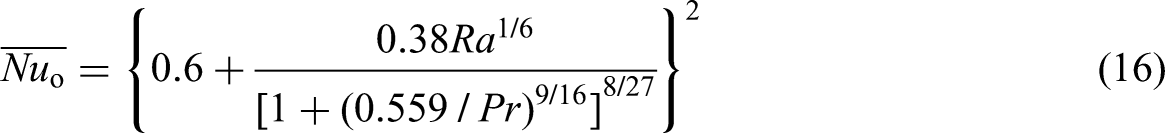
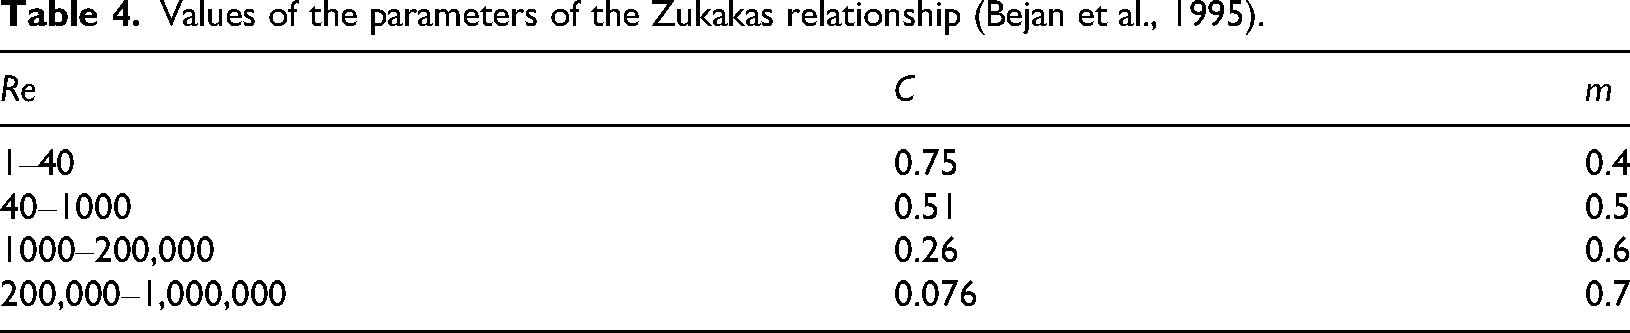
When it is windy, heat transfer from the glass protector to the environment through convection is necessary. In this situation, the Nusselt number can be calculated using the Zukakas relation for external forced displacement flows around a cylinder with a constant temperature (Bejan et al., 1995).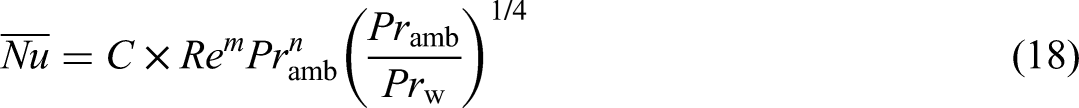
To calculate the Nusselt number using the equation provided, the values of the parameters listed in Table 4 are required. Additionally, the value of ‘n’ is determined based on the value of the parentheses in the equation: for values greater than 10, n = 0.36, and for values less than or equal to 10, n = 0.37. It is important to note that equation (18) is applicable for specific Reynolds and Prandtl numbers, and all fluid properties are assumed to be calculated at atmospheric temperature. The radiation heat loss in the glass shield occurs due to the temperature difference between the glass cover and the sky. To simplify this concept, the glass cover is considered a small gray convex object surrounded by a large black hole-like object representing the sky. The radiation heat transfer occurs solely between the glass cover and the sky (Bejan et al., 1995):
Values of the parameters of the Zukakas relationship (Bejan et al., 1995).
Note that the assumption that the sky is black is not accurate, especially when the sky is cloudy. However, this assumption does not cause a big error and can be ignored. The amount of heat absorbed in the absorber tubes, which is characterized by 
In this regard, αabs is the absorption coefficient of the absorbent tube surface, 


Effect coefficients of optical efficiency (Bejan et al., 1995).
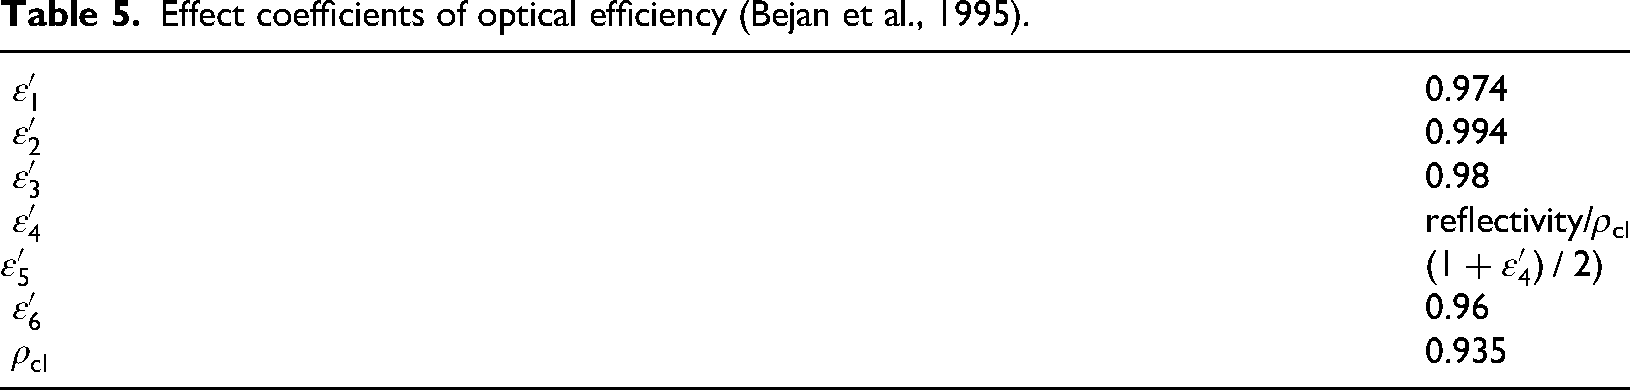
Using Table 5, the coefficients of equation (22) can be calculated, and the amount of solar radiation absorbed by the absorber tube
Exergy analysis
The flow at any point of the cycle has two terms of physical and chemical exergy, which are calculated as follows. In this article, other exergy flows are omitted (Ameri et al., 2016; Mokhtari et al., 2016b).
Physical exergy is calculated as follows (Ameri et al., 2016; Mokhtari et al., 2016b).
The chemical exergy of seawater is calculated as follows, which is determined based on the Gibbs energy function and its compounds (Shayesteh et al., 2019):

The Gibbs energy can be determined by examining the relationship between enthalpy and entropy. This correlation is presented as follows:
The difference between the entropy of pure water and the entropy of salt water is determined based on the salt concentration. Here is the chemical exergy of salty water: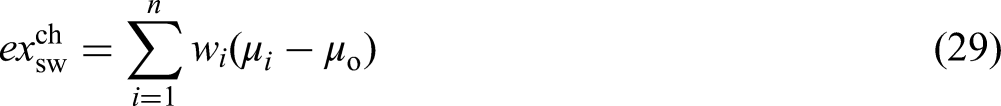
By writing an exergy balance equation in a system, the amount of exergy destruction in each equipment can be calculated (Ameri et al., 2016; Bejan et al., 1995).
Exergy efficiency can be defined as follows, according to the definition of fuel exergy, according to Bejan et al. (1995):
Economic analysis (3E)
By calculating the cost of purchasing equipment that includes ORC equipment and solar and RO systems, economic analysis equations can be quantified. According to Table 2 for different parts, the cost of the solar farm is also considered to be 350 dollars per square meter (Ameri et al., 2016). The costs of the RO system are also based on the relationships suggested in Bejan et al. (1995), and the heat recovery costs are also from Mokhtari et al. (2017). RO costs include replacement of membranes, annual operating costs that include: laboratory, repairs, and chemical additives. The operating costs of other components are also calculated based on Ameri et al. (2016). Finally, the total annual cost is calculated as follows:
The normalized total cost is also determined from equation (33) (Mokhtari et al., 2016c):
The investment cost (CRF) is influenced by the interest rate and the expected lifespan of the equipment, as calculated by equation (34) (Mokhtari et al., 2016c).
Environmental analysis (4E)
Power generation department
Based on ASHRAE Standard 34, different fluids can be selected as fluids that can be investigated based on two factors: toxicity and flammability (Macchi and Astolfi, 2016).
Reverse osmosis system section
This section discusses two environmental effects: (a) the use of additive chemicals in the pretreatment of RO systems, and (b) the discharge of brine from the RO system. The article explores the idea of raising the temperature of the water entering the RO system to increase brine production and improve biological effects. This change can reduce the environmental impact of brine discharge into the sea. By increasing the water temperature, the density of the saltwater decreases, causing the brine to have a lower volume compared to the sea. This results in faster mixing with the surrounding water. However, there are limitations to how much the temperature of the discharge can be increased. The dimensionless function is defined as follows: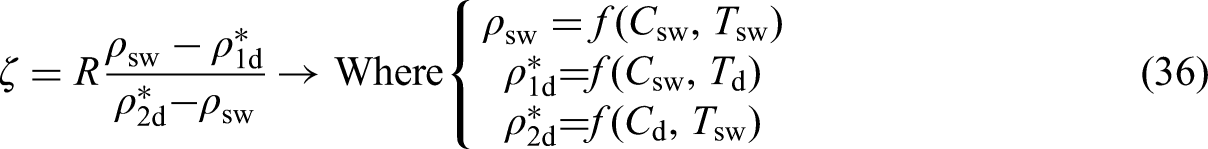
To put it simply, when you subtract the density difference of the diluted flow at a constant concentration (which includes the brine flow and rejected flow) from the density difference of the flows based on concentration difference at constant temperatures, you get the term R. This term R represents a decrease in volume flow rate due to recycling. The higher the value of this function, the greater the difference in density will be on the environmental effects of this RO. This increase in density will go in the direction of maximizing the value of . The amount of discharge to the sea should be reduced, and the temperature of the discharged brine should be increased based on the limitations of the membrane used in the system.
Optimization
To optimize a thermodynamic system, you need to identify the decision variables, the objective function, and the optimization characteristics for the genetic algorithm.
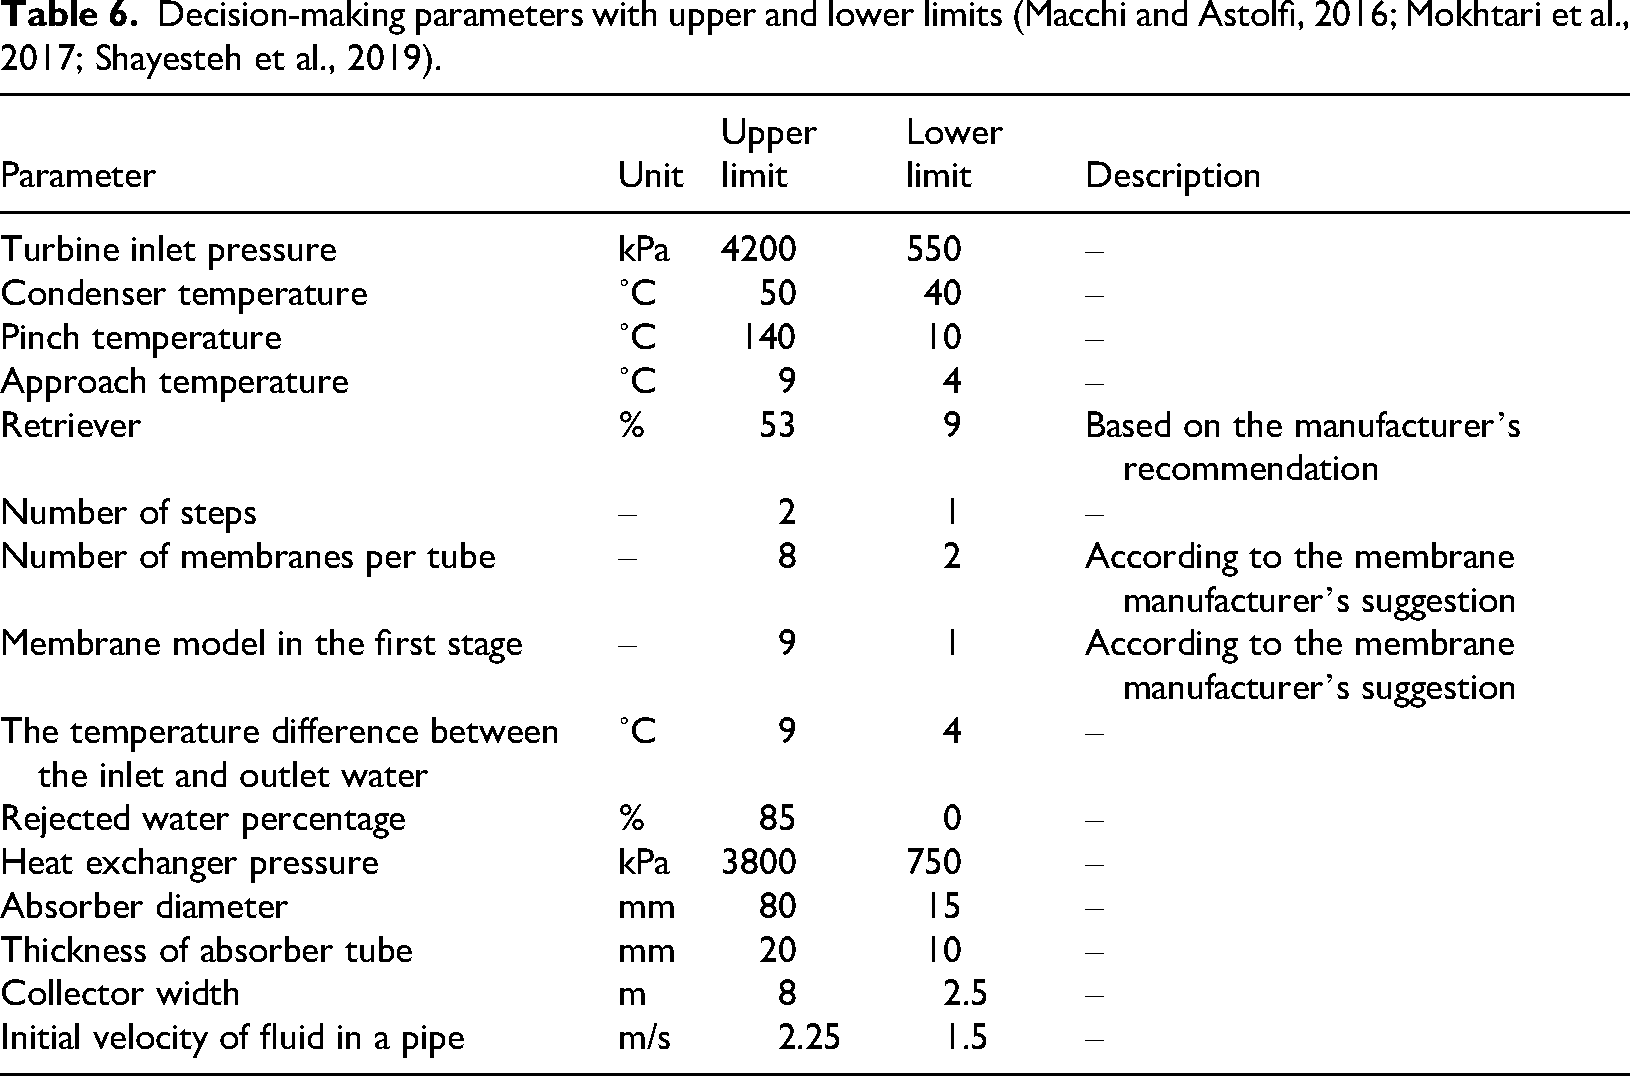
The decision variables in this article are stated based on Table 6. To determine the configuration and membranes, each of them is assigned an integer number, which is selected and analyzed from the genetic algorithm side of the desired membrane.
Decision-making parameters with upper and lower limits (Macchi and Astolfi, 2016; Mokhtari et al., 2017; Shayesteh et al., 2019).
When determining the objective function, the final price of produced water and exergy efficiency are taken into account for optimizing two objectives. These objectives are derived from equations (31) and (35). In a three-objective optimization, the function of environmental effects () is also considered, which is calculated using equation (36).
Results
Validation
Since the desired cycle has two parts, the validation of this work will be presented in two separate sections.
Solar sector
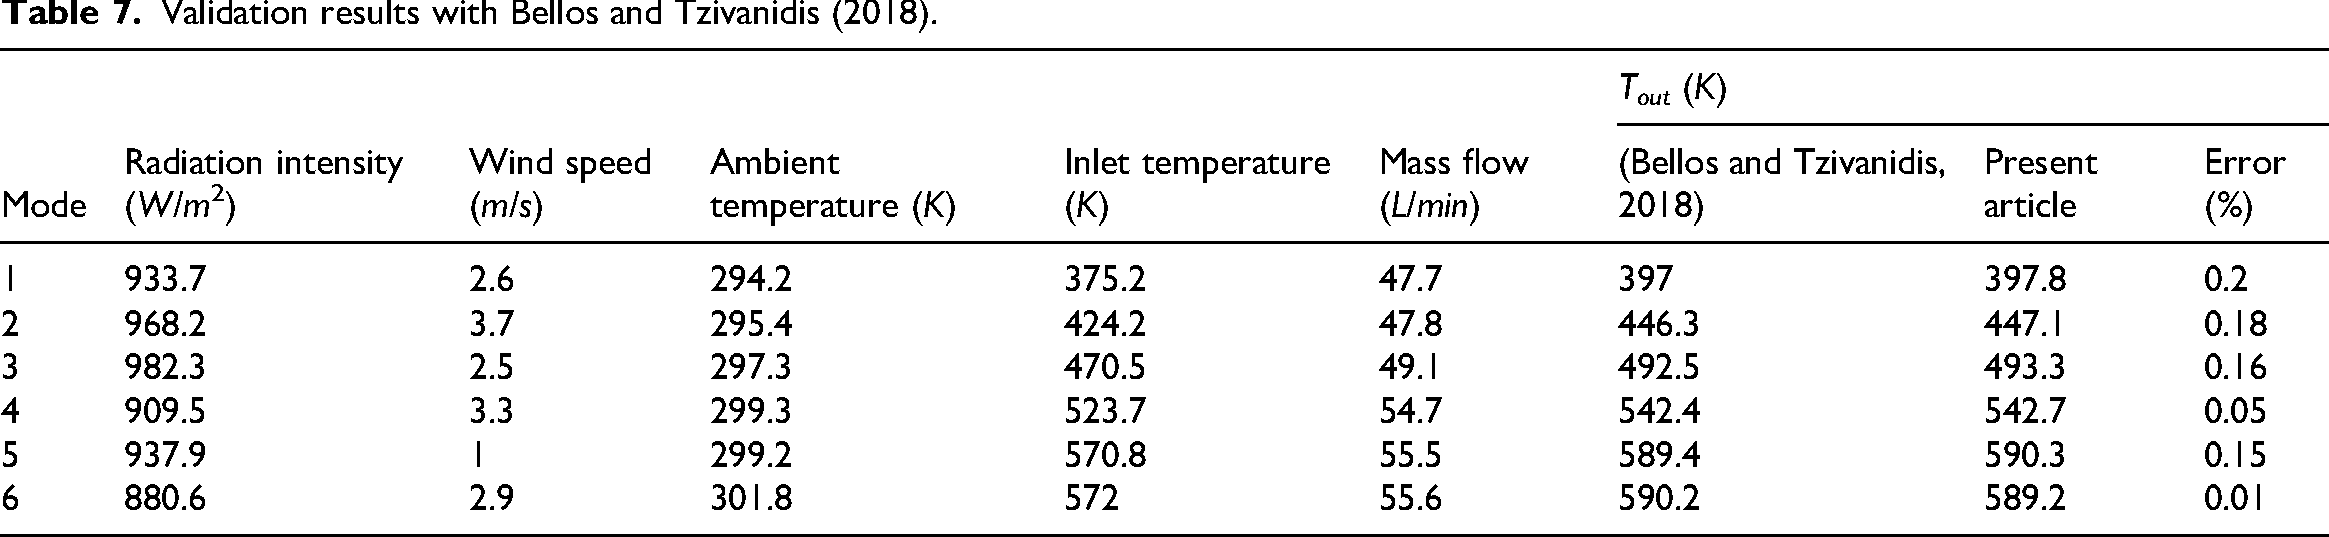
The solar collector was tested under various operating conditions, as detailed in Table 7. The working fluid used was Syltherm 800. The table indicates that the average error in calculating the outlet temperature is only 0.12%, demonstrating the high accuracy of the thermal model that was developed.
Validation results with Bellos and Tzivanidis (2018).
ORC section
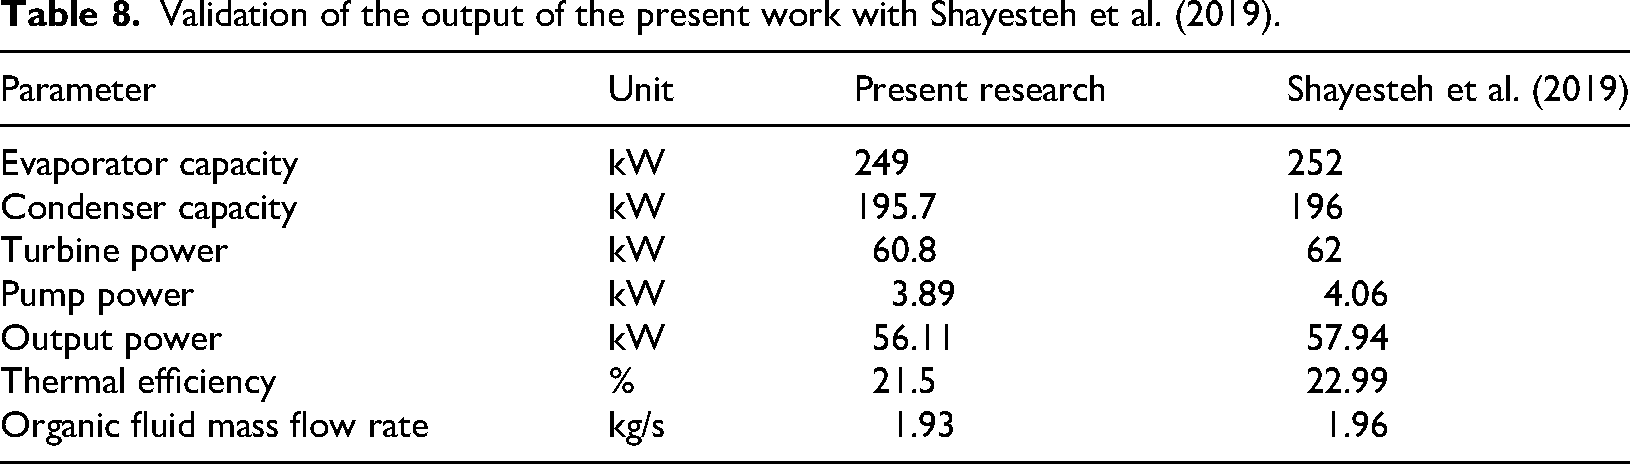
The characteristics of the organic fluid were determined using Refprop software. The ORC section was validated for the system using Shayesteh et al. (2019). Table 8 shows that the error in this section is within an acceptable range.
Validation of the output of the present work with Shayesteh et al. (2019).
RO system section
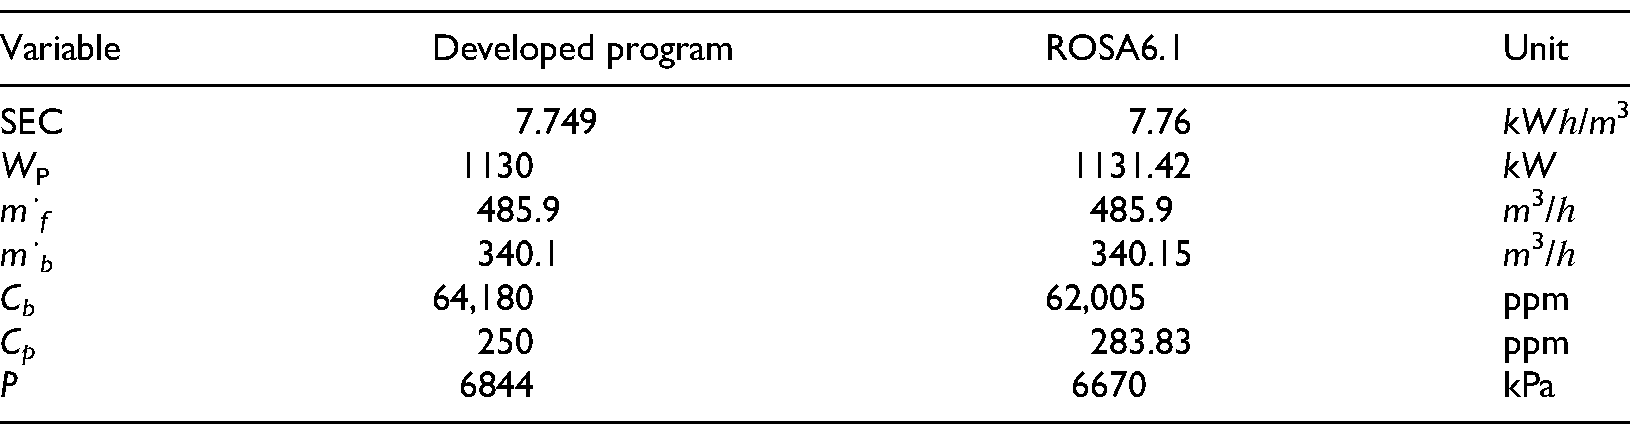
Every company has created software that is tailored the membranes they have manufactured. This software automatically includes the information about the company's membranes in its database. In this part, the code created using MATLAB software was tested with DOW Company's ROSA software, and the outcomes are displayed in Table 9.
The results obtained in comparison with the results of ROSA6.1.
The system's proposed algorithm optimizes three-objective functions, as shown in Figure 2, through its beam curve. From the total energy produced, approximately 58% of the energy is recovered, which prevents the destruction of the exergy of the system. If this equipment is not used, high-quality exergy will be removed from the system and will increase the ExL of the system. Another factor that increases costs is the decrease in pinch temperature. By reducing this temperature, the amount of recycling has increased, and the output oil temperature has also decreased. This will have two negative effects on the cycle. In the first part, by reducing the temperature of the input oil to the solar farm, more length and number of branches are needed for energy supply, and this issue is very practical considering that most of the costs are allocated to the design and implementation of a solar farm. In the second part, there is an increase in the equipment costs of the ORC cycle, particularly the converter and turbine. These components make up a large portion of the overall costs in the ORC cycle. The cost of the converter and turbine is equal to 49% and 18% of the total Rankine organic system, respectively. A solar farm with a length of 200 m and an absorbent tube with an internal diameter of 73.5 mm, the number of branches equal to 12, and a collector width of 5.35 m is proposed in the plan. With this design, the percentage of total system costs (TAC) for solar farm, ORC cycle, and RO system at an optimal point is 76.82%, 19.64%, and 3.5%, respectively. It can be seen that in most of the optimal points, based on the recovery, water source, and available power for the high-pressure pump, the configuration of the RO system is made as a single stage. The membrane in this configuration is selected from the SW30XLE-400i model; the number of membranes in each pressure tube is selected to be equal to 6. Table 10 displays the outcomes of optimizing the three objectives of the system. The chosen recovery is influenced by the pressure of the RO pump. The beam curve illustrates a nearly constant power with a 12% pressure decrease. As a result, the recovery input has decreased by 20%. The selected membrane is capable of withstanding temperatures up to 40 °C and pressures up to 80 bars. With these restrictions, it can be seen that the temperature of the water entering the system is 32.6 °C and the pressure is 64.5 bar. Low pressure is one of the factors of low recovery. This is due to the environmental dimensionless function. In spite of this function, to reduce it, the RO concentration value has been used by reducing the density term. The genetic algorithm has reduced the concentration of brine by choosing a one-step RO system. Furthermore, taking into account that 18% of the condenser section's reject is used to dilute brine water, it is evident that this process results in a decrease in concentration. This reduction plays a crucial role in minimizing the environmental impact. According to the function, the balance between the volume of the brain and the density ratio has led to an increase in the concentration contribution by the genetic algorithm. In the analysis of the environmental effects of these systems, it can be seen that in each of the points, if the amount of Brine decreases, the concentration will increase. Based on the term (ρ s w − ρ1d∗)/(ρ2d∗ − ρ s w ) at an optimal point around 0.27, and the recovery value is selected around 0.28. This will lead to the influence of the concentration of production brine on the environmental effects.
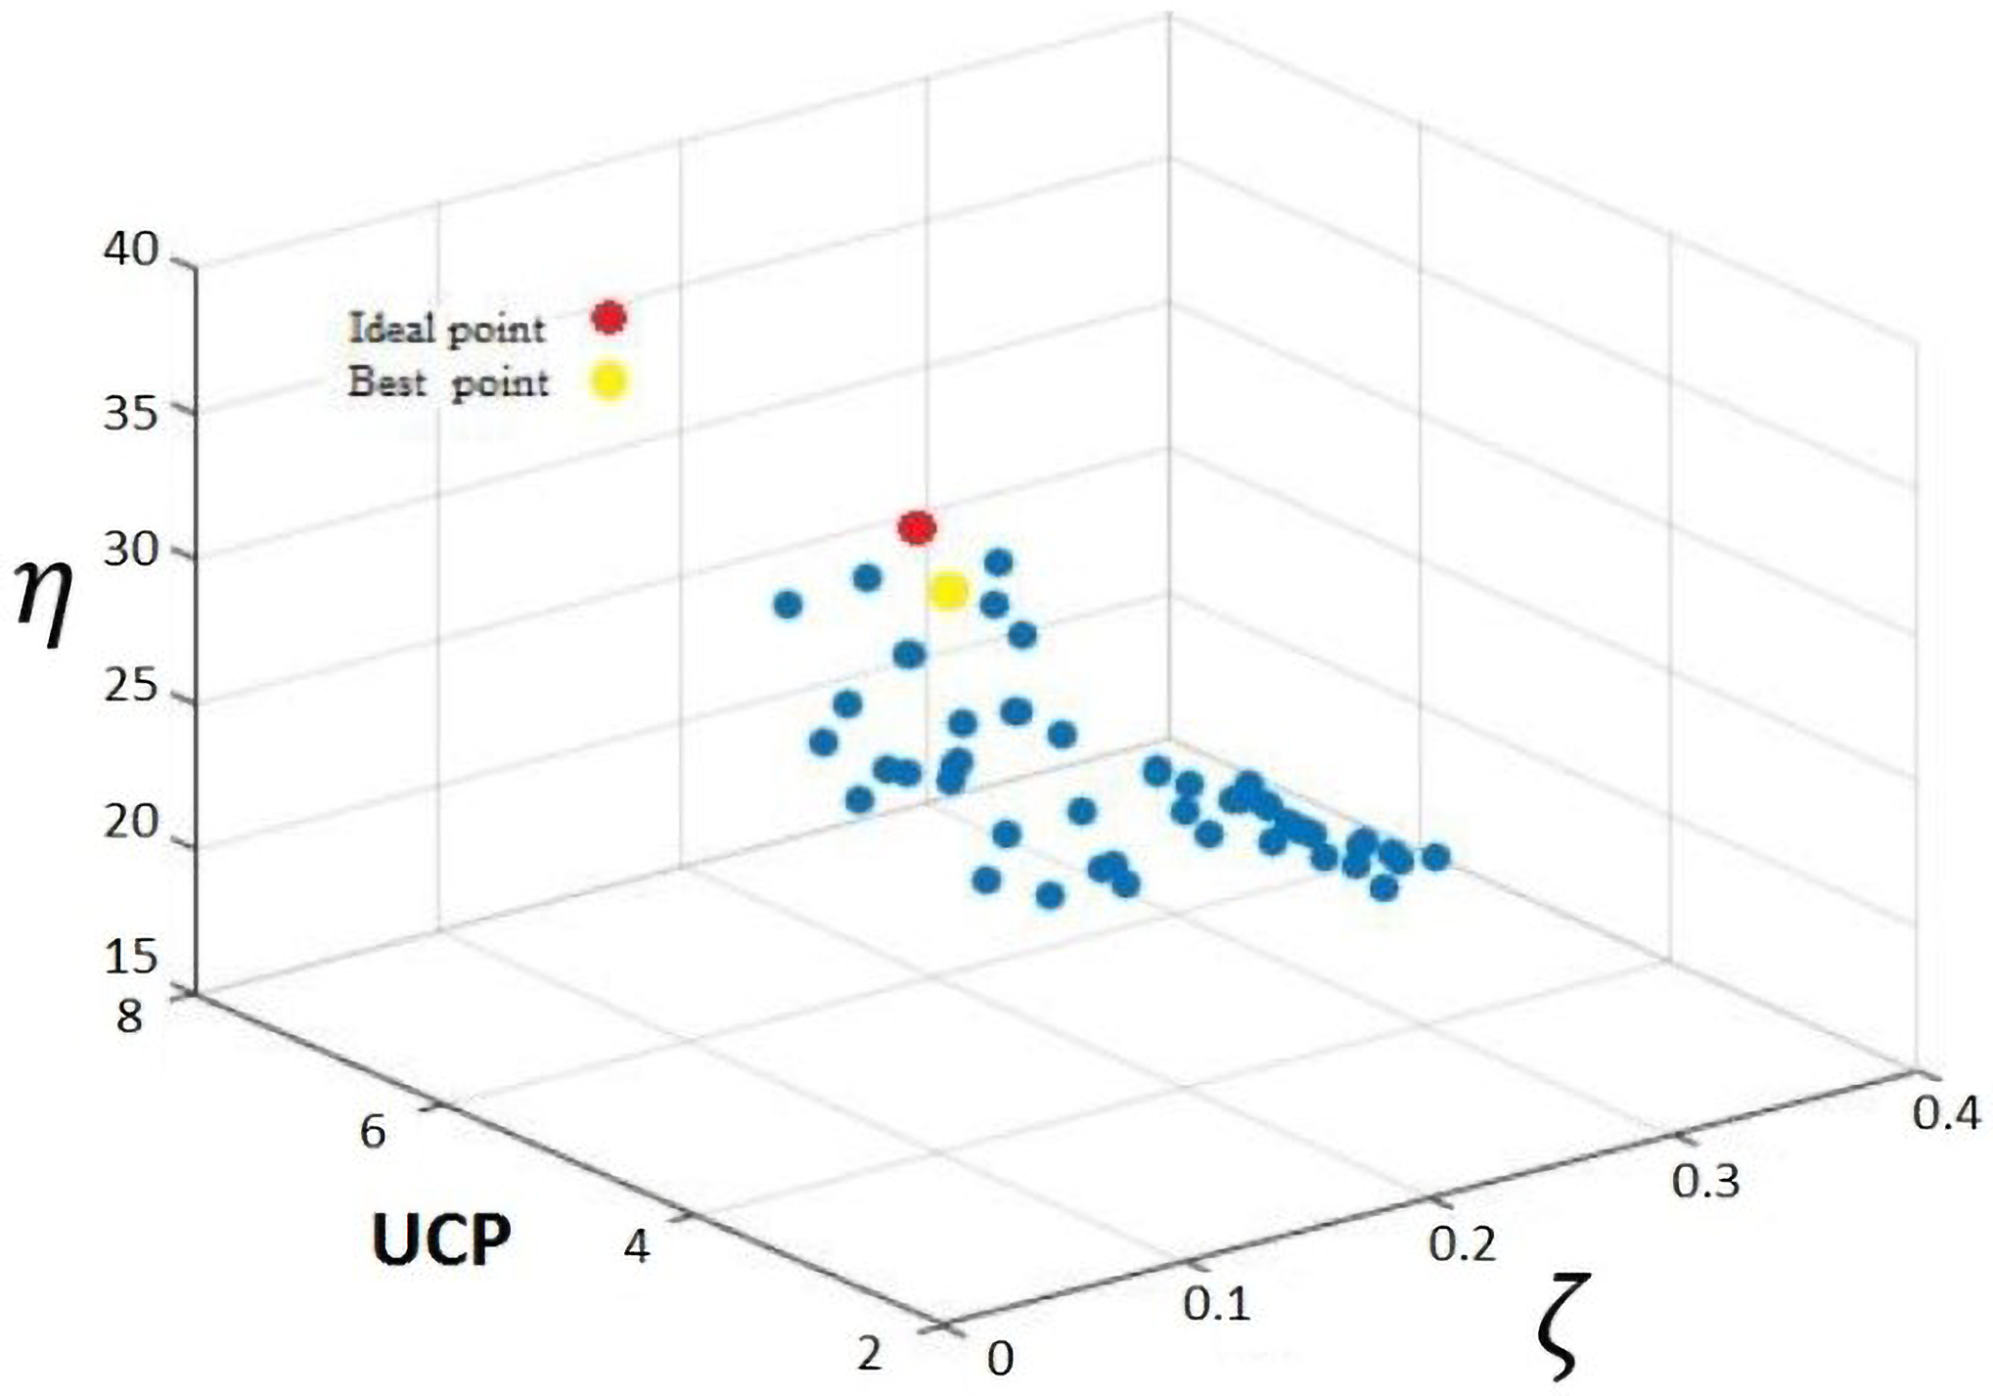
A three-objective beam curve is created using objective functions for exergy efficiency, UPC, and ζ.
Outputs from the three-objective optimization.
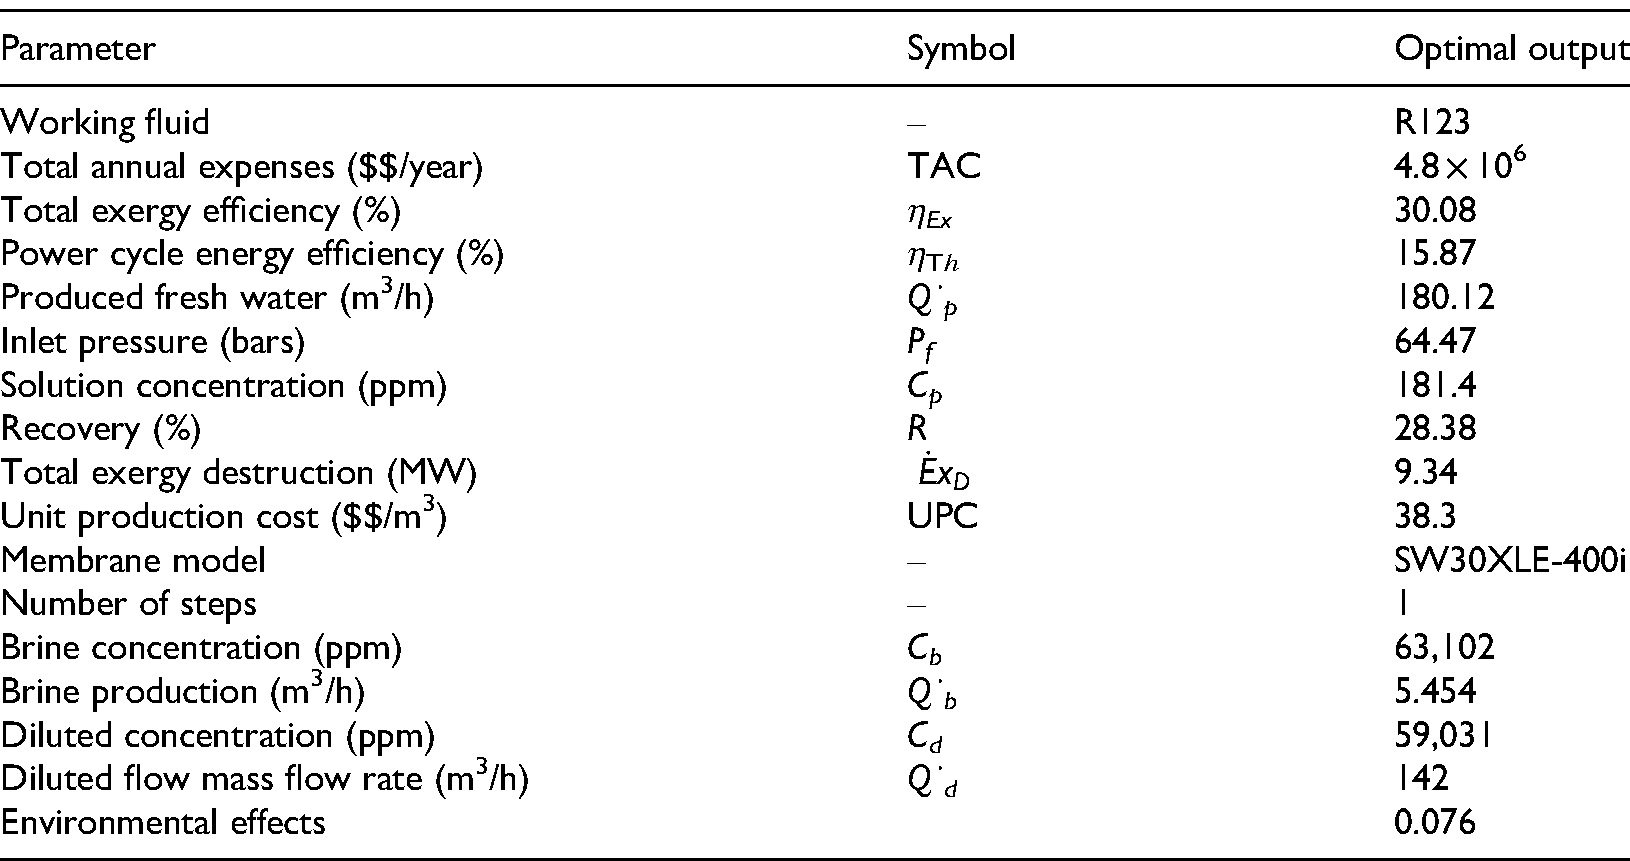
Although R123 was found to be the optimal working fluid under the given conditions, alternatives R245fa and R134a could also be studied.
The SW30XLE-400i membrane by DOW Filmtec was selected because of its high salt rejection (>>99.7%), maximum operating pressure (80 bar), good performance at moderate temperatures (<45 °C), and compatibility with the proposed operating point (64.5 bar, 32.6 °C). Its wide commercial availability and reliability make it an optimal choice for this application.
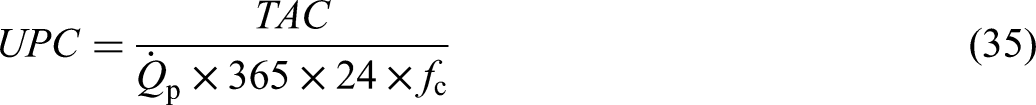
According to Table 10, the unit production cost is higher than for conventional RO plants because it includes:
Capital investment and annualized cost of solar field and ORC system, Maintenance, replacement of membranes, and chemical usage, Operating costs under solar-driven conditions.
The costs of conventional RO are not directly comparable to those of the grid. Similar studies of solar and ORC desalination show that our results are consistent with such systems.
The system's sensitivity analysis has been conducted at an optimal point. Figure 3 shows how exergy efficiency changes with seawater temperature. As seawater temperature increases, exergy efficiency also increases because exergy destruction in the condenser decreases. Figure 4 illustrates the cost variations in the system with changes in seawater temperature. As sea water temperature rises, costs slightly increase due to the increased need for equipment and higher heat transfer levels in the condenser.
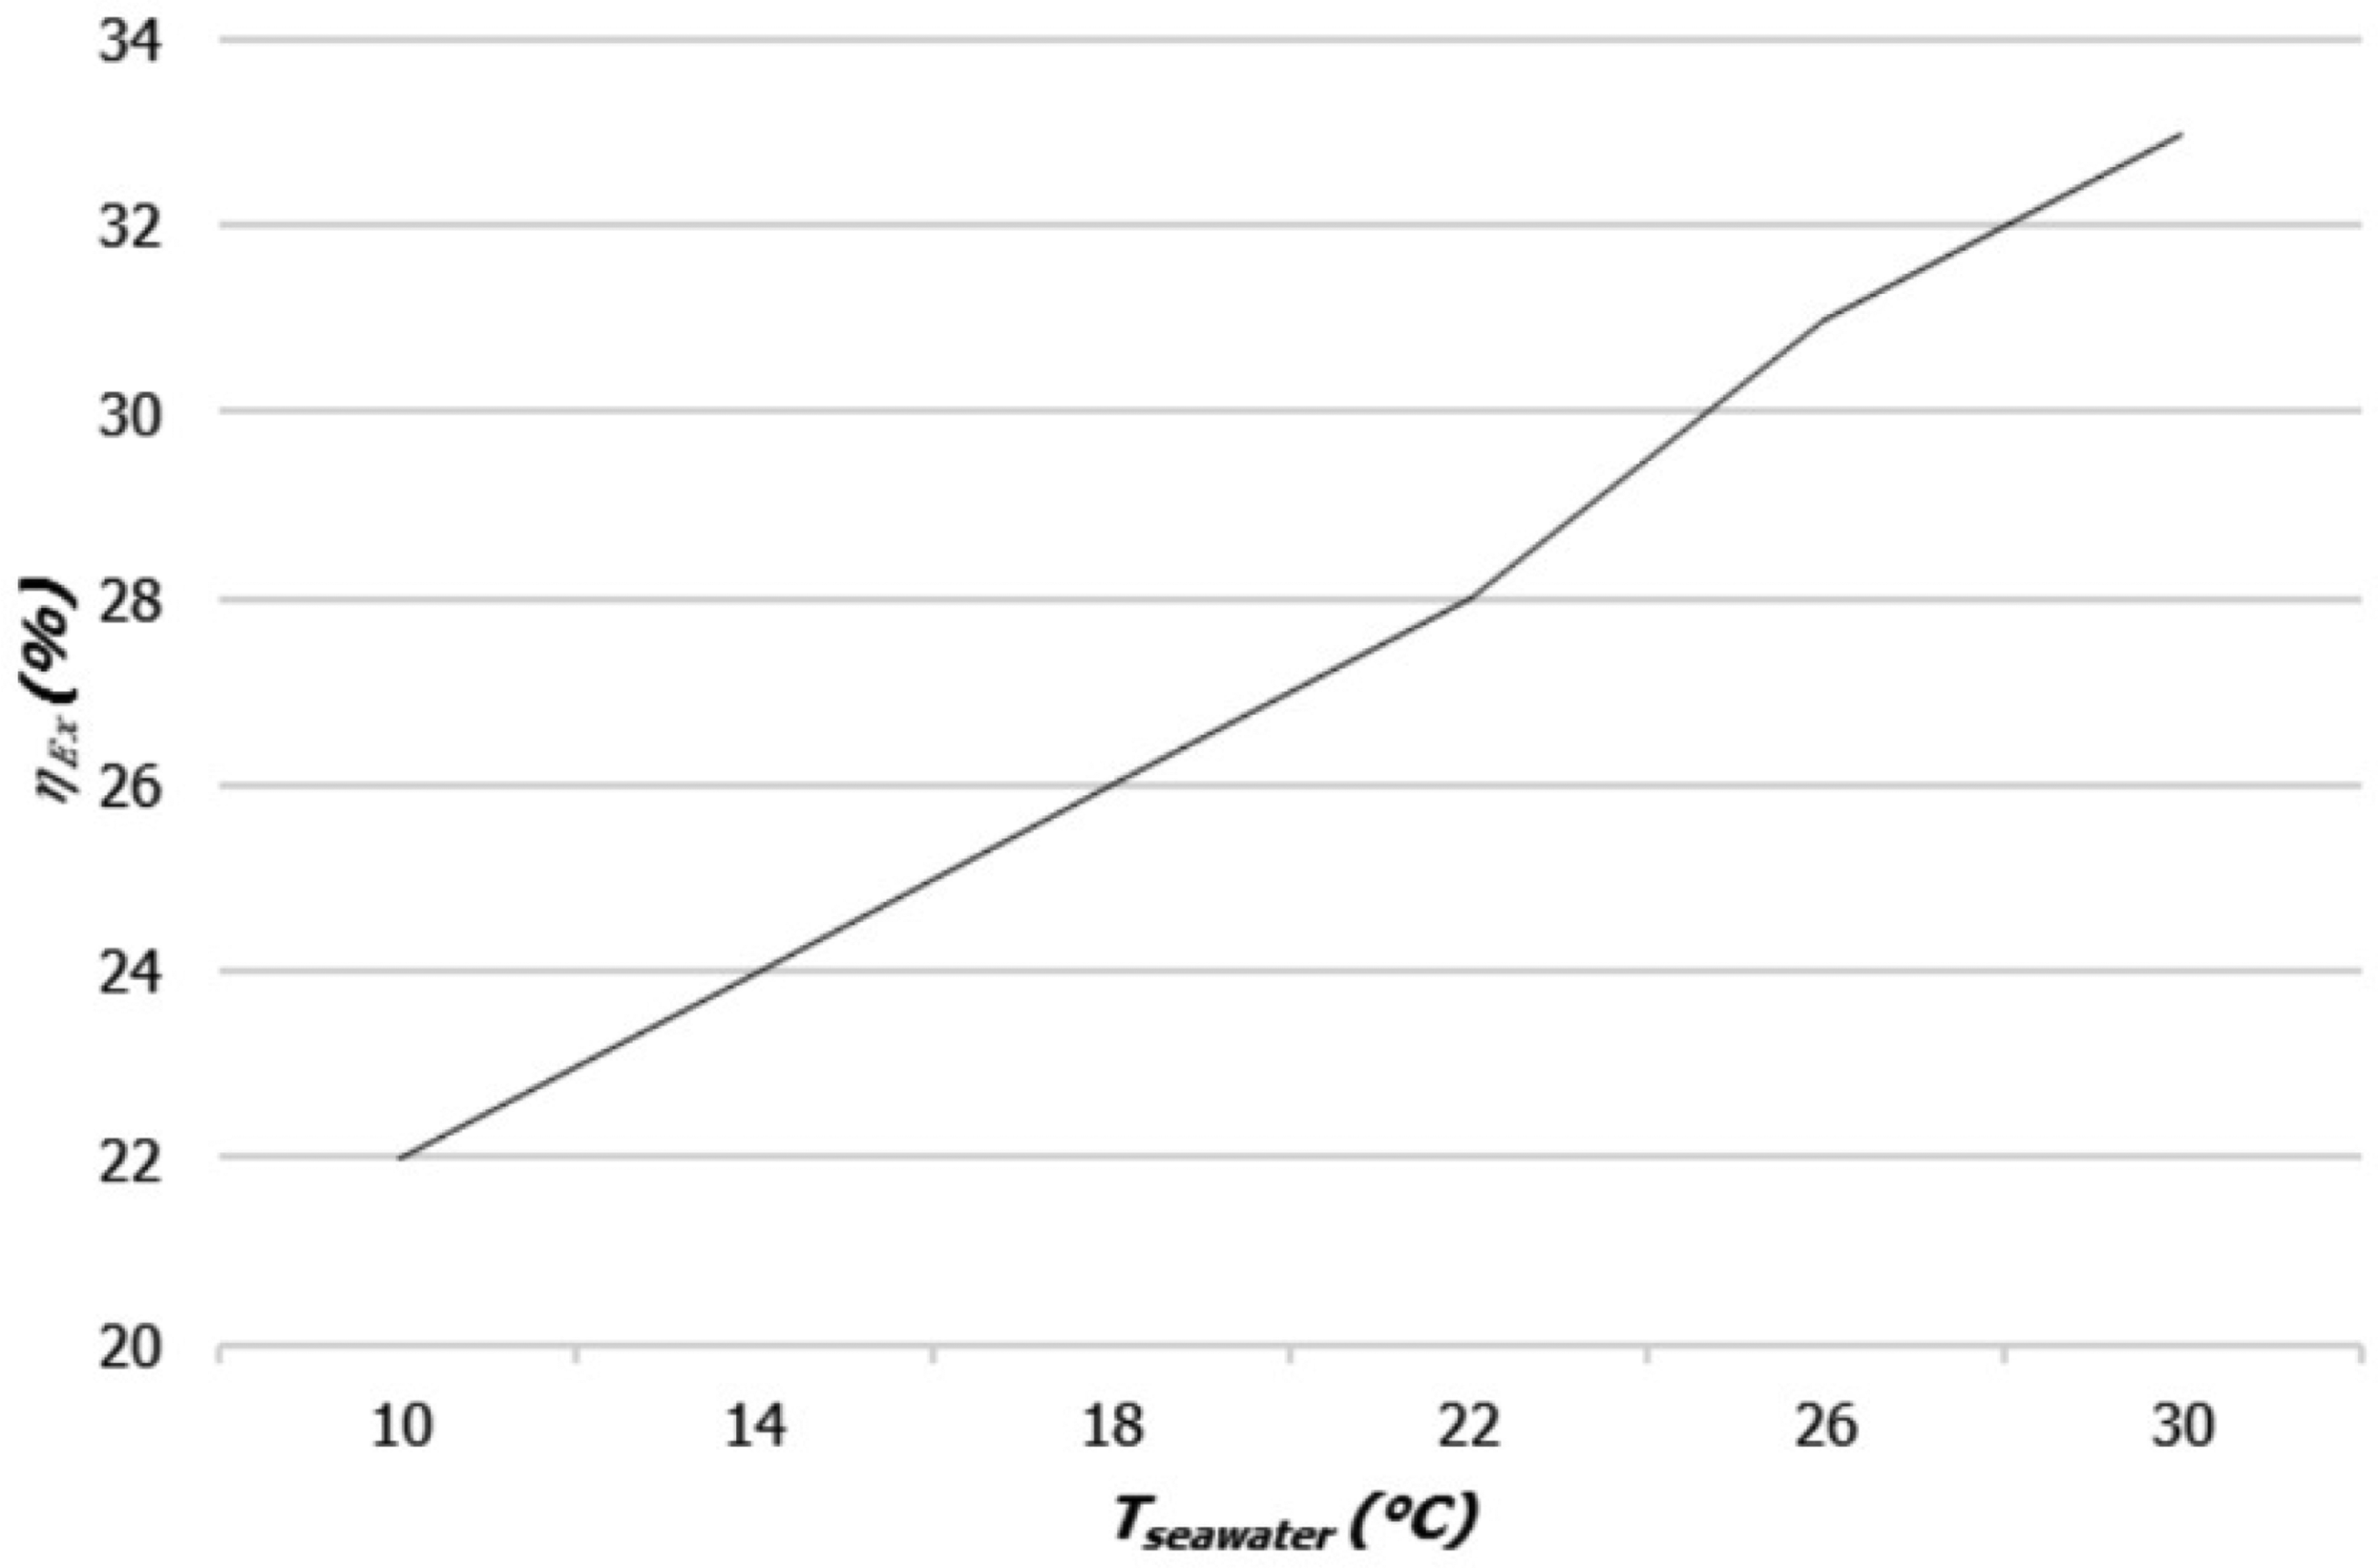
Exergy efficiency changes according to sea water temperature changes.
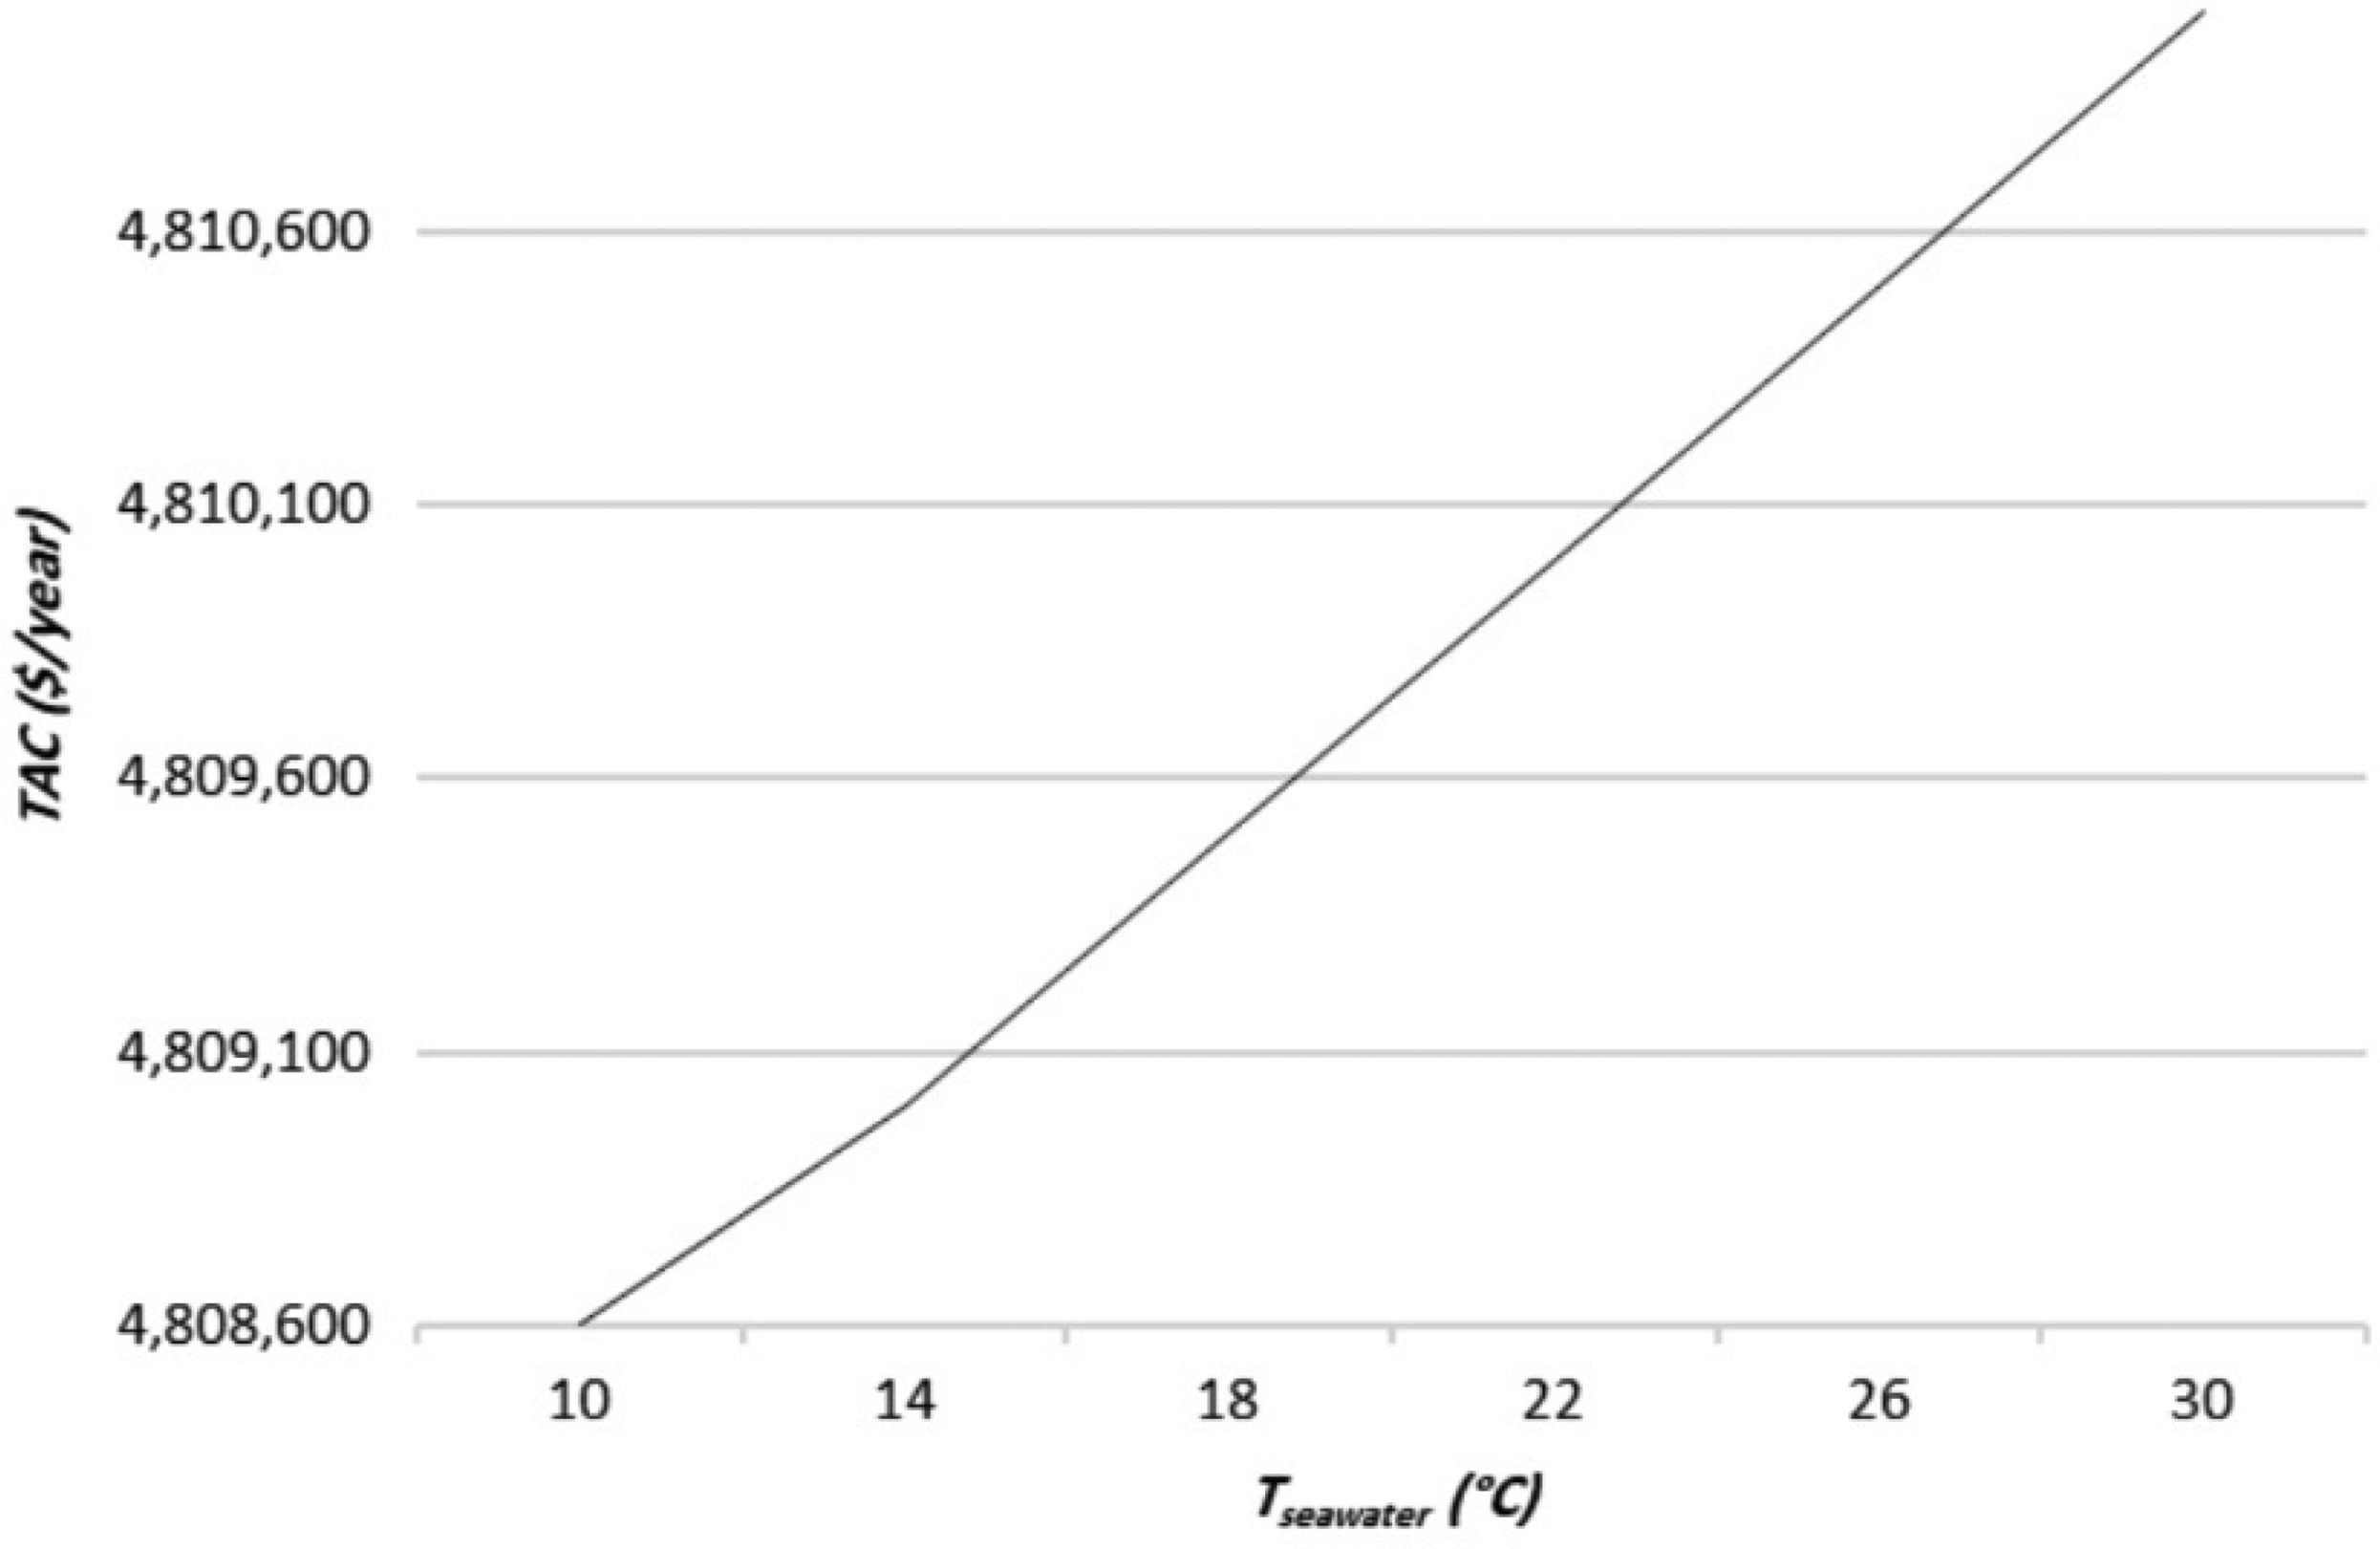
TAC changes according to sea water temperature changes.
The fluctuation in sea water temperature will significantly impact exergy efficiency and the dimensionless function of environmental effects. This means that the environmental dimensionless function will change by 55% and exergy efficiency by 60%, while water production will only decrease by 7.2%. Figure 5 illustrates how changes in seawater temperature affect the dimensionless function of environmental effects. The drop in the temperature of the water leaving the system into the sea has led to a reduction in buoyancy force and the mixing of brine with seawater, increasing the harmful environmental effects of brine.
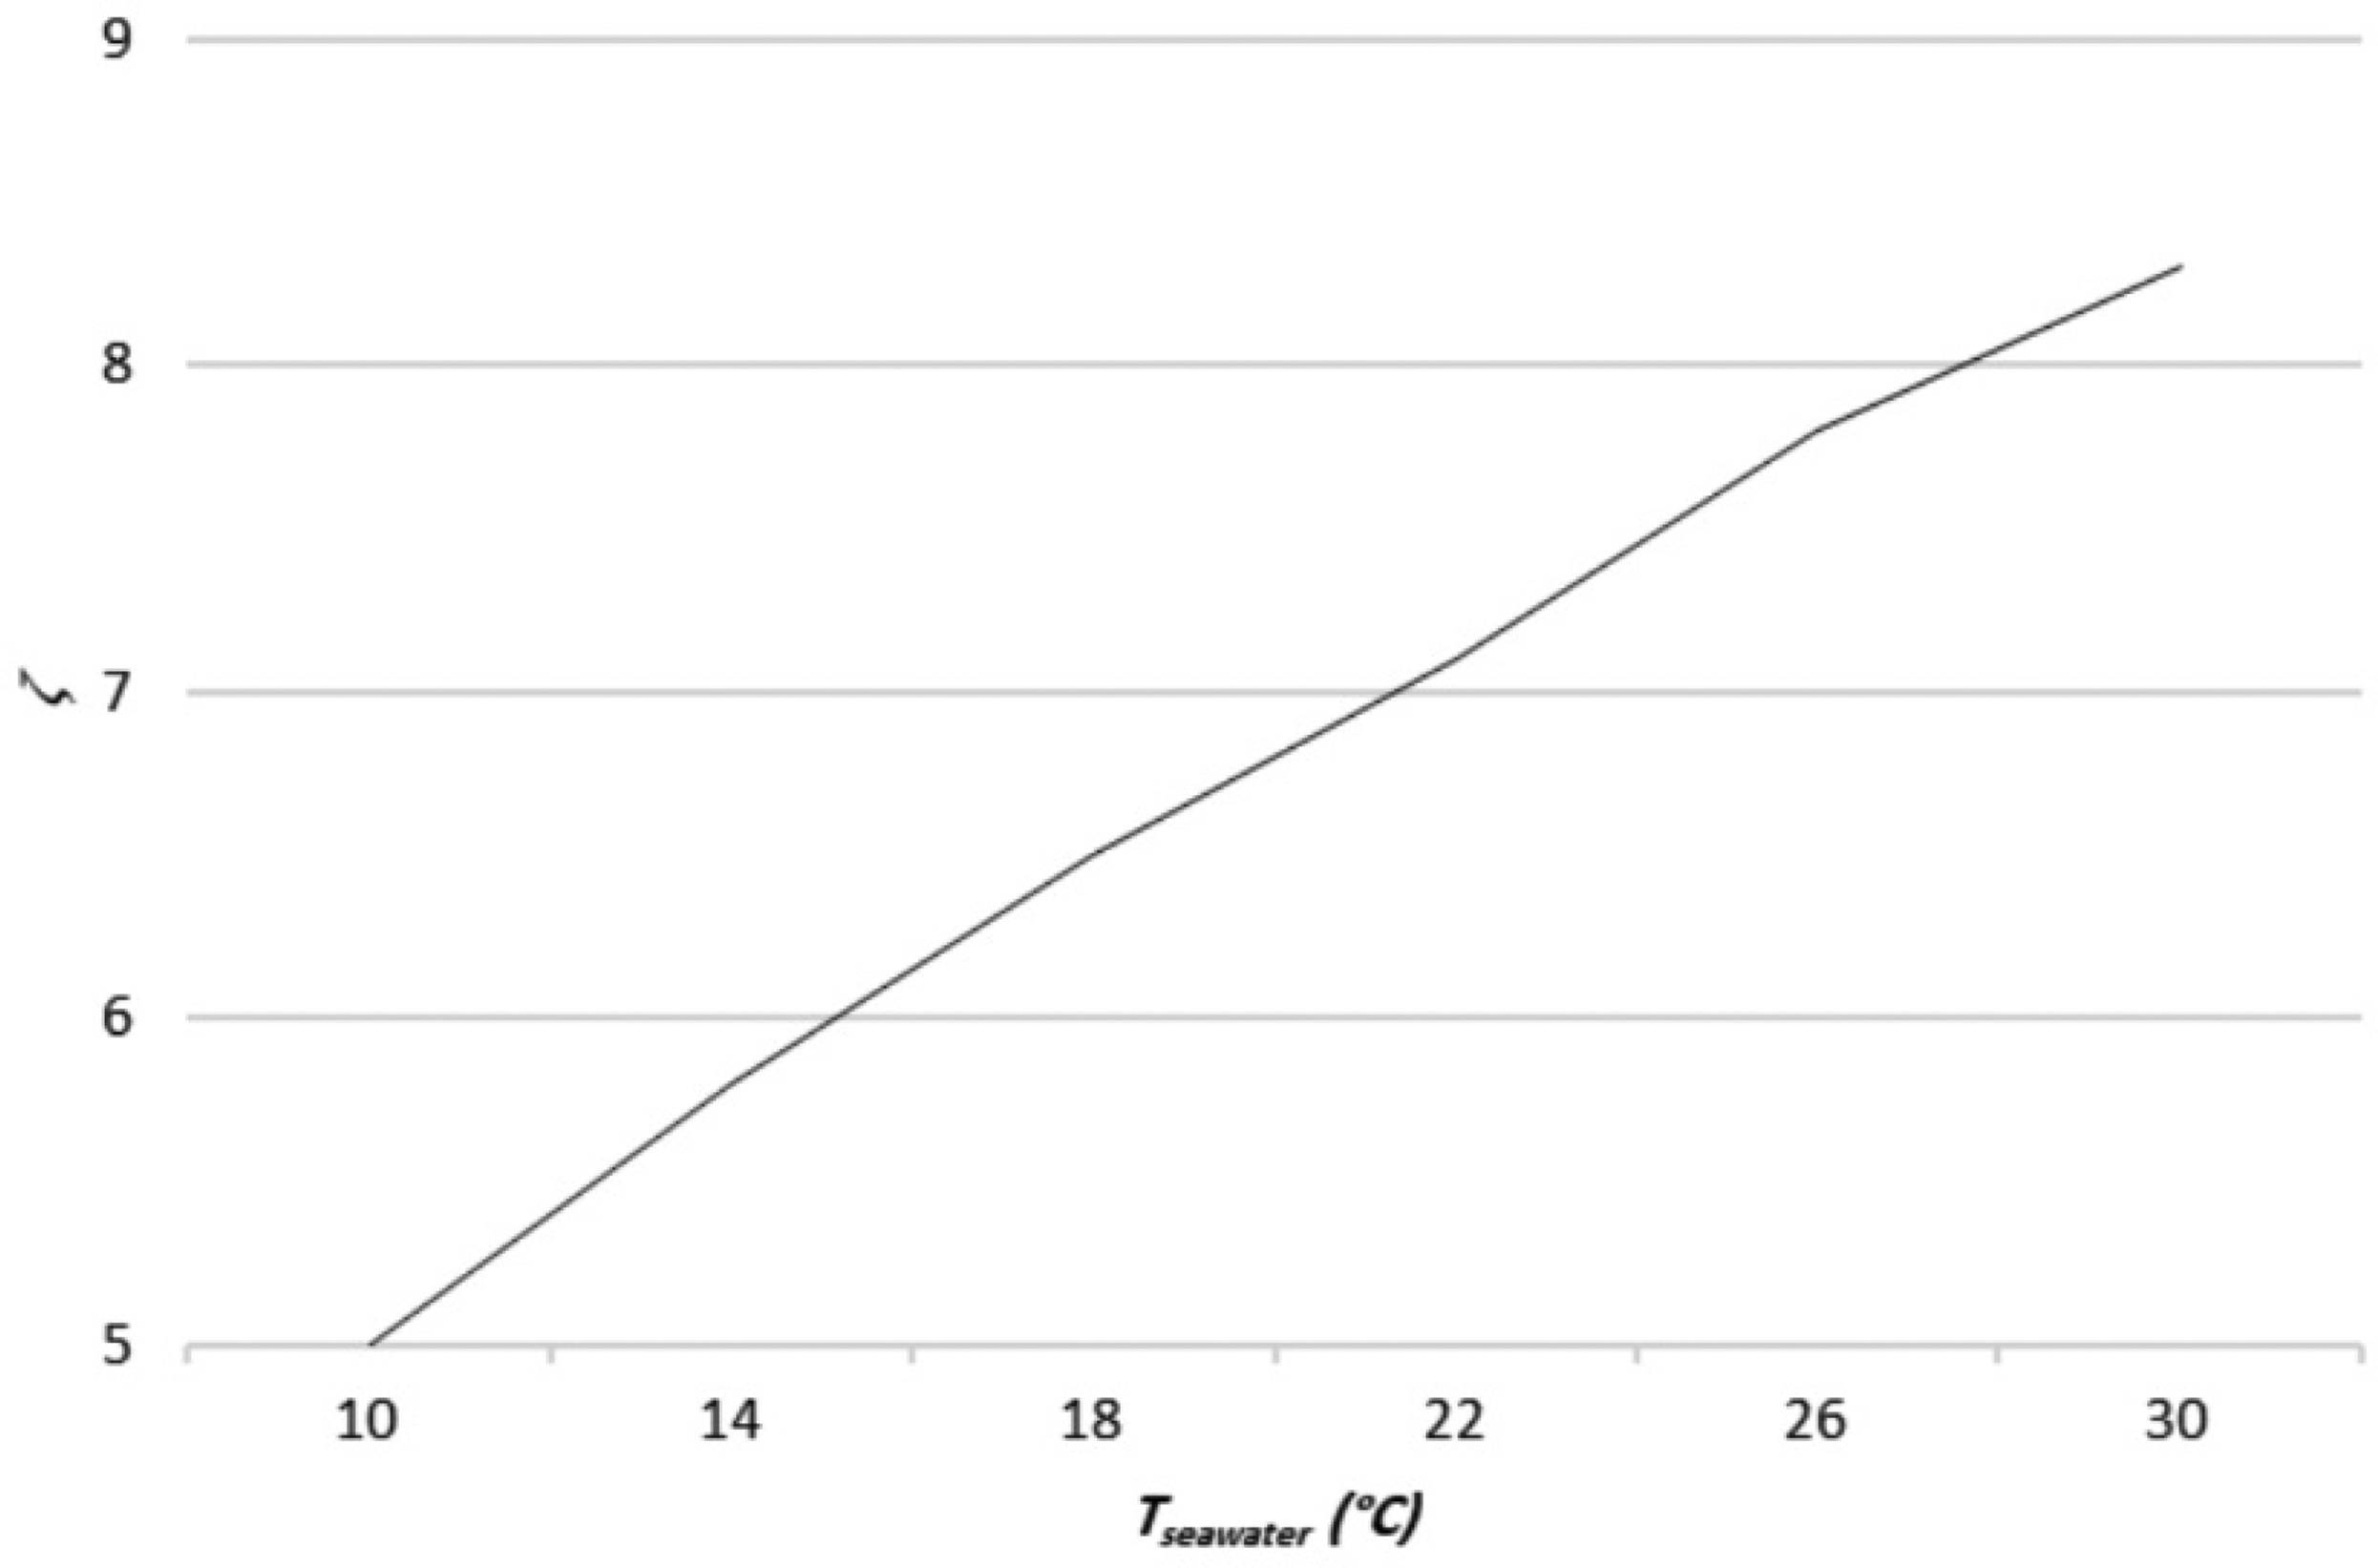
Dimensionless function changes of environmental effects in relation to sea water temperature changes.
Figure 6 illustrates how changes in seawater impact the recovery process. The increase in recovery is a result of reduced feed water flow and higher seawater temperature, which causes more significant changes compared to fresh water production. As per the temperature correction factor in the equations, higher temperatures lead to lower fresh water production flow rate and higher salt water concentration in the system. Figures 7 and 8 further support this; showing that as sea water temperature rises, fresh water production decreases while salt water concentration in the discharged water increases. This also means that environmental effects will increase accordingly.
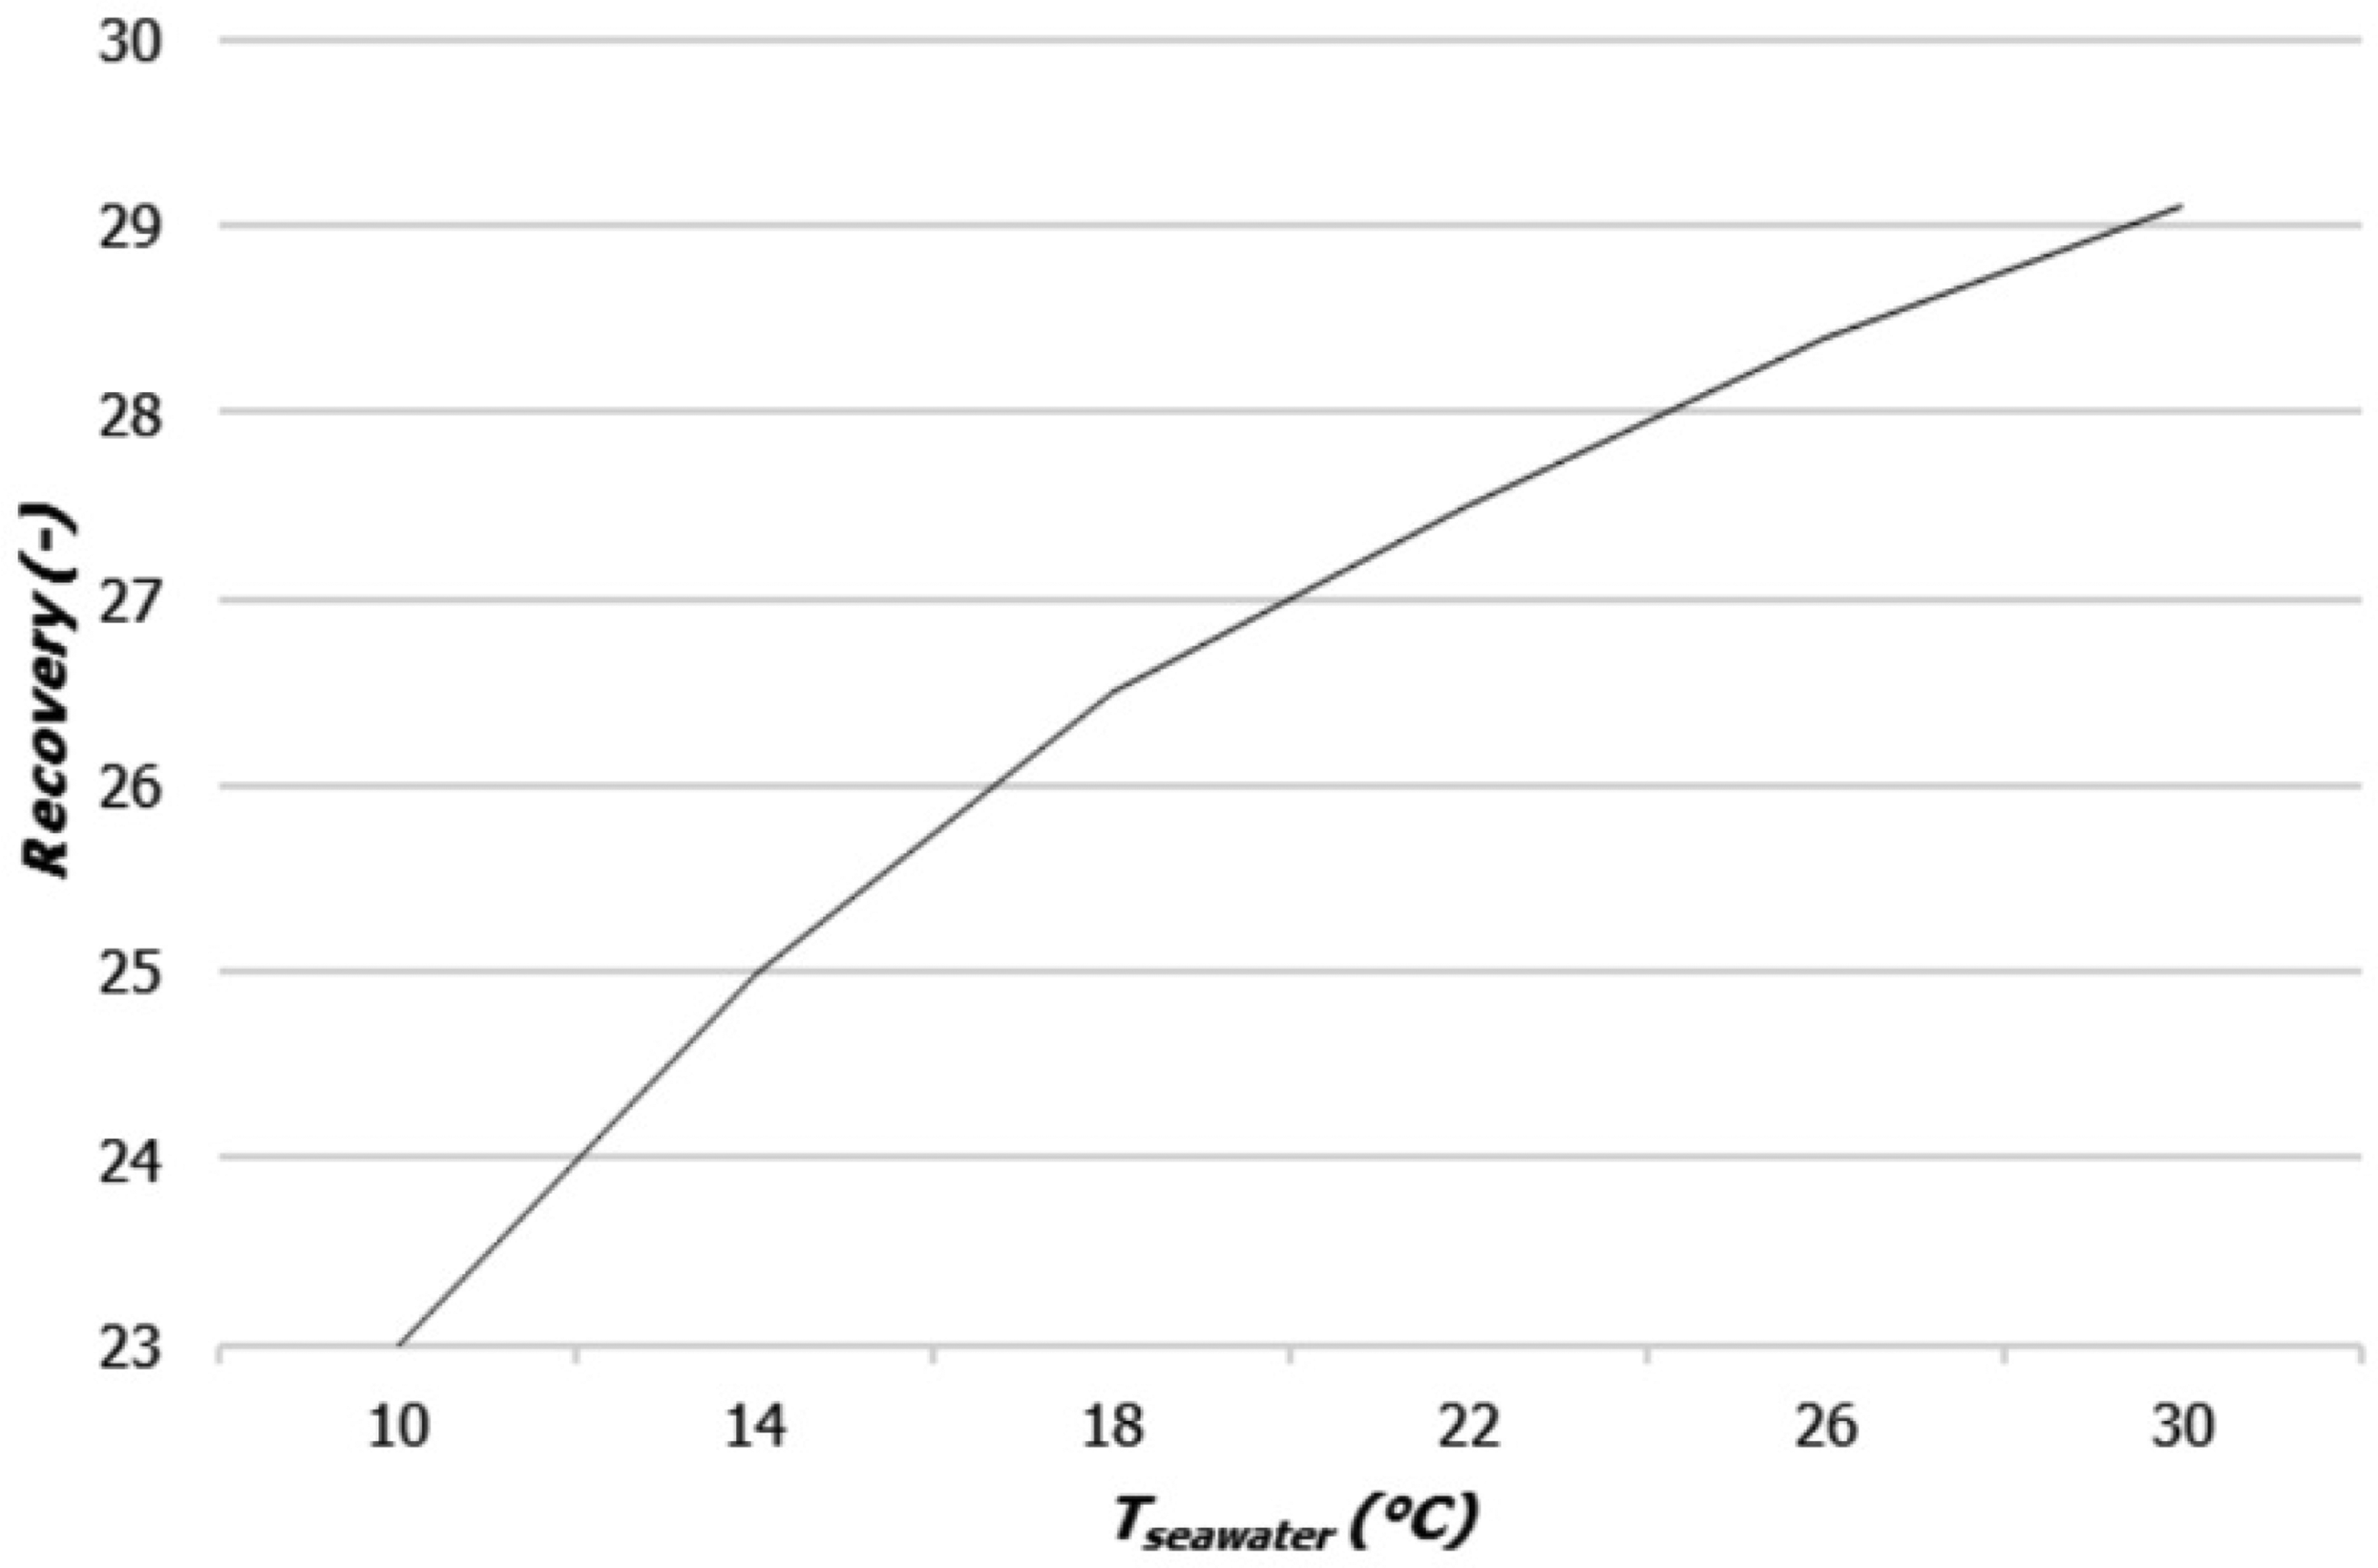
Recovery changes according to sea water temperature changes.
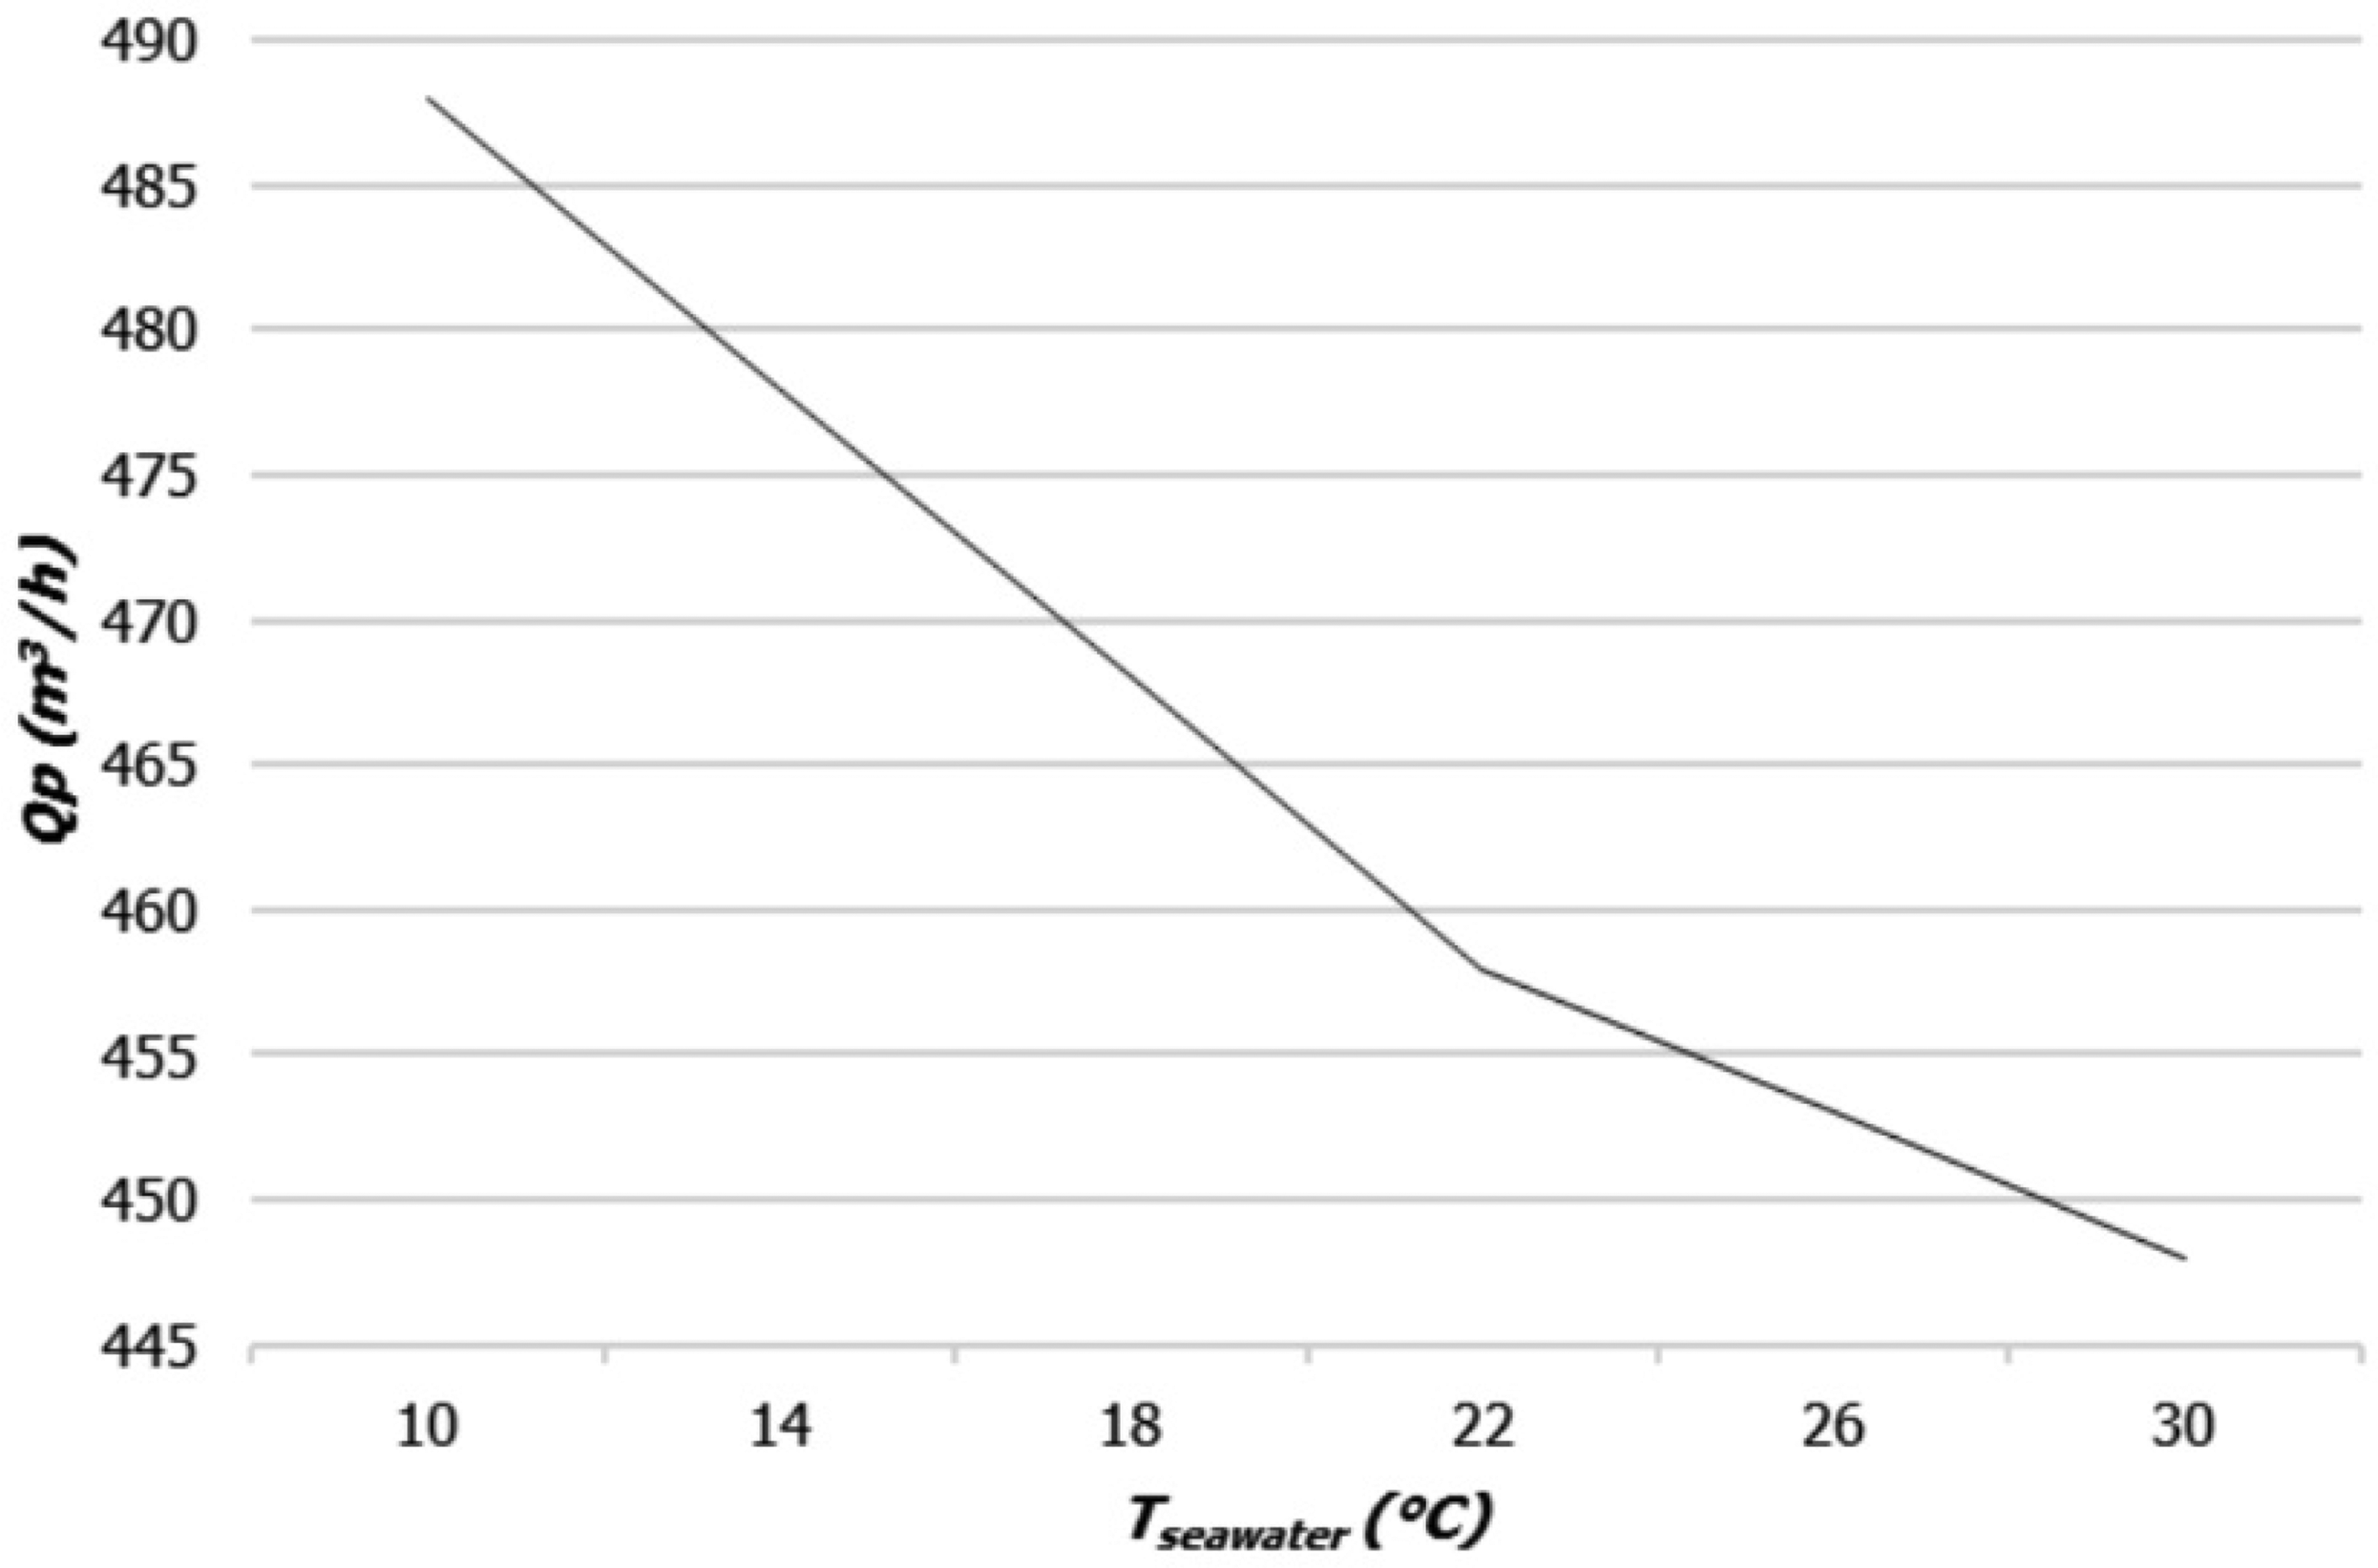
Changes in the produced fresh water discharge according to the seawater temperature.
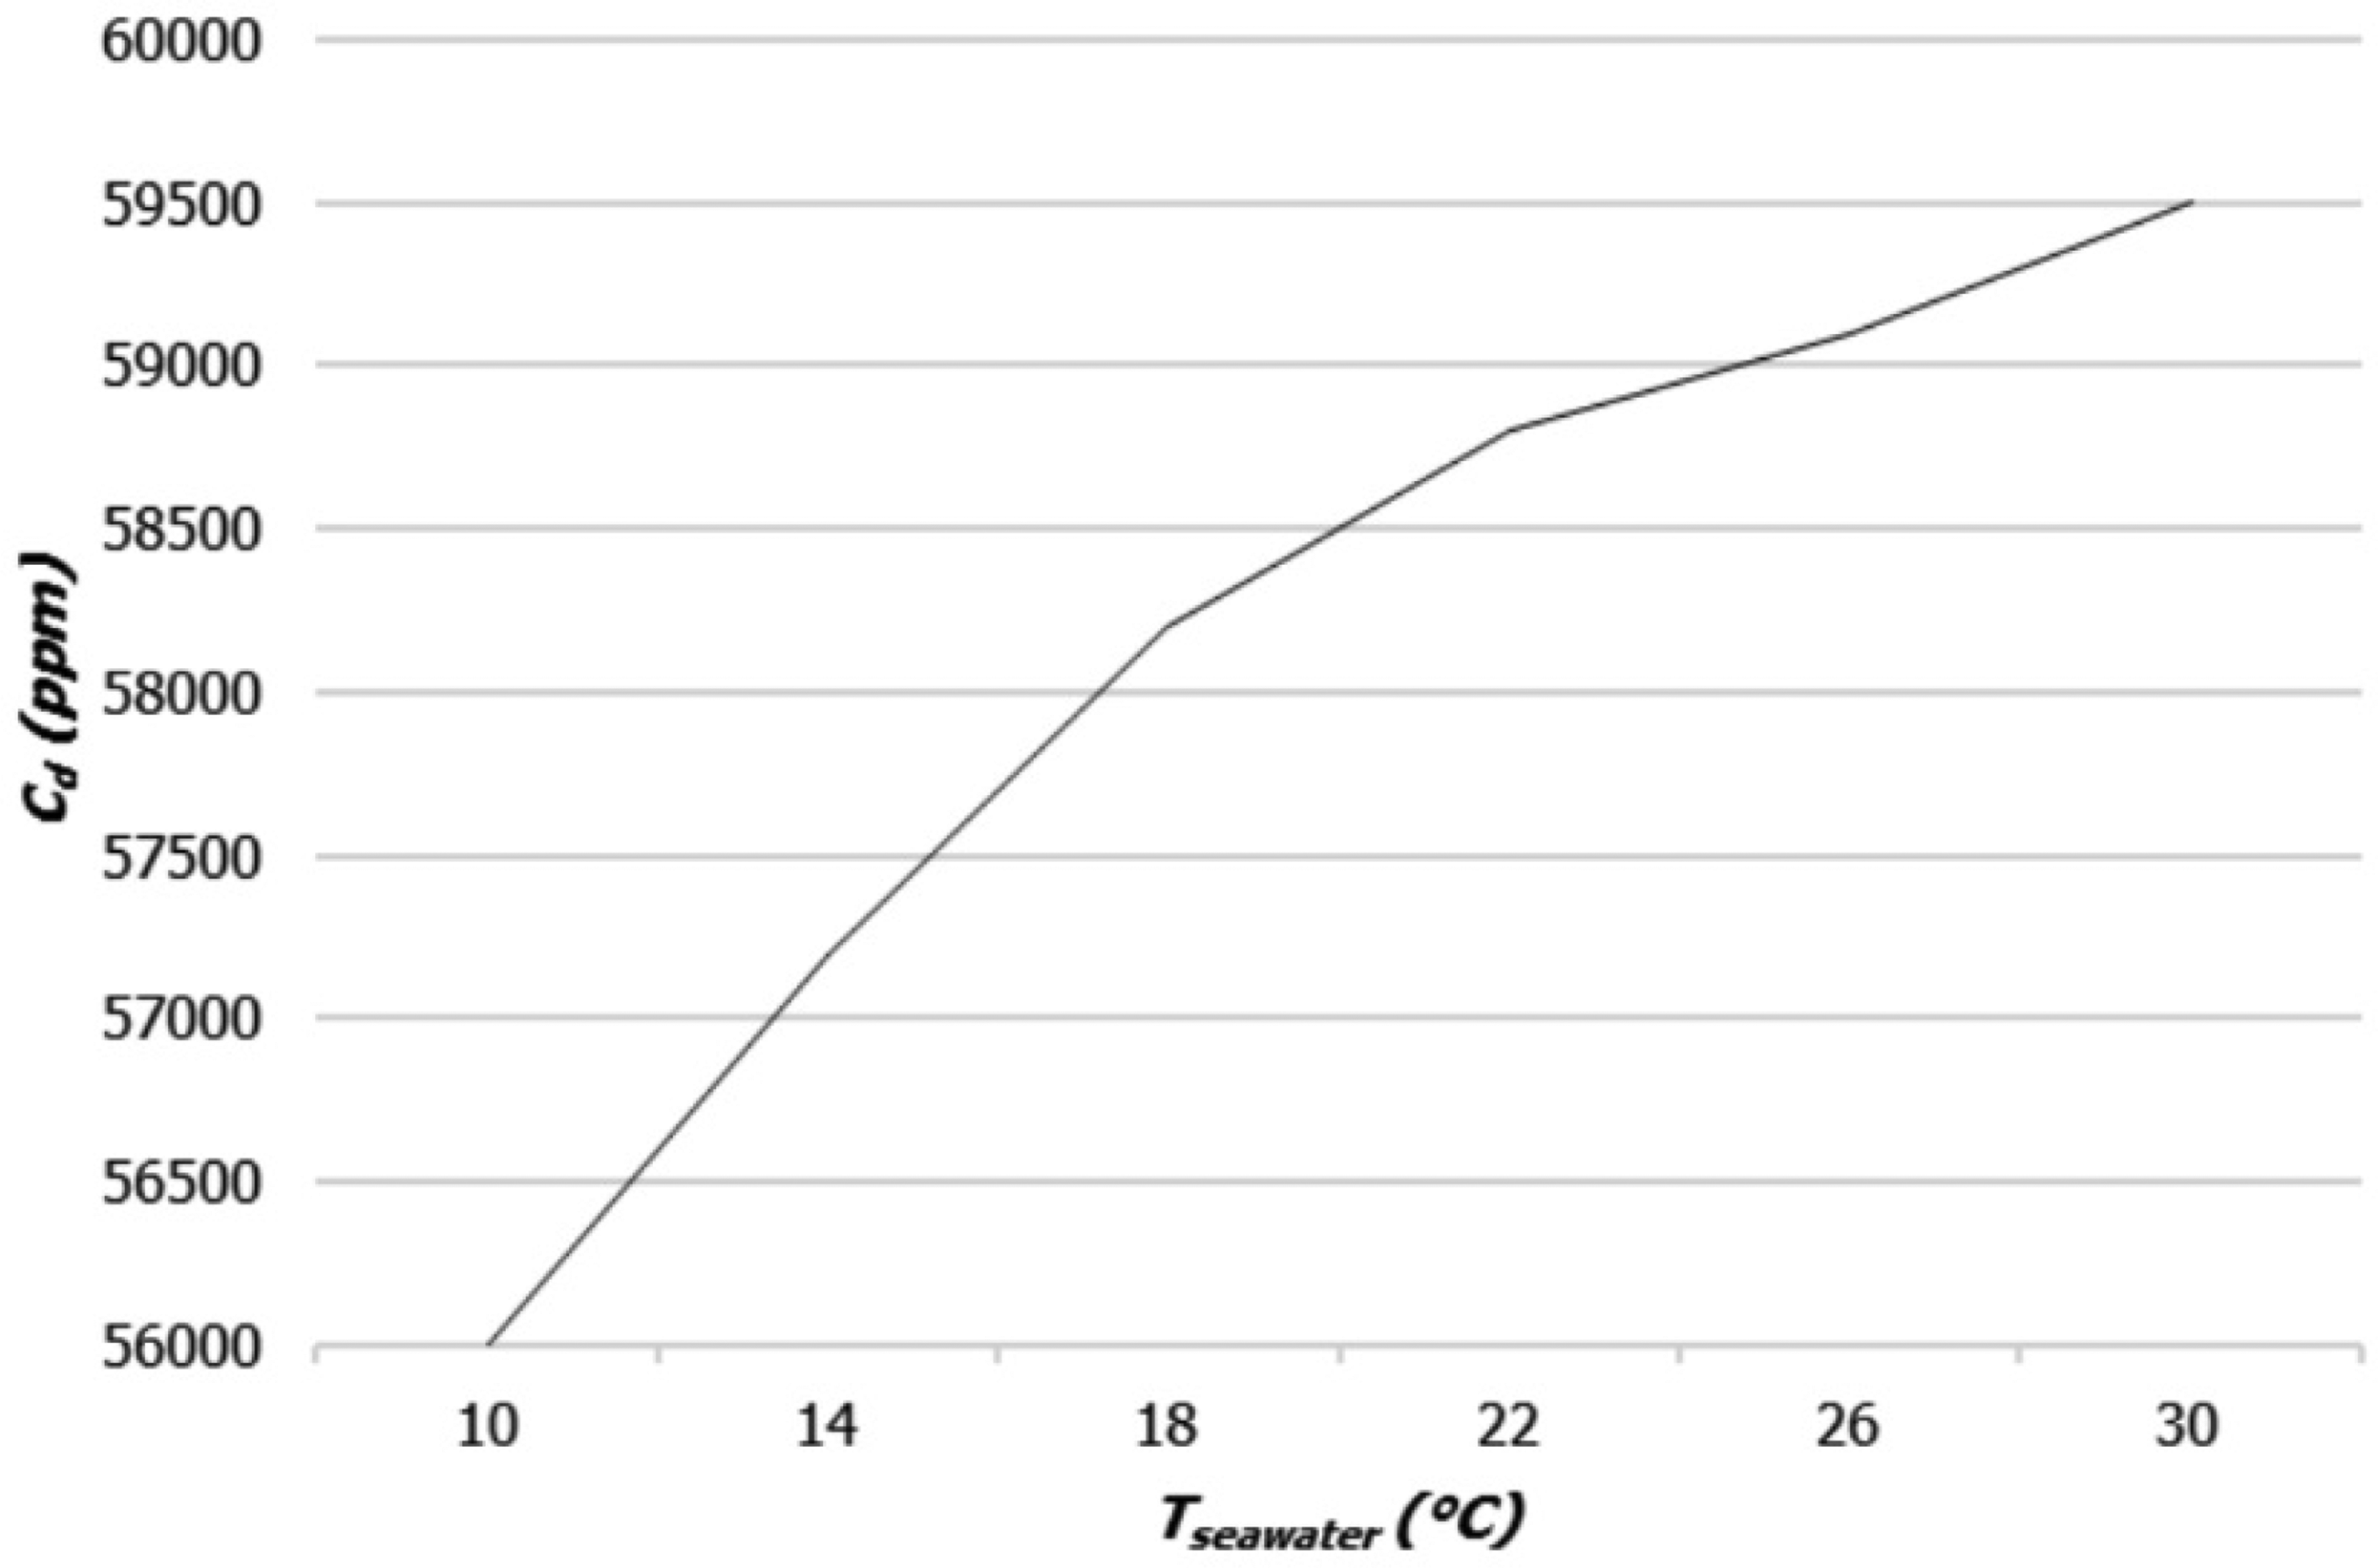
Diluted brine concentration changes according to seawater temperature.
Changing the diameter of the absorber tube in a solar farm affects the cost of the system, as shown in Figures (9) and (10). Increasing the diameter results in higher costs but also increases production capacity. More power production means more fresh water can be produced, leading to improved exergy efficiency and lower prices for the fresh water. The genetic algorithm selected an oil speed of 1.9 m/s for a diameter of 73.5 mm.
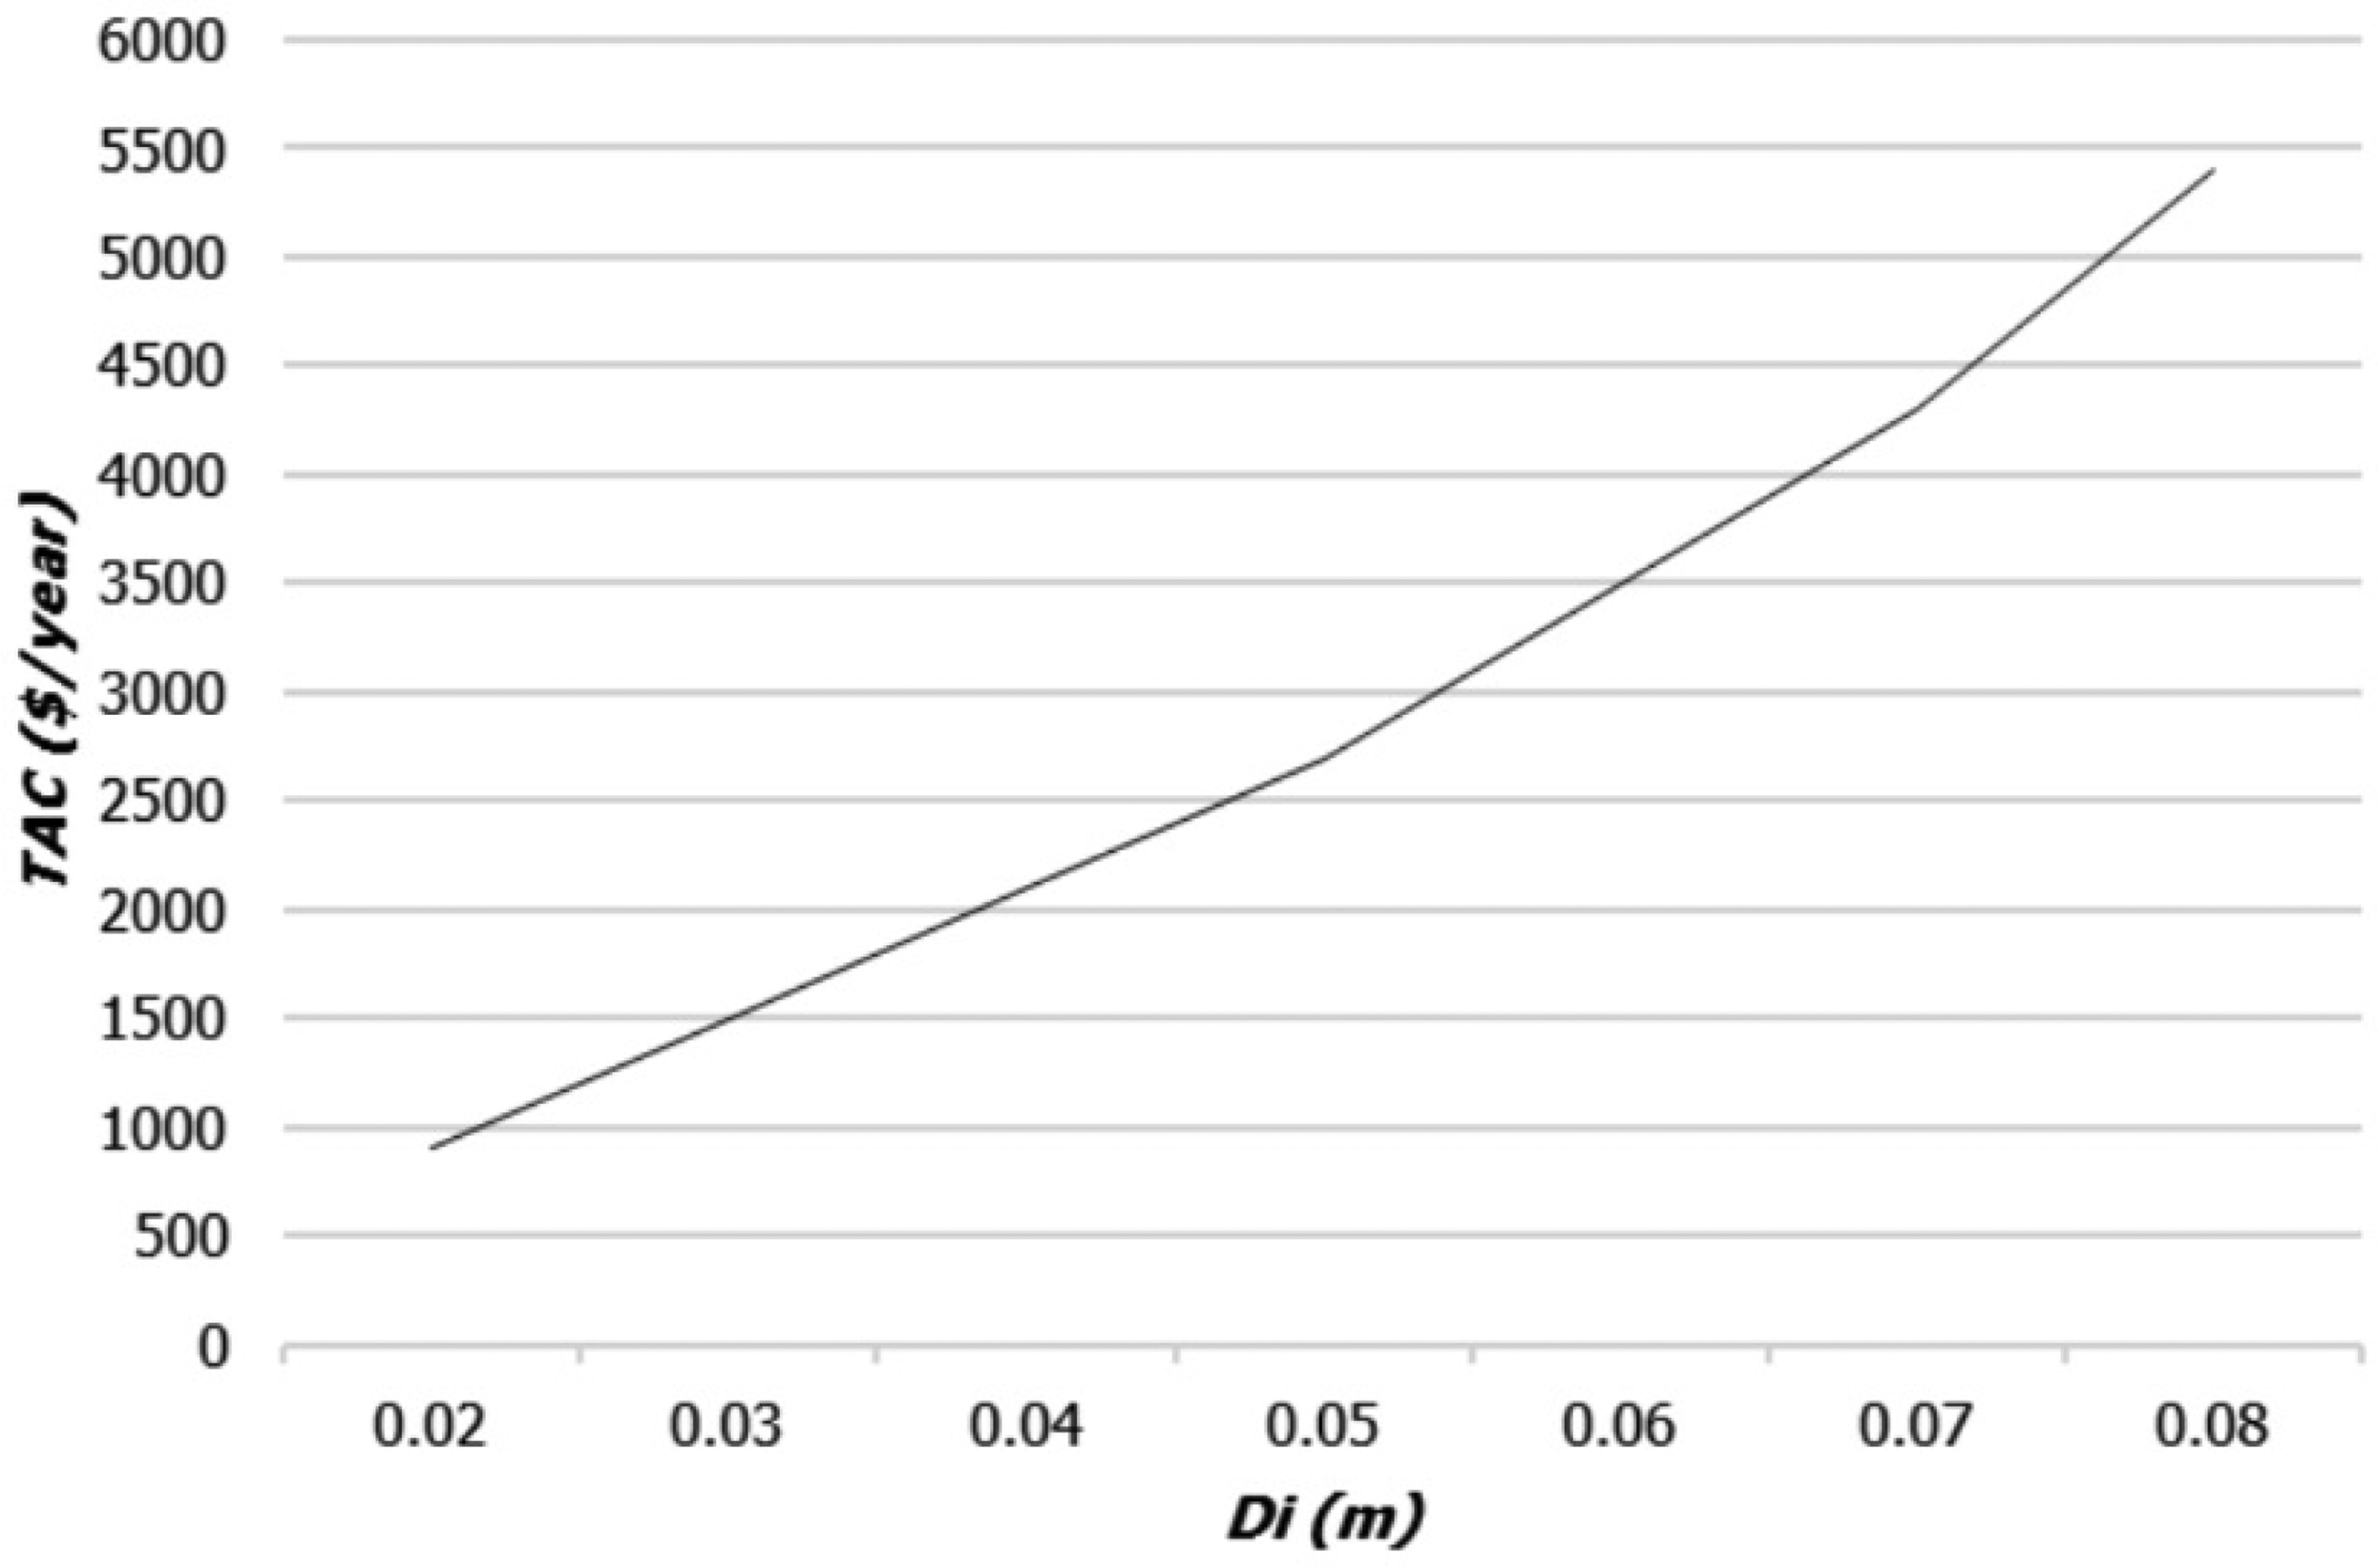
Changes in TAC in terms of changes in the internal diameter of the absorber tube in the solar farm.
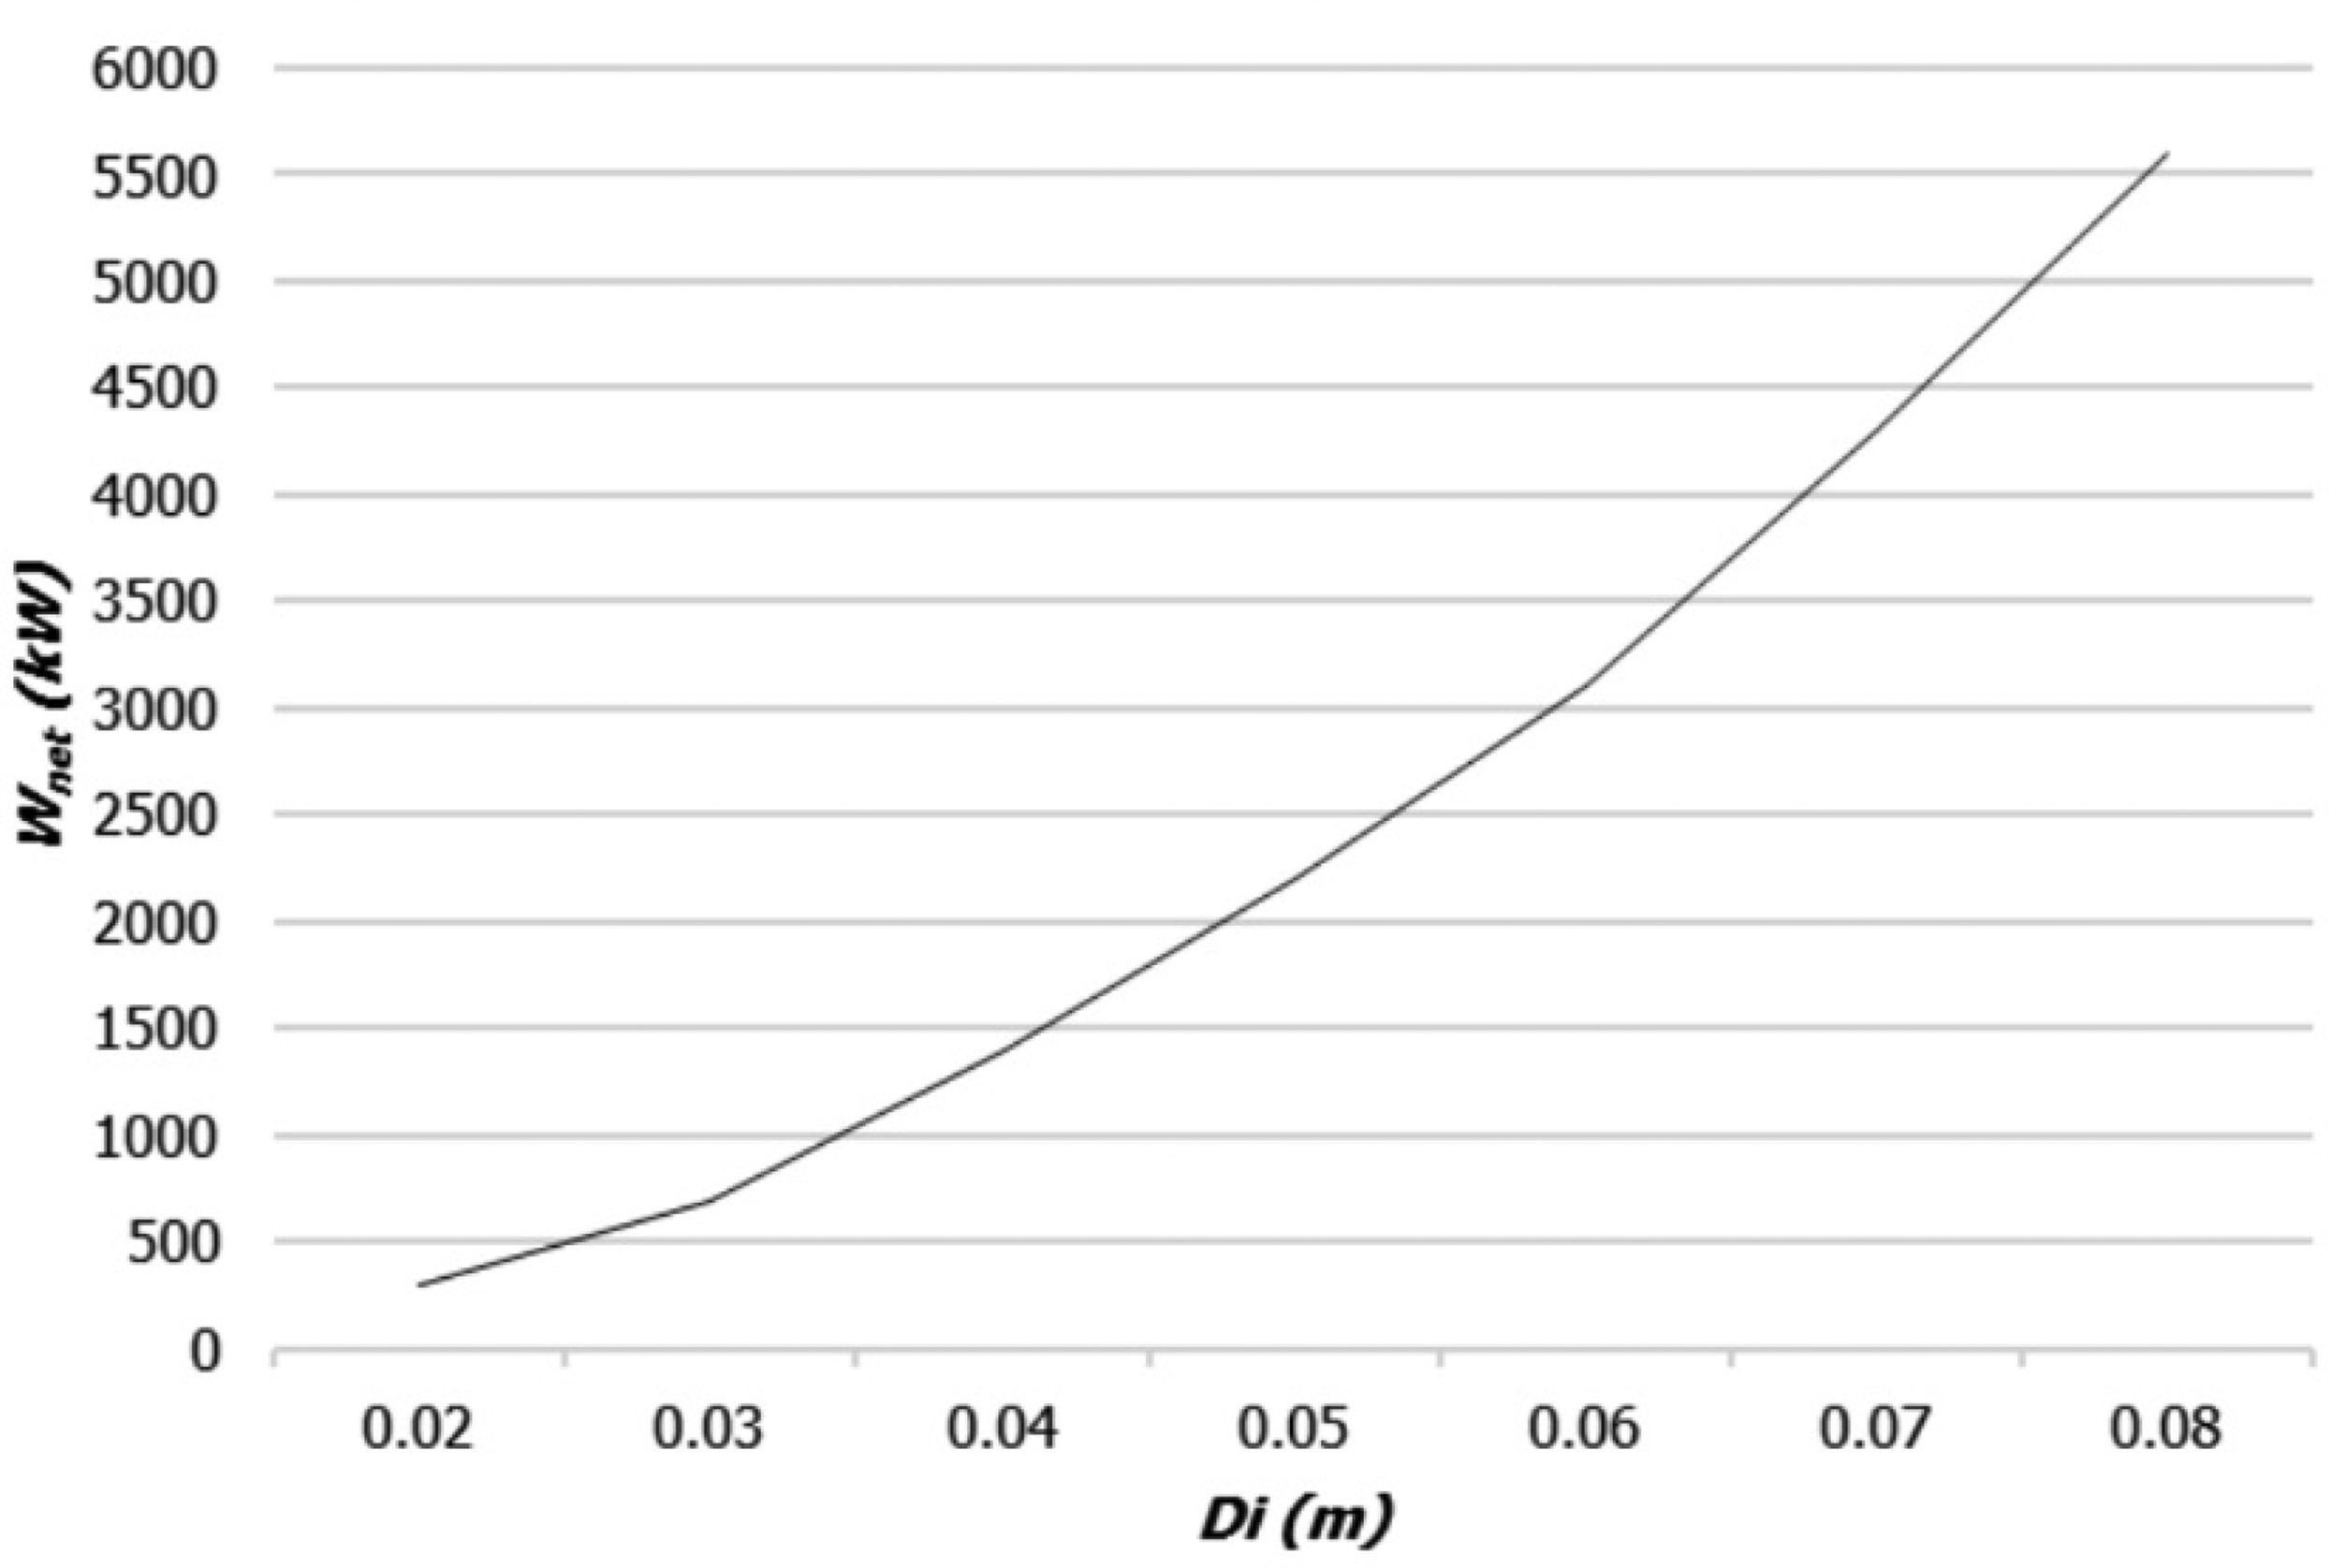
The changes in the production power according to the changes in the internal diameter of the absorber tube in the solar farm.
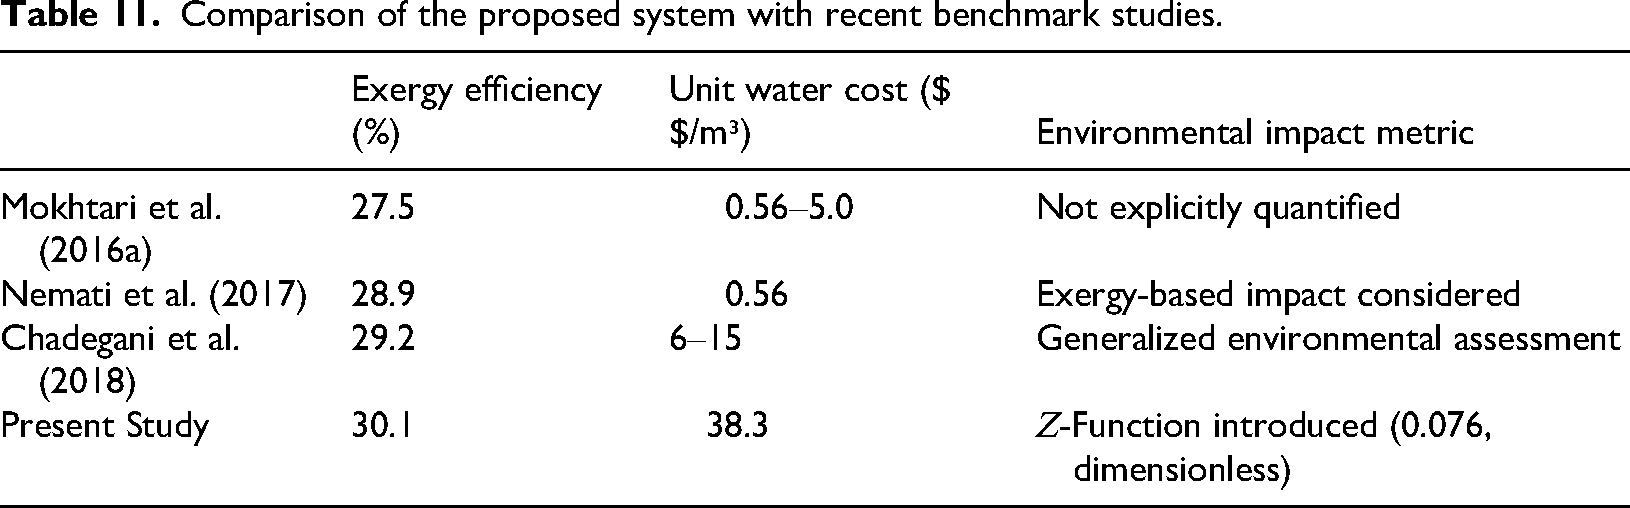
Table 11 compares key performance indicators of the proposed system with recent benchmark studies. This highlights the novelty and competitiveness of our work.
Comparison of the proposed system with recent benchmark studies.
Conclusion
In this article, based on the definition of the function, the analysis and investigation of the environmental effects of this RO system from the perspective of 4E were discussed. As mentioned, an index that can determine the environmental effects in a specific way in the objective functions has been discussed in a few articles. To better express the concept of the function, this index was investigated in a solar farm where the production power is used for the desalination of seawater. The results show that the use of the function can lead to the improvement of the environmental effects, both in reducing the concentration and in increasing the bionic force to reduce the mixing time and reduce the range of brine emission. Furthermore, the inclusion of the recovery parameter in this function helps to strike a balance between exergy efficiency, fresh water production, and final price while considering environmental impacts. The genetic algorithm successfully enhanced the relevant indicators. The term (ρ
s
w
− ρ1d∗)/(ρ2d∗ − ρ
s
w
) in the function in the optimization is about 0.27, the lower this value is, the more the environmental effects of RO are also reduced. The results showed that a single-stage RO system was used to reduce the increase in brine concentration, and by increasing the seawater temperature by 12 °C, the minimum environmental effects of brine can be achieved along with optimal exergy efficiency. If the oil fluid enters the ORC at a low temperature, it will lead to an increase in system costs. The achievements of this article can be mentioned as follows:
Utilize waste heat from the condenser to minimize the environmental impact of the RO system. Increasing exergy efficiency along with reducing the price using the environmental impact function defined in this article. Three-objective optimization results in a 12% reduction in environmental impact and a 7.5% increase in exergy efficiency.
Footnotes
Abbreviations
Funding
The authors received no financial support for the research, authorship, and/or publication of this article.
Declaration of conflicting interests
The authors declared no potential conflicts of interest with respect to the research, authorship, and/or publication of this article.