
Abstract
To clarify water-conducting fracture zones (WCFZ) development under repeated mining, this study focuses on Huayang Coal Mine's Working Face 15101, adopting an integrated multi-method framework (experimental testing-visual verification-theoretical simulation). Borehole water injection tests are conducted to obtain the variation of WCFZ's permeability coefficient and its developmental height; by observing fracture morphology through borehole television, a quantitative correlation between “permeability coefficient and fracture structure” is established. The study also utilizes theoretical calculations and numerical simulations to predict WCFZ height evolution, and systematically reveals the development characteristics of WCFZ under repeated mining and the law governing its influence on the permeability of overlying strata. Results indicate that the permeability coefficients of the caving zone and fracture zone are 4.9–8.2 and 1.6–4.6 times those of the original rock strata, respectively. This pattern is supported by the fracture morphology observed through borehole television. Numerical simulations find that mining the No. 15 coal seam increases the No. 9 coal seam's overlying WCFZ height by approximately 11.4%. With the study comparing field measurements (75.31 m), theoretical analysis results (68.87 m, approximately 8.6% lower), and numerical simulations (73.87 m, approximately 1.9% lower), the final WCFZ height after repeated mining is determined by field measurements. These findings improve understanding of repeated mining-induced WCFZ and guide roof water hazard mitigation in similar mines.
Keywords
Introduction
As coal mining progresses into deeper zones, mining methods have shifted from single-seam to multiseam operations (Chabedi and Zvarivadza, 2016; Christopher, 2021; Zeng et al., 2024). This transition has induced significant changes in the stress field of overlying strata: stress redistribution during upper-seam mining evolves further during lower-seam mining, resulting in complex stress superposition effects (Cao et al., 2025; Feng et al., 2023; Suchowerska et al., 2013; Sun et al., 2025). The cavity formed after coal seam mining is known as the goaf. The roof, having lost its support, undergoes failure: the lower part forms a fragmented caving zone, while the upper part develops into a fracture zone with dense fissures (Li et al., 2025). Both the caving zone and fracture zone are water-conductive, and together they form the water-conducting fracture zoneWCFZ, a continuous fractured zone created by the deformation and rupture of overlying strata under mining-induced stress. As a core indicator of overlying strata fracture degree, its development height and permeability changes are jointly governed by factors like overlying strata lithology, stress state, and mining sequence (Chen et al., 2023). Initial fractures from upper-seam mining undergo secondary expansion and connectivity under repeated mining disturbances in lower seams, eventually forming a connected water-conducting network (Peng et al., 2024; Yang et al., 2024; Zhao et al., 2024).
Fractures overlying strata caused by repeated mining not only leads to interlayer separation and uneven settlement but also further amplifies the potential risk of geological hazards through abrupt variations in the permeability of WCFZ (Genis et al., 2018; Iwanec et al., 2016; Liu et al., 2024). When fracture networks connect aquifers, they can potentially cause mine water inrushes (Guo and Ma, 2025; Wang et al., 2024). Additionally, imbalances in groundwater systems can cause a series of ecological issues, including aquifer depletion and water quality degradation (Han et al., 2023; Kumi et al., 2024; Zhao and Wu, 2018). As a core parameter measuring the water-conducting capacity of fractures, the dynamic changes in permeability coefficient directly determine the actual hazard range of WCFZ (Guo et al., 2022). At present, the coupled evolution law of permeability and fracture structure under repeated mining conditions remains unclear, and the dynamic mechanism by which this coupling regulates water-conducting capacity has not yet been clarified. These two uncertainties are the key factors that have directly compromised the accuracy of hazard early warning and prevention.
In recent years, scholars have explored the patterns of overlying strata fractures through theoretical analysis, numerical simulation, physical modeling, and field measurement. However, these approaches have significant limitations. Empirical formulas in the Specification for coal pillar retention and coal mining under buildings, water bodies, railways, and main tunnels (Regulations for Mining Under Three Conditions) fail to adapt to complex geological settings, leading to large deviations in predicting the height of WCFZ (Feng et al., 2025; State Administration of Work Safety et al., 2017; Wu et al., 2021). Numerical simulations are constrained by factors such as the selection of mechanical parameters and simplifications of fracture evolution models, making it difficult to accurately reproduce dynamic permeability changes (Andrey et al., 2019; Khanal et al., 2019; Zhao et al., 2025; Zheng et al., 2024). While physical modeling can intuitively demonstrate failure processes, it suffers from high costs, long cycles, and challenges in quantifying permeability (Hu et al., 2024; Luo et al., 2023). Traditional borehole water injection tests and borehole television observation mostly focus on leakage differences before and after mining, with insufficient attention to the dynamic characteristics of permeability coefficients (Adhikary and Guo, 2014; Chang et al., 2023; Xu et al., 2025; Wu et al., 2024). Consequently, the correlation mechanism among fracture structure, permeability, and water-conducting capacity under repeated mining remains insufficiently resolved. Although previous studies have addressed the WCFZ, few have quantitatively established the permeability–fracture–structure linkage in the context of repeated mining.
To address these issues, this study adopts an integrated multimethod research approach: experimental testing-visual verification-theoretical simulation. Borehole water injection tests are used to quantitatively obtain changes in permeability coefficients and developmental heights of WCFZ under repeated mining, while borehole television observations of fracture morphology help establish a quantitative correlation between “permeability coefficient-fracture structure.” Theoretical analysis and numerical simulations are employed to predict the evolutionary patterns of the height of WCFZ. The research findings will provide quantitative support for water inrush prevention and groundwater protection in multiseam mining, with practical guiding significance for improving the level of safe mining and the effectiveness of ecological protection in mining areas.
Material and methods
Study area
Geological condition
Huayang Coal Mine is situated on the western flank of the Taihang Mountain composite anticline, the southern section of the eastern wing of the Qinshui Basin, and the western side of the Jinhuo fold-fault belt. The geological structure of the mining area is generally characterized by broad and gentle anticlines and synclines. The strata are relatively flat, with a dip angle of approximately 4°–7°. The stratigraphic sequence in the study area is well-preserved, encompassing deposits from the Early Paleozoic to the Cenozoic. Coal seams are primarily hosted in the Upper Carboniferous Taiyuan Formation and the Lower Permian Shanxi Formation. The area contains multiple coal seams of significant thickness, including the stable and mineable No. 3, No. 9, and No. 15, with average thicknesses of 4.73 m, 1.74 m, and 2.78 m, respectively. The remaining reserves of the No. 3 coal seam lie beneath Shangzhang Village, Xiazhang Village, Fengzhuang Village, and the former Huayang Coal Mine site; these reserves are no longer amenable to regular mining and have been sealed off. Following the merger and reorganization of the mines, the main mineable seams are the No. 9 and No. 15 coal seams. The mining area is divided into five mining fields: Mining field 1, Mining field 2, Mining field 3, Mining field 4, and Mining field 5. Among these, Mining field 2 is situated in the No. 9 coal seam and has been nearly fully mined, while the remaining four mining fields are in the No. 15 coal seam. The working Face 15101 is located in Mining field 1, where the coal seam elevation ranges from +643 to +659 m, with an average burial depth of 366.8 m. The overall burial depth gradually increases from east to west, as shown in Figure 1.
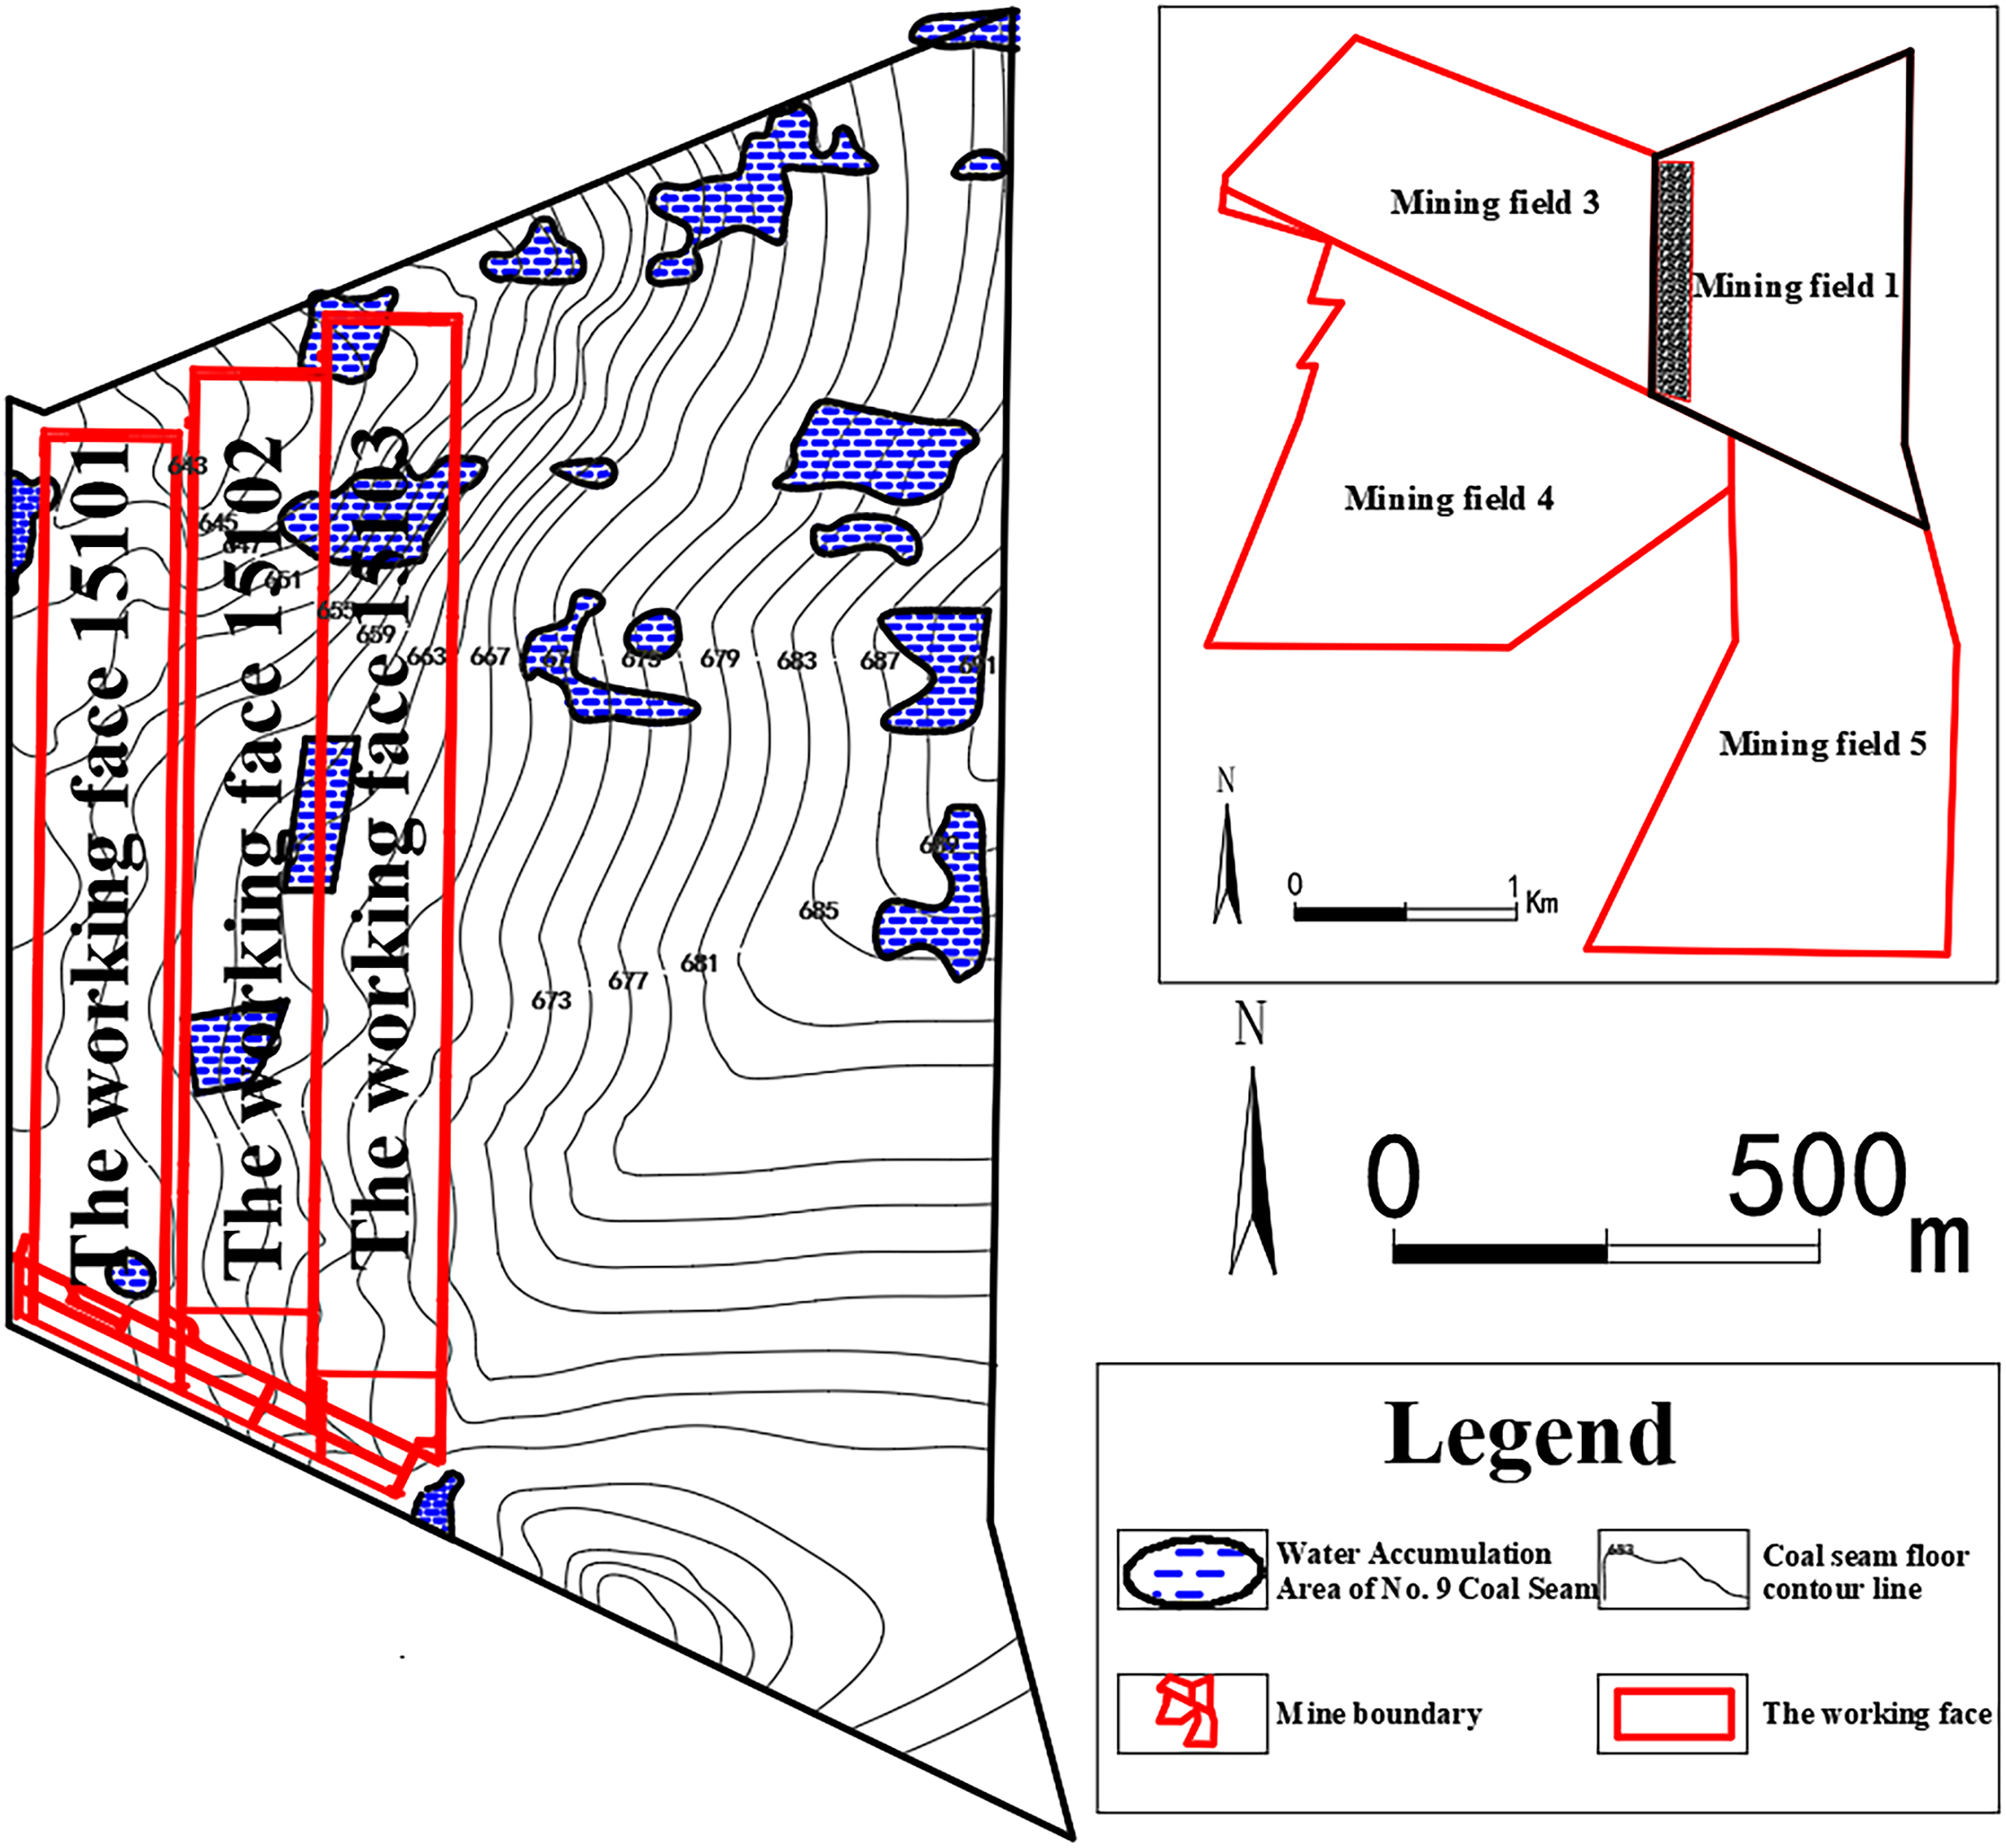
Location map of the working face 15101.
Hydrogeological condition
The Huayang Coal Mine is located in the Yanhe Spring hydrogeological basin, with the mining field situated in the southern runoff area of the basin. Based on the lithology and water-bearing properties of each stratum in the mine, seven aquicludes and eight aquifers have been identified (as shown in Figure 2). These include: the mudstone and aluminous mudstone aquicludes at the base of the Benxi and Taiyuan Formations; interlayer aquicludes between the Carboniferous-Permian limestone and sandstone aquifers; the Quaternary sand-gravel porous aquifer; sandstone fractured aquifers in the Permian Upper Shihezi, Lower Shihezi, and Shanxi Groups; sandstone and limestone karst-fractured aquifers in the Upper Carboniferous Taiyuan Group; and the Middle Ordovician limestone karst-fractured aquifer. Notably, the Taiyuan Group limestone aquifers act as direct water-bearing aquifers for the roof of No. 9 and No. 15 coal seams. Dominated by limestone layers K2, K3, K4, and K5, these aquifers are distributed in layers and separated by mudstone aquicludes, resulting in weak hydraulic connectivity between them. Among all aquifers, only the Ordovician limestone aquifer exhibits relatively high water-bearing capacity, while the others have low capacity.
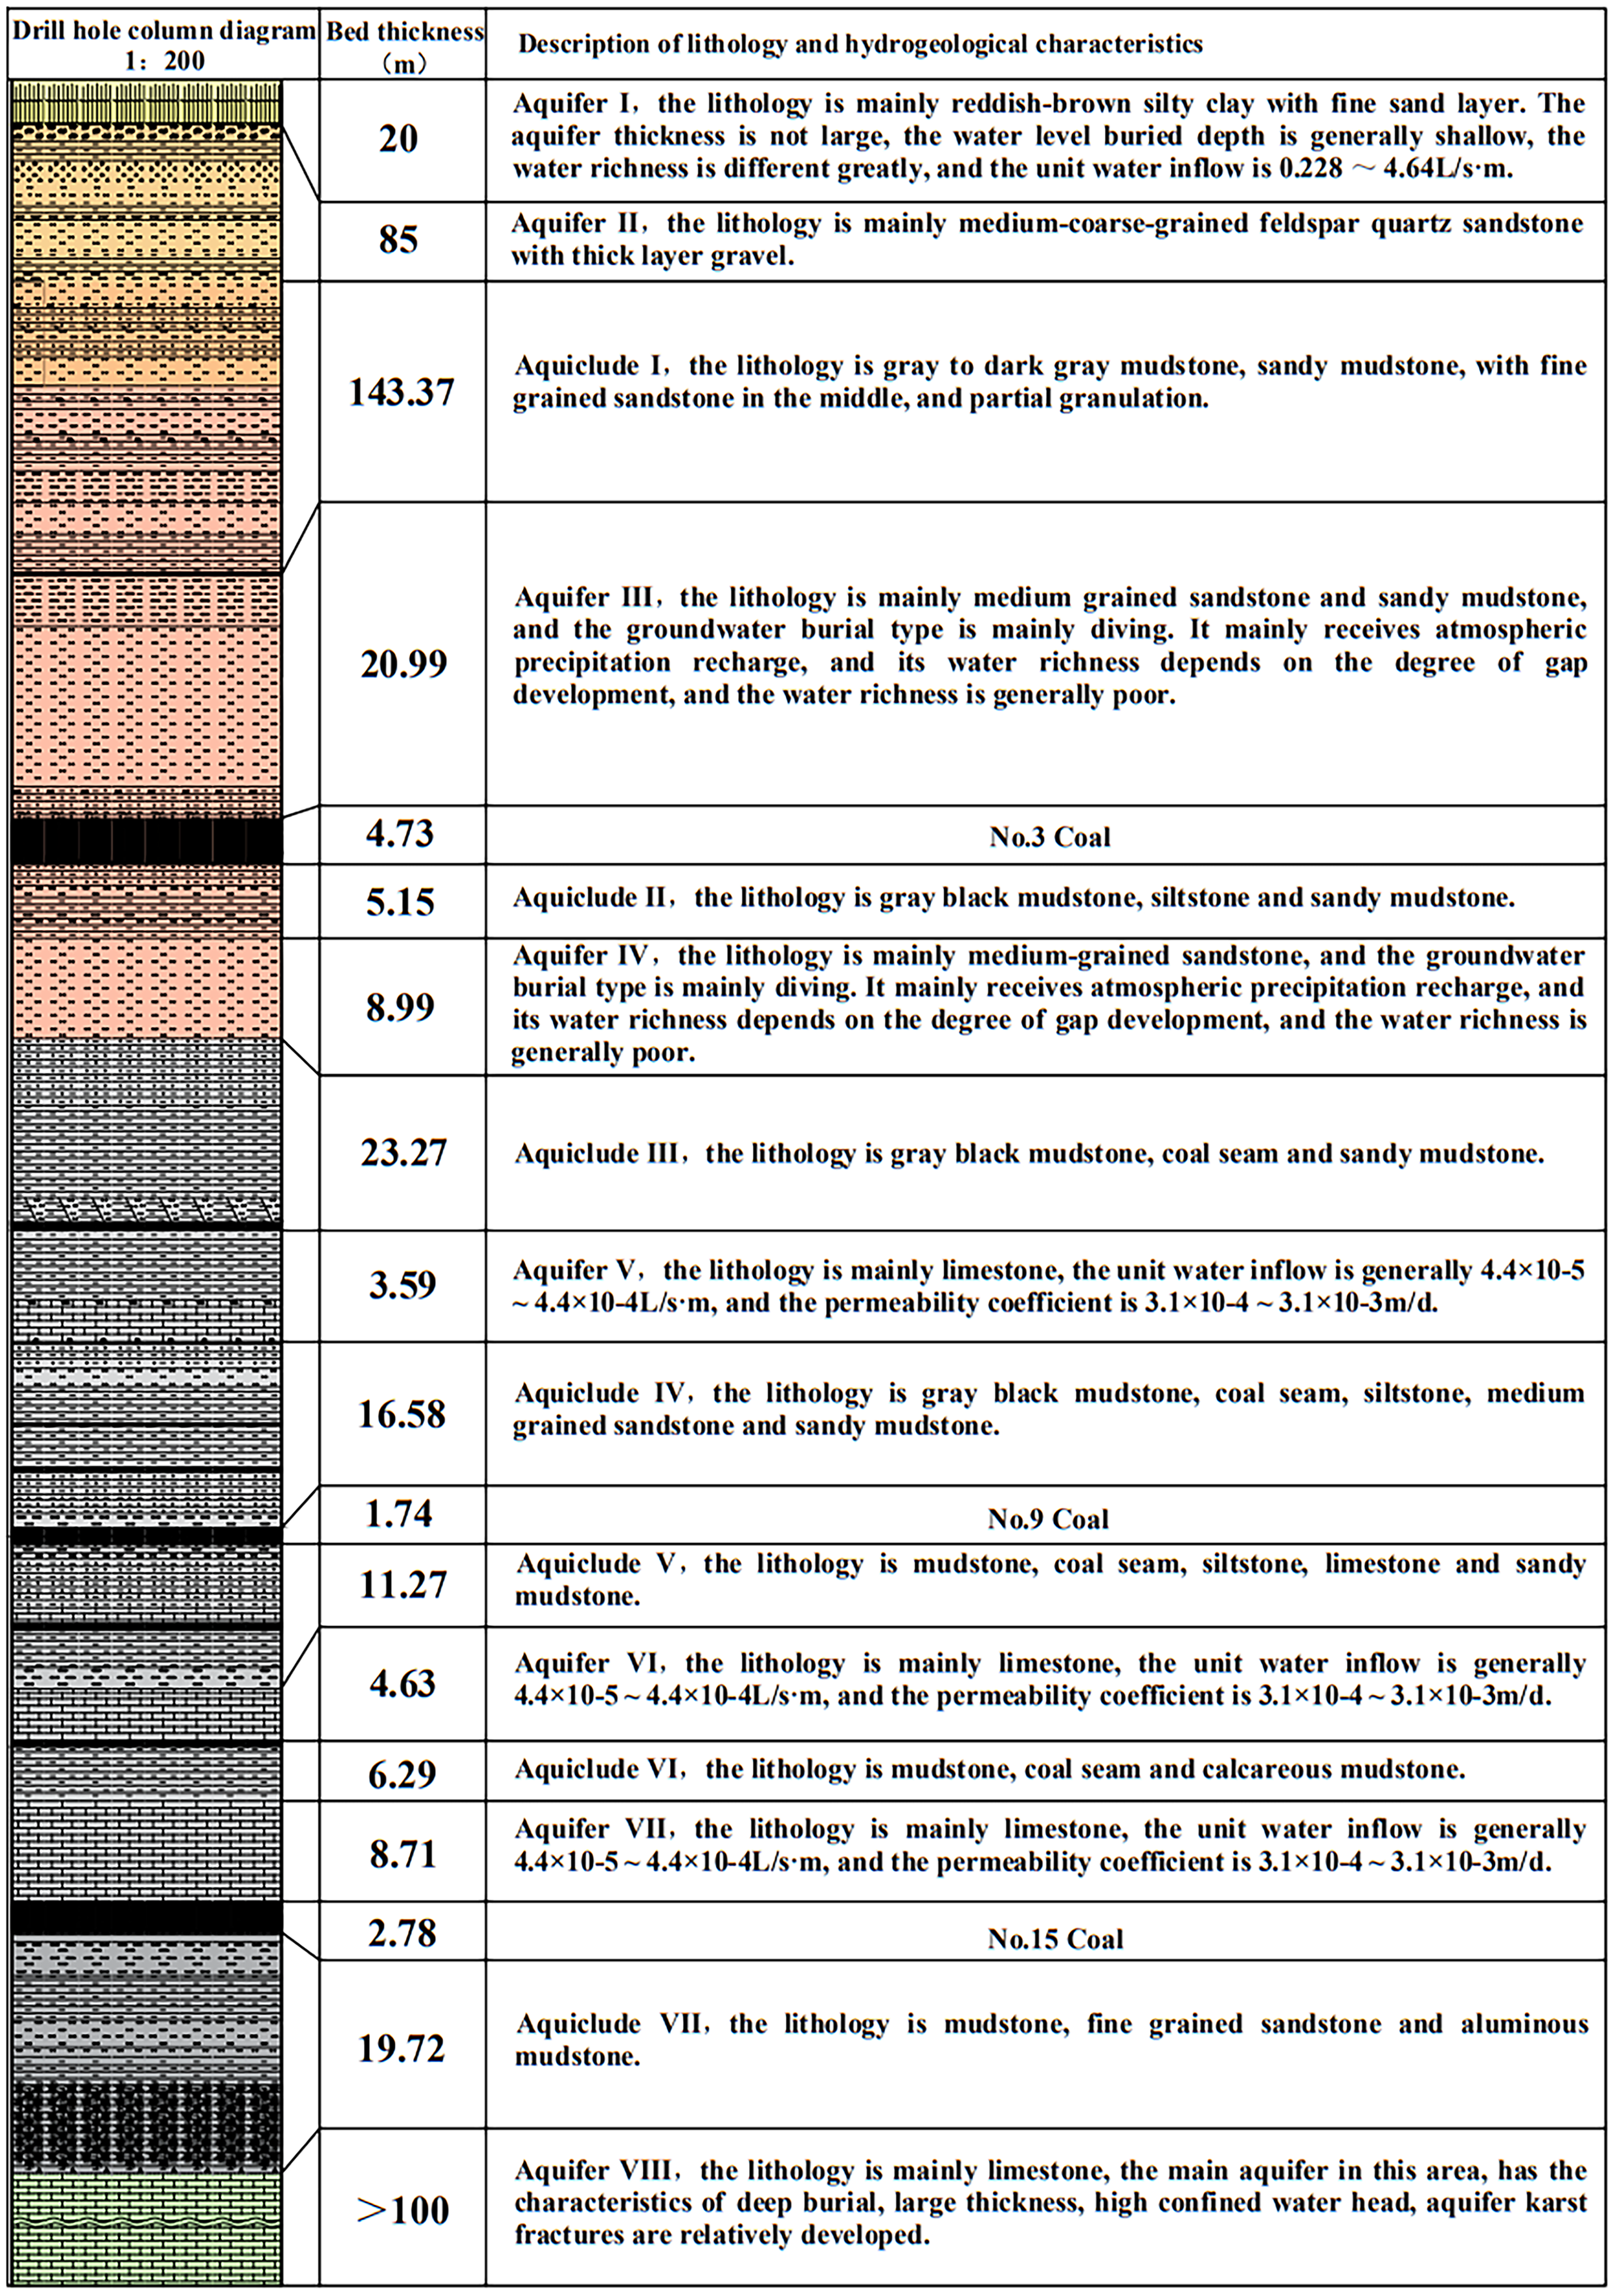
Vertical distribution diagram of aquifers and aquicludes.
Working face overview
The working face 15101 has a strike length of 941 m and a dip length of 150 m, with roadways arranged along the coal seam strike. To the south lies the No. 15 coal main track haulage roadway; to the east, the haulage gateway (15101); to the west, the return airway (15101); and to the north, the mine field boundary. The layout of the working face is shown in Figure 3. Mining is conducted using mixed inclined-vertical shaft development, with full-seam fully mechanized mining and full caving for roof management.
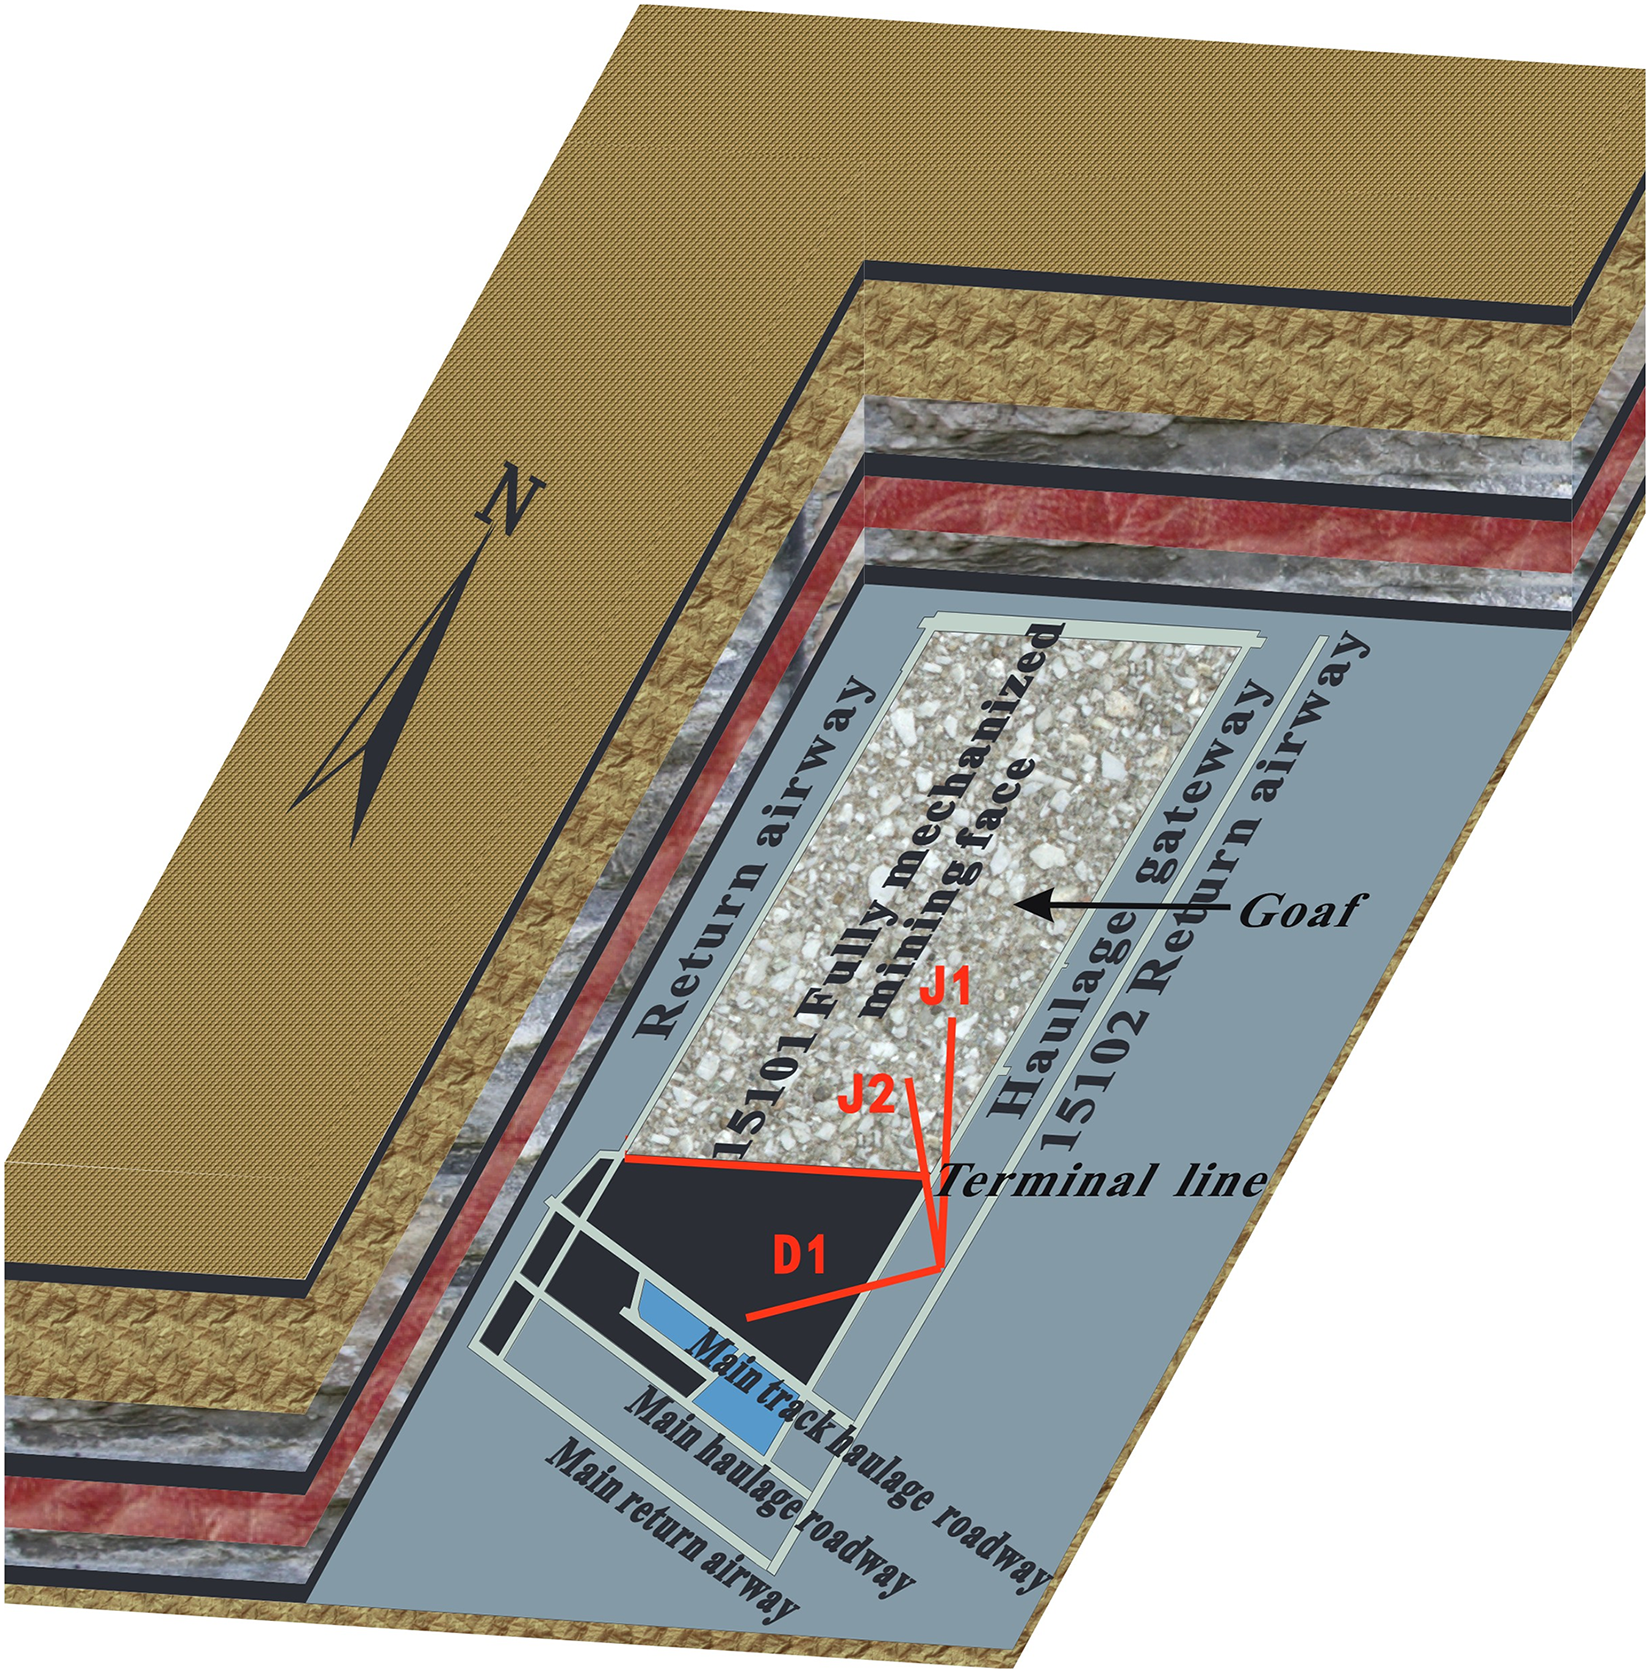
The working face15101 layout.
Field measurement
Borehole location
Taking into account the on-site conditions, three boreholes were drilled 32 m north of the 2HS2 survey point in the return airway (15102) (coordinates: 35°38′00″N, 113°17′17″E; elevation: +657 m): one original rock comparison borehole (D1), one fracture zone test borehole (J1) for the WCFZ, and one caving zone height test borehole (J2). The borehole construction parameters are shown in Table 1, and their layout is shown in Figures 3 and 4.
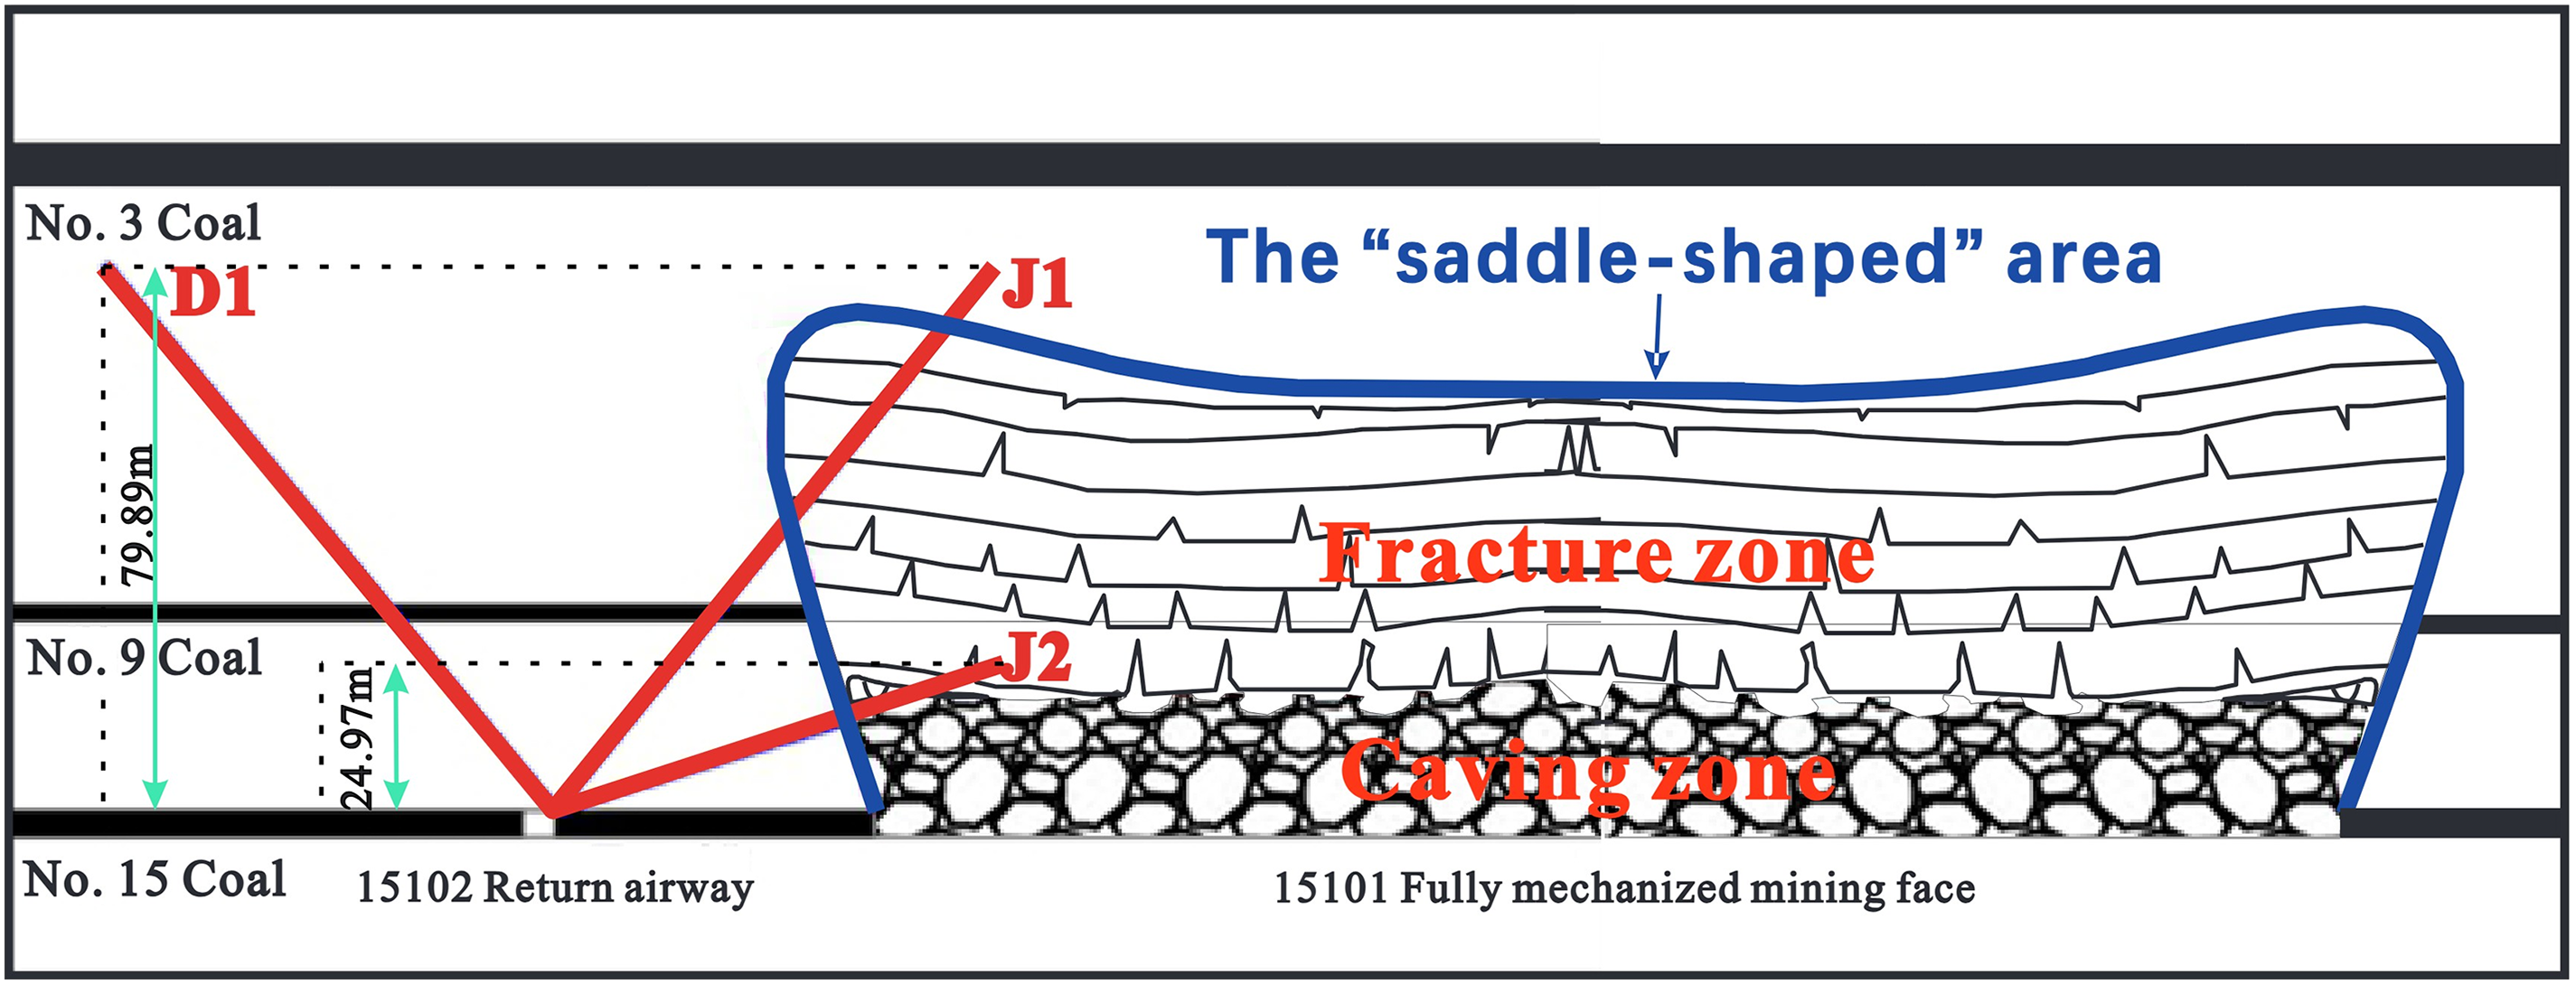
Borehole layout cross-section.
Borehole construction parameters.
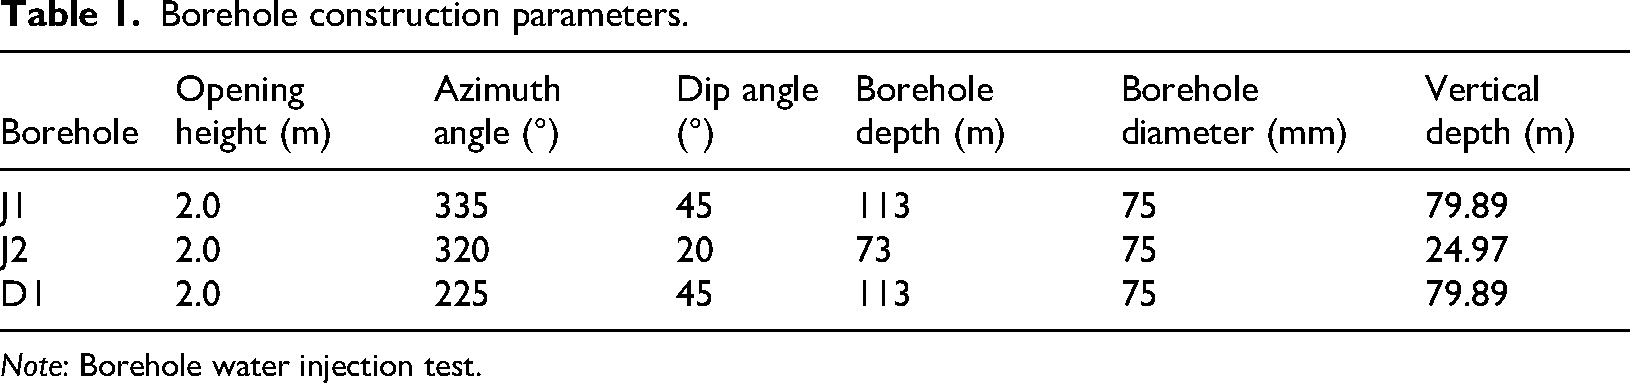
Note: Borehole water injection test.
The dual-end sealing system used for the observation is shown in Figure 5. The specific steps for observation are as follows:
Before testing, assemble the equipment pipelines and check the sealing of gas lines and water lines. During testing, open the vent valve and water drain valve, and advance the water injection section of the water stopper to the bottom of the borehole. Open the water inlet valve; once water flows out of the borehole collar, close the inlet valve, then observe and record the pressure on the water injection gauge, which is the pipeline hydrostatic pressure at the elevation of the double-end plugging leakage measurement device (referred to as “elevation static pressure”). Next, open the air inlet valve and maintain an inflation pressure of 3 MPa. Based on this elevation static pressure, add 1 MPa of water injection pressure to perform constant-pressure injection into the sealed borehole section. During observation, when the water injection flow rate balances with the leakage flow rate through borehole wall fractures, both the injection pressure and flow rate stabilize. Once stable, observe and record the water injection flow rate per minute. After completing the flow observation, close the water injection valve and open the vent valve to allow the sealing capsule to contract. Repeat Steps (2) to (4) until the test is complete.
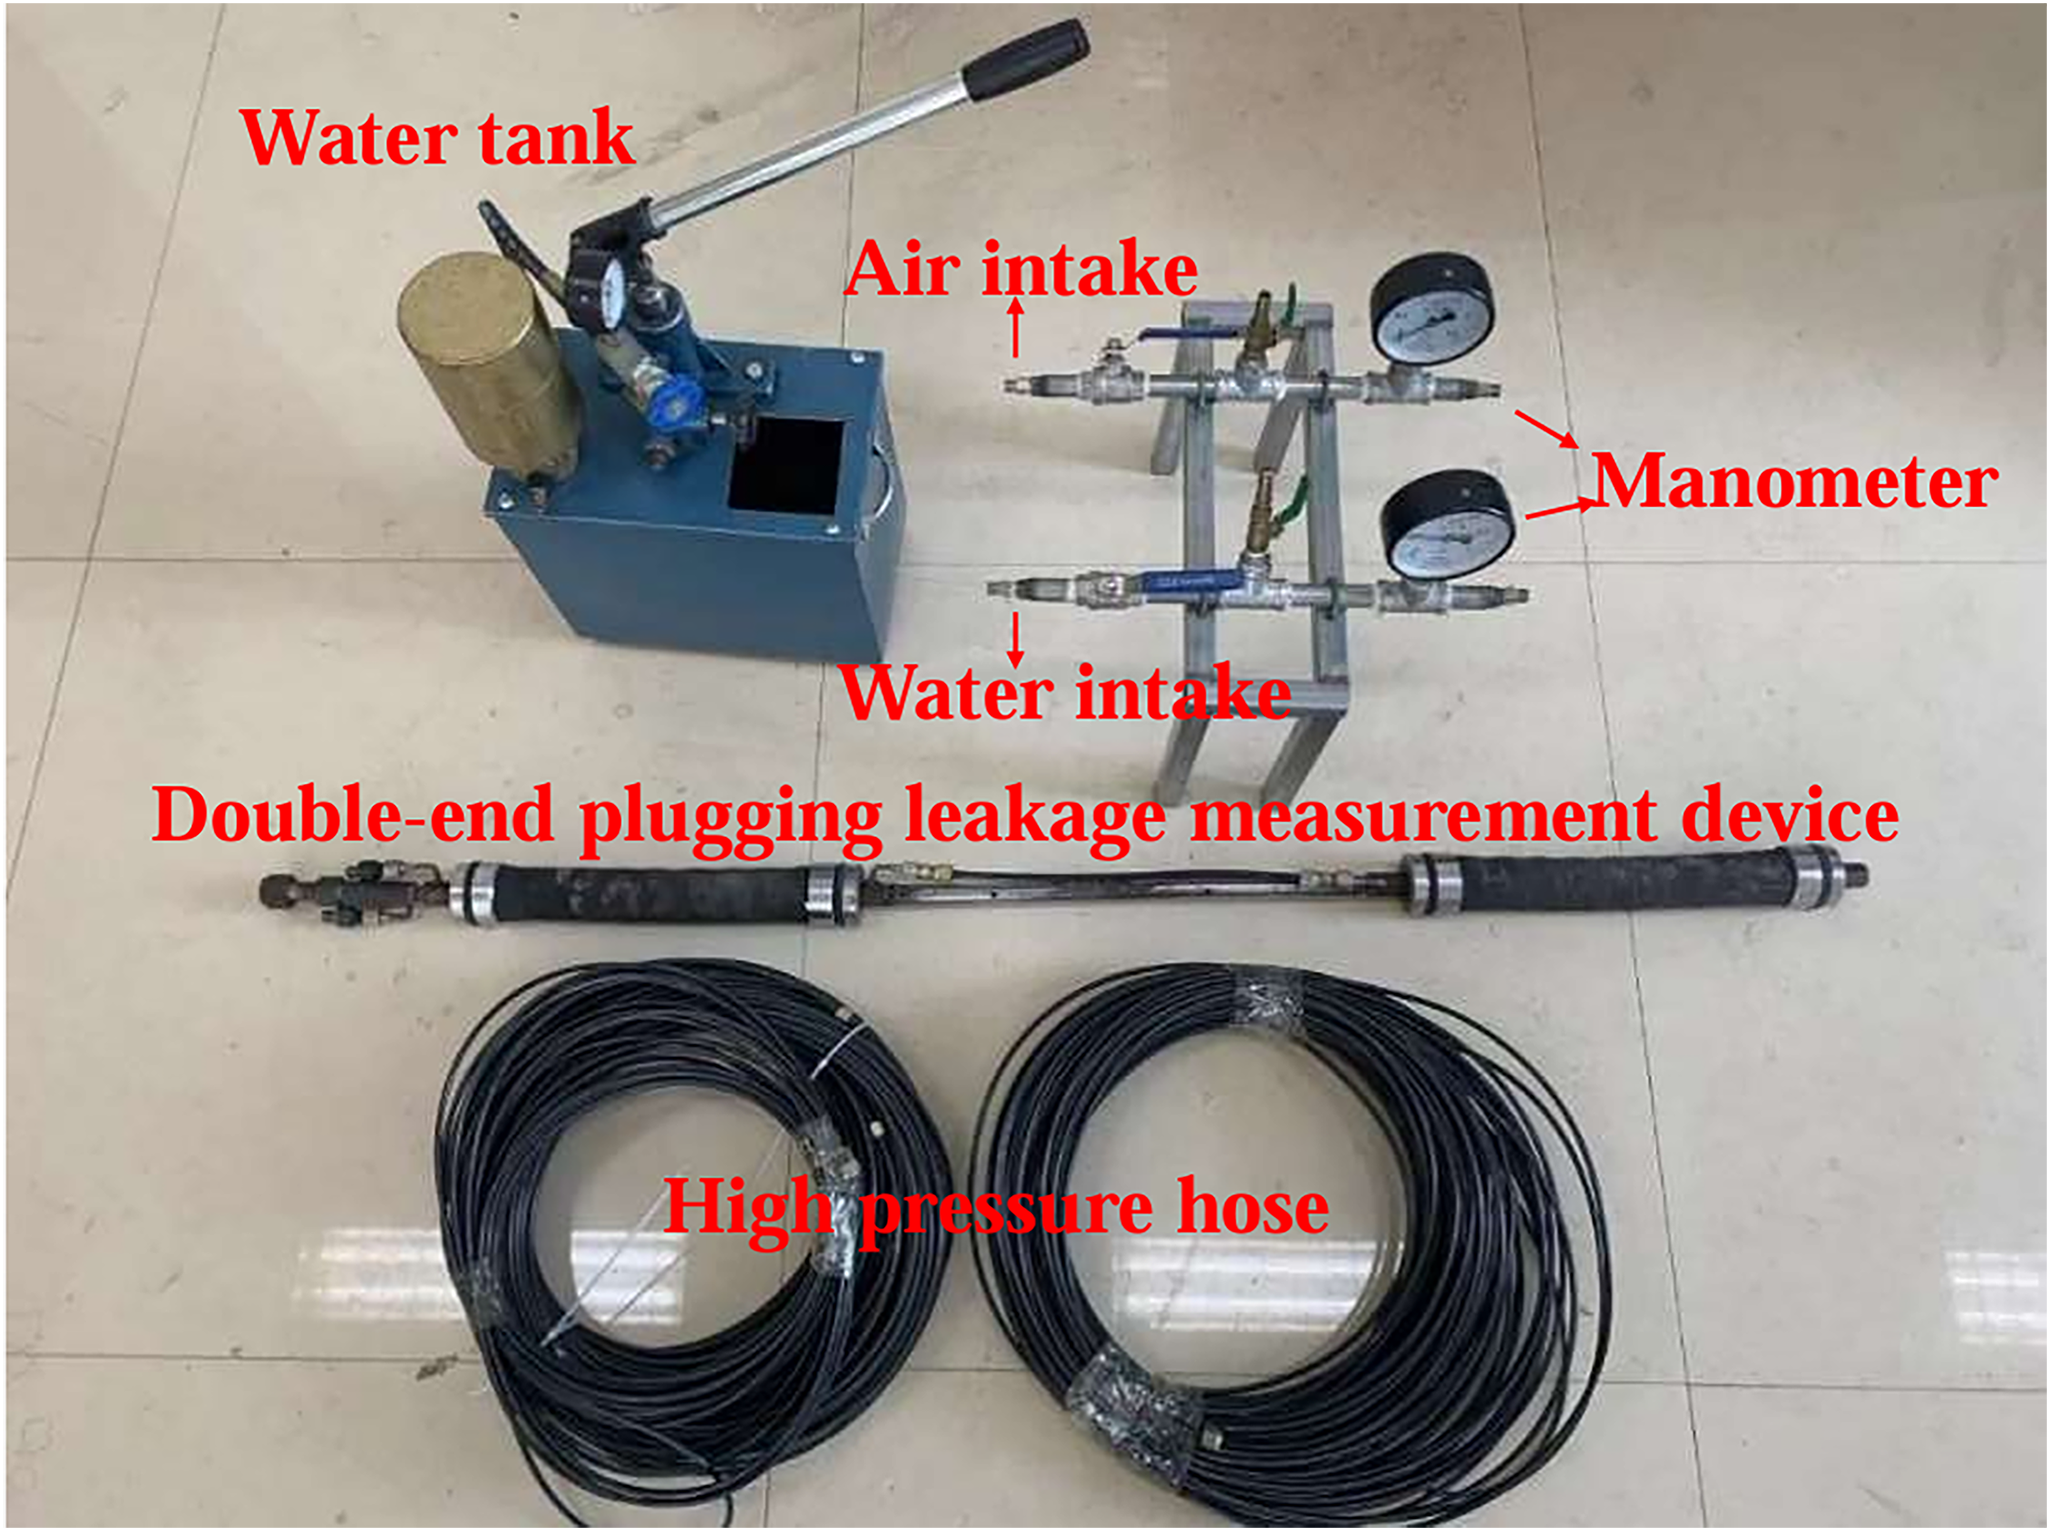
Double-ended sealing system.
In accordance with the above-mentioned plan, the on-site borehole water injection tests commenced on 15 February 2023. The tests began with borehole D1 to obtain background data, followed by the remaining test boreholes in the sequence of J1–J2, and were completed on 18 February 2023.
Borehole television observation
Based on the quantitative detection results of the borehole water injection tests, a waterproof camera probe was inserted into the borehole. Live footage was observed in real time via a monitor to visually inspect fractures in the overlying strata, enabling the determination of the borehole wall lithology, as well as the size and distribution of fractures, karst features, and fractured zones. This process served to validate the findings of the borehole water injection tests. Field observations of the three boreholes were conducted using the GT053 upward-inclined borehole tester (shown in Figure 6), manufactured by Hongxu Technology Co., Ltd. Video recordings were obtained, reviewed repeatedly to identify key observations, and critical results were extracted, which further validated the findings of the borehole water injection tests.
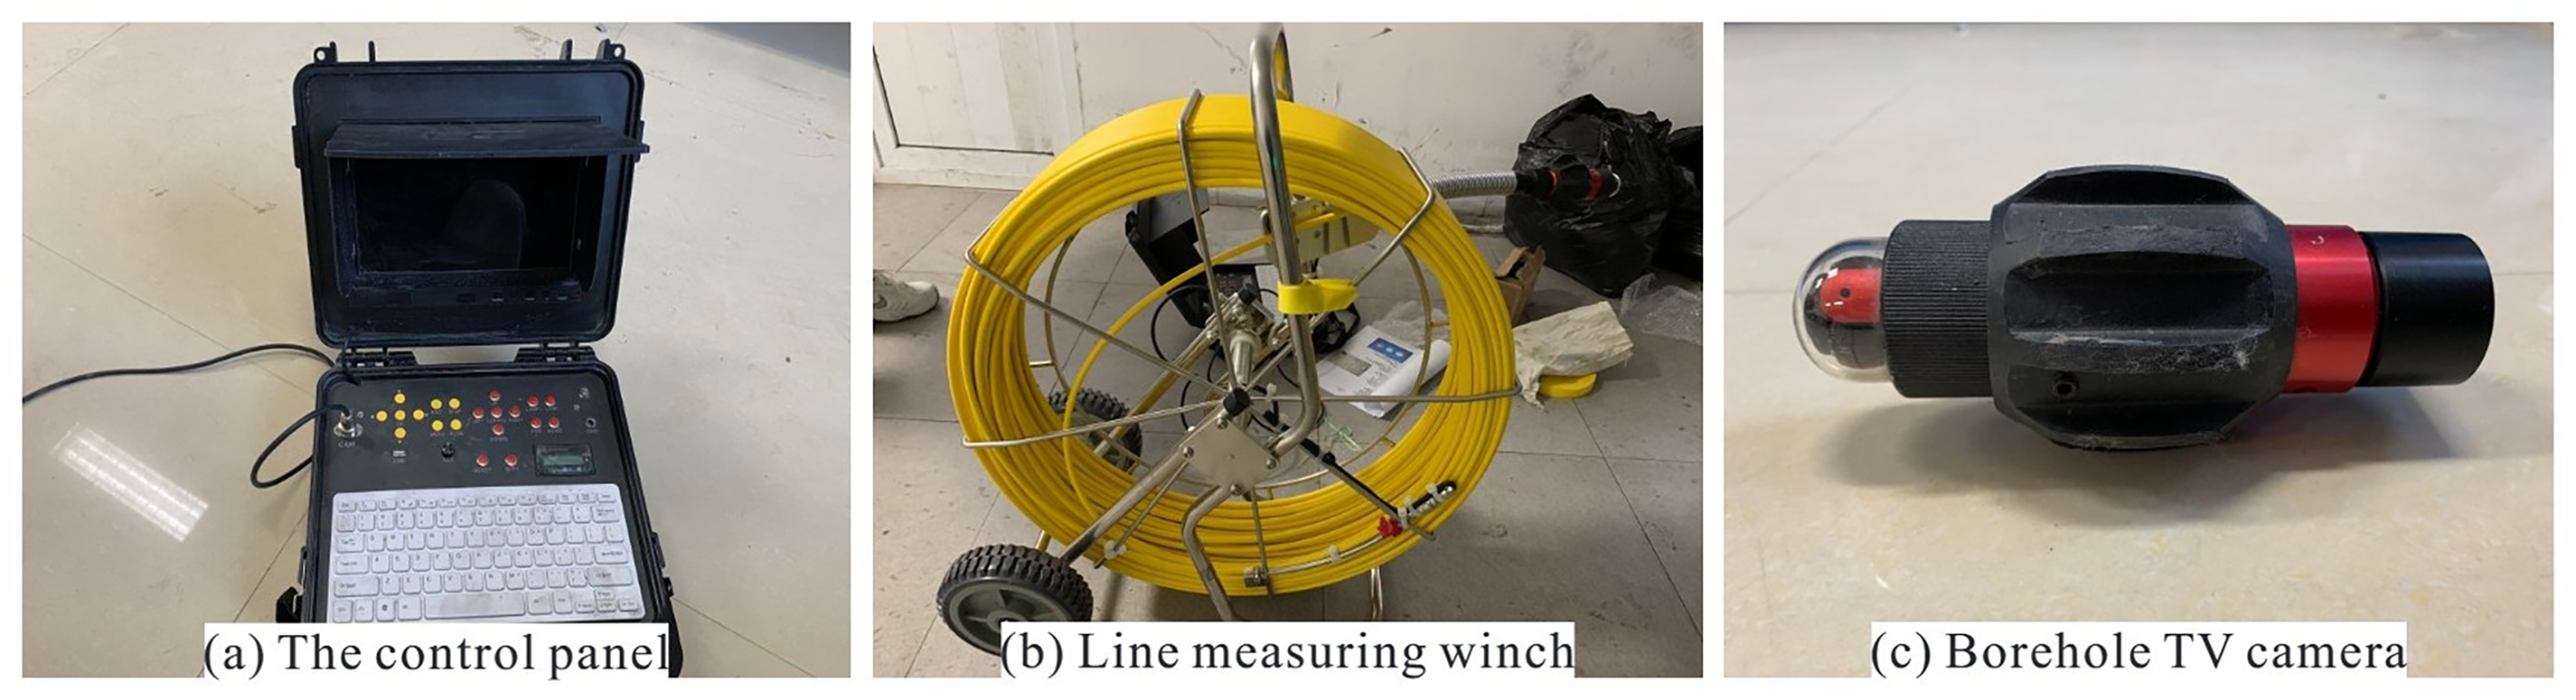
The GT053 upward-inclined borehole testing instrument.
Theoretical analysis
The analysis of the combined and mechanical structural properties of overlying strata is as an indispensable prerequisite for researching coal mining under water bodies. Based on the lithology and mechanical properties of the immediate roof and main roof (also known as basic roof) of the coal seam, the overlying strata can be classified from bottom to top into four types: (1) Hard–Hard; (2) Hard–Soft; (3) Soft–Hard; (4) Soft–Soft. Mining practice shows that the Hard–Hard structure has the highest WCFZ development, the Soft–Soft structure the lowest, and the Soft–Hard structure's height exceeds that of the Hard–Soft structure (Zhu and Teng, 2012). To quantitatively characterize the constraining effect of overlying strata's mechanical properties on the development of WCFZ, this study draws on geologically representative borehole columnar data from the mining area and integrates basic parameters obtained from laboratory mechanical strength tests of typical rock strata. Within the rock column height range where WCFZ potentially develops (with a value of 150 m adopted in this study), the following formula is used to calculate the weighted average uniaxial compressive strength of the overlying strata, thus providing quantitative support for the subsequent analysis of WCFZ development patterns.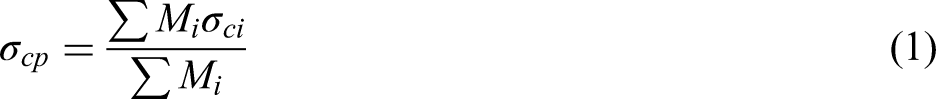
where σcp is the weighted average uniaxial compressive strength of rock column section (MPa); ∑Mi is the normal thickness of i layer (m); σci is the uniaxial compressive strength of i layer (MPa).
Within the empirical formulas for WCFZ height calculation designated in the Regulations for Mining Under Three Conditions, (2) and (3) apply to medium-hard overlying strata, and (4) and (5) apply to hard overlying strata (State Administration of Work Safety et al., 2017).


where Hli is the height of WCFZ (m); M is the mining height (m); ∑M is the thickness of the mined coal seam (m).
Numerical simulation
Among numerical simulation software commonly used in mining, UDEC and FLAC3D each have distinct features, with notable differences in their core algorithms and applicable scenarios. UDEC is makes use of the Discrete Element Method. By defining the constitutive relations of block contacts, it can accurately capture discontinuous deformations—such as the initiation, propagation, and coalescence of overlying strata fractures after coal seam mining—giving it a significant edge in simulating the failure and evolution of heterogeneous, multifractured rock masses. While both software use command streams for operation, rely on finite difference numerical solutions, and support secondary development via the built-in FISH language, FLAC3D is grounded in the continuous medium assumption. It works better for simulating the overall stress and macrodeformation of rock masses but is less capable of depicting discontinuous behaviors like fracture development. For this reason, UDEC stands out in geotechnical, mining, and geological engineering—particularly in research on rock mass fracture mechanisms.
Model establishment and scheme design
In light of the geological conditions of the working face 15101 and the upper No. 9 coal seam in Huayang Coal Mine, this study uses UDEC software to simulate the mining process. Modeling parameters are determined based on the strata characteristics exposed by the HY2 borehole near the working face. The model dimensions are designed as: 400m × 200 m, following the natural vertical distribution of rock strata, with a total of 18 rock strata. Among them, the No. 9 and No. 15 coal seams are the study horizons, with an interlayer spacing of 30.9 m and thicknesses of 1.74 m and 2.78 m, respectively. Rock strata joints are arranged in a staggered overlapping pattern, with a block aspect ratio (length: width) of 1:2. Due to the lower joint development density in key strata, the size of their joint blocks is scaled up to 1.5 times that of ordinary horizons to match field actual joint characteristics. Boundary conditions are set as follows: the upper boundary is a free boundary; the side boundaries restrict X-axis displacement; the bottom boundary is fully fixed. The model is loaded with a self-weight stress field to achieve initial stress equilibrium, with initial displacements (X- and Y-axes) set to 0. Rock mass failure is governed by the Mohr–Coulomb criterion, and the Coulomb slip model applies to contact surfaces. To eliminate boundary effects, 100 m protective coal pillars are arranged on both sides of the mined coal seam. The UDEC numerical simulation model is shown in Figure 7.
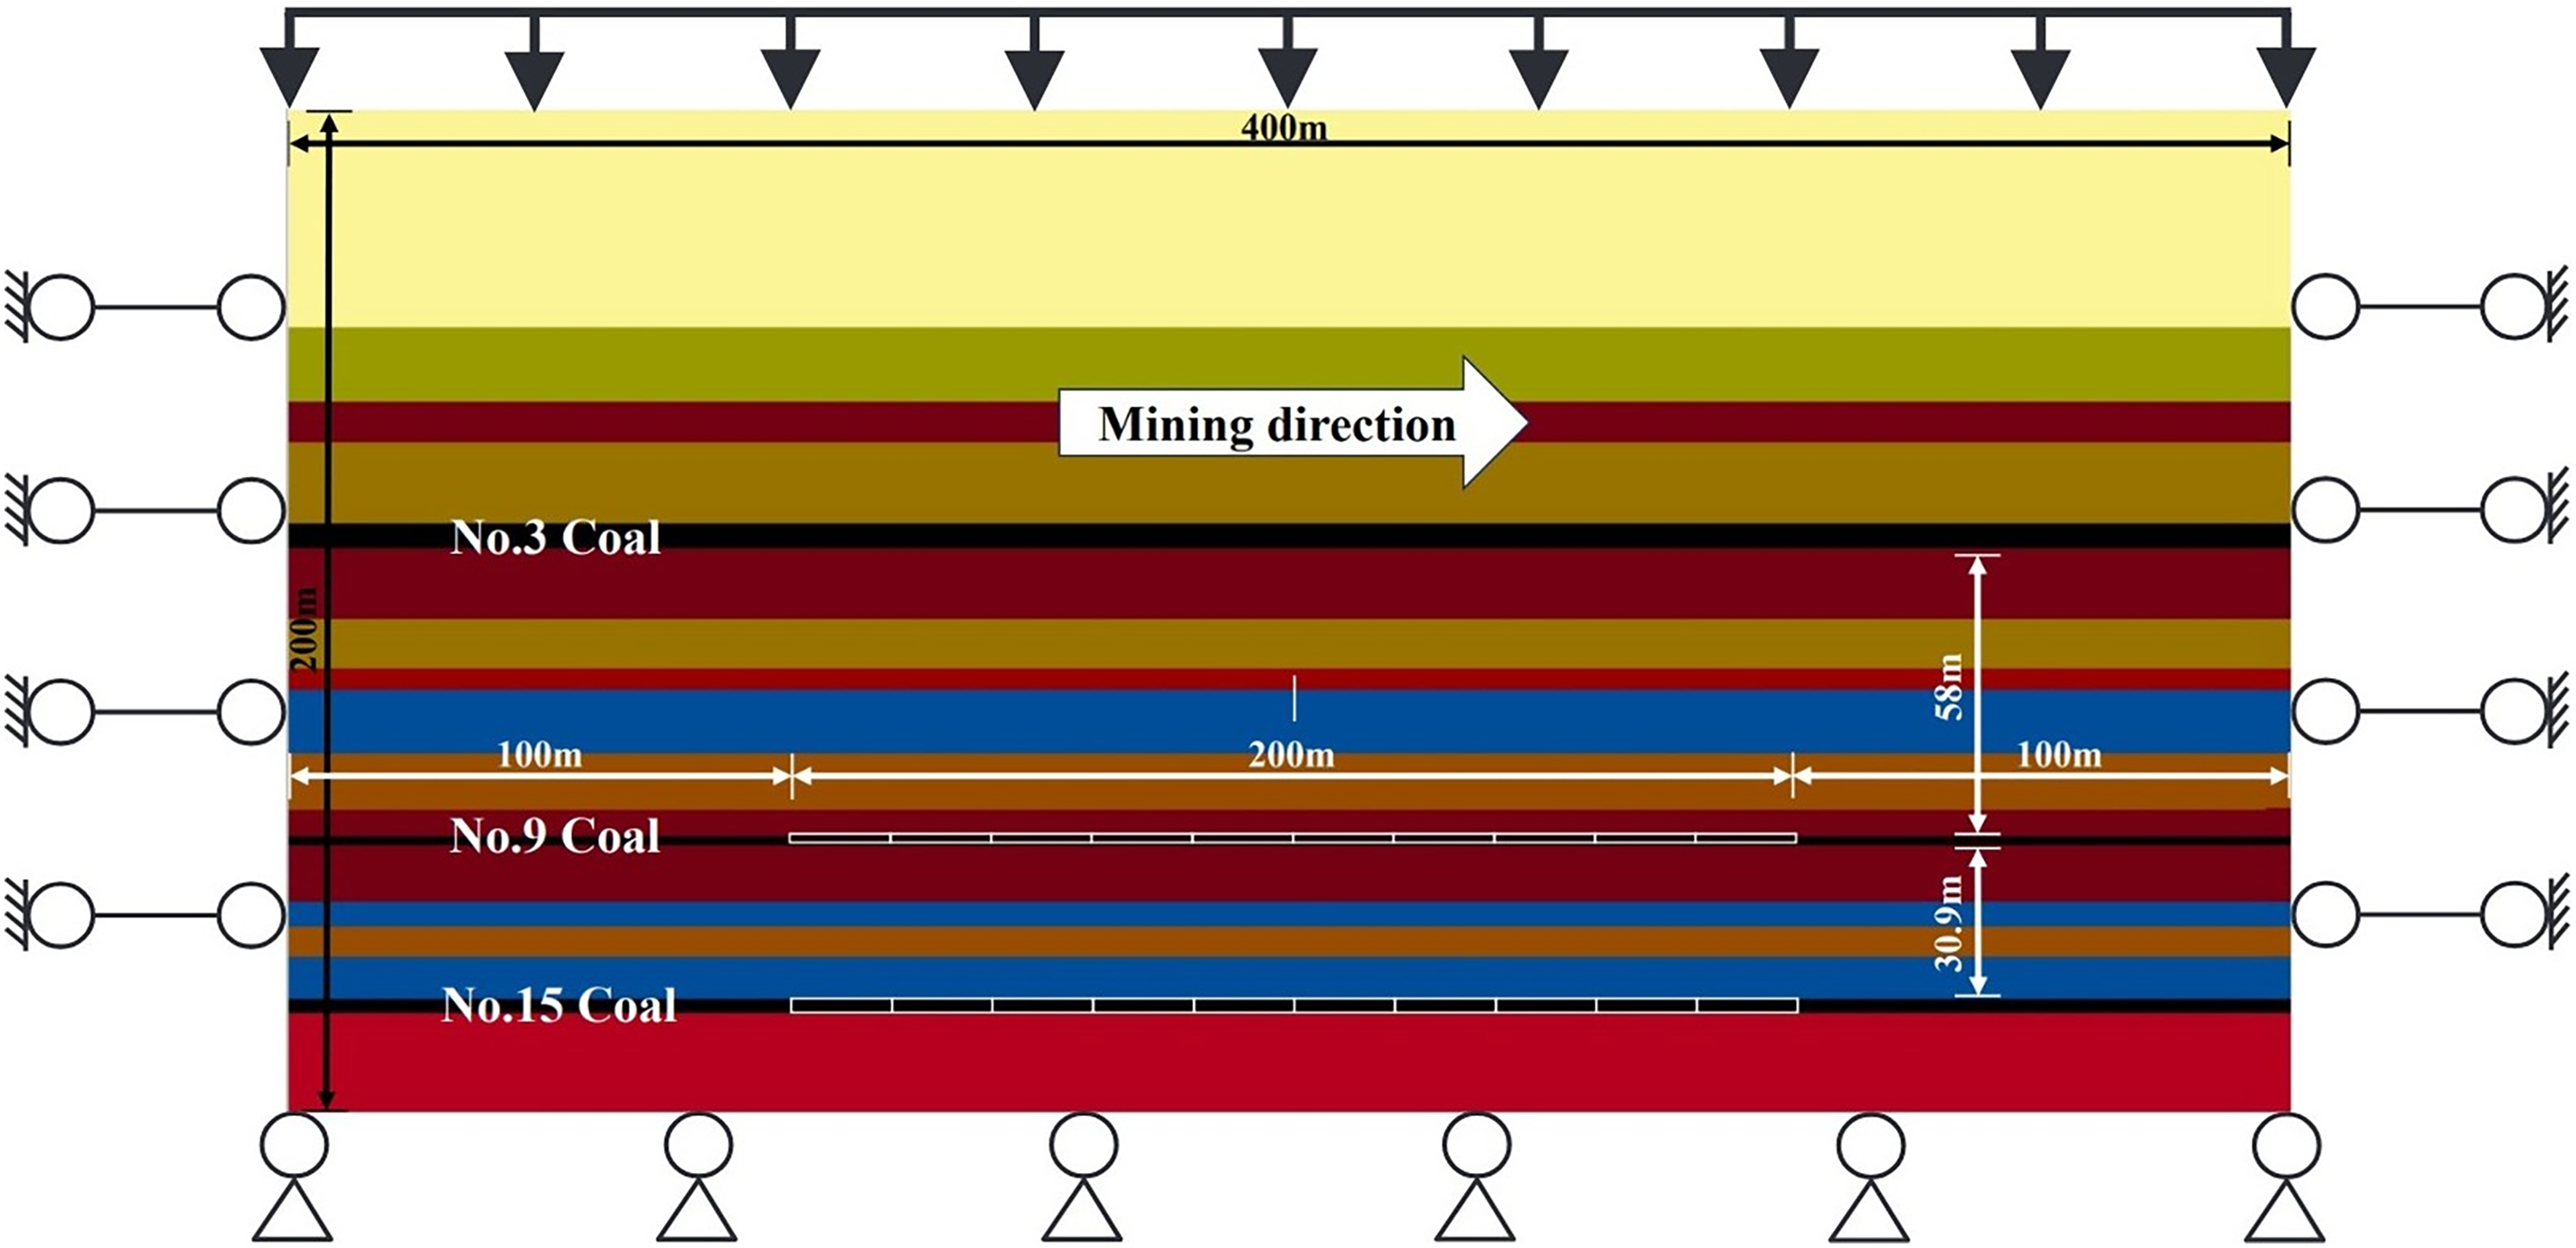
UDEC numerical simulation model.
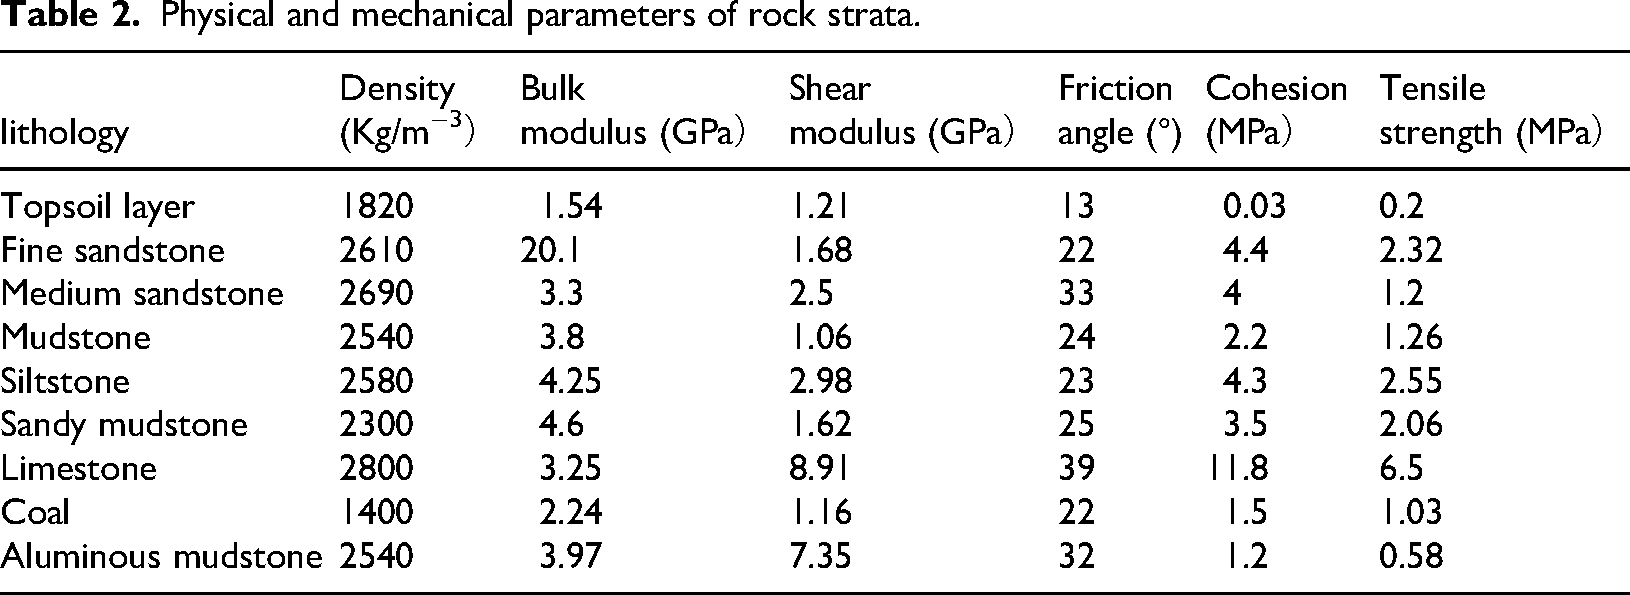
In compliance with relevant rock mechanics experimental standards, physicomechanical tests were performed on overlying rock samples in the laboratory. Combined with the parameter requirements of the Mohr–Coulomb criterion. These tests enabled the determination of physicomechanical parameters for each overlying stratum, with details provided in Table 2. To examine the impact of No. 15 coal seam mining on the failure degree of overlying strata, three schemes were designed: Scheme 1 involved mining only the No. 9 coal seam; Scheme 2 focused on mining solely the No. 15 coal seam; Scheme 3 entailed mining the No. 9 coal seam first and then the No. 15 coal seam, to simulate the fracture patterns of overlying strata under repeated mining conditions. During on-site mining of the working face 15101, when full strike mining is achieved, the overlying strata subsidence reaches its theoretical maximum. At this stage, the overlying strata experiences the most severe failure, and WCFZ develops to its maximum height. Under such conditions, this study temporarily excludes the influence of the working face dip direction. The total mining length of the coal seam is 200 m, with a mining step length of 20 m; each seam is mined in 10 steps.
Physical and mechanical parameters of rock strata.
Results and discussion
Results and analysis of borehole water injection test
Using the obtained observation data obtained, quantitative and qualitative analyses were conducted on the water injection volumes of one original rock comparison borehole and two postmining observation boreholes, with reference to the distribution of the coal seam's roof and floor strata. Initially, a water injection test was performed in borehole D1 to obtain background data, followed by tests on the other test boreholes. The permeability coefficient of the original rock strata was calculated from borehole the segmented water injection volumes of borehole D1. This value was then compared with the permeability coefficients of the corresponding postmining rock strata, calculated from the segmented water injection volumes of boreholes J1 and J2. Through this comparison, the height of the WCFZ was determined. The segmented water injection volumes of the boreholes and the back-calculated permeability coefficients are shown in Figures 8–10.
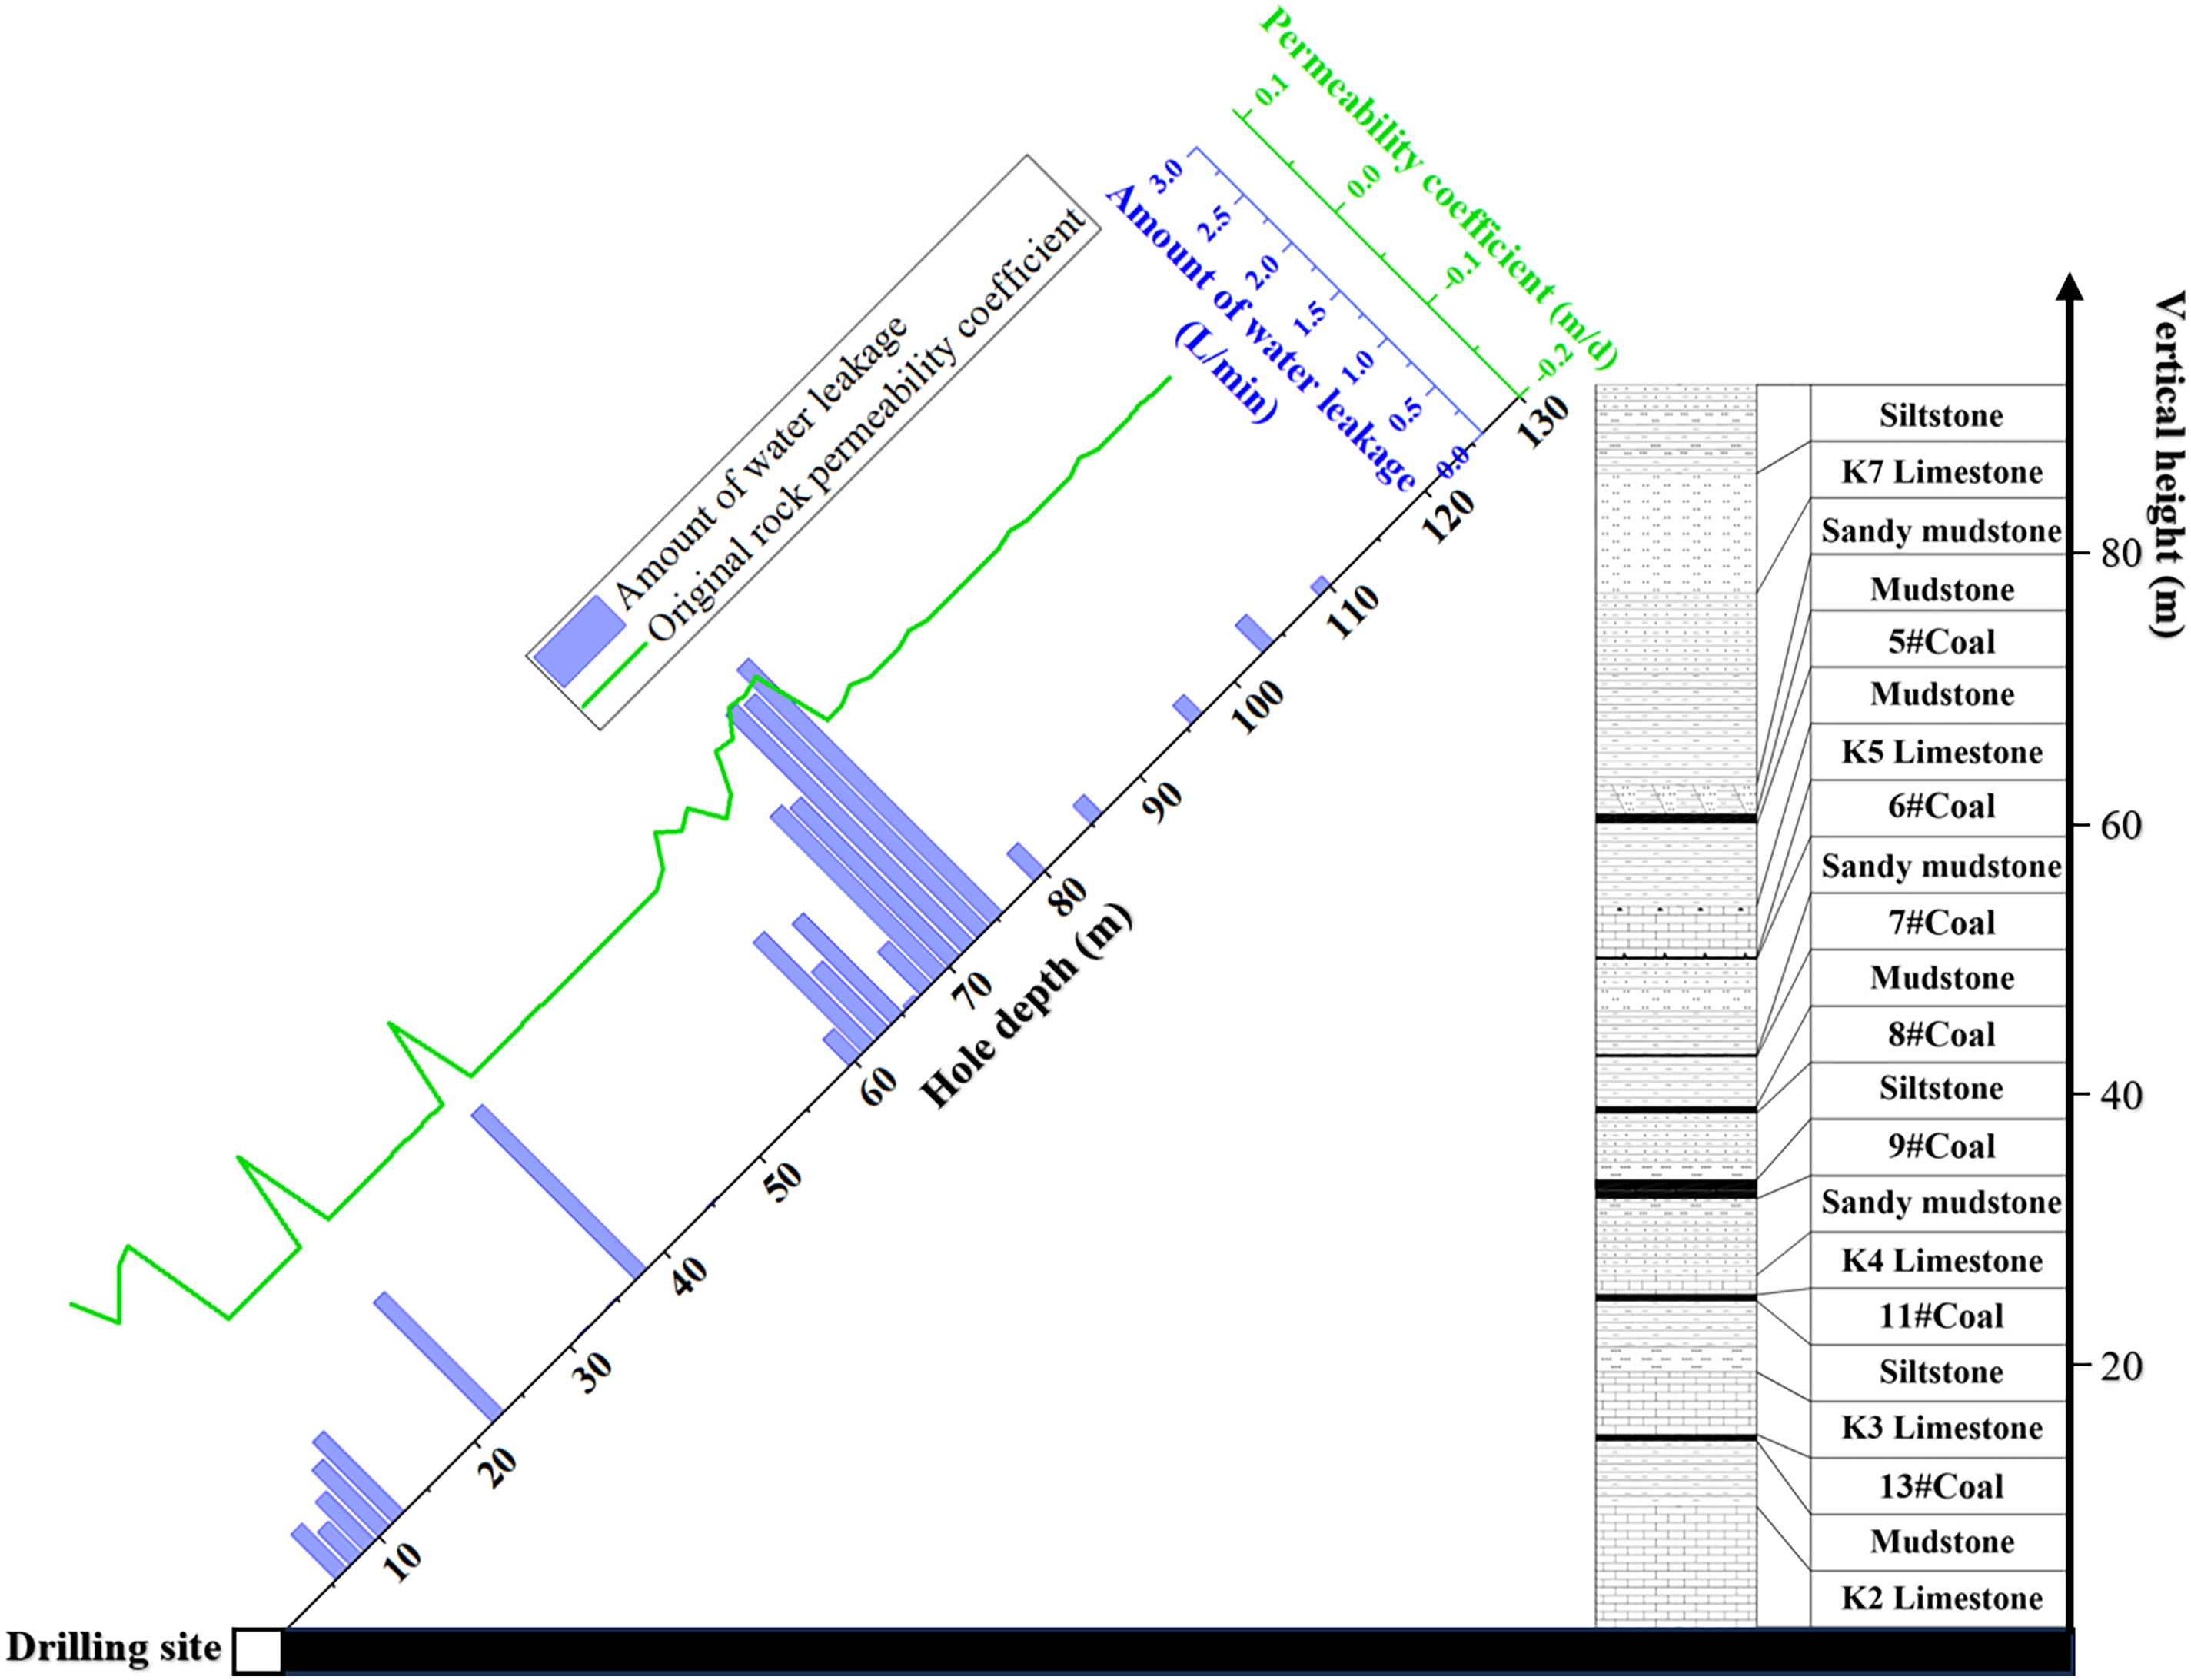
D1 borehole water injection and permeability coefficient diagram.
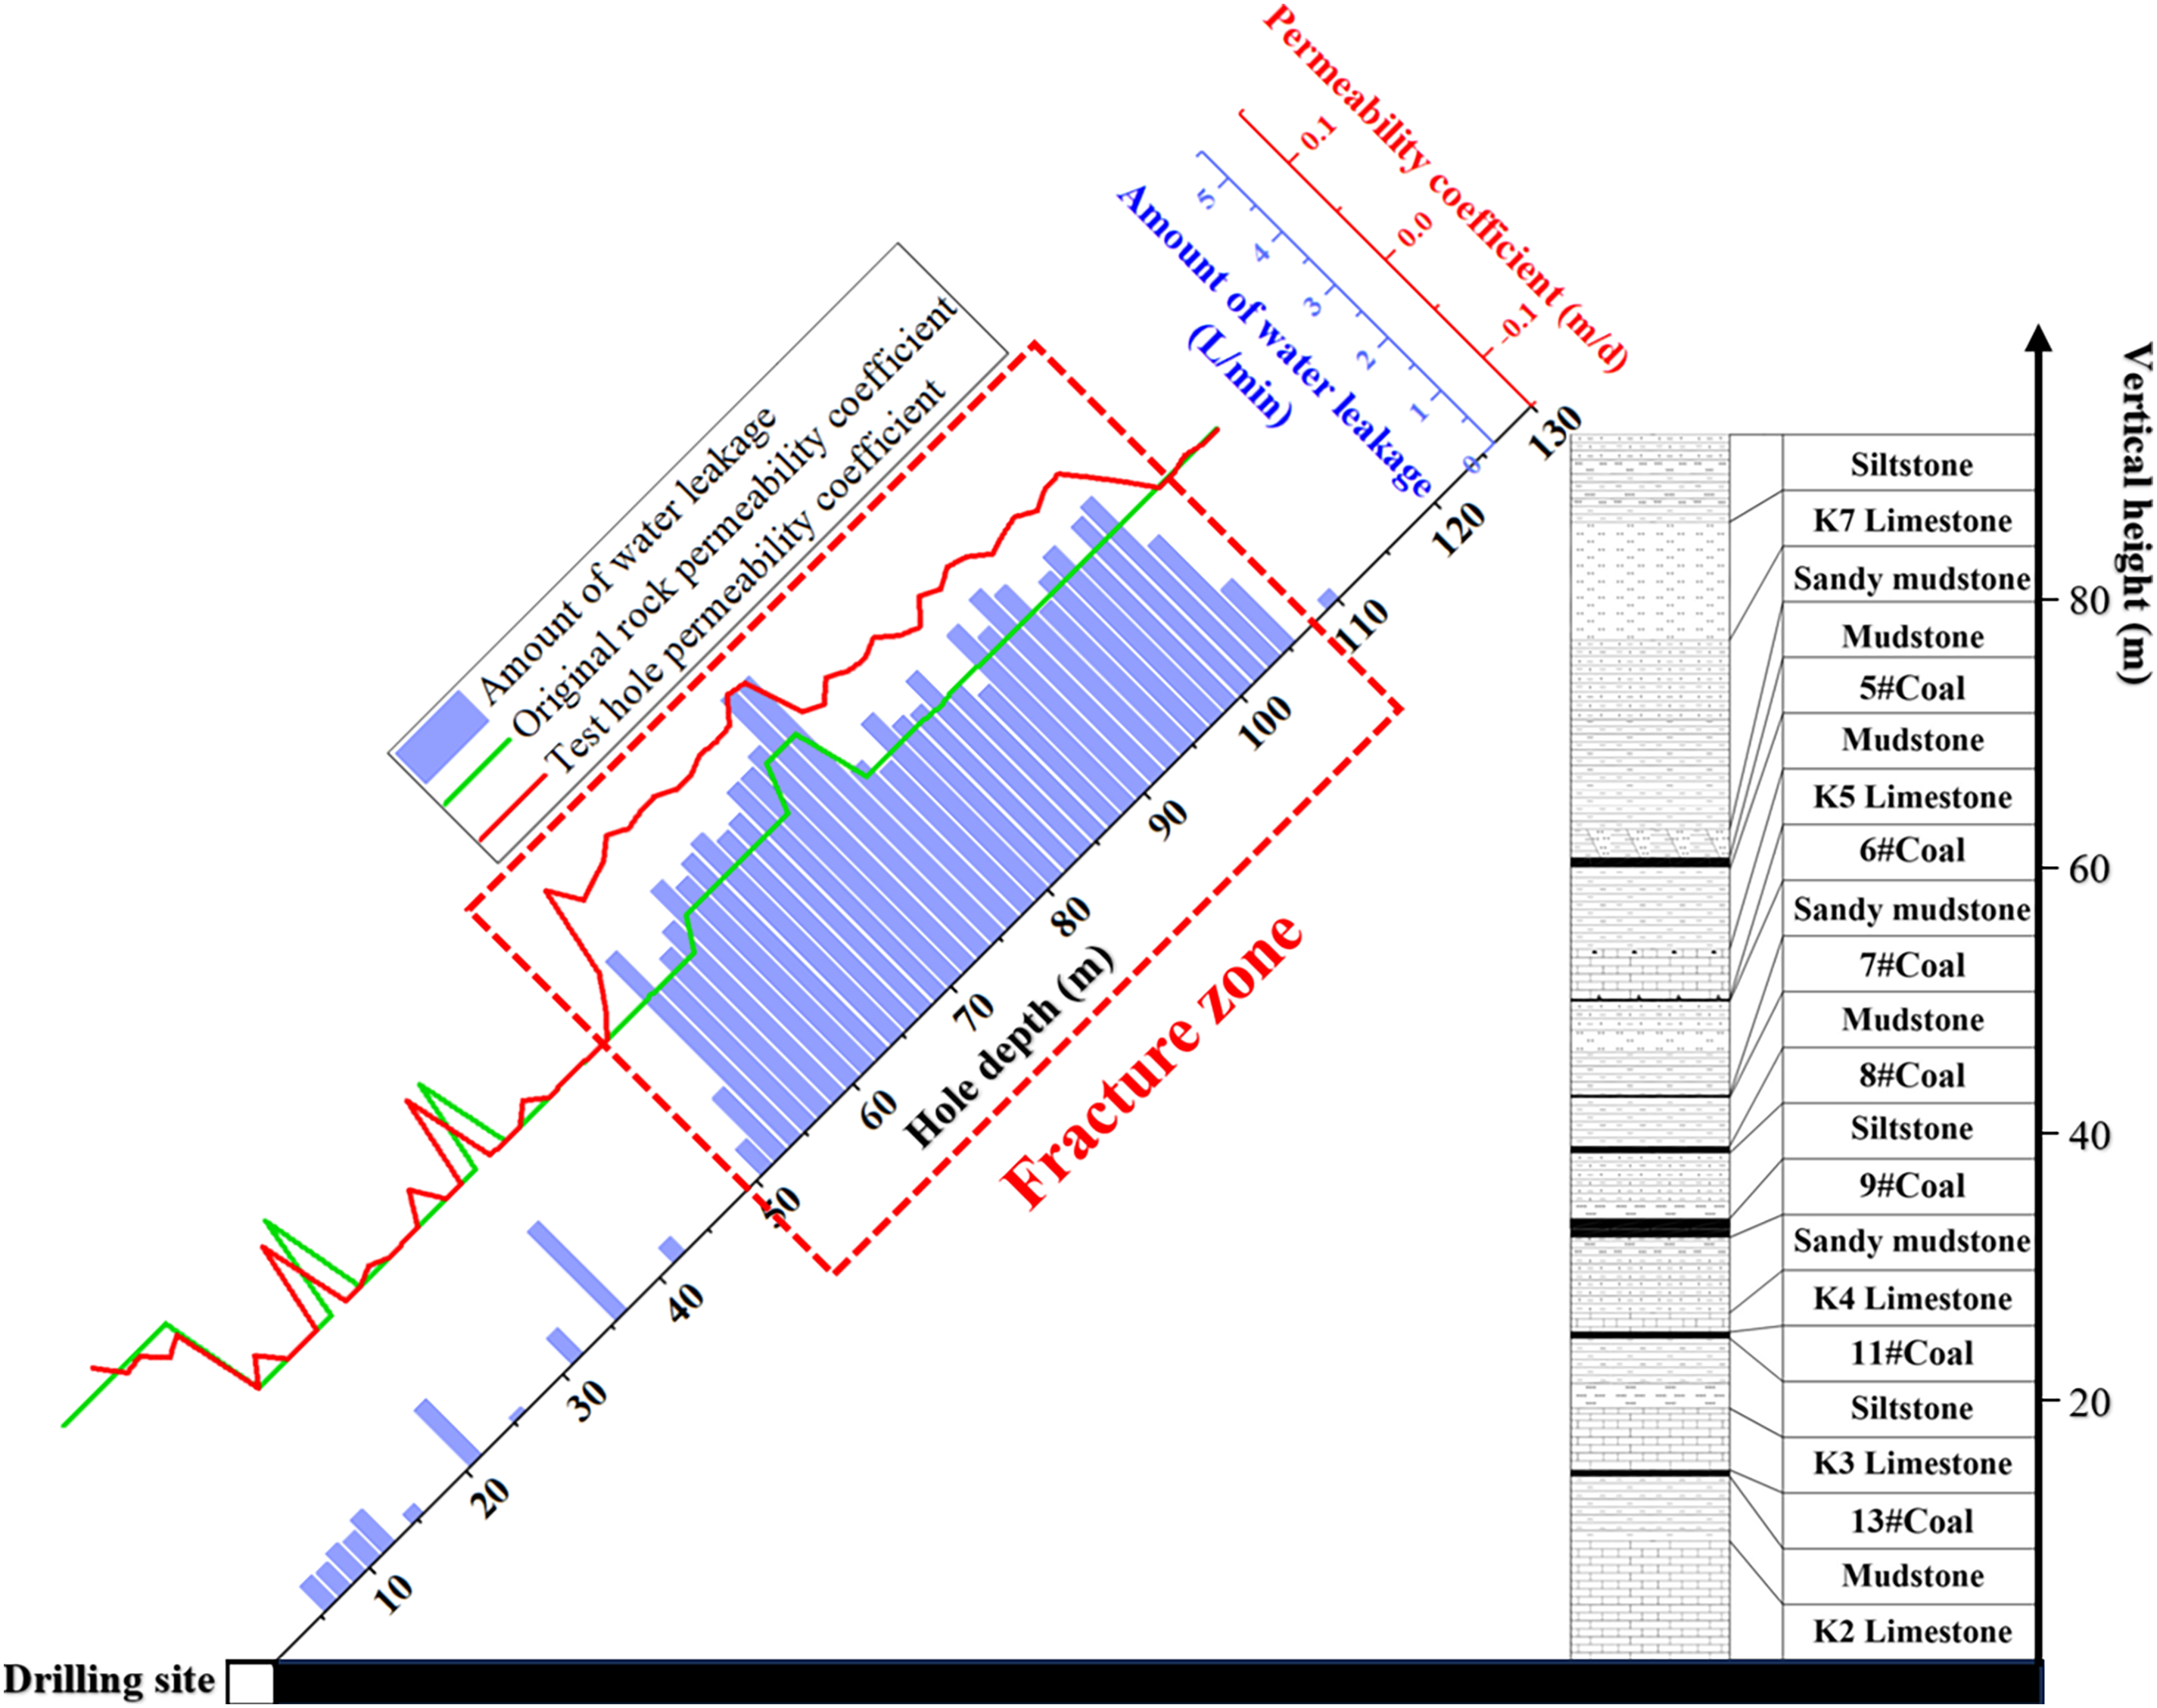
J1 borehole water injection and permeability coefficient diagram.
J2 borehole water injection and permeability coefficient diagram.
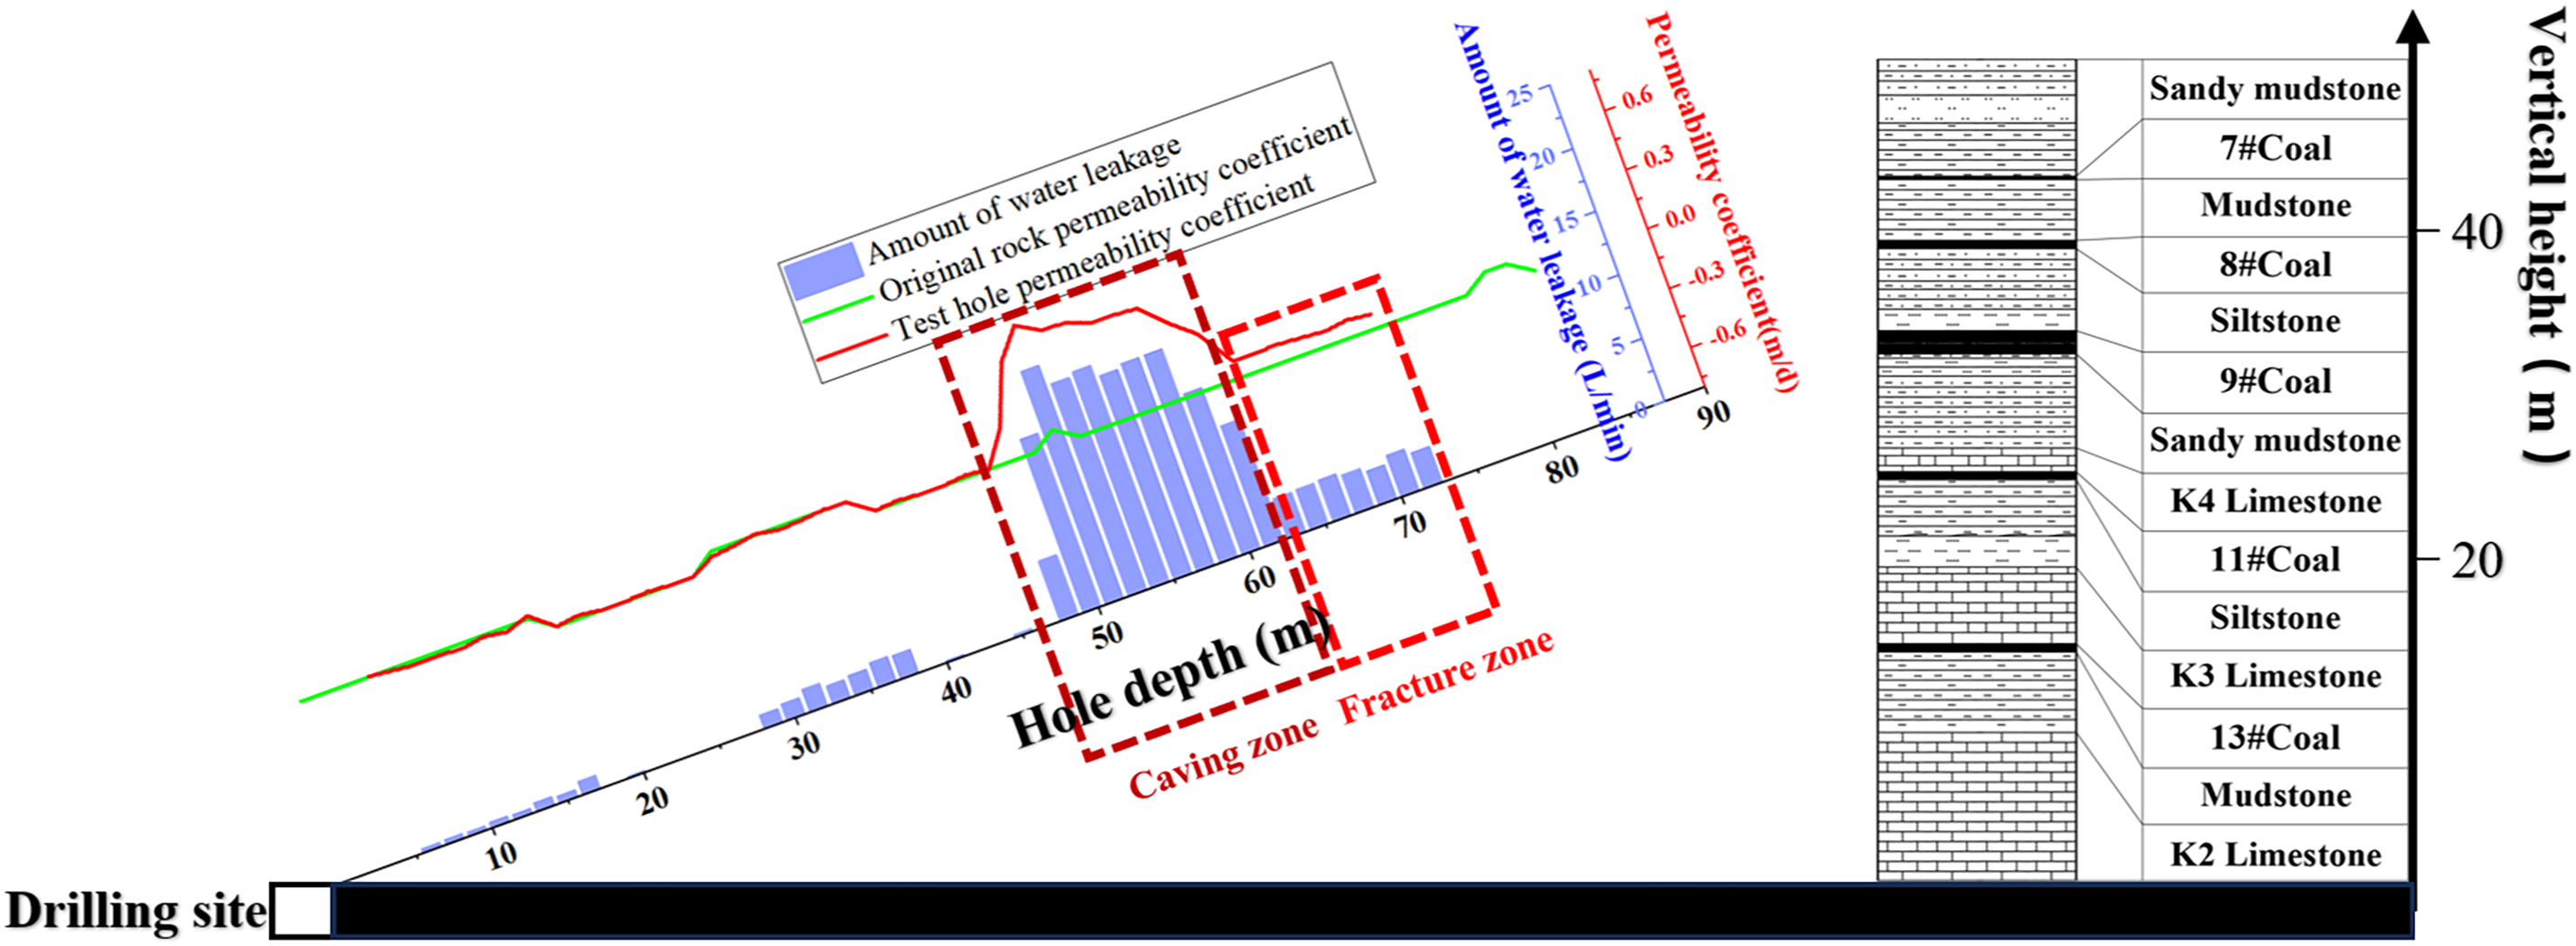
The observation results of borehole D1 are shown in Figure 8. Water injection volume increased significantly at the 6–12 m depth section, and at 22.5 m, 37.5 m, 60–67.5 m, and 69–75 m depth. Analysis combined with the mine's comprehensive hydrogeological column map shows these sections correspond respectively to the K2, K3, K4 limestone aquifers, interbedded mudstone and medium-grained sandstone, and the K5 limestone aquifer. Water injection volume ranged from 0.29 to 2.67 L/min, with permeability coefficients between 0.008 and 0.094 m/d. In contrast, water injection volume in rock strata such as mudstone and siltstone was basically 0 L/min, indicating extremely low permeability. Comparing the calculated permeability coefficients with the mine's hydrogeological data revealed good consistency, showing that the rock strata in borehole D1 were not affected by mining disturbance and could well reflect the permeability characteristics of the original rock strata.
The observation results of borehole J1 are shown in Figure 9. Water injection leakage points were found at the 6–12 m depth section, and at 21 m, and 36 m depth. The water injection volumes and back-calculated permeability coefficients were consistent with those in borehole D1 at corresponding positions, indicating that the rock strata in this section were not disturbed by mining and lay outside the development range of WCFZ. In the depth section 51–106.5 m, water injection volume increased significantly, with permeability coefficients notably higher than those in borehole D1 at corresponding positions and reaching 1.6–4.6 times that of D1. This suggests the rock strata here lie within the “saddle-shaped” area of the fracture zone. No water injection leakage occurred from 106.5 m depth to the borehole bottom, meaning the borehole has extended beyond WCFZ, with a corresponding vertical height of 75.31 m above the coal seam roof. Thus, the height of the WCFZ for borehole J1 is determined as 75.31 m.
The observation results of borehole J2 are shown in Figure 10. In the 6–46.5 m depth section, water injection volumes and permeability coefficients were largely consistent with those in borehole D1 at corresponding positions, indicating that the rock strata here were not affected by mining disturbance. However, in the 48–61.5 m depth section, water injection leakage and permeability coefficients increased sharply and stabilized, reaching 4.9–8.2 times those of borehole D1. This suggests that the rock strata in this section lie within the caving zone, with a vertical height of 21.03 m above the coal seam roof. From 63 m depth to the final hole, water injection leakage remained stable, with water injection volumes and permeability coefficients largely consistent with those in borehole J1 at corresponding positions, indicating that this section has entered the fracture zone. Therefore, the height of the caving zone for borehole J2 is determined as 21.03 m.
Results and analysis of borehole television observation
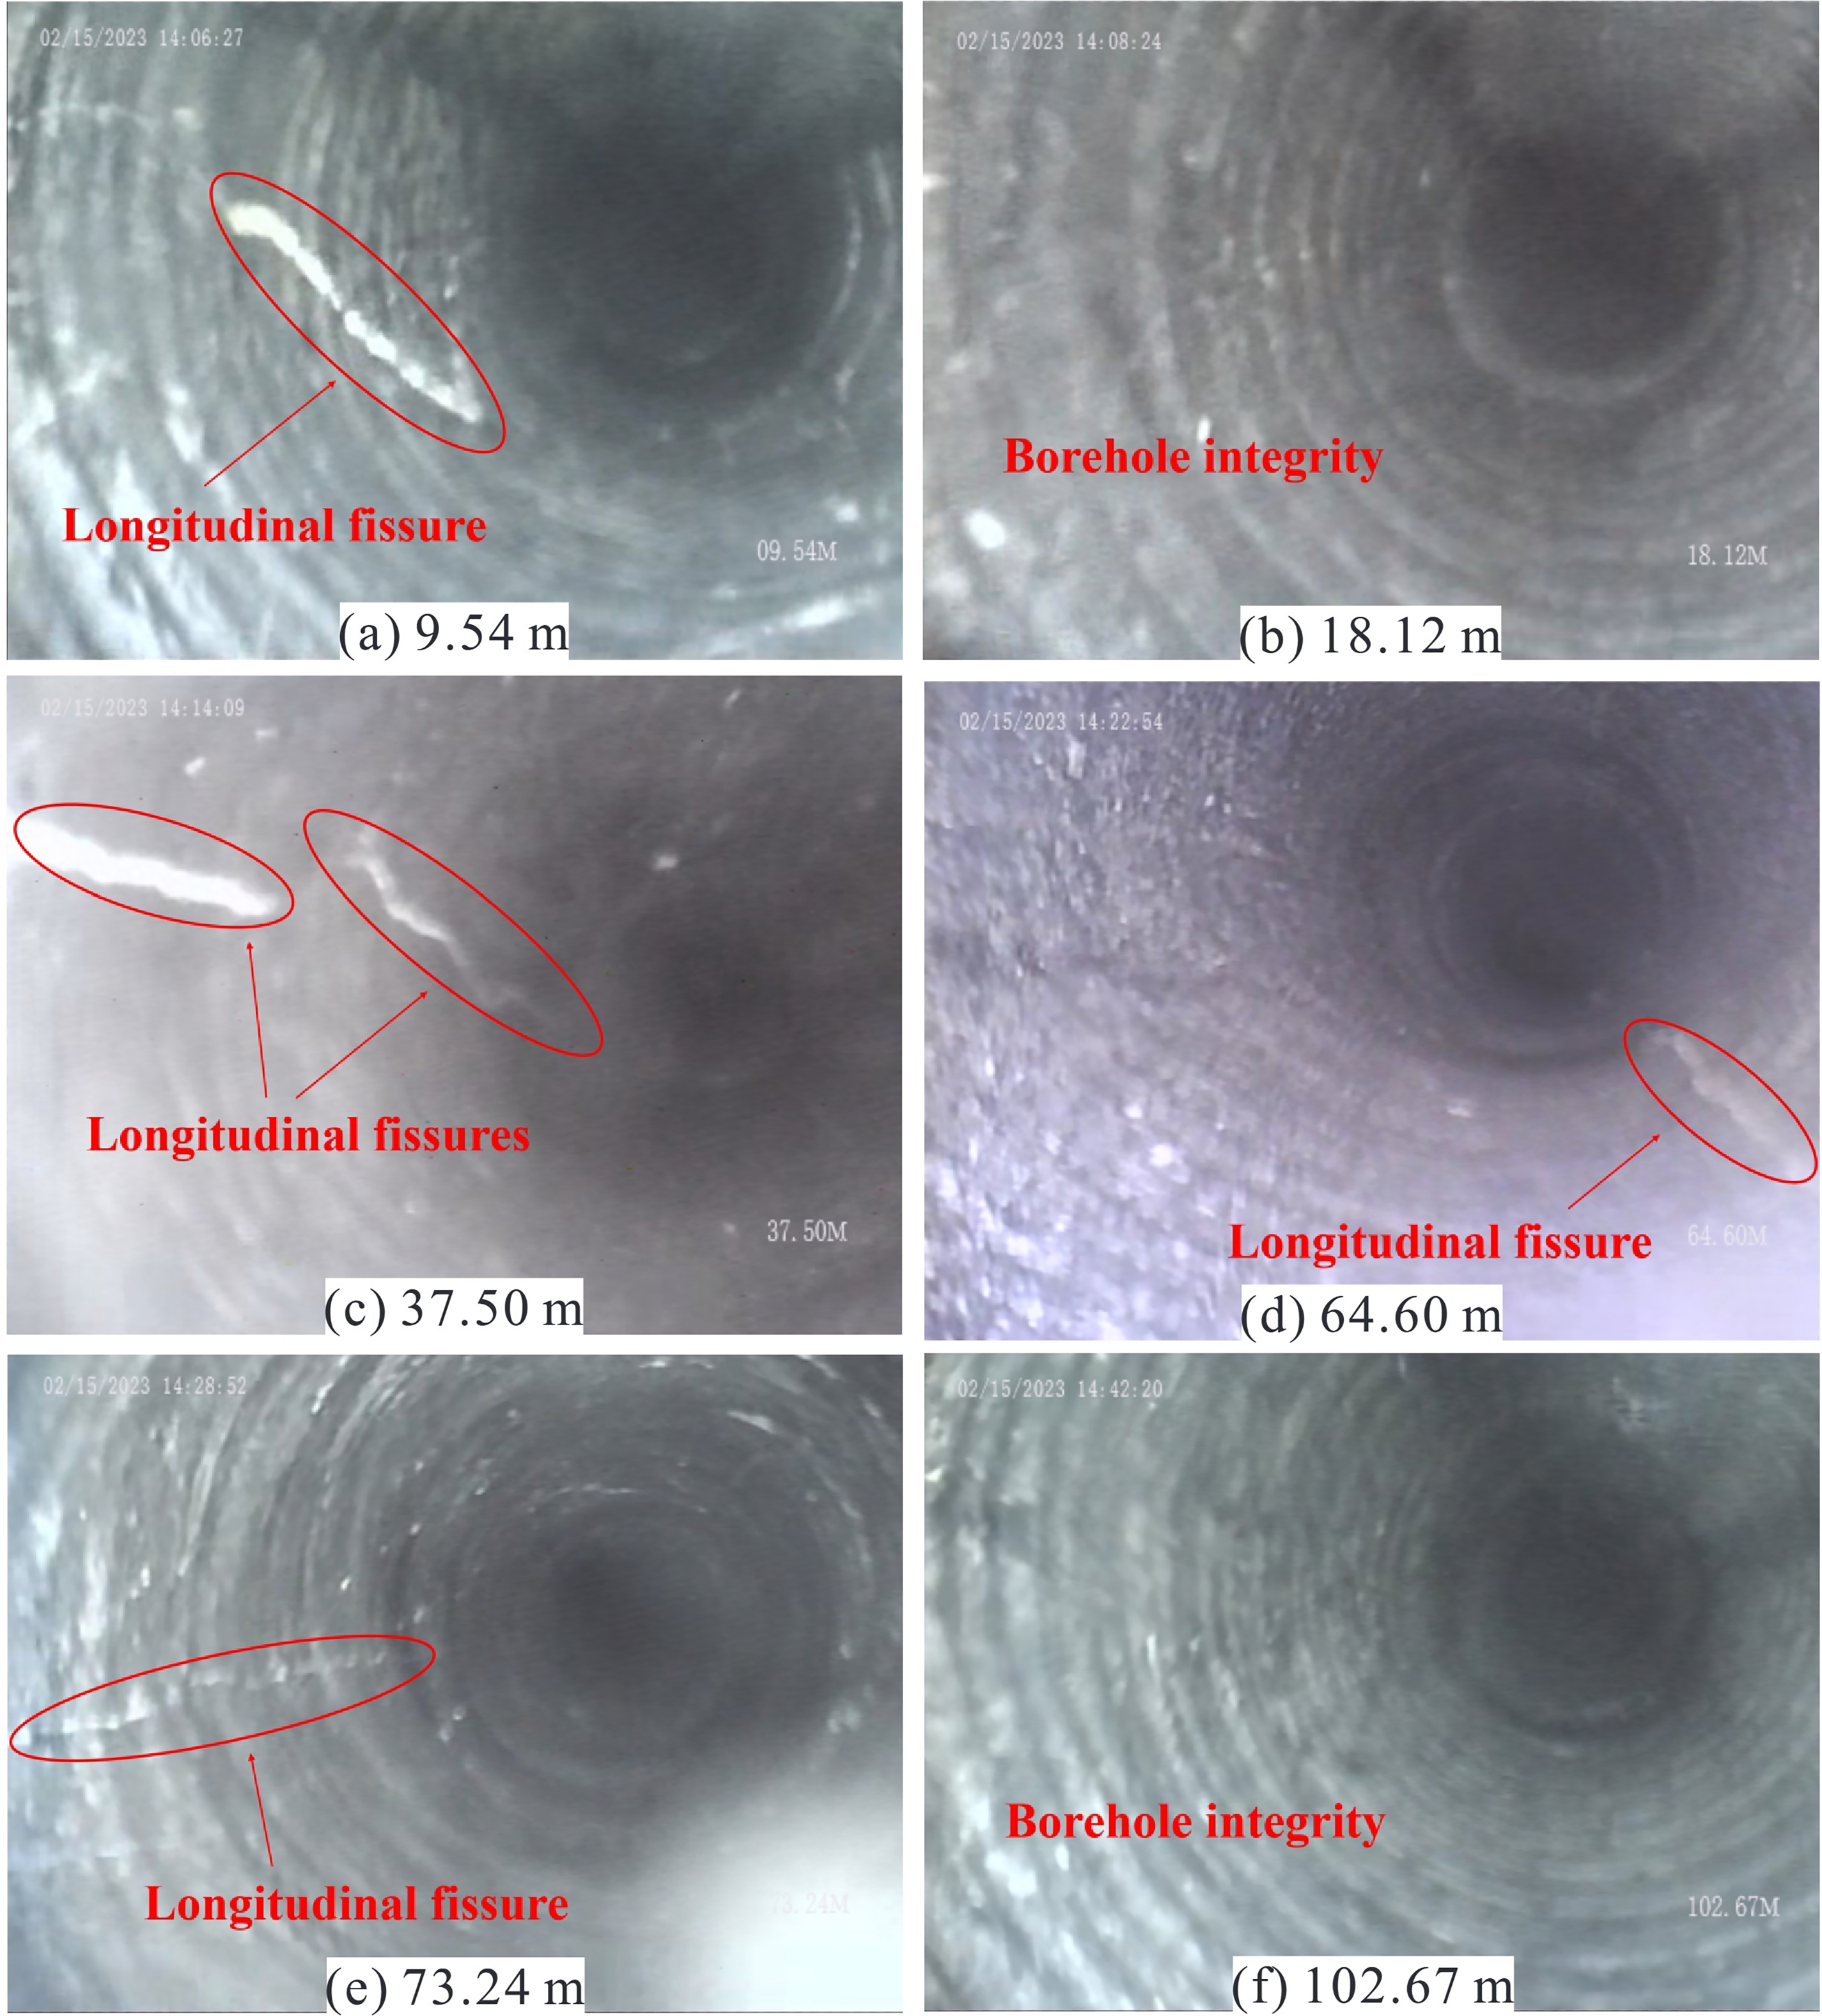
Borehole D1: Small fissures appear on the borehole wall at the 7.5–12 m depth section (Figure 11(a)), 37.5 m depth (Figure 11(c)), 60–70.5 m depth section (Figure 11(d)), and 72–75 m depth section (Figure 11(e)), corresponding to the K2 limestone aquifer, K4 limestone aquifer, interbedded mudstone and medium-grained sandstone, and K5 limestone aquifer, respectively. The borehole walls are intact at other positions, as shown in Figure 11(b) and (f). Small primary fissures can only be observed in rock segments with significant changes in lithology. The results of the borehole television observation for D1 are largely consistent with those of the water injection test.
Borehole D1 measurement image.
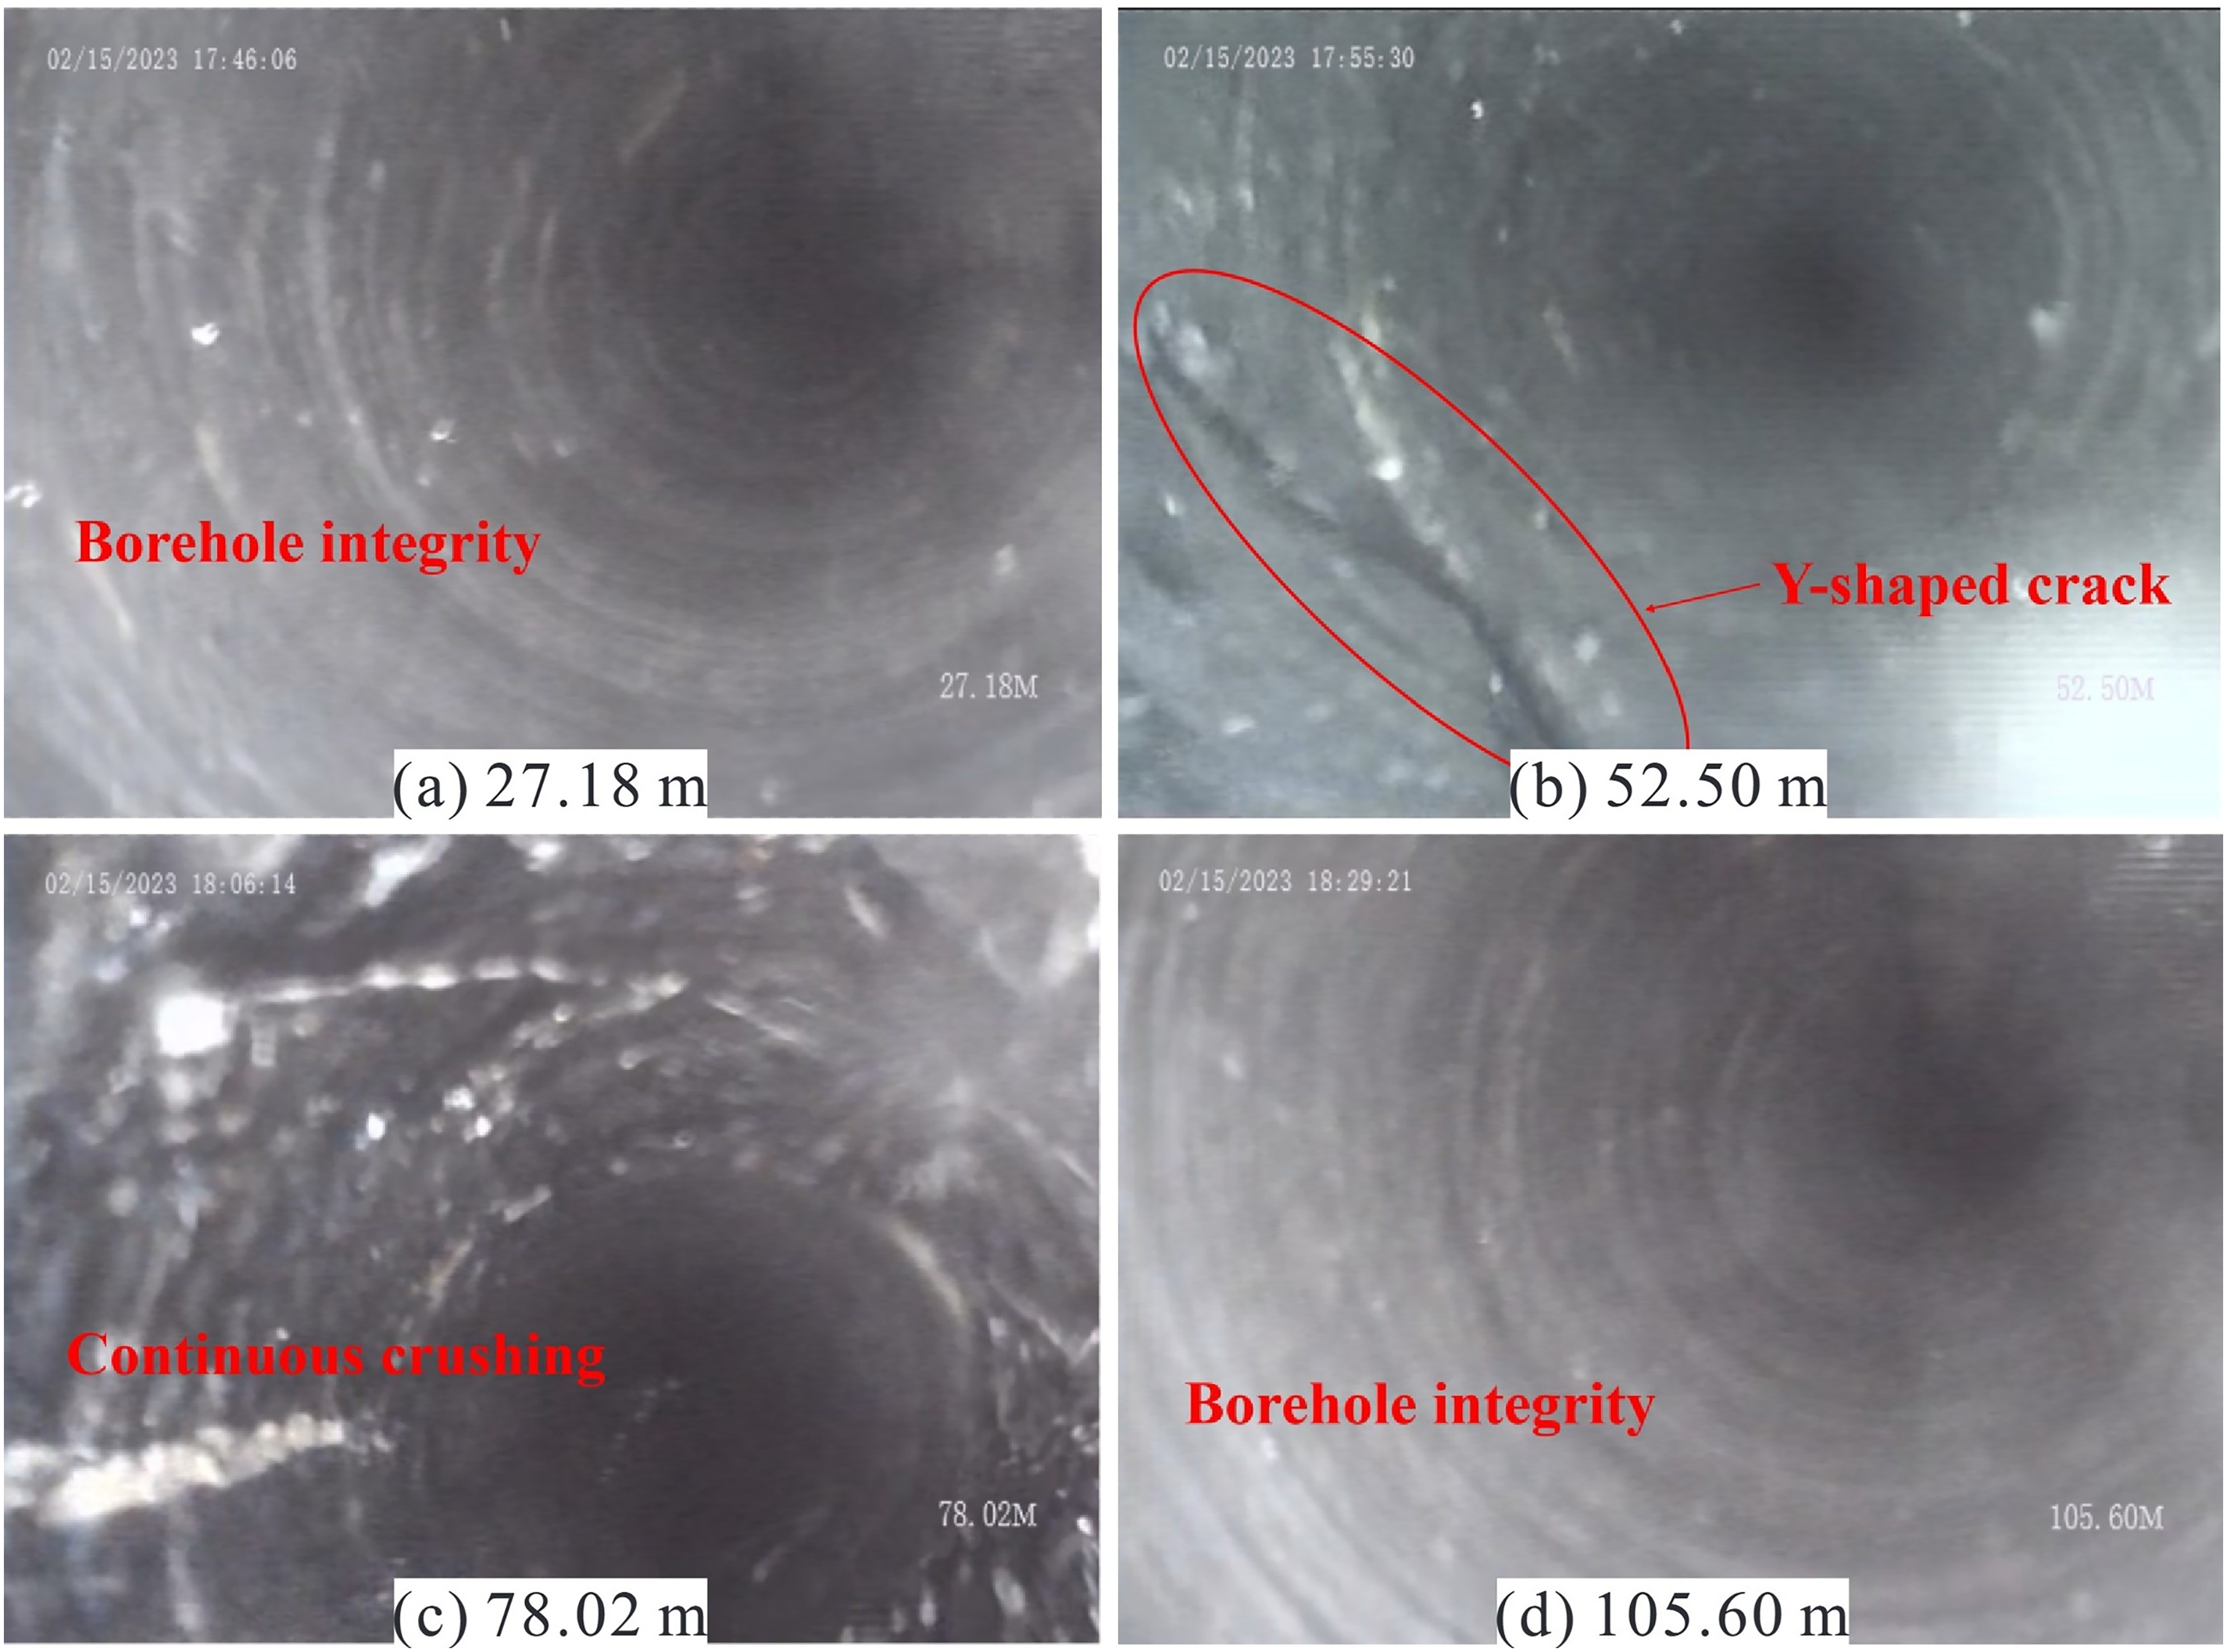
Borehole J1: In the depth section of 0–51 m and from a depth of 105.6 m to the borehole bottom (as shown in Figure 12(a) and (d)), small fissures only appear in limestone and sandstone layers, while the borehole walls are intact at other positions. The condition of the borehole walls is consistent with that observed in D1, indicating no mining disturbance. These segments are judged to be outside the fracture zone and beyond the fracture zone, respectively. In the depth section of 52.5–105.6 m (Figure 12(b) and (c)), segments with damaged borehole walls are closely spaced, and there are even long continuous broken segments on the borehole wall. This section is within the WCFZ. The WCFZ development height, obtained from the borehole television observation of J1, is 74.66 m, slightly lower than the 75.31 m obtained from borehole water injection tests.
Borehole J1 measurement image.
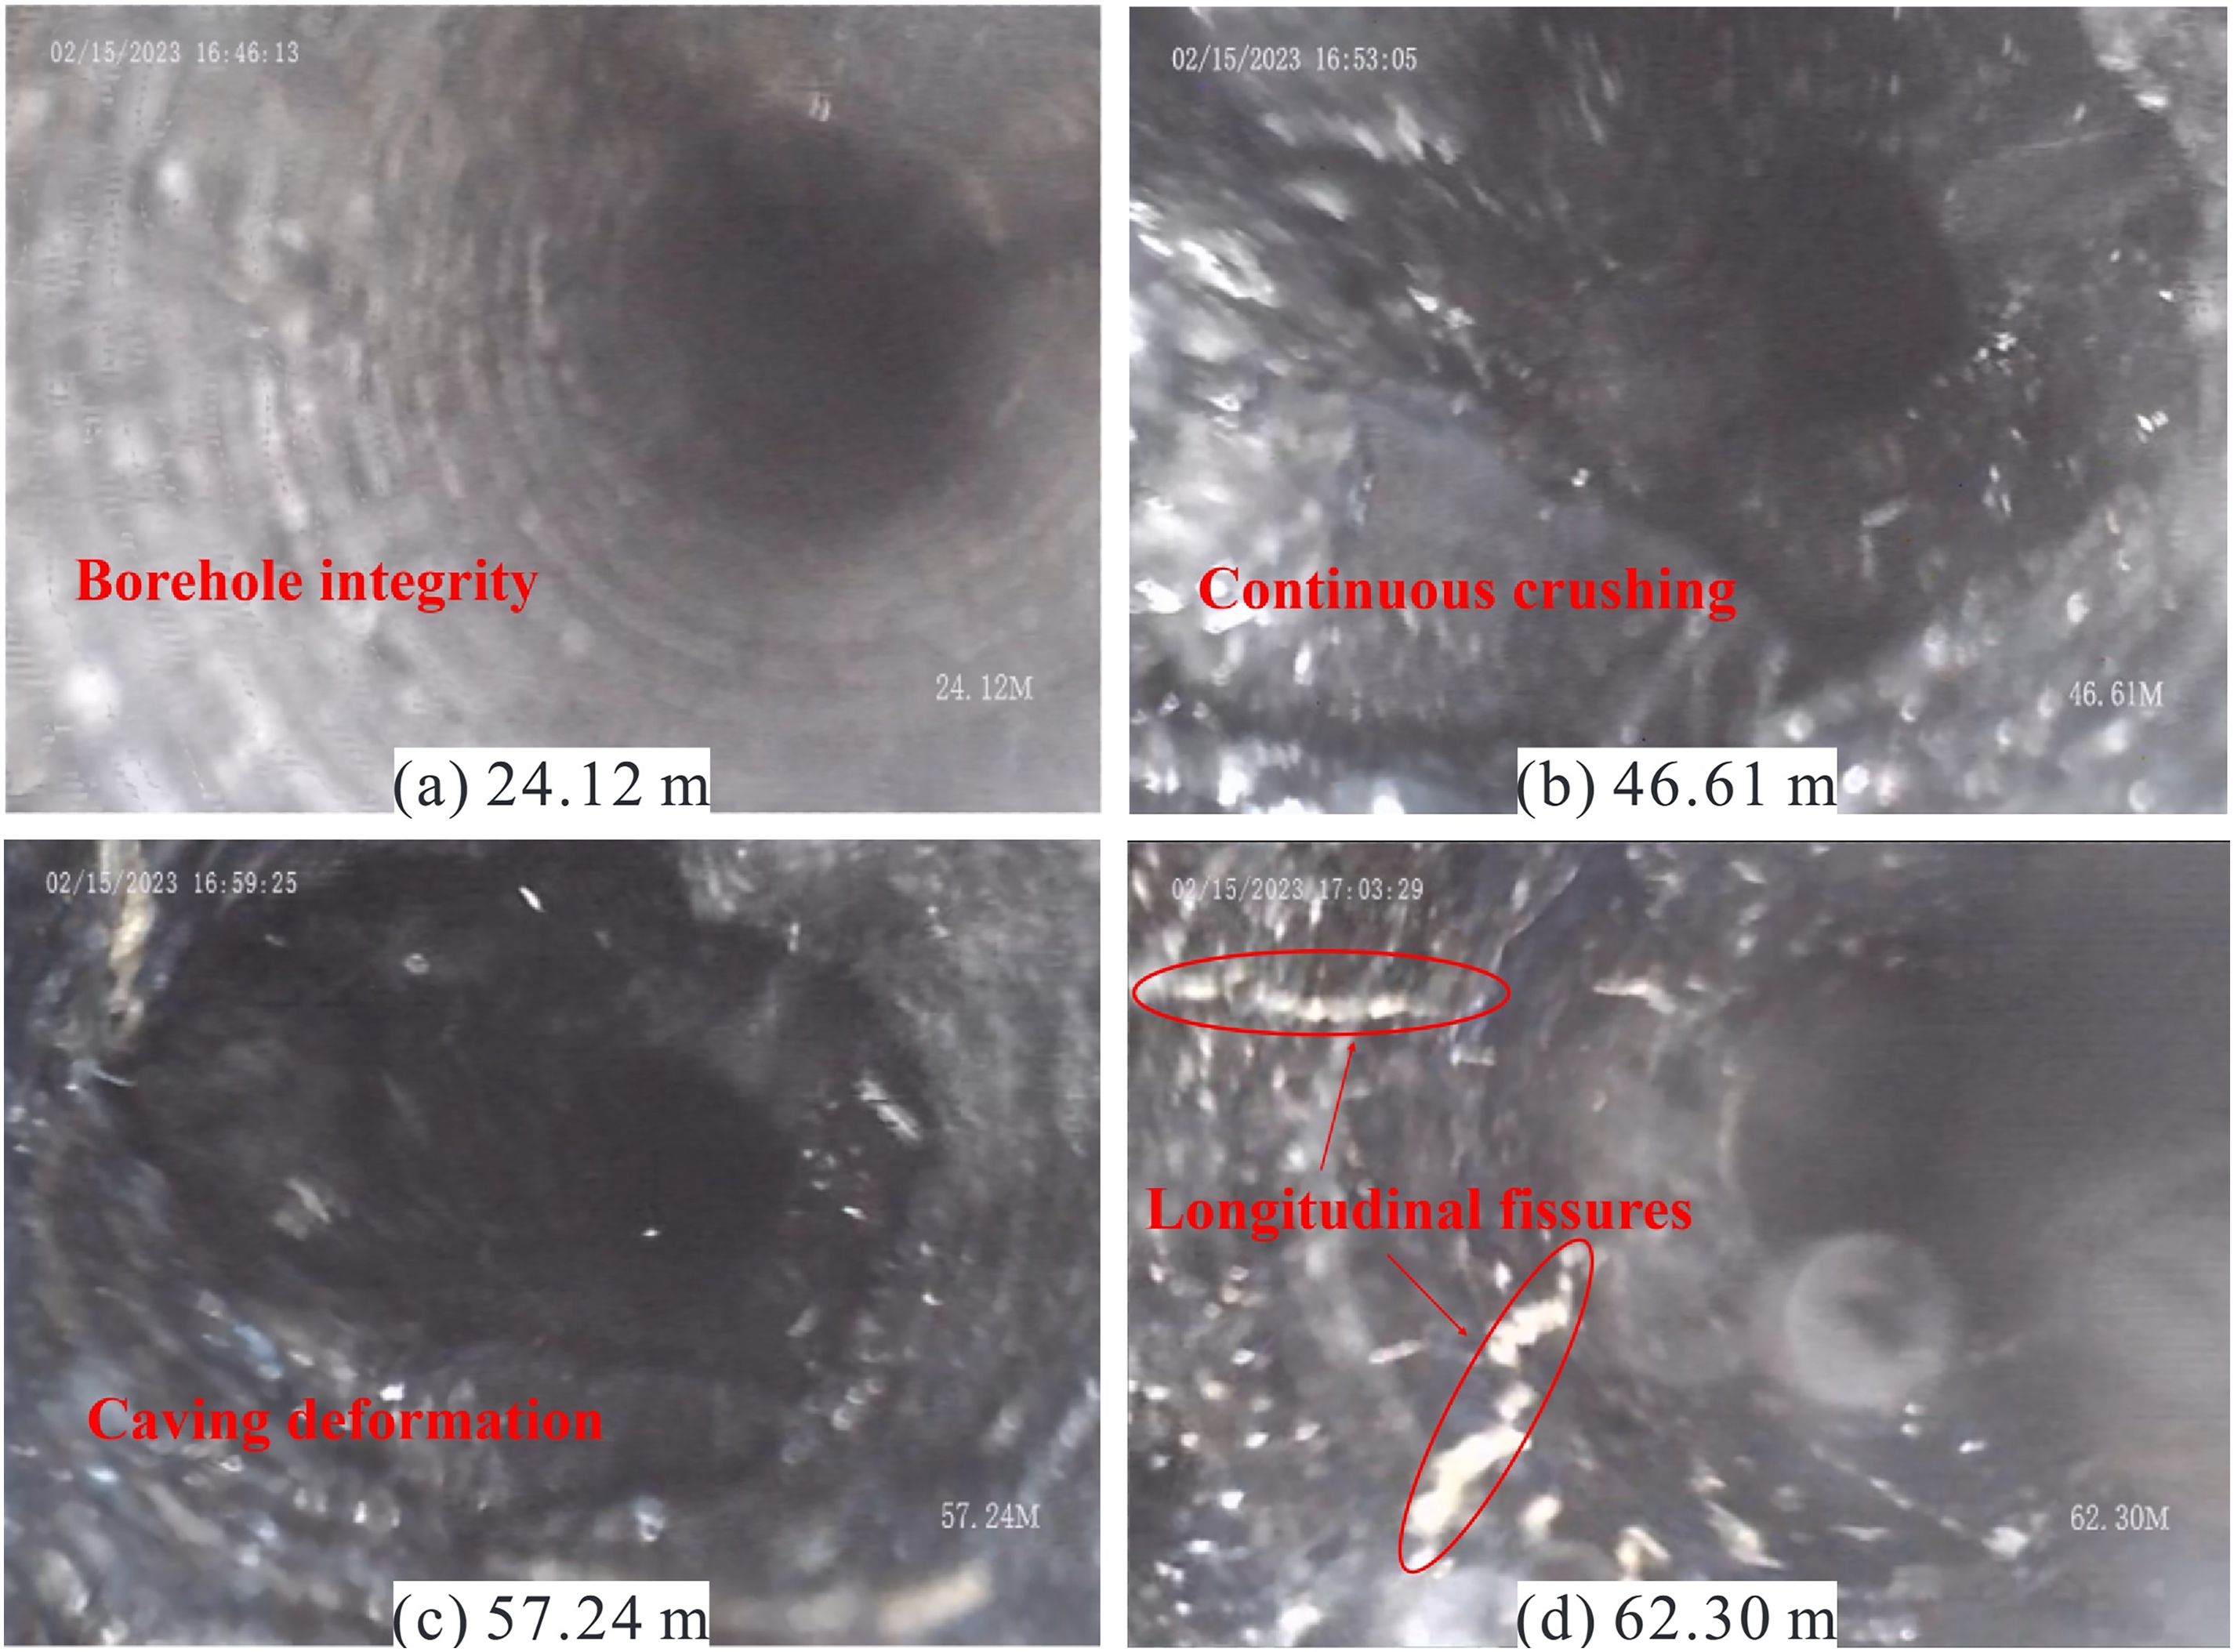
Borehole J2: In the 6–45 m depth section (Figure 13(a)), the condition of the borehole wall is consistent with that observed in D1, indicating it has not entered the caving zone. However, at the 46.5–57.24 m depth section (Figure 13(b) and (c)), there are long continuous broken segments on the borehole wall, and even borehole wall crushing and deformation, showing this section lies within the caving zone. From 62.3 m depth (21.18 m from the coal seam roof) to the borehole bottom (Figure 13(d)), the borehole walls show continuous small fissures, indicating this section has exited the caving zone and entered the fracture zone. The development height of the caving zone, determined by the borehole television observation of J2, is 21.18 m.
Borehole J2 measurement image.
Results and analysis of theoretical analysis
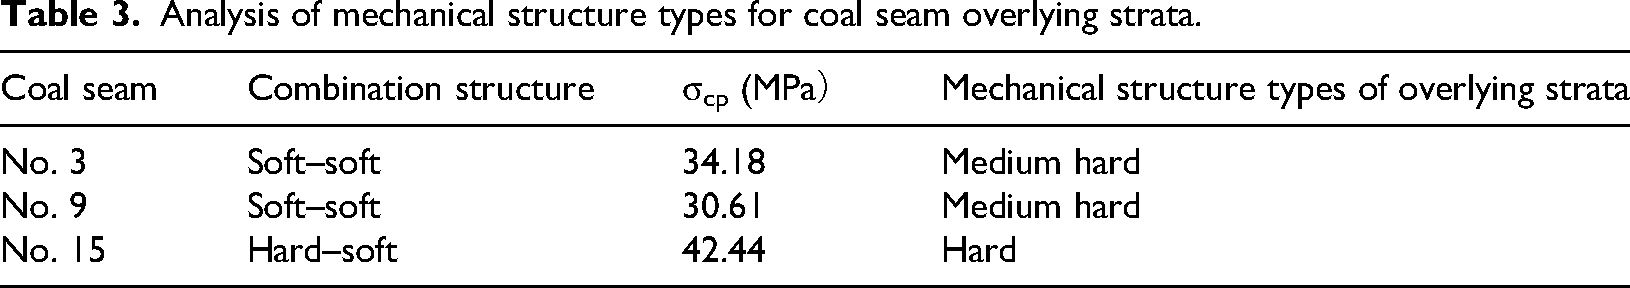
According to the calculation results of equation (1), the mechanical structure types of overlying strata in the coal seam roof are classified into four categories: hard overlying strata, with a uniaxial compressive strength of 40–80 MPa; medium-hard overlying strata, with a uniaxial compressive strength of 20–40 MPa; soft overlying strata, with uniaxial compressive strength of 10–20 MPa; and extremely soft overlying strata, with a uniaxial compressive strength less than 10 MPa. The calculation results are shown in Table 3.
Analysis of mechanical structure types for coal seam overlying strata.
Based on the calculation results of equations (2)–(5) (Table 4), the mining thickness of No. 3, No. 9, and No. 15 coal seams is 4.73 m, 1.74 m, and 2.78 m respectively, with the corresponding height of WCFZ being 53.49 m, 36.23 m, and 60.99 m. The height of WCFZ for No. 3 and the No. 9 coal seams was calculated based on the condition of medium-hard overlying strata. The distance between the roof of the No. 9 coal seam and the floor of the No. 3 coal seam is 62 m, with the height of its WCFZ being only 36.23 m; Therefore, the height of its WCFZ will not connect with the goaf of No. 3 Coal Seam. A comparison of the parameters of the No. 3 and the No. 9 coal seams shows that the height of the WCFZ of the No. 3 coal seam (53.49 m) is significantly higher than that of the No. 9 coal seam (36.23 m). Considering the difference in their mining thicknesses, it can be concluded that mining thickness has a significant impact on the development of the WCFZ.
Calculation results.

The height of WCFZ of the No. 15 coal seam is 60.99 m. According to the requirements of the Regulations for Mining Under Three Conditions, the height of the WCFZ for closed spaced coal seams should be determined by evaluating the minimum distance between the upper and lower coal seams. If this distance is greater than the height of the caving zone of the lower coal seam, the maximum height of the WCFZ should be taken as the higher value between the two seams. After mining the No. 9 coal seam, the highest point of the WCFZ is 68.87 m above the roof of the No. 15 coal seam; therefore, the WCFZ for the No. 15 coal seam is 68.87 m.
Results and analysis of numerical simulation
Scheme 1: The development pattern of the WCFZ in overlying strata under the condition of single mining of the No. 9 coal seam was analyzed, as show in Figure 14. Simulation results show that when the working face advances to 200 m, the immediate roof (siltstone layer) collapses and fills the goaf. The overlying strata failure propagates upward to the main roof, causing fractures and subsidence in the main roof. After compaction of the caving zone strata, a significant separation forms at the top interface of the sandy mudstone layer, 33.67 m above the No. 9 coal seam roof. Fissures develop in a “trapezoidal” pattern, with dense transverse and longitudinal fissures below the separation. Based on the simulation, the development height of the WCFZ during single mining of the No. 9 seam is determined as 33.67 m, 66.31 m above the No. 15 coal seam roof.
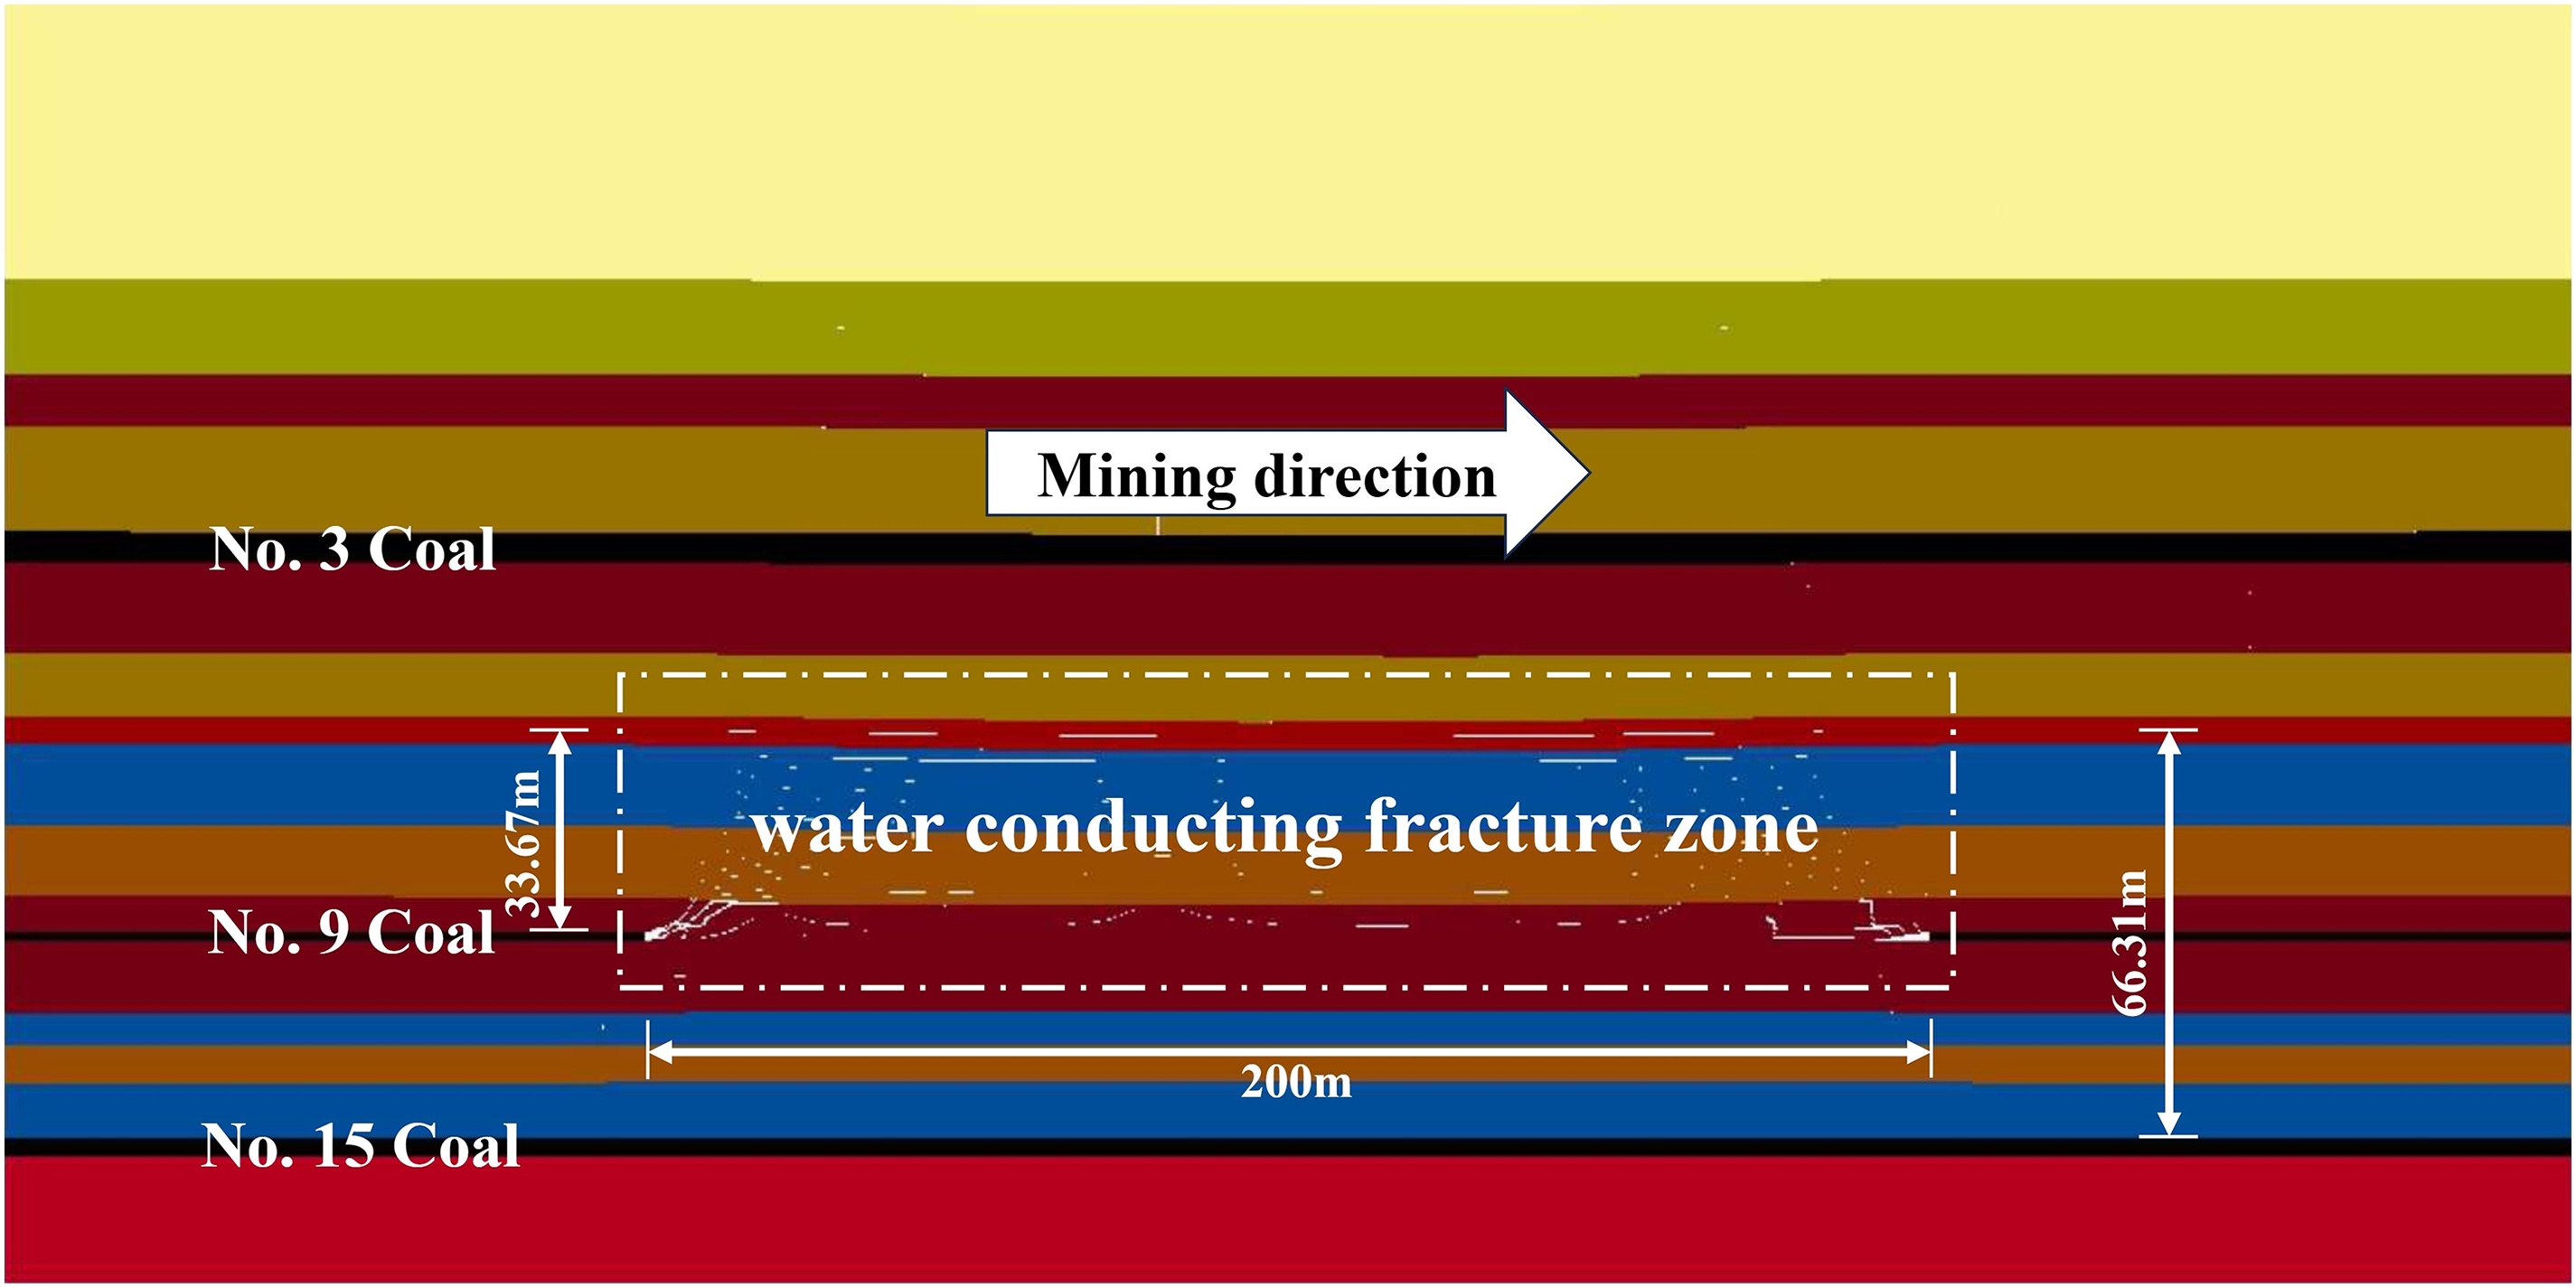
Overburden failure of mining No. 9 coal.
Scheme 2: It was assumed that the No. 9 coal seam was unmined, with only the No. 15 coal seam mined alone, as shown in Figure 15. Simulation results indicate that after mining, the immediate roof (limestone layer) completely collapses and fills the goaf. A separation occurs at the limestone top interface, 57.77 m above the No. 15 coal seam roof, with no obvious fissures above the separation but significant fissure development below. Thus, the development height of WCFZ during single mining of the No. 15 seam is 57.77 m.
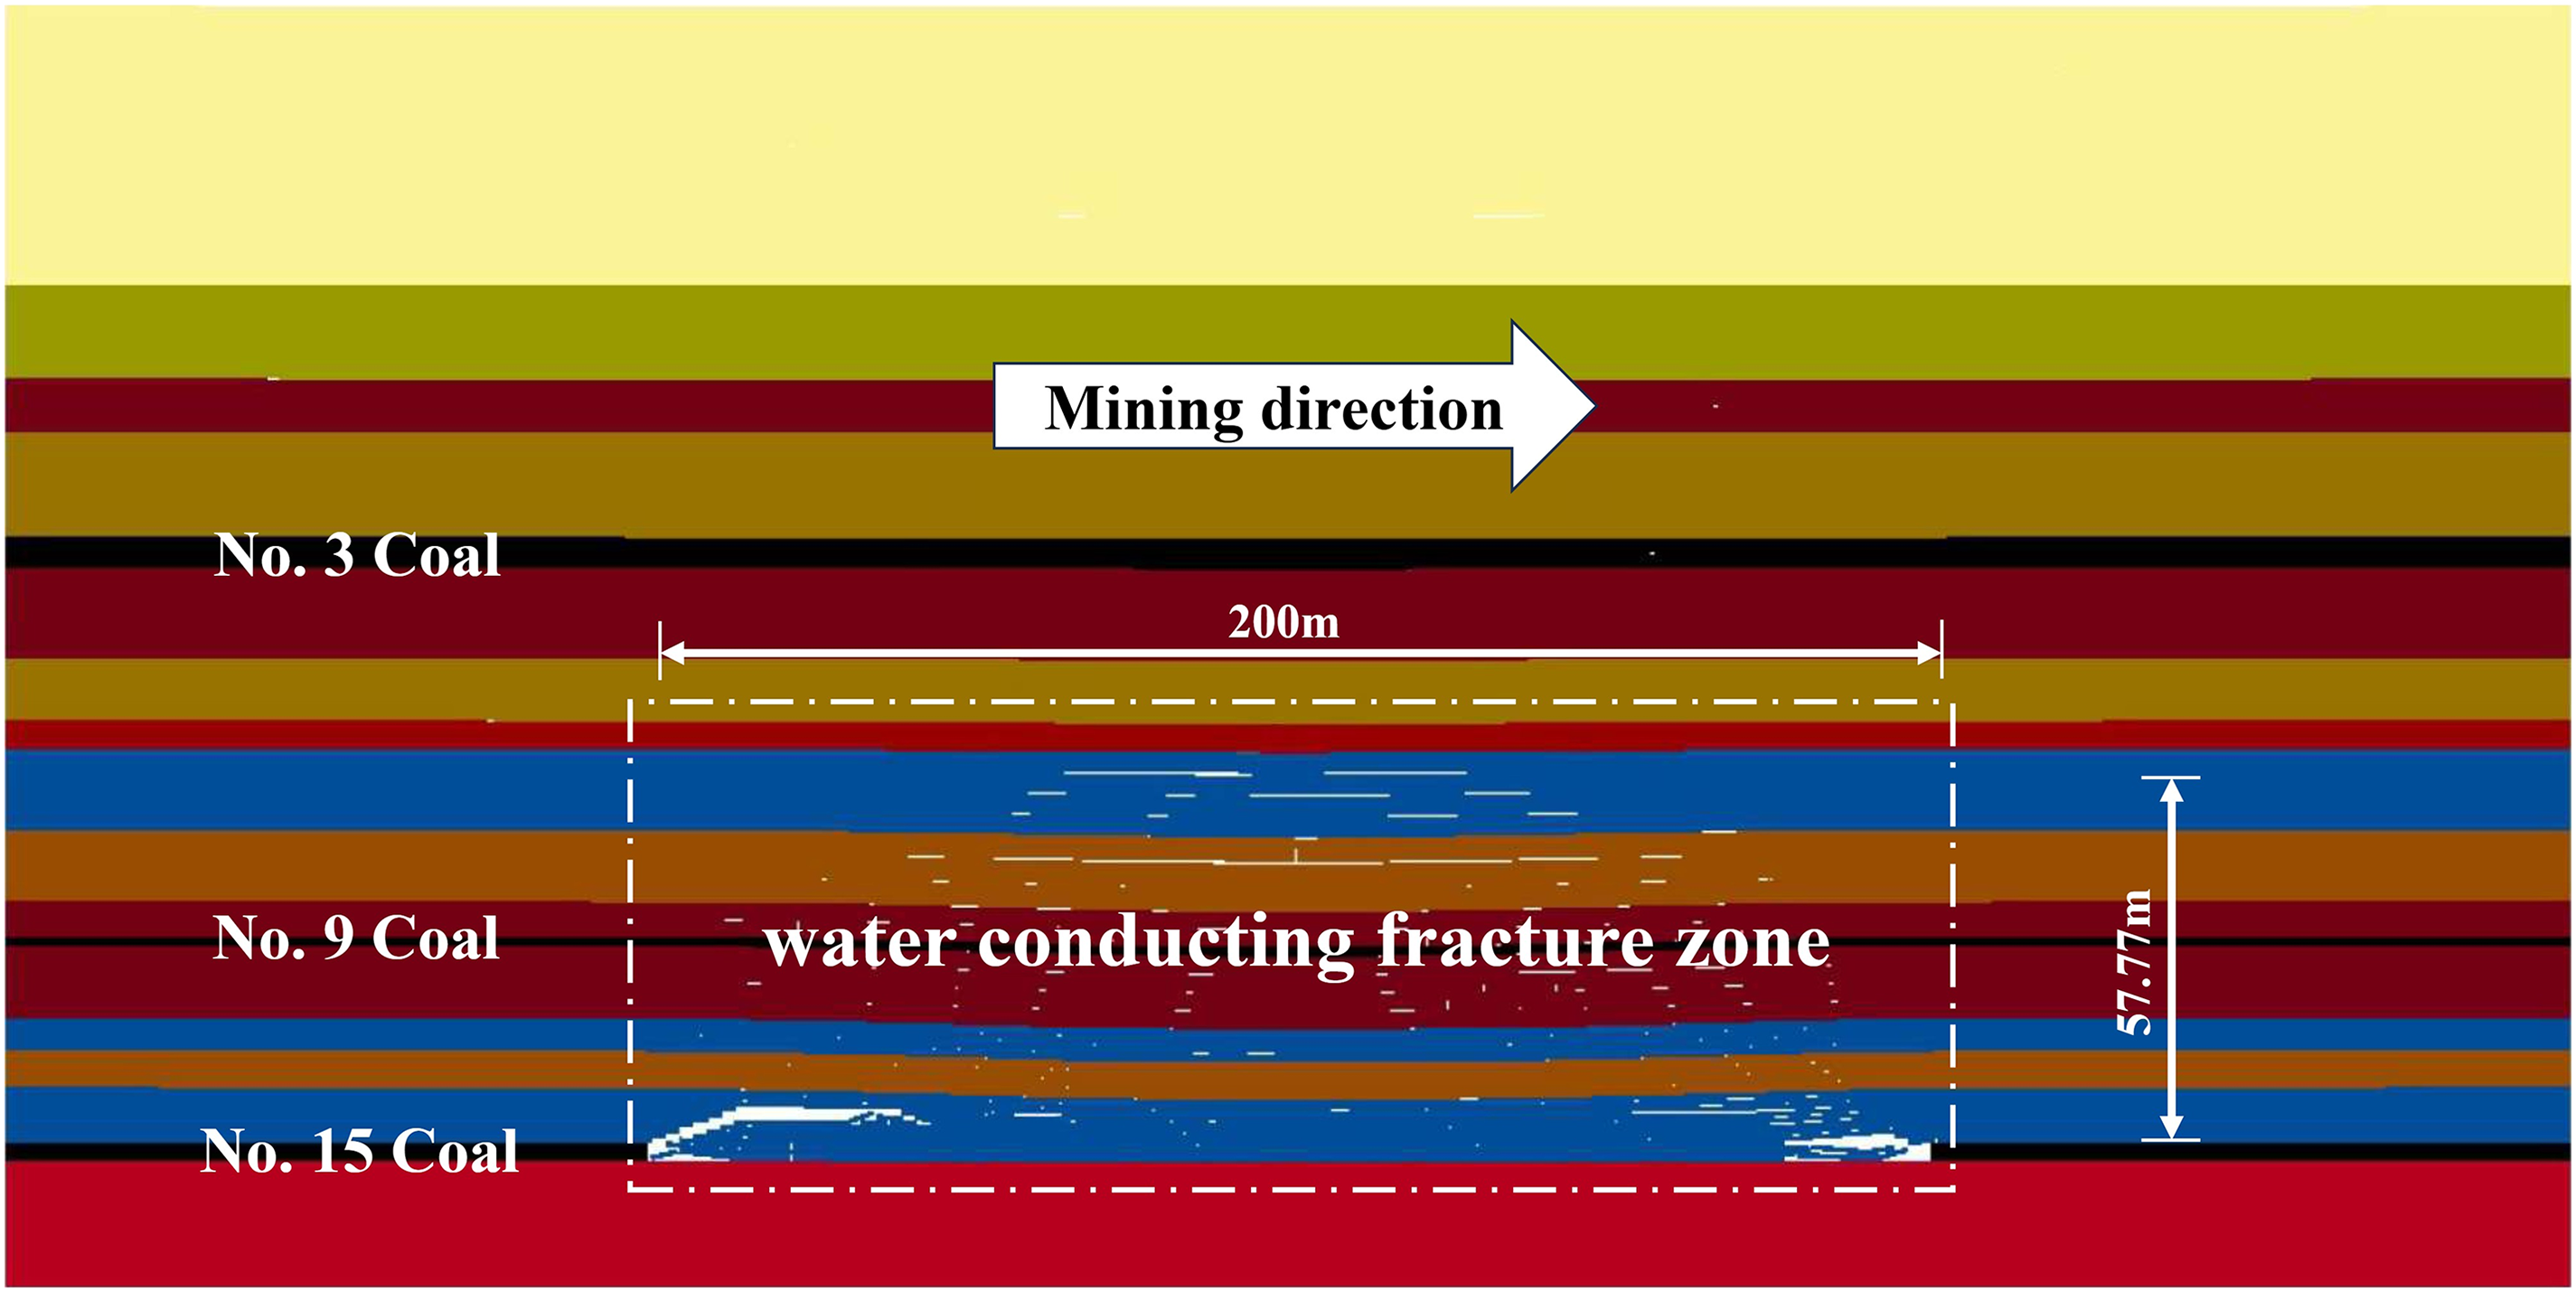
Overburden failure of mining No. 15 coal.
Scheme 3: To align with actual mining conditions, a double-seam mining scheme was adopted, involving sequential mining of the No. 9 and No. 15 coal seams, as show in Figures 16 and 17. Simulation results indicate that after mining the No. 9 seam, noticeable fractures appear on both sides of the goaf roof. During mining of the No. 15 seam, roof fractures further develop, and the interlayer breaks and subsides, causing secondary damage to the caving zone and fracture zone of the No. 9 seam's overlying strata. Mining the No. 15 seam causes its overlying fractures to interconnect with those of the No. 9 seam's goaf, extending further along the fracture trend from the initial mining of the No. 9 seam. Ultimately, the WCFZ height increases significantly, reaching a maximum at the sandy mudstone layer 73.87 m above the No. 15 coal seam roof. Therefore, under double-seam mining conditions, the development height of WCFZ is 73.87 m due to repeated mining disturbance.
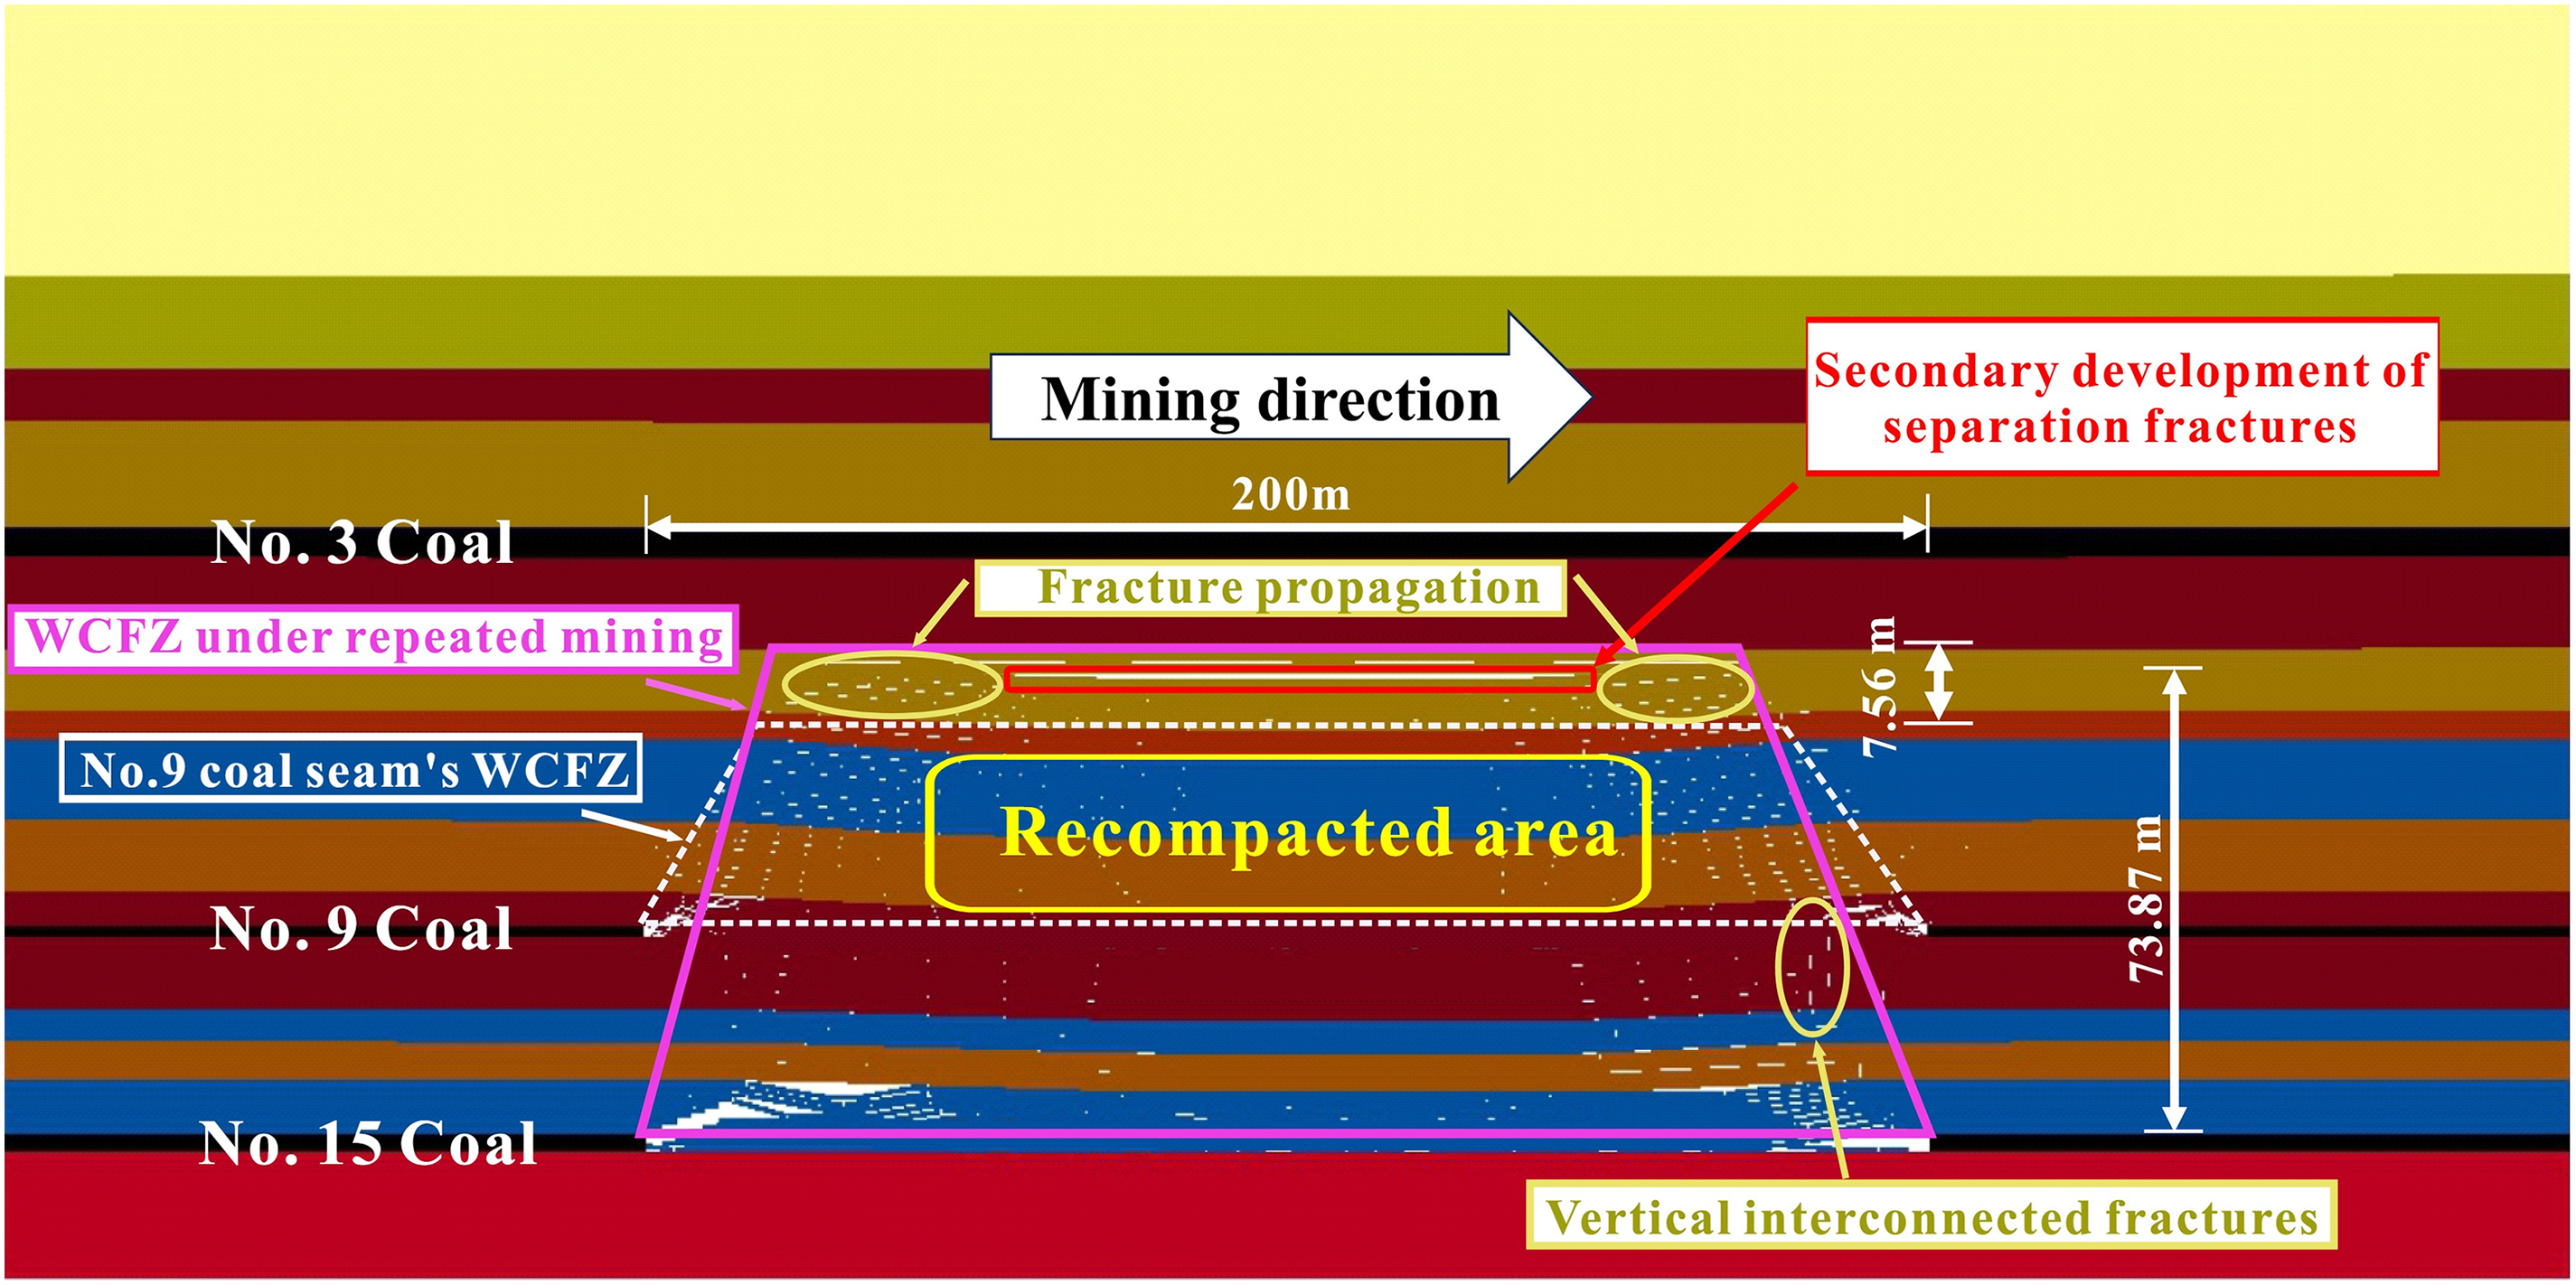
Overburden failure of double coal seams mining.
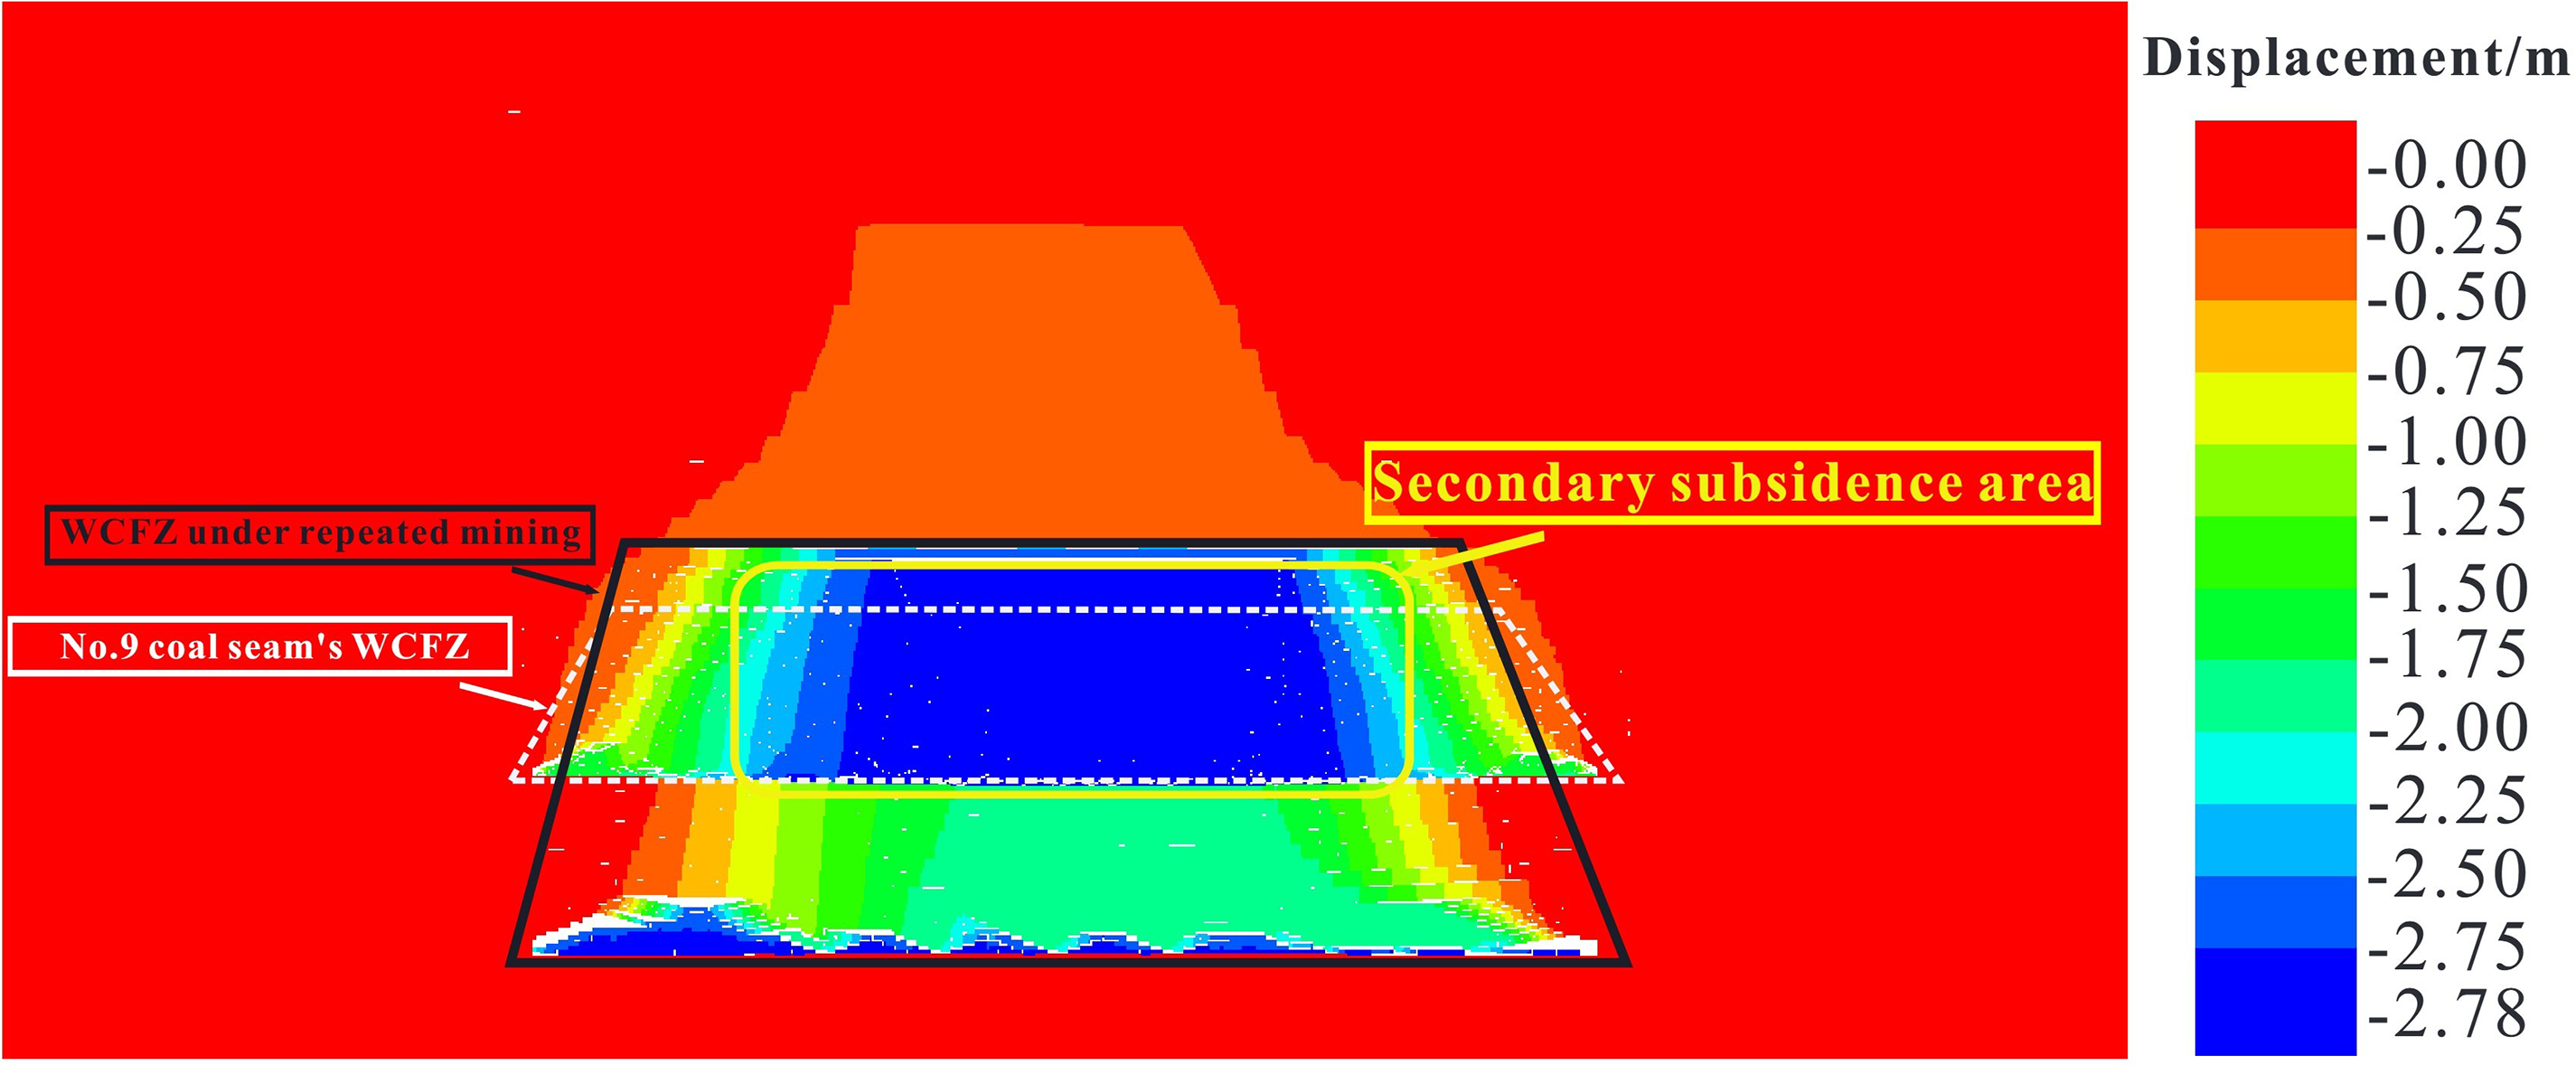
Displacement field of repeated mining disturbance.
Comprehensive comparative analysis of the height of the WCFZ
Based on field measured data, combined with theoretical analysis and numerical simulation predictions, a systematic analysis was conducted on the height of the WCFZ in the No. 15 coal seam of Huayang Coal Mine. The results obtained by three methods were compared (Table 5).
Comprehensive comparison of the height of WCFZ.
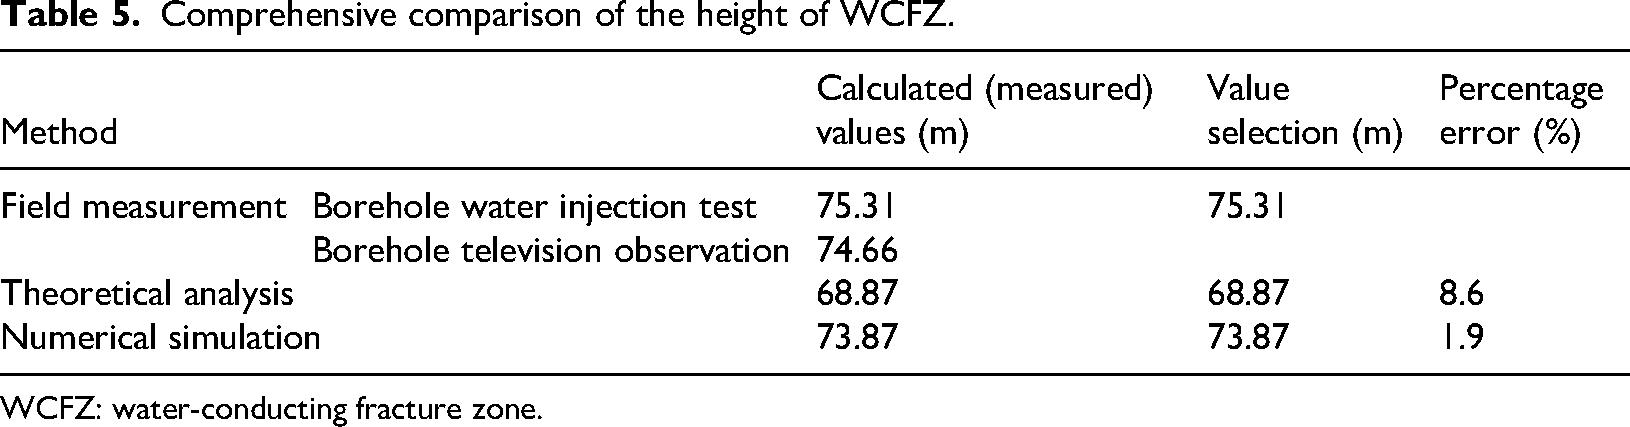
WCFZ: water-conducting fracture zone.
As shown in Table 5, the heights of the WCFZ obtained from field measurements and numerical simulations are relatively close. Based on the field measurement results, the maximum height of the WCFZ is 75.31 m. The height predicted by theoretical analysis is significantly smaller at 68.87 m, with a difference of 6.44 m from the measured value and an error margin of 8.6%, which significantly underestimates the actual developmental height. This result further confirms that the Regulations for Mining Under Three Conditions fails to account for the secondary development of fractures caused by repeated mining, making it difficult to adapt to the complex geological environment of deep coal seams and the superimposed disturbance conditions of multiseam mining. The result predicted by numerical simulation is 73.87 m, which is close to the field measured data with an error margin of 1.9%.
Through the “experimental testing-visual verification-theoretical simulation” multimethod collaborative framework, the development characteristics of WCFZ under repeated mining disturbance are systematically revealed, Borehole water injection tests show that the permeability coefficient of the caving zone strata is 4.9–8.2 times that of the original strata, and that of the fracture zone is 1.6–4.6 times. This quantitative difference is supported by the fracture morphology observed via borehole television, which compensates for the limitation of single methods in correlating macro parameters with microstructures. Numerical simulations indicate that multiseam mining induces secondary development of the upper fracture zone, with its height increasing by approximately 11.4% compared to that after mining the No. 9 coal seam, directly confirming the superimposed effect of repeated mining disturbance. Finally, through cross-validation of field measurements, empirical formulas, and numerical simulations, the maximum value is adopted to determine the height of WCFZ. The 8.6% deviation from the empirical formula method further clarifies the necessity of multi-method collaborative calibration. This research path, which ranges from parameter quantification to pattern revelation and then to result verification, provides specific methods for water hazard assessment in repeated mining areas. Additionally, the 11.4% height increase data highlights the key points for risk prevention and control in multiseam mining. The finally determined height of WCFZ directly serves the safety production practice of the mine, achieving a close integration of theoretical methods and engineering needs.
Error and reliability analysis of simulation results
Error analysis
During simplification of the geological model, the regularized joint network fails to fully replicate the random distribution of natural fractures, potentially causing deviations calculation of the height of the WCFZ. The mechanical parameters of the mass are limited by the representativeness of core sampling, and simplification of joint parameters of key strata may further superimpose additional errors. Additionally, discrepancies between the simplified initial stress field and the heterogeneity of in-situ ground stress also affect the simulation accuracy.
Reliability analysis
Based on the verification results, there is a 1.9% deviation between the height of WCFZ obtained through numerical simulation and the field measured values. The fracture development characteristics are consistent, indicating that it has basic reliability in both quantitative calculation and qualitative description. Further comparison with the theoretical analysis results shows that the relative error is less than 8% and the variation trend is consistent, with no systematic deviation, which indicates that the theoretical assumptions of the model are well adapted to the actual physical processes. Overall, despite potential errors introduced by model simplification, after on-site calibration and cross-validation of measured and theoretical results, the simulation results can effectively characterize the actual development characteristics of WCFZ, meeting the reliability requirements of engineering applications.
Strengths and limitations of the study
The strengths of this study lie in the establishment of a multimethod collaborative framework: “experimental testing-visual verification-theoretical simulation.” By linking permeability coefficients to fracture morphology, integrating cross-validation of three sets of test results for the height of WCFZ, and clarifying error characteristics such as deviations in empirical formula methods, the reliability of the findings has been effectively enhanced. However, there are some limitations to consider. The impacts of variables like in-situ stress anisotropy and fault distribution were not considered in the study. Specifically, in-situ stress anisotropy affects permeability by regulating fracture opening and closing states, and faults under such distribution tend to form local high-permeability zones while mining disturbance easily activates their propagation. Additionally, constraints on borehole television resolution may introduce measurement biases, which in turn affect the accuracy of the “permeability coefficient-fracture structure” correlation. Furthermore, the study only focuses on static fracture characteristics post-mining, lacking long-term monitoring data. Consequently, this makes it difficult to fully uncover patterns of fracture changes caused by time-dependent closure, as well as fracture reactivation and permeability temporal evolution; these changes are specifically manifested as creep and fine particle deposition. This limits its guiding value for long-term mine stability and groundwater protection to some extent.
Conclusion
Based on data obtained from water injection tests, the permeability coefficients of different segments in each borehole were back-calculated using water injection loss flow rates, the rest showed that the permeability coefficients of rock strata in the caving zone and fracture zone are 4.9–8.2 times and 1.6–4.6 times that of the original rock, respectively. When combined with fracture morphologies observed via borehole television, a quantitative correlation between “permeability coefficient and fracture structure” was established. High-permeability segments correspond to dense fractured cracks, while fine cracks match low-permeability segments, with the two mutually corroborating each other.
According to the physical and mechanical parameters of the overlying strata, an analysis of the mechanical structural properties revealed that the No. 15 coal seam's overlying strata exhibit hard structural properties and a “hard-soft combination” property, with a relatively low development height of the WCFZ. being relatively low. Numerical simulation comparing single-seam and multiseam schemes shows that mining of the lower seam induces secondary development of the WCFZ in the upper seam, and the height of the WCFZ is increased by approximately 11.4%. Additionally, the fracture of overlying strata during multiseam mining exhibits a significant repeated mining disturbance effect.
The heights of the WCFZ were determined using three methods: field measurements, theoretical analysis and numerical simulation. The results were 75.31 m, 68.87 m, and 73.87 m, respectively, with the empirical formula yielding a conservative estimate of approximately 8.6%. To ensure the safety of coal mining operations, the maximum value was adopted as the final result, confirming that the development height of the WCFZ following the mining of coal seam 15 is 75.31 m.
Footnotes
Acknowledgments
We are also grateful to the editor and reviewers for their insightful feedback and recommendations.
Authors’ contribution
Junbin Chang was the primary experimenter and completed the entire manuscript; Kai Bian, Jinpeng Xu, and Jinxi Wang provided ideas and improved the manuscript; Cunjin Lu, Fuzhu Wu, and Shouqiao Shi assisted in completing the field measurement experiments; Xiaoyan Zhang, Yanli Yang, and Balaji Panchal assisted in the numerical simulation.
Funding
This work was funded by the Natural Science Foundation Project of Hebei Province (Grant No. D2025402025).
Declaration of conflicting interests
The authors declared no potential conflicts of interest with respect to the research, authorship, and/or publication of this article.
Data availability
The raw data supporting the conclusions of this article will be made available by the authors, without undue reservation.