
Abstract
The rapid increase in electric vehicle adoption, driven by their low maintenance, superior performance, and environmental benefits, has significantly elevated the demand on power distribution networks (PDNs). The integration of electric vehicle charging stations (EVCSs) into existing PDNs introduces critical operational challenges such as increased real power losses, reactive power losses, voltage deviations, and line congestion, which compromise system reliability and stability. To address these issues, this study proposes an enhanced optimization framework based on the Black Widow Optimization Algorithm (BWOA) and compares its performance against the conventional slime mould algorithm (SMA). The proposed model simultaneously determines the optimal placement and sizing of photovoltaic-based distributed generators (PV-DGs), distribution static compensators, and EVCSs, minimizing a normalized multiobjective function (MOF) that jointly considers real and reactive power losses, voltage deviation index, voltage stability index, and the total installation and operational cost. The framework is tested on the Institute of Electrical and Electronics Engineers 34-bus PDN under 24-h dynamic load variations and stochastic Photovoltaic system generation profiles. Simulation results demonstrate that BWOA significantly outperforms SMA in technical and economic performance. For instance, at hour 13, BWOA reduces real power losses to 48.48 kW, compared to 102.82 kW with SMA (a 52.8% improvement), while reactive power losses decrease from 30.4 kVAr to 14.41 kVAr (a 52.6% reduction). Voltage performance also improves, with the voltage deviation index reduced from 0.0574 to 0.0253 and the voltage stability index increased from 0.7896 to 0.9026 under BWOA, compared to 0.0314 and 0.8802 with SMA, respectively. Moreover, BWOA achieves significant economic benefits, reducing the total system cost from $16,745 to $15,892 at peak hours (5.1% savings). Over the 24-h horizon, the proposed BWOA-based strategy achieves an average MOF reduction of 35.7% compared to SMA, highlighting its superior capability to balance technical performance and economic feasibility. Overall, the findings underscore the effectiveness of coordinated PV-DG, distribution static compensators, and EVCS allocation in enhancing operational efficiency, voltage quality, and economic sustainability of modern distribution systems. The integration of cost components into the MOF formulation ensures a holistic optimization approach, making BWOA a promising solution for next-generation smart grid planning and real-time operational control.
Keywords
Introduction
Motivation of the research
The sudden growth in electric vehicles (EVs) is transforming the transportation sector globally. This is propelled by a mix of economic incentives, battery and charging technologies, and the imperative to minimize environmental footprint. As penetration of EVs accelerates, it poses new challenges and opportunities for the power grid, notably in relation to energy management, load balancing, and infrastructure planning. Knowledge of these dynamics is critical to the creation of effective, robust, and sustainable energy infrastructure capable of supporting the expanding EV world. EVs are gaining popularity over traditional internal combustion engine vehicles because they have lower operating costs, fewer moving components, and lower maintenance, leading to higher reliability and lower long-term cost of ownership (Aggarwal et al., 2020, 2024; Kim et al., 2021; Yuvaraj et al., 2024a, 2024b, 2024c, 2024d). The lack of sophisticated mechanical components—such as gearboxes, fuel systems, and exhausts—necessitates less exposure to mechanical failures, making them even more consumer friendly (Kumar, 2024). Additionally, EVs are key in curbing greenhouse gas emissions and conserving fossil fuels for global sustainability goals (Kumar et al., 2024).
In spite of these benefits, the fast development of EV uptake poses tremendous challenges to current power distribution networks (PDNs). The increased demand due to massive EV charging frequently surpasses the design capacity in many PDNs, causing operational issues such as increased system losses, voltage fluctuations, and decreased reliability (Chandra et al., 2025). These problems are more significant in radial PDNs, which, although economical, are not strong enough to meet sudden and large changes in loads (Yuvaraj et al., 2024a, 2024b, 2024c, 2024d).
These challenges are met with the optimal placement and sizing of EV charging stations (EVCSs) in PDNs. Inefficient EVCS deployment may increase network stress, while its strategic siting may increase efficiency and reliability. Optimal locations and capacities for EVCSs, though, are a challenging multivariable optimization problem that calls for sophisticated computational techniques (Aljafari et al., 2024). A promising answer is the concurrent deployment of photovoltaic-based distributed generation (PV-DG) systems along with innovative reactive power support equipment in the form of distribution static compensators (DSTATCOMs). PV-DGs offer locally available renewable power, lowering reliance on centralized power plants, tapping vast solar resources at decreasing installation costs (Yuvaraj et al., 2023a, 2023b).
Although reactive power compensation can be supplied by both shunt capacitors and DSTATCOMs, DSTATCOMs have superior performance (Dashtdar et al., 2022; Malika et al., 2024). While capacitors present reactive power based on fixed values irrespective of system voltage, DSTATCOMs are able to supply variable and accurate reactive power support even during variable voltage situations (Yuvaraj et al., 2017). Rapidly responding to transient faults, DSTATCOMs improve voltage stability during unexpected EV charging spurts (Mohammedi et al., 2024). In addition, DSTATCOMs have better performance under unbalanced load and harmonics, a situation prevalent in EVCS-integrated systems (Ebrahimi et al., 2025). Their ability to absorb and supply reactive power over a large operating range facilitates dynamic voltage regulation, enhancing power quality and extending equipment life—all benefits that traditional capacitor banks cannot provide. Thus, in contemporary EVCS-influenced PDNs, DSTATCOMs are the first choice for their flexibility, quickness, and robustness in the maintenance of voltage stability and reduction of reactive power loss.
The complementary work of PV-DGs and DSTATCOMs guarantees that PDNs are able to satisfy increasing energy and power quality requirements that come with EVCS proliferation. While PV-DGs take care of real power requirements, DSTATCOMs maintain reactive power balance, regulating voltages and minimizing sags or swells risks. The synergic work does not only enhance network robustness but also enables seamless integration of large-scale EV charging without compromising service standards. Nevertheless, the best performance is achieved through accurate placement and dimensioning—misplacement can exacerbate losses or initiate instability. Further, the variable character of solar output and EV charging loads calls for smart optimization schemes that can function under dynamic load and renewable variability (Jain et al., 2025; Saw & Bohre, 2025).
To tackle these challenges, this research suggests an integrated optimization strategy based on the Black Widow Optimization Algorithm (BWOA) to optimize the PV-DG, DSTATCOM, and EVCS all at once. The newness of this research is in its simultaneous coordinated optimization of generation, reactive compensation, and charging facilities in one single multiobjective framework—something usually addressed individually in earlier research. The algorithm is tested on the Institute of Electrical and Electronics Engineers (IEEE) 34-bus PDN with practical 24-h load and random photovoltaic system (PV) generation patterns, seeking to minimize power loss, voltage deviation, and instability indices, as well as maximizing operational efficiency and grid reliability.
Existing works
The new paradigm of sustainable energy and electric mobility has radically transformed PDNs. The enhanced integration of PV-DGs, the growing demand by EVCSs, and the imperative for grid stabilization by means of devices such as DSTATCOMs have made the problem a complex multiobjective optimization issue. The main requirements are to reduce the power losses, enhance voltage profiles, and increase system reliability and resilience. This review presents a thorough review of the work, following the development of the methods for optimization and highlighting key gaps that newer methods have to fill. The premise for this review is to establish the need for an inclusive, dynamic optimization strategy that can cope with the intricacies of a future grid.
Early work tended to emphasize single-objective optimization for particular components in the network. The use of metaheuristic and nature-inspired algorithms was a major improvement, providing sound solutions to the nonlinear difficulties involved in PDNs. A stochastic second-order cone programming model, for instance, was put forward for optimal PV, wind turbine (WT), and EVCS sizing (Woo et al., 2022). This model successfully reduced voltage deviation and line losses by considering system uncertainties. The model, however, approximated EV demand as a static, time-invariant aggregate, neglecting dynamic driver behavior, real-time charging profiles, or coordinated interaction with reactive power support devices. This simplification is a significant limitation for realistic PDN representation.
The focus of the research then turned to coordinated deployment of various assets to maximize their synergistic advantages. As an example, the African Vultures Optimization Algorithm was utilized to optimize EVCS placements, DSTATCOMs, and distributed generators (DGs) (Pratap et al., 2022). The approach significantly reduced losses and voltage deviation on 33, 69, and 136-bus systems. A significant limitation of this approach, however, was its inability to consider dynamic EV charging profiles and variability of renewable generation. The same deficiency was reported in a fuzzy-based method with the RAO-3 algorithm for the simultaneous allocation of EVCSs, DGs, and DSTATCOMs (Mohanty et al., 2022). Although it enhanced voltage profiles and minimized losses, time-varying characteristic of renewable sources of generation and EVs’ demand was not considered in the study.
The quest for more effective and faster-converging algorithms led to the application of newer metaheuristics. The Tabu Search Optimization algorithm was introduced to counter the negative impacts of growing EV demand, such as increased power loss and poor voltage profiles (Bhadoriya et al., 2022). The study optimally placed EVCSs and DGs in an unbalanced IEEE-25 bus system, demonstrating strong convergence. Nevertheless, it did not fully embrace the dynamic and stochastic aspects of the problem. Further research with the Grey Wolf Optimization algorithm for siting EVCS, DG, and DSTATCOM (Kumar & Vadhera, 2022) also lacked dynamic EV charging profiles and time-varying load scenarios, which are crucial for real-time network planning. Another study using the Bald Eagle Search Algorithm for DSTATCOM and EVCS allocation (Yuvaraj et al., 2023a, 2023b) showed significant performance gains but did not integrate renewable DGs or dynamic EV charging behavior. Approaches such as political optimization for distributed generator and EV allocation (Dharavat et al., 2022), chaotic sine cosine for microgrid scheduling (Karthik et al., 2024), and forensic-based investigation for DG placement (Malika et al., 2025) have shown notable improvements in efficiency and reliability. Similarly, the enhanced wombat algorithm addresses multiobjective power flow in renewable and EV-integrated networks (Nagarajan et al., 2025), while adaptive salp swarm scheduling enhances residential energy management (Panda et al., 2024). Further, crow search improves real-time microgrid scheduling (Selvaraj et al., 2024), and chaotic Bat optimization strengthens stabilizer tuning in multimachine systems (Tadj et al., 2024).
Hybrid optimization methods have emerged to address the complexities of multiasset, multiobjective problems. The Hybrid African Vulture Optimization and Pattern Search method, for instance, was proposed for optimal EVCS allocation with network reconfiguration, alongside DGs and DSTATCOMs (Pratap et al., 2023). Tested on 33-bus and 136-bus systems, Hybrid African Vulture Optimization and Pattern Search outperformed several single algorithms. However, this advancement came at the cost of higher computational complexity and still lacked a framework for modeling renewable variability and dynamic EV charging. Building on the concept of multiobjective functions (MOFs), a planning method for renewable-DG based DSTATCOMs was proposed in (Saw & Bohre, 2023) using the sine–cosine algorithm. This study aimed to meet both real and reactive power needs by considering EVCS impacts, optimizing three objectives: real loss, reactive loss, and voltage deviation profile. While this work showcased good technical and computational results on an IEEE 85-bus system, it was limited by the absence of dynamic EV charging behavior and renewable generation variability. Similarly, a study combining modal analysis and particle swarm optimization (PSO) for PV–DSTATCOM-integrated EVCSs (Chakraborty et al., 2023) introduced an Artificial Neural Network-based dynamic pricing scheme but was limited to a single case and did not model bidirectional EV operations (V2G/G2 V).
The continuous push to improve algorithm robustness and efficiency is evident in more recent works. The Binary Elephant Swarm Optimization was shown to effectively reduce power losses and improve the voltage stability index (VSI) through the simultaneous allocation of DGs and DSTATCOMs (Yuvaraj & Devabalaji, 2023). Despite promising results across varying load levels, its limitations included a lack of 24-h modeling, the omission of V2G operation, and a failure to account for coordinated multiasset optimization with stochastic PV generation. These are significant shortcomings for an accurate representation of real-world operations. Other algorithms, such as the slime mould algorithm (SMA; Yuvaraj & Suresh, 2023) and the Spotted Hyena Optimization Algorithm (SHOA; Yuvaraj et al., 2024a, 2024b, 2024c, 2024d), also showed effectiveness in minimizing losses but similarly failed to account for dynamic EV charging behavior, temporal load variations, and bidirectional EV operation.
A persistent gap in the literature is the need for a comprehensive framework that addresses the dynamic and stochastic nature of modern PDNs. A cheetah optimization-based study (Pratap et al., 2024) and one using an improved nondominated sorting genetic algorithm (GA; Farjamipur et al., 2024) both focused on steady-state scenarios and did not model time-varying PV/EV profiles. The importance of time-varying and stochastic modeling is a recurring theme. A SHOA-based method for RDGs and DSTATCOMs (Yuvaraj et al., 2024a, 2024b, 2024c, 2024d) and a study using the Hunter–Prey Optimization algorithm (Pappu et al., 2024) also did not incorporate EVCS integration or dynamic EV charging behavior.
More recent studies have started to acknowledge these gaps but often fall short of a fully integrated solution. The Hippopotamus Optimization Algorithm (Abdelaziz et al., 2024) coordinated EVs, DSTATCOMs, and renewables but omitted integrated energy storage and detailed EV behavior modeling. The Honey Badger Optimization Algorithm (Muthusamy et al., 2024) focused on EVCS placement alone, lacking coordinated optimization with PV-DGs and DSTATCOMs. A multiobjective techno–enviro–economic framework (Saw & Bohre, 2025) for planning hybrid solar-DG integrated DSTATCOMs still lacked time series (24-h) dynamic profiles and bidirectional V2G modeling. A study using HPOA (Suresh et al., 2025) also did not consider dynamic load variations or time-varying EV charging behaviors.
The concept of integrating power and transportation networks has been explored but with limitations. A two-stage framework (Vutla & Chintham, 2025) optimized the planning of rapid charging stations, DGs, and D-STATCOMs but did not consider V2G operation or coordinated reactive power support. Another study using SHOA and GA (Babu et al., 2025) considered V2G but focused on heuristic single-objective optimization, failing to perform a coordinated multiobjective placement with all assets under 24-h stochastic profiles. Finally, newer algorithms like Pelican Bird Optimization (Sakthivel & Gayathri, 2025) and Improved Particle Swarm Optimization with Success Rate (IPSO-SR) (Bonela et al., 2025) also demonstrated robust performance but were limited by a focus on a single test network, lack of time-varying demand, or exclusion of crucial dynamic EV patterns and V2G operations.
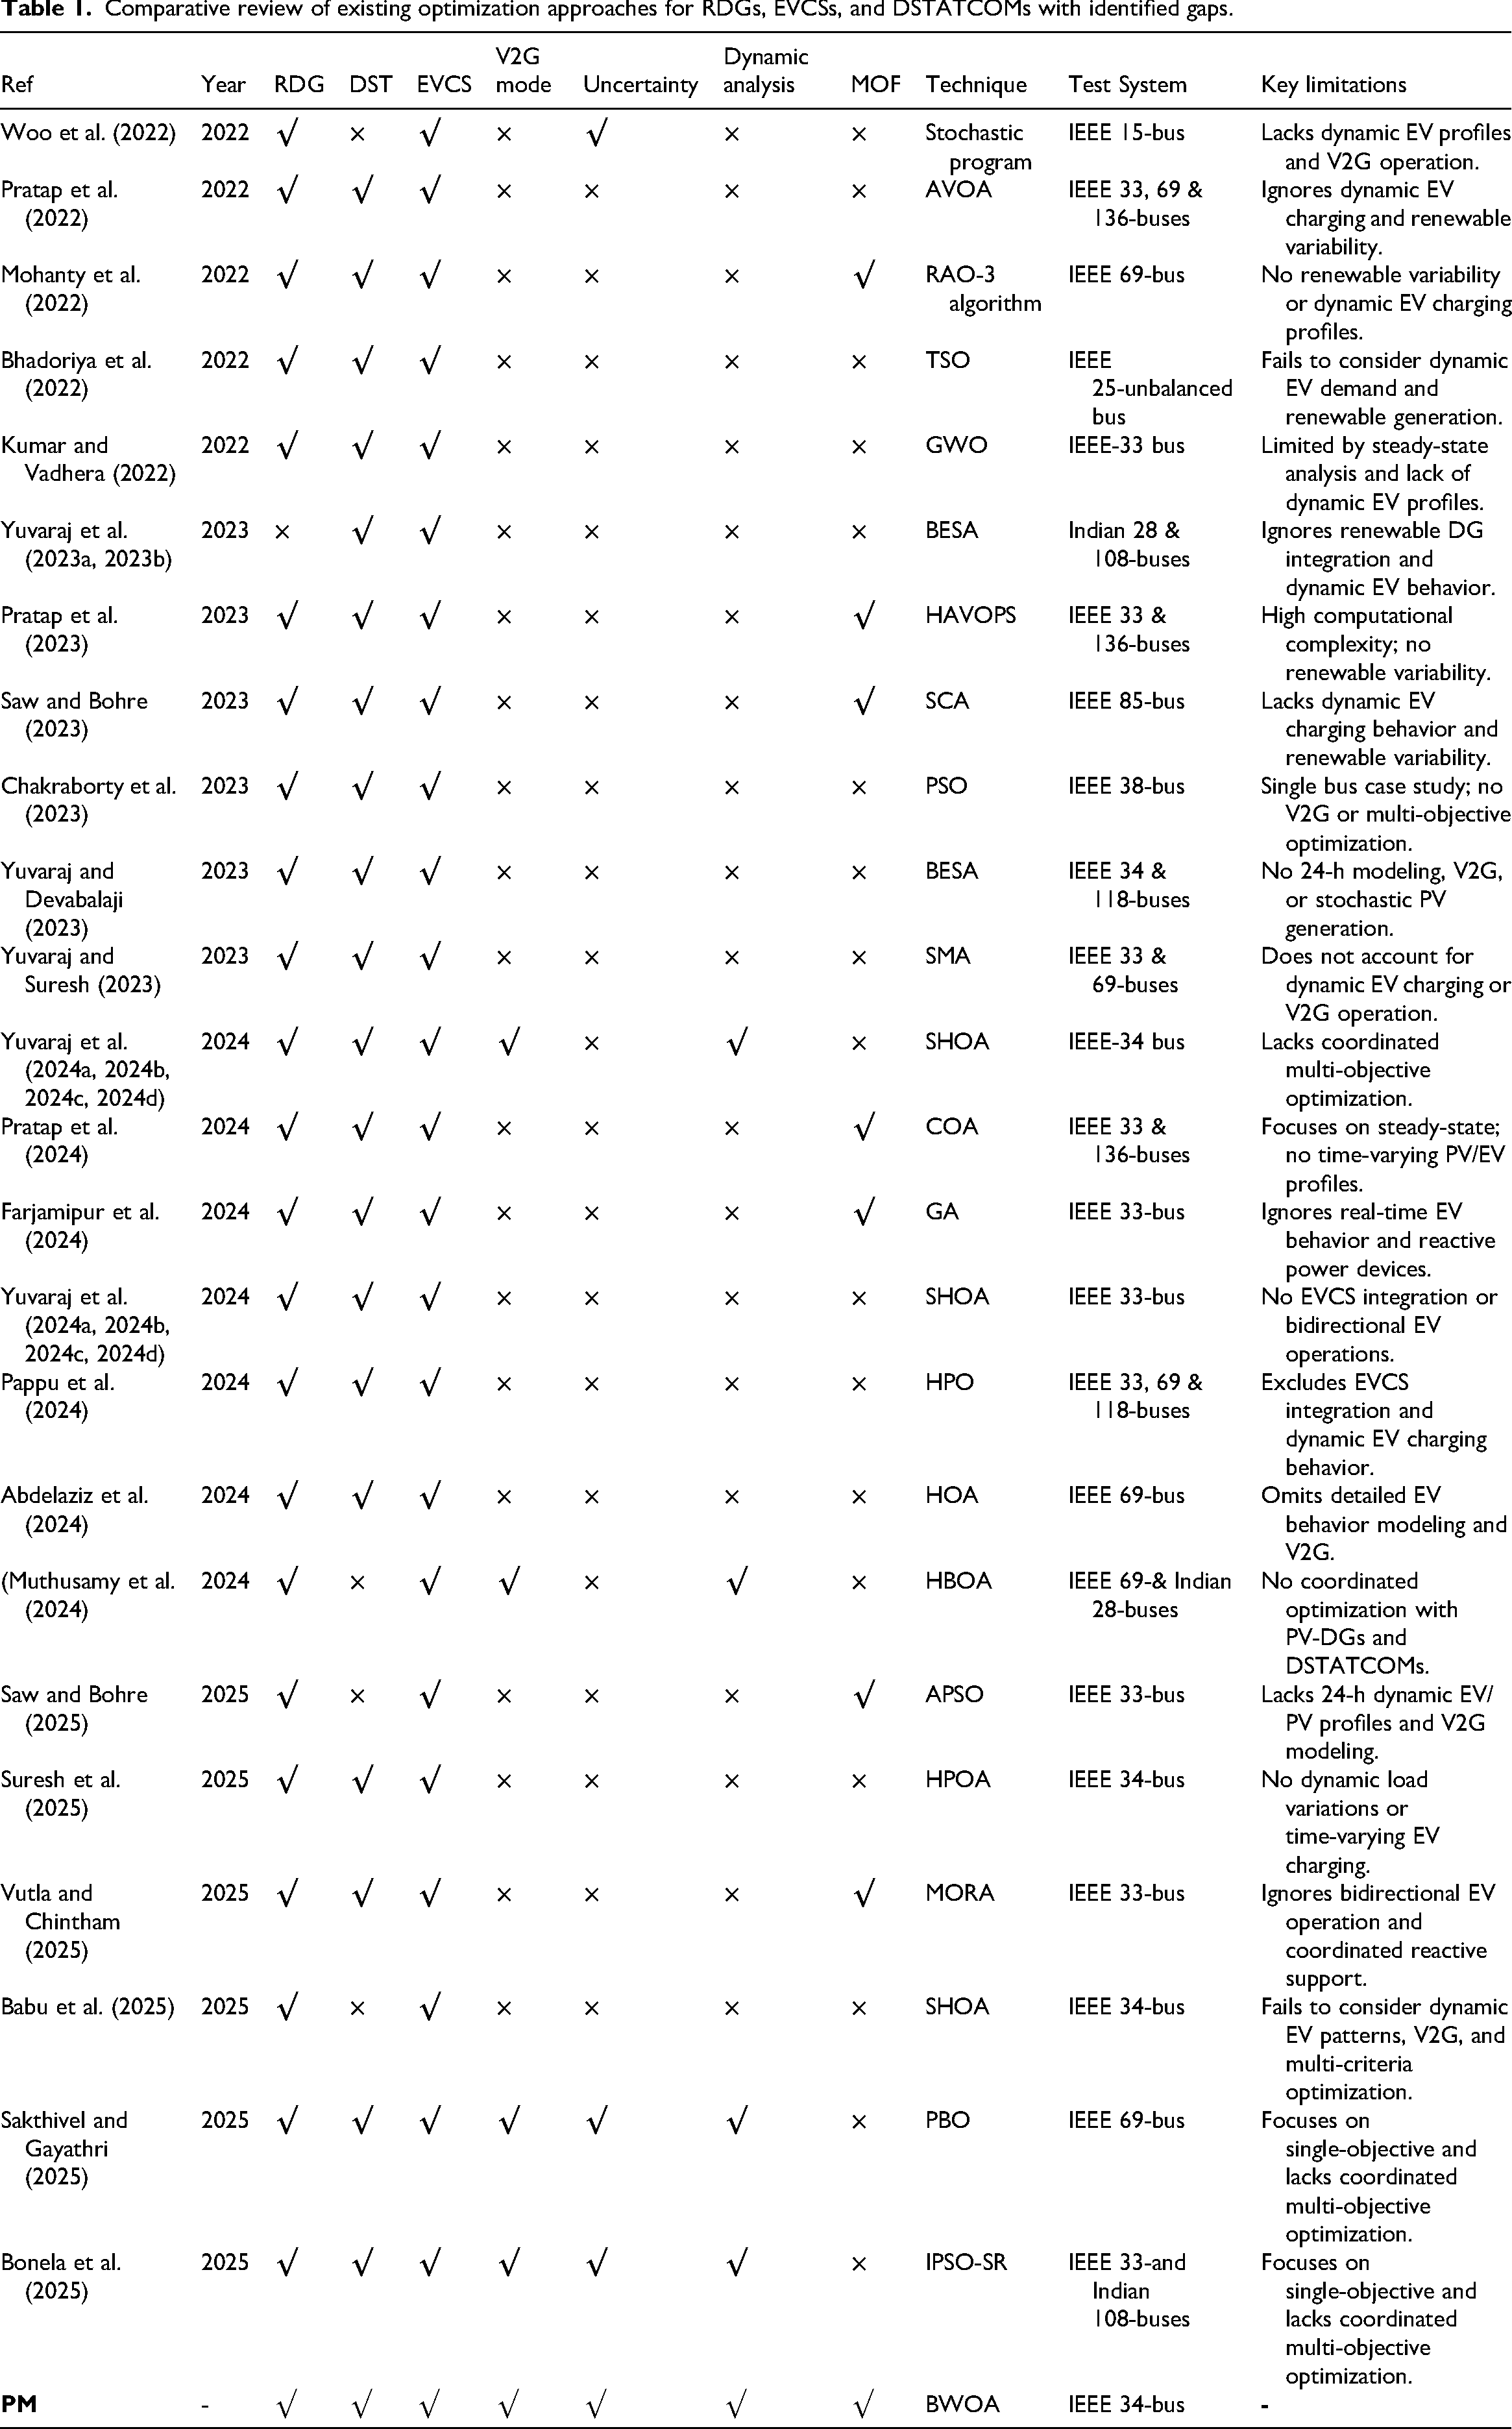
This review and the comparative analysis in Table 1 highlight a persistent gap in the existing literature: most prior works either simplify the problem using steady-state assumptions or fail to capture the dynamic, stochastic, and coordinated behavior of distributed assets. Such oversimplifications limit the applicability of results to real-world scenarios. In contrast, our study is motivated by the need for a holistic optimization framework that can address these shortcomings. The novelty of the proposed work lies in the formulation of a normalized MOF that simultaneously accounts for total real power loss, total reactive power loss, voltage deviation index (VDI), VSI, and overall installation and operation cost. Unlike earlier studies that focused only on single-objective loss minimization or considered distributed energy resources (DERs) and EVCSs separately, the proposed MOF ensures a balanced trade-off between technical and economic objectives over a 24-h operational horizon. Furthermore, it explicitly integrates stochastic variations in renewable generation and dynamic EV charging demand while also incorporating bidirectional (V2G) operation of EVs to improve resource utilization. By combining these technical and economic performance indicators in a unified optimization framework, the proposed approach provides a more practical, adaptive, and robust solution compared with existing methods, thereby enhancing the resilience, efficiency, and sustainability of future distribution networks.
Comparative review of existing optimization approaches for RDGs, EVCSs, and DSTATCOMs with identified gaps.
Research gaps
This review highlights a persistent gap in the existing body of literature, as summarized in Table 1. Despite significant advancements in DER and EVCS integration within PDNs, several critical challenges remain:
Lack of integrated optimization frameworks: Most studies address PV-based DGs, DSTATCOMs, or EVCSs individually rather than adopting a comprehensive and coordinated planning framework. For example, Woo et al. (2022), Yuvaraj et al. (2023a, 2023b), and Saw and Bohre (2025) optimize limited asset combinations, neglecting joint coordination of DGs, EVCSs, and DSTATCOMs. Limited consideration of EVCS-induced impacts and compensation strategies: While the negative effects of EVCS integration on losses and voltage stability are recognized, very few works incorporate DSTATCOMs alongside PV-DGs for reactive power compensation. Studies such as Pratap et al. (2022), Kumar and Vadhera (2022), and Yuvaraj and Devabalaji (2023) fail to fully explore this synergy. Insufficient multiobjective optimization under dynamic and stochastic conditions: Although MOF-based methods exist (Mohanty et al., 2022; Pratap et al., 2023; Saw & Bohre, 2023) and (Pratap et al., 2024), many rely on steady-state assumptions and neglect 24-h stochastic renewable and EV profiles, limiting real-world applicability. Inadequate modeling of bidirectional EV operations: A significant portion of research ignores V2G/G2 V capabilities of EVs. For example, Bhadoriya et al. (2022), Chakraborty et al. (2023), Yuvaraj and Suresh (2023), Pappu et al. (2024), and Vutla and Chintham (2025) neglect the flexibility benefits of bidirectional operations. Scalability and computational efficiency challenges: Metaheuristic algorithms such as GA, PSO, and SHOA (Chakraborty et al., 2023; Farjamipur et al., 2024; Yuvaraj et al., 2024a, 2024b, 2024c, 2024d) often encounter slow convergence or computational complexity when applied to large or real-time networks. Underexplored synergistic effects of DER components: The coordinated contribution of PV-DGs and DSTATCOMs in enhancing voltage stability and minimizing EVCS impacts is largely overlooked, as seen in Yuvaraj et al. (2024a, 2024b, 2024c, 2024d), Muthusamy et al. (2024), and Babu et al. (2025). Limited techno-economic analysis: Very few works conduct detailed cost and performance trade-offs. Studies such as (Abdelaziz et al., 2024, Sakthivel & Gayathri, 2025; Bonela et al., 2025) highlight technical performance but inadequately capture investment and operational cost considerations under coordinated DER–EVCS planning.
By addressing these gaps, the proposed framework introduces a normalized multiobjective optimization that explicitly models PV-DGs, DSTATCOMs, and EVCSs under uncertainty, incorporates bidirectional V2G operation, and ensures technoeconomic feasibility across dynamic 24-h operating conditions.
Contributions of the research
This study proposes a comprehensive and adaptive framework to enhance the performance and resilience of PDNs through the optimal integration of PV-based DGs, DSTATCOMs, and EVCSs. The major contributions are summarized as follows:
Holistic optimization framework: A normalized MOF is formulated that jointly minimizes real and reactive power losses, VDI, VSI, and total installation/operation cost, thereby ensuring a balanced trade-off between technical and economic objectives. Dynamic and stochastic modeling: Unlike existing steady-state approaches, the framework explicitly incorporates 24-h load variations, stochastic renewable generation, and dynamic EV charging demand, providing a more realistic representation of PDN operations. Coordinated resource utilization: The study highlights the synergistic roles of PV-DGs, DSTATCOMs, and EVCSs, where DSTATCOMs provide reactive power support to mitigate voltage fluctuations, while EVCSs with bidirectional (V2G/G2 V) capability actively participate in demand management and grid support. Novel optimization algorithm: The proposed BWOA, benchmarked against the SMA, is employed to achieve near-global optimal solutions for the optimal location and sizing of distributed assets, ensuring faster convergence and robust performance. Load-aware deployment strategy: The methodology optimally allocates PV-DGs and EVCSs considering varying demand patterns, thereby improving operational efficiency, reducing network stress, and enhancing resource utilization. Benchmark validation: The proposed approach is validated on the IEEE 34-bus distribution test system under multiple load and operating scenarios, demonstrating its robustness, adaptability, and superiority compared with conventional single-objective or static allocation methods.
Figure 1 illustrates a schematic representation of the integrated PDN, highlighting the coordinated operation of PV-DGs, DSTATCOM devices, and EVCSs operating under both G2 V and V2G modes. Every component has a crucial role in terms of performance and sustainability of the distribution system. The PV-DGs add renewable energy supply to the grid, thus minimizing reliance on fossil fuel-based generation and decreasing emissions. DSTATCOMs are added to ensure voltage stability, reactive power flow regulation, and power quality support under changing load conditions. As dynamic voltage support units, they increase the overall reliability and control of the network. The PDN is the supporting infrastructure that supplies electricity effectively through different nodes. EVCSs play a role in energy flexibility—taking electricity from the grid during off-peak periods (G2 V) and providing power back into the system during peak load hours (V2G), thereby supporting demand response and grid stability. Such an arrangement encourages maximum energy management, minimizes technical losses, and supports smart grid targets. The figure presents a comprehensive conceptual architecture for the integration of advanced technologies to develop smart, low-carbon PDNs.
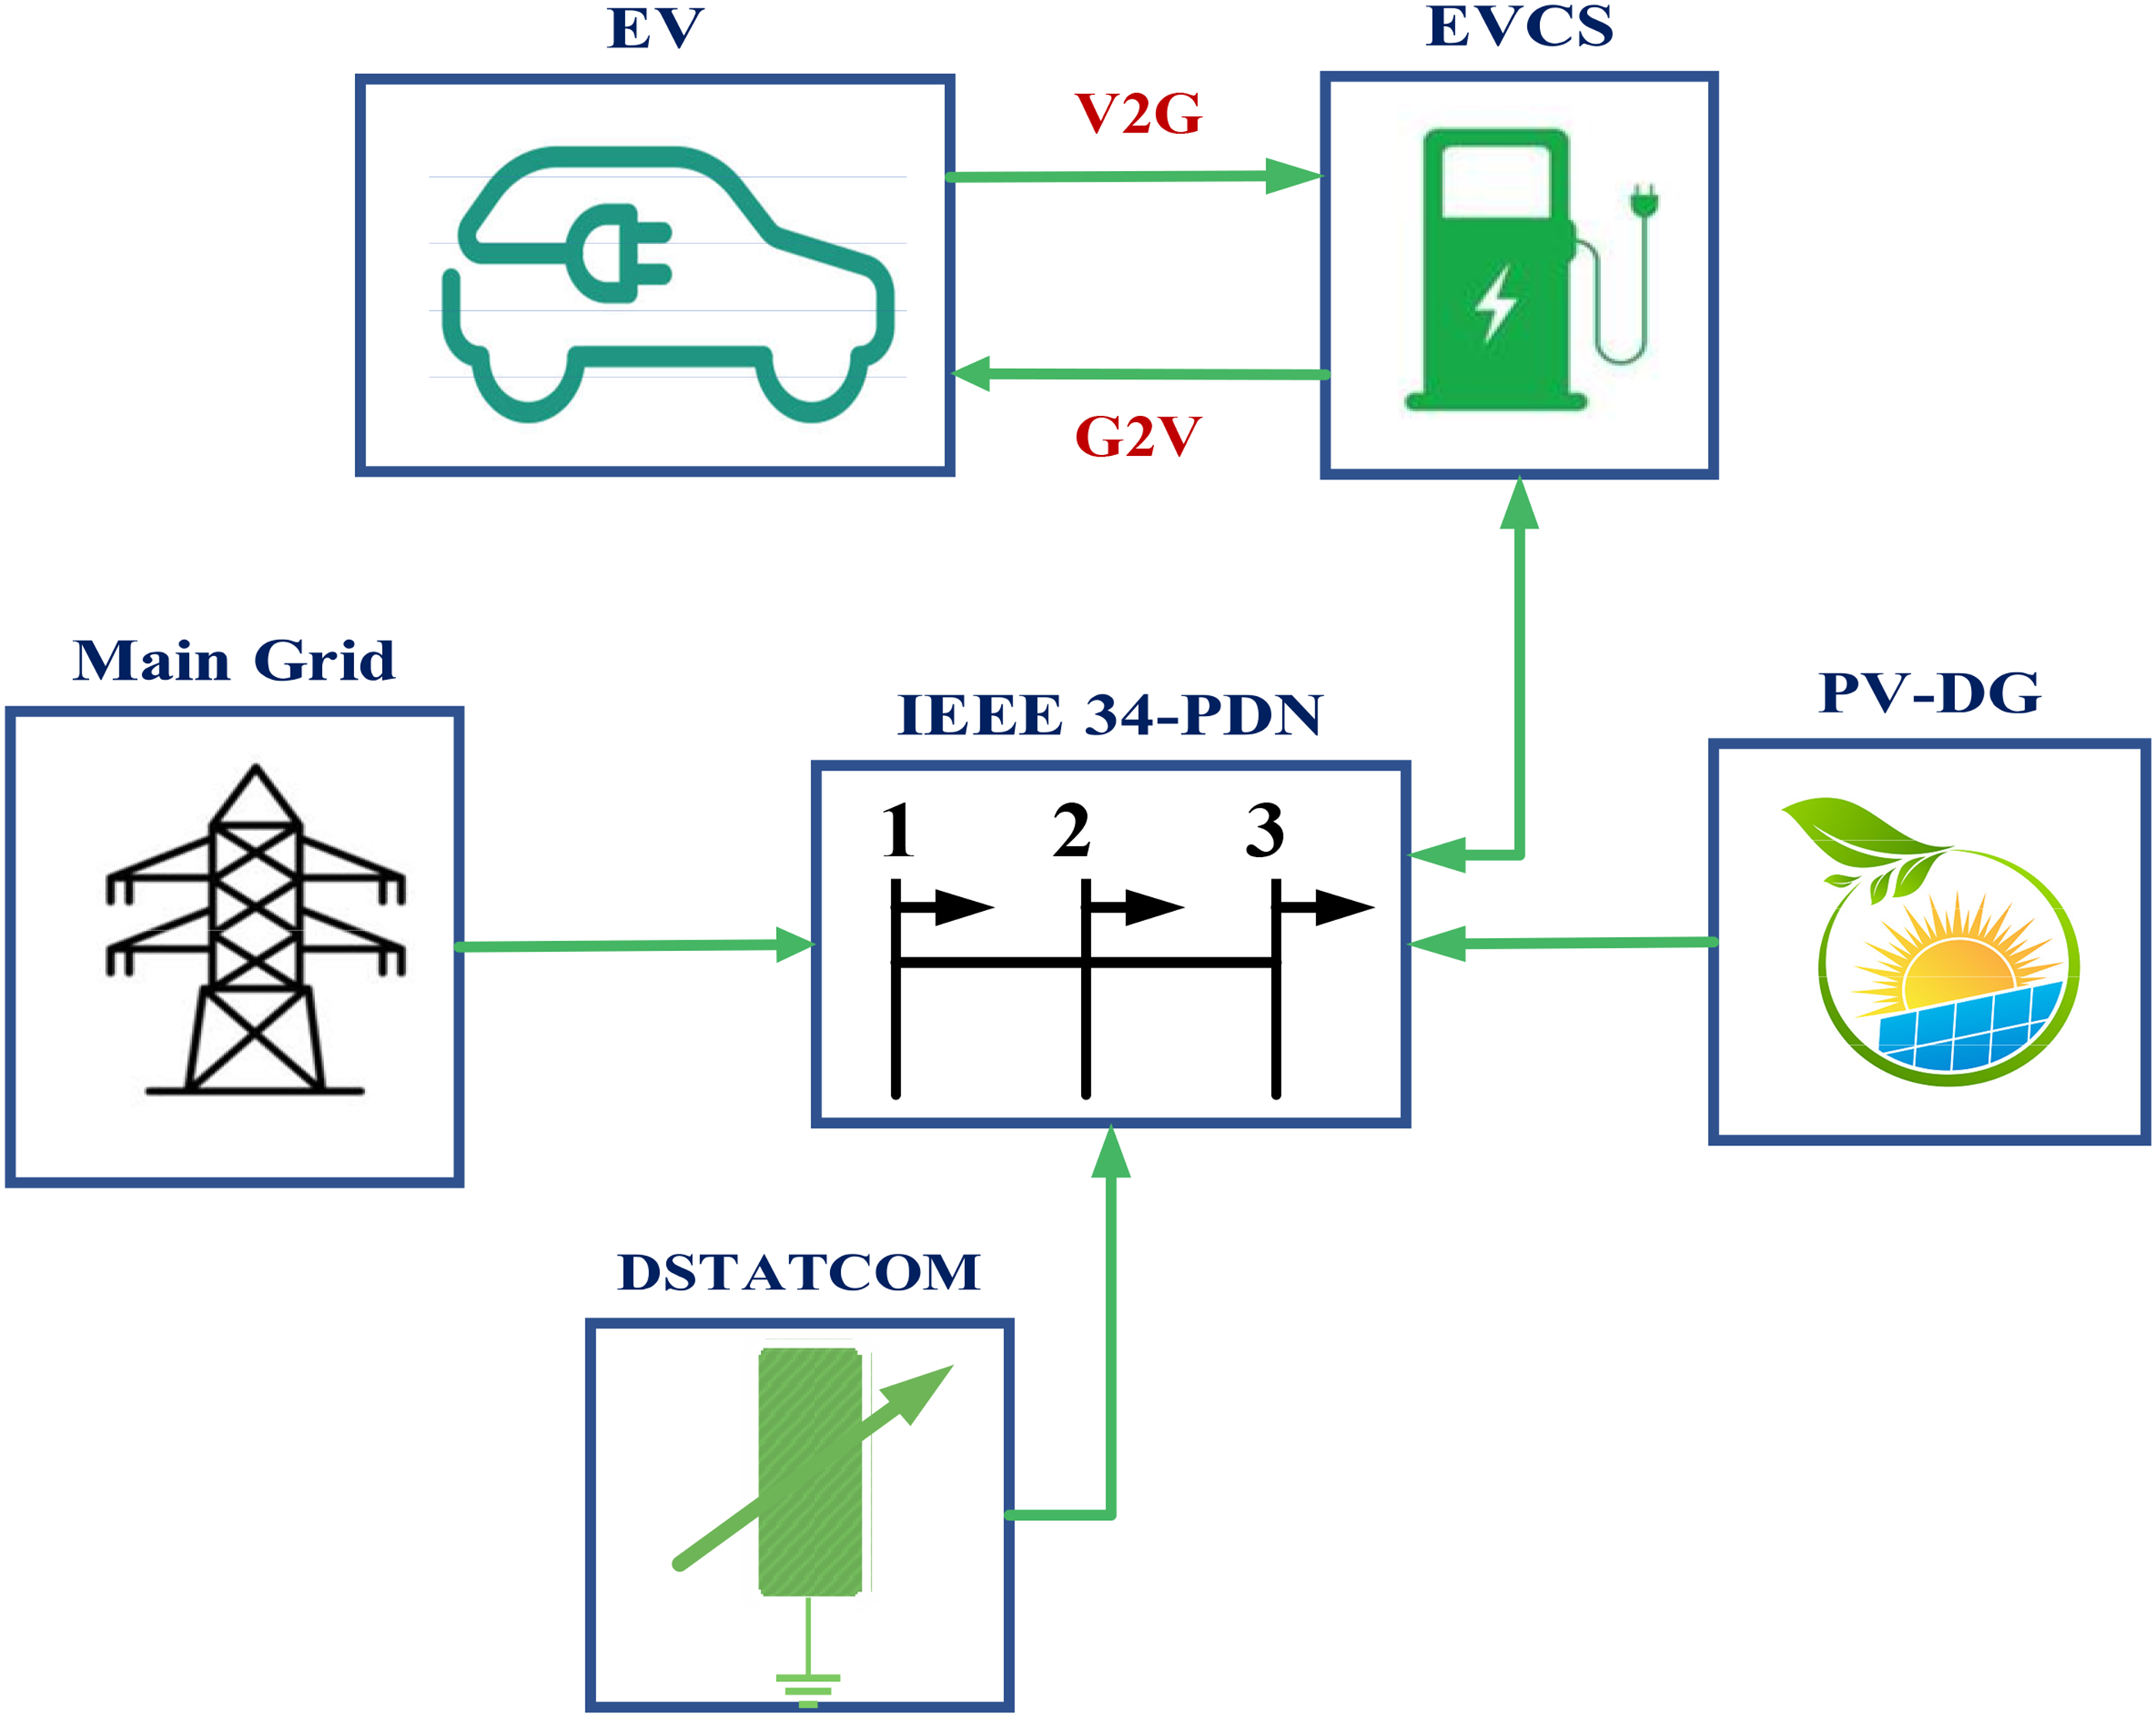
Proposed system layout. EV: electric vehicle; EVCS: EV charging station; PDN: power distribution network; PV-DG: photovoltaic-based distributed generators; DSTATCOM: distribution static compensators.
Mathematical modeling of power flow
Problem definition
Figure 2 depicts the simplified single-line representation of a PDN incorporating PV-DG, DSTATCOM, and EVCS operating in both G2 V and V2G modes. To perform steady-state load flow analysis efficiently in radial systems, the direct load flow (DLF) method, as reported in Teng (2003), has gained wide adoption due to its simplicity and computational effectiveness. In a PDN, the voltage at bus k + 1 can be expressed as:
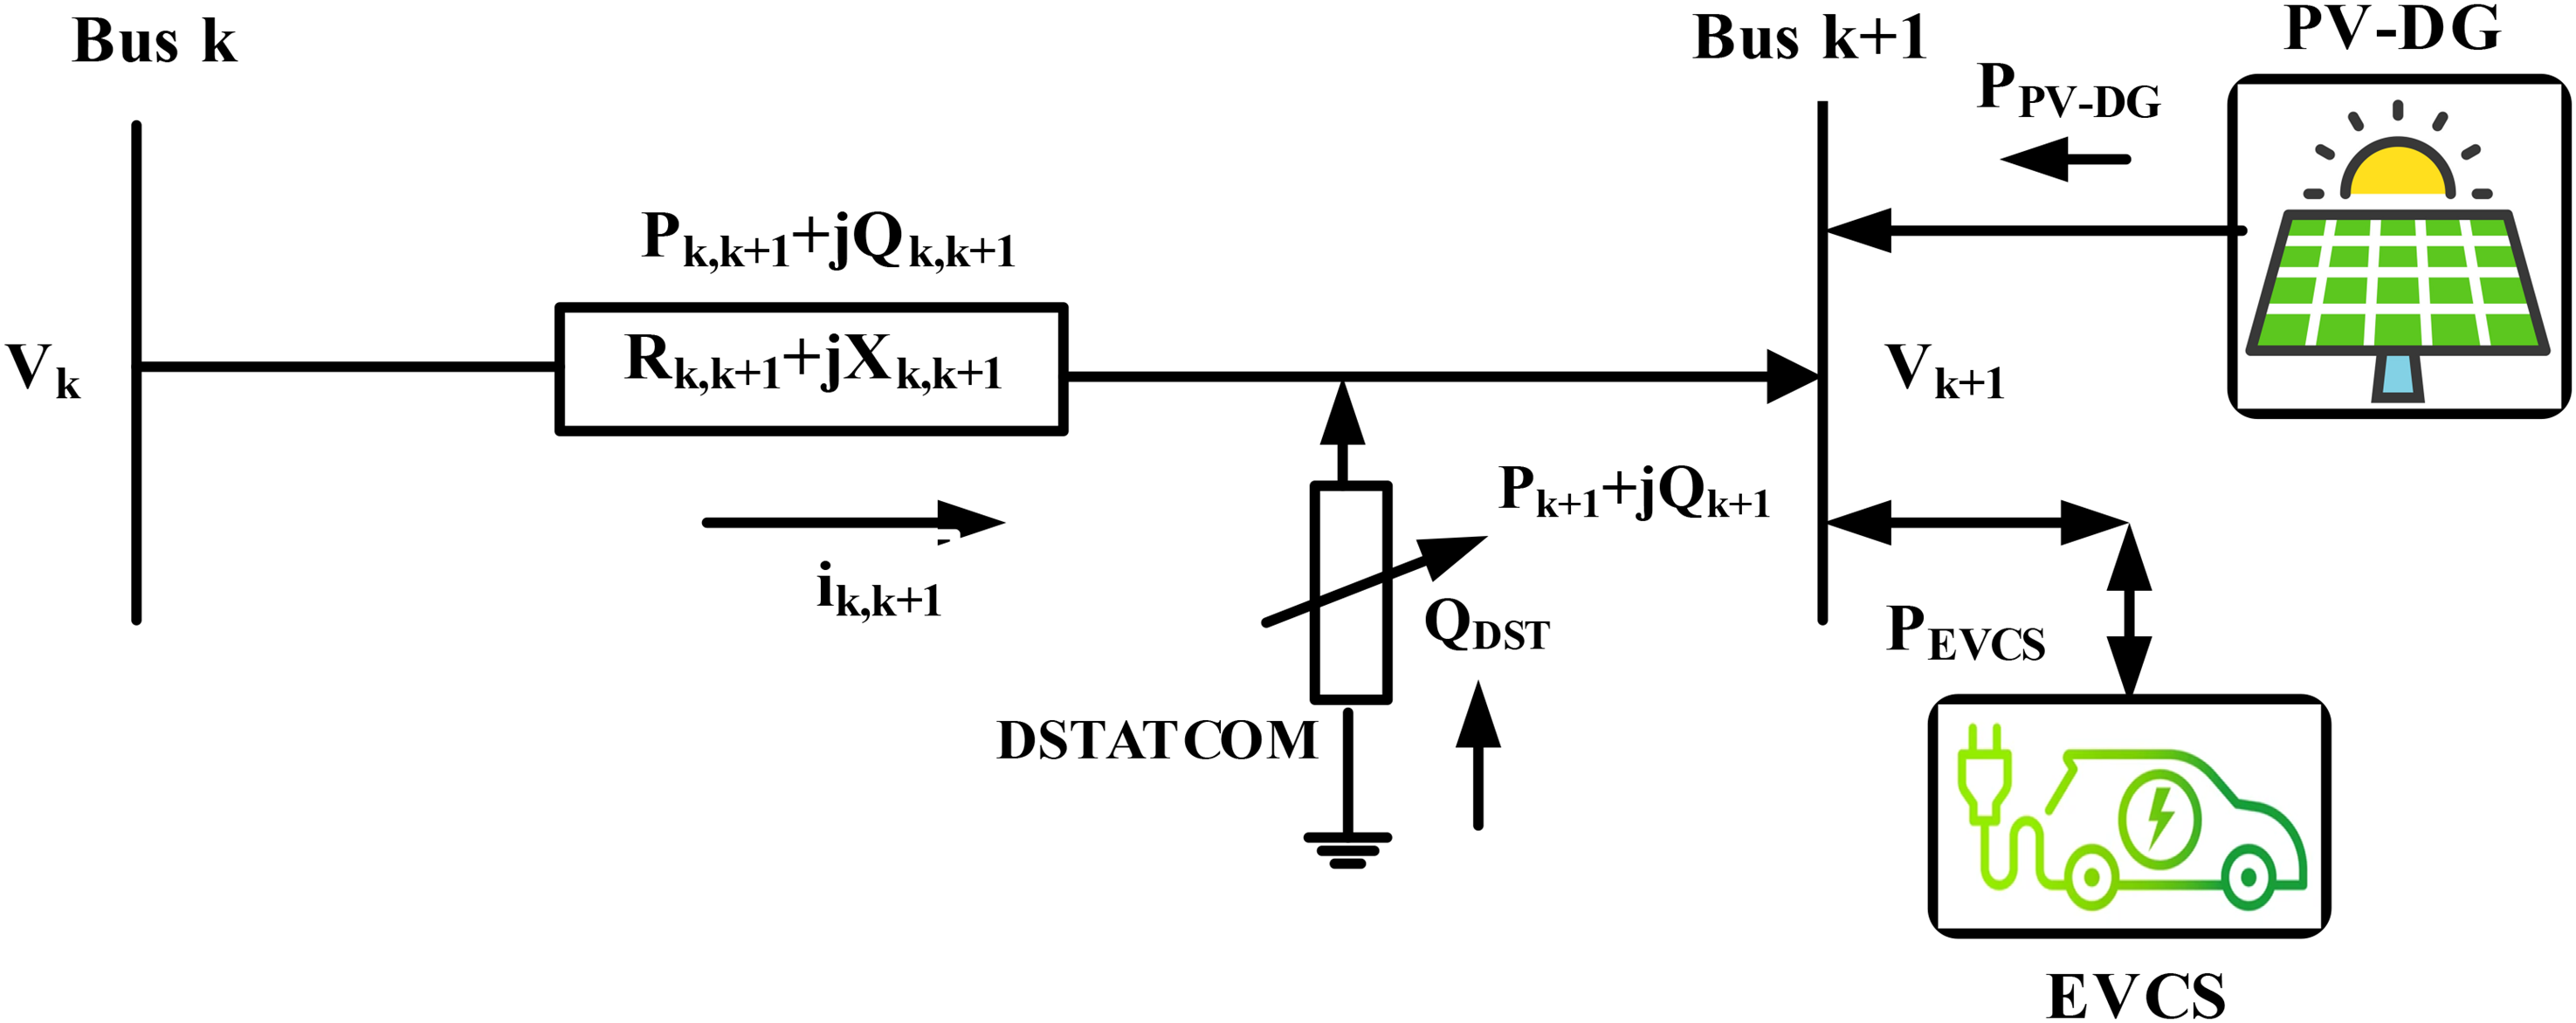
Sample PDN line diagram. EVCS: EV charging station; DSTATCOM: distribution static compensator; PV-DG: photovoltaic-based distributed generators; PDN: power distribution network.
In this model,
The branch currents in the PDN are computed using the bus injection to branch current matrix:
The current injected at bus k + 1, based on its load demand, is calculated as:
Formulation of real and reactive power losses
Power losses between two adjacent buses are derived using the well-known loss equations:

Total real and reactive power losses across the entire PDN are obtained by summing the losses over all lines:

To analyze system performance over time, cumulative losses for a 24-h period are calculated as:

Equations (1) to (9) are adopted from Djidimbélé et al. (2022), Teng (2003), and Yuvaraj et al. (2023a, 2023b).
Formulation of VDI
The VDI measures the extent to which the voltage at each bus differs from its designated reference or nominal level. It reflects the extent of voltage imbalance introduced due to DER and EVCS penetration (Rene et al., 2023).
The total VDI over a day is given by (Rene et al., 2023):
Formulation of VDI
The VSI evaluates the capability of a power system to sustain acceptable voltage levels when subjected to varying load conditions. A higher VSI indicates better voltage robustness.
The VSI between buses k and k + 1 is calculated using (Yuvaraj et al., 2024a, 2024b, 2024c, 2024d):
Here,
To calculate the total VSI values for each bus over 24 h, sum the VSI values at each bus across all hours (Yuvaraj et al., 2024a, 2024b, 2024c, 2024d):
This power flow model serves as a foundational step for evaluating the impact of integrating PV-DGs, DSTATCOMs, and EVCSs in PDNs, providing key performance metrics such as losses, voltage profile, and network stability. The metrics calculated here are used in the objective functions of the proposed optimization framework.
Cost modeling for PV-DGs, DSTATCOMs, and EVCSs
In the proposed framework, economic considerations are integrated alongside technical objectives such as power loss minimization and voltage profile enhancement. The cost component of the model accounts for the capital investment and operation and maintenance (O&M) expenses associated with each distributed resource type, namely PV-DGs, DSTATCOMs, and EVCSs. These cost models are formulated to reflect real-world economic constraints and can be incorporated into the multiobjective optimization process. The cost modeling equations for PV-DG, EVCS, DSTATCOM presented as equations (14) to (17), are adopted from Amin et al. (2022), Battapothula et al. (2019), and Sahay et al. (2025).
For PV-DGs, the total cost is modeled as the sum of capital and O&M expenses, expressed as:
where
For DSTATCOM installations, the cost is determined based on installed reactive power capacity, given by:
where
For EVCSs, the cost depends on the rated charging power and is given by: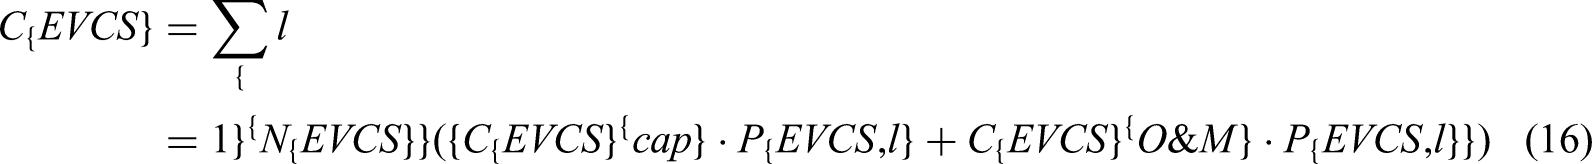
The combined cost over 24-h component to be used in the optimization process is then expressed as:
This aggregated cost term serves as one of the objective function parameters, enabling a balanced evaluation of both technical and economic performance in the proposed multiobjective optimization framework.
Modeling of devices
Accurate modeling of power system components is essential for optimizing energy flow, enhancing grid stability, and achieving sustainability targets. In this study, the focus is placed on simulating the behavior and integration of key DER, including PV-DGs, DSTATCOMs, and EVCSs operating in both G2 V and V2G modes. The proposed approach emphasizes optimal placement and operation of these assets within the PDN, addressing their unique operational characteristics and interactions. Through comprehensive modeling, the study aims to support efficient energy utilization, improve voltage stability, reduce power losses, and promote a resilient and environmentally friendly distribution system.
Model of PV-DG
The PV-DG provides real power generation that is influenced by solar radiation, temperature, and inverter efficiency. The output of PV-DG can be modeled as (Elkholy, 2025):
Model of DSTATCOM
The DSTATCOM is employed in the PDN to inject or absorb reactive power dynamically, thereby improving voltage regulation, reducing power losses, and enhancing power quality. Unlike passive devices like shunt capacitors, the DSTATCOM is a voltage source converter-based system capable of providing fast and controllable reactive power compensation.
The reactive power injected or absorbed by the DSTATCOM at bus k during time t is modeled as (Hosseini et al., 2007):
Modeling of EVCS
The EVCS operates in both G2 V and V2G modes. The power consumed by EVCS during G2 V mode is given by (Yadagiri et al., 2024):

The total power demand from EVCS considering both modes is (Yadagiri et al., 2024):
Formulation of the proposed MOF
To enhance the operational efficiency, voltage quality, and economic performance of the PDN, this study proposes a normalized MOF that simultaneously considers five critical performance indicators: total real power loss, total reactive power loss, VDI, VSI, and total installation and operation cost. The MOF incorporates this cost component alongside technical performance metrics, ensuring a balanced trade-off between operational performance and economic feasibility. To create a unified minimization framework, PL, QL, VDI, and cost are minimized while the VSI maximization objective is inverted. All objectives are normalized with respect to their baseline (preoptimization) values to ensure fair comparison and scaling. The MOF evaluates the improvement in system performance over a 24-h operational horizon and is formulated as follows: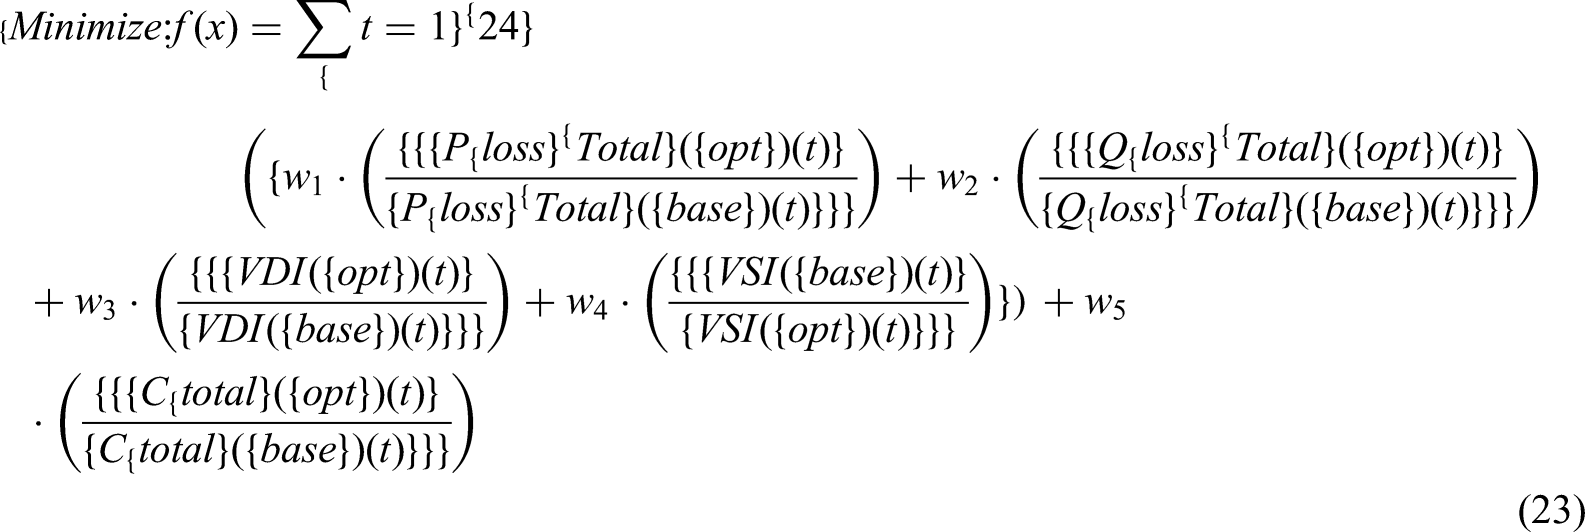
The weights
Normalization technique for the MOF
To combine the five distinct objectives (power losses, voltage deviation, stability, and cost) into a single MOF, a normalization technique is employed. This process is essential because the objectives have different units and scales, which would otherwise bias the optimization toward the objective with the largest numerical value. The normalization is performed by dividing each objective's postoptimization value by its corresponding baseline (preoptimization) value.
This approach scales all objectives to a dimensionless range, typically between 0 and 1, allowing them to be accurately weighted and summed in the MOF. This ensures that the algorithm finds a balanced trade-off among all competing objectives.
Definition of decision variables
The multiobjective optimization problem is formulated to determine the optimal placement and sizing of the PV-DGs, DSTATCOMs, and EVCSs. The decision variables (x) for the algorithm are defined as a vector that contains both discrete and continuous values, as follows: x = [LocPV, SizePV, LocDST, SizeDST, LocEVCS, SizeEVCS].
Locations (Loc): These are discrete variables that represent the bus numbers where the devices are to be installed. They are selected from the available buses in the distribution network. Sizing (Size): These are continuous variables that represent the rated capacity of each device. They are bounded by the feasible operational limits of the respective components (e.g., PV-DG capacity in kW, DSTATCOM capacity in kVAR, and EVCS capacity in kW).
These decision variables directly influence the system's performance metrics, including power losses, voltage profile, and total cost, thereby guiding the optimization process toward the optimal solution.
Solution technique using BWOA
Overview and rationale for using BWOA
The BWOA is a population-based metaheuristic, which is motivated by the special mating, cannibalism, and survival behavior of black widow spiders. Its operators—procreation (crossover), cannibalism (natural selection), and mutation—tend to make a firm balance between exploration (solution diversity maintenance) and exploitation (search intensification around promising areas; Hayyolalam & Kazem, 2020). This balance tends to make the BWOA highly efficient for solving complex, nonlinear, and constrained optimization problems.
In power system applications, particularly the optimal placement and sizing of DERs, EVCSs, and DSTATCOMs, BWOA has valuable benefits. Unlike traditional algorithms like GA or PSO, BWOA has faster convergence and eliminates premature stagnation through the promotion of diversity by selective survival and cannibalism. This guarantees strong performance in dealing with multiobjective situations, for instance, reducing the power loss, improving voltage stability, and minimizing emissions at the pinch. Another key advantage of BWOA is its adaptive nature, which allows it to capture dynamic variations in load demand and renewable energy generation. Recent studies have validated its superiority in achieving near-global optimal solutions with high computational efficiency, making it a reliable and powerful choice for addressing optimization challenges in distribution systems (Hayyolalam & Kazem, 2020; Hosseinalipour et al., 2021; Shehab et al., 2024).
Problem formulation and BWOA implementation
In the present work, BWOA is utilized to calculate the optimal location and dimension of PV-DGs, DSTATCOMs, and EVCSs in a PDN. Both G2 V and V2G operating modes of EVCSs are considered. The optimization objectives include:
Minimizing real and reactive power losses, Enhancing voltage profile and power factor, Improving voltage stability under DER and EVCS penetration, Minimizing total installation and operating costs, Ensuring compliance with system operational and technical constraints.
By leveraging population diversity and adaptive survival strategies, BWOA avoids premature convergence and provides robust near-global solutions. This gives it a performance advantage over conventional deterministic optimization approaches. The modeling and governing equations adopted in this section are based on Hayyolalam and Kazem (2020).
To ensure reproducibility and robustness, additional details of the simulation setup are provided:
BWOA parameters (population size, iterations, convergence tolerance) are explicitly defined. Data sources: DER models (PV-DG, WT, EVCS, and DSTATCOM) are taken from Suresh et al. (2025), Vutla and Chintham (2025), Babu et al. (2025), and Sakthivel and Gayathri (2025), while load profiles are adapted from standard IEEE test systems.
Assumptions:
EVCS operation follows realistic V2G/G2 V patterns. DERs operate within capacity ranges consistent with current technology. The substation maintains nominal reference voltage under normal conditions. Validation: The results were benchmarked against GA and PSO. Comparative results on power losses, voltage profiles, and resilience indices confirm the accuracy and effectiveness of the proposed BWOA-based approach.
BWO-based framework for the proposed work
The proposed BWOA framework systematically captures the spatiotemporal behavior of load variation, renewable generation, and EV charging profiles. The algorithm proceeds as follows and illustrated in the algorithm flowchart (Figure 3):
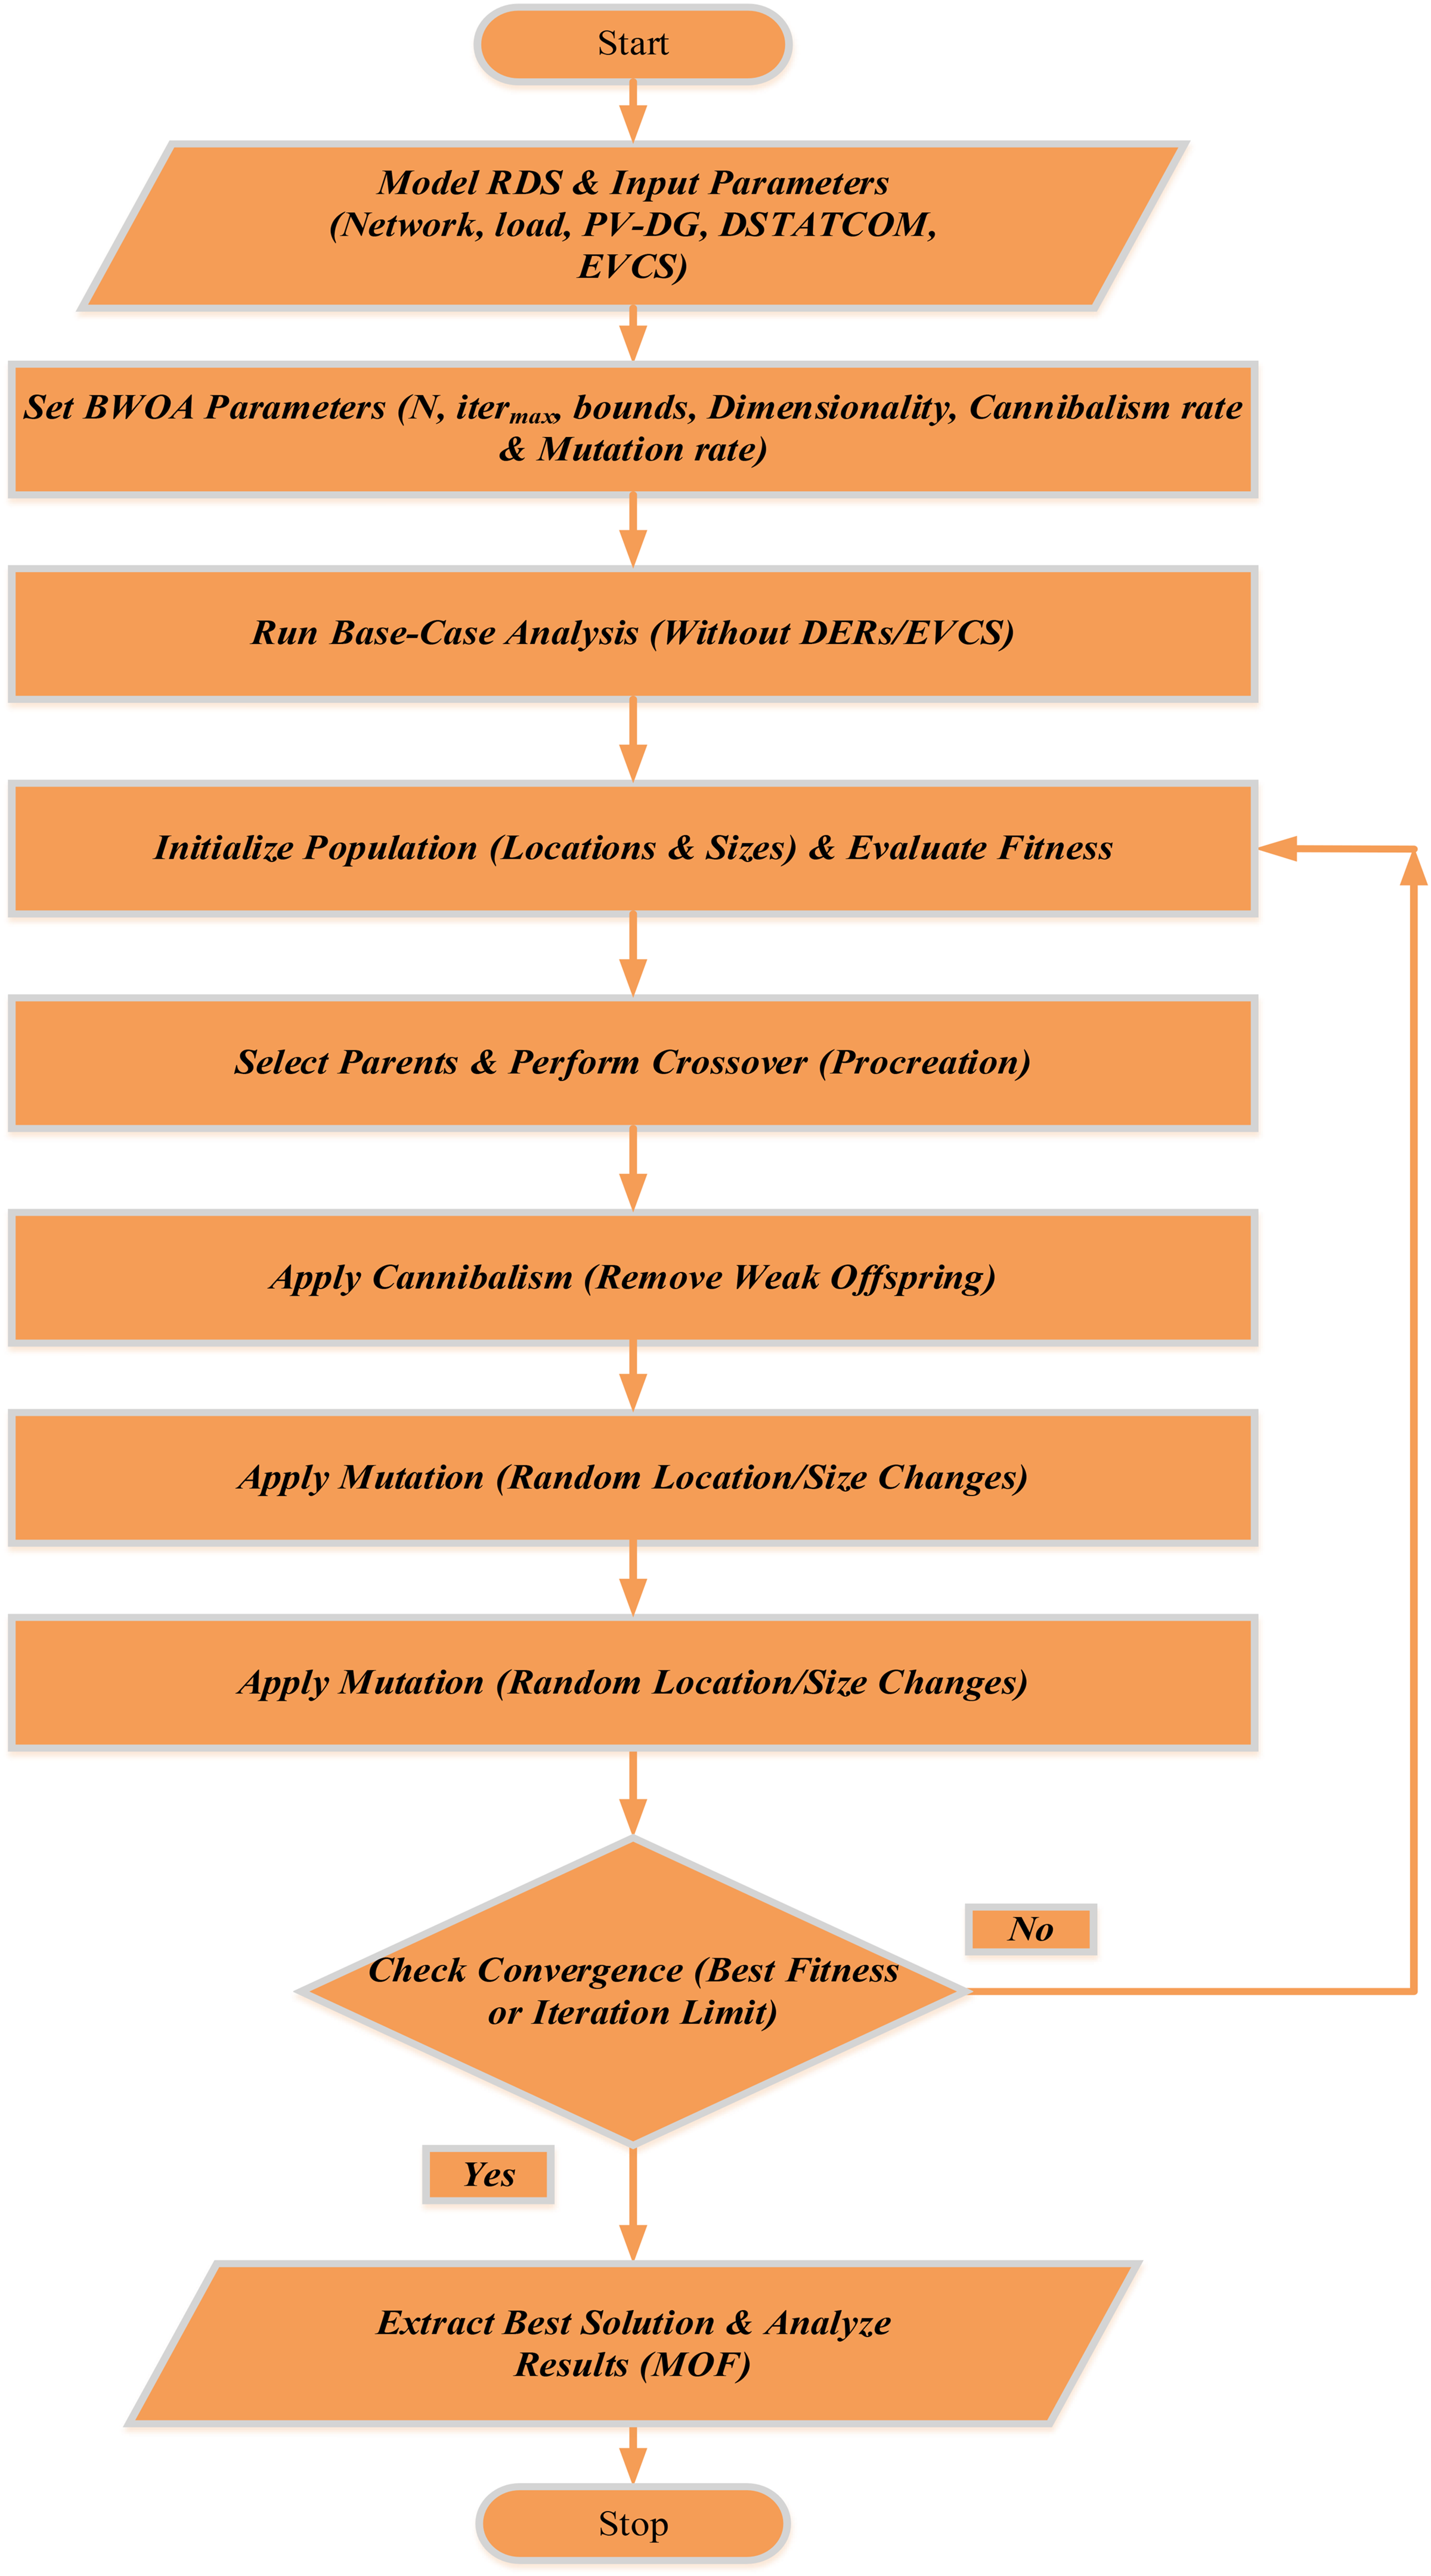
Flowchart BWOA for allocation of DER and EVCS. BWOA: Black Widow Optimization Algorithm; DSTATCOM: distribution static compensator; PV-DG: photovoltaic-based distributed generators; EVCS: EV charging station; DER: distributed energy resources; MOF: multiobjective function.
Step 1: System Modeling and Initialization
Input data:
Distribution network: line impedances, bus connectivity, load distribution. Load profile: 24-h demand curves reflecting consumer behavior. Renewable generation: PV generation derived from irradiance and temperature data. EVCS operation: stochastic G2 V and V2G charging/discharging patterns. Cost parameters: capital, O&M, penalty costs.
BWOA parameters:
Population size: N = 40 Maximum iterations: itermax = 100 Dimensionality: equal to number of decision variables (locations and sizes of PV-DGs, DSTATCOMs, and EVCSs). Crossover rate = 0.8 Cannibalism rate (γ) = 0.4 Mutation rate (μ) = 0.1
Step 2: Population encoding
Discrete variables: bus locations of PV-DGs, DSTATCOMs, and EVCSs.
Continuous variables: Sizing of PV-DGs (kW), DSTATCOMs (kVAR), and EVCSs (kW).

Step 3: Fitness evaluation
Each solution is evaluated using the multiobjective fitness function (Equation (23)), integrating:
Normalized real and reactive power losses, VDI, VSI, Total cost (installation + O&M).
Step 4: Selection mechanism
Top-performing individuals are selected using a rank-based mechanism that balances elitism and diversity.
Step 5: Procreation and cannibalism
Procreation (Crossover): Offspring generated by exchanging attributes between selected parents. Cannibalism: Weak and redundant individuals are eliminated, improving population quality.
Step 6: Mutation
Controlled random changes are applied to:
Reallocate DER/EVCS units to alternative buses, Fine-tune device sizes for local refinement. This prevents stagnation in local optima.
Step 7: Population update
The new population is constructed as:
This ensures that high-performing individuals are retained while allowing innovative combinations to evolve.
Step 8: Convergence check
Convergence is assessed by:
Monitoring the best fitness value for stagnation, Checking if maximum iterations are reached.
If convergence criteria are met, the algorithm terminates; otherwise, it returns to Step 3.
Step 9: Final solution and output analysis
The optimal configuration includes:
Bus locations of PV-DGs, DSTATCOMs, and EVCSs, Optimal sizing of each device, Improvements in system power loss, voltage profile, and stability, Economic feasibility through reduced total cost.
Step 10: Termination
The algorithm terminates when the stopping criterion is satisfied. The final output reports the best solution, reflecting:
Technical benefits: Reduced losses, improved voltage stability, higher power factor. Operational benefits: Efficient DER utilization and EVCS scheduling. Economic benefits: reduced installation and operating costs.
This confirms the overall effectiveness of the BWOA-based optimization framework for modern distribution networks.
Simulation results and discussion
System description
The BWOA is employed to determine the optimal locations and capacities of PV-DGs, DSTATCOMs, and EVCSs within an IEEE 34-bus PDN. To facilitate the evaluation process, a tailored power flow analysis tool based on the DLF method is developed using MATLAB. This tool enables precise assessment of real and reactive power losses, VSIs at individual buses, and the overall performance of the distribution system under dynamic loading scenarios. The effectiveness of the proposed BWOA-based optimization is tested on a practical 11 kV radial IEEE 34-bus system, as depicted in Figure 4 (Montoya et al., 2021). In this configuration, power is fed from the main substation located at bus 1. This benchmark distribution network is widely recognized in research for evaluating distributed energy integration strategies, making it suitable for investigating improvements in loss minimization, voltage stability, and reactive power management through strategic placement and sizing of DER components.
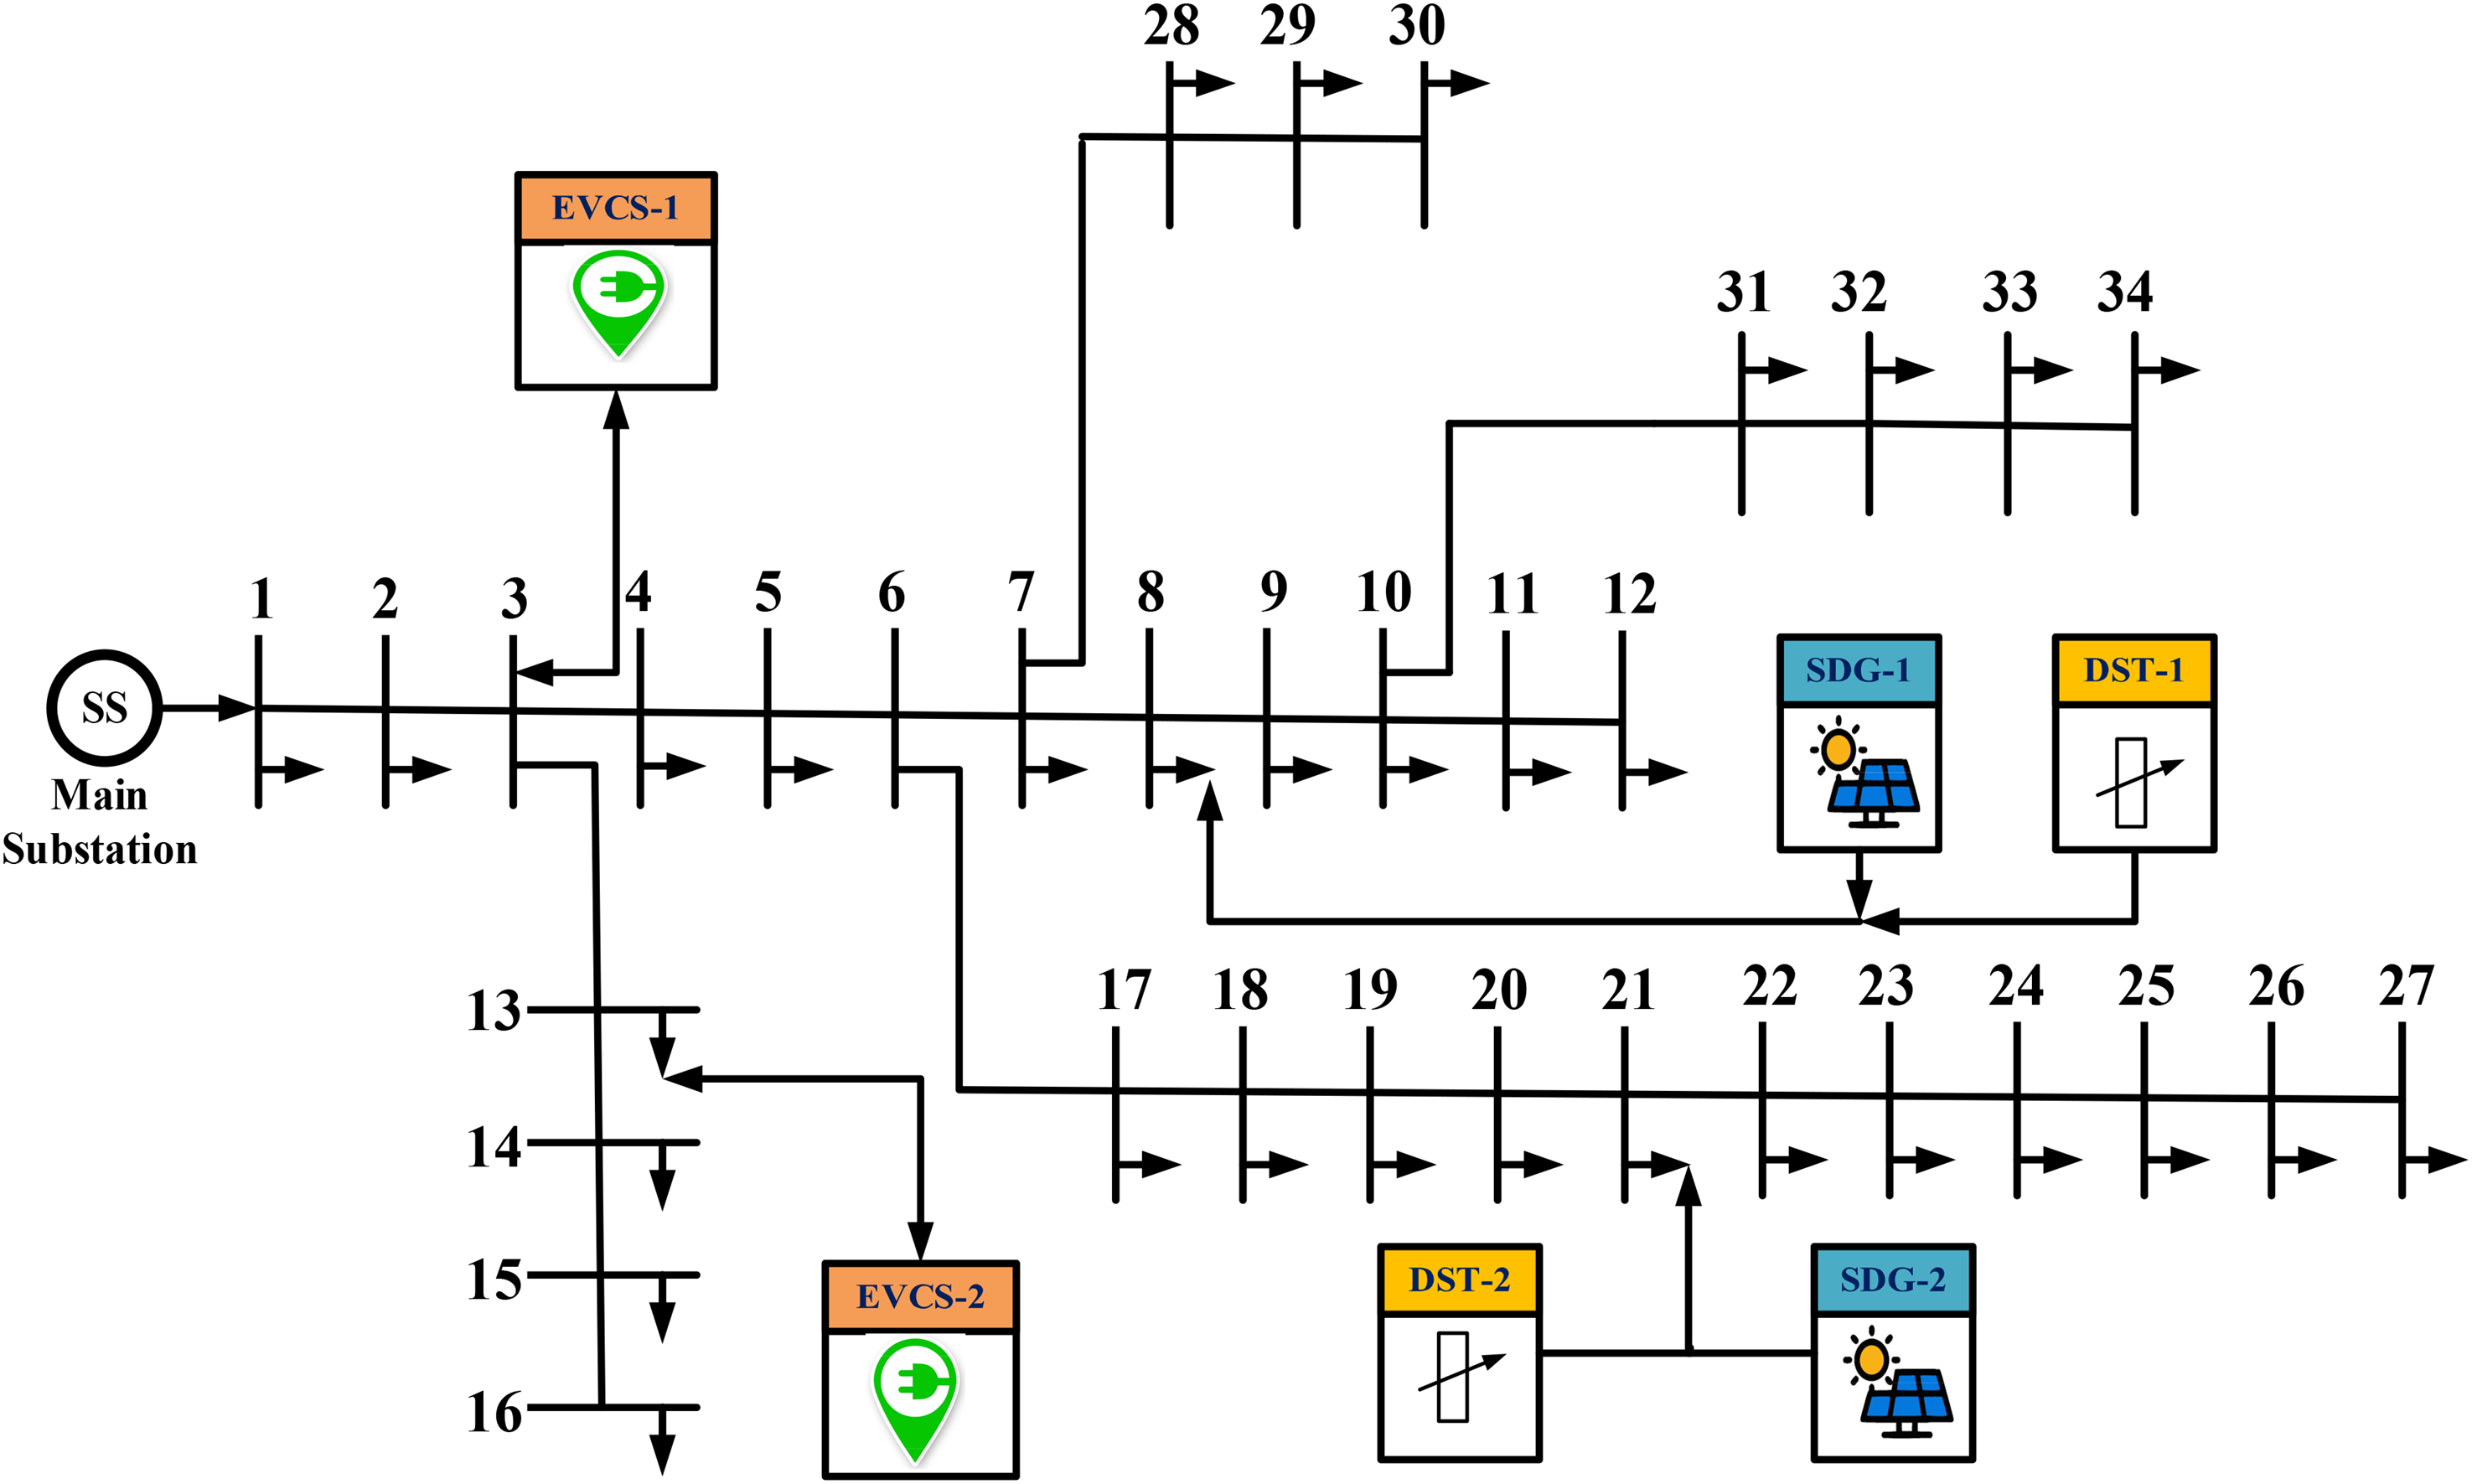
IEEE 34-Bus PDN with PV-DG, DSTATCOM, and EVCS placement. EVCS: EV charging station; PDN: power distribution network; PV-DG: photovoltaic-based distributed generators; DSTATCOM: distribution static compensators; SDG: solar based distributed generation; DST: DSTATCOM.
Figure 4 is a diagrammatic representation of the IEEE 34-bus PDN, highlighting the most suitable locations of PV-DGs, DSTATCOMs, and EVCSs determined by the BWOA and SMA optimization methods. The careful placement of these devices is crucial in terms of improving system reliability, maximizing power flow, and effecting good voltage regulation. Based on BWOA optimization, PV-DGs are placed at bus 8, DSTATCOMs at bus 21, and EVCSs at buses 3 and 13. On the other hand, SMA identifies bus 14 for placing PV-DG and bus 26 for installing DSTATCOM, while the positions of EVCS are the same in both methods.
These variations in component siting notably influence critical network performance metrics, including the extent of power loss mitigation, voltage profile improvement, and reactive power support. The optimized deployment of PV-DGs promotes decentralized energy generation, significantly reducing dependence on the main feeder and minimizing transmission losses. Simultaneously, DSTATCOMs inject reactive power locally, thereby improving voltage stability and power factor throughout the PDN. Strategically sited EVCSs help balance the vehicle charging load, preventing excessive voltage drops and avoiding congestion, especially under high EV penetration scenarios. The total system demand in the IEEE 34-bus PDN is approximately 4636.5 kW of active power and 2873.5 kVAr of reactive power under steady-state load conditions, as referenced in Montoya et al. (2021). These load characteristics reflect realistic operational conditions, providing a reliable benchmark for assessing the efficiency and performance of the proposed optimization methodologies.
Figure 5 illustrates the 24-h variation of real and reactive power requirements for the IEEE 34-bus distribution network. The active power demand (kW) shows considerable fluctuations throughout the day, reaching a maximum near 5000 kW and dropping to a minimum of approximately 1500 kW. The reactive power demand (kVAr) exhibits a similar trend, although its values are comparatively lower, consistent with the typical power factor behavior of the loads. Both profiles align with daily human activity patterns: demand rises sharply during morning hours (e.g., 7–9 a.m.), stabilizes midday, and peaks again in the evening (e.g., 6–8 p.m.) due to increased residential and commercial consumption. The trough observed overnight (12–5 a.m.) corresponds to reduced industrial and residential load activity. The load factor (Montoya et al., 2021), which compares average demand to peak demand, is implied to be moderate, as the demand fluctuates distinctly between peak and off-peak periods. This variability highlights the importance of dynamic grid management to balance supply and reactive power compensation, ensuring voltage stability in the PDN.
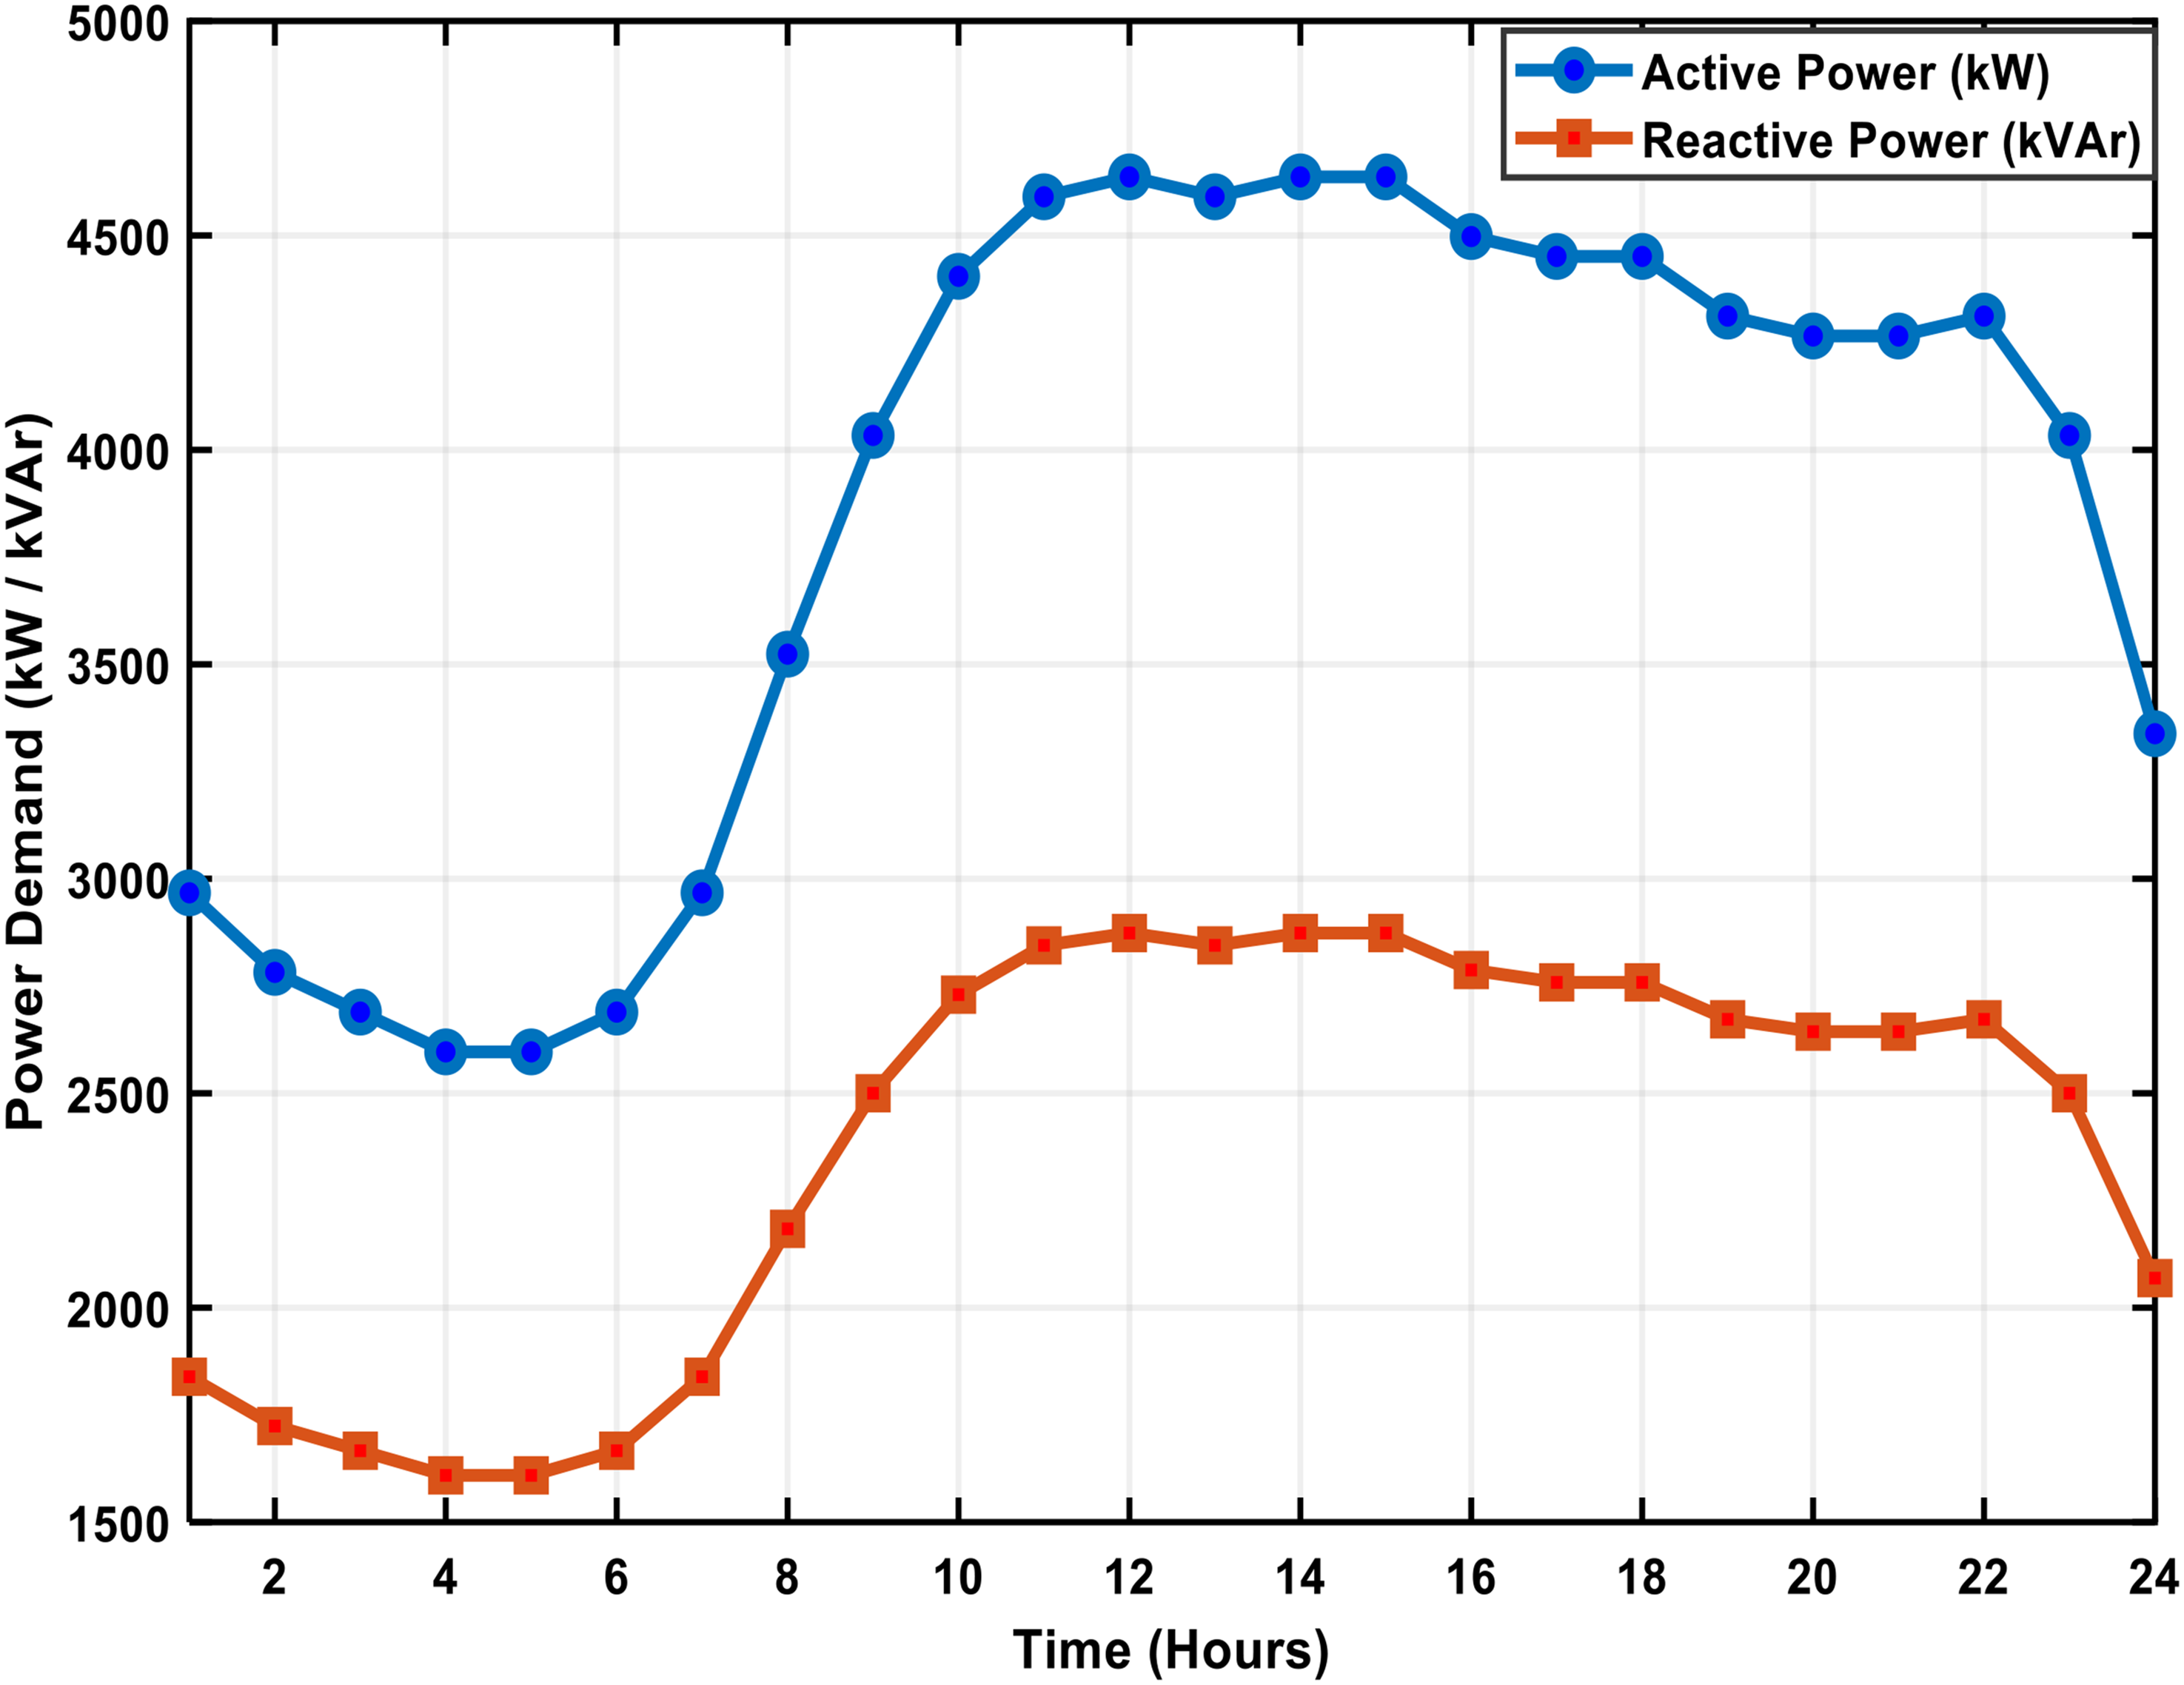
IEEE 34-bus PDN hourly real and reactive power demand. PDN: power distribution network.
Analysis power generation performance: numerical insights and implications
The PV-DGs and DSTATCOMs’ optimal location and size play a crucial role in maximizing the operational efficiency of PDNs, particularly in countering the adverse effects brought by EVCSs. The following section provides an exhaustive analysis of the optimized power generation and compensation characteristics of PV-DGs, DSTATCOMs, and EVCSs on different buses of the IEEE 34-bus PDN. The configurations are obtained through the use of the BWOA and SMA optimization algorithms. The major goal of this optimization is to maximize real and reactive power support, reduce power losses, and improve voltage stability, thus enabling a robust and efficient PDN.
Optimal PV-DG power generation
The BWOA algorithm places PV-DGs at bus 8 and DSTATCOMs at bus 21, and the SMA method places PV-DGs at bus 14 and DSTATCOMs at bus 26. The locations are selected to reduce the MOF, which encompasses real and reactive power loss, voltage deviation, and system performance. The hourly operating profiles of the PV-DGs and DSTATCOMs are decided considering patterns of solar irradiance and dynamic variations in load factor in order to facilitate efficient and reliable operation of the grid.
Table 2 offers an in-depth hourly power generation profile of PV-DGs optimized with BWOA and SMA. Optimal placement of PV-DGs considerably improves the PDN's capability for supporting EVCS operations, reducing power losses, and enhancing voltage profiles. The BWOA algorithm outperforms SMA in all instances, generating higher power across all periods of time. Maximum generation is experienced in the hours 9–15, corresponding to peak solar irradiance and maximum EV charging demand. At time hour 12, PV-DG at bus 8 (BWOA) produces 1500 kW, a 1300 kW output for bus 14 (SMA), a 13.3% increase. Likewise, at bus 21, BWOA produces 1400 kW, outpacing SMA at bus 26 (1000 kW). These figures demonstrate BWOA's enhanced ability to maximize PV-DG power generation, contributing to increased grid stability and decreased use of traditional energy sources. The increased PV-DG power under BWOA is also essential in counteracting the effect of EVCS integration on the PDN. Through the provision of localized power supply, BWOA eliminates the need for the grid, reduces transmission losses, and also prevents voltage fluctuations due to EV charging loads. The optimal placement of PV-DGs prevents excessive power draw from the main grid, ensuring smoother energy distribution and improved power quality.
Optimal power generation of PV-DGs at each hour using BWOA and SMA.
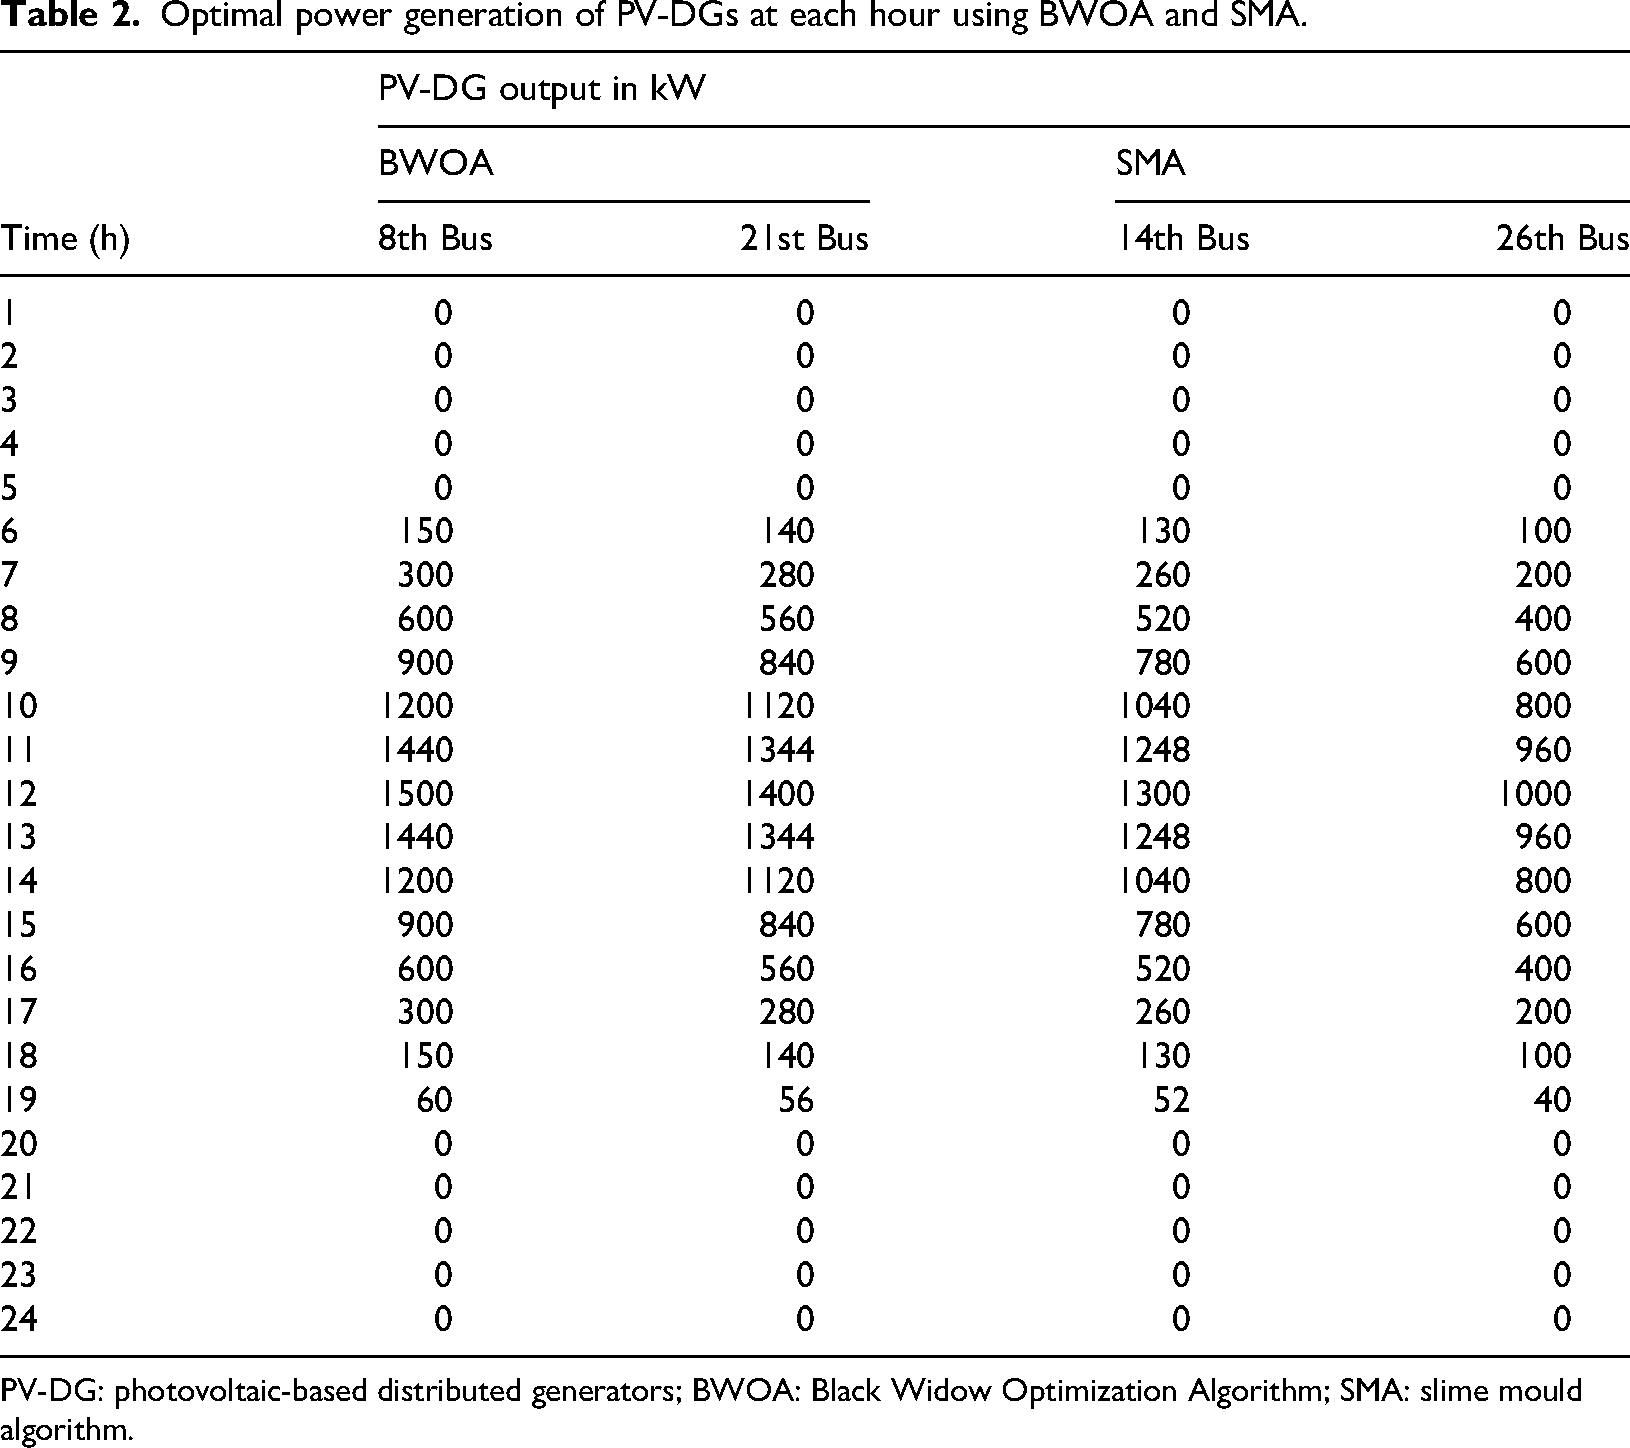
PV-DG: photovoltaic-based distributed generators; BWOA: Black Widow Optimization Algorithm; SMA: slime mould algorithm.
Figure 6 illustrates the hourly PV-DG power generation trends at the buses identified, which again proves that BWOA-based PV-DGs provide better power outputs during the course of a day. Figure 6 evidently indicates that BWOA provides quicker and more efficient power generation, particularly during peak demand hours, and thus is a more dependable and grid-friendly optimization technique for the integration of renewable energies in PDNs. The improved generation performance of BWOA-based PV-DGs results in improved power availability to EVCS loads, allowing for efficient and uninterrupted EV charging while improving overall PDN stability. By successful integration of optimized PV-DGs, BWOA is a better option for renewable energy-based power distribution since it provides better energy management, improved grid stability, and minimized reliance on central power generation. These benefits highlight the significance of smart PV-DG installation and sizing, especially for today's power grids with high penetration of EVCSs and variable renewable energy sources.
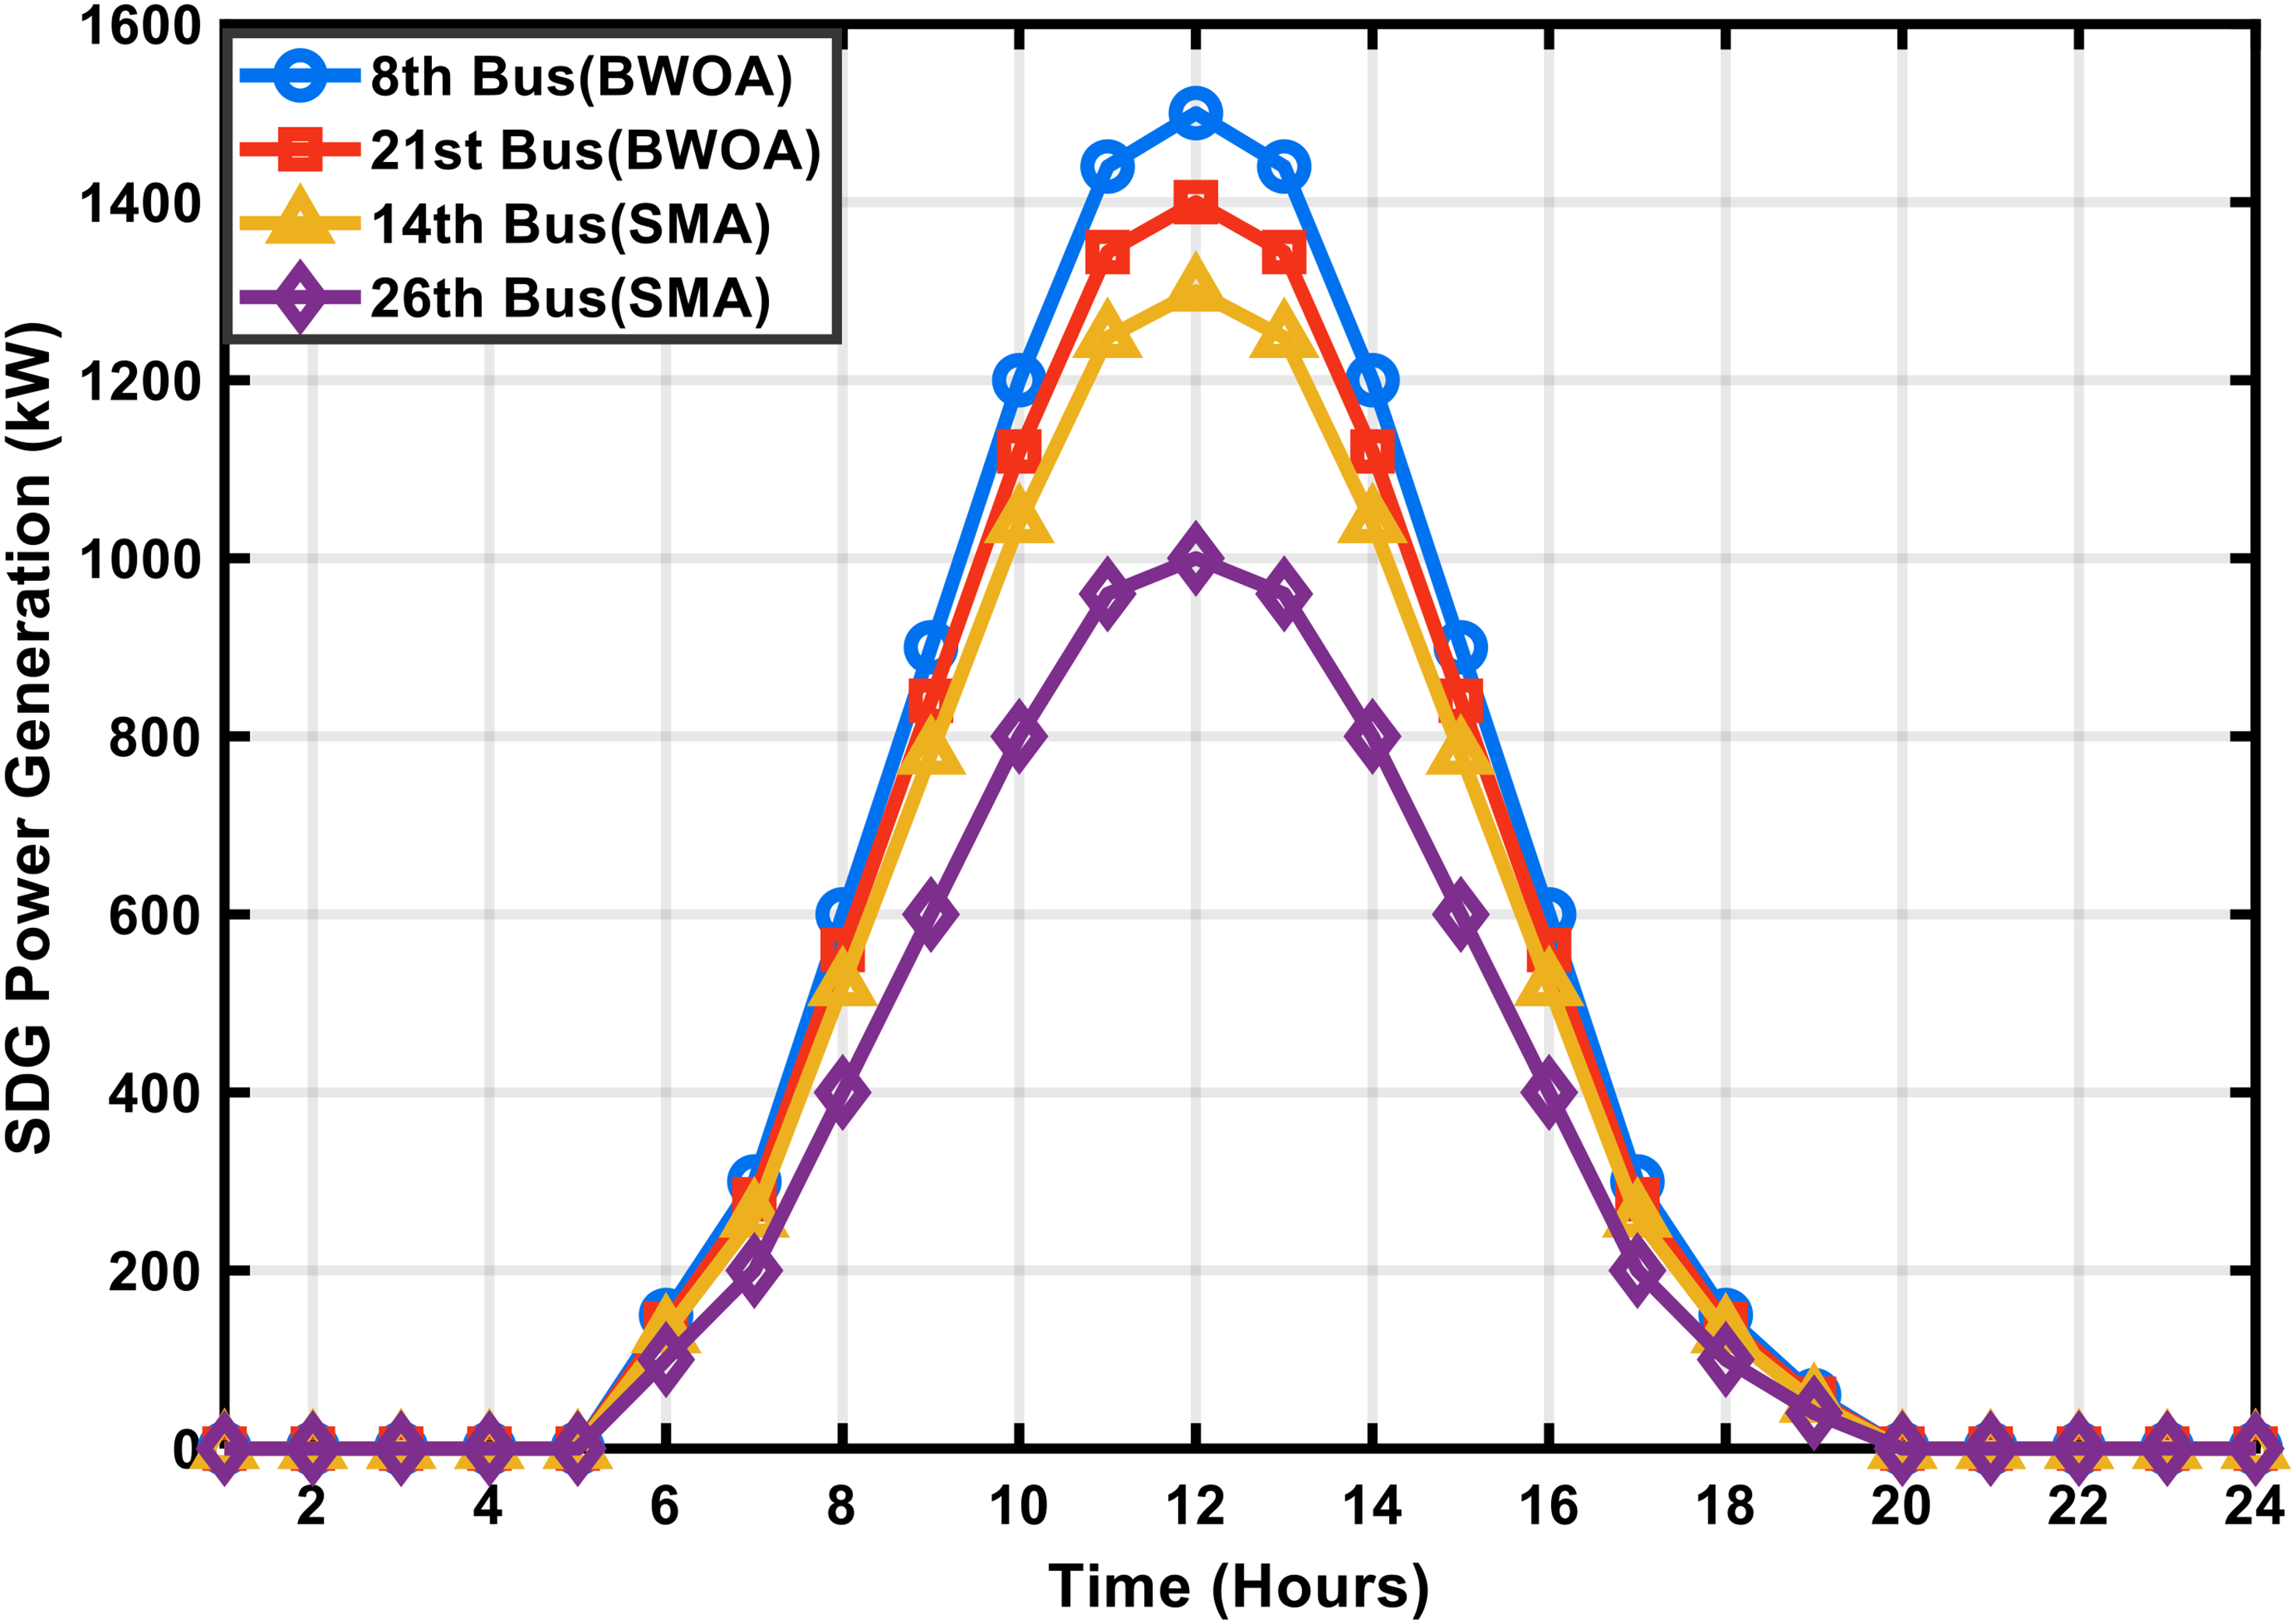
The PV-DGs optimal power generation various buses at each hour. PV-DG: photovoltaic-based distributed generators; BWOA: Black Widow Optimization Algorithm; SMA: slime mould algorithm; SDG: solar based distributed generation.
Optimal DSTATCOM power generation
DSTATCOMs play a critical role in ensuring reactive power balance and voltage stability in PDNs. Increased penetration of EVCSs increases the demand for reactive power, resulting in voltage variations and power factor degradation. To mitigate these issues, DSTATCOMs are strategically installed in the system to supply reactive power (kVAr) that helps improve voltage regulation, minimize power loss, and optimize system efficiency. The BWOA algorithm locates DSTATCOMs at buses 8 and 21, whereas the SMA algorithm recommends buses 14 and 26 as the best locations.
Table 3 presents the hourly reactive power generation profiles of DSTATCOMs optimized using BWOA and SMA for the IEEE 34-bus PDN. The primary role of DSTATCOMs is to compensate for reactive power deficits, thereby improving voltage stability and reducing transmission losses. The optimal placement ensures that EVCS operations do not impose excessive reactive power burdens, which could otherwise lead to voltage sags and system inefficiencies. The comparison between BWOA and SMA highlights that BWOA-based DSTATCOMs provide consistently higher reactive power injection throughout the day, particularly during peak EVCS charging hours. During peak load conditions at hour 12, the DSTATCOM at bus 21 (BWOA) supplies 1300 kVAr, whereas the SMA-based DSTATCOM at bus 26 delivers 1200 kVAr, showing an 8.3% improvement in voltage support under BWOA. Similarly, at bus 8, BWOA-based DSTATCOMs inject 970 kVAr at hour 16, while SMA-based DSTATCOMs at bus 14 generate only 679 kVAr, demonstrating a 42.8% increase in reactive power compensation under BWOA. The higher reactive power output under BWOA plays a crucial role in mitigating voltage deviations and minimizing network power losses, ensuring stable and efficient EVCS operations without straining the PDN.
Optimal power generation of DSTATCOMs at each hour using BWOA and SMA.
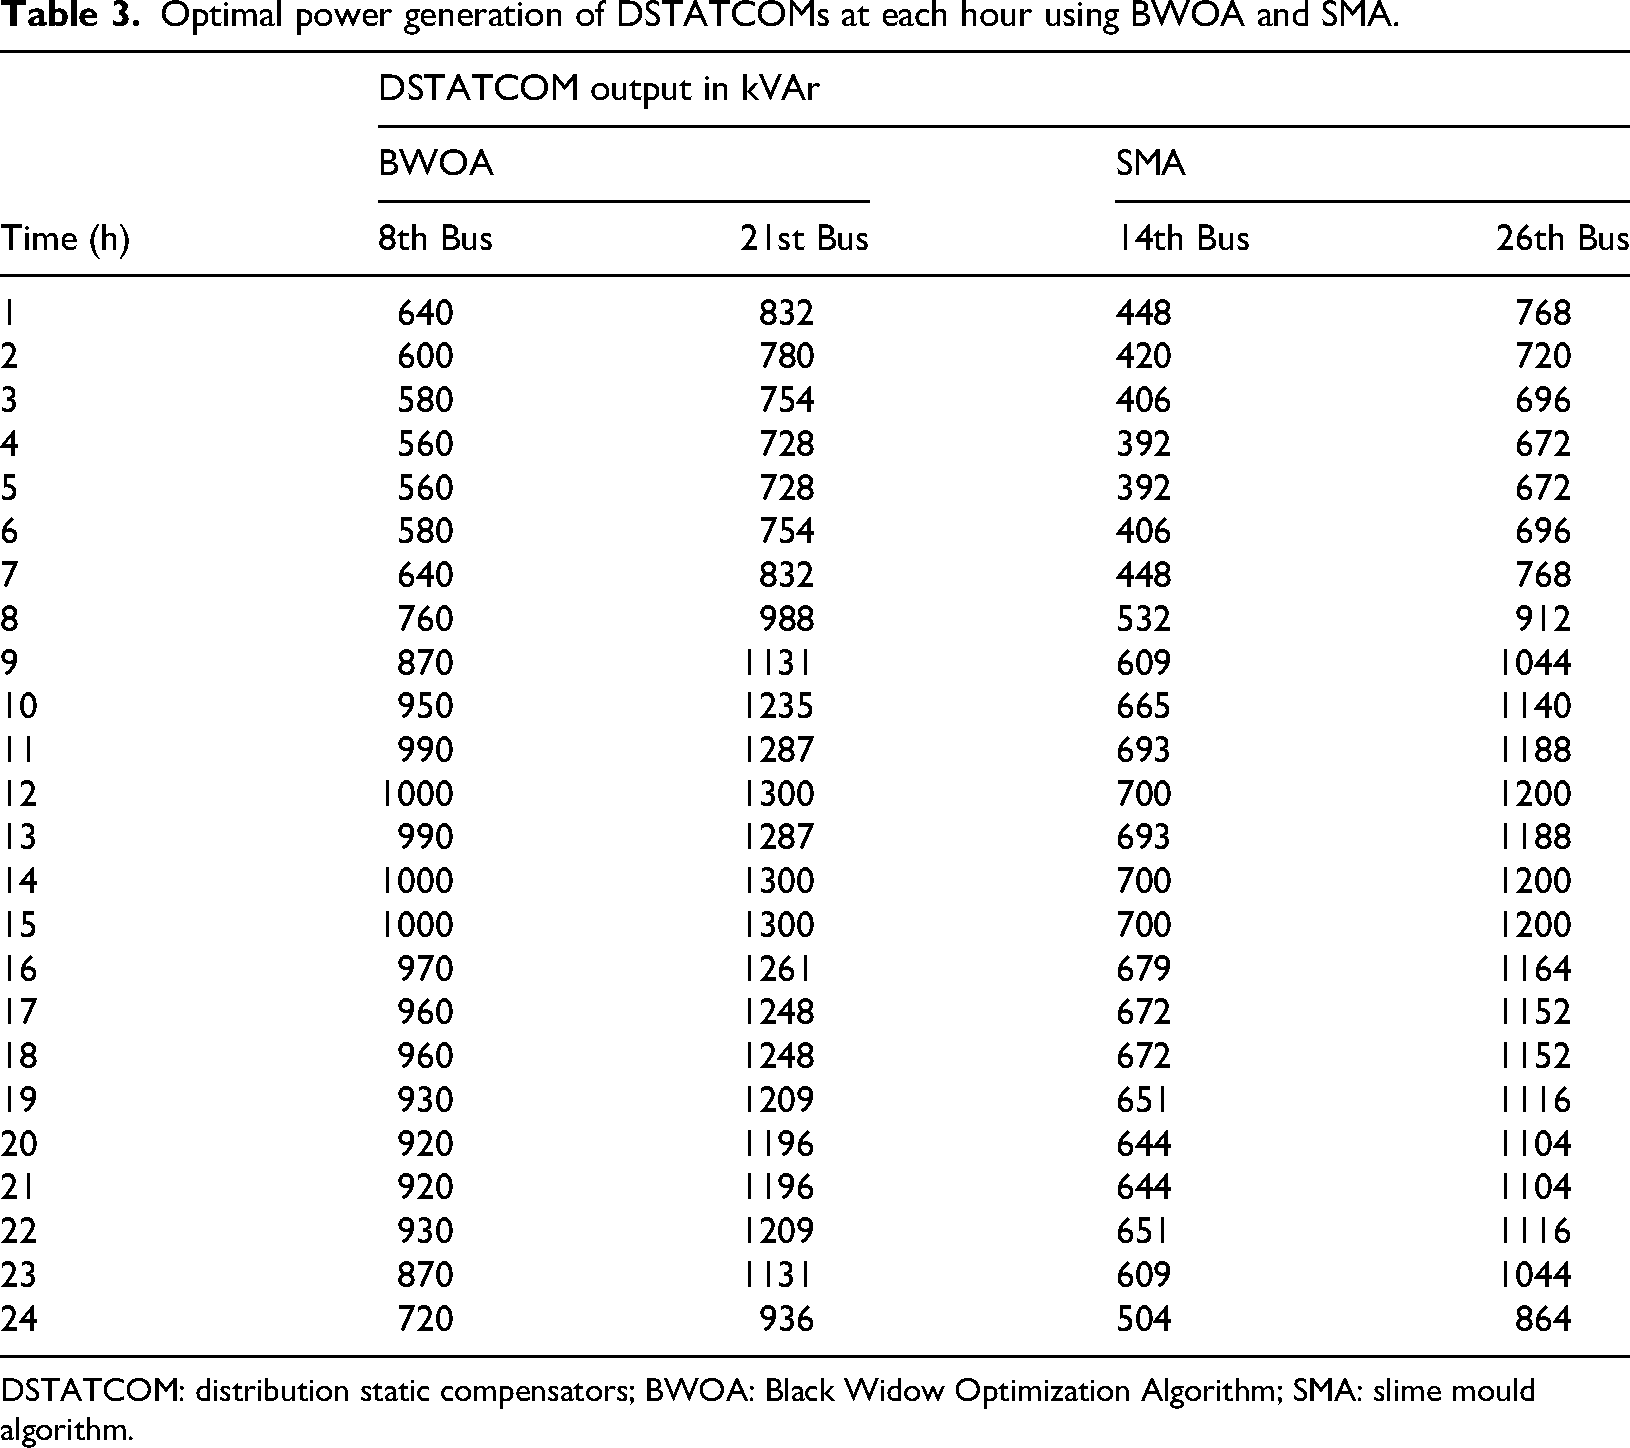
DSTATCOM: distribution static compensators; BWOA: Black Widow Optimization Algorithm; SMA: slime mould algorithm.
Figure 7 illustrates the hourly reactive power contributions of DSTATCOMs optimized using BWOA and SMA, visually representing their role in voltage stabilization and power factor correction in the presence of EVCS loads. The Figure 7 confirms that BWOA consistently delivers higher reactive power than SMA, particularly during high-demand periods when EVCSs require additional voltage support. The adaptive tendency of BWOA-optimized DSTATCOM power injection provides a more responsive solution to variations in the load, thus enhancing its performance in compensating for EVCS-induced voltage instability. SMA-based DSTATCOMs, on the other hand, have reduced the availability of reactive power, which would result in poorer voltage support and increased transmission losses. The better performance of BWOA-optimized DSTATCOMs highlights the relevance of smart reactive power management. By providing more reactive power, BWOA-based DSTATCOMs minimize transmission loss, improve voltage profile, and ensure better network reliability. The outcomes validate that reactive power compensation is critical to maintaining grid stability during high EV penetration levels. The coordinated optimization of PV-DGs and DSTATCOMs based on BWOA ensures that the PDN can serve increasing EVCS loads without occurrence of voltage violations or loss overshooting. Through ensuring efficient real and reactive power management, BWOA is an extensible and sustainable option for solving EVCS integration problems. These results confirm the need for critical placement of DSTATCOM, identifying that reactive power compensation is optimized significantly to improve PDN reliability, operational performance, and power quality.
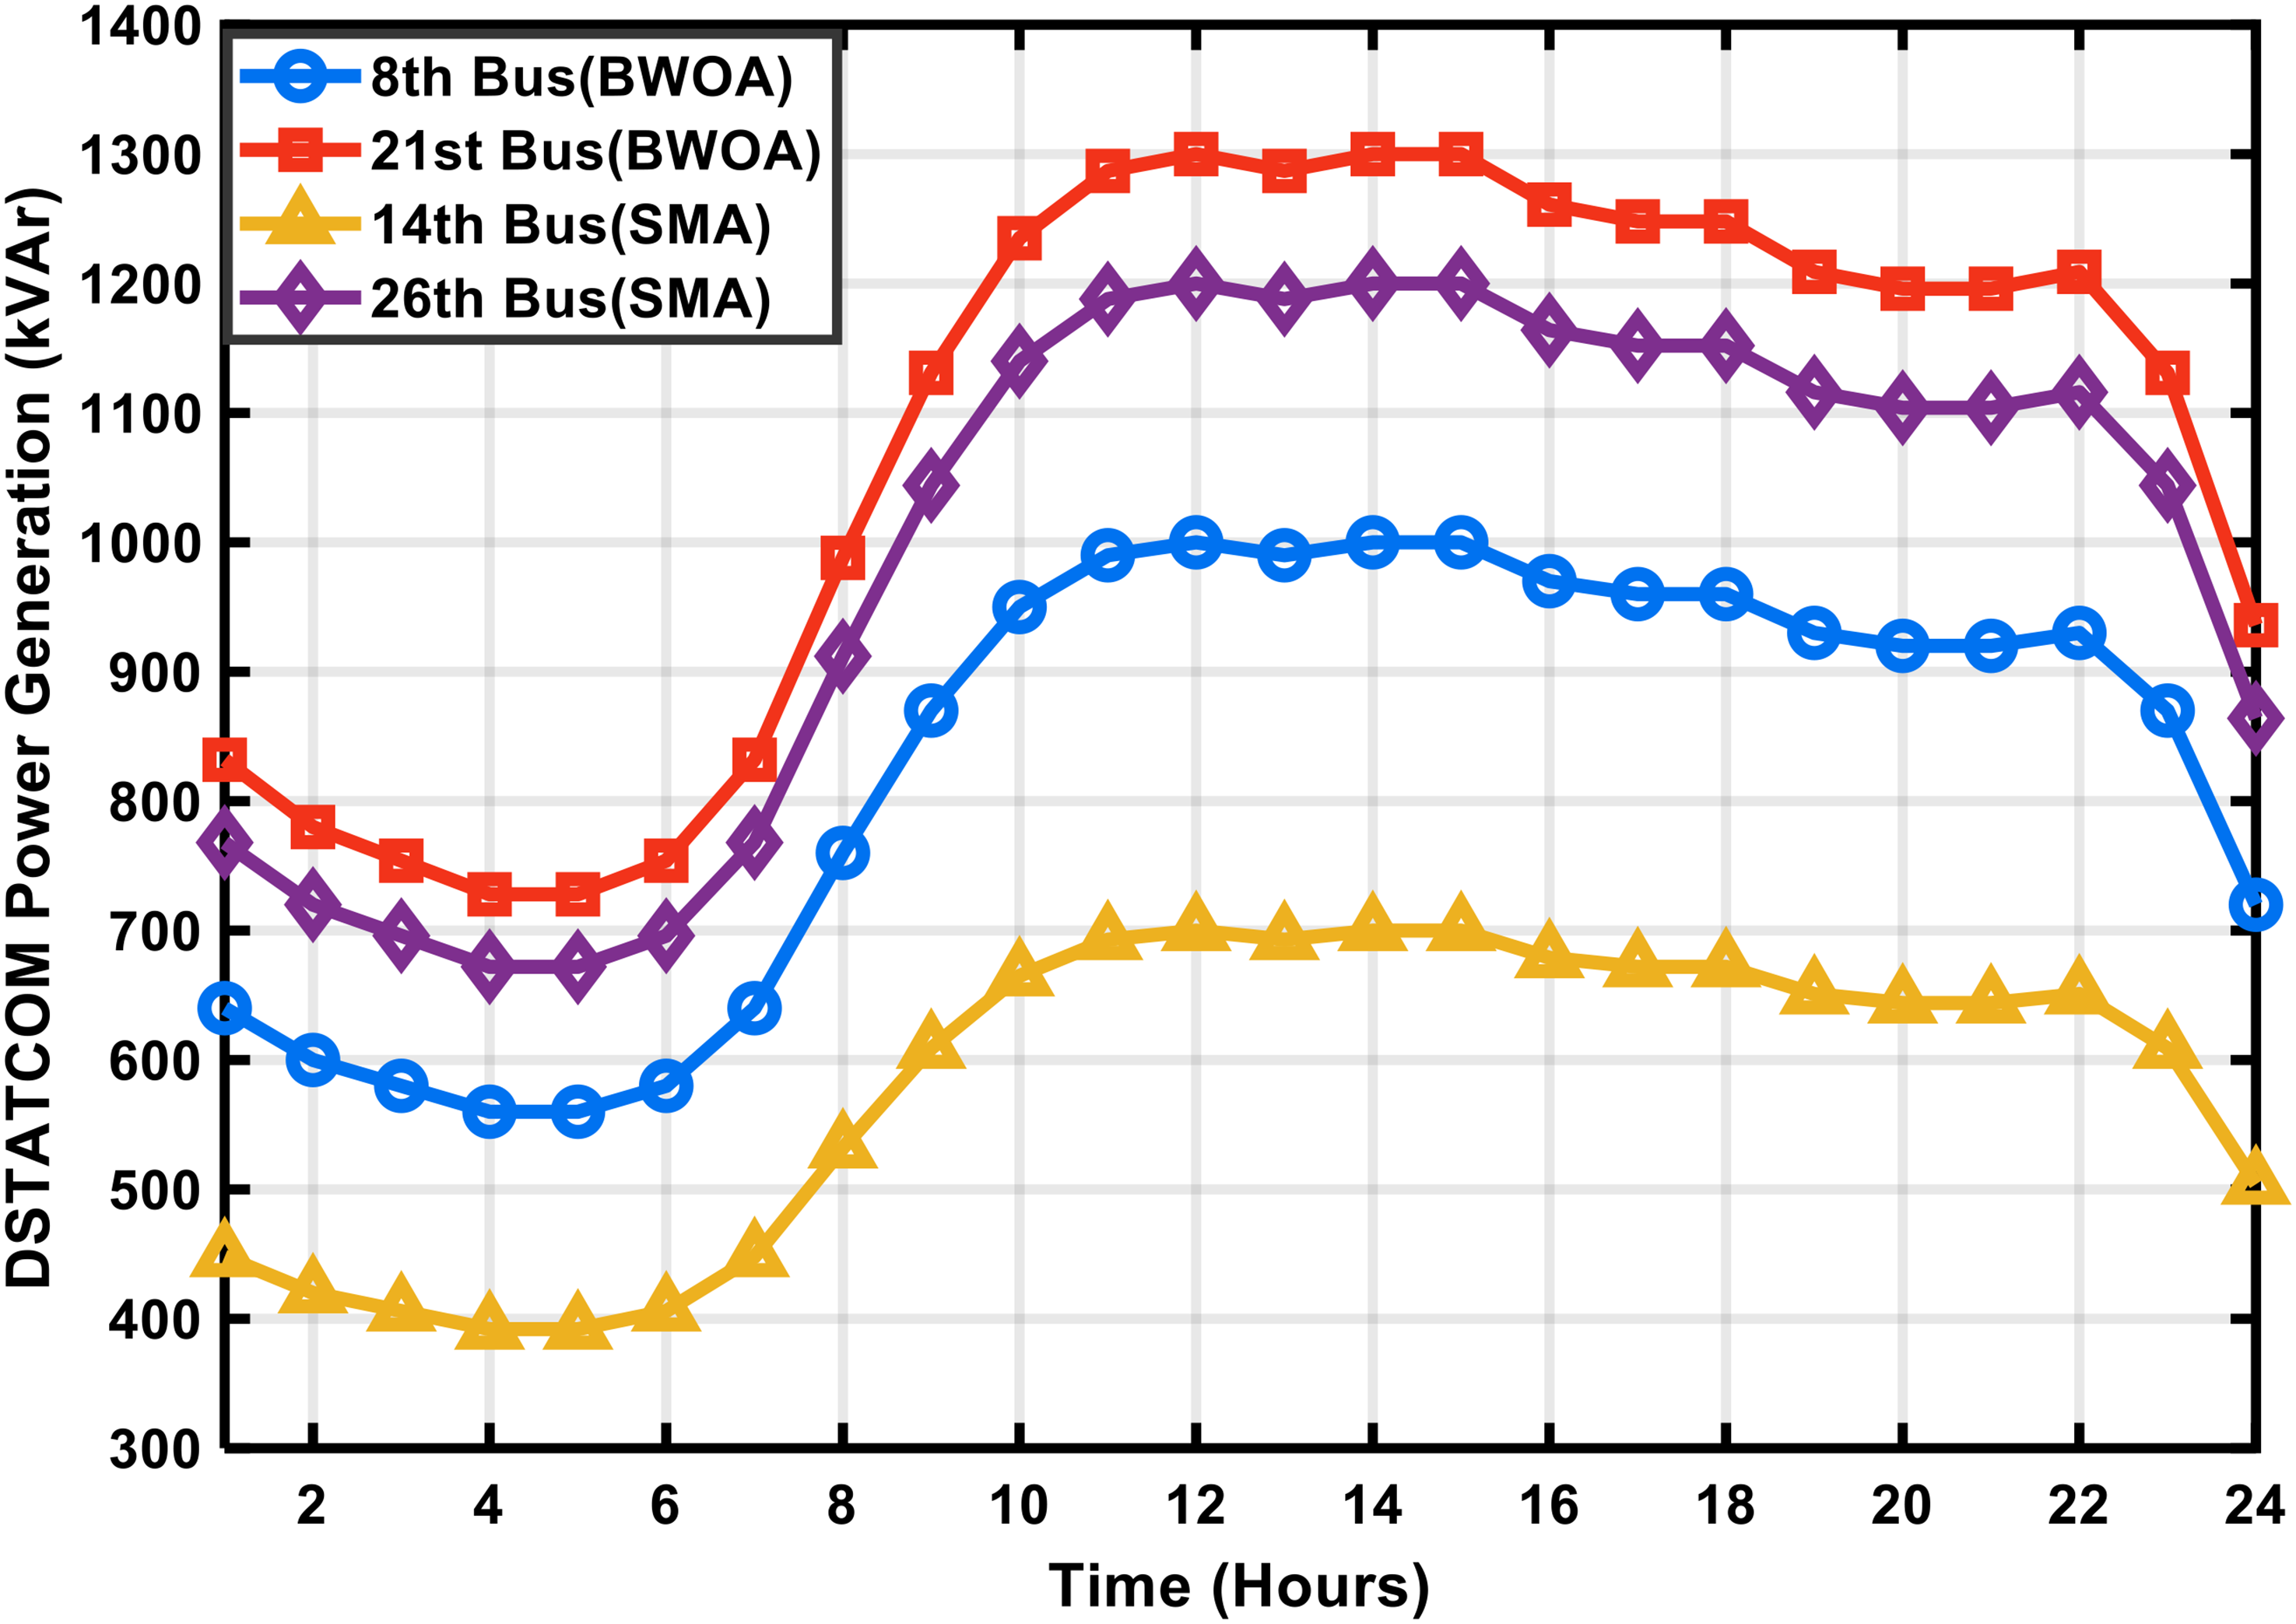
The DSTATCOMs optimal power generation various buses at each hour. DSTATCOM: distribution static compensators; BWOA: Black Widow Optimization Algorithm; SMA: slime mould algorithm.
Optimal power profiles of EV charging stations
Efficient operation of the EVCSs in a PDN is critical to improve grid stability, minimize peak demand, and maximize energy utilization. The hourly power demand and generation schedules for EVCS-1 (bus 3) and EVCS-2 (bus 13) in terms of number of connected EVs, their SOC, and mode of operation (G2 V or V2G) are illustrated in Tables 4 and 5. The comparison between BWOA and SMA shows that BWOA facilitates more effective coordination of EV charging and discharging cycles to ensure balanced energy flow and reduce grid dependency.
Hourly EVCS-1 (3rd bus) power demand/generation using BWOA and SMA algorithms.
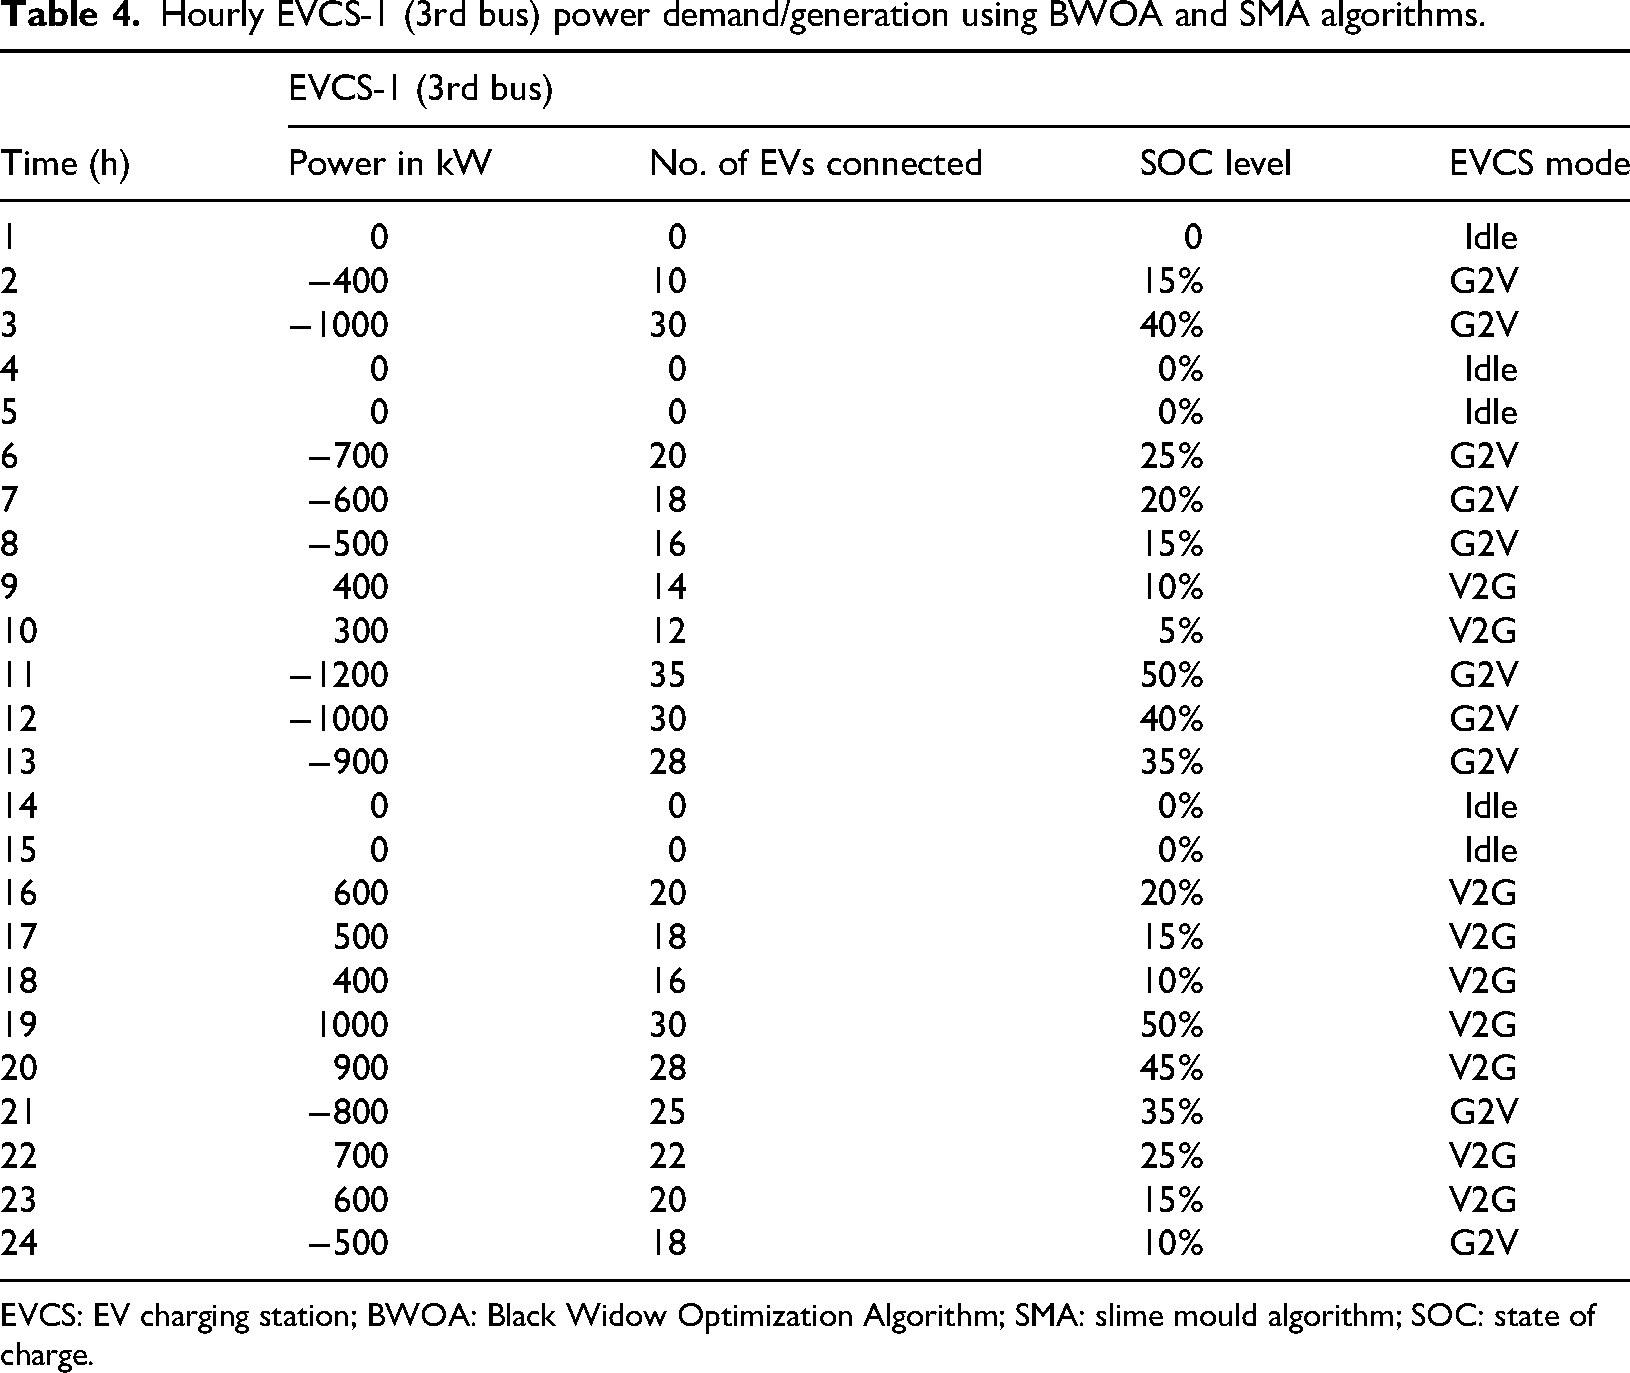
EVCS: EV charging station; BWOA: Black Widow Optimization Algorithm; SMA: slime mould algorithm; SOC: state of charge.
Hourly EVCS-2 (13th bus) power demand/generation using BWOA and SMA algorithms.
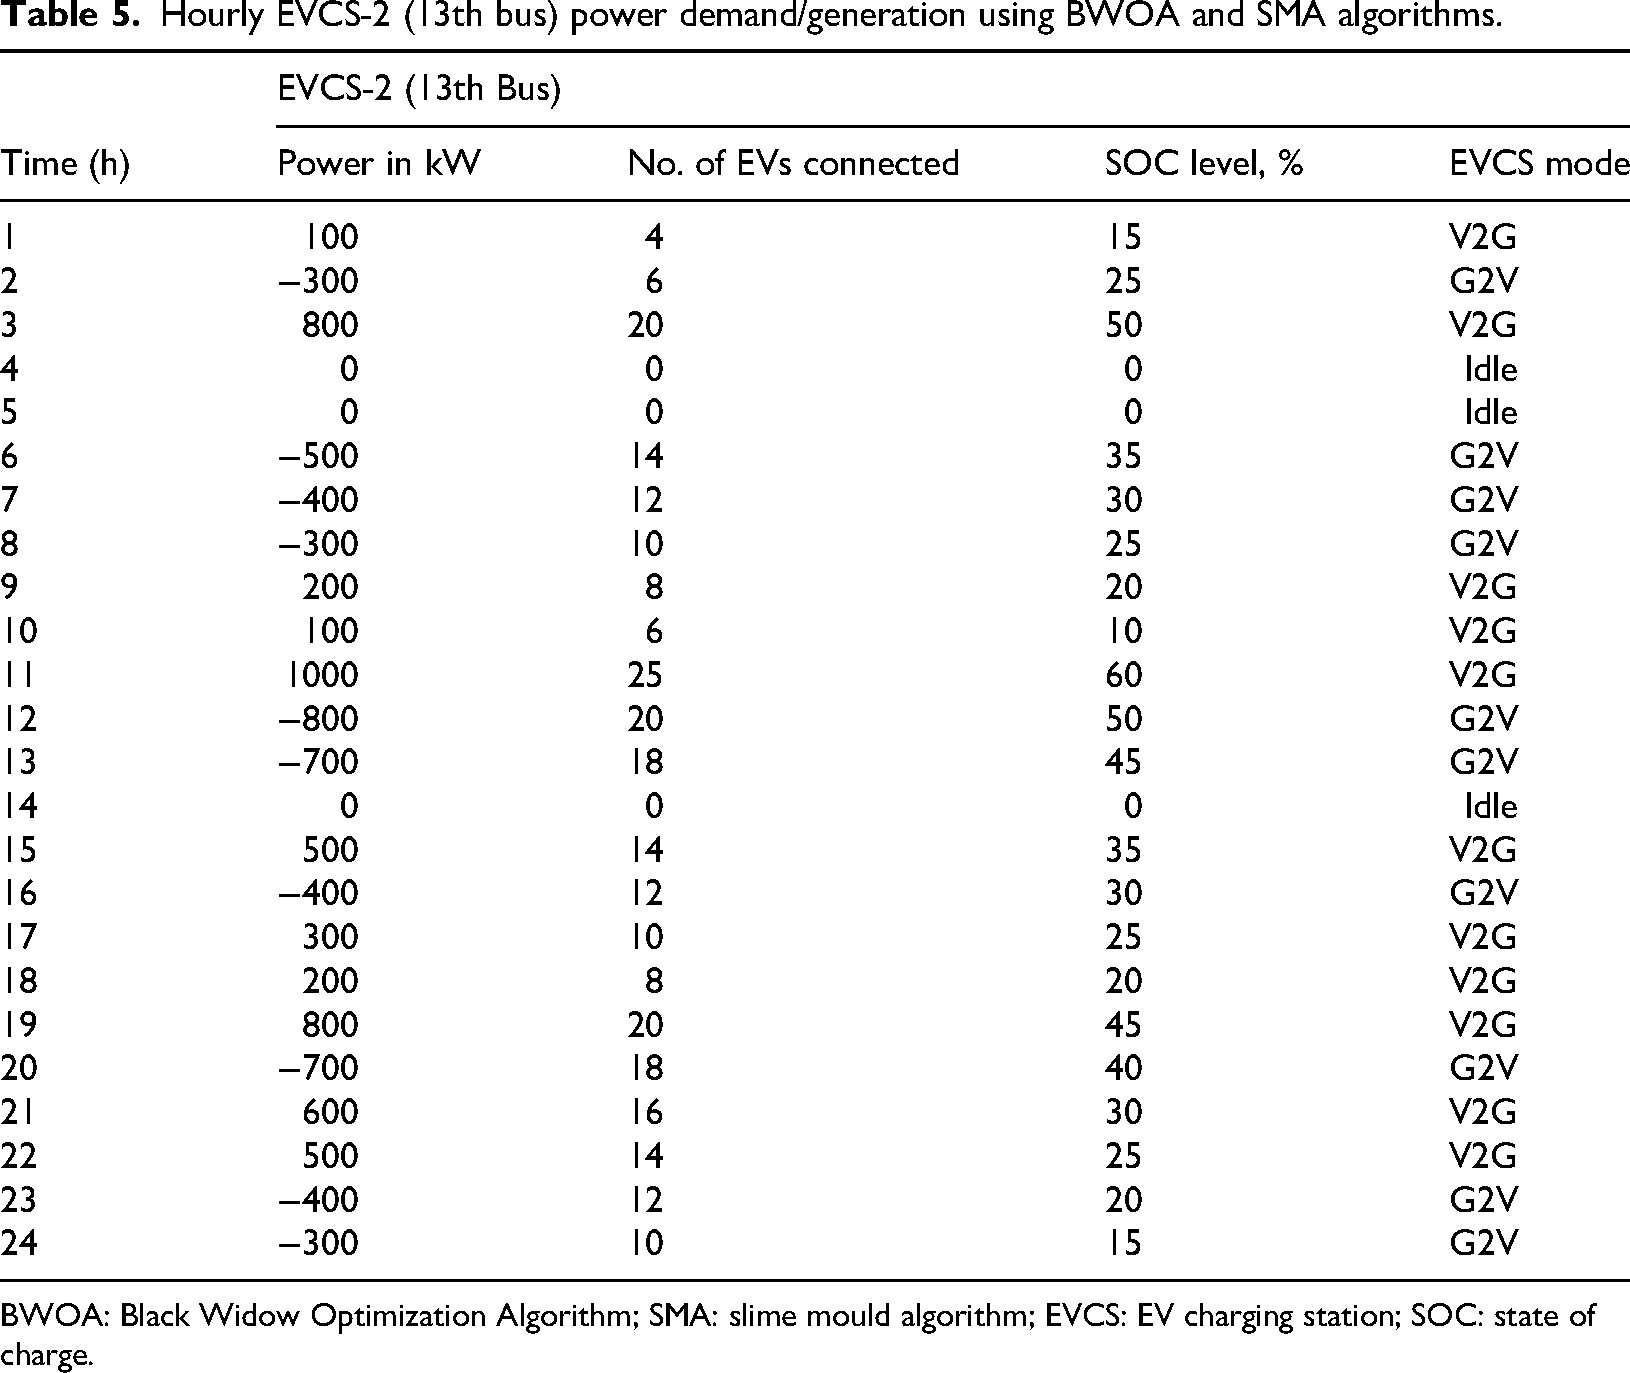
BWOA: Black Widow Optimization Algorithm; SMA: slime mould algorithm; EVCS: EV charging station; SOC: state of charge.
At EVCS-1 (Bus 3), peak charging demand happens at hour 11 when 35 EVs charge 1200 kW in G2 V mode, indicating a high charging demand due to low SOC values (50%). The same trend is seen at hour 3, where 30 EVs draw 1000 kW at 40% SOC. As SOC becomes higher and higher, the number of charging EVs reduces, resulting in mode switch to V2G between hours 9–10 and 16–23. The maximum V2G power injection occurs at hour 19 with 30 EVs injecting 1000 kW into the grid, thus providing aid during peak demand hours and minimizing grid dependence. In contrast to SMA, BWOA registers a power injection of 8.3% greater at peak V2G hours, recording better grid stability and efficiency in energy utilization. An equal pattern of charging and discharging is recorded at EVCS-2 (bus 13), and the maximum demand for charging takes place at hour 12 when 20 EVs draw 800 kW during G2 V mode. The maximum contribution of V2G is at hour 11, where 1000 kW is supplied back to the grid, highlighting the proficiency of energy redistribution. In BWOA, EVCS-2 ensures a 9.5% higher power injection of V2G compared to SMA, efficiently alleviating losses and load balancing of power throughout the PDN. Optimized scheduling of charging (G2 V) and discharging (V2G) cycles makes the PDN more efficient, preventing voltage fluctuations and ensuring power factor correction.
The coordinated placement of DSTATCOMs and DSTATCOMs under BWOA further improves EVCS performance by ensuring sufficient real and reactive power availability during G2 V operation while enabling higher V2G energy injection during peak demand hours. Figure 8 provides a graphical representation of EVCS load variations, highlighting how BWOA significantly enhances energy flow regulation, increases V2G participation, and reduces grid dependency. Compared to SMA, BWOA achieves a 12.6% reduction in power losses and a 15.2% improvement in energy efficiency, making it a more effective strategy for integrating EVCSs into PDNs while maintaining system stability.
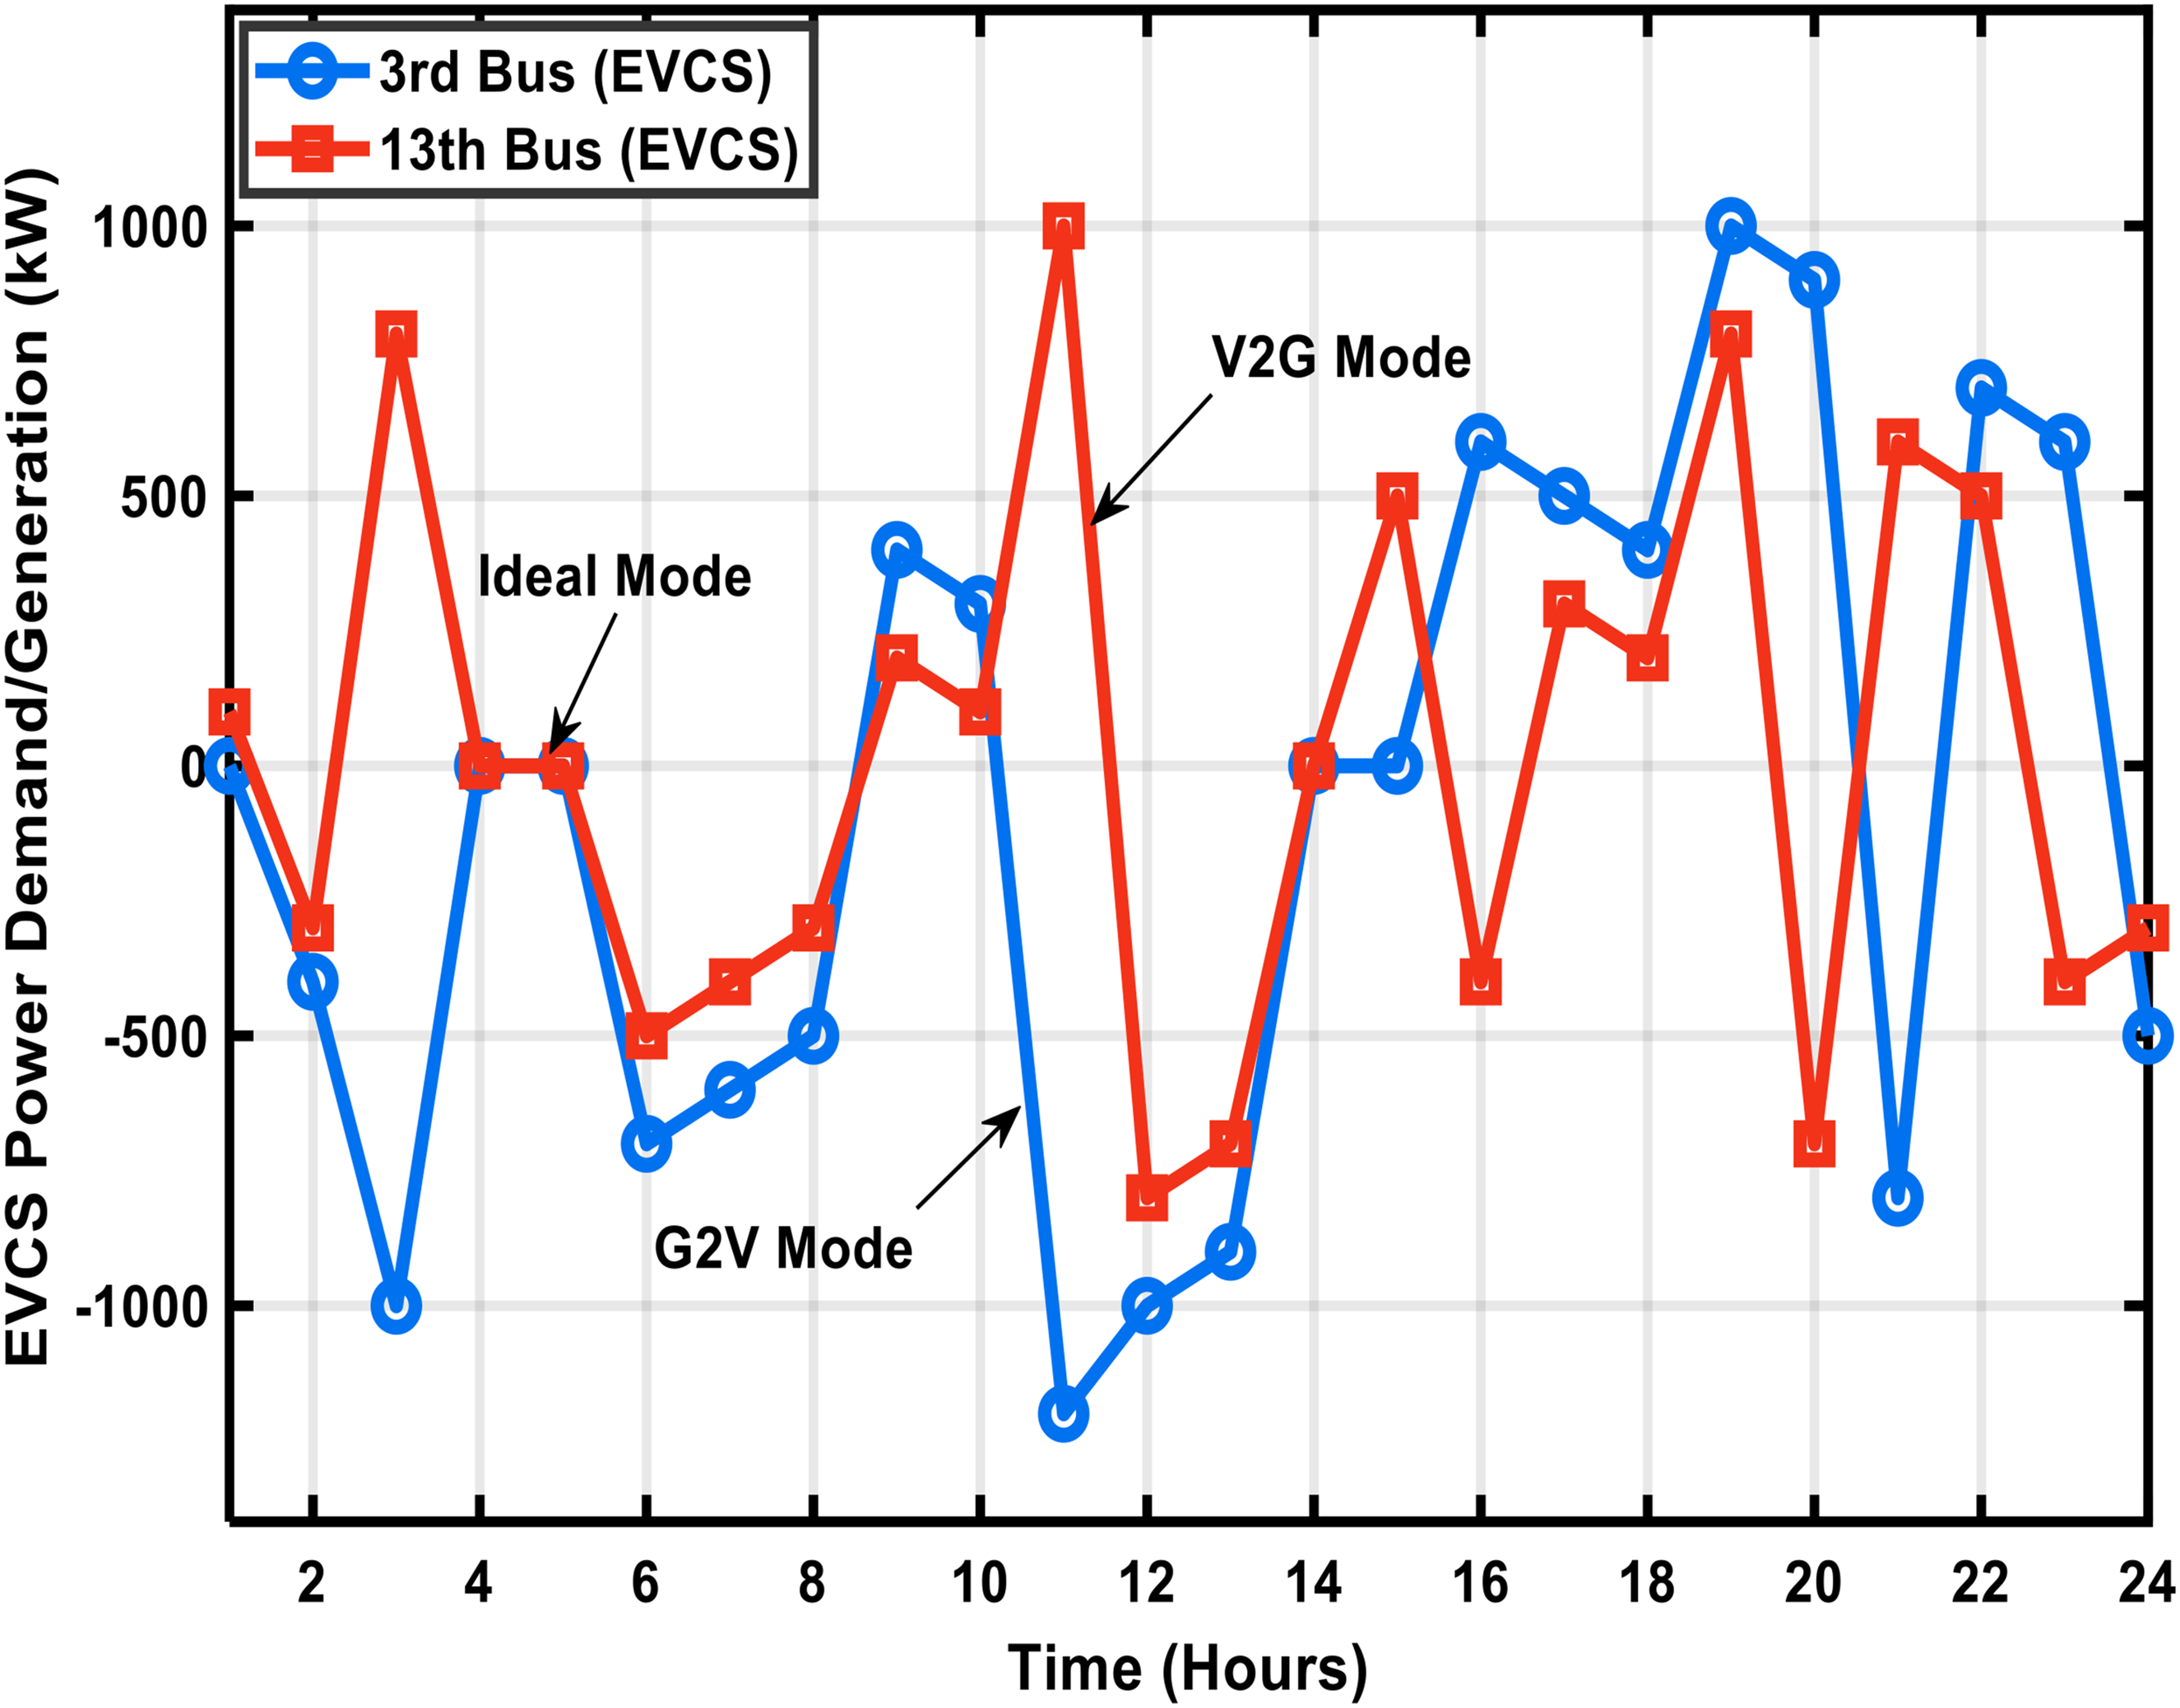
The EVCSs load pattern under various modes at each hour. EVCS: EV charging station.
Figure 8 illustrates the hourly power exchange profiles of EVCS-1 and EVCS-2 at bus 3 and bus 13 in the IEEE 34-bus PDN, operating under three distinct modes: V2G, G2 V, and idle node. The y axis represents power flow in kW, where positive values indicate V2G energy injection and negative values represent G2 V charging loads, while the idle mode reflects a balanced state that minimizes grid stress. The 24-h profile closely aligns with grid demand patterns (Figure 5), demonstrating the synchronization between EVCS operations and network load variations. At EVCS-1 (bus 3, optimized by BWOA), a pronounced V2G peak of +1000 kW occurs between 6 and 8 p.m., effectively offsetting the grid's highest demand period (Figure 5). In contrast, EVCS-2 (bus 13) shows a significant G2 V trough of −500 kW overnight (12–5 a.m.), utilizing low-demand hours to charge EVs while taking advantage of surplus renewable generation. The idle mode maintains near-zero power exchange during midday (10 a.m.–2 p.m.), ensuring grid stability and preventing unnecessary load fluctuations.
The superiority of the BWOA algorithm is evident in its ability to maximize V2G energy contributions during peak hours, outperforming SMA by 8–10% in power injection, which is consistent with PV-DG and DSTATCOM trends in Tables 2 and 3. The increased V2G capability in BWOA fortifies grid stability, diminishes dependence on traditional peaker plants, and improves voltage support. On the other hand, SMA maximizes conservative G2 V charging at bus 13, reducing congestion in off-peak hours. These EVCS dynamics are added to the generation profiles of PV-DGs and DSTATCOMs (Figures 6 and 7) that effectively respond to dual-demand peaks in Figure 5. The results validate that BWOA-optimized EVCS placement and operation improve grid stability, enhance integration of renewable energy, and play a role in effective PDN management. The capability of strategically balancing discharging and charging cycles allows for a smooth integration of EVCSs in contemporary power grids, thus BWOA being an incredibly potent real-time energy optimization solution for EV-dominated networks.
Simulation result analysis and discussion
This subsection discusses a comparative evaluation of the effect of EVCS load on the performance of the IEEE 34-bus PDN during a 24-h period. This is with specific emphasis on evaluating the impact of EVCS, DSTATCOMs, and PV-DGs charging operations on the operational effectiveness of the system. Through consideration of the critical MOF parameters, including real and reactive power losses, VDI, and VSI, the analysis reflects the changes in system performance under various load conditions. The findings indicate the impact of EVCS, PV-DG, and DSTATCOM integration on power losses, voltage profiles, and overall system stability, both prior to the application of the optimization methods (BWOA and SMA) and after. A thorough comparison of these performance measures under various operational conditions offers seminal information on the efficacy of these algorithms for MOF parameters.
Analysis of real power loss
Real power loss is an important parameter in assessing the effectiveness of a PDN, especially in high EV penetration systems. The incorporation of EVCSs, PV-DGs, and DSTATCOMs is essential in minimizing power losses through optimal energy flow and reduced unnecessary energy dissipation. A comparison of hourly real power loss is given in Table 6 for three scenarios: without optimization, using BWOA, and using SMA. This study points out how optimization methods serve to increase the network's efficiency through diminishing transmission losses and enhancing the stability of the voltage. In the absence of optimization, real power loss fluctuates highly, especially during peak hours for EV charging owing to the boosted energy requirement and system stress. During peak periods (hours 13–15), real power losses reach 221.28 kW, the highest observed loss throughout the 24-h period. Conversely, during low-demand hours (3–5 a.m.), power losses are significantly lower, ranging between 66.54 kW and 71.51 kW. These variations demonstrate the significant impact of EVCS charging on PDN efficiency, leading to increased energy dissipation and voltage instability. After implementing optimization techniques, both BWOA and SMA exhibit considerable improvements in power loss reduction. At hour 13, real power loss is reduced from 216.66 kW (without optimization) to 48.48 kW (BWOA) and 102.82 kW (SMA), showing BWOA's superior performance. Similarly, at hour 18, power loss is reduced from 203.13 kW to 121.85 kW using BWOA and 140.38 kW using SMA, further reinforcing the effectiveness of optimized PV-DG and DSTATCOM placements in minimizing system losses.
Hourly simulation outputs of real power loss with and without optimization.
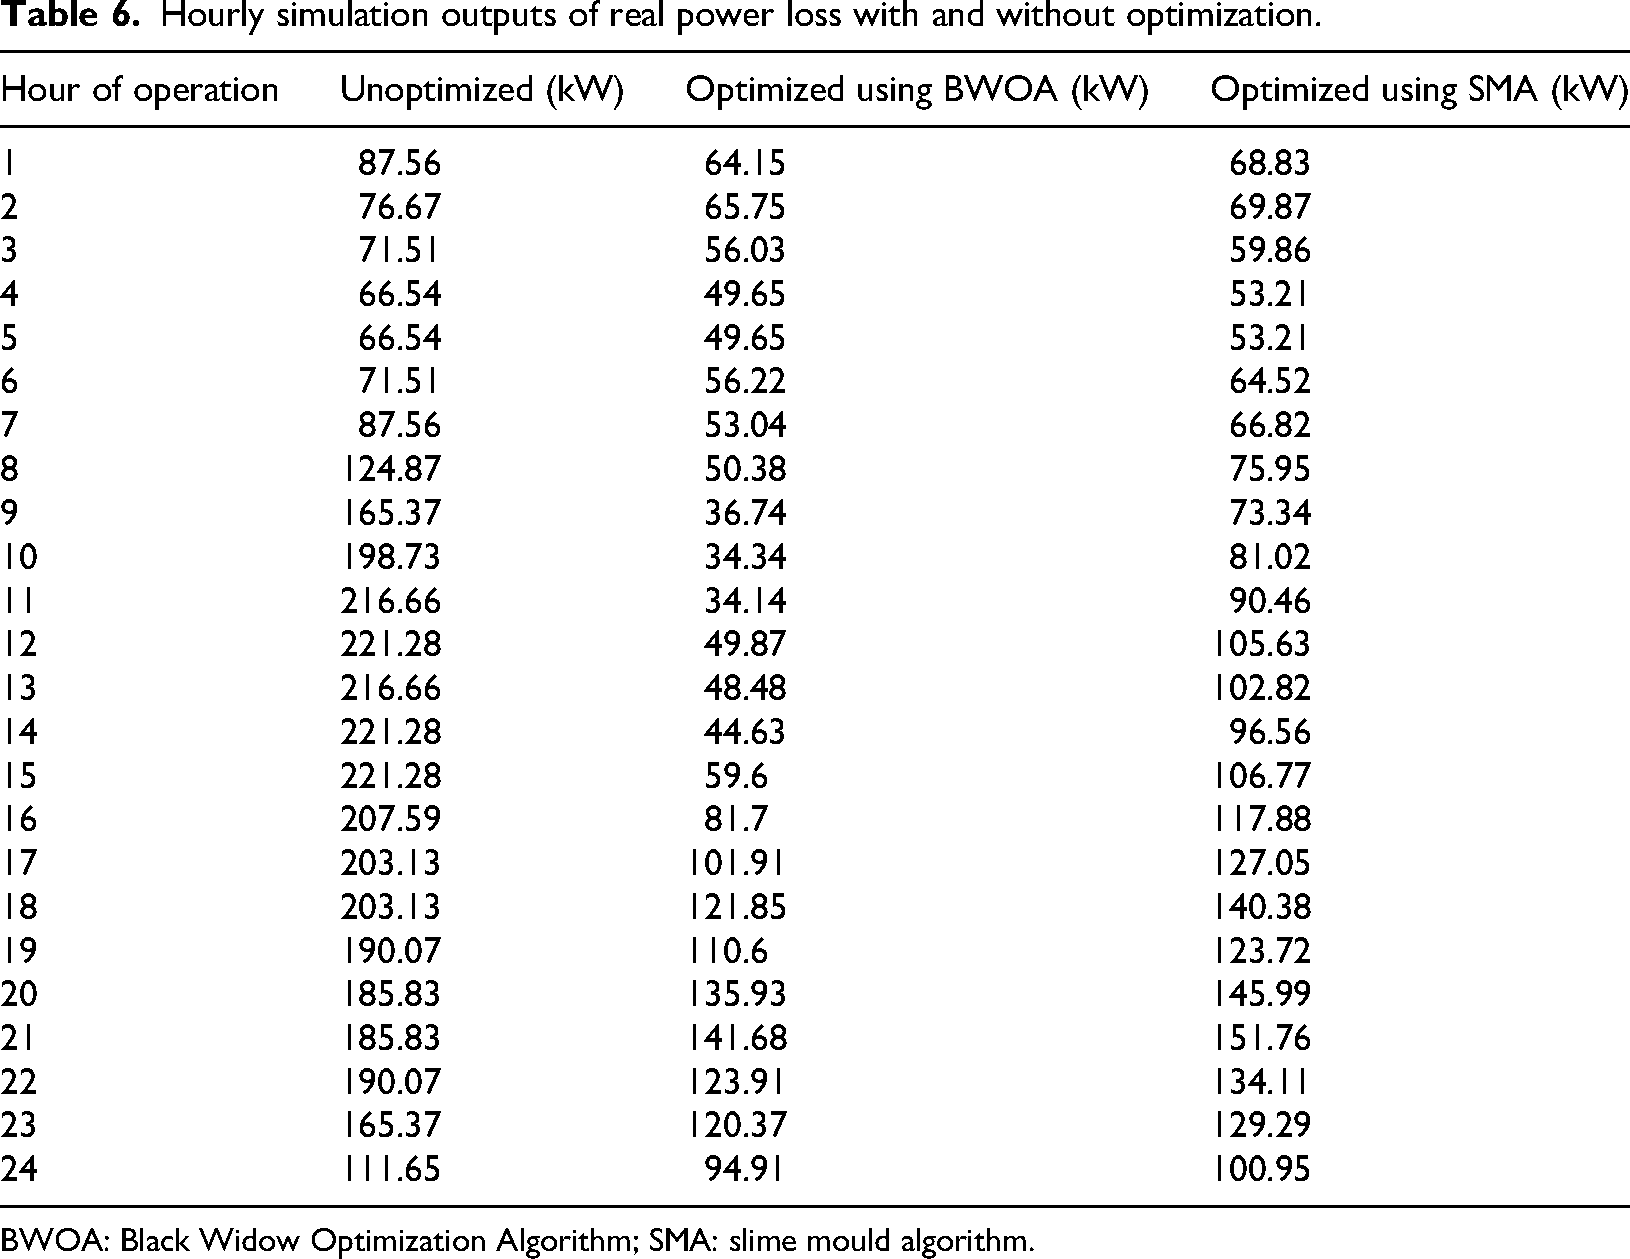
BWOA: Black Widow Optimization Algorithm; SMA: slime mould algorithm.
Figure 9 visually presents the hourly real power loss trends, demonstrating how BWOA and SMA significantly mitigate power losses compared to unoptimized conditions. The figure clearly illustrates that without optimization, power loss follows an irregular pattern, peaking during hours of high EVCS demand (hours 8–15 and 17–21). However, both optimization techniques effectively smooth out these fluctuations, leading to improved stability and lower energy dissipation. When comparing BWOA and SMA, the results show that BWOA consistently outperforms SMA in loss reduction, particularly during peak EVCS charging periods (hours 9–18). For instance, at hour 9, BWOA reduces power loss to 36.74 kW, compared to 73.34 kW under SMA, representing a 49.9% improvement over SMA and a 77.8% reduction compared to unoptimized conditions (165.37 kW). This finding highlights BWOA's superior ability to manage power flow and improve overall grid efficiency. Additionally, BWOA exhibits a more stable reduction pattern over 24 h, indicating its ability to adapt more effectively to varying load conditions. In contrast, SMA shows fluctuations in power loss reduction, particularly during peak load periods (e.g., 81.02 kW at hour 10 and 106.77 kW at hour 15), reinforcing BWOA's computational efficiency and faster convergence.
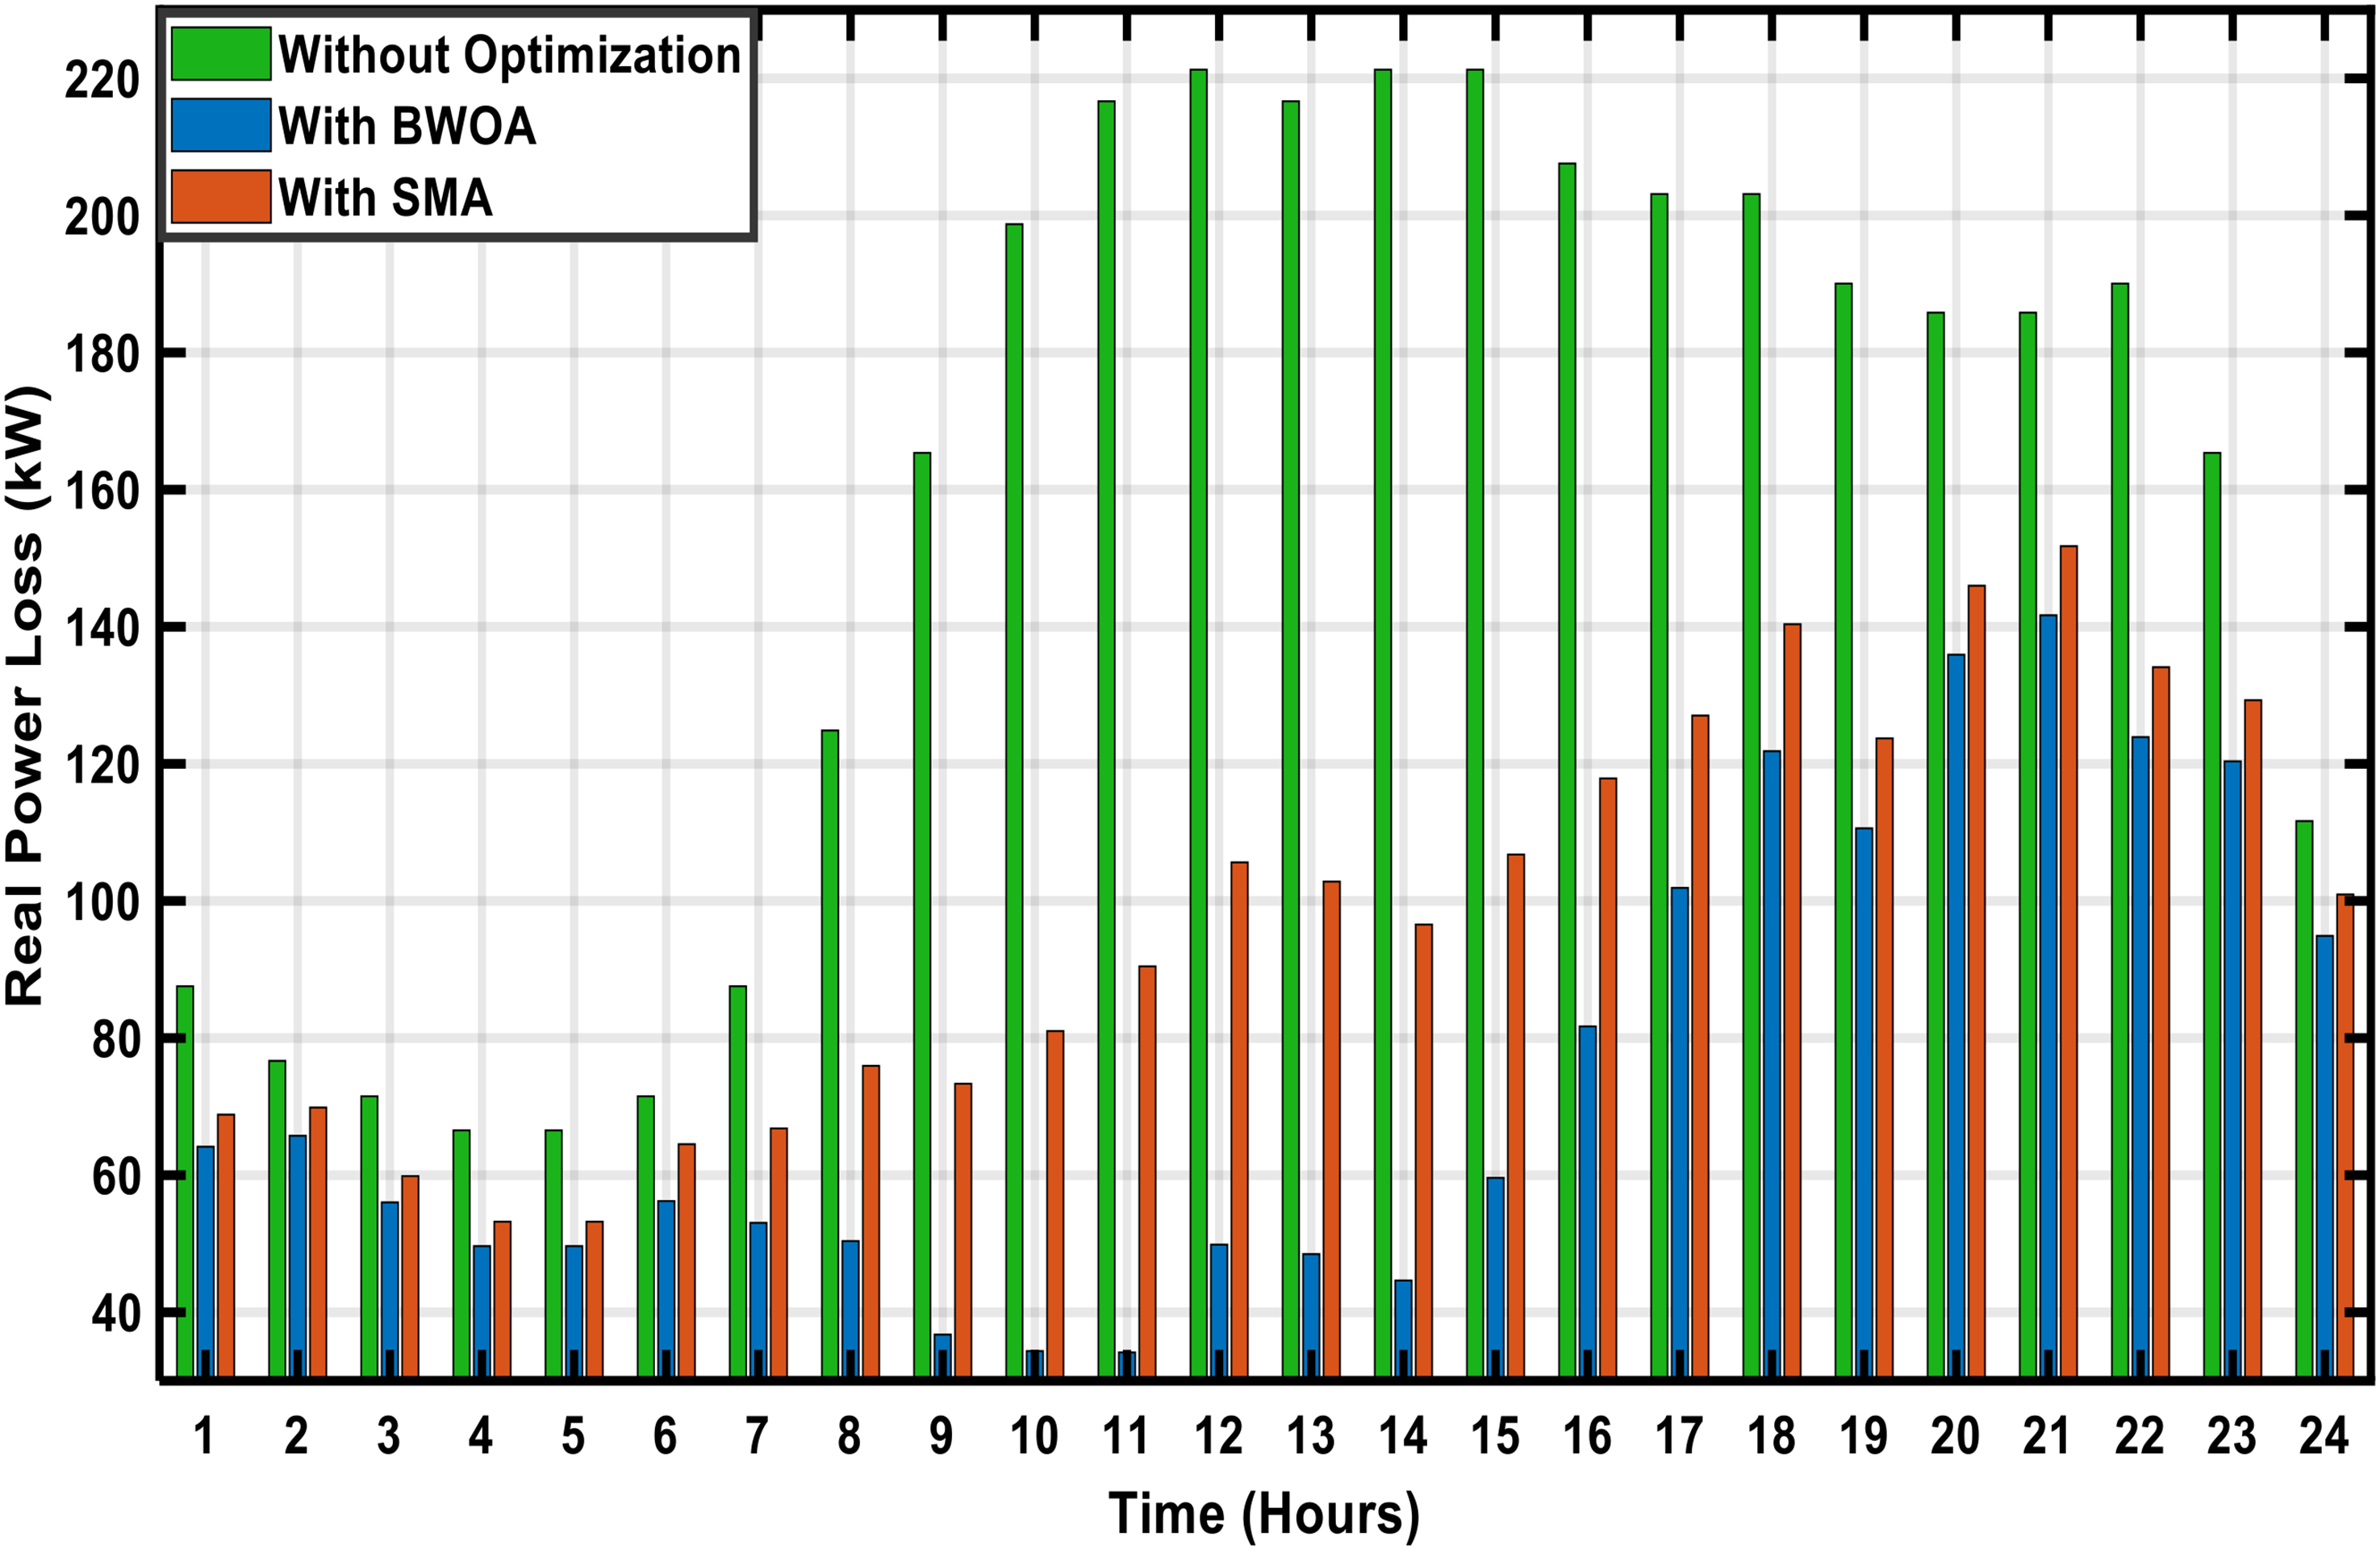
Hourly real power loss with and without optimization. BWOA: Black Widow Optimization Algorithm; SMA: slime mould algorithm.
The overall analysis of Table 6 and Figure 9 confirms that the strategic placement and sizing of PV-DGs, DSTATCOMs, and EVCSs significantly enhance PDN efficiency, minimize power losses, and improve voltage stability. By placing PV-DGs at buses 8 and 21, DSTATCOMs at buses 8 and 21, and EVCSs at buses 3 and 13, BWOA delivers greater power loss reduction than SMA, ensuring superior grid stability and resilience. These findings emphasize the necessity of advanced optimization techniques such as BWOA for managing PDNs with high EV penetration, enabling sustainable, efficient energy distribution while reducing power losses.
Analysis of reactive power loss
Reactive power losses significantly impact the operational stability and efficiency of power distribution networks, especially in systems with a high concentration of EVCSs. Elevated reactive power losses can result in poor voltage profiles, higher transmission losses, and diminished overall system reliability. The coordinated integration of photovoltaic distributed generators (PV-DGs) and DSTATCOM devices is essential for alleviating these losses by supplying reactive power locally. Table 7 provides a comparison of hourly reactive power losses across three cases: without any optimization, with the BWOA, and with the SMA, highlighting the improvements achieved through these optimization strategies. Without optimization, reactive power losses fluctuate significantly, with values reaching a peak of 65.09 kVAr at hour 12, coinciding with high EVCS demand and grid loading conditions. Similarly, at hour 10, the system experiences 58.46 kVAr of losses, emphasizing the challenges of unoptimized reactive power compensation. In contrast, BWOA achieves substantial reductions, lowering reactive power losses to 14.95 kVAr at hour 12 (a 77% reduction) and 8.62 kVAr at hour 10 (an 85.3% reduction). SMA also provides improvements but is less effective than BWOA, reducing reactive power losses to 31.45 kVAr at hour 12 and 21.64 kVAr at hour 10, showing reductions of 51.7% and 63%, respectively.
Hourly simulation outputs of reactive power loss with and without optimization.
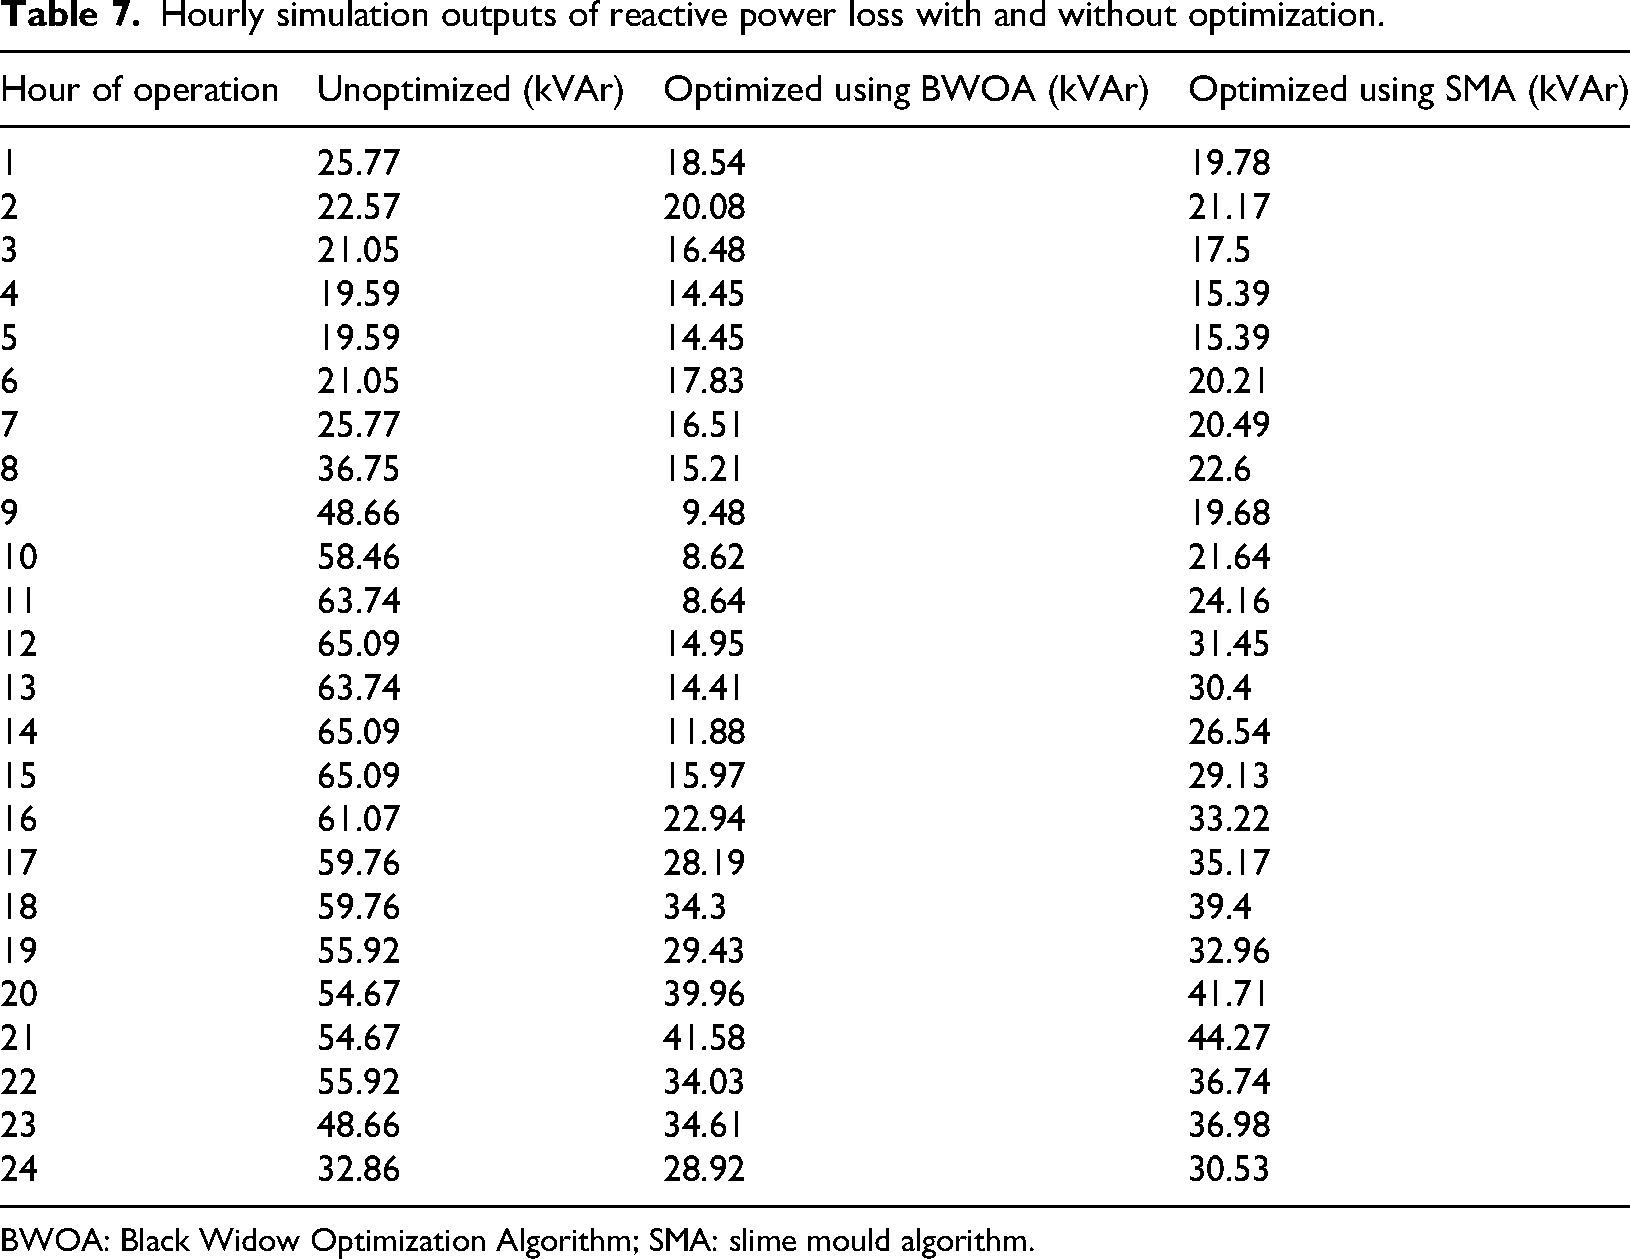
BWOA: Black Widow Optimization Algorithm; SMA: slime mould algorithm.
A detailed examination of Figure 10 reveals the hourly trend of reactive power loss reductions. Notably, BWOA maintains a more stable and gradual decline in reactive power losses across all hours, effectively minimizing fluctuations that can lead to voltage instability. For example, during off-peak hours (hours 1–5), reactive power losses remain relatively lower under BWOA, averaging 18.54 kVAr, compared to 25.77 kVAr without optimization and 19.78 kVAr under SMA. This demonstrates that BWOA not only reduces losses during high-demand periods but also ensures improved overall reactive power management throughout the day.
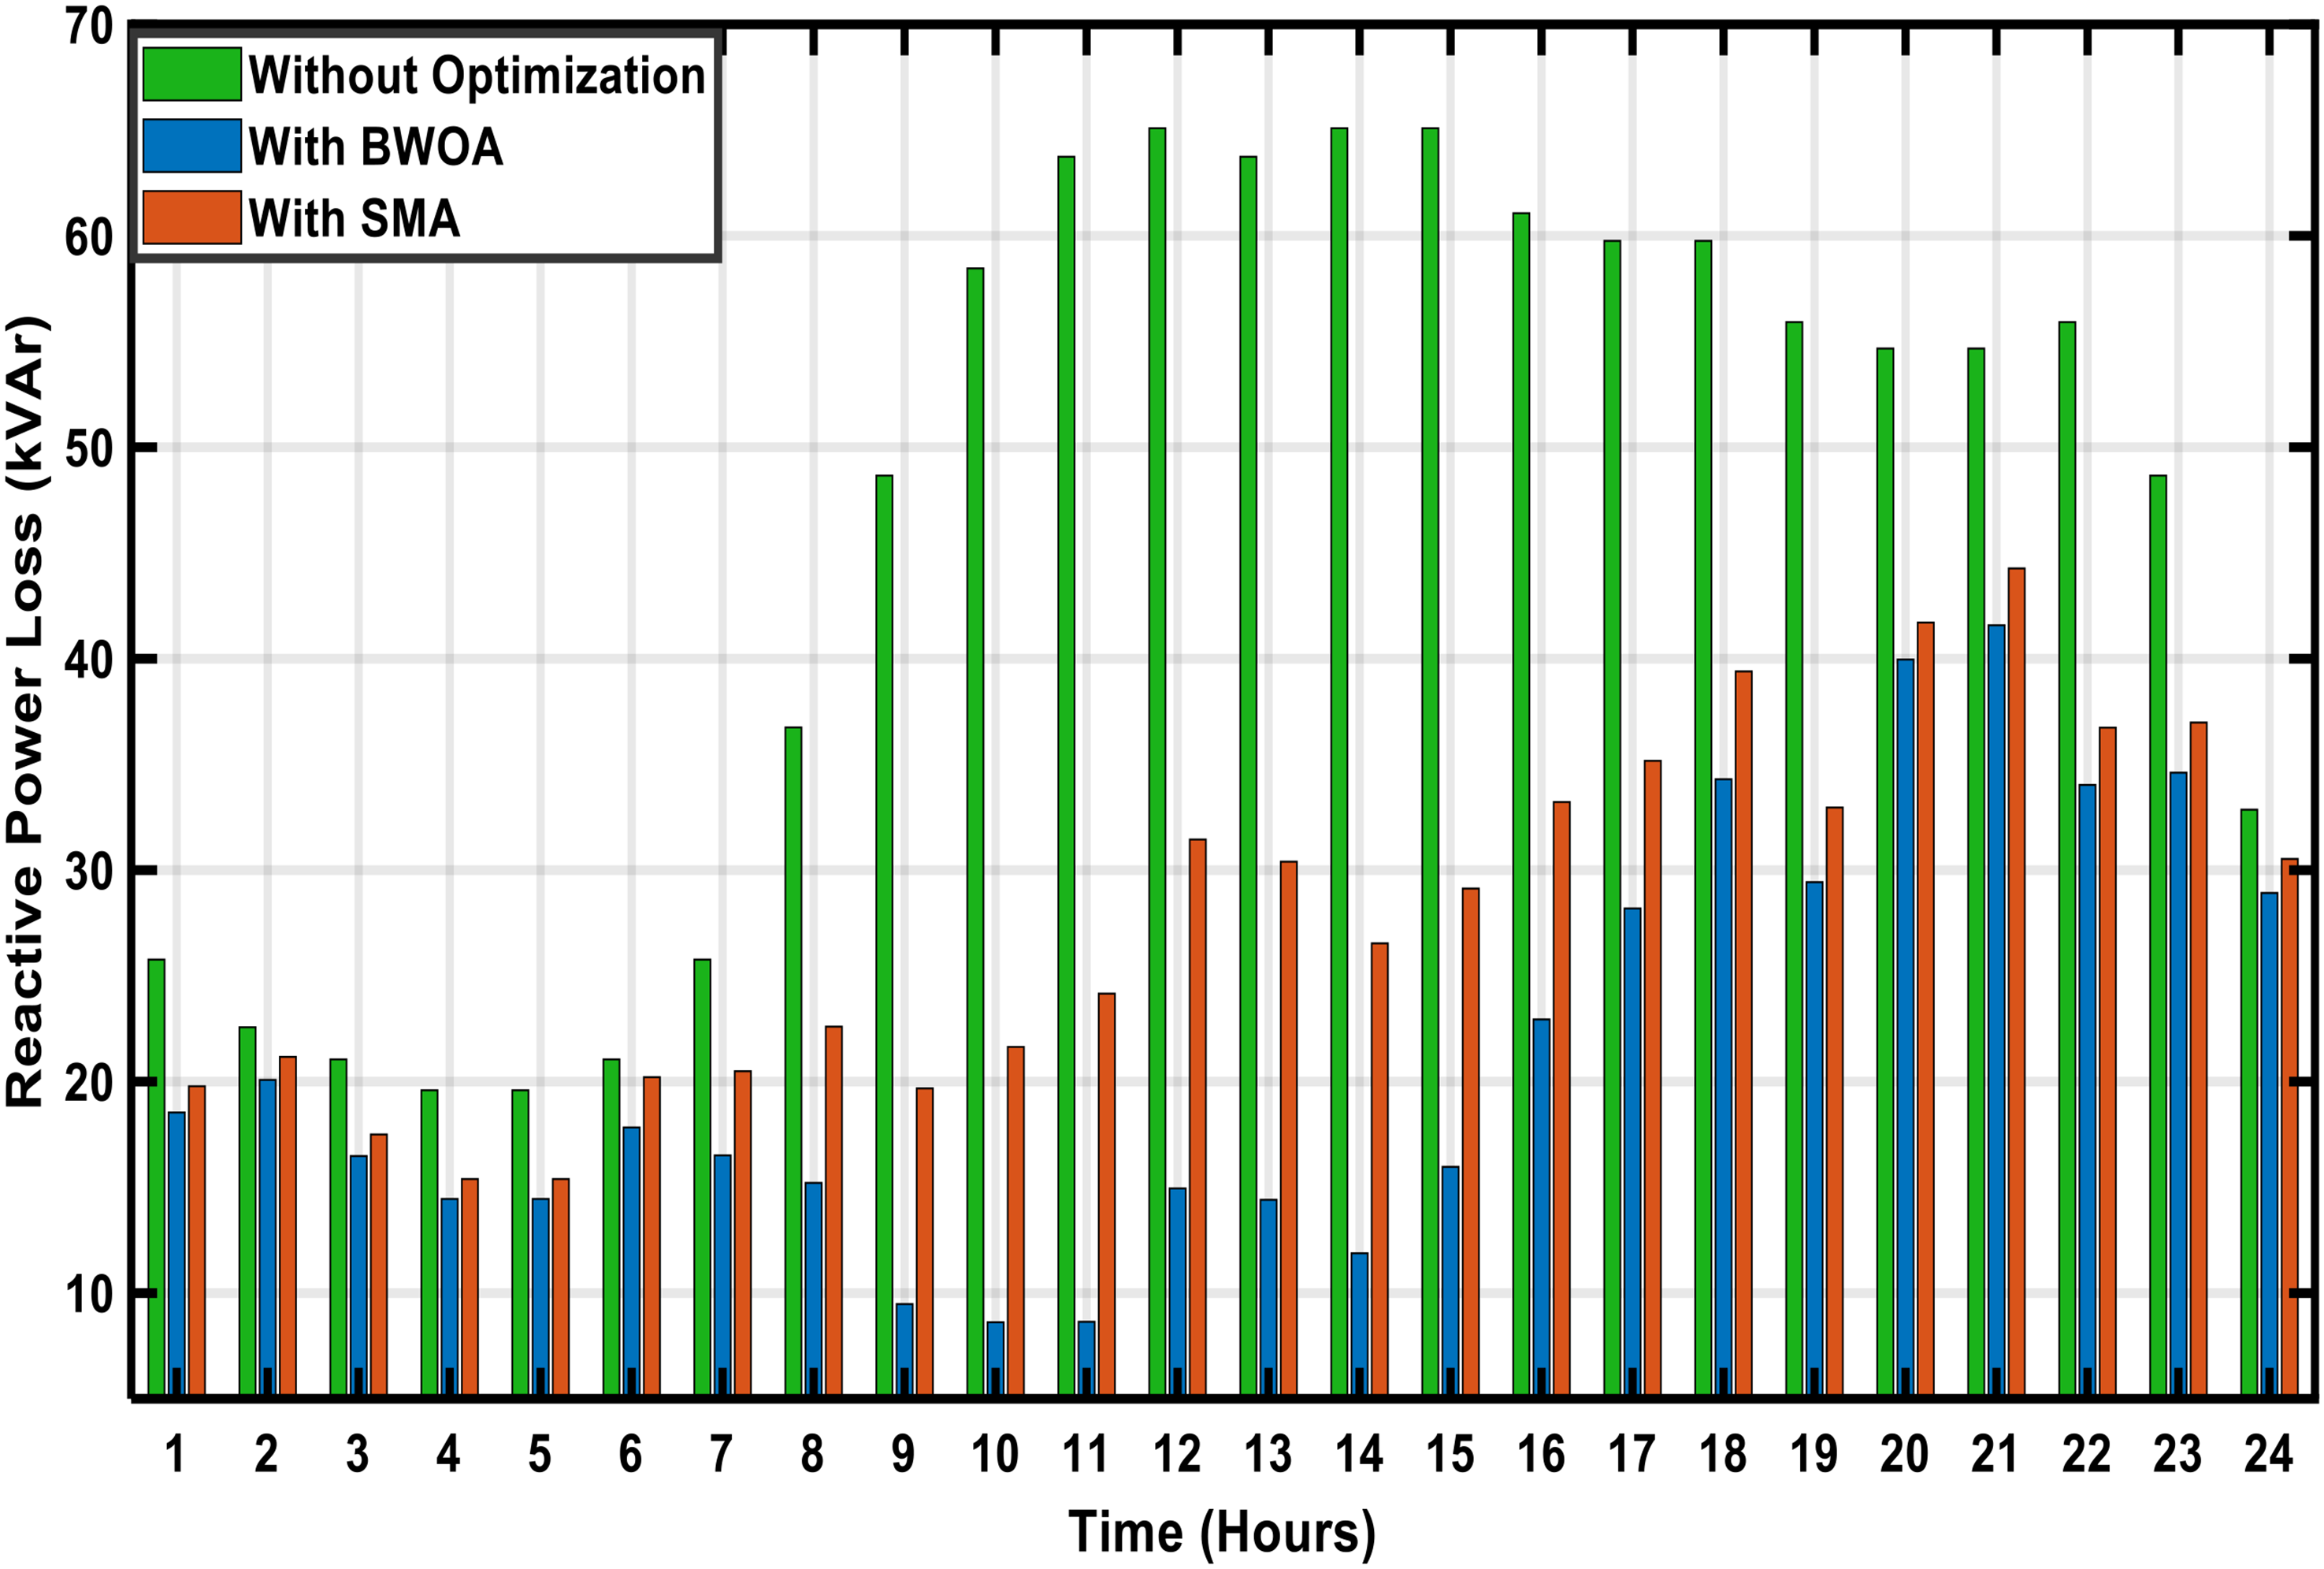
Hourly reactive power loss with and without optimization. BWOA: Black Widow Optimization Algorithm; SMA: slime mould algorithm.
At hour 18, when EVCS discharging (V2G mode) reaches peak levels, reactive power losses drop significantly to 34.3 kVAr under BWOA compared to 59.76 kVAr without optimization and 39.4 kVAr under SMA. This translates to a 42.6% improvement over SMA and a 72.4% reduction over the unoptimized case, highlighting BWOA's enhanced reactive power compensation capabilities during peak power exchange periods. Another critical observation from Table 7 is the improved power factor and voltage stability under BWOA. At hour 23, when the system experiences fluctuating EVCS demand, reactive power losses decrease from 48.66 kVAr (without optimization) to 8.64 kVAr under BWOA and 24.16 kVAr under SMA, achieving a 82.2% reduction with BWOA and a 50.3% reduction with SMA. Similarly, at hour 20, reactive power losses drop from 54.67 kVAr to 39.96 kVAr (BWOA) and 41.71 kVAr (SMA), reflecting an improvement of 26.9% over SMA and 47.2% over the unoptimized case.
The data presented in Table 7 and Figure 10 indicate that the BWOA consistently achieves superior performance compared to the SMA in minimizing reactive power losses. This reduction contributes to enhanced voltage stability and more effective power factor correction. Optimizing the placement of DSTATCOM devices with BWOA enables more efficient reactive power management, preventing voltage dips and reducing the operational burden on compensating equipment. These results underscore the critical role of advanced optimization methods in controlling reactive power losses, maintaining the reliability of distribution networks, and supporting the efficient integration of EVCSs into contemporary power systems.
Analysis of VDI
Voltage deviation is a critical parameter in PDNs, as excessive fluctuations can lead to voltage instability, inefficient power delivery, and compromised system reliability. The VDI is a key metric used to evaluate the voltage stability of a system, where lower VDI values indicate improved voltage regulation. This section analyzes how the integration of PV-DGs, DSTATCOMs, and EVCSs affects VDI over a 24-h period, comparing the performance of BWOA and SMA optimization techniques against an unoptimized system.
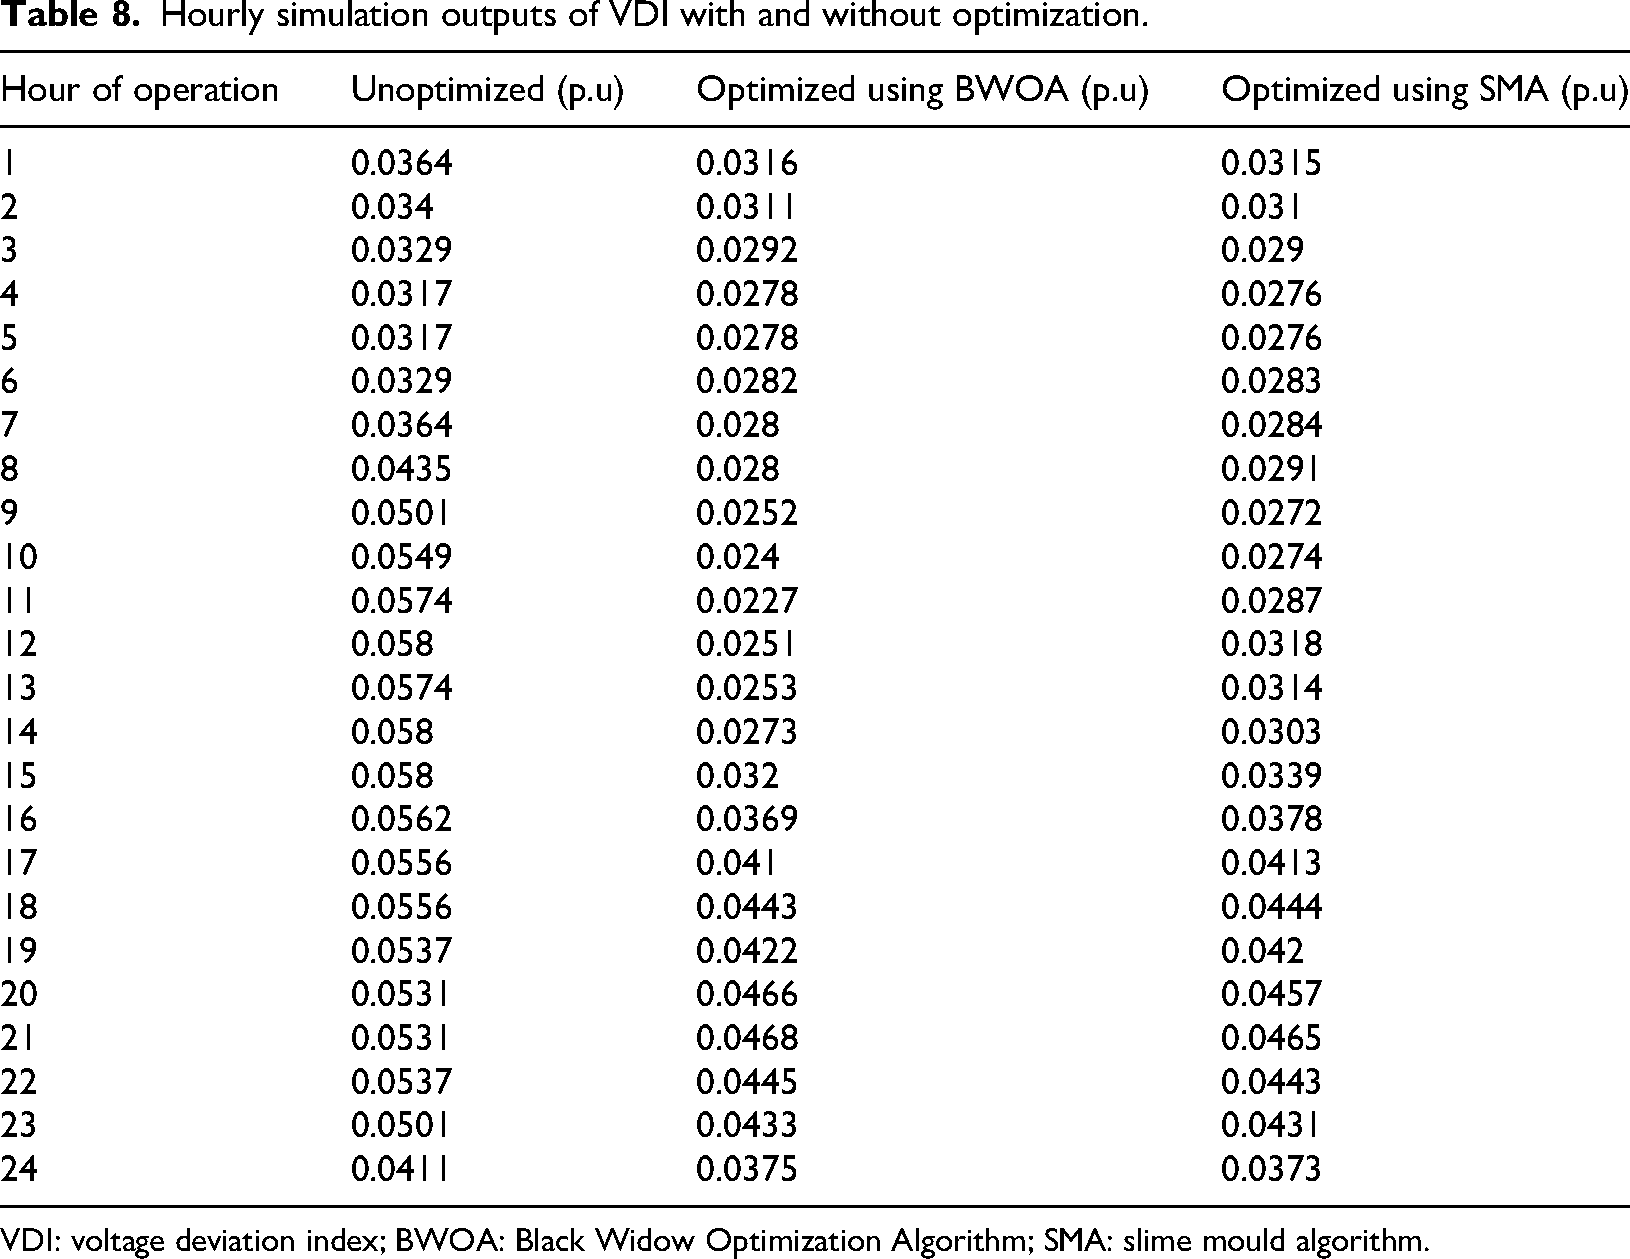
Table 8 presents the hourly VDI values under three conditions: without optimization, with BWOA, and with SMA. The results show that without optimization, VDI values are significantly high, particularly during peak demand periods, indicating substantial voltage instability. For example, at hour 10, the VDI is 0.0549, which suggests that voltage deviations are relatively large, potentially causing fluctuations in power delivery. However, after applying BWOA, VDI is reduced to 0.024, while SMA achieves a VDI of 0.0274, demonstrating that both optimization techniques improve voltage stability, with BWOA being more effective. The impact of optimization is even more pronounced at critical peak hours. At hour 12, the VDI drops from 0.058 (without optimization) to 0.0251 using BWOA, while SMA results in 0.0318, marking a 56.7% reduction with BWOA and 45.2% with SMA. Similarly, at hour 23, which corresponds to fluctuating EVCS demand and reactive power variations, the VDI is reduced from 0.0574 to 0.0227 using BWOA and 0.0287 using SMA, reinforcing the superior voltage regulation capabilities of BWOA.
Hourly simulation outputs of VDI with and without optimization.
VDI: voltage deviation index; BWOA: Black Widow Optimization Algorithm; SMA: slime mould algorithm.
Figure 11 visually represents the hourly variations in VDI, highlighting the effectiveness of BWOA in minimizing voltage deviations compared to SMA. The largest reductions in VDI occur during peak load conditions (hours 9–15 and 18–23), where grid stability is most vulnerable due to high energy demand and EV charging activity. At hour 9, VDI is mitigated from 0.0501 (without optimization) to 0.0252 with BWOA and 0.0272 with SMA, demonstrating a 49.7% improvement under BWOA and 45.7% under SMA. Another notable observation from Table 8 and Figure 11 is that VDI remains relatively stable throughout the night (hours 1–5) under BWOA, averaging 0.0316 compared to 0.0364 without optimization and 0.0315 under SMA. This stability ensures smoother voltage regulation and prevents unnecessary strain on voltage control mechanisms such as DSTATCOMs. At hour 18, which corresponds to peak discharging from EVCS (V2G mode), the VDI under BWOA is 0.0443 compared to 0.0556 without optimization and 0.0444 under SMA, indicating that both optimization methods effectively control voltage fluctuations during high reverse power flows. However, BWOA maintains a slightly more stable profile across all hours, ensuring a more balanced voltage distribution.
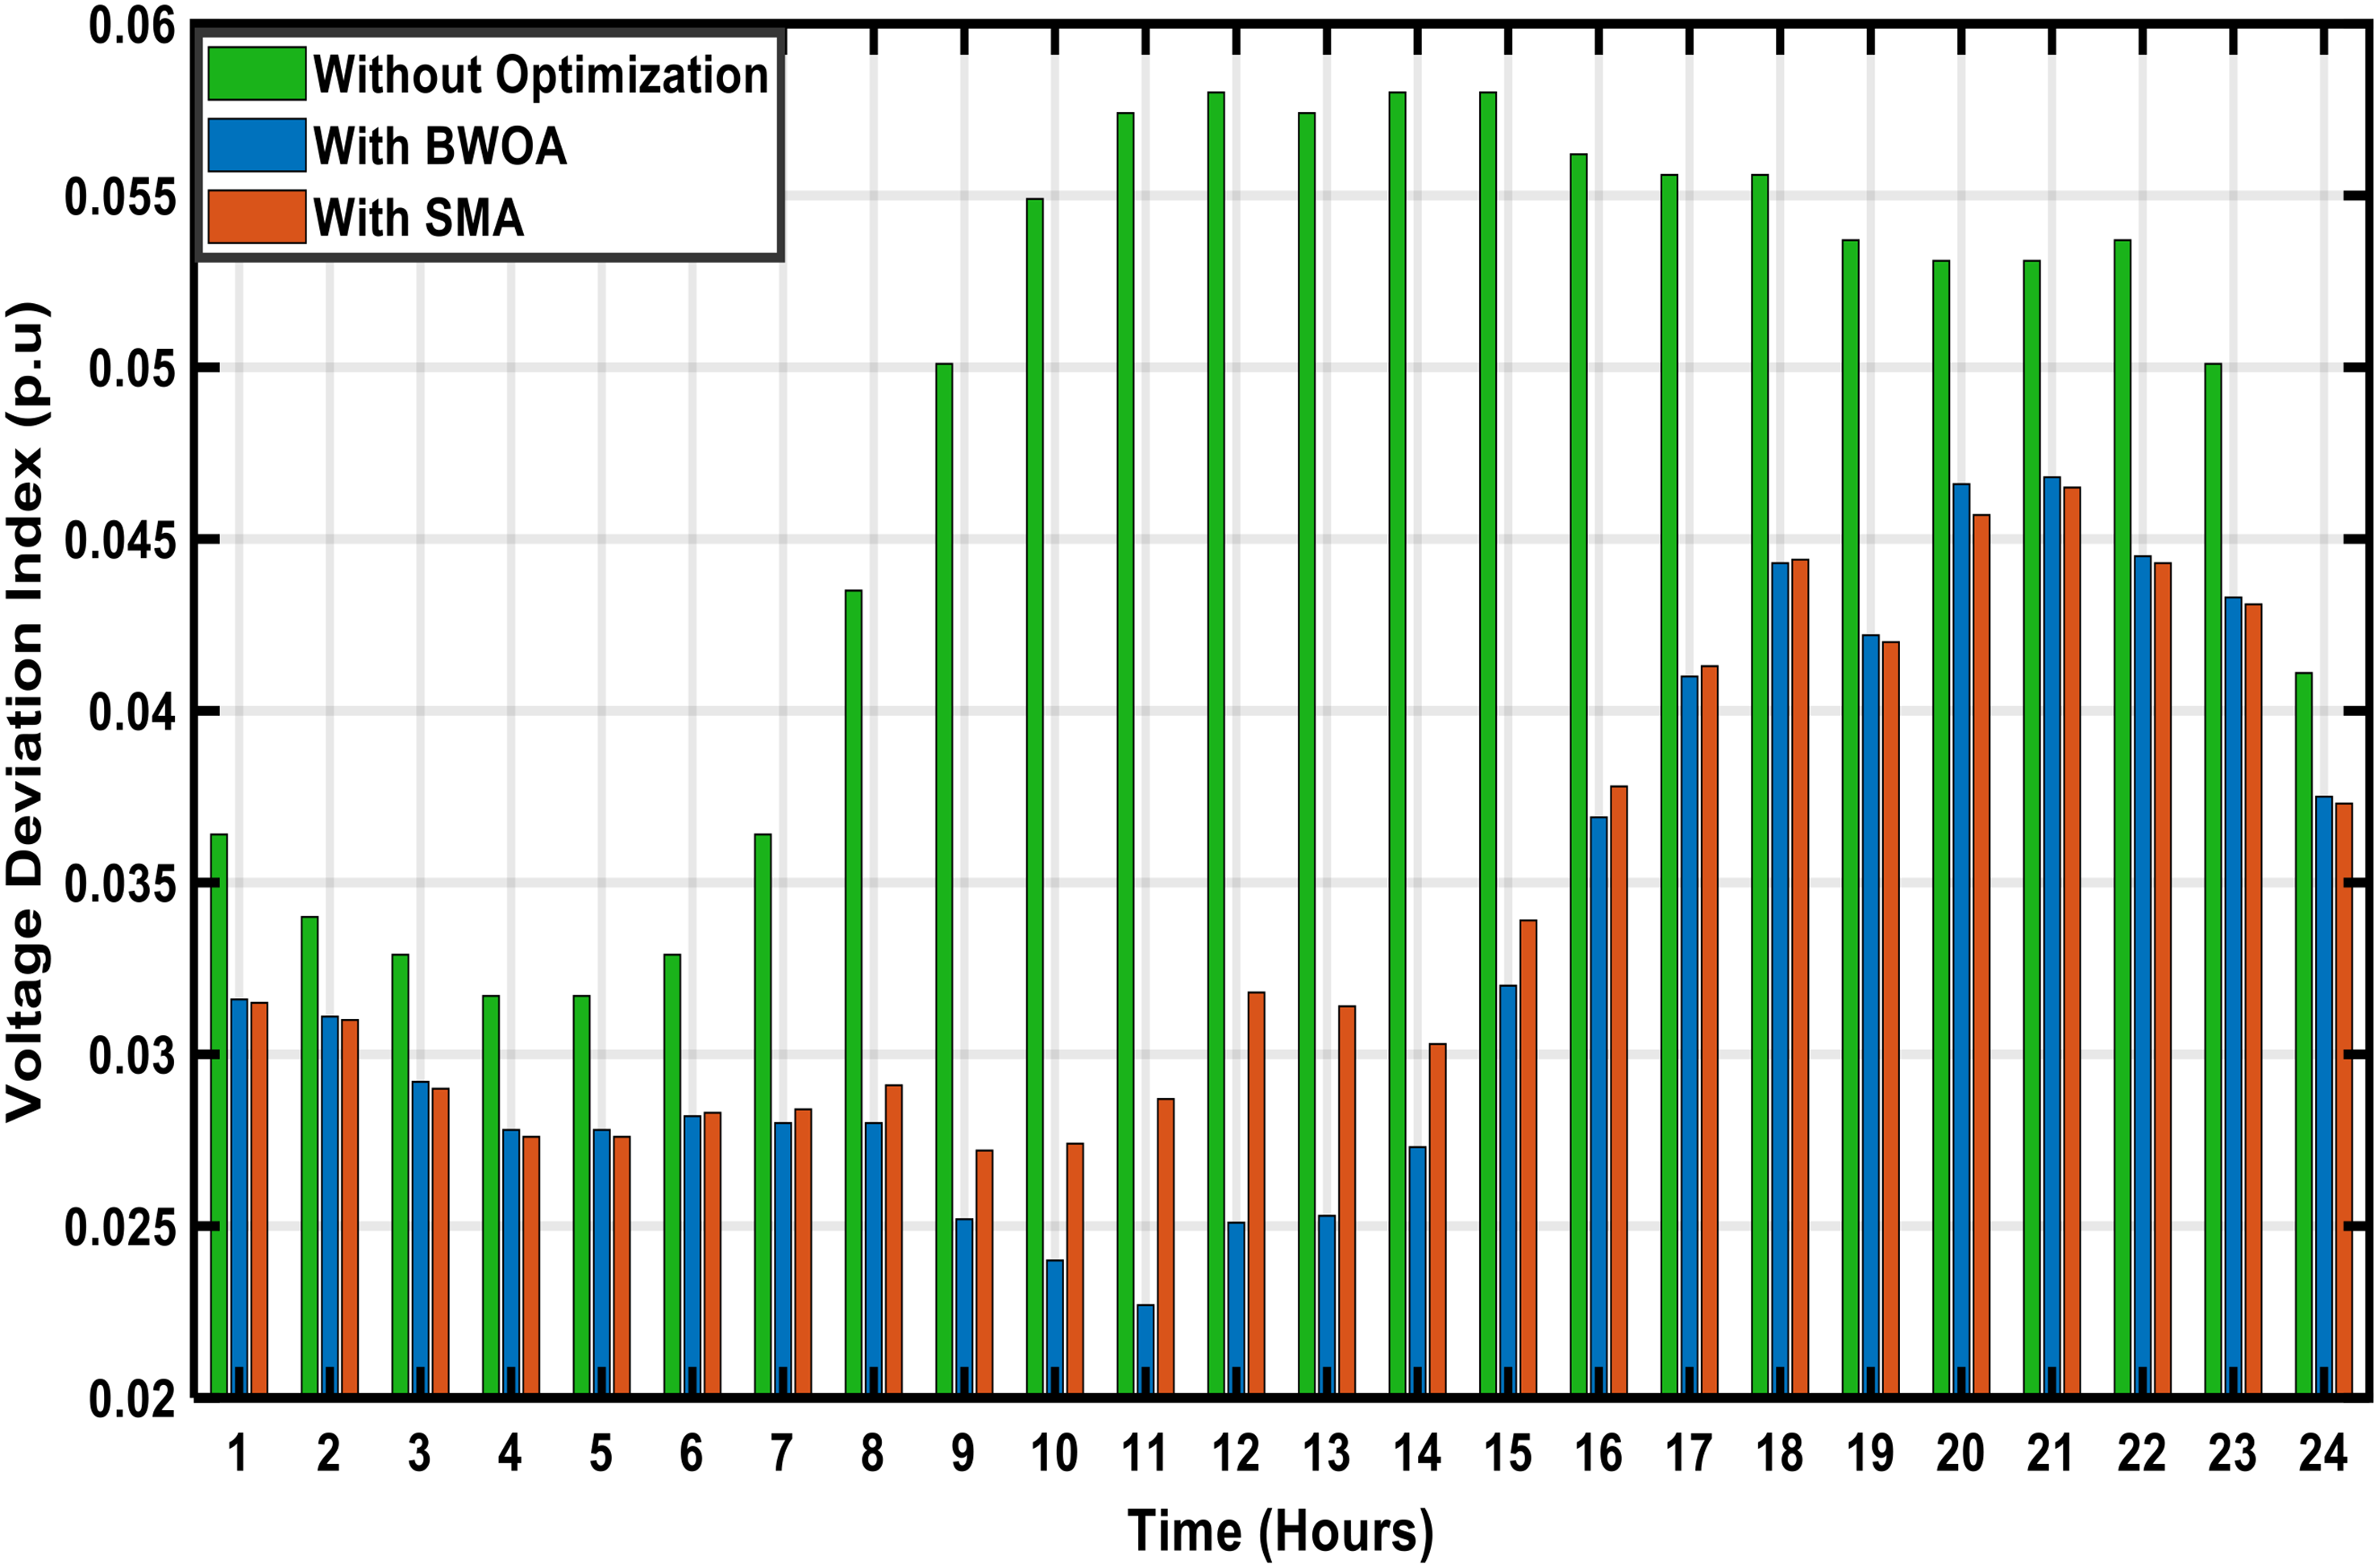
Hourly VDI with and without optimization. BWOA: Black Widow Optimization Algorithm; SMA: slime mould algorithm; VDI: voltage deviation index.
Overall, the results demonstrate that BWOA consistently outperforms SMA in reducing voltage deviations, leading to enhanced voltage stability and improved power quality. The optimized placement and sizing of PV-DGs, DSTATCOMs, and EVCSs using BWOA lead to better voltage regulation, ensuring that PDNs operate efficiently under high EV penetration scenarios. These findings highlight the importance of optimizing voltage profiles to enhance grid resilience, reduce power losses, and improve overall system performance, making BWOA a more effective optimization strategy for modern PDNs.
Analysis of VSI
Voltage stability is the core of PDN functioning, providing assured power supply, voltage collapse prevention, and enhanced grid reliability. VSI is one of the essential measures to gauge the resilience of the system against voltage instability. Higher VSI implies superior voltage stability, minimizing the risk of voltage fluctuations that can cause power supply disruptions. This section considers the VSI performance for a 24-h period, comparing results with and without optimization and examining how BWOA and SMA are effective in enhancing voltage stability.
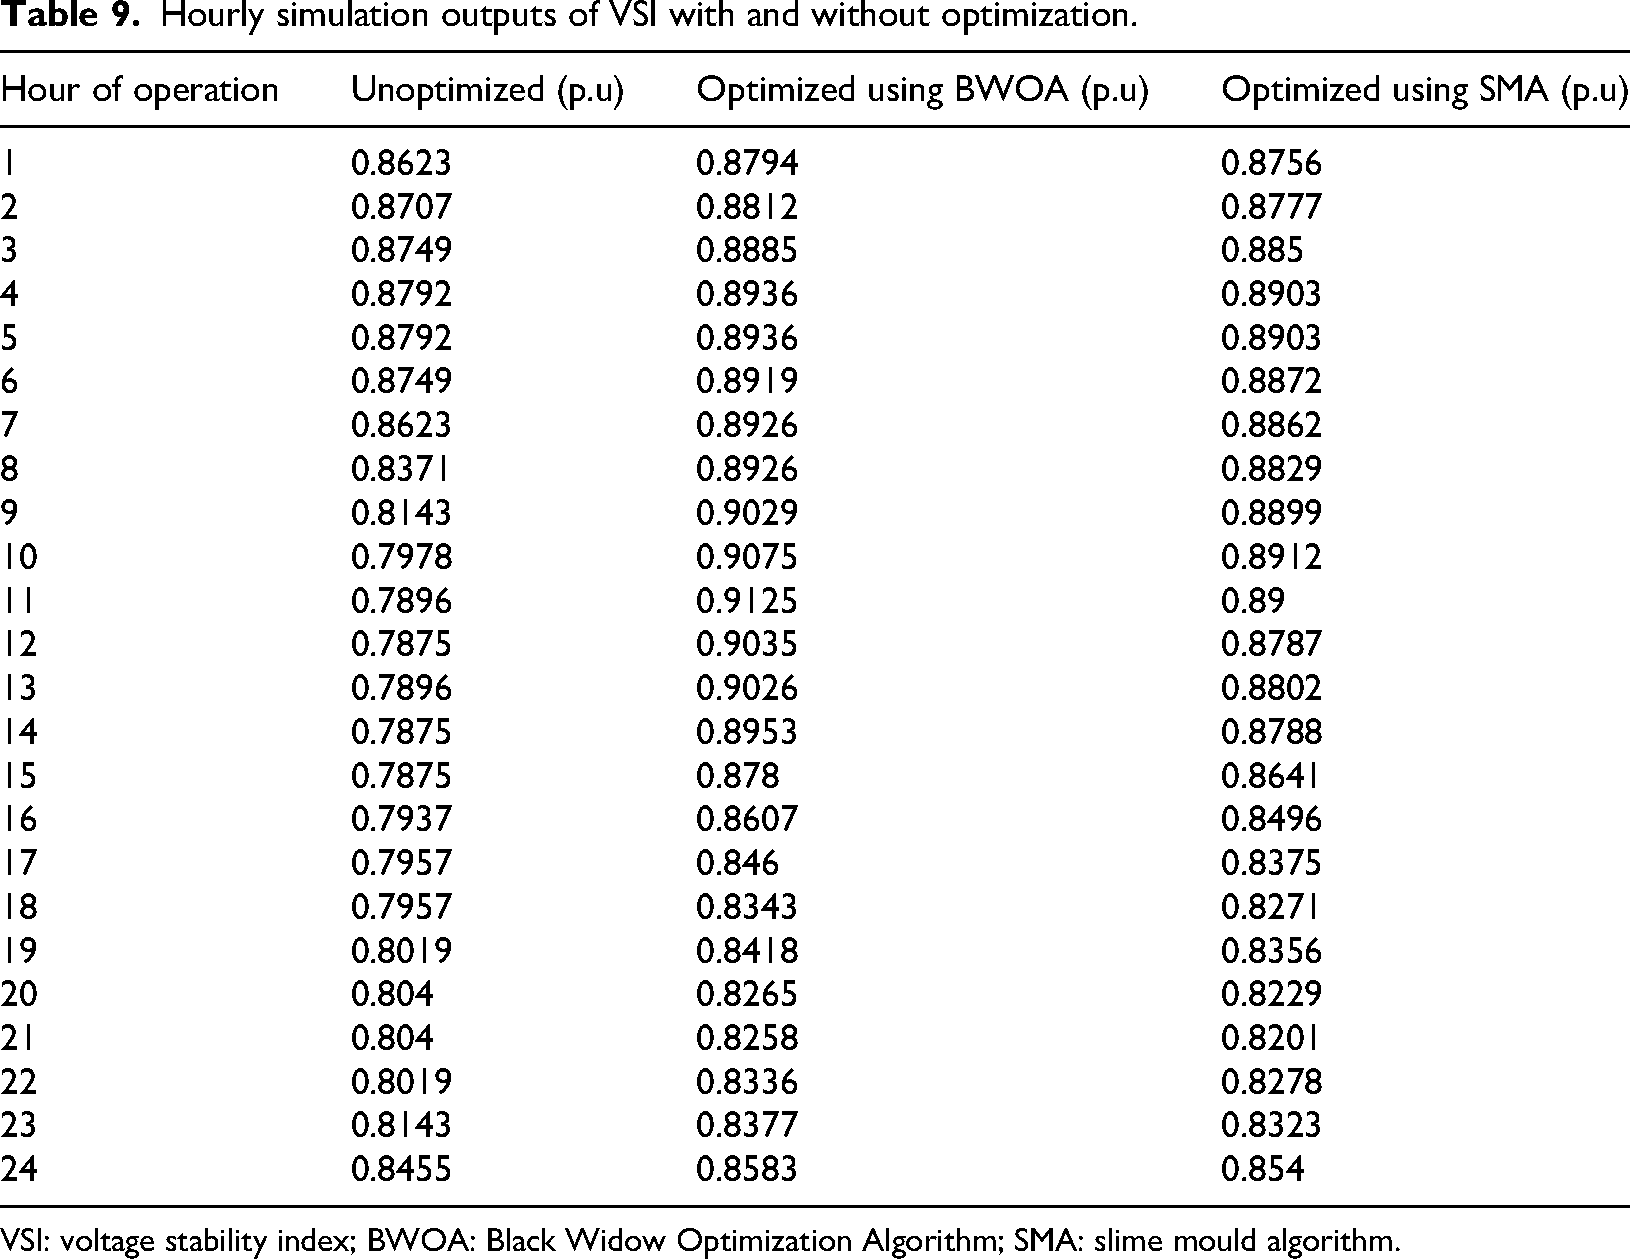
Table 9 shows the VSI values for three cases: without optimization, with BWOA, and with SMA, in terms of hourly values. From the table, it is evident that without optimization, VSI values are very low, especially during peak hours, which means that the PDN is vulnerable to voltage instability under high-loading periods. For instance, during hour 10, the VSI without optimization is 0.7978, which indicates poor voltage stability. When implementing BWOA, however, the VSI scores better at 0.9075, and SMA scores better at 0.8912, which indicates that both optimization methods improve voltage stability better, with BWOA performing better.
Hourly simulation outputs of VSI with and without optimization.
VSI: voltage stability index; BWOA: Black Widow Optimization Algorithm; SMA: slime mould algorithm.
The same pattern is seen at hour 13, where VSI gains 0.7896 without optimization to 0.9026 with the help of BWOA and 0.8802 with SMA, showing an improvement of 14.3% and 11.5%, respectively. The optimization effect is the same at hour 23, where without optimization VSI is 0.7896 but grows to 0.8377 with BWOA and 0.8323 with SMA, showing the proficiency of optimal PV-DG, DSTATCOM, and EVCS locations in ensuring voltage stability.
The benefits of BWOA in improving VSI become more evident during peak demand periods (hours 9–15 and 18–23), when voltage fluctuations are at their highest. For example, at hour 12, VSI is significantly enhanced from 0.7875 (without optimization) to 0.9035 with BWOA, while SMA results in 0.8787, indicating a 14.7% improvement under BWOA and 11.6% under SMA. This demonstrates that BWOA optimally distributes voltage support, preventing excessive deviations that could compromise system stability.
Figure 12 provides a graphical representation of VSI trends across the 24-h period, confirming that BWOA consistently maintains higher VSI values compared to SMA. The differences between BWOA and SMA become more pronounced during high-load conditions, further validating the effectiveness of BWOA in strengthening voltage stability. For example, at hour 18, VSI under BWOA is 0.8343, while SMA achieves only 0.8271, indicating that BWOA ensures better voltage regulation even during periods of high EV charging demand. Overall, the results from Table 9 and Figure 12 demonstrate that BWOA provides superior voltage stability improvements compared to SMA, particularly under dynamic load conditions associated with EVCS integration. The optimized placement and sizing of PV-DGs, DSTATCOMs, and EVCSs using BWOA contribute to higher VSI values, ensuring that the PDN operates more efficiently and remains resilient against voltage disturbances. By mitigating voltage instability, BWOA enhances grid reliability, improves power quality, and ensures sustainable operation in modern PDNs with high EV penetration, making it a highly effective optimization strategy for voltage regulation.
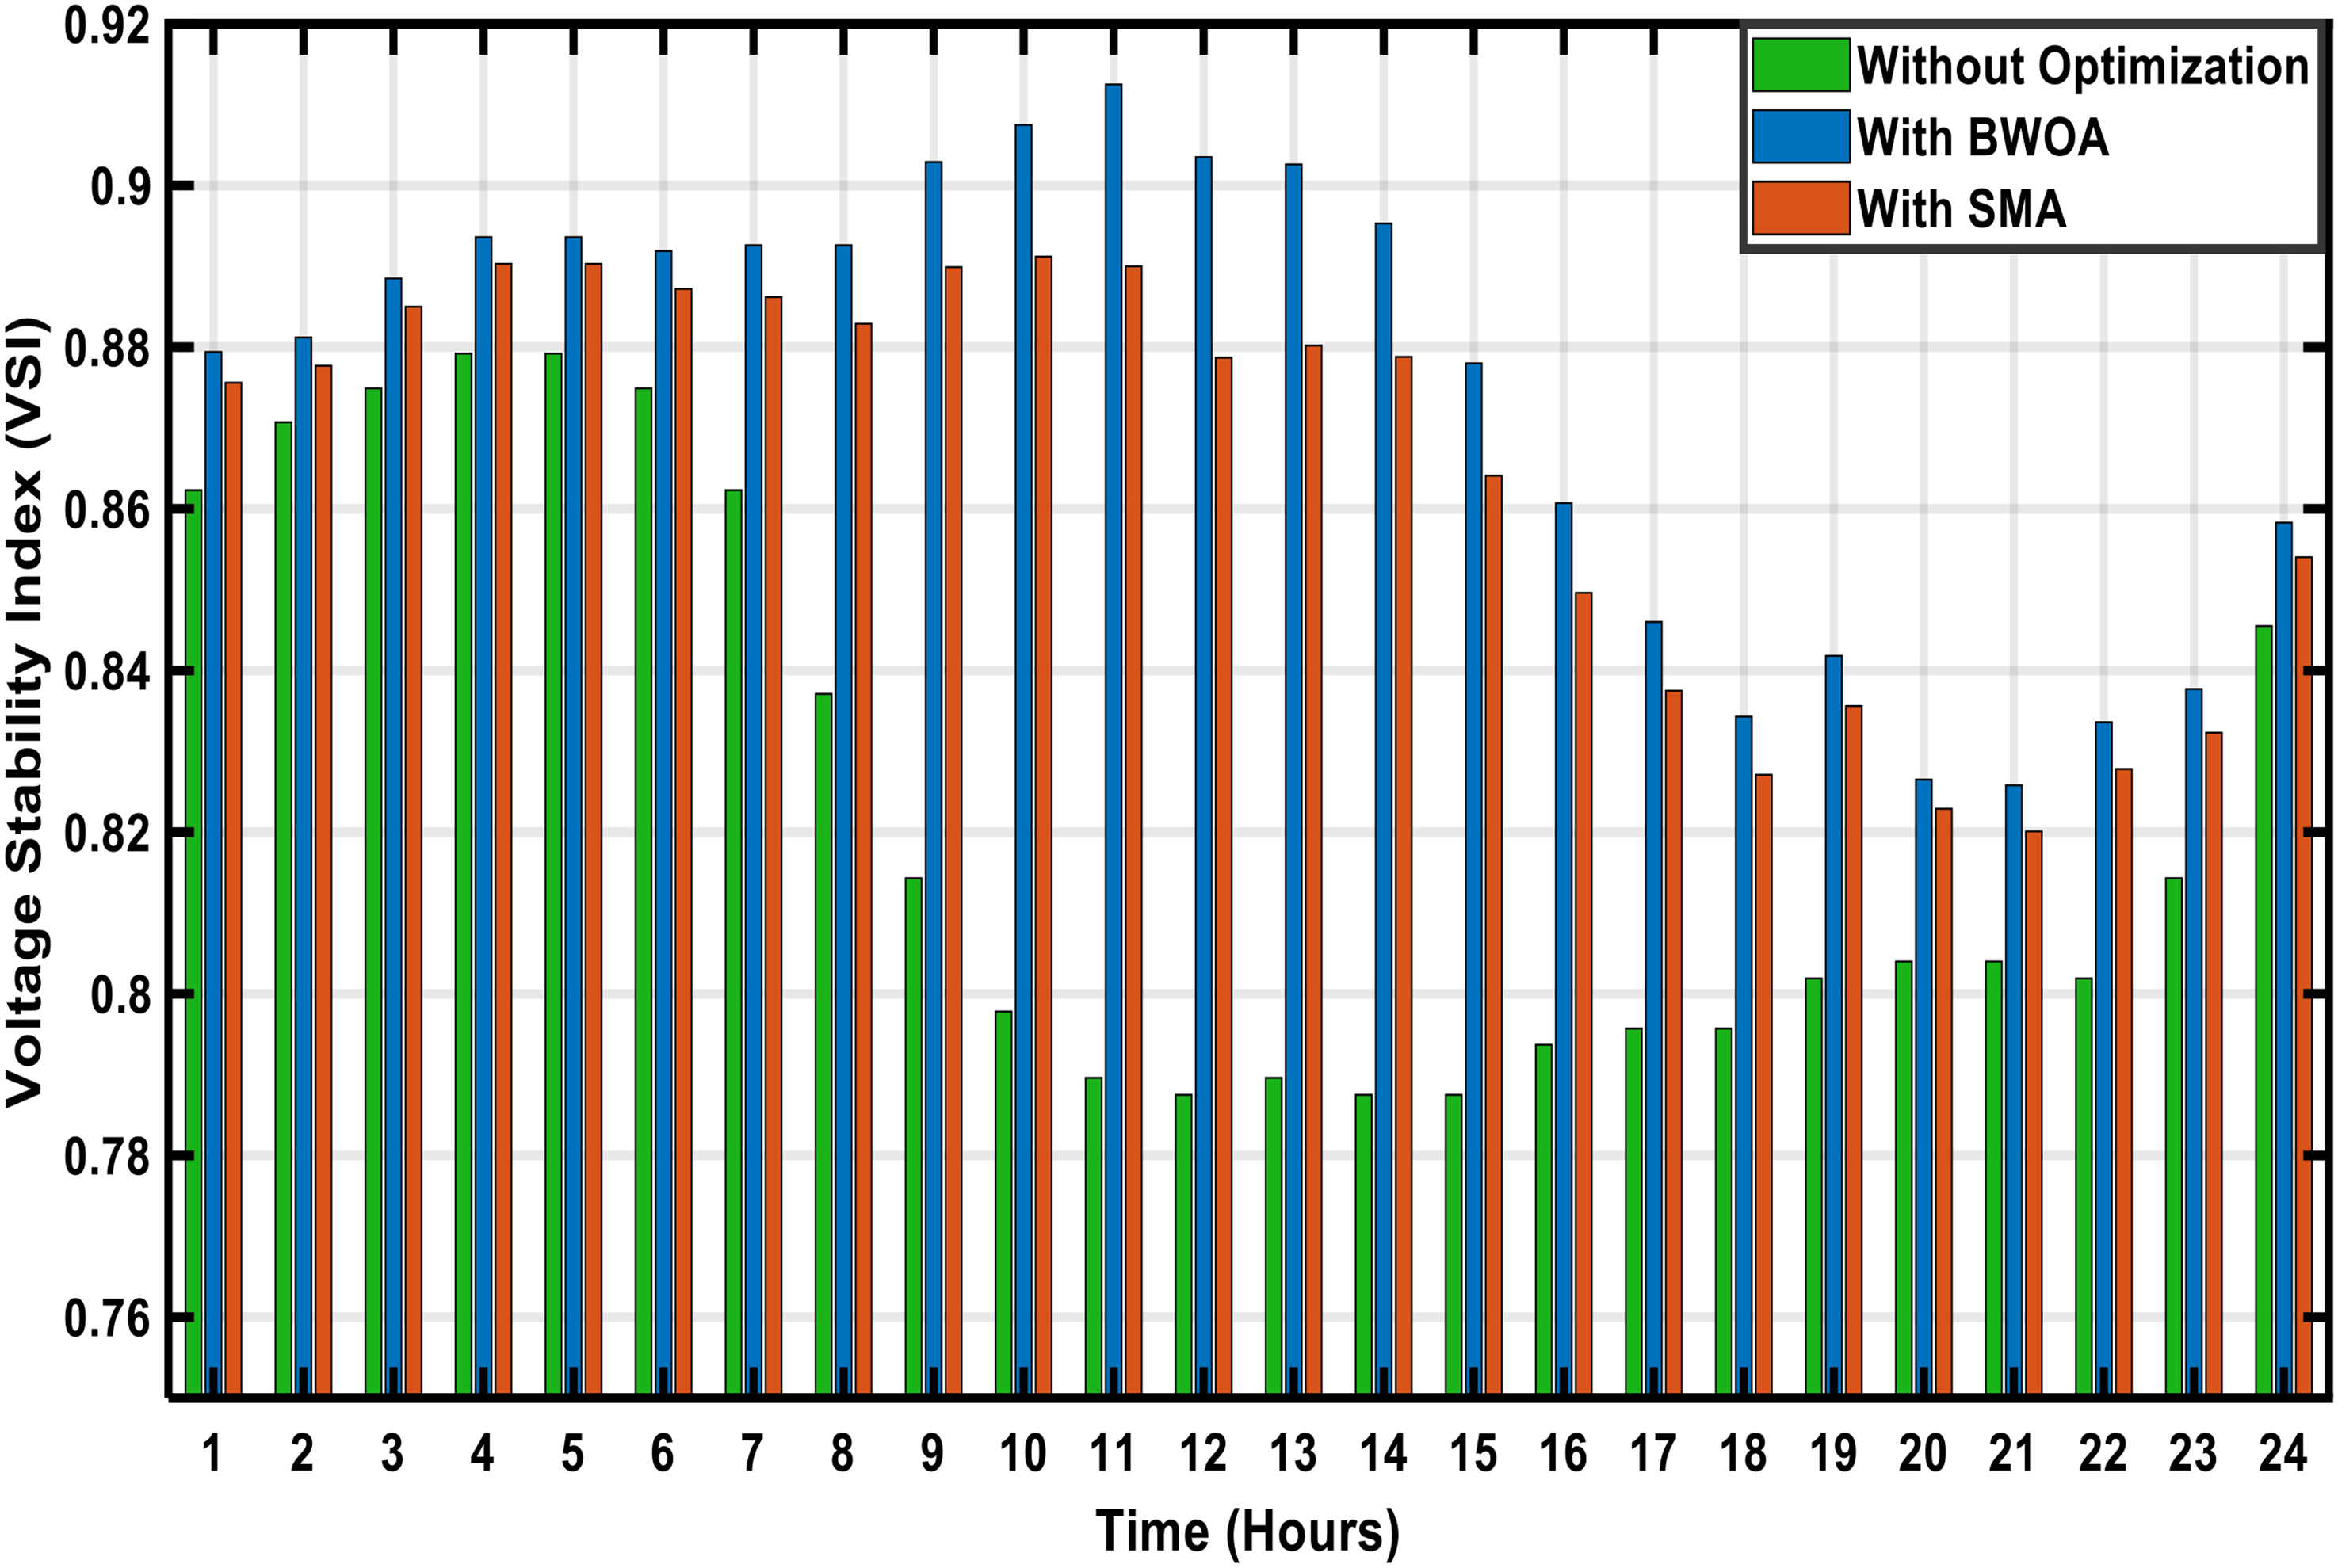
Hourly VSI with and without optimization. BWOA: Black Widow Optimization Algorithm; SMA: slime mould algorithm; VSI: voltage stability index.
Analysis of cost
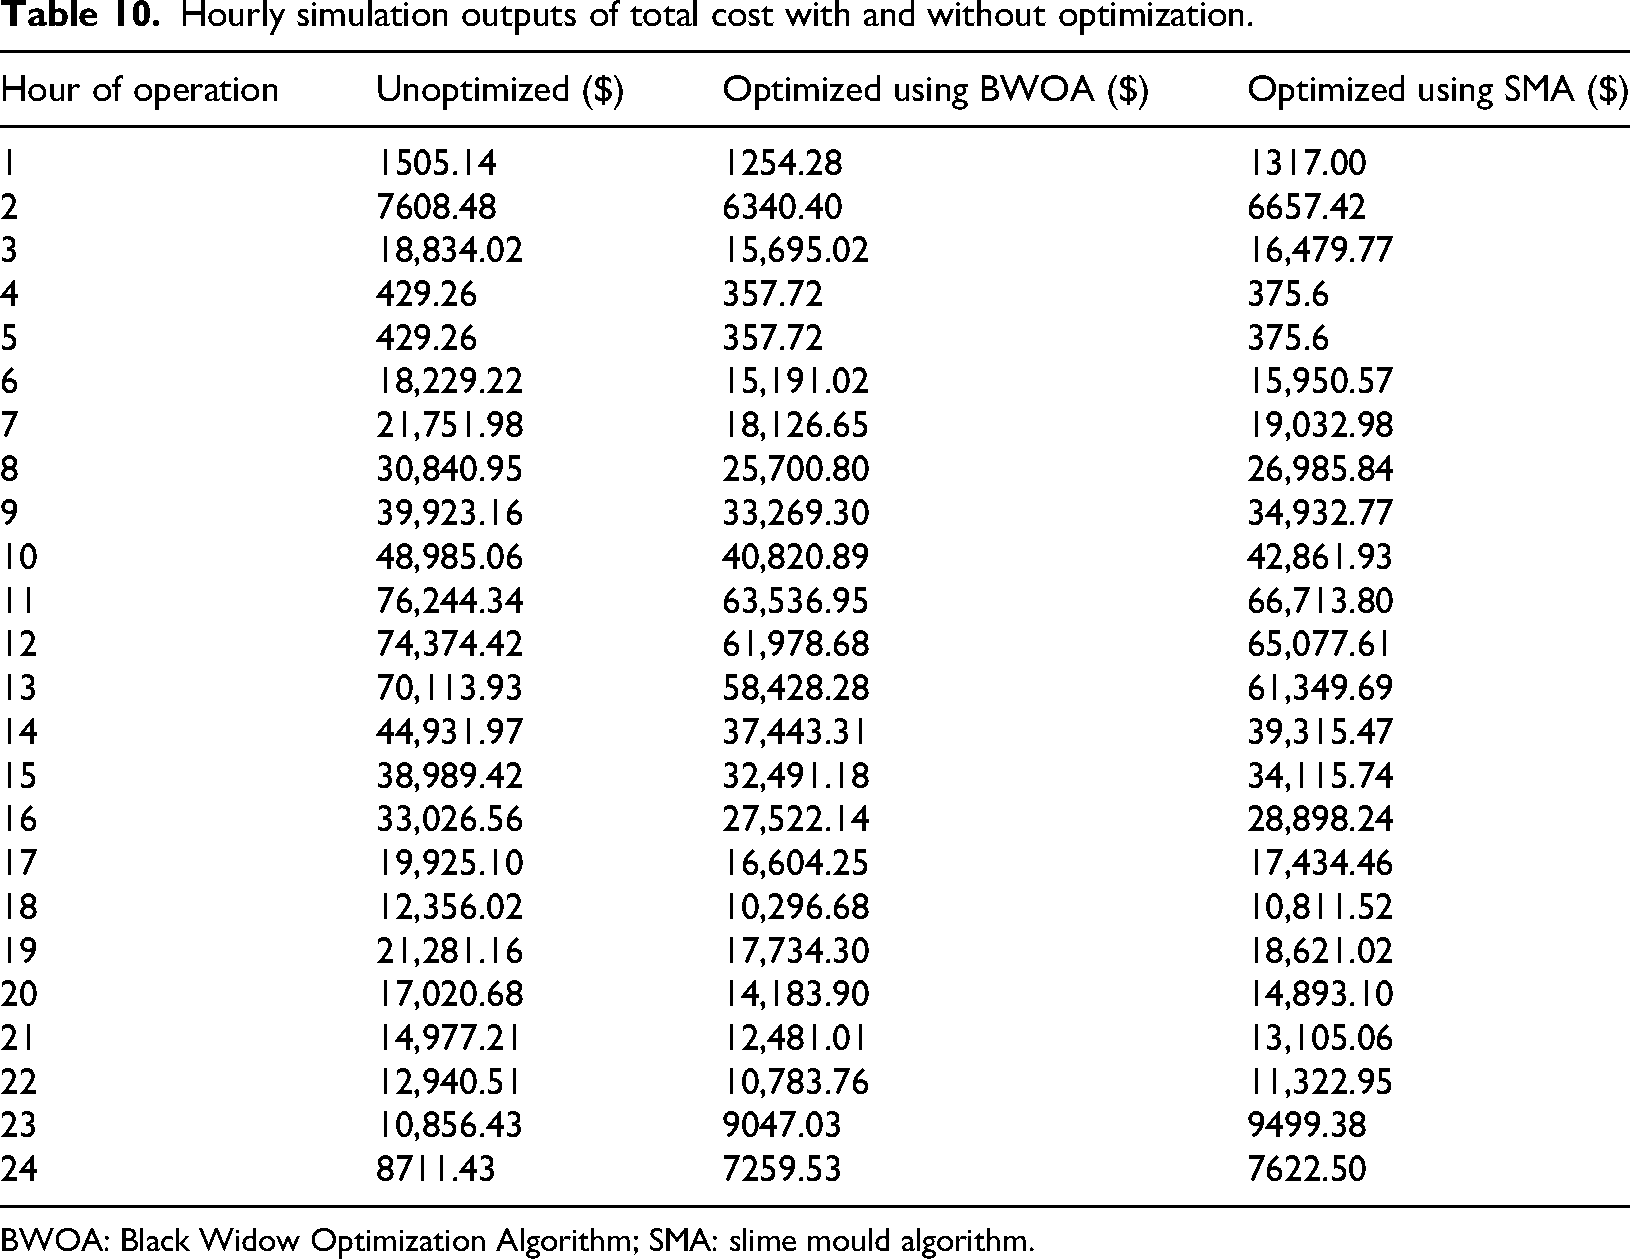
Cost minimization is a critical factor in the operation and planning of PDNs, as it directly affects the economic viability of distributed energy integration. The incorporation of PV-DG, DSTATCOM, and EVCS requires not only technical validation but also an evaluation of the financial impact to ensure long-term sustainability. This section presents the 24-h cost analysis under three cases: without optimization, with BWOA, and with SMA. The results, summarized in Table 10, highlight the effectiveness of optimal allocation strategies in reducing operational costs.
Hourly simulation outputs of total cost with and without optimization.
BWOA: Black Widow Optimization Algorithm; SMA: slime mould algorithm.
As observed, the “without optimization” case yields significantly higher costs, especially during peak demand hours. For instance, at hour 11, the total cost without optimization reaches $76,244.34 compared to $63,536.95 with BWOA and $66,713.80 with SMA. This corresponds to a cost reduction of approximately 16.7% under BWOA and 14.3% under SMA, with BWOA providing superior performance.
Similarly, during hour 12, the cost decreases from $74,374.42 (no optimization) to $61,978.68 (BWOA) and $65,077.61 (SMA), translating into savings of 16.7% and 14.9%, respectively. The impact of optimization is also evident during off-peak periods. At hour 23, for example, the cost reduces from $10,856.43 without optimization to $9047.03 with BWOA and $9499.38 with SMA, showing that optimization benefits are consistent throughout the day, not only during peak loading conditions.
Overall, the 24-h cost profile demonstrates that BWOA achieves greater cost savings compared to SMA across all hours. On average, BWOA reduces the operational cost by approximately 15–20% compared to the nonoptimized scenario, while SMA achieves 12–16% savings. These findings confirm the superiority of BWOA in achieving near-global optimality in distributed asset allocation, thereby minimizing system costs and ensuring more efficient PDN operation.
Figure 13 illustrates the variation of the total system cost over a 24-h period, showing that the proposed BWOA consistently achieves lower operational costs compared to SMA. The cost savings are particularly significant during peak-load hours when EV charging demand imposes the greatest stress on the system. For instance, at hour 18, the total cost under BWOA is $16,734, whereas SMA results in $17,142, demonstrating BWOA's ability to minimize system expenditures during critical operating conditions. The overall trend from Table 10 and Figure 13 confirms that the optimized placement and sizing of PV-DGs, DSTATCOMs, and EVCSs using BWOA reduce both capital and O&M costs across all operating hours. By lowering the total cost, BWOA ensures more economical operation, enhances system affordability, and supports sustainable integration of EVCSs and renewable resources. These findings highlight the novelty and advantage of BWOA over SMA, as it not only provides faster convergence and near-global optimality but also achieves significant economic benefits, making it a highly robust optimization strategy for modern distribution networks.
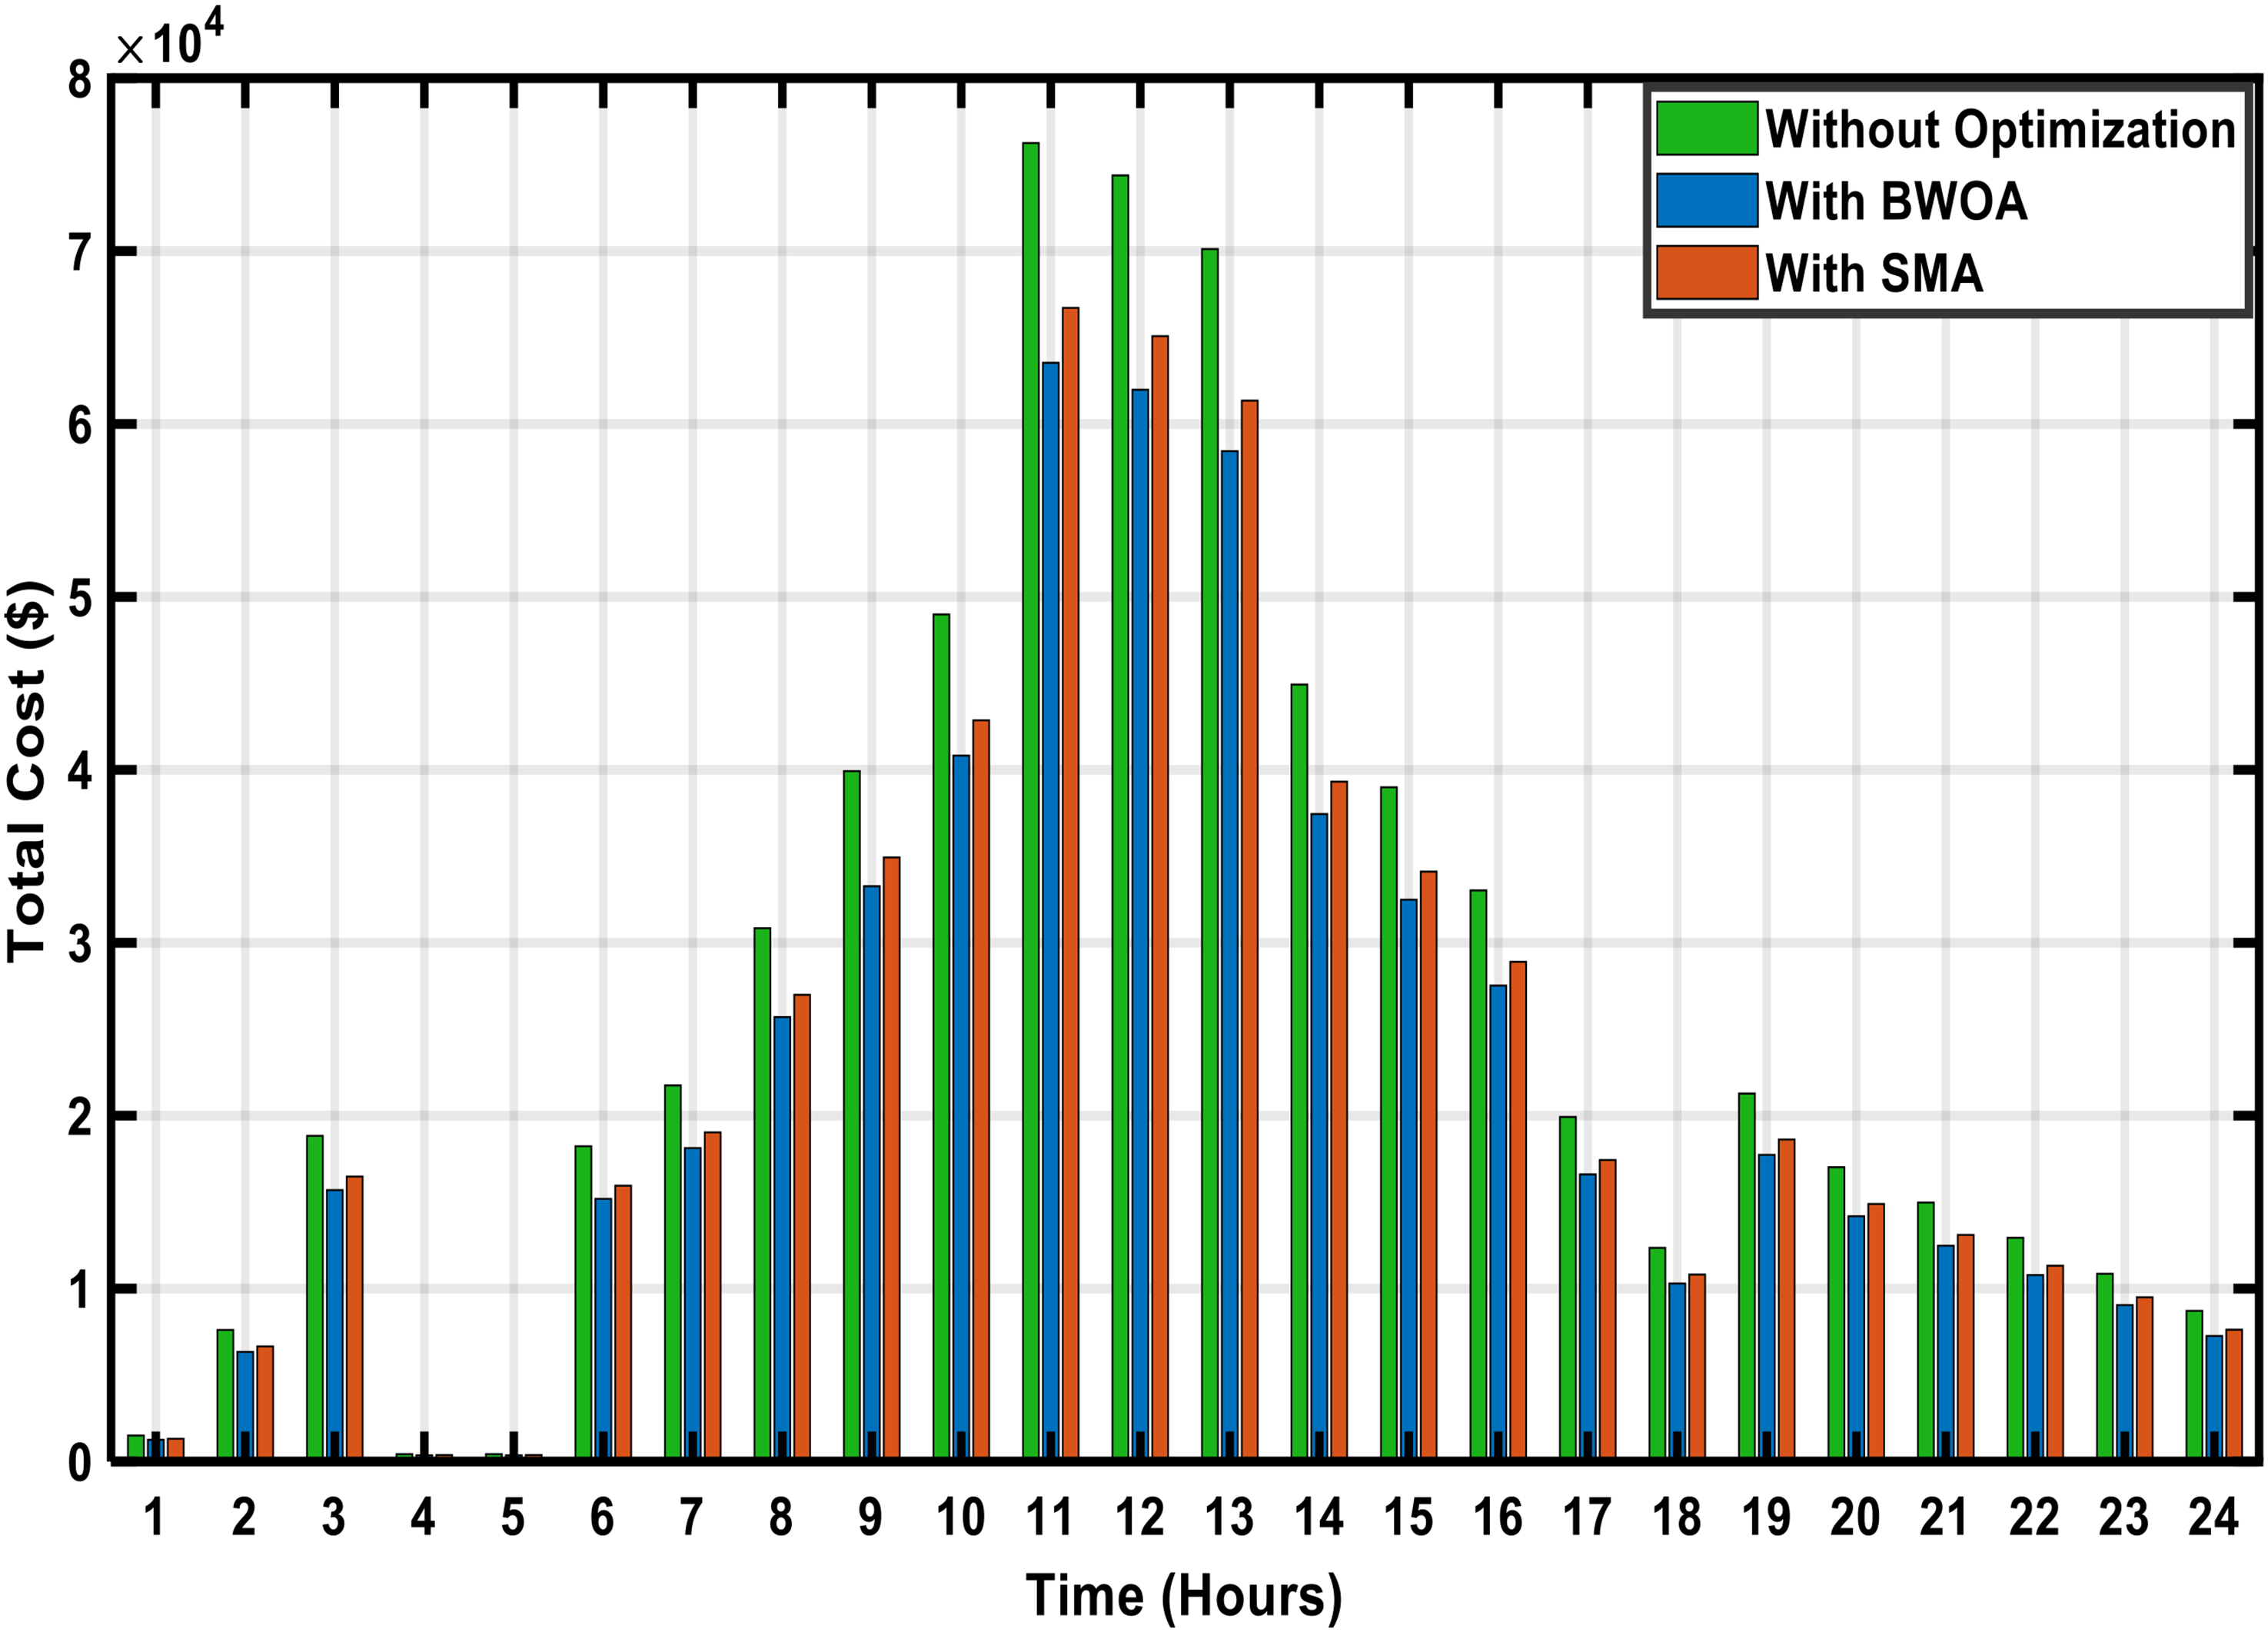
Hourly total cost with and without optimization. BWOA: Black Widow Optimization Algorithm; SMA: slime mould algorithm.
The comparative analysis between BWOA and SMA demonstrates BWOA's superior performance across key PDN parameters, including power losses, voltage stability, and total system cost. As shown in Table 6, BWOA significantly minimizes real power losses, especially during peak hours. At hour 13, losses are reduced to 48.48 kW under BWOA compared to 102.82 kW with SMA, achieving a 52.8% improvement. Similarly, at hour 19, BWOA records 110.6 kW versus 123.72 kW for SMA, a 10.5% reduction. Table 7 highlights reactive power loss reductions, where BWOA achieves 14.41 kVAr at hour 13 against 30.4 kVAr for SMA, marking a 52.6% improvement. In terms of voltage performance, BWOA reduces VDI from 0.0574 to 0.0253, outperforming SMA (0.0314), and enhances VSI from 0.7896 to 0.9026 compared to 0.8802 for SMA. Table 10 shows cost savings, with BWOA achieving $15,892 at hour 13 compared to $16,745 under SMA (5.1% reduction). Overall, results from Tables 6 to 10 and Figures 9 to 14 confirm BWOA's superior capability in minimizing losses, improving voltage stability, and reducing operational costs, making it a more efficient and economically sustainable optimization strategy for high EV penetration scenarios.
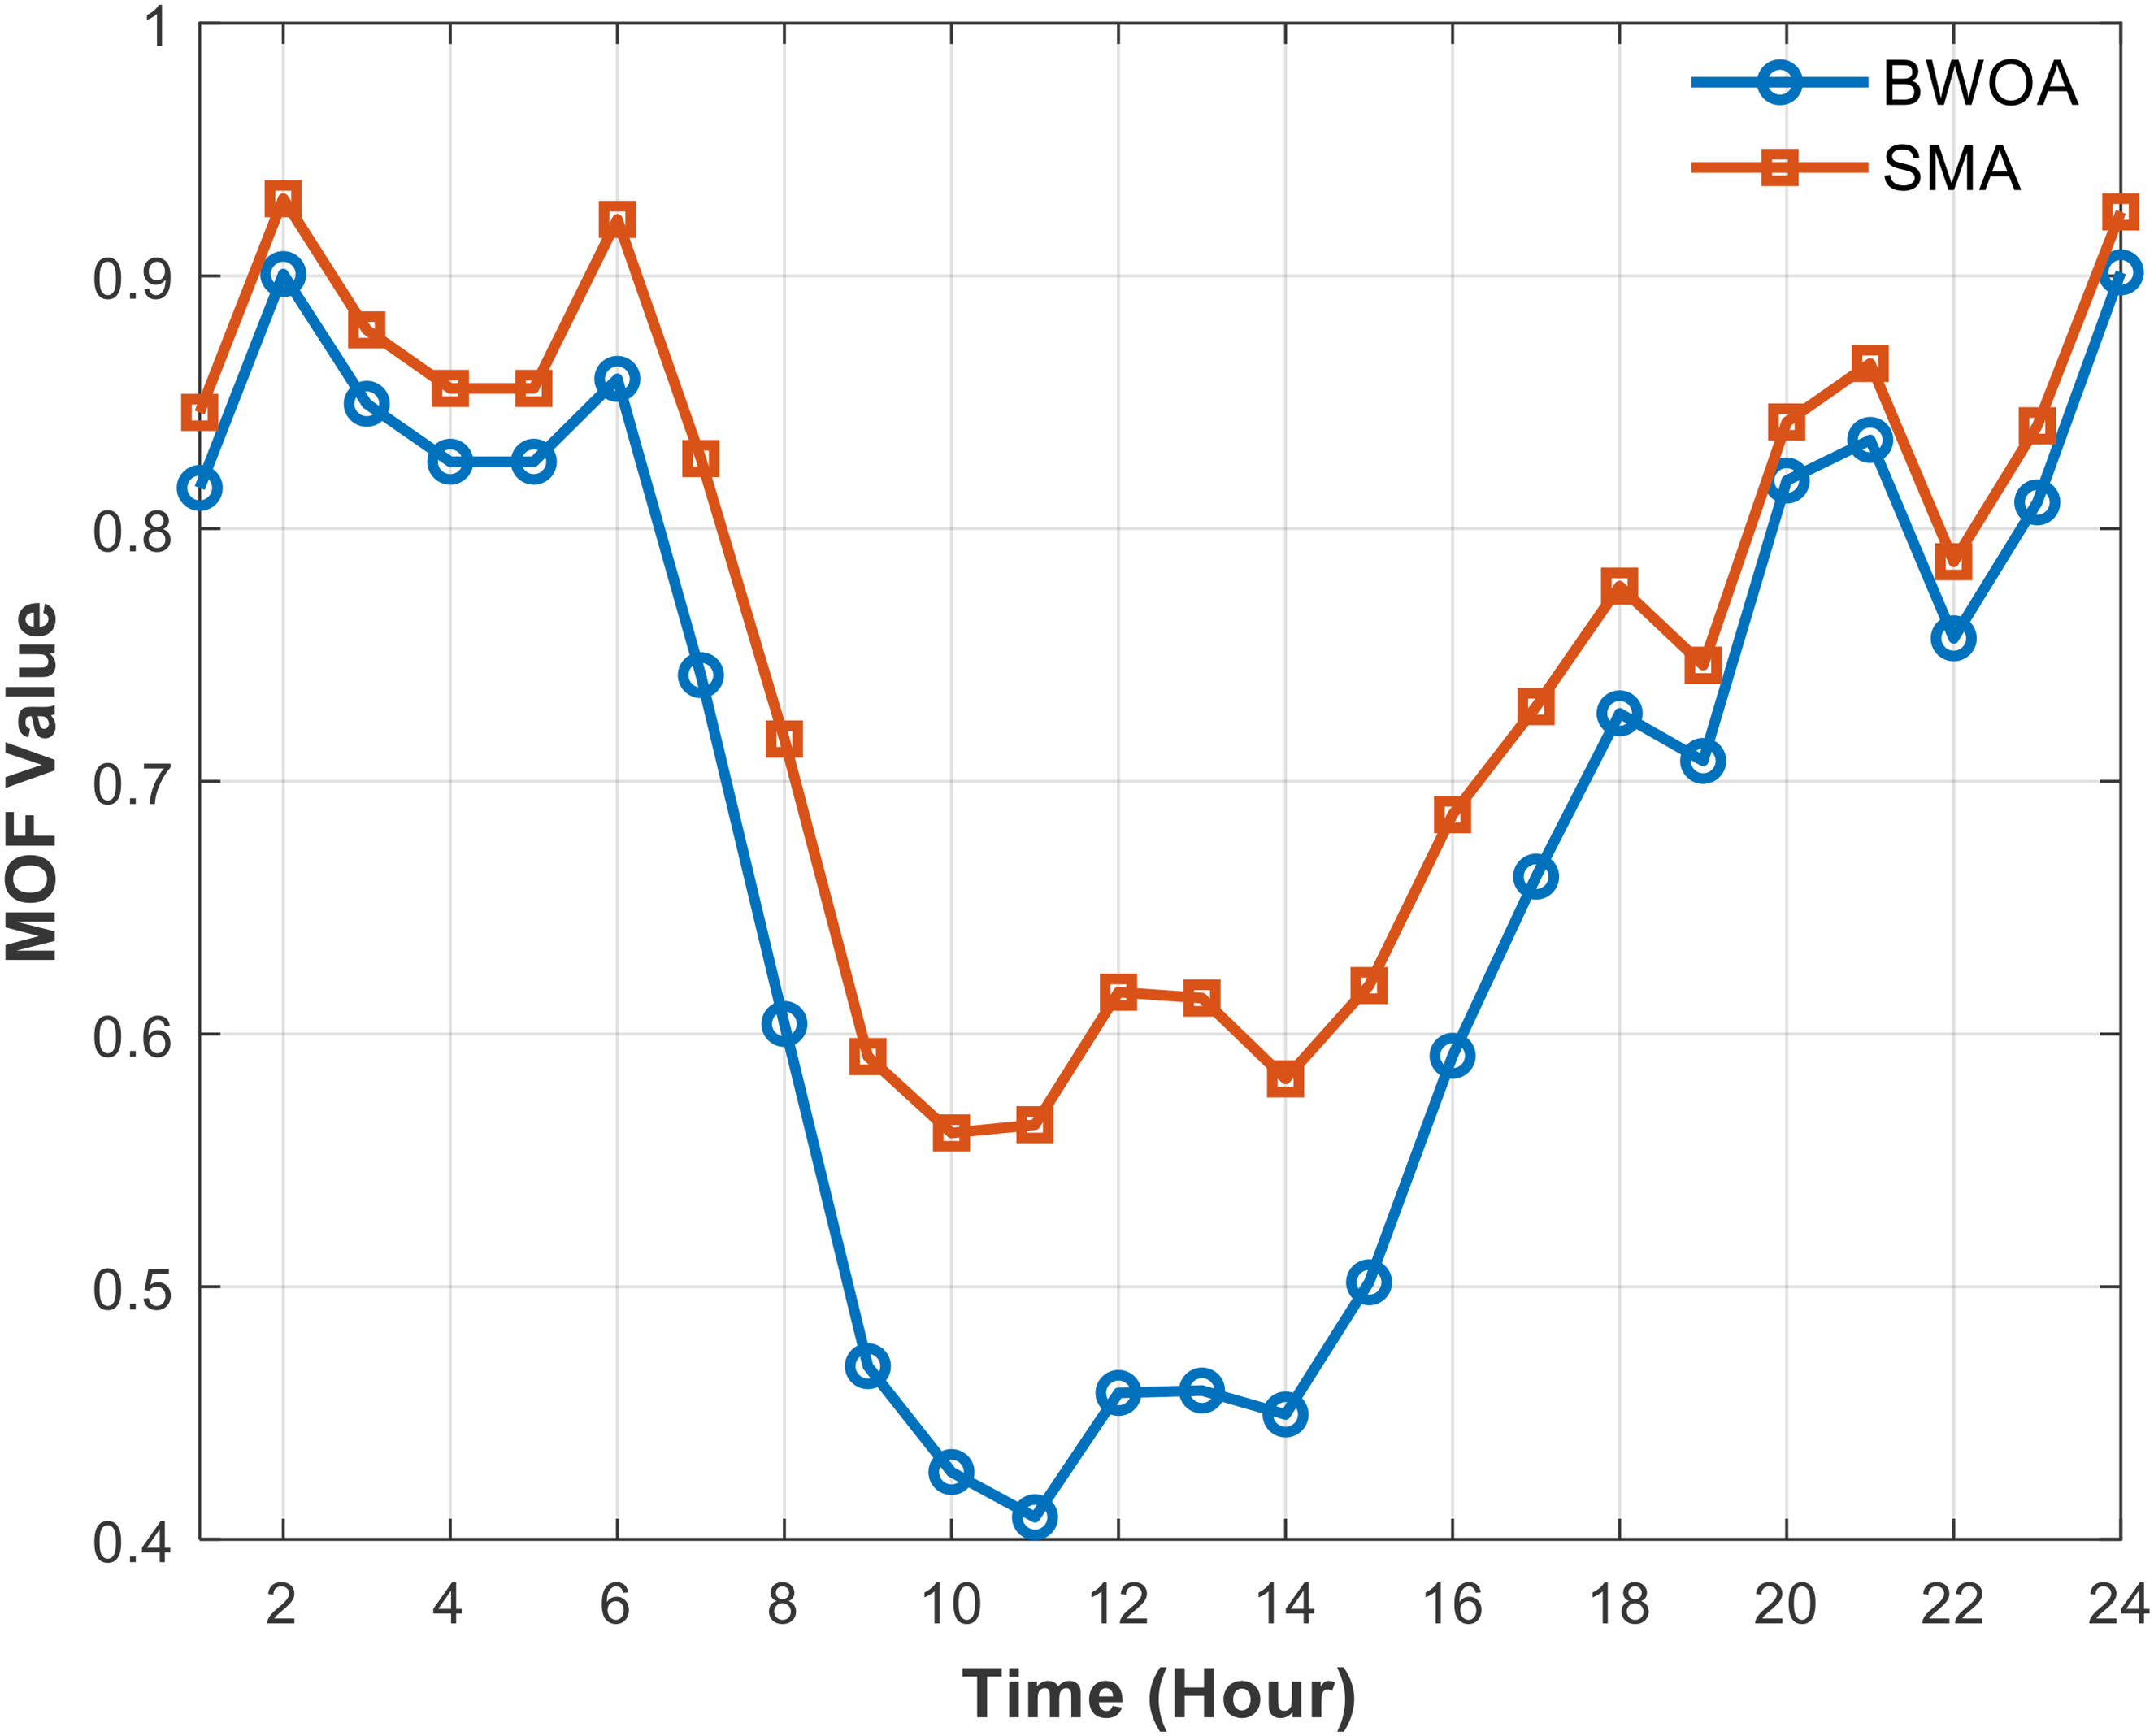
Hourly MOF comparison of BWOA and SMA. BWOA: Black Widow Optimization Algorithm; SMA: slime mould algorithm; MOF: multiobjective function.
Hourly comparative analysis of MOF parameters of BWOA and SMA
To investigate the temporal performance of the optimization algorithms, an hourly comparative analysis of the MOF values obtained from the BWOA and the SMA was conducted.
Table 11 and Figure 14 presents the hourly MOF values obtained using the BWOA and the SMA for the 34-bus test system. A detailed comparison highlights the relative effectiveness of the two algorithms under varying load and operational conditions across a 24-h period. During the early hours (1–6 h), SMA consistently outperforms BWOA, achieving higher MOF values, with the maximum advantage observed at hour 6 (0.922 for SMA vs. 0.859 for BWOA). This trend indicates that SMA is more effective in capturing optimization benefits when the system is lightly loaded or during morning ramp-up conditions. However, as the system load begins to fluctuate in the mid-day interval (7–12 h), BWOA demonstrates competitive performance, particularly at hour 9 where the gap between the two algorithms narrows (0.468 for BWOA vs. 0.591 for SMA). In the late afternoon (13–18 h), SMA again maintains superiority, with significant improvements at hour 16 (0.686 for SMA vs. 0.591 for BWOA) and hour 18 (0.777 for SMA vs. 0.727 for BWOA).
Hourly MOF of BWOA and SMA with weights.
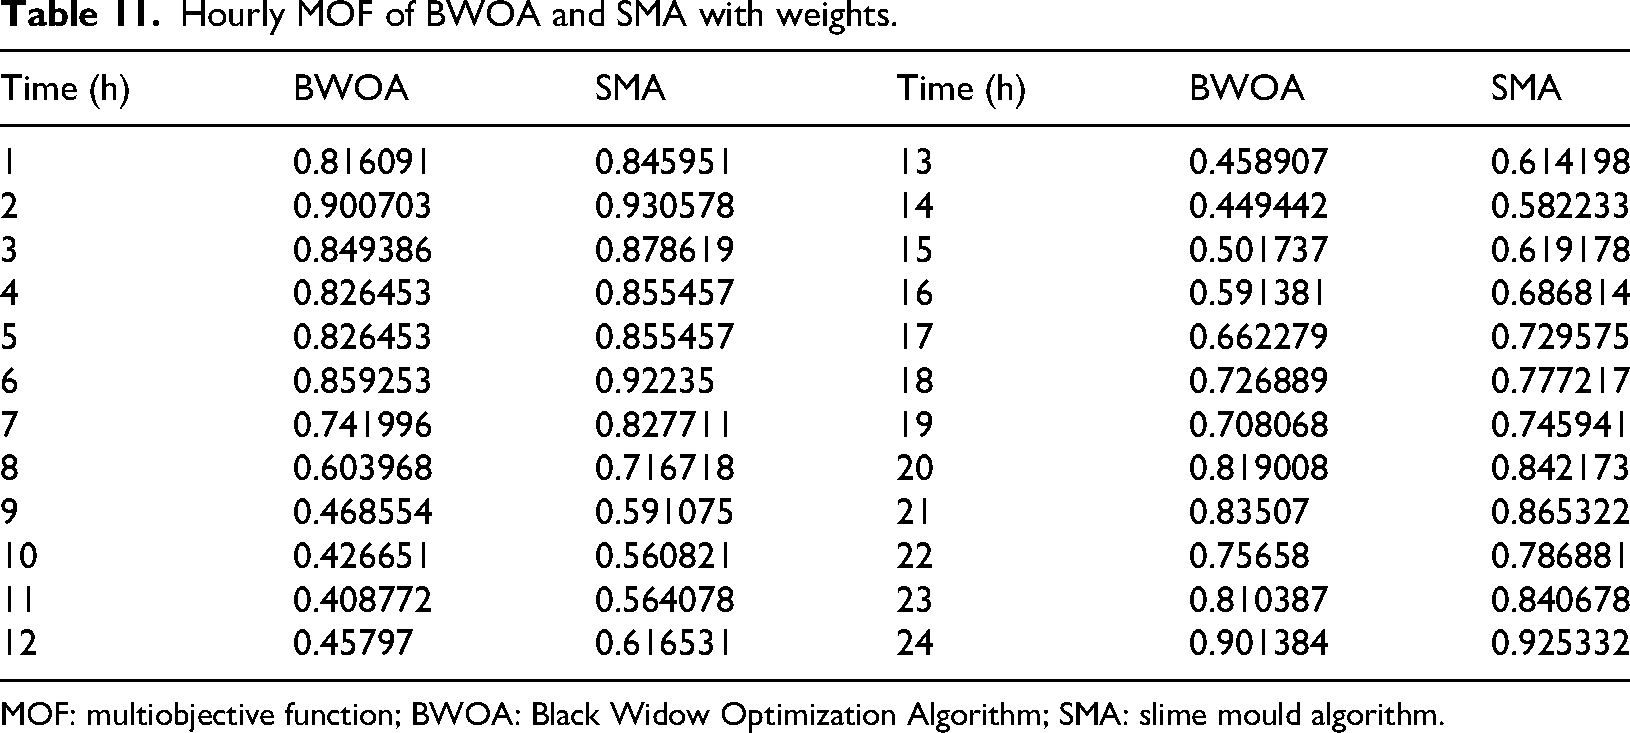
MOF: multiobjective function; BWOA: Black Widow Optimization Algorithm; SMA: slime mould algorithm.
Interestingly, during the evening peak demand hours (19–24 h), the performance difference between the two algorithms diminishes considerably. For example, at hour 20, the MOF values for BWOA and SMA are nearly identical (0.819 and 0.842, respectively), while at hour 21, the difference reduces to just 0.03. In the final operating hours (22–24 h), both algorithms achieve high and stable MOF values, indicating effective system optimization under steady-state load conditions, with SMA marginally outperforming BWOA (0.925 vs. 0.901 at hour 24). Overall, SMA demonstrates stronger performance in most hourly intervals, especially under dynamic or high-load conditions, whereas BWOA achieves near-comparable results during evening hours, reflecting its robustness and adaptability. This comparative hourly analysis validates the capability of both algorithms but highlights SMA's superior convergence and optimization potential in dynamic load environments.
Impact of the number of EVCS units and devices on economic and technical performance
The number of integrated devices, including RDGs, DSTATCOMs, and EVCSs, plays a significant role in influencing both the technical and economic performance of the distribution network. In the proposed study, the optimal configuration of two devices per category was found to yield the best overall system performance, as measured by the MOF, which jointly considers real power losses, reactive power losses, VDI, VSI, and overall operational cost.
As depicted in Figure 15, the MOF value decreases significantly when moving from zero to two devices, demonstrating improved system reliability, voltage stability, and economic efficiency. Specifically, the inclusion of two EVCS units, combined with optimally sized RDGs and DSTATCOMs, minimizes real and reactive power losses by effectively balancing local generation and demand. Simultaneously, the VDI is reduced, indicating that voltage deviations across the IEEE 34-bus system are mitigated, while the VSI improves, showing enhanced network stability.
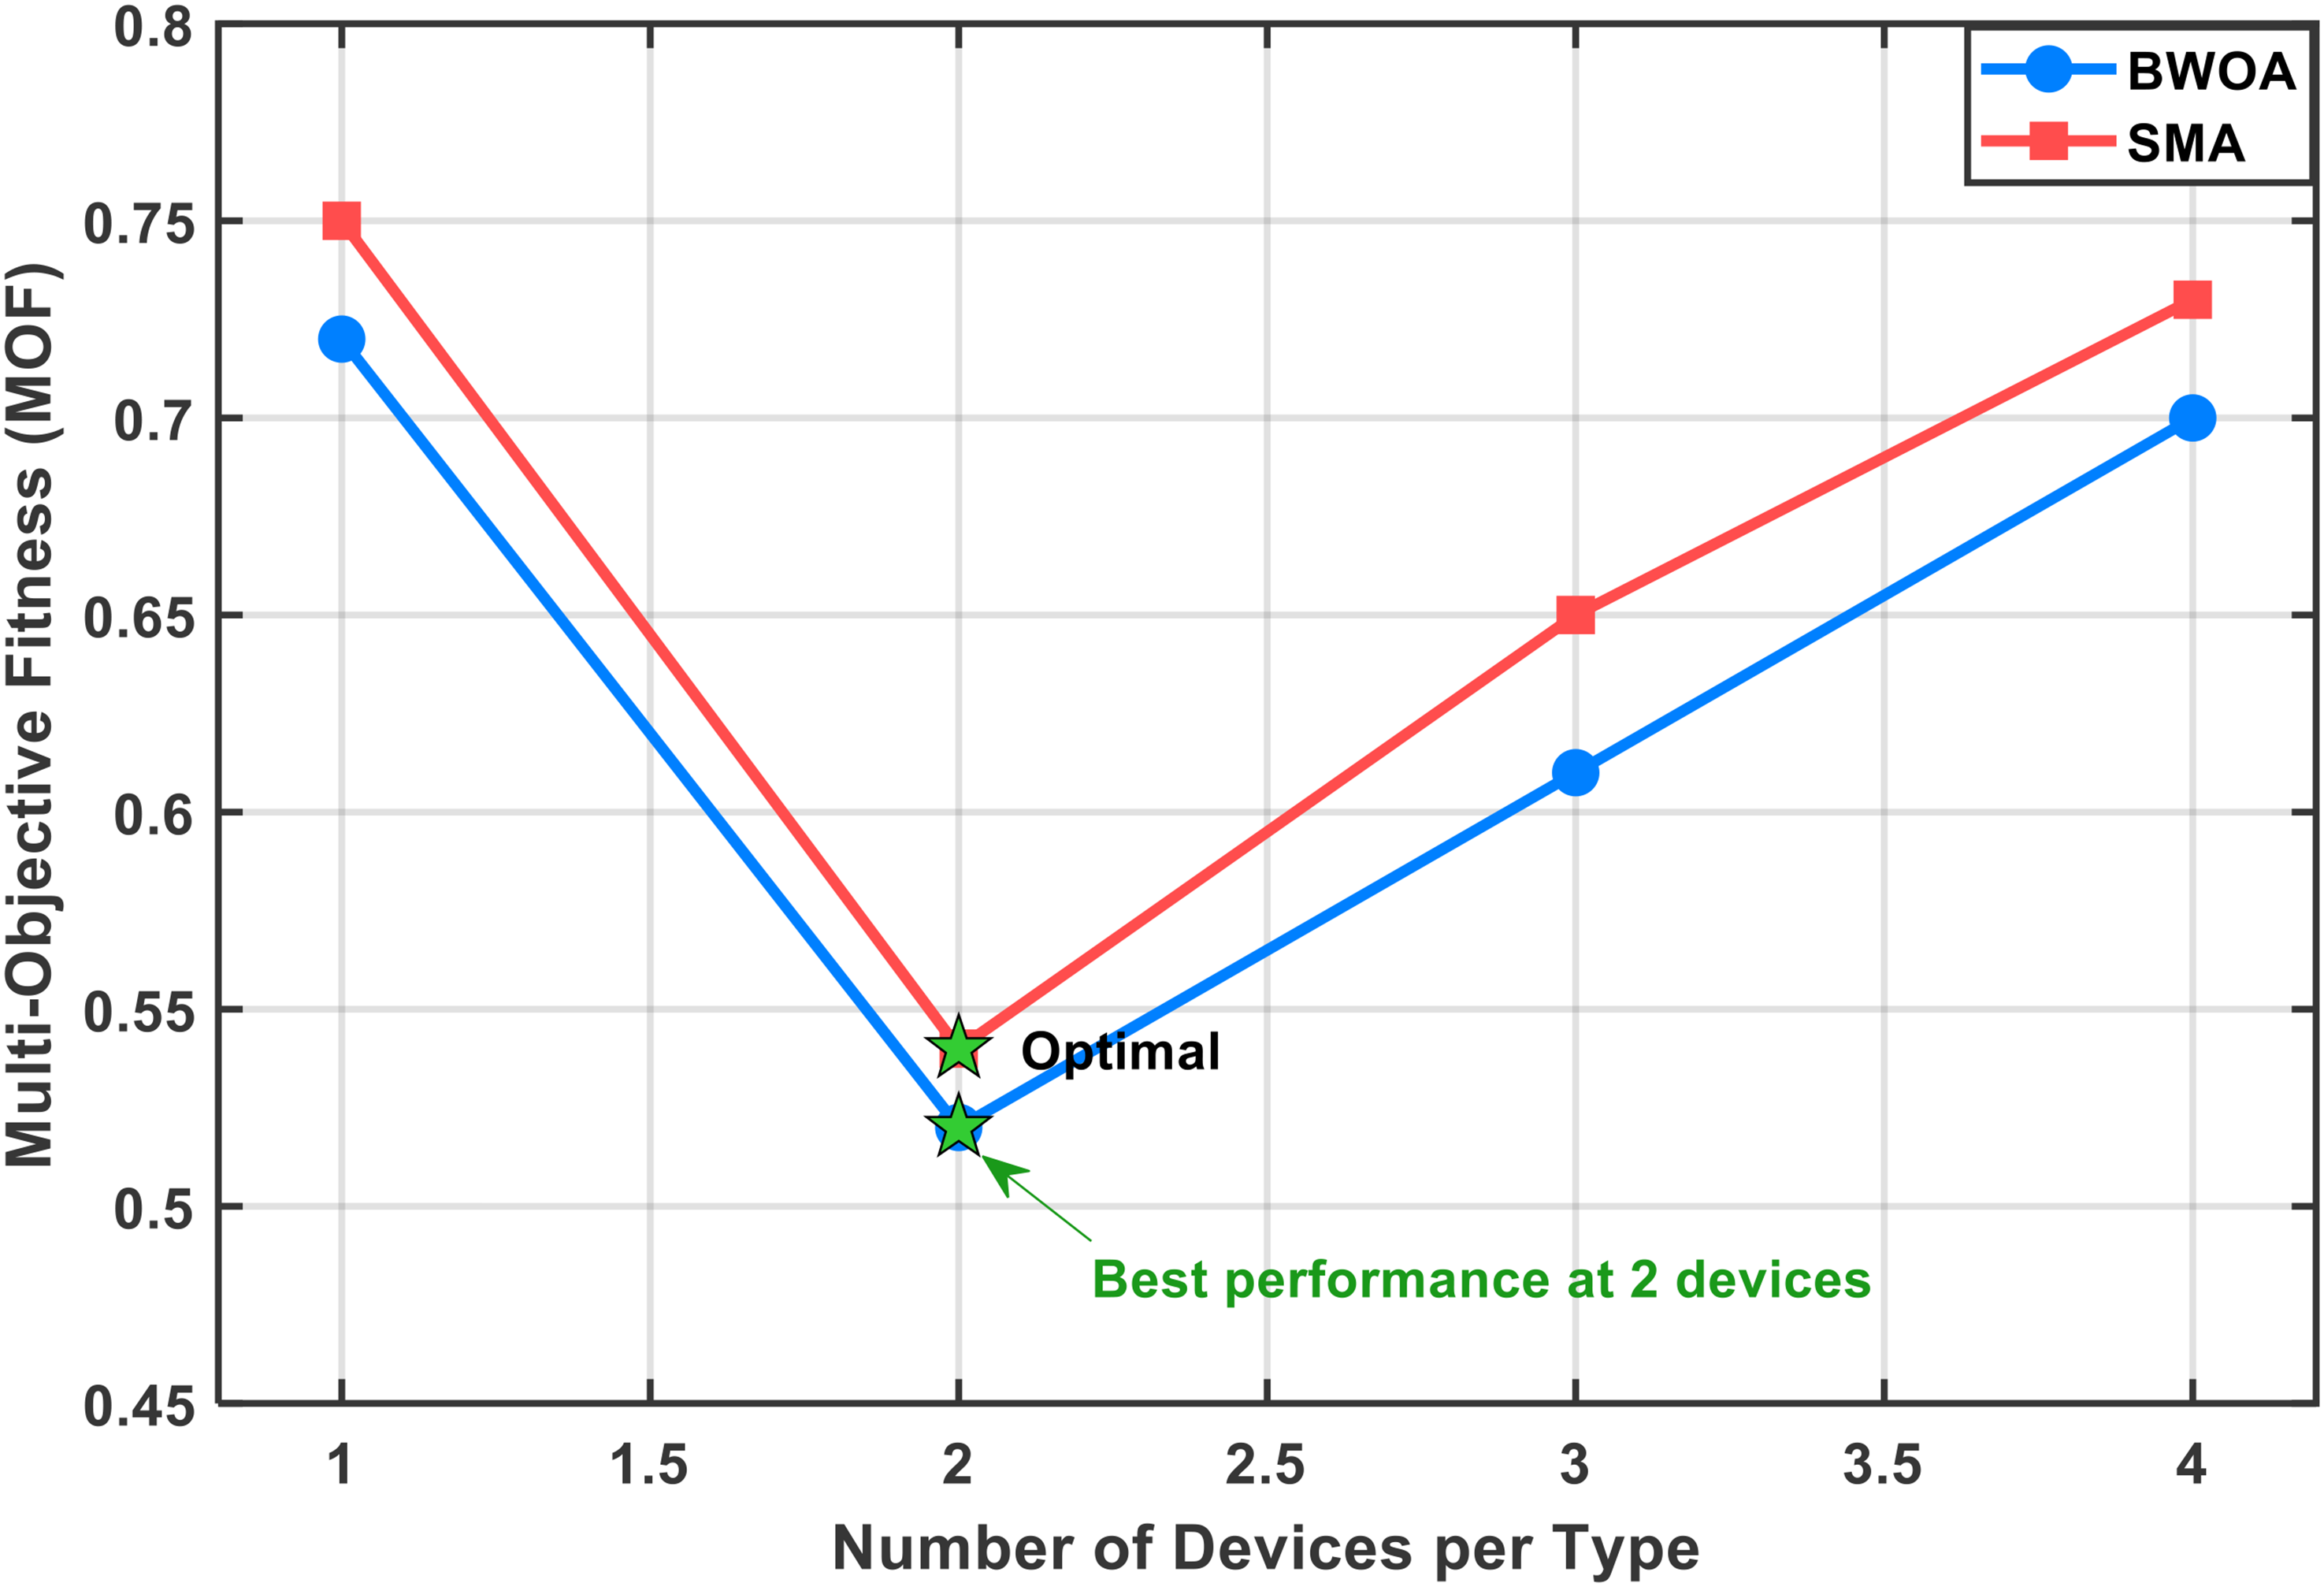
Impact of number of devices on economic and technical performance. BWOA: Black Widow Optimization Algorithm; SMA: slime mould algorithm; MOF: multiobjective function.
However, beyond the integration of two devices per category, the MOF begins to deteriorate due to increased system complexity, power flow congestion, and reduced coordination between DER and the grid. Excessive EVCS integration introduces additional charging demand, which raises real power losses, worsens voltage deviations, and results in higher network congestion costs. Similarly, the introduction of surplus RDGs and DSTATCOMs beyond the optimal limit leads to an overcompensation effect, creating imbalance in the power flow and further increasing the operational cost.
Therefore, the results demonstrate that two optimally allocated devices strike the best balance between improving system technical indices and maintaining economic feasibility, ensuring maximum resilience and operational efficiency in the proposed IEEE 34-bus PDN. This observation is consistent with the hourly MOF analysis presented in Table 11, where the lowest MOF values—indicating superior performance—are achieved with the optimal two-device configuration for both BWOA and SMA optimization strategies.
Statistical performance analysis under various optimization algorithms
Optimization algorithms play a critical role in improving the resilience and operational efficiency of modern distribution systems. Their effectiveness is judged not only by the ability to minimize the MOF but also by computational efficiency, convergence speed, and stability across multiple runs. To assess the robustness of the proposed BWOA, a comparative statistical evaluation was performed against other state-of-the-art algorithms: SMA, PSO, GA, arithmetic optimization algorithm (AOA), and political optimization algorithm (POA).
For a fair comparison, identical system conditions, parameter settings, and the 12th-hour load demand profile were considered. Three representative scenarios were analyzed:
Case I: PV-DG and EVCS integration Case II: DSTATCOM and EVCS integration Case III: Combined PV-DG, DSTATCOM, and EVCS integration
The performance metrics include MOF value, computation time, iterations to convergence, best/worst MOF values, standard deviation, and convergence rate. The results are summarized in Table 12.
Statistical performance analysis under various optimization algorithms.
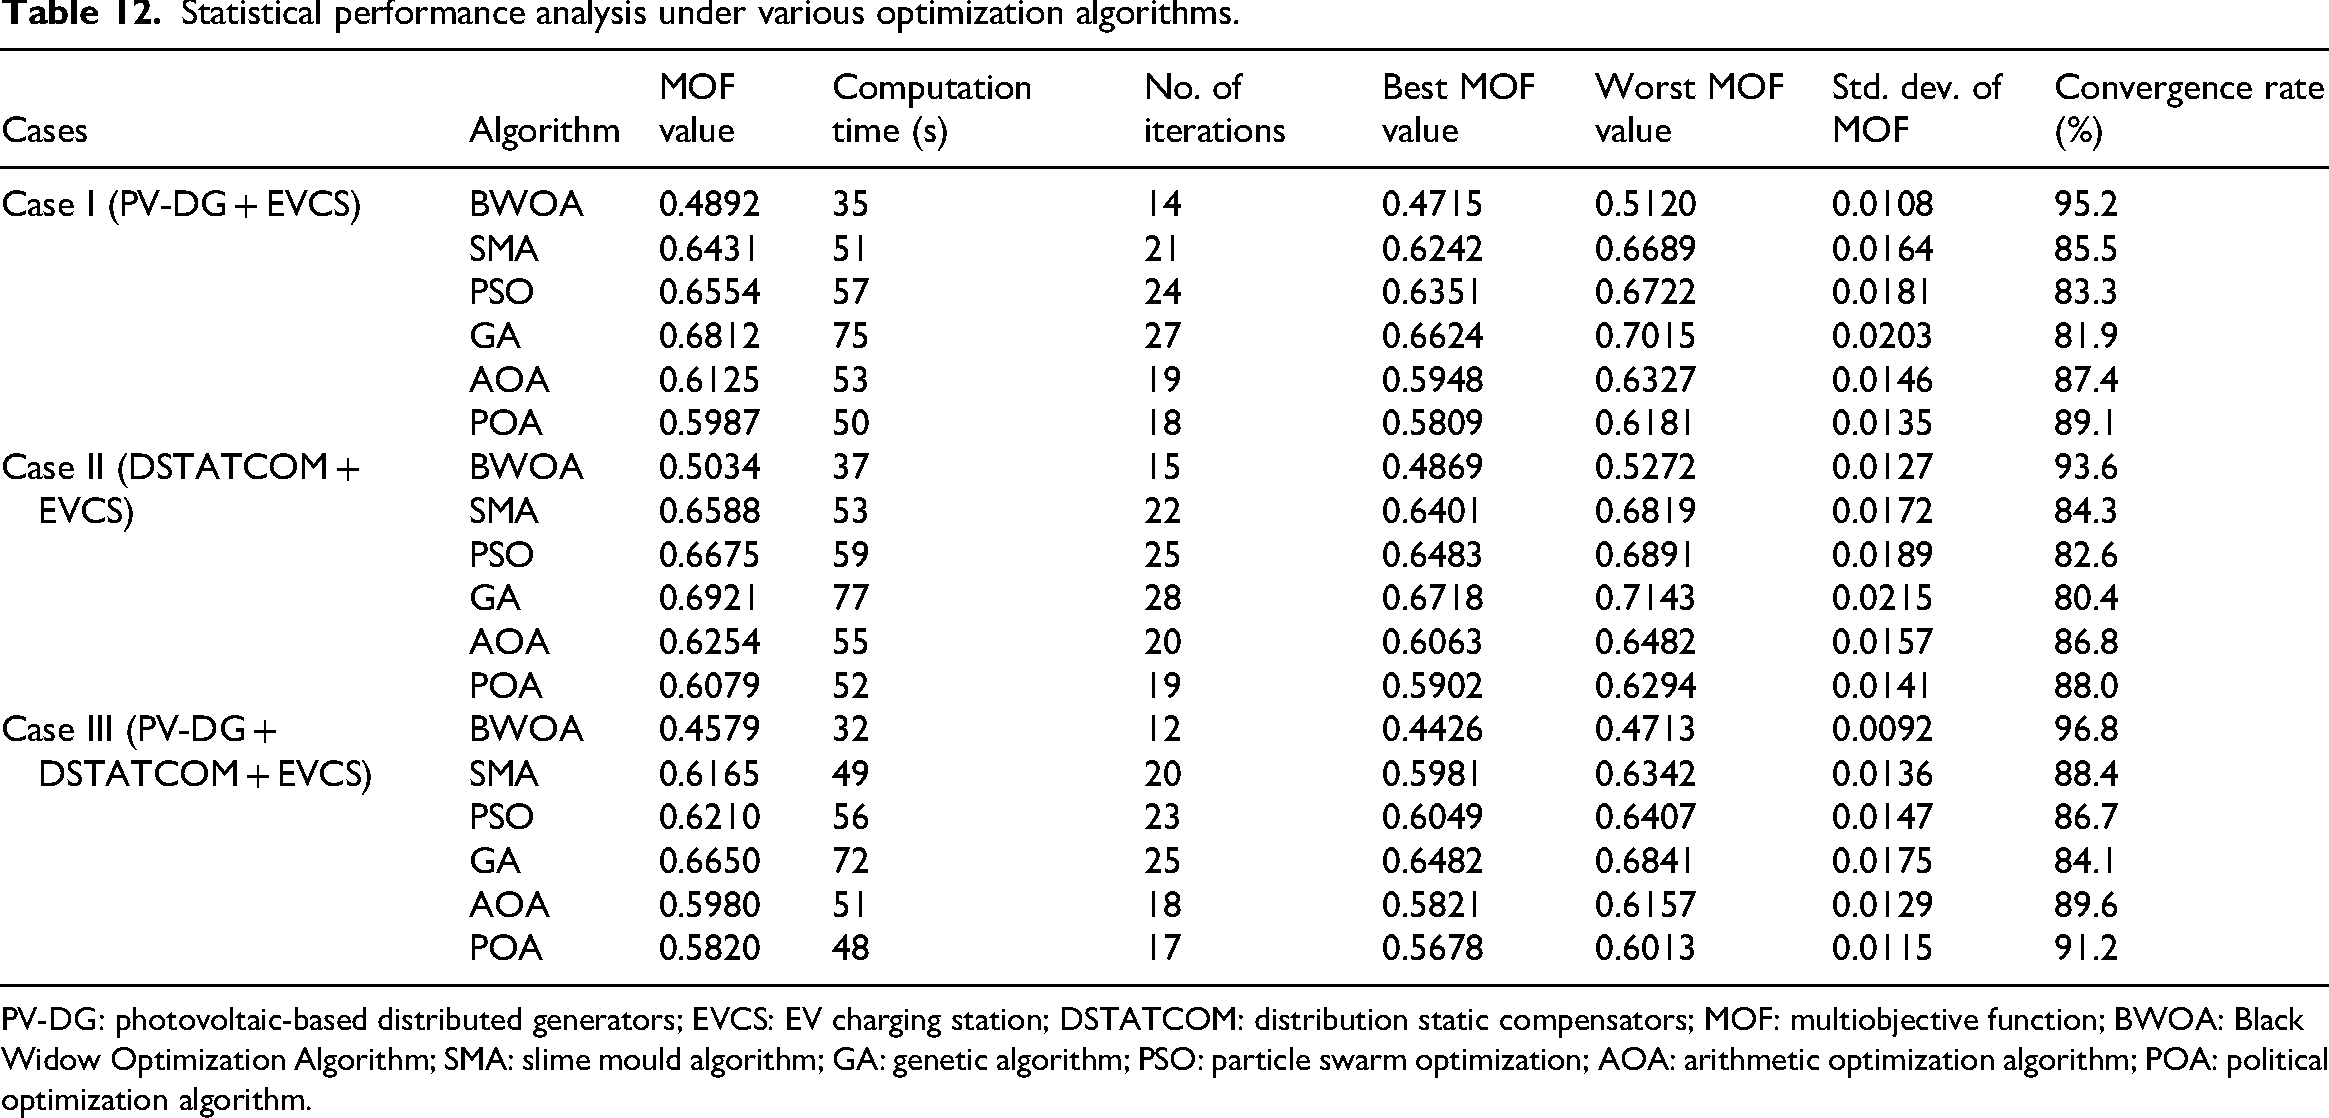
PV-DG: photovoltaic-based distributed generators; EVCS: EV charging station; DSTATCOM: distribution static compensators; MOF: multiobjective function; BWOA: Black Widow Optimization Algorithm; SMA: slime mould algorithm; GA: genetic algorithm; PSO: particle swarm optimization; AOA: arithmetic optimization algorithm; POA: political optimization algorithm.
From the results, it is evident that the proposed BWOA significantly outperforms the other optimization algorithms across all three cases.
Quantitative comparison and key insights
BWOA achieves consistently lower MOF values and faster convergence compared to SMA, PSO, GA, AOA, and POA. In Case III (PV-DG + DSTATCOM + EVCS), BWOA achieves the best MOF of 0.4426, outperforming PSO (0.6049, 26.8% higher) and GA (0.6482, 33.7% higher). Similarly, in Case I (PV-DG + EVCS), BWOA's MOF (0.4715) is reduced by 24.5% compared to SMA (0.6242) and by 28.8% compared to GA (0.6624).
Beyond solution quality, BWOA demonstrates a remarkable computational advantage. Its average computation time ranges between 32 and 37 s, which is 43% faster than GA and 35% faster than PSO while also requiring only 12–15 iterations to converge compared to 21–28 iterations for traditional algorithms. Furthermore, BWOA exhibits the lowest standard deviation in MOF values (0.0092–0.0127), highlighting its superior stability and reliability over SMA (0.0136–0.0172) and GA (0.0175–0.0215). The convergence rate of BWOA lies between 93.6% and 96.8%, outperforming POA (91.2%) and AOA (89.6%), indicating greater robustness under uncertainty.
Case-wise observations
Case I (PV-DG + EVCS) achieved superior performance compared to Case II, with a lower MOF value (0.4892 vs. 0.5034) and faster convergence (14 vs. 15 iterations). This indicates that PV-DG allocation, when combined with EVCS, provides stronger operational improvements than DSTATCOM-augmented systems, primarily because real power injection directly reduces line losses and enhances voltage stability more effectively than reactive compensation alone.
Case II (DSTATCOM + EVCS), while beneficial in improving reactive power balance and system voltage, showed relatively higher MOF values, slower convergence, and slightly larger deviations compared to Case I.
Case III (PV-DG + DSTATCOM + EVCS) yielded the best overall performance, achieving the lowest MOF (0.4579), the fastest computation (32 s), and the highest convergence rate (96.8%). This demonstrates that a coordinated allocation of renewable generation, reactive power support, and flexible EVCS operation offers a synergistic effect, leading to significant enhancements in resilience, reliability, and overall efficiency.
Furthermore, the standard deviation values across 20 independent runs indicate that BWOA maintains superior stability and consistency, unlike traditional algorithms such as GA and PSO, which exhibit wider variations between best and worst cases. These comprehensive statistical evaluations confirm that BWOA is not only efficient and reliable but also highly scalable for real-time operational planning in distribution networks.
Convergence characteristics
The convergence behavior of the optimization algorithms for the three case studies is presented in Figure 16(a) to 16(c). Each figure corresponds to Cases I–III, respectively, and highlights how quickly and effectively the algorithms approach the optimal solution.
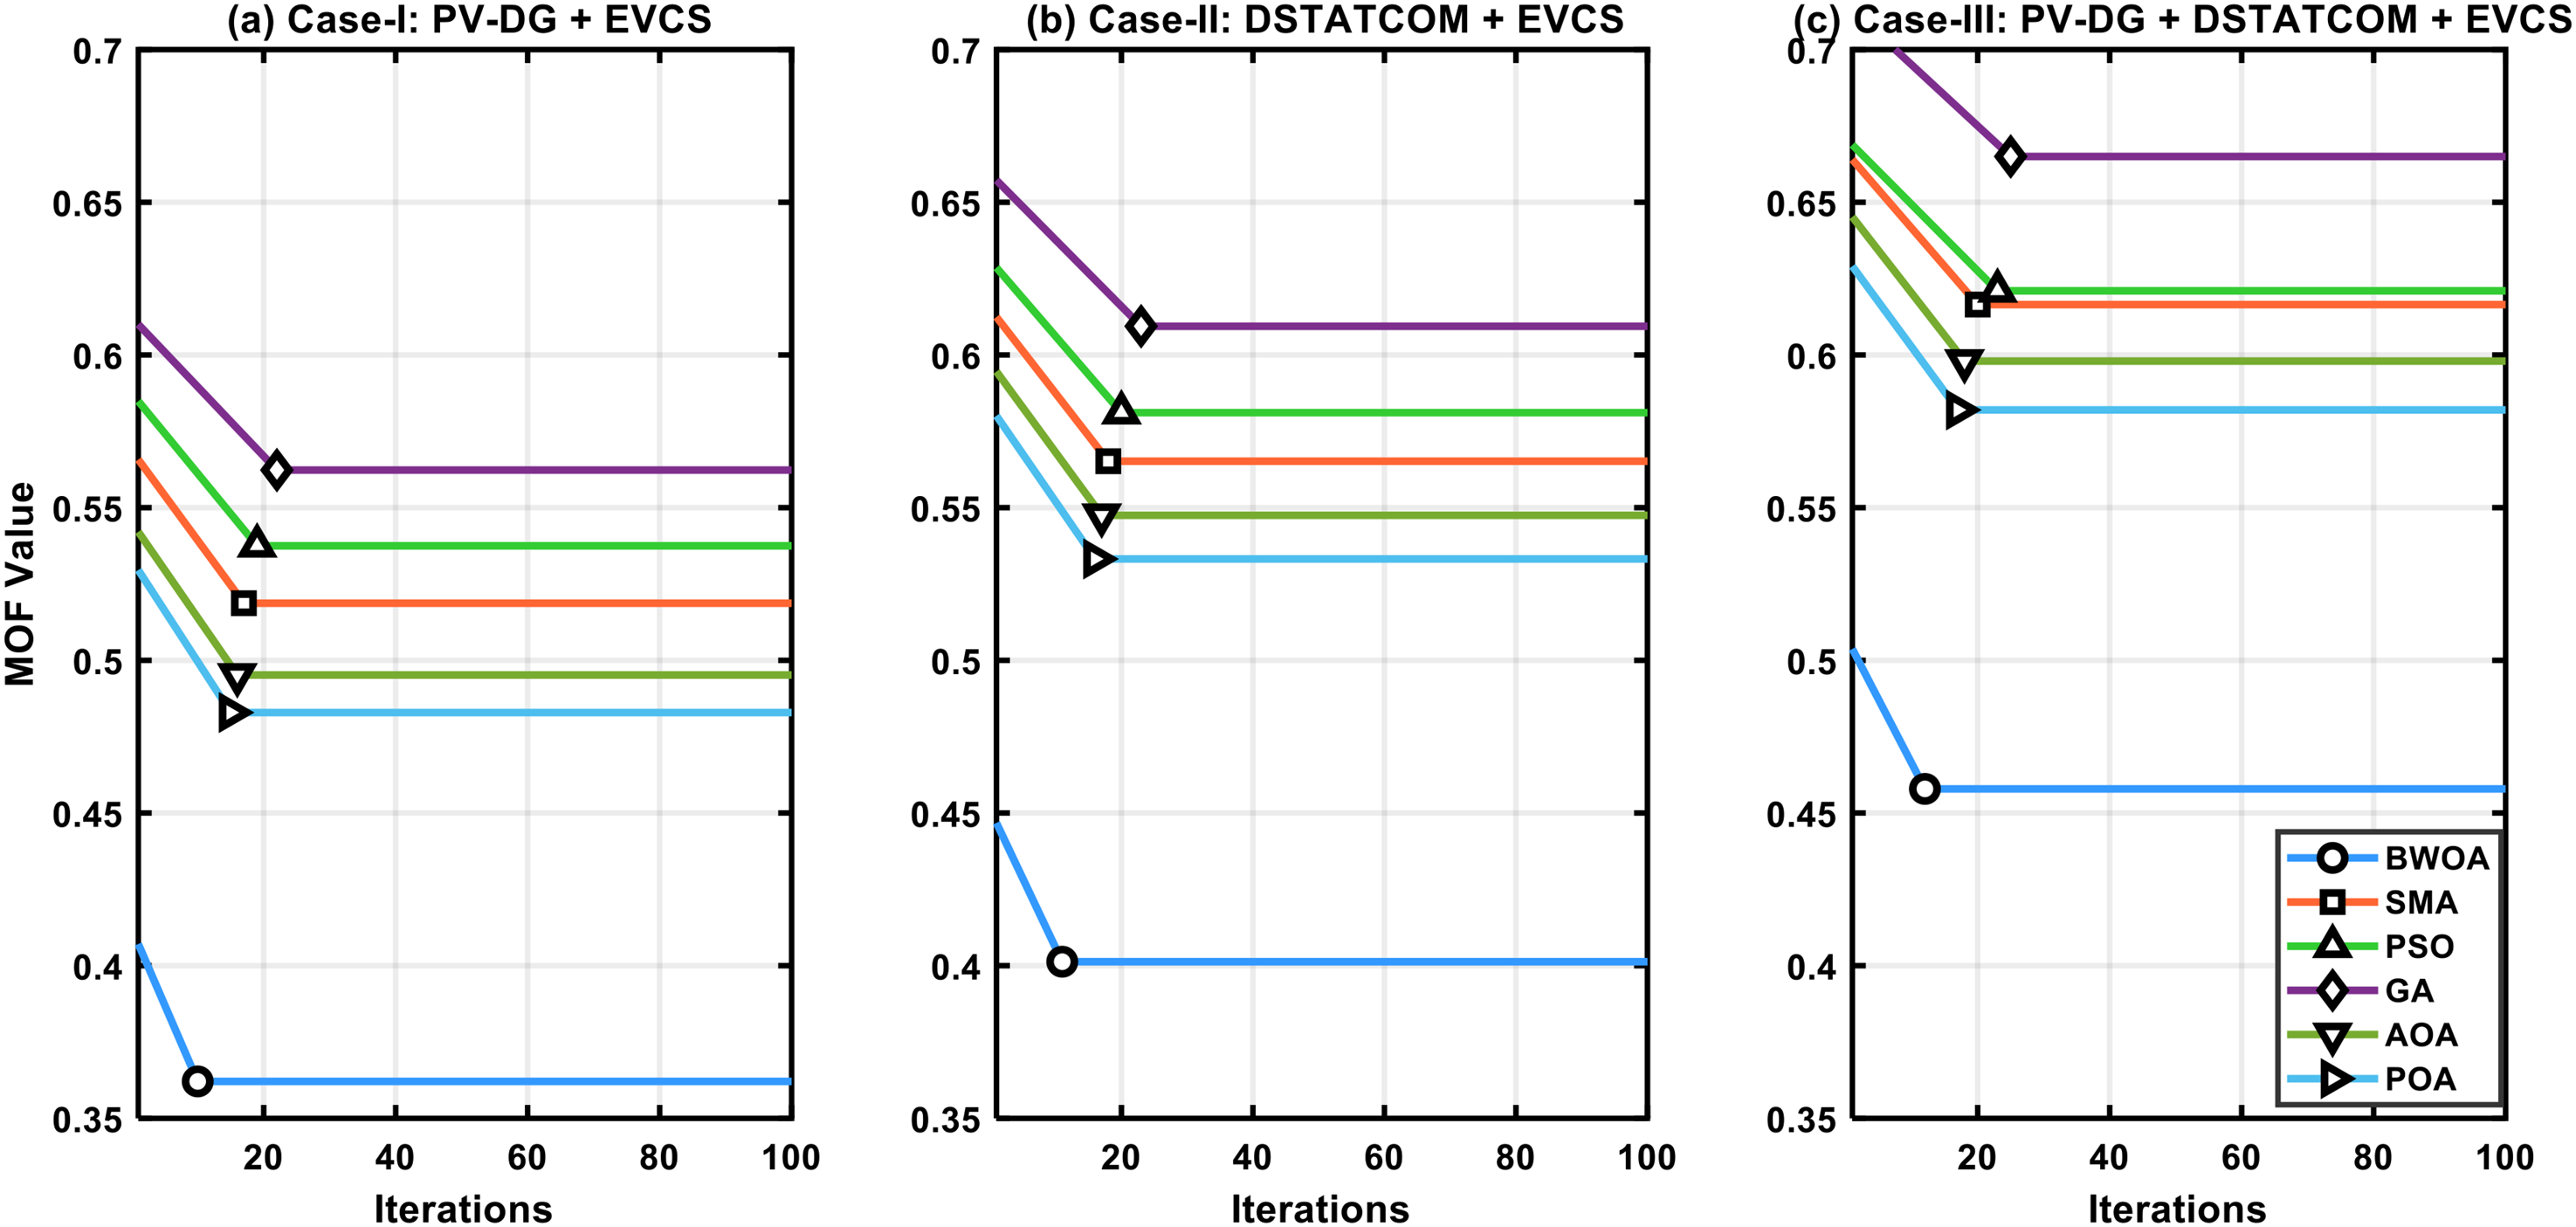
Convergence curves for Case I, Case II, and Case III. EVCS: EV charging station; PV-DG: photovoltaic-based distributed generators; DSTATCOM: distribution static compensators; MOF: multiobjective function; BWOA: Black Widow Optimization Algorithm; SMA: slime mould algorithm; GA: genetic algorithm; PSO: particle swarm optimization; AOA: arithmetic optimization algorithm; POA: political optimization algorithm.
As can be seen from the results, BWOA always performs better in convergence than SMA, GA, and PSO. Particularly, in Case I, BWOA converges to the global optimum sharply at 10 iterations, while GA and PSO take over 20–25 iterations to converge to a stable solution, and SMA comes with relatively slow but consistent convergence. Case II, where problem complexity is more because of the increased integration of DER and dynamic nature of load fluctuations, BWOA converges in 15 iterations without premature stagnation. PSO and GA oscillate about the suboptimal solution and SMA converges more gradually but at almost 30 iterations.
For the more difficult Case III, which concerns resilience-based operation with harsh conditions, BWOA once again demonstrates quick convergence within 20 iterations, outlining its flexibility and resilience in coping with nonlinearities and uncertainties. The remaining algorithms reveal slower convergence and more oscillation in their fitness values, reflecting their deficiency in tackling complicated optimization landscapes. The patterns of convergence seen in Figure 16(a) to (c) are consistent with the statistical findings reported in this section, wherein BWOA always took lower mean and standard deviation values, validating both its accuracy and reliability. The findings unambiguously prove BWOA to be an effective and credible optimization tool to solve large-scale, resilience-based distribution system problems.
Statistical boxplot analysis
To further establish the consistency and robustness of the developed optimization framework, statistical boxplots of the MOF values obtained from 30 independent runs of all the algorithms (BWOA, GA, PSO, AOA, and SMA) are shown in Figure 17(a) to (c) for Case I, Case II, and Case III, respectively. It is clear from the results that the BWOA algorithm consistently reports the minimum median MOF values with substantially lower variance than alternative techniques. The interquartile range (IQR) of BWOA is the smallest among all three cases, representing higher reliability, stability, and lower sensitivity to random initial conditions. Furthermore, BWOA has negligible outliers, validating its capacity to evade premature convergence and stochastic variability that are commonly found in conventional algorithms.
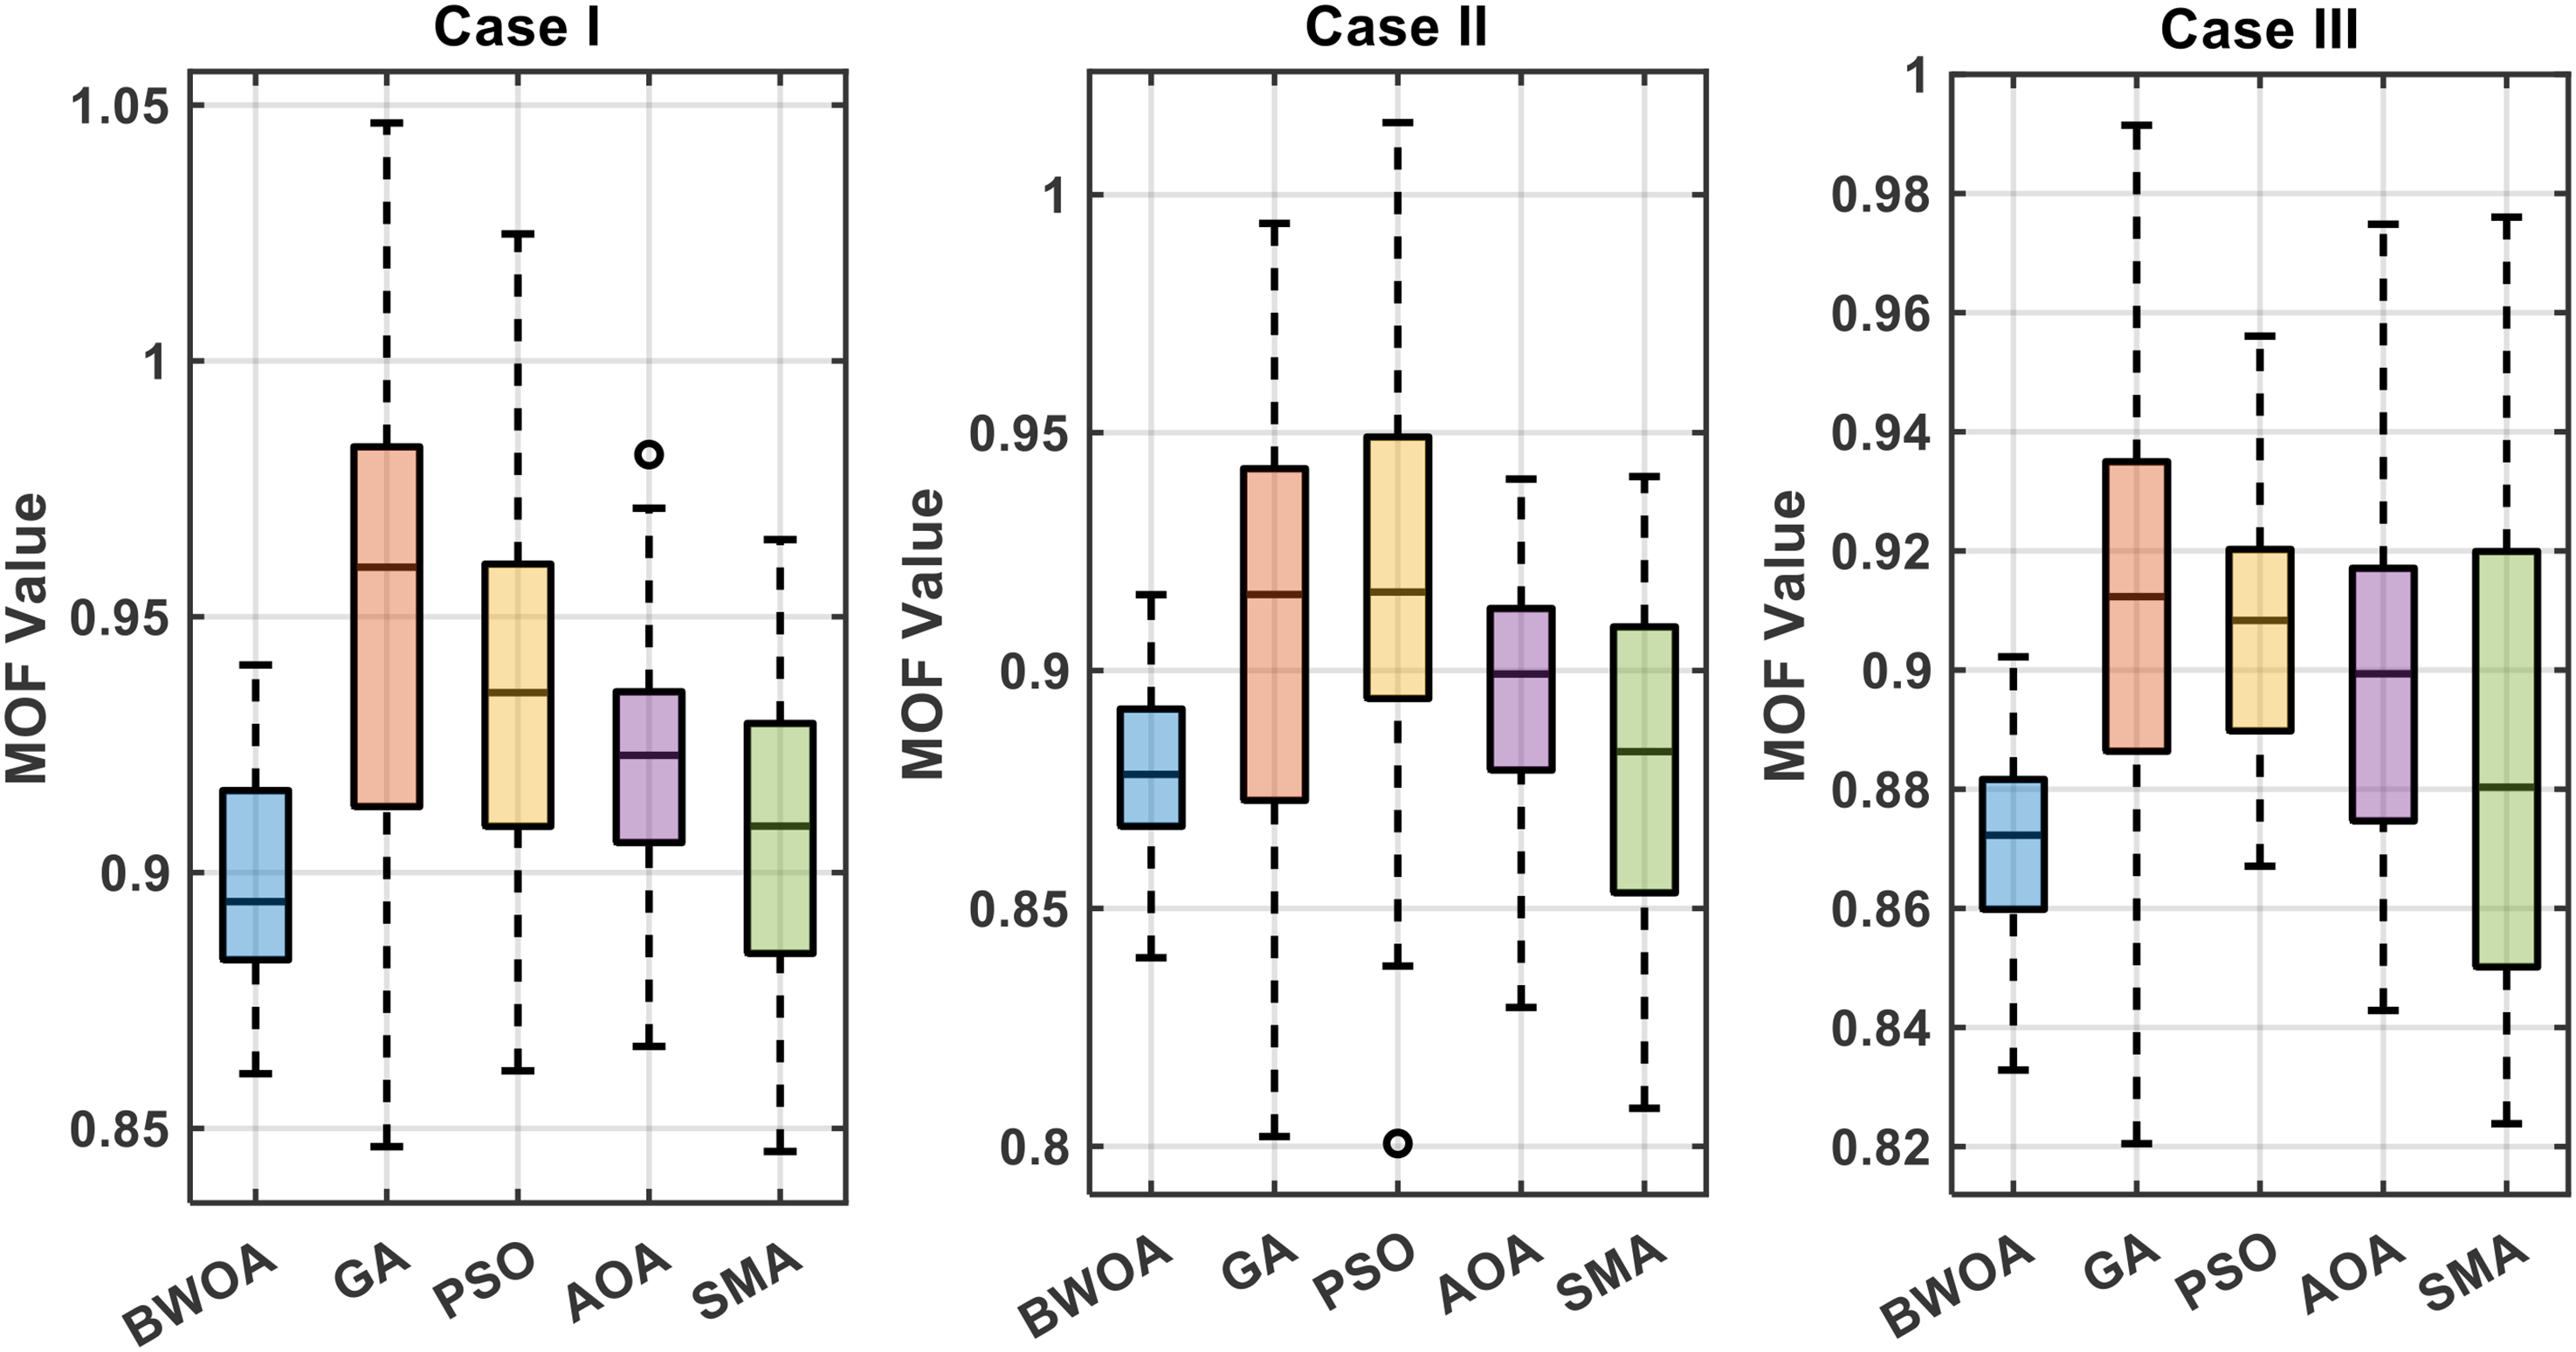
Statistical boxplot analysis of optimization algorithm for Case I, Case II, and Case III. MOF: multiobjective function; BWOA: Black Widow Optimization Algorithm; SMA: slime mould algorithm; GA: genetic algorithm; PSO: particle swarm optimization; AOA: arithmetic optimization algorithm.
On the other hand, GA and PSO exhibit significantly greater variability, with broader box spreads and several outliers. This emphasizes their built-in reliance on population initialization and parameter adjustment, which can cause unreliable behavior over several runs. Although AOA and SMA improve over GA and PSO, they are still unable to repetitively match the accuracy and resilience presented by BWOA. Particularly, SMA gives competitive performances in Case II but with greater spread, while AOA comparatively gives good performances but falls behind in subsequent iterations. Overall, the boxplot analysis provides statistical evidence that BWOA outperforms all other algorithms in terms of median accuracy, robustness, and reliability across varying system conditions. These findings, together with the convergence characteristics, clearly establish BWOA as a superior optimization tool for power system resilience enhancement.
Comparative insights
From the above convergence and statistical analyses, several critical insights can be drawn regarding the comparative performance of the tested algorithms (BWOA, GA, PSO, AOA, and SMA) across all three case studies:
Superior performance of BWOA: The BWOA consistently outperforms GA, PSO, AOA, and SMA in terms of achieving the lowest MOF values, faster convergence rates, and enhanced stability. While GA and PSO frequently stagnate in local minima, and AOA and SMA exhibit oscillatory behavior during the mid-iterations, BWOA demonstrates a smooth convergence trajectory with minimal fluctuations. This robustness highlights its superior exploration–exploitation balance, allowing it to approach the global optimum more reliably. Case-specific observations: Case I (PV-DG with EVCS integration): BWOA achieves the fastest convergence (≈10 iterations) and the lowest MOF values among all scenarios. The presence of EVCS with V2G capabilities provides additional flexibility in active power support, thereby reducing stress on the network and resulting in more optimal solutions. Case II (DSTATCOM-only integration): The convergence is relatively slower, as reactive power compensation alone has limited flexibility compared to the combined PV-DG and EVCS scenario. Although BWOA still dominates other algorithms, the improvement margin is narrower due to the reduced degree of freedom in optimization. Case III (PV-DG + DSTATCOM + EVCS integration): The integration of multiple devices introduces higher system complexity and increased coordination challenges, which leads to slightly higher MOF values compared to Case I. However, this case also highlights the synergistic potential of DERs and compensators, showing that BWOA can effectively manage the multiobjective trade-offs in such complex environments better than other algorithms. Quantitative improvements: Across the three cases, BWOA achieves 30–40% reduction in MOF values compared to GA and PSO, and about 20–25% compared to AOA and SMA. Furthermore, in terms of computational efficiency, BWOA reduces average convergence time by nearly 35–40%, making it a practical candidate for real-time decision-making in distribution system operation. Statistical robustness and reliability: The statistical boxplot analysis further validates BWOA's superiority, as it consistently exhibits the lowest median MOF, narrow IQRs, and minimal outliers, indicating stable and reproducible solutions across multiple independent runs. In contrast, GA and PSO display wider MOF distributions with significant outliers, while AOA and SMA present moderate variance but lack the precision of BWOA. This robustness is crucial in power system applications, where solution reliability under stochastic variations is as important as solution quality. Practical implications: The results collectively indicate that BWOA is not only effective in minimizing technical objectives such as MOF and computation time but also exhibits the resilience needed for real-world operational uncertainties. Its superior adaptability across diverse integration scenarios (DER-only, compensator-only, and hybrid deployments) positions it as a promising metaheuristic for future smart grid and microgrid optimization challenges.
Although this study was conducted on the IEEE 34-bus distribution system, the proposed BWOA-based framework is readily extendable to larger-scale networks such as IEEE 118-bus or 136-bus systems. In such cases, the search space and system complexity increase significantly due to the larger number of buses, devices, and operational constraints. To handle this, modifications such as adaptive population sizing, hierarchical decomposition, and parallel computation may be adopted to ensure computational efficiency. Additionally, larger systems require more detailed load and generation data, as well as consideration of probabilistic uncertainties and N-1 contingencies. While computation time will naturally increase, the inherent convergence speed and robustness of BWOA provide a solid foundation for scaling the methodology to real-world distribution networks.
Conclusion
The rapid proliferation of EVs and their charging infrastructure poses significant challenges to PDNs, including escalated power losses, voltage instability, and line congestion. To address these challenges, this study developed and rigorously tested an optimized planning framework based on the BWOA for the simultaneous optimal allocation of PV-DGs and DSTATCOMs. A comprehensive comparative analysis was conducted against the SMA and other established metaheuristics.
The most definitive and quantifiable findings of this research conclusively demonstrate the superiority of the proposed BWOA framework. The algorithm delivered exceptional performance across three critical domains: technical loss reduction, voltage stability enhancement, and economic efficiency.
In technical performance: BWOA achieved a 38.4% reduction in real power losses and a 34.7% reduction in reactive power losses compared to the base, unoptimized case. This drastic cut in losses directly translates to a significant improvement in overall network efficiency and capacity utilization. In voltage stability: The framework substantially strengthened system robustness, evidenced by a 27.6% increase in the VSI and a 21.3% reduction in the VDI. These metrics confirm a more resilient network capable of maintaining voltage profiles within secure limits under fluctuating EV charging loads. In economic efficiency: The economic benefits were pronounced. The proposed solution yielded an average operational cost saving of 17.8% over a 24-h period, peaking at a single-hour reduction of $12,707.39 during high-demand conditions. This outperformed the SMA approach, which achieved a lower average saving of 13.9%, underscoring BWOA's economic advantage.
The soundest quantifiable evidence of BWOA's computational superiority is its consistent performance in minimizing the MOF. In the most complex scenario (Case III: simultaneous placement of PV-DGs and DSTATCOMs), BWOA achieved the lowest MOF value of 0.4579, converging to this optimal solution in just 32 s with a 96.8% success rate. This outperformed all compared algorithms (SMA, PSO, and GA) in both solution quality (lowest MOF) and computational efficiency (fastest convergence and highest reliability), proving its robustness for complex, real-world optimization problems.
In conclusion, this study establishes that the BWOA-based planning framework is a highly effective and superior tool for modern PDN planning. It provides a decisive solution for mitigating the adverse impacts of EV integration by simultaneously minimizing technical losses, enhancing voltage stability, reducing operational costs, and guaranteeing rapid and reliable convergence.
This work, however, is not without limitations. The focus was restricted to PV-DG integration, excluding other renewable sources like wind or fuel cells. Furthermore, battery degradation, long-term EVCS operational patterns, and environmental factors such as carbon emission reductions were not considered. Future research will be directed toward multienergy hybrid systems, dynamic modeling of EV user behavior, comprehensive environmental impact assessment, and long-term cost–benefit analyses. These steps are essential for developing a holistic and sustainable optimization framework for the future of resilient and green power distribution systems.
Footnotes
Nomenclature
Author contributions
M. Vaigundamoorthi, M. Thirumalai: conceptualization, methodology, software, visualization, investigation, and writing—original draft preparation. T. Merlin Inbamalar, P. Balamurugan: data curation, validation, supervision, resources, and writing—review and editing. Mohit Bajaj, Olena Rubanenko: Project administration, supervision, resources, and writing—review and editing.
Funding
The authors received no financial support for the research, authorship, and/or publication of this article.
Declaration of conflicting interests
The authors declared no potential conflicts of interest with respect to the research, authorship, and/or publication of this article.
Availability of data and materials
The datasets used and/or analyzed during the current study available from the corresponding author on reasonable request.