
Abstract
With increased penetration of electric vehicle (EV) in conventional transportation it has become important for manufacturer to build faith of customers in their product, specially battery performance. Accurate state of charge (SOC) measurement has now become crucial as most users wants to know the exact range available to them while driving EV. This study explores equivalent circuit models (ECMs) performance for lithium-ion 18650 (NMC) battery, the ECM RC parameters are evaluated by performing static capacity test and hybrid pulse power characterization (HPPC) test. The simulation model performance is compared with the experimental data, the cell open circuit voltage (OCV) errors (maximum absolute error and the root mean square error) are evaluated for different SOC range. Results shows 0.0439 V error for 10% SOC level to 100% SOC level in HPPC test and 0.0166 V error for 10% SOC level to 100% SOC level in long pulse discharge test, thus recommends the use of ECM for most of the practical usable SOC.
Keywords
Introduction
Batteries are a vital component of the current global energy system and are expected to be essential to safe and reasonably priced clean energy transitions. They are a crucial part of the millions of electric cars (electric vehicles [EVs]) that are sold annually in the transportation sector. As their costs decrease and the proportion of electricity produced by solar and wind increases, they are becoming more and more significant in utility-scale and behind-the-meter applications in the power sector. Thanks to advances in battery chemistry and production, average battery costs have decreased by 90% since 2010 (rep, 2024). Since they have transformed electronic devices and electric mobility and are becoming more popular in power systems, lithium-ion batteries are now a vital component of contemporary economies.
The EV market faces several significant challenges, particularly related to battery technology, which hinder widespread adoption. One of the most pressing issues is the availability and supply chain constraints of critical battery materials, such as lithium, cobalt, and nickel, which are essential for manufacturing high-performance batteries (Waseem et al., 2023). Another critical challenge is the accurate measurement of the state of charge (SOC) in batteries, which is crucial for ensuring reliable performance and preventing unexpected power depletion (Hossain et al., 2022; Lipu et al., 2022). Inaccurate SOC estimation can lead to reduced efficiency, safety risks, and diminished consumer trust. Addressing these challenges requires advancements in battery technology, improved supply chain resilience, and the development of more precise battery management systems (BMS) to enhance the overall viability and appeal of EVs.
Accurate SOC measurement is a cornerstone of effective battery management systems (BMS), as it directly impacts the performance, safety, and longevity of batteries in EVs. Precise SOC estimation ensures optimal energy utilization, prevents overcharging or deep discharging, and enhances user confidence by providing reliable range predictions. Over the years, the evolution of equivalent circuit models (ECMs) has played a pivotal role in improving SOC estimation accuracy (Singh et al., 2023; Sun et al., 2024). These models, ranging from simple resistor–capacitor (RC) networks to more complex multi-time-scale configurations, simulate battery behavior under varying conditions, enabling better prediction of SOC dynamics. However, the effectiveness of these models relies heavily on accurate estimation of circuit parameters, such as internal resistance, capacitance, and open-circuit voltage, which are influenced by factors like temperature, aging, and operating conditions (Chang, 2013; Chen et al., 2012). Accurate SOC measurement is highly desirable so as to predict the accurate EV range which boosts the user experience. BMS is also an integral part of EV, it takes input from battery in form of SOC, voltage, current, temperature to ensure safe operation of connected cells (Chen et al., 2025; He et al., 2011; Oh et al., 2024). The battery non-linear characteristic along with other factors like hysteresis, self-discharge, ageing, regeneartion, and temperature makes SOC estimation quite difficult, it becomes a tedious task for a designer to address all operating factors. There are several methods available in literature to estimate battery SOC (How et al., 2019a; Meng et al., 2017; Tao et al., 2024), broadly SOC estimation methods can be grouped into direct and indirect methods; first includes open circuit voltage (OCV) estimation method, coulomb counting method, electrochemical impedance spectroscopy method (Demirci et al., 2024a, 2024b; Monirul et al., 2024) and later includes model based estimation, adaptive filter-based estimation, fuzzy, and AI-based estimation (How et al., 2019b; Manoharan et al., 2022, 2023; Murawwat et al., 2023; Shah et al., 2022).
Evaluation of 18650 sodium-ion cells for commercial viability is presented in Bischof et al. (2024), the cell is compared for different parameters such as temperature, specific energy and cell impedance parameters. For cooling the cylindrical 18650 lithium-ion battery during rapid charging, reciprocating liquid immersion cooling has been suggested and tried in Li et al. (2023). 18650 lithium-ion cell of different manufacturers were analyzed for different methodologies for evaluation of OCV, internal resistance and cell capacity in Soto et al. (2019) and detailed recommendations were made. Assessment study of different charging protocols were presented for lithium-ion batteries (18650 high-power cells) and impact of charging voltages/currents on charging time, cell efficiency and capacity utilization is detailed in Keil and Jossen (2016). 18650 lithium ion battery thermal runaway assessment is studied in Zhong et al. (2022), the long-term cycle of an 18650-type cylindrical battery with varying SOC was examined, along with its aging behavior, mechanism, and thermal stability; it offers helpful recommendations for creating safer lithium ion battery’s. Since the BMS makes the primary performance and safety decisions for a battery pack and uses SOC as an input for all of its operations, the primary focus of our study is on precise SOC measurement for 18650 lithium ion batteries utilizing the equivalent circuit approach.
Equivalent circuit model falls under model-based estimation method, they are capable of predicting the non-linear behavior of battery under different operating conditions, as well as requires low cell chemistry knowledge thus are quite favorite in automotive industry for accurate SOC estimation. The non-linear behavior can be obtained using combination of different electrical circuit elements such as resistor, inductor, and capacitor, the commonly used models are
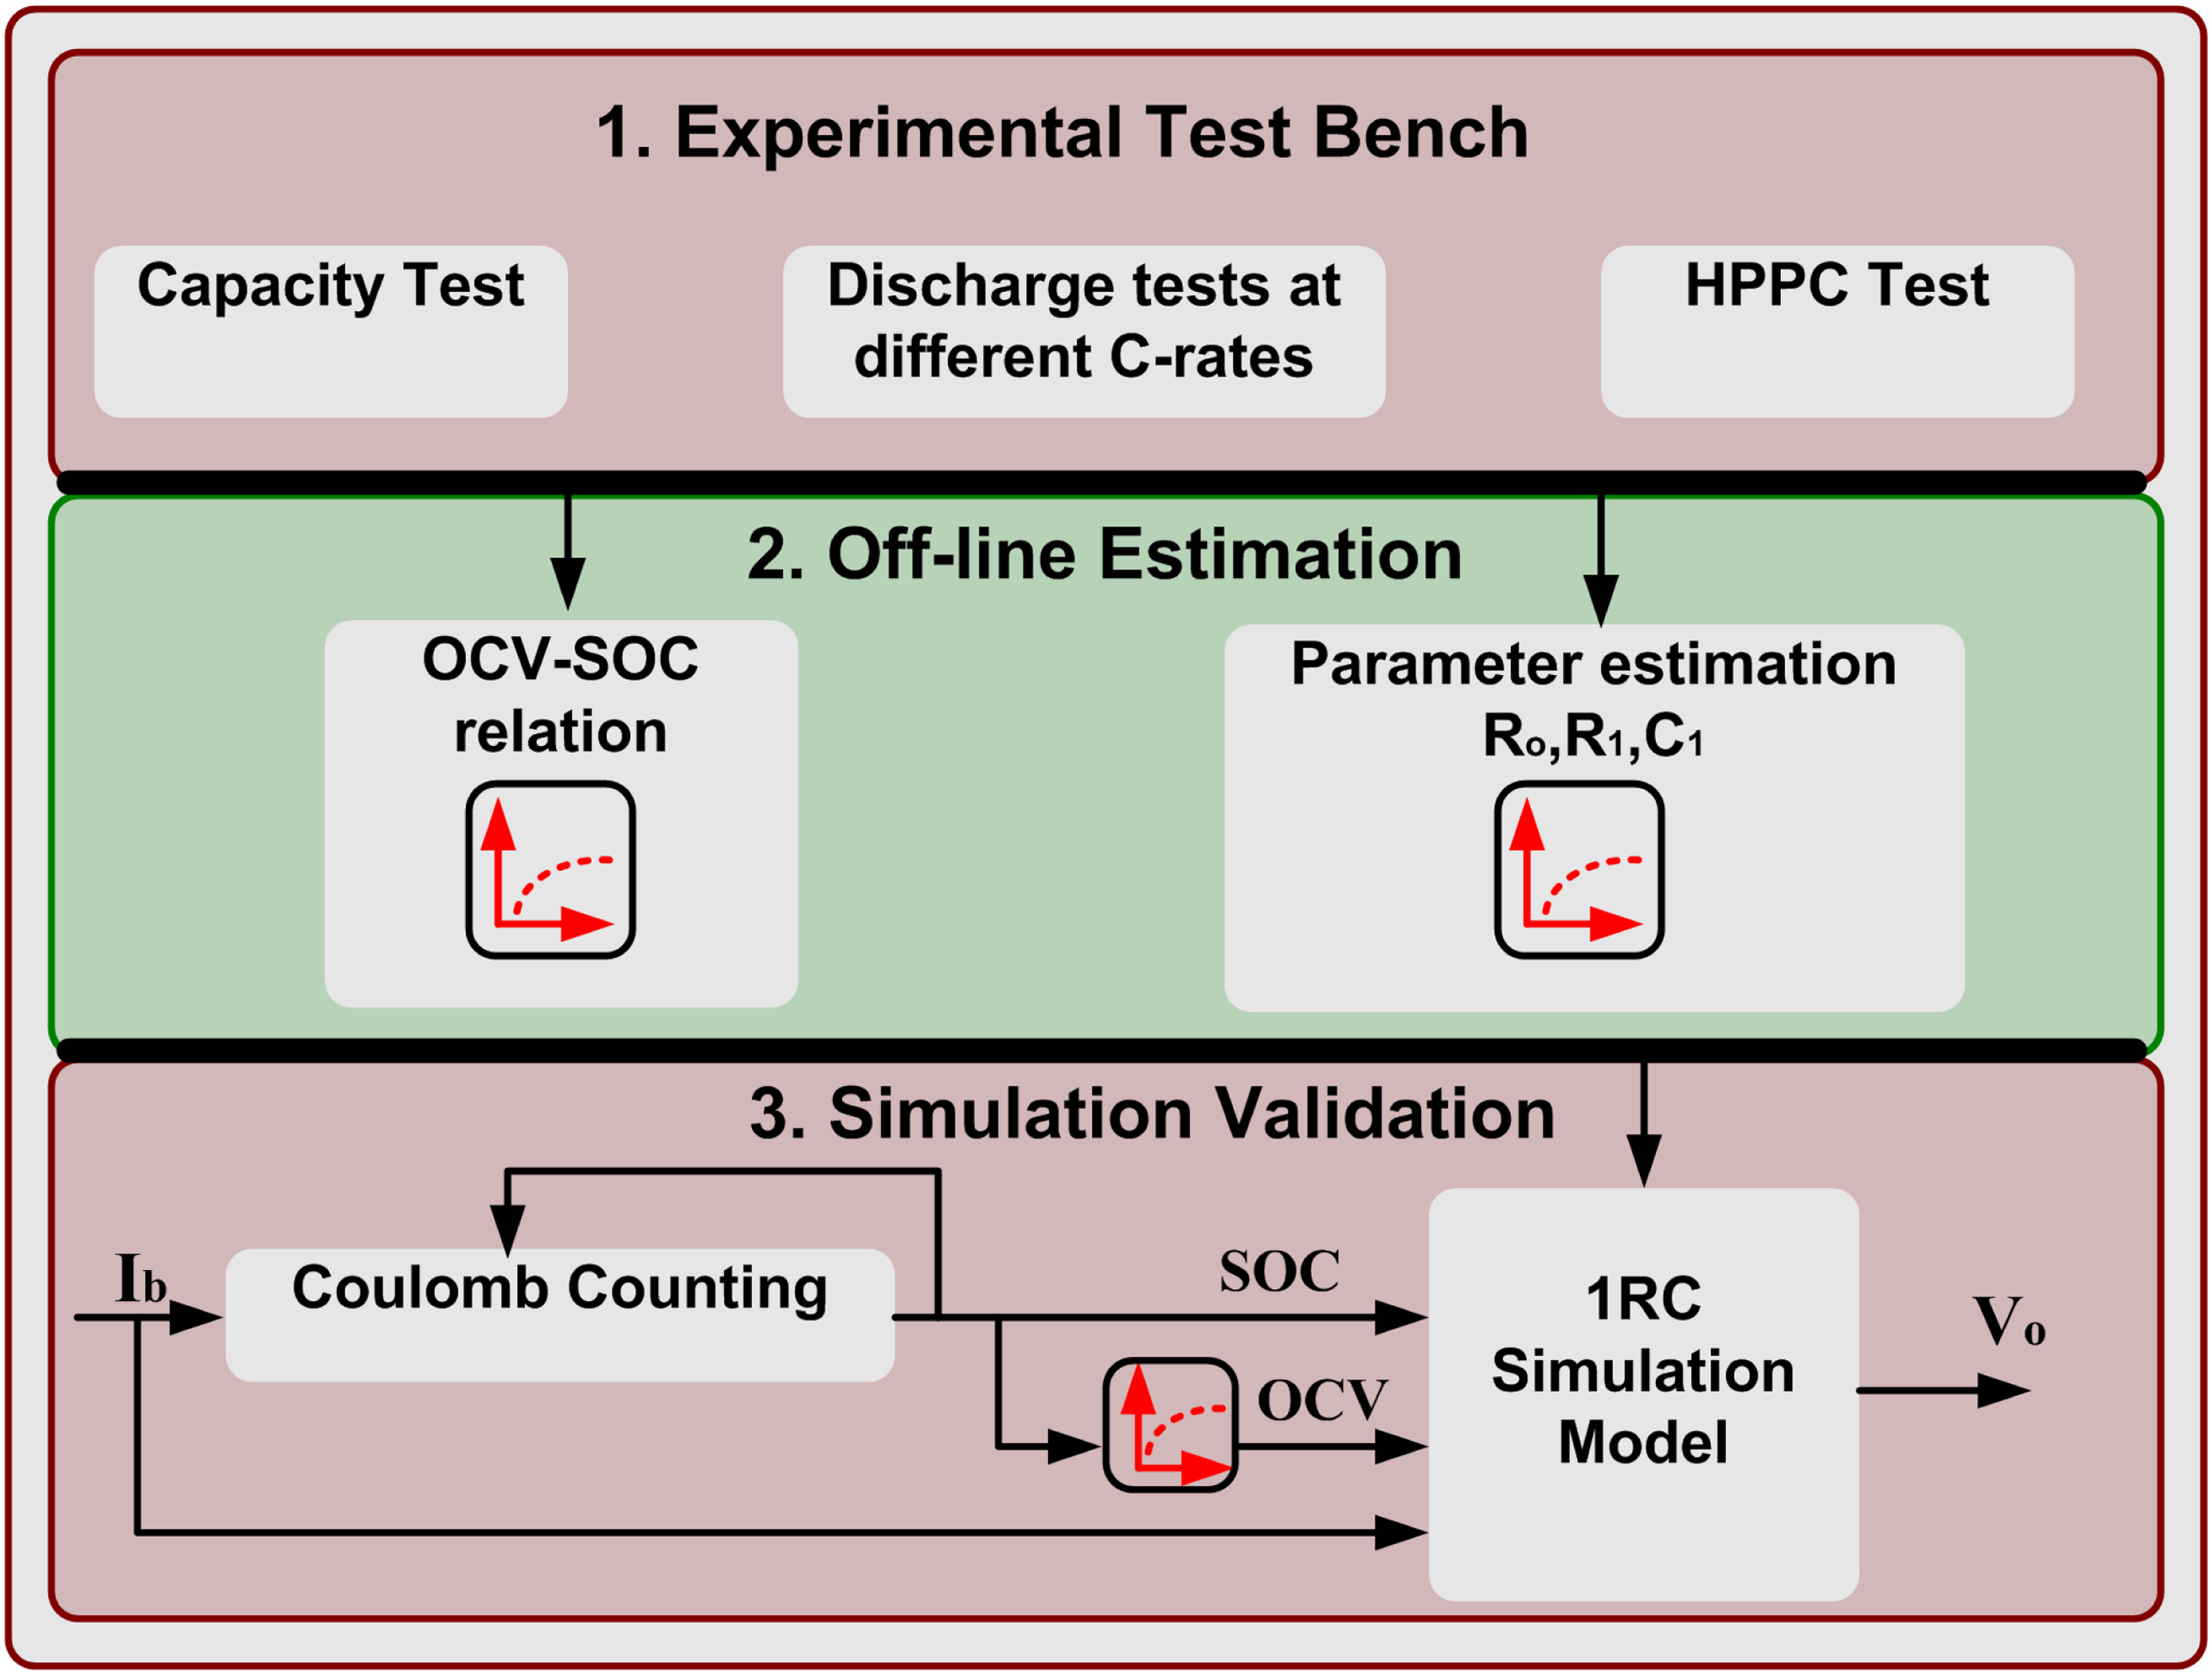
In this study the performance of the ECM is evaluated for a lithium-ion 18650 cell with NMC chemistry. In this study, section “Li-ion battery equivalent circuit models” elaborates cell types, chemistry, and ECMs for lithium-ion cell. Section “Equivalent circuit model parameter estimation” describes the methodology adopted for determining the ECM parameter for lithium-ion 18650 cell, which includes different tests such as capacity test, OCV determination test and high pulse characterization test. The simulation model validation with the experiment data and various results are presented in section “Experiments and model verification” and section “Conclusion” concludes the article.
Li-ion battery equivalent circuit models
Lithium-ion batteries have become the cornerstone of modern energy storage systems due to their high energy density, long cycle life, and versatility. These batteries are composed of various cell types, each designed to meet specific performance requirements for different applications. The choice of cell type significantly impacts the battery’s energy density, power capability, thermal stability, and safety (Young et al., 2012). This subsection provides an overview of the primary types of lithium-ion cells, their structural configurations, and their suitability for various applications. Lithium-ion cells are broadly categorized based on their physical design and packaging. The three most common types are cylindrical, prismatic, and pouch cells as shown in Figure 1. Each configuration has distinct advantages and limitations, making them suitable for specific use cases (Camargos et al., 2022). Cylindrical cells are characterized by their robust, cylindrical metal casing, typically made of steel or aluminum. The electrodes are wound into a spiral structure, providing mechanical stability and efficient heat dissipation. They are characterized with certain advantages such as, high mechanical strength and durability, excellent thermal management due to uniform heat distribution, standardized sizes (e.g. 18650, 21700, 32700, etc.) facilitate mass production, and integration (Habib et al., 2019; Houache et al., 2022).
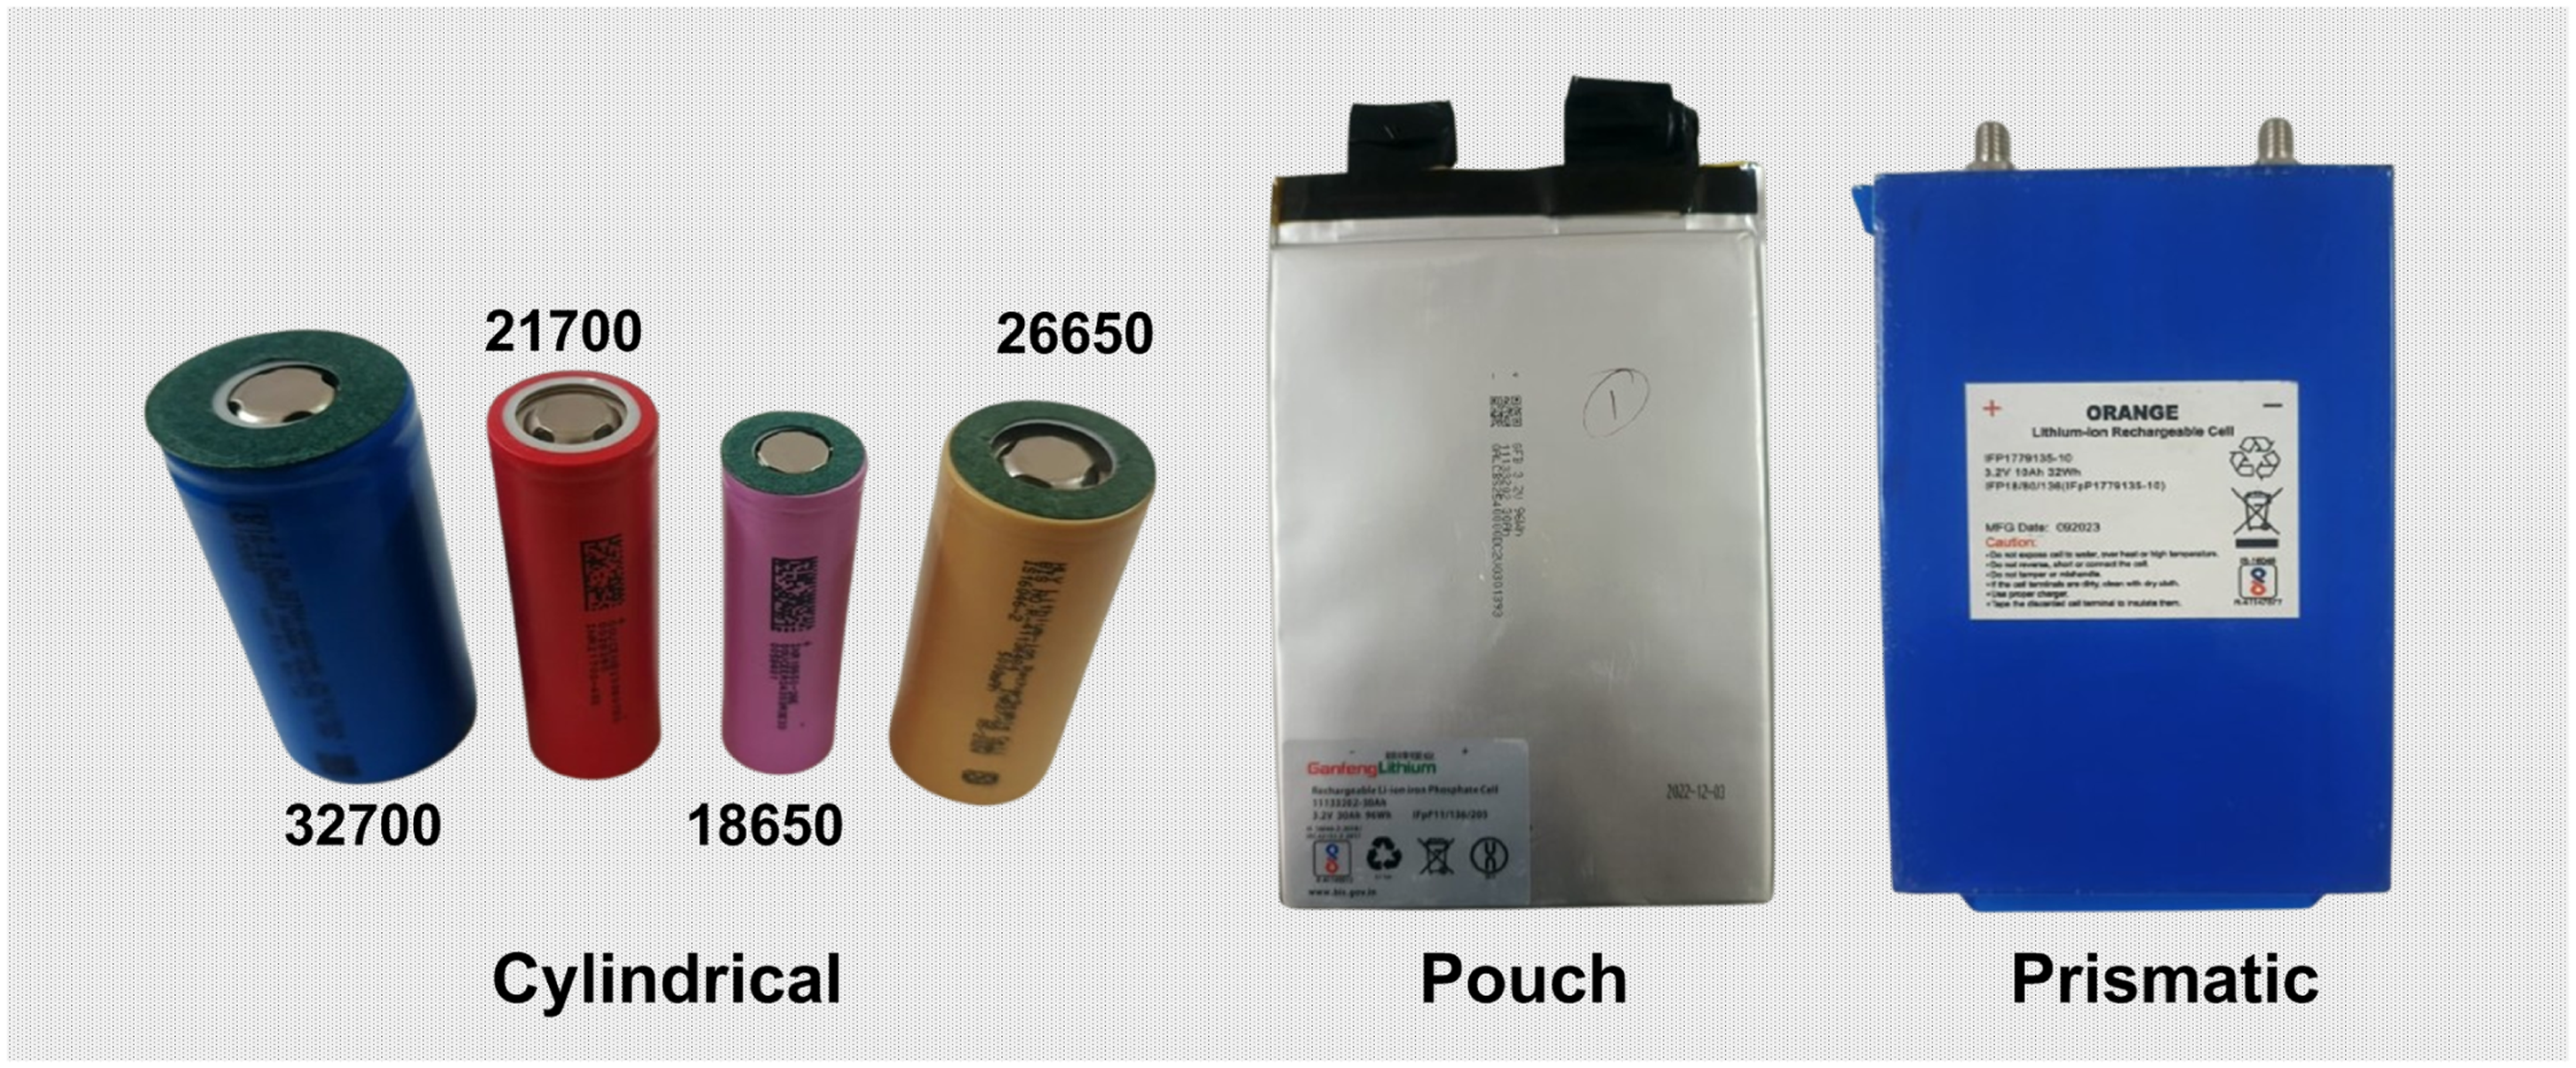
Lithium-ion cell formats.
In electric vehicle high performance of battery is expected. Batteries operational behavior is quite cumbersome and some time unexpected also, thus it is highly desirable for designers to understand how the battery responds to different current stimuli. It is thus obvious to have an equivalent mathematical model of battery to predict output voltage for a current stimuli. Here

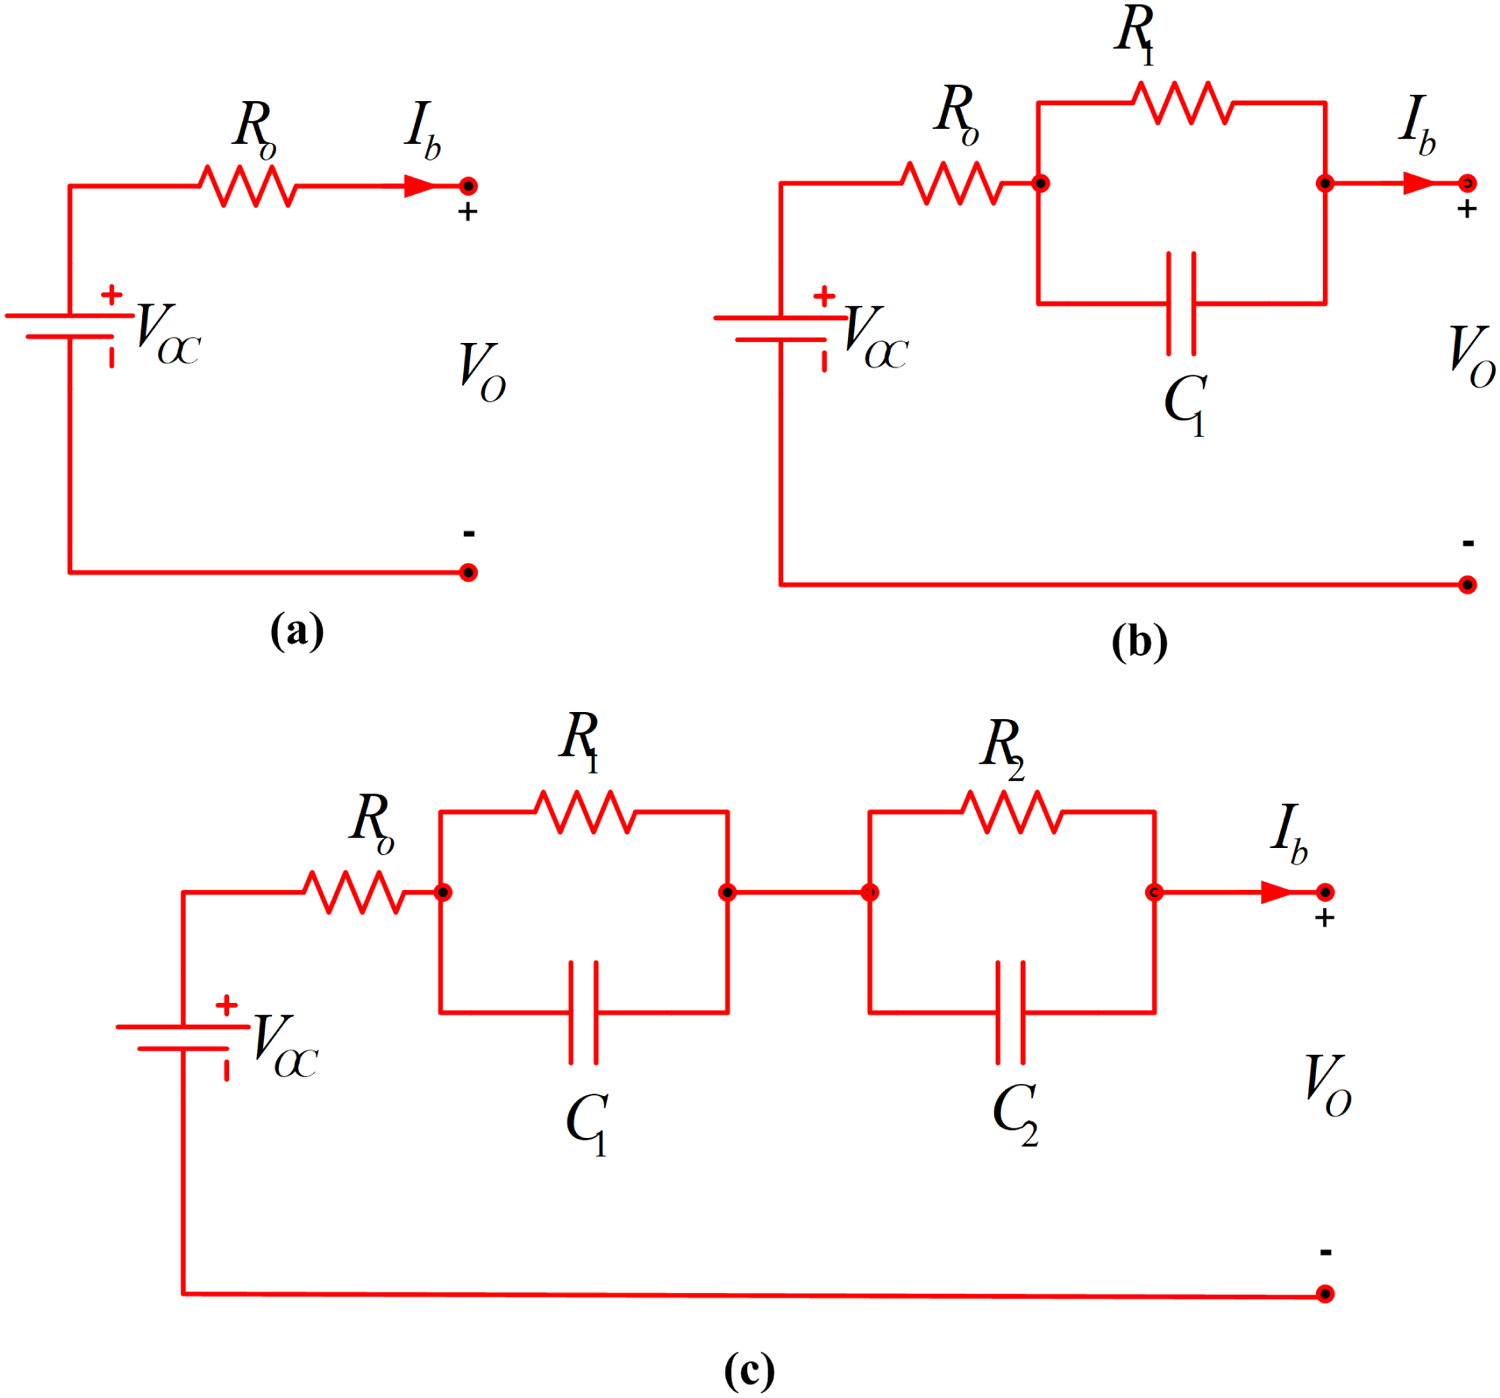
Lithium-ion cell equivalent circuit model showing (a)
Thevenin model shown in Figure 2 is superior than
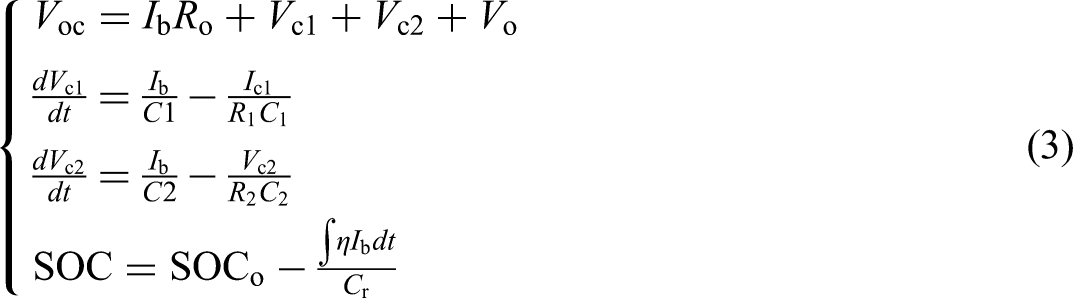
Discrete time analysis at
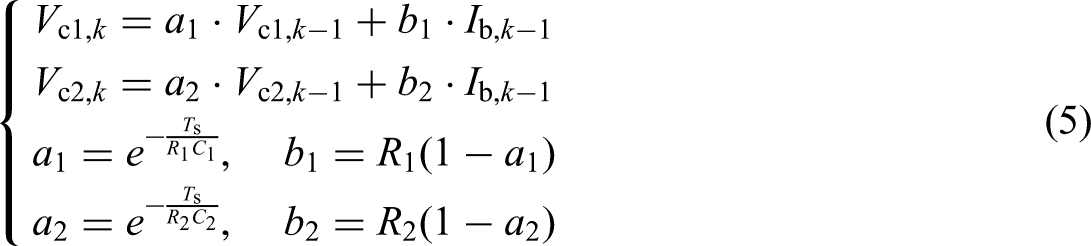
The discharge/charge pulse behavior of INR18650-26E (NMC type) is shown in Figure 3. Here a test sequence (start-step I-step II-step III-step IV-step V-end) is followed for cell ID-18 and cell ID-19, where the steps are as: Step I = rest (2 min), step II = discharge pulse (5 min) and step III = rest (10 min), step IV = charge pulse (5 min), step V = rest (10 min). Initially during rest the cells are in stable condition and have different initial voltage, during the start of the discharge/charge pulse there is sudden decrease/increase of cell OCV due to internal dc resistance, the cell ID-21 has received a 1C amp discharge/charge pulse and cell ID-18 has received a 0.5C amp discharge/charge pulse. During the discharge/charge pulse the OCV follows a dynamic non-linear profile as shown in Figure 3 and for the rest time after discharge/charge pulse, the OCV recovery is evident and this slowly changing voltage is known as diffusion voltage. Thus it is crucial to have an ECM which could track this dynamic non-linear behavior and predicts the battery SOC accurately.
Lithium-ion 18650 cell constant discharge/charge pulse behavior.
Equivalent circuit model parameter estimation
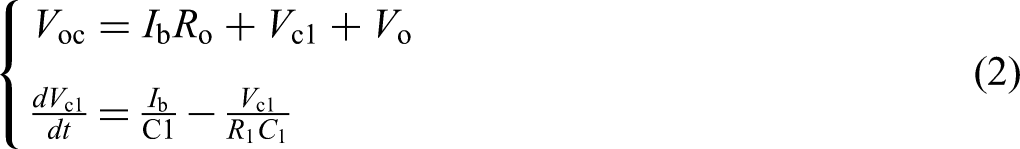
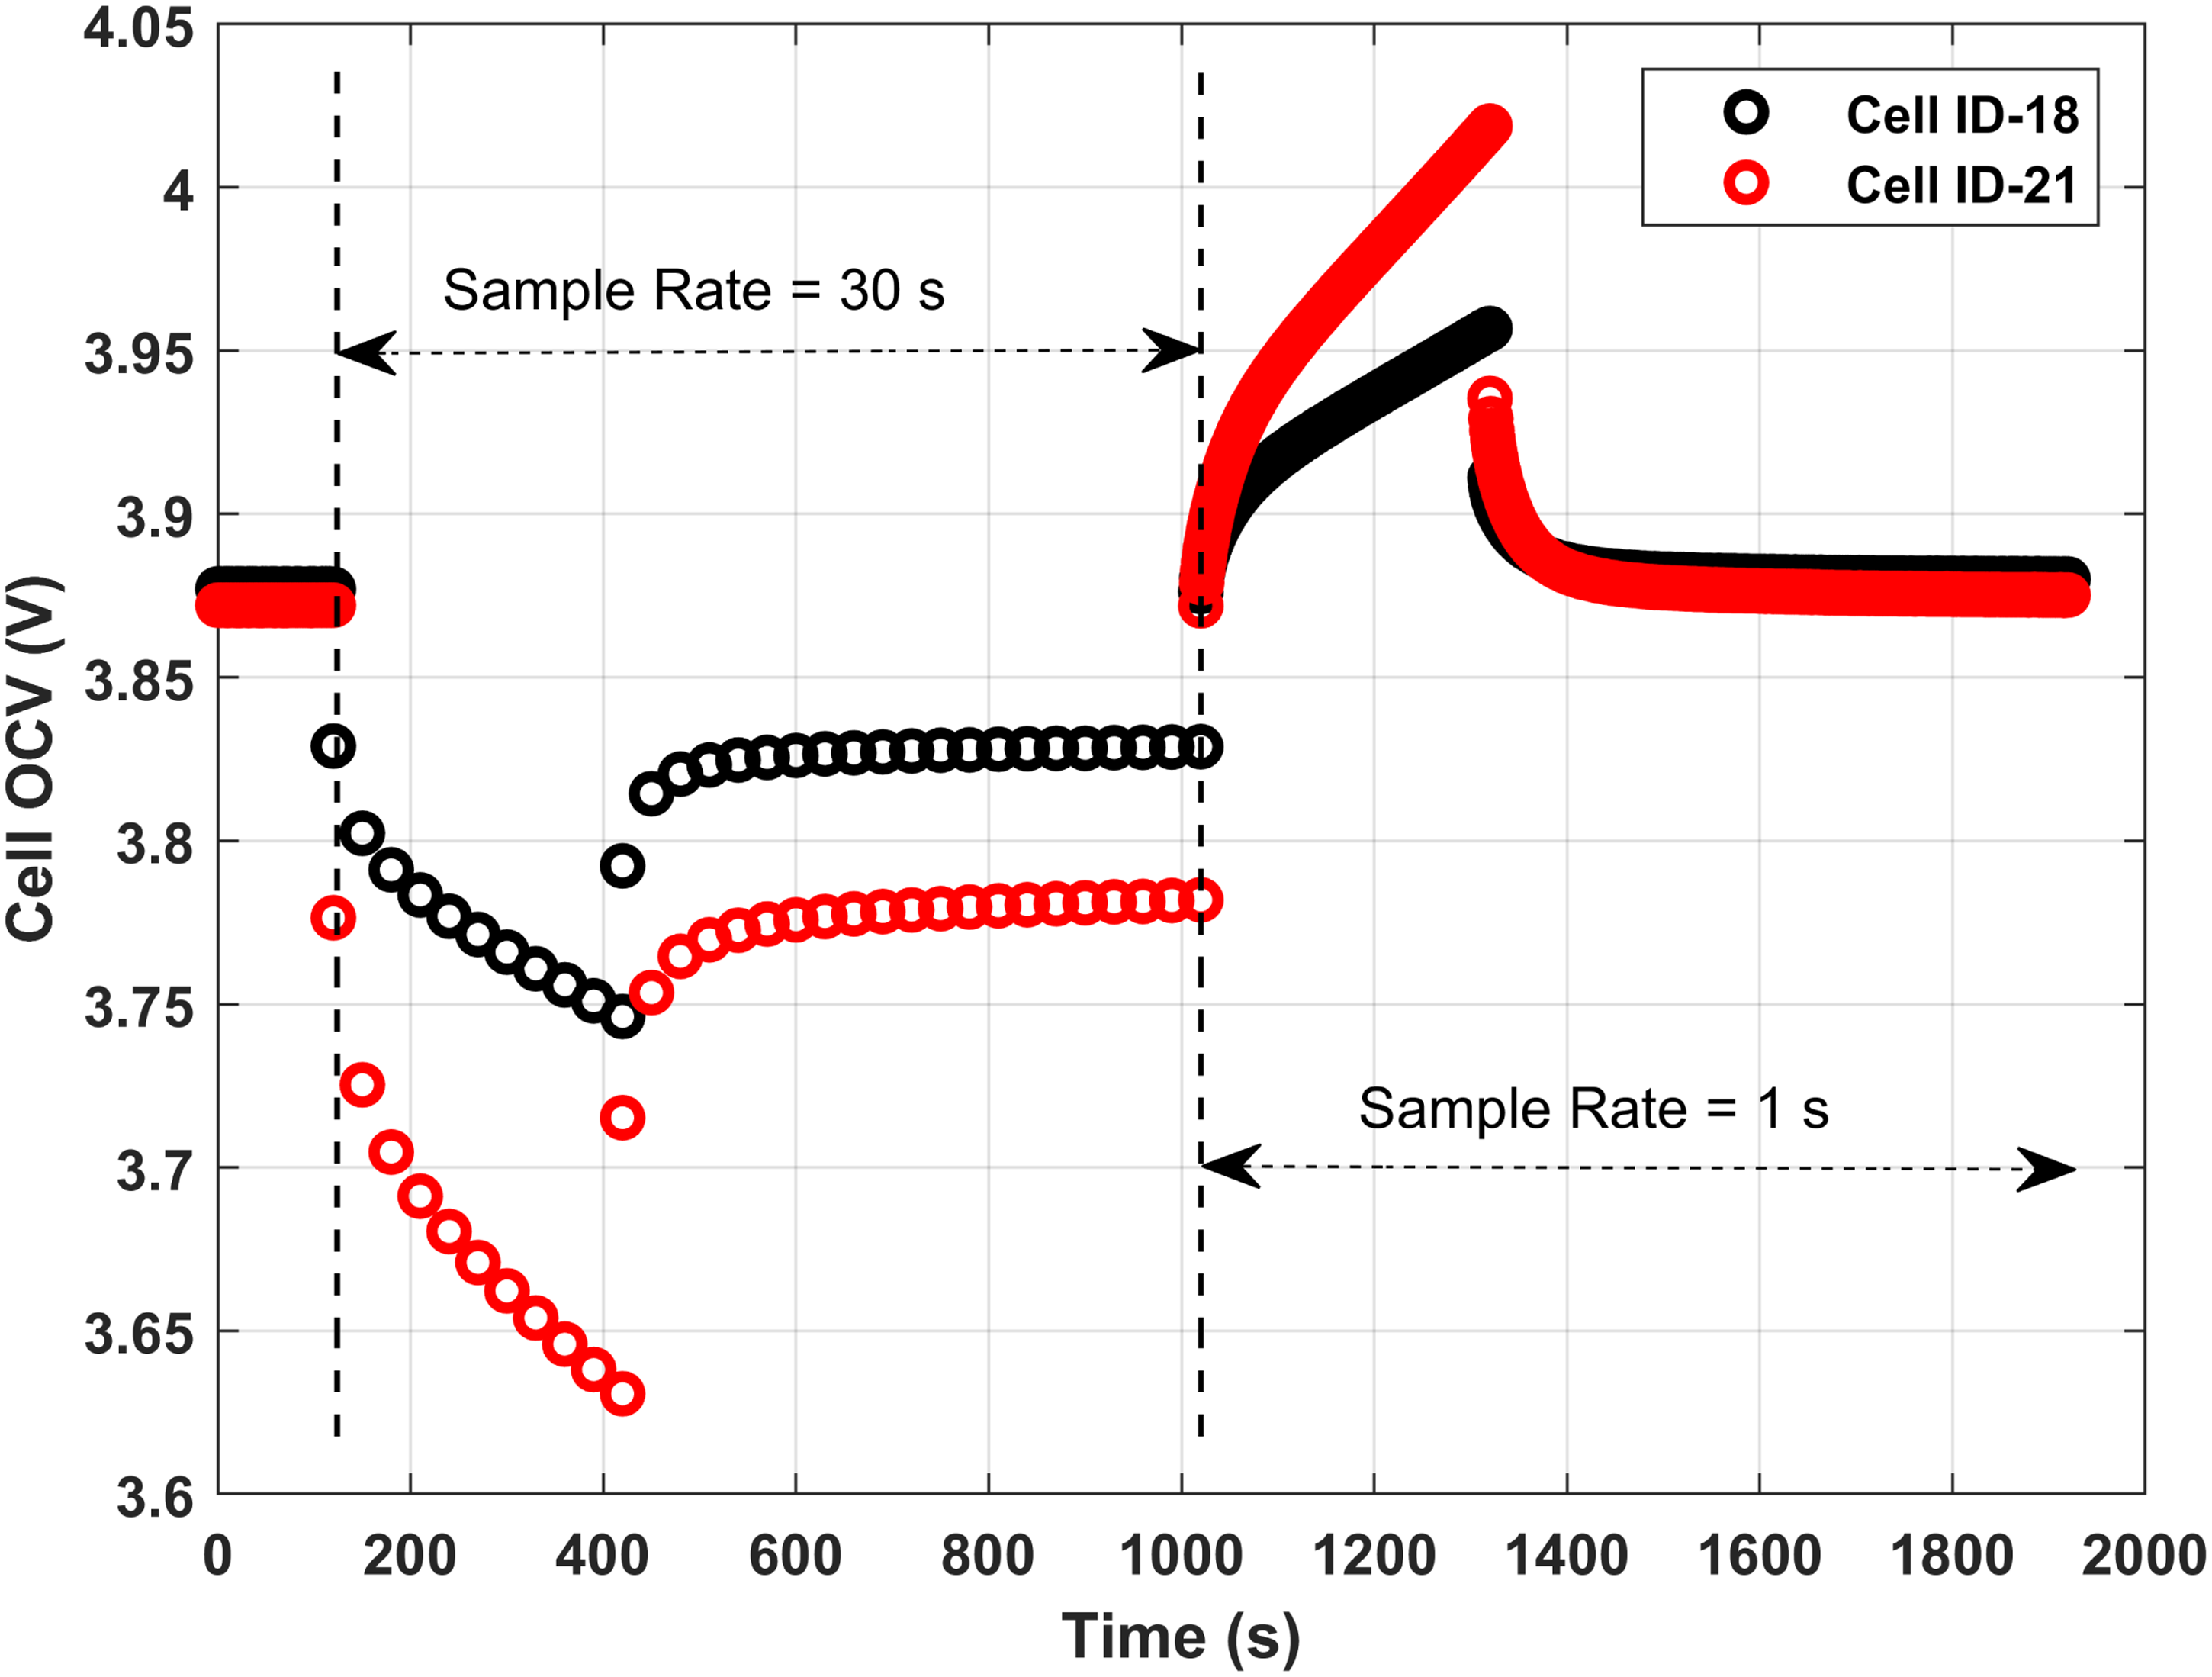
Lithium-ion cell chemistry used in this study are NMC and LFP type, however, detailed analysis is presented for INR18650-26E (NMC) cell. The specification for INR18650-26E (NMC) cell, INR21700-45E (NMC) cell, 26650 (NMC) cell and 32700 (LFP) cell is given in Table 1. Li-ion NMC cells are widely used in EV due to their high energy density, long cycle life, and versatility. The battery electrical behavior is modeled using the 1RC equivalent circuit, and for accurate modeling ECM parameter evaluation must be address to avoid inaccurate range, SOC and DOD prediction and will also compromise BMS decision making which ultimately leads to uncertainty to the user of EV. A simple procedure is followed to estimate the circuit parameters, first static capacity test is performed on the cell, then HPPC test is performed which includes a series of charge/discharge pulse with relaxation period and at last from the obtained experimental data set cell ECM parameters are estimated.
Different lithium ion cells electrical specifications.
OCV determination
The OCV is a fundamental parameter in the characterization of lithium-ion batteries, representing the voltage of the battery when no external load is applied and the system is in equilibrium. OCV is a critical input for BMS as it is directly related to the SOC of the battery. Accurate determination of the OCV–SOC relationship is essential for reliable SOC estimation, capacity fading analysis, and the development of ECMs.
The OCV–SOC relationship is typically nonlinear and varies depending on the battery chemistry, temperature, and aging conditions. The OCV curve is often fitted using empirical or semi-empirical models, such as polynomial functions, look-up tables, or advanced electrochemical models. The hysteresis effect, which results in different OCV values during charge and discharge, is also analyzed and incorporated into the model for improved accuracy.
It is of high priority to know the battery SOC so as to accurately predict the vehicle range, and beside this the BMS is going to utilize OCV data for its most of the crucial functions. Battery OCV pattern is not straightforward and rather is a function of SOC and temperature. The OCV data of different Lithium-ion cells is acquired for different C rates using a 8 channel cell testing machine. The host computer extracted the data through BTS 6.0.0 software, and the voltage and current parameters are recorded for the whole duration of test with an interval of 1 sec, the test bench with test control interface, test sequence setting and test data capturing is shown in Figure 4. The test procedure follows: Step I- Initially the cell is charged to the upper voltage using constant current constant voltage (CCCV) mode and then kept for rest for 2 hour till the steady state voltage is reached. Step II- Cell is discharged with C/5 amp rate till the cut-off voltage is reached (discharge capacity is verified from the cell data sheet). Step I and II are then repeated for C/2 and 1C amp rate, here the cell data sheet is used to ensure cell operates in the prescribed limit, and thus for charging CCCV mode is used and discharge current is limited to 1C amp.
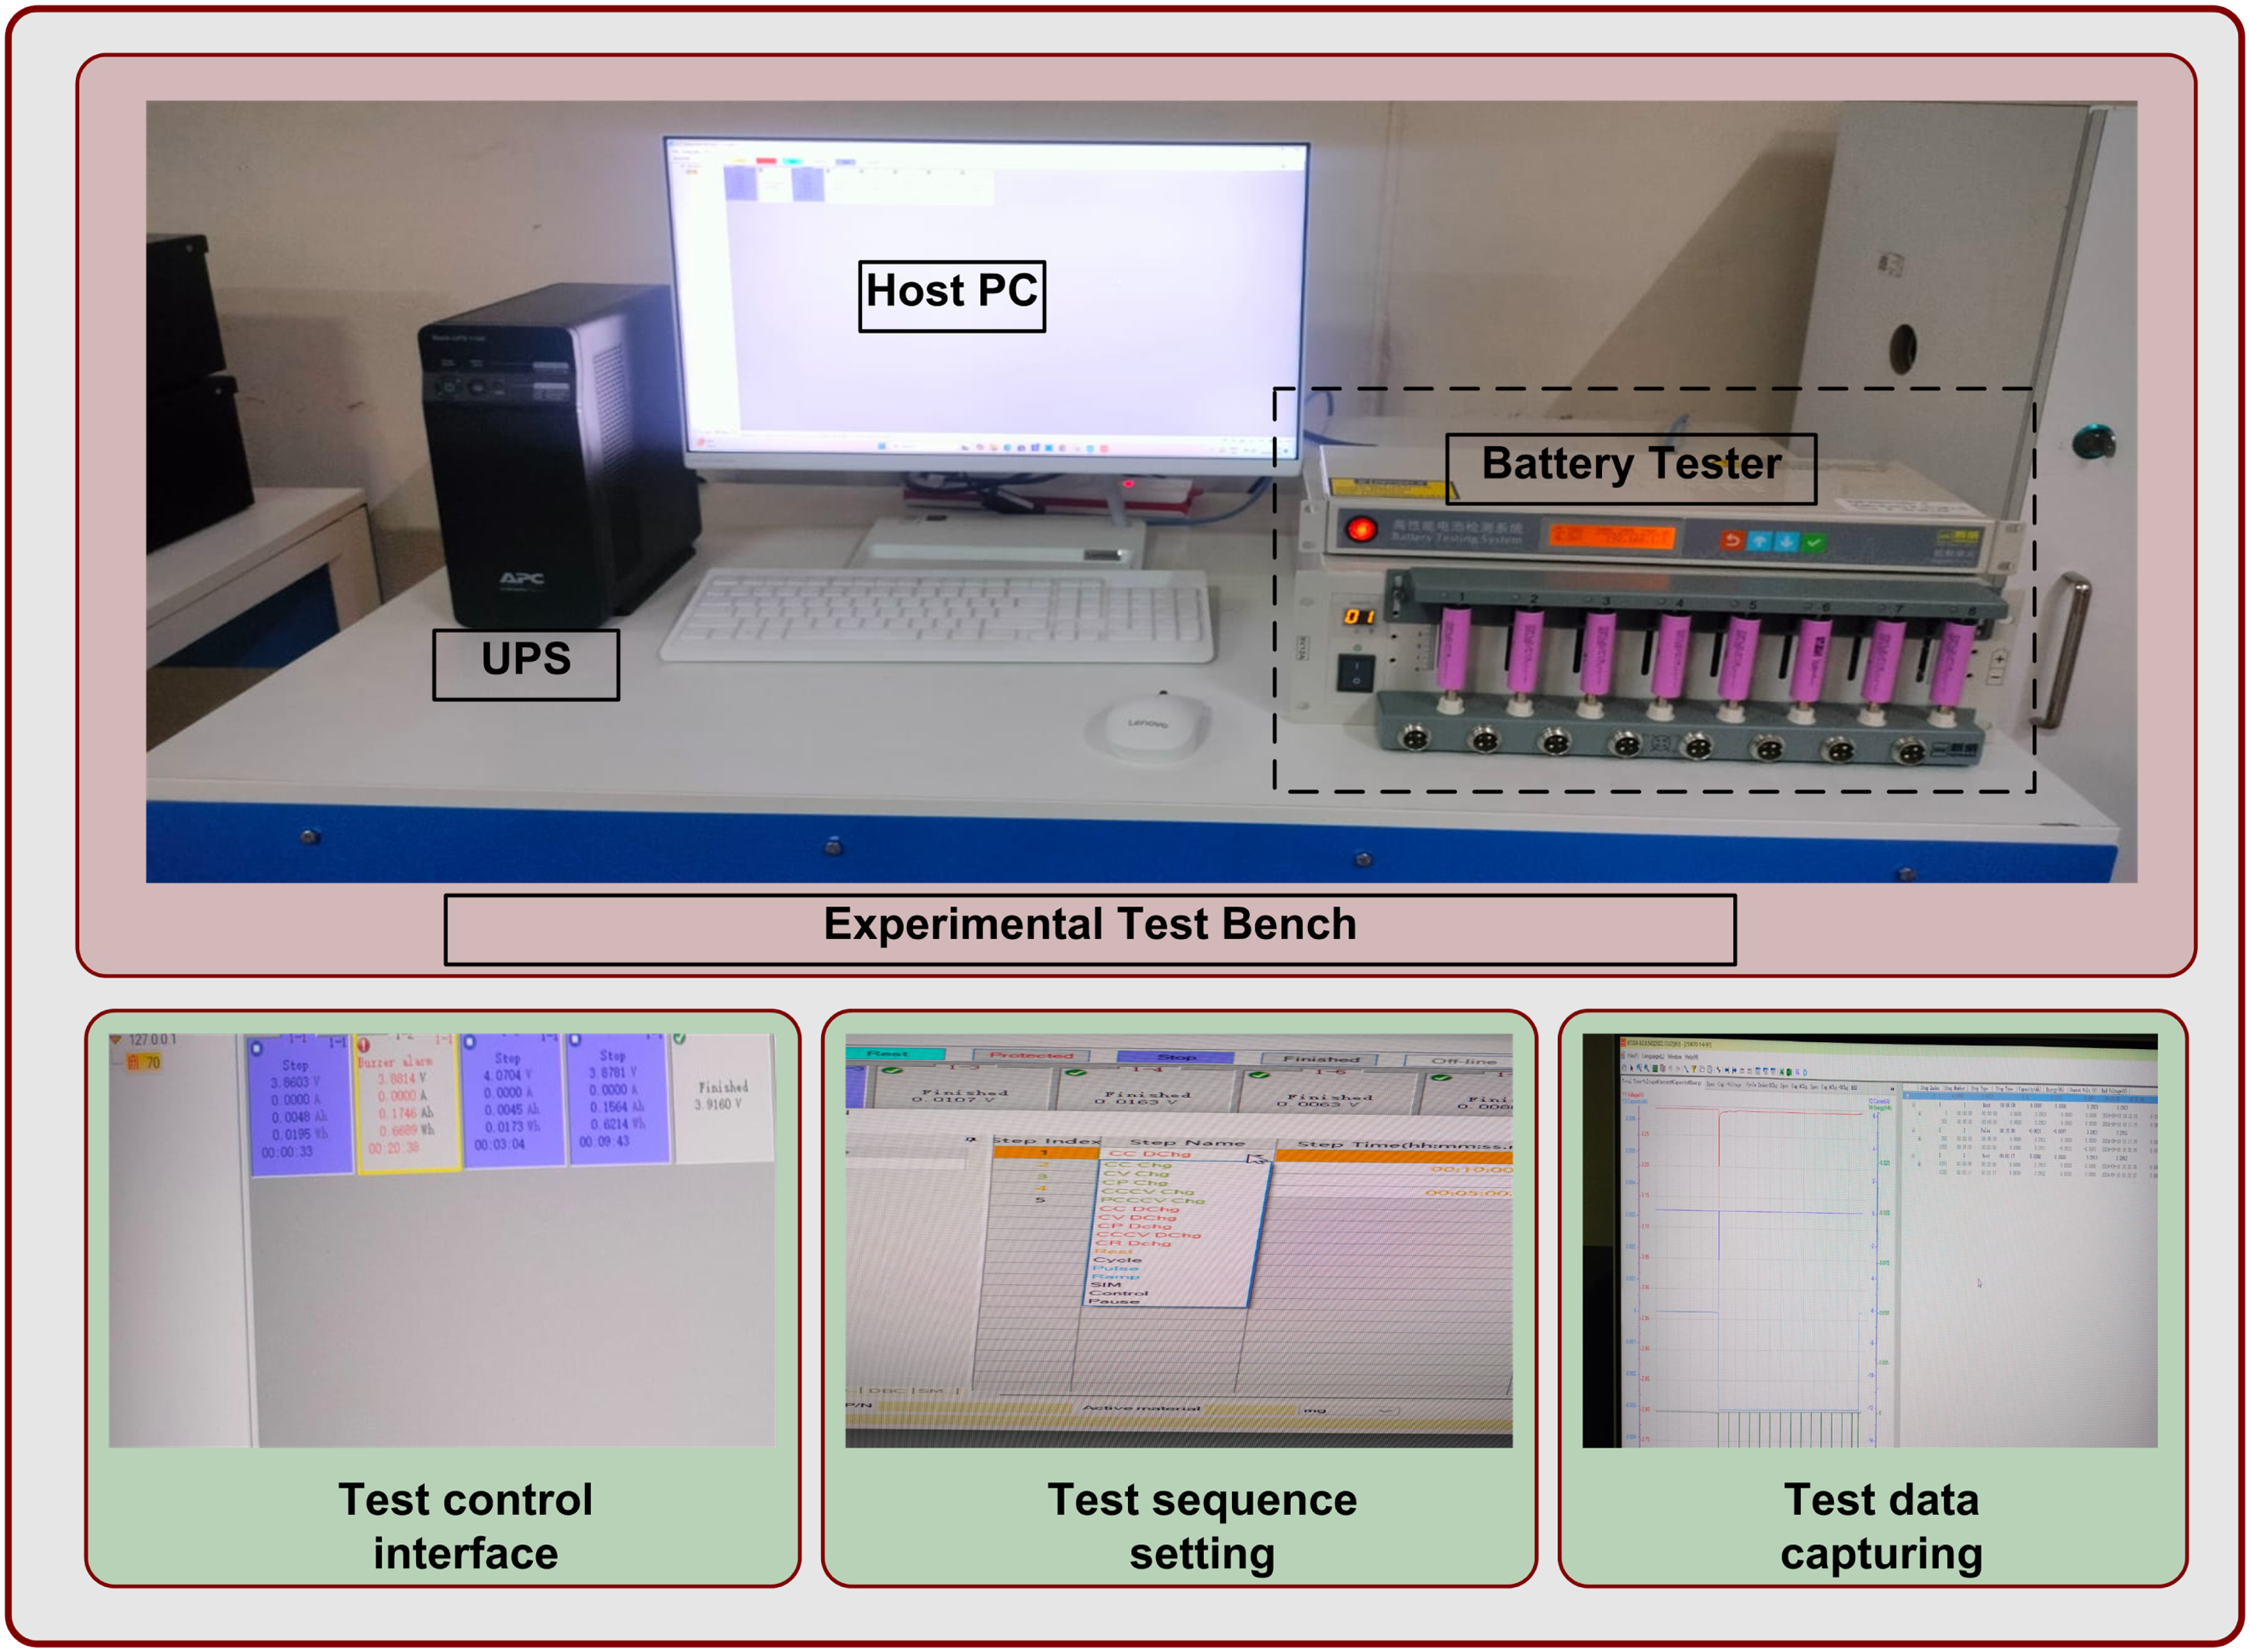
Experimental test bench (top), and test control interface operation (bottom).
For 32700 (LFP) cell, the cell OCV curve is captured with respect to the SOC as shown in Figure 5, the available capacity for C/5 A, C/2 A, and 1C A were 6.1344 Ah, 6.1900 Ah, and 6.1011 Ah, respectively, which conforms to the cell datasheet. Cell OCV curve is almost flat for a range of 30% SOC to 90% SOC range. For 21700 (NMC) cell, the cell OCV curve is captured as shown in Figure 5, the available capacity for C/5 A, C/2 A, and 1C A were 4.534 Ah, 4.51 Ah, and 4.517 Ah, respectively, which conforms to the cell datasheet. Various graphs are plotted for lithium-ion NMC and LFP cells as shown in Figure 5. All cells have followed the same test procedure i.e they are first ensured to attain the upper voltage limit through CCCV mode, sufficient time is given for rest so as to attain thermal equilibrium; then a constant C/2 A discharge is ensured till the cut-off voltage. Lithium-ion NMC type cell (18650, 21700, 26650) OCV–SOC curve pattern is somewhat similar with small variations, whereas the lithium-ion LFP type cell (32700) OCV–SOC curve is more flat as compared to NMC type as shown in Figure 5.
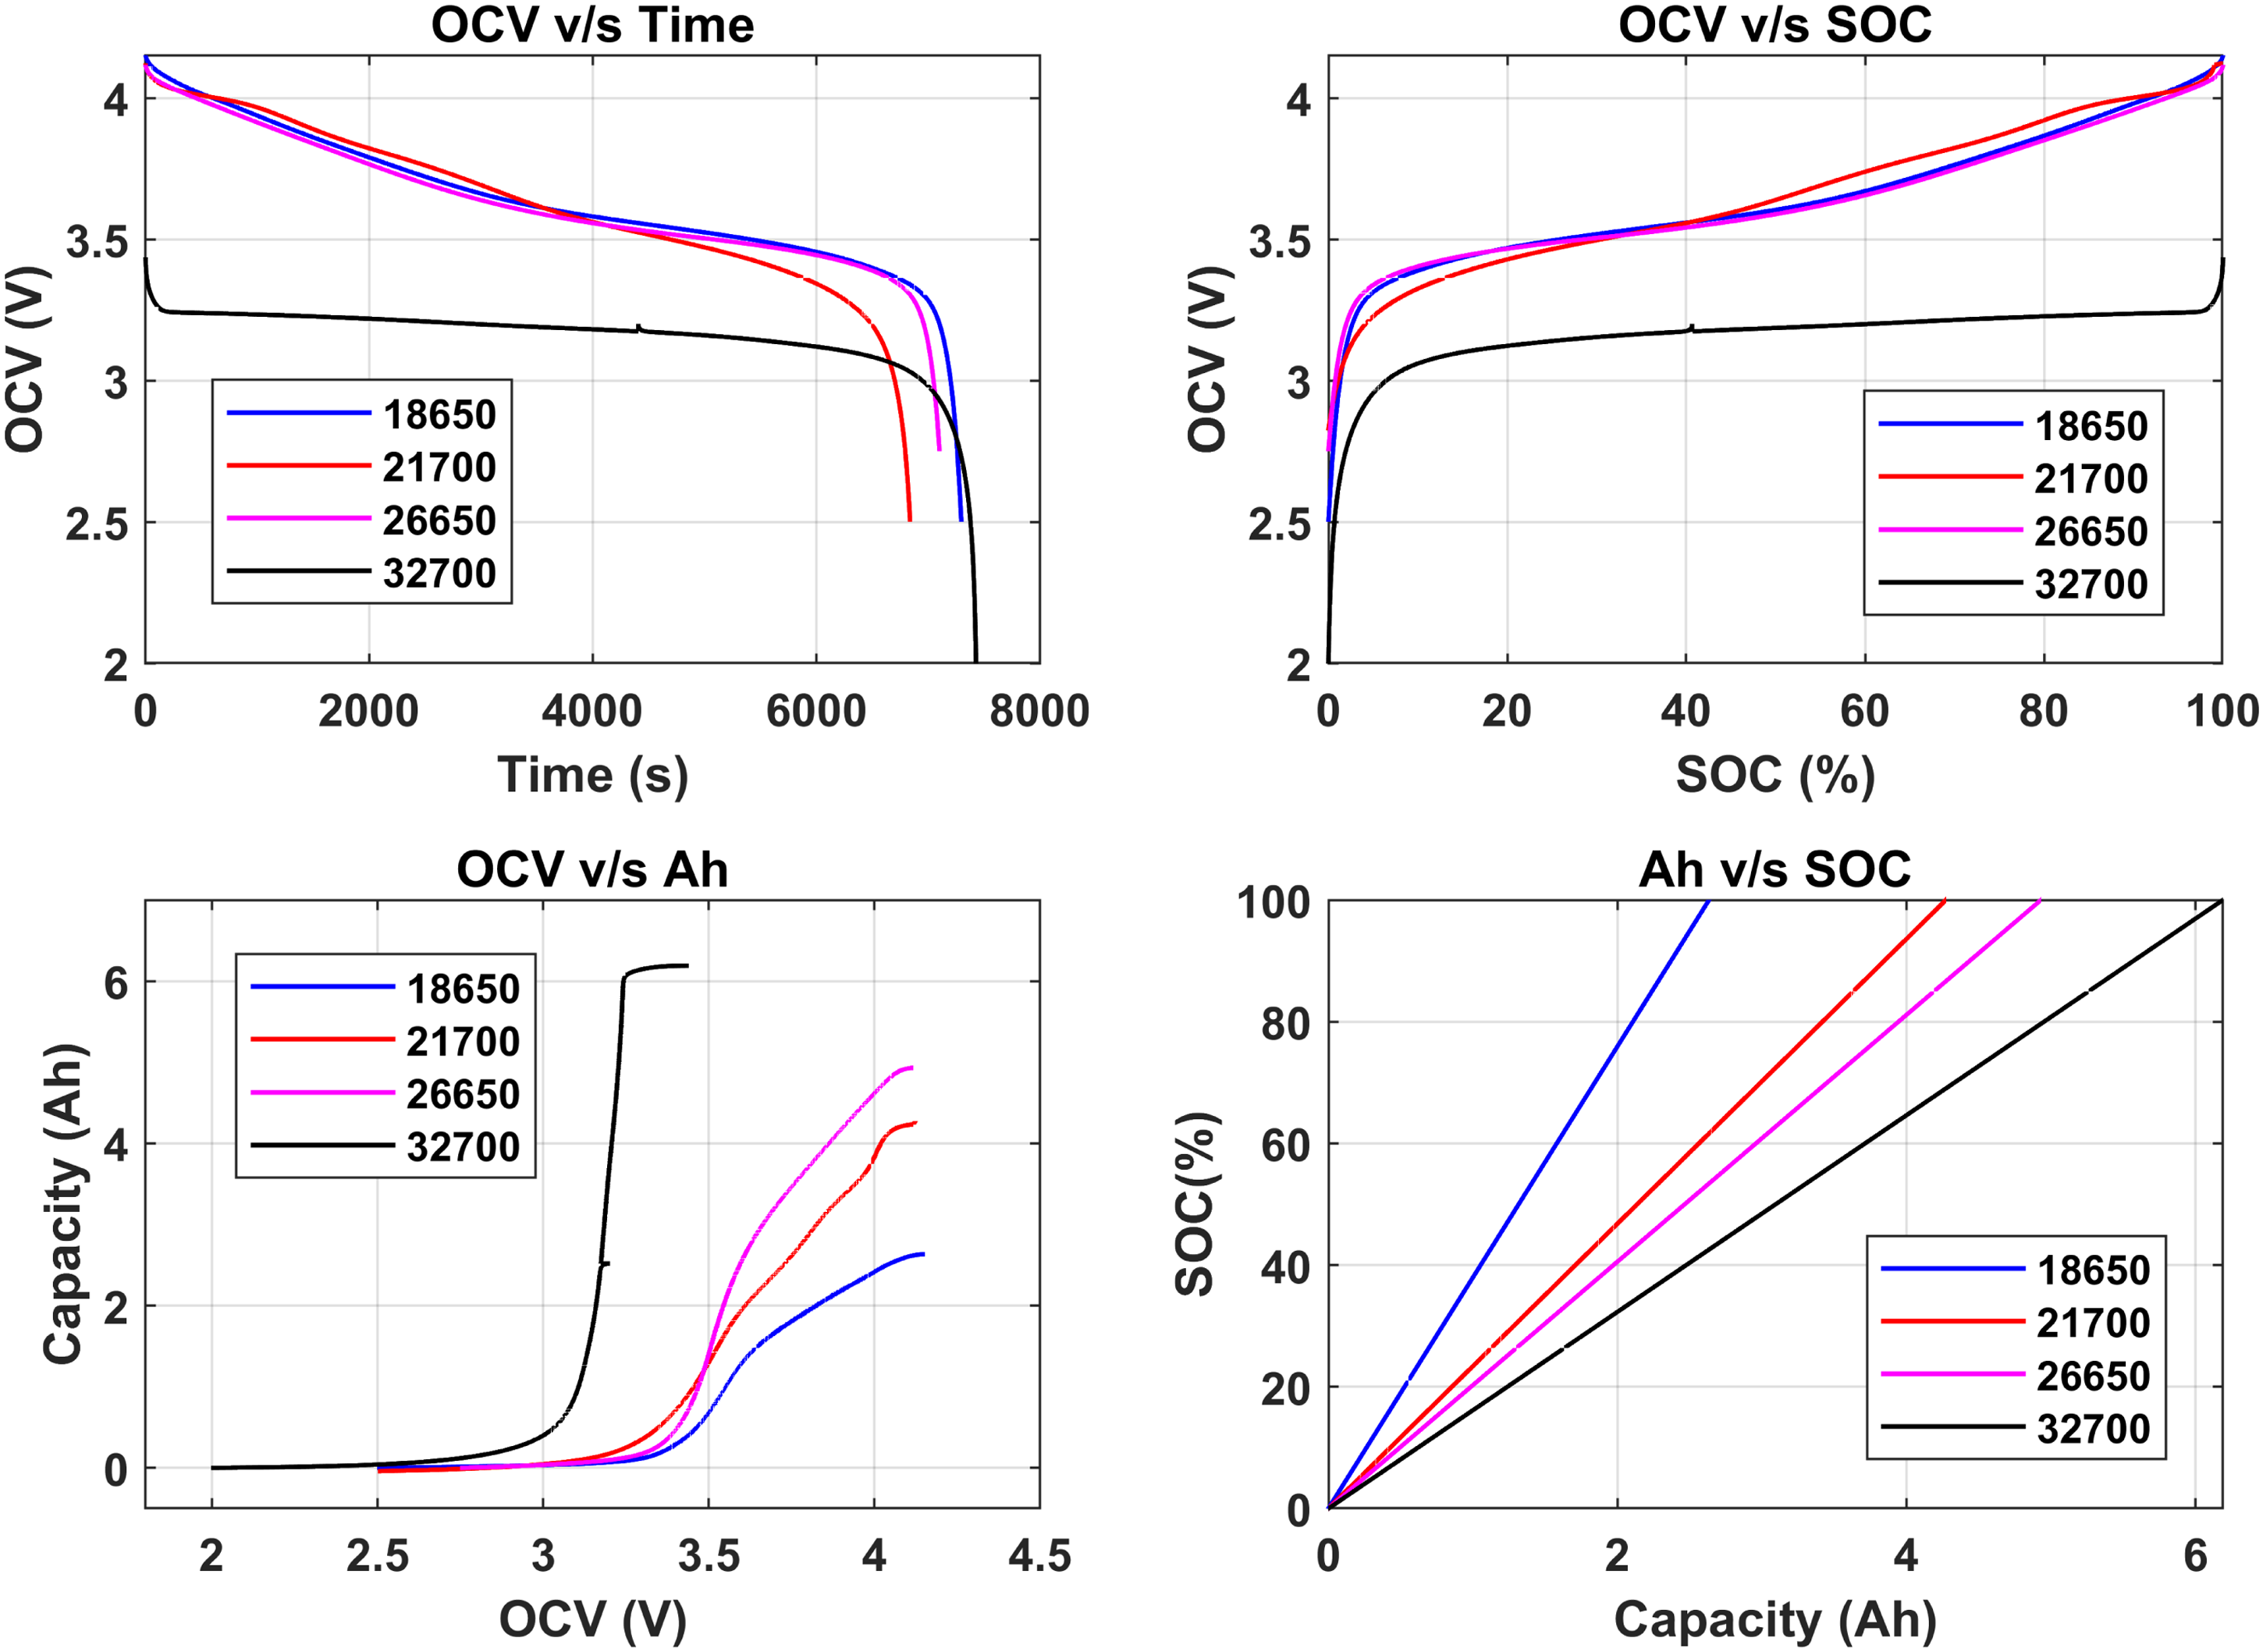
Test results for different Lithium-ion cells showing, cell OCV data w.r.t time (top left), cell OCV data w.r.t cell SOC (top right), cell capacity data w.r.t cell OCV (bottom left) and cell SOC data w.r.t cell capacity (bottom right).
HPPC test
The HPPC test is a widely used experimental technique to evaluate the dynamic performance and internal resistance characteristics of lithium-ion batteries. This test provides critical insights into the battery’s ability to deliver high-power pulses, which is essential for applications such as EVs, hybrid electric vehicles (HEVs), and grid energy storage systems. The HPPC test is particularly valuable for understanding the battery’s response under transient load conditions, which are often encountered in real-world operating scenarios.
The HPPC test involves applying a series of short-duration, high-current pulses to the battery, followed by a rest period to allow the system to stabilize. The test is typically conducted at various states of charge (SOC) to capture the battery’s performance across its entire operating range. The pulse discharge and charge currents are selected based on the battery’s rated capacity and the desired power level, often expressed as a multiple of the C-rate (e.g. 1C, 5C, or 10C).
The test protocol generally consists of the following steps:
Initialization: The battery is preconditioned by charging it to the upper voltage limit and then discharging it to the lower voltage limit to establish a baseline.
SOC Adjustment: The battery is charged or discharged to a specific SOC level, typically in 10% increments from 100% to 0% SOC.
Pulse Application: At each SOC level, a high-current discharge pulse is applied for a short duration (e.g. 10 seconds), followed by a rest period (e.g. 40 seconds). This is immediately followed by a high-current charge pulse of the same duration and magnitude, again followed by a rest period.
Data Collection: Voltage and current responses are recorded throughout the test to analyze the battery’s dynamic behavior, including its internal resistance, polarization effects, and capacity fade.
Data Analysis: The voltage response during the HPPC test is used to calculate the battery’s internal resistance, which is a key parameter for assessing its power capability. The internal resistance is determined by the voltage drop (
Additionally, the HPPC test provides valuable information on the battery’s polarization resistance, which arises due to the electrochemical processes occurring within the cell. The polarization resistance can be estimated by analyzing the voltage relaxation behavior during the rest periods.
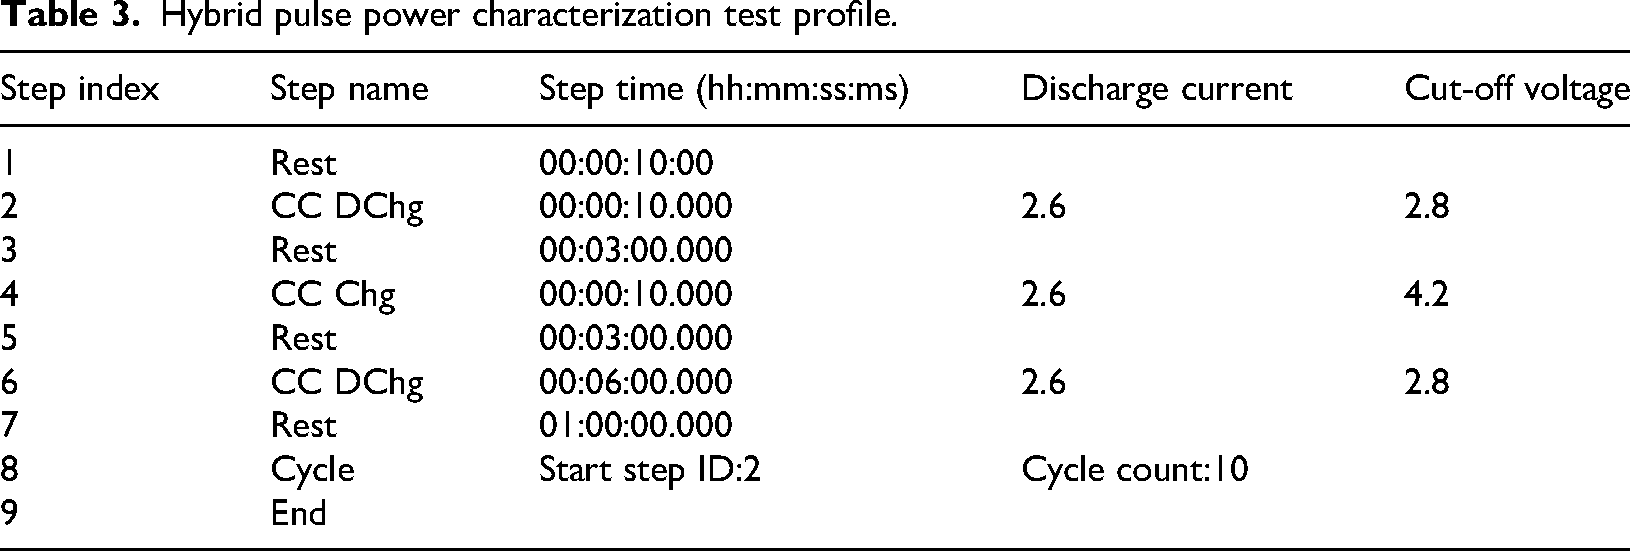
Internal parameters of battery equivalent circuit plays a vital role in predicting the dynamic behavior of battery. HPPC test is conducted on the lithium ion cell at a 10% SOC intervals starting from 100% to 0%. The upper (100% SOC) and lower (0% SOC) voltage level are strictly as per the cell data sheet, and in HPPC test the amp C rate are strictly in accordance of the limits prescribed in the cell data sheet, here a charge and discharge pulse sequence of 1C amp rate is used.
RC parameter identification
The accurate identification of RC (resistor-capacitor) parameters is a critical step in developing ECMs for lithium-ion batteries. These parameters, which include ohmic resistance, charge transfer resistance, and double-layer capacitance, are essential for capturing the dynamic behavior of the battery, such as voltage relaxation, polarization effects, and transient response. RC parameter identification enables the simulation of battery performance under various operating conditions, making it indispensable for BMS, SOC estimation, and SOH monitoring.
HPPC test data will be utilized for circuit parameter calculation, the discharge pulse response is shown in Figure 6, where the instantaneous voltage transition at the start and end instants of discharge pulse is due to series resistance 

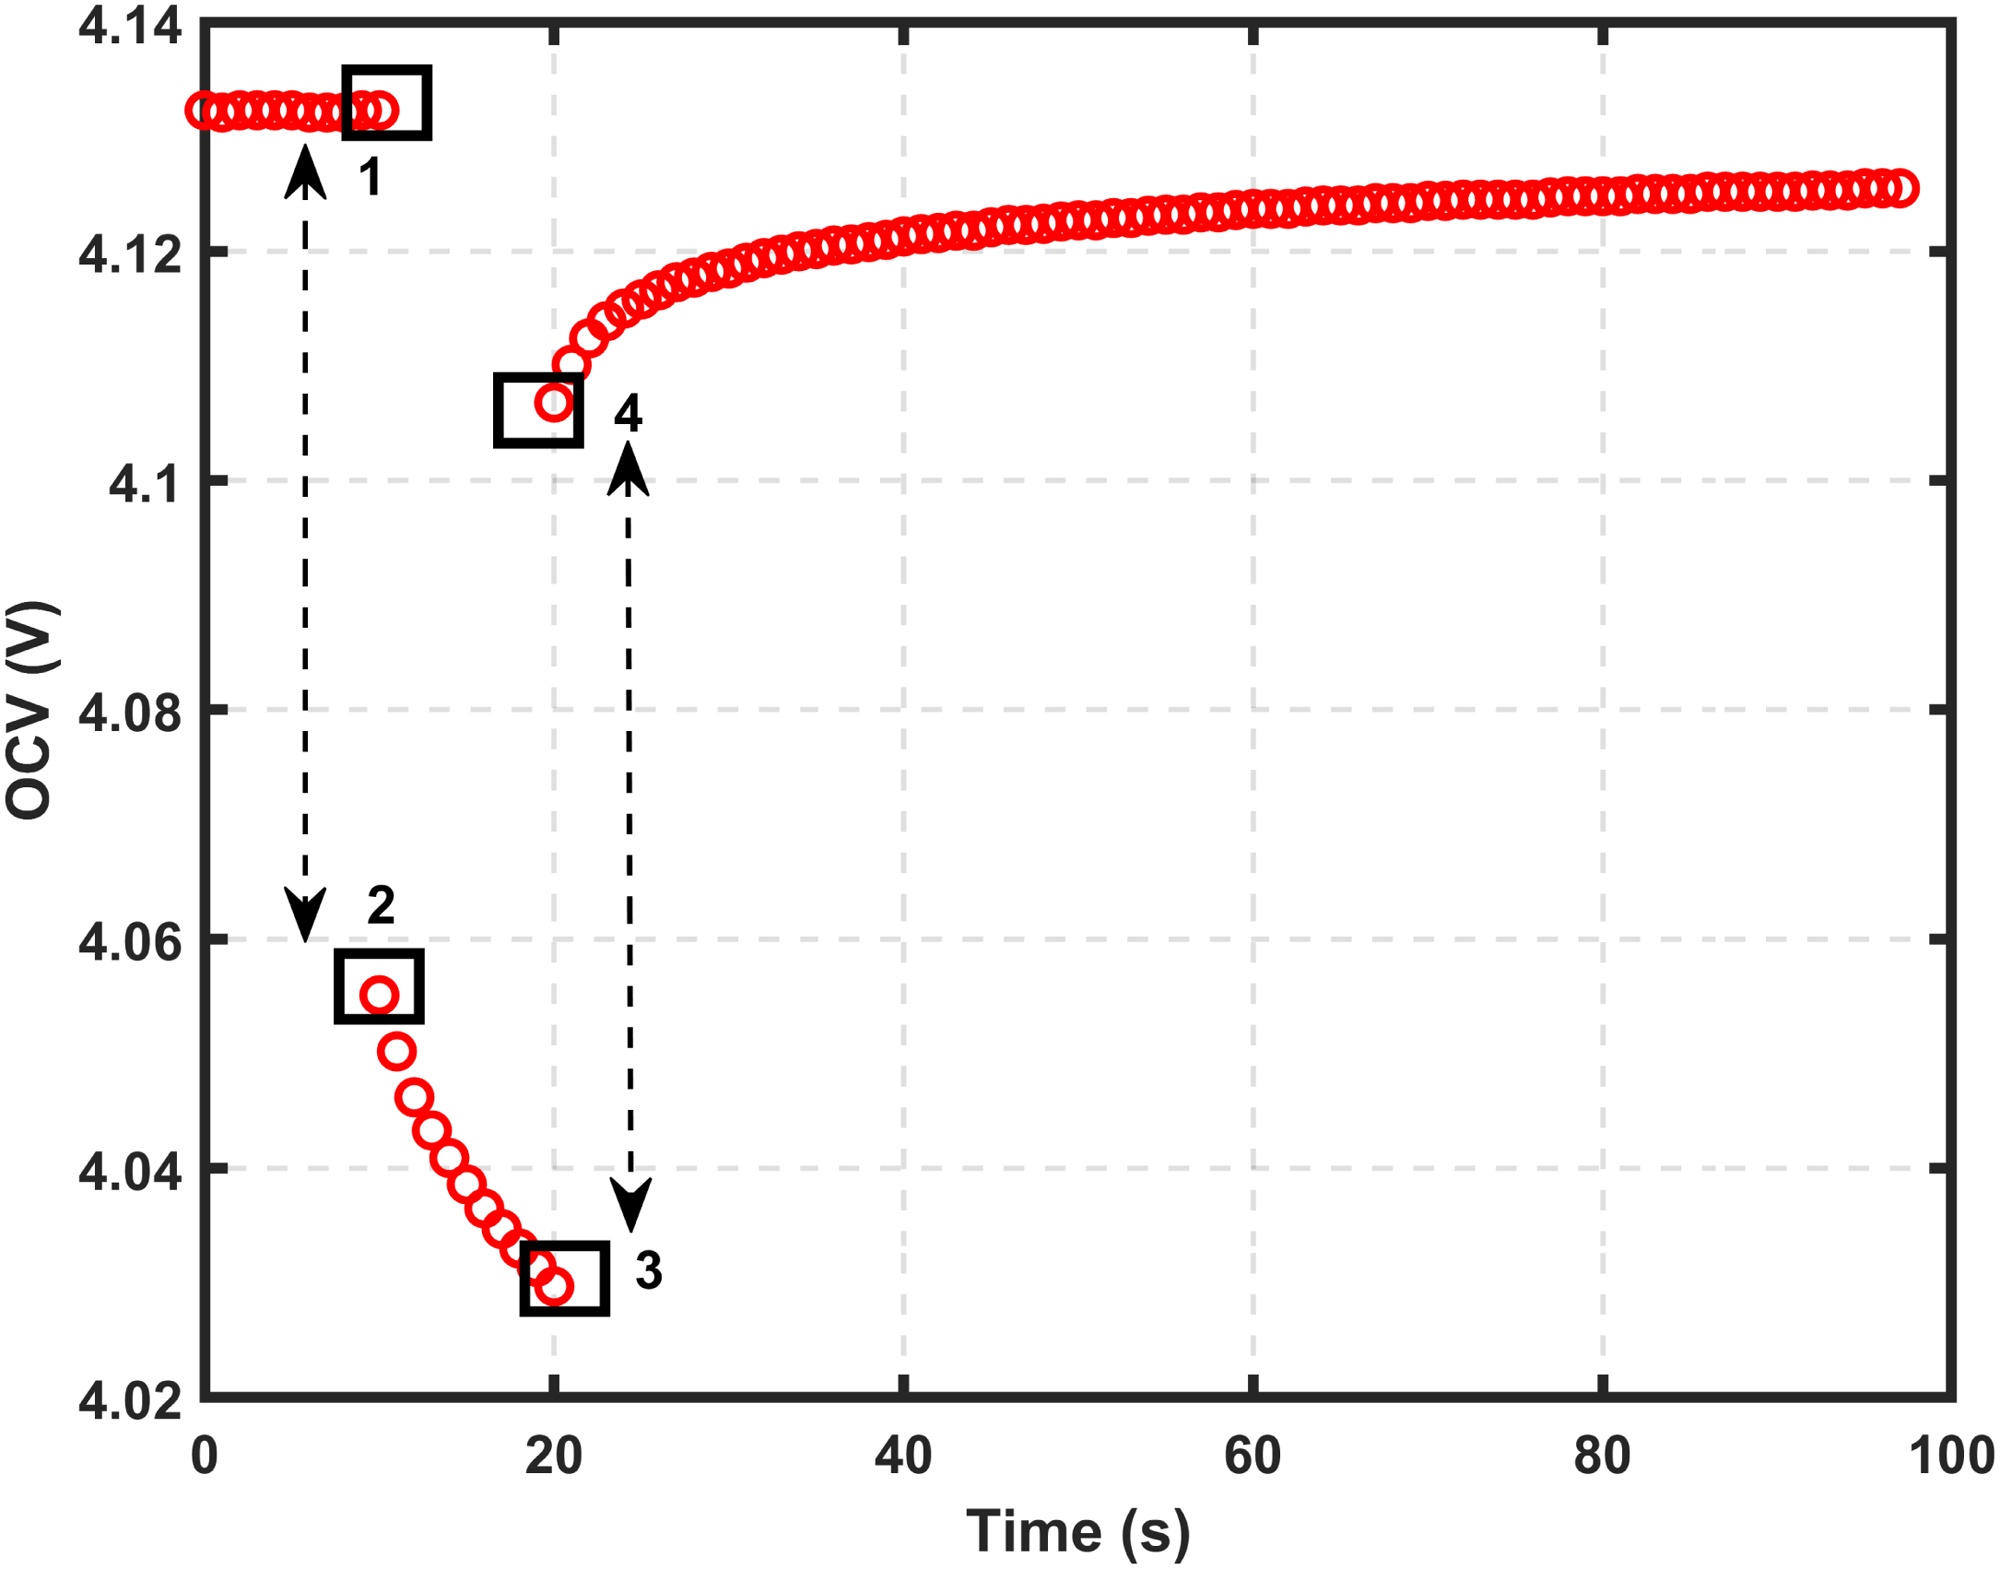
Constant discharge pulse response of lithium-ion 18650 cell.
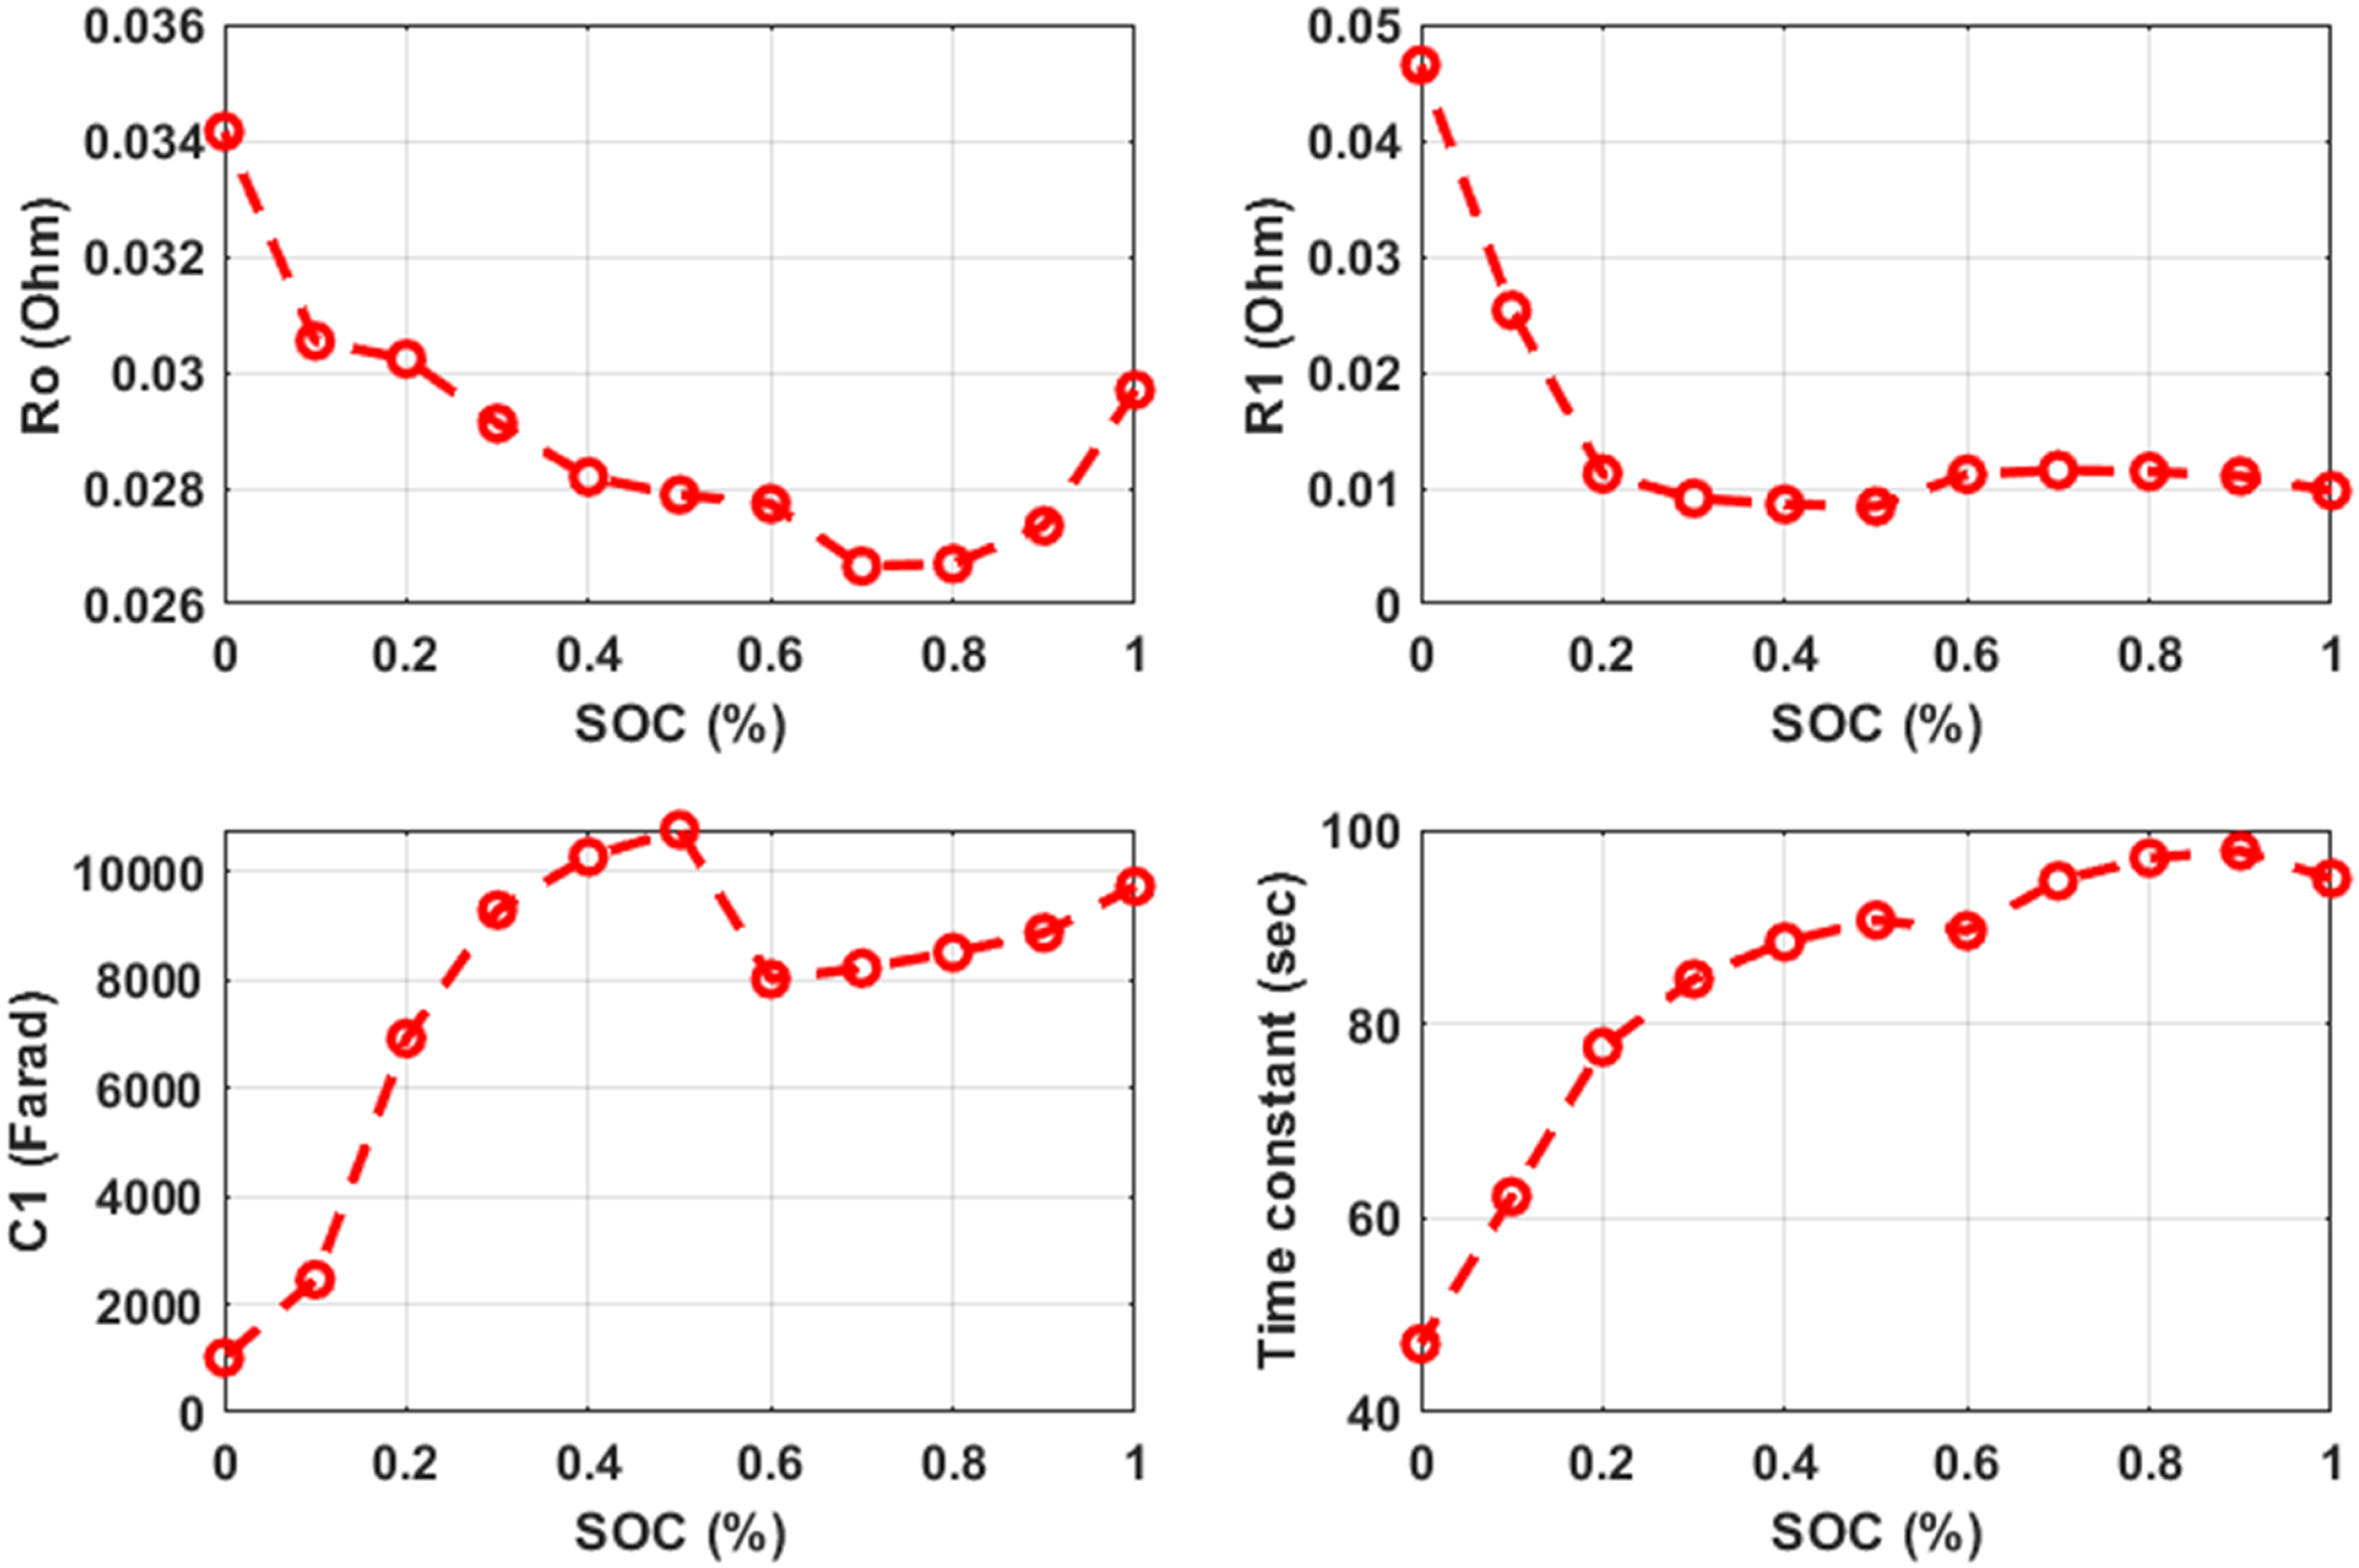
Evaluated RC parameters of 18650 cell at different SOC level showing, top left: equivalent resistance (
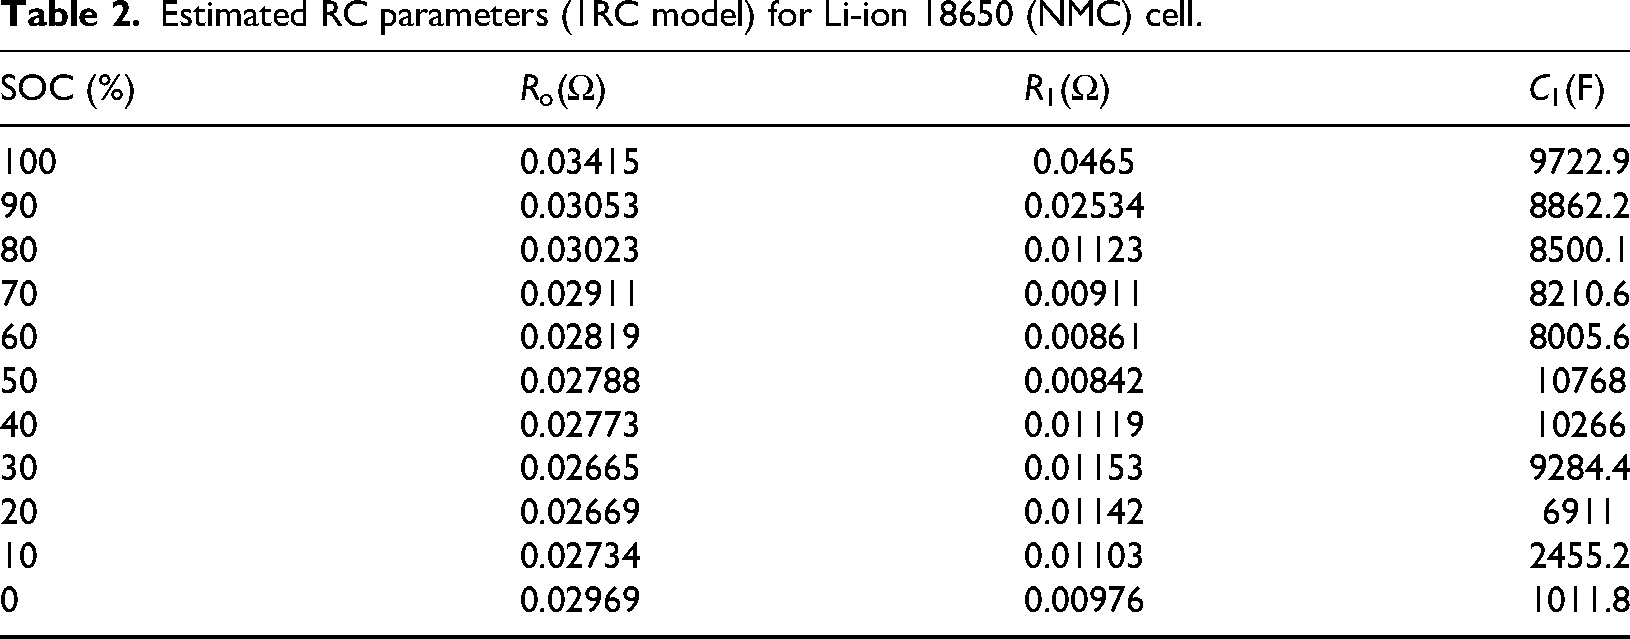
Estimated RC parameters (1RC model) for Li-ion 18650 (NMC) cell.
Experiments and model verification
All experiments for cell testing were conducted on the test bench shown in Figure 4, where the test sequence/cycle is fed through the host computer. The test platform utilizes BTS 6.0.0 software, the test instructions were entered using the host computer, and a UPS backup is ensured for hassle free test completion. For each test the data is collected from the host computer and the extracted data is analyzed separately using Matlab software. The equivalent circuit parameters are estimated using the procedure described in section “Equivalent circuit model parameter estimation” and the parameters are tabulated in Table 2. Now the simulation model performance need to be evaluated for these obtained circuit parameters, which will further validate its utility for SOC and SOH measurement. The realistic scenario of a cell operating under BMS monitoring is taken into account in all validation tests. For this reason, the lower cut-off voltage is chosen at 2.8 V rather than 2.5 V in order to prevent the cell from entering a deep discharge state.
HPPC test validation
HPPC test is utilized to estimate the equivalent circuit parameter, now a simulation model as shown in Figure 8 will be simulated for similar current pulse to evaluate the validity of the simulation model and estimated RC parameters accuracy. First, capacity test, constant discharge tests and HPPC tests are conducted using the experimental test bench, then OCV–SOC relation and 1RC model circuit parameters are estimated offline. Simulation model can be validated by providing the current profile obtained from the test bench (or any new profile). The input to the simulation model are battery current profile, cell SOC and cell OCV as shown in Figure 8, whereas battery terminal voltage ( A prolonged rest period is ensured for a fully charged cell , and the test is started with a 10-second rest period. 1C discharge pulse for 10 seconds duration is applied (the battery current during discharging is taken as +ve, while during charging is taken as A short rest period of 3 minutes. A 1C charge pulse for 10 seconds duration is applied. A short rest period of 3 minutes. A 1C discharge pulse for 6-minute duration is applied. A long rest period of 60 minutes. Repeat step 2 to step 7 for 10 cycles. With the above HPPC test sequence SOC level is gradually decreased from 100% to 0% with a 10% SOC decrements in each cycle as shown in Figure 9.
Implementation of 1RC simulation model.
HPPC Test results for 18650 Li-ion cell (at 10% SOC interval).
Hybrid pulse power characterization test profile.
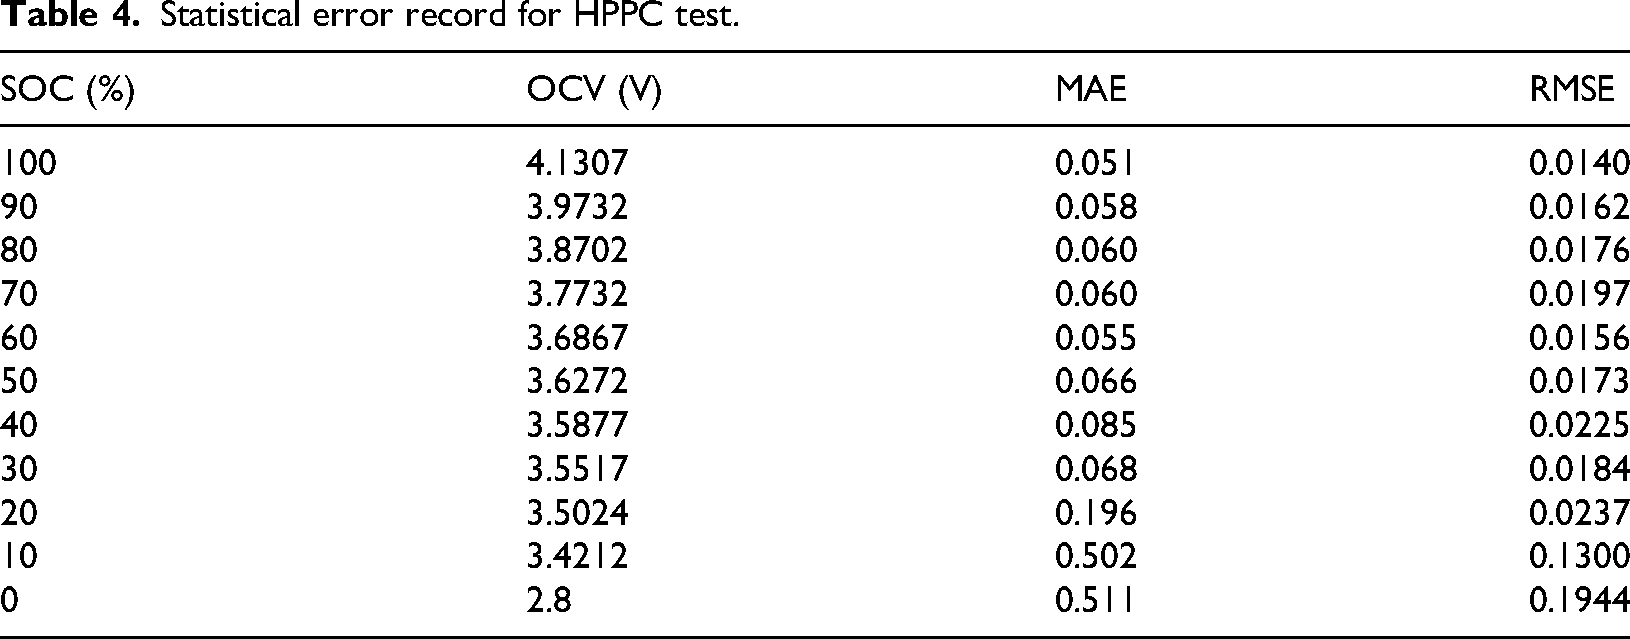
Statistical error record for HPPC test.
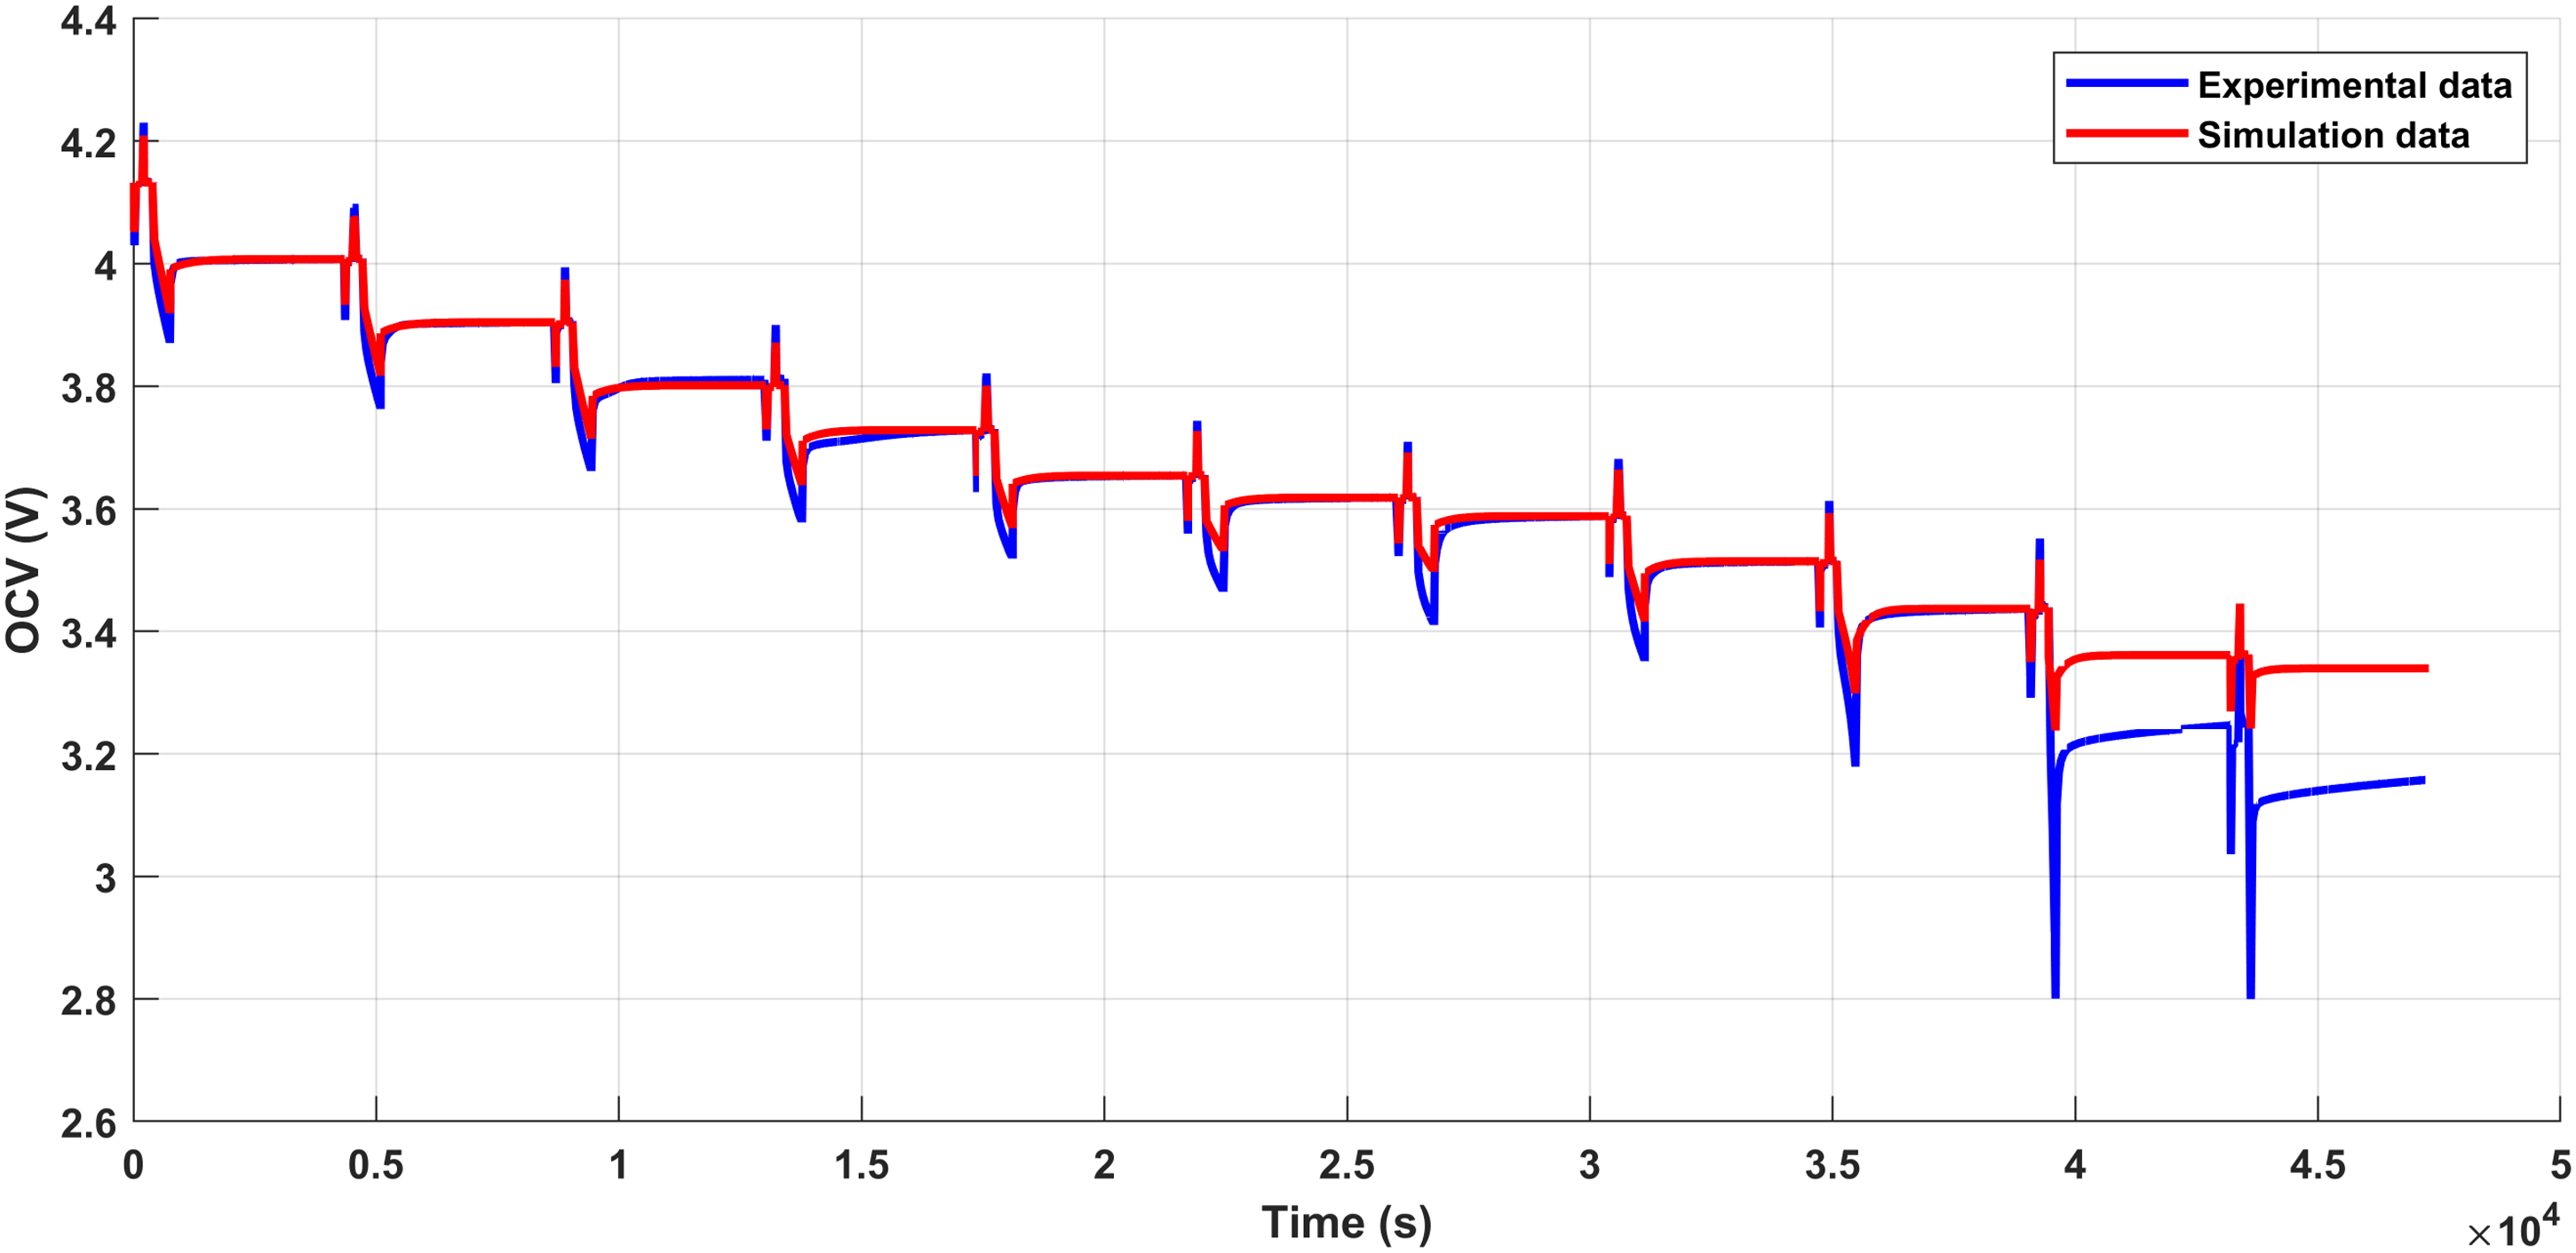
Simulation model for 18650 cell (shown in Figure 8) is run for the similar HPPC cycle and the results were captured as shown in Figure 9, where the blue line indicates experimental data and the red line indicates simulation response. Analyzing Figure 9 it is visible that the simulation response is tracking most of the experimental data in the range of 100% SOC level to 20% SOC level, however, deviates a little in the last two cycles. The RMS error for OCV between experimental data and simulation response for HPPC test is shown in Figure 10, where the error in OCV voltage follows a similar pattern between range of 100% SOC level to 20% SOC level. The internal resistance
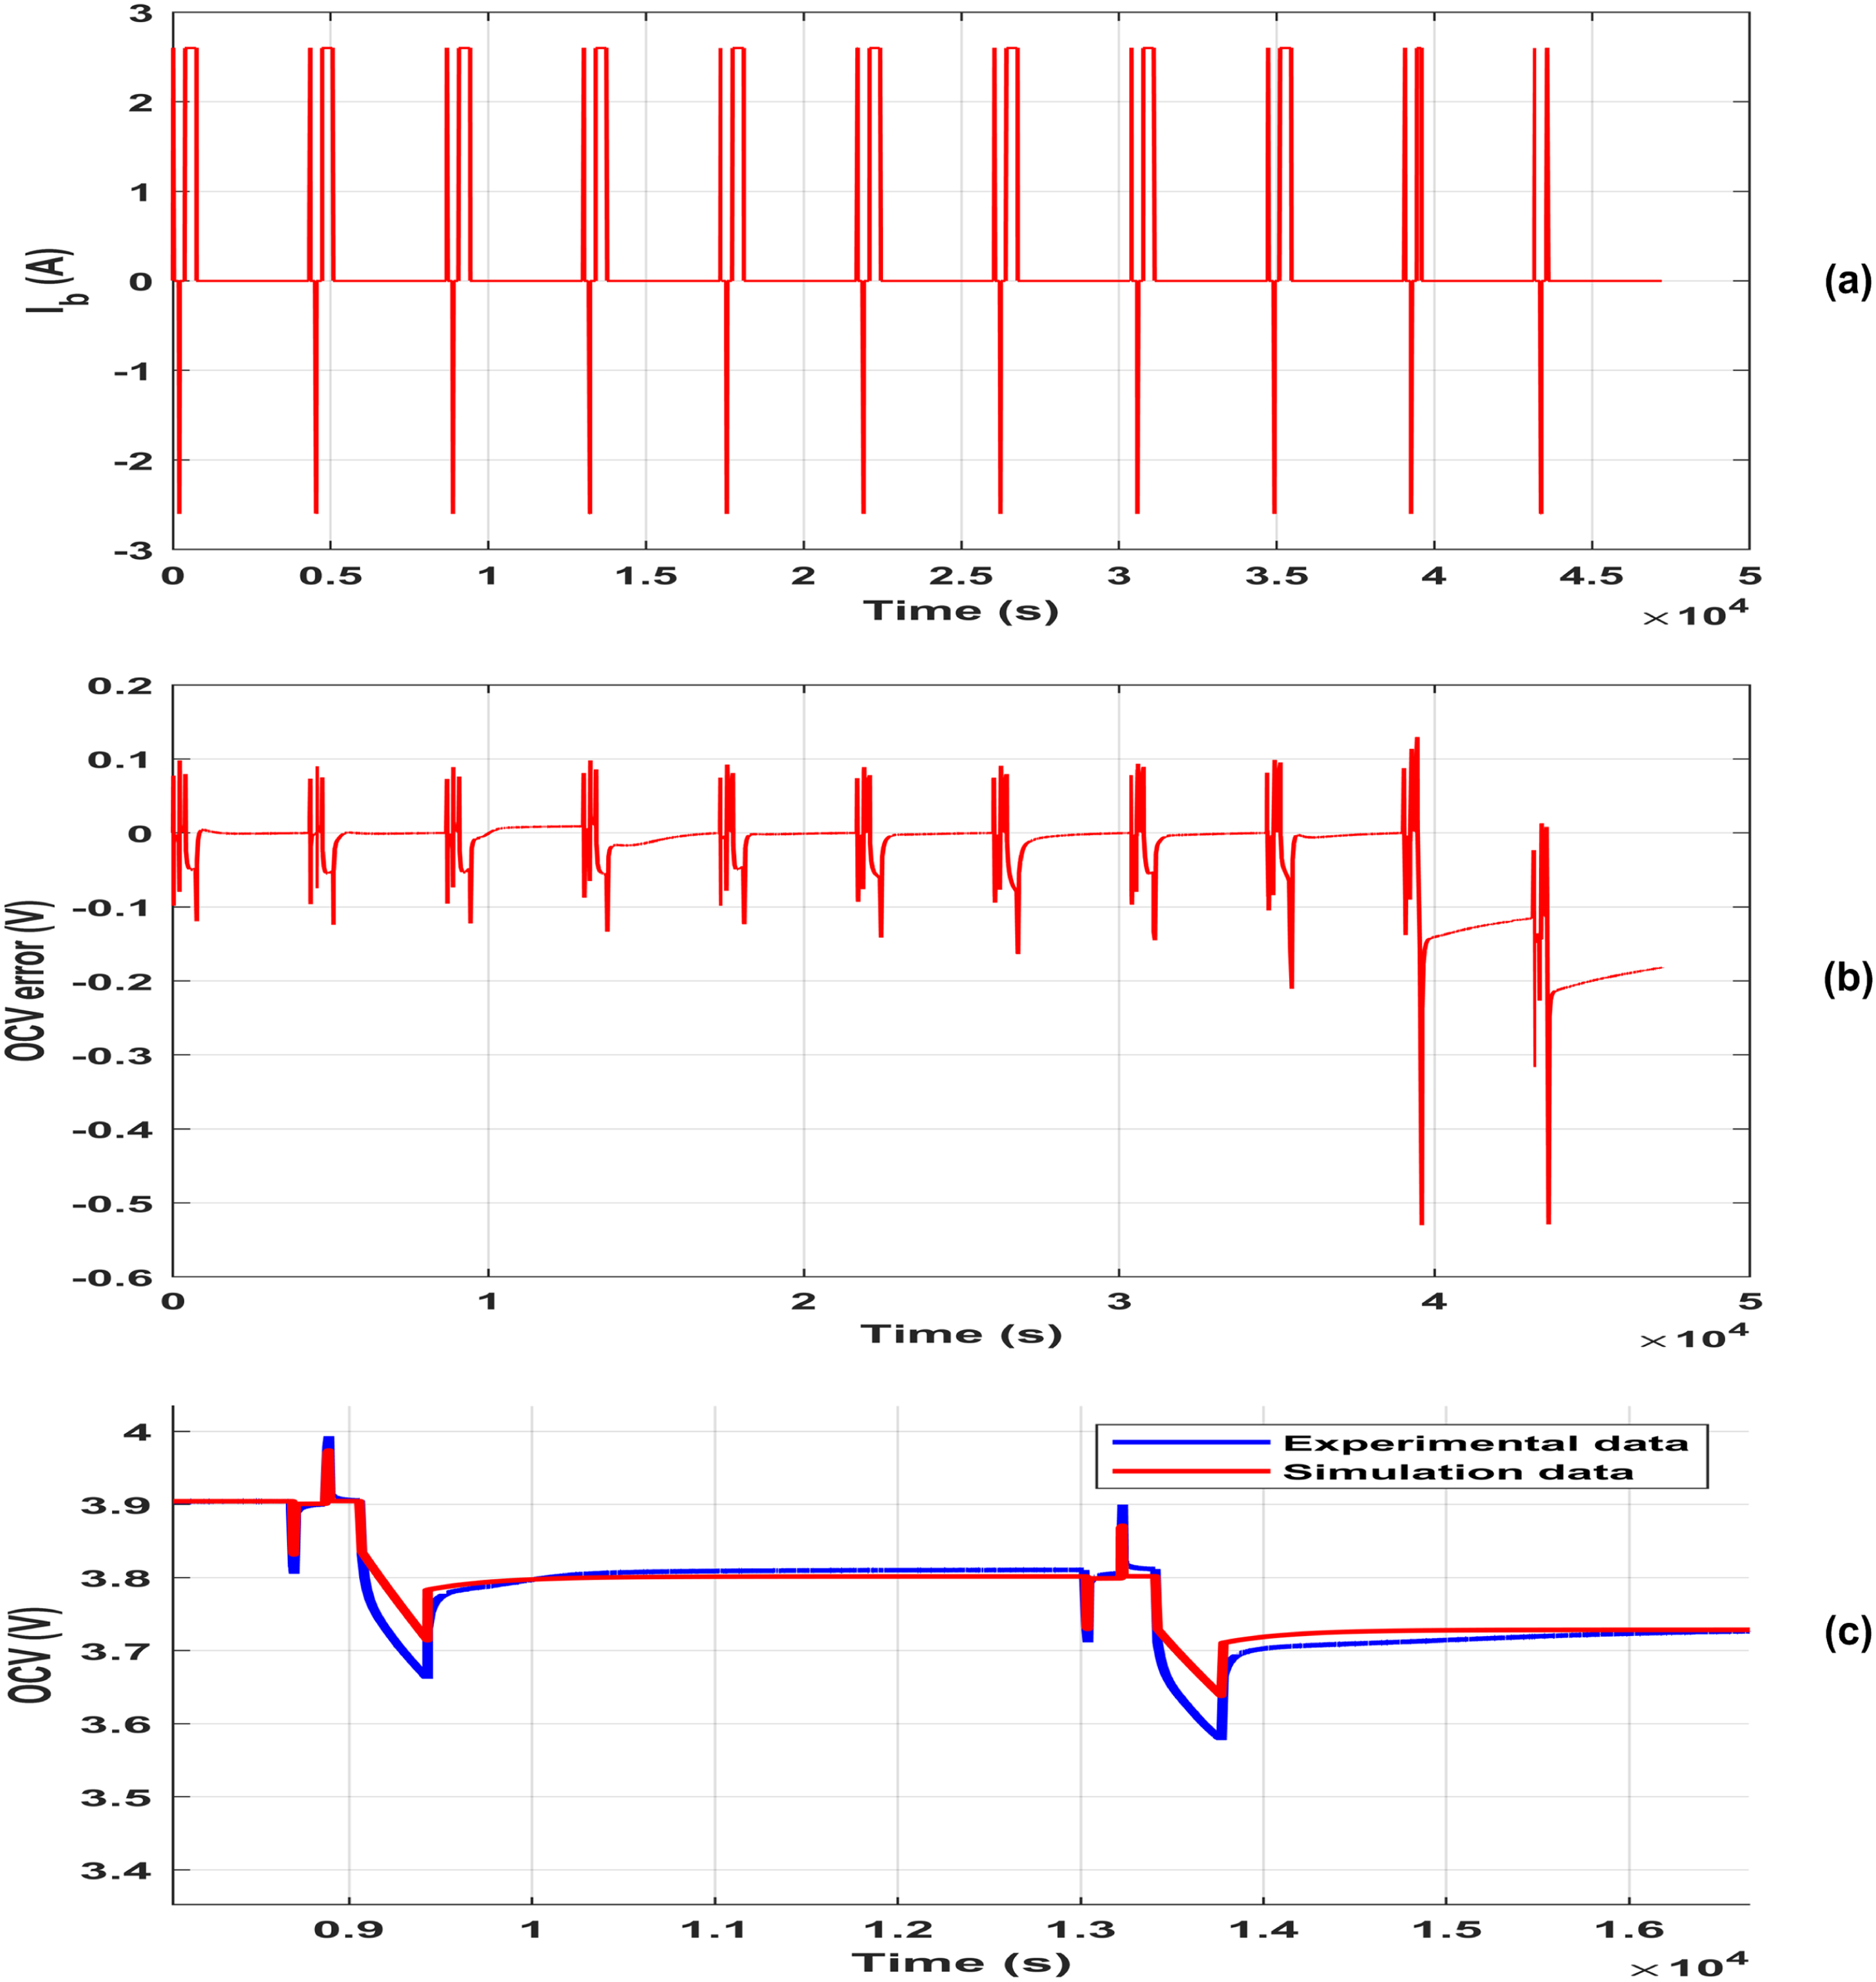
(a) Battery current profile in HPPC test, (b) battery OCV RMS error for HPPC test, and (c) battery OCV curve for 80% to 70% SOC range.
Data for each 10% SOC interval is analyzed and the error between experimental data and the simulated model response is measured. The root mean square error (RMSE) is evaluated as per Eq. 8, where OCVerror represents open circuit voltage root mean square error between the experimental open circuit voltage (OCVexp) and simulated open circuit voltage (OCVsim). At 100% SOC level, simulated response of HPPC test for Li-ion 18650 cell shows a considerable tracking of the experimental data for Li-ion 18650 cell, voltage errors at different SOC level is tabulated in Table 4. For HPPC test the Maximum Absolute Error (MAE) (as per Eq. 9) recorded is 0.051 V where as the RMSE obtained is 0.0140 V.


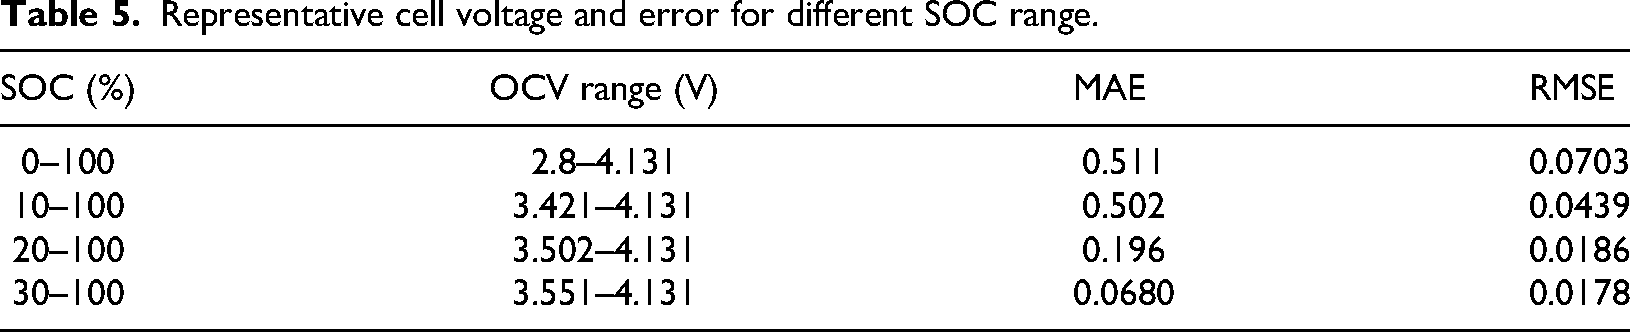
From 20% SOC level to 90% SOC level the simulated response of HPPC test for Li-ion 18650 cell almost follows the experimental data for Li-ion 18650 cell, the recorded maximum absolute error and RMSE for different SOC intervals is shown in Table 5. Cell OCV RMSE and AME in the region from 30% SOC level to 100% SOC level almost follows a similar pattern, that is the errors RMSE and AME plots (Figure 10) represent almost a flat line. The measure of performance of the evaluated circuit parameters can be evaluated for different SOC interval lengths, from 0% SOC level to 100% SOC level the recorded RMSE and MAE are 0.0703 V and 0.511 V, respectively, from 10% SOC level to 100% SOC level the recorded RMSE and MAE are 0.0439 V and 0.502 V, respectively, from 20% SOC level to 100% SOC level the recorded RMSE and MAE are 0.0186 V and 0.196 V, respectively, and from 30% SOC level to 100% SOC level the recorded RMSE and MAE are 0.0178 V and 0.0680 V, respectively.
Representative cell voltage and error for different SOC range.
Constant discharge pulse test validation
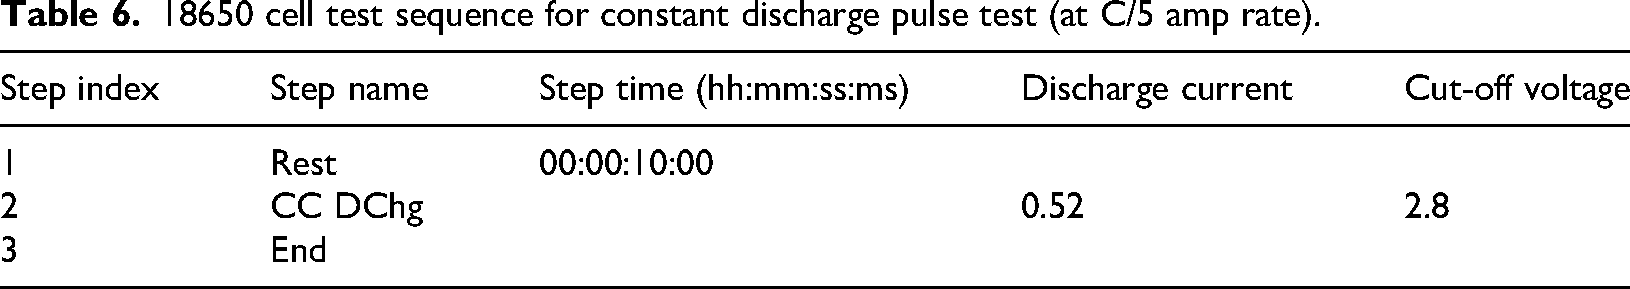
In the HPPC test the upper and lower voltage restriction and the rated C rate is taken care as per the data sheet of Li-ion 18650 cell. After the rated C rate HPPC test, a long constant discharge pulse test is preformed. In this test, the test commands were entered through the host computer, a fully charged Li-ion 18650 cell is discharged till the cell OCV reaches discharge cut-off voltage using a constant C/5 amp discharge pulse and the test sequence is elaborated in Table 6.
18650 cell test sequence for constant discharge pulse test (at C/5 amp rate).
With help of the test set up shown in Figure 4, the discharge test is performed, after a prolonged rest period thermal stability of Li-ion 18650 cell is ensured, and the test is started with a 10-second rest period as first step, in this step the cell OCV voltage remains constant. After this short rest period, the cell is discharged with constant discharge pulse of C/5 amp (0.52 A). The captured data is plotted in Figure 11, here a close resemblance of the experimental data and simulation data is visible. In this experiment the discharge pulse is removed once the Li-ion 18650 cell voltage has reached the cut-off voltage (2.8 V) and hence the capacity has reached to 0% SOC level, that is cell is completely drained as visible in Figure 11. However, in the simulation model for the same time the cell OCV voltage has reached 3.28 V and as per simulation model the cell has reached to 0.3% SOC level. The cell OCV obtained from the simulation model (when operated with the estimated parameters) shows a considerable overlapping when plotted against time as well as SOC, except for the last 10% SOC level. The RMSE error for OCV obtained is 0.0166 V.
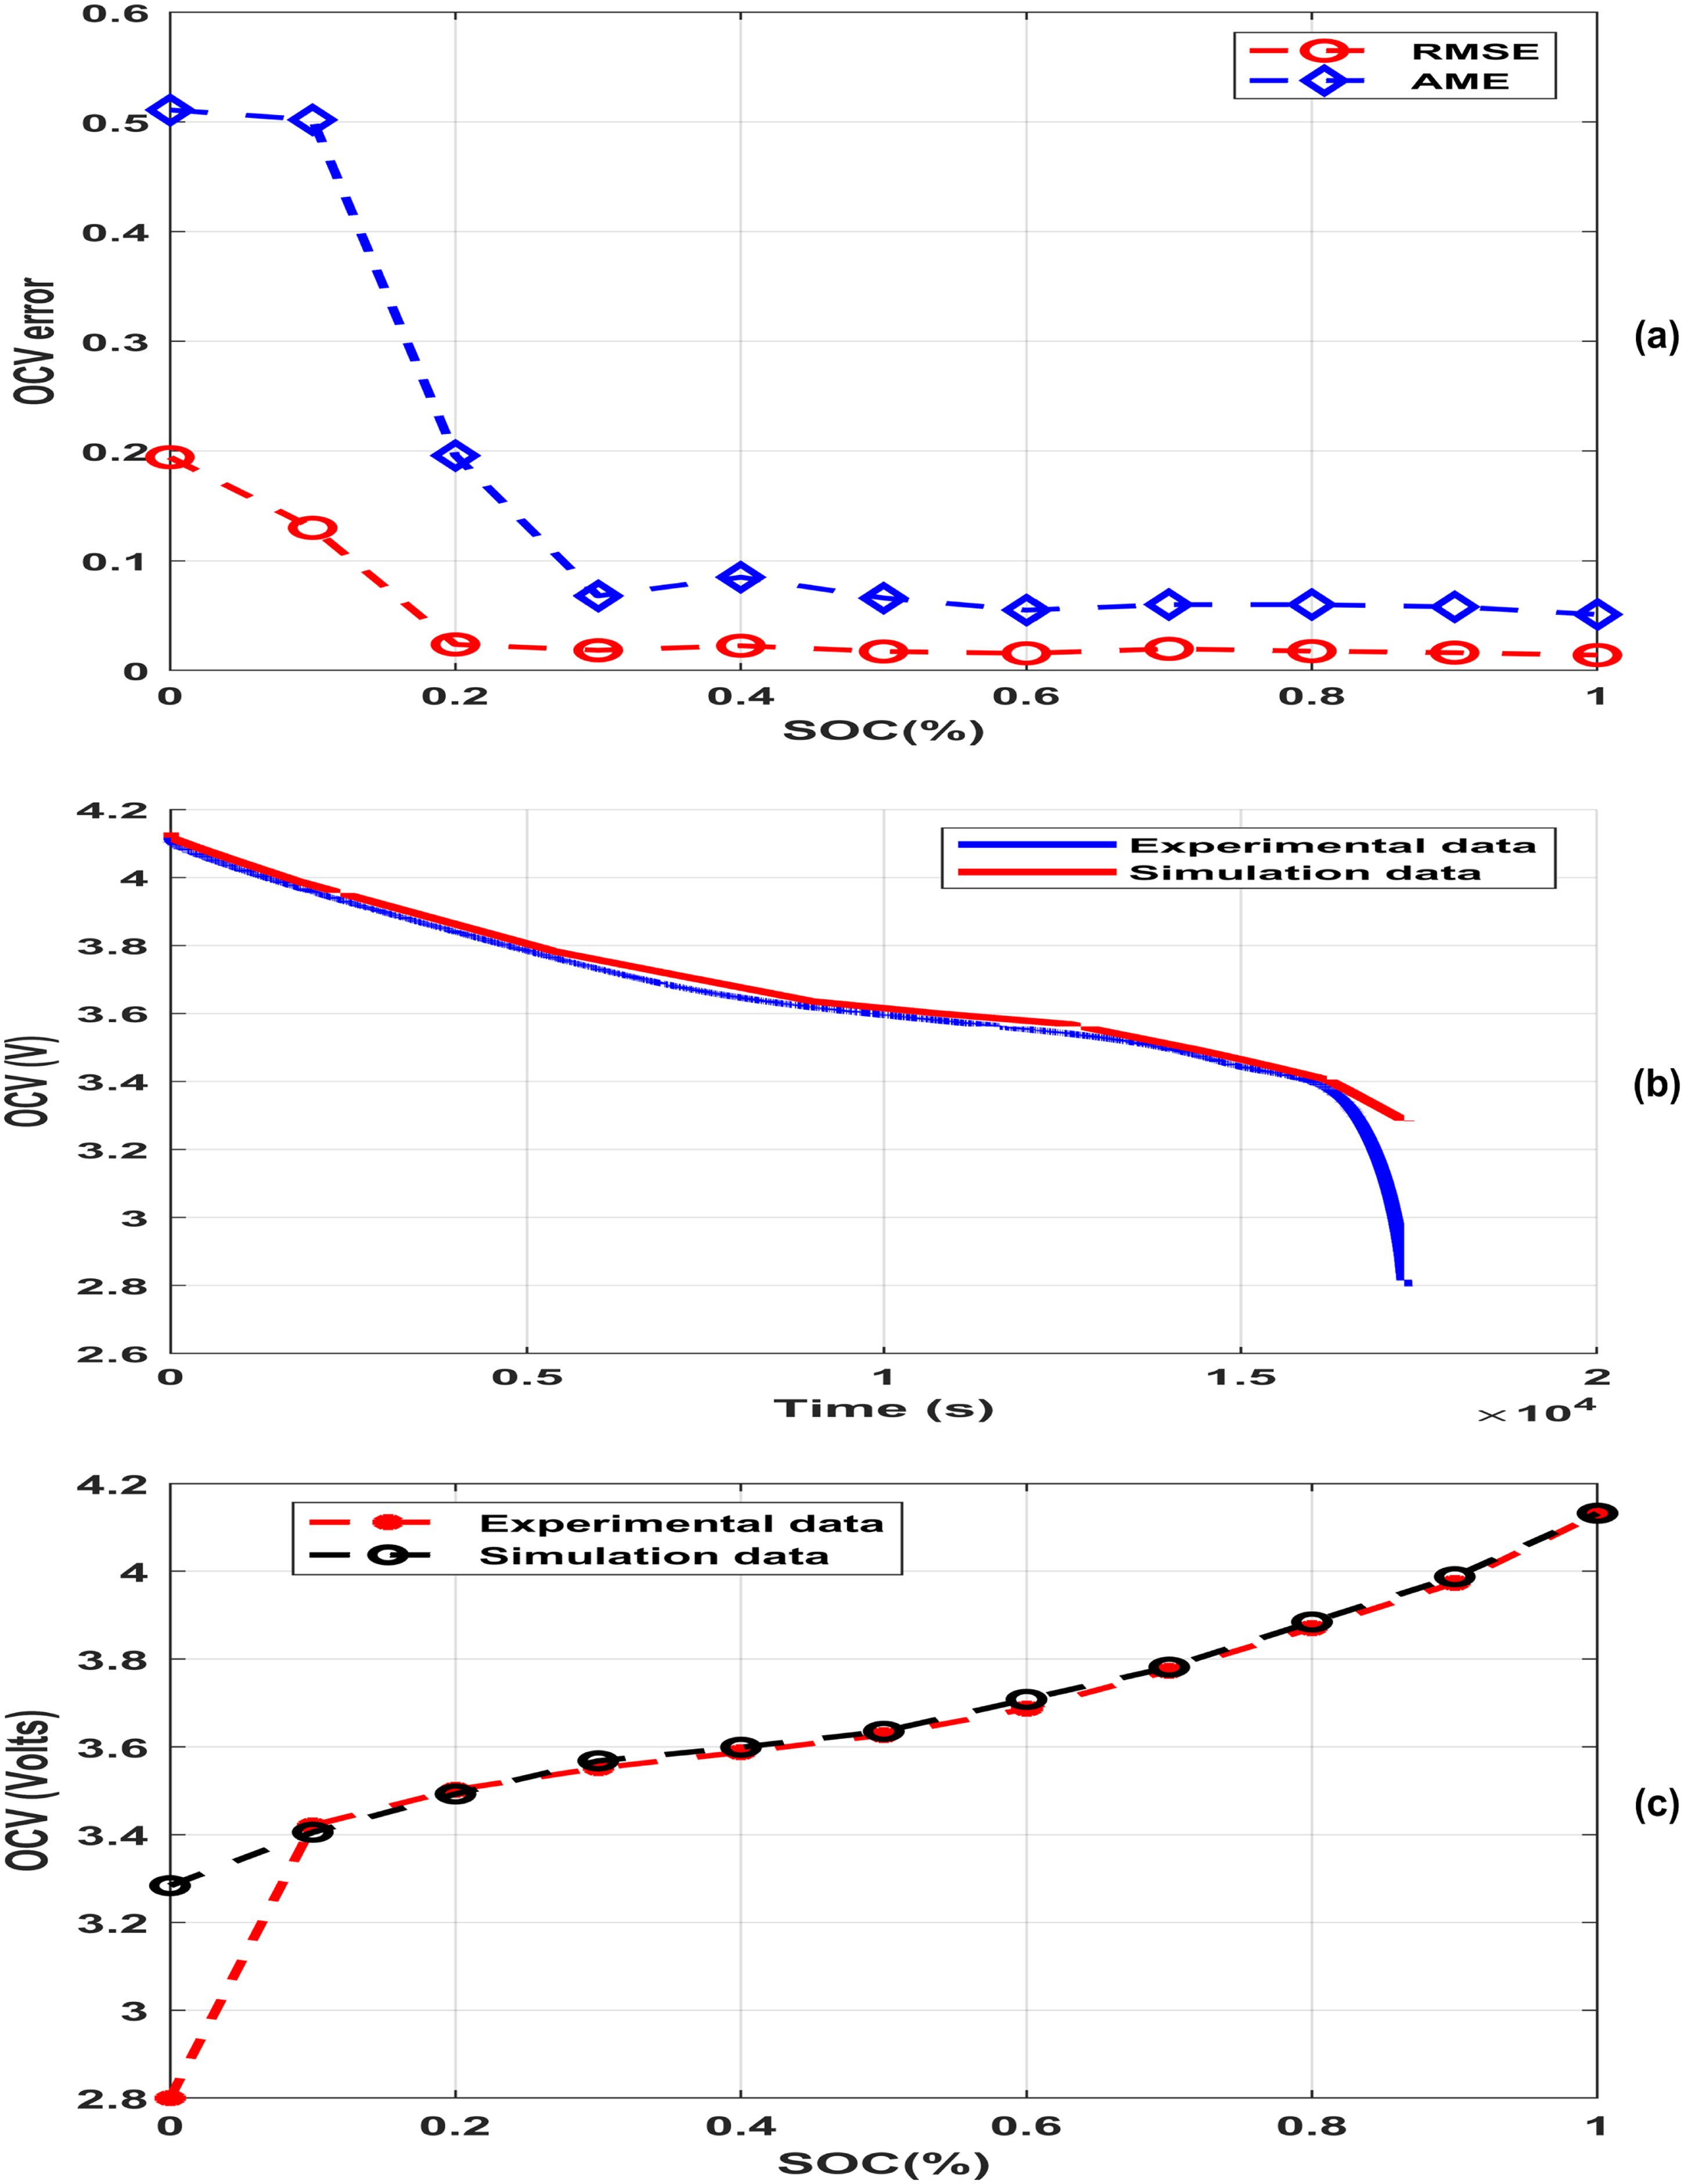
(a) RMSE and AME error for 18650 cell at different SOC level for HPPC test, (b) 18650 cell OCV test results for constant discharge pulse test (at C/5 amp rate), and (c) OCV–SOC curve for constant discharge pulse test (at C/5 amp rate) for 18650 cell.
Results obtained from the experimental test data and simulation model data shows strong resemblance. In the HPPC test the OCV RMSE is low for the 20% to 100% SOC range, and slightly higher for 10% to 100% SOC range. In most of the EV batteries BMS is an integral part, which restricts the cell voltage to reach its lowest limit so as to avoid the cell deep discharge probability. For BMS operation the simulation model OCV estimation shows a considerable performance for most of the practical usable SOC range. Thus, this study with obtained results recommends use of 1RC model for Lithium-ion 18650 (NMC) cell SOC estimation and BMS application, the results obtained from the 1RC model are quite applicable for the most of the practical usable SOC range.
Conclusion
Accurate SOC estimation is critical for the safe and efficient operation of electric vehicles. In this study, we present and validate a 1RC ECM tailored for an INR18650 (NMC) lithium-ion cell, with a focus on both time-domain and discrete-time implementations suitable for BMS applications. A key contribution of this work lies in the experimental validation of the 1RC model using real laboratory data, including static capacity tests, high pulse power characterization, and constant current charge/discharge cycles. The RC parameters
This study shows that even a low-complexity 1RC model, when carefully parameterized, achieves accurate SOC estimation with maximum absolute and RMS errors well within acceptable bounds, especially for practical BMS integration. With discrete-time implementation of the SOC estimator, making it readily deployable on digital platforms. Overall, the validated 1RC model provides a compelling trade-off between simplicity and accuracy, and is recommended for BMS applications where computational efficiency and ease of implementation are important.
Footnotes
Funding
The authors received no financial support for the research, authorship, and/or publication of this article.
Declaration of conflicting interests
The authors declared no potential conflicts of interest with respect to the research, authorship, and/or publication of this article.