
Abstract
Electric vehicles (EVs) are pivotal in reducing greenhouse gas emissions and achieving sustainable transportation goals. However, lithium-ion batteries (LIBs), the primary energy source for EVs, face critical thermal management, safety, and long-term efficiency challenges. This study proposes an integrated thermal and battery management system that combines a water–ethylene glycol-based liquid cooling mechanism with high-conductivity copper tubing to enhance LIB performance, longevity, and safety. Through COMSOL multiphysics simulations, this study examines LIB thermal behavior under varying operational conditions. The results indicate a 20% reduction in temperature peaks, with the battery maintaining an optimal temperature range of 15°C to 35°C, thus mitigating the risks of thermal runaway. Experimental validation using infrared thermography and thermal imaging confirms the system's efficiency, showing a maximum recorded battery temperature of 43.48°C under load conditions, significantly lower than unmanaged battery systems. Beyond thermal management, this work integrates advanced battery management strategies, including state-of-charge estimation, predictive fault diagnostics, active energy optimization, and cell balancing. Experimental analysis further reveals that the proposed system improves heat dissipation, resulting in a more uniform temperature distribution across the battery pack and reduced internal resistance-related losses. Additionally, infrared thermographic measurements demonstrate a 2°C to 3°C temperature uniformity improvement across battery cells, preventing localized overheating. This novel approach bridges the gap between cutting-edge cooling techniques and intelligent battery management, offering a scalable and cost-effective solution for next-generation EV battery systems. The findings have significant implications for enhancing battery safety, improving operational efficiency, extending battery lifespan, and accelerating global EV adoption.
Keywords
Introduction
Energy storage technology is crucial for advancing new energy EVs and smart grids. Electric vehicles (EVs) have become increasingly popular worldwide, with many considering them a competitive substitute for internal combustion engines (ICEs). Currently, one-third of all fossil fuels have been used by aircraft, ships, cargo, and ICE cars. In the transportation sector, 80% of vehicles were powered by oil, 5% by biofuel, 5% by natural gas, and 10% by electricity (Hasan et al., 2021; Rahimi-Eichi et al., 2013). Lithium-ion batteries (LIBs) are the most rapidly expanding energy storage technology on the market, which benefits the new energy electric car sector's tremendous expansion. Air pollution is now one of the most serious threats to human health. These cause acid rain, global warming, bronchitis, cancer, respiratory tract infections, and asthma (Jacobson, 2009). Greenhouse gas (GHG) concentrations rise due to increased human activity and air pollution. As a result, the temperature rises unusually. The transportation industry alone accounts for around 23% of global GHG emissions. Research indicates that the primary sources of air pollution and GHG emissions, nitrogen oxides, sulfur dioxide (SO2), carbon monoxide (CO), and carbon dioxide (CO2) are industries and industrial energy facilities. The energy storage system of an EV powers the EV motor and features like air conditioning and navigation lighting. When driving, EVs emit no CO, CO2, NO, or SO2 gas, helping to solve environmental issues related to fossil fuels and qualifying them as zero-carbon vehicles (Macharia et al., 2023).
The ICE is responsible for around 35% of the carbon monoxide (CO), 25% of the nitric oxides (NOx), 30% of the hydrocarbons (HC), and tiny levels of lead discharged into the atmosphere (Dey and Mehta, 2020). Global demand for fossil fuels is depleting nonrenewable energy sources, potentially resulting in supply constraints and increased oil prices. An oil-free mobility option, such as EVs, can be a sustainable alternative to address this. Unlike typical ICE vehicles, EVs emit no pollution since they use electric drivetrains driven by battery packs. This shift to EVs has the potential to address environmental concerns while also reducing reliance on finite fossil fuel stocks (Arias et al., 2019). EVs are becoming more and more popular. These vehicles can reduce emissions and dependency on oil, reduce our carbon footprint, help achieve carbon neutrality, and spark a green transportation revolution that will help fight climate change. The development of EVs should be expanded globally, provided that sustainable electrical sources are available (Chau, 2016). EVs require less maintenance and emit less noise pollution since they have fewer moving parts. The absence of elements gearboxes and ICE, frequently requiring extensive maintenance, contributes to EVs’ cheaper operating costs. The highest forecasted cost savings per kilometer are expected for all energy sources (Van Mierlo et al., 2021).
LIBs are commonly used in consumer electronics due to their high energy density, power density, and environmental friendliness. Nonetheless, vehicle LIBs pose safety, uniformity, longevity, and cost challenges because of their high capacity, high serial-to-parallel ratio, and specific operating limits. These limits, which include the need to operate within particular voltage and temperature ranges, impact the widespread adoption of these batteries in automobiles. LIBs have a strong presence in the portable electronics market and are extensively utilized in the automotive and stationary energy storage industries. This is because lithium batteries have a higher energy density than older battery technologies like lead-acid or nickel-based batteries and newer technologies like sodium-ion batteries (SIBs). Lithium-metal batteries (LMBs), specifically solid-state batteries (SSBs), are a promising technology that can significantly enhance the energy density and driving range of EVs. However, further research and development are necessary to address concerns regarding longevity, rapid charging, and cost requirements (Duffner et al., 2021).
LMBs, especially SSBs, are widely considered among the most promising options for high-power electric propulsion systems by numerous researchers and institutions. The lithium-ion battery management system (BMS) plays a key role in EV industrialization and market integration, serving as a main component. Accordingly, it is growing important to research advanced and intelligent BMSs for LIB packs. BMS includes battery data collection, modeling, status estimations, charge and discharge control, problem diagnosis and warning, temperature management, balance control, and communication. Modern BMSs arrange battery modeling and state estimates since they are critical for ensuring dependable operation, improving the battery system, and building the framework for effective safety management (An et al., 2021; Song et al., 2020).
Efficient battery management is necessary to guarantee EV batteries’ reliable and secure operation. It helps batteries attain optimal performance and extend their service lifetimes across charge/discharge cycles. As a result, each EV is outfitted with a BMS, which is responsible for various operations such as battery status estimate, battery cell balance and pack charging/discharging control, thermal management, fault prediction and health diagnostics, and communication (How et al., 2020; Li et al., 2020). According to most battery manufacturers’ specifications, normal operating temperatures for modern vehicle LIBs include discharging between 20°C and 55°C and charging between 0°C and 45°C (Brandt et al., 2019; Fan et al., 2022). LIBs have a minimum charging temperature of 30°C. Furthermore, the working voltage of LIBs usually is between 1.5 V and 4.2 V (Chen, 2025). The primary reason for the extensive use of LIBs in commercial EVs is their remarkable energy density and durability during multiple charge and discharge cycles.
Optimal efficiency can be achieved by maintaining a temperature range of 15°C to 35°C. A proficient thermal management system is crucial for dispersing heat and controlling the temperature of the battery (Lu et al., 2013). The authors in Hwang et al. (2024) have investigated the phenomenon of heat generation in lithium-ion cells and have examined current research on four main thermal management techniques: air-cooled, liquid-cooled, phase transition material-based, and thermo-electric-based systems. The findings indicate that air-cooled systems are more effective for EVs with short travel distances. In contrast, liquid-cooled systems are better suited for long trips, larger battery capacities, and high thermal requirements. Phase change material (PCM) technologies are exceptionally effective for EVs that encounter regular thermal demands and uphold stable ambient temperatures. Thermoelectric battery heat management solutions are more efficient to enhance control when integrated with other technologies.
This manuscript makes multifaceted contributions to EV battery systems by addressing critical challenges in thermal management, safety, energy efficiency, and advanced battery management strategies (BMS). It introduces an innovative water–ethylene glycol-based cooling system that employs high-conductivity copper tubing to achieve efficient heat dissipation and temperature uniformity across LIB cells. The study demonstrates significant advancements in thermal performance through a combination of computational modeling using COMSOL multiphysics and experimental validation supported by thermography and infrared (IR) imaging. Results indicate a 20% reduction in temperature peaks, consistent maintenance of optimal operating temperatures between 15°C and 35°C, and enhanced thermal stability under high-demand conditions. These findings underline the proposed system's capability to mitigate thermal runaway risks, extend battery lifespan, and improve safety and performance. Beyond thermal management, the manuscript explores various advanced BMS integral to EV technology. These include state-of-charge (SOC) estimation, cell balancing, predictive diagnostics, fault detection, and energy flow optimization, all integrated with the proposed thermal solution to create a comprehensive and efficient battery system.
It further explores the critical evaluation of electrochemical energy storage technologies, comparing LIBs with alternatives such as SSBs, SIBs, and lithium-sulfur batteries (LSBs), providing insights into their suitability for EV applications. By combining experimental, simulation-based, and theoretical approaches, the paper also highlights emerging trends in battery materials, hybrid energy storage systems, and sustainable energy solutions, addressing key technological gaps in current EV systems. The manuscript goes beyond individual battery performance to discuss the global EV landscape, highlighting market adoption trends, challenges in charging infrastructure development, and the increasing demand for sustainable, high-performance energy storage systems. This work provides a scalable and cost-effective framework for next-generation EV battery technology by integrating cutting-edge thermal management techniques with advanced battery system innovations. The findings hold significant implications for accelerating the adoption of EVs, reducing environmental impact, and supporting the transition to sustainable transportation solutions.
This study is consistent with existing literature, which indicates that integrating multiple cooling strategies or enhancing coolant properties significantly improves thermal management. While this work primarily examines the effectiveness of two coolant types in regulating battery pack temperature, previous research has explored alternative methods, such as thermoelectric cooling and PCMs, to achieve substantial temperature reductions. The findings emphasize the critical role of selecting an appropriate coolant liquid in optimizing battery thermal management, essential for ensuring long-term battery performance and durability.
State-of-the-art advancements and knowledge gaps in integrated thermal and battery management for EVs: Recent advancements in integrated thermal and battery management systems (ITBMS) for EVs focus on improving battery performance, lifespan, and safety through innovative cooling techniques and intelligent control strategies. State-of-the-art developments include liquid and PCM-based cooling, advanced machine learning algorithms for real-time battery state estimation, and coupled electrochemical–thermal models for precise thermal regulation.
However, key knowledge gaps remain. The tradeoff between thermal efficiency and energy consumption needs further optimization. The impact of varying environmental conditions on ITBMS performance has not been fully explored. Additionally, experimental validation of simulation-based optimization methods is still limited, requiring more real-world testing to ensure reliability. Addressing these gaps will enhance EV battery performance and overall system efficiency. The latest works published by researchers on thermal runaway and thermal management of LIBs are clearly outlined in Table 1.
Recent works published on thermal run away and thermal management of lithium-ion battery, and the state-of-charge estimation or the state-of-health estimation.

BTMS: battery management system; CC: constant current; CFD: computational fluid dynamics; CPCM: composite phase change material; CV: constant voltage; EG: ethylene glycol; EKF: extended Kalman filter; FGCA: fuzzy grey correlation analysis; FGRA: fuzzy grey relational analysis; FLNN: functional link neural network; GNP: graphene nanoplatelets; HDP: heat dissipation performance; HPPC: hybrid pulse power characterization; LCP: liquid cold plate; LIB: lithium-ion batteries; LSSVM: least squares support vector machine: PCM: phase change material; SOC: state-of-charge; SOH: state of health; SVM: support vector machine; TPLB: ternary polymer Li-ion batteries.
This paper is outlined as follows: The introduction of EVs is described in the “Introduction” section. “Overview of current worldwide EVs scenario” section presents a comprehensive summary of the current global EV landscape. “State-of-the-art battery managements” section provides an overview of the present state of the art in battery management. “EV BTMS” section is on advancing cutting-edge battery thermal management technology and includes a case study on actively controlling the temperature of LIBs. “Social impact of EVs” section offers a comprehensive summary of the societal influence on EVs. “Conclusions” section provides a final analysis and conclusion of the work conducted on battery thermal management systems (BTMS) in EVs.
Overview of current worldwide EV scenario
The global EV market has surpassed five million listings. EV revenues in the United States increased by 2%, Portugal by 3%, China by 5%, Ireland by 7%, the Netherlands by 8%, and Norway led with a large 50% share of new EV sales. The number of EV passengers grew from 450,000 in 2015 to 2.1 million by 2019 (Lim et al., 2020). EVs are currently being adopted at a rapid pace in the European and Chinese markets. This increase is mainly driven by growing environmental concerns and efforts to replace traditional ICE vehicles. Several countries and corporations are establishing policies to encourage the use of EVs, emphasizing a progressive plan to address climate change and GHG emissions. EV sales in India have increased significantly, from 48,179 units in the financial year 2020–2021 to 4,42,901 units in the fiscal year 2022–2023. Sales of EVs in the country have increased significantly during the last 2 years. The number of electric cars sold in 2020–2021 was 48,179. This figure increased to 237,811 in 2021–2022 and 442,901 in 2022–2023. The global EV market is rapidly expanding, with sales expected to exceed 10 million by 2022.
EVs accounted for 14% of all new car sales in 2018, up from 9% in 2021 and less than 5% in 2020. China led the worldwide market with a 60% share, exceeding its 2025 target. EV sales increased by more than 15% in Europe, the second-largest market, accounting for more than one in every five new car sales. The United States, the third largest market, had a 55% growth in EV sales, reaching an 8% market share. Sales of EV are expected to continue to be strong in 2023; in the first quarter, over 2.3 million units were sold, a 25% rise from the year before. By the end of 2023, sales of EVs (cars) are expected to reach 14 million, a 35% increase from the previous year, especially in the second half of the year. This increase may help EVs account for 18% of yearly auto sales. Potential increases in oil prices combined with encouraging national policies and incentives could entice more potential purchasers.
EV demand in major markets is projected to considerably influence energy markets and climate targets within present regulatory frameworks. According to current policy, road transport oil demand will peak around 2025, with EVs displacing more than 5 million barrels daily by the end of 2030. This change is expected to save around 700 Mt CO2-equivalents by 2030. Commercial vehicle electrification is rising, with global electric light commercial vehicle (LCV) sales expected to exceed 310,000 units in 2022, despite an overall LCV sales fall of about 15% (Aderibigbe and Gumbo, 2023).
In 2022, electric buses and medium- to heavy-duty trucks will account for around 66,000 and 60,000 units, accounting for 4.5% of total bus sales and 1.2% of total truck sales. Electric bus sales in countries committed to reducing emissions in public transportation, such as Finland, will exceed 65% by 2022. The desire to electrify heavy-duty vehicles is clear, with 220 new electric models set to hit the market in 2022, adding to over 800 models from more than 100 original equipment manufacturers. The growing demand for EVs drives the demand for batteries and key minerals. Automotive LIBs demand increased by 65% to 550 GWh in 2022, up from 330 GWh in 2021, primarily due to electric passenger car sales. EV batteries will account for around 60% of lithium, 30% of cobalt, and 10% of nickel demand in 2022, a significant rise from just 5 years ago when these estimates were around 15%, 10%, and 2%, respectively. Ensuring supply chain sustainability and resilience is crucial, especially considering recent battery material price volatility.
The adoption of four-wheeler EVs in developing nations, particularly India, is less than 1%. Nevertheless, motorcycles and tricycles have become increasingly popular in India, Taiwan, and Vietnam (Rajper and Albrecht, 2020). Indonesia aims to achieve a sales target of more than 20% for EVs by 2025. The country plans to introduce tax incentives for EVs and their components to accomplish this. To promote the adoption of EVs in developing nations, it is essential to prioritize the development of charging infrastructure (Wilberforce, 2021). Malaysia targets 125,000 charging stations by 2030, while Thailand plans to have 1.2 million EVs and 690 charging stations by 2036 as part of its policy implementation. Figure 1 displays the light-duty plug-in EVs inventory and the yearly sales in the leading nations for 2022 (https://en.wikipedia.org/wiki/Electric_car_use_by_country).
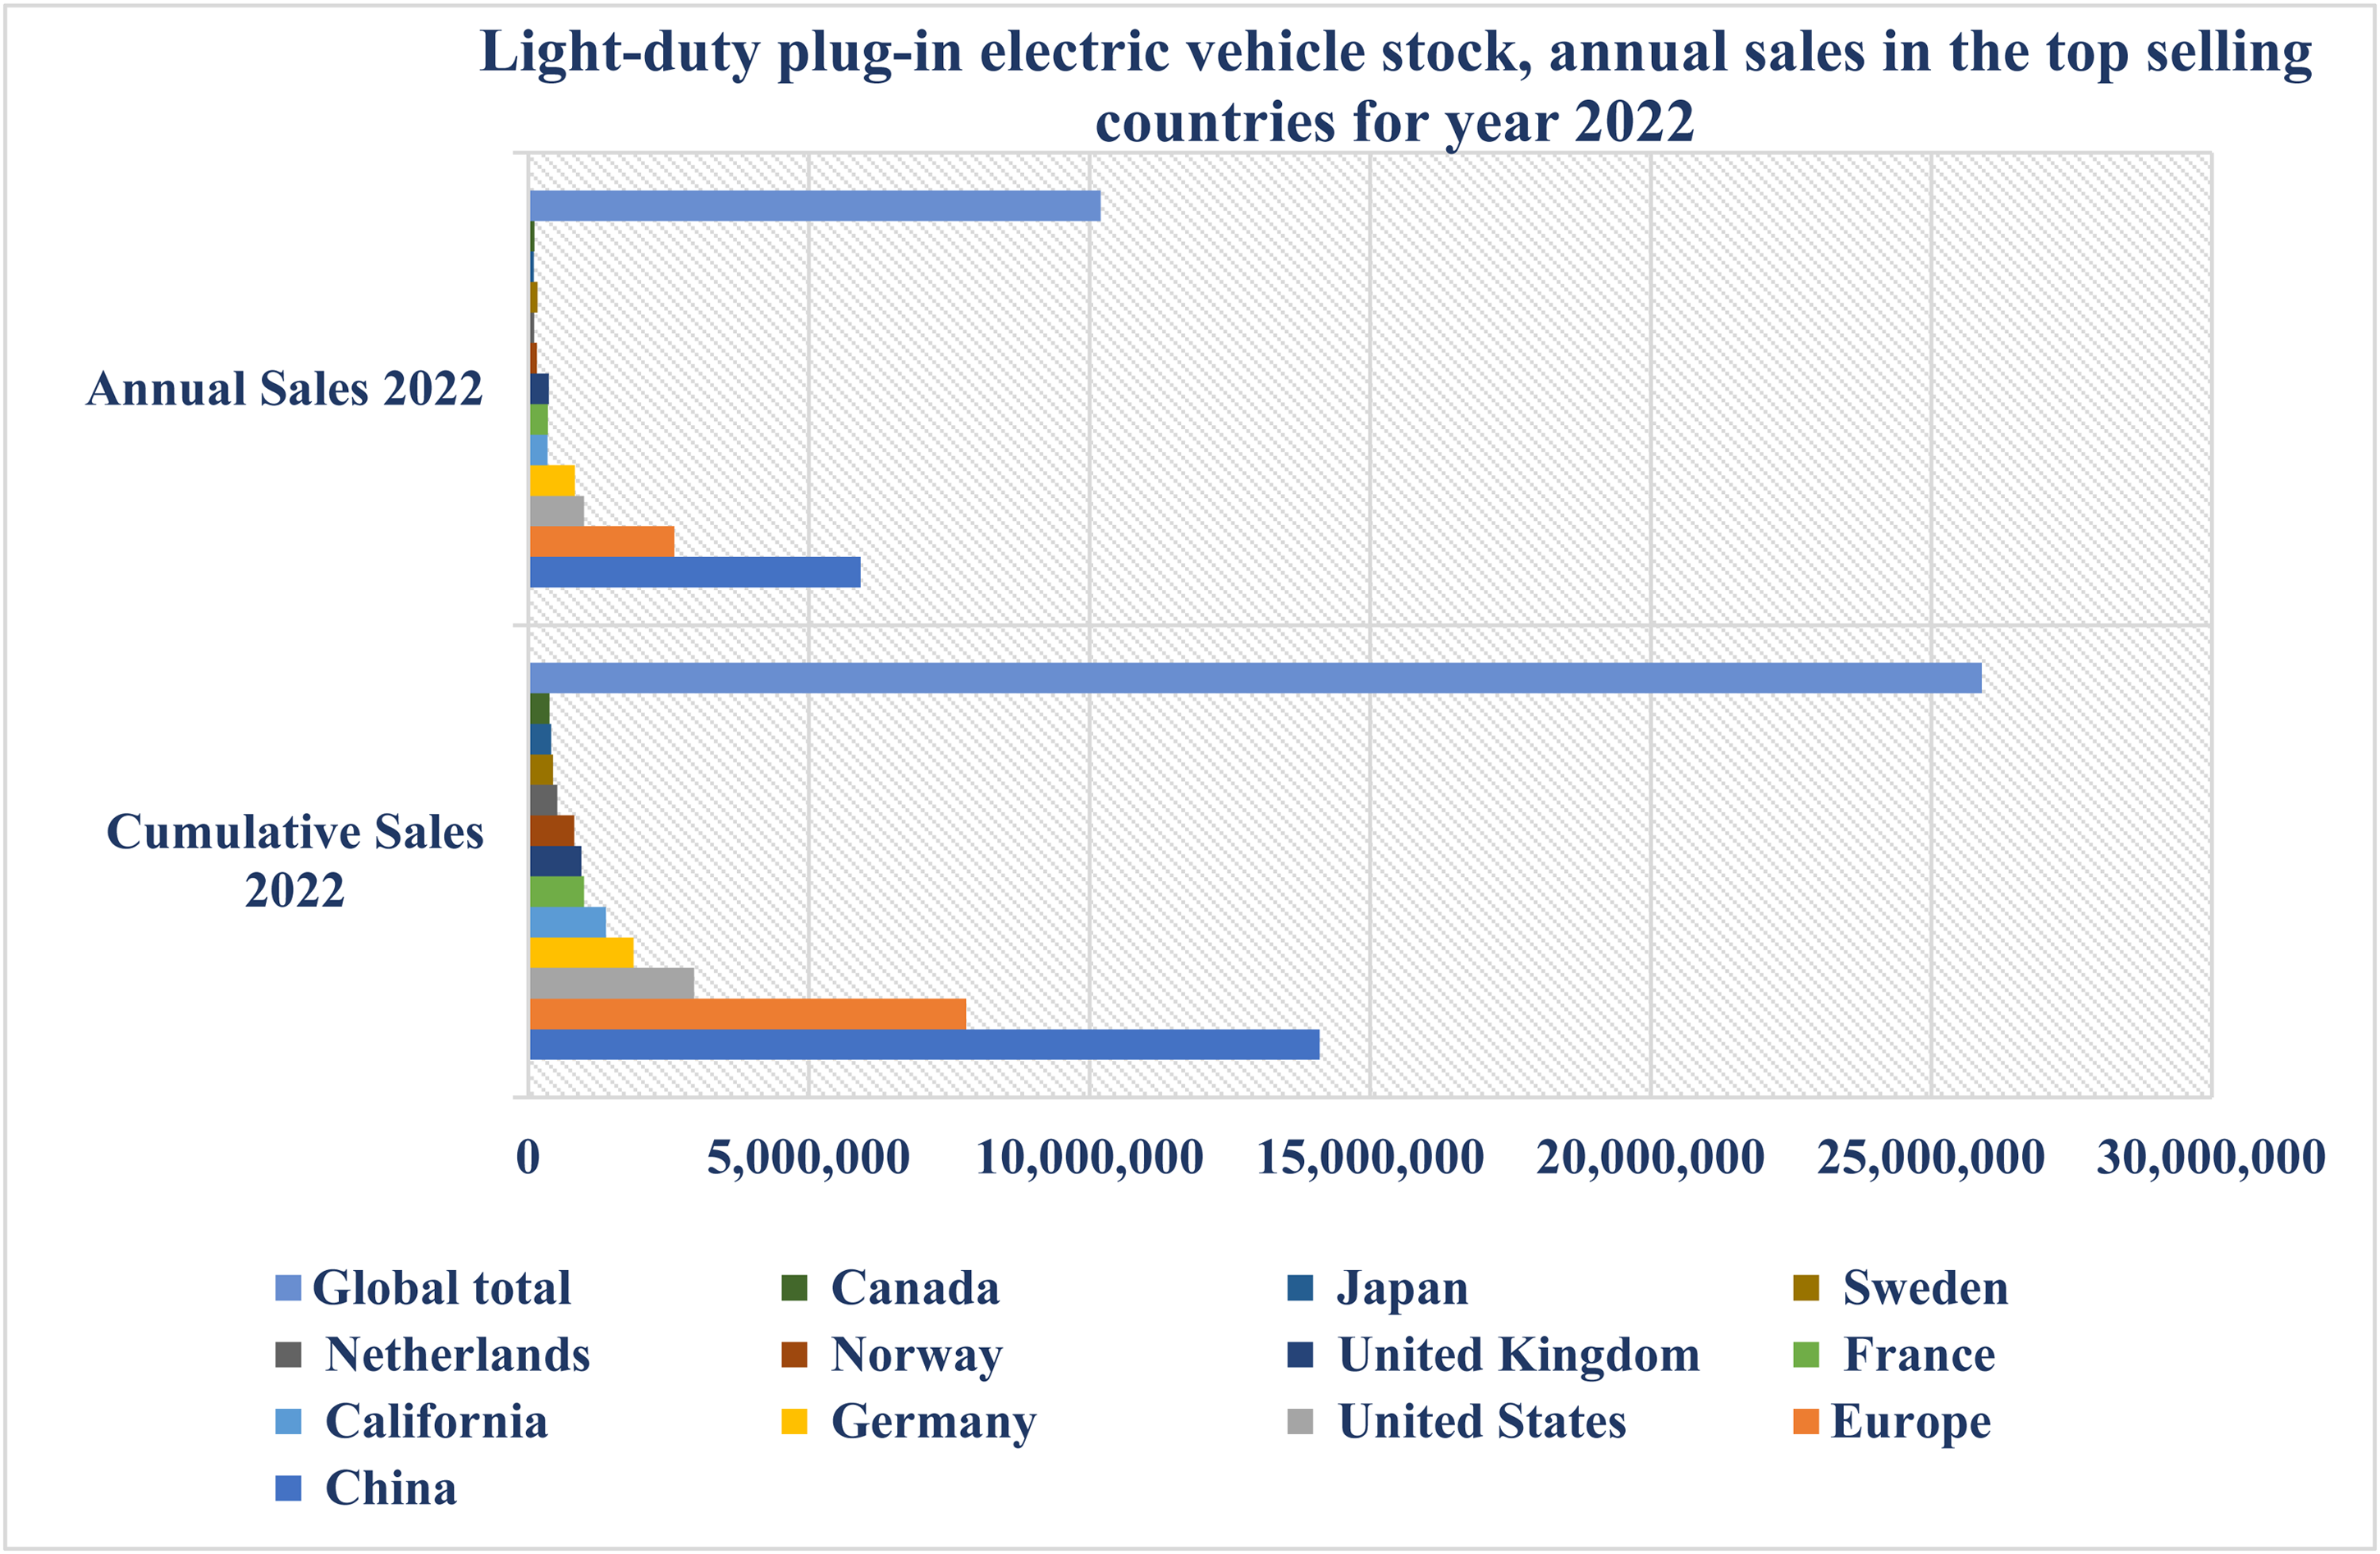
Light-duty plug-in electric vehicle stock, annual sales in the top selling countries for year 2022 (Wilberforce, 2022).
Figure 2 displays the market share of passenger plug-in vehicles concerning the total number of new car sales. The data include selected nations and regional markets, as referenced by source (https://en.wikipedia.org/wiki/Electric_car_use_by_country). As of March 2022, India had registered about 28,000 plug-in automobiles, constituting a small portion of the overall 1 million EVs, including motorcycles, tricycles, and commercial vehicles with four wheels. The government encourages the use of EVs through the Faster use and Manufacturing of Hybrid and Electric Vehicles plan. This program offers rewards and reduces the Goods and Services Tax on EVs from 12% to 5%, as specified in the Union Budget 2019. Additional benefits include a tax exemption of Rs 150,000 on the interest paid for loans taken for EVs, and EVs are exempt from road tax. According to the Bureau of Energy Efficiency, as of July 14, 2022, India had 1,334,385 EVs and 2826 functional public charging stations.

Passenger plug-in market share of total new car sales for selected countries and selected regional markets (Wilberforce, 2022).
Electrochemical energy storage technologies
EVs depend on several electrochemical energy storage sources for their propulsion systems. The primary sources are batteries, with LIBs being the most prevalent. The electrochemical energy storage sources utilized in EVs are LIBs, nickel-metal-hydride (NiMH) batteries, flow batteries, and lithium-polymer batteries. LIBs are the preferred energy storage technology for electric cars due to their superior energy density, long cycle life, and minimal self-discharge rate. During these batteries’ charging and discharging cycles, lithium ions migrate between the positive and negative electrodes. SSBs are a developing technology that substitutes the liquid or gel electrolyte in conventional LIBs with a solid electrolyte. They provide prospective benefits such as increased energy density, enhanced safety, and extended longevity.
NiMH batteries are less prevalent in modern EVs due to their lower energy density than LIBs. However, they have been used in specific hybrid and early EVs. They are more resistant to high temperatures and less toxic than other battery compounds. Lithium-polymer batteries are similar to LIBs, except they use a polymer electrolyte instead of a liquid one. They are versatile in shape and size, perfect for satisfying specific design requirements in EVs. Flow batteries are rechargeable batteries that store energy directly in the electrolyte solution. By separating power and energy, EVs can achieve faster charging times and longer driving ranges. Electrochemical energy storage technologies play a vital role in enabling the broad adoption of electric cars by providing efficient, reliable, and affordable means of storing and distributing electrical energy. Ongoing research is focused on improving the performance, energy density, and lifespan of these batteries to enhance the capabilities of electric cars (Schimpe et al., 2018).
EVs typically utilize hybrid energy storage systems comprising batteries and ultra- or supercapacitors. These systems offer a high energy density, enabling longer driving distances and high specific power for rapid energy transfer during acceleration and braking. Fuel cells provide the possibility of achieving zero emissions and sufficient power and energy densities while their research is advancing at a sluggish pace. Lead-acid batteries, nickel-based batteries, and LIBs have played crucial roles in various stages of EV advancement. LIBs represent a significant advancement in battery technology, providing superior performance characteristics such as high energy density, extended cycle life, and enhanced safety. This has significantly influenced the development of electric cars (Winter et al., 2018).
Flow batteries and fuel cells share more commonalities than conventional batteries. Additional research is needed to assess the suitability of various metal-ion possibilities, such as zinc-ion, magnesium-ion, and aluminum-ion batteries, for EV applications. Due to their more advanced development, SIBs are expected to enter the market before other metal-ion technologies. Lead-acid batteries were previously used for beginning purposes and only recently started to be used for extended driving ranges. LIBs have gradually supplanted lead-acid and nickel-based batteries and are poised to become the dominant power source for EVs in the next decade (Konarov et al., 2018).
State-of-the-art batteries
LIBs are extensively used in EVs because of their high energy density, excellent safety features, and long-lasting performance. A LIB cell comprises of an anode, cathode, electrolyte, and separator. Improvements in these elements boost the efficiency of the battery. The external circuit controls the movement of electrons to facilitate transfer of electricity. Optimal material selection and battery design are crucial factors in attaining superior energy density and specific energy.
The following sections investigate and describe various aspects of battery storage, characteristics, features, and critical battery management components in EV applications. Figure 3 depicts a categorization of electrochemical energy storage systems. Power batteries are more common in current EV applications than fuel cells. EVs utilize hybrid energy storage technology that integrates battery storage with supercapacitors. These systems offer a combination of high energy density, enabling longer driving ranges, and high specific power, facilitating quick energy transfer during acceleration and braking. Although fuel cells emit no pollutants and have high power and energy densities, technological advancement is modest. Figure 4 depicts the classification of EVs used in the present scenario.
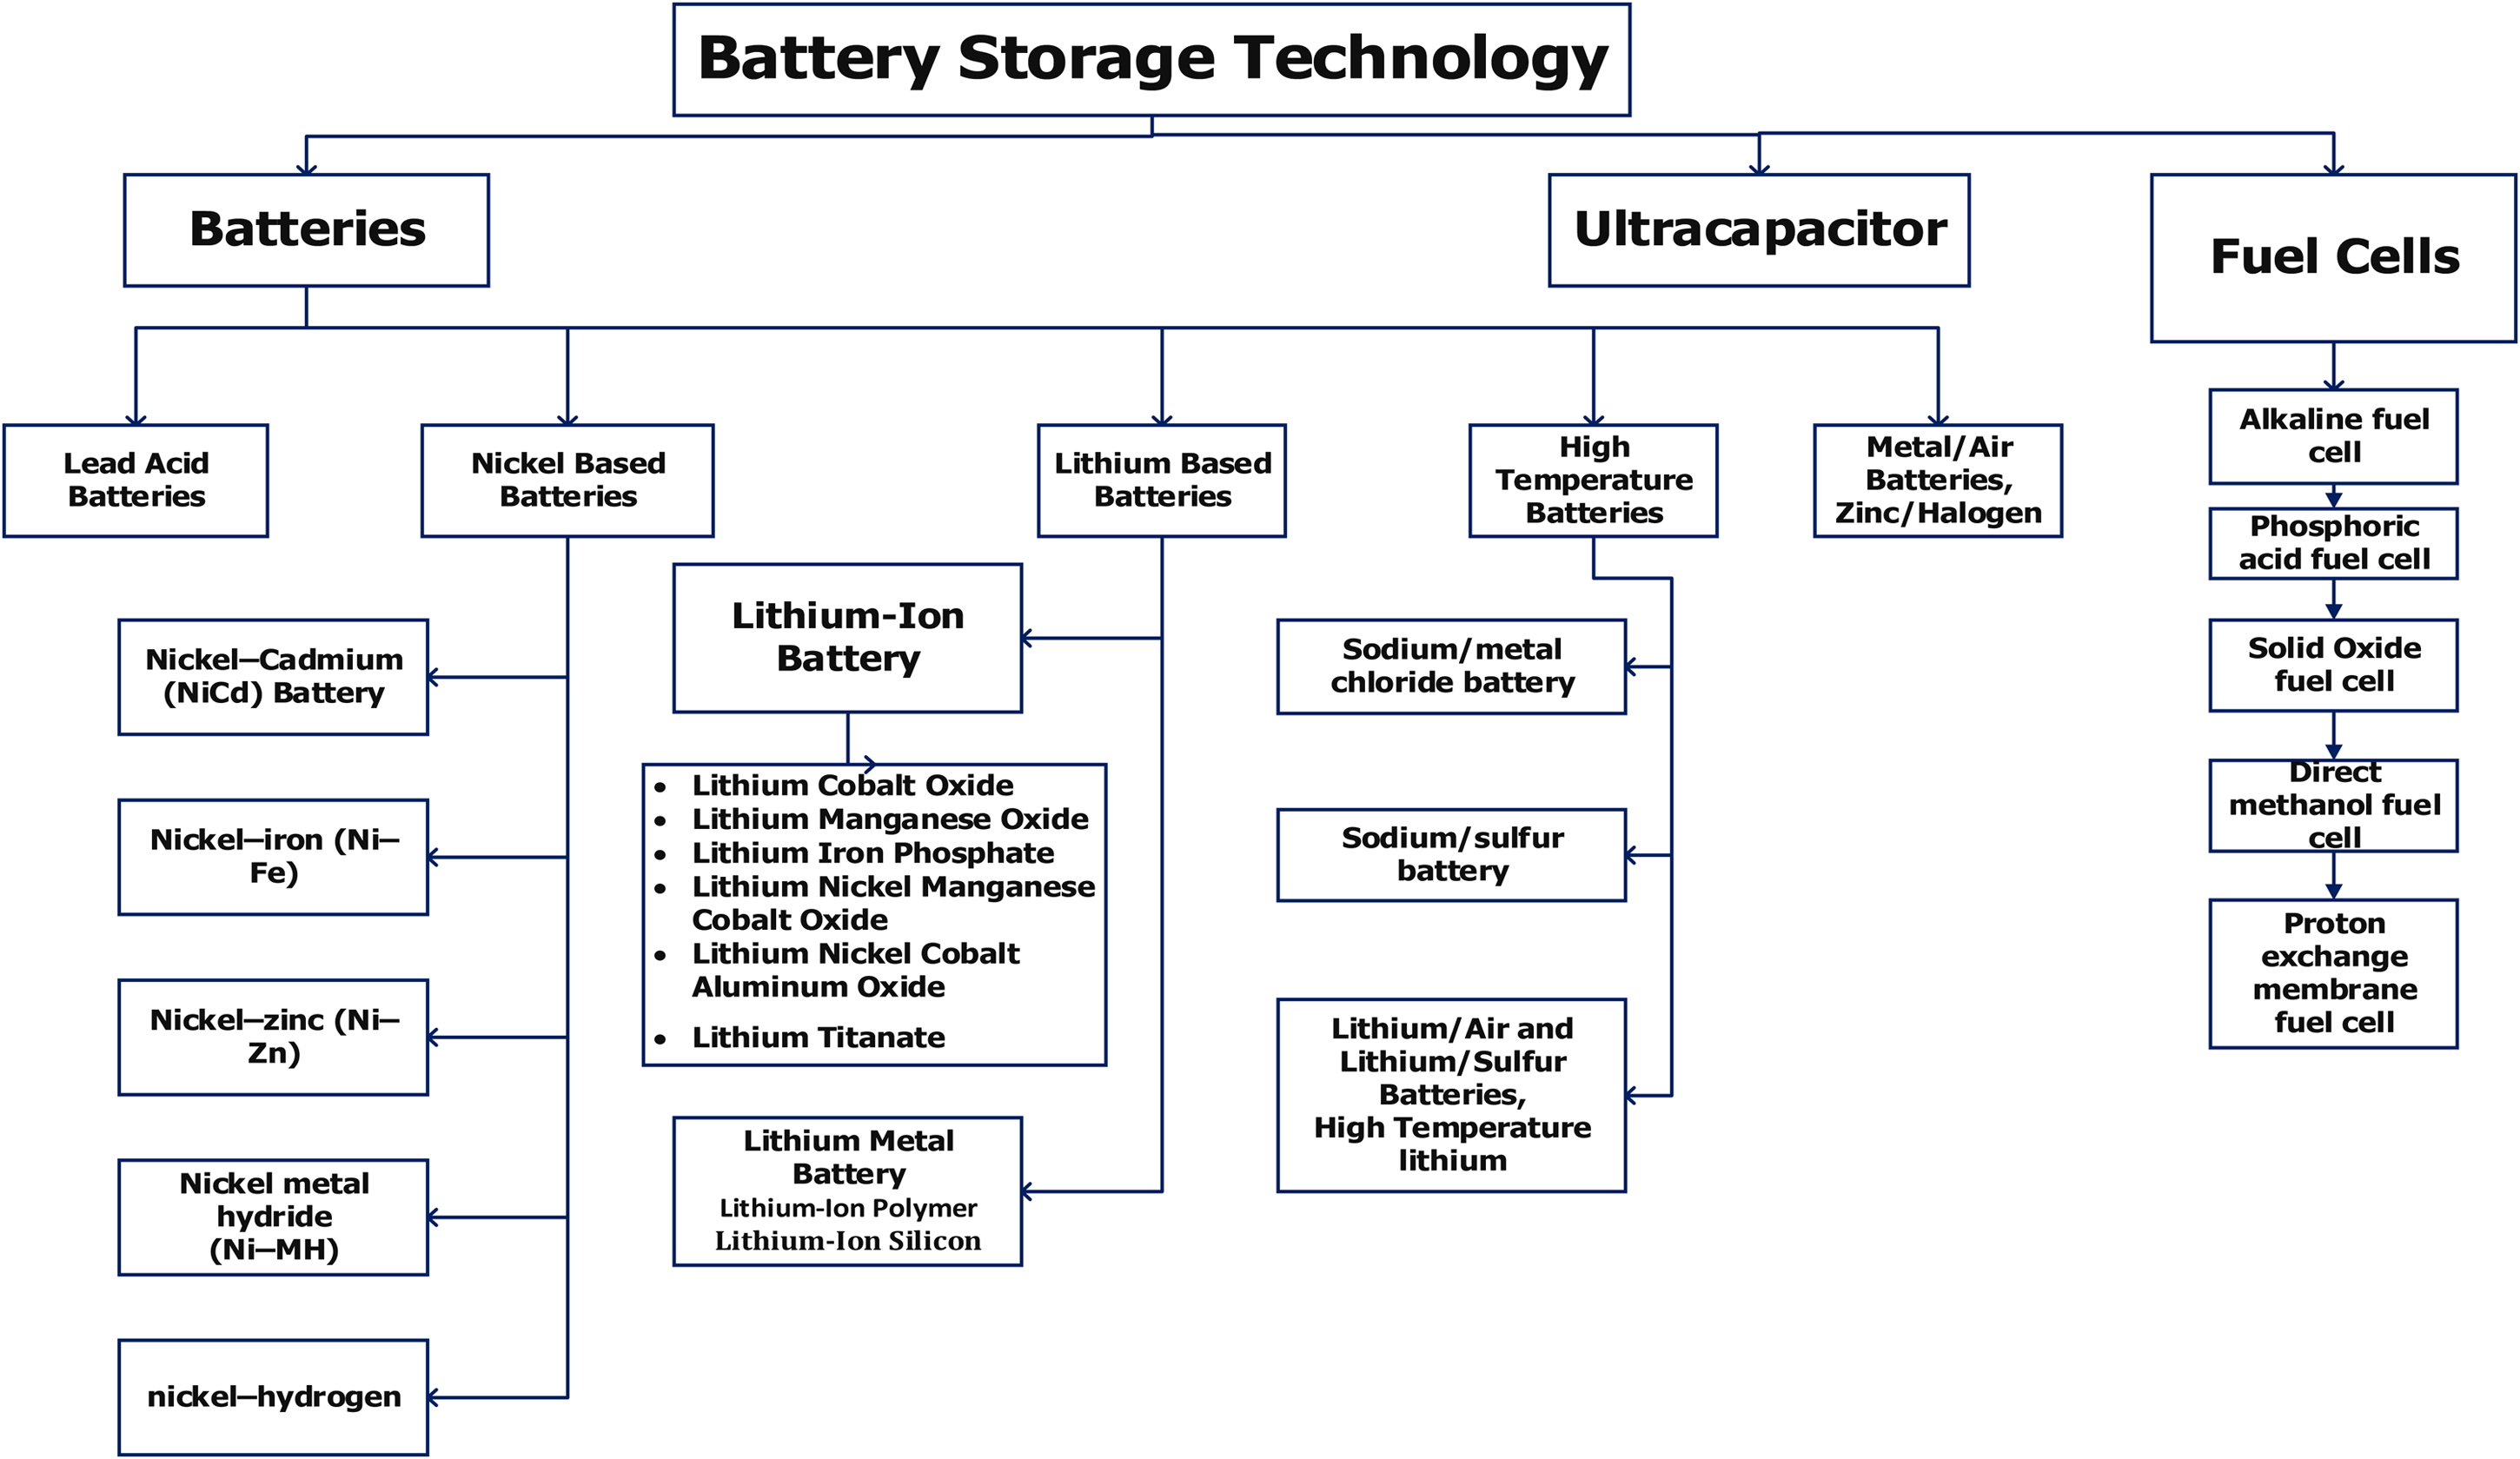
Classification of electrochemical energy storage sources.
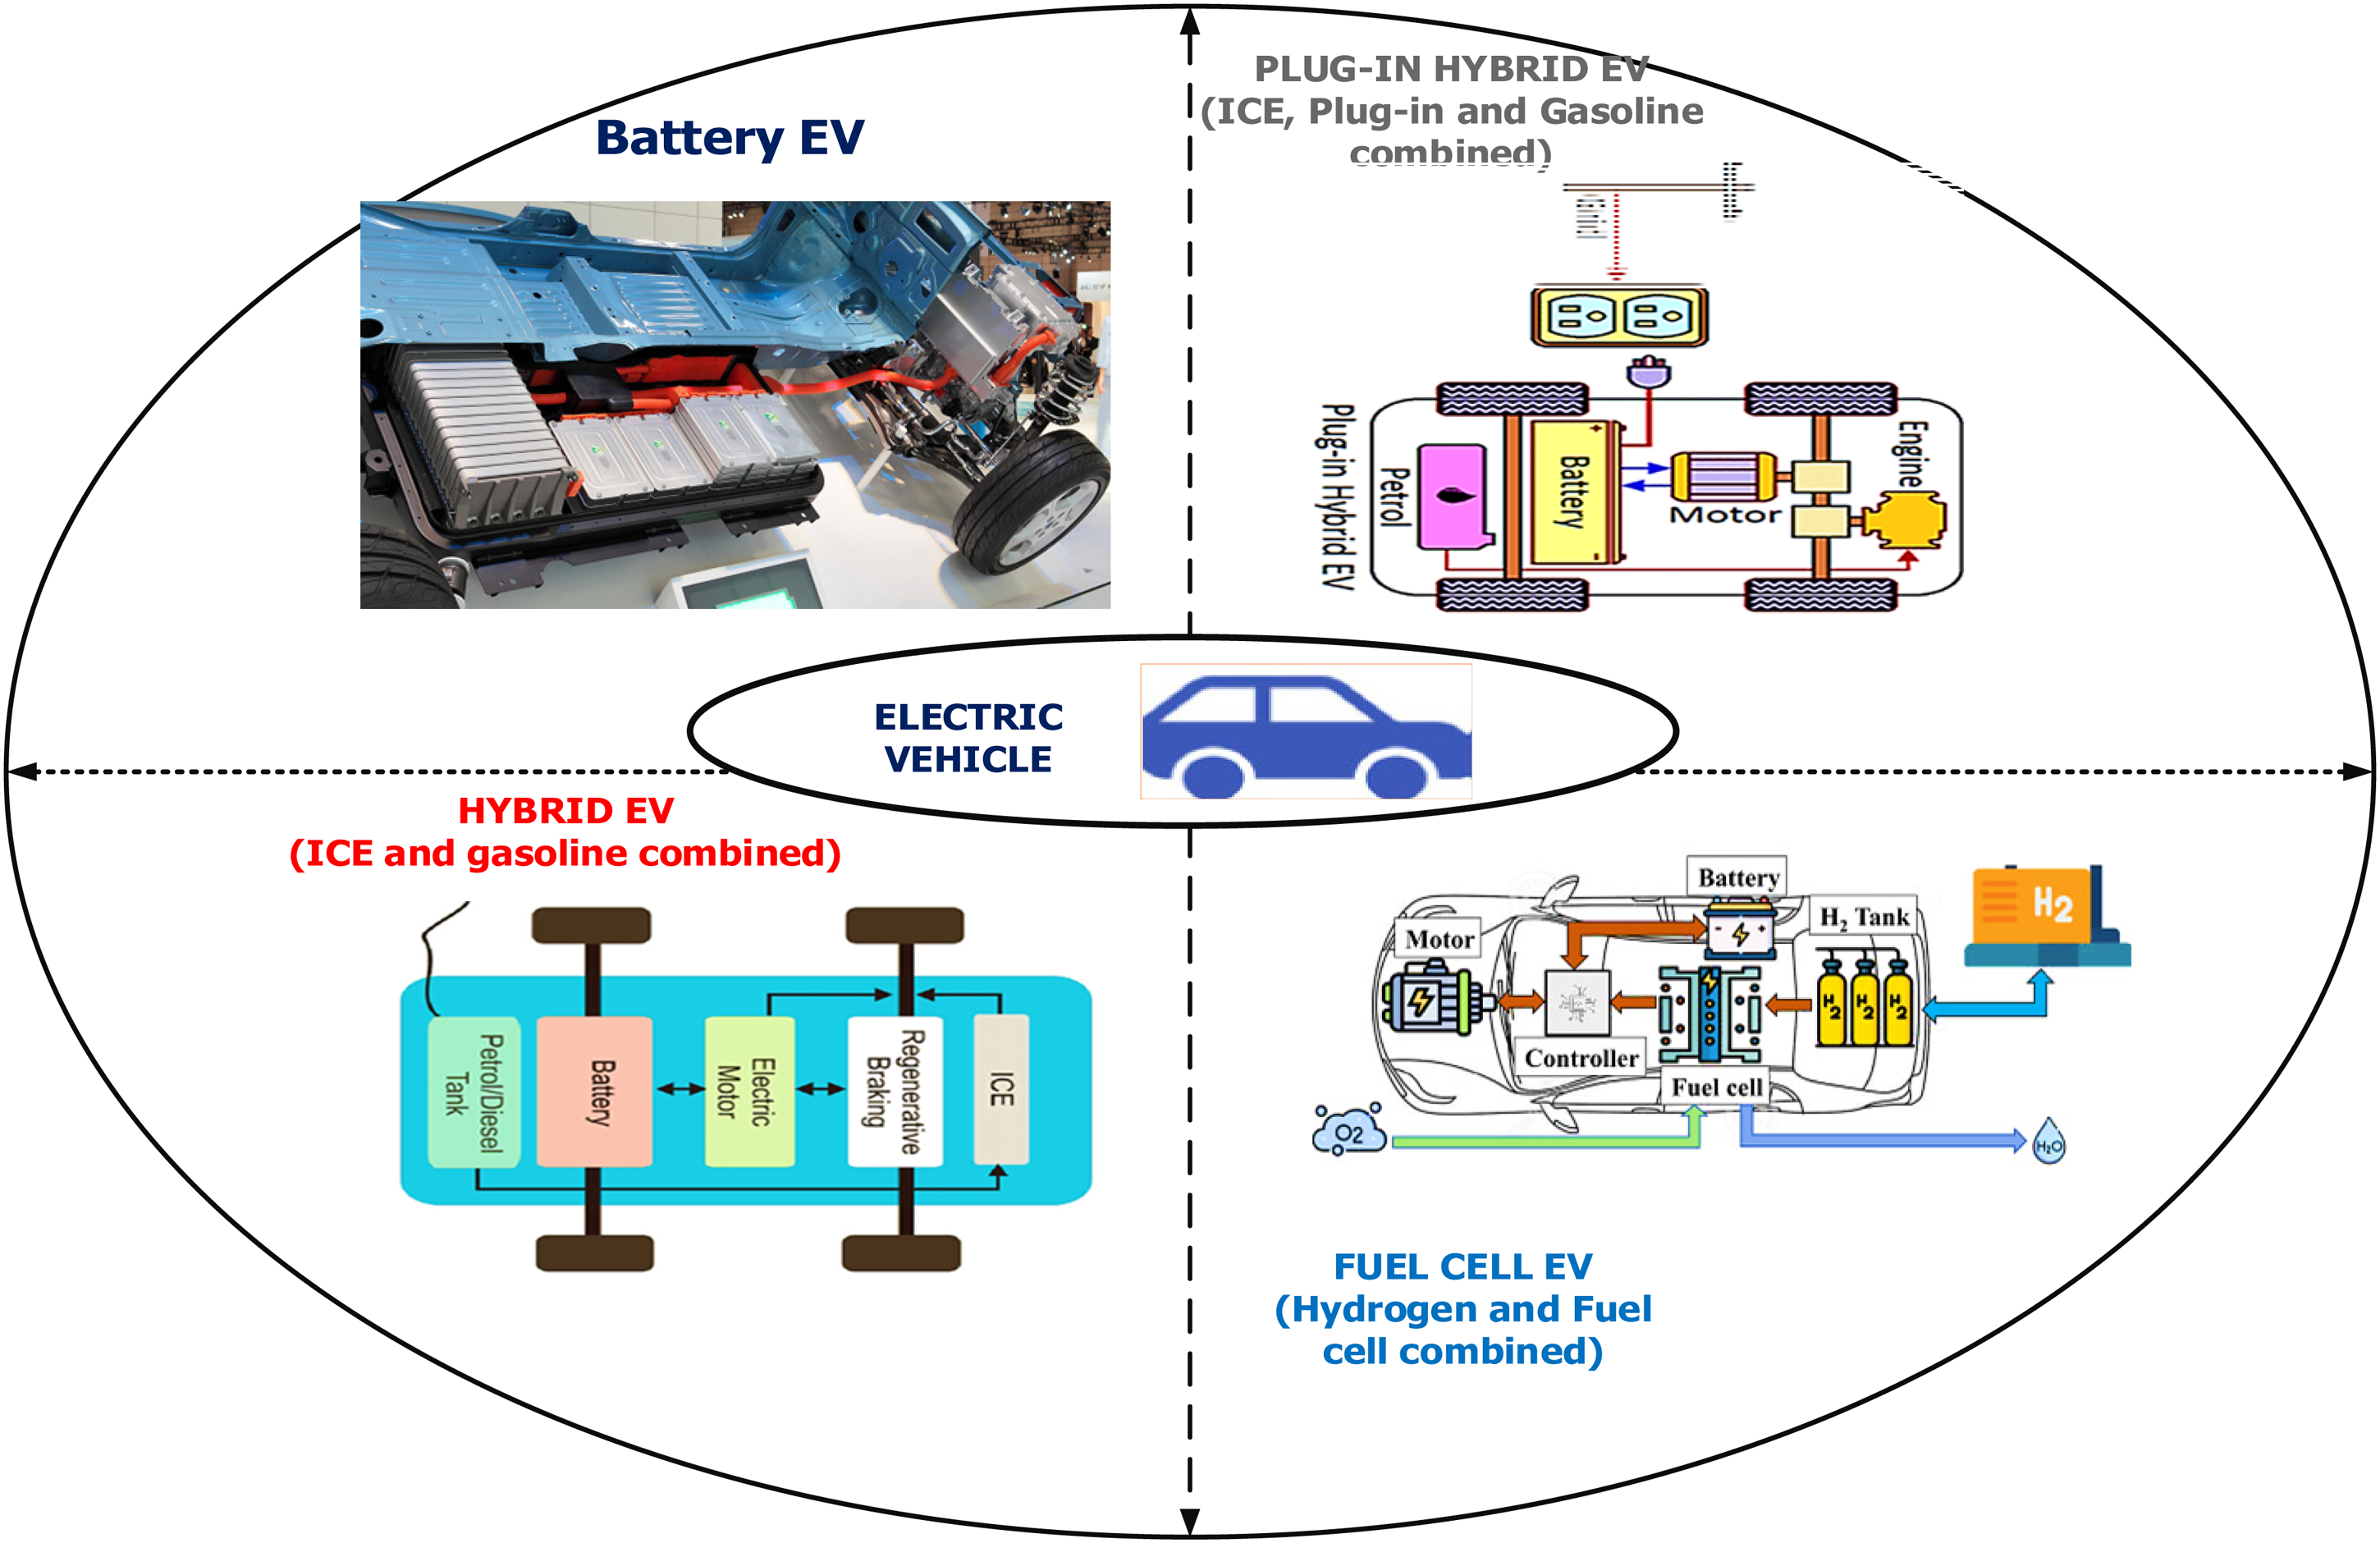
Classification of electric vehicles.
Lead acid battery (pb–acid)
A lead-acid battery, one of the earliest technologies used worldwide, typically has a specific energy range of 25–45 Wh/kg when the battery fully charges it. Unlike nickel metal hydride batteries, this battery has a relatively short cycle life because it loses active material with time (Manzetti and Mariasiu, 2015). The shedding of active material causes this. The insufficient ratios of energy to weight and volume also contribute to the limitations, which are further compounded by environmental issues associated with lead and acid. Nevertheless, despite these drawbacks, its cheap manufacturing cost of approximately 150 USD/kWh makes it suitable for use in compact, lightweight automobiles that display satisfactory performance.
Lithium-ion battery
LIBs are a popular choice for EVs due to their high energy density, efficiency, long life, and ability to perform in hot conditions. Because of its low redox potential and high electrochemical equivalency, lithium is still regarded as the finest material for EV batteries. Furthermore, lithium has a lower reduction potential than other elements, which improves its ability to sustain optimum cell potential. Significantly, the battery's recyclability adds to its benefits. Nonetheless, considerable challenges remain, including restricted availability of materials and a high cost of $140 USD per kilowatt-hour (kWh) (Maiyalagan and Elumalai, 2021).
Nickel-based batteries
Nickel oxyhydroxide has been employed as a cathode substance in several battery configurations, such as nickel-iron (Ni-Fe), nickel-cadmium (Ni-Co), nickel-zinc (Ni-Zn), nickel metal hydride (Ni-MH), and nickel-hydrogen (Ni-H2) batteries. Out of these options, the Ni-Zn battery has the highest cell voltage of 1.6 V compared to other batteries that contain nickel. It offers more incredible specific energy than the Ni-Co battery and is more ecologically benign due to its nontoxicity. In addition, it exhibits excellent resistance to excessive charging and discharging, impressive charging and discharging capabilities at high rates, and demonstrates optimal performance across a broad temperature spectrum. However, the commercialization of this technology is hindered by its limited lifespan of approximately 300 cycles, which is attributed to the dissolution of specific zinc components in the electrolyte. Consequently, researchers in the field of battery chemistry are actively investigating this subject. Since 1992, the Ni-MH battery has gained popularity in the EV sector because of its established technology and exceptional performance characteristics (Liu et al., 2022). This battery utilizes hydrogen absorbed in metal hydride as the anode material. It has a nominal cell voltage of 1.32 V. It also possesses a higher specific energy than lead-acid batteries. Various battery manufacturers have significantly improved Ni-MH batteries, which are currently utilized in EVs, including the Toyota RAV4L and Honda EV Plus.
Lithium-based batteries
Lead-acid and nickel-based systems are being gradually phased out in favor of lithium-based systems, which have set in a new era for batteries that can deliver high energy and power levels. G.N. Lewis first conducted experiments on lithium batteries in 1912, a decade before the invention of LIBs in 1976 (Lewis and Keyes, 1913). Electrolytes, not water-based, were used in these early lithium metal-based batteries, which used metallic lithium as the anode. They represented a significant technological achievement by offering better specific energy and greater energy density while maintaining lower weight. Coin-type Li/MnO2 battery, which holds a lower weight. In the following years, beginning in the 1970s, various primary systems based on lithium metals existed. These systems utilized various cathode materials, such as pyrite, manganese dioxide, and more (Eichinger and Semrau, 1990).
Rechargeable LMBs are now facing considerable safety problems, which is preventing them from successfully commercializing. The lithium metal is a desirable option since it has the most significant specific capacity of 3860 mAh/g and a low operation potential of −3.04 V (Chen et al., 2020). As a result of its high energy density and specific energy, LMBs give EV propulsion a significant amount of potential. Even though there are numerous types of LMBs, including LSBs and lithium-oxygen batteries, as well as SSBs that make use of lithium metal anodes and layered oxide cathodes in conjunction with solid electrolytes, SSBs are widely considered to be the most promising technology for increasing energy density in EV purposes (Janek and Zeier, 2016).
During the 1980s, Goodenough and his colleagues introduced a new era for LIBs explicitly designed for power applications. The development of LIBs can be divided into three distinct stages: commercialization starting in 1991, exploration beginning in 2008, and foresight emerging in 2019. The first generation of LIBs initially used LiCoO2 as the cathode and petroleum coke as the anode (Mizushima et al., 1980). Successive iterations, characterized by improvements in anode materials (transitioning from hard carbon to graphite) and electrolytes, resulted in significant increases in energy density. The most advanced cathode materials for high-energy LIB cells are layered lithium nickel cobalt manganese oxides. These materials have higher capacities and are more cost-effective compared to LiCoO2. Graphite is still the favored choice for the anode material. To enhance the energy density and reduce the cost of LIBs, one can increase the nickel concentration in the cathode layered oxides and incorporate silicon into the graphite negative electrode. Graphite is still the most used material for the anode, but silicon is restricted to small amounts. LIBs have significantly improved, increasing their specific energy from 98 Wh/kg in 1990 to 195 Wh/kg in 2008 and beyond. As a result, they have become widely used in hybrid and battery EVs (Zhou et al., 2021).
Emerging battery technologies
Battery technology is essential for progressing at a quick pace to ensure the future of EVs, renewable energy storage, and portable devices. The present restrictions of energy density, charging speed, safety, and sustainability are being addressed by emerging battery technologies to address these limitations. Listed below are some of the more encouraging improvements in this area.
➢ ➢ ➢ ➢ ➢ ➢
By providing higher energy densities, increased safety, faster charging, and greater environmental sustainability, these developing battery technologies have the potential to revolutionize the use of energy storage. These improvements will significantly impact the widespread adoption of EVs, the integration of renewable energy sources, and the proliferation of advanced portable electronic gadgets as research and development efforts continue.
Technical capacity for EV batteries
The technical capacity of EV batteries is a critical factor in determining their performance, efficiency, and suitability for widespread adoption (Cready et al., 2003). This capacity encompasses various aspects, including energy density, charging speed, lifespan, safety, and environmental impact. Here are the key elements of the technical capacity for EV batteries:
➢ ➢ ➢ ➢ ➢ ➢
Research and development are constantly changing the technical capability of EV batteries. Progress is being made in energy density, charging speed, lifetime, safety, and environmental sustainability because of advancements in battery chemistry, materials science, and engineering. These improvements are required to facilitate the transition to a transportation system that is more environmentally friendly and to facilitate the widespread adoption of EVs (Mohammed and Jung, 2021).
State-of-the-art battery managements
State-of-the-art BMS is essential for maximizing the performance, safety, and longevity of batteries used in EVs and other applications. These advanced systems incorporate cutting-edge technologies and methodologies to monitor, control, and optimize battery functions. Here are the key features and capabilities of modern BMS (Zhai et al., 2020):
➢ ➢ ➢ ➢ ➢ ➢ ➢ ➢ BMSs are essential for improving battery systems’ dependability, effectiveness, and security, propelling the progress of EV technology and other applications that rely on batteries. Modern BMS plays a crucial role in enhancing energy storage solutions’ sustainability and performance by consistently introducing and integrating new technologies.
Advanced management technologies
Advanced management technologies in EV BMS are crucial for optimizing battery performance, safety, and lifespan. These technologies integrate sophisticated monitoring, control, and predictive capabilities, leveraging the latest advancements in hardware and software. Here are the key components of advanced management technologies in EV BMS (Tamilselvi et al., 2021):
➢ ➢ ➢ ➢ ➢ ➢ ➢ ➢ ➢ ➢
Advanced management technologies in EVs BMS are essential for enhancing the performance, safety, and longevity of EV batteries. By leveraging cutting-edge sensing, predictive analytics, machine learning, and connectivity solutions, these technologies drive the evolution of EVs toward greater efficiency, reliability, and sustainability.
Emerging management technologies
Emerging battery management technologies in EVs focus on improving battery performance, safety, and longevity through creative techniques and forward-thinking methodology (Lee et al., 2021). These technologies incorporate some of the most cutting-edge hardware and software solutions, which ultimately result in battery systems that are more efficient and reliable. The following is a list of the most significant components and trends in the upcoming technologies for battery management.
➢ ➢ ➢ ➢ ➢ ➢ ➢ ➢ ➢
Emerging BMS technologies in EVs are essential in advancing their performance, safety, and sustainability. By integrating AI, IoT, advanced materials, and innovative management strategies, these technologies drive the evolution of EV battery systems toward higher efficiency, reliability, and user satisfaction.
EV BTMS
BTMS are essential for providing EV batteries’ best performance, safety, and longevity (Al Shdaifat et al., 2023). Efficient thermal management is necessary to keep the battery within its proper temperature range, avoiding overheating or excessive cooling, which can degrade battery performance or safety (Lipu et al. 2021, 2022). The main components and technologies employed in BTMS are as follows:
➢ ➢ ➢ ➢ ➢ ➢ ➢ ➢
An efficient BTMS is necessary for the dependable and effective operation of EV batteries, contributing to enhanced vehicle performance, safety, and durability. As the technology behind EVs continues to progress, advancements in BTMS will play a crucial part in tackling difficulties related to thermal management and promoting the wider adoption of EVs (Aditya et al., 2022).
Basic battery parameters
The basic battery parameters considered typically in BTMSs are as follows:
Case study on active temperature control of lithium-ion battery
This case study aims to regulate the temperature of an LIB and ensure a uniform thermal distribution.
Safety: Preventing the battery from exceeding its safe temperature threshold, thereby reducing the risk of thermal runaway, fires, or explosions. Performance: Improving battery efficiency by maintaining an optimal operating temperature, typically between 20°C and 30°C (68°F and 86°F). Longevity: Prolonging battery lifespan by minimizing the adverse effects of extreme temperatures, which accelerate degradation. Efficiency: Enhancing overall energy efficiency by keeping the battery within its ideal thermal range.
Simulation design of lithium-ion battery pack in COMSOL software
In this work, a battery cooling system has been implemented to enhance the battery's longevity and ensure optimal performance. The system maintains the battery temperature below ambient levels using a coolant mixture of water and ethylene glycol. It comprises 6 mm copper pipes, a temperature sensor (DS18031), a proportional–integral–derivative controller, a DC 12-V 0.11A brushless fan, a 12-V DC pump motor, and a temperature control relay-based module, as illustrated in Figure 5.
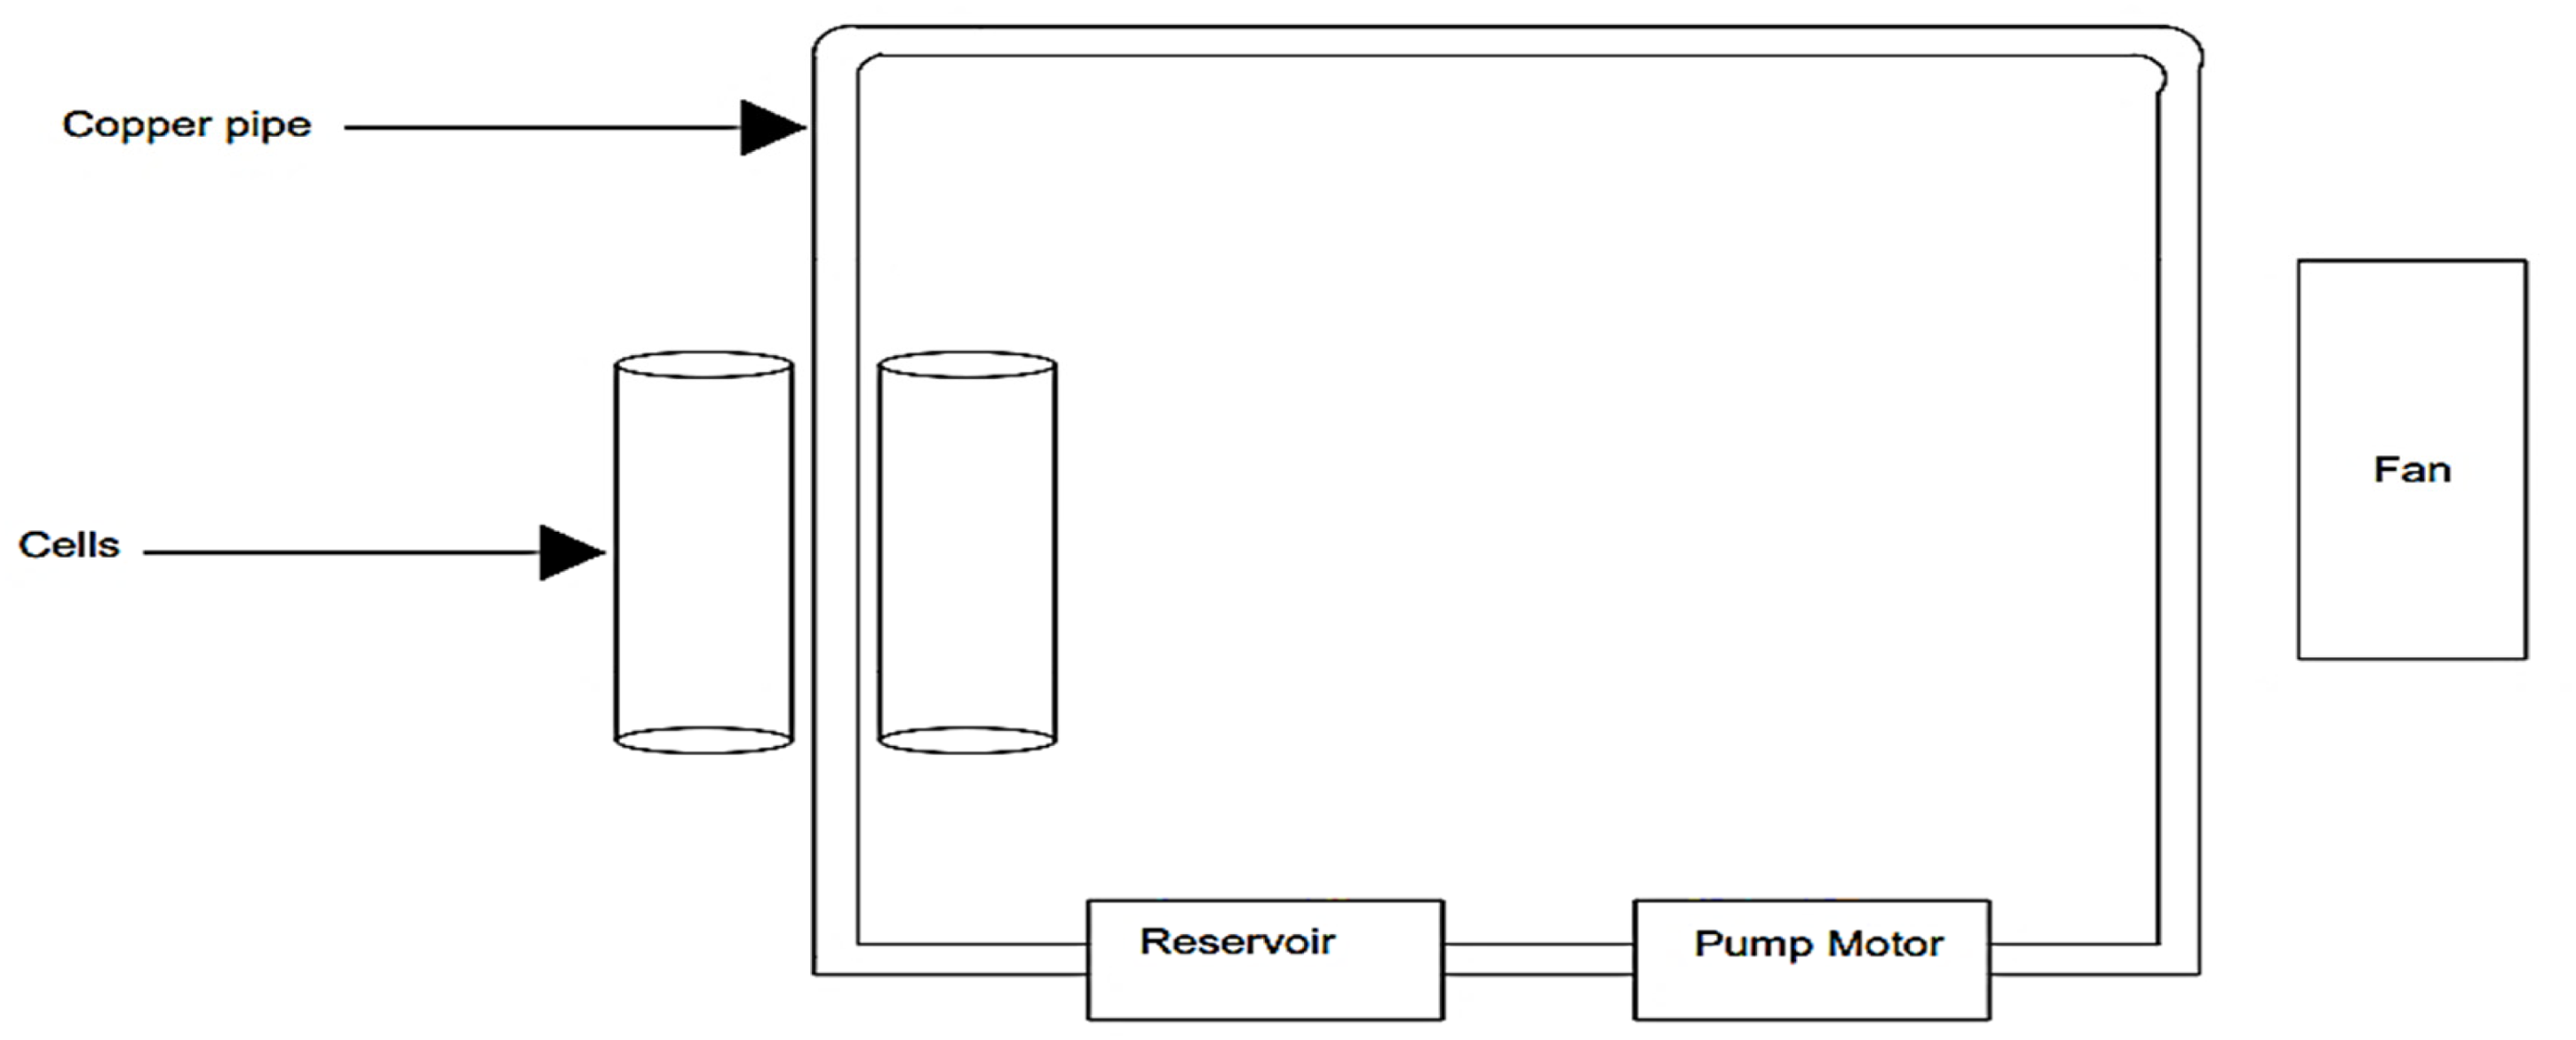
Battery cooling system.
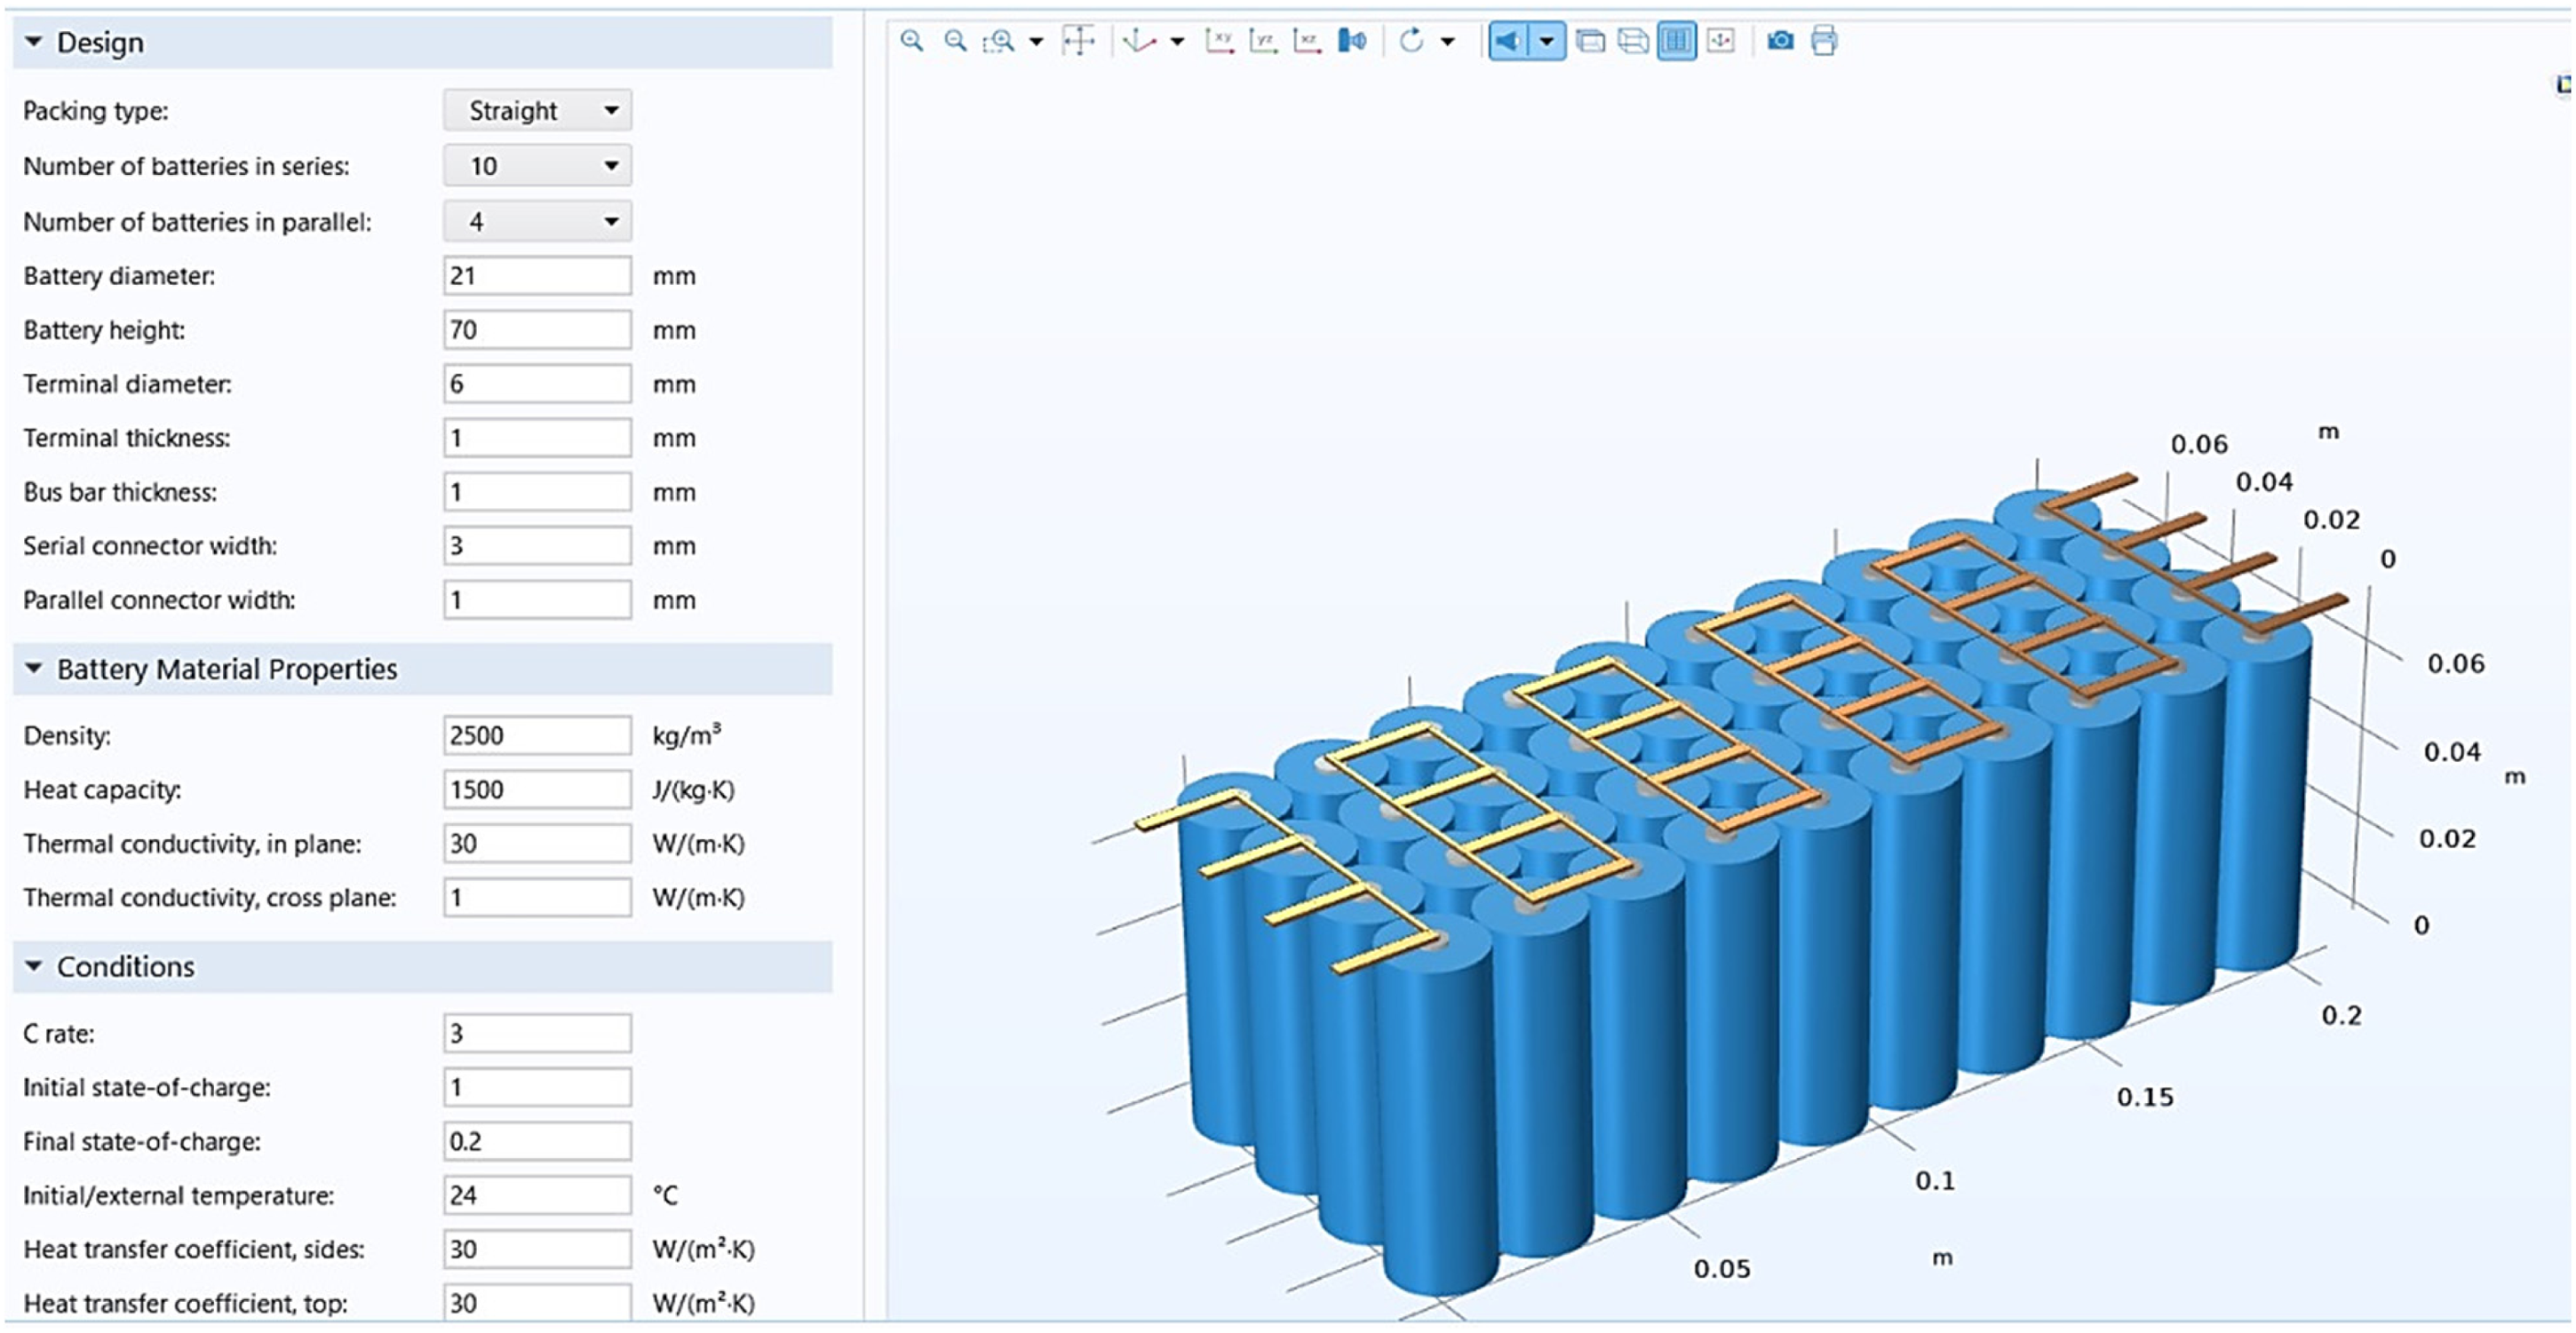
The 6-mm copper pipes are integrated within the battery's vacant spaces, leveraging copper's high thermal conductivity to dissipate excess heat efficiently. The system includes a temperature control module that continuously monitors the battery temperature. If the average temperature exceeds 30°C, the module automatically activates the pump motor, initiating coolant circulation through the copper pipes. As the battery cells generate heat during operation, the liquid coolant absorbs this heat through direct contact with the cell modules. The absorbed heat is then carried away by the coolant, which recirculates through the system, maintaining a stable thermal environment. This cooling cycle continues throughout the battery's operation, ensuring efficient heat dissipation and improved thermal stability. COMSOL multiphysics is widely used for thermal and electrochemical-modeling LIB packs. Figure 6 depicts the design of the LIB in the COMSOL software, which consists of a battery pack having a combination of 10 cells connected in series and four cells in parallel.
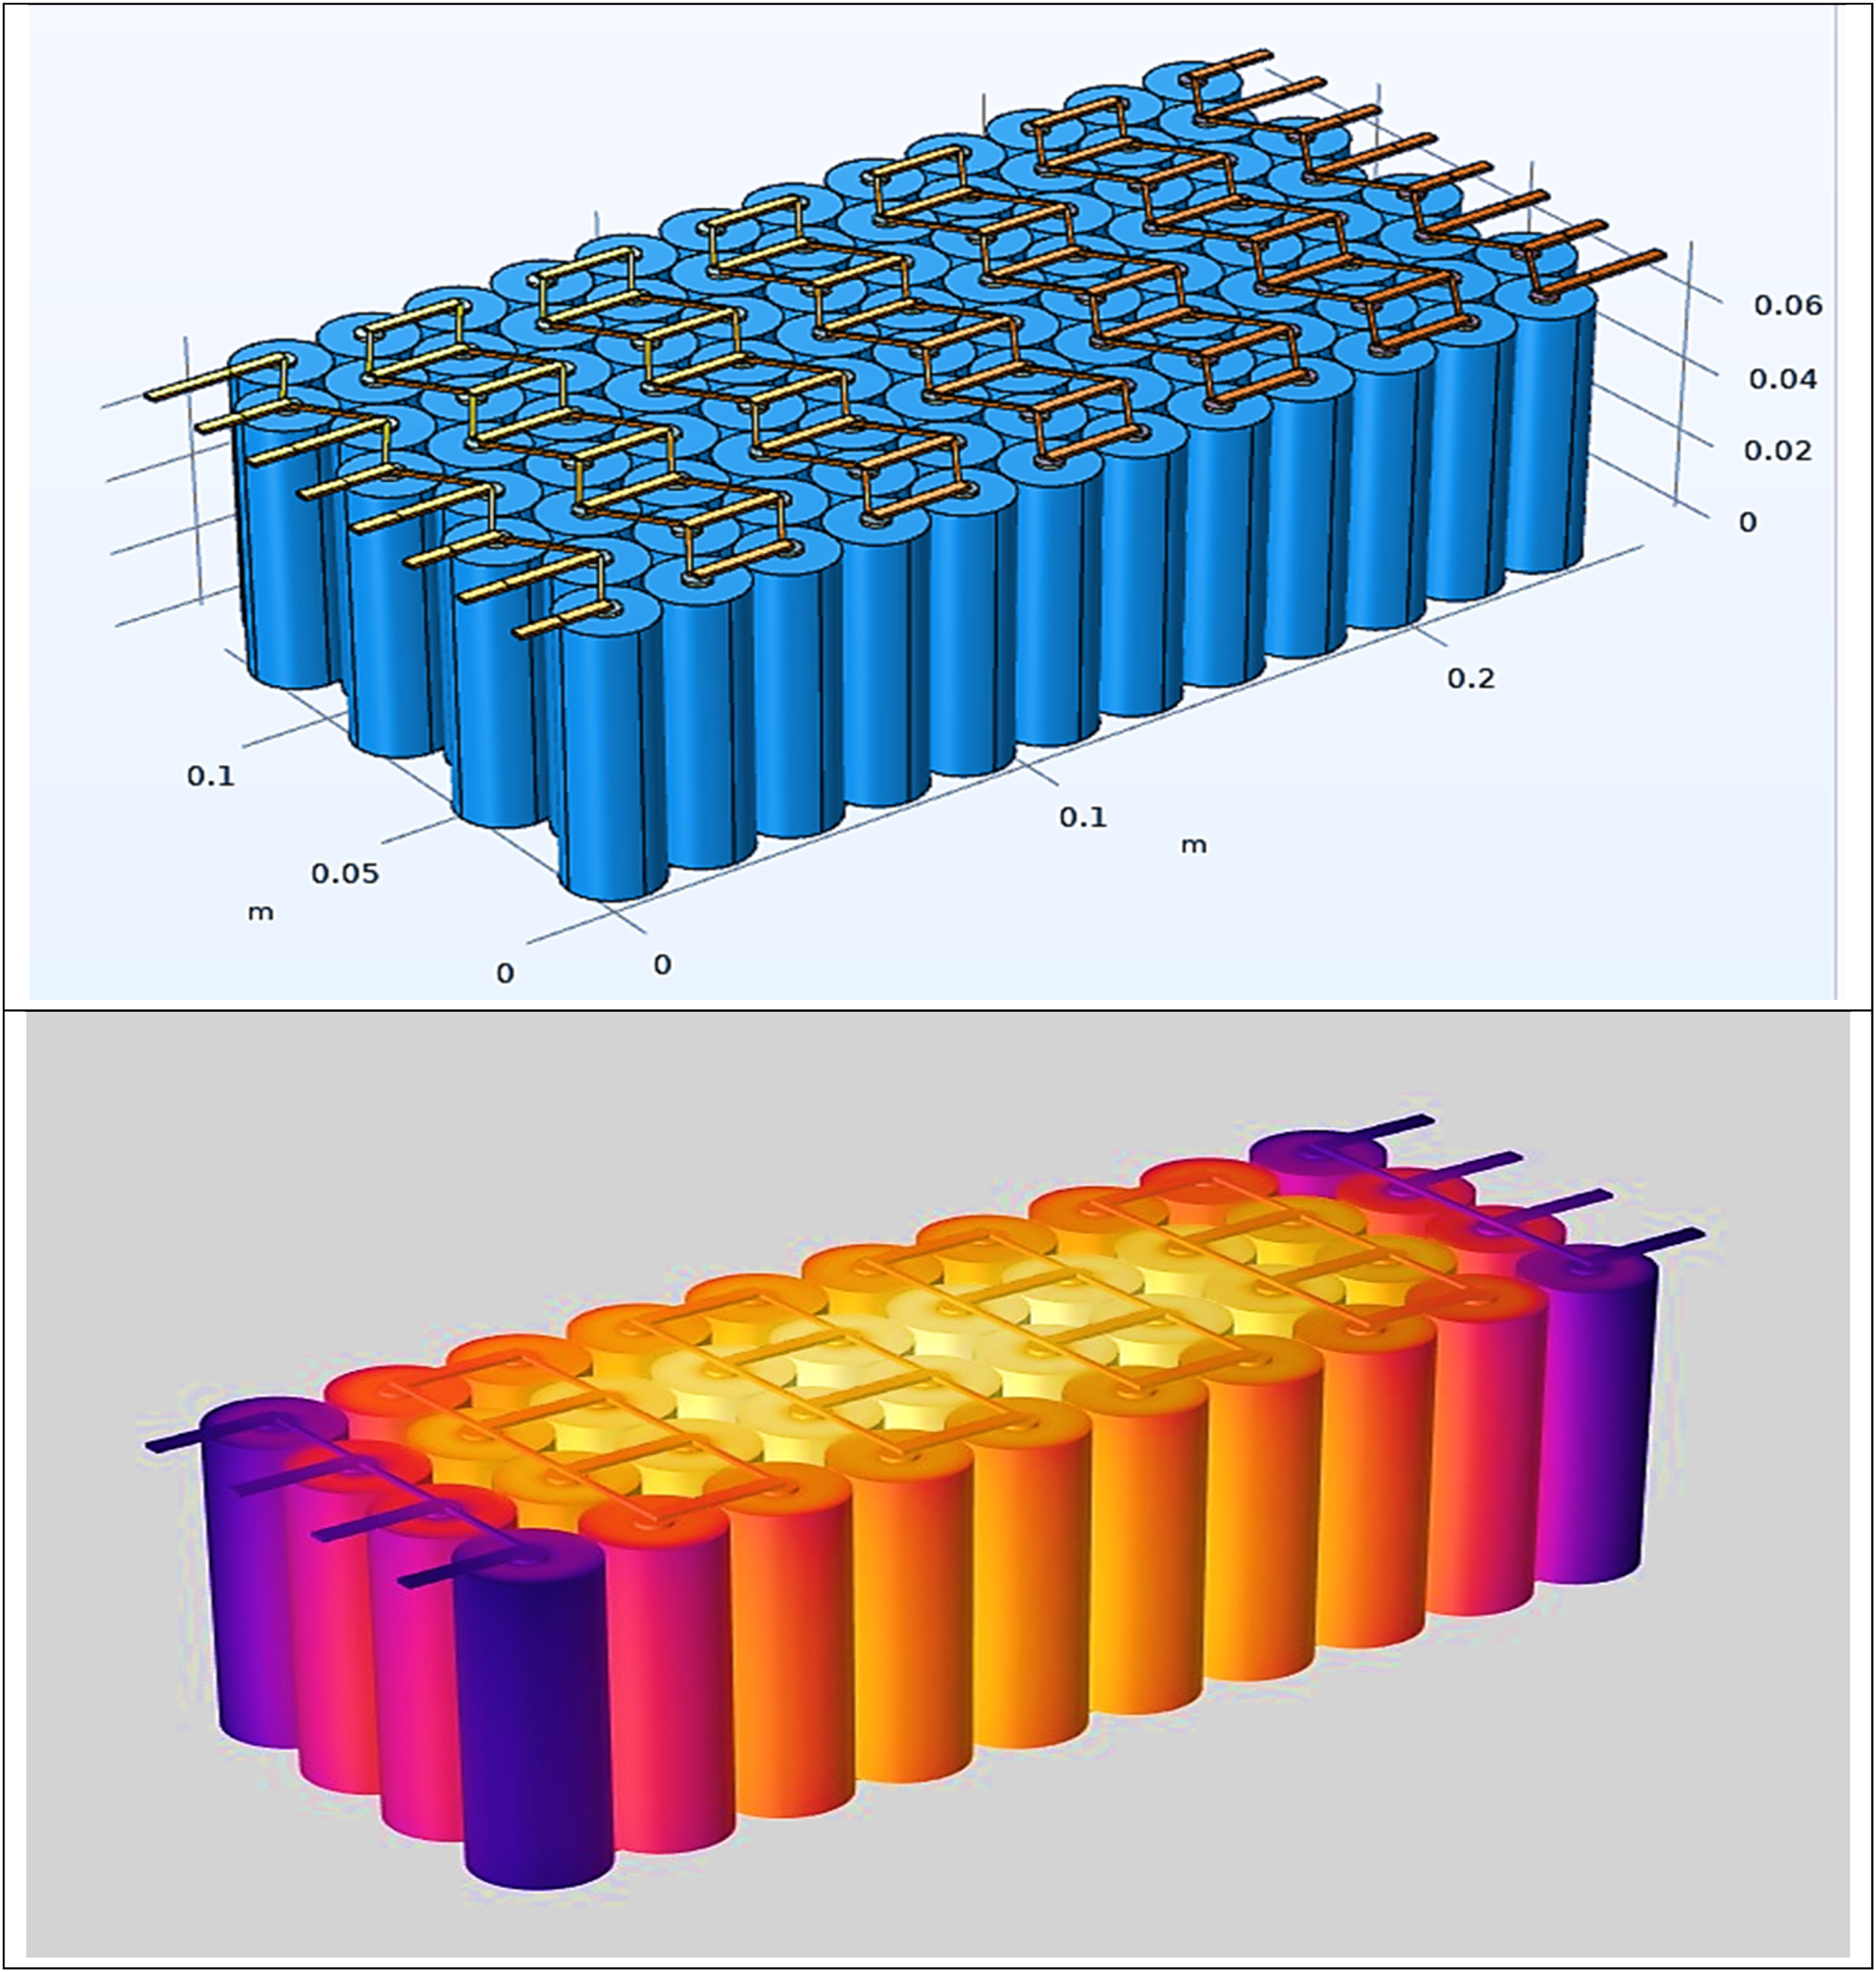
Design of lithium-ion battery pack in COMSOL.
Select the “Battery and Fuel Cells Module” and “Heat Transfer Module.” Define geometry of the LIB pack. Assign materials (battery, coolant, casing). Set governing equations (electrochemical and thermal). Apply boundary conditions (current input, cooling parameters). Mesh the model for accurate results. Run simulations and analyze temperature distribution and heat generation.
Figure 7 shows the thermal distribution of the LIB pack obtained from the software after design. Battery material properties: Set the average battery material properties. The thermal conductivity can vary in plane and cross-plane, which most batteries do. Conditions: define C rate, initial SOC, and final SOC. The initial/external temperature is the temperature the battery pack has during the start of the simulation, and it is also the temperature outside the battery. It is possible to define the heat transfer coefficients at the sides, the top, and the bottom of the battery pack.
Lithium-ion battery pack thermal distribution and cell surface temperature.
Specification of lithium-ion battery
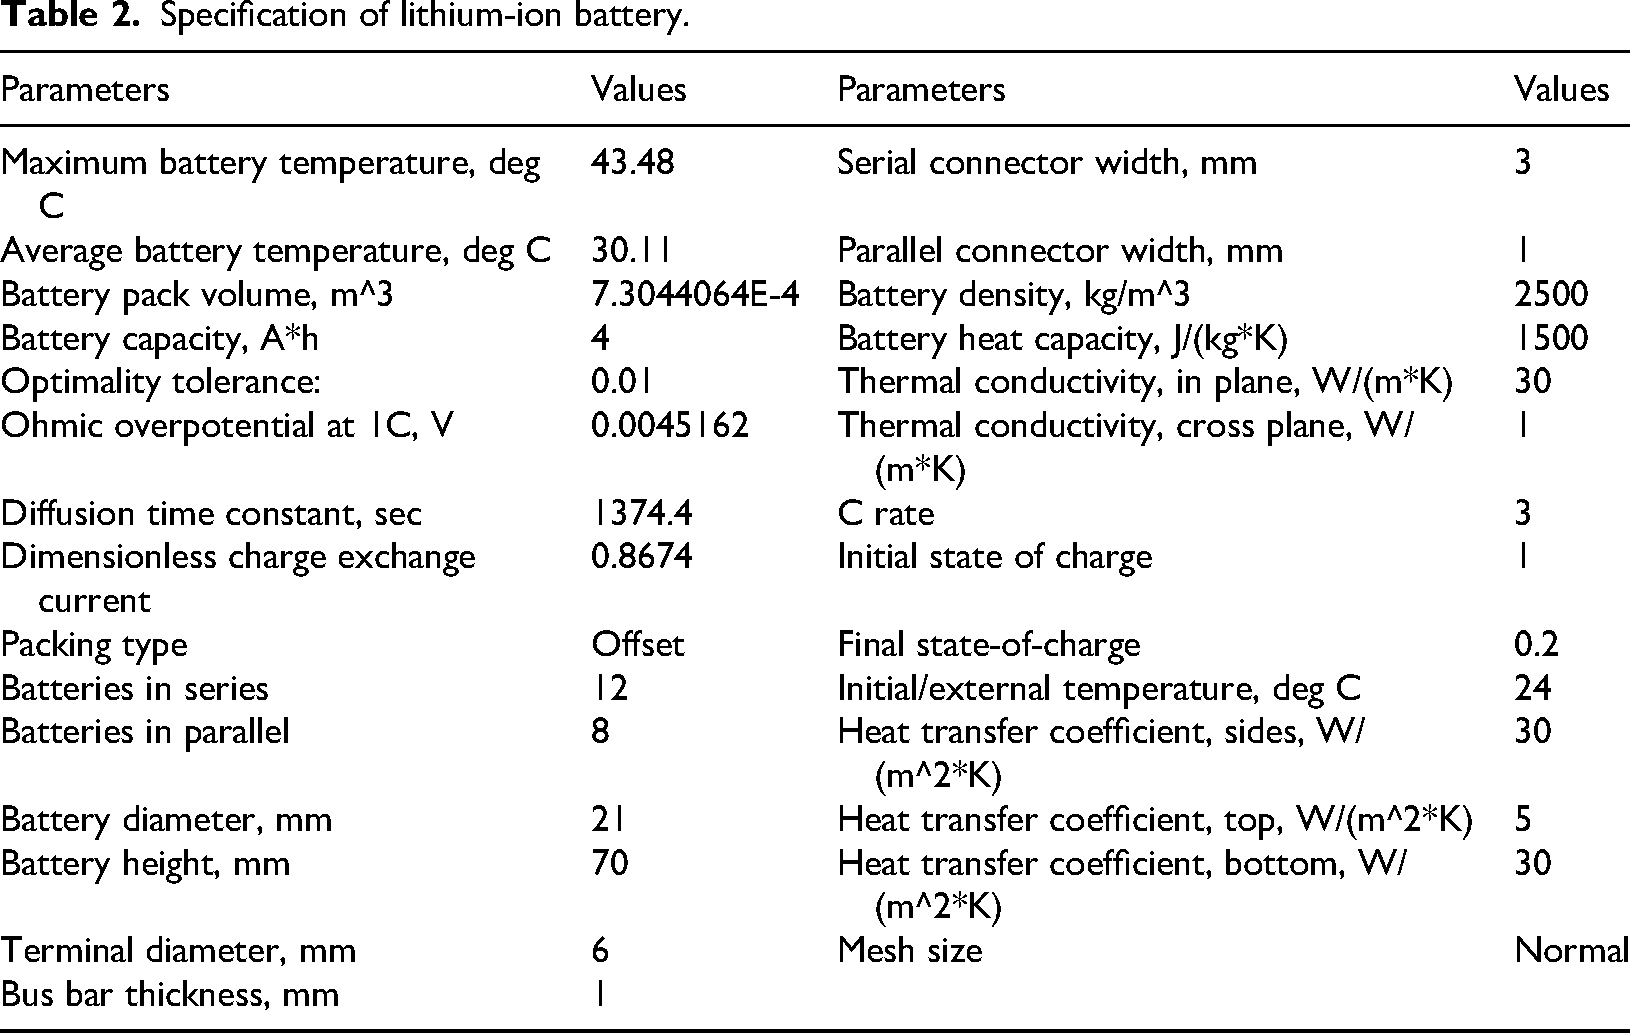
The specification considered in this work to design LIB pack in COMSOL software is provided in Table 2.
Specification of lithium-ion battery.
Simulation results of battery pack controller design using COMSOL software
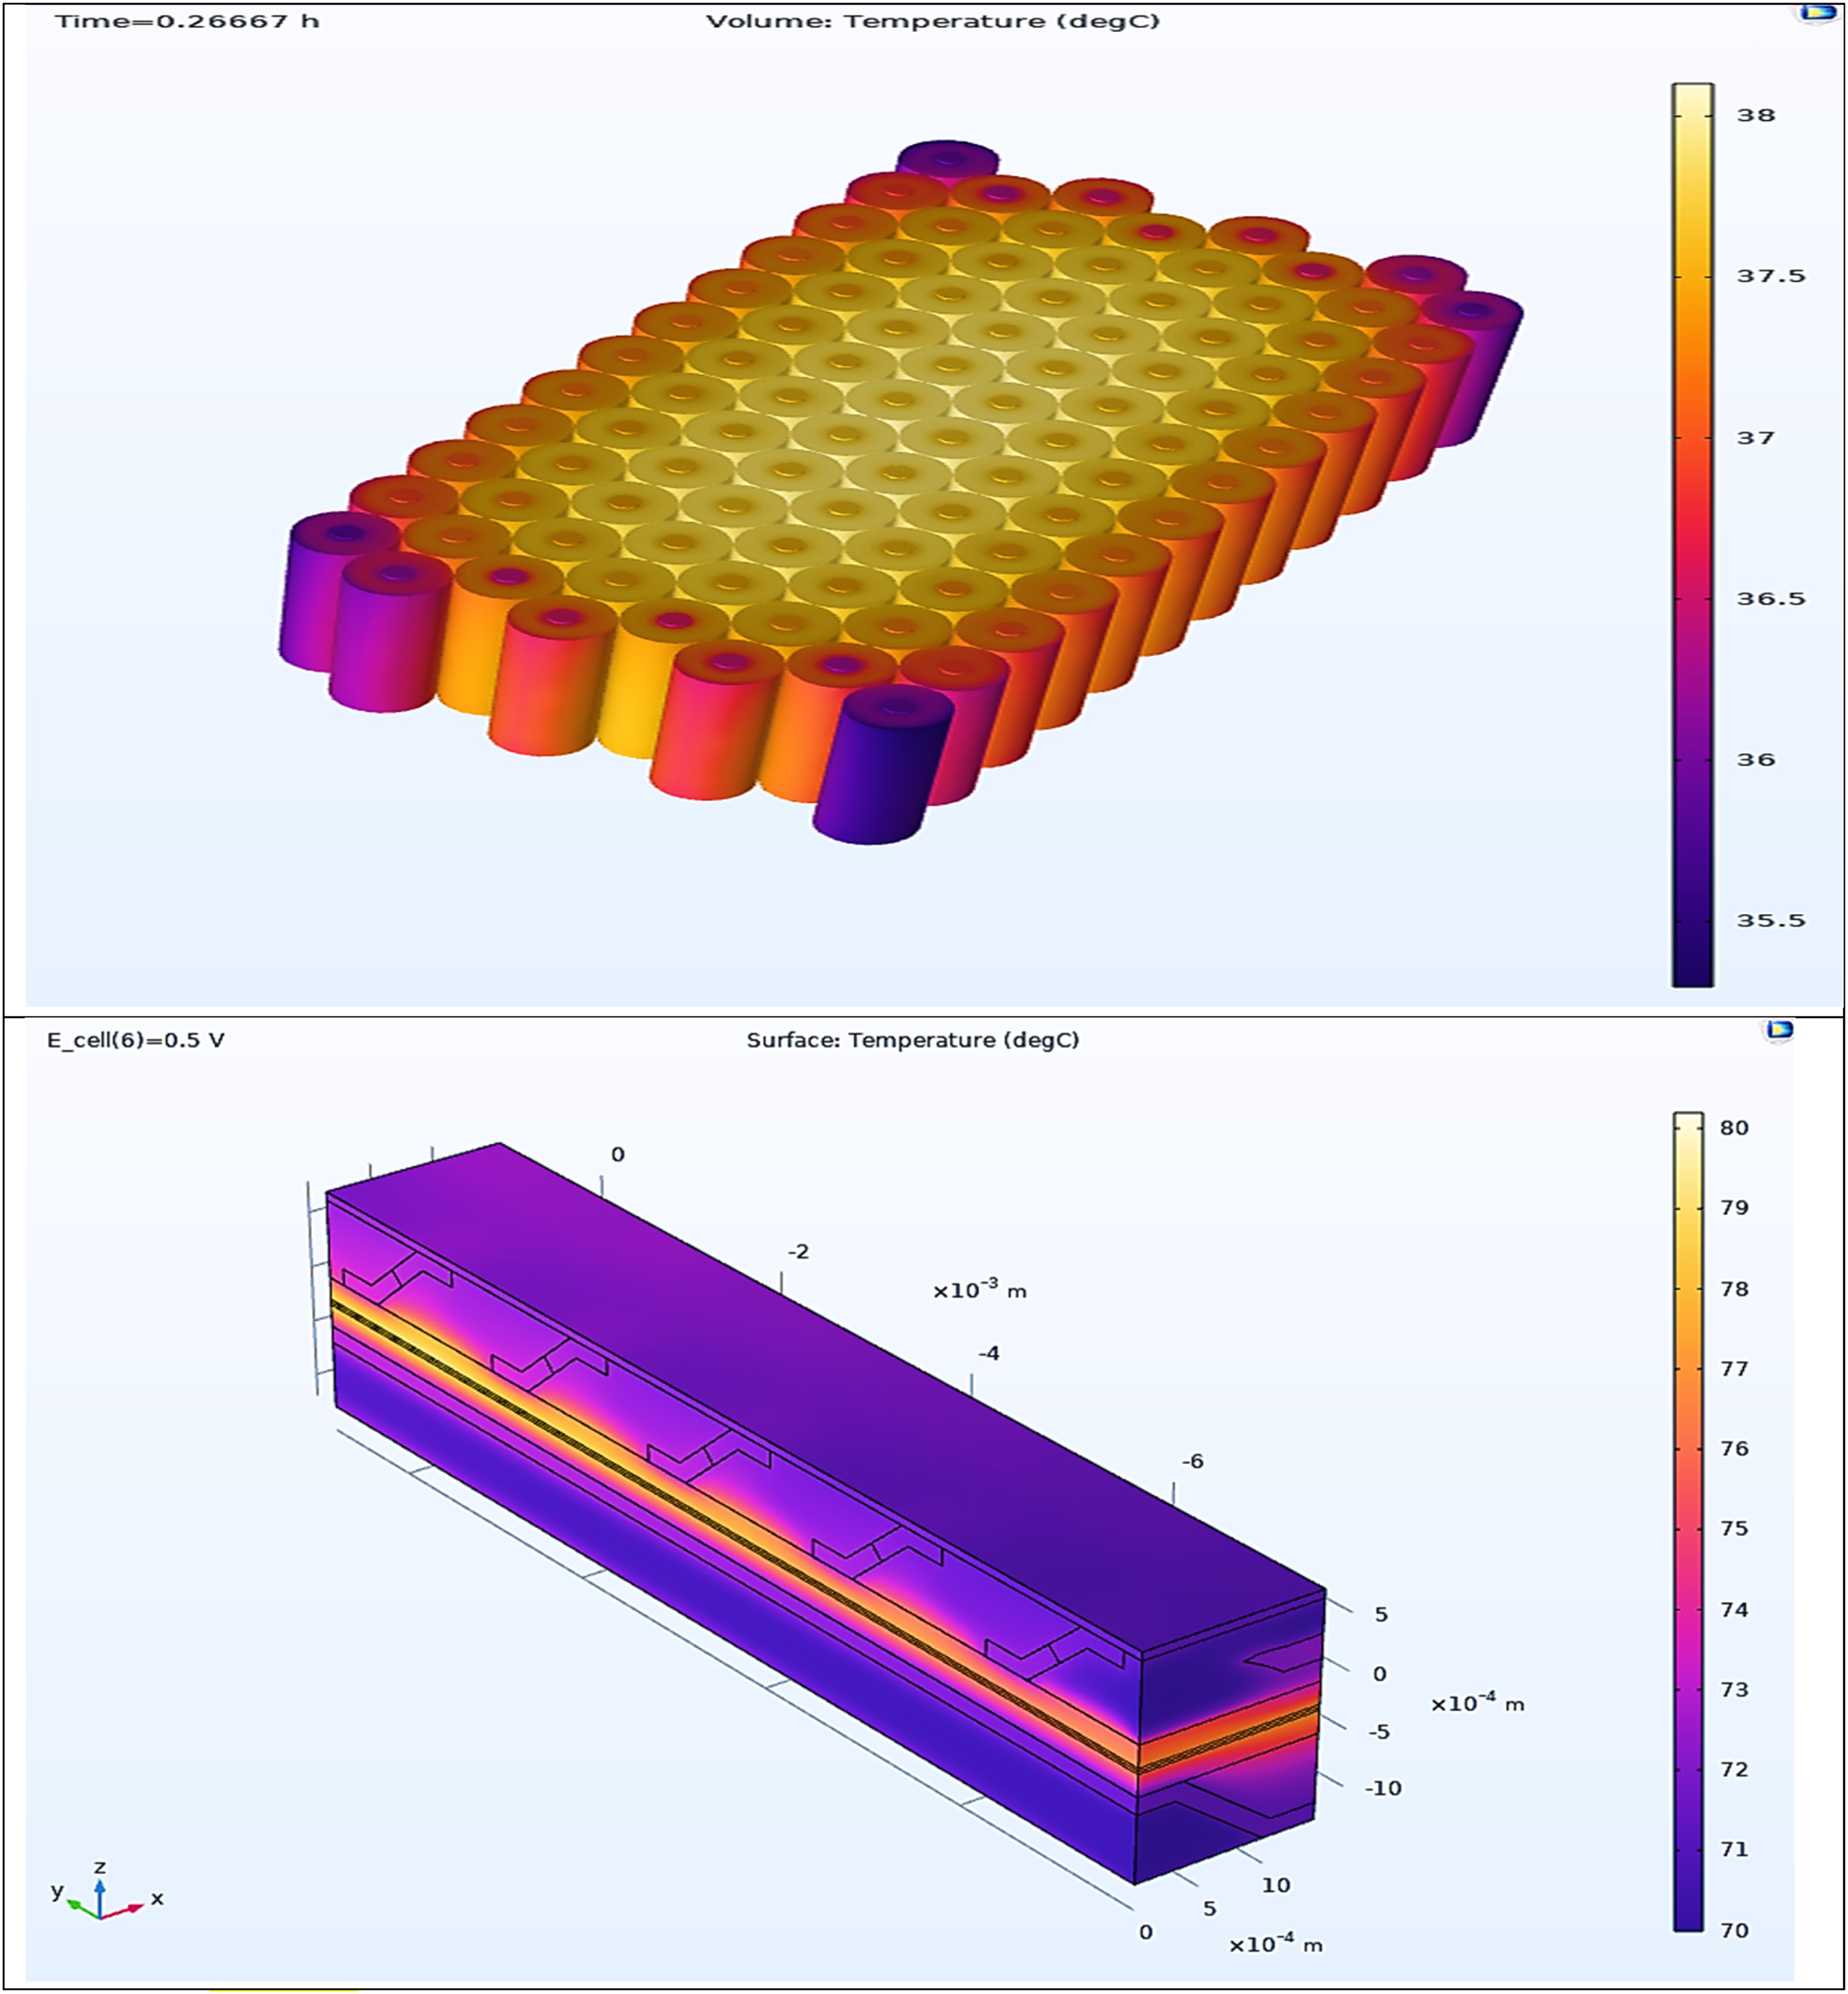
Figure 8 illustrates the Li Battery Pack Designer, which uses COMSOL software to construct and analyze LIB cells. The battery cell properties are as follows: battery capacity: 10 Ah; reference temperature: 25°C. This figure shows a battery pack design and simulation interface. The left panel contains input parameters for the battery configuration, including the number of cells in series and parallel, battery dimensions, material properties, and operating conditions. The right side displays a 3D model of the battery pack, consisting of cylindrical cells connected with bus bars. This setup is likely used for thermal and electrical performance analysis of the battery system.
Design of Li-ion battery pack in COSMOL.
The findings demonstrate how several forms of overpotentials and cell current change over time. Peaks and troughs in the overpotentials indicate high and low battery loads, respectively. The cell current graph depicts the current flow during these periods. This program is most used to simulate and optimize battery cell performance by allowing users to enter specified parameters, examine experimental data, and display the findings using detailed graphical representations. The considered input value to battery pack simulation is Ohmic overpotential at 1 C: 0.01113 Volts, diffusion time constant: 1.28 *10^4 s, dimensionless charge exchange current: 0.3796, battery cell capacity: 10 Ah, reference temperature: 25°C. The obtained open circuit voltage(V) of battery is 3.351, having a state of charge 0.05 as shown in Figure 9. These parameters are transferred and used by the battery pack simulation.
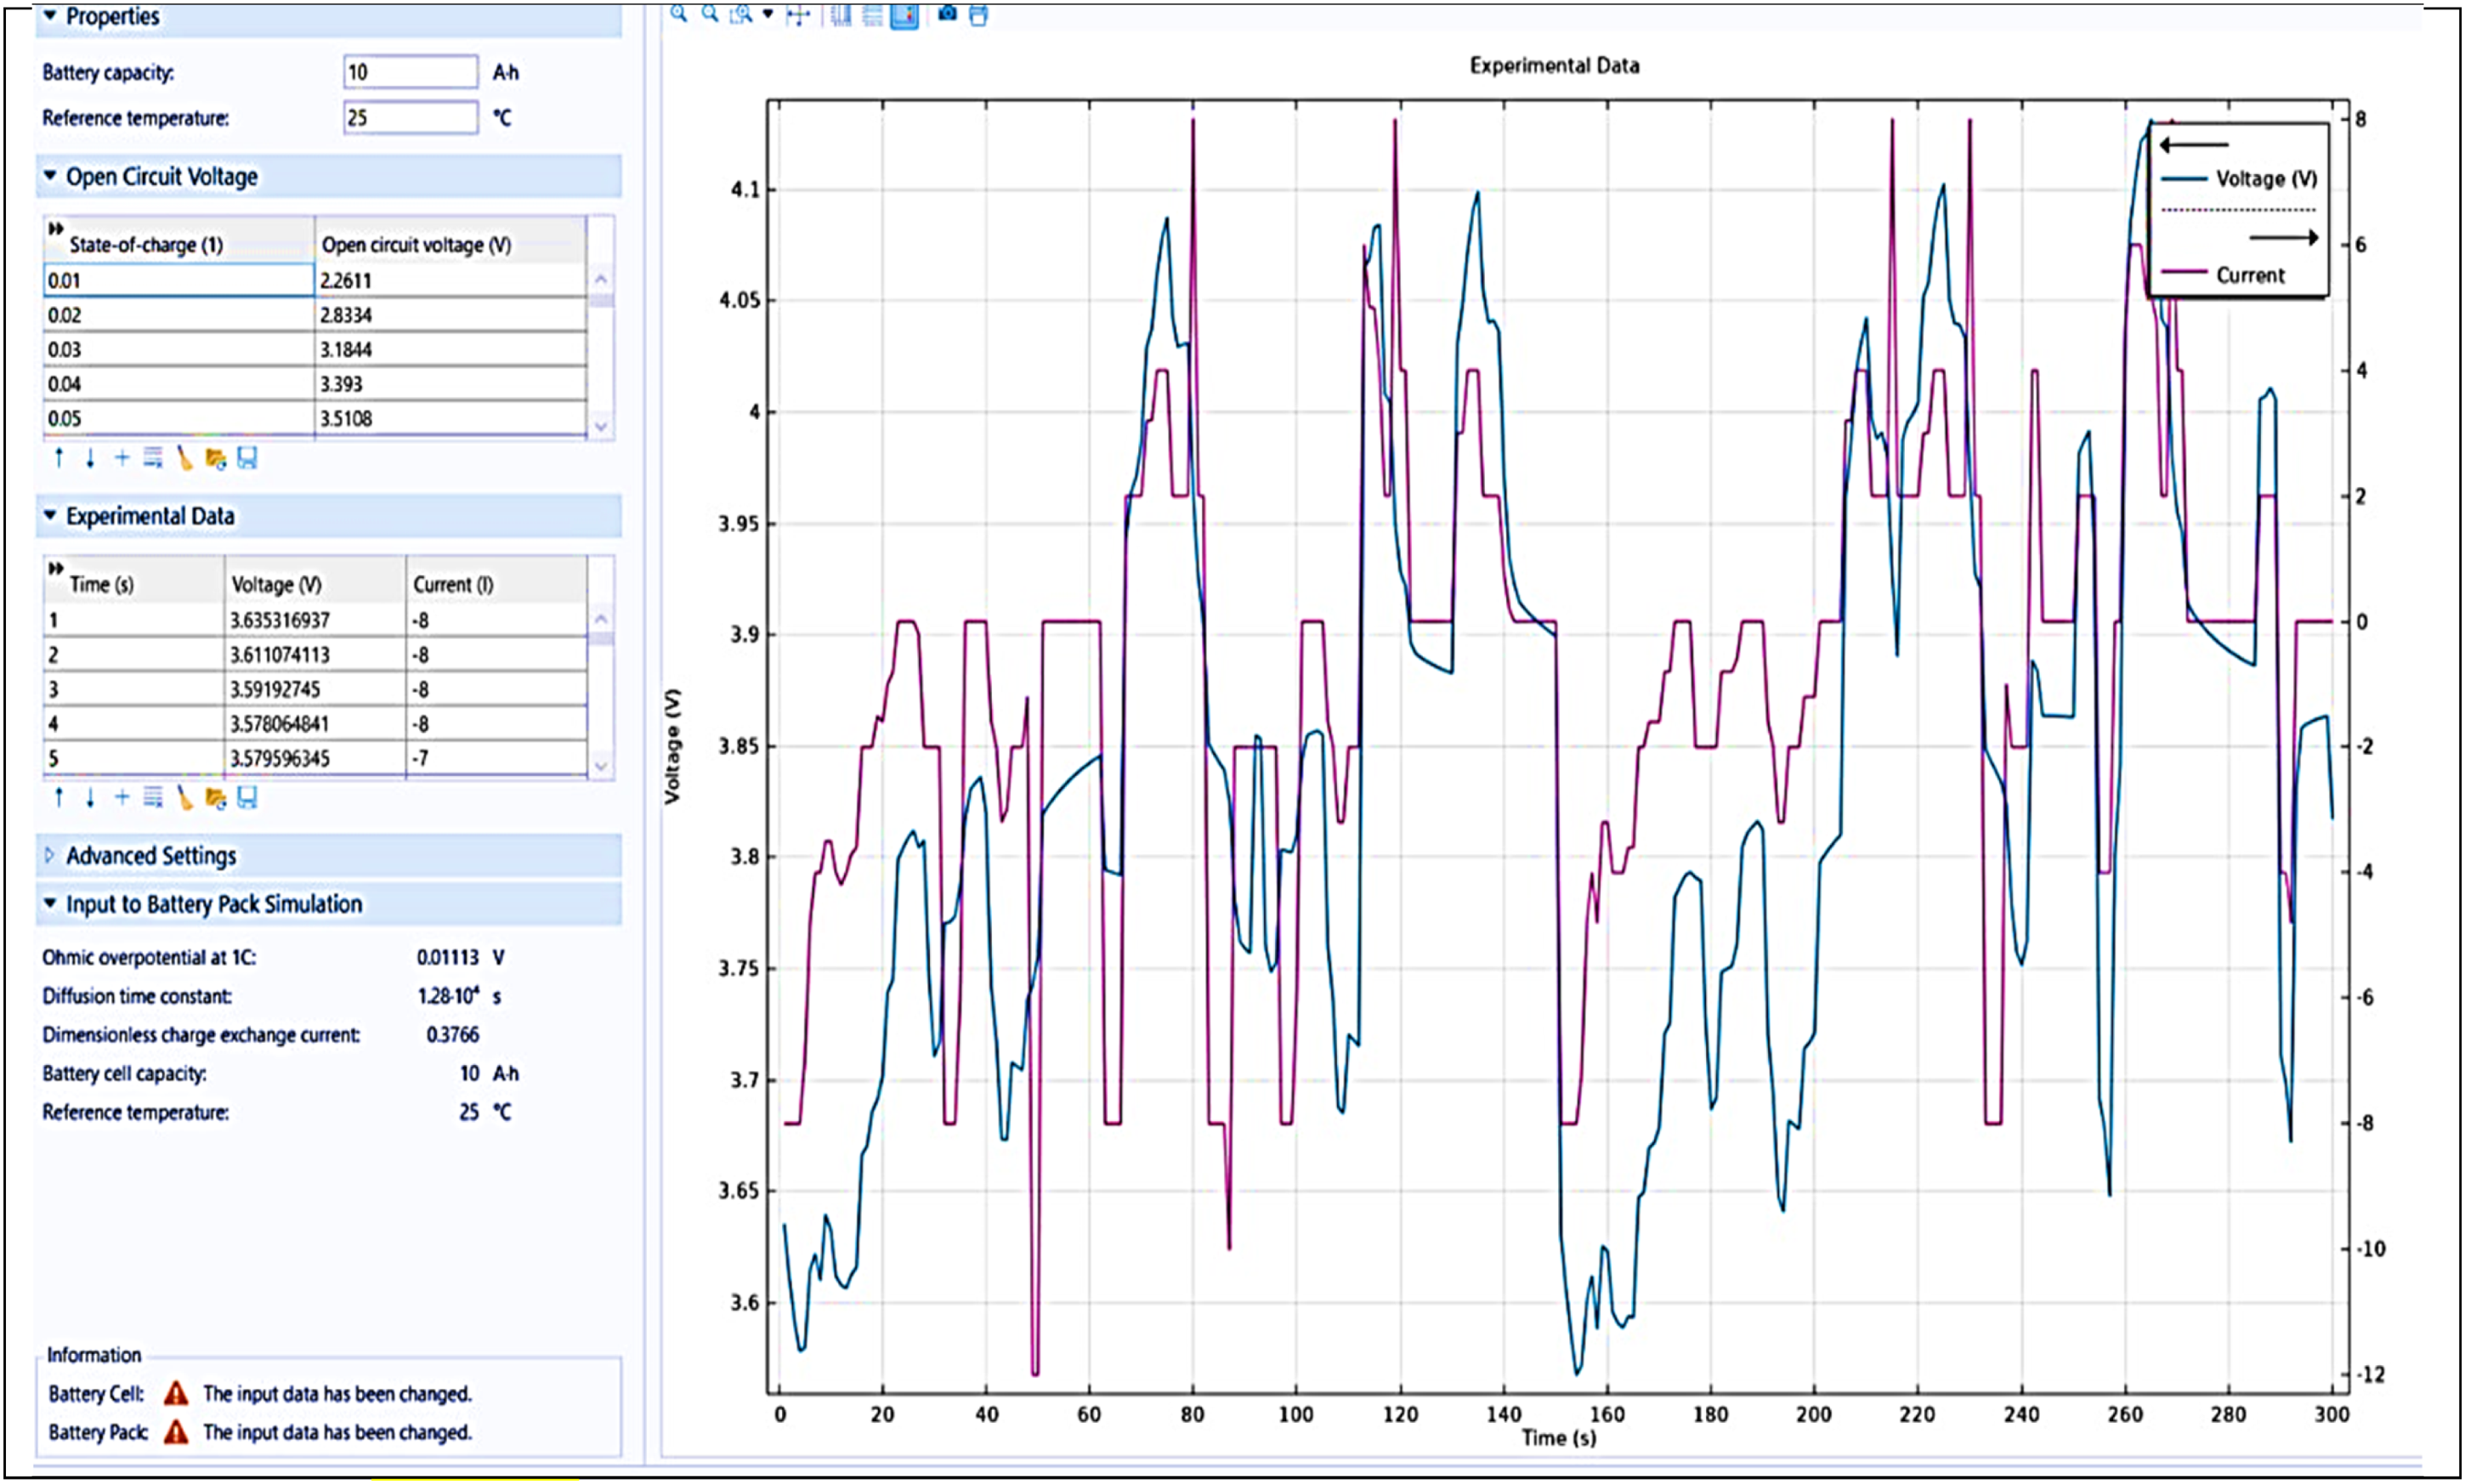
Graphical representation of voltage versus time in battery pack.
Figure 10 depicts a “cell potential vs. time” graph for three cells labeled Cell 1, Cell 2, and Cell 3 obtained from the battery cell simulation.
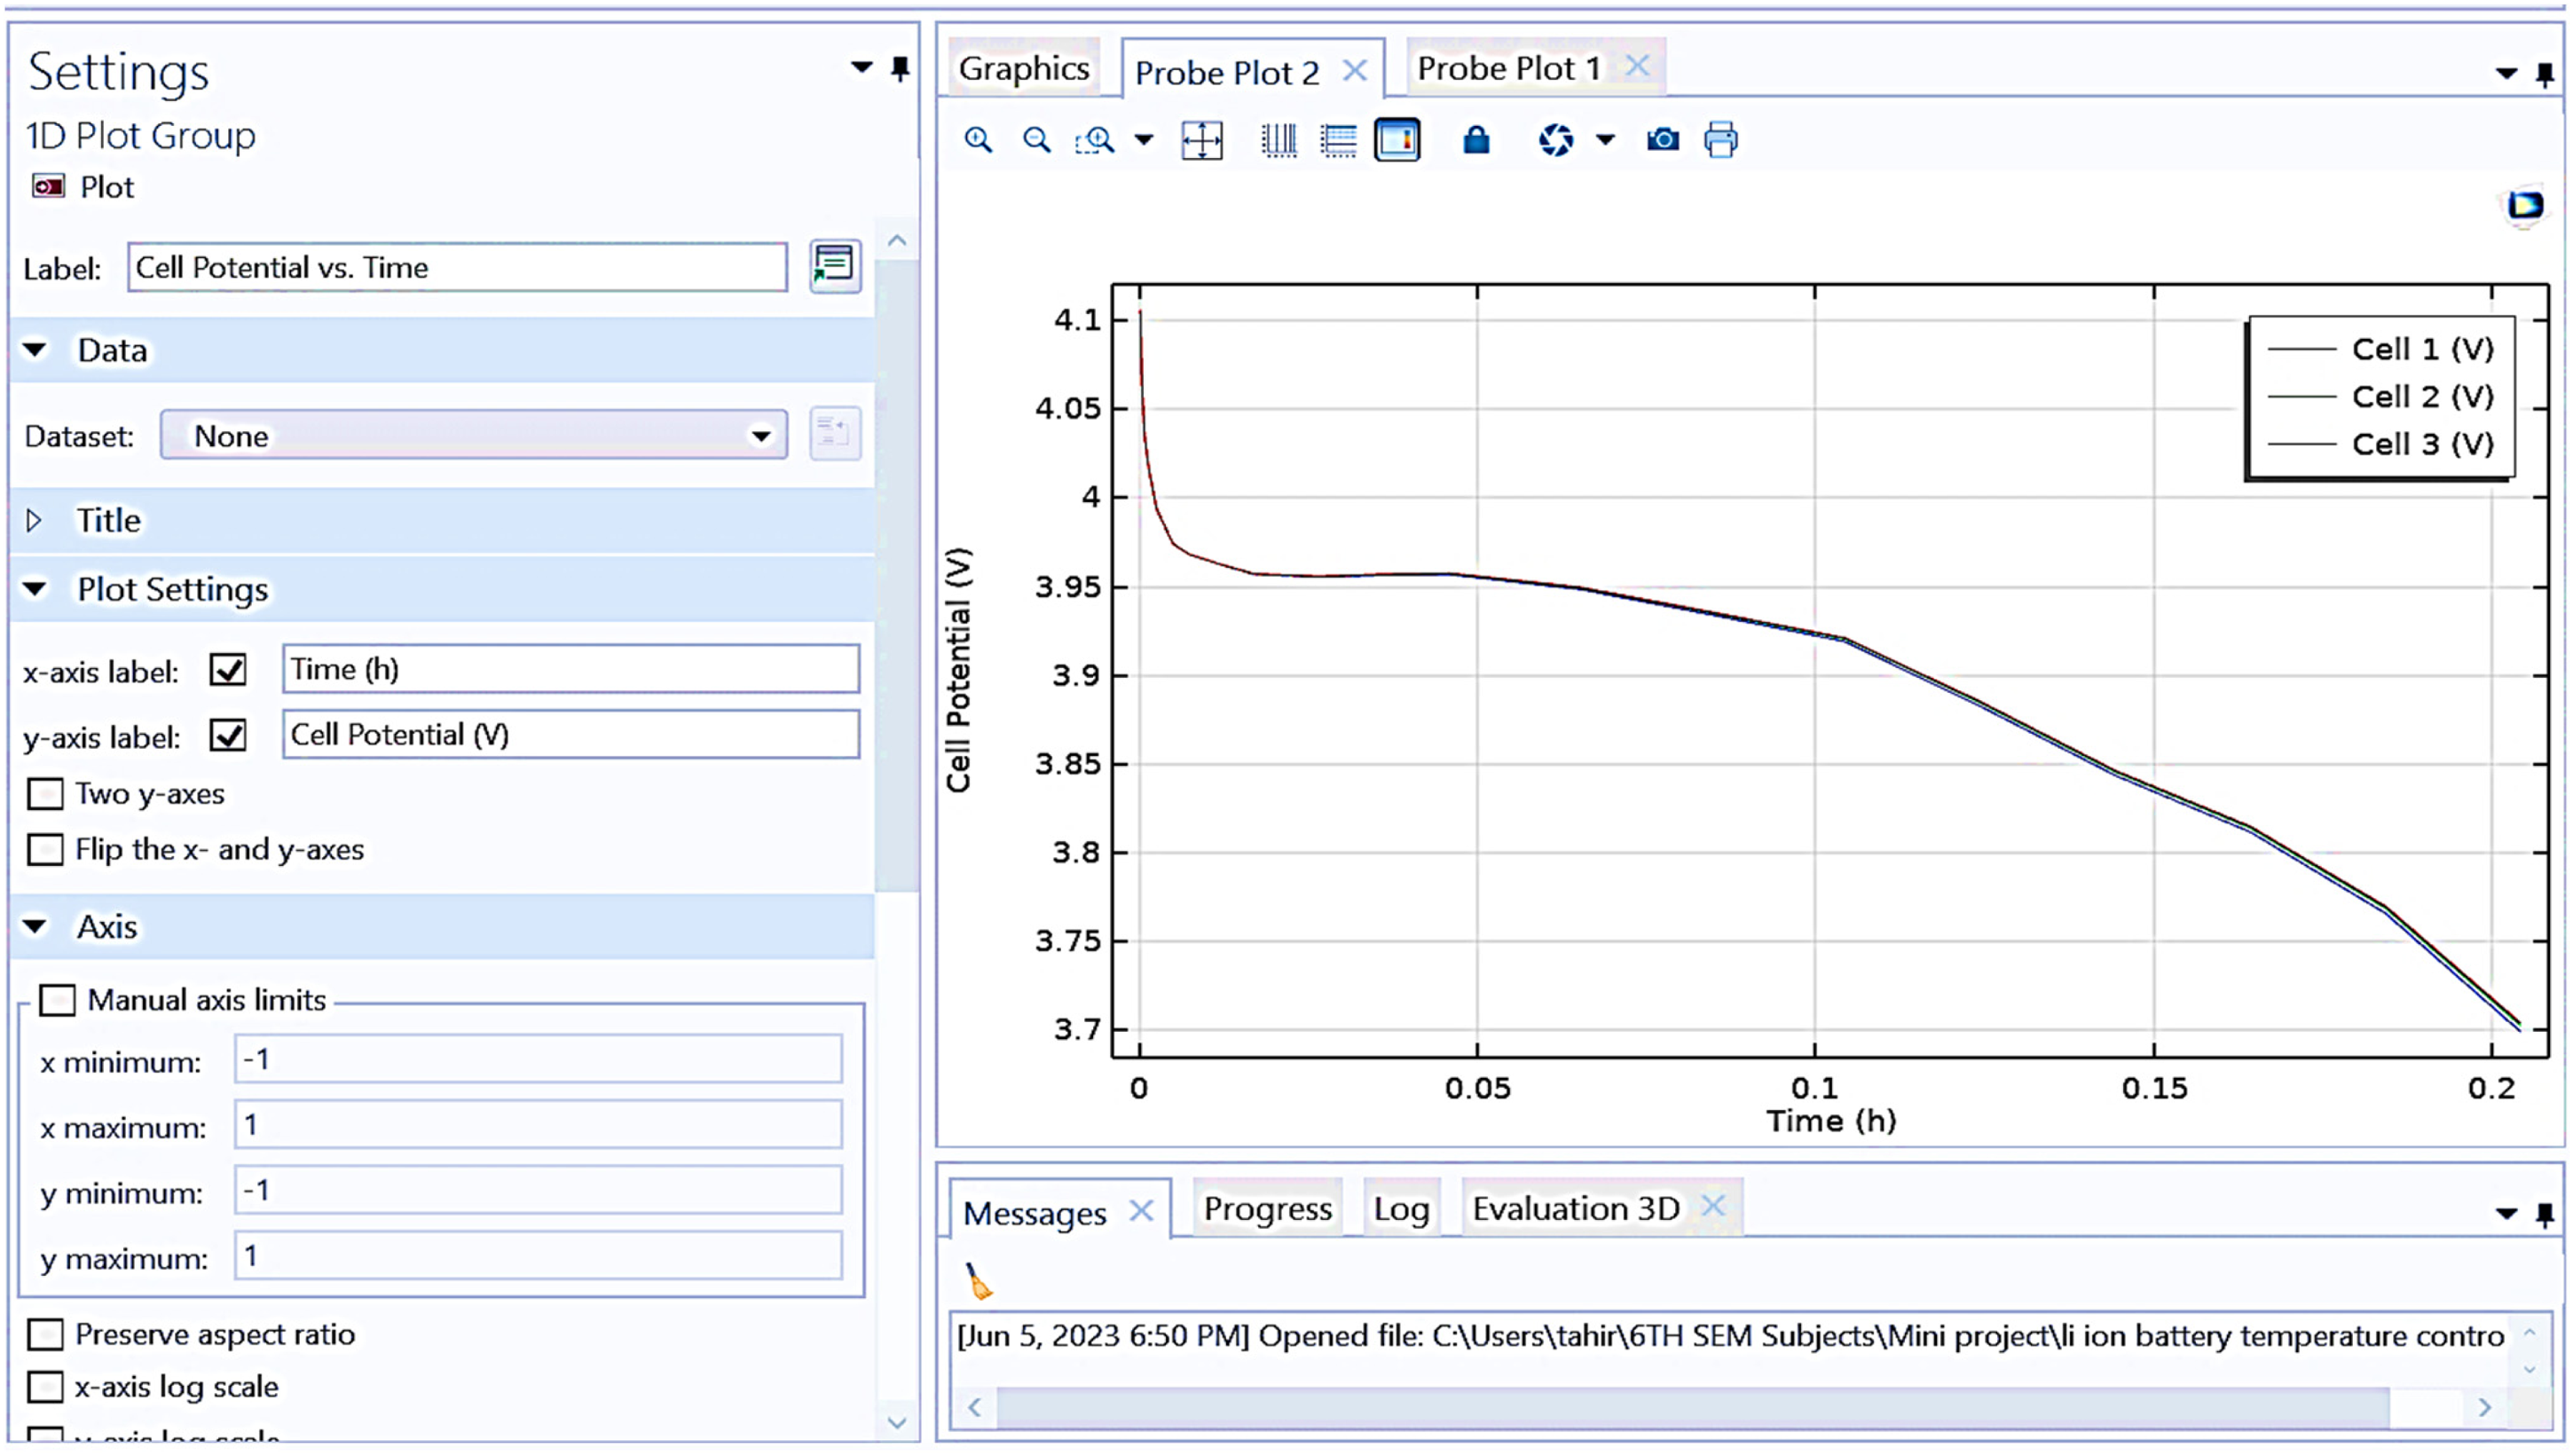
Shows graphical representation between cell potential versus time (h).
The x-axis represents time in hours (h), while the y-axis represents the cell potential in volts (V). The obtained result shows that all three cells start at an initial potential slightly above 4.1 V. All cell have a rapid drop in potential within the first 0.02 h. Following the initial drop, the potentials of the three cells stabilize and then decline gradually over the rest of the period. The potential for all cells remains closely aligned throughout the duration, indicating similar behavior in their discharge profiles. The plot provides a comparative view of the discharge characteristics of the three cells under identical conditions.
Figure 11 displays “cell potential and load vs. time,” showing the relationship between cell voltage, open-circuit cell voltage, and C rate over time.
x-axis (time in seconds): The time duration of the measurement. Primary y-axis (voltage in V): Displays the cell voltage (blue line) and open-circuit cell voltage (green line). Secondary y-axis (C rate): Represents the charge/discharge rate (red line).
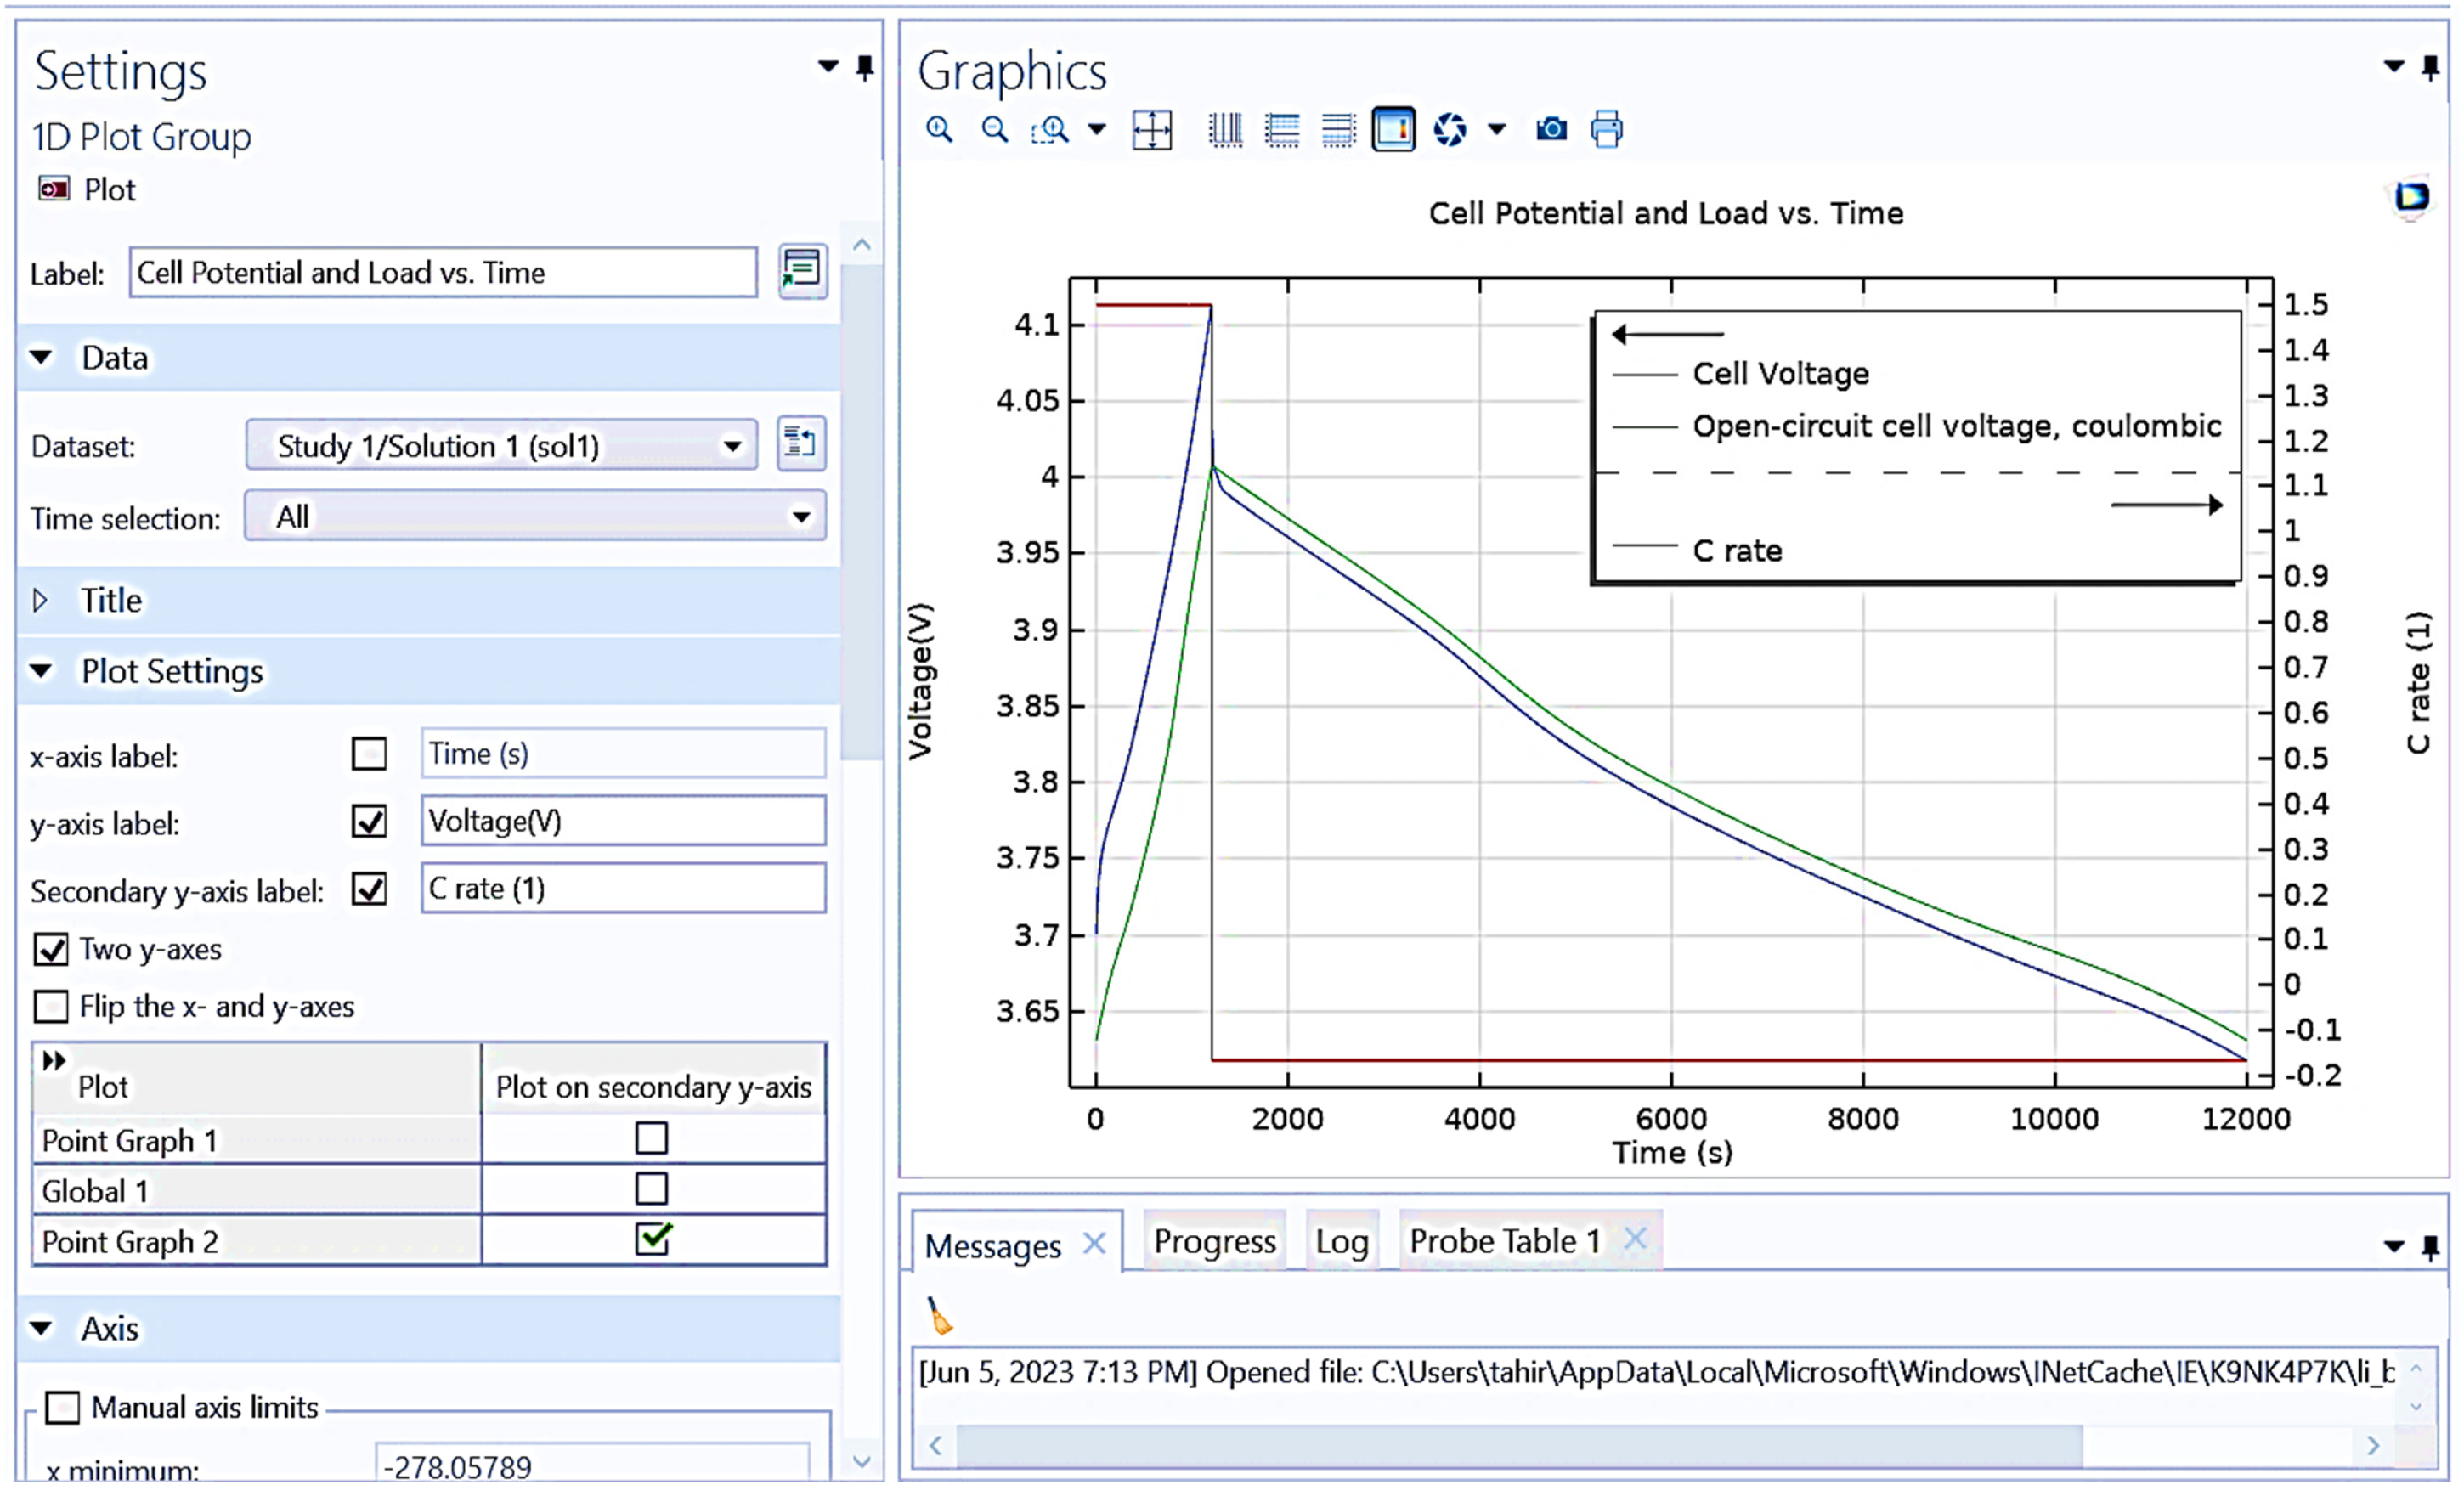
Shows graphical representation between cell potential and load versus time.
It is observed from Figure 11 that initial voltage rise: both the cell voltage and open-circuit cell voltage start slightly below 4.1 V, rapidly increasing to just above 4.1 V. Voltage decline: after peaking, both voltages decrease steadily over time, with the cell voltage showing a slightly higher potential than the open-circuit cell voltage throughout the duration. C rate: The C rate starts at 1.5, drops sharply to zero, and then stabilizes at a constant value slightly below zero for the remainder of the time. This graph effectively illustrates the discharge behavior of the cell under a load, highlighting the differences between loaded and open-circuit conditions, as well as the changes in discharge rate over time.
Figure 12 presents “cell temperatures vs. time” for three cells (Cell 1, Cell 2, and Cell 3). The x-axis represents time in hours (h), and the y-axis represents cell temperature in degrees Celsius. It is observed that the initial temperature of all three cells starts at around 21°C to 22°C. Temperature rise: over 0.2 h, the temperature of all three cells increases steadily. Final temperature: by the end of the period, Cell 1 reaches approximately 36°C, Cell 2 around 35.5°C, and Cell 3 around 35°C. Temperature trends: while all cells show a similar rising trend, there are slight variations in the final temperatures, with Cell 1 being the highest and Cell 3 the lowest. This plot illustrates the heating behavior of the cells under operational conditions, showing a consistent increase in temperature over time with minor differences between the cells.
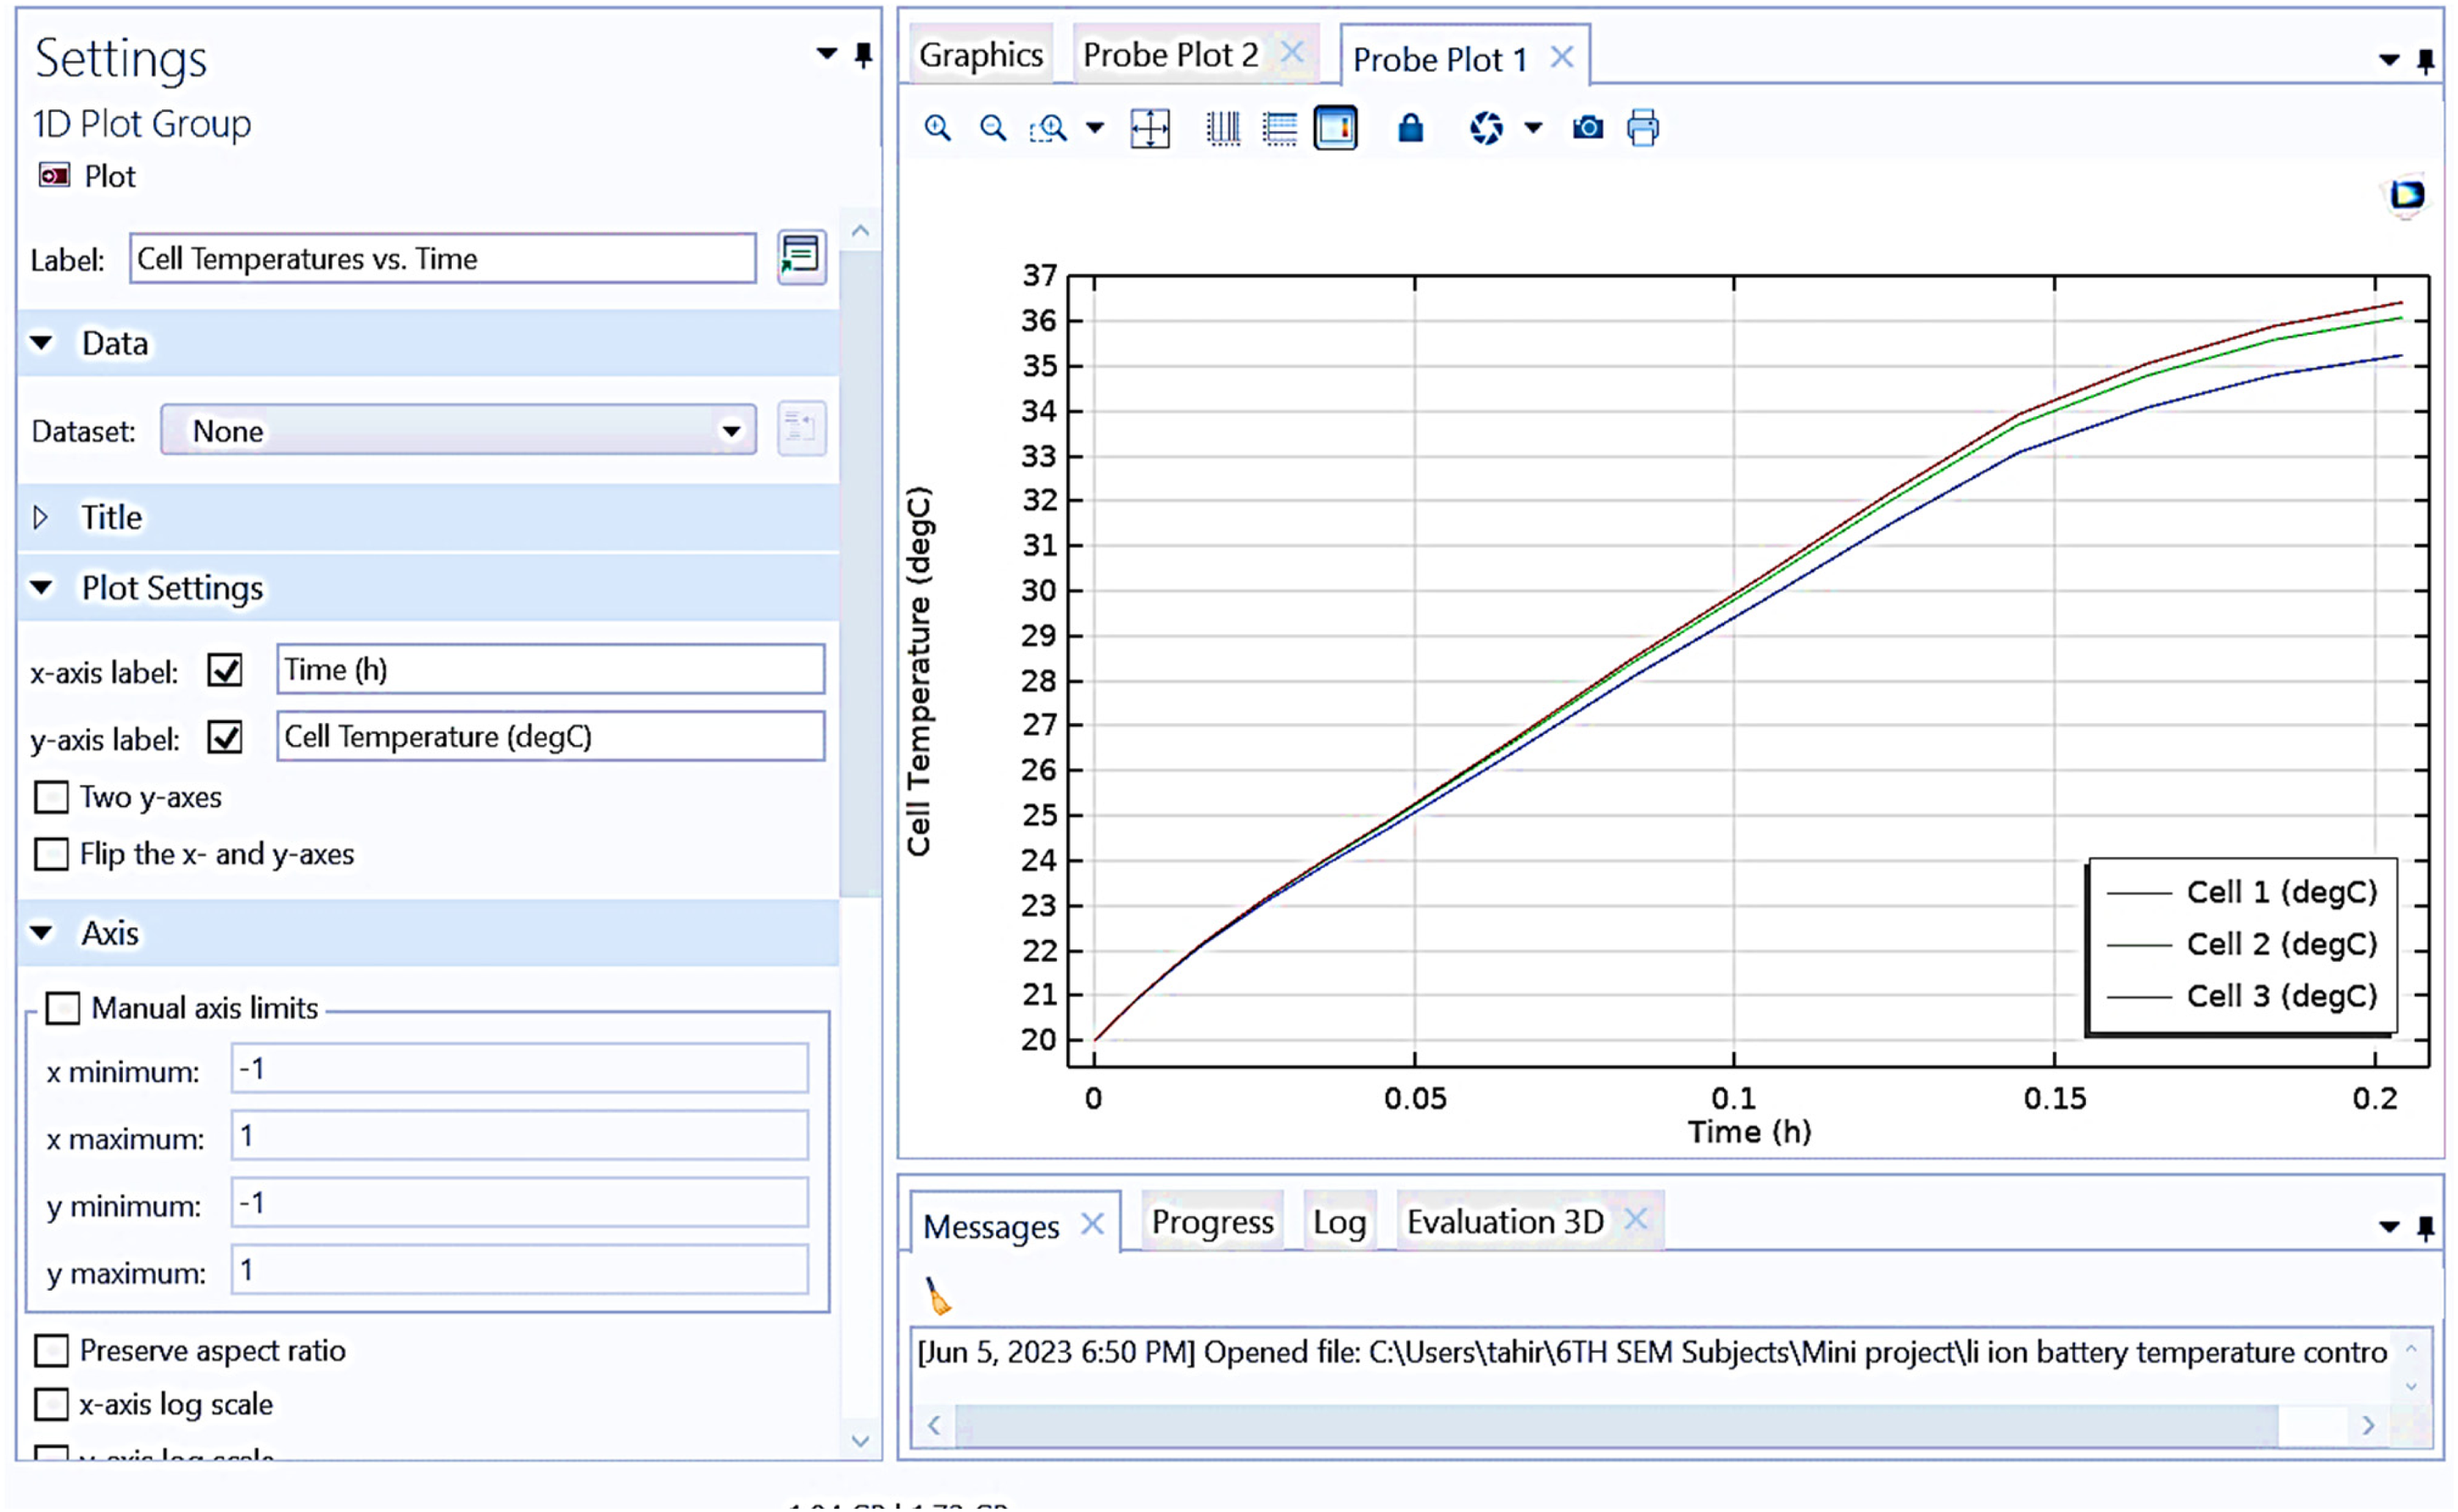
Graphical representation between cell temperatures versus time obtained from COSMOL.
Figure 13 shows a graphical analysis obtained from COMSOL multiphysics, displaying temperature and heat sources versus time. In figure, Time (s) is represented on x-axis, and temperature (°C) and generated heat (W) on the y-axis.
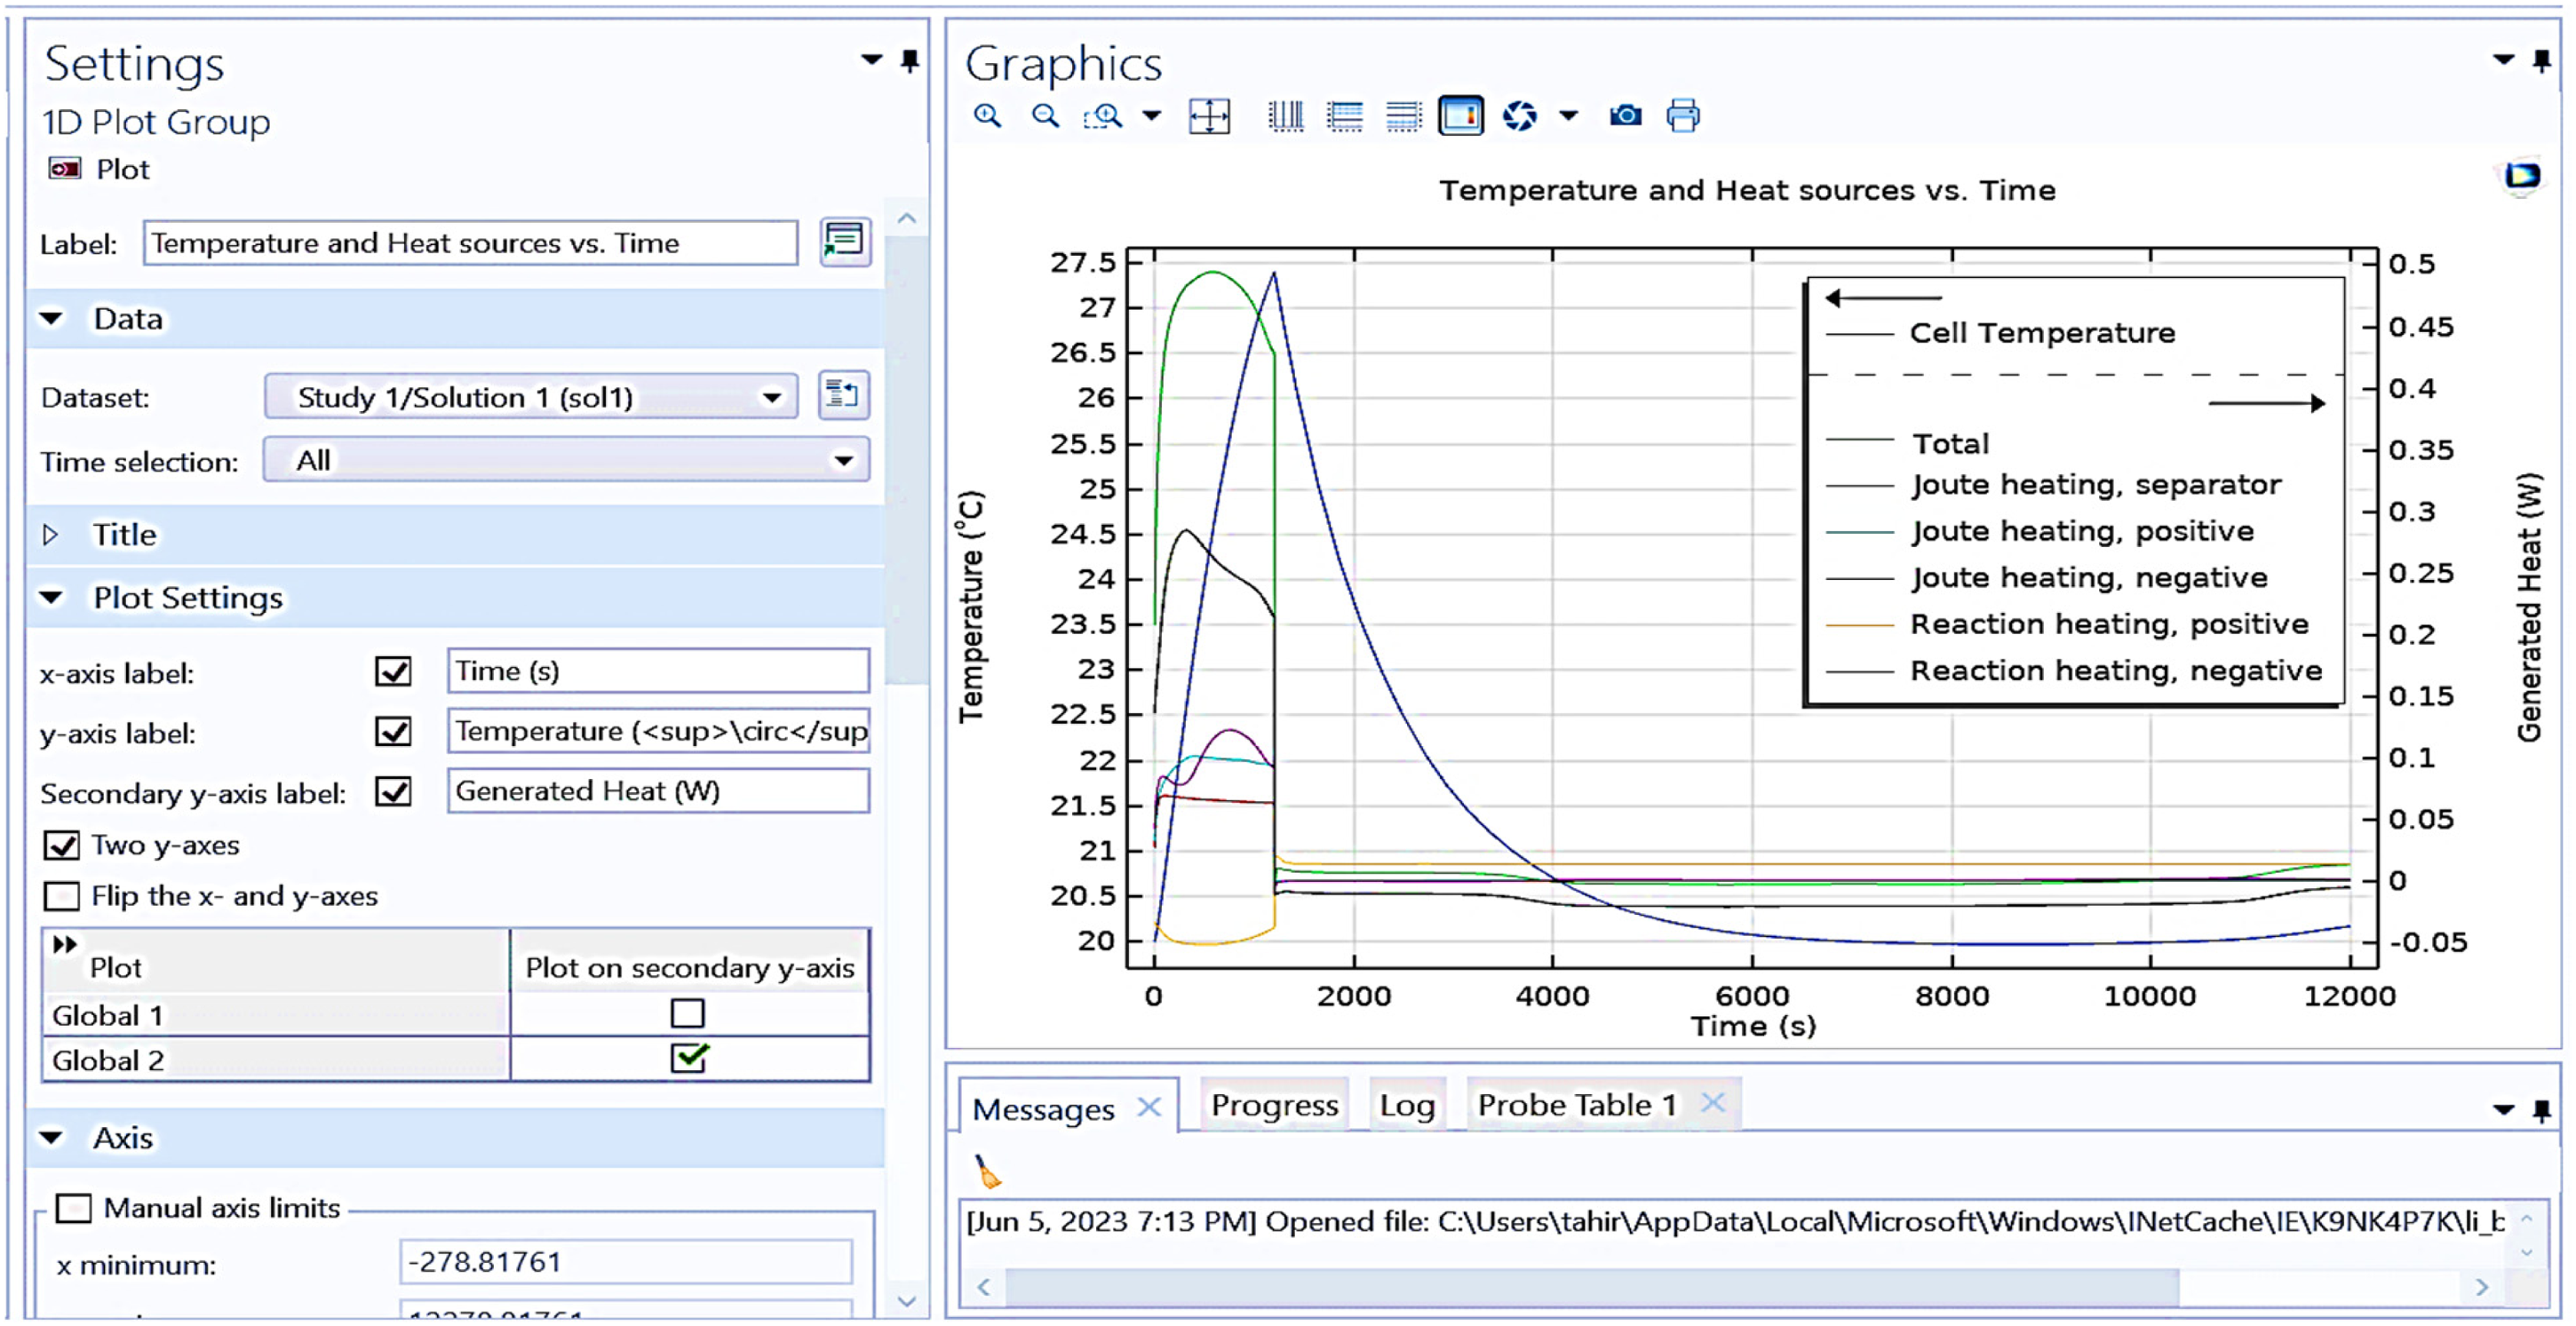
Shows graphical representation between temperature and heat sources versus time.
It is observed from above figure different heat sources and temperature such as cell temperature (dashed line), total heat, joule heating (separator, positive, negative), reaction heating (positive, negative) of battery taken for testing. The temperature curve represents a peak at the start and then a decline over time. The generated heat curves display various sources of heat generation, with individual contributions. The settings panel on the left includes options for configuring the plot, such as selecting the dataset, time selection, and axis labels. The plot demonstrates the dynamic behavior of temperature and heat sources in a system over a simulated period of approximately 12,000 s (3.33 h). It is observed that the temperature rises to 27.5°C at start of the battery charge and gradually reduces the heat generated between battery cells, taking a time interval of 1000 s. If a coolant liquid is passed between the battery cells, the heat will reduce drastically, taking less time.
Figure 14 shows the electrolyte potential distribution versus potential (V) of battery designed in this study. x-axis represents the spatial coordinates, x component (µm) and y-axis represents potential (V). The graph lines represent different phases of charge and discharge of battery such as start of charge (blue line), end of charge (green line), start of discharge (red line), and end of discharge (cyan line) of the battery. The settings panel on the left allows for configuration of the plot, including selecting the dataset, time selection, and axis limits. The plot provides insights into the behavior of the electrode potential during the charge and discharge cycles of the designed battery. It is observed from results that how the potential voltage changes based on the spatial coordinates, x component (µm).
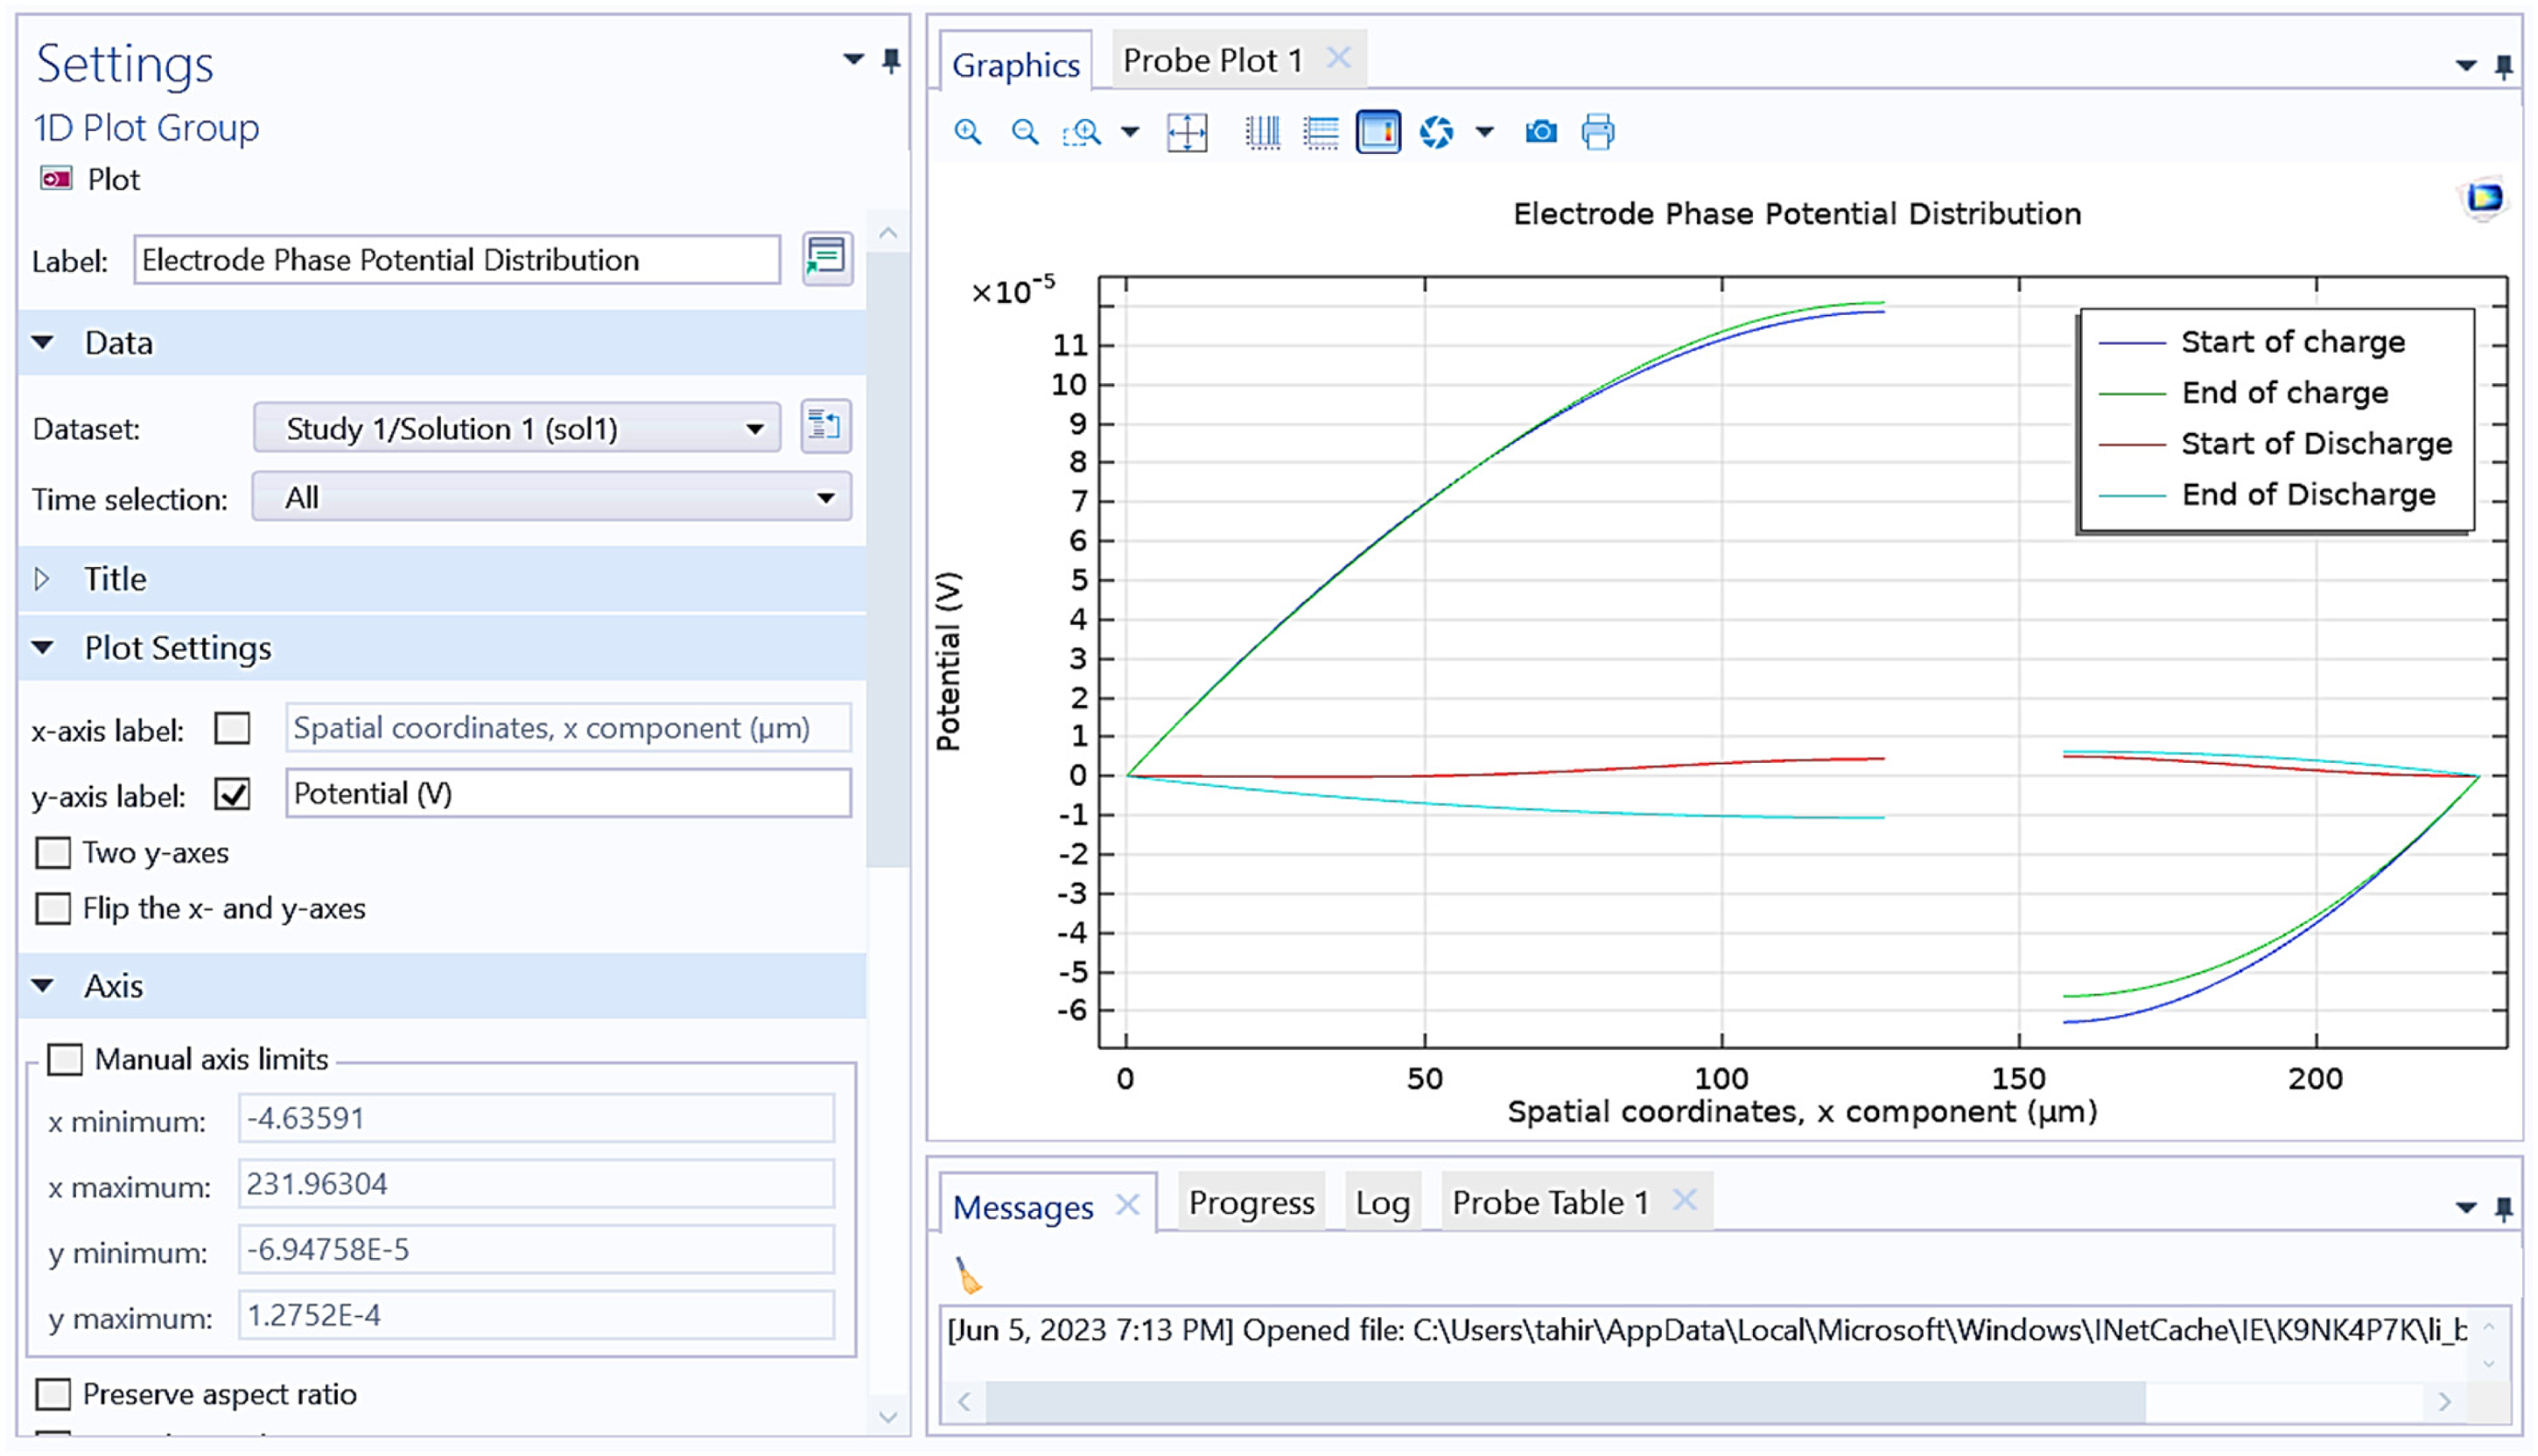
Shows graphical representation between electrolyte potential distribution versus potential (V) of battery.
Figure 15 shows the state of charge (SOC) plot versus time. In this plot, the x-axis represents time in seconds (s), and the y-axis represents the state of charge (SOC), which is a dimensionless quantity typically ranging from 0 to 1 (or 0% to 100%). The plot characteristics represent that the SOC starts at approximately 0.25 at 0 s. The SOC increases linearly, reaching its peak value of around 0.75 at approximately 2000 s. After reaching the peak, the SOC decreases linearly back down to approximately 0.25 by around 10,000 s. The manual axis limits in the plot are considered custom manual axis limits set for both the x and y axes. The x-axis ranges from approximately −244.71761 to 12,244.71761 s. The y-axis ranges from approximately 0.23199 to 0.76796. This plot likely represents a charging and discharging cycle of a battery over time, showing how the SOC changes during these processes. It is observed from the plot that the SOC of the battery reaching 75% takes a time of 1000 s and gradually drops based on the load connected to the battery. The SOD is maintained for the proposed battery up to 25%.
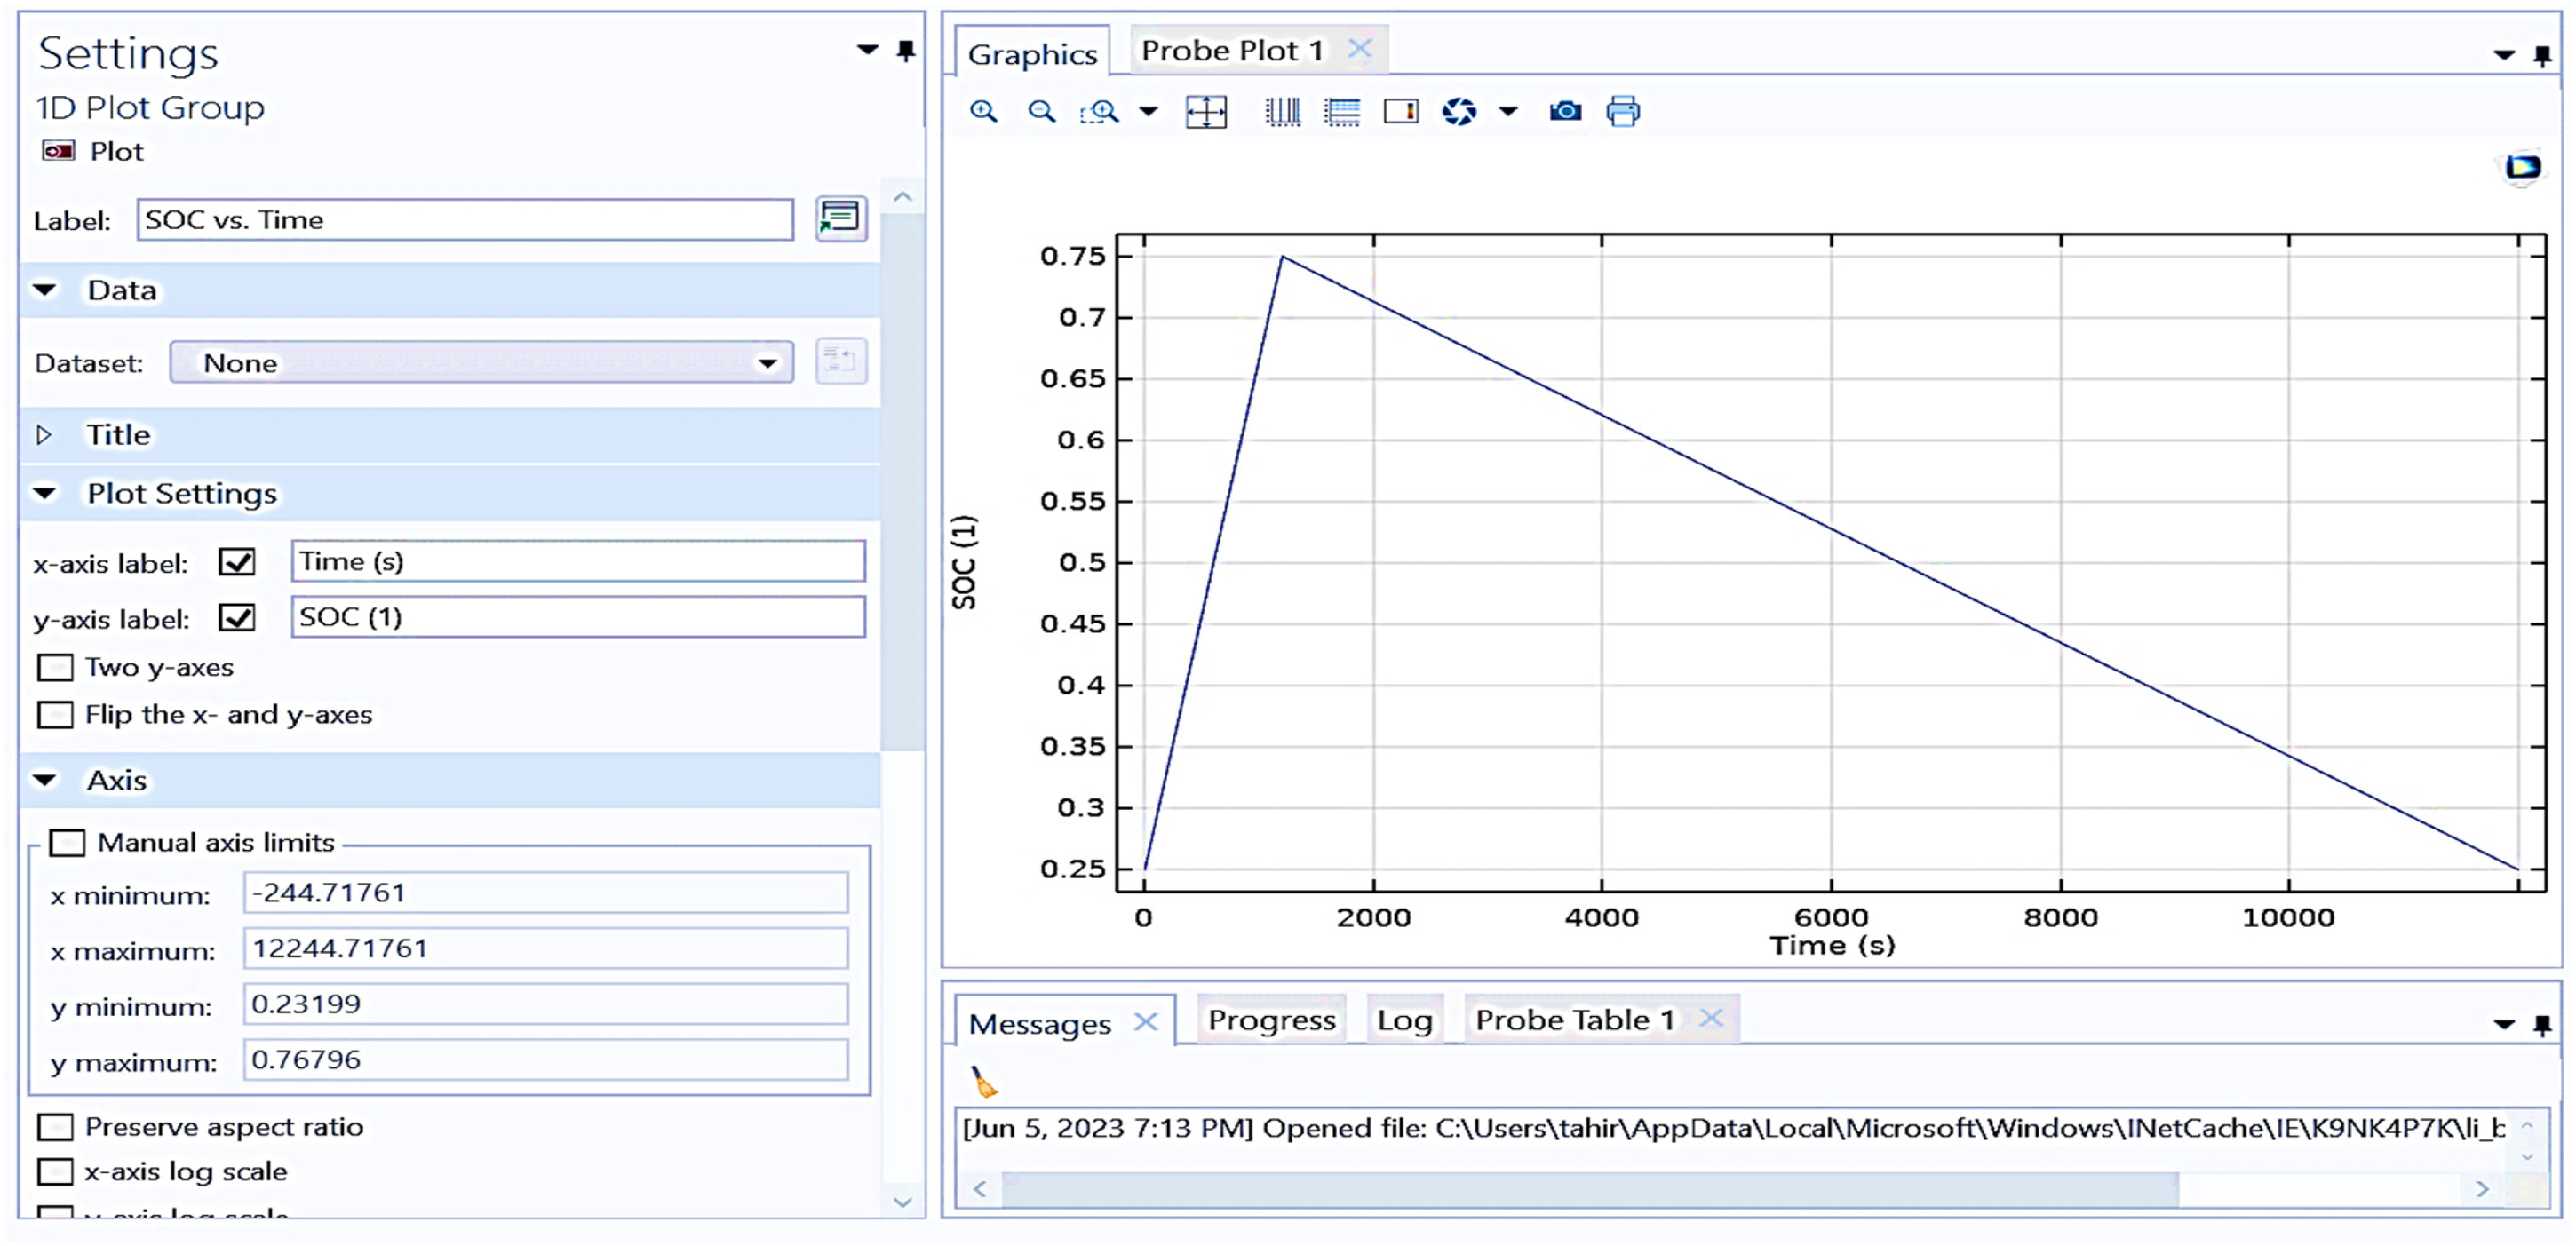
Shows graphical representation between SOC versus time (S).
Thermography of battery pack
Thermography is a noncontact diagnostic technique that utilizes IR imaging to detect and visualize temperature distributions across a surface. When applied to battery packs, thermography is crucial in monitoring and maintaining battery health, safety, and performance.
➢ Temperature monitoring:
Uniformity: Ensuring uniform temperature distribution across the battery pack helps prevent thermal runaway and prolongs battery life. Hot spots detection: Identifying areas with abnormally high temperatures can indicate potential failures or inefficiencies, such as internal short circuits, overcharging, or excessive resistance. ➢ Safety:
Early detection of failures: Thermography allows for early identification of thermal anomalies, enabling preventative measures before a catastrophic failure occurs. Preventing thermal runaway: By monitoring temperatures in real time, thermography can help prevent thermal runaway, a dangerous situation where increased temperatures lead to further heat generation, potentially causing fires or explosions. ➢ Performance optimization:
Balancing cell temperatures: Maintaining balanced temperatures across all cells in a battery pack ensures optimal performance and efficiency. Improving cooling systems: Thermographic data can be used to design and optimize cooling systems, ensuring that all parts of the battery pack remain within safe operating temperatures. ➢ Maintenance and diagnostics:
Predictive maintenance: Regular thermographic inspections can predict and prevent failures, reducing downtime and maintenance costs. Quality control: During manufacturing, thermography ensures that all battery packs meet thermal performance standards before deployment.
Thermography is an essential tool for the thermal management of battery packs. Providing real-time temperature data enhances the safety, reliability, and performance of batteries across various applications. Regular thermographic inspections are integral to the proactive maintenance and optimal functioning of battery systems. The hardware setup of the proposed model shown in Figure 16 consists of the following components: heat exchanger (center): made of copper tubes arranged in a rectangular array to dissipate heat effectively. Cooling liquid container (bottom): a labeled container (“water ethylene glycol”) holds the cooling liquid. Pump (bottom right): circulates the cooling liquid through the system. Control electronics (center top): includes a digital temperature controller to monitor and regulate the system. Wiring and switches: various wires connect the components, and a switch is visible to turn the system on and off. Fan (top right): provides additional airflow for heat dissipation.
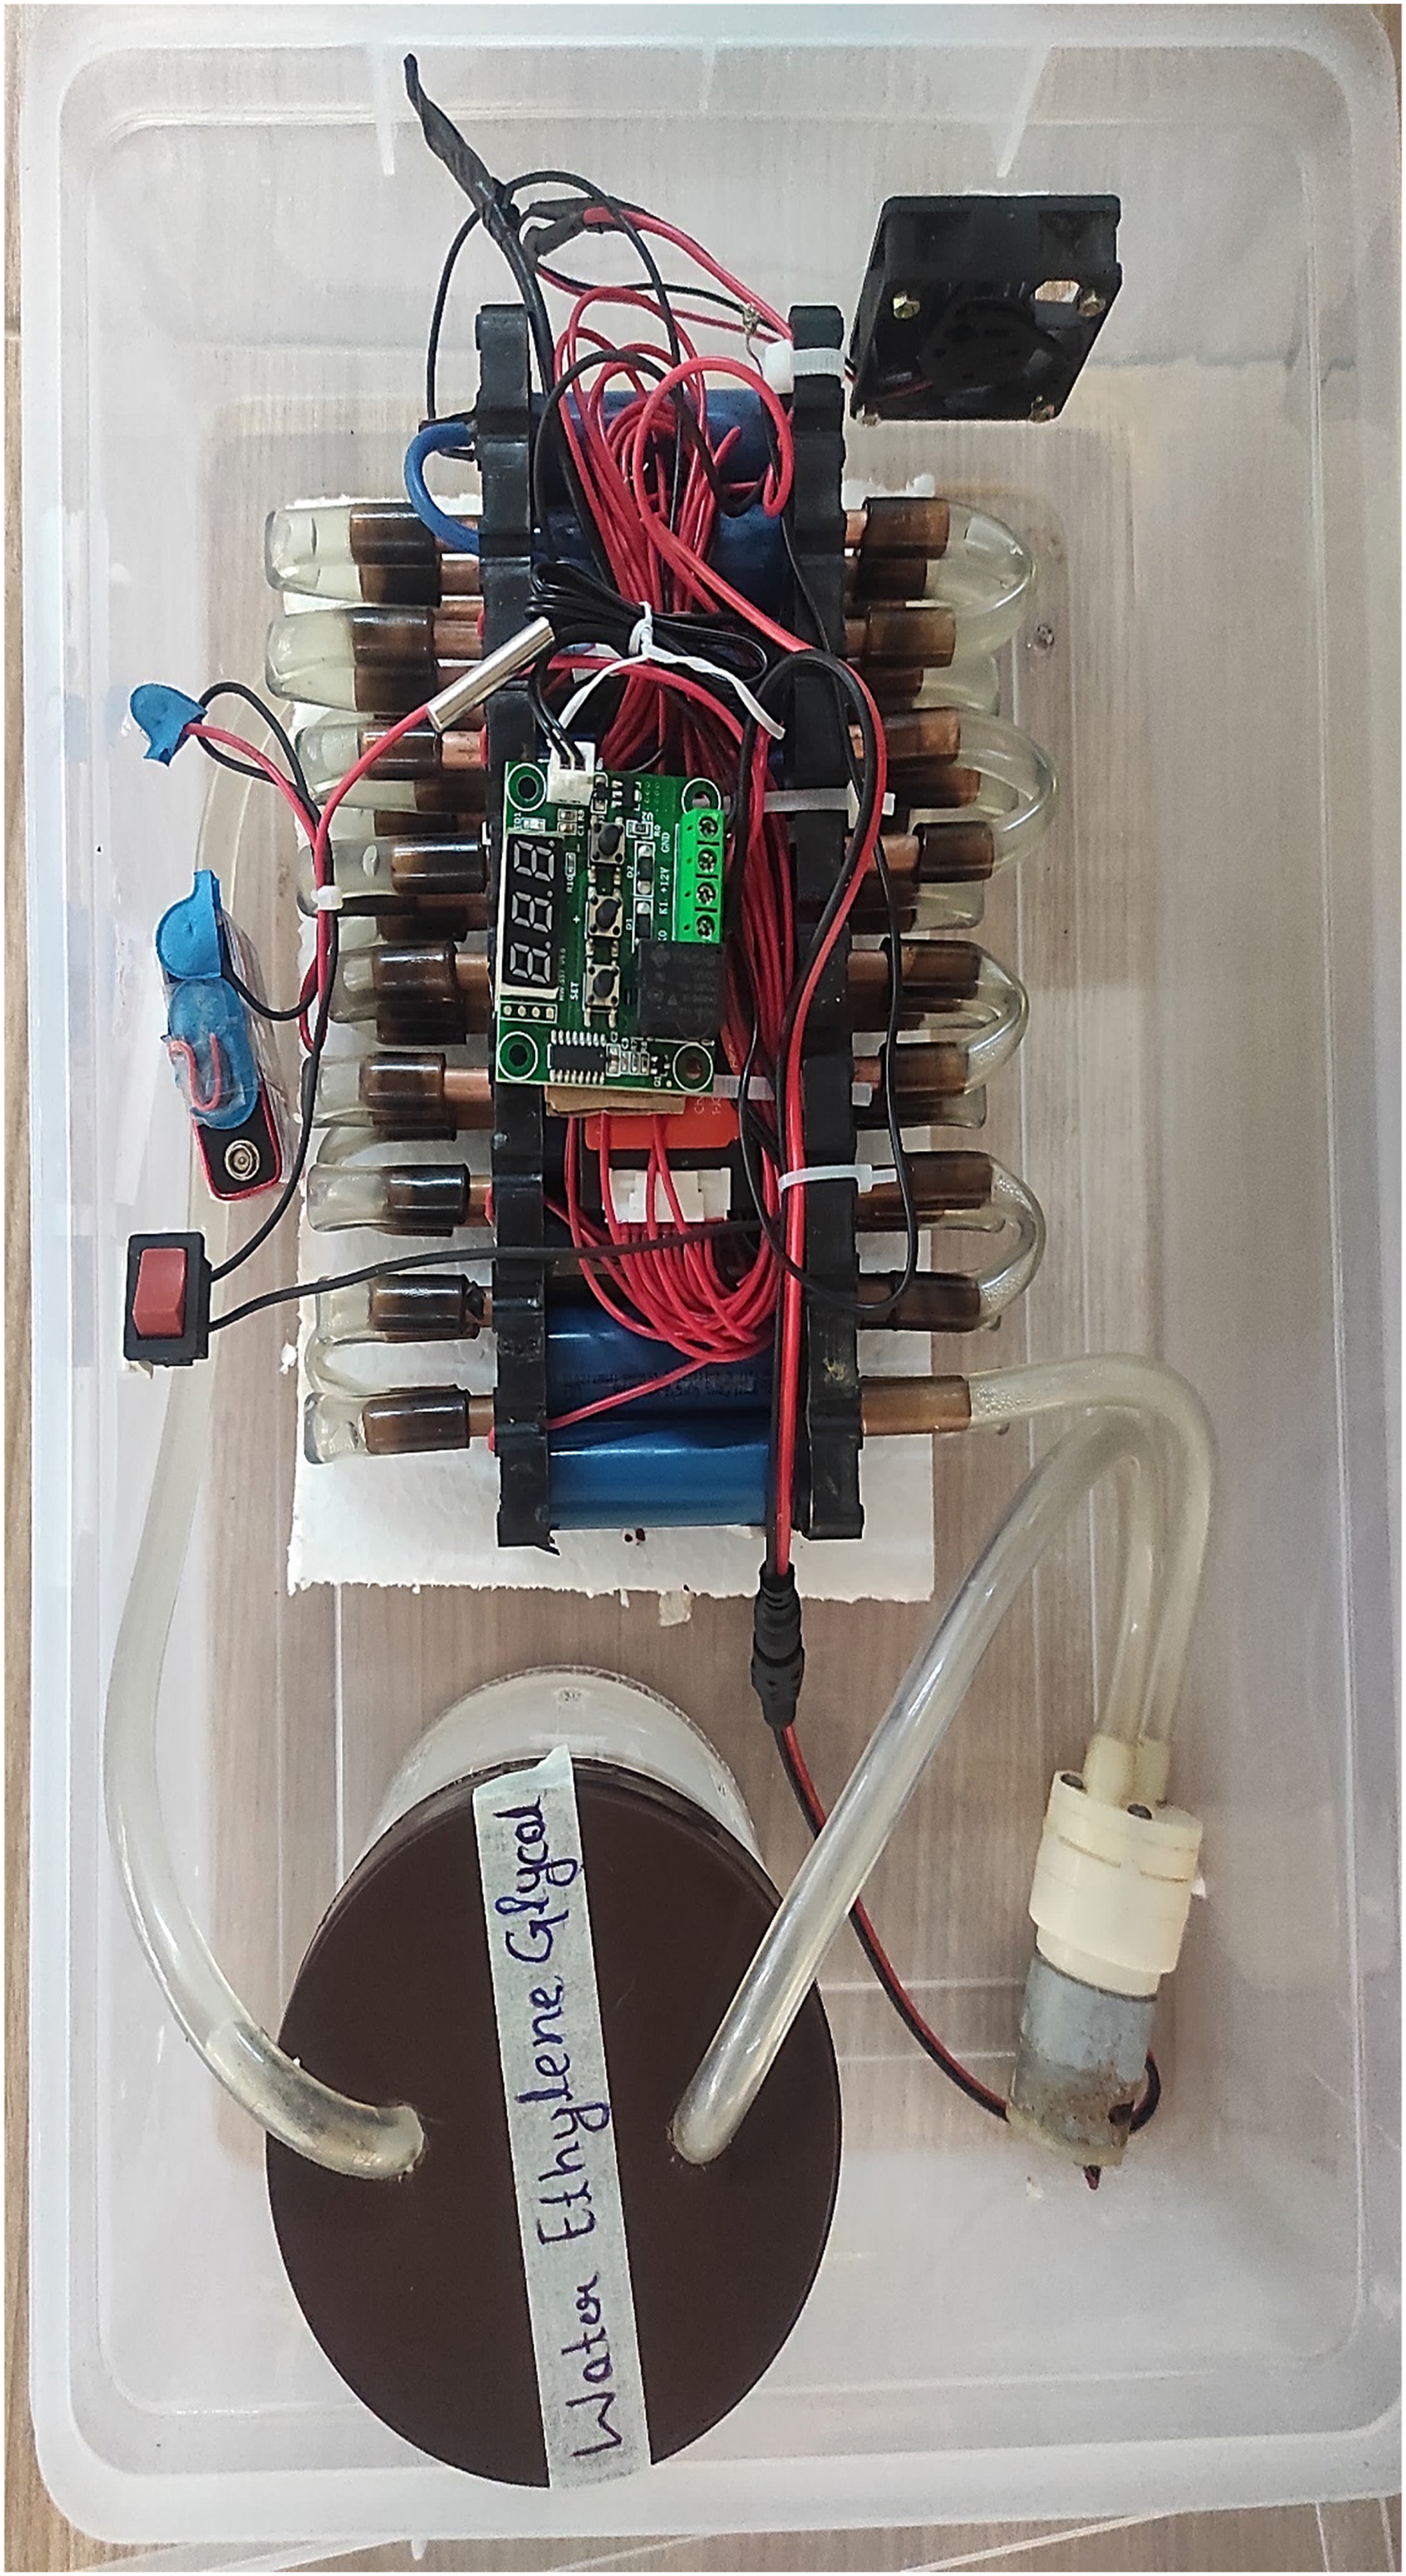
Hardware setup of proposed battery management system with cooling liquid.
Implementation of lithium-ion battery pack hardware system
Water ethylene glycol mixtures is taken as liquid cooling for battery pack designed in this work. The following are the parameters considered in this work.
Price:- 40–100 Rs
Melting point:- 12.9c
PH level:- 5–8
Structural formula:- C2H6O2
Molecular formula:- C2H6O2
Purity:- 99%
Solvability:- water
EINECS NO:- 203–473-3
Molecular weight:- 62.068 grams.
Appearance:- Water white to light yellow clear liquid.
Storage:- Room temperature.
Shelf life:- 2 years
Physical form:- Liquid
Raw material:- Ethylene, oxide
Purity (%):- 97% min
Best before:- 1 year
The properties of water ethylene glycol mixtures make them ideal for use as antifreeze or heat transfer fluids, such as in our GlycoChill + E-series heat transfer fluids. The following are the chemical and physical properties of water ethylene glycol. Water and ethylene glycol possess an innate liquid appearance and exhibit transparency. Conversely, if the heat transfer fluid is colored in compliance with industry standards, such as the GlycoChill + ‘E’ series, the resulting mixture will be pink. There is a possibility that it has a slightly pleasant scent. At all concentrations, ethylene glycol is entirely soluble in water. In a glycol/water mixture, the burst point is consistently lower than the freeze point. Ethylene surpasses propylene glycol in terms of viscosity, specific heat, freeze point, and thermal conductivity. However, it should be noted that ethylene is a marine pollutant and poses a considerable toxicity hazard if ingested. Thermal conductivity refers to the speed at which heat is transferred through a medium, such as a combination of ethylene glycol and water.
Increased concentrations of ethylene glycol in a water solution will result in reduced heat conduction due to the superior thermal conductivity of water, which is considered the benchmark. The concentration of ethylene glycol in a mixture decreases as its heat conductivity improves. It seems like you meant to say “ethylene glycol.” Ethylene glycol is a liquid commonly utilized in freezing and antifreeze solutions. It is colorless and odorless and has a sweet taste. According to the literature, the cooling system can be used as either an active or passive cooling system. The basic design of the passive systems allows them to remove heat in common situations with minimal vigor. The active systems have exceptional thermal performance in challenging conditions to maintain the battery temperature within the designated range.
Research has been done on combining passive and active cooling systems to maximize each system's advantages. The thermoelectric, forced air, and liquid cooling schemes are integrated into the BTMS to manage the thermal single-cell Li-ion battery activity (battery rechargeable cell 18,650, 3.7 V, 5.0 Ah). With the thermoelectric cooler, which used water as a coolant, the cell's surface temperature dropped from 55°C to 12°C. presented a BTMS that cools the LiFePO4 battery (16 V and 20 Ah) by building a copper tube connected to silicon cold plates. The authors contrasted this cooling system that discharges heat at a pace of 5°C over six cycles using silicon cold plates combined with air induced convection. They employ water as a means of cooling. Furthermore, distinct airflow velocities ranging from 2.0 to 10.0 m/s were utilized. Three distinct airflow velocities—6.0, 8.0, and 10 mL/s—have been used throughout the cooling process. Additionally, the researchers looked at flow rate in two dimensions in various orientations.
In this case study, LIBs with a capacity of 260 mAh, voltage of 3.7 V, and energy capacity of 9.62 Wh were used for battery thermal investigation. Li-ion batteries are a type of rechargeable battery that store energy by allowing Li + ions to move back and forth across electronically conducting materials. LIBs offer superior specific energy, increased energy density, enhanced energy efficiency, extended cycle life, and longer calendar life in comparison to conventional rechargeable batteries. LIBs can be manufactured to achieve either an optimal power density or energy density. The predominant battery types employed in portable electronic devices are lithium polymer batteries, which utilize polymer gel as the electrolyte, graphite as the anode, and lithium cobalt oxide (LiCoO2) as the cathode material. When these materials are mixed, they exhibit a high energy density. The two compounds mentioned are lithium manganese oxide (LiMn) and lithium iron phosphate (LiFePO4).
The process of experimental works done in this study is as follows:
IR sensor: Captures emitted heat from the battery. Temperature calculation: Using IR data to calculate surface temperature based on Planck's law. Emissivity adjustment: Adjusts settings for accurate readings, considering the battery's material. Thermal image display: Converts IR data into a thermal image or temperature reading. This allows the camera to identify temperature hotspots, helping detect issues like overheating or failing battery cells (https://unitestinst.com/wp-content/uploads/2021/11/TIS20.pdf).
Without load and water ethylene glycol
The TiS20+ MAX IR camera from Fluke, with a sensor resolution of 120 × 90 pixels, captured an image on April 16, 2024, at 2:40:23 PM from a distance of 1 m. This camera, identified by serial number TiS20+ MAX-21080031, is suitable for detailed thermal imaging, aiding diagnostics and maintenance by providing accurate temperature measurements and thermal profiles. The TiS20+ MAX-21080031 camera measures the batteries thermal temperature by detecting IR radiation emitted from the battery's surface as depicted in Figure 17. The specifications and details of an IR camera used for thermographic analysis in this work are as follows:
TiS20+ MAX-21080031 Fluke infrared camera.
Camera specifications:
Camera model: TiS20+ MAX
The TiS20+ MAX is a specific model of IR camera designed for thermal imaging applications. IR sensor size: 120 × 90
The sensor size of 120 × 90 pixels indicates the resolution of the IR images captured by the camera. This resolution provides detailed thermal images sufficient for various diagnostic purposes. Camera serial number: TiS20+ MAX-21080031
The serial number uniquely identifies this specific unit of the TiS20+ MAX model, allowing for traceability and service records (https://www.fluke.com/en-in/product/thermal-cameras/tis20plus). Camera manufacturer: Fluke
Fluke is a well-known manufacturer of electronic test tools and software, renowned for producing reliable and high-quality IR cameras.
Image time: April 16, 2024, 2:40:23 PM
The timestamp indicates when the thermal image was captured, essential for correlating the thermal data with specific events or conditions. Distance to target: 1.00 m
The distance from the camera to the target is 1 m. This distance is important for interpreting the thermal data accurately, as the distance can affect the apparent temperature readings due to factors like emissivity and atmospheric conditions.
Table 3 provides the measured results for considered battery design without load and water ethylene glycol using a Fluke TiS20+ MAX IR camera. Figure 18 provides the detailed experimental temperature measurements and related parameters resulting in values for a specific area and points on the surface of a battery pack designed using a Fluke IR camera.
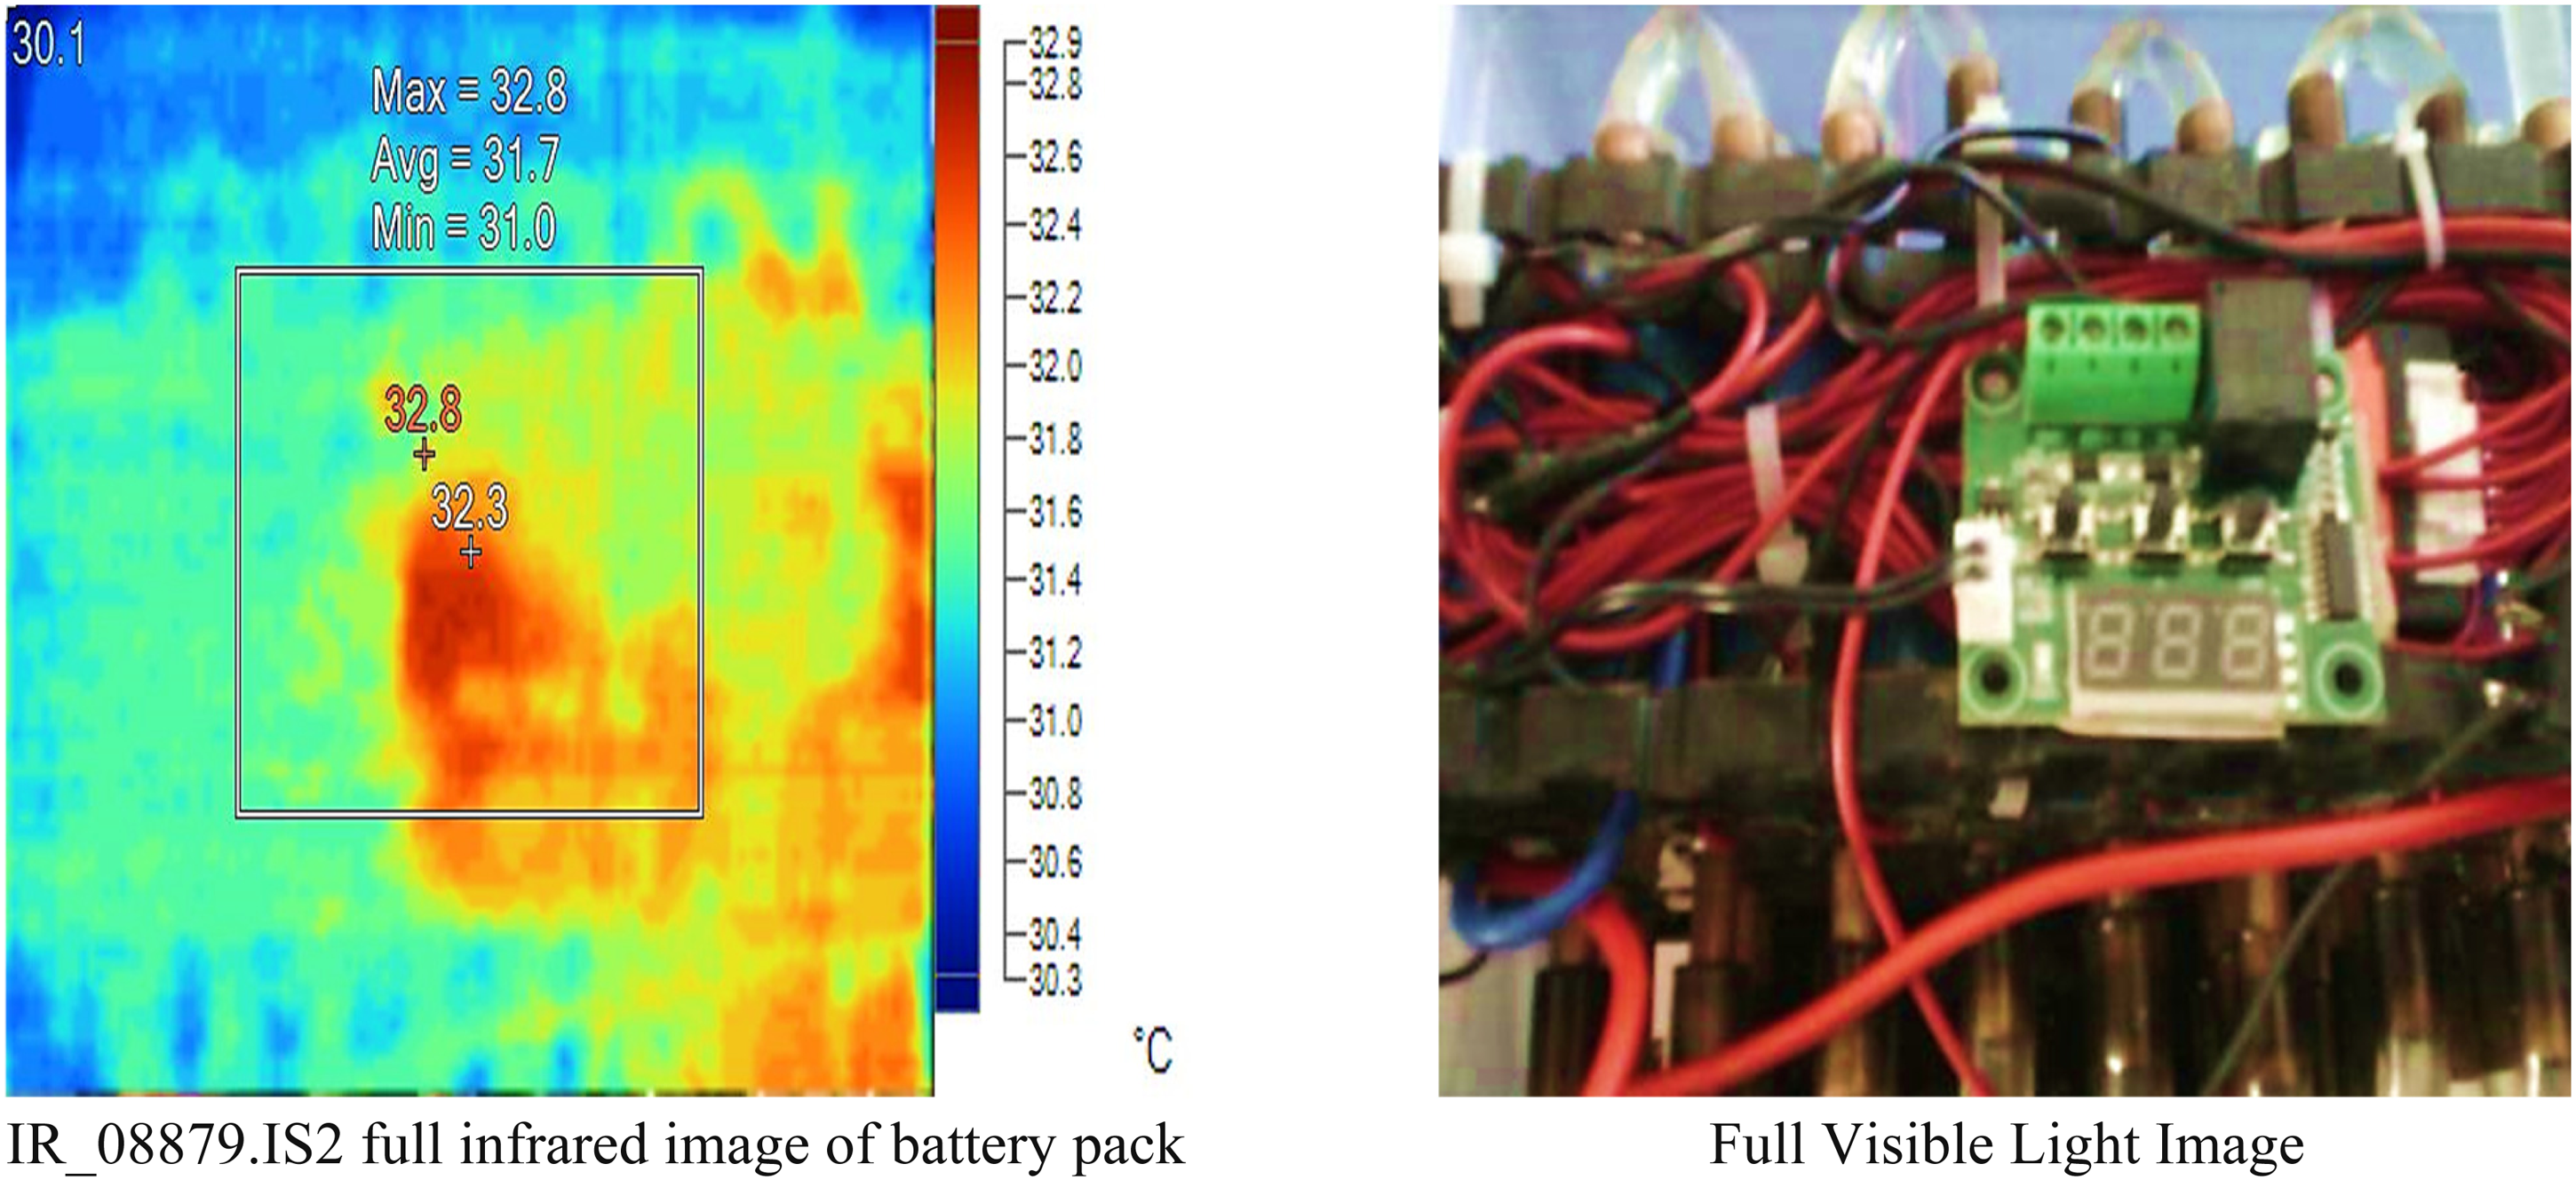
Results of proposed battery pack without load connected, and water ethylene glycol.
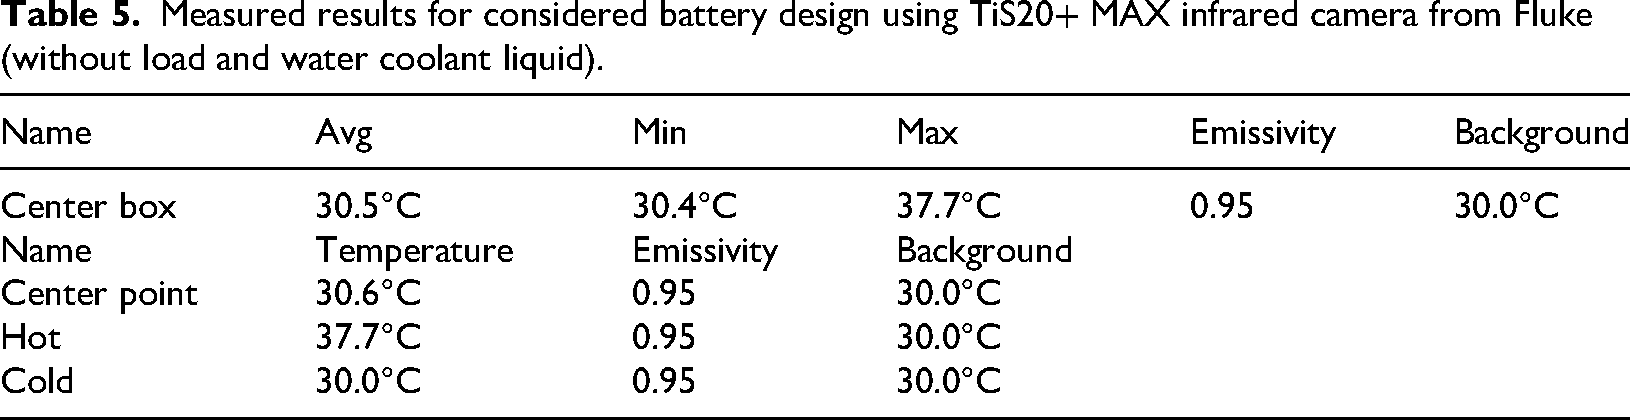
Measured results for considered battery design using TiS20+ MAX infrared camera from Fluke (without load and water ethylene glycol).
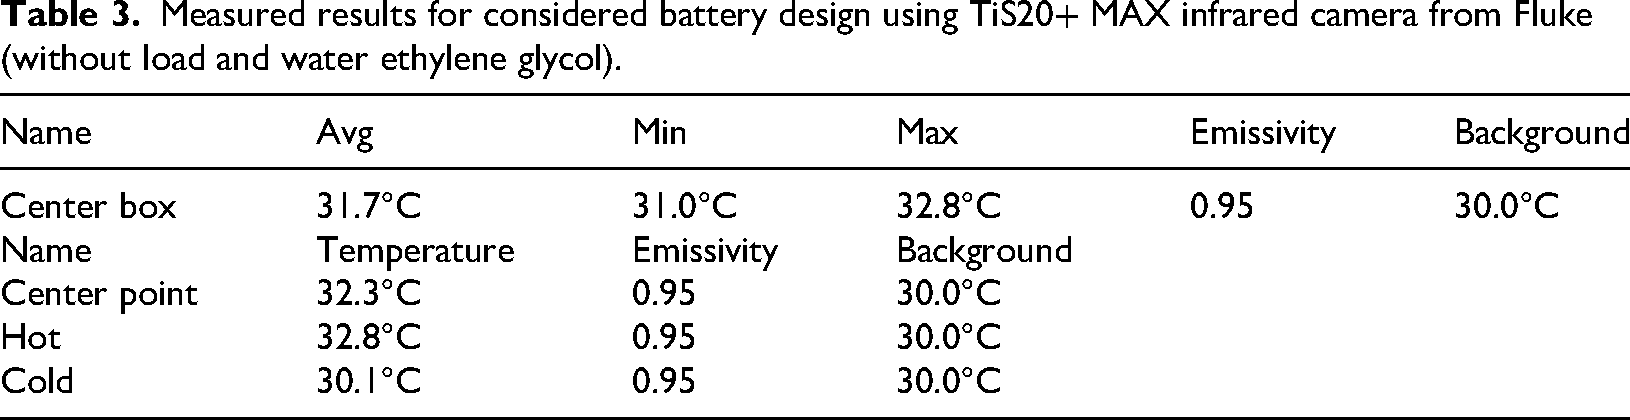
The center box shows a relatively narrow temperature range with an average temperature of 31.7°C, suggesting uniform heating or cooling within this area. The center point has a slightly higher temperature (32.3°C) compared to the average temperature of the center box. The hot point is identified at 32.8°C, which is the maximum temperature observed within the center box. The cold point has the lowest temperature at 30.1°C, indicating some degree of temperature variation within the observed area.
The emissivity is consistently set at 0.95 for all measurements, indicating a uniform surface characteristic. The background temperature is maintained at 30.0°C, providing a reference for the measurements.
With load and water ethylene glycol
Table 4 provides the measured results for battery design considered with load and water ethylene glycol using TiS20+ MAX IR camera from Fluke.
Measured results for considered battery design using TiS20+ MAX infrared camera from Fluke (with load and water ethylene glycol).
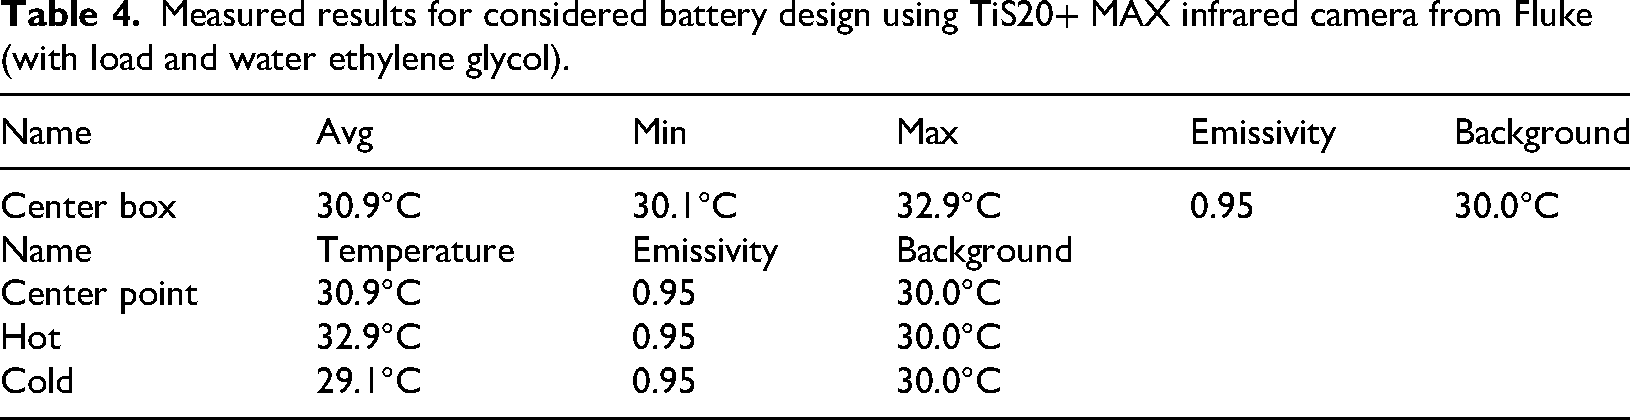
The obtained detailed temperature measurements and related parameters for a specific area and points on a surface of the battery pack are shown in Figure 19.
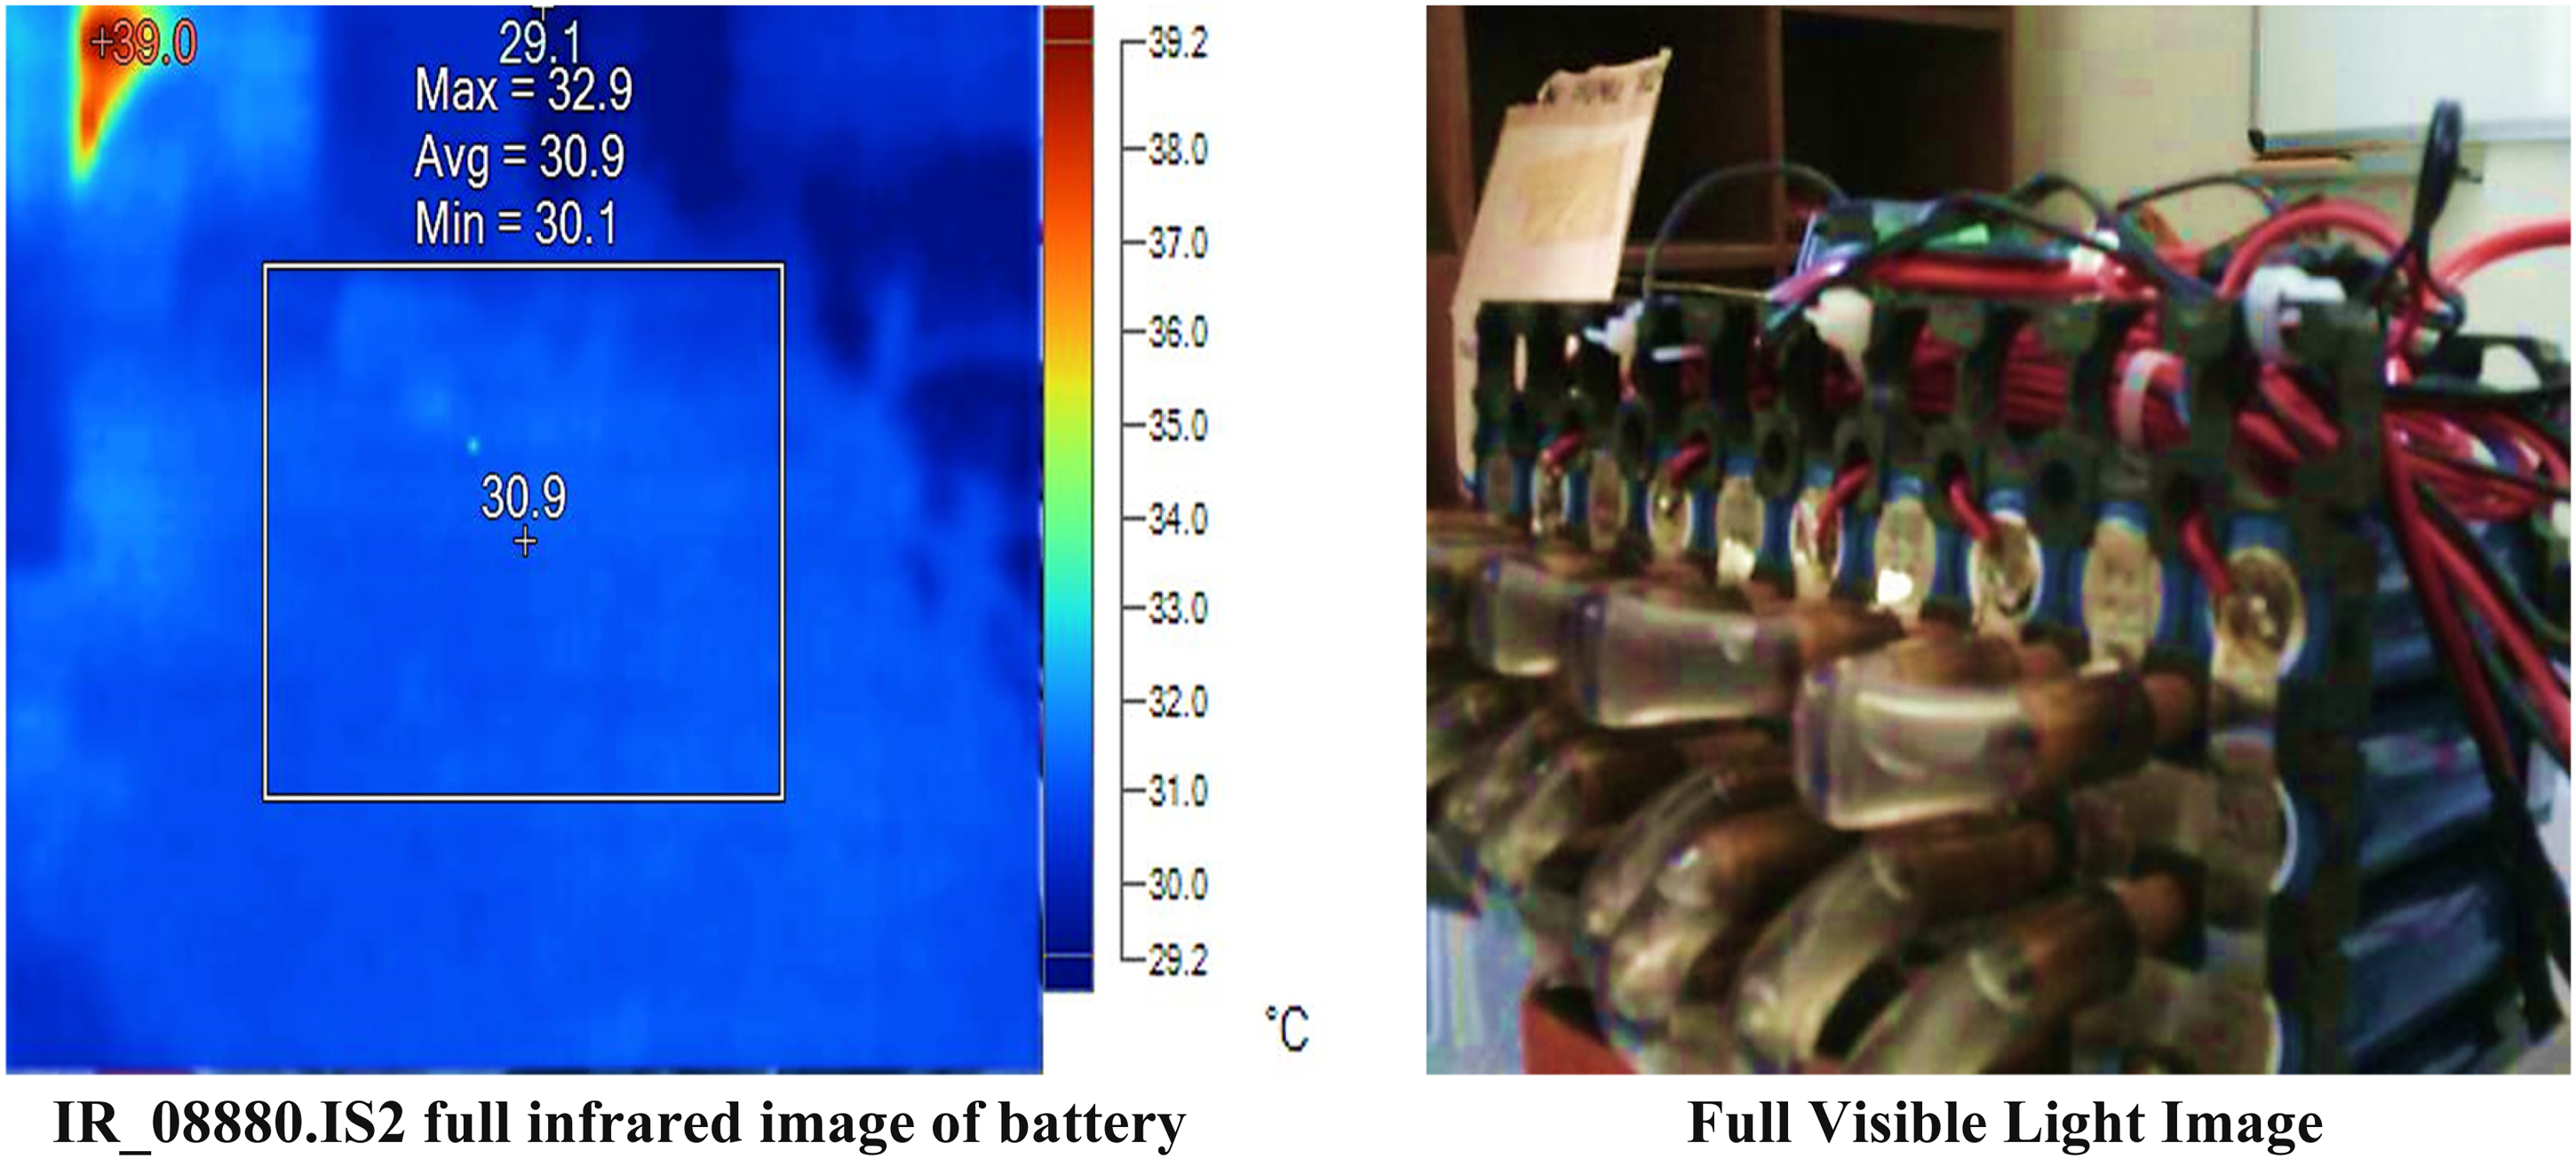
Results of proposed battery management system with load, and water ethylene glycol.
The center box displays a temperature range from 30.1°C to 32.9°C, with an average of 30.9°C. This indicates a relatively stable temperature distribution within this area, though there are some variations. The center point has a temperature equal to the average temperature of the center box (30.9°C), suggesting it is representative of the overall temperature in this region. The hot point is significantly higher at 32.90°C, indicating a localized hot spot within the observed area. The cold point is the lowest recorded temperature at 29.1°C, showing some areas are cooler than the average.
The emissivity is consistently set at 0.95 for all measurements, suggesting a uniform surface characteristic. The background temperature is maintained at 30.0°C, providing a consistent reference for the measurements.
Without load and water coolant liquid
Table 5 provides the obtained measured results for considered battery design pack without load, and water coolant liquid using a TiS20+ MAX IR camera.
Measured results for considered battery design using TiS20+ MAX infrared camera from Fluke (without load and water coolant liquid).
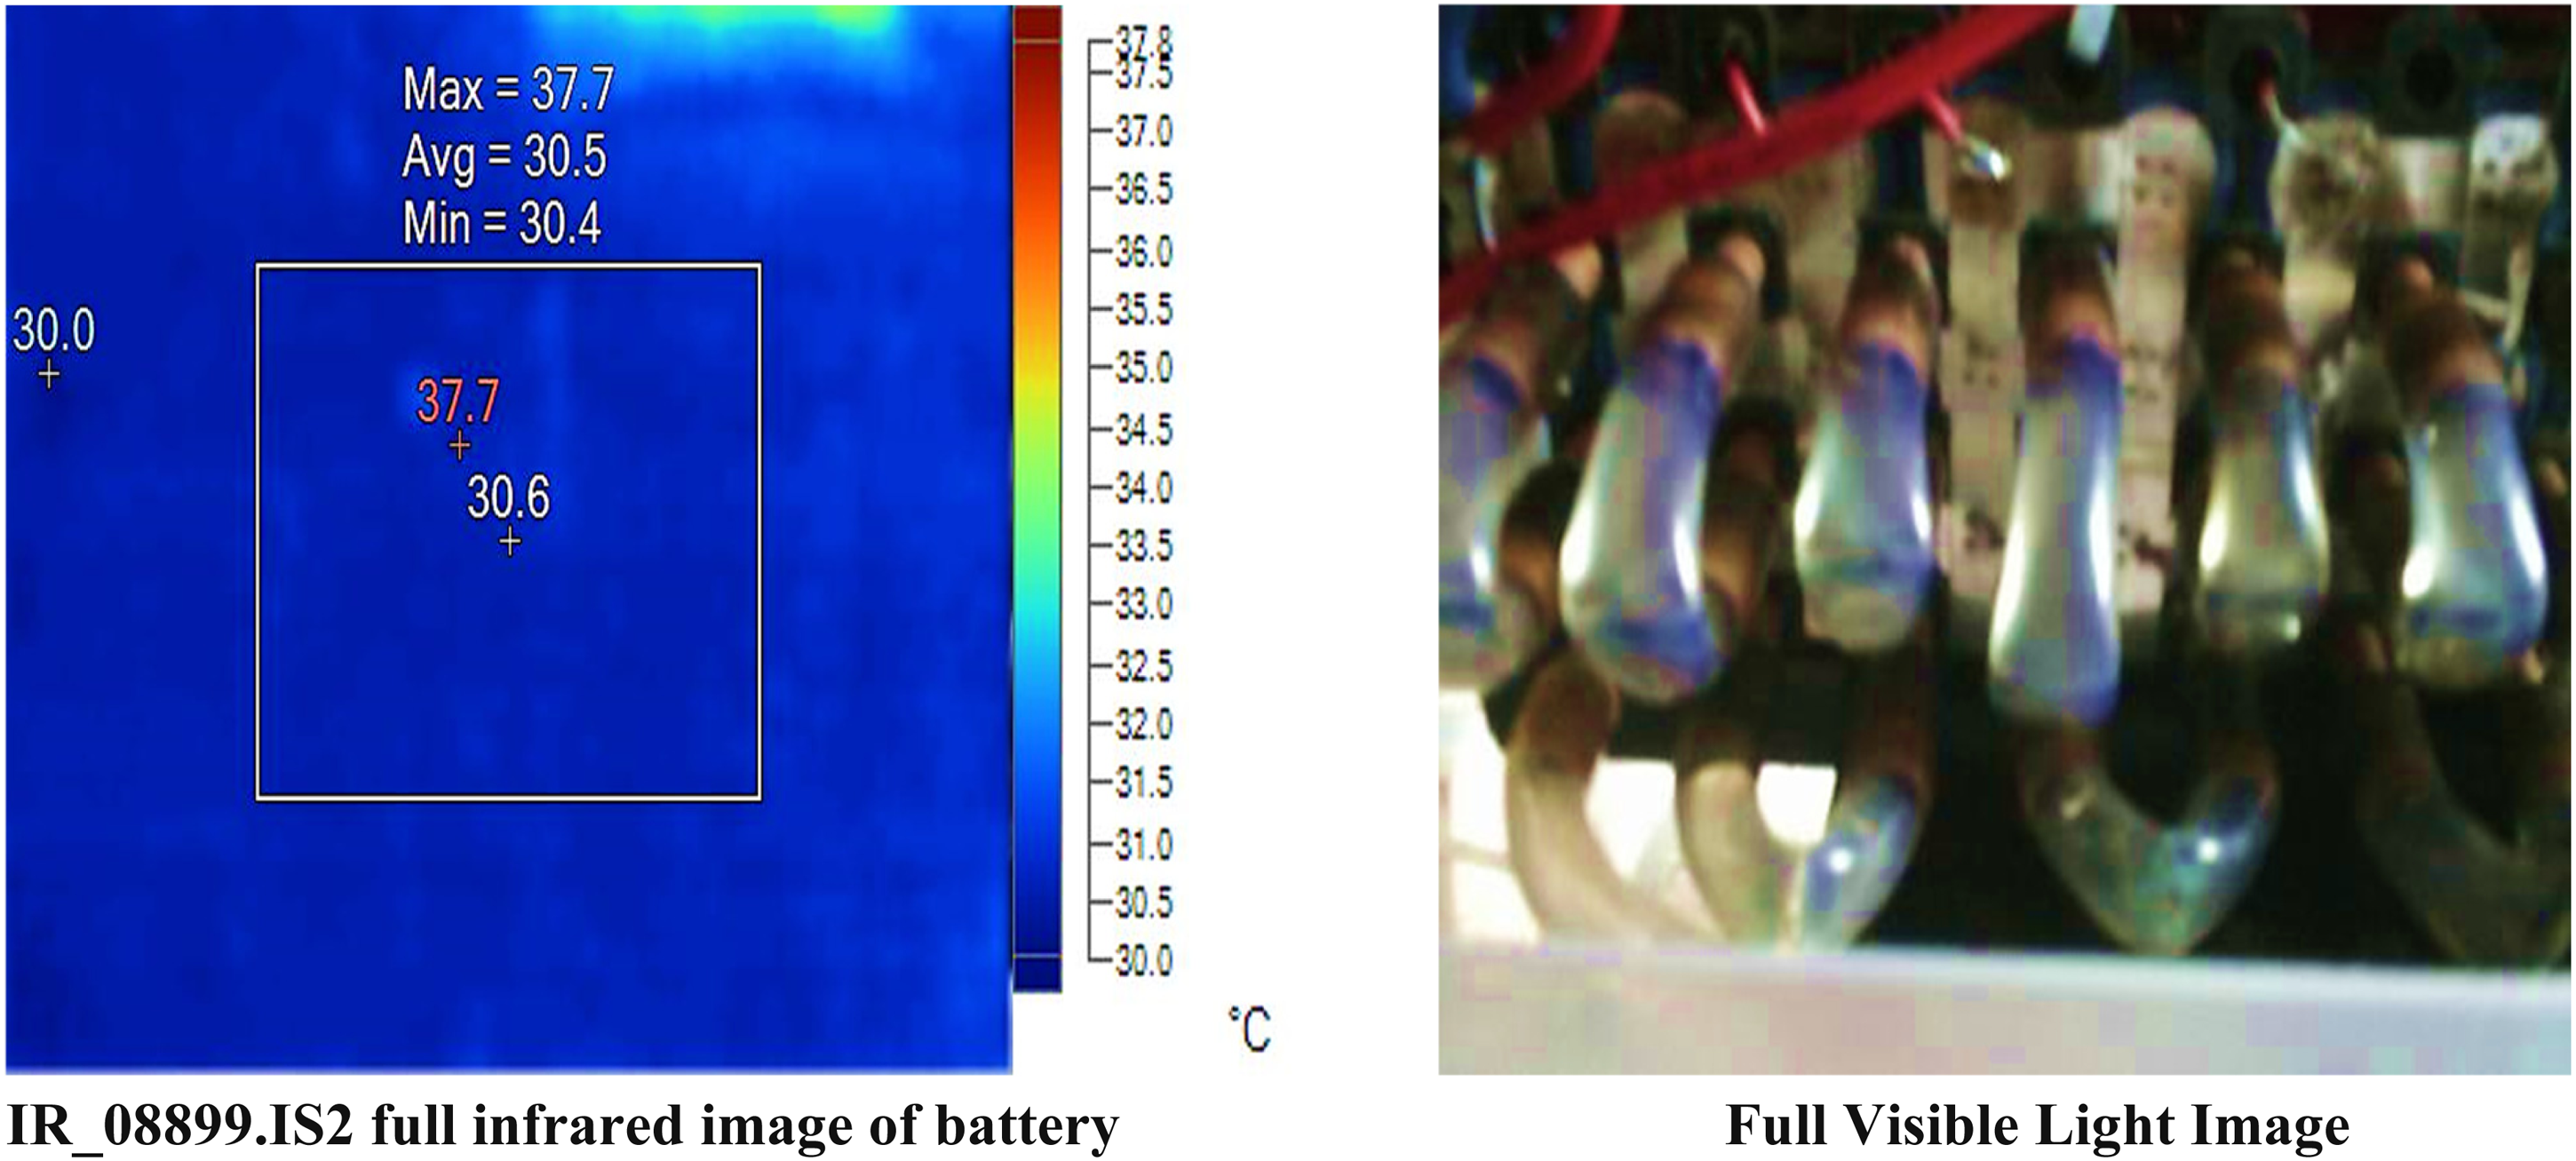
The temperature measurements and related parameters for a specific area and points on the surface of battery pack obtained from experimental analysis are shown in Figure 20.
Results of proposed battery management system without load, and water coolant liquid.
The center box has an average temperature of 30.5°C, with temperatures ranging from 30.4°C to a maximum of 37.7°C. This suggests that while most of the area is around the average temperature, there are localized spots of significantly higher temperature. The center point temperature is 30.6°C, which is slightly above the average temperature of the center box, indicating a stable and representative measurement. The hot point is recorded at 37.7°C, which is the highest temperature within the center box, indicating a significant hot spot. The cold point is recorded at 30.0°C, which is the lowest temperature measured, indicating a cooler area within the observed region.
The emissivity is consistently set at 0.95 for all measurements, indicating a uniform surface characteristic. The background temperature is maintained at 30.0°C, providing a consistent reference for the measurements.
It observed that experimental results indicate a generally stable temperature distribution with a notable hot spot at 37.7°C and a minor cooler region at 30.0°C. The consistent emissivity and background temperature ensure that these readings are comparable across the different points and areas measured.
With load and water coolant liquid
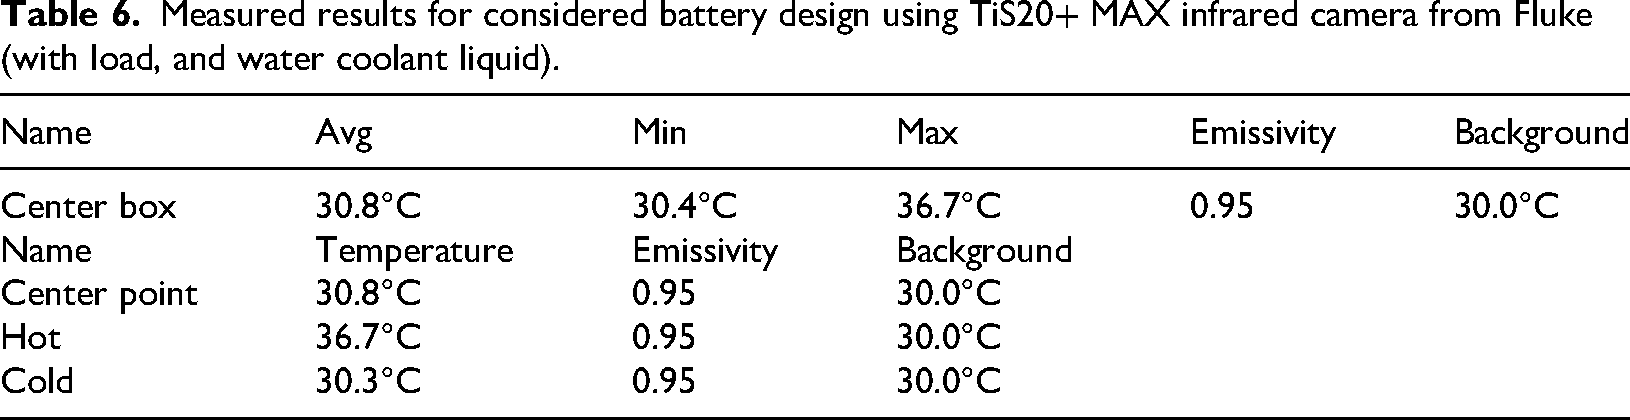
Table 6 provides the measured results for considered battery design pack with load, and water coolant liquid using a TiS20+ MAX IR camera.
Measured results for considered battery design using TiS20+ MAX infrared camera from Fluke (with load, and water coolant liquid).
The temperature measurements and related parameters for a specific area and points on a surface of battery pack obtained from experimental analysis are shown in Figure 21.
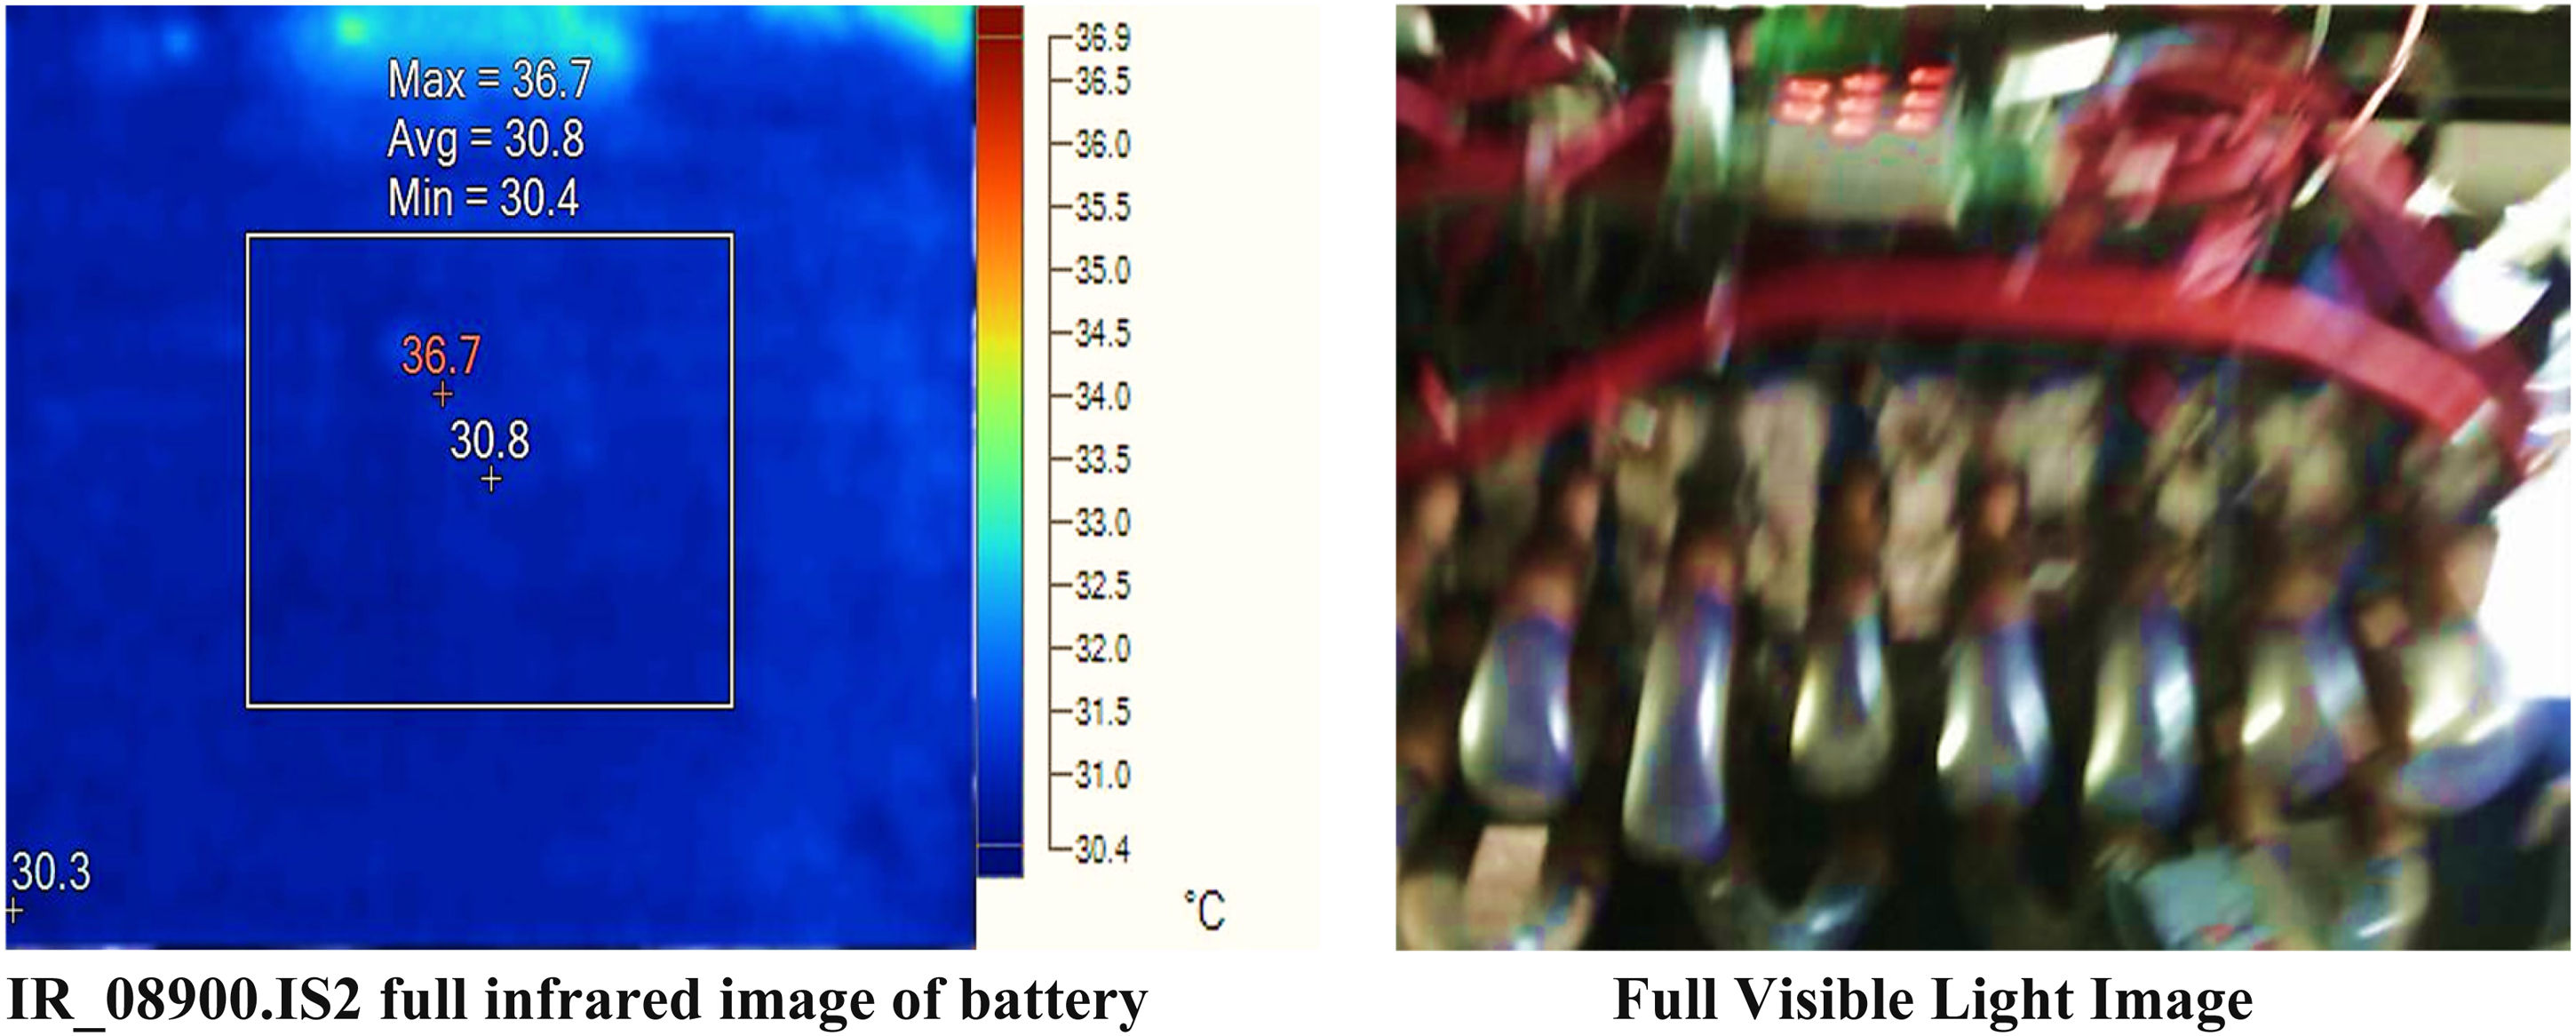
Results of proposed battery management system with load, and water coolant liquid.
The center box displays an average temperature of 30.8°C, with temperatures ranging from 30.4°C to 36.7°C. This suggests a relatively stable temperature with some variation within the area. The center point has a temperature of 30.8°C, matching the average temperature of the center box, indicating that it is representative of the overall temperature in this region. The hot point has the highest temperature at 36.7°C, indicating a localized hot spot within the observed area. The cold point is at 30.3°C, which is slightly below the average temperature, indicating a cooler spot within the area.
The emissivity is consistently set at 0.95 for all measurements, indicating uniform surface characteristics. The background temperature is maintained at 30.0°C, providing a consistent reference for the measurements.
It is observed that the results shows a generally stable temperature distribution with a notable hot spot at 36.7°C and a cooler region at 30.3°C. The consistent emissivity and background temperature ensure reliable comparisons across the different points and areas measured. The temperature control of LIBs is crucial for their safety and performance. For optimal storage, it is recommended to keep LIBs in cold and dry environments with a temperature of 15°C. The temperature range typically suitable for lithium-ion cells is from 5°C to 20°C. Extremely low temperatures, such as 0°C, can lead to a decrease in battery capacity because of the deceleration of chemical reactions within the battery caused by the freezing temperature. Conversely, elevated temperatures can greatly expedite the deterioration of LIBs. It is advisable to use these batteries within the ideal temperature range of 20°C to 45°C.
Various case studies have shown that the water-cooling system is capable of effectively controlling both the highest temperature and the fluctuations in temperature. The efficiency of a water-based cooling solution can be significantly improved by incorporating specialized additives. Introducing a small amount of nanoparticles or liquid metal enhances the thermal conductivity of the coolant, leading to superior heat dissipation. This improvement allows the system to maintain the desired cooling performance even at reduced flow rates, thereby minimizing energy consumption. Future research should explore the potential of liquid metals and nanofluids in thermal management applications to optimize cost and performance. In this study, a water–ethylene glycol mixture has been employed as the primary coolant to regulate battery temperature effectively.
Figures 22 and 23 show the experimental results of the proposed BMS images under testing conditions, showing both normal and IR images taken from TiS20+ MAX IR camera along the obtained output, indicating the average temperature in the battery pack.
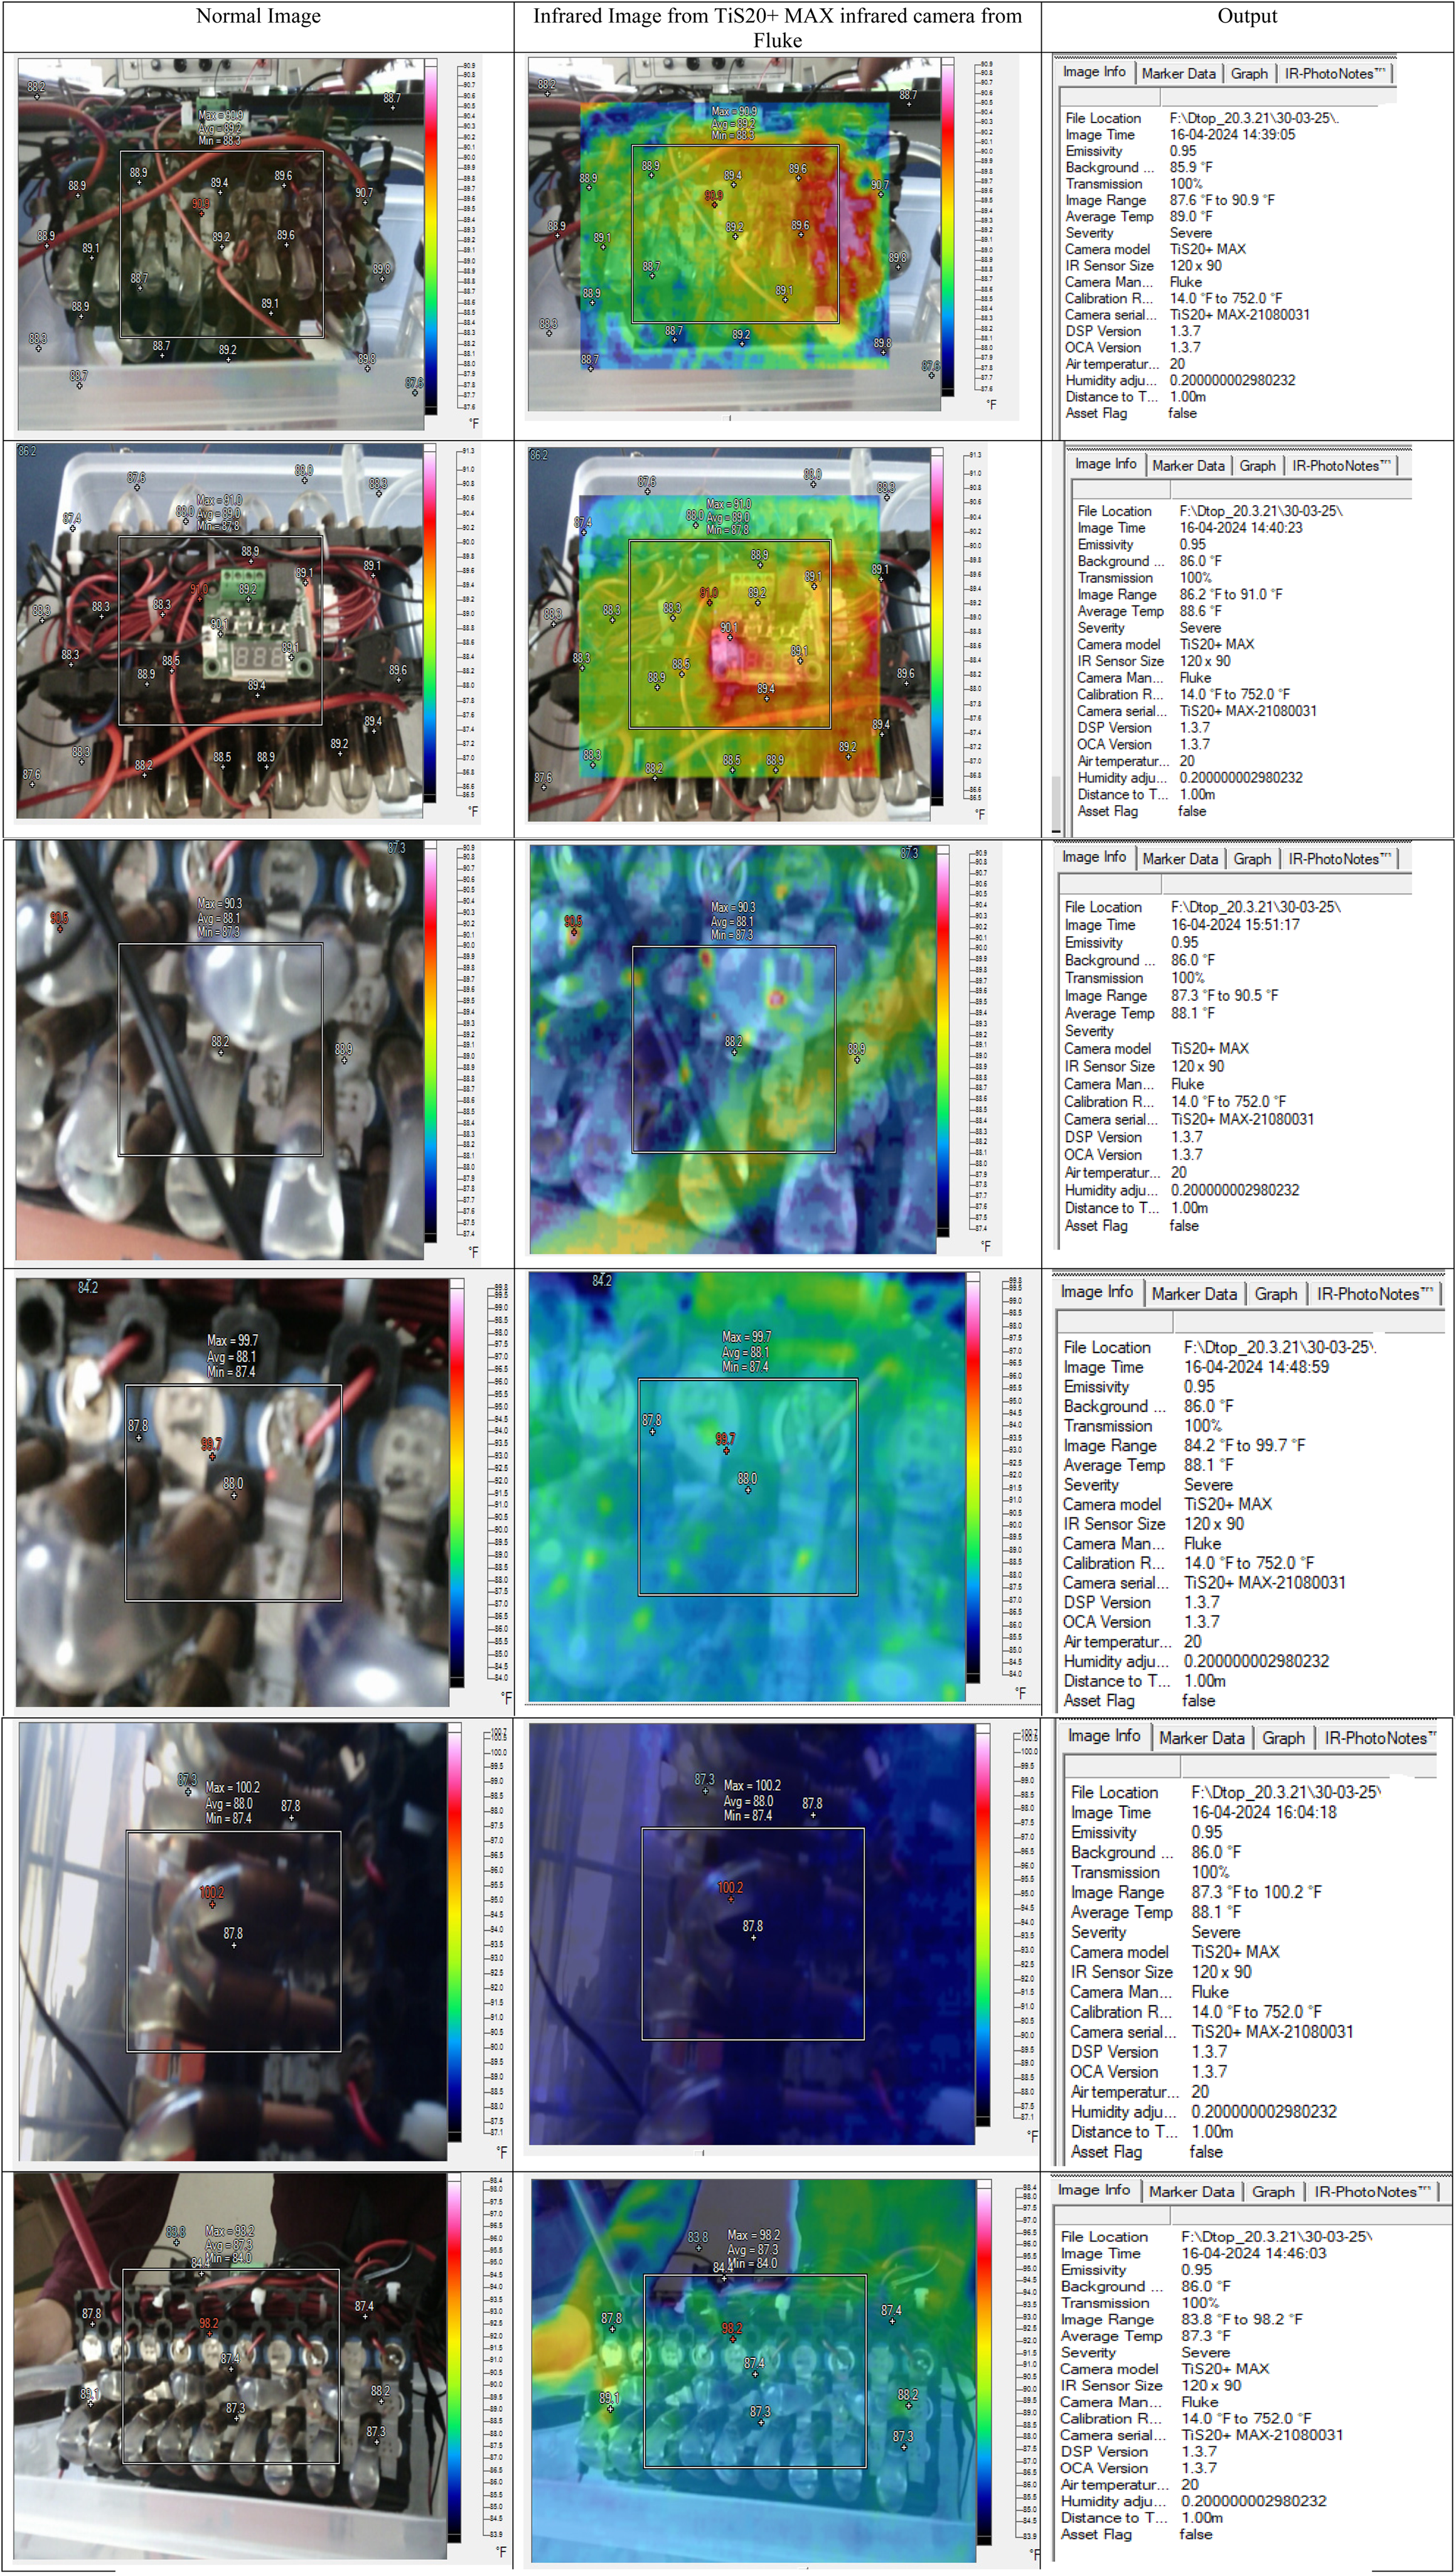
Experimental results of proposed battery management system showing infrared image taken from TiS20+ MAX infrared camera.
Infrared image of battery pack taken from TiS20+ MAX infrared camera from Fluke during testing condition.
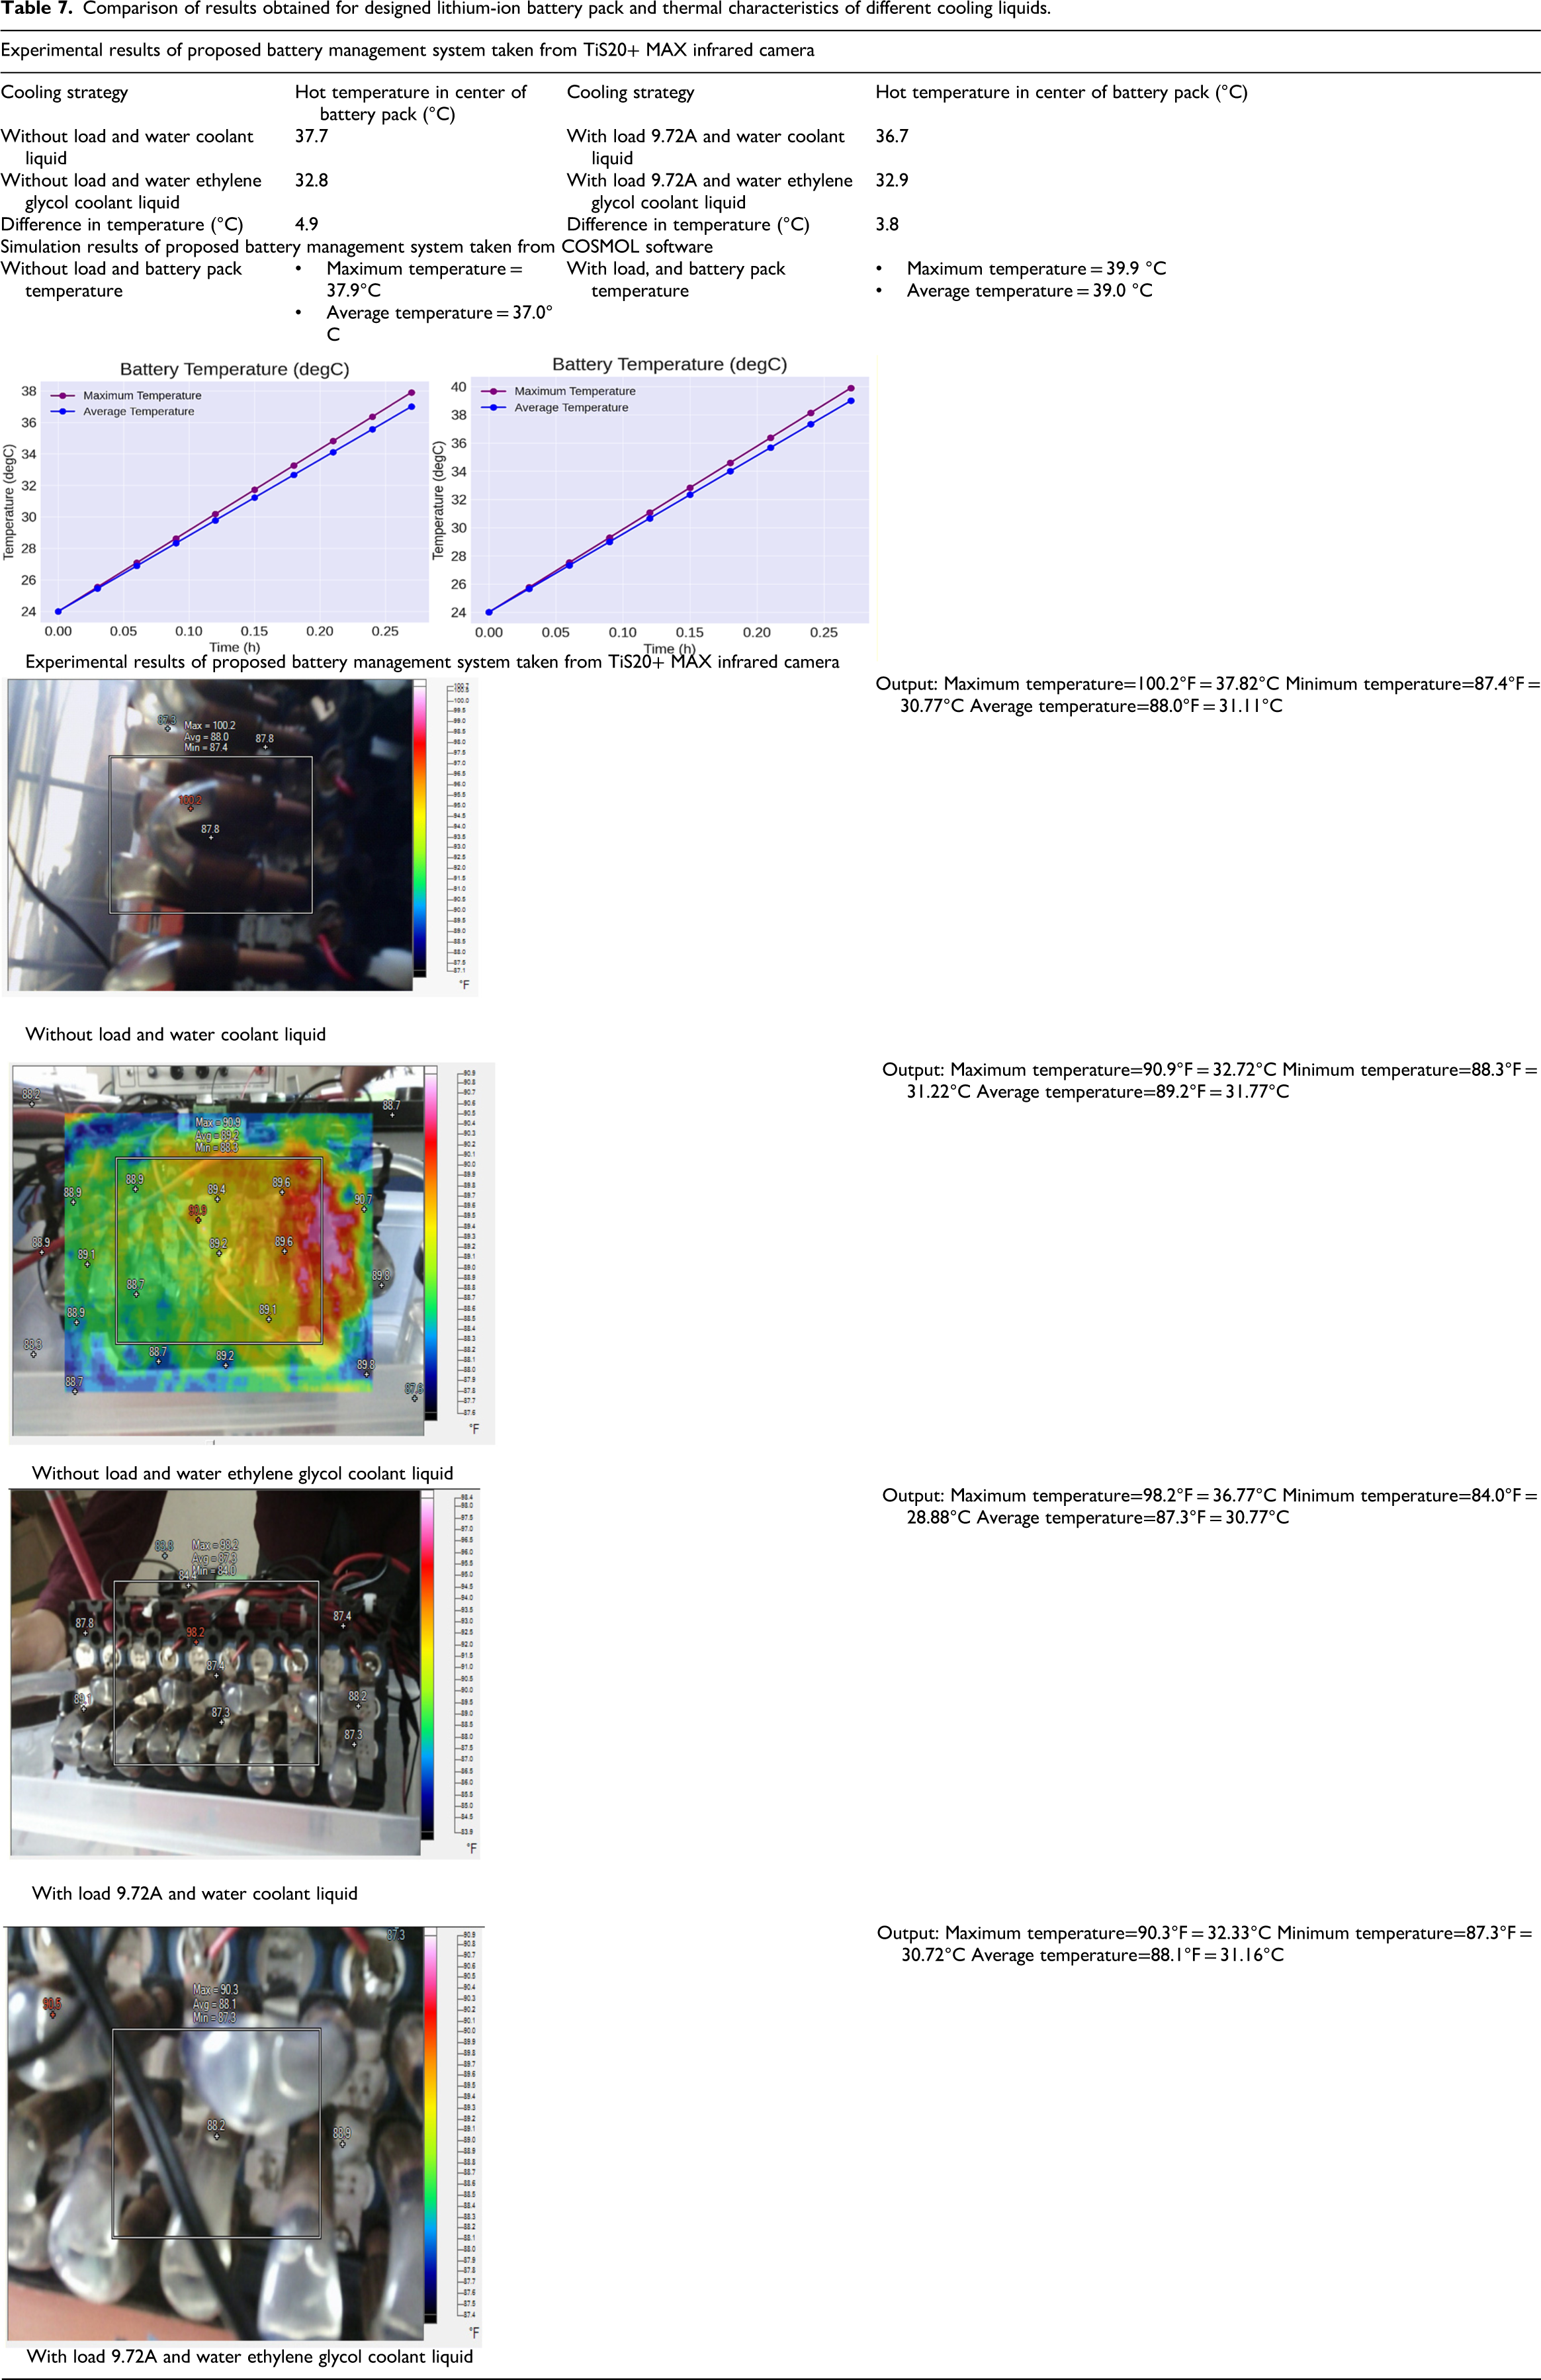
Comparison of results obtained for designed lithium-ion battery pack and thermal characteristics of different cooling liquids
The comparison of results obtained for designed LIB pack and thermal characteristics of different cooling liquids is shown in Table 7. The maximum temperature and average temperature still fall outside the optimal range.
Comparison of results obtained for designed lithium-ion battery pack and thermal characteristics of different cooling liquids.
Comparison of results with previous works published on battery thermal management systems
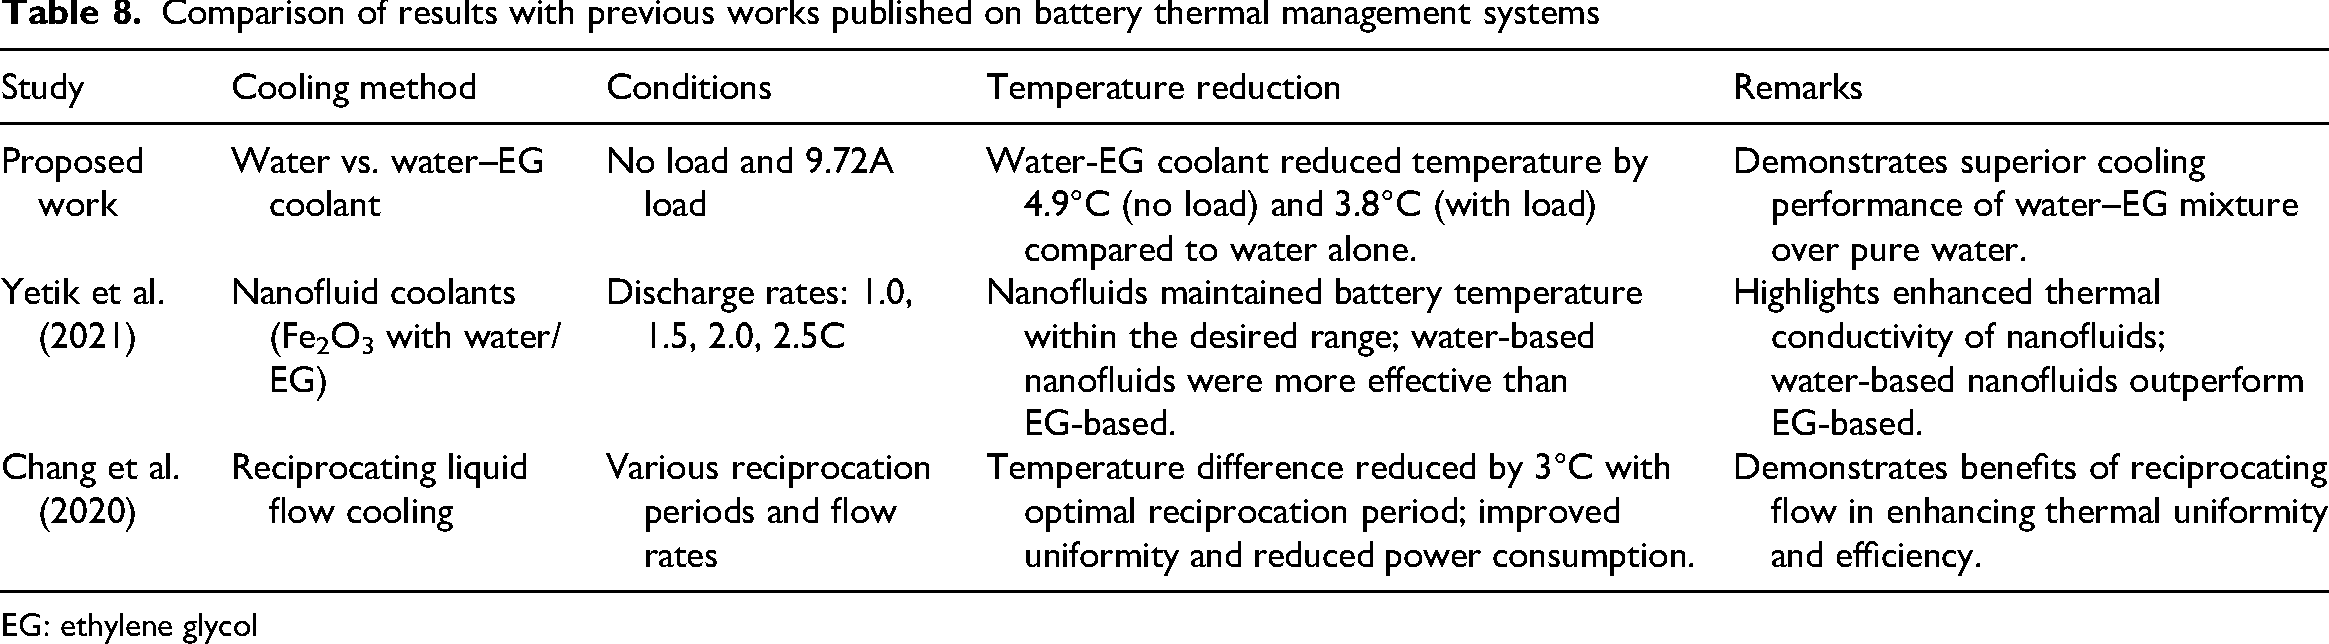
EG: ethylene glycol
Table 7 presents the experimental and simulation results of a proposed BMS using different cooling strategies. The obtained results data have been divided into two sections:
➢
The simulation results of battery pack temperature under two conditions: without load and with load.
Without load:
Maximum temperature: 37.9°C Average temperature: 37.0°C With load:
Maximum temperature: 39.9°C Average temperature: 39.0°C
➢
The table compares the hot temperature in the center of the battery pack under different cooling strategies, both without load and with a load of 9.72A. Two types of coolant liquids are used:
Water coolant liquid Water–ethylene glycol coolant liquid
Without load:
The battery pack temperature with water coolant liquid is 37.7°C. The battery pack temperature with water–ethylene glycol coolant liquid is 32.8°C. The difference in temperature between the two coolant liquids is 4.9°C, indicating that water–ethylene glycol is more effective in reducing temperature. With load (9.72A):
The battery pack temperature with water coolant liquid is 36.7°C. The battery pack temperature with water–ethylene glycol coolant liquid is 32.9°C. The difference in temperature between the two coolant liquids is 3.8°C, again showing the superior cooling performance of water–ethylene glycol. Effectiveness of water–ethylene glycol coolant: This coolant consistently results in lower temperatures compared to pure water, demonstrating its effectiveness in battery thermal management. Load impact: The presence of a load (9.72A) increases the temperature in both experimental and simulation results, but the rise is lower when using water–ethylene glycol.
➢ Experimental vs. simulation results: The experimental data show lower battery temperatures compared to the simulation, possibly due to real-world heat dissipation effects that are not fully captured in the model.
Table 8 below compares the results with previous studies on BTMS, revealing insights into the effectiveness of various cooling strategies.
It is observed from results that integrating multiple cooling strategies and enhancing coolant properties significantly improves thermal management of battery pack. The obtained results indicate that utilizing a water–ethylene glycol coolant enhances battery pack thermal management more effectively than pure water, with observed temperature reductions of 4.9°C under no-load conditions and 3.8°C at a 9.72A load. Though this work primarily compares the effectiveness of two coolant types in regulating temperature within a battery pack, previous studies have investigated alternative approaches such as thermoelectric cooling and PCMs to achieve significant temperature reductions. The findings emphasize the critical role of selecting an appropriate coolant liquid in optimizing battery thermal management, which is essential for ensuring long-term battery performance and durability. A broader perspective on the effectiveness of the proposed cooling solution can be obtained by comparing it to existing battery thermal management systems (BTMS) reported in the literature. Table 8 summarizes key comparative results, including coolant types, operating conditions, and thermal reduction metrics. This benchmarking highlights the performance advantages of the water–ethylene glycol system implemented in this study.
Intelligent control schemes, optimization algorithms, and methods in EVs
➢ Adaptive cruise control: Utilizes sensors and machine learning algorithms to maintain a safe distance from other vehicles and optimize speed for energy efficiency. Regenerative braking: Manages the energy recovery process during braking to improve overall efficiency. Predictive maintenance: Uses data analytics and AI to predict and prevent potential failures by monitoring the health of vehicle components. Route optimization: Employs navigation systems and real-time traffic data to determine the most efficient routes, minimizing energy consumption and travel time.
➢ Genetic algorithms: Inspired by natural selection, these algorithms are used for optimizing complex functions by iteratively improving a set of candidate solutions. Particle swarm optimization: Models social behavior of birds flocking or fish schooling to find optimal solutions by sharing information within a population of candidate solutions. Simulated annealing: Mimics the process of annealing in metallurgy, seeking to avoid local minima by allowing uphill moves in the solution space to find a global optimum. MPC: Uses a dynamic model of the EV to predict future states and optimize control inputs accordingly, ensuring optimal performance over a prediction horizon.
➢ BMS: Monitors and manages battery health, state of charge, and thermal conditions to ensure optimal performance and safety (Kumar et al., 2025). Energy management systems: Coordinates the distribution and usage of energy within the vehicle, balancing the needs of various subsystems to maximize efficiency. Telematics and connectivity: Integrates communication technologies to provide real-time data exchange between the vehicle and external systems, enabling features like remote diagnostics, OTA updates, and fleet management. V2G technology: Allows EVs to interact with the power grid, enabling bidirectional energy flow to support grid stability and provide additional revenue streams for EV owners.
These intelligent control schemes, optimization algorithms, and methods are crucial for the advancement of EV technology, contributing to more efficient, reliable, and user-friendly EVs.
Social impact of EVs
The adoption of EVs has profound social implications, influencing various aspects of society from environmental health to economic opportunities and urban development. Here are some key areas where EVs are making a significant social impact:
➢ ➢ ➢ ➢ ➢
Overall, the social impact of EVs extends beyond just transportation, influencing public health, economic development, urban planning, and environmental sustainability. As the adoption of EVs continues to grow, these benefits are expected to become more pronounced, contributing to a more sustainable and equitable future.
Economic influences of EVs
The rise of EVs is reshaping economies worldwide, with significant impacts on various sectors from manufacturing and energy to infrastructure and employment. Here are some key economic influences of EVs:
➢ ➢ ➢ ➢ ➢ ➢ ➢ ➢
Overall, the economic influences of EVs are multifaceted, promoting industrial growth, energy transformation, infrastructure development, and consumer benefits. These influences contribute to a dynamic economic landscape, paving the way for sustainable development and long-term prosperity.
Environmental effects of EVs
The adoption of EVs has a profound impact on the environment, offering numerous benefits and some challenges. Here are the key environmental effects of EVs:
➢ ➢ ➢ ➢ ➢ ➢
Conclusions
This research comprehensively analyzes cutting-edge battery and management technology for EV applications. The results indicate that utilizing a water–ethylene glycol coolant enhances battery pack thermal management more effectively than pure water, with observed temperature reductions of 4.9°C under no-load conditions and 3.8°C at a 9.72A load. This study aligns with the existing literature, which suggests that integrating multiple cooling strategies or enhancing coolant properties improves thermal management. Though this work primarily compares the effectiveness of two coolant types in regulating temperature within a battery pack, previous studies have investigated alternative approaches, such as thermoelectric cooling and PCMs, to achieve significant temperature reductions. This work highlights the importance of selecting appropriate cooling strategies and materials to enhance battery performance and longevity.
Modern EVs integrate advanced technologies such as AI, cloud computing, blockchain, sensor-on-chip, innovative power electronics, vehicular information, and the energy internet to enhance reliability and safety. Research suggests that move-and-charge and wireless power transfer technologies offer potential solutions to current battery limitations. Additionally, the study highlights the limitations of LIBs concerning energy density, charging speed, and safety while underscoring the importance of real-time status prediction using realistic datasets. It also reviews advancements in BTMS, primarily air-cooled, liquid-cooled, and thermoelectric systems. Hybrid BTMS, combining multiple cooling methods, enhances efficiency. While air-cooled systems are cost-effective and low-maintenance, they are inadequate for high thermal loads. In contrast, liquid-cooled systems offer superior heat dissipation and uniform temperature distribution but are more complex, costly, and maintenance-intensive.
Footnotes
Highlights
Overview of advanced thermal management techniques in LIB systems for EVs. Detailed analysis of air-cooled, liquid-cooled, and phase-change material-based thermal management systems for EV applications. Exploration of state estimation approaches in BMS for energy and lifespan prediction. Evaluation of energy management strategies, including charge-discharge control, protection, and cell equalization for optimal battery performance. Identification of research opportunities to advance next-generation BMS for sustainable electric mobility.
Ethical considerations
This study did not involve human or animal subjects, and therefore, ethical approval was not required.
Informed consent
This study did not involve human participants, and therefore, informed consent was not required.
Author contributions
Pujari Harish Kumar, R Gayathri, N Chinna Alluraiah: conceptualization, methodology, software, visualization, investigation, writing–original draft preparation. Pasala Gopi, Mohit Bajaj: data curation, validation, supervision, resources, writing–review and editing. Reshma Gopi R, Sunil Kumar P, Rashmi G, Ievgen Zaitsev: project administration, supervision, resources, writing–review and editing.
Funding
The authors received no financial support for the research, authorship, and/or publication of this article.
Declaration of conflicting interests
Authors stated that there is no conflict of interest.
Data availability statement
The datasets used and/or analyzed during the current study available from the corresponding author on reasonable request.
Supplemental material
Supplemental material for this article is available online.
Trial registration number/date
This study does not involve clinical trials, and therefore, trial registration is not applicable.