
Abstract
Dust accumulation on solar photovoltaic (PV) panels significantly reduces efficiency, especially in urban environments. This study examines the effect of cement, plaster, and soil-laterite dust on PV performance in Kampala, Uganda. A clean panel served as a control, while experimental panels were exposed to 10 g, 20 g, and 30 g of each dust type, and power output was determined. The results showed a strong negative correlation between dust accumulation and power output, with higher dust concentrations causing greater efficiency losses. Cement dust had the most severe impact (80.6% power reduction at 30 g) due to its fine particle size (1–100 µm) and high calcium oxide (CaO) content (62.75%), forming a dense, opaque layer. Soil-laterite dust, with larger particles (60–2000 µm) and high ferric oxide (Fe2O3) and aluminium oxide (Al2O3) content, led to a 72.8% power loss, while plaster dust caused a 68.3% decline. These findings highlight the need for regular cleaning, anti-soiling coatings, and improved panel positioning to mitigate dust-related losses.
Introduction
The global demand for clean and renewable energy has driven the widespread adoption of solar photovoltaic (PV) technology, particularly in regions with abundant sunlight, such as sub-Saharan Africa. In Uganda, solar energy has emerged as a viable solution to address energy access challenges, especially in off-grid and peri-urban communities. However, despite the high solar irradiance in Kampala, the actual energy output of PV systems often falls short of their theoretical potential. One of the most significant yet frequently overlooked factors contributing to this performance gap is the accumulation of surface dust on PV panels.
Dust is composed of tiny solid particles suspended in the air, originating from various sources such as construction activities, soil erosion, industrial emissions, and transportation (Kamal et al., 2023; Pitawala and Samaradiwakara, 2025). These particles can settle on surfaces, including solar PV panels, forming a layer that obstructs sunlight and reduces energy conversion efficiency. In this study, dust is defined as any solid particulate matter that accumulates on the surface of solar PV panels and negatively affects their performance by blocking or scattering incident solar radiation. Among the many types of dust, this study focuses on three specific types common in urban and industrial environments: cement dust, plaster dust, and soil-laterite dust.
Kampala, Uganda, is experiencing rapid urbanisation, with increasing construction activities, industrial production, and expanding road networks. These activities contribute to high airborne dust levels, which settle on solar PV panels, leading to efficiency losses. Since solar energy is a key renewable resource for addressing Uganda's growing electricity demand (Adolf and Uzorka, 2025; Katongole et al., 2024; Uzorka et al., 2025), understanding how dust accumulation affects PV performance is essential for ensuring optimal energy production and sustainability.
The primary objective of this study is to investigate the impact of selected dust types (cement, plaster, and soil-laterite) at different concentrations on the performance of solar PV panels.
As Uganda increasingly adopts solar energy as part of its renewable energy strategy, maintaining the maximum efficiency of solar PV panels is crucial. Dust accumulation, if not properly managed, can significantly reduce solar power output, leading to financial losses and reduced energy reliability. Understanding how different dust types and concentrations impact PV efficiency will provide valuable insights for policymakers, solar farm operators, and individual users to develop effective cleaning schedules, preventive measures, and site selection strategies for solar installations in dusty environments.
Several studies have established a negative correlation between dust accumulation and solar PV efficiency. According to Salamah et al. (2022), even a thin layer of dust can lead to substantial reductions in solar energy absorption, with power losses ranging from 5% to over 50%, depending on the dust type and deposition rate. This broad range, while indicative of dust's impact, lacks specificity regarding regional conditions, particle size, and panel orientation. Similarly, Chala et al. (2024) found that in arid and semi-arid regions, where dust storms are frequent, PV efficiency can decrease by up to 85% if panels are left uncleaned for extended periods, yet their findings may not fully translate to more humid or tropical environments like Kampala, where dust characteristics and deposition dynamics differ significantly. Said et al. (2024) reported that dirt accumulation on PV panels could cause electrical energy losses of up to 80%, reinforcing the need for preventive maintenance. However, their study focused on industrial zones with high particulate density, raising questions about applicability in mixed urban-residential areas. In another study, Kazem et al. (2022) observed an 80% drop in short-circuit voltage after PV panels were exposed to cement dust, reinforcing the significant shading effects of fine dust particles. Still, they did not account for the frequency of such exposure or its cumulative effect over time. These findings suggest that dust not only reduces power output but also affects electrical characteristics such as voltage and current generation.
Several studies investigated the role of dust composition and particle size. Drame et al. (2021) and Yavaş et al. (2022) examined the effect of iron-rich dust on solar panels, reporting that dust containing high levels of Fe₂O₃ significantly increases surface reflectance, thereby reducing the amount of solar radiation absorbed by the PV cells, while valuable, the study was limited to regions with significant mining activity, making its generalizability to urban centres debatable. Furthermore, Vedulla and Geetha (2023) emphasised that accumulated dust increases the surface resistance of solar panels, leading to higher energy dissipation and lower efficiency. In addition, Paul (2021) reported that every additional gram of dust could result in a measurable drop in PV power output, with finer particles causing more significant reductions. Similarly, Quan et al. (2022) found that dust accumulation follows a predictable trend of efficiency decline, reinforcing the importance of routine cleaning and maintenance.
The size and optical properties of dust particles are critical yet inconsistently reported. Tamboura and Gosteva (2024) reported that fine dust particles form a more compact and opaque layer, effectively blocking solar radiation. Their study also found that dust particles smaller than 100 µm tend to adhere strongly to the panel surface, requiring active cleaning for removal. In addition, Elamim et al. (2024) observed that dust with a higher metal oxide content absorbs more solar radiation, leading to increased panel heating and efficiency losses. Similarly, Chanchangi et al. (2020) found that plaster dust forms a more porous layer that allows some light penetration, resulting in lower but still considerable efficiency losses. In another study, Ziaeemehr et al. (2023) reported that light-coloured dust, such as plaster dust, scatters more sunlight, reducing its direct absorption by the PV panel. Similarly, Gunes and Balog (2025) noted that plaster dusts, while allowing partial light penetration, scatter incoming solar radiation and increase surface reflectivity. However, these findings sometimes contradict one another regarding which dust type is more detrimental, suggesting a lack of standardised testing conditions across studies.
Given the substantial impact of dust on PV performance, researchers have explored various mitigation strategies, including automated cleaning, anti-soiling coatings, and optimised panel design. Olorunfemi et al. (2022) and Zhao et al. (2021) reported that regular cleaning can restore up to 90% of lost efficiency, emphasising that frequent manual or automated cleaning is necessary in dusty environments. Additionally, Rajbahadur et al. (2024) examined the effectiveness of hydrophobic and self-cleaning coatings, which were found to reduce dust adhesion by up to 70%. Another strategy proposed is adjusting PV panel tilt angles, which helps minimise dust deposition (Alzahrani et al., 2025; Wang et al., 2025; Zheng et al., 2024). Their study showed that tilting panels at steeper angles reduces dust accumulation by allowing wind and rain to naturally clean the surface. However, in regions with low rainfall, this strategy may have limited effectiveness.
Existing research consistently highlights the detrimental effects of dust on PV panel performance, with factors such as dust type, particle size, and composition playing critical roles in determining efficiency losses. Studies have also established a strong negative correlation between dust accumulation and power output, reinforcing the need for regular cleaning and preventive measures. However, limited studies have focused on the specific impact of cement, plaster, and soil-laterite dust, particularly prevalent in urban environments like Kampala, Uganda. Without this knowledge, effective maintenance schedules and mitigation strategies cannot be developed, limiting the reliability and adoption of solar power in urban Uganda. This study addresses this gap by providing empirical data on how these three dust types, at varying concentrations, affect PV power output.
Methodology
This study experimentally investigates the performance of ten identical PV panels installed in Kampala to assess the impact of dust deposition on power output and efficiency. To systematically analyse this issue, one panel is maintained in a clean state as a control, while the remaining nine panels are artificially polluted with three common urban dust types: cement, plaster, and soil-laterite. Each dust type is applied in varying concentrations of 10 g, 20 g, and 30 g across three separate panels to evaluate the impact of different accumulation levels. The selected dust weights (10 g, 20 g, and 30 g) were chosen to simulate low, medium, and high levels of dust accumulation that can realistically occur on PV panels in urban environments over different periods. These quantities were informed by: Observational data from PV installations in dusty urban sites around Kampala, where periodic cleaning is infrequent; Previous literature that demonstrates measurable efficiency losses at even low dust accumulation thresholds (5–30 g/m²) (Abd et al., 2025; Rachedi et al., 2025; Wu et al., 2024); and the need to ensure experimental clarity in identifying performance degradation trends across clearly defined dust concentrations. All PV panels are installed in a mounted position to ensure optimal sunlight capture, positioned near, and adjusted to the same inclination angle to maintain a controlled comparison. Key performance parameters, including current, voltage, temperature and irradiance, are recorded at regular intervals throughout the day to enable accurate power calculations. The experiment was repeated 10 days and the average values were recorded.
Dust samples
The dust samples used in this study include cement, plaster powder, and laterite soil, which are primarily found at construction sites and paved roads, respectively.
Cement dust
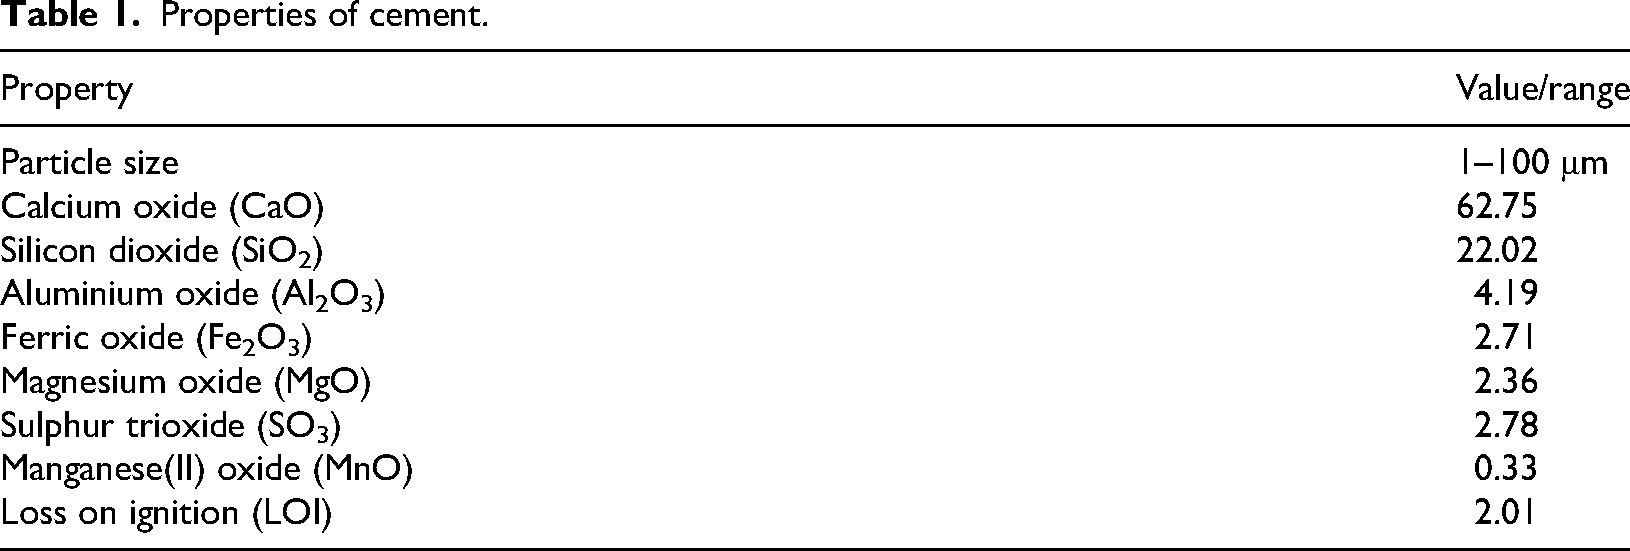
Cement dust consists of fine powdery particles produced during the manufacturing, transportation, and handling of cement. Due to its alkaline nature, cement dust can react with moisture to form a hardened layer, which can further hinder the absorption of solar radiation. It is commonly found in construction sites, cement factories, and areas near cement transportation routes. In this study, Portland cement with a 42.5 grade, produced by Tororo Cement Limited, Uganda, was used. Properties of Portland cement according to manufacturer specifications are shown in Table 1.
Properties of cement.
Plaster dust
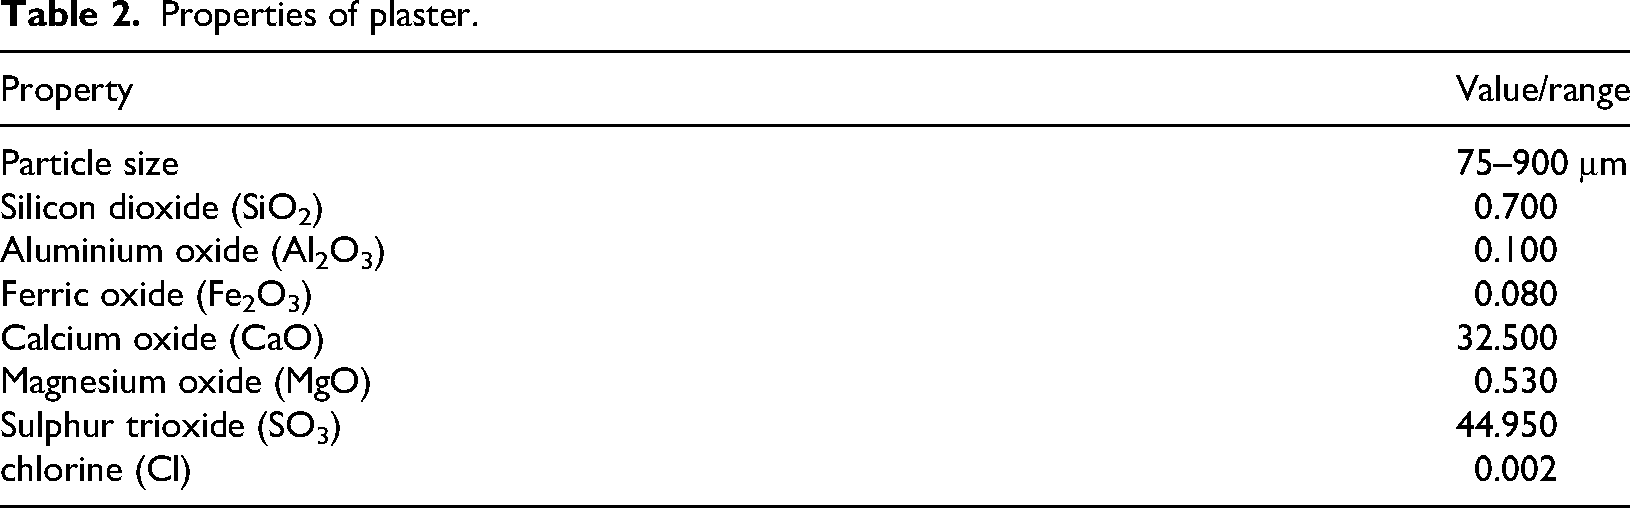
Plaster dust is a fine, dry material primarily composed of calcium sulphate (CaSO₄) in the form of gypsum or anhydrite. Unlike cement dust, plaster dust tends to form a porous layer, allowing some light penetration but still reducing PV panel efficiency. It is frequently encountered at construction sites, renovation areas, and gypsum processing plants. Properties of plaster according to manufacturer's specifications are shown in Table 2.
Properties of plaster.
Laterite soil dust
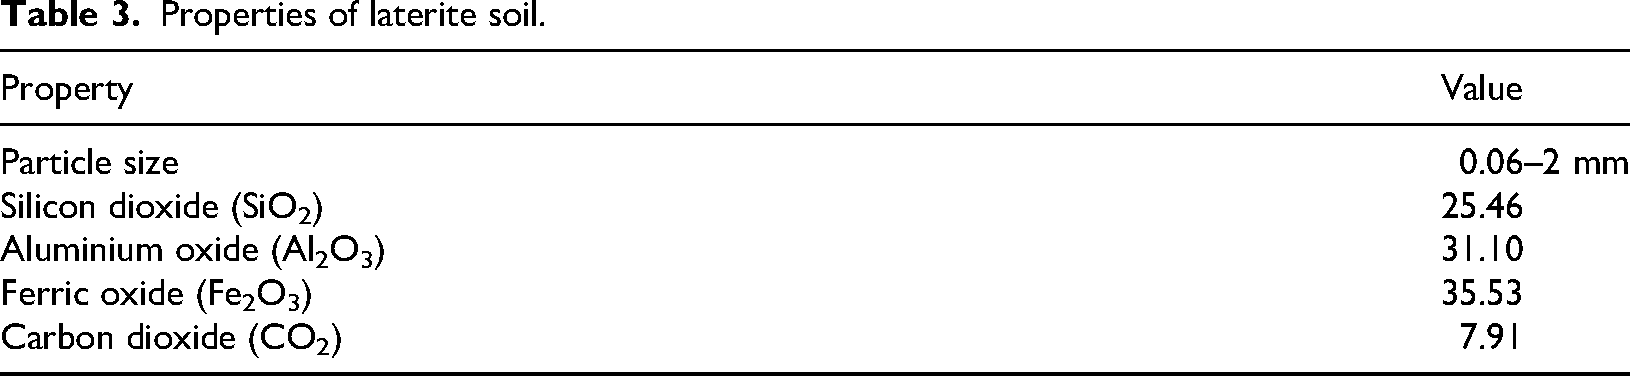
Laterite soil dust is a naturally occurring, iron-rich soil commonly found in tropical regions, including Uganda. Laterite dust is reddish-brown in colour and can significantly reduce PV panel efficiency by absorbing and scattering sunlight. It is widely found in unpaved roads, construction sites, and excavation areas, making it a common airborne pollutant in urban and semi-urban environments. Properties of Laterite are shown in Table 3.
Properties of laterite soil.
The different types of dust samples used in the study are shown in Figure 1.
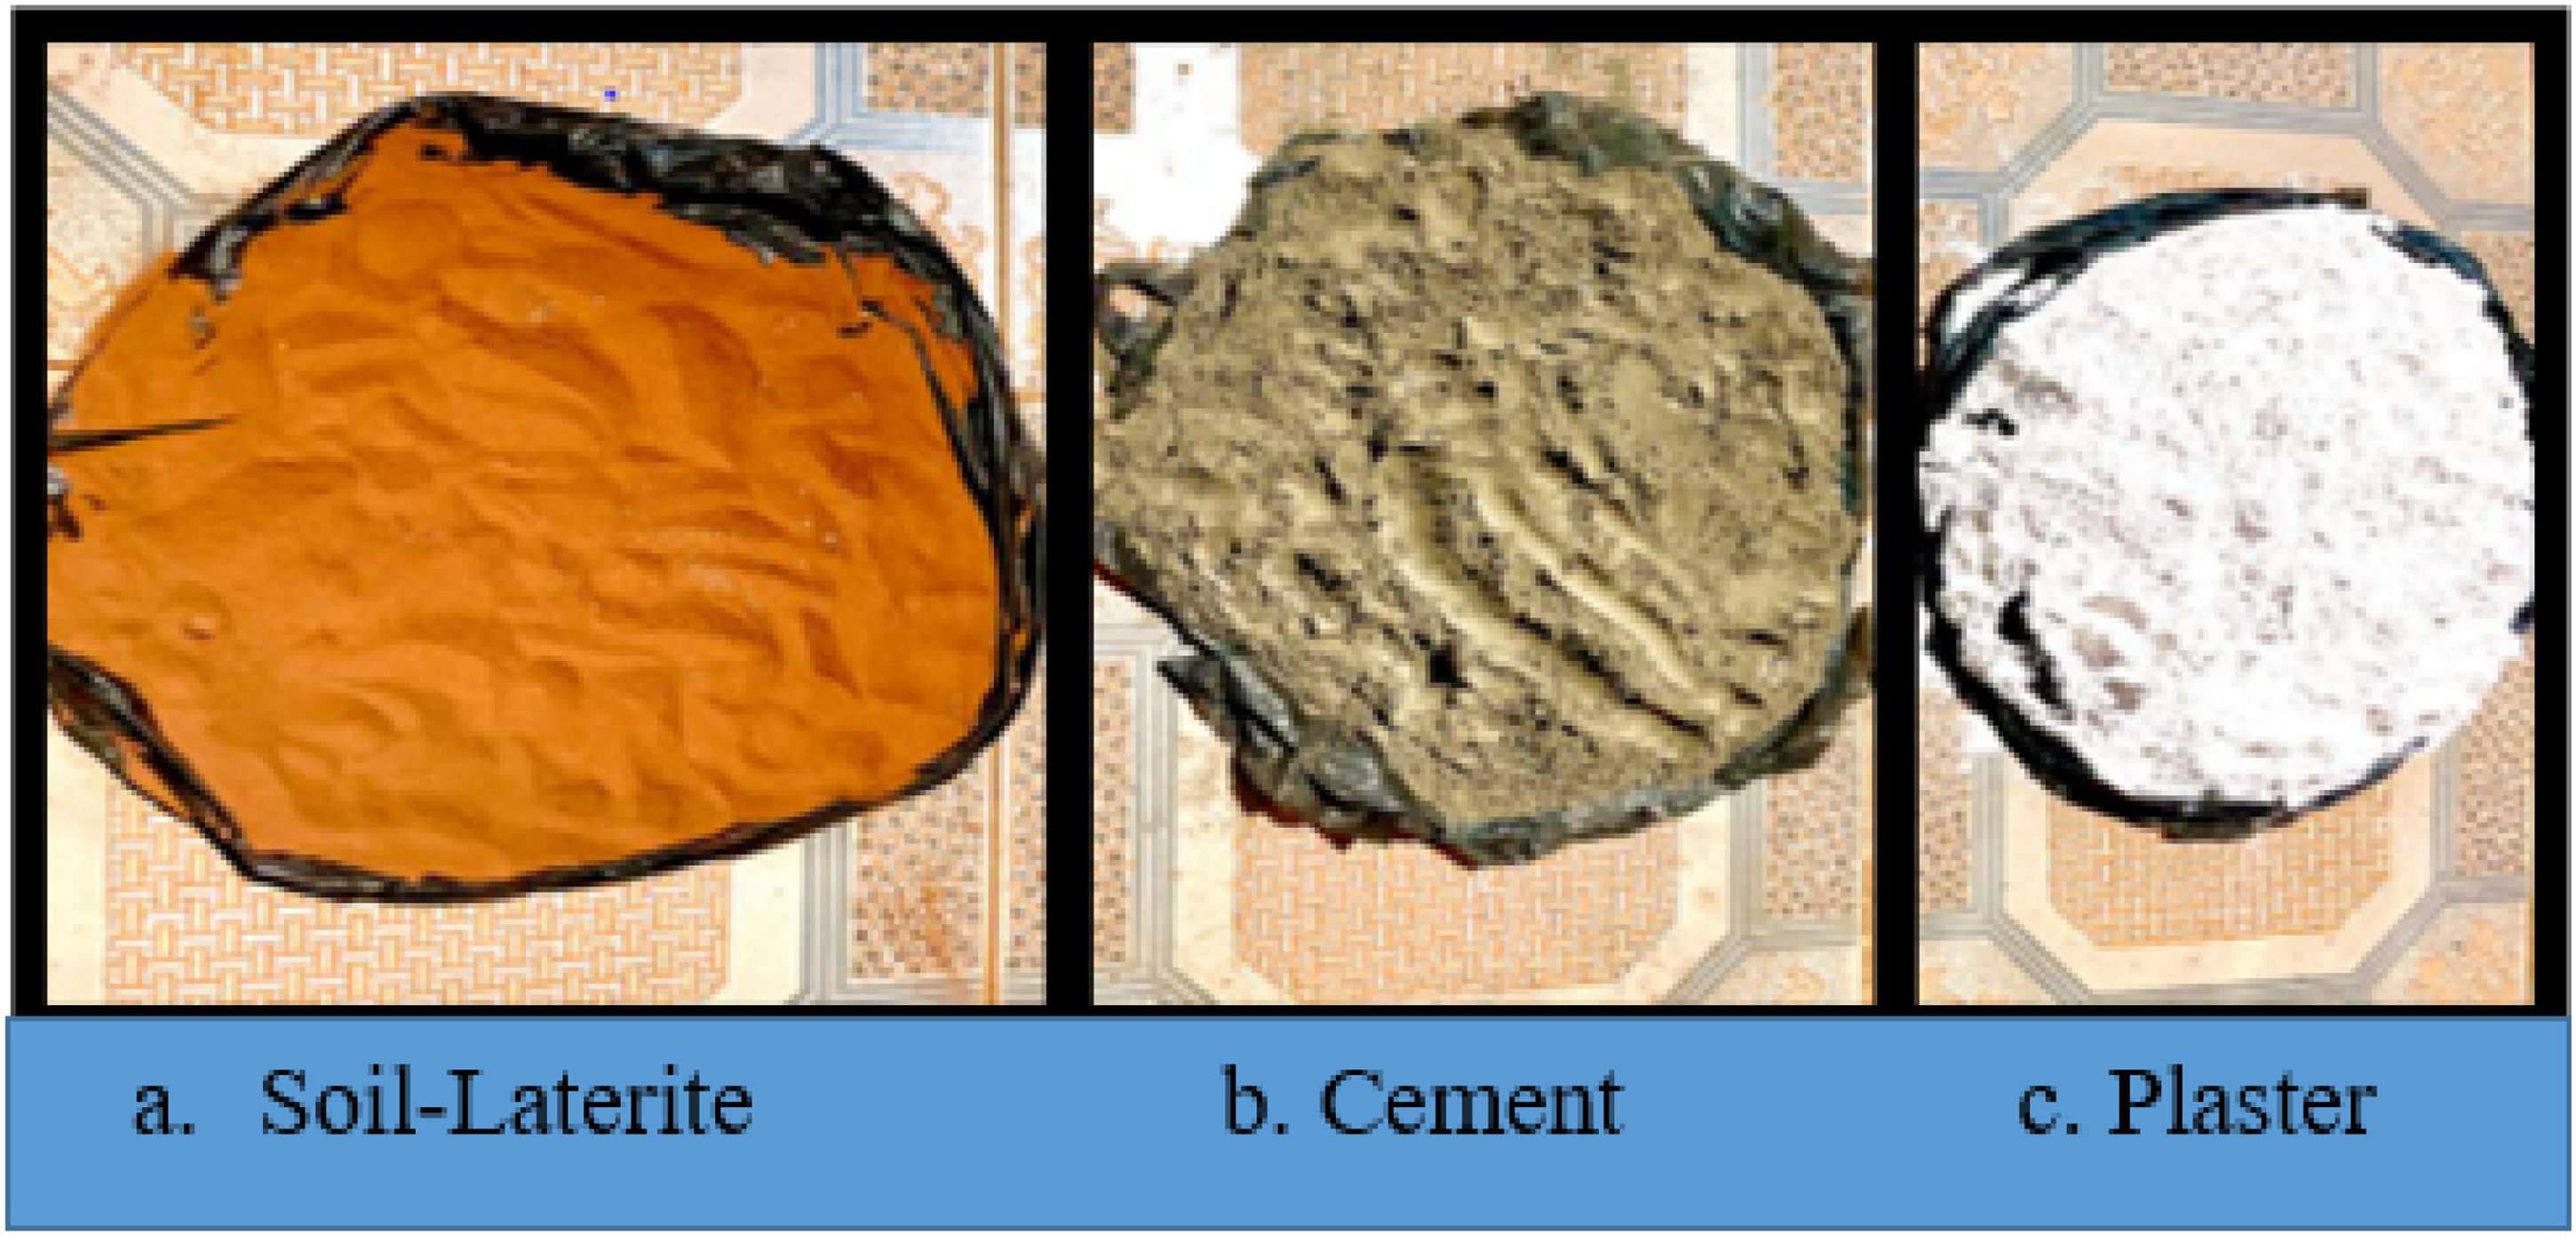
Dust samples used in the study.
Dust application procedure
A flour strainer with a sieve size of approximately 25–30 mm was used to evenly distribute the dust over the surface of the PV module, placed under sunlight. Data was collected for various concentrations of dust (10 g, 20 g, and 30 g), while monitoring changes in cell temperature, ambient temperature, and irradiance. The performance metrics, such as current, voltage, and power, were recorded in a real experimental environment to evaluate the effect of dust accumulation on the PV module's output.
Experimental setup
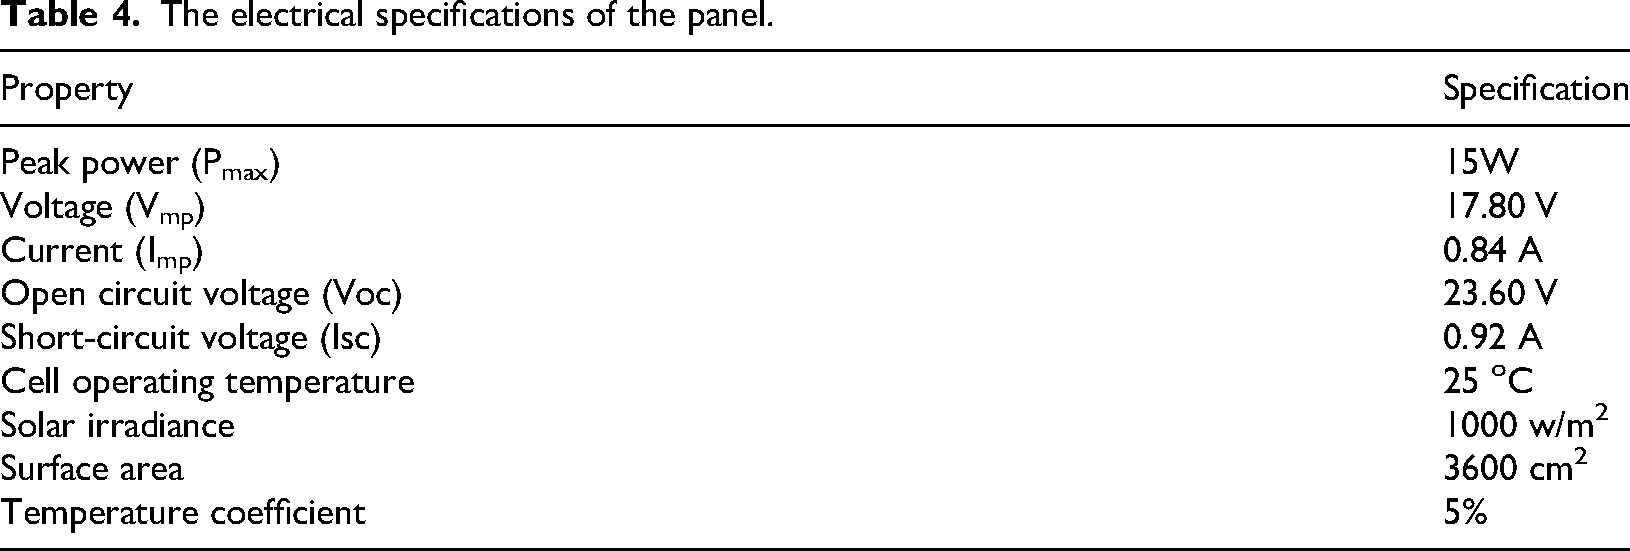
As illustrated in Figure 2, 10 solar PV panels were exposed to sunlight as part of an experimental setup designed to assess the impact of dust pollution on their performance. The panels were installed at a fixed tilt angle of 15.5˚ due south, optimised for solar exposure based on the sun-earth geometry and the geographical location of Kampala, Uganda. This angle was carefully documented to ensure consistency in sunlight capture. One panel was maintained in a clean state to serve as a control, while the remaining nine panels were subjected to varying levels of artificial dust pollution to simulate real-world environmental conditions. The panels were securely mounted to prevent shading from nearby objects and to preserve the integrity of the experimental setup. Each panel was constructed using silicon monocrystal cells, with electrical specifications provided in Table 4. The system was positioned in an outdoor environment to ensure uninterrupted and optimal sunlight exposure throughout the experiment. This arrangement enabled a controlled investigation into the effects of dust accumulation on PV panel efficiency and power output under realistic operating conditions.
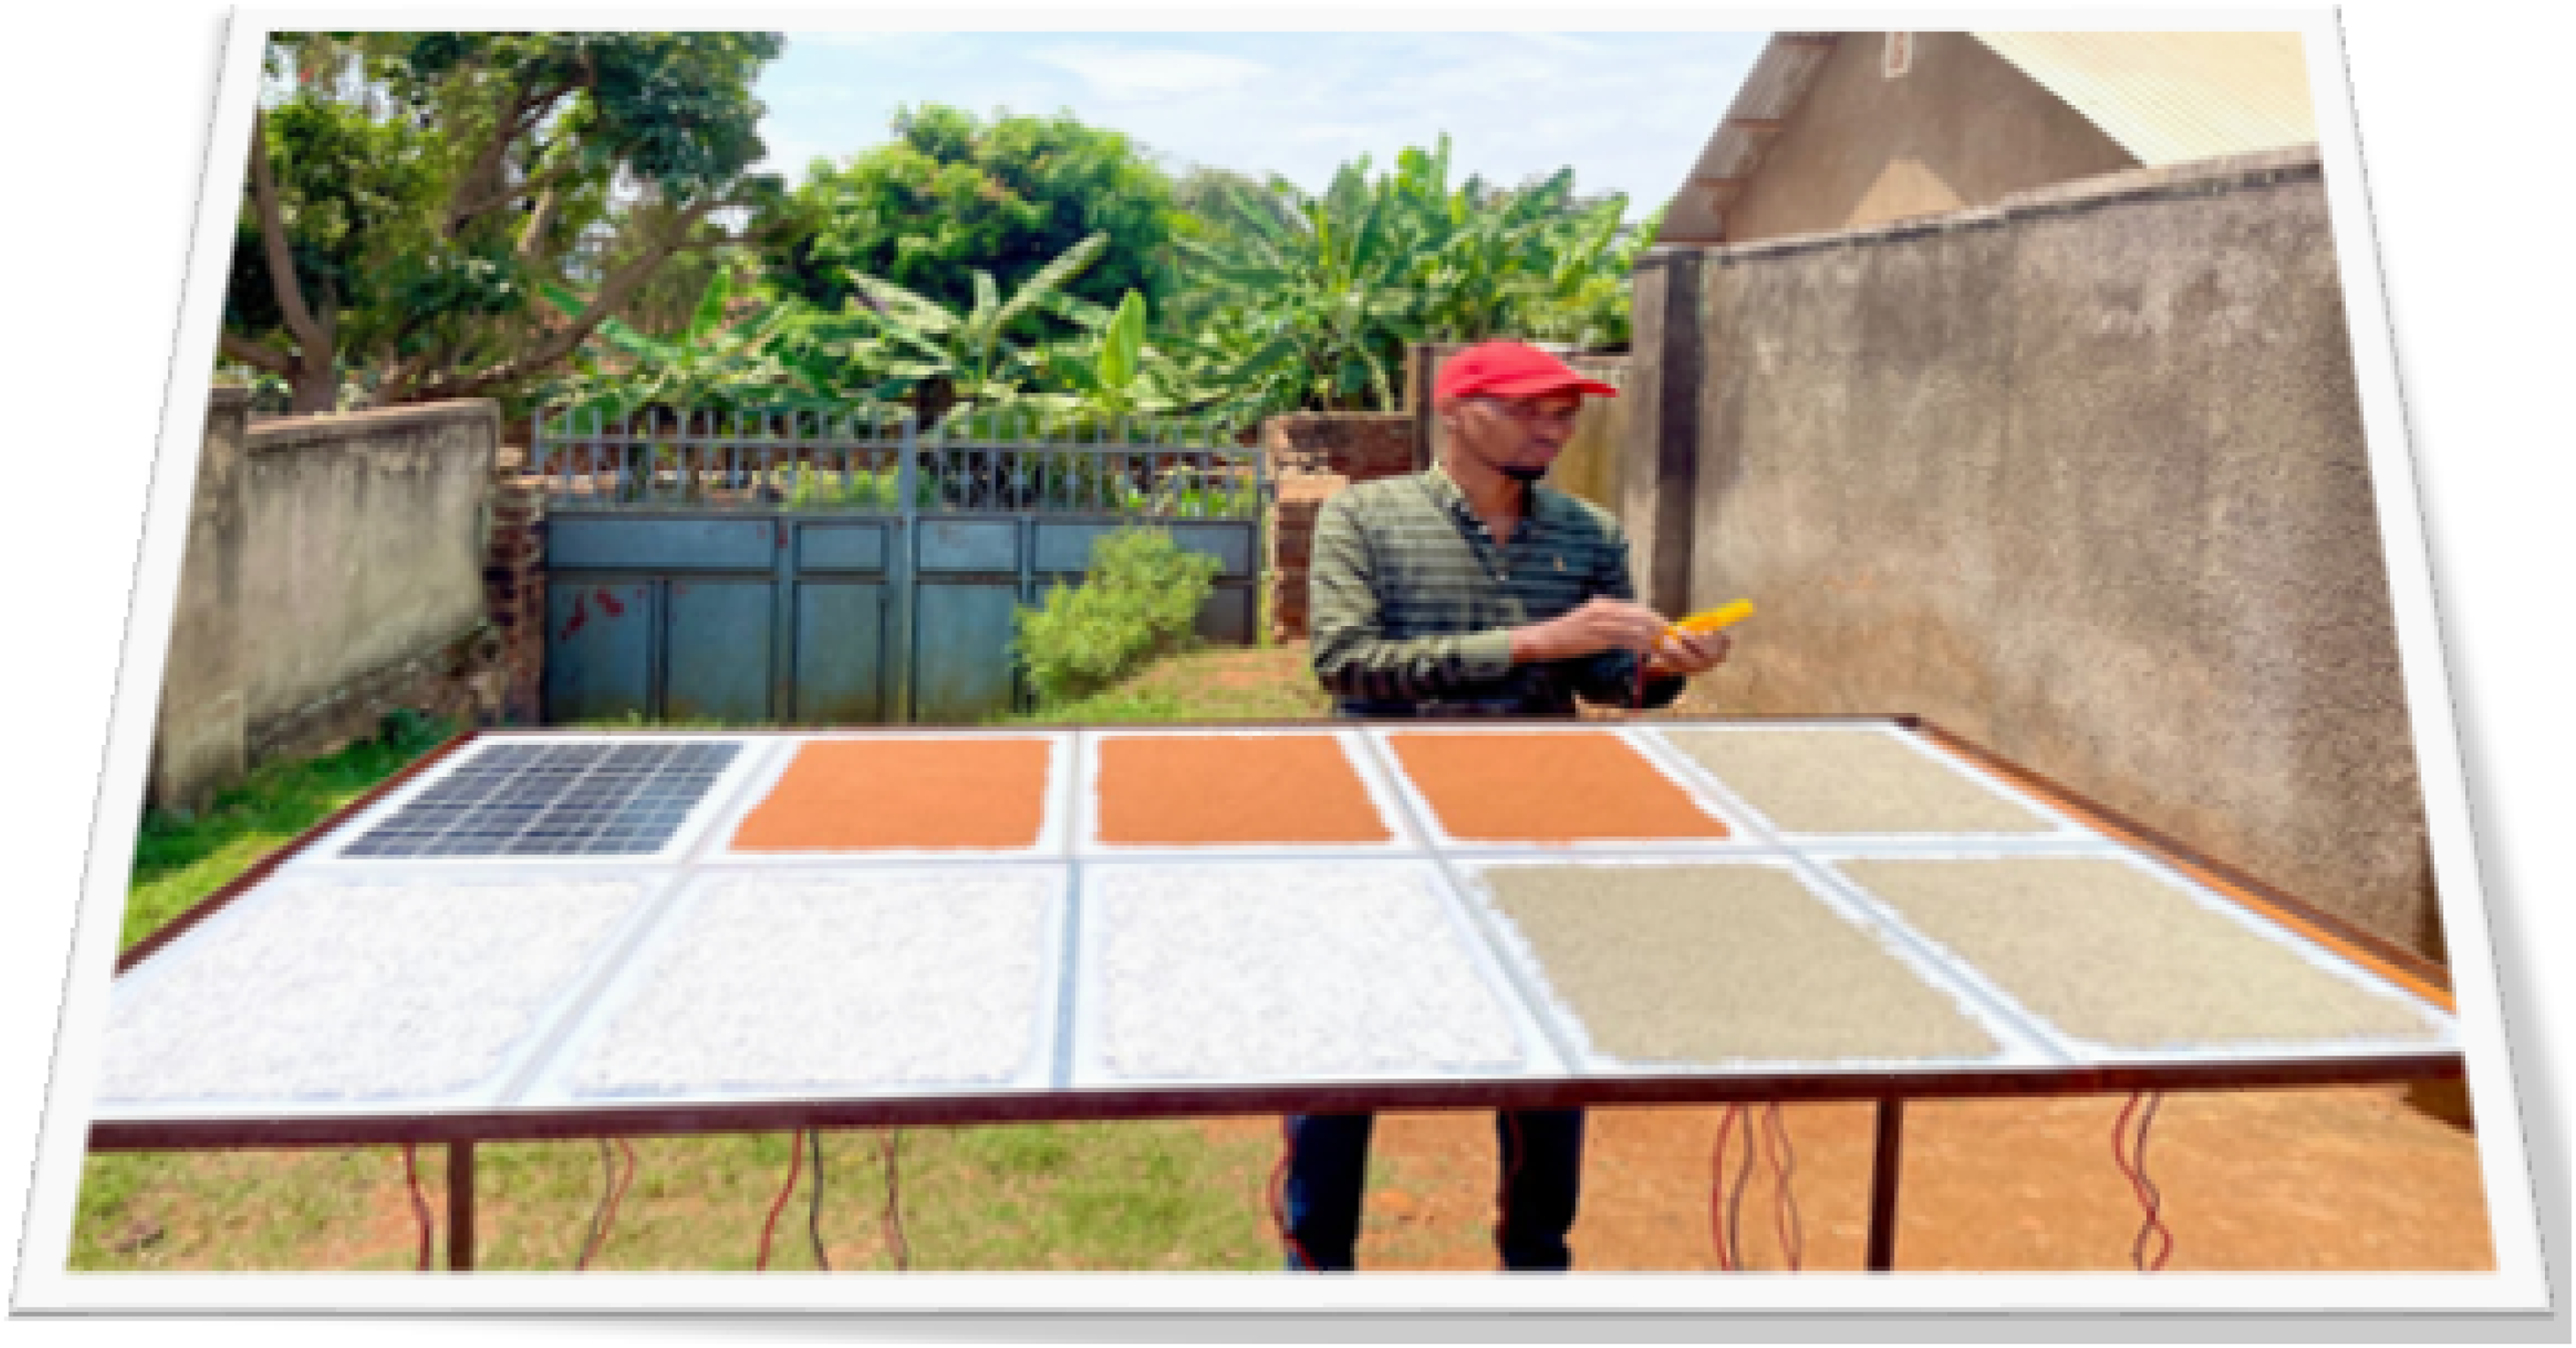
Exposed PV panels. PV: photovoltaic.
The electrical specifications of the panel.
Measurement tools
The instruments used in the study are shown in Figure 3.
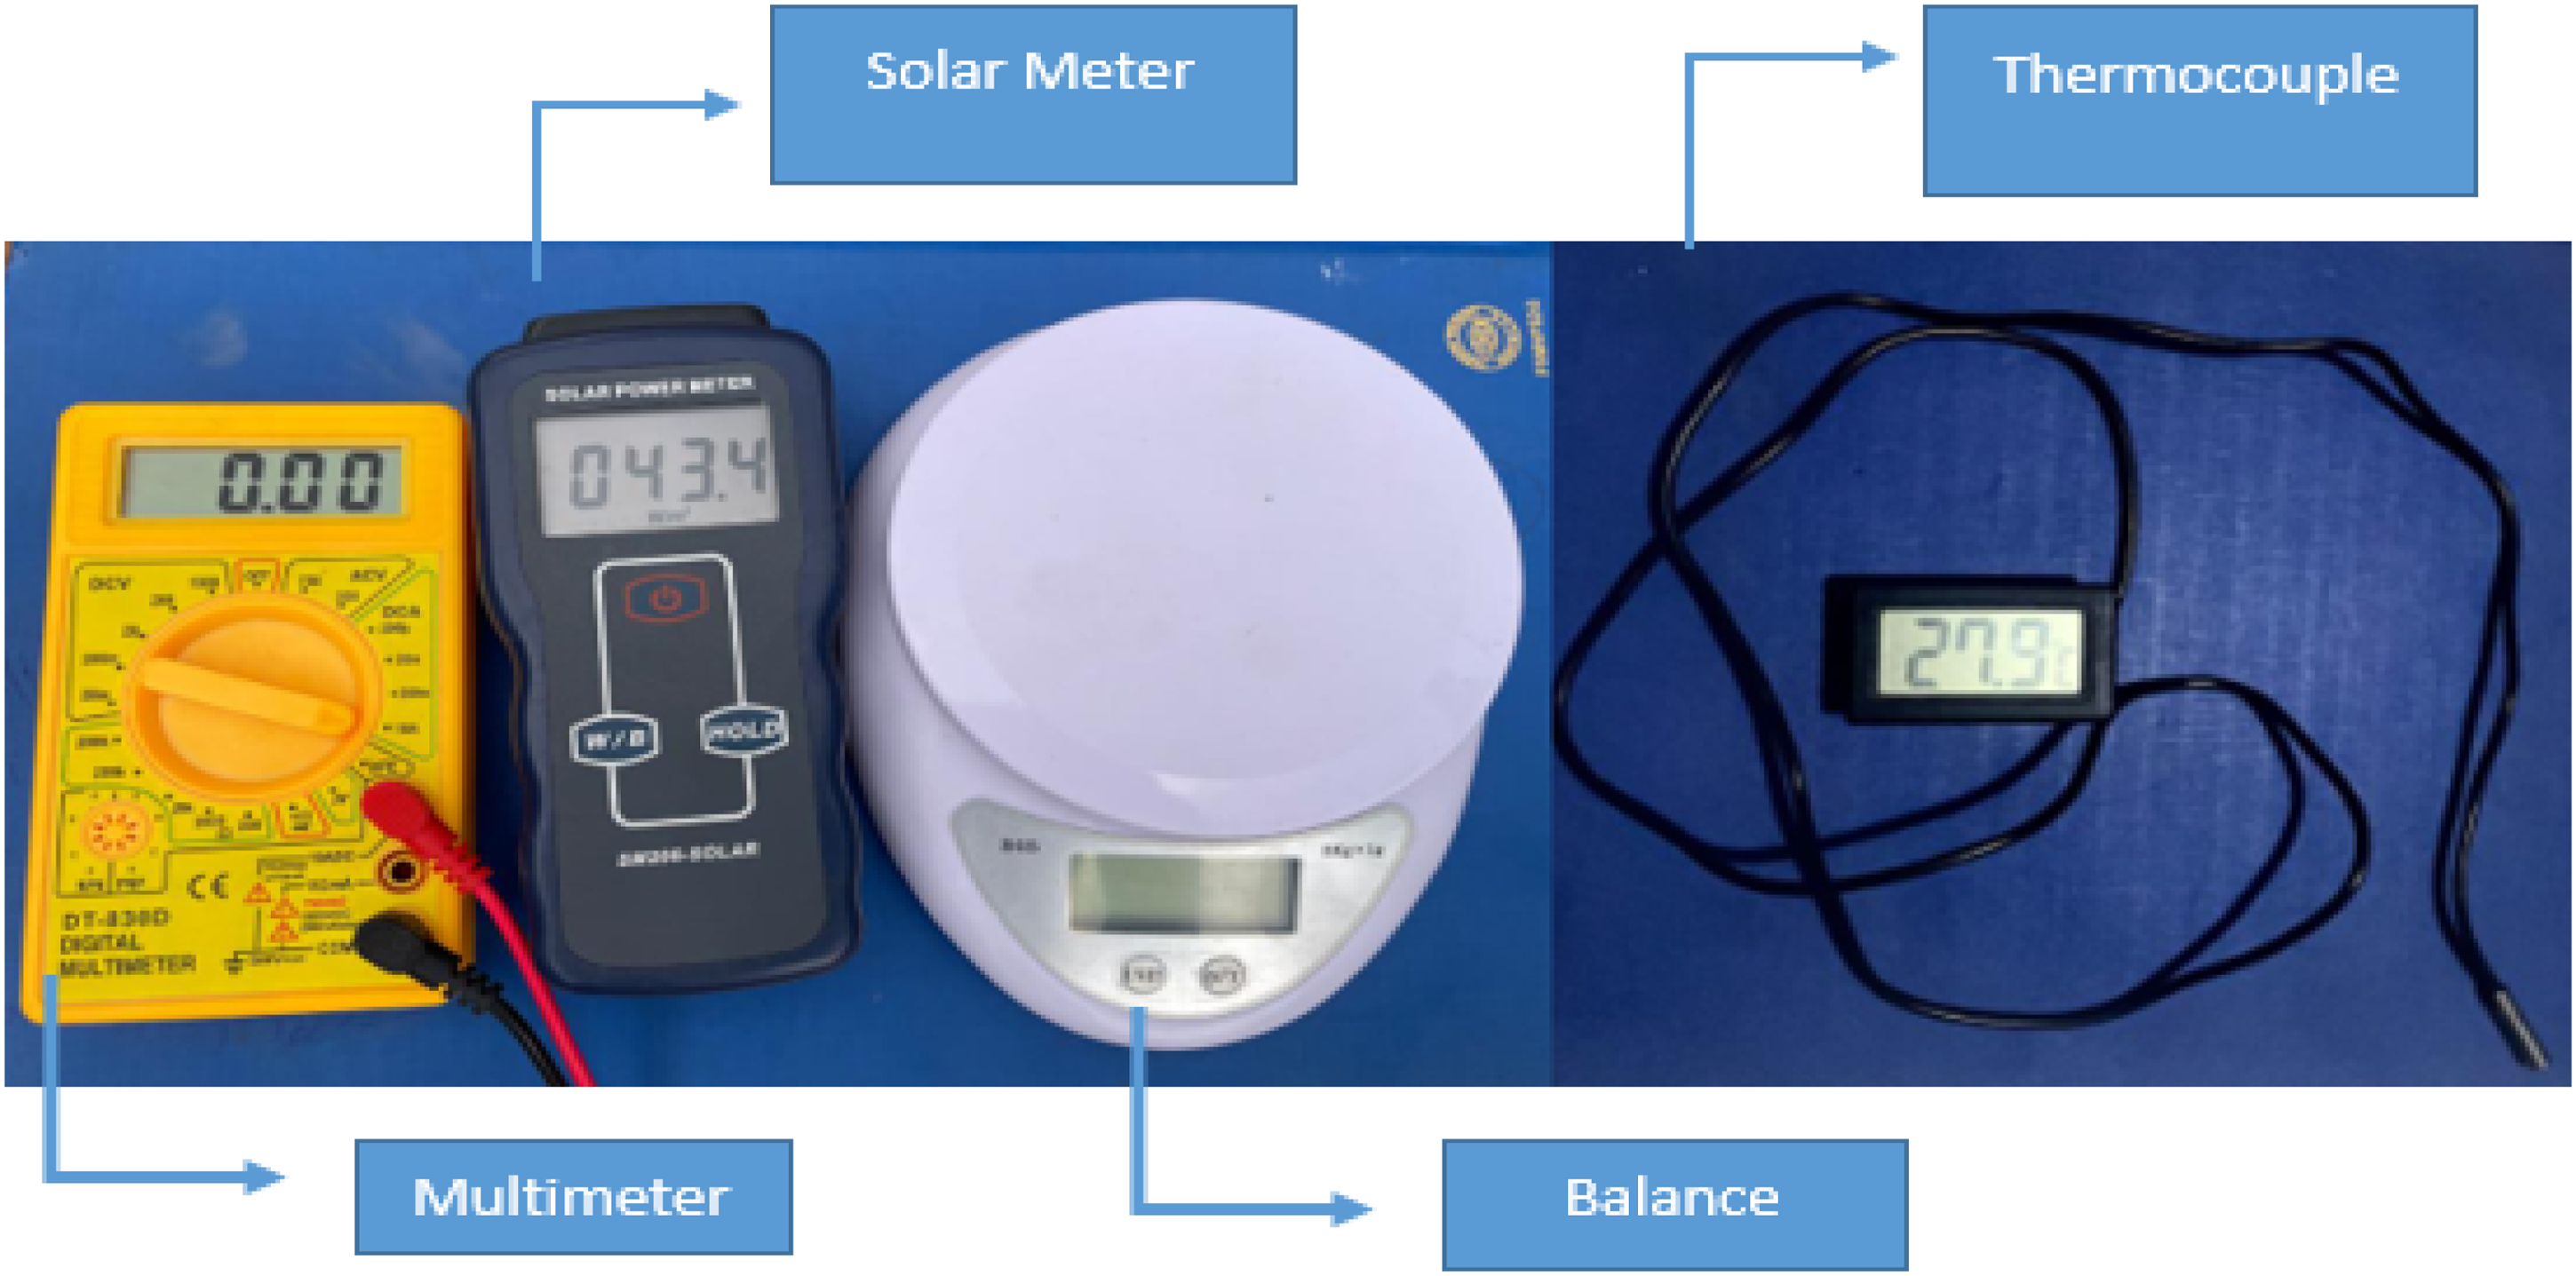
Instruments used in the study.
Specifications of multimeter (MASTECH, M3900).
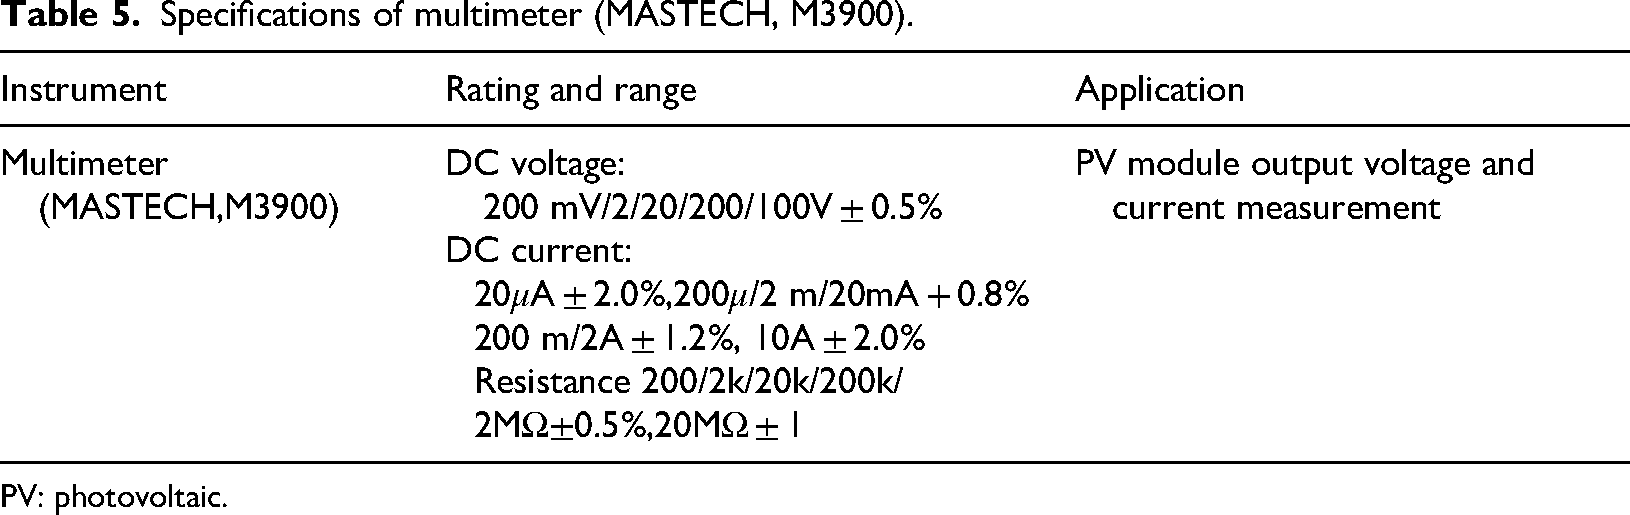
PV: photovoltaic.
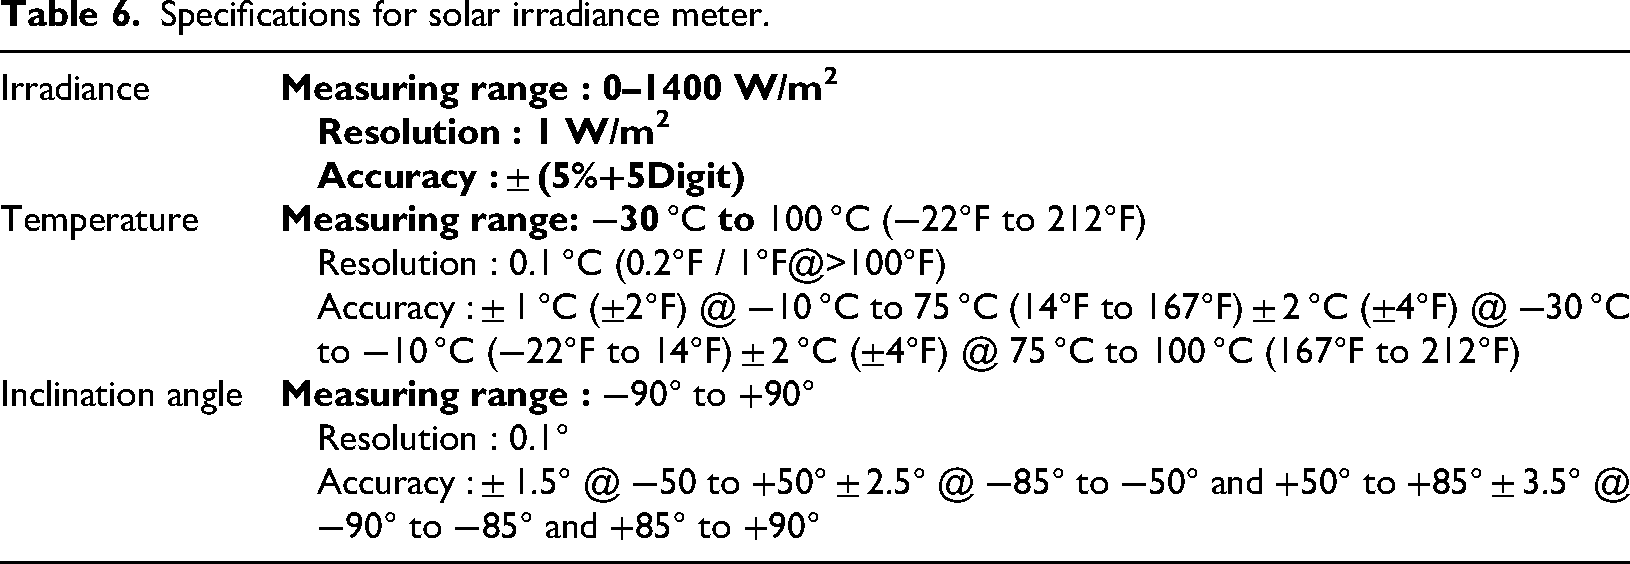
Specifications for solar irradiance meter.
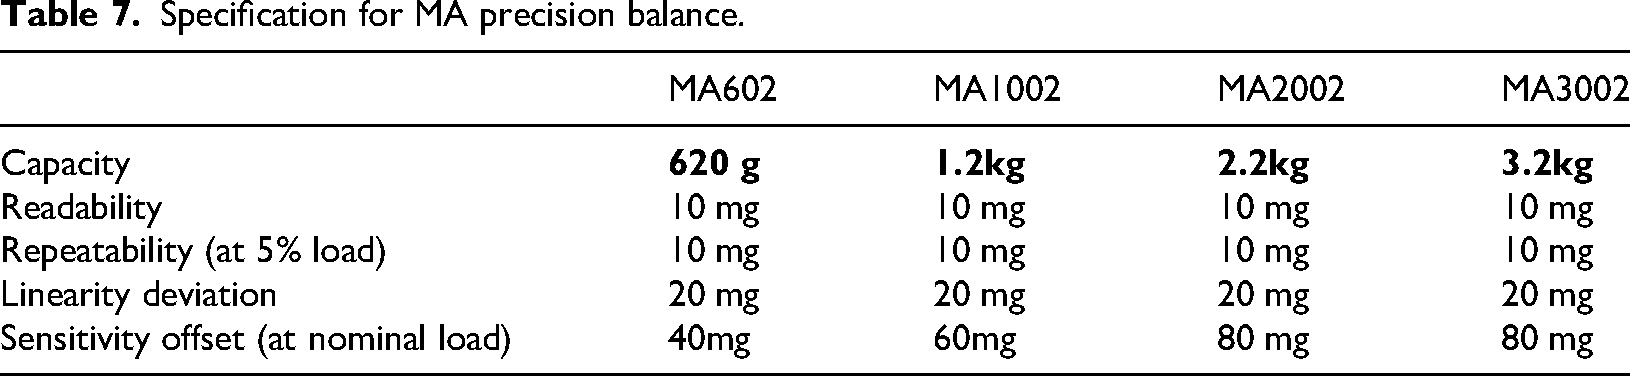
Specification for MA precision balance.
Mitigation strategies
To ensure the integrity and consistency of the experimental results, the study was designed with mitigation strategies that accounted for weather-related variables, primarily focusing on minimising the effects of rainfall, wind, and fluctuating irradiance. The experiment was deliberately conducted during the dry season in Kampala, Uganda, characterised by limited rainfall and intermittent cloud cover. This period provided an optimal environment to evaluate dust accumulation on PV panels without interference from natural cleaning effects such as rain. Low-wind conditions were specifically selected to mitigate the potential displacement of dust from the PV panels. Wind-induced dust removal could introduce inconsistencies in dust accumulation levels, thereby affecting measurement reliability. The stability of the accumulated dust layer was further ensured through daily visual inspections and documentation, confirming that no significant displacement occurred due to wind or other environmental factors. The artificial application of predetermined quantities of cement, plaster, and soil-laterite dust was another key mitigation strategy. This controlled application ensured uniform distribution across the panel surfaces, thereby eliminating the variability associated with natural dust deposition patterns. Additionally, the intrinsic properties of the selected dust types - such as fine particle size, cohesive characteristics, and mineral content (e.g. calcium oxide in cement and ferric oxide in soil-laterite)—enhanced adhesion to the panel surfaces. These properties minimised the likelihood of dust detachment under mild wind conditions, ensuring that the accumulation remained stable throughout the experiment. While varying cloud cover and sunshine levels influenced solar irradiance, they did not directly affect dust accumulation or removal. To mitigate irradiance variability, measurements of current, voltage, power, irradiance, and temperature were taken at consistent times daily, maintaining uniform environmental conditions during data collection. By integrating these mitigation measures—selection of the dry season, low-wind periods, controlled dust application, frequent inspections, and standardised measurement times—the experimental design successfully isolated the effects of dust accumulation from weather-related factors. This approach ensured the reliability and validity of the findings, accurately representing real-world conditions where dust build-up on PV panels is more pronounced in the absence of rain and significant wind activity.
Measuring photovoltaic panel performance parameters
The performance parameters of PV panels were systematically evaluated through precise measurements of solar irradiance and temperature, utilising a solar irradiance meter and a thermometer, respectively. In addition, voltage and current outputs were recorded at regular intervals using a multimeter for both clean and dust-covered panels to assess performance variations throughout the day. Ten PV panels were installed in a mounted position to optimise sunlight capture. One panel was maintained in a clean state as a control, while the remaining nine panels were artificially exposed to different concentrations (10 g, 20 g, and 30 g) of each dust type. Key performance parameters, including current, voltage, cell temperature, ambient temperature, and irradiance, were recorded at 15-min intervals from 9:00 AM to 5:00 PM daily. The experiment was conducted for ten days, with average values recorded for analysis. Based on these measurements, the electrical power output and efficiency were calculated as follows:

Investigating the impact of selected dust (cement, plaster, and soil-laterite) concentrations on solar photovoltaic panel performance
This study examined the impact of dust accumulation on the performance of solar PV panels by analysing key parameters such as power output, voltage, current, and efficiency. To quantify this impact, correlation analysis was carried out using SPSS 30 to assess the strength and direction of the association between dust concentration and solar panel performance. Additionally, regression analysis was also utilised using SPSS 30 to model the effect of dust concentration on efficiency and other performance metrics, allowing for the prediction of performance variations based on dust accumulation. Visual representations, including line graphs and bar charts, were also used to illustrate these effects. By comparing regression coefficients across different dust types, the study determined which type had the most significant impact on solar panel efficiency.
Result
Photovoltaic panel performance parameters
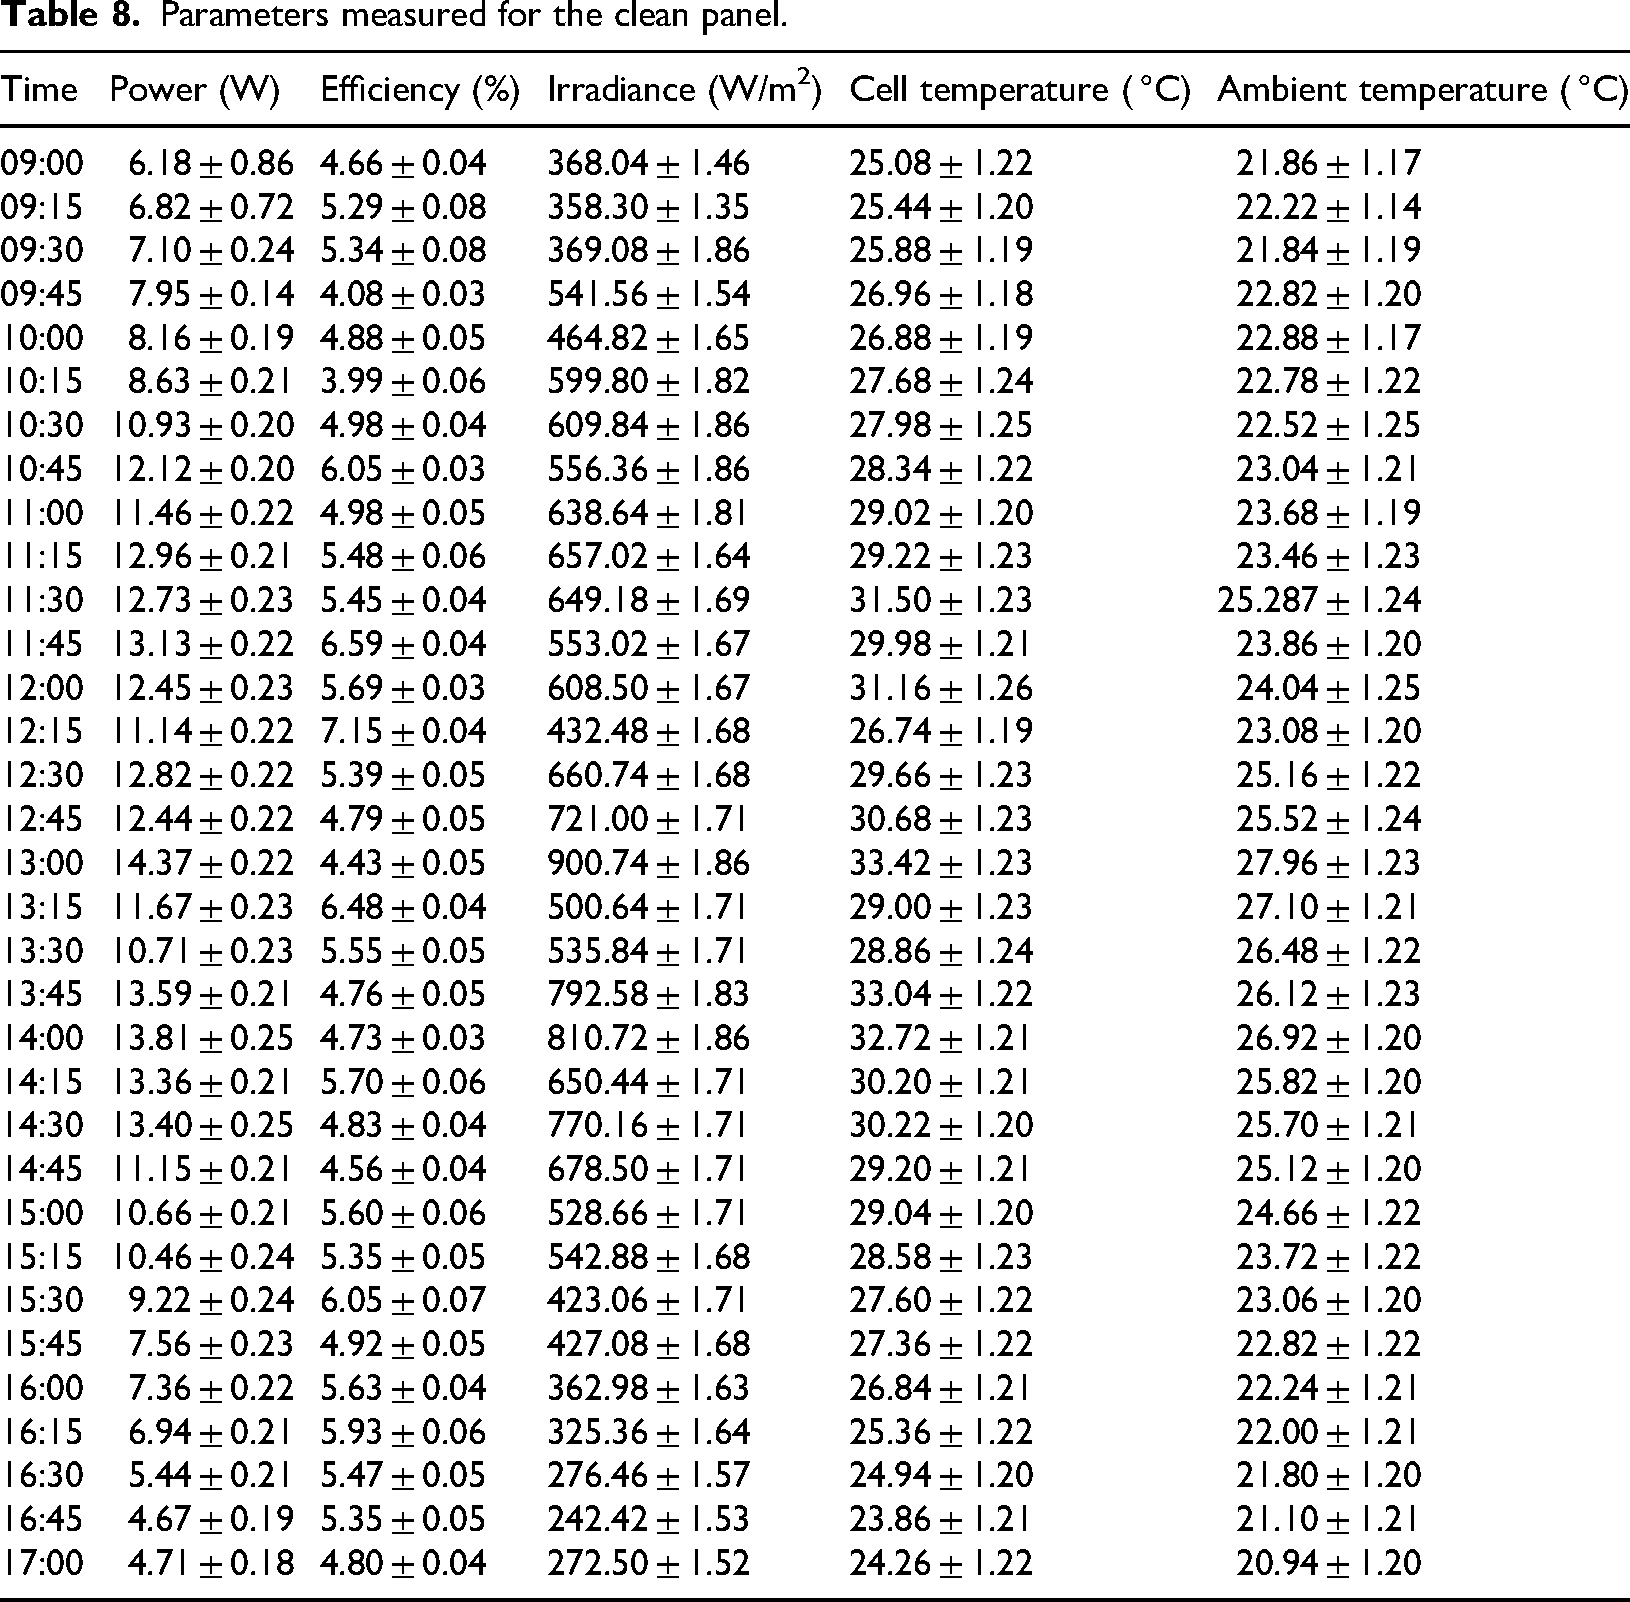
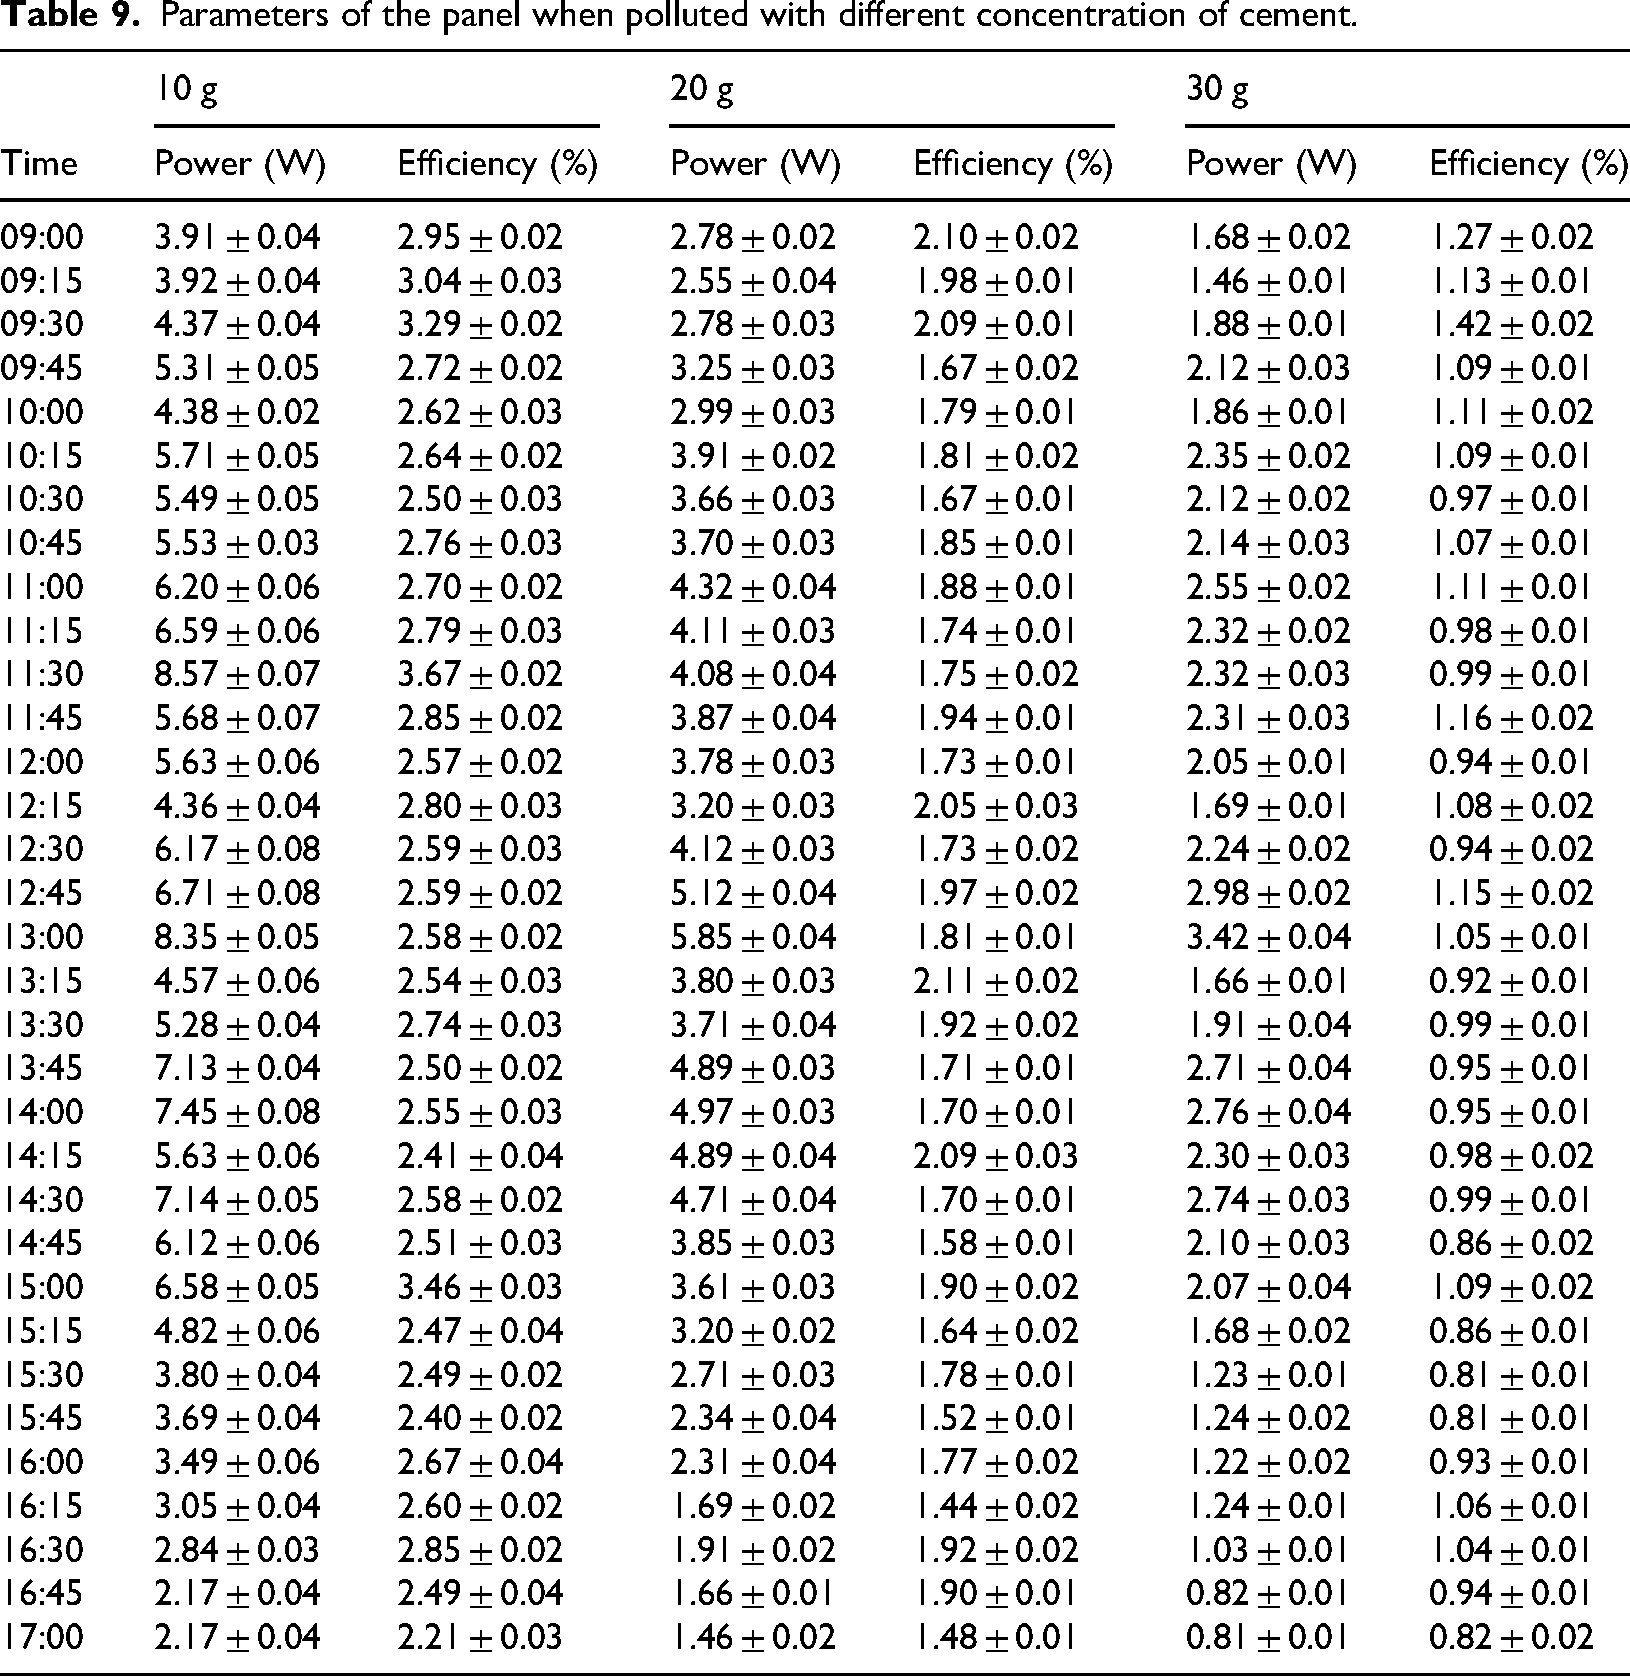
A clean panel was used as the control, with its data presented in Table 8. The impact of varying concentrations of cement dust on panel performance is presented in Table 9, highlighting the relationship between dust accumulation and efficiency loss. Higher concentrations of cement dust lead to more significant reductions in energy output, making it a crucial factor for solar panel maintenance. Similarly, Table 10 presents data on energy output for panels exposed to different concentrations of plaster dust. Additionally, Table 11 presents the results for panels subjected to varying concentrations of soil-laterite dust. The values of Irradiance (W/m2), Cell Temperature ( °C), and Ambient Temperature ( °C) remain the same for all the panels at the given time as indicated in Table 8.
Parameters measured for the clean panel.
Parameters of the panel when polluted with different concentration of cement.
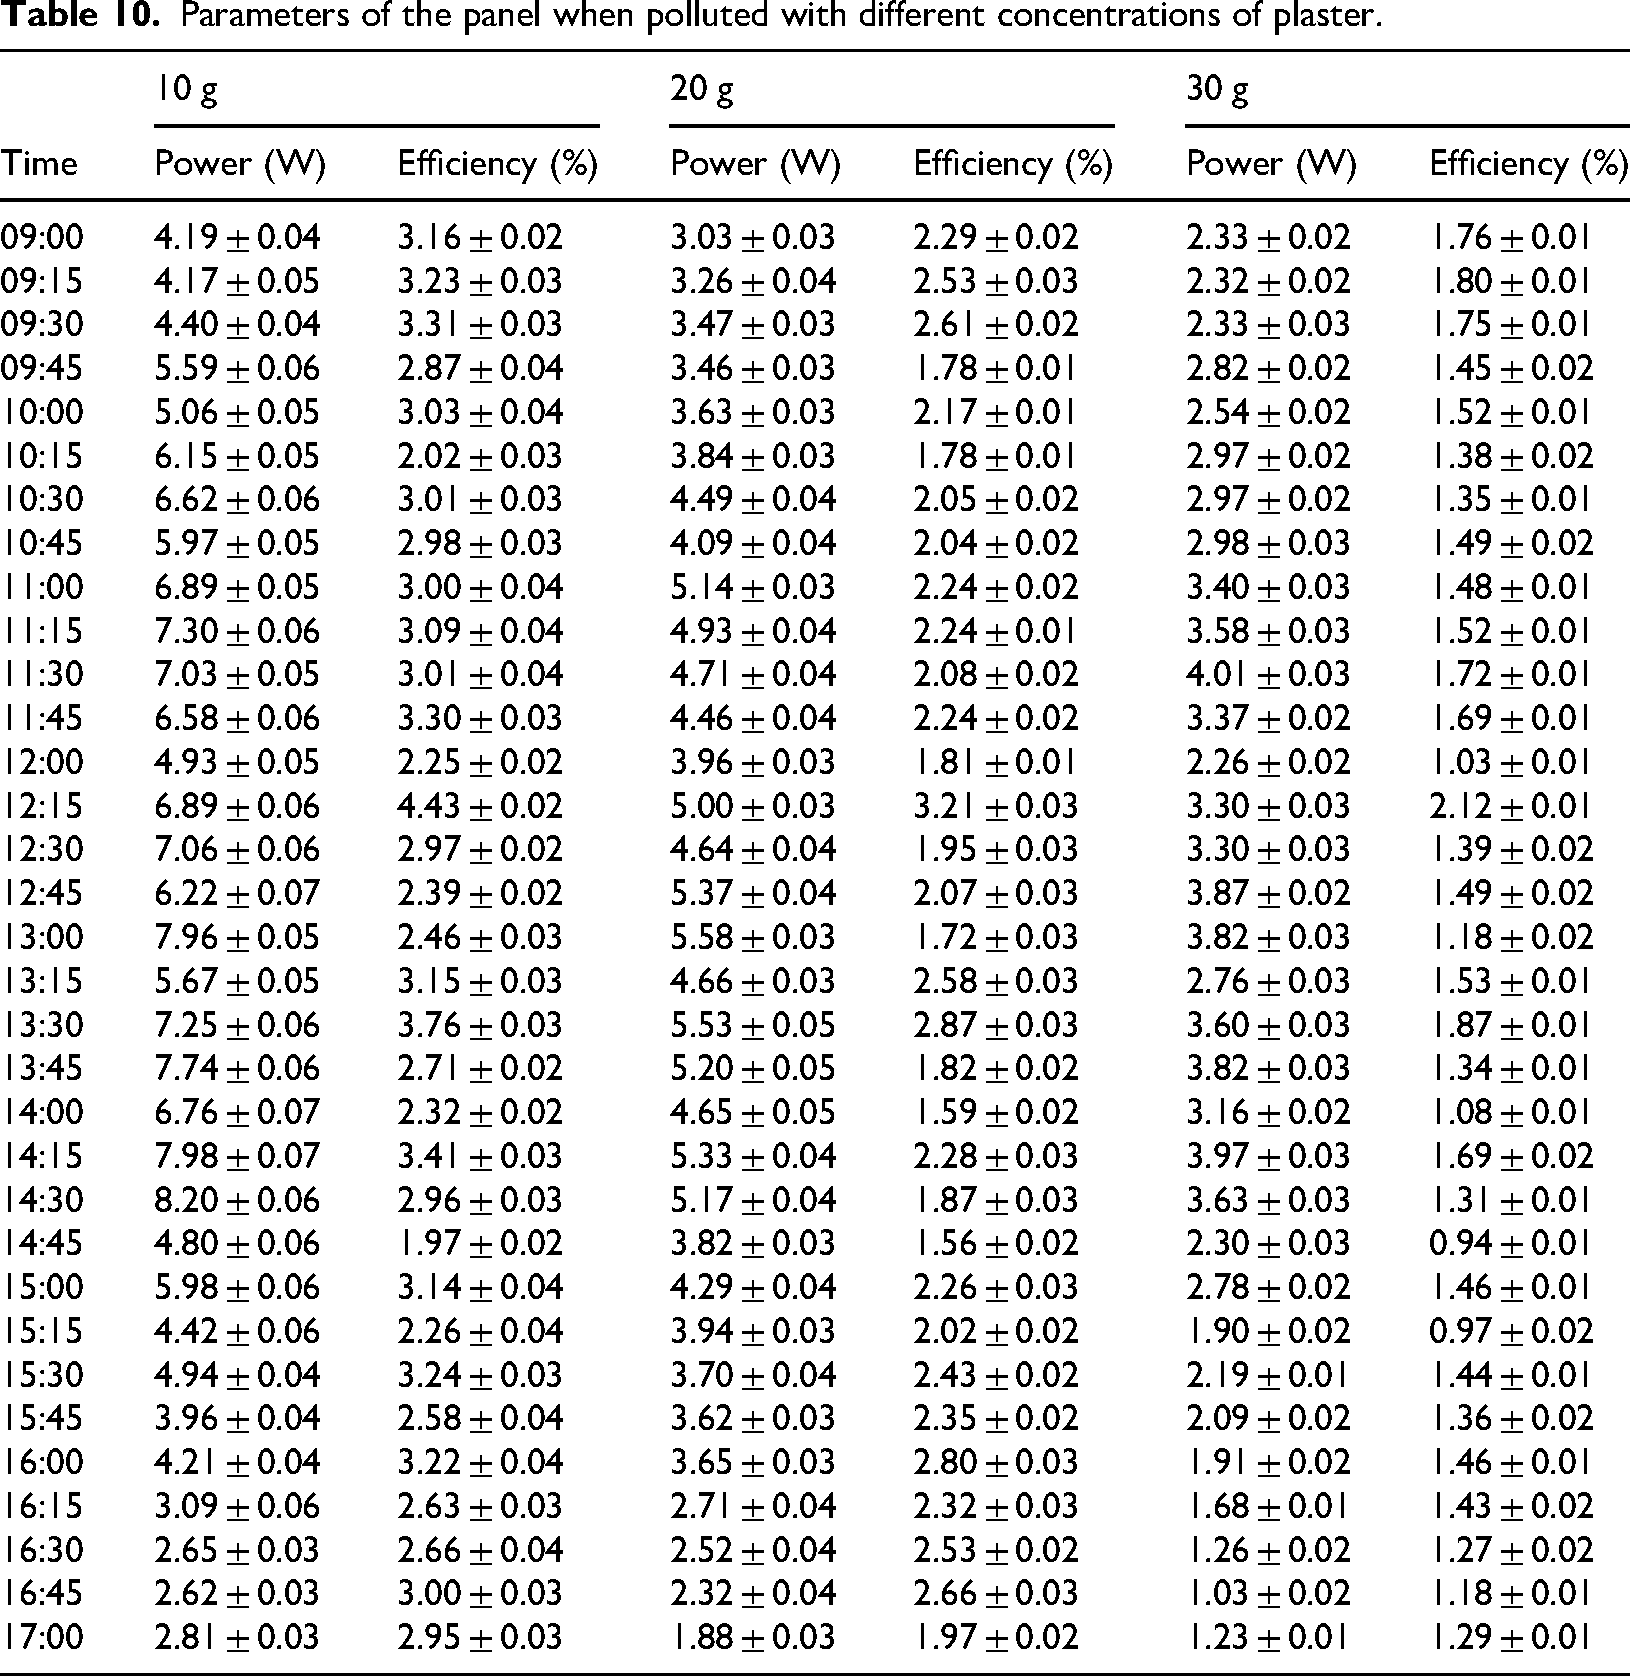
Parameters of the panel when polluted with different concentrations of plaster.
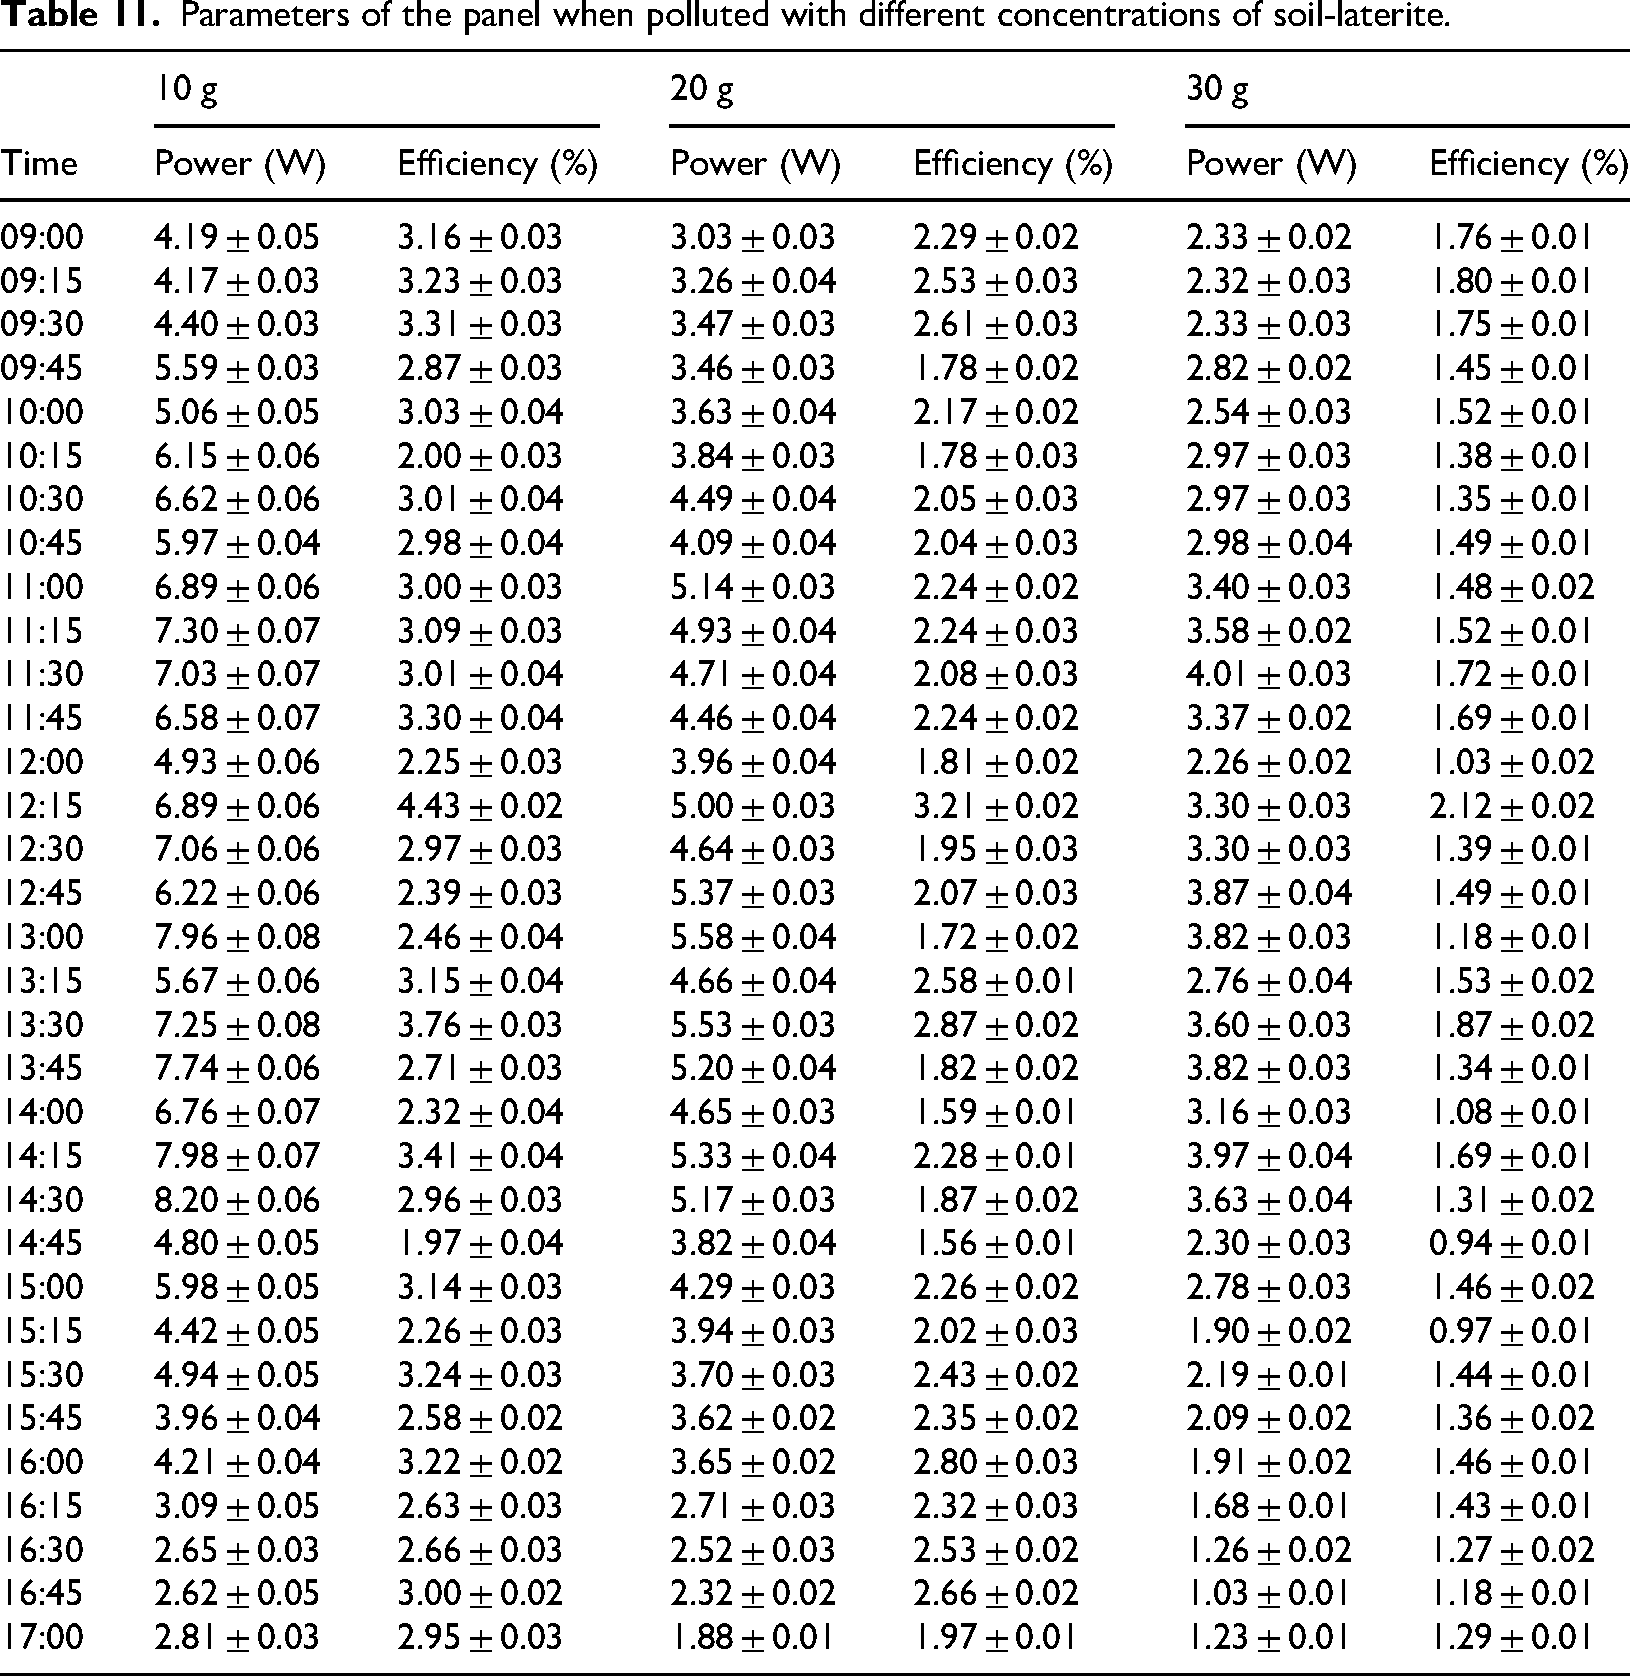
Parameters of the panel when polluted with different concentrations of soil-laterite.
Power output and efficiency were compared with varying amounts of dust concentrations, specifically 10 g, 20 g, and 30 g as shown in Figures 4–9. There is a progressive decline, clearly illustrating a negative relationship between dust concentration and the power output and the panel's efficiency.
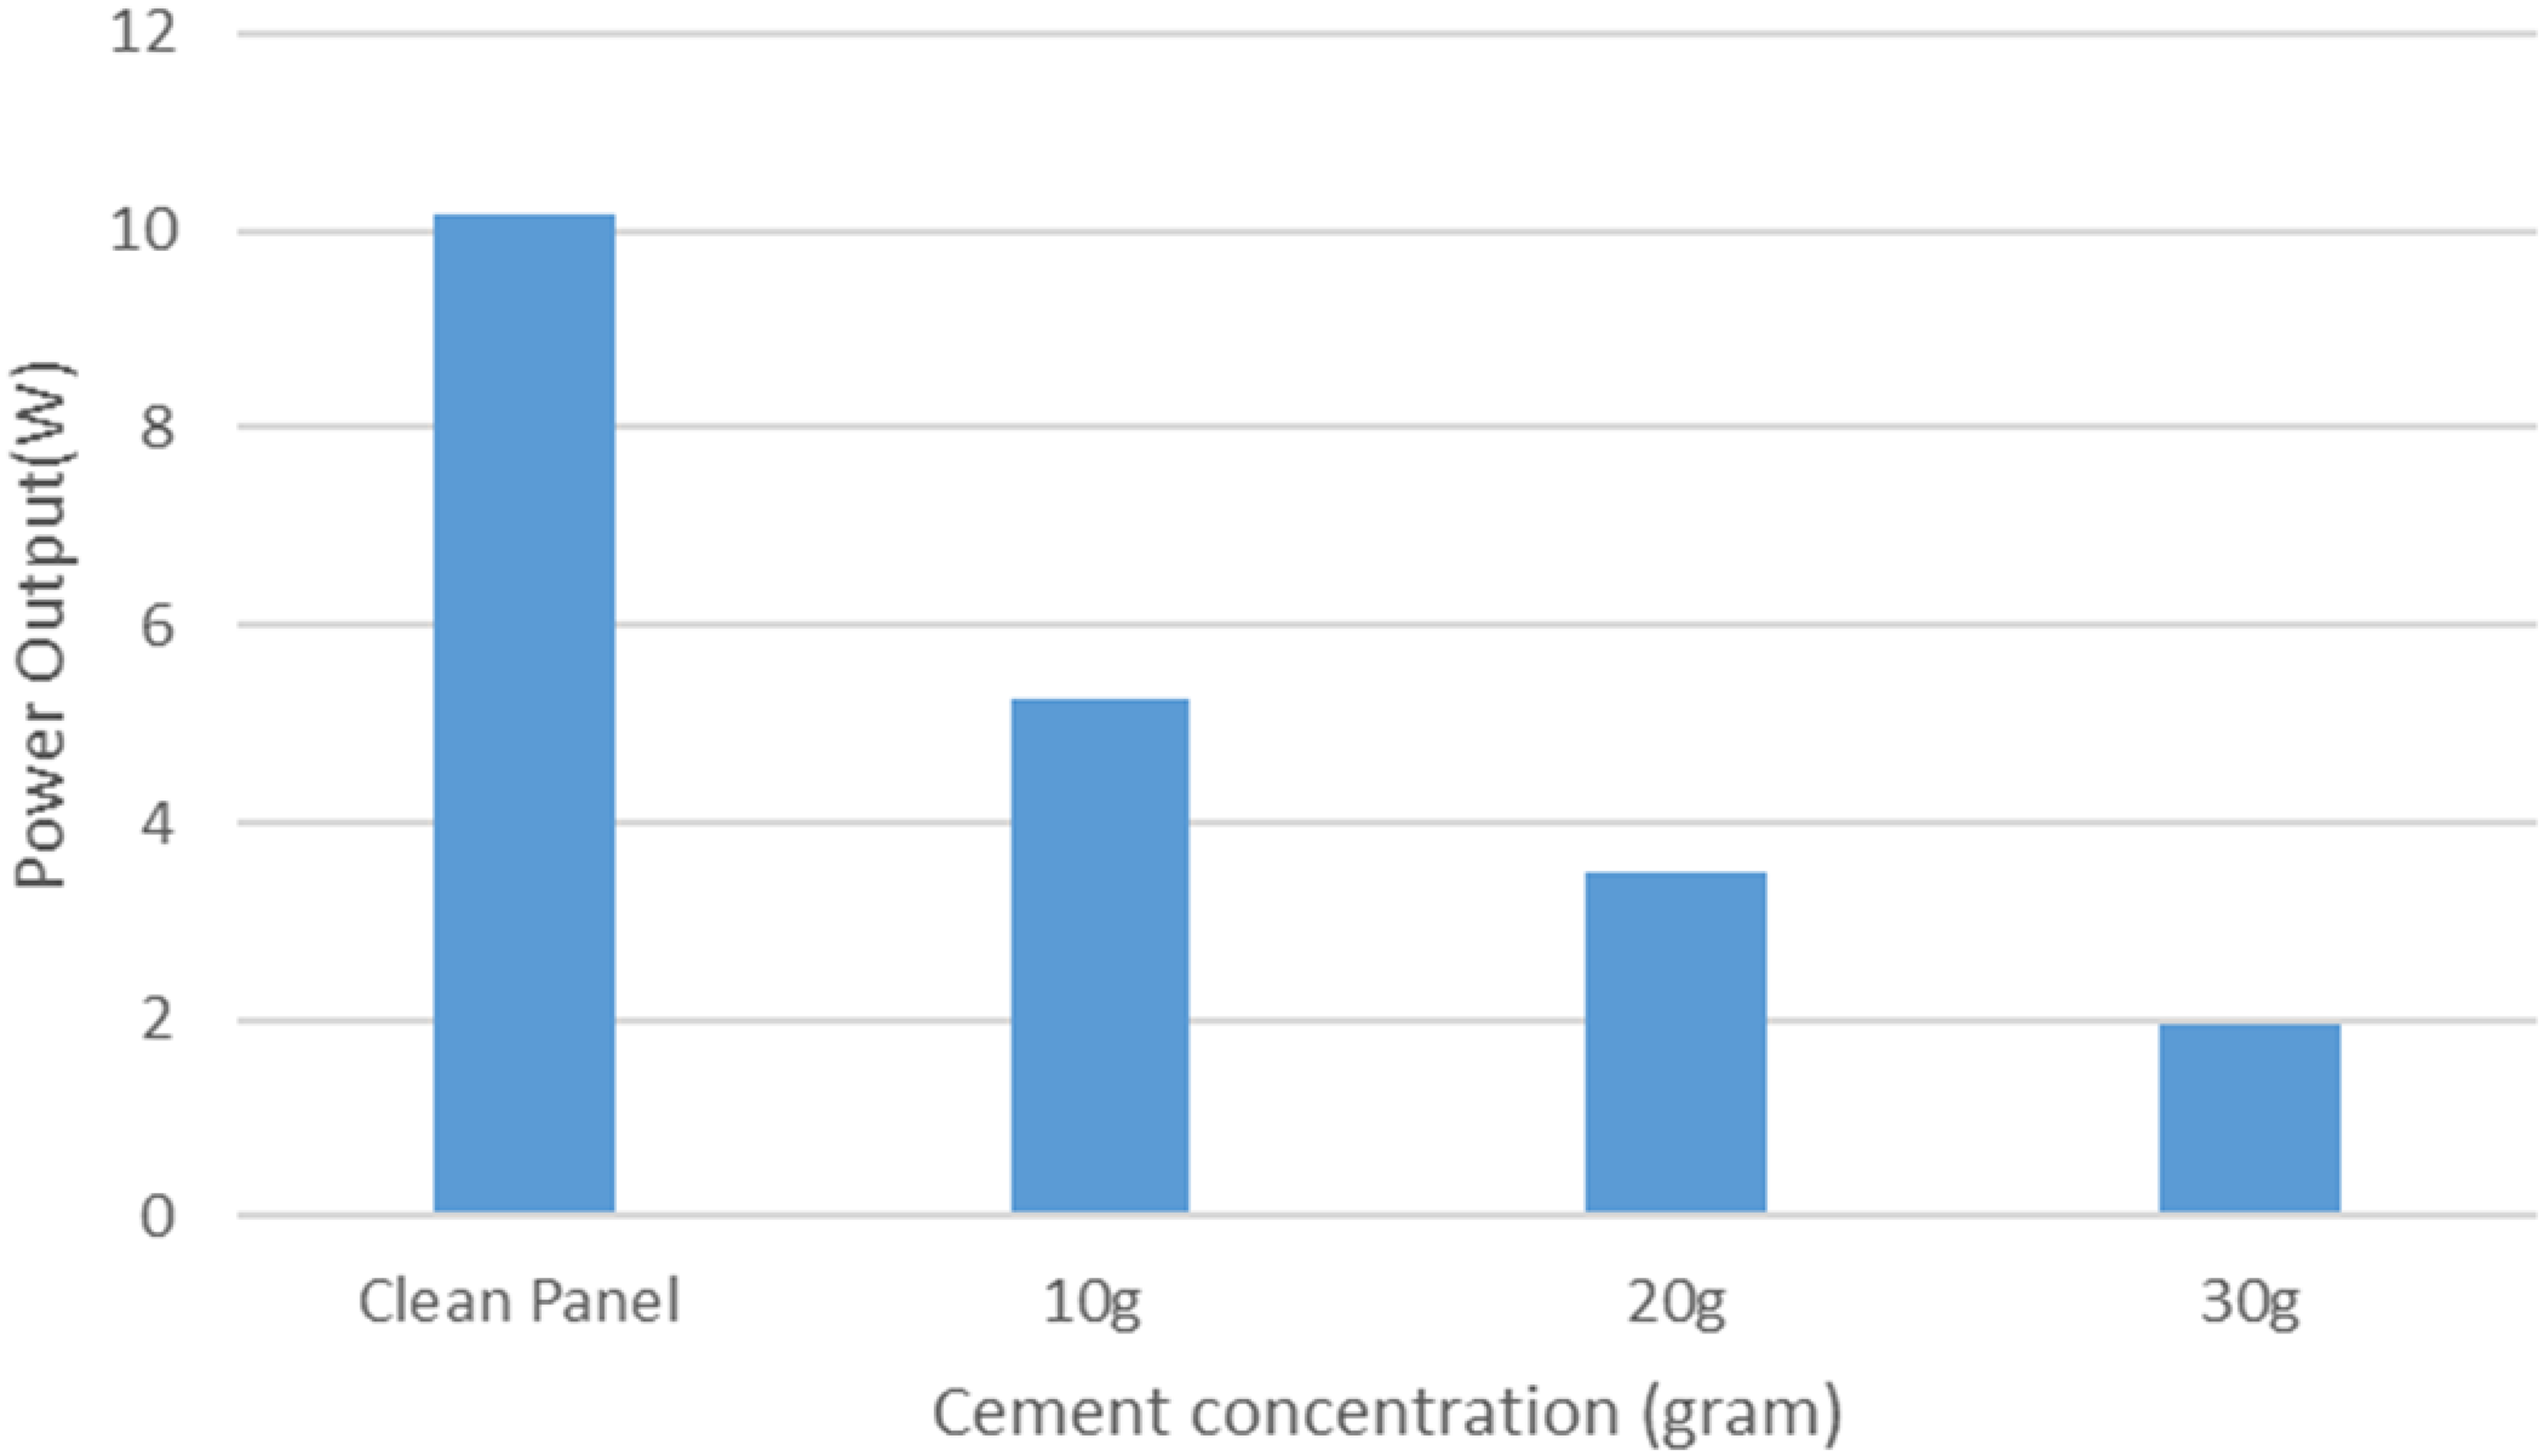
The impact of cement concentration on the PV power. PV: photovoltaic.
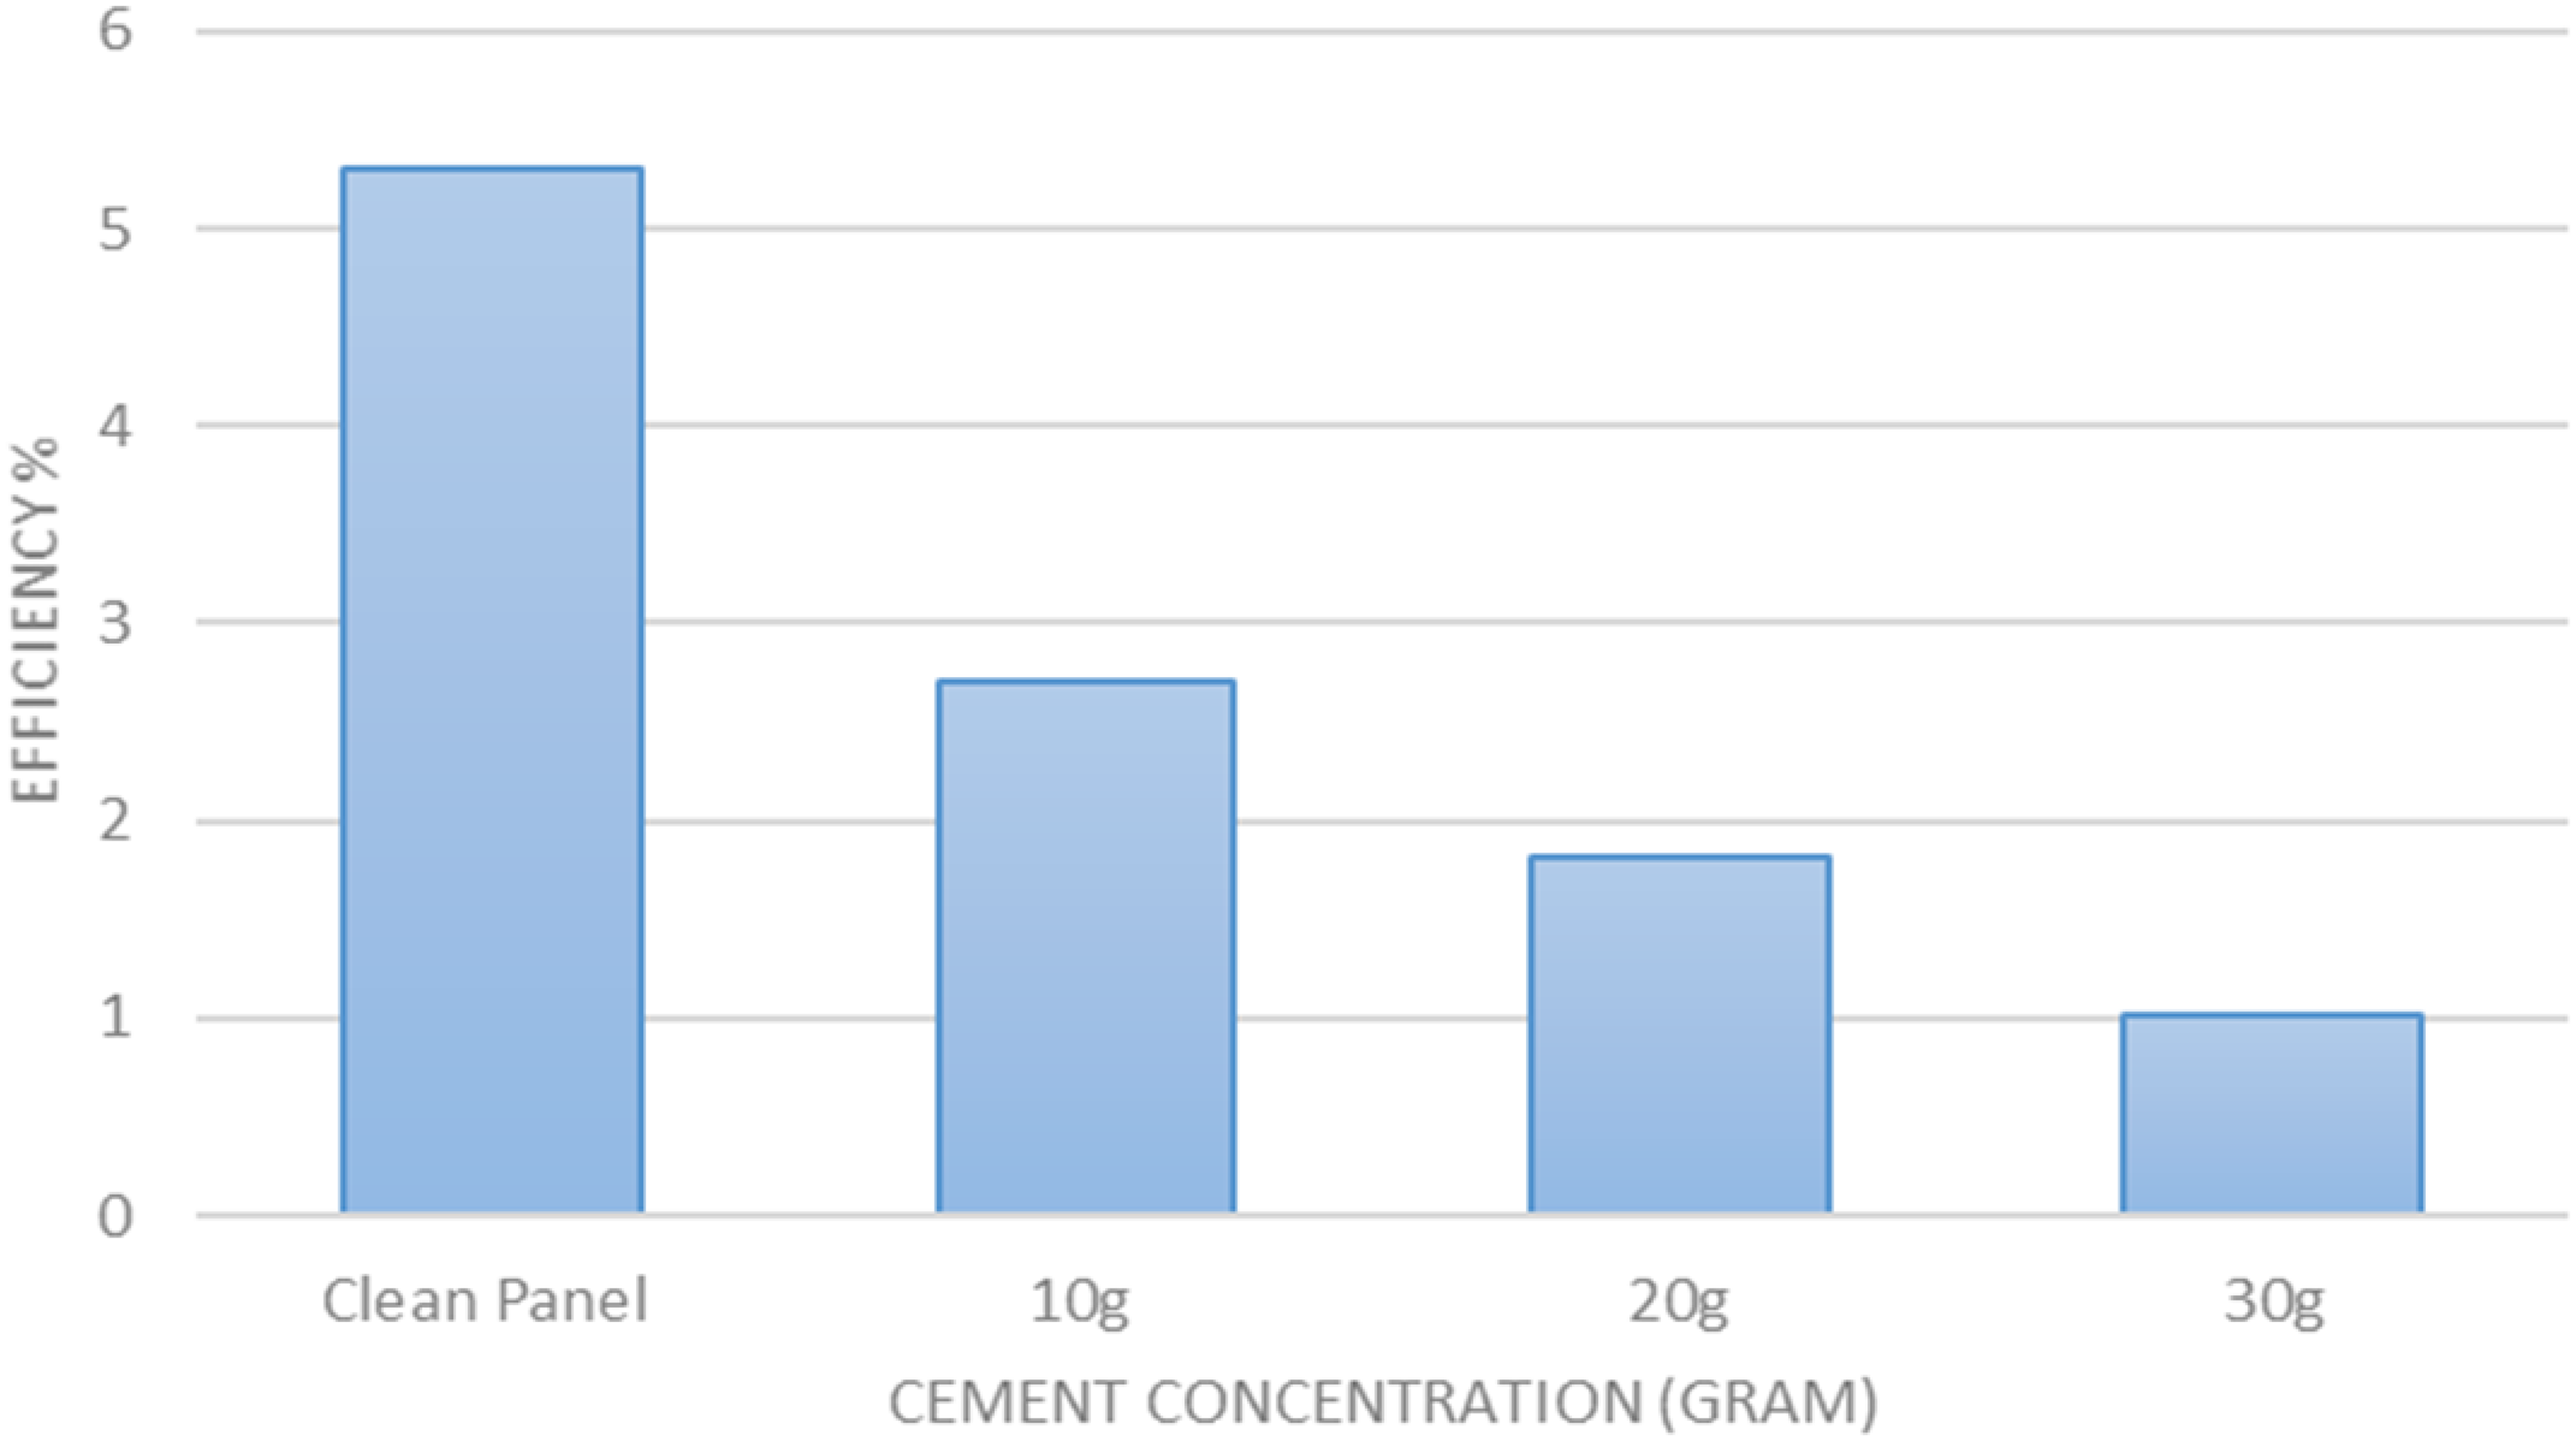
The impact of cement concentrations on the PV efficiency. PV: photovoltaic.
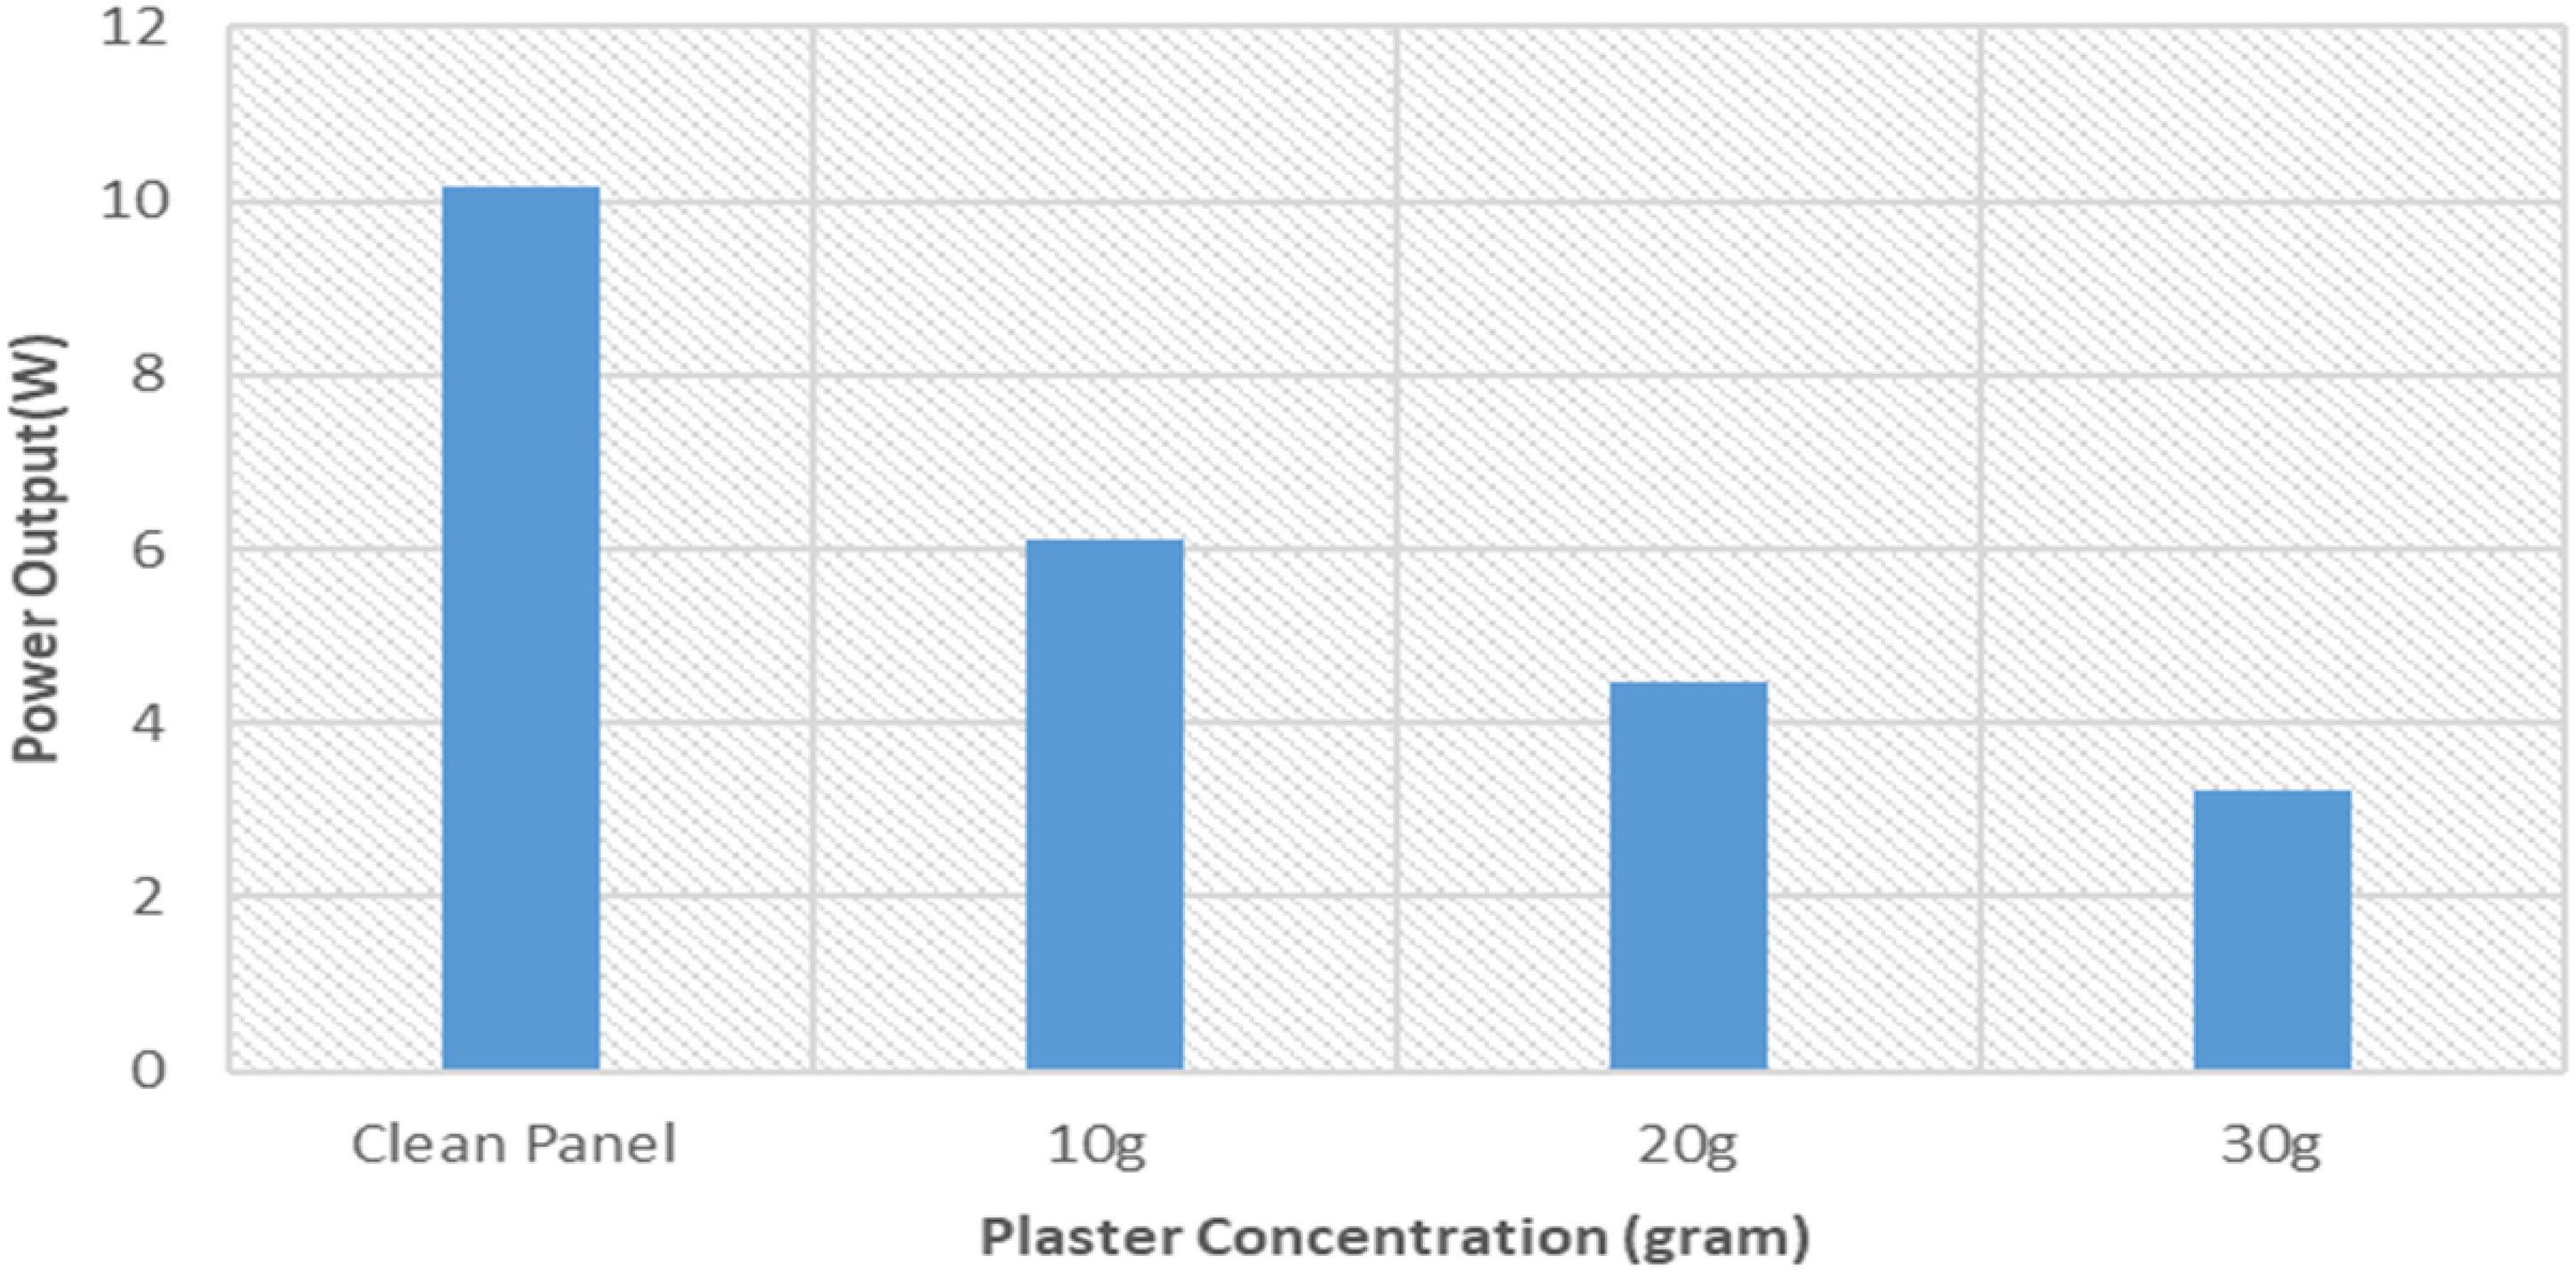
The impact of plaster concentrations on the PV power. PV: photovoltaic.
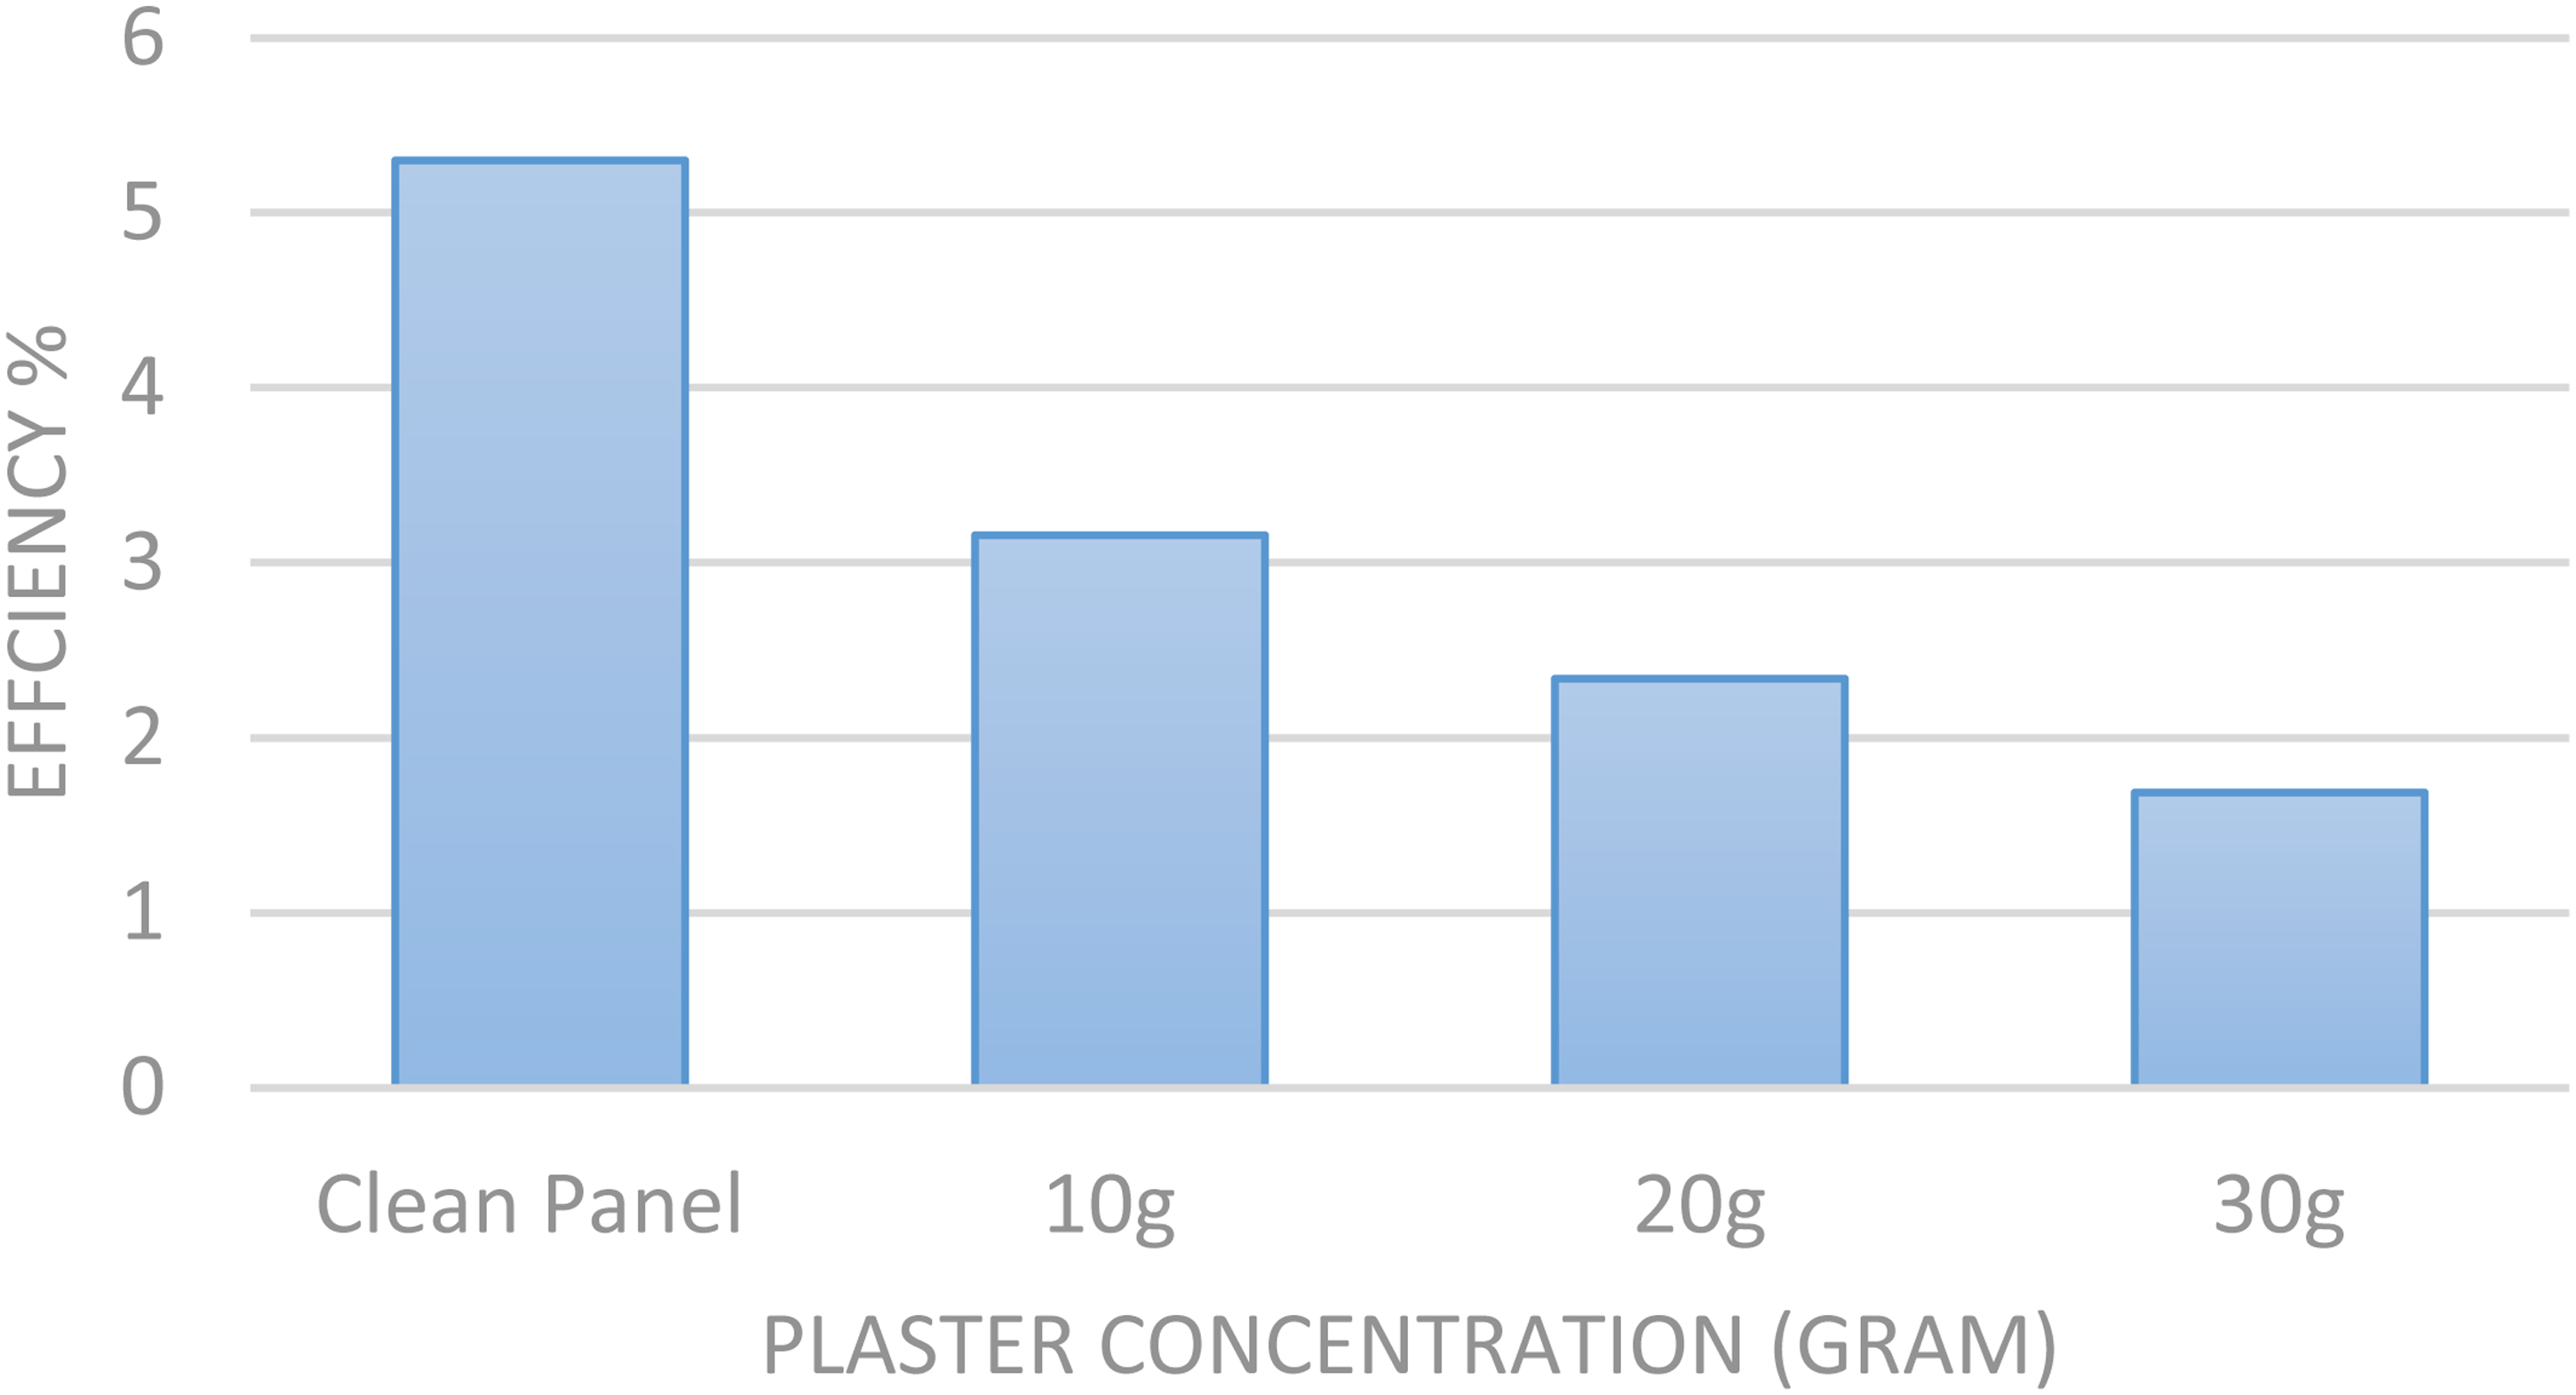
The impact of plaster concentrations on the PV efficiency. PV: photovoltaic.
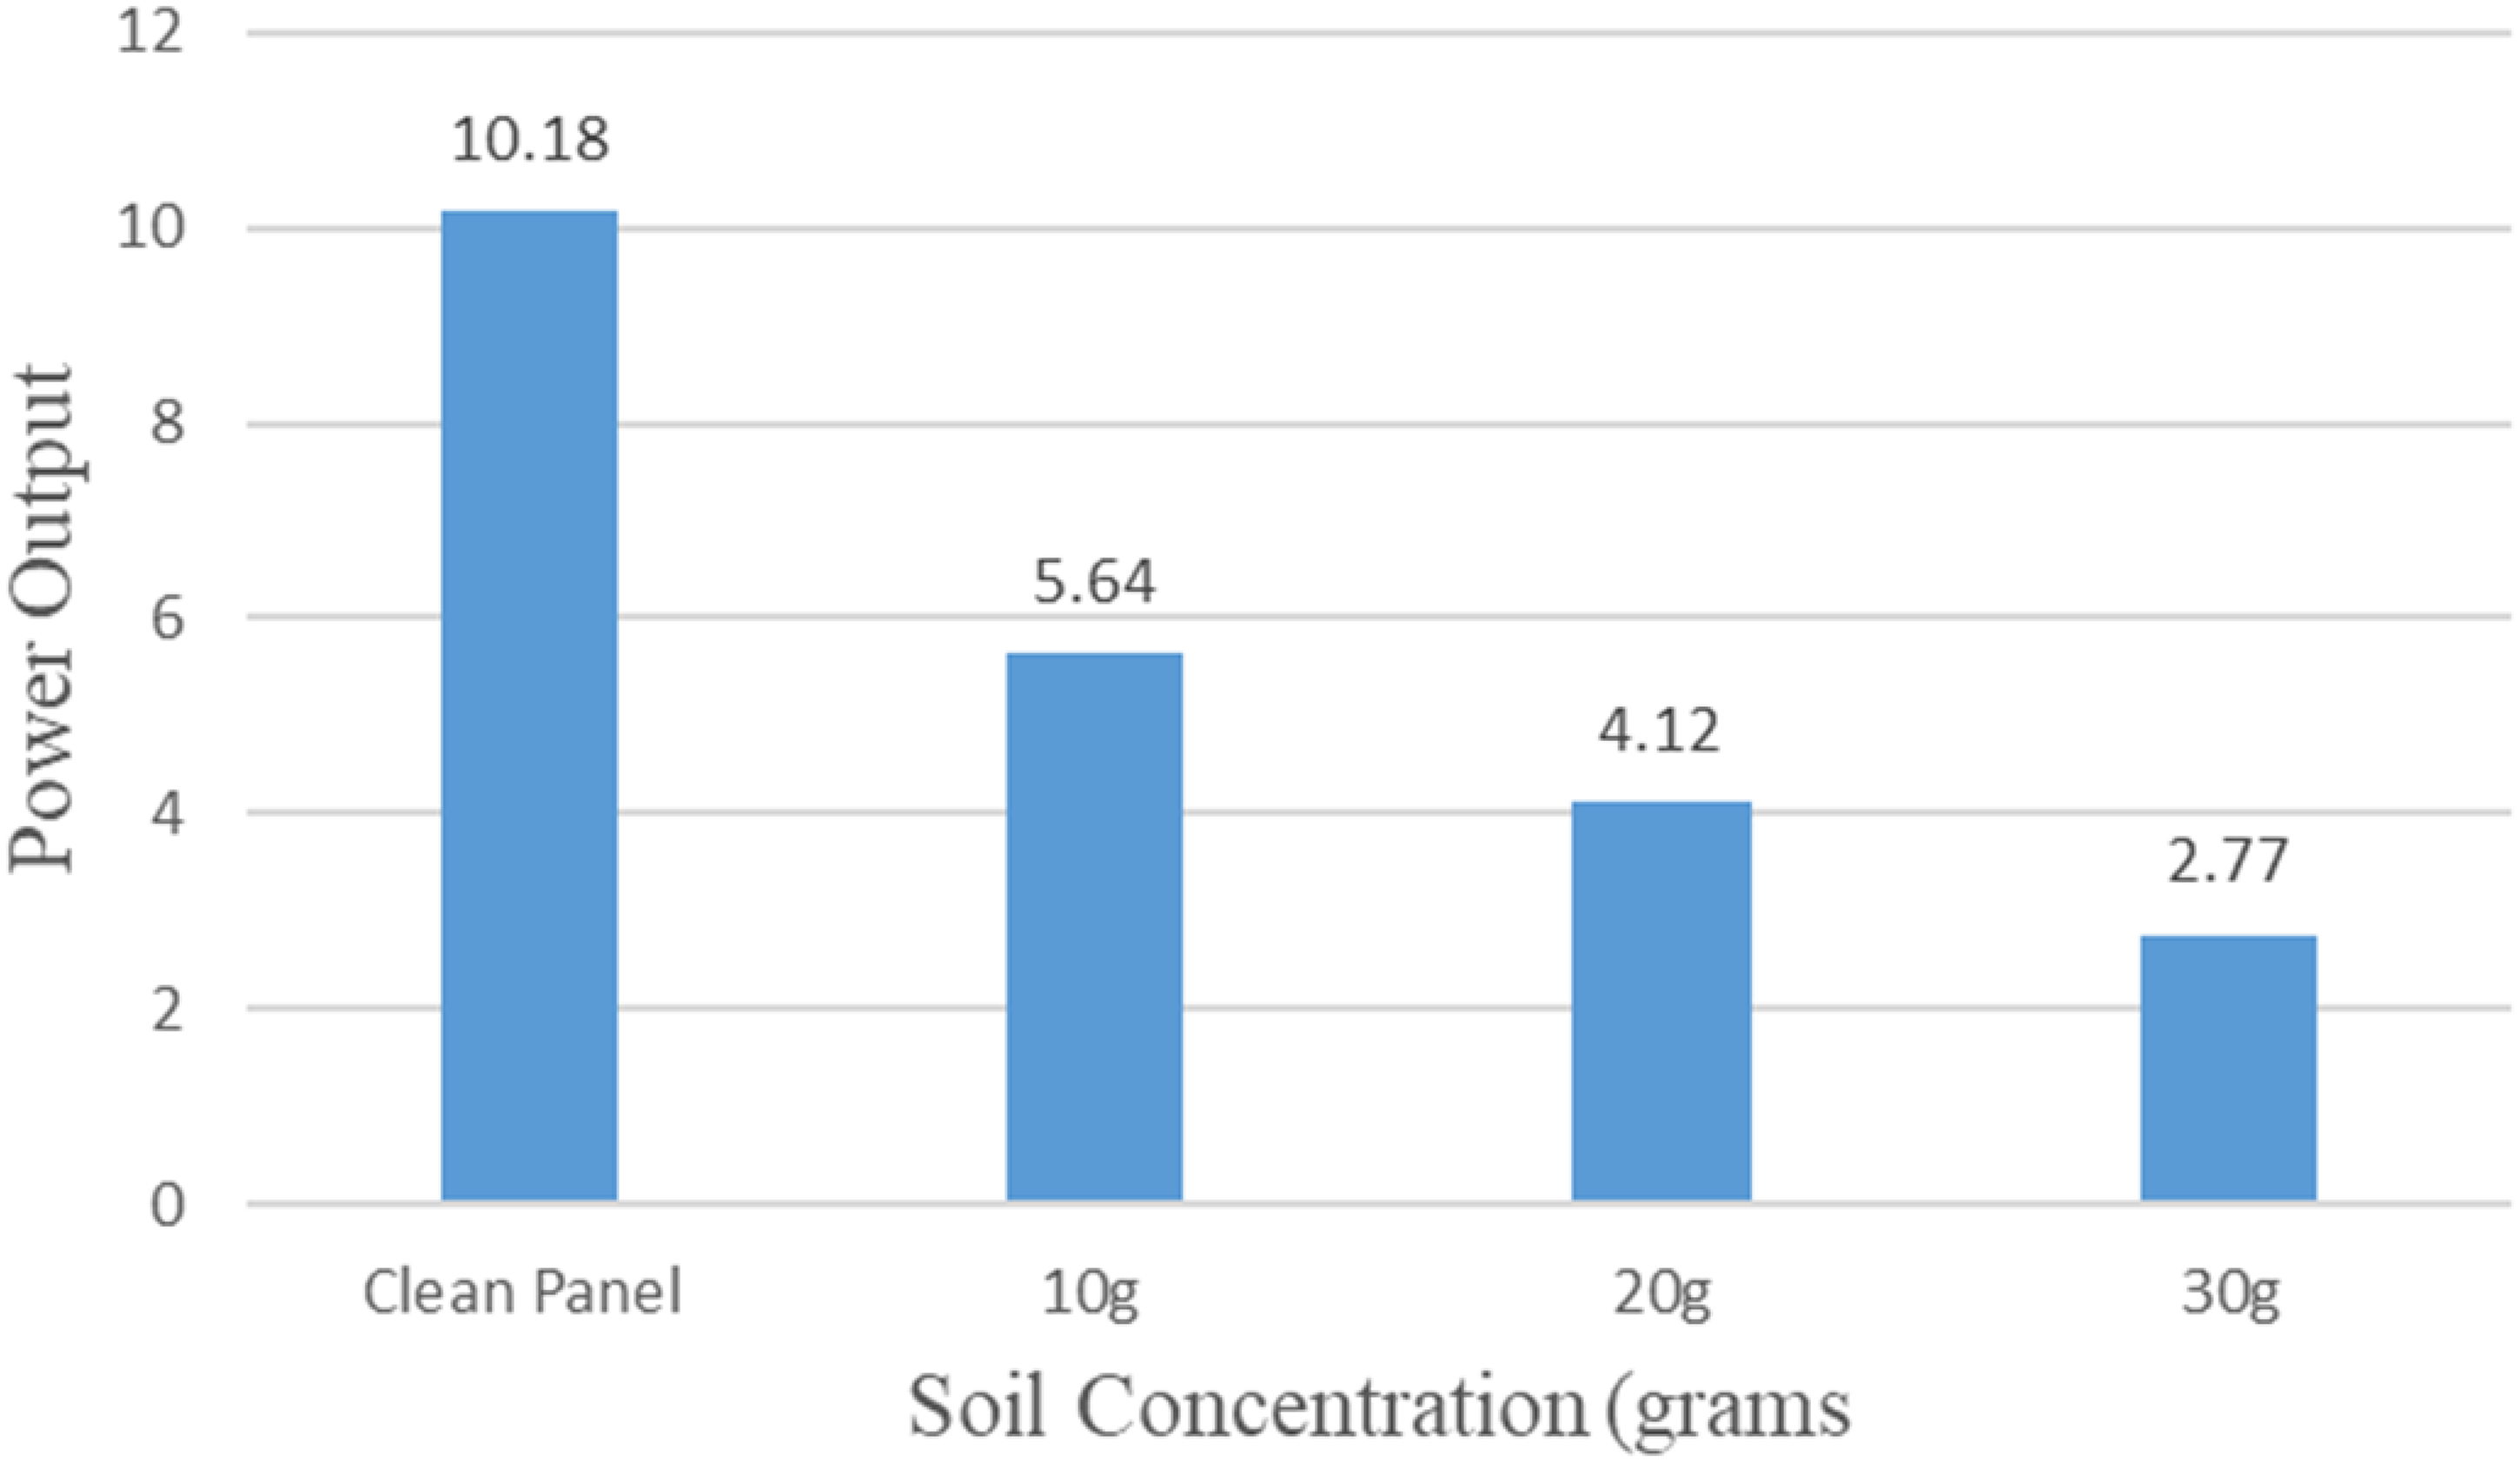
The impact of soil concentrations on the PV power. PV: photovoltaic.
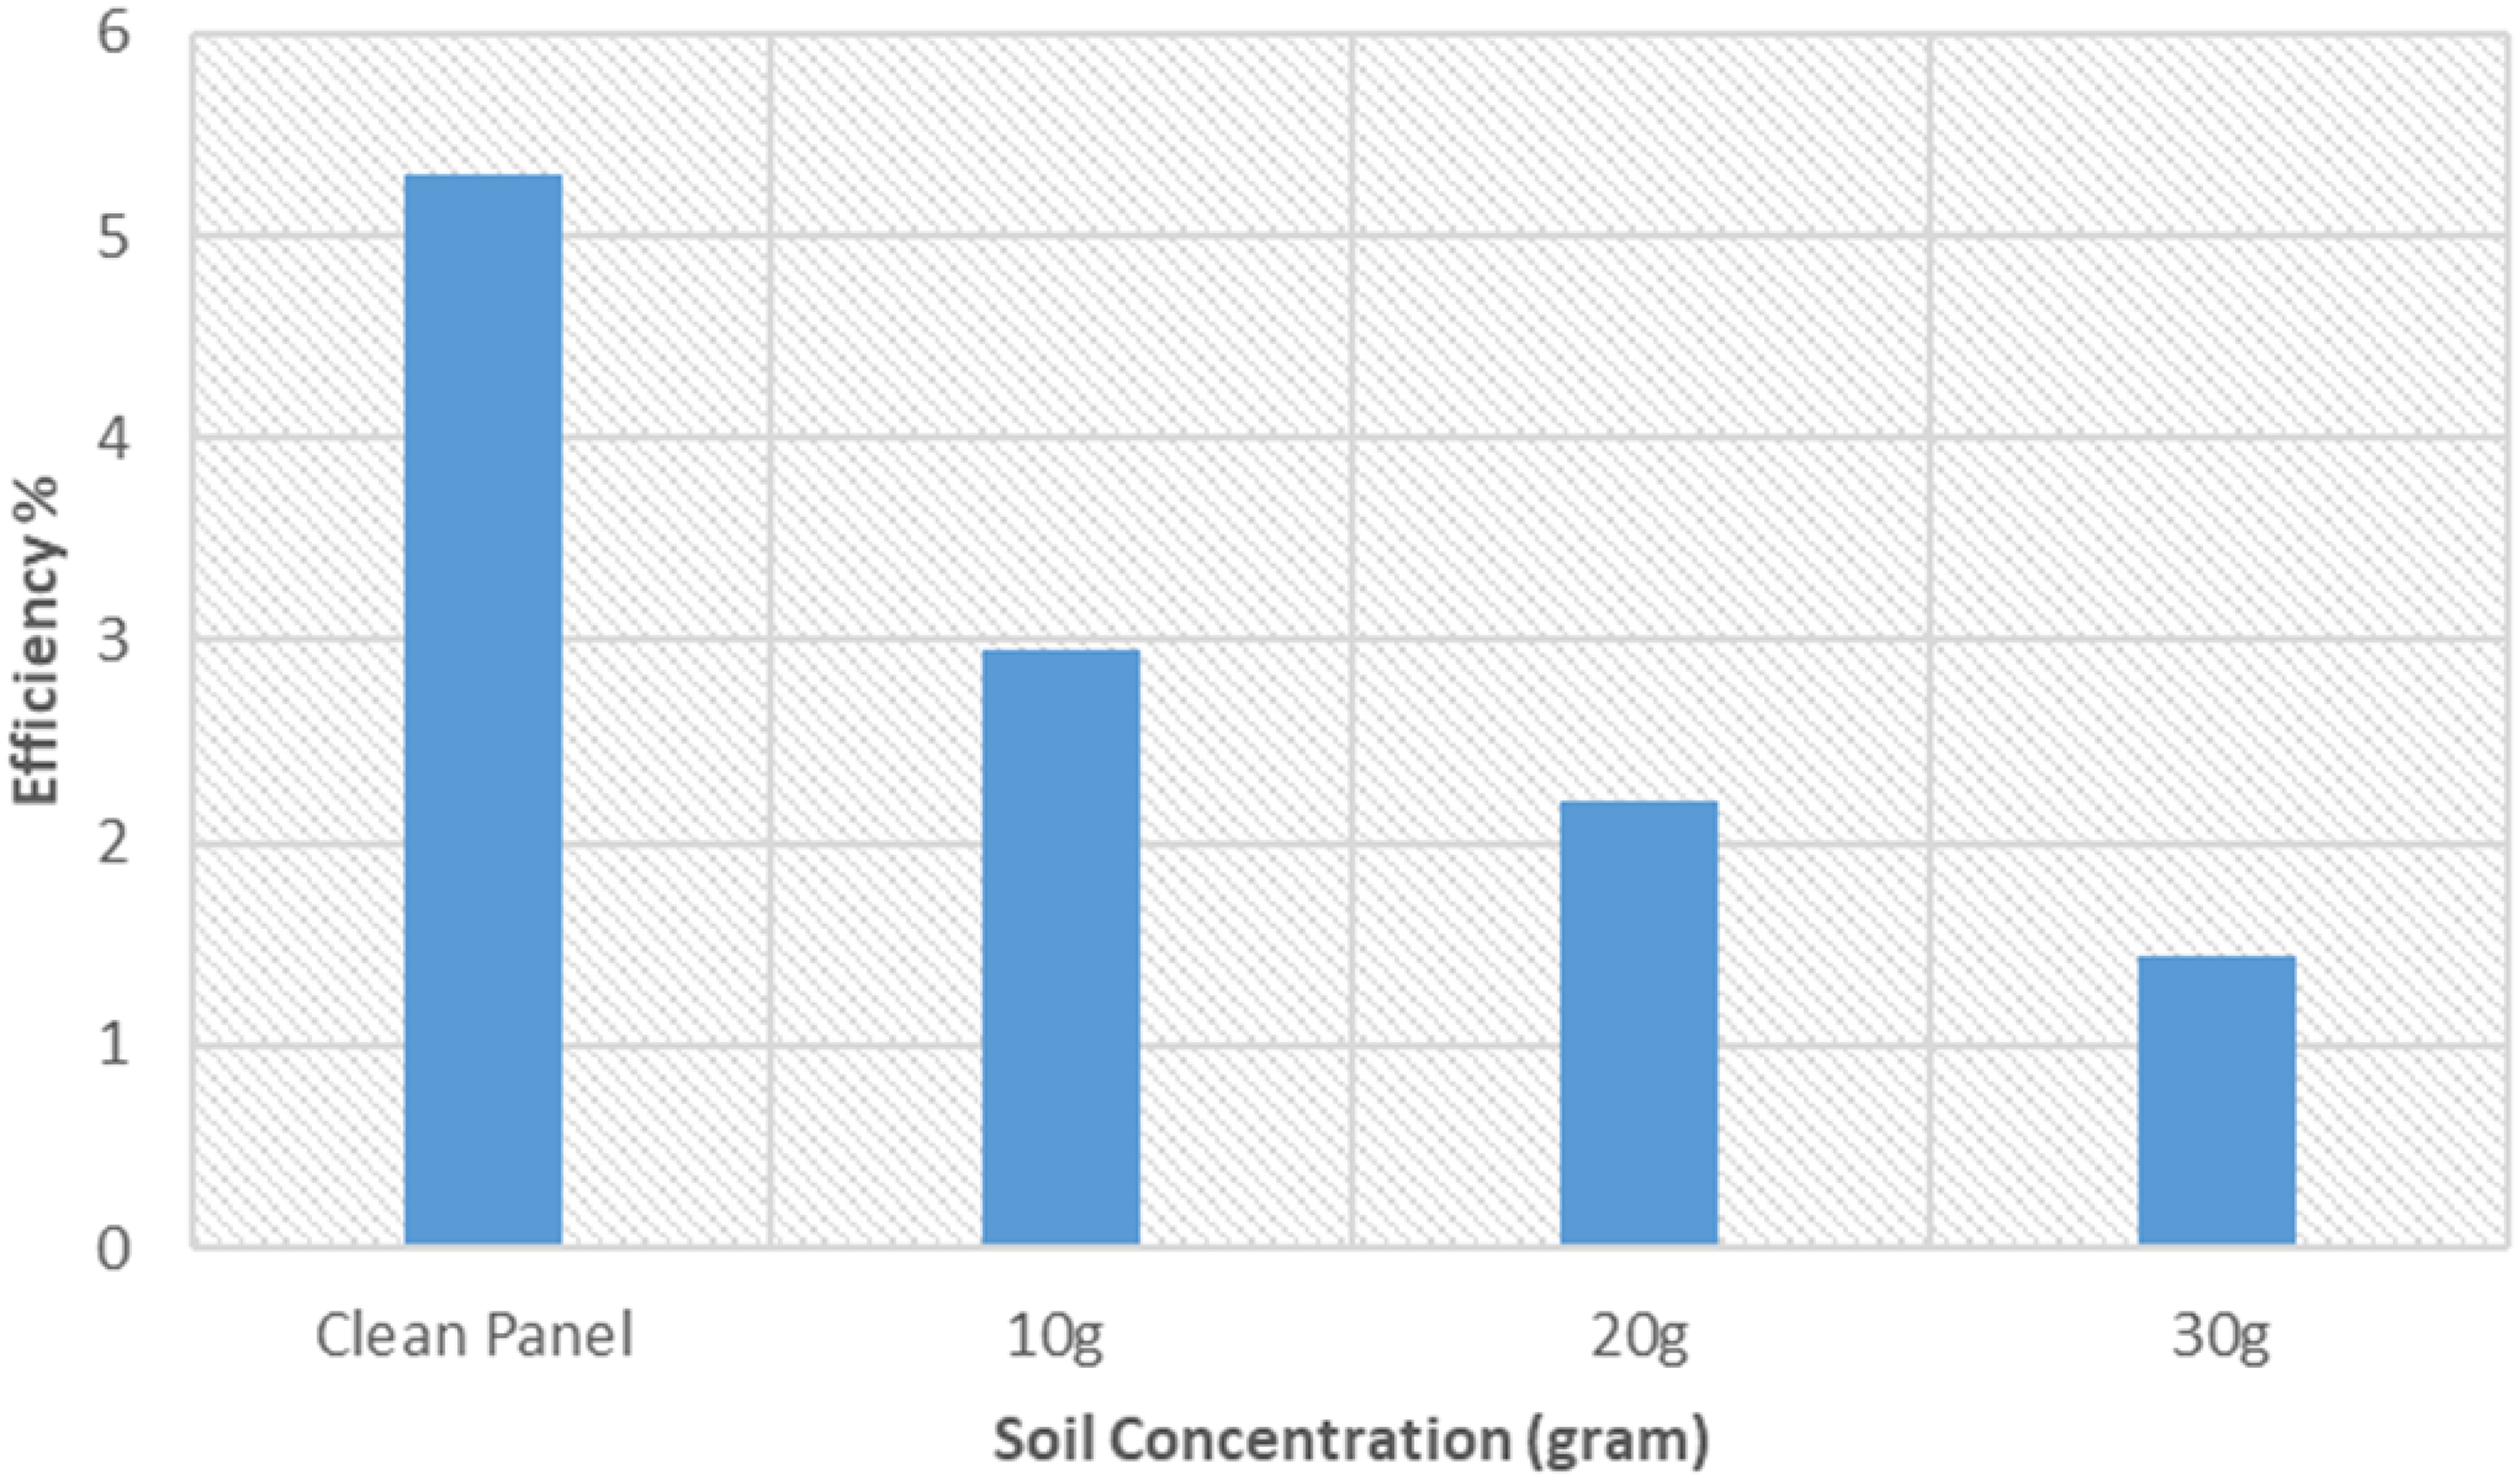
The impact of soil-laterite concentrations on the PV efficiency. PV: photovoltaic.
Power output over time under varying cement dust concentrations
An analysis of the line charts using an Excel package corresponding to the impact of varying amounts of cement dust on the power output of a panel reveals a consistent negative correlation between dust accumulation and power generation. The data presented across three different scenarios, 10 g, 20 g, and 30 g of cement dust, demonstrate a progressive decline in performance as the level of dust increases. In Figure 10, the clean panel exhibits a gradual increase in power output from 6.18 W at 09:00 to a peak of 14.37 W at 13:00, followed by a subsequent decline. In contrast, in Figure 10 (a), the panel subjected to 10 g of cement dust starts with a significantly lower power output of 3.91 W, reaching a peak of only 8.57 W at 11:30. This comparison clearly illustrates the detrimental effect of cement dust, as the dust-laden panel never surpasses the clean panel in terms of power output. A similar trend is observed in Figures 10 (b) and 10(c). Figure 10(c) represents the most significant reduction in power output among the three cases, reinforcing the correlation between increasing cement dust and declining panel efficiency.
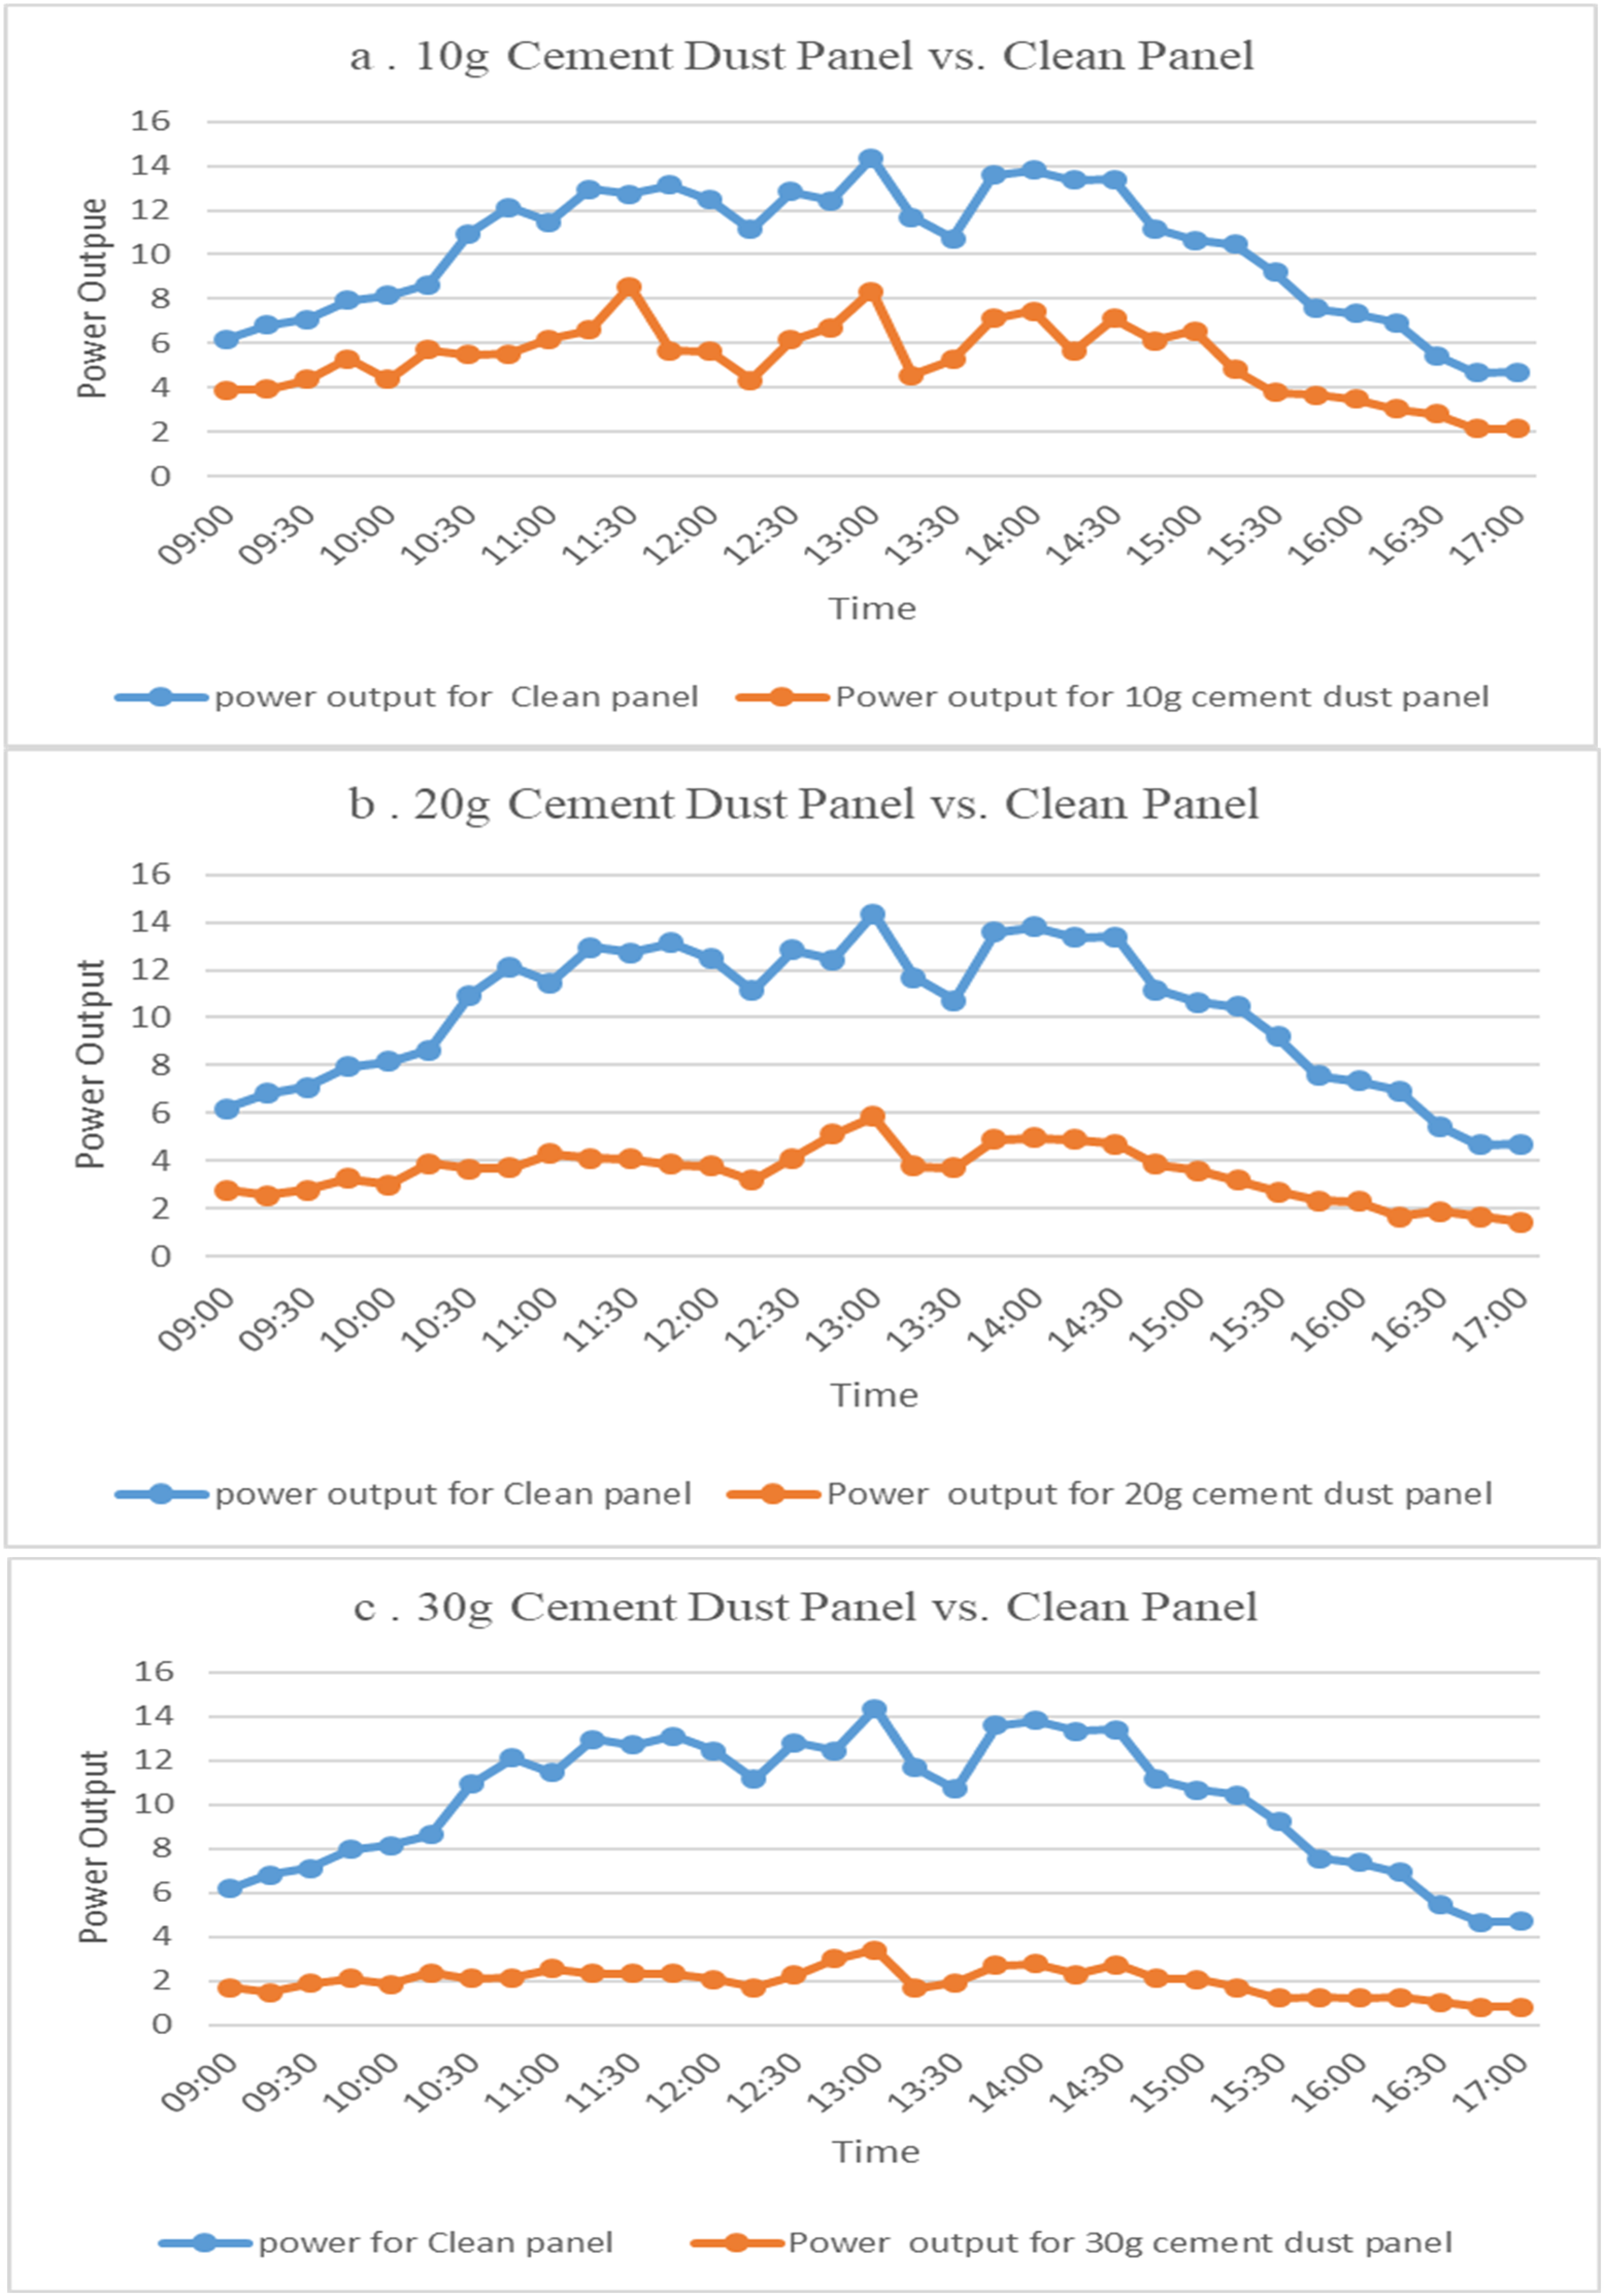
Power output of different concentrations of cement dust on solar panels.
Panel efficiency over time under varying cement dust concentrations
The investigation into the impact of cement dust on panel efficiency reveals significant insights regarding the performance of clean panels versus those contaminated with varying amounts of cement dust, as illustrated in Figure 11. The clean panel efficiency begins at 4.66 at 09:00, reaching a peak of 7.15 around 12:15. After this peak, the efficiency fluctuates slightly, dropping at 4.80 by 17:00. In contrast, the panel exposed to 10 g of cement dust starts at a much lower efficiency of 2.95 at 09:00 and exhibits a gradual decline throughout the day, ultimately dropping to 2.21 by 17:00. Similar trends are observed in panels exposed to 20 g and 30 g of cement dust with significant reduction in efficiency in increased concentrations of cement dust.
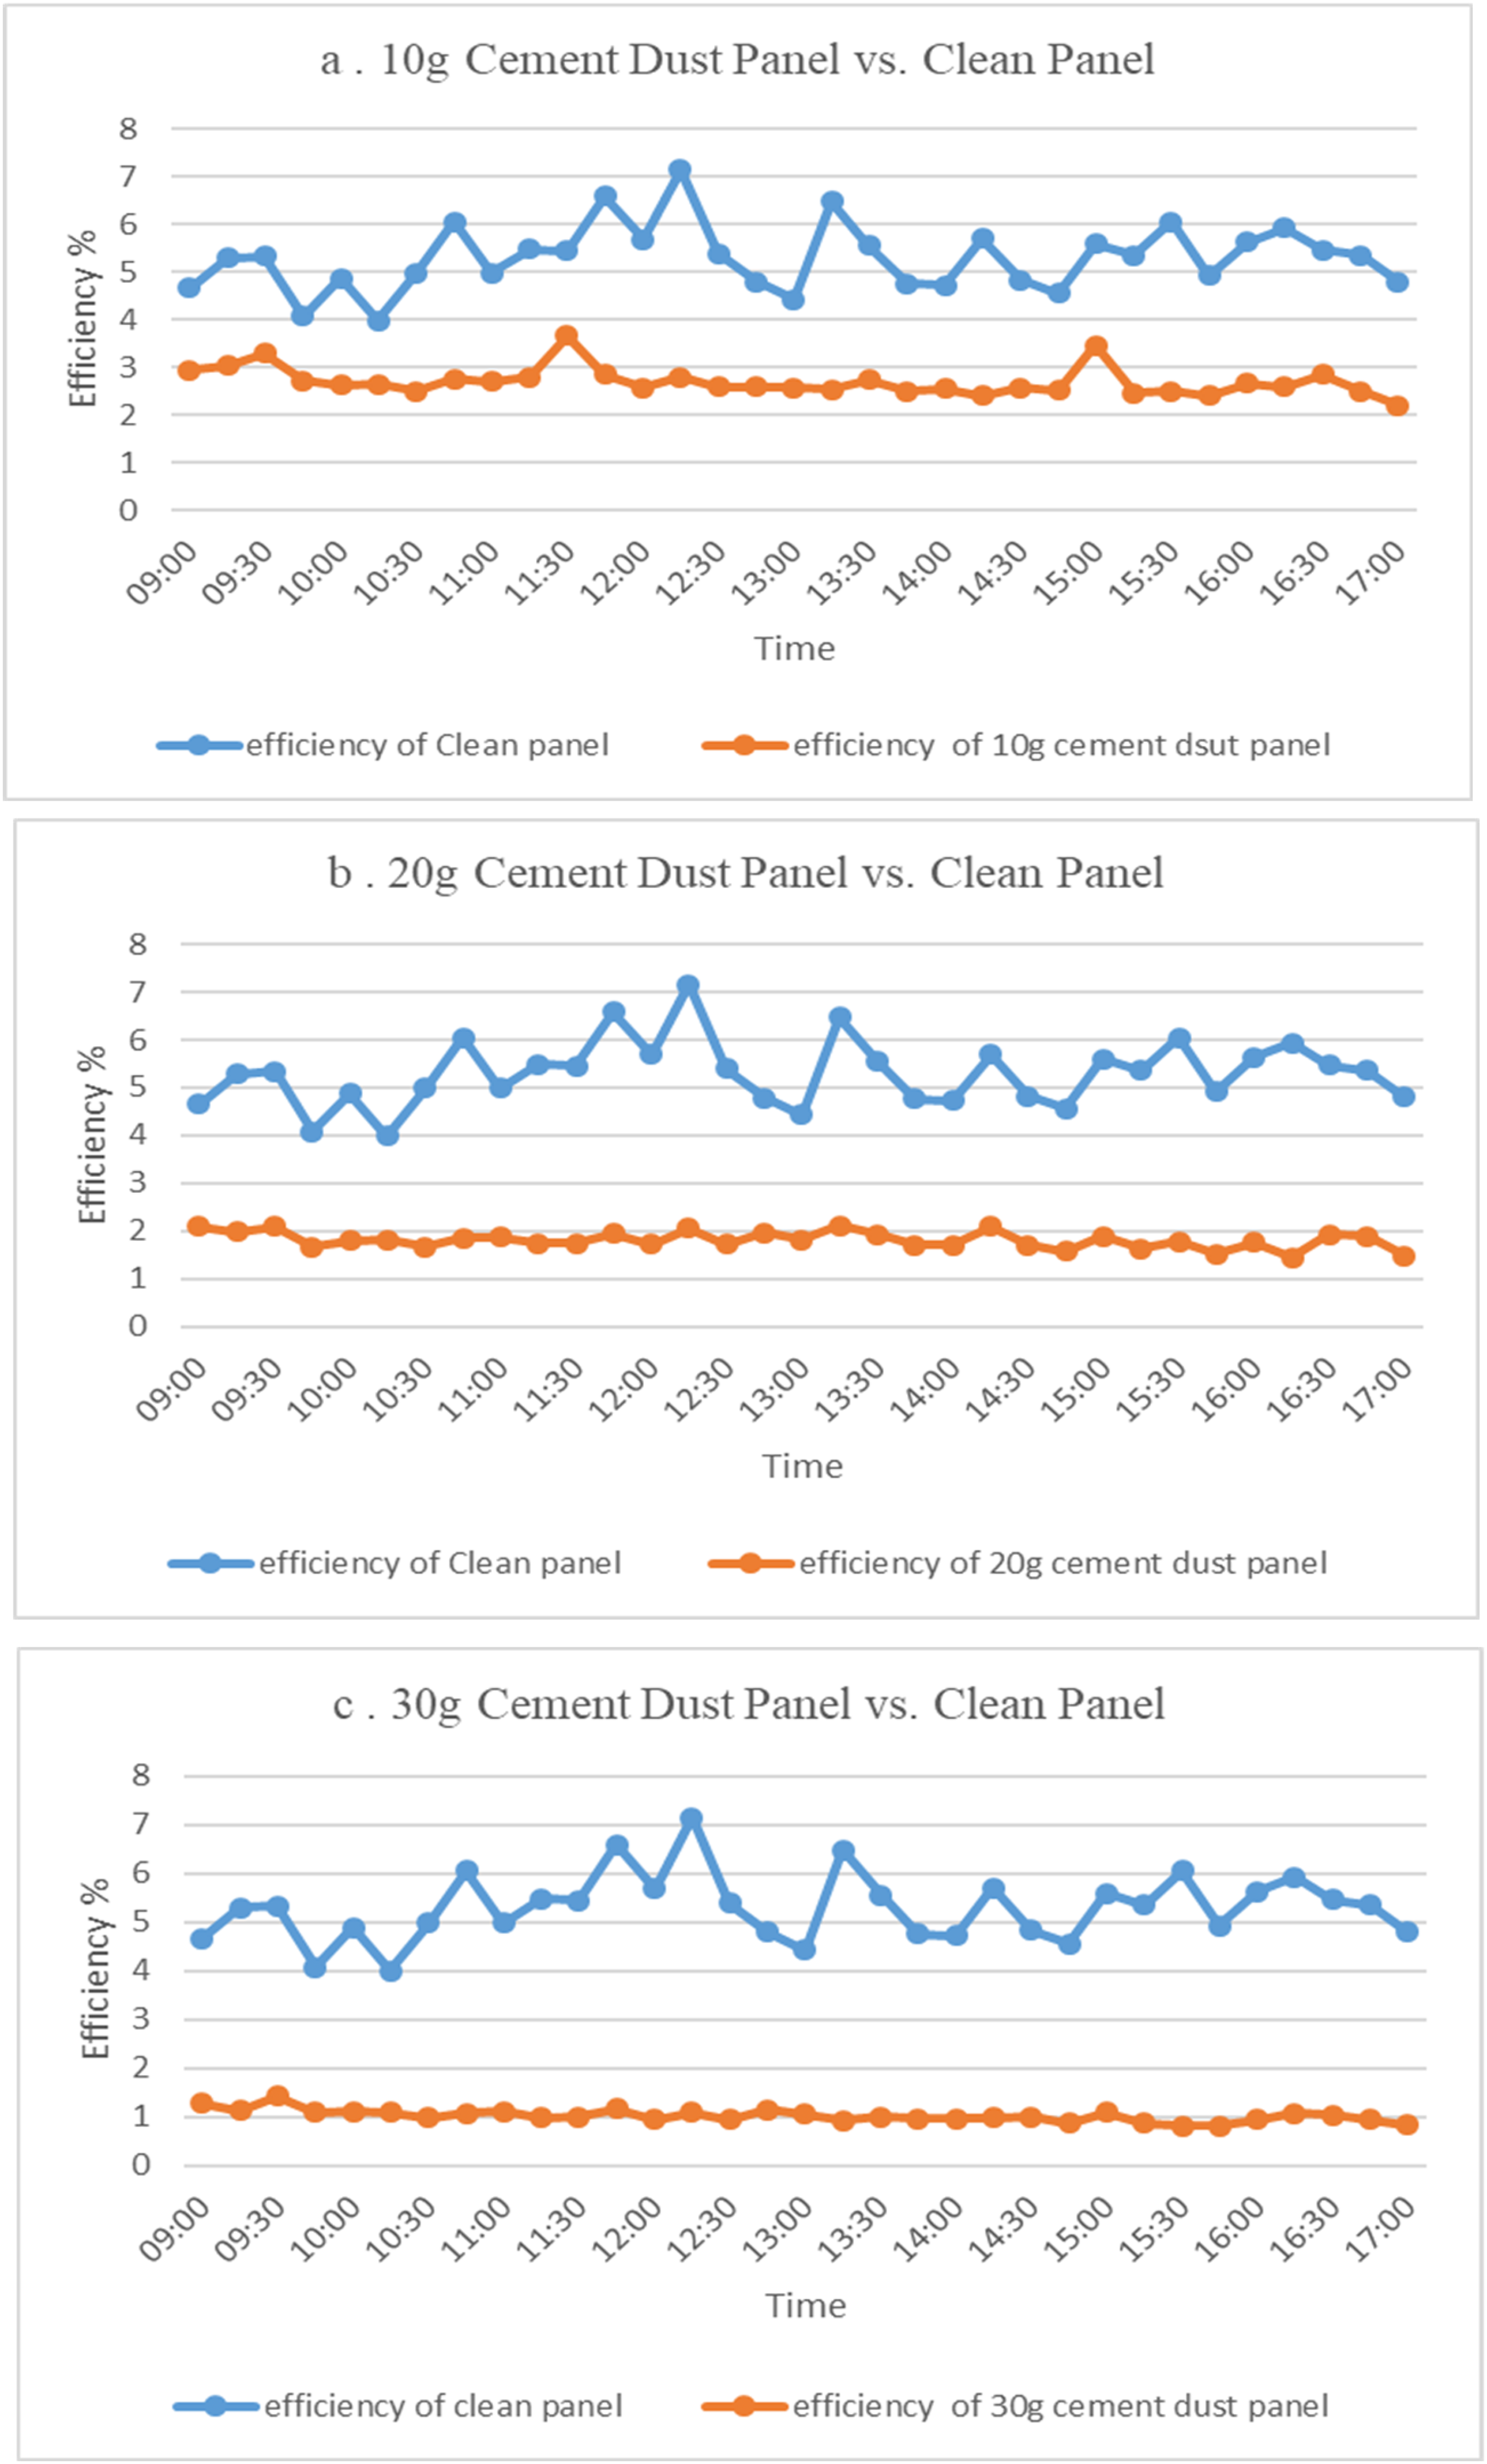
Efficiency of different concentrations of cement dust on solar panels.
Power output over time under varying plaster dust concentrations
The analysis of the power output of panels subjected to varying amounts of plaster dust is presented in Figure 12. The clean panel starts with a power output of 6.18 at 09:00, reaches a peak of 14.37 around 13:00, and gradually declines to 4.71 by 17:00. In contrast, the panel with 10 g of plaster dust begins with a lower output of 4.09, shows a gradual increase to peak at 10.14 by 13:00, and declines to 2.87 by 17:00. Although the plaster dust panel improves slightly during the day, it remains significantly less efficient than the clean panel, indicating the negative impact of plaster dust on power output. A similar trend is observed in the panel with 20 g and 30 g of plaster dust. The highest concentration results in the lowest power output. The clean panels consistently perform better, and as the amount of plaster dust increases, the power output of the contaminated panel decreases.
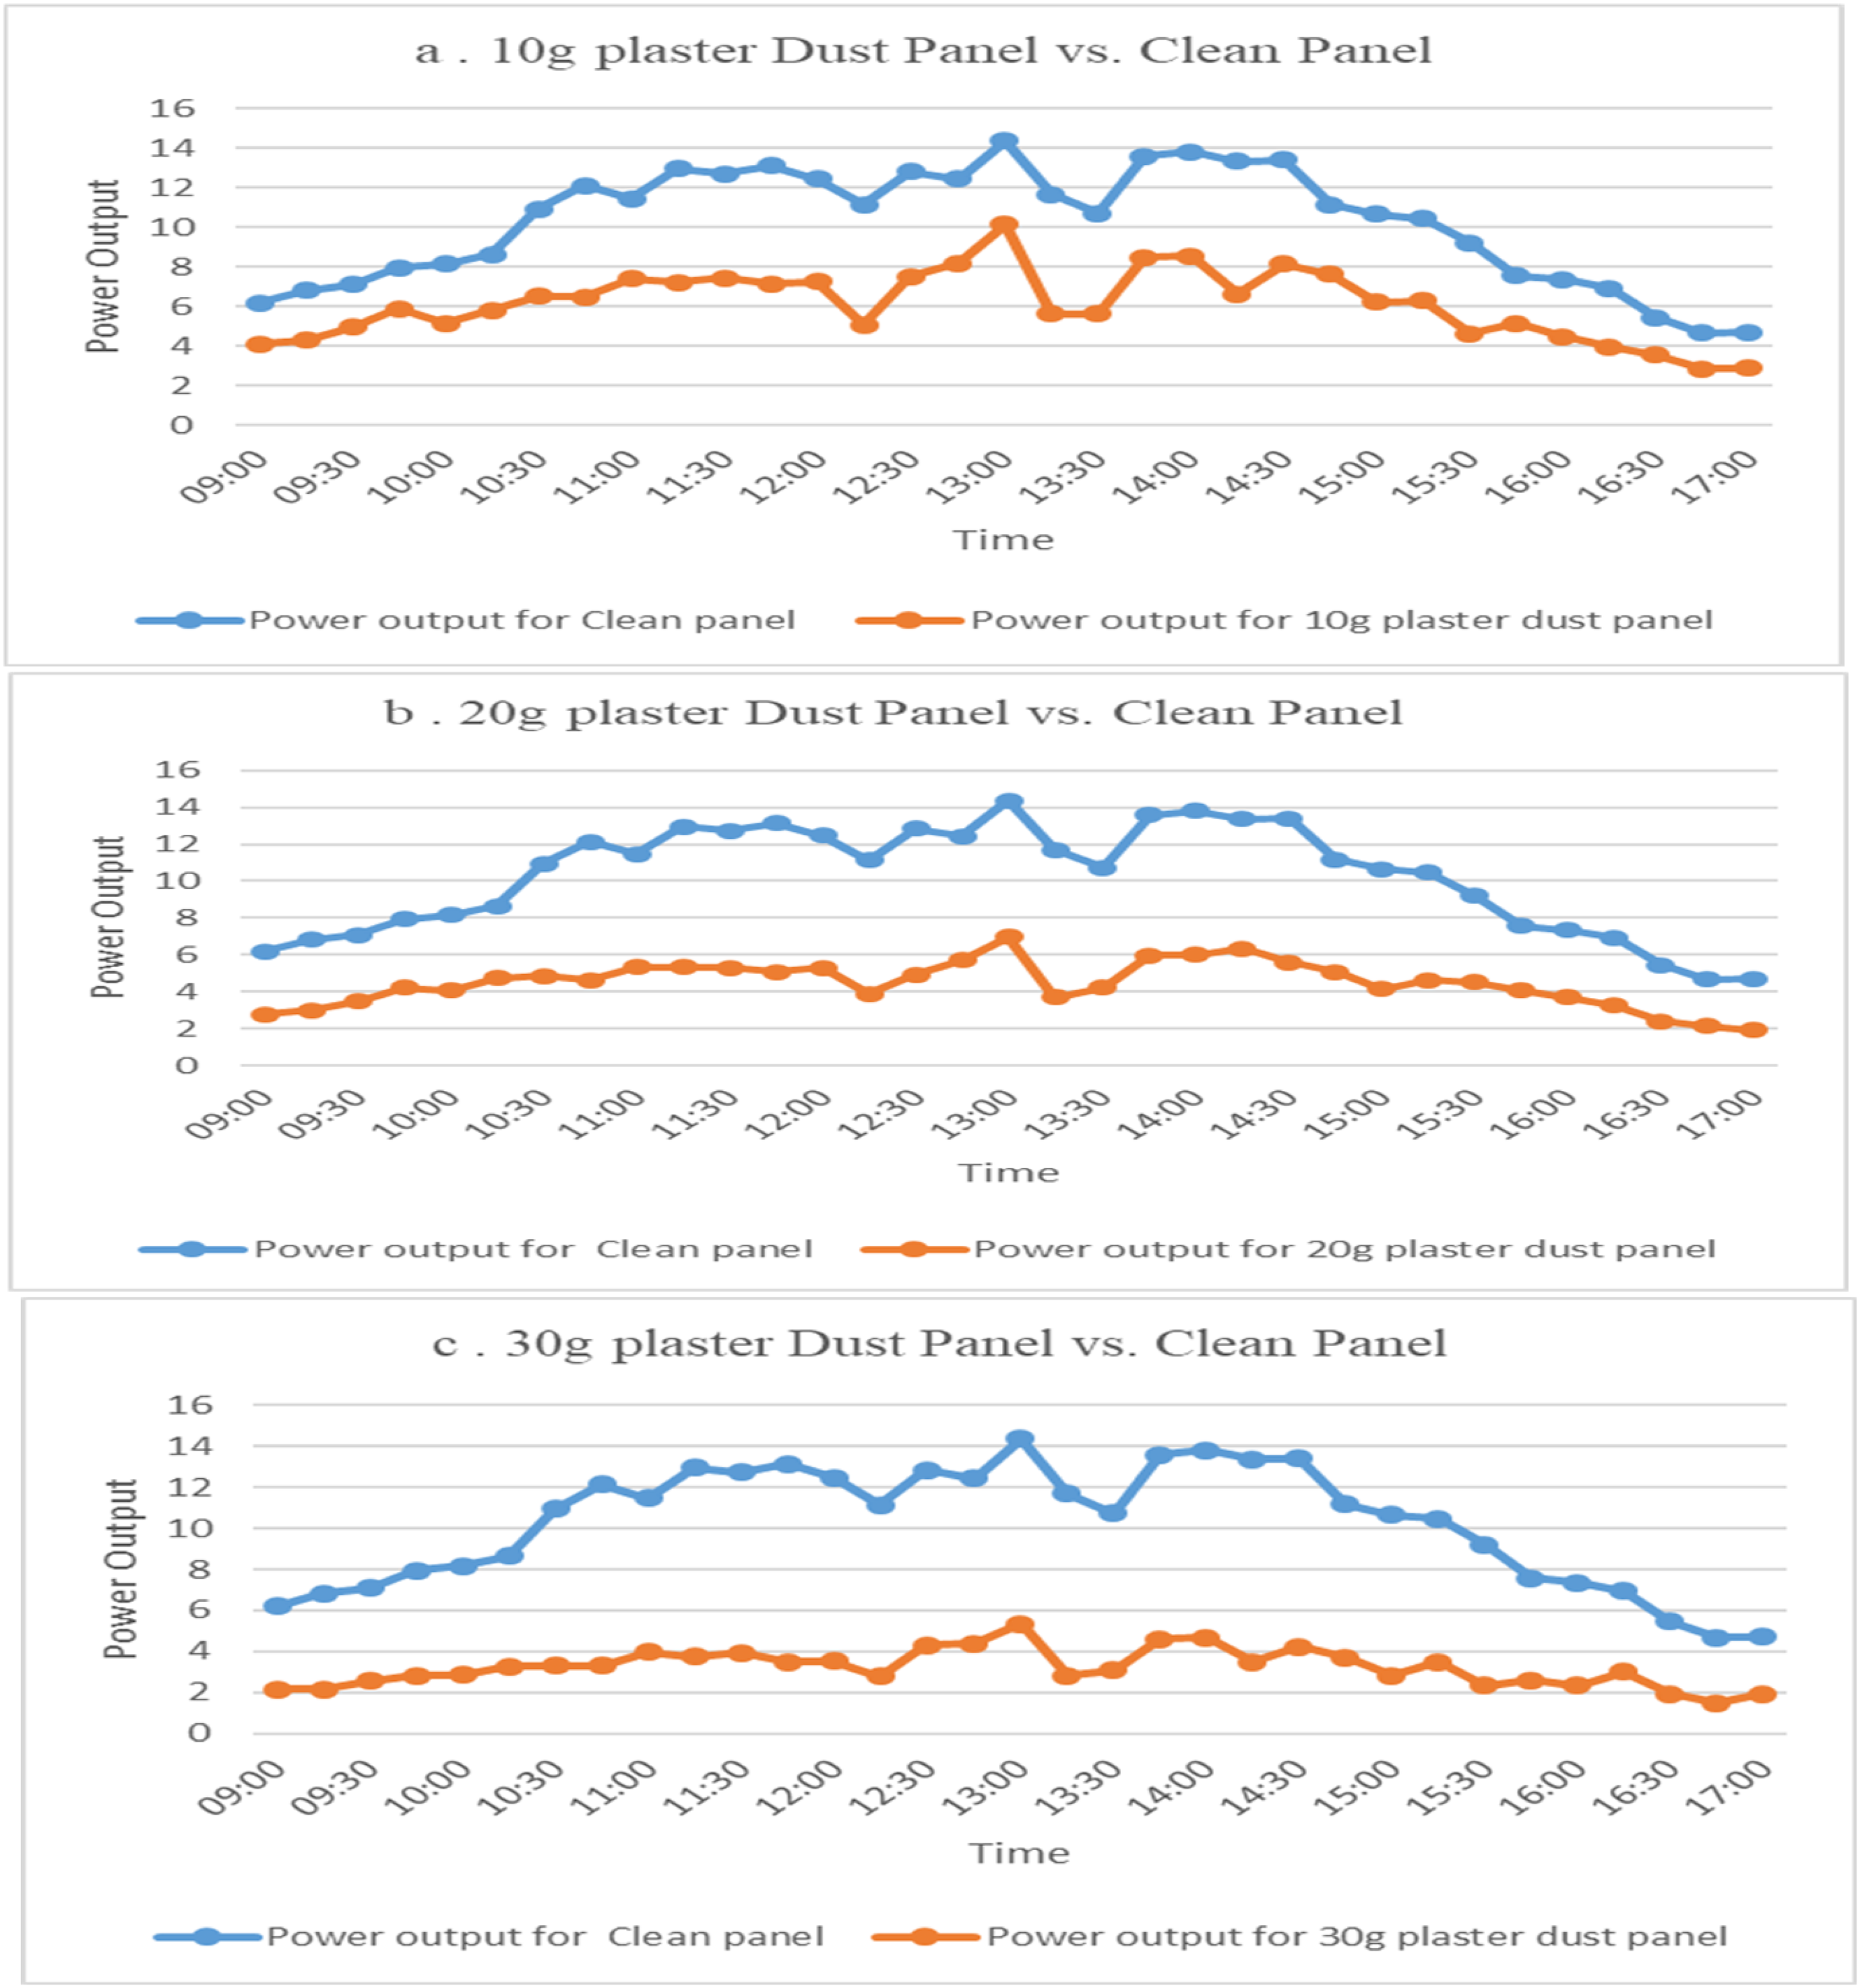
Power output of different concentrations of plaster dust on solar panels.
Panel efficiency over time under varying plaster dust concentrations
The analysis of panel efficiency under varying concentrations of plaster dust demonstrates a clear inverse relationship between dust concentration and panel performance, as shown in Figure 13. The clean panel begins with an efficiency of 4.66 at 09:00, reaches a peak of 7.16 around 12:15, and drops at 4.80 by 17:00. In contrast, the panel with 10 g of plaster dust starts with an efficiency of 3.08, achieves a modest peak of 3.74 around 09:30, and declines to 2.92 by 17:00. These findings reveal that, while the efficiency of the plaster dust panel fluctuates slightly over time, it remains consistently lower than that of the clean panel, emphasising the adverse effects of plaster dust contamination on performance. A similar trend is observed in the panel with 20 g and 30 g of plaster dust, with higher plaster dust concentrations leading to significant reductions in panel efficiency.
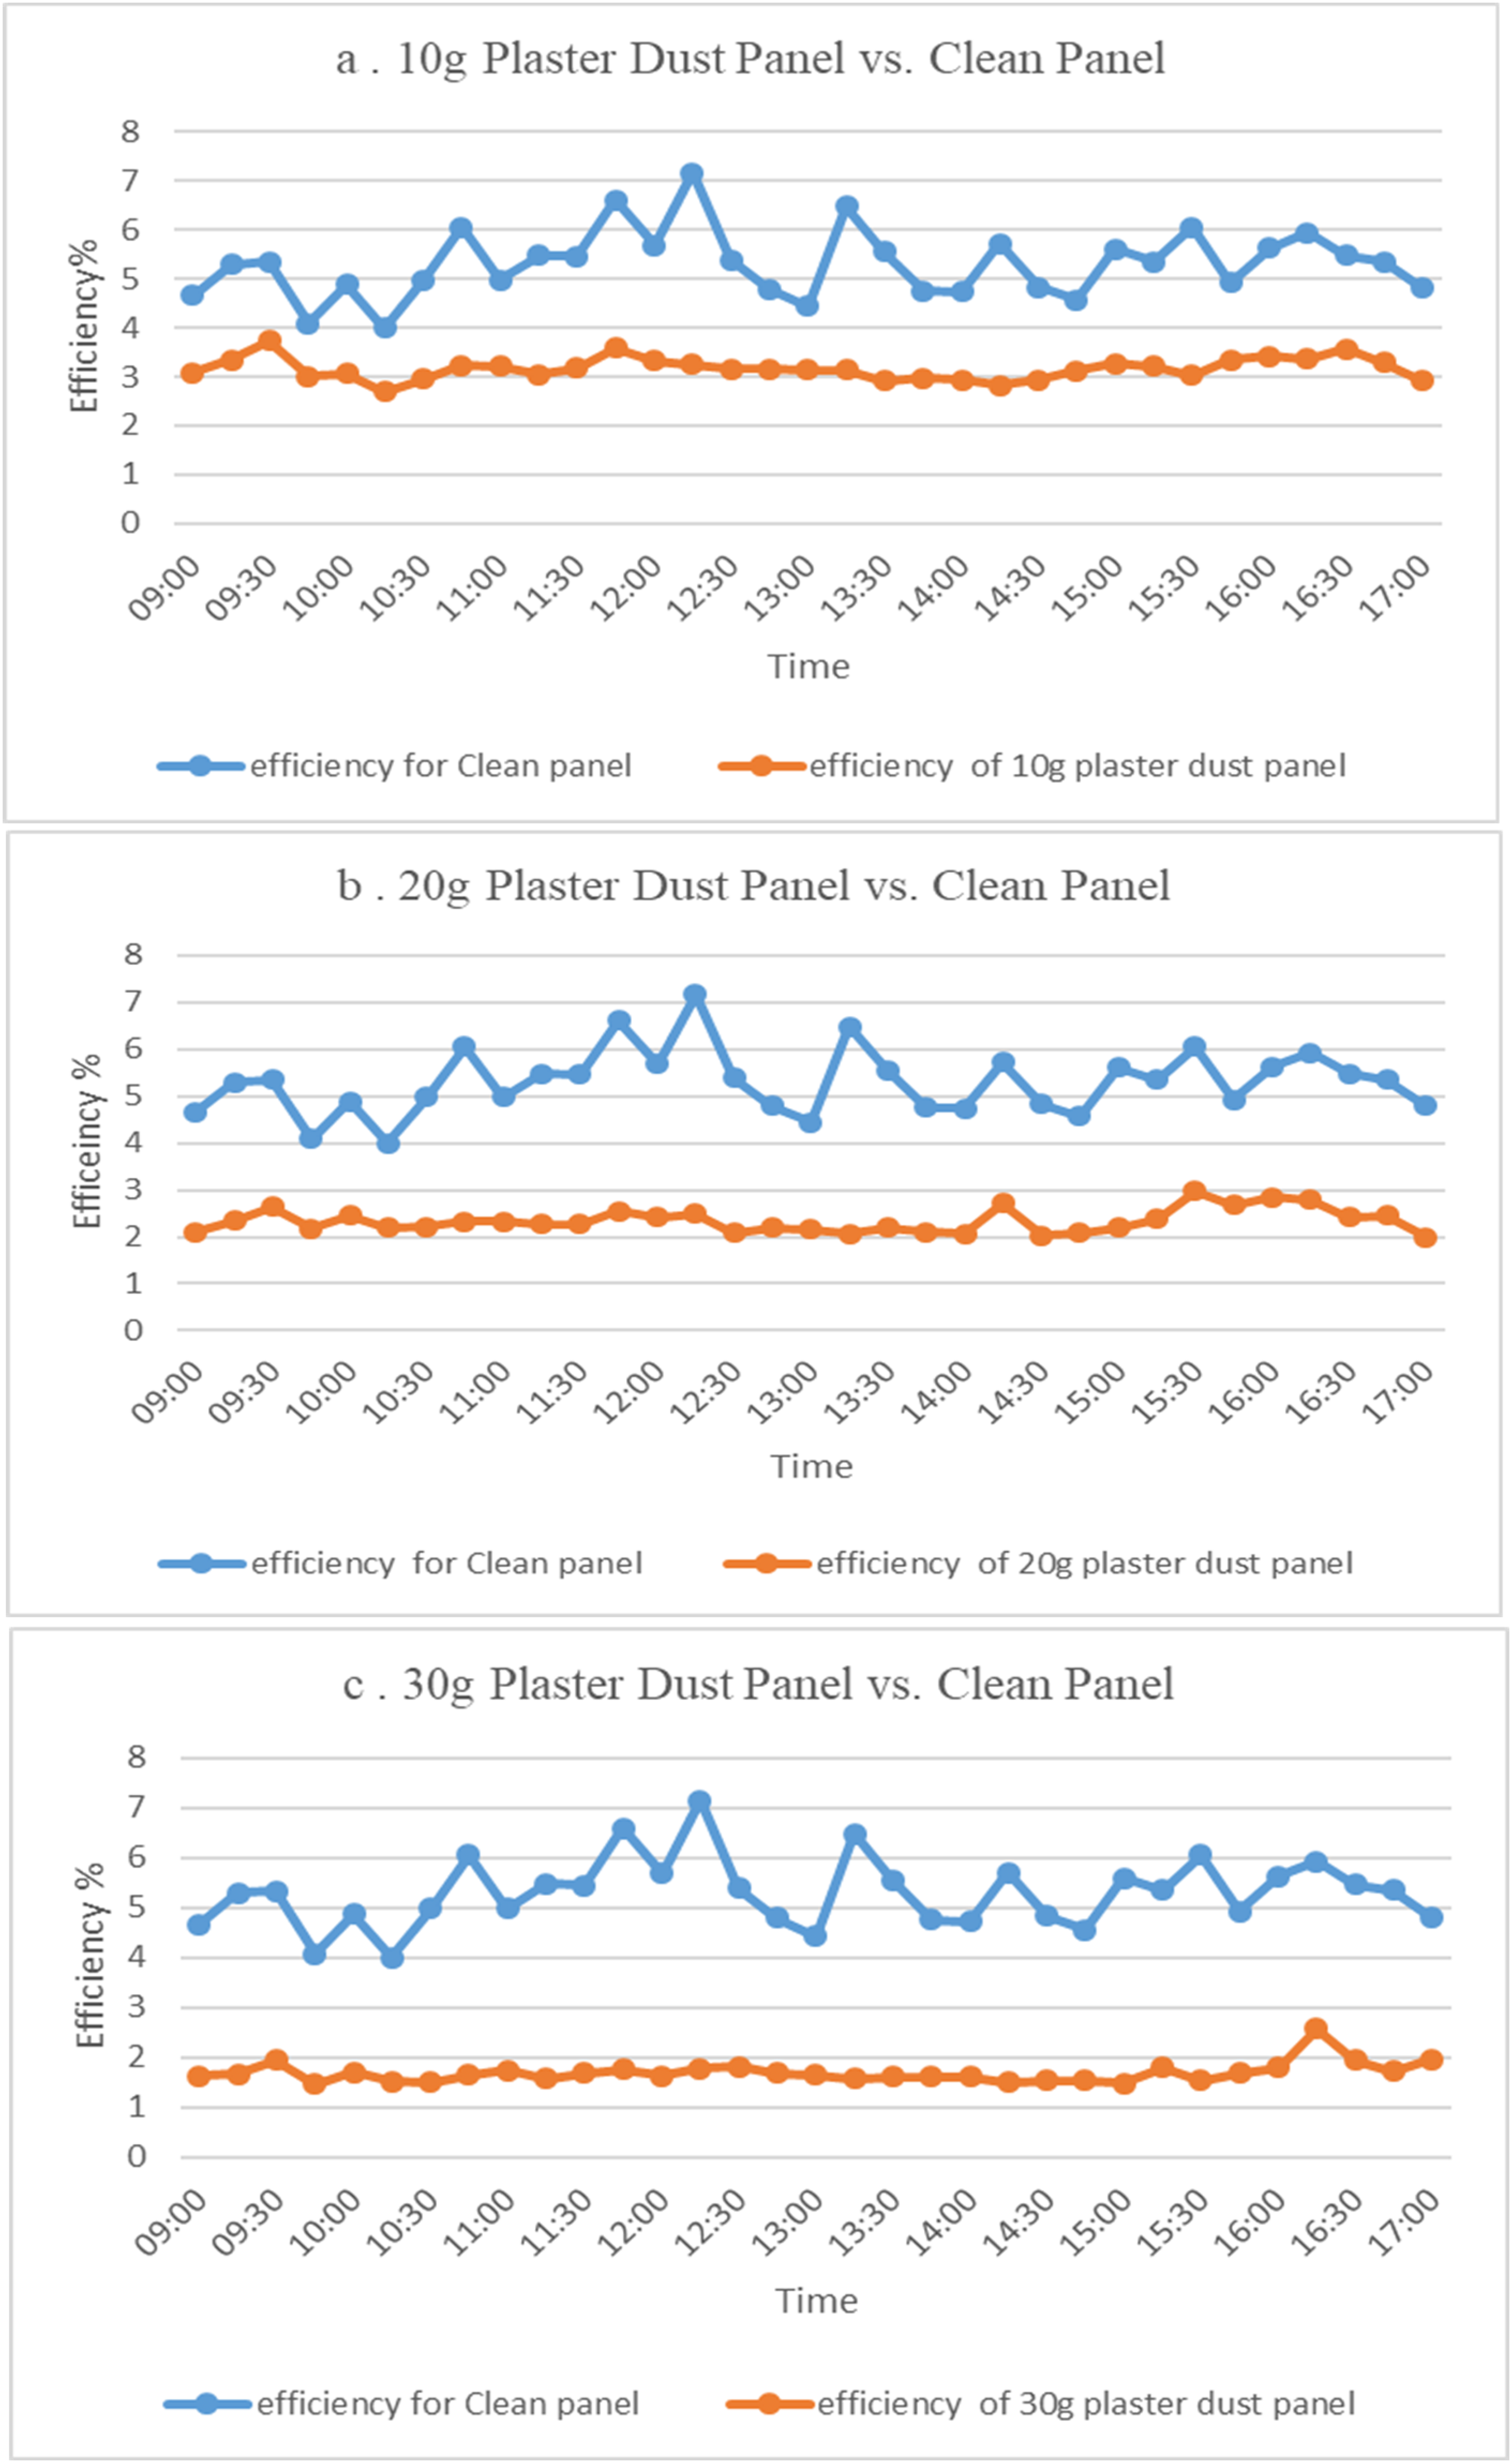
Efficiency of different concentrations of plaster dust on solar panels.
Power output over time under varying soil-laterite dust concentrations
The analysis of power output under different soil dust concentrations demonstrates a clear inverse relationship between dust concentration and panel performance, as shown in Figure 14. The clean panel starts with a power output of 6.18 at 09:00, peaks at 14.37 around 13:00, and ends the day at 4.71 by 17:00. The 10 g dust panel begins at a lower power output of 4.19, reaches a peak of 7.96 around 13:00, and declines to 2.81 by 17:00. While the power output of the dust-laden panel improves throughout the day, it remains significantly lower than that of the clean panel, thus indicating the negative impact of soil dust on performance. Similar trends are observed in the 20 g and 30 g panels, with higher concentrations of soil dust resulting in lower power output.
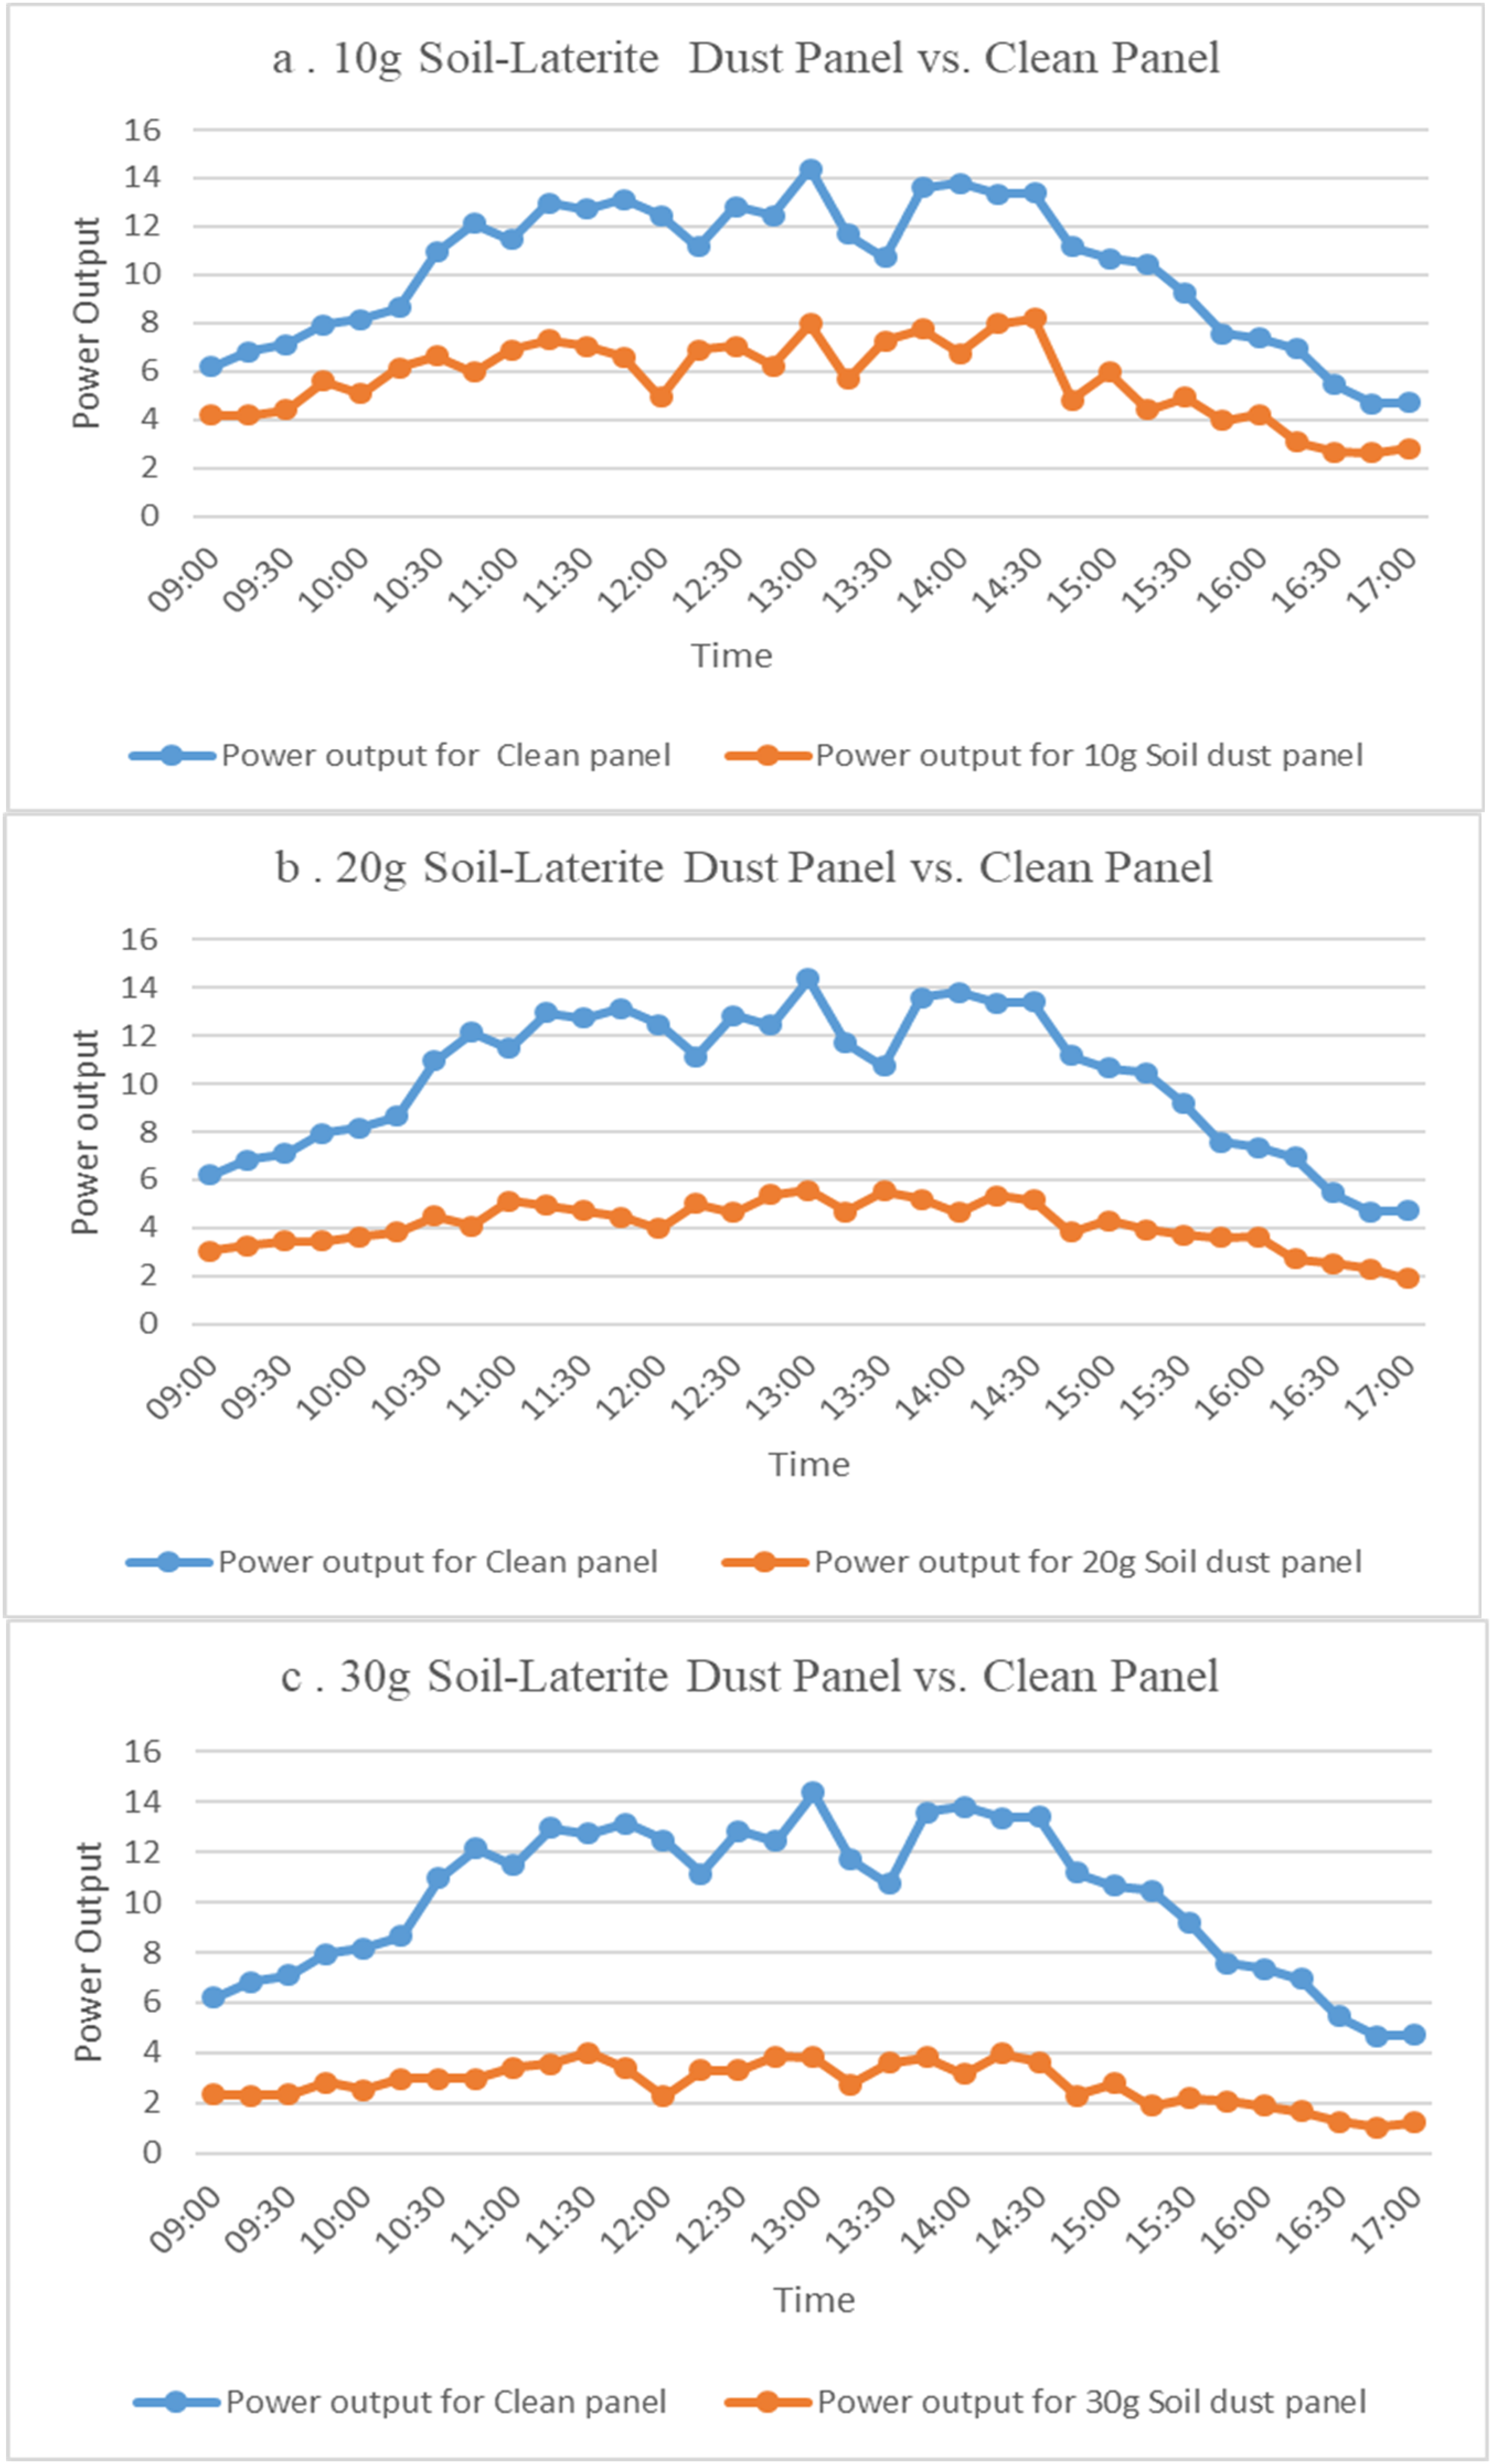
Power output of different concentrations of soil-laterite dust on solar panels.
Panel efficiency over time under varying soil-laterite dust concentrations
The line graph analysis of panel efficiency under varying soil dust concentrations is presented in Figure 15. The clean panel begins with an efficiency of 4.66 at 09:00, peaks at 7.16 around 12:15, and drops at 4.80 by 17:00. The panel with 10 g of soil dust starts at an efficiency of 3.16, reaches a peak of 4.43 at 12:15, and decreases to 2.95 by 17:00. This data demonstrates that while the efficiency of the dust-contaminated panel increases during the day, it remains significantly lower than that of the clean panel, highlighting the adverse impact of soil dust on panel performance. Similar trends are observed in the panel with 20 g and 30 g of soil-laterite, with the highest concentration of soil dust resulting in the most significant decline in efficiency, reinforcing the negative impact of dust accumulation on panel performance.
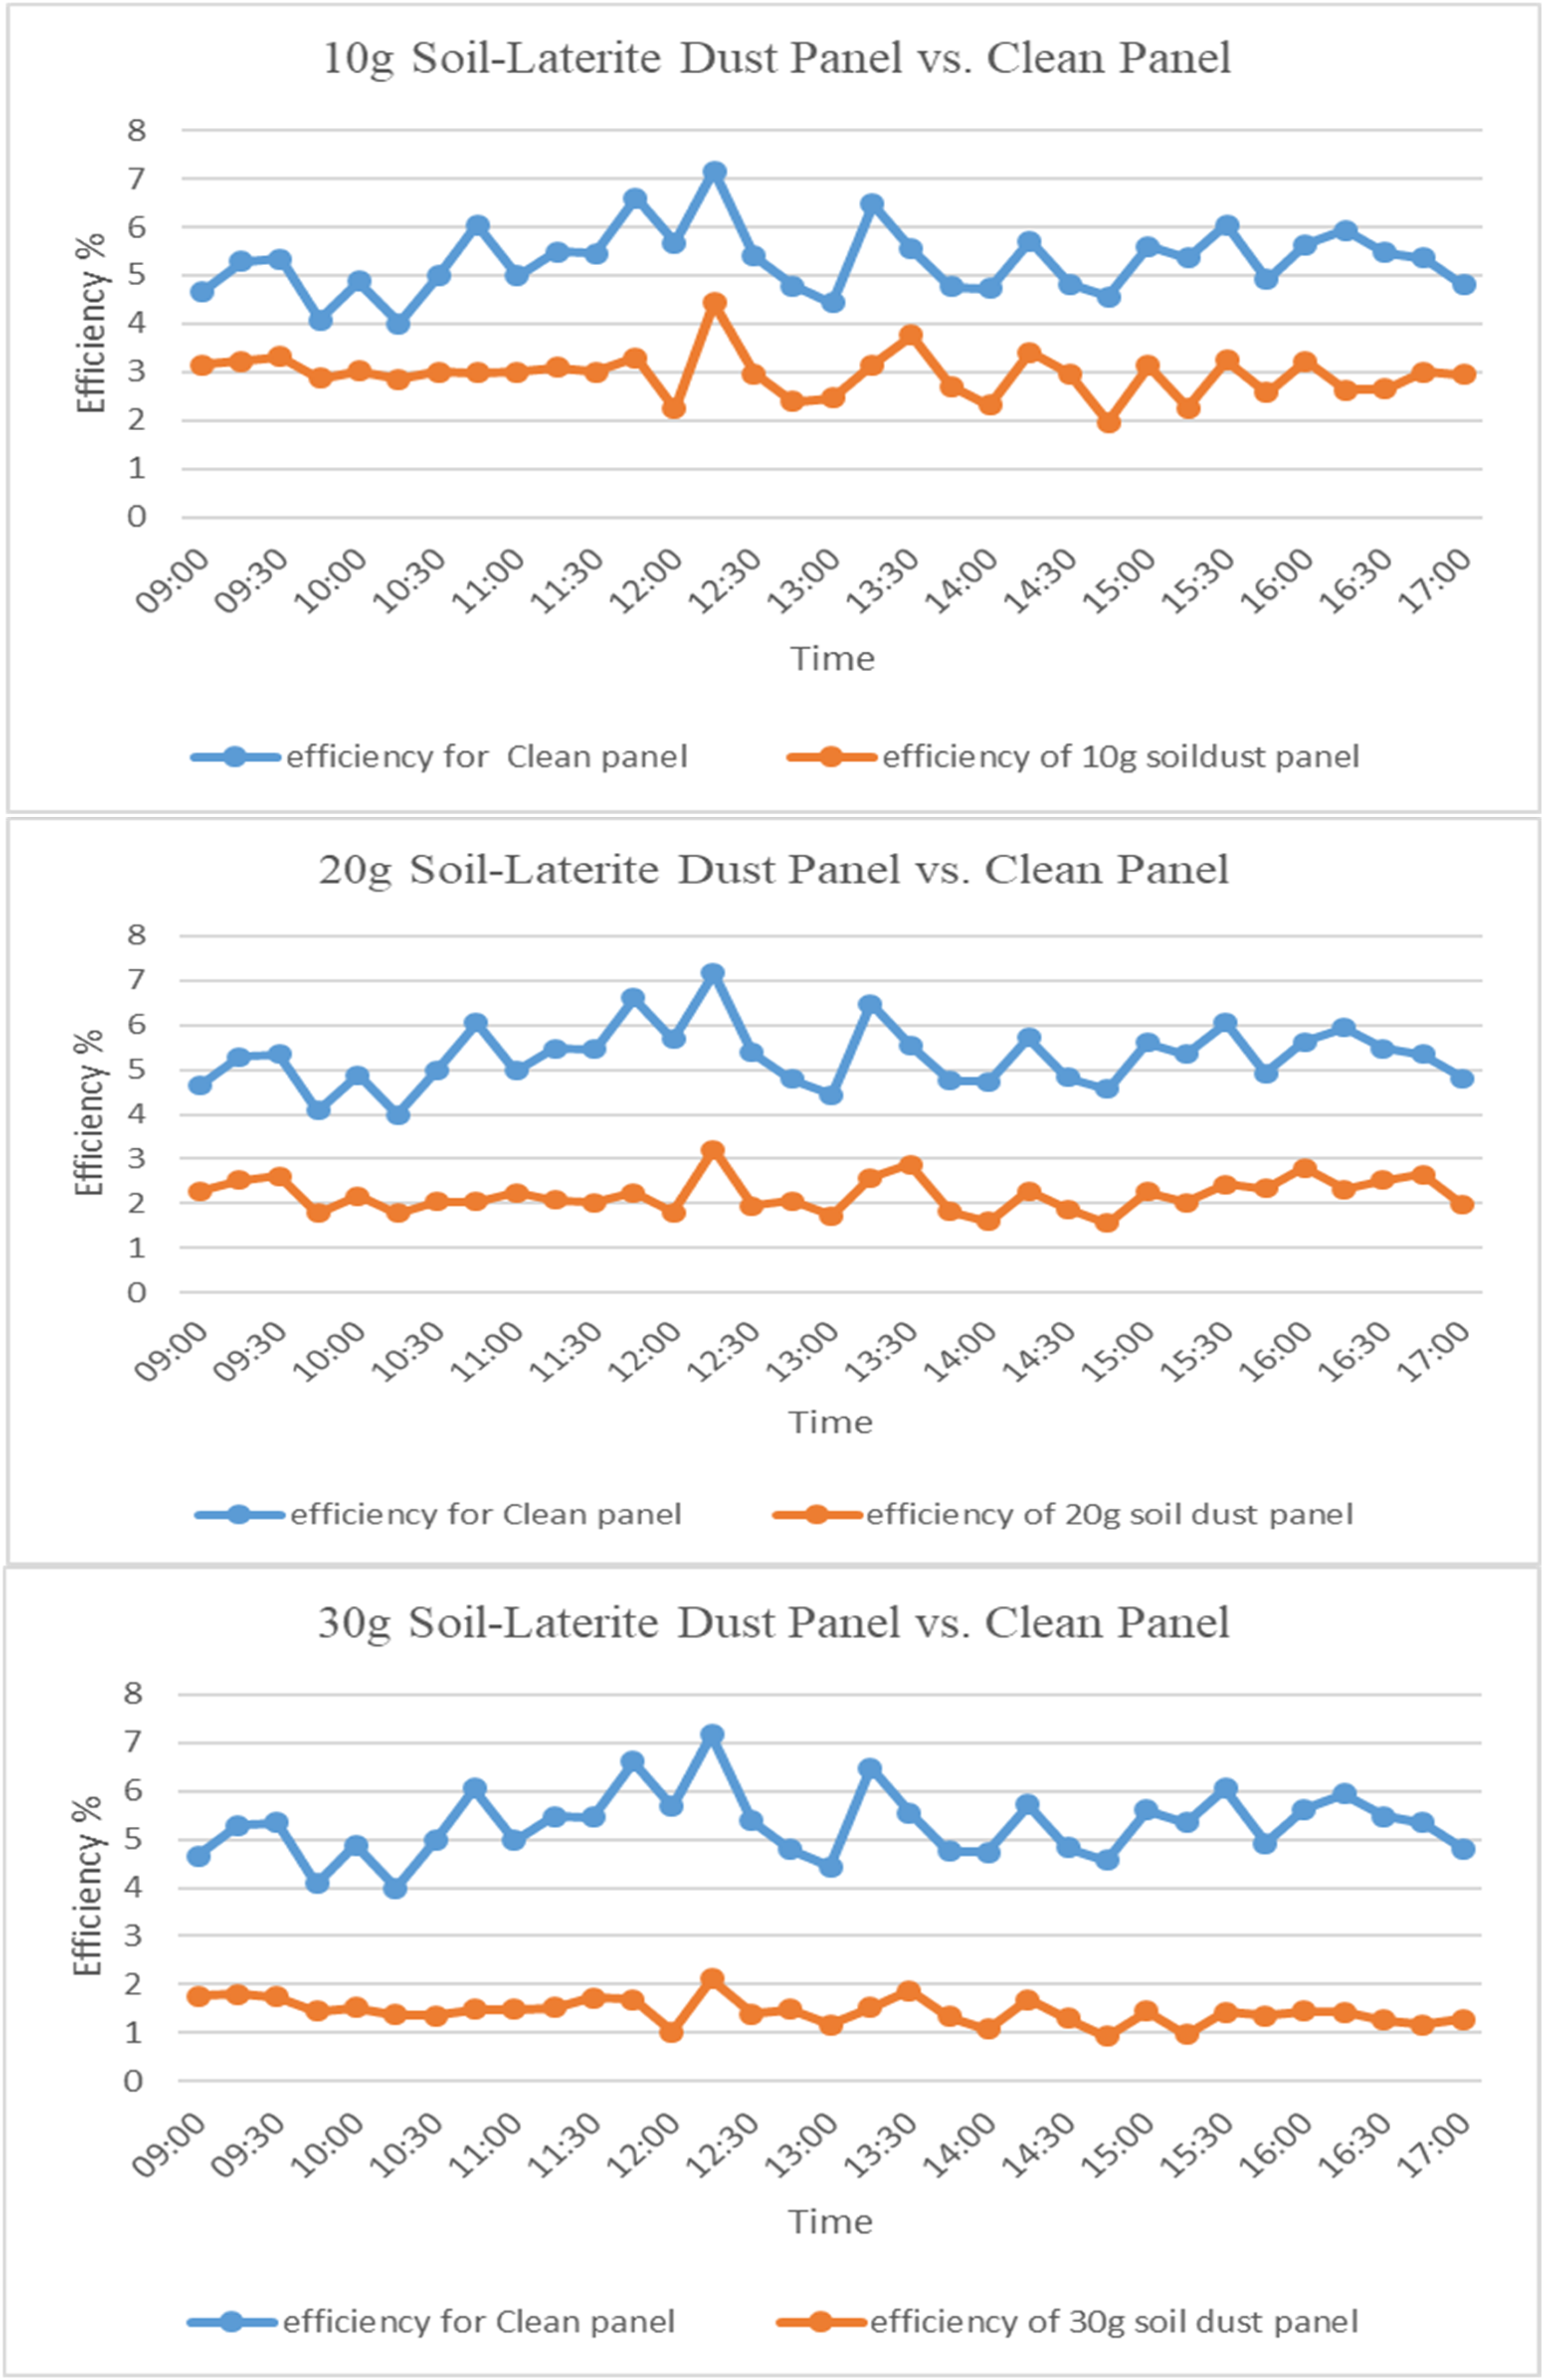
Efficiency of different concentrations of soil-laterite dust on solar panels.
Analysis of the effect of different dust types on solar panel power output
Table 12 shows the effect of different dust concentrations on the power output of a solar (PV) panel. The analysis of the three dust types reveals distinct differences in their impact on PV panel performance, primarily attributed to their physical and chemical properties as indicated in Tables 1, 2 and 3, as well as the thickness of accumulation. Cement dust, characterised by its fine particle size range of 1 to 100 µm and a high calcium oxide (CaO) content of 62.75%, exhibited the most detrimental effect on power output. At the highest concentration of 30 grams, the PV panel experienced an 80.6% reduction in power. This pronounced decrease can be attributed to the finer particles of cement dust, which tend to form a more uniform and compact layer on the panel surface. Such a layer is highly effective at scattering and absorbing incoming solar radiation, thereby significantly reducing the amount of light reaching the PV cells. In contrast, soil-laterite dust, with a broader particle size distribution ranging from 60 to 2000 µm and notable concentrations of ferric oxide (Fe2O3) at 35.53% and aluminium oxide (Al2O3) at 31.1%, led to a slightly lower but still substantial power reduction of 72.8% at the same concentration. Despite having larger particles compared to cement dust, the high content of iron and aluminium oxides likely contributed to the dust's opacity and its ability to obstruct solar irradiance. Additionally, the heterogeneous particle sizes may have resulted in an uneven dust layer, which, although less compact than cement dust, still significantly hindered the panel's efficiency. Plaster dust, with particle sizes between 75 and 900 µm and the highest sulphur trioxide (SO3) content at 44.95%, caused the least reduction in power output, registering a 68.3% decrease at 30 g. The relatively larger particle size and the chemical composition of plaster dust may have allowed for more gaps within the accumulated layer, enabling a greater fraction of solar radiation to penetrate compared to cement and soil-laterite dust. The lower opacity and less cohesive nature of the plaster particles likely contributed to this reduced impact.
Effect of different dust concentrations on the power output of solar (PV) panel.
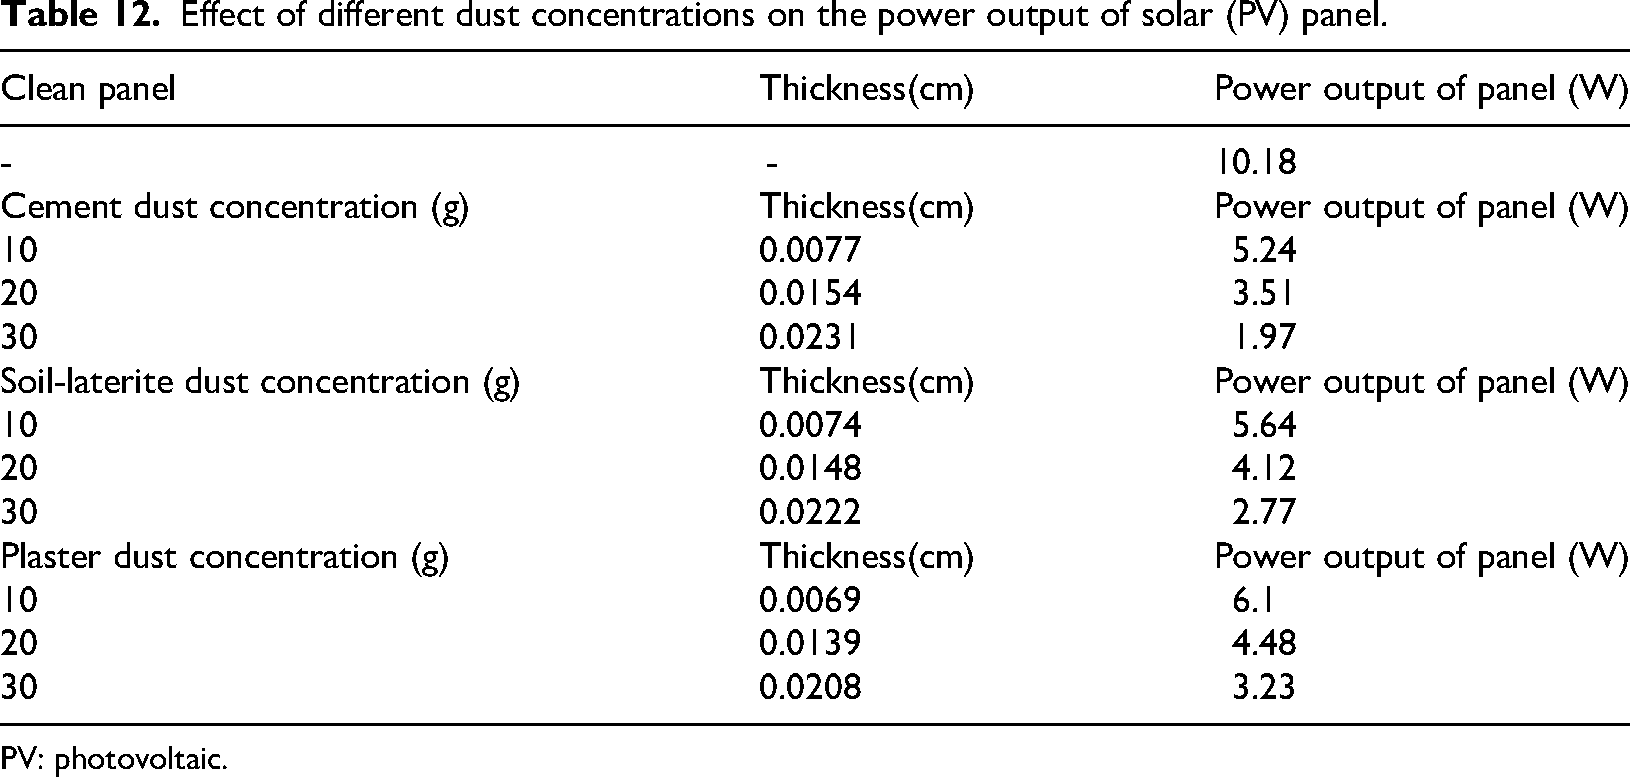
PV: photovoltaic.
Overall, the varying effects of the dust types on PV performance underscore the importance of considering both the physical dimensions and chemical compositions of pollutants. Fine particles with high surface adhesion and opacity, as observed with cement dust, present the most significant threat to solar energy generation. Conversely, larger particles with less cohesive properties, as seen with plaster dust, though still harmful, pose a comparatively lower risk. This analysis highlights the critical need for targeted mitigation strategies, especially in urban and industrial regions where such pollutants are prevalent.
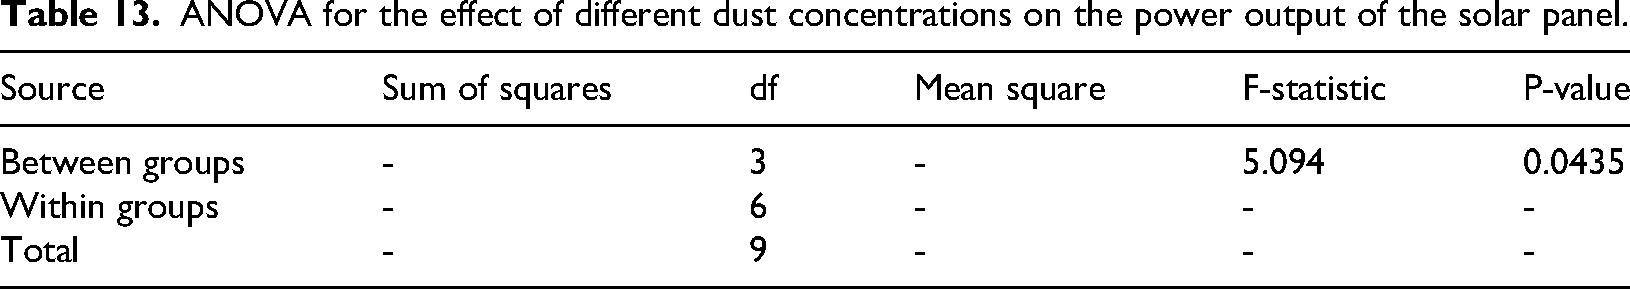
Table 13 shows the ANOVA for the effect of different dust concentrations on the power output of the solar panel. The F-statistic is 5.094, and the p-value is 0.0435, indicating that there is a statistically significant difference in power output among the different dust types and concentrations at the 5% significance level.
ANOVA for the effect of different dust concentrations on the power output of the solar panel.
Correlation and regression analysis: impact of cement dust concentrations on the power output of the photovoltaic panel
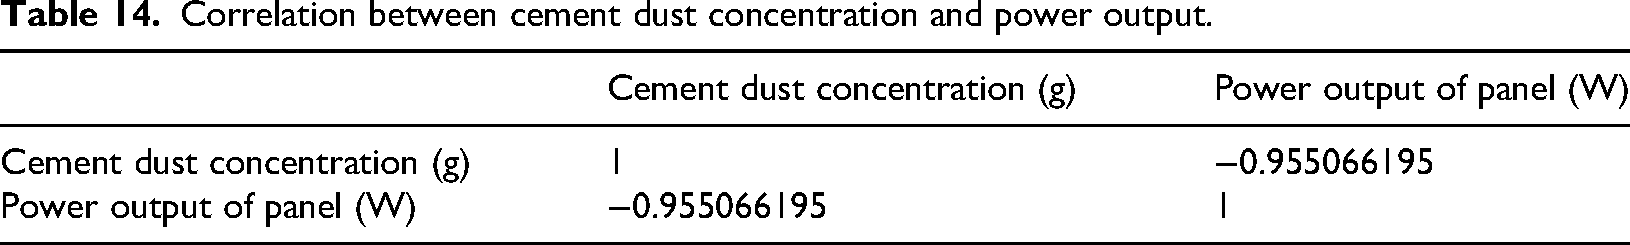
The correlation analysis performed between cement dust concentration and power output yields a correlation coefficient of approximately −0.955, indicating a strong negative relationship between the two variables as presented in Table 14.
Correlation between cement dust concentration and power output.
Regression analysis for cement dust concentration is presented in Table 15. The model exhibits a multiple R value of 0.955 and an R-squared value of 0.912, meaning approximately 91.2% of the variance in power output can be explained by cement dust concentration. This high R² value suggests the model fits the data well, despite the small sample size (n = 4). The F-statistic of 20.77 and a significance F of 0.0449 (p < 0.05) indicate that the overall regression model is statistically significant, supporting the hypothesis that cement dust concentration has a measurable effect on panel output. The regression coefficient for cement dust concentration is −0.2636, meaning that for every additional gram of cement dust, the PV panel's power output is expected to decrease by 0.26 W. The associated p-value of 0.045 confirms that this coefficient is statistically significant at the 5% level. The 95% confidence interval for the coefficient ranges from −0.5125 to −0.0147, which further validates the negative relationship between dust and output, as the interval does not include zero.
Regression analysis between cement dust concentration and power output.
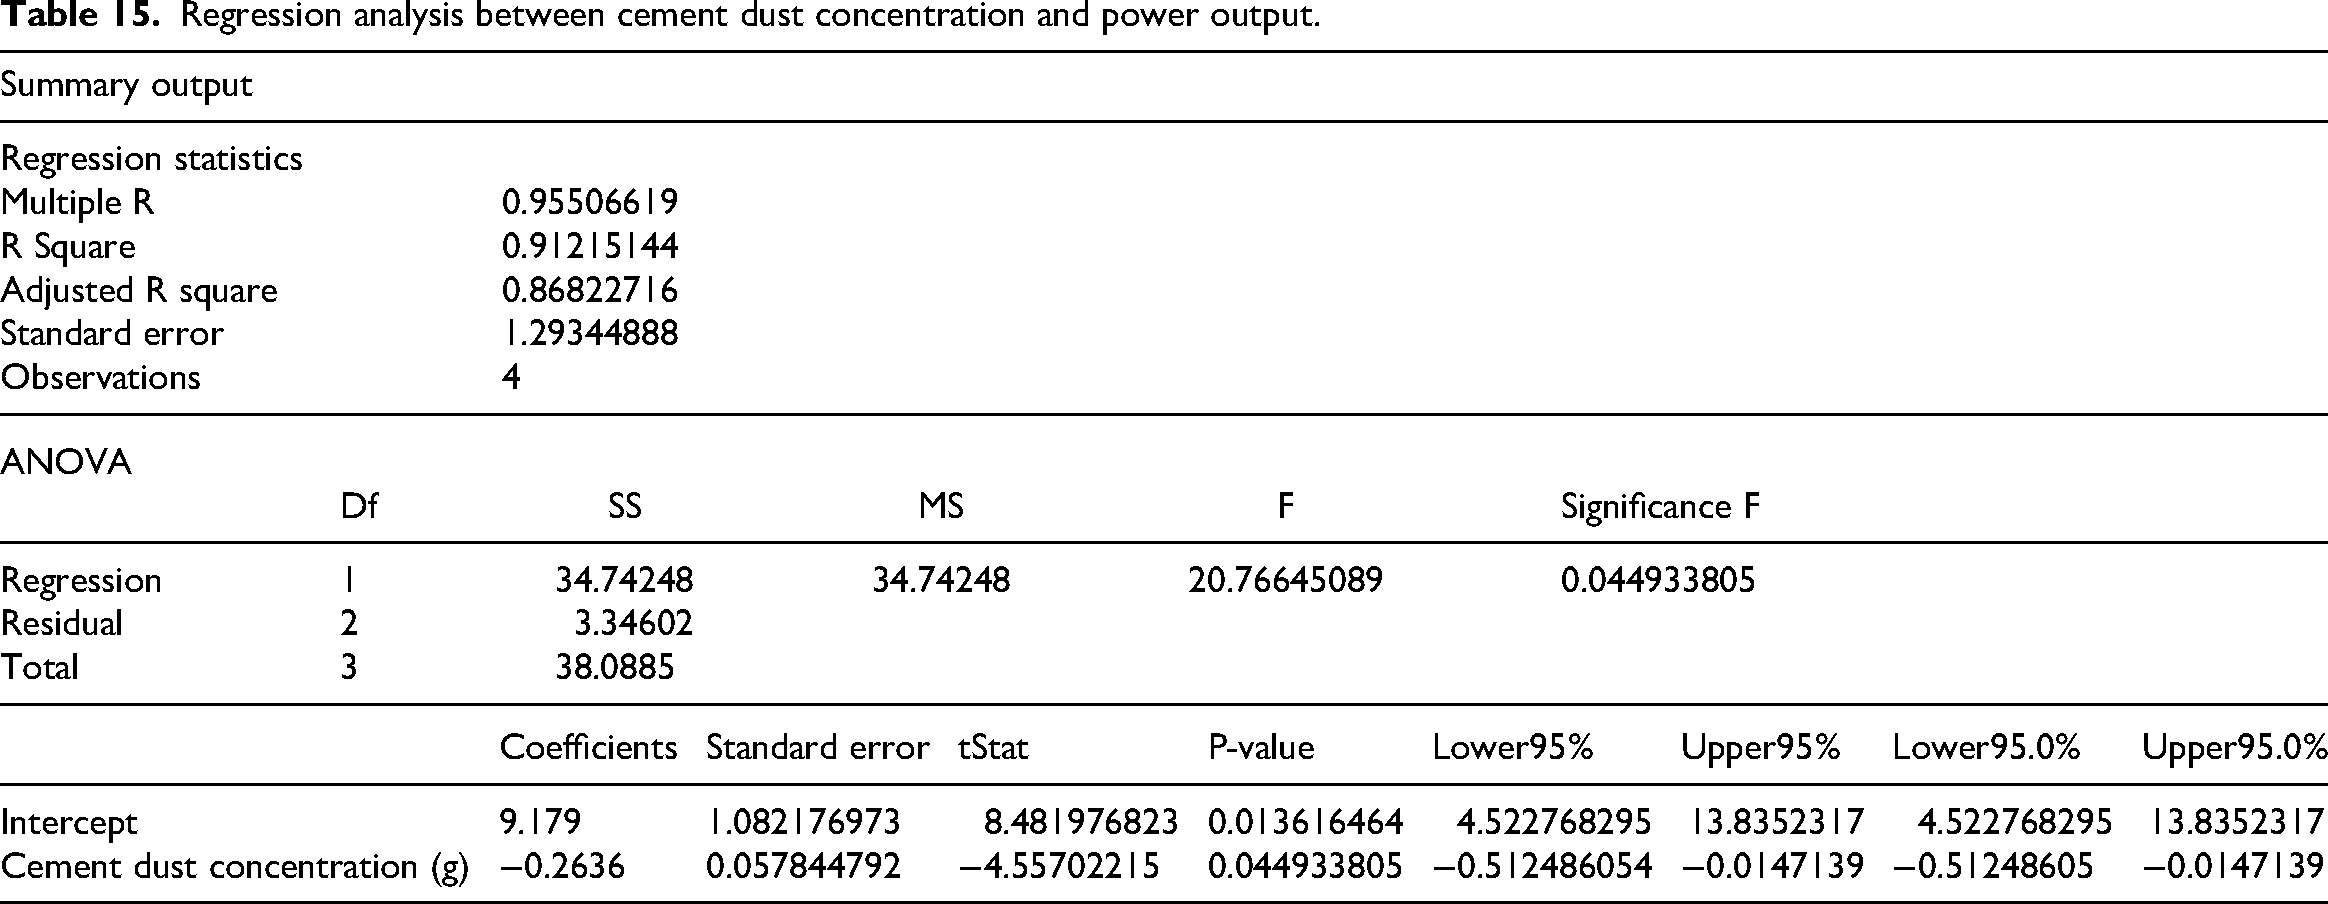
This analysis confirms that cement dust has a statistically significant and detrimental effect on solar PV panel performance. The model's predictive strength is reinforced by the high R² value and narrow confidence intervals. These results emphasise the importance of preventive dust mitigation strategies, especially in areas with frequent cement-related construction activity.
Correlation and regression analysis: impact of soil – laterite dust concentrations on the power output of the photovoltaic panel
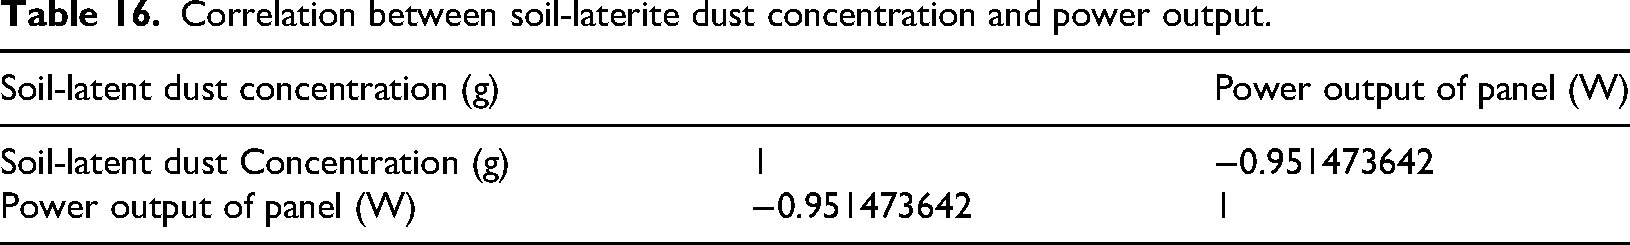
The correlation analysis conducted between soil-laterite dust concentration and power output yielded a correlation coefficient of approximately −0.951 as shown in Table 16, indicating a strong negative relationship between the two variables.
Correlation between soil-laterite dust concentration and power output.
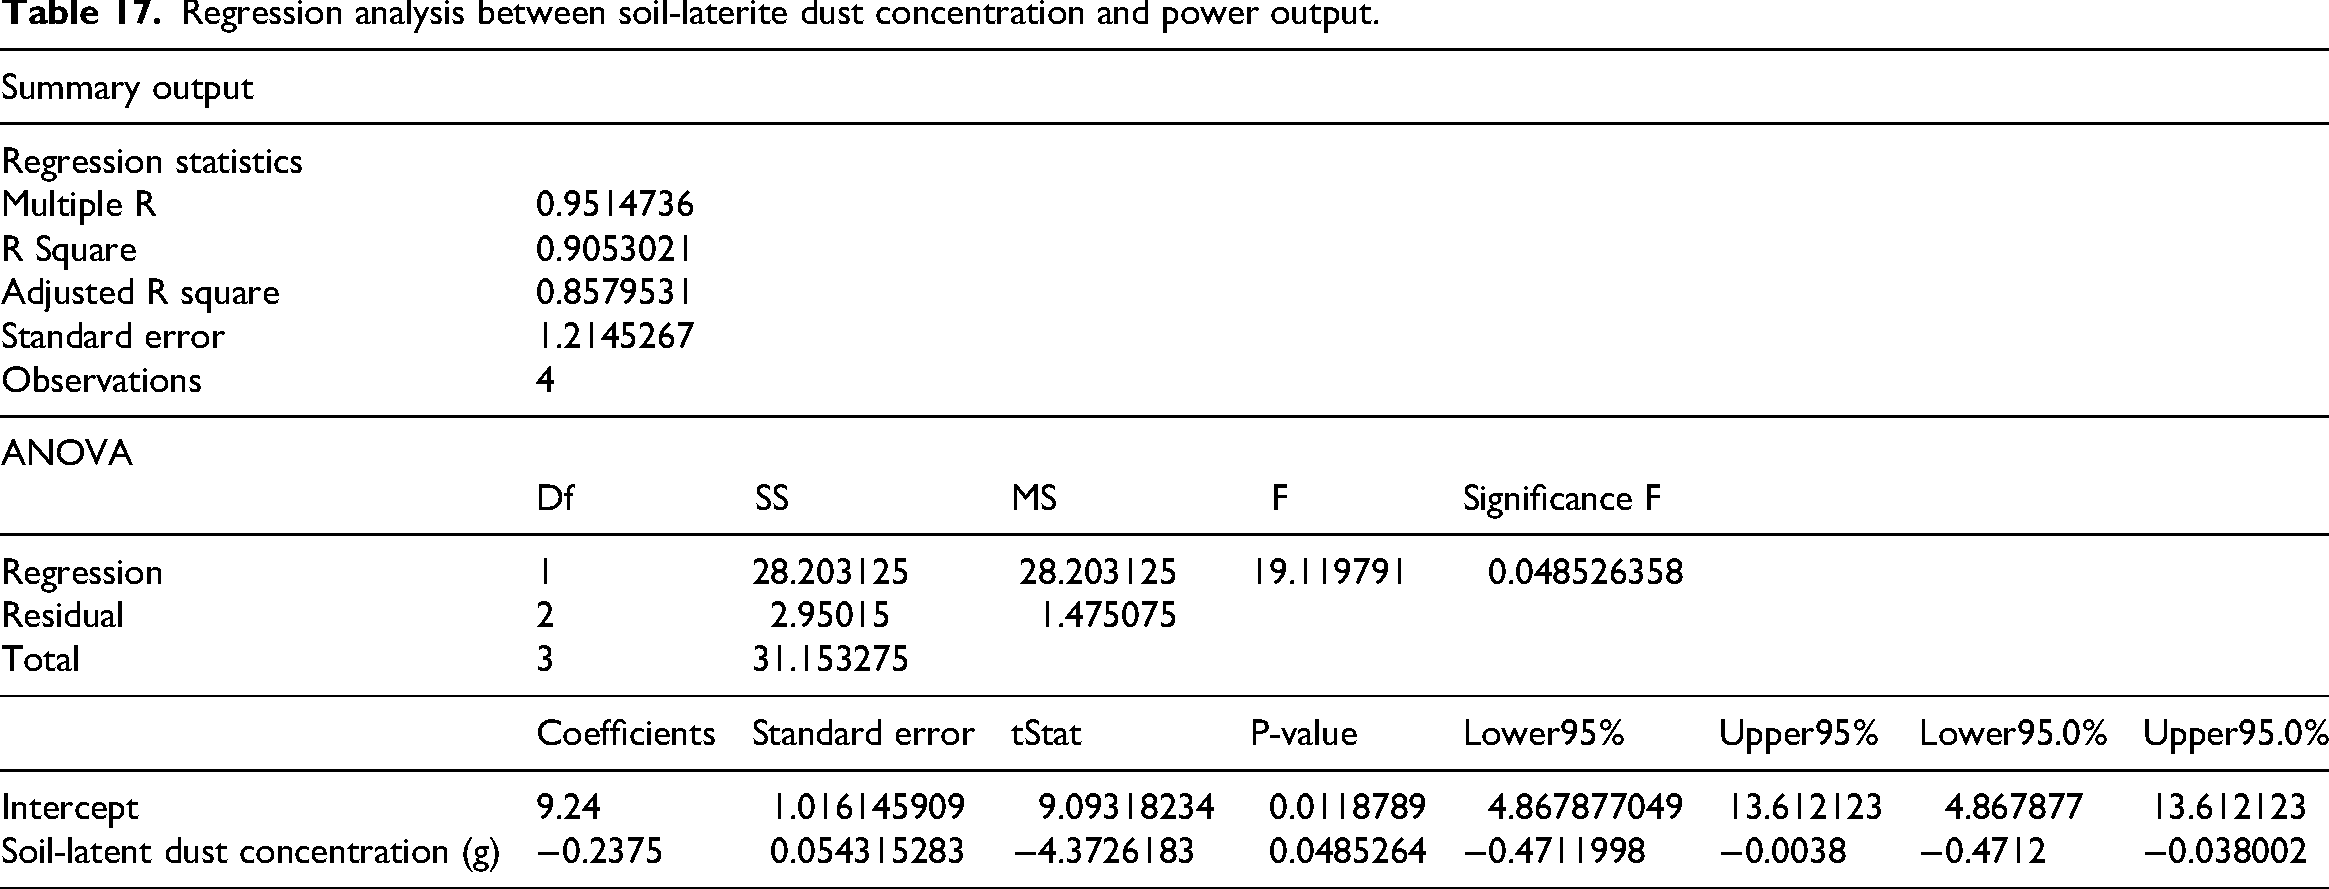
Regression analysi
Regression analysis between soil-laterite dust concentration and power output.
Correlation and regression analysis: impact of plaster dust concentrations on the power output of the photovoltaic panel
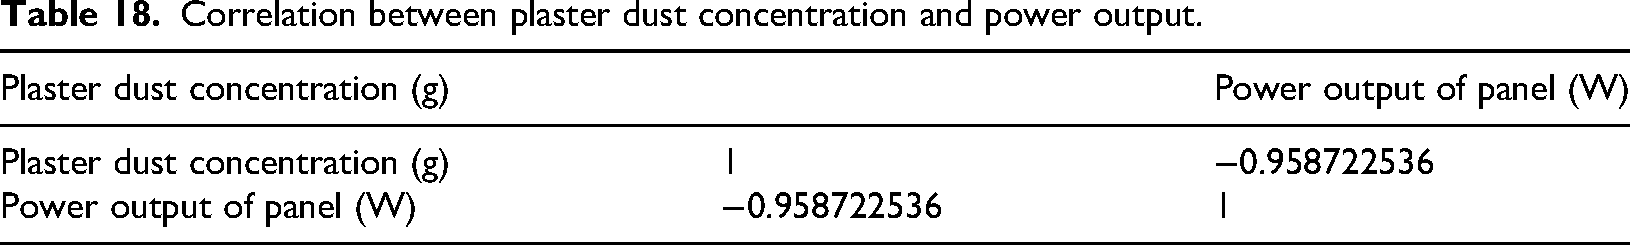
The correlation analysis conducted between cement dust concentration and power output yielded a correlation coefficient of approximately −0.958 as shown in Table 18, indicating a strong negative relationship between the two variables.
Correlation between plaster dust concentration and power output.
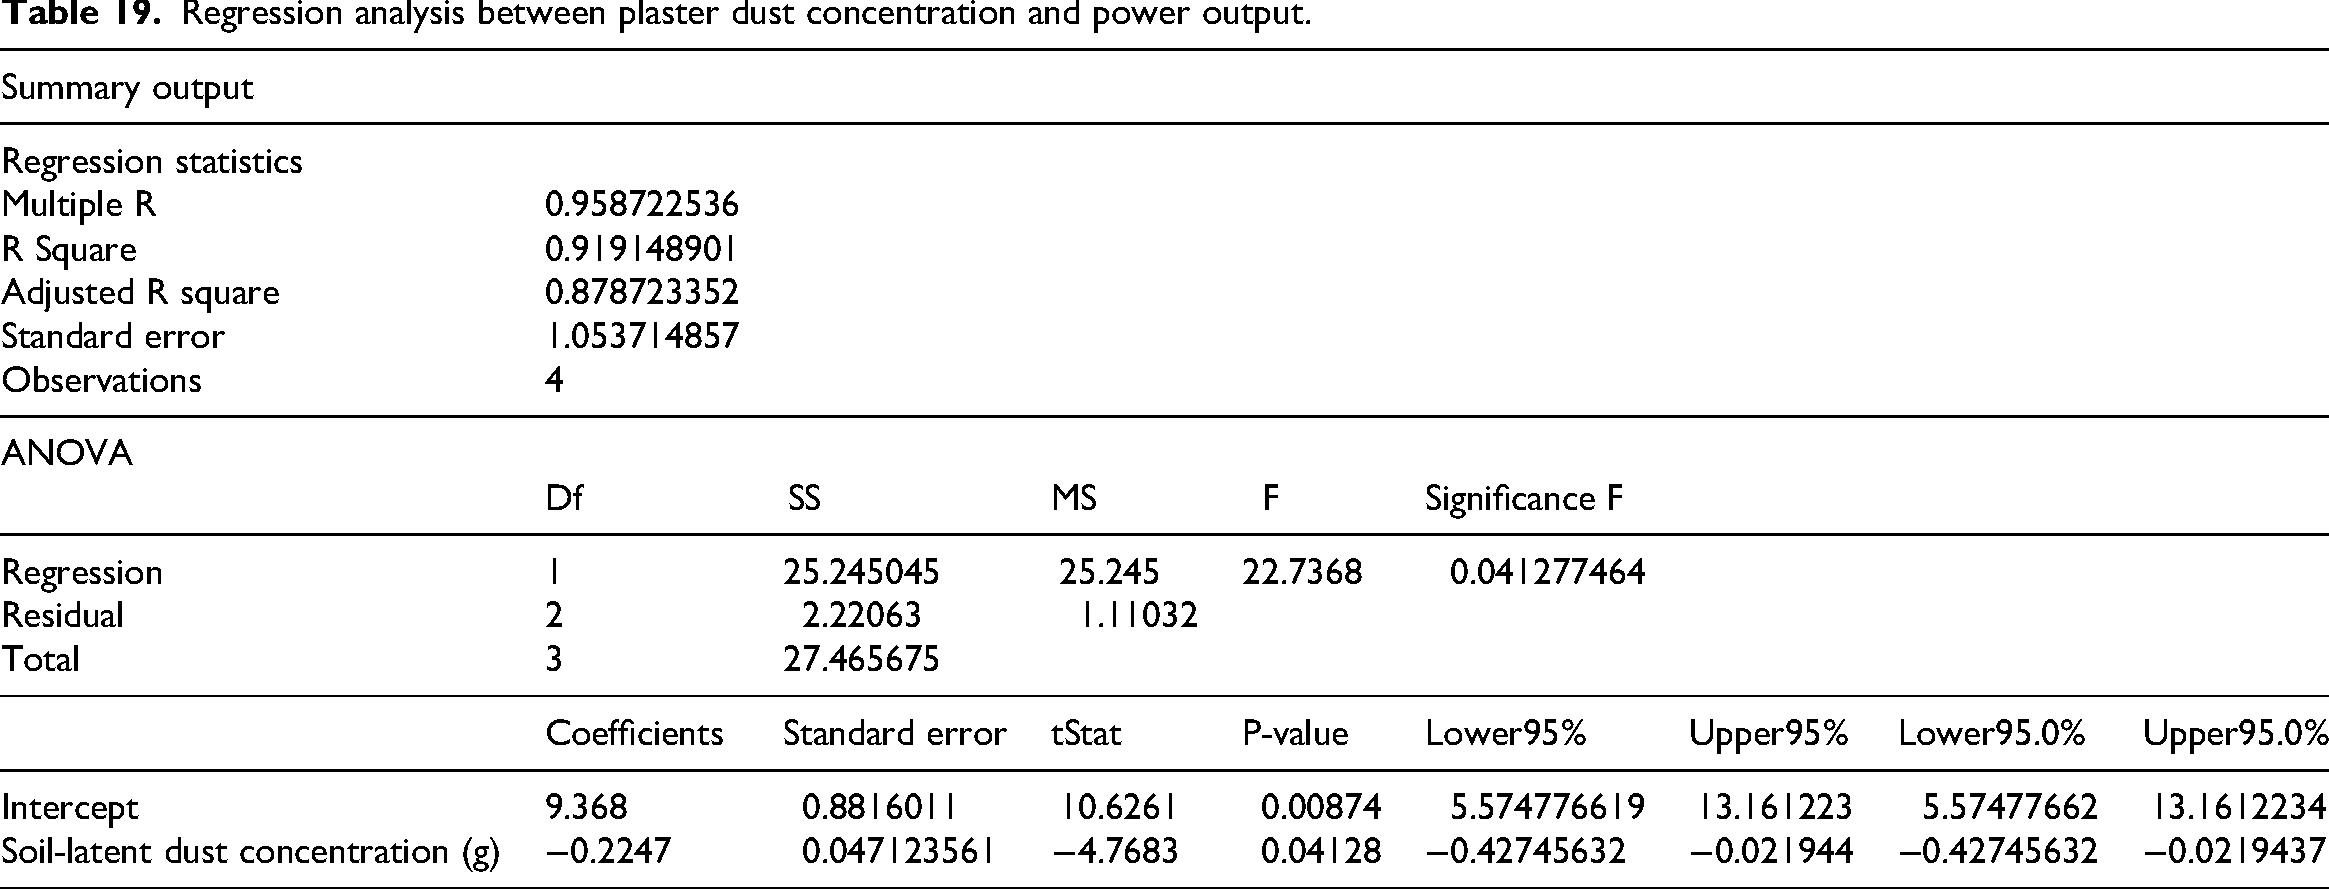
Regression analysis for plaster dust concentration is shown in Table 19. The Multiple R-value of 0.959 and R² of 0.919 indicate that 91.9% of the variance in power output is explained by the dust concentration. The Adjusted R² of 0.879 also supports the robustness of the model, especially given the limited sample size (n = 4). The F-statistic of 22.74 and significance F of 0.0413 indicate the model is statistically significant at the 5% level, confirming a meaningful effect of plaster dust on power performance. The regression coefficient for plaster dust concentration is −0.2247, suggesting that for every additional gram of plaster dust, the panel's power output decreases by approximately 0.225 W. This value is supported by a p-value of 0.0413, confirming its statistical significance. Moreover, the 95% confidence interval for the coefficient ranges from −0.4275 to −0.0219, not crossing zero, which reinforces the reliability of the negative effect observed. This analysis clearly shows that plaster dust causes statistically significant reductions in PV panel performance. With each gram of dust lowering output by nearly 0.23 W, the findings highlight a critical maintenance issue for solar systems in areas with active construction.
Regression analysis between plaster dust concentration and power output.
Discussion of finding
The findings of this study highlight the direct and proportional relationship between dust accumulation and the decline in solar PV panel performance. Across all three dust types, cement, plaster, and soil-laterite, higher dust concentrations led to more severe reductions in power output. A clear negative correlation was observed between increasing dust concentration and PV power output, consistent with the work of Salamah et al. (2022), who emphasised that even minimal dust accumulation significantly reduces energy yield. In this study, at the highest concentration of 30 g of cement dust, PV power output dropped by 80.6%, while the same concentration of soil-laterite and plaster dust caused 72.8% and 68.3% reductions, respectively. These results are comparable to those reported by Quan et al. (2022), who found that higher dust deposition densities led to progressively greater efficiency losses, with reductions exceeding 70% in areas of heavy dust accumulation.
The regression analysis in this study further confirmed this trend, showing that for each additional gram of dust, power output decreased significantly. These findings are in line with the study by Paul (2021), who also observed a linear reduction in power output with increasing dust deposition, particularly for finer dust particles that form a denser, more opaque layer over the panel surface.
Cement dust was found to cause the highest power losses due to its fine particle size (1–100 µm) and high calcium oxide (CaO) content (62.75%), which enables it to form a dense, cohesive layer that significantly reduces light penetration. This aligns with Chala et al. (2024), who reported an 80% reduction in PV short-circuit voltage due to cement dust accumulation in Oman. However, unlike Oman's desert climate, Kampala experiences high humidity and moderate rainfall, which might contribute to particle clumping and stronger adhesion to the PV surface, potentially increasing the shading effect even with lower dust mass. This suggests that cement dust may have a more prolonged impact in humid urban environments where natural cleaning by rainfall is less consistent or effective due to irregular wetting and drying cycles. The shading effect caused by cement dust further exacerbates internal resistance within the solar cells, a factor also highlighted by Vedulla and Geetha (2023), who noted that cement dust particles create a highly resistive layer, reducing overall panel efficiency by up to 85%. Said et al. (2024) reported similar findings, showing that electrical energy losses due to dirt accumulation could reach up to 80%, which closely matches the 80.6% efficiency loss observed in this study at the highest cement dust concentration. The fine nature of cement dust particles makes them difficult to dislodge naturally, reinforcing the need for frequent cleaning and maintenance, as suggested by Olorunfemi et al. (2022), who found that regular cleaning can recover up to 90% of lost efficiency.
Soil-laterite dust, though having larger particle sizes (60–2000 µm) compared to cement dust, still significantly reduced PV efficiency, with a 72.8% decline at 30 g concentration. The presence of ferric oxide (Fe₂O₃, 35.53%) and aluminium oxide (Al₂O₃, 31.1%) contributes to its high opacity, which inhibits light absorption. These results are in line with findings from Drame et al. (2021) in Senegal, where natural dust containing high clay and metal oxide content adhered strongly to PV panels and blocked solar radiation effectively. Interestingly, the behaviour of laterite dust in Kampala appeared more aggressive than in drier regions, possibly due to the hygroscopic nature of the particles, which allows them to absorb moisture and stick more firmly to surfaces, creating a denser and more opaque layer. Similar results were reported by Yavaş et al. (2022), who found that iron-rich dust particles reduce PV efficiency by absorbing and scattering solar radiation. Despite its lower cohesiveness compared to cement dust, soil-laterite particles still created a substantial barrier to solar irradiance, as previously demonstrated in studies by Yavaş et al. (2022), who observed that dust with high Fe₂O₃ content significantly increases surface reflectance, thereby reducing energy absorption. Additionally, compared to cement, the soil-laterite dust layer was less compact, meaning it may be more easily removed by wind or rainfall, a factor also noted by Zhao et al. (2021) in their study on dust deposition and cleaning methods.
Plaster dust, although causing a substantial 68.3% reduction in power output at 30 g, had the lowest impact among the three dust types. This is likely due to its larger particle sizes (75–900 µm) and higher sulphur trioxide (SO₃) content (44.95%), which made it less cohesive than cement dust. These findings align with Chanchangi et al. (2020), who found that plaster dust forms a more porous layer, allowing partial light penetration. These findings are particularly relevant in cities undergoing rapid construction like Kampala, where plaster dust is a byproduct of ongoing urban development. Even at lower concentrations, plaster dust had notable effects, reducing power output by over 25.8% at just 10 g accumulation, indicating that even small amounts of dust can significantly hinder PV efficiency. This is consistent with the work of Ziaeemehr et al. (2023), who found that light-coloured and less compact dust layers still cause significant power losses due to their ability to scatter solar radiation. Compared to studies in Istanbul and Cairo (Gunes and Balog, 2025; Kamal et al., 2023), which also face urban-construction-related dust issues, the results here show similar levels of power degradation but under different moisture and temperature conditions, highlighting the importance of localised environmental interactions with dust composition.
Conclusion
This study has demonstrated a clear and significant impact of dust accumulation on the performance of solar PV panels, with higher dust concentrations leading to greater reductions in power output. Among the three dust types analysed, cement, soil-laterite, and plaster dust, cement dust had the most severe effect. A key finding of this study is the strong negative correlation between dust accumulation and PV power output, with regression analysis confirming that every additional gram of dust led to a measurable decrease in power output.
Given the rapid expansion of solar energy in urban environments like Kampala, Uganda, where airborne dust from construction, unpaved roads, and industrial activities is prevalent, these findings highlight the critical need for regular PV panel maintenance. Effective mitigation strategies such as automated cleaning systems, anti-soiling coatings, optimised panel tilt angles, and urban dust control measures should be considered to sustain optimal PV performance.
Future research should explore long-term dust accumulation patterns, the influence of humidity on dust adhesion and removal, and the potential for self-cleaning PV technologies to minimise efficiency losses. In addition, field studies evaluating real-world dust deposition rates and their seasonal variations could provide further insights into optimising solar energy generation in dusty environments.
In conclusion, this study provides strong empirical evidence that increasing dust concentration leads to significant and predictable losses in PV efficiency, reinforcing the need for proactive dust management strategies to maximise the viability and sustainability of solar energy systems in urban and industrial regions.
Footnotes
Funding
The authors received no financial support for the research, authorship, and/or publication of this article.
Declaration of conflicting interests
The authors declared no potential conflicts of interest with respect to the research, authorship, and/or publication of this article.
Data availability
The datasets generated during and/or analysed during the current study are available from the corresponding author upon reasonable request.