
Abstract
Reliable and cost-effective electricity generation has been a significant problem for many years. Economic dispatch (ED) techniques have been widely used for efficient power production at minimal cost. However, conventional ED techniques have been studied considering only traditional power plants. With the depletion of fossil fuels and rising environmental concerns, many countries are shifting toward maximizing the share of renewable energy resources in their energy mix. The dispatch strategies should consider both conventional and renewable energy systems to align with this transition. Therefore, in this study, the ED of a system comprising 13 photovoltaic (PV) plants and 10 thermal generators is optimized using the binary artificial bee colony technique within a combined economic and emission dispatch (CEED) framework. Only selected expenditures, fuel and emission charges for thermal units, and the per-unit expense of PV power are considered. Moreover, both full solar radiation and reduced radiation conditions, simulating cloudy weather, are included in the CEED framework. The results demonstrate that the proposed algorithm gives satisfactory outputs, capping the PV share to 25% to maintain grid stability and leverage renewable energy benefits. Furthermore, the proposed algorithm is compared with particle swarm optimization (PSO) within the CEED framework. The comparative analysis depicts that the proposed algorithm reports less computational time than PSO.
Keywords
Introduction
The global pursuit of cleaner and more sustainable energy sources is continuously growing due to concerns about climate change and the rising costs of conventional fossil fuels (Jiannan and Waseem, 2024; Ubaid et al., 2024). The Earth's energy reserves are limited, and resources like petroleum, coal, and natural gas are being consumed at an accelerating rate, with projections indicating their depletion within the next 41 years (Constantin et al., 2023). Growing energy costs, environmental issues, and rapid fuel depletion have significantly increased interest in renewable energy sources. As highlighted in Divison’s (2024) study, Pakistan's total electricity production stands at 92,091 GWh, with contributions from various sources: thermal power at 59.4%, hydropower at 25.4%, nuclear energy at 8.4%, and variable renewable resources at 6.8%. The country experiences an average solar insolation of 5 to 7 kWh per square meter per day across nearly 95% of its territory, with a persistence factor exceeding 85%, as noted in Munawar’s (2009) study. Pakistan's power sector operates as an interconnected network, primarily dependent on conventional energy sources. Significant upgrades and modifications are essential to align with modern energy demands, including renewable sources.
The power sector strives to produce electricity at the lowest possible cost while adhering to operational constraints and limitations imposed on generating units. Economic dispatch (ED) plays a key role in optimizing generation costs while ensuring that power demand is met efficiently (Bo et al., 2023; Thammarsat and Tsung-Che, 2024). Various constraints, such as power balance, generator capacity limits, and ramp rate restrictions, are considered in ED. A range of optimization techniques incorporating both equality and inequality constraints have been explored for ED, as highlighted in Guojiang et al.’s (2014) study. However, with growing concerns over the environmental impact of emissions from fossil fuel-based thermal power plants, power utilities must now factor in environmental regulations alongside cost-effectiveness. This has given rise to the multi-objective economic load dispatch (ELD) problem, also referred to as combined economic and emission dispatch (CEED) (Dimple and Sanjay, 2013). Fossil fuel-based power plants, which rely on coal, gas, oil, and diesel, release harmful pollutants into the air. Additionally, the discharge of heated cooling water from thermal plants raises surrounding water temperatures, adversely affecting aquatic ecosystems. Nuclear power plants also pose environmental risks by emitting hazardous radiation. Due to these concerns, emission control has become a crucial operational objective and a key component of the dispatch process (Dimple and Sanjay, 2013).
Conventional optimization techniques such as Lagrangian relaxation (Liangliang et al., 2024), gradient-based methods and dynamic programming (Long et al., 2023; Yuzhu et al., 2023), integer programming (Fatemeh and Akmal, 2024), lambda-iteration (Vikas & Omveer, 2023), and the Newton–Raphson method (Ana et al., 2024), have long been used for ELD problems. However, they often depend on derivative information, may produce suboptimal solutions, and demand high computational effort for complex nonlinear scenarios (Hardiansyah et al., 2013). Linear programming requires piecewise linear cost approximation, while Newton's methods struggle with managing many inequality constraints (David and Anders, 2023; Saied et al., 2024, 106711). To overcome these limitations, modern meta-heuristic optimization techniques have been increasingly employed (Arunachalam, 2022; Manteaw & Nicodemus, 2012; Mohammed et al., 2024; Mohd et al., 2023; Muhammad et al., 2024; Ruxin et al., 2024; Syama et al., 2024; Tingyu et al., 2024). These techniques provide more efficient and effective solutions for complex optimization problems compared to traditional techniques.
The artificial bee colony (ABC) method optimizes complex ELD problems efficiently. Compared to other heuristic approaches, the promising features of ABC include stable convergence, better quality solutions, and good computational efficiency. The ABC has been used for solving a variety of optimization problems given in the literature (see for instance, Alok, 2008; Çobanl et al., 2010; Dervis and Bahriye, 2007; Karaboga and Bahriye, 2008; Karaboga and Bahriye, 2009; Nayak et al., 2010).
This work presents a mixed-integer CEED optimization model for solar-integrated power systems and introduces a binary ABC (BABC) algorithm to solve the optimization problem. The effectiveness of the suggested algorithm is evaluated by assessing its results against those obtained using particle swarm optimization (PSO). Additionally, the study investigates the effects of variations in solar radiation due to cloudy conditions on system operations.
The following is an outline of the rest of the article: The literature review will be covered in the second section, and the multi-objective CEED problem, the specifics of the BABC approach used to solve the CEED problem, including solar power, and the test system utilized are covered in the third section. The fourth section documents the findings while the fifth section presents the conclusions obtained during this research.
Literature review
In Karaboga and Bahriye (2009), a benchmarking study of ABC is performed by implementing various techniques for 48 different types of functions. The authors in Juan et al. (2006) demonstrated that, compared to other empirical solving techniques such as differential evolution, generic algorithm (GA), and PSO, ABC has the advantages of being more flexible, simple, and very fast due to the existence of fewer parameters that need to be controlled. The ABC proves to be more promising and powerful in terms of performance.
The ABC algorithm has been effectively applied to both the leaf constrained minimum spanning Tree (LCMST) and ELD problems, outperforming traditional methods like GA, PSO, and ant colony optimization (ACO). It handles smooth and nonsmooth cost functions while considering various system constraints.
In Alok (2008), the ABC algorithm has also been applied to LCMST problem. Its performance is evaluated by comparing it with other established algorithms in the literature, such as the subset-coded GA, tabu search-based LCMST, and ACO for LCMST. The results indicate that the ABC approach outperforms these benchmark techniques. In another study (Nayak et al., 2010), researchers utilized the ABC algorithm to solve the ELD problem. The outcomes were compared with those obtained using PSO, GA, and other conventional techniques found in previous research. The study considers both smooth and nonsmooth cost functions, incorporating constraints such as power loss, generator capacity, ramp rate limitations, and prohibited operating zones for generators in the nonsmooth case. For smooth cost functions, constraints related to power balance and generator capacity are included. The research utilizes test cases with 6, 15, and 18 power generation units.
The ABC is used for reactive power optimization for the test model of Institute of Electrical and Electronics Engineers (IEEE) 6-bus and IEEE 30-bus systems in (Çobanl et al., 2010). The results of ABC are compared with other meta-heuristic techniques present in the literature, such as GA and PSO. Simulated results show that ABC gives a better solution than the other two techniques.
To solve the combined problem of economic and emissions dispatch (EED), an elegant method based on the seeking and searching attitude of honeybees is developed in Gaurav et al. (2011). The performance accuracy of the proposed ABC method is verified by applying it on a test bench consisting of a quadratic cost function based on 18 thermal power generators and 6 generating units based on the standard IEEE 30-bus bus configuration with loss considerations and emission constraints, respectively.
Hemamalini and Sishaj (2010) aim to achieve the balance between emission minimization and cost issues by proposing a hybrid technique based on the swarm intelligence method and multi-objective optimization problem. The problem is solved using ABC by manipulating every objective as a separate entity under the weighted sum technique. An IEEE 6-bus test bench is used to verify the proposed method's effectiveness. In addition, the results obtained from multi-objective ABC are compared to other existing methods, reporting better performance under all scenarios.
The multi-variable function optimization problem can be solved using the ABC technique. The ABC algorithm is used for solving the EED problem involving a multi-variable function in Sonmez (2011) which is different from that of the multi-objective EED in Karaboga and Bahriye (2008). The problem is converted into a single objective by using the price penalty factor and is solved using ABC. As a test bench, a standard IEEE 30-bus system consisting of 6 generating units is considered. The results derived from the analysis have been compared against the previous literature reported by Harry and Robert (2003). The comparative study reflects that the ABC algorithm produces more accurate and improved solutions for EED problems compared to other pragmatic methods.
The study in Harry and Robert (2003) takes into account both economic factors and the environmental impact of emissions from fossil-fueled power plants. To address this multi-objective optimization problem, the Non-Dominated Sorting Genetic Algorithm II is employed. The effectiveness of this approach is demonstrated using two distinct test systems.
Various experimental methods have been recently proposed for solving power system ED problems. In Yacine et al.’s (2014) study, for instance, the valve-point effect is considered in the solution of ED problem and optimized using ABC technique. Considering the valve-point effects, the recommended approach is implemented on different test frameworks, taking incremental fuel cost as a function. The outcomes demonstrate that the proposed methodology is effective and powerful compared to other optimization techniques referred to in the literature.
Gaurav et al. (2012) also present an ABC algorithm for three and six generating units combined in a test system. Their effectiveness is measured through the solution of combined emissions and economic dispatch problem. Results demonstrate that the proposed method can handle robustly and effectively the multi-objective optimization problem (Gaurav et al., 2012).
The streamlining of coal-based fuel used to fire the generators has been considered in Ganga (2012). The authors compare ABC with other techniques for the mentioned purpose. Gauss Seidel and Newton–Raphson techniques are the two conventional methods used for the solution of ELD problems. However, their complexity increases exponentially as the size of the system increases. Fuzzy logic, artificial immune systems, and neural networks are some of the artificial intelligence (AI) techniques used to overcome the drawbacks of conventional methods. In Ganga (2012), ABC is compared with the other techniques. A comparison shows that conventional techniques may land at a local minimum while ABC assures a global minimum. The results of ABC are compared with classical methods, lambda iteration, and GA. Three sets of generator data are used for the performance evaluation in terms of losses, that is, three generators, IEEE six-generator 30 bus system, and 38 generators test data (Ganga, 2012).
Hardiansyah (2013) employs ABC to solve the ELD problem. The proposed setup consists of 3, 6, and 15 thermal unit systems, considering linear inequality and equality constraints. All the results were compared with the GA and a conventional method (quadratic programming). The algorithm used in this article is equipped with efficient solutions.
The study by Belkacem and Kamel (2014) introduces an enhanced ABC algorithm designed to handle economic dispatch problems for generators with nonlinear characteristics, including the valve-point loading effect. To improve performance, a novel local search mechanism is integrated with the ABC algorithm, allowing for more efficient identification of optimal solutions. The proposed method is applied to large-scale power systems comprising 13 and 40 generating units while accounting for valve-point loading effects. Comparative analysis demonstrates that this approach effectively addresses complex and large-scale economic dispatch problems, outperforming traditional methods.
A new algorithm is proposed by Hardiansyah (2015) that aims to improve the conventional ABC algorithm. In this method, the next iteration solution is always close to the previous arbitrary solution. Moreover, perturbation in frequency is controlled by the introduction of a controlled parameter. A modified ABC (MABC) is produced by combining all the previous methods. The standard IEEE 30-bus test system is used for the testing of the CEED solution, which was performed using MABC and compared with the algorithms reported in the previous work.
Abdullahi et al. (2023) implemented conventional and variants of smell agent optimization (SAO) algorithms for different optimization problems. In the first stage, the Quasi-oppositional based learning SAO (QOBL-SAO) and its levy flight variation (LFQOBL-SAO) are tested on 10 benchmarked functions and 5 CEC2020 real-world optimization problems. The variants of SAO are implemented to optimize the hybrid system consisting of photovoltaic (PV), wind, and battery storage. The findings demonstrate that the LFQOBL-SAO outperforms the conventional SAO and QOBL-SAO algorithms.
In Hassan et al.’s (2022) study, the techno-economic evaluation and sensitive analysis of renewable energy resources and diesel-based power plant is conducted using combined dispatch strategies for six locations in Saudi Arabia. The simulations are performed using Hybrid Optimization of Multiple Energy Resources (HOMER) software, and results have shown that for a fully renewable energy system, the levelized cost of energy (LCOE) is 0.305 to 0.399 US$/kWh for Abha and Hail locations. The LCOE is around 30% to 50% higher for different locations.
The economic assessment of three renewable energy resources, PV, wind, and battery is studied by Hassan et al. (2021). First, the solar irradiance and wind speed data for seven locations are collected through ground monitoring stations. Findings illustrate that for the data of 2019, the PV/wind/battery system is suitable for Yanbu and Sharurah cities. While for Al-Jouf, Al-Wajh, Hafr-batin, Jeddah, and Riyadh, the PV/battery system has the lowest LCOE. The proposed study projected that with the decline in the cost of PV and battery systems compared to wind turbines till 2025, the PV battery system will have the lowest LCOE for each city.
In this research work, the ED of 13 solar plants and 10 thermal generators is optimized in a CEED model. The ABC is implemented for the CEED problem. For simplicity among the various costs, that is, fuel, labor, maintenance, and supply cost, only fuel and emission costs are considered for thermal units along with the solar plants per unit cost. Based on the nature of the decision variables involved, the ED problem to be optimized is a mixed integer optimization problem. Moreover, the aspects of full solar radiation and reduced radiation due to the cloudy environment are also considered. The solar units cannot be dispatched for complete demand due to their unpredictable nature; therefore, solar power is restricted to 25% of the total power dispatched.
Method
Multi-objective problem formulation
This section focuses on the formulation of the multi-objective optimization problem. The main aim of the CEED is to optimize fuel costs and minimize emissions simultaneously while ensuring all operational constraints are met and can be represented mathematically by equation (1). ‘n’ denotes the number of generating plants.
Equality and inequality constraints are as follows. ‘n’ denotes the number of generating plant.


Although the CEED problem involves multiple objectives by nature, it can be reformulated as a unified optimization problem by introducing a cost adjustment parameter, represented by “h.” This factor helps in balancing the economic cost and emission levels, allowing for a unified optimization approach. By substituting


The cost of a solar power plant is
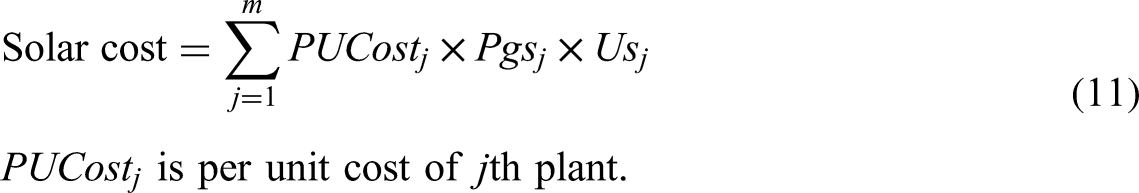
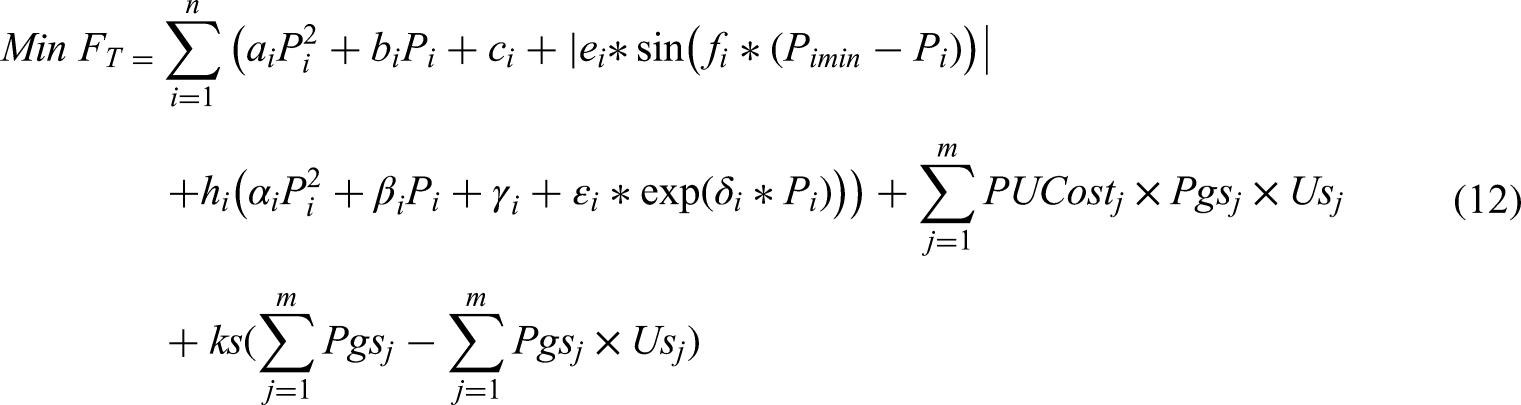
The inclusion of solar plant modifies the optimization problem as follows.


ABC algorithm
The ABC is a stochastic optimization technique that belongs to the family of swarm-based algorithms; this section provides essential details about its functionality. The algorithm draws inspiration from the food-gathering behavior of honeybees. In the ABC model, the ABC includes three types of bees with specific roles: employed, onlooker, and scout bees, as illustrated in Figure 1.
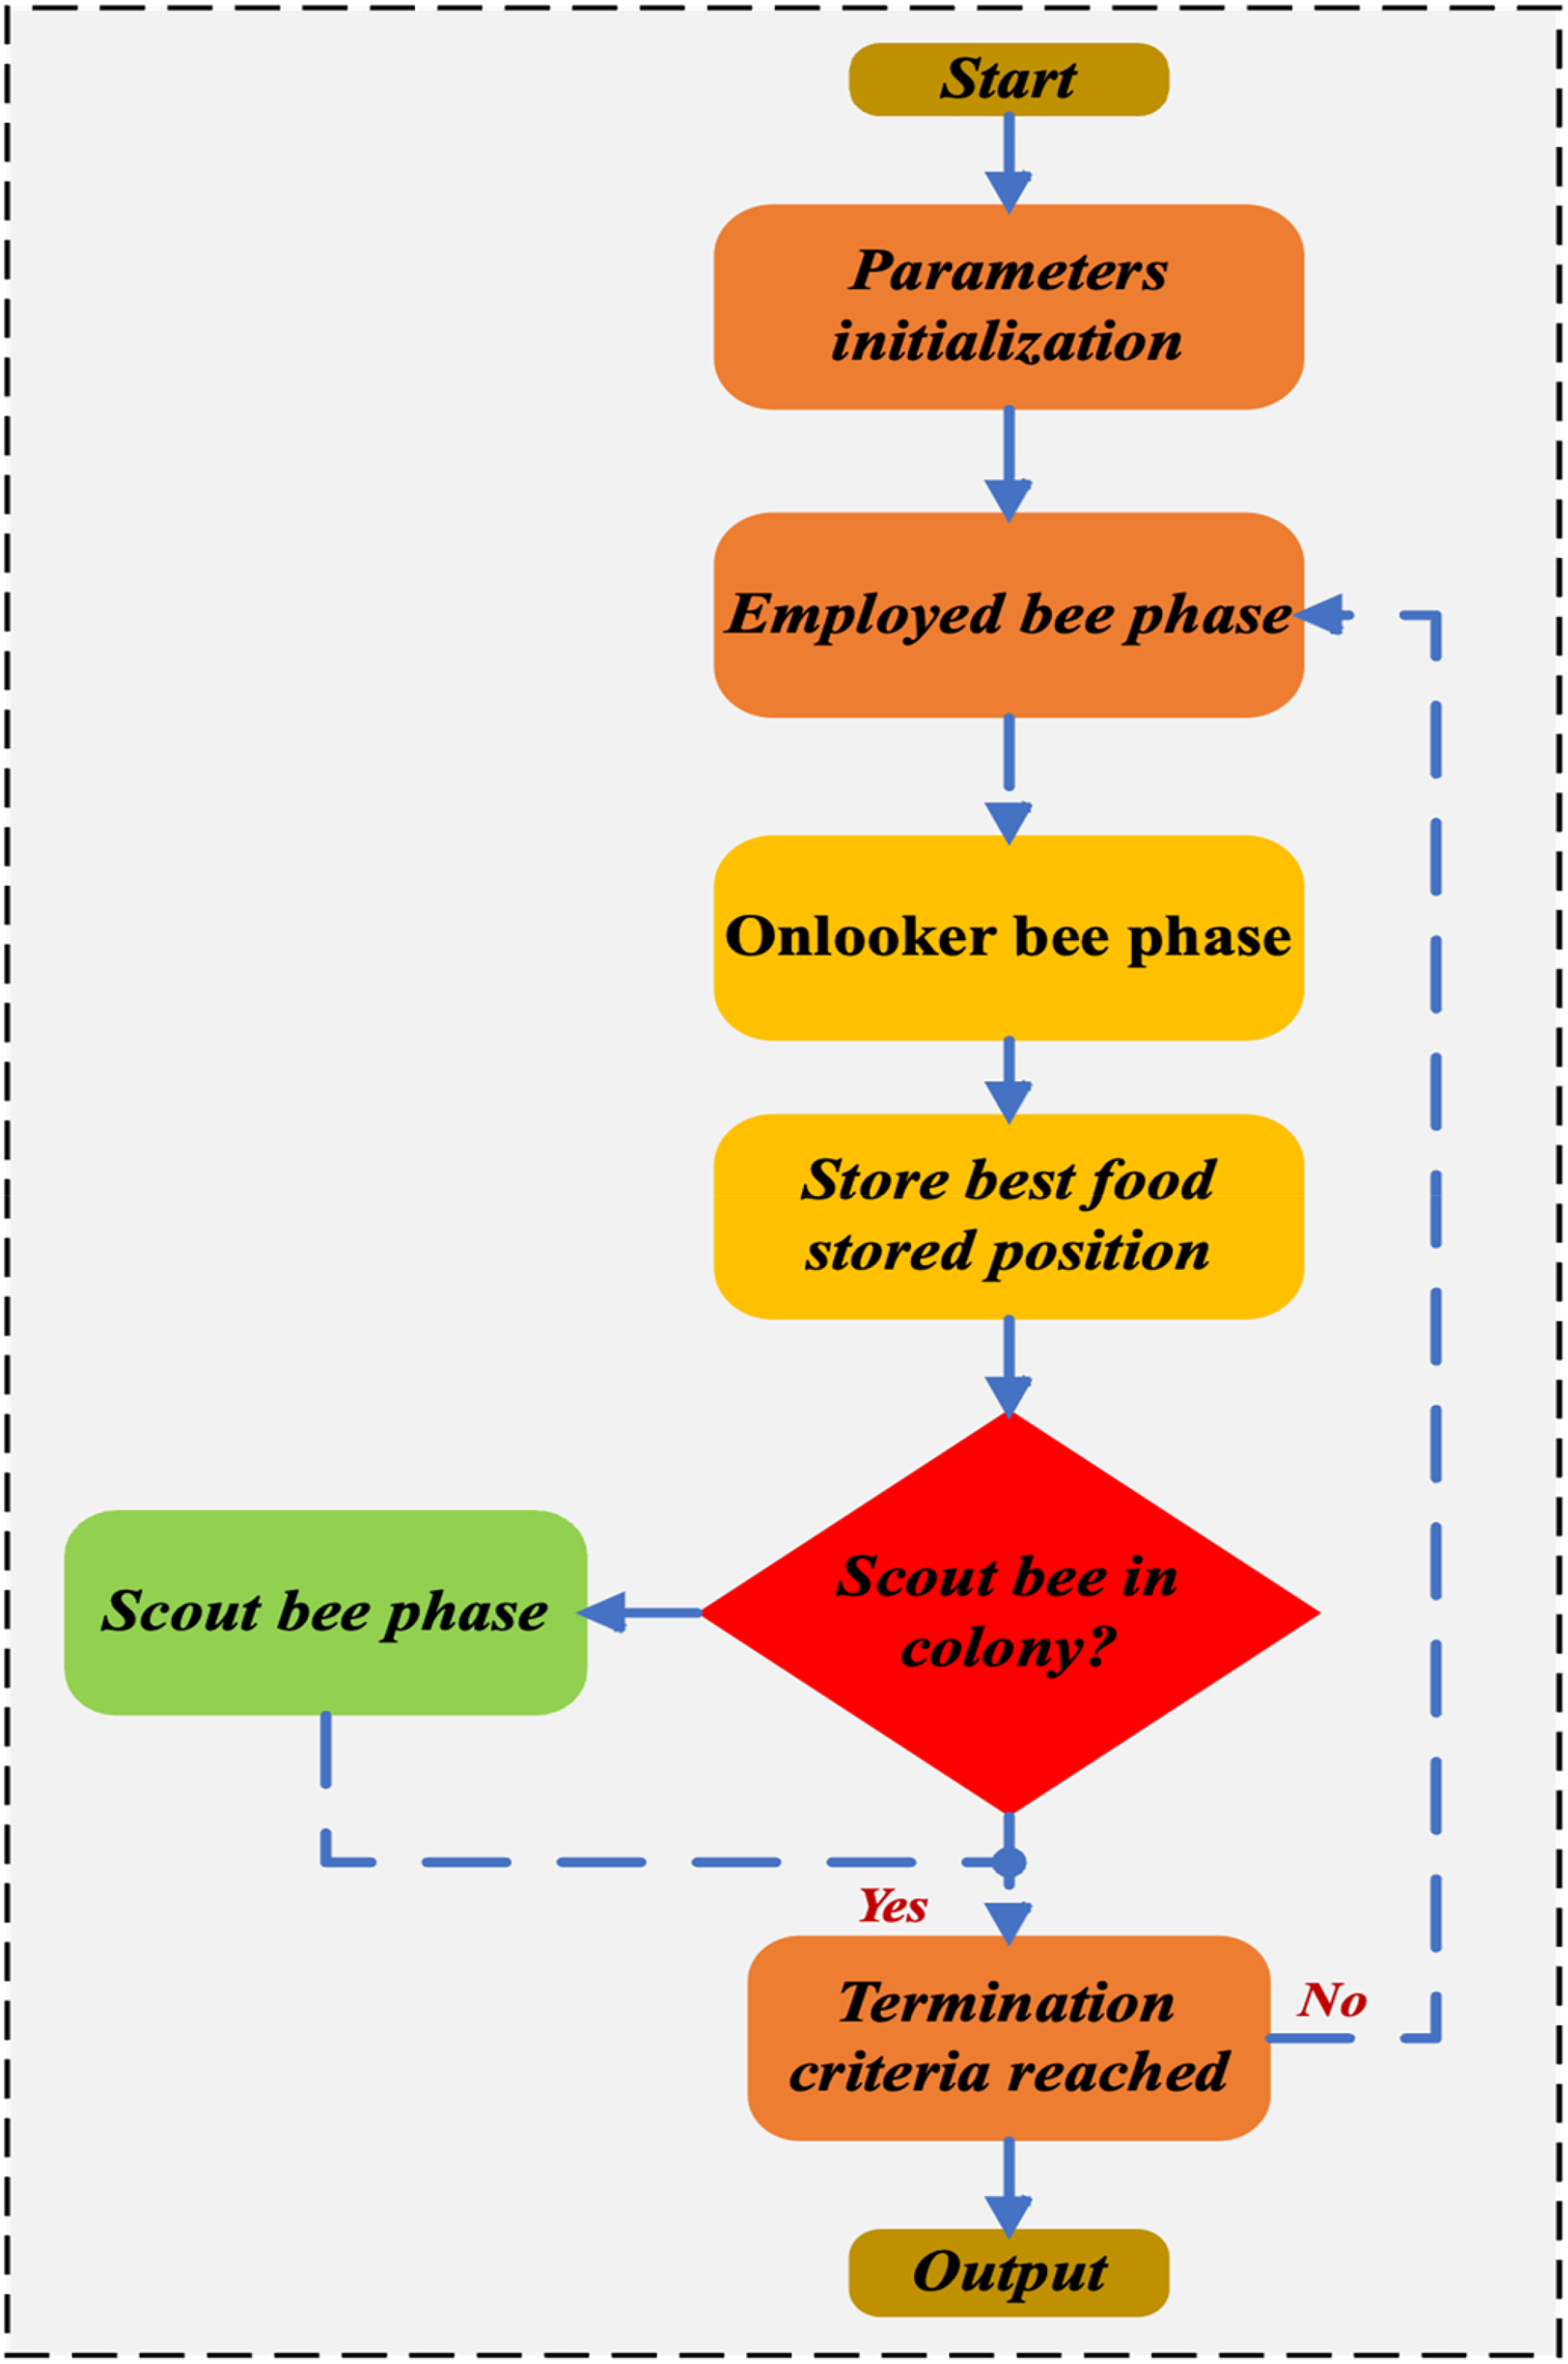
Flow chart of artificial bee colony.
The quantity of employed bees corresponds to the number of food-source situated near the hive; an increase in food sources leads to employing more bees. When a food source is depleted, an employed bee transitions into a scout bee. In the ABC framework, food source locations represent potential solutions, while the nectar quantity corresponds to solution fitness. A visual representation of the ABC algorithm's workflow is depicted in Figure 1.
Steps in algorithm
Step 1: Initialization
Initial population solutions or sources (Xi = 1, 2, 3…, D) are randomly dispersed across the dimensional problem space (D).
Step 2: Reproduction
Here, the food-source is chosen by an artificial onlooker-bee depending on the probability values (Pi) of the selected source. The calculation of Pi is formalized as:
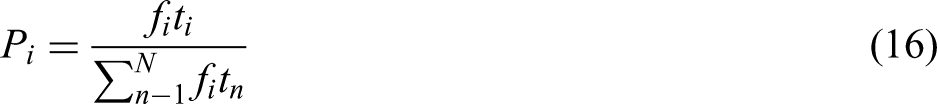
Here, fi and t i denote the fitness of the ith solution, reflecting the nectar availability at the corresponding source location, while N represents the total number of sources, also indicating the total employed bees.
The following expression is used to generate and update a potential food location, replacing the previous one stored in the record.

Step 3: Substitution of bee and source
In ABC, if it is established that a certain source cannot be enhanced even after the predetermined repetitions then the source is thought to be abandoned. Here the number of predetermined repetitions is an important aspect that is controlled by the “Limit” for abandonment.
The operation for determination of a new source by scout bees after abandoning source Xi, can be defined as:

After the production of each source position Vij, its performance is evaluated and compared by artificial bee with the old one. Provided that the new source is found in better or equal fitness than the older source, it replaces the older source in the memory. If it is not proven better or equal, the older source remains intact in the memory. Control parameters of ABC algorithm is presented in appendix Table II.
Binary ABC
Problems containing decision variables in binary form (such as either 1 or 0) are being optimized using the binary type of ABC algorithm, referred to as BABC. The structure of BABC is similar to that of the original ABC algorithm with real values, however, it has some differences as well. The differences are as follows.
The binary positions of particles are adjusted based on random selection, due to the binary nature of the BABC algorithm, A binary value is allocated to every dimension of a particle under the probability value of 0.5, The position update is done according to the following conditions,


The sigmoid function is for scaling the value of velocity in a range of 0 and 1, and is found as,

Test system
This section provides details about the test system used in the study. The system comprises 10 thermal generation units along with 13 solar power plants. The system has been designed for the Capital Territory of Pakistan, Islamabad. Relevant data for the thermal units is outlined in appendix Tables III and IV (as referenced in Manteaw and Nicodemus, 2012). Specifically, coefficients of fuel cost and limits of generation are given in appendix Table III, while coefficients of emission are documented in appendix Table IV. Information regarding solar power plants is documented in appendix Tables V and VI.
Appendix Table V provides details on the power capacity and per-unit cost of various solar plants, as estimated within the range specified by Burrett et al. (2009). Appendix Table VI, on the other hand, includes data (global solar-radiation, temperature, and the load profile) for Islamabad on 17 July 2012.
The global solar radiation values have been calculated by making use of a geospatial toolkit. The Islamabad Electric Supply Company (IESCO) has supplied power demand statistics for the region, while temperature data is sourced (Weather Underground, n.d.). The date, July 17, was randomly chosen from the limited dataset available for July 2012. Power demand fluctuates between 1074 and 1318 MW during selected hours, as presented in appendix Table VI.
Results
This section presents results of the proposed model. The simulations have been carried out for the time span of 6 hours starting from 10:00 to 15:00 hours has sufficient solar radiation level exists during this period. The upper bounds to the contributions of solar and thermal shares to cope the demand are 25% and 75%, respectively.
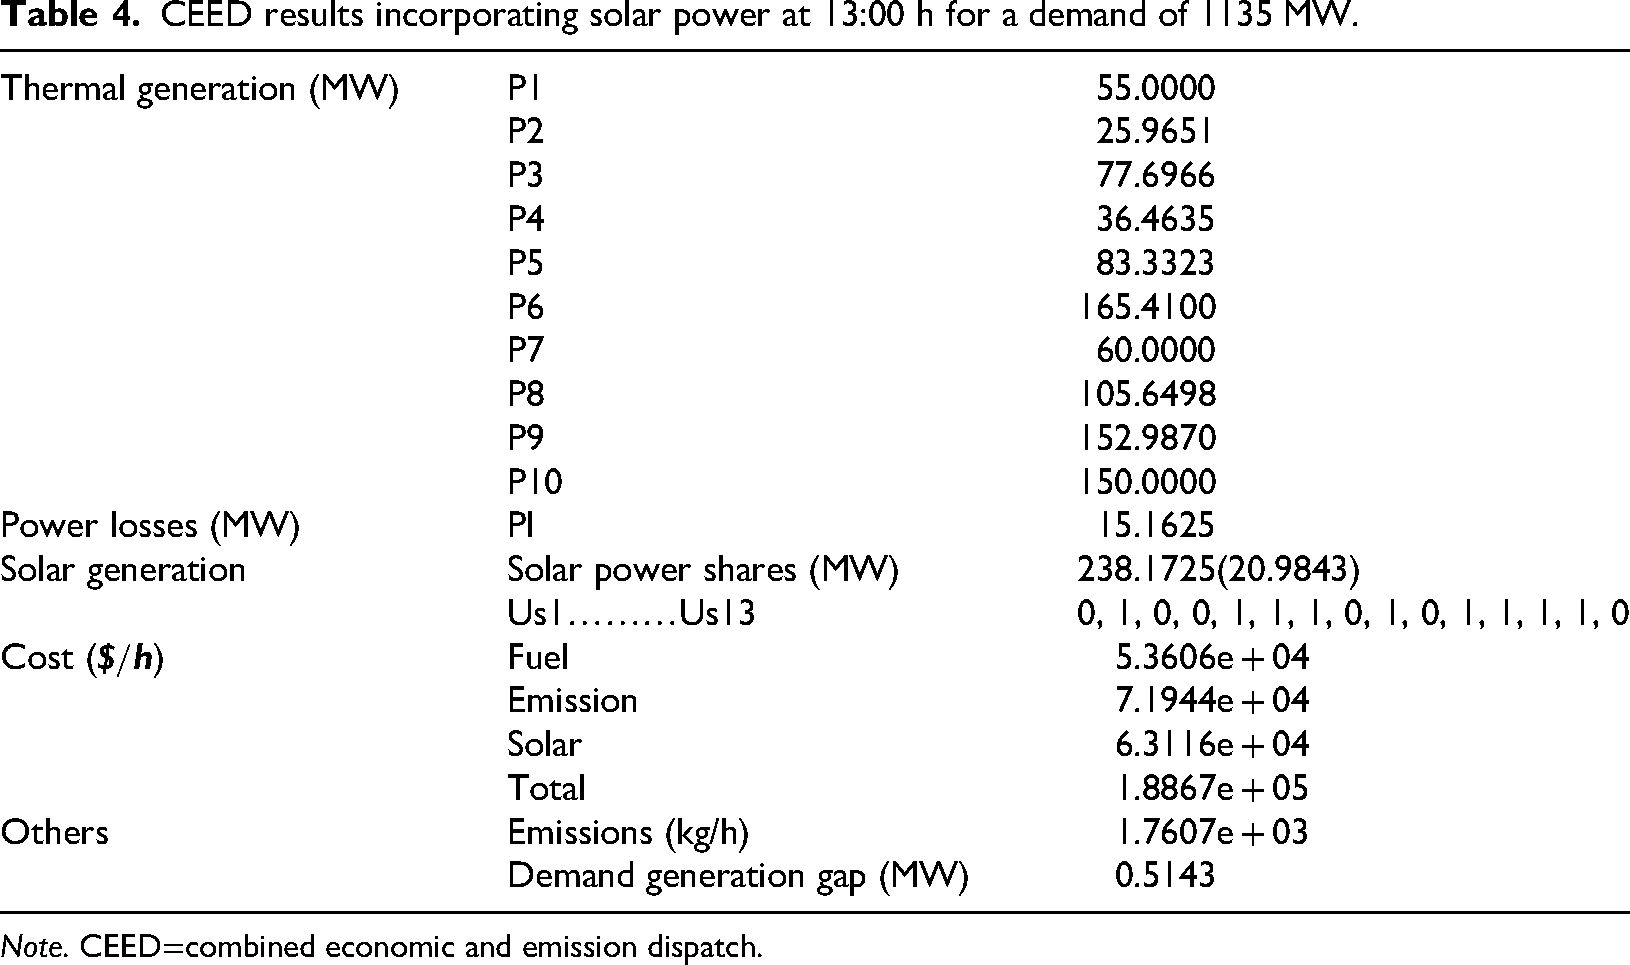
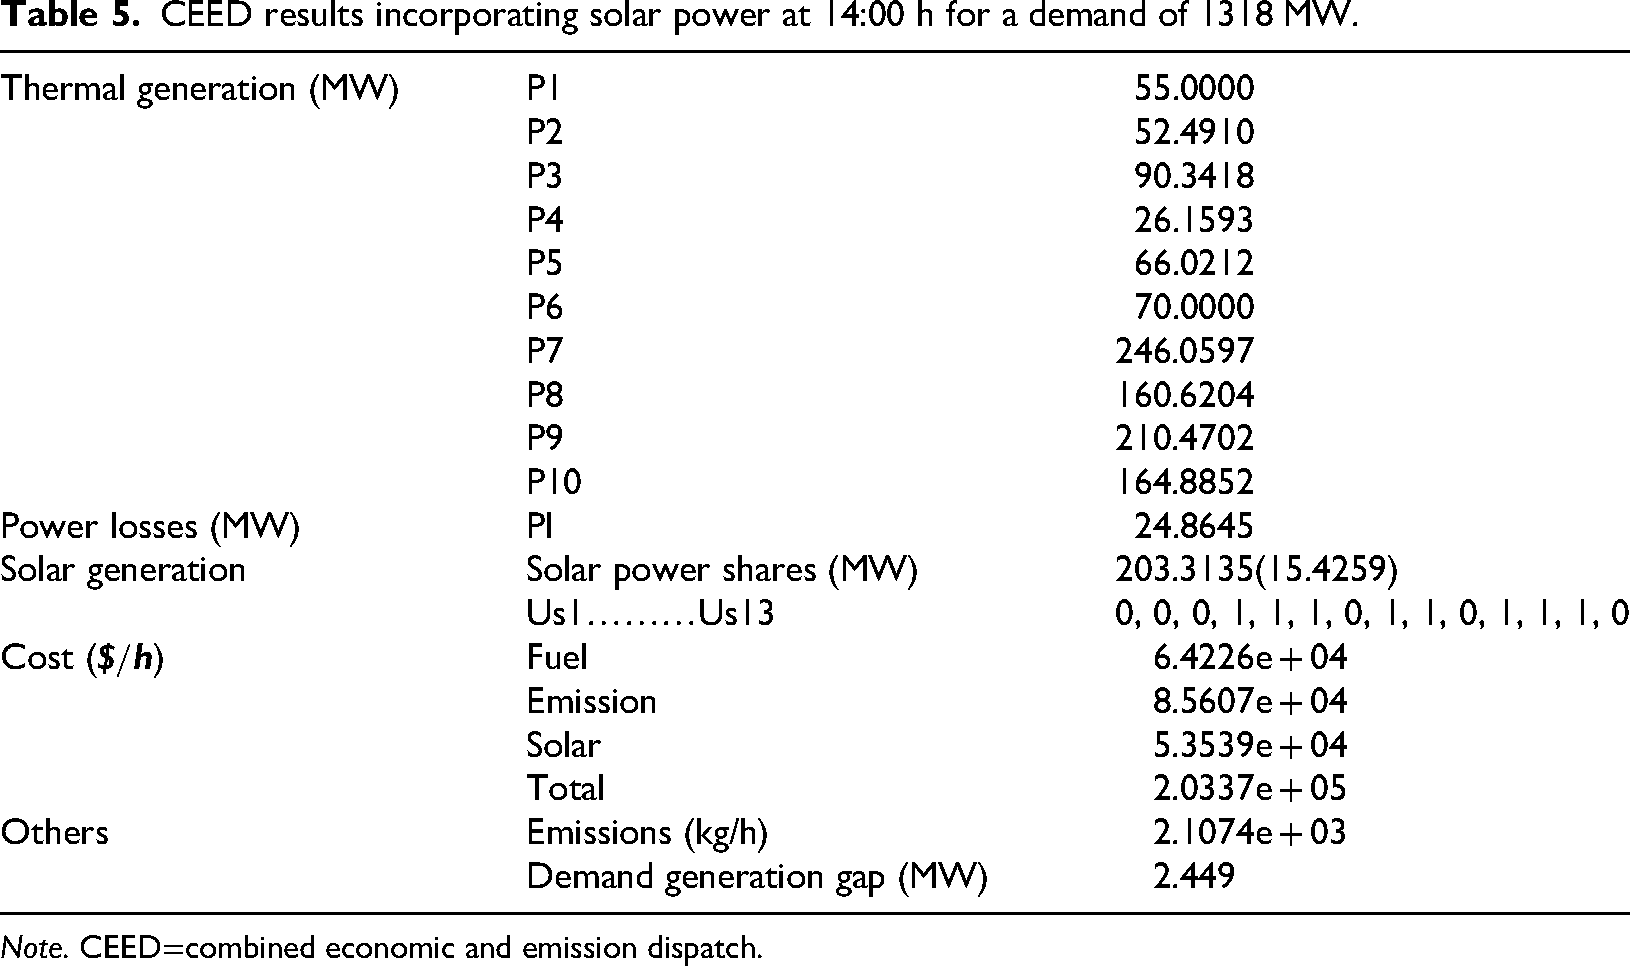
The simulations were performed under two different scenarios: one with full solar radiation and the other with decreased solar radiation, simulating cloudy weather conditions. The results for CEED under full solar radiation conditions are summarized in Tables 1 to 6. These tables show the power production levels of each thermal unit, transmission losses, total solar power share, operational status of individual solar plants, associated costs, emissions, and any deviations in power balance.
CEED results incorporating solar power at 10:00 h for a demand of 1244 MW.
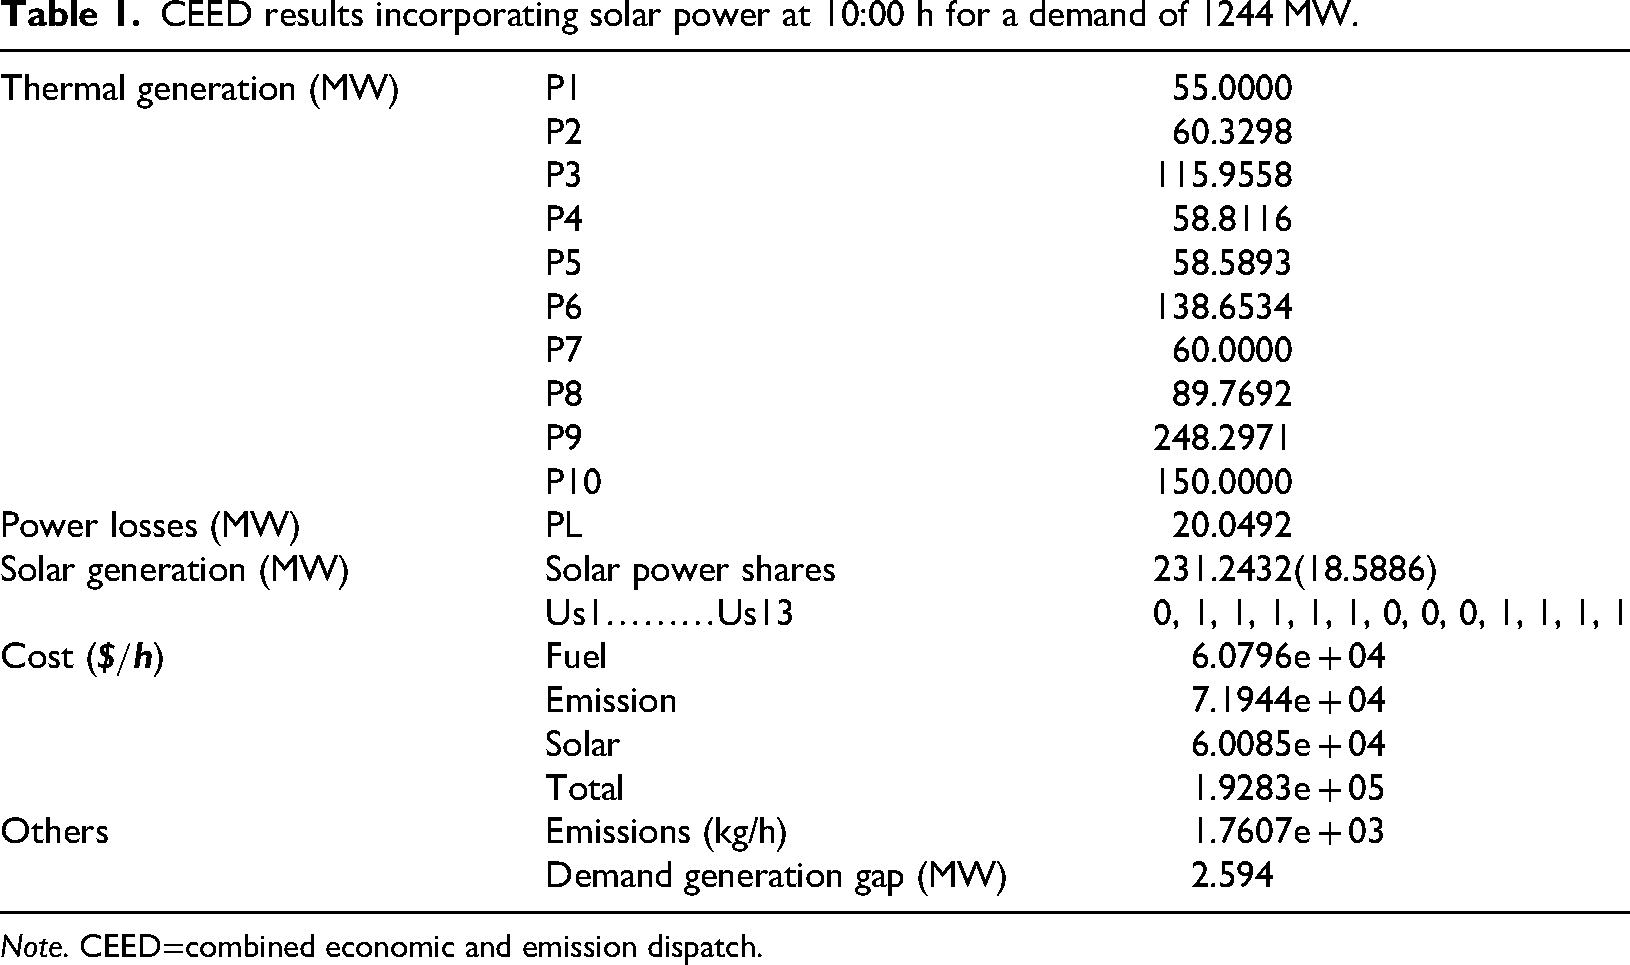
Note. CEED=combined economic and emission dispatch.
CEED results incorporating solar power at 11:00 h for a demand of 1088 MW.
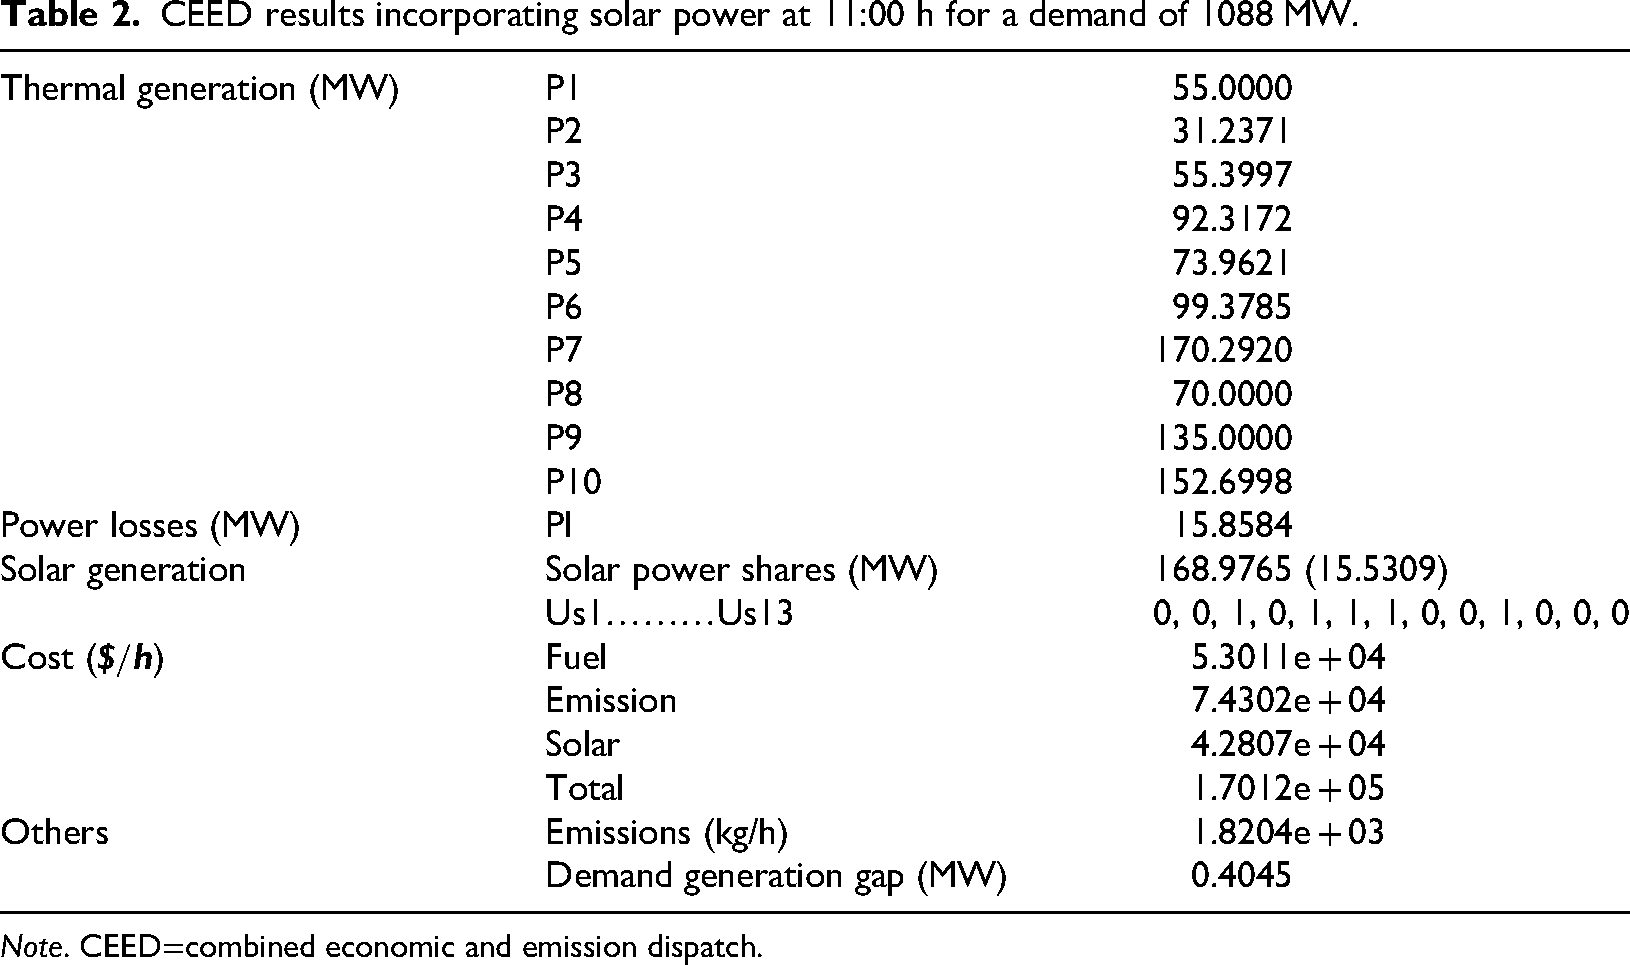
Note. CEED=combined economic and emission dispatch.
CEED results incorporating solar power at 12:00 h for a demand of 1240 MW.
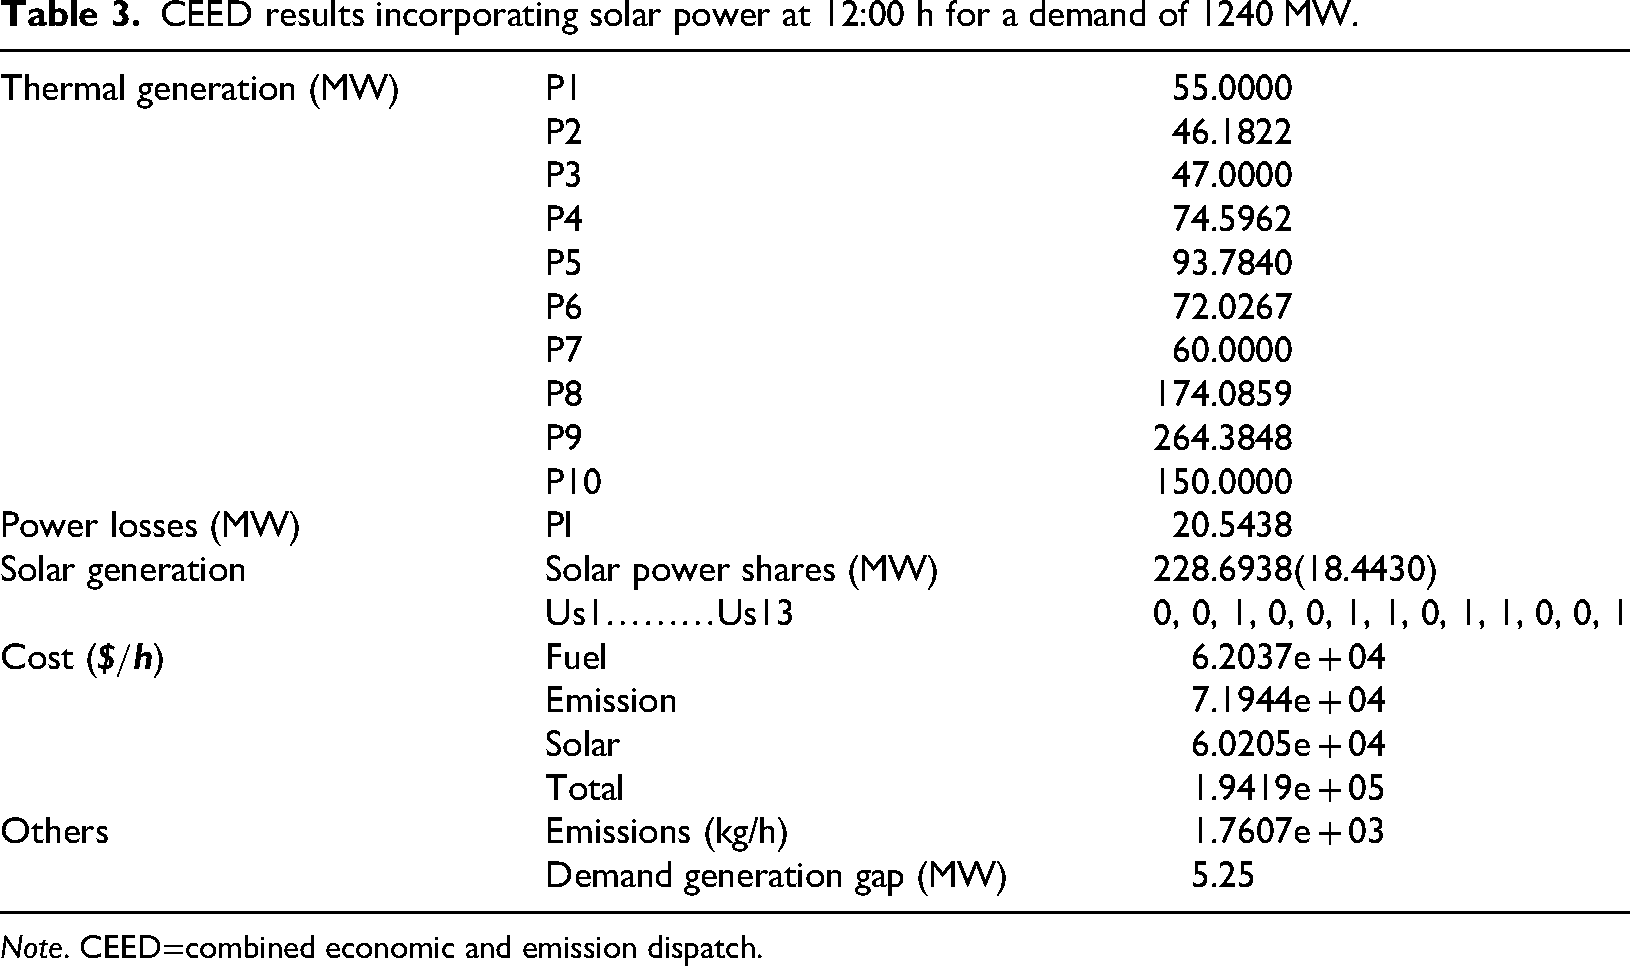
Note. CEED=combined economic and emission dispatch.
CEED results incorporating solar power at 13:00 h for a demand of 1135 MW.
Note. CEED=combined economic and emission dispatch.
CEED results incorporating solar power at 14:00 h for a demand of 1318 MW.
Note. CEED=combined economic and emission dispatch.
CEED results incorporating solar power at 15:00 h for a demand of 1074 MW.
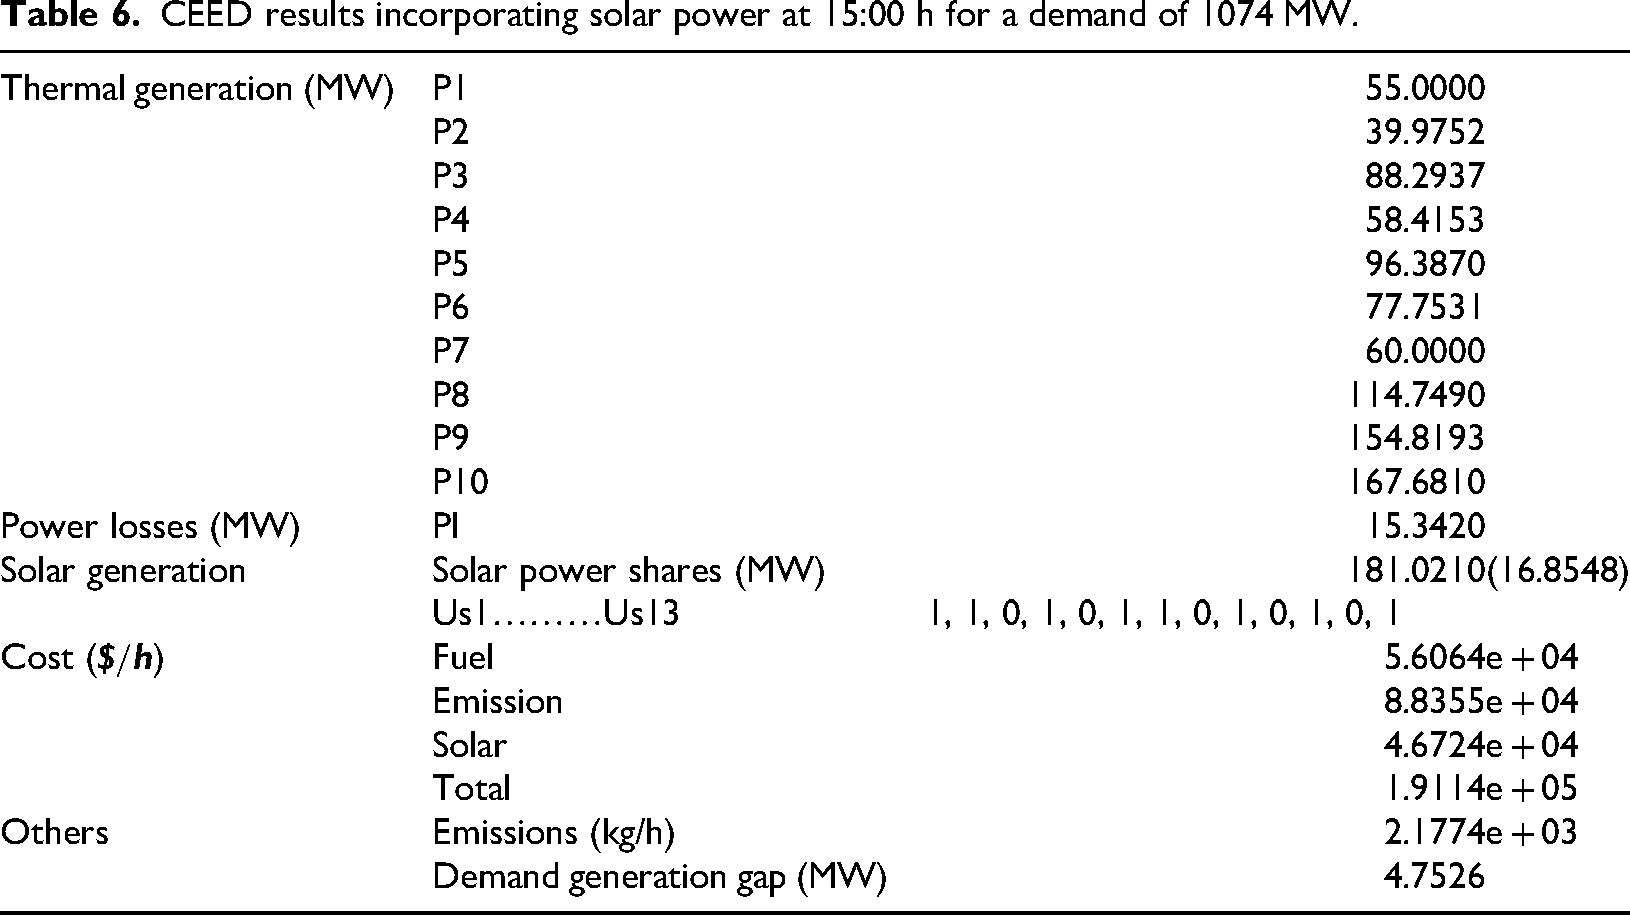
The notations Us1 to Us13 indicate the operational status of the solar plants, where a value of 1 represents an active (ON) state, and 0 indicates an inactive (OFF) state. Power mismatch refers to any deviation from the power balance constraint. A positive mismatch signifies that power generation exceeds demand, while a negative mismatch implies that generation falls short of the required load.
The results presented in the tables indicate that the proposed algorithm performs effectively. For example, appendix Table III shows that the power output of thermal units P1 to P10 remains within the specified defined thresholds. Additionally, Tables 1 to 6 reveal that the solar system stays well within the upper bound. The evaluation of solar share is determined by the outputs of individual solar plants and the number of plants that are switched ON. The output of any individual plant varies depending on the available solar radiation and temperature at any given time. An increase in incident radiation or the number of ON solar plants results in a higher solar share, and vice versa. The algorithm optimizes the solar share by turning the appropriate solar units ON or OFF. For example, in Table 1, the algorithm switches on the solar plants 2, 3, 4, 5, 6, 10, 11, 12, and 13 to achieve a solar share of 231.2432 MW at 10:00 hours. A comparison of the results in Tables 1 and 3 reveals an interesting observation. Ideally, the solar share should increase in Table 3 at 12:00 hours, given the rise in solar radiation. However, the solar share is found to be 228.6938 MW, slightly lower than the value in Table 1. This is because the load demand in Table 3 is 1240 MW, slightly lower than 1244 MW in Table 1. Consequently, any further increase in solar share is constrained by limit (15). Additionally, it is evident that fewer solar plants are ON in Table 3 compared to Table 1. This is because the relatively higher solar radiation at 12:00 hours results in increased power output from individual solar plants. As a result, fewer plants are needed to achieve the solar share of 228.6938 MW. Furthermore, for a given load demand, an increase in solar share corresponds to a reduction in thermal share, and vice versa. As the solar and thermal shares change, the associated entities also vary accordingly. Solar cost is linked to solar share, while fuel cost, emissions, and emission cost are associated with thermal share. For instance, in Table 1, the solar cost came out to be 6.0085e + 04
Comparison of solar share.
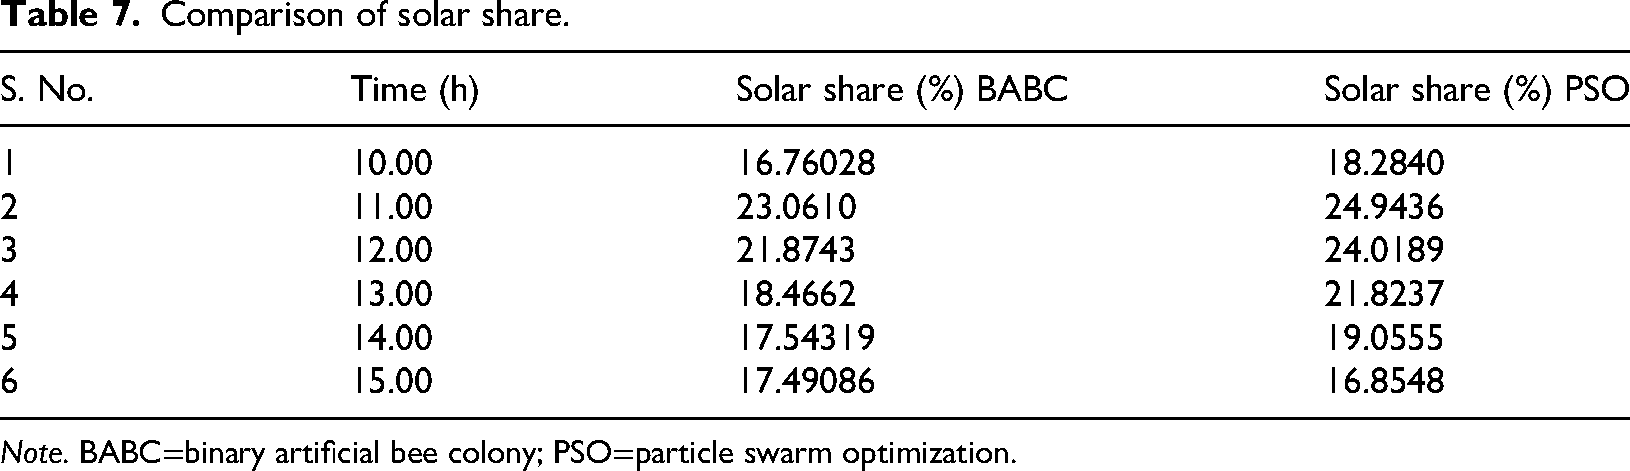
Note. BABC=binary artificial bee colony; PSO=particle swarm optimization.
Figure 2 depicts the contribution of solar power under different solar radiation levels. Cloud cover influences solar radiation depending on factors such as density, altitude, and extent. Compared to beam radiation, global solar radiation experiences a smaller reduction due to cloud cover. Since global solar radiation is the focus, simulations have been performed assuming reductions of 20% and 40% in radiation levels. As illustrated in Figure 2, a decline in solar radiation results in a proportional drop in solar power contribution, which aligns with expectations.
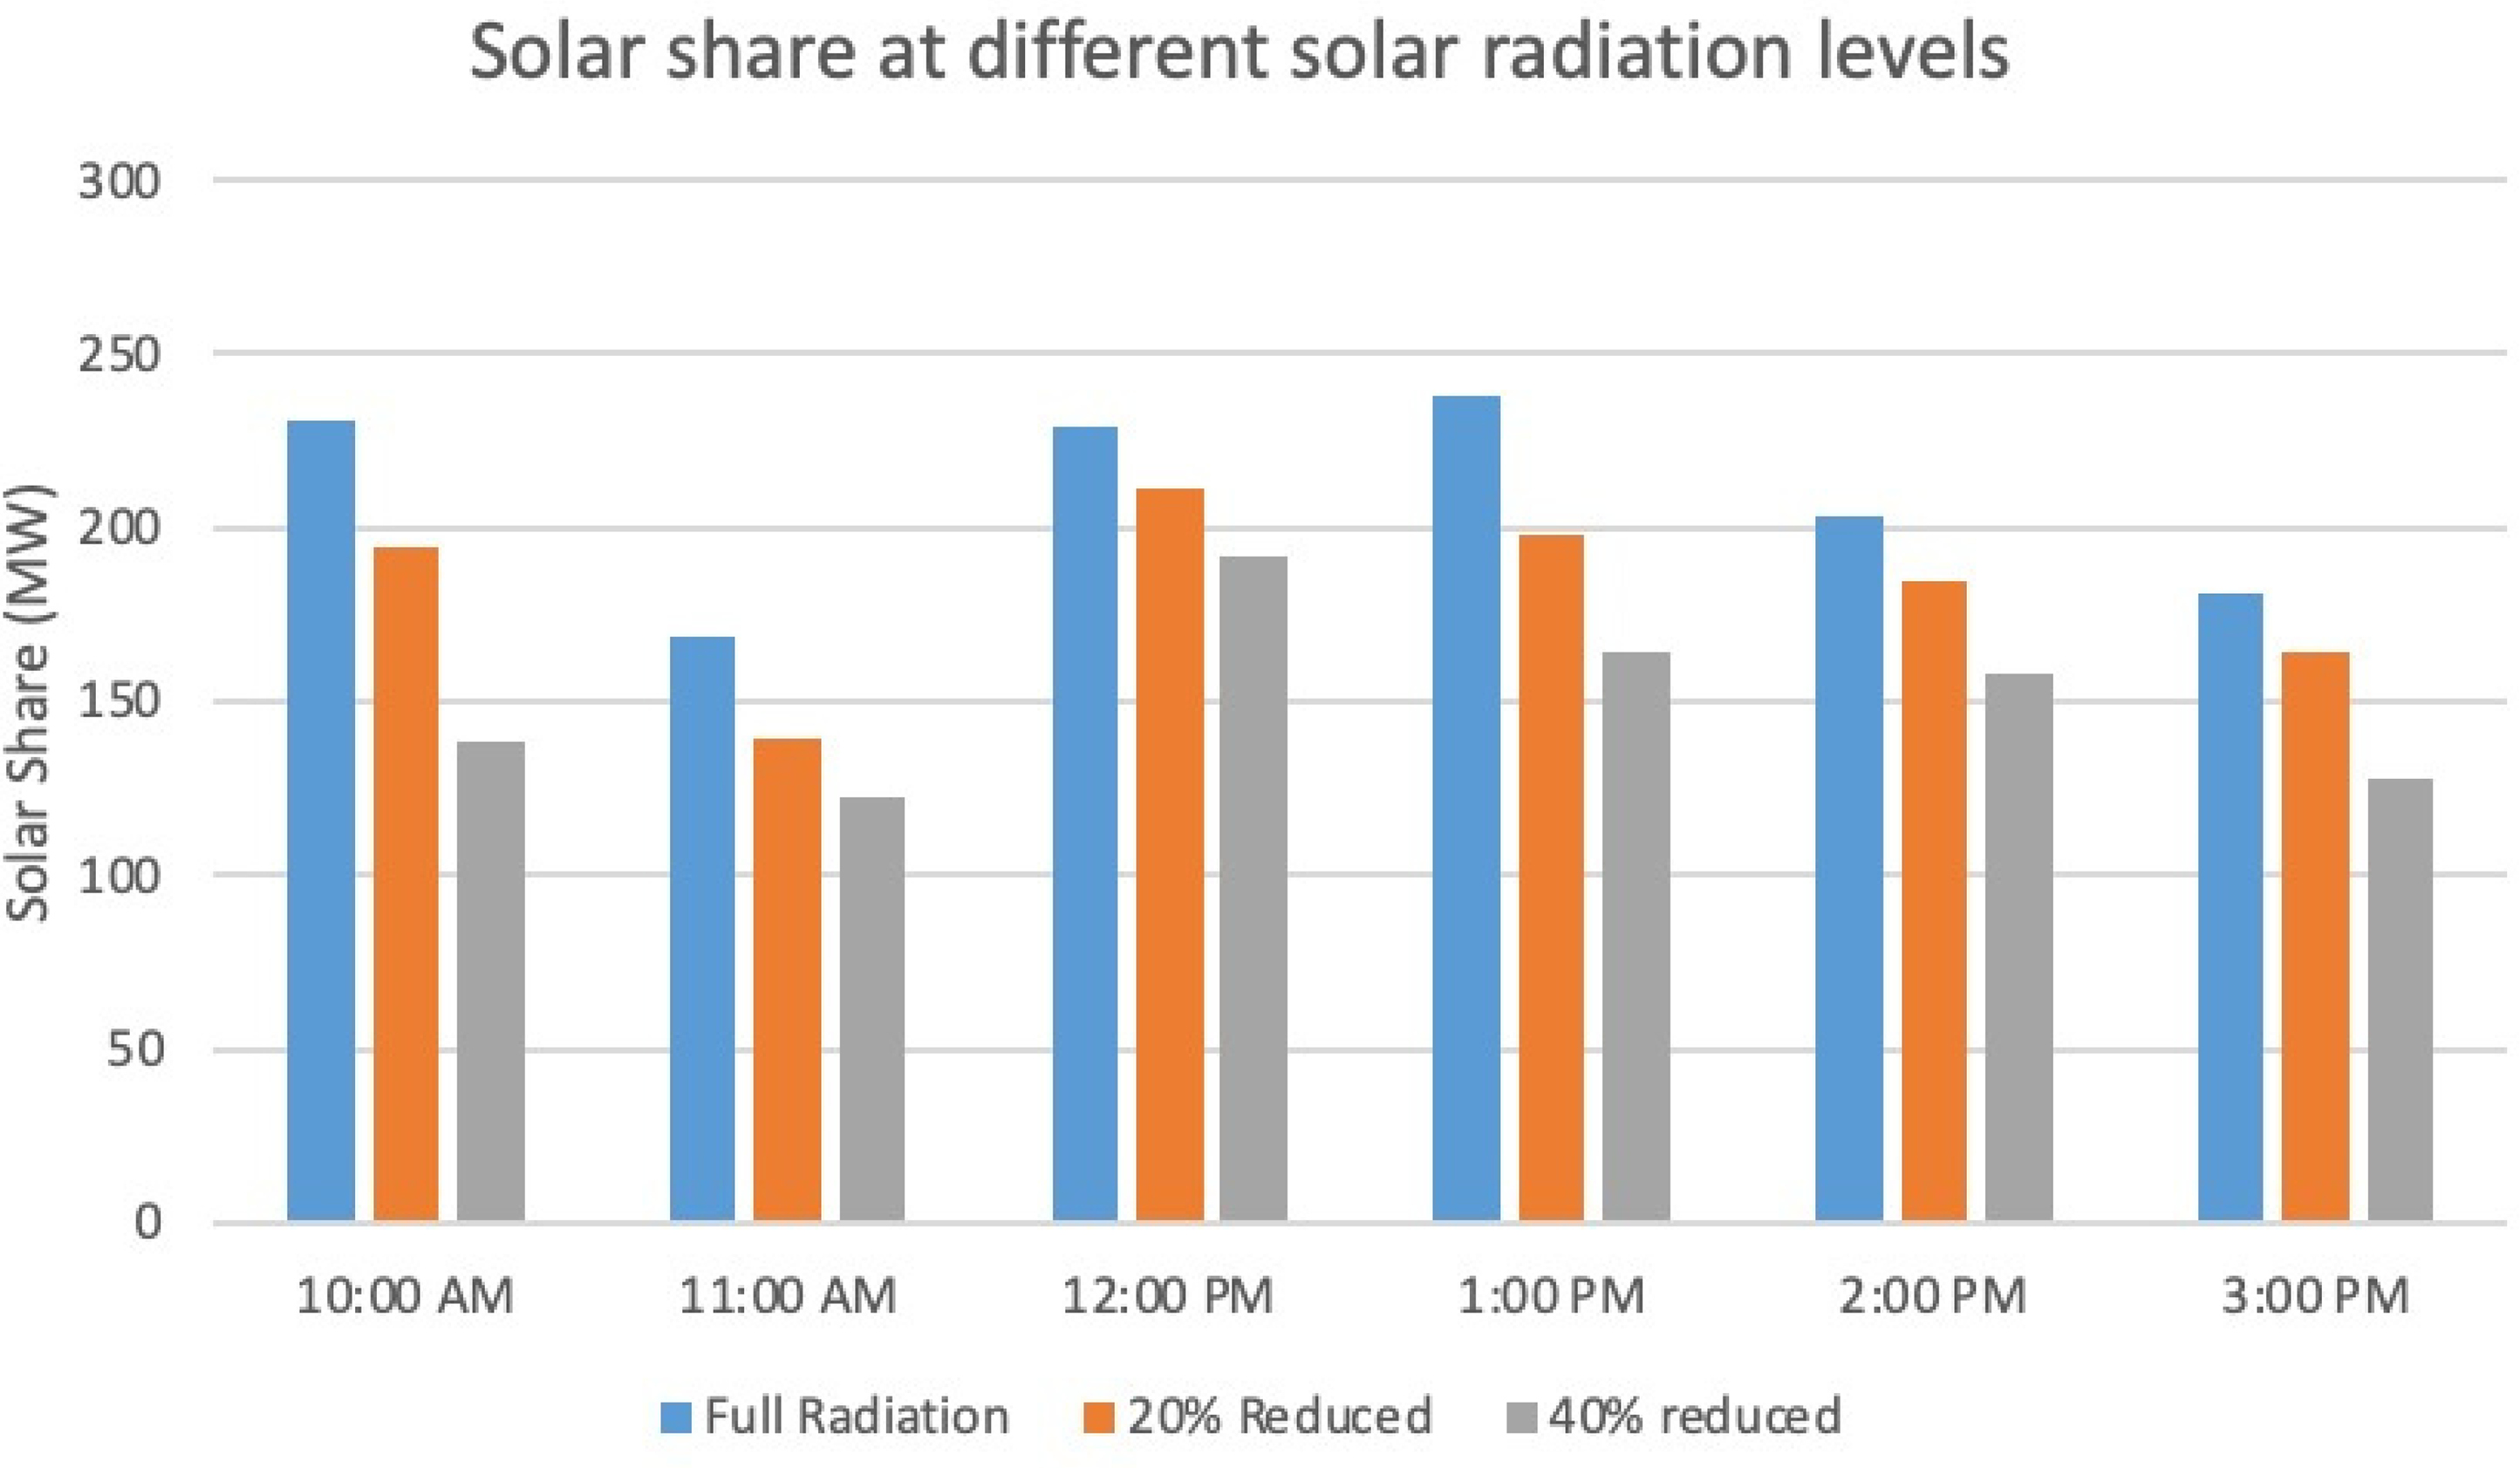
Solar share at different radiation levels.
In addition to the results discussed earlier, this article also presents a comparative evaluation of the BABC and PSO algorithms. Table 7 compares the performance of both algorithms in terms of solar share. From Table 7, it can be seen that PSO performs better than BABC in maximizing solar share. PSO achieves a maximum solar share of 24.9436% at 11:00 hours and a minimum of 16.08548% at 15:00 hours. In comparison, BABC reaches a maximum solar share of 23.0610% at 11:00 hours, which is slightly less than PSO's maximum, and a minimum share of 16.76028% at 10:00 hours. The analysis reveals that both algorithms yield solar share within the defined constraints, with PSO performing marginally better than BABC.
Table 8 presents a comparison of solar cost obtained by both algorithms, with solar cost being higher in PSO due to its higher solar share. Therefore, BABC performs better than PSO in terms of solar cost.
Comparison of solar cost.
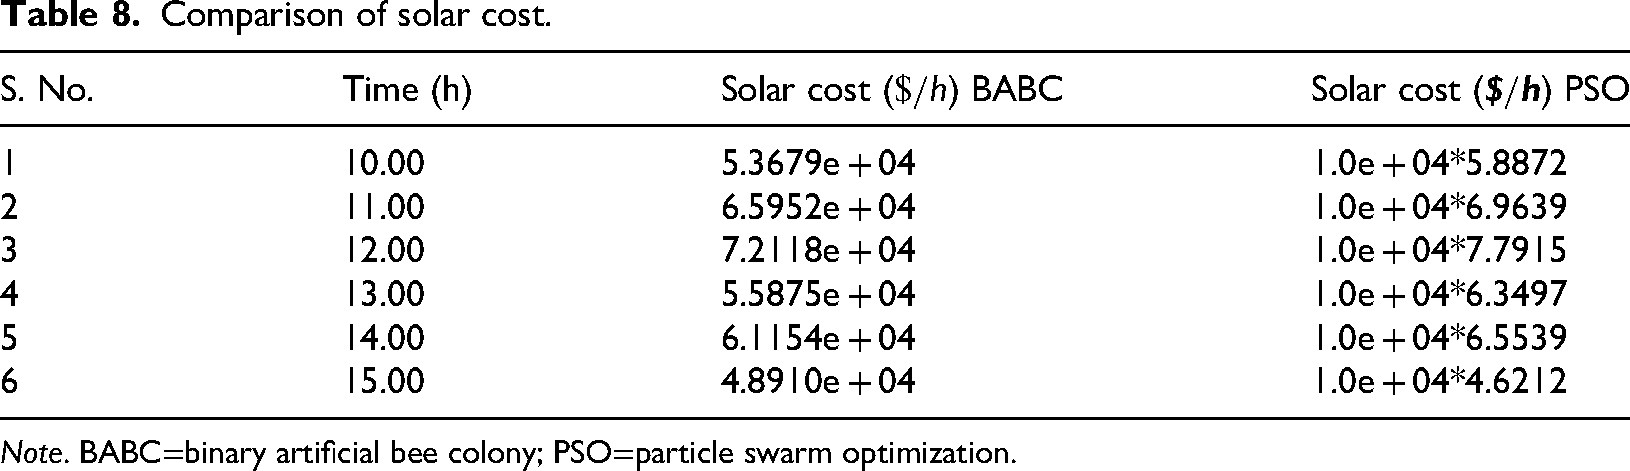
Note. BABC=binary artificial bee colony; PSO=particle swarm optimization.
Table 9 illustrates a comparison of the simulation run times for BABC and PSO. The table shows that BABC converges faster than the PSO algorithm.
Simulation time comparison.
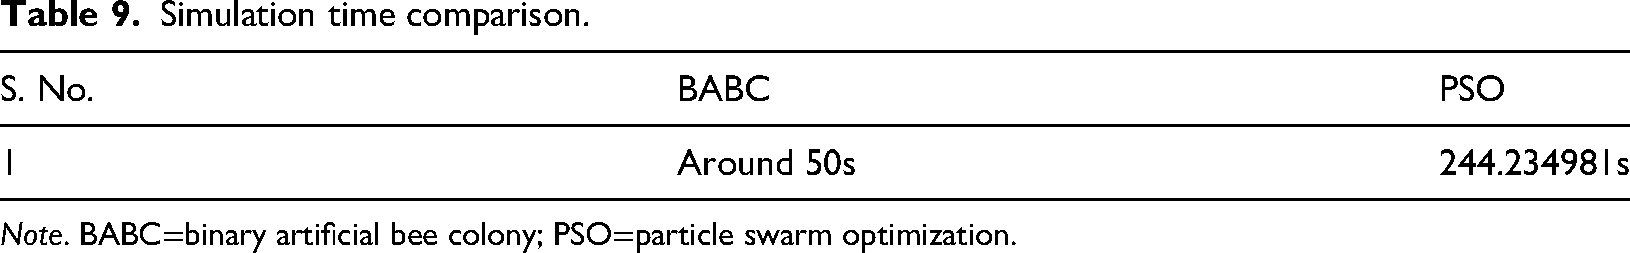
Note. BABC=binary artificial bee colony; PSO=particle swarm optimization.
Table 10 presents a comparative assessment of fuel cost for the two algorithms. The fuel cost in PSO is lower than in BABC, as the higher solar share in PSO leads to a lower thermal share and, thus, a reduced fuel cost compared to BABC.
Fuel cost comparison of BABC and PSO.
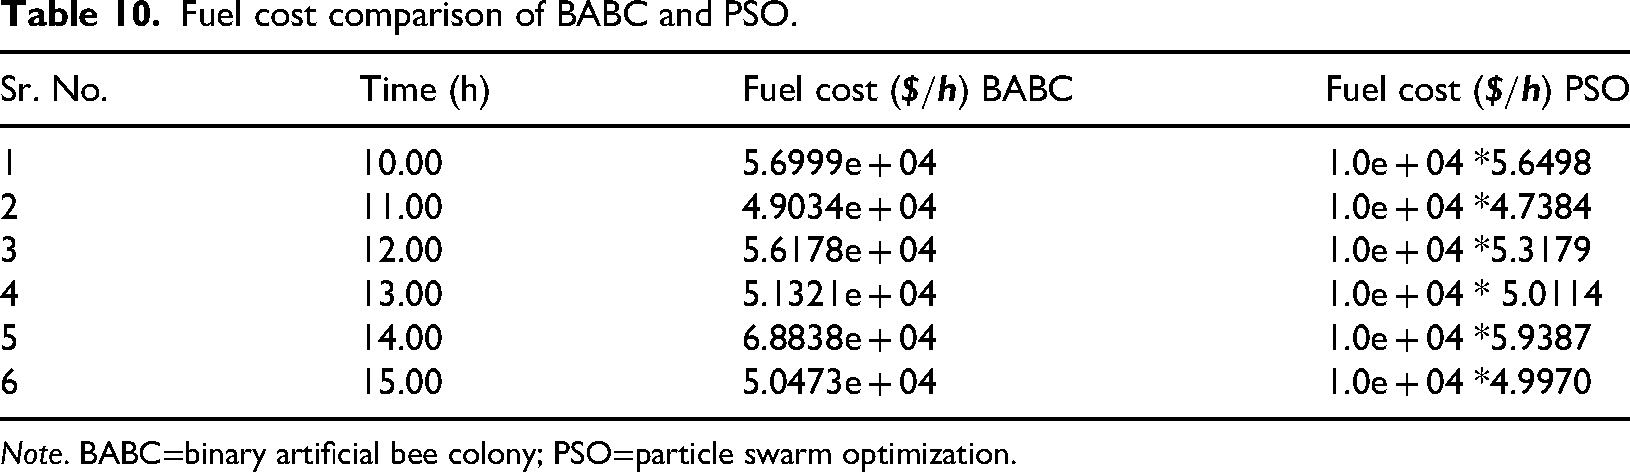
Note. BABC=binary artificial bee colony; PSO=particle swarm optimization.
Table 11 reports a comparison of emissions for the BABC and PSO algorithms. The table clearly shows that PSO yields better results than BABC. This is due to the higher solar share in PSO, which leads to a lower thermal share and, as a result, reduces emissions.
Comparison of emissions.
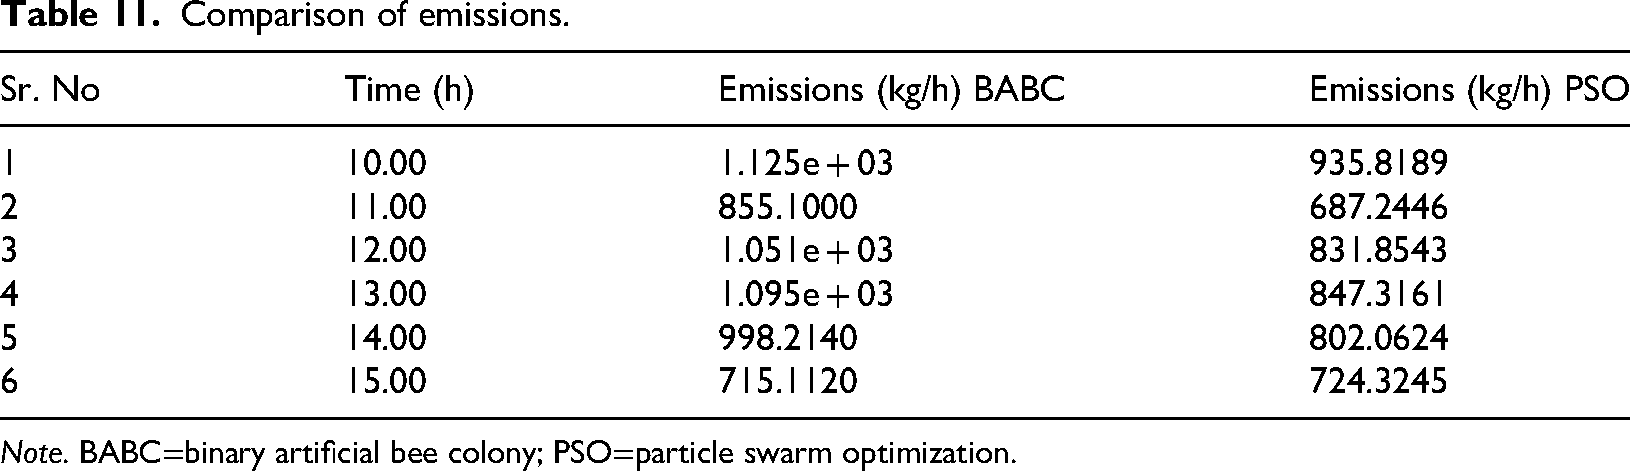
Note. BABC=binary artificial bee colony; PSO=particle swarm optimization.
Table 12 presents the total cost, which is the sum of fuel cost, solar cost, and emission cost. PSO provides better results in terms of total cost. While solar cost is higher in PSO compared to BABC, as shown in Table 11, the overall total cost in BABC still remains higher due to its higher emission cost.
Total cost comparison of BABC and PSO.
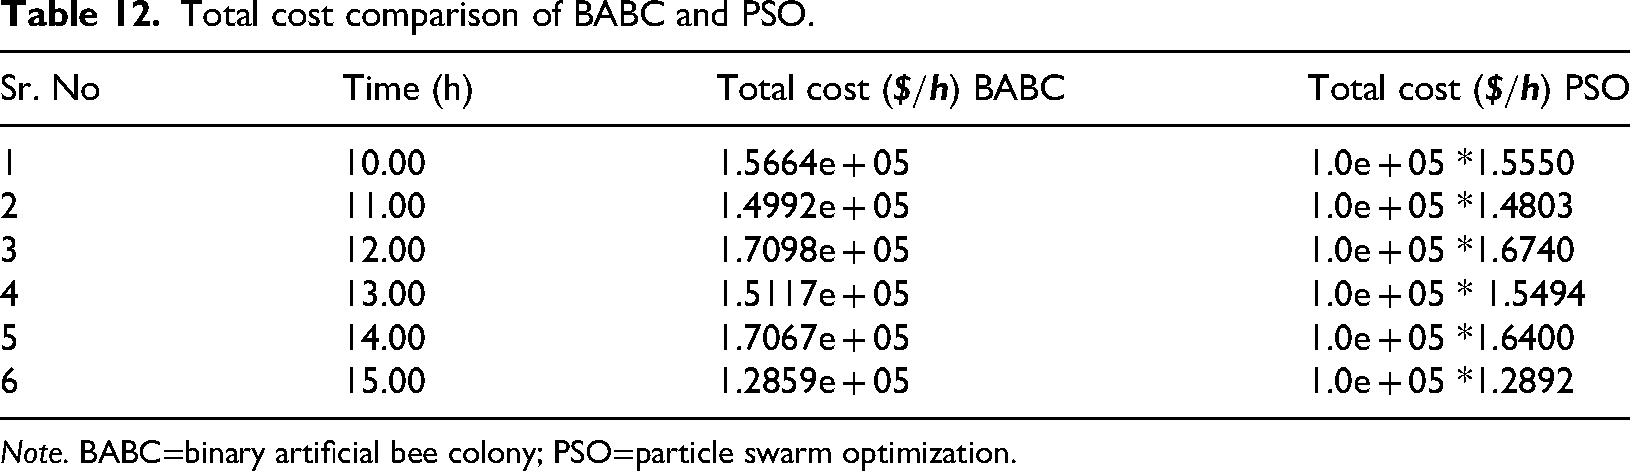
Note. BABC=binary artificial bee colony; PSO=particle swarm optimization.
Conclusions
In this research, we have presented a new method for solving the CEED problem using BABC optimization technique for a system having 10 thermal and 13 solar plants. Power balance, thermal generator limit constraint, along with the full and reduced radiation levels of solar plants, have been taken into account in the developed algorithm. Only fuel and emission costs of thermal and per unit costs of solar plants are considered. Results show that the proposed algorithm gives satisfactory outputs. With BABC simulation, the solar share of 231.2432 MW, the solar, fuel, and emission costs of 6.0085e + 04$/h, 6.0796e + 04$/h, and 7.1944e + 04$/h, were achieved, respectively, with emissions of 1.7607e + 03 kg/h. With a solar share of 228.6938 MW, the resulting fuel and emission costs are 6.2037e + 04 $/h and 7.1944e + 04$/h, respectively, with 1.7607e + 03 kg/h emissions. The study also compared the cost of BABC with the PSO algorithm. Findings demonstrated that BABC has high emission cost compared to PSO due to a lower share of solar plants. However, the BABC algorithm outperforms the PSO regarding computational time.
The key limitations and future aspects of this study are as follows: This study doesn’t include network power losses. It was assumed that the network power losses in bulk PVs and thermal plants are equal because both can be installed near load centers. Future work includes further investigation of the ED problem with the incorporation of network power losses and including other constraints.
The proposed model does not consider energy storage systems, which could be helpful in managing solar power intermittency more effectively. However, this would impose modeling complexities related to battery capacity, life, state of charge limits, and efficiency losses. These aspects are recognized as potential extensions of the current work and will be considered in future studies.
The study uses static pricing without consideration of dynamic pricing and demand response strategies that possibly improve cost-emission optimization. Integrating dynamic pricing would enable more flexible and economically efficient operation. This could be an excellent direction for follow-up research and model enhancement.
Only PV and thermal generators are considered in this study; other renewable sources such as wind and hydro are excluded. Variability and forecasting uncertainty associated with sources like wind were not addressed to maintain model simplicity. The work prioritizes evaluating the BABC algorithm performance within a constrained setup, intentionally omitting additional complexities for clarity.
Footnotes
Author contributions
SR, AJ, NAK, and AM were involved in conceptualization; SR, AJ, NAK, UA, UJ, and AM in methodology; AJ, NAK,UA, and UJ in software; SR, UJ, and AM in validation; UJ and AM in investigation and writing—review and editing; AJ and NAK in data curation; SR and UA in writing—original draft preparation; SR and AM in supervision and project administration; and UJ in funding acquisition. All authors have read and agreed to the published version of the manuscript.
Funding
The authors received no financial support for the research, authorship, and/or publication of this article.
Declaration of conflicting interests
The authors declared no potential conflicts of interest with respect to the research, authorship, and/or publication of this article.