
Abstract
Most instability damage in rock engineering results from the accumulation of microcracks. Fracture tests were conducted in I/II mixed mode using semi-circular bending (SCB) Specimens comprising coal, sandy mudstone, and sandstone with five different pre-fracture angles (β). The evolution of fracture processes and micro-deformation field in rocks were analyzed using digital image calculation method (DICM) and acoustic emission (AE) monitoring. The findings indicate that as β increases, KI gradually decreases, while KII initially increases and then decreases with β growth. Integrating load force-time curves with AE signals reveals three stages in the fracture processes of coal, sandy mudstone, and sandstone: crack initiation, stable crack expansion, and destabilization damage. Furthermore, a comprehensive comparison confirms that experimental results of fracture toughness (Keff) for the three rock specimens in I/II hybrid crack mode are consistent with the principles of the modified maximum circumferential stress (MMTS) theory.
Introduction
The geological formations of natural rock masses exhibit inherent complexities, such as the presence of numerous fractures and joints, which give rise to stress concentration phenomena near the tips of these fractures. As a consequence, the load-bearing capacity of the rock is substantially reduced (Gao et al., 2022). Within the field of fracture mechanics, the stress intensity factor (SIF) assumes a crucial role in characterizing the critical nature of stress force or energy in the vicinity of the fracture tip, thereby providing valuable insights into the behavior of fracture growth and expansion (Rossmanith, 2014). By quantifying the magnitude of stress intensity, the SIF facilitates the assessment of fracture propagation mechanisms and aids in understanding the fundamental attributes governing fracture processes. Determining SIF plays an essential role in rock engineering and is usually found in the studies on rock cutting procedure, rock burst, rock fracturing, tunneling and roadway excavation, hydraulic fracturing (Xie et al., 2017). Many rock engineering disasters in mining and petroleum engineering are caused by macroscopic damage gradually accumulated by minutiae failures. Therefore, it is imperative to know the trend of rock fracture expansion and minutiae damage mechanism (Ma et al., 2023b; Zuo et al., 2019).
Irwin classified simple cracks into three types: Mode I crack (open crack), Mode II cracks (slip crack) and Mode III cracks (Tear crack) (Figure 1). Rock fracture is usually under complex conditions of strain or stress (Jing and Hudson, 2002). Pure type I deformation transpires when in-plane loading induces the opening of the fractured surface without any accompanying sliding, whereas pure type II deformation manifests itself as relative sliding along the fracture line between the surfaces(Ayatollahi and Aliha, 2007a). Pure type I fracture is a commonly observed damage mode in rock failure. In recent years, there has been a surge in comprehensive experimental and theoretical investigations aimed at elucidating the toughness characteristics associated with pure type I fractures. Researchers have dedicated significant efforts to study and analyze the mechanical behavior and fracture properties exhibited by this fracture type. The primary objective of these investigations is to gain a deeper understanding of fracture mechanics and provide valuable insights into the behavior of materials when subjected to pure type I fractures under various loading conditions. (Dai et al., 2015). However, in the rock mechanics and rock engineering, many rock engineering research objects are subject to complex stresses (including external stresses and initial ground stresses); and the instability failure is usually caused by hybrid crack modes (a mixture of pure type I and pure type II fracture), rather than pure tensile damage (pure type I fracture) or shear failure (pure type II damage) (Gao et al., 2022; Zuo et al., 2019).
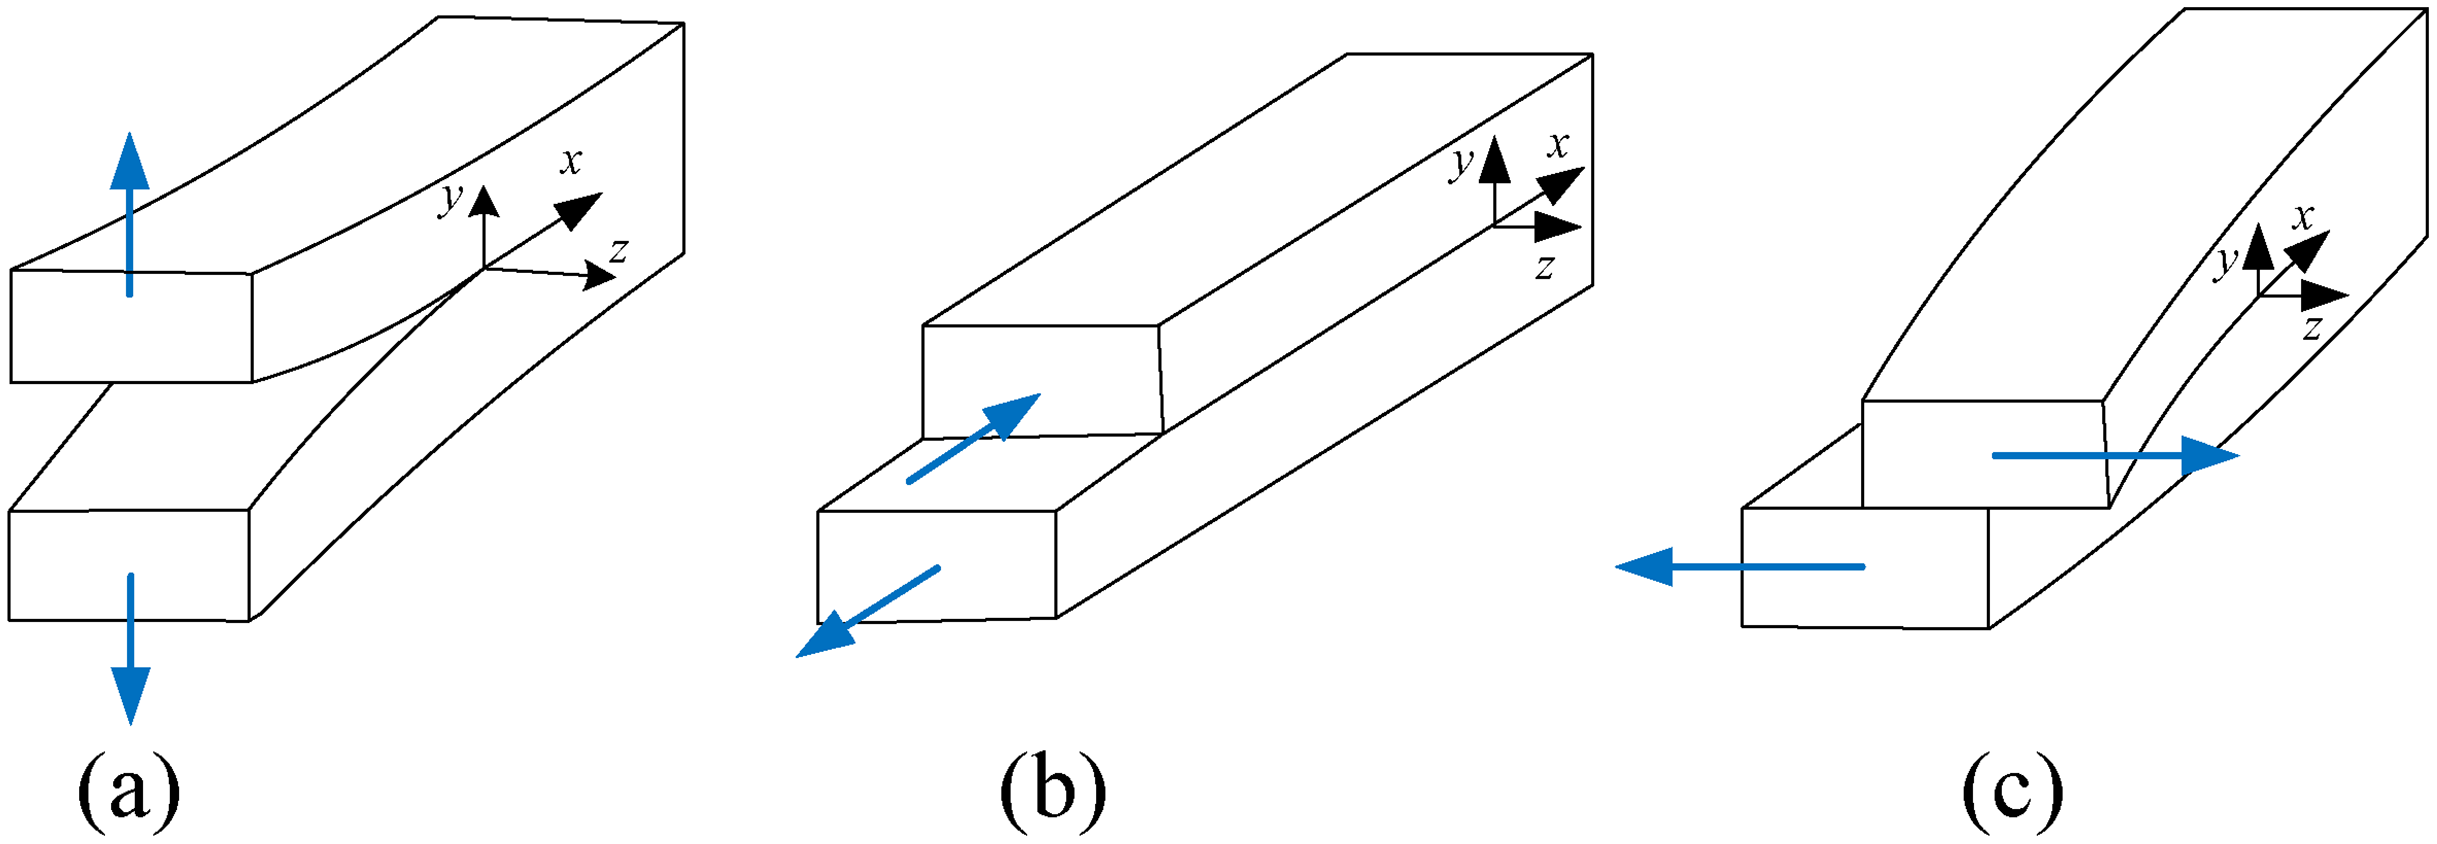
Three basic +types of cracks (The relative motion directions associated with each type of crack are indicated by the arrows in the figure.). (a) Type I (Open crack). (b) Type II (Slip crack). (c) Type III (Tear crack).
Currently, the test methods for fracture toughness for I/II hybrid crack type mainly include the center-cut Brazilian disc test method, the oblique-cut Brazilian disc test method, the asymmetrically loaded semi-disc three-point bending test method, and the compact tensile-shear sample test method (Maccagno and Knott, 1989; Sheity et al., 1985). Chong and Kuruppu (1984) proposed a semi-circular bend (SCB) test method, which is being used widely for fracture toughness testing for rock. This method is featured with the following merits: low material consumption, simple preparation of Specimens, convenient loading, and stable test performance. This testing method is applicable for evaluating the fracture toughness values of pure type I, pure type II, and hybrid cracks, while also proving valuable for conducting dynamic fracture toughness tests on rocks.
In recent years, there has been a significant increase in research focusing on the assessment of hybrid crack toughness of rock materials under I/II loading conditions using the semi-circular bending (SCB) method, as evidenced by numerous studies conducted by researchers in the field. For example, Chen et al. (2023); Chu et al., (2024) investigated the fracture behavior of high-temperature granite under liquid nitrogen cooling using the SCB test method. Shang et al. (2023) determined the mode-I static fracture toughness of filled-cemented rocks based on the semi-circular three-point bending method, considering only quasi-static tensile stress conditions. Kuruppu and Chong (2012) conducted fracture toughness tests on brittle rocks utilizing the SCB method. Similarly, Wang et al. (2017) employed the SCB approach to assess the fracture toughness of shale in pure type I conditions. Zuo et al. (2014, 2017, 2019) investigated the fracture behavior, failure mechanisms, and strength theories at the microscopic scale for various rock types, such as sandstone, basalt, and granite, through the implementation of the SCB test method. Meng et al., (2022) focused on the Hybrid crack behavior and acoustic emission response characteristics of laminated rock-like materials using the SCB method. Kataoka et al. (2017) explored the fracture toughness in type I conditions for rocks through SCB tests conducted under compressive loading conditions. Additionally, Ji et al., (2016) employed digital imagery analysis of data obtained from three-point bending tests on semicircular discs to extract critical characteristics, process zone lengths, and critical opening displacements for damage types in marble and yellow sandstone.
However, most of these studies reported experiments on stronger rocks such as granite, basalt, yellow sandstone, and shale. Many of them focused on fracture initiation and calculation of fracture toughness. Little attention has been focused on fracture mechanics parameters and crack extension in coal-measure sedimentary rock formations, especially on I/II hybrid crack patterns at various pre-fracture inclinations.
Generally, coal-measure rock formations have great joints and primary fractures. In coal mine roof control, roadway maintenance, coal pillar design, rock burst prevention and hard roof control with hydraulic fracturing in coal mines (Xia et al., 2018), and coal seam fracturing to increase penetration in CBM mining (Liu et al., 2019), it is imperative to know the characteristic parameters of fracture mechanics and the characteristics of fracture initiation and extension in coal sedimentary rock strata for the design of a hydraulic fracturing technology scheme. Consequently, this study aimed to examine the fracture characteristics of coal, sandy-mudstone, and sandstone specimens with varying pre-fracture inclination angles. The experimental investigation involved the application of a three-point bending setup under static loading conditions to conduct fracture tests on semi-circular bending (SCB) Specimens, encompassing both pure type I and I/II mixed type fractures. The resulting test data were subsequently utilized to calculate fracture mechanics parameters for the three rock Specimens. In addition, a digital spot camera system was employed to measure displacement and strain fields, enabling the analysis of fracture extension characteristics in different rock types subjected to I/II hybrid crack conditions. The acquired experimental data significantly contribute to our understanding of the fracture toughness of coal-measured sedimentary rock materials. Moreover, these findings establish crucial fracture mechanics parameters that can shed light on the underlying mechanisms governing the initiation and propagation of hydraulic fractures within coal measure sedimentary rock formations.
Test methodologies and sample preparation
Test methodologies
In this study, the fracture toughness of rocks was comprehensively examined using the well-established Semi-Circular Bending (SCB) methodology, which is widely recommended by ISRM (Kuruppu et al., 2014). The SCB configuration, as depicted in Figure 2, incorporates various key parameters for analysis. Specifically, 2R represents the diameter of the SCB sample, providing a critical dimension for characterizing the specimen. The parameter α corresponds to the pre-fracture length, representing the extent of the initial crack in the sample. Additionally, the inclination angle of the pre-crack is denoted by β, which plays a crucial role in determining the fracture behavior. The span of the bottom symmetry support roller is represented by 2S, serving as a significant factor in the mechanical response of the specimen. Lastly, the load applied at the top of the sample is denoted by P, which influences the fracture initiation and propagation processes.
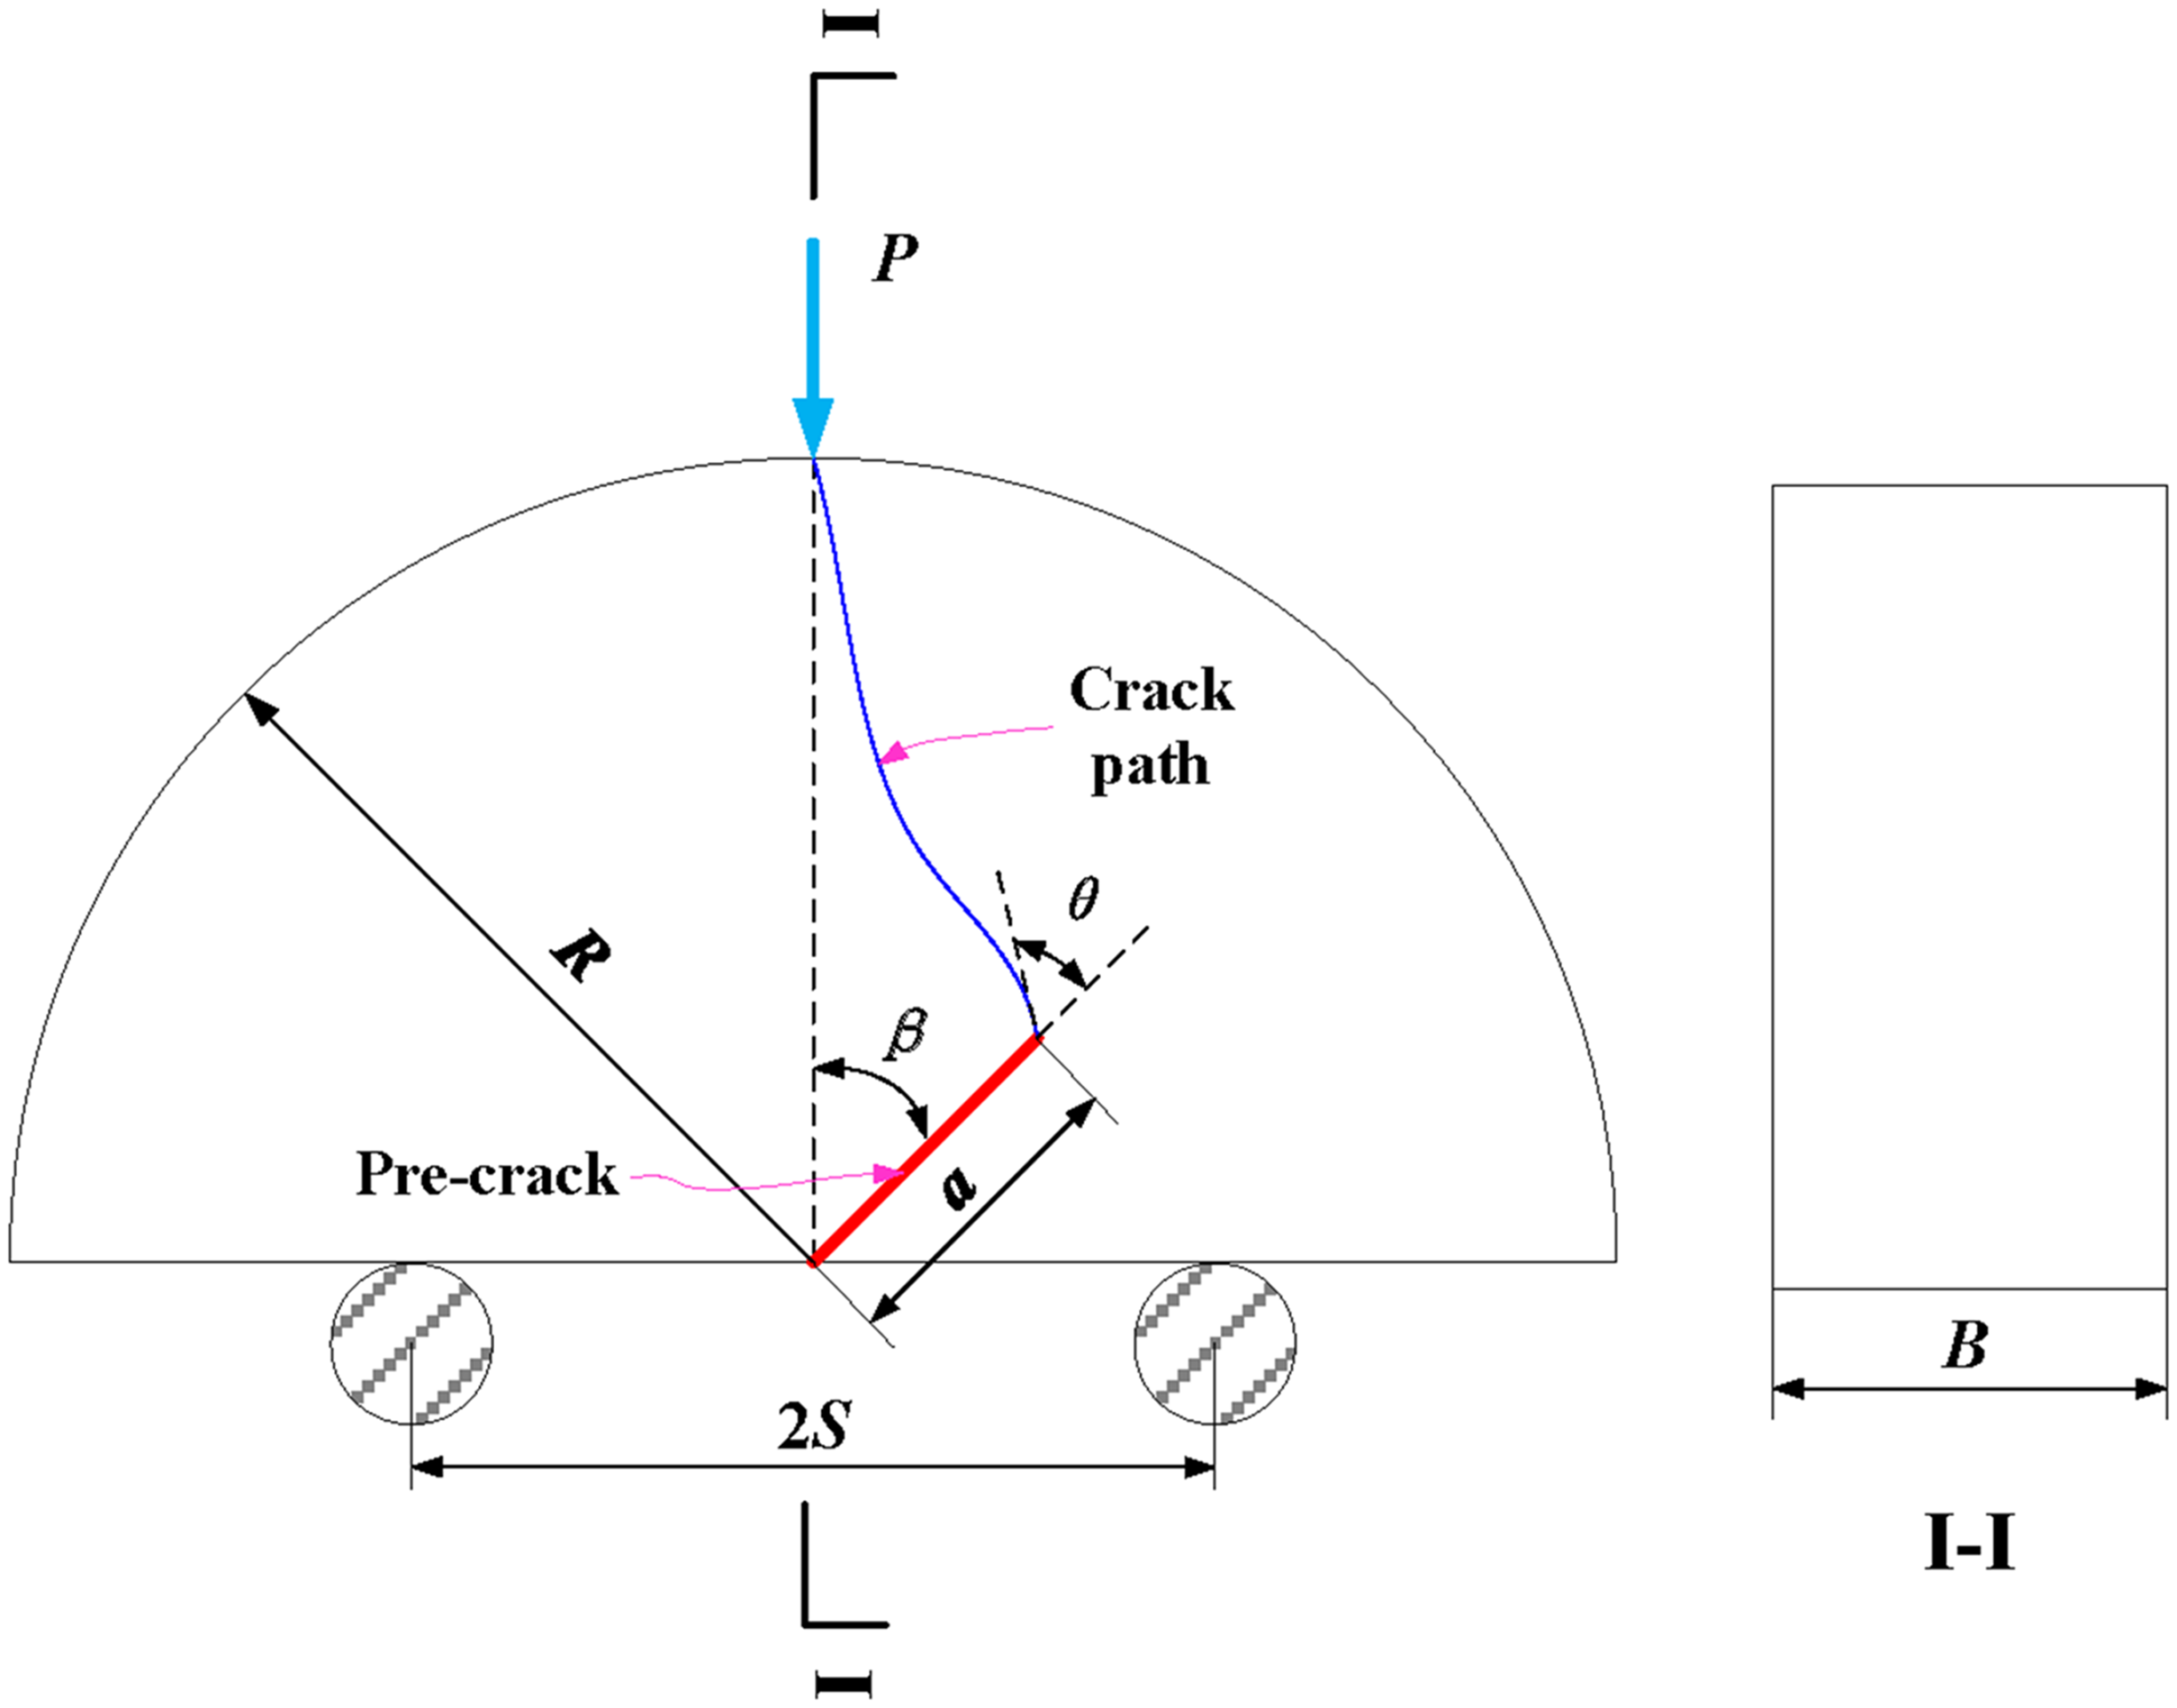
Geometry of the SCB test.
To quantitatively assess the fracture behavior, the stress intensity factor (SIF) is a fundamental parameter of interest, capable of characterizing both type I and type II fractures. The calculation formulas for determining the SIF are presented as follows (Ayatollahi and Aliha, 2004; Ma et al., 2023a):


Where, within the framework of the semi-circular bending (SCB) test, the designation “B” is employed to represent the thickness of the SCB specimen. The geometric parameters YI and YII are employed to quantify fractures of type I and type II, respectively. The parameters in question are determined by the geometric equations that incorporate α/R, S/R, and the pre-fracture angle β. Once the applied load, denoted as P, surpasses the critical value, Pcr, the stress intensity factor can be ascertained by employing Equations (1) and (2) to compute the fracture toughness values, namely KIC and KIIC.
SCB sample preparing and test procedure
In order to prevent initial mechanical damage to the natural rocks caused by conventional coring equipment, this study employed a diamond wire cutter integrated with a CNC machine tool to prepare three lithological Specimens: coal, sandy mudstone, and sandstone. The geometric shapes of these Specimens are depicted in Figure 2. The SCB Specimens were fabricated using 0.5 mm thick diamond cutting sheets, with a pre-fracture length-to-sample radius ratio (a/R) of 0.35 and pre-fracture angles (β) set at 0°, 15°, 30°, 45°, and 54°. The sample dimensions were R = 38 mm and B = 30 mm. The different pre-fracture angles corresponded to distinct ratios of mixed tensile-shear states. Specifically, a pre-fracture angle of β = 0° (YI ≠ 0, YII = 0) represented the pure type I fracture configuration, and the obtained test results provided parameters specific to pure type I fractures. Conversely, a crack angle of β = 54° (YI = 0, YII ≠ 0) corresponded to the pure type II fracture configuration, yielding parameters specific to pure type II fractures. For pre-fracture angles of 15°, 30°, and 45° (YI ≠ 0, YII ≠ 0), the test allowed for the investigation of I/II mixed type fracture characteristics. (Ayatollahi and Aliha, 2007b).
The experimental investigations were conducted using the MTS C64.106 electro-hydraulic servo universal machine for testing. The experimental setup is depicted in Figure 3. The testing machine has a maximum test force of 1000 kN, and the test force and displacement transducers provide an accuracy of ±0.5%. During the tests, the semi-disc Specimens were mounted in the universal testing machine, and the transverse distance between the two support rollers at the bottom of the test frame was adjusted to achieve an S/R ratio of 0.5. To ensure static test conditions, the machine applied a displacement loading rate of 0.01 mm/min.
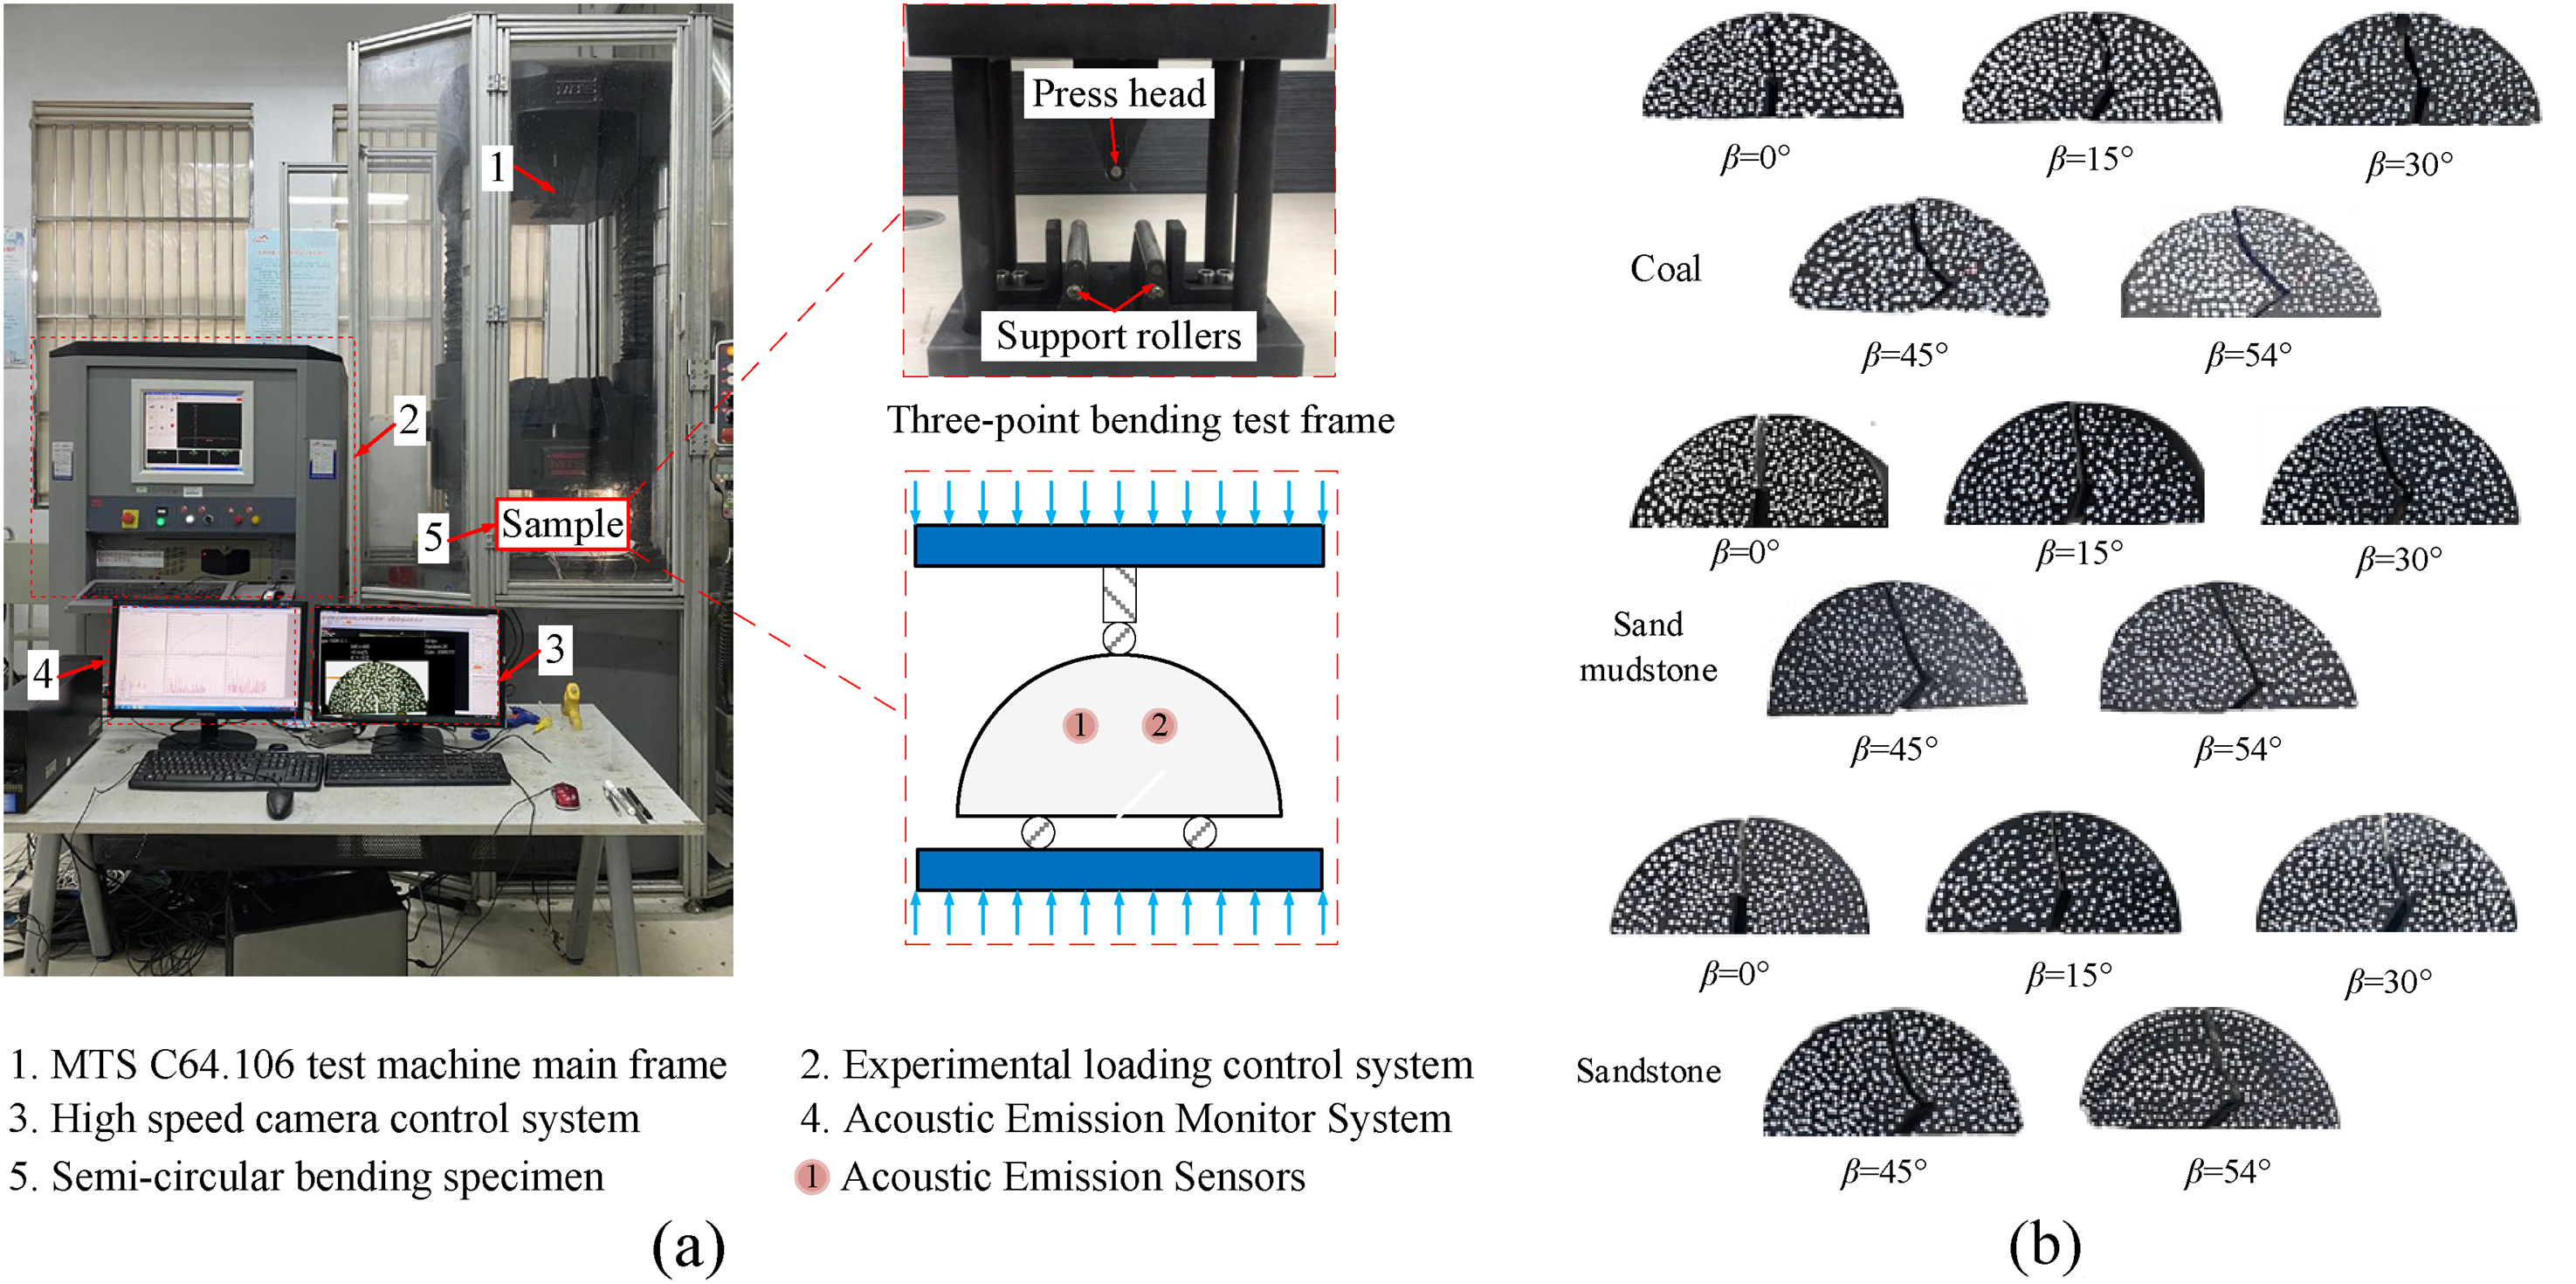
Experiment loading control system and photographs of post-failure specimens. (a) Experiment loading and control system. (b) Photographs of post-failure specimens.
To analyze the I/II Hybrid crack characteristics of the various rock Specimens, a digital image calculation method (DICM) was employed to monitor the local deformation patterns of the SCB Specimens throughout the loading process. The fracture process of the rock SCB Specimens was recorded using a high-speed camera (FASTCAM Mini UX50) with image dimensions of 640 × 480 pixels and a shooting speed of 5 frames/s. A LED fluorescent lamp served as the light source. After the tests, the GOM Correlate 2017 system software was utilized to correlate the scattered spot images and extract the necessary data for analysis.
Concurrently, the acoustic emission signals emitted by the SCB specimens were recorded using an acoustic emission system (Model PCI-2, Physical Acoustic Corporation, America). The system is configured with an acquisition threshold of 40 dB, a gain of 40 dB, and a sampling frequency of 2 MHz. An NANA-30 model acoustic emission probe (manufactured by Physical Acoustic Corporation) was employed to capture signals within the frequency range of 125–750 kHz, with a resonant frequency of 140 kHz.
Analysis of test results
Crack propagation process
Figure 4 depicts the loading force-time curves and acoustic emission counting characteristics during the fracture process of SCB specimens with varying prefabricated crack angles in coal. For β=0°, cracks initiate at point A (t = 16.2 s, Pcr = 0.17kN), followed by steady expansion to point B (t = 126.6 s, Pcr = 1.38kN) as the loading force growth rate decreases. Subsequently, the cracks rapidly propagate, leading to penetration at point C (t = 196.6 s, Pcr = 1.78kN), resulting in specimen damage (Figure 4(a)). In the case of β=15°, cracks initiate at point A (t = 115.4 s, Pcr = 0.55kN), and then expand steadily to point B (t = 276.8 s, Pcr = 1.42kN) as the loading force growth rate initially decreases and subsequently increases. The cracks rapidly propagate, leading to penetration at point C (t = 365.9 s, Pcr = 2.09kN), resulting in specimen damage (Figure 4(b)). For β=30°, cracks initiate at point A (t = 75.24 s, Pcr = 0.61kN), followed by steady expansion to point B (t = 184.69 s, Pcr = 1.55kN) as the loading force steadily increases. The cracks rapidly propagate, leading to penetration at point C (t = 254.4 s, Pcr = 2.3kN), resulting in specimen damage (Figure 4(c)). When β=45°, cracks initiate at point A (t = 18.1 s, Pcr = 0.08kN) and steadily expand to point B (t = 156.2 s, Pcr = 0.96kN) after a rapid expansion phase, followed by a continued rise in loading force. At point C (t = 276.7 s, Pcr = 1.76kN), the cracks penetrate, leading to specimen damage (Figure 4(d)). Finally, for β=54°, cracks initiate at point A (t = 44.6 s, Pcr = 0.23kN) and steadily expand to point B (t = 98.8 s, Pcr = 0.56kN) as the loading force growth rate first decreases and then increases. The cracks rapidly propagate, resulting in penetration at point C (t = 224.4 s, Pcr = 1.43kN) and subsequent specimen damage (Figure 4(e)).
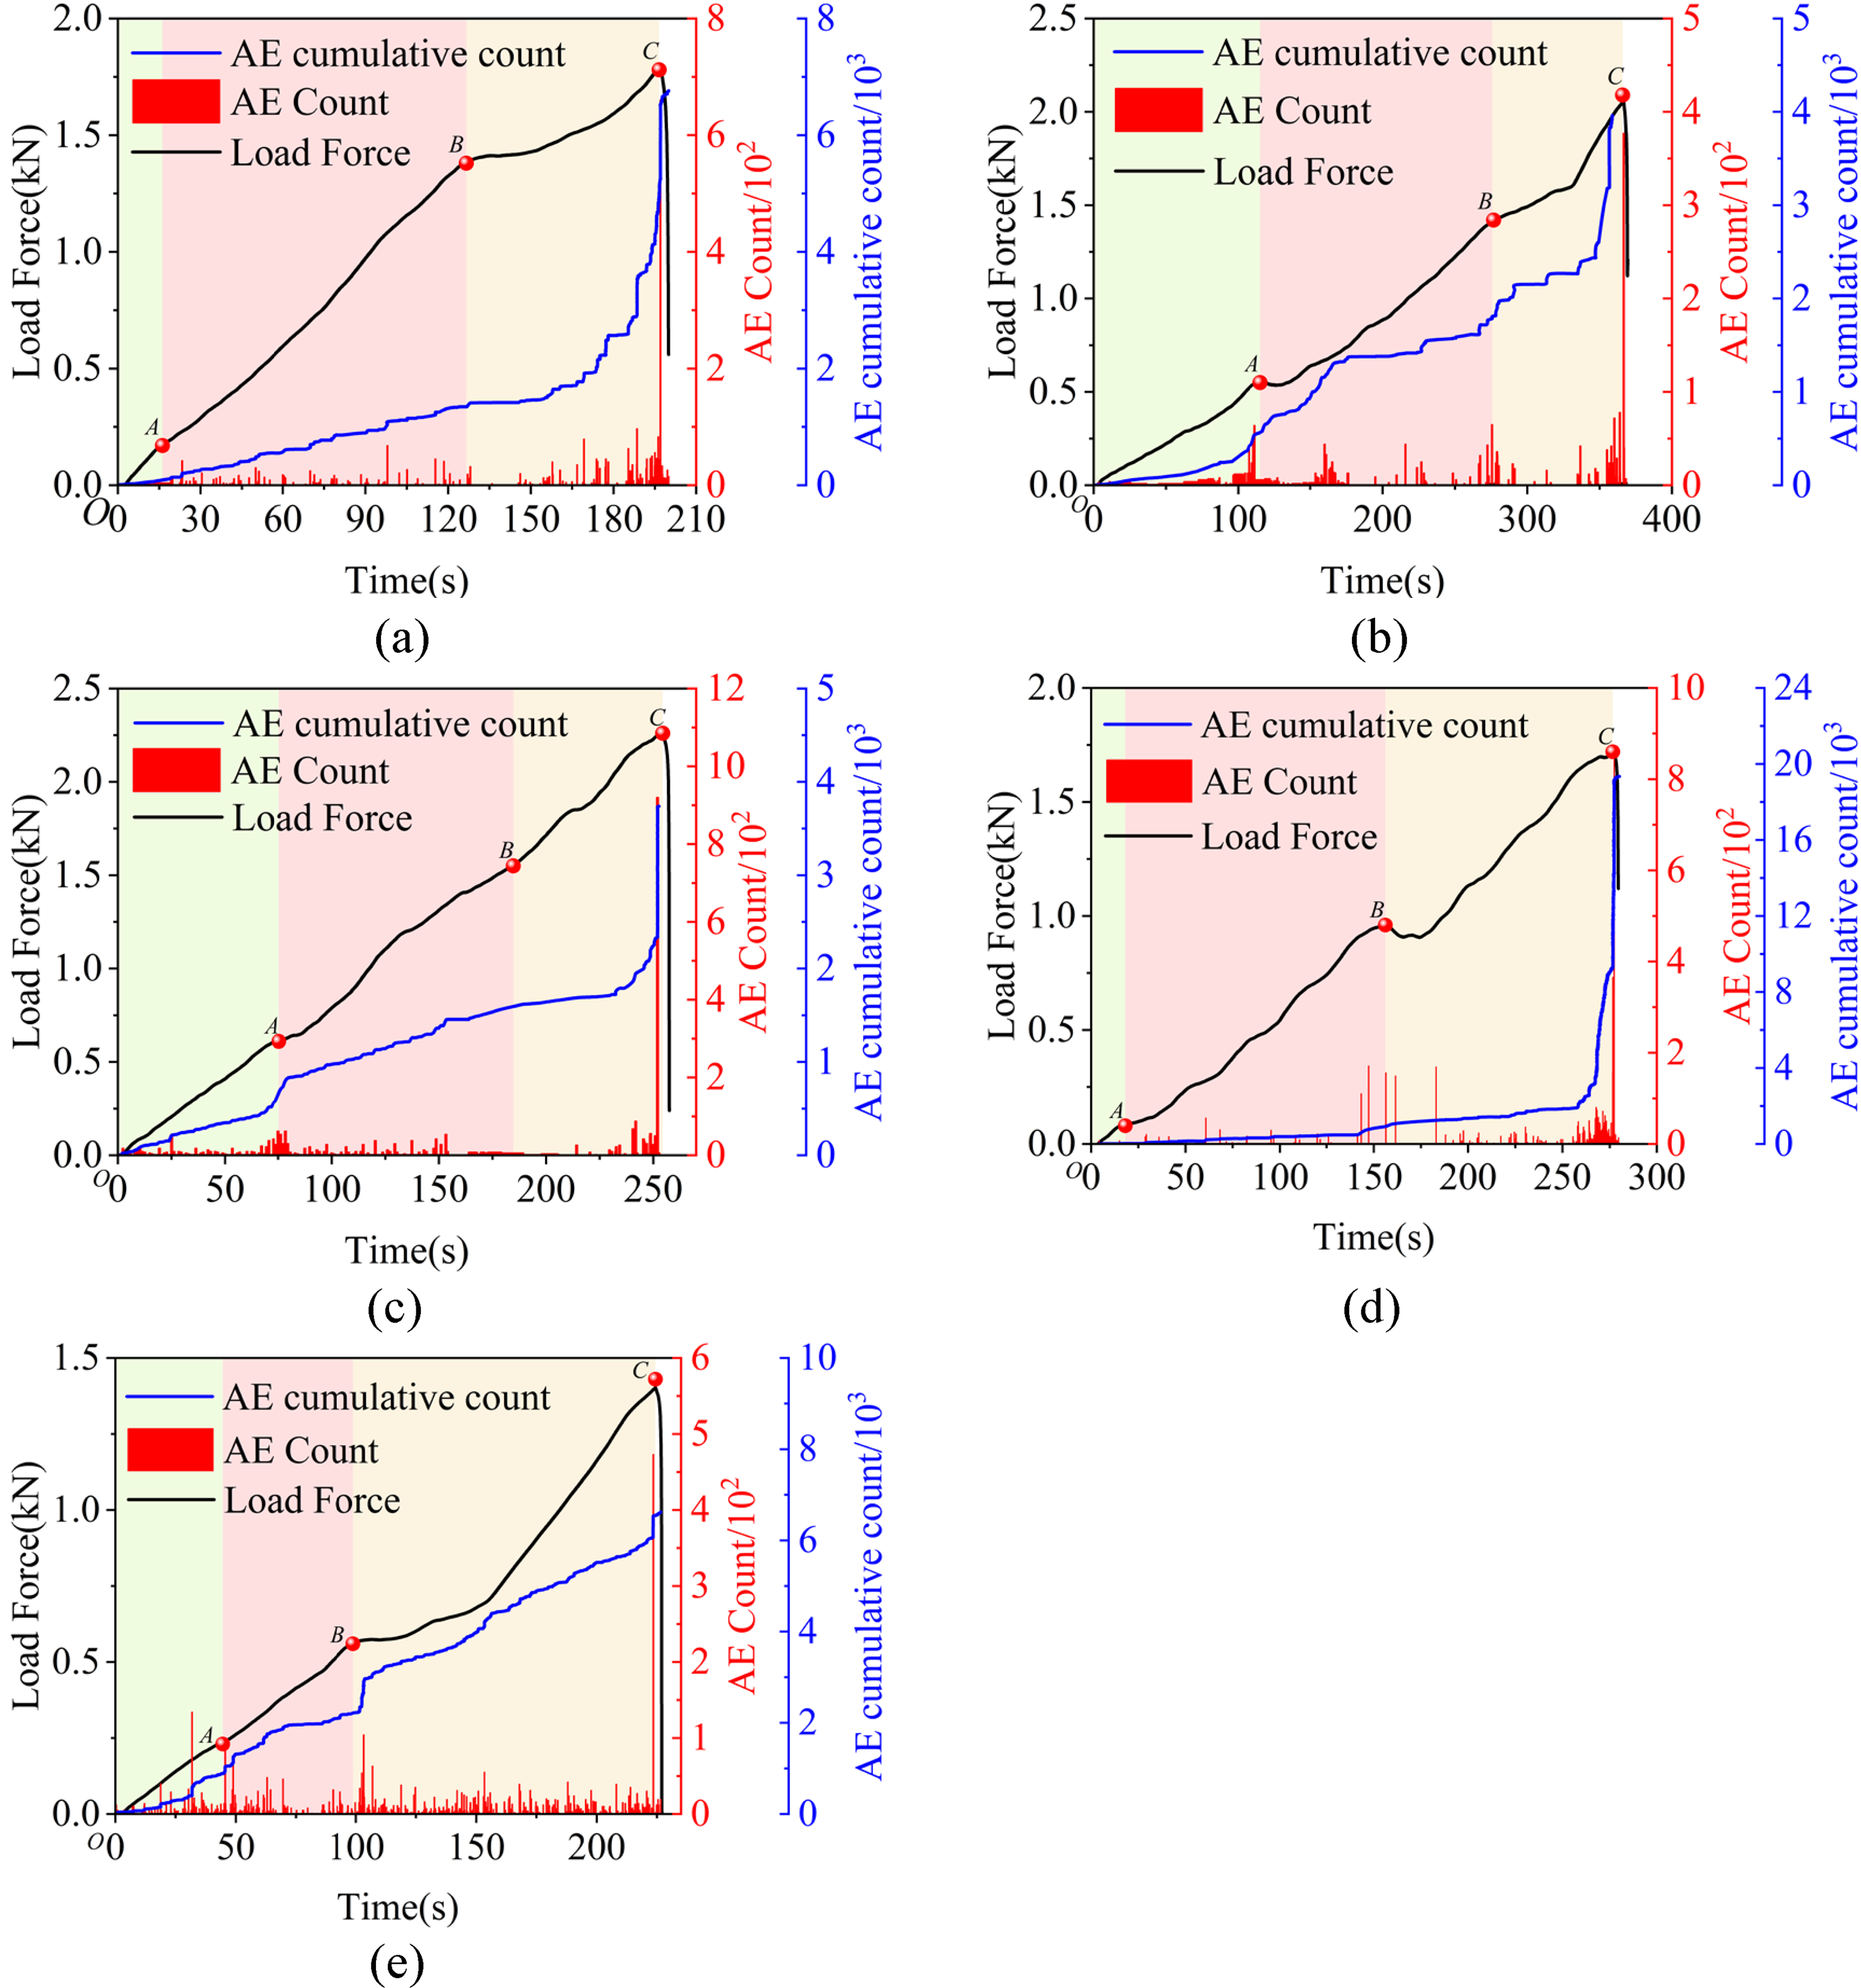
Correspondence of AE counts, cumulative AE counts and load force-time curves of SCB specimens of coal. (a) C-0-2. (b) C-15-2. (c) C-30-1. (d) C-45-3. (e) C-54-3.
Figure 5 illustrates the loading force-time curves and acoustic emission counting characteristics during the fracture process of SCB specimens with different prefabricated crack angles in sandy mudstone. For β=0°, cracks initiate at point A (t = 153.5 s, Pcr = 0.65kN) and then steadily expand to point B (t = 304.8 s, Pcr = 1.66kN) as the loading force growth rate initially decreases. Subsequently, the loading force growth rate first decreases and then increases, and the cracks rapidly propagate, leading to penetration at point C (t = 382.7 s, Pcr = 2.14kN) and specimen damage (Figure 5(a)). In the case of β=15°, cracks develop at point A (t = 36.2 s, Pc = 0.24kN) and steadily expand to point B (t = 105.5 s, Pcr = 0.87kN) as the loading force growth rate initially decreases and subsequently increases. The cracks rapidly propagate, resulting in penetration at point C (t = 258.1 s, Pcr = 2.25kN) and specimen damage (Figure 5(b)). For β=30°, cracks initiate at point A (t = 42.4 s, Pcr = 0.20kN) and then steadily expand to point B (t = 189.7 s, Pcr = 0.70kN) as the loading force growth rate increases and then decreases. The cracks rapidly propagate, leading to penetration at point C (t = 157.9 s, Pcr = 1.51kN) and specimen damage (Figure 5(c)). When β=45°, cracks develop at point A (t = 82.5 s, Pcr = 0.29kN) and then steadily expand to point B (t = 215.2 s, Pc = 0.88kN) as the loading force growth rate first decreases and then increases. The cracks rapidly propagate, resulting in penetration at point C (t = 327.6 s, Pcr = 1.49kN) and specimen damage (Figure 5(d)). Finally, for β=54°, cracks initiate at point A (t = 63.1 s, Pcr = 0.29kN) and steadily expand to point B (t = 209.3 s, Pcr = 0.92kN) as the loading force growth rate first decreases and then increases. The cracks rapidly propagate, as observed in Figure 5(e).
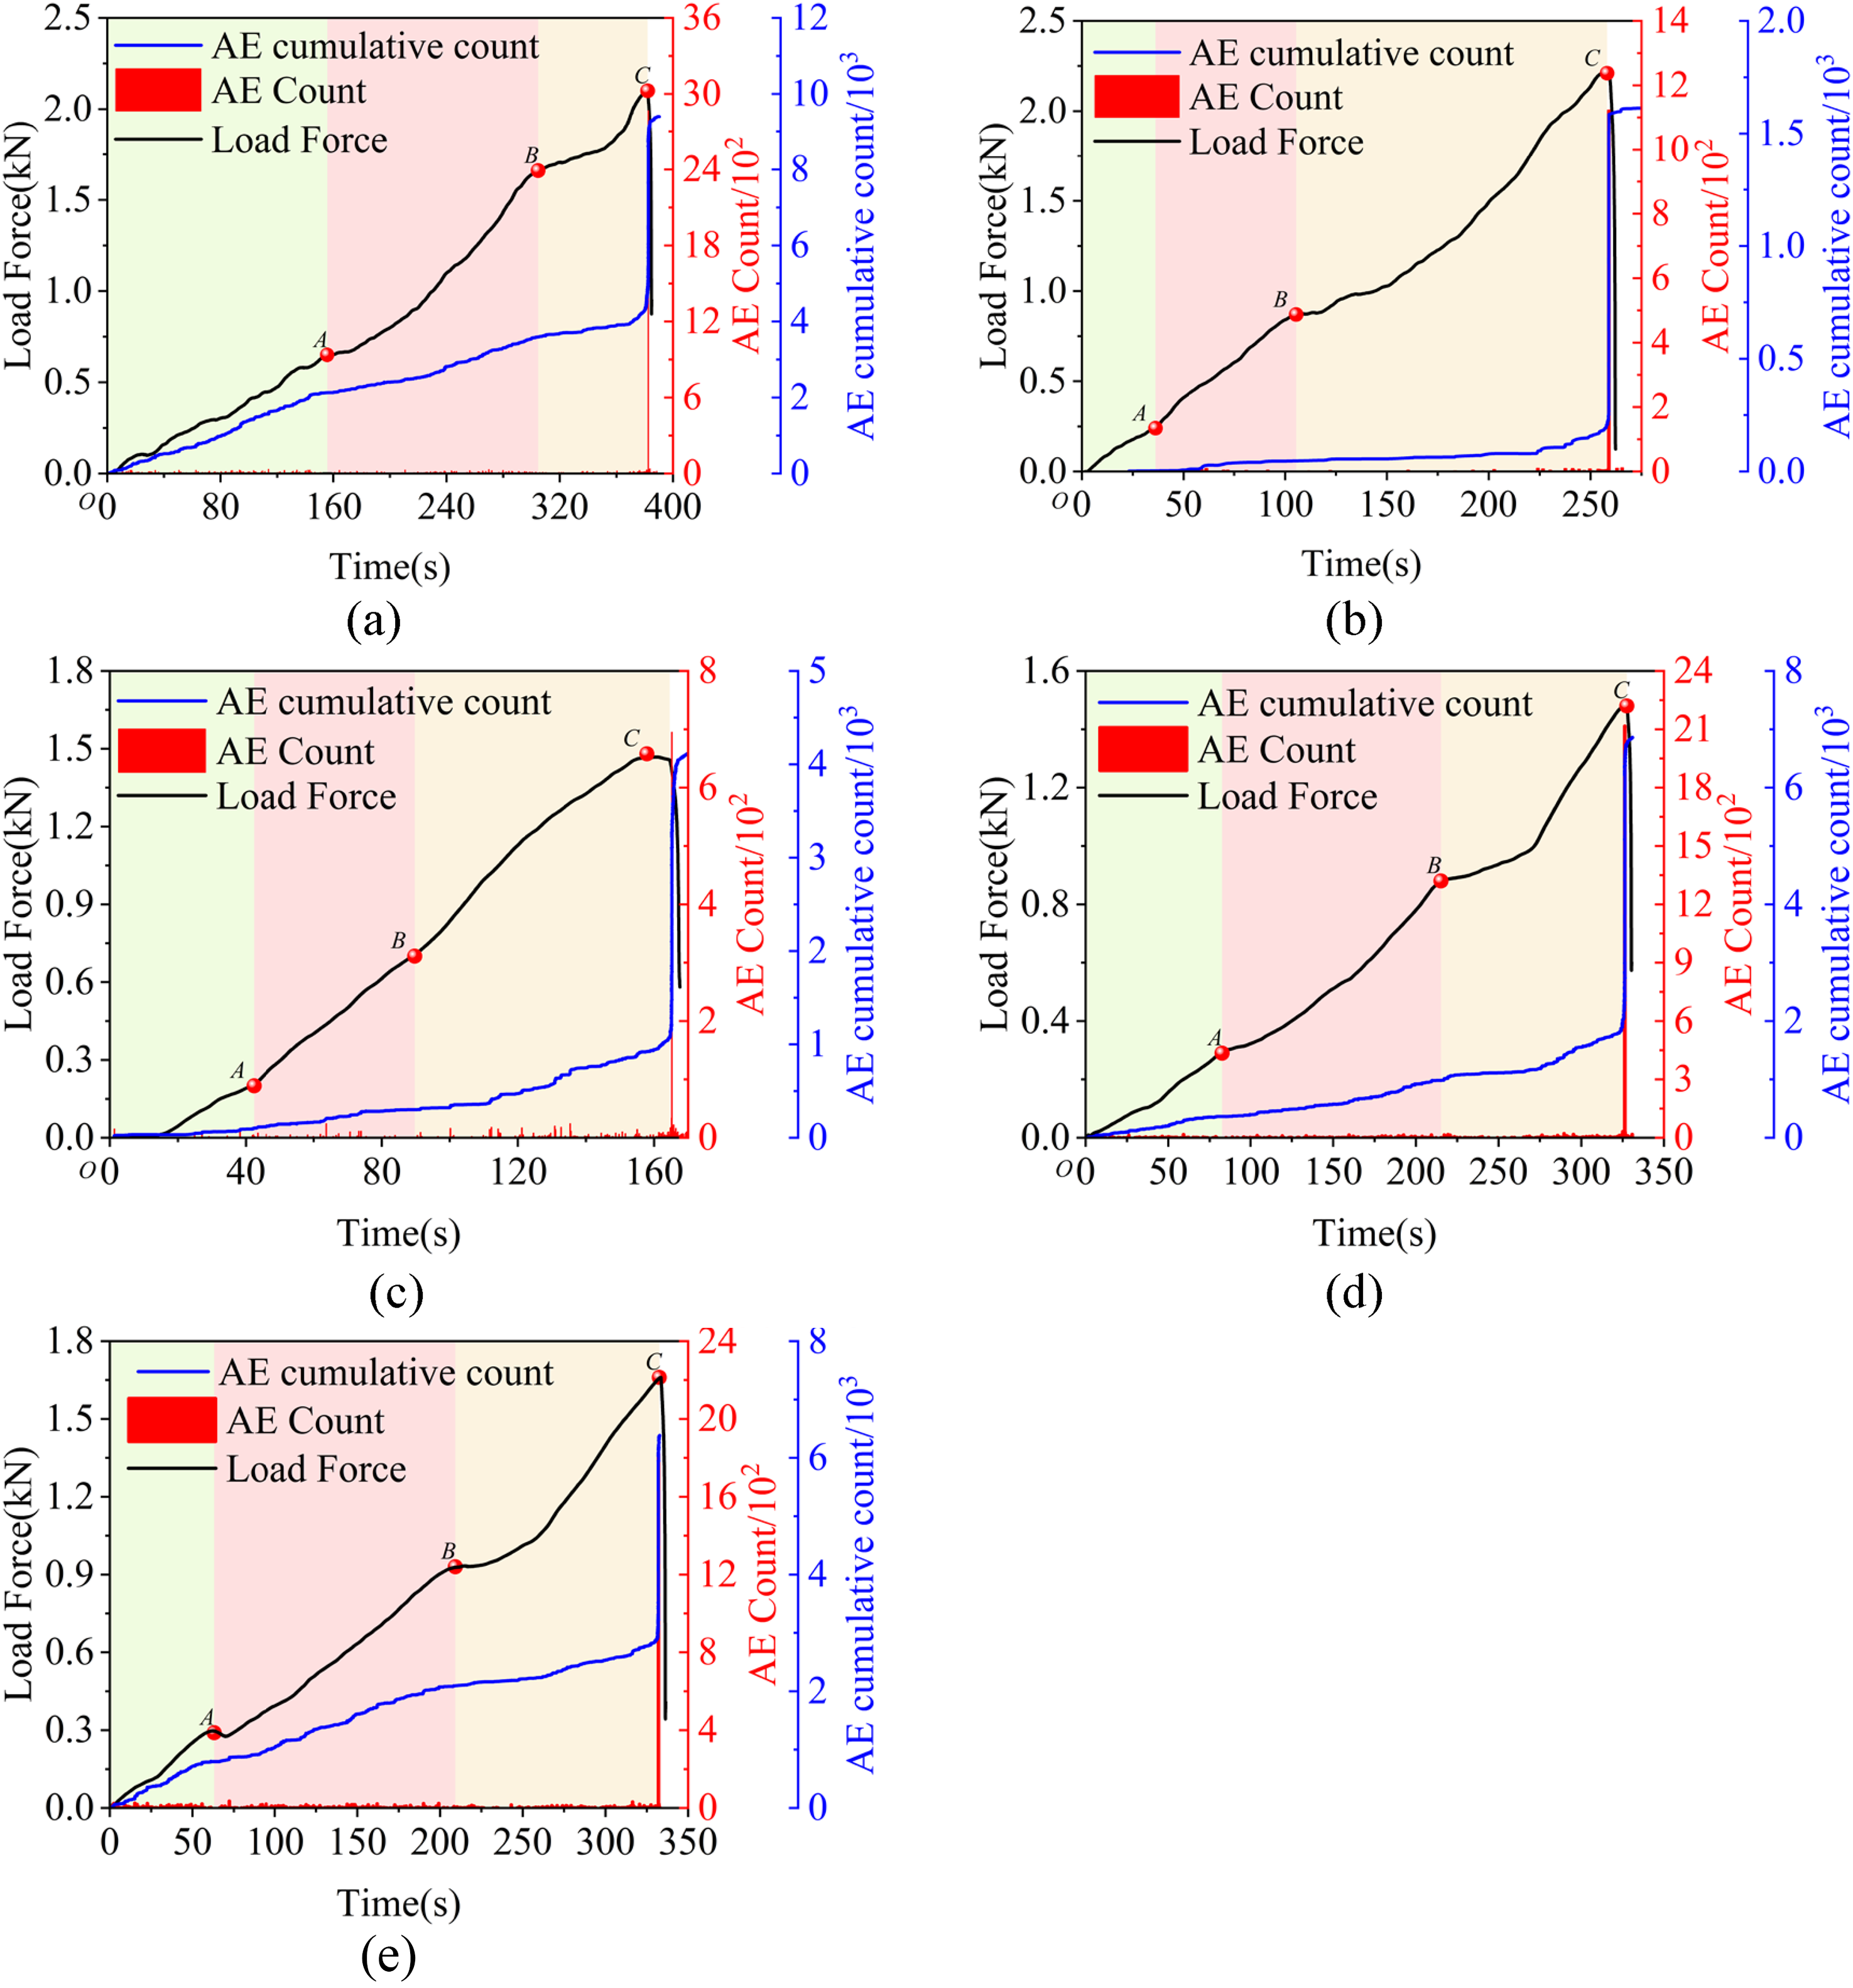
Correspondence of AE counts, cumulative AE counts and load force-time curves of SCB specimens of sand-mudstone. (a) SM-0-2. (b) SM-15-1. (c) SM-30-2. (d) SM-45-1. (e) SM-54-1.
Figure 6 presents the loading force-time curves and acoustic emission counting characteristics during the fracture process of SCB specimens with different prefabricated crack angles in sandstone. For β=0°, cracks initiate at point A (t = 110.5 s, Pcr = 0.94kN) and then steadily expand to point B (t = 203.4 s, Pc = 1.98kN) as the loading force growth rate first decreases. At point C (t = 3292.8 s, Pc = 3.02kN), the cracks penetrate, resulting in specimen damage (Figure 6(a)). In the case of β=15°, cracks develop at point A (t = 116.3 s, Pc = 0.79kN) and steadily expand to point B (t = 238.4 s, Pc = 1.77kN) as the loading force growth rate decreases and subsequently increases. The cracks rapidly propagate, leading to penetration at point C (t = 350.3 s, Pc = 3.13kN) and specimen damage (Figure 6(b)). For β=30°, cracks initiate at point A (t = 91.3 s, Pc = 0.42kN) and then steadily expand to point B (t = 283.8 s, Pc = 1.67kN) as the loading force growth rate decreases and subsequently increases (Figure 6(c)). When β=45°, cracks develop at point A (t = 235.7 s, Pc = 0.64kN) and steadily expand to point B (t = 337.5 s, Pc = 1.66kN) as the loading force growth rate decreases and subsequently increases (Figure 6(d)). Finally, for β=54°, cracks initiate at point A (t = 115.7 s, Pc = 0.78kN) and steadily expand to point B (t = 344 s, Pc = 1.99kN) as the loading force growth rate increases instantaneously, the cracks rapidly propagate (Figure 6(e)).
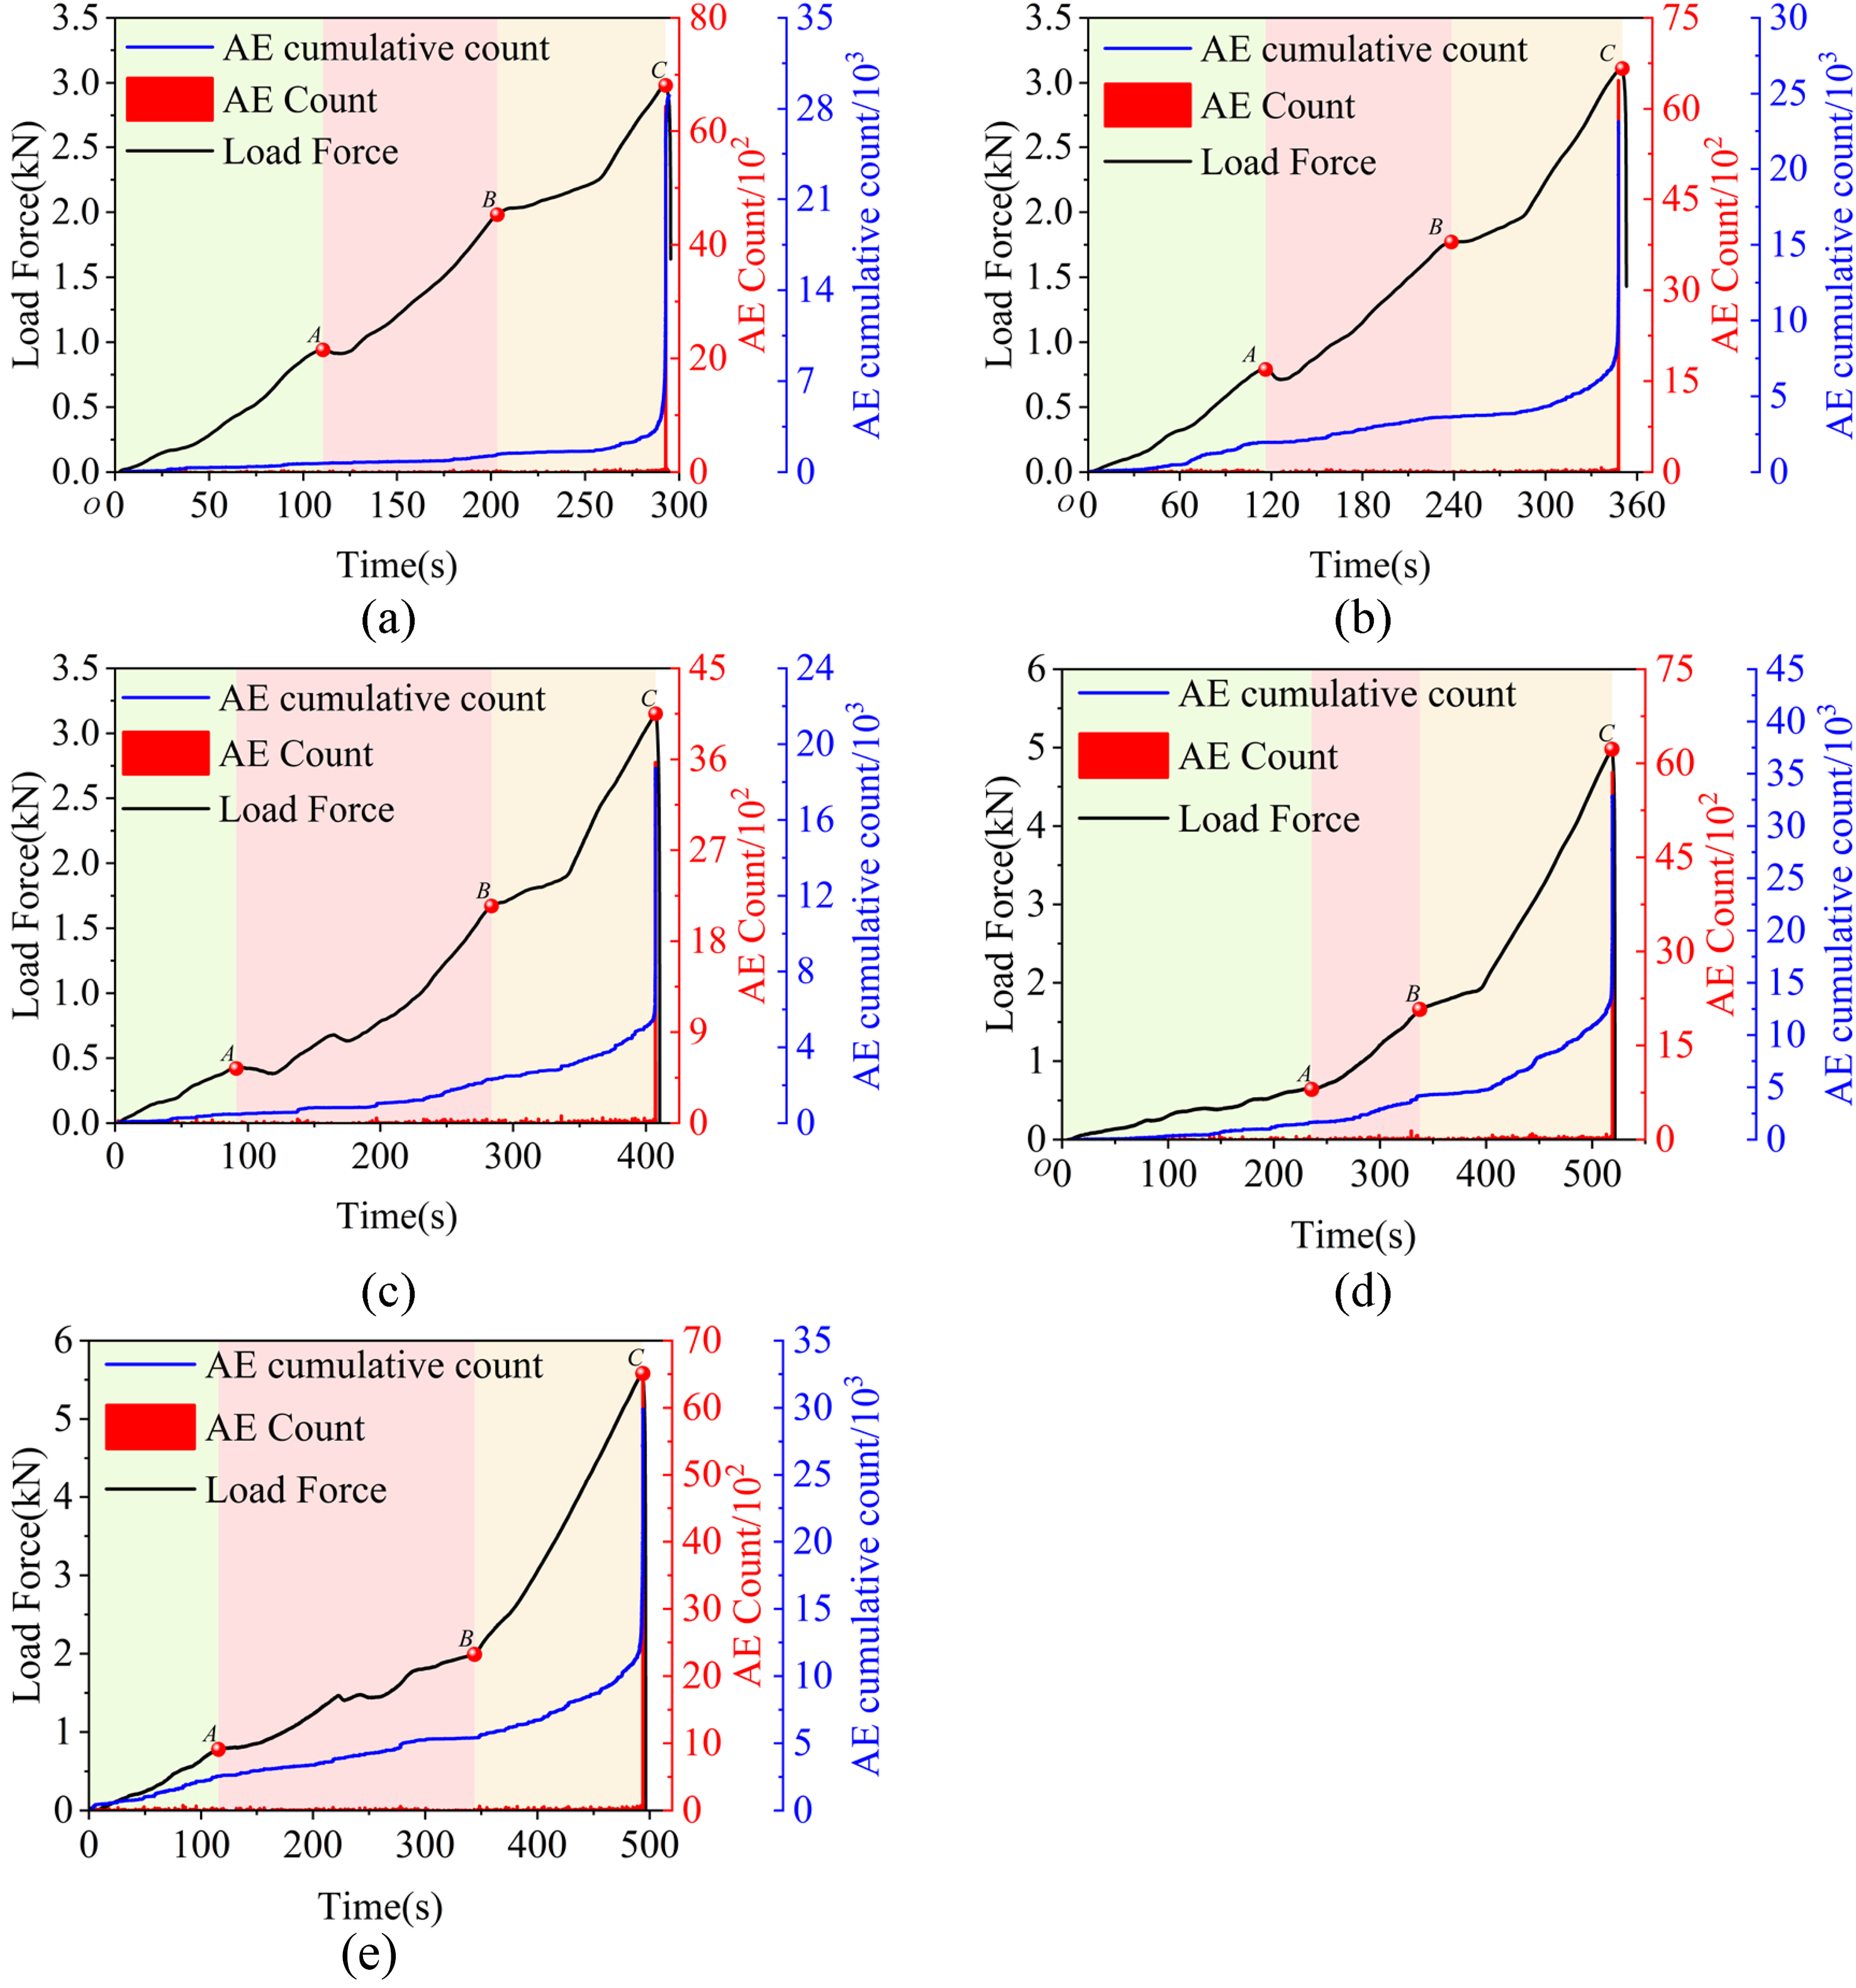
Correspondence of AE counts, cumulative AE counts and load force-time curves of SCB specimens of sandstone. (a) S-0-2. (b) S-15-2. (c) S-30-2. (d) S-45-2. (e) S-54-3.
The SCB experimental findings of this study elucidate the fracture extension process exhibited by coal, sandy mudstone, and sandstone, which can be classified into three distinct stages. Initially, during the crack sprouting stage (OA section of the loading force-time curve), new cracks originate at the tip of the prefabricated cracks as the loading force gradually increases. Subsequently, in the stable crack expansion stage (AB section of the loading force-time curve), the newly formed cracks within the SCB specimen steadily propagate along a trajectory that deviates from the prefabricated crack line as the loading force continues to escalate. Finally, in the destabilization damage stage (BC section of the loading force-time curve), characterized by a rapid surge in loading force, the newly formed crack undergoes rapid expansion, penetrating through the top of the SCB specimen and resulting in complete destabilization and damage of the specimen.
Analysis of deformation field evolution
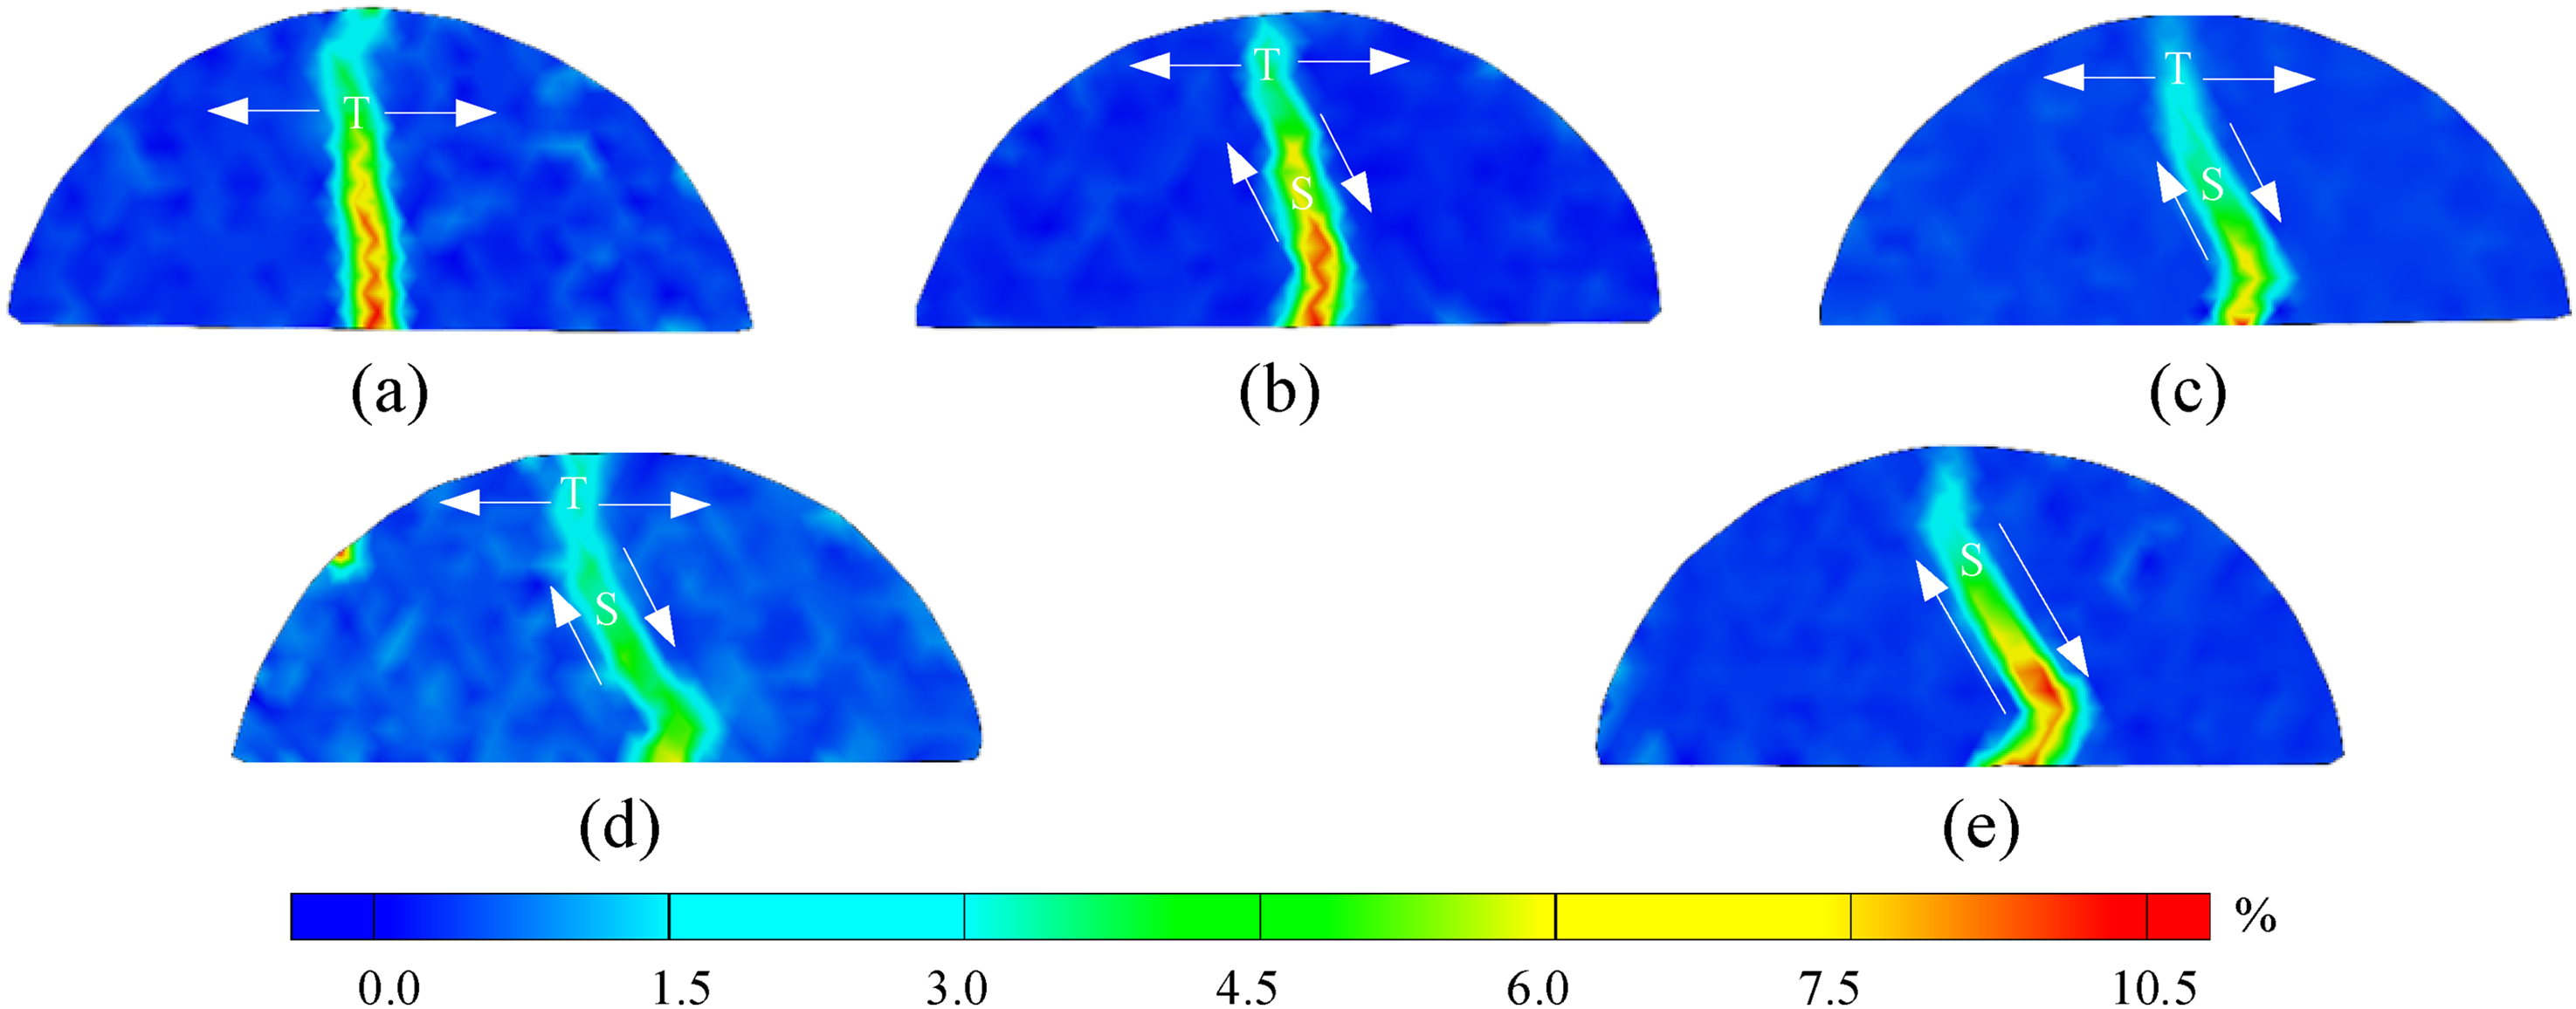
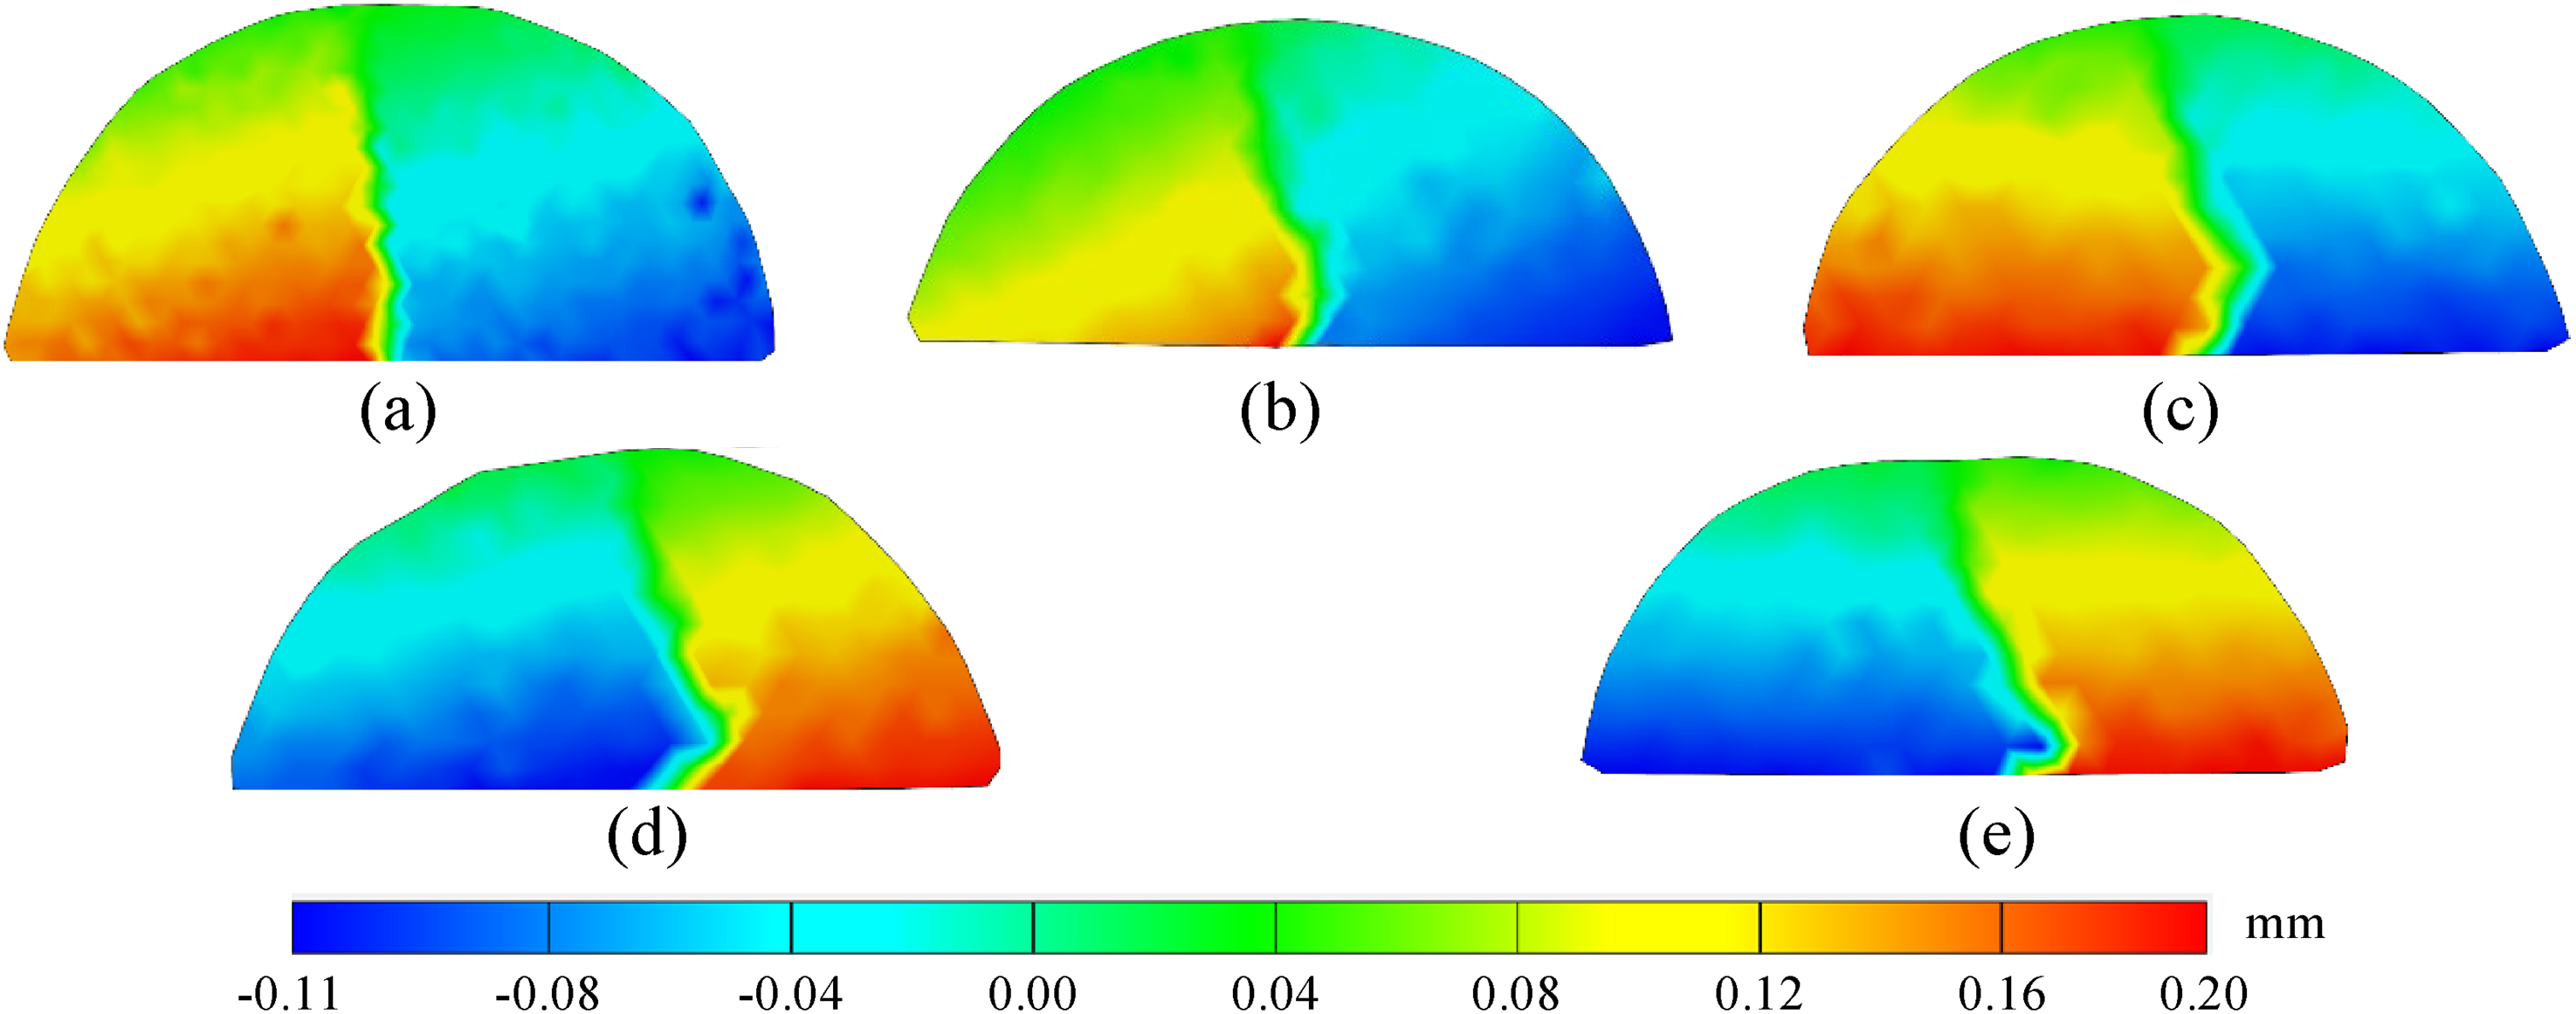
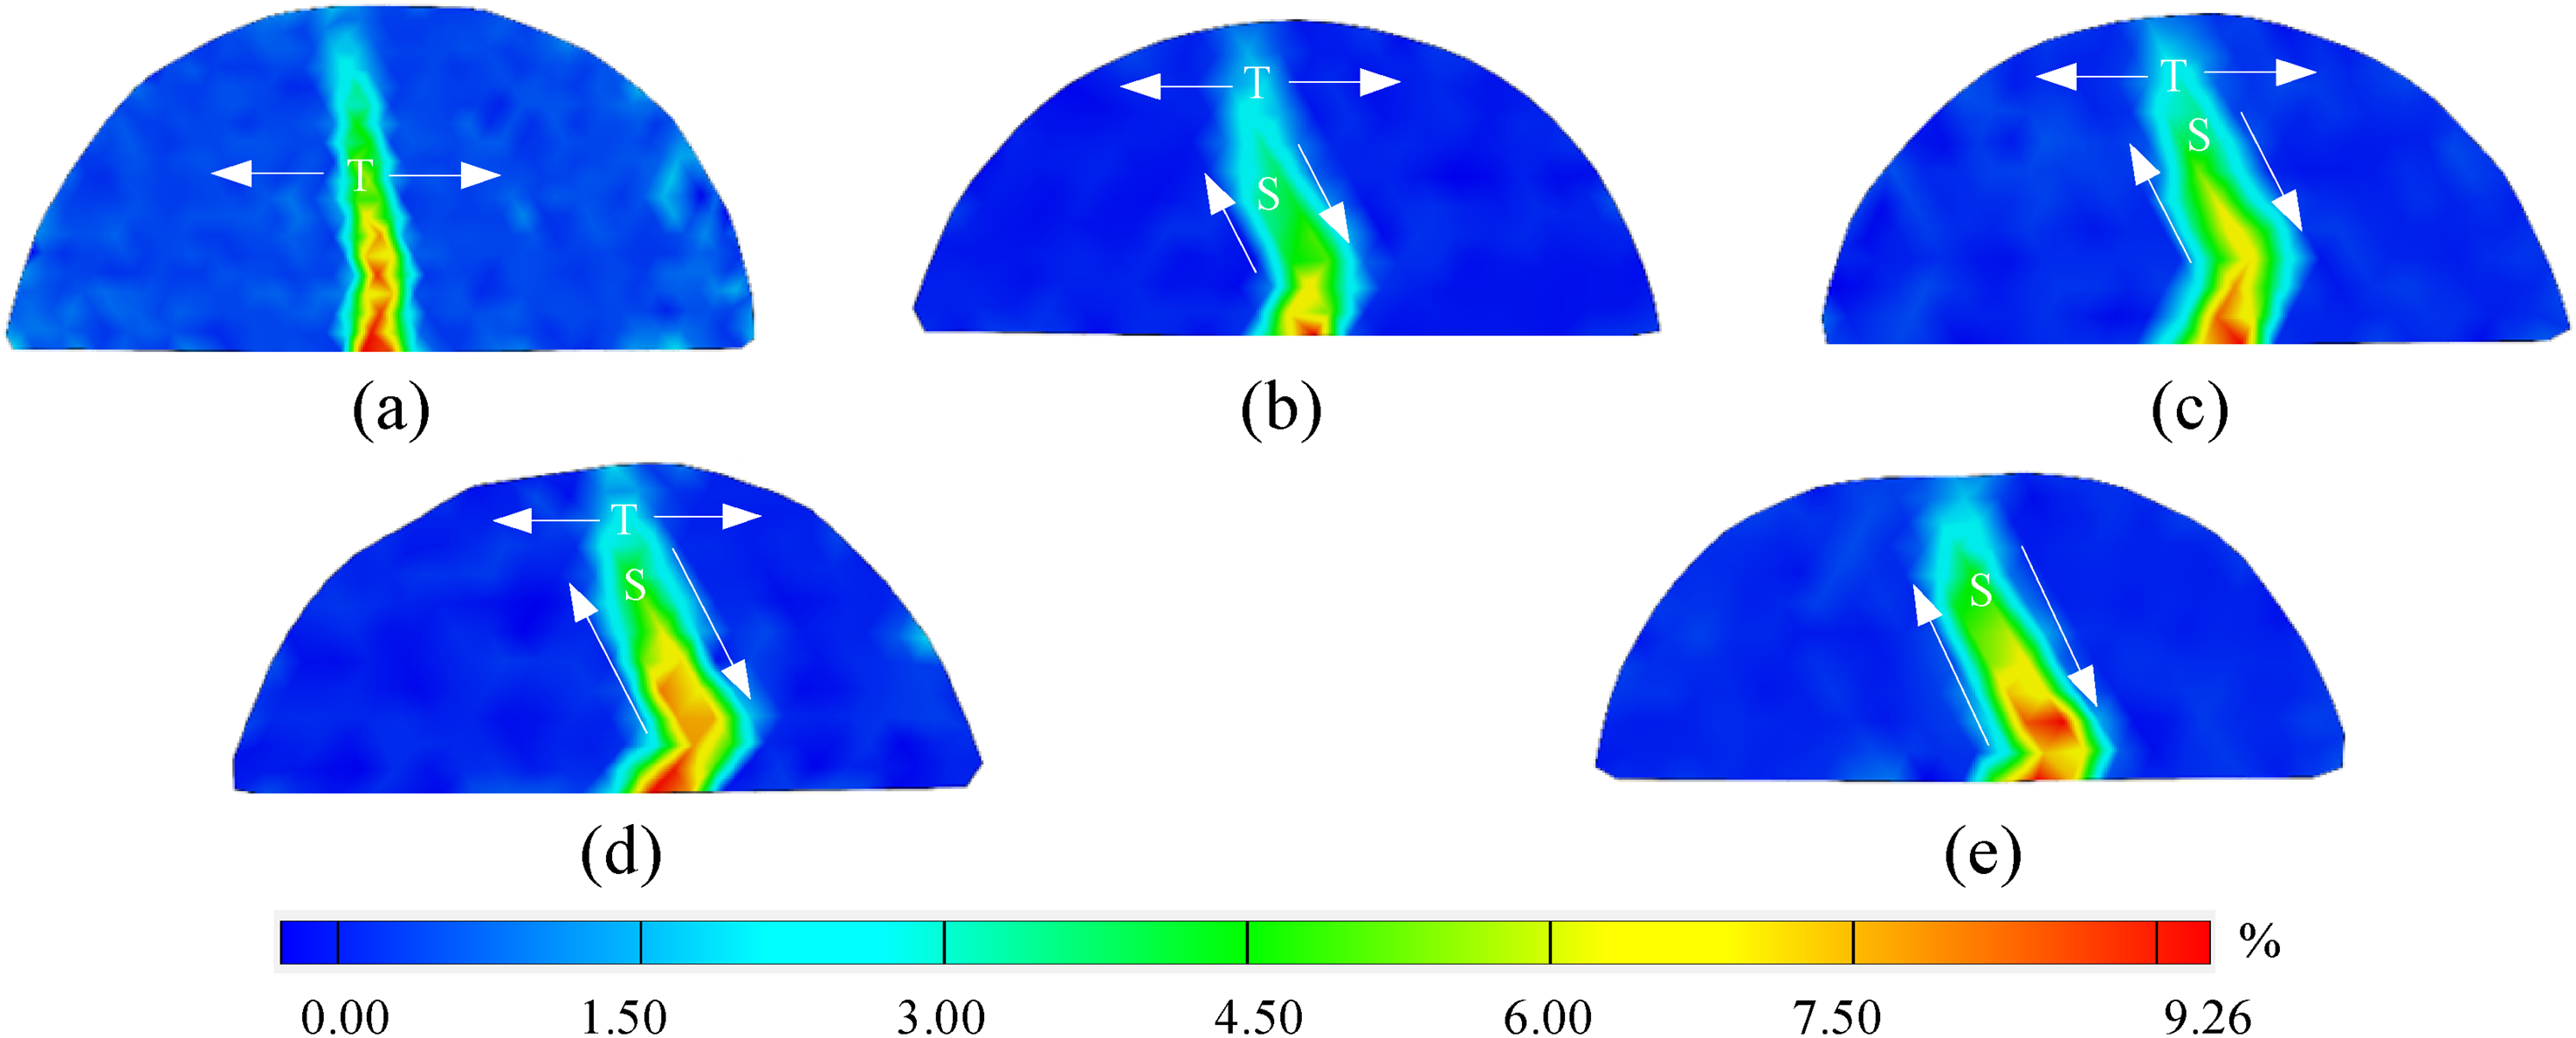
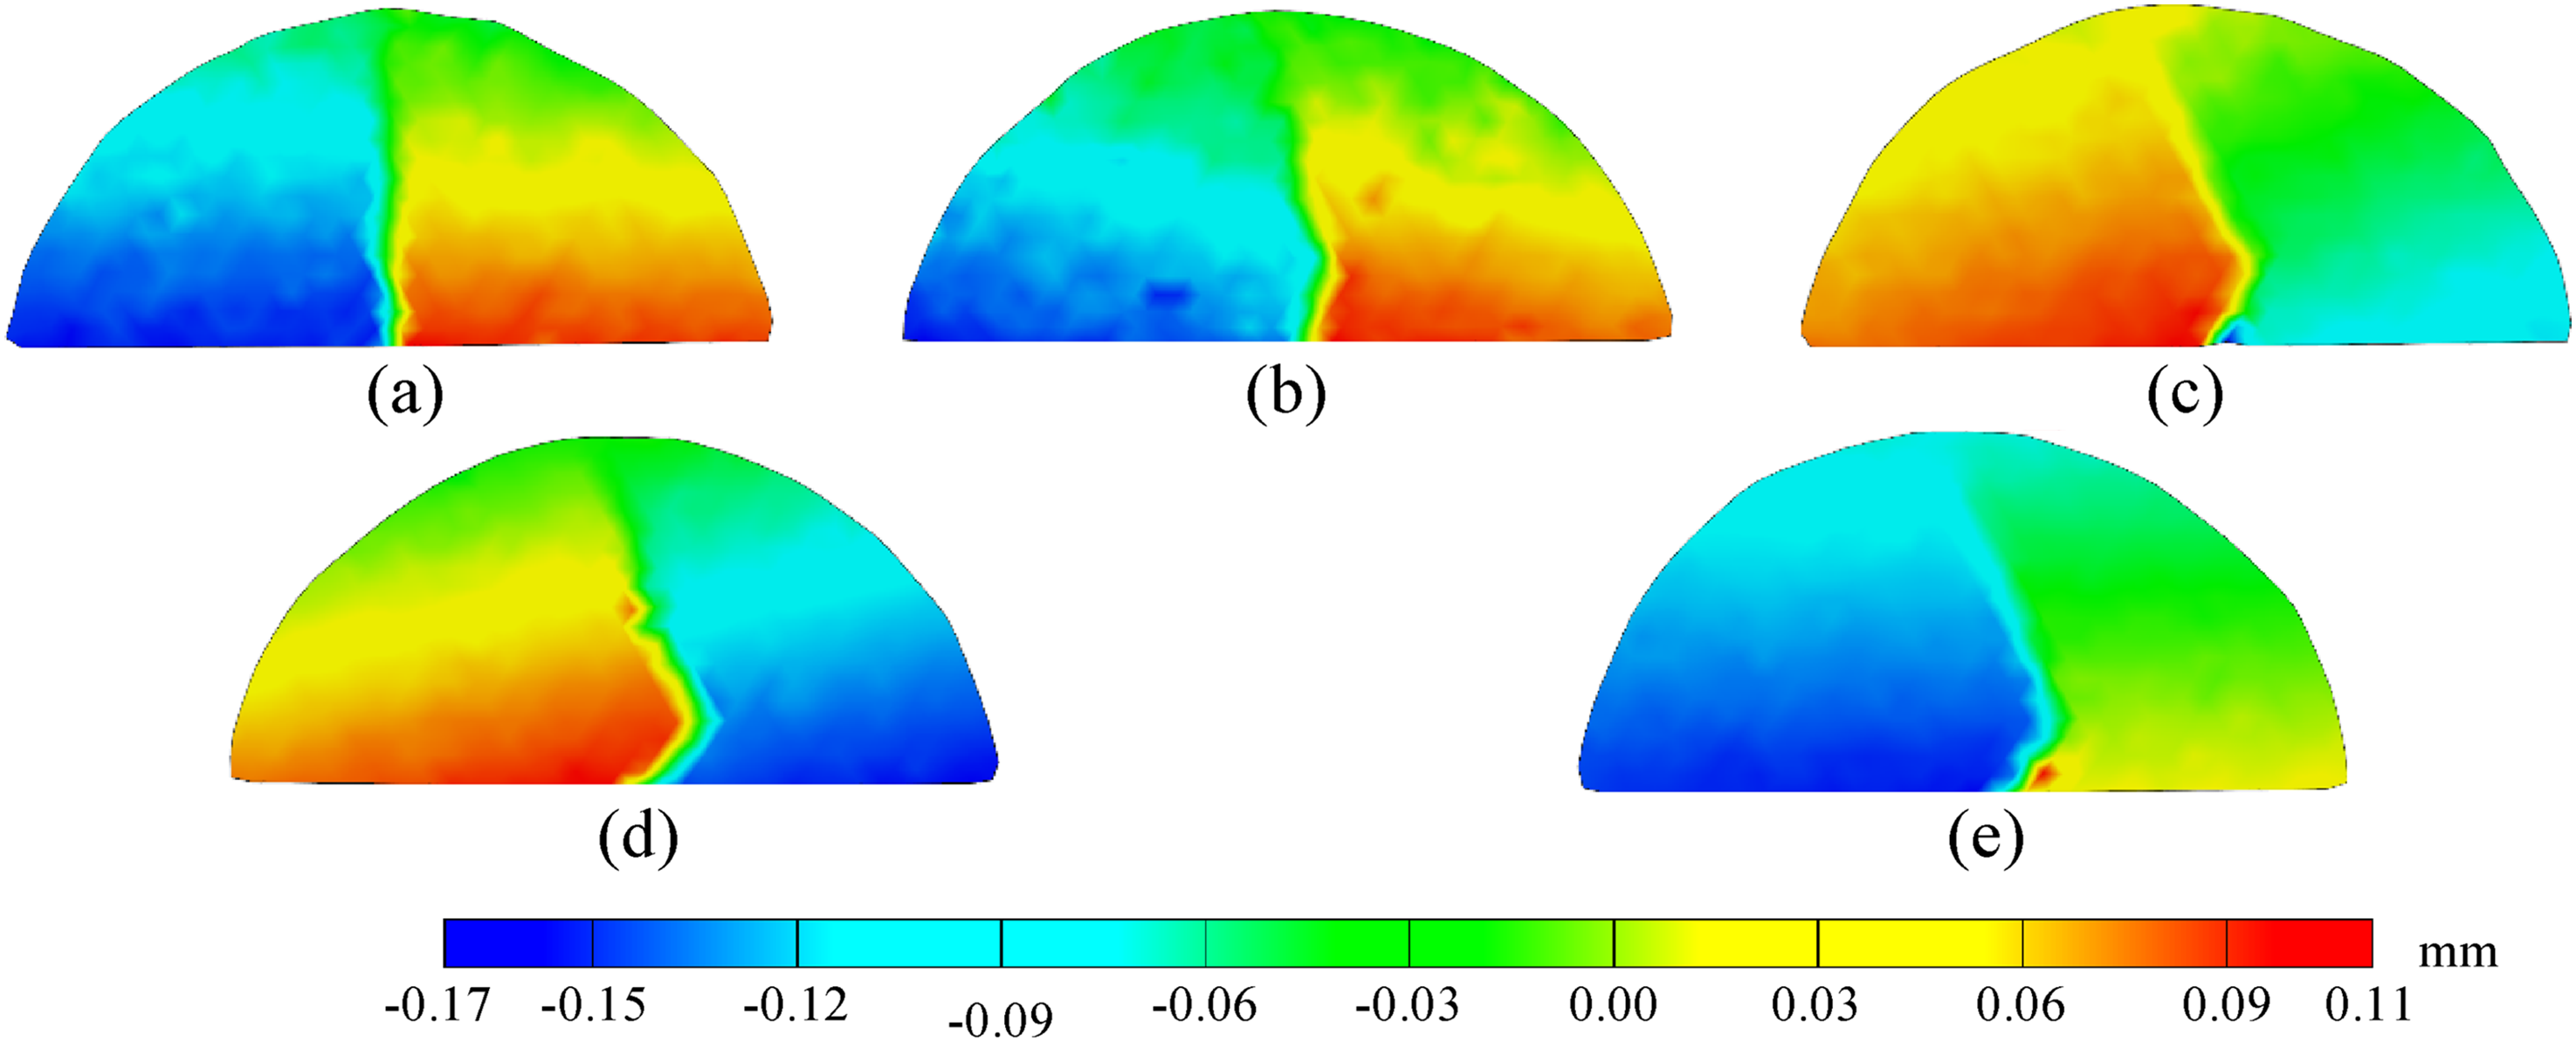
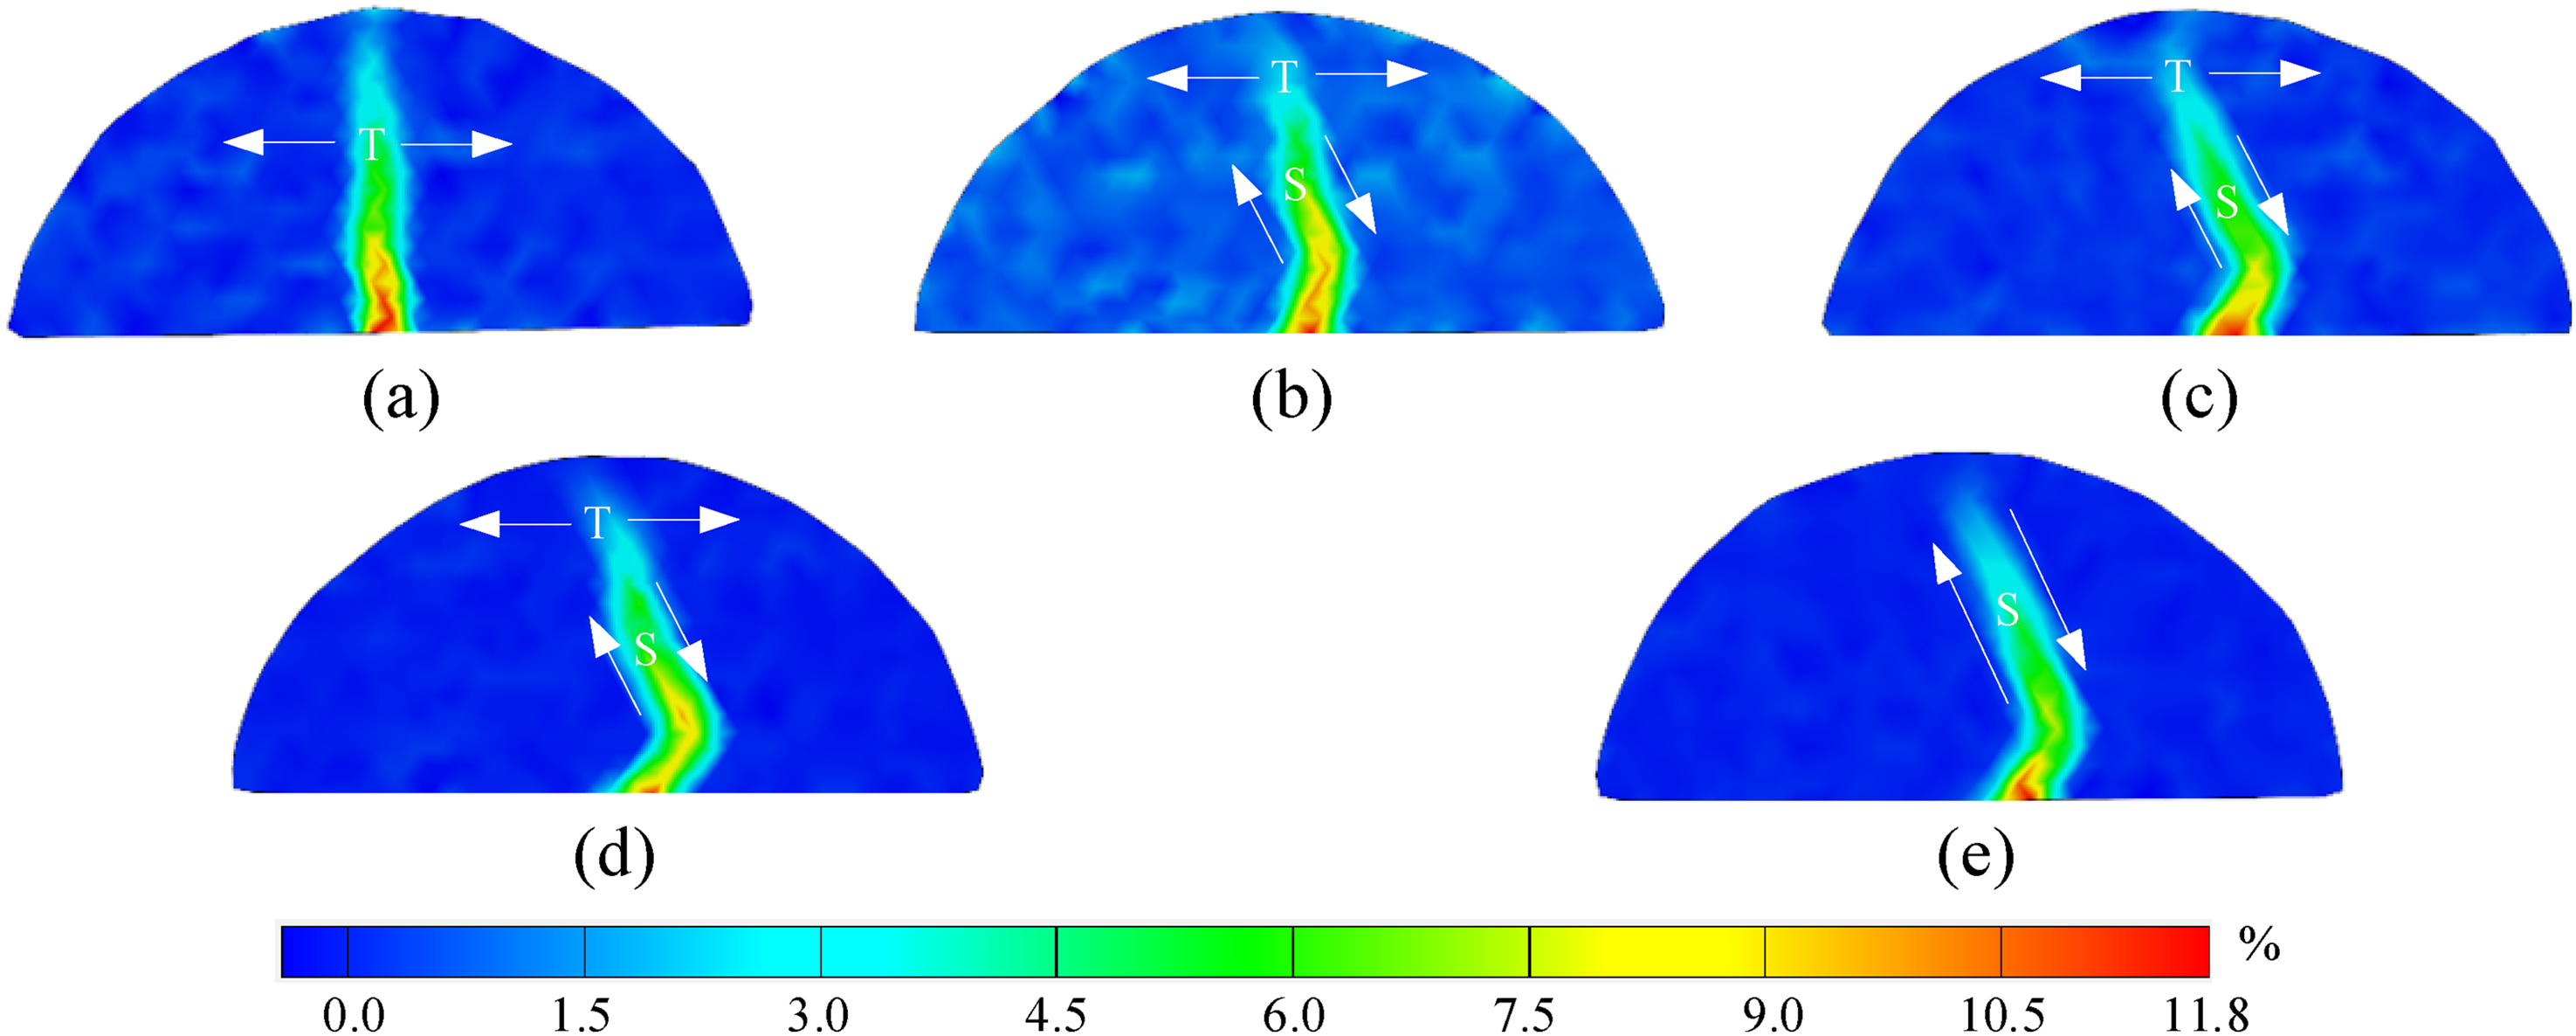
To investigate the crack growth, development, penetration, and ultimate failure of SCB Specimens under varying pre-fracture angles, a comparative analysis of displacement and strain fields was conducted for coal, sandy mudstone, and sandstone specimens. The strain field visualization employed the symbol “T” to represent tensile fractures and the letter “S” to denote shear cracks. Examination of the displacement fields (Figure 7, Figure 8, and Figure 9) and variation patterns in the strain field (Figure 10, Figure 11, and Figure 12) during the fracture process revealed distinct characteristics. For β = 0°, the cracks initiated by loading originated from the tip of the pre-fracture gap and propagated along the direction of the pre-fracture line until failure occurred through penetration. In the case of coal SCB Specimens, tension cracks (pure type I) primarily contributed to the failure mechanism. However, near the loading point of SCB Specimens, partial shear failure occurred due to the influence of the primary fracture, as depicted in Figure 10(a). Conversely, the fracture failure of sandy mudstone and sandstone predominantly resulted from tension cracks (pure type I), as illustrated in Figure 11(a) and Figure 12(a). As β increased (β = 15°, 30°, 45°, and 54°), the loading-induced cracks deviated from the pre-fracture line after sprouting from the tip of the pre-fracture gap. Instead, they extended from the fracture tip to the top loading point of SCB Specimens until failure through penetration, exhibiting a non-linear trajectory. This failure mechanism deviated from the pre-fracture line and was characterized by a mixed mode of tensile cracks (type I) and shear cracks (type II). Furthermore, with increasing β, the proportion of shear cracks in the Hybrid crack increased while the proportion of tensile cracks decreased, as observed in Figure 10(b–e), Figure 11(b–e), and Figure 12(b–e). However, it is important to note that the destabilization damage of SCB specimens primarily resulted from tensile cracks, regardless of the pre-fracture angle.
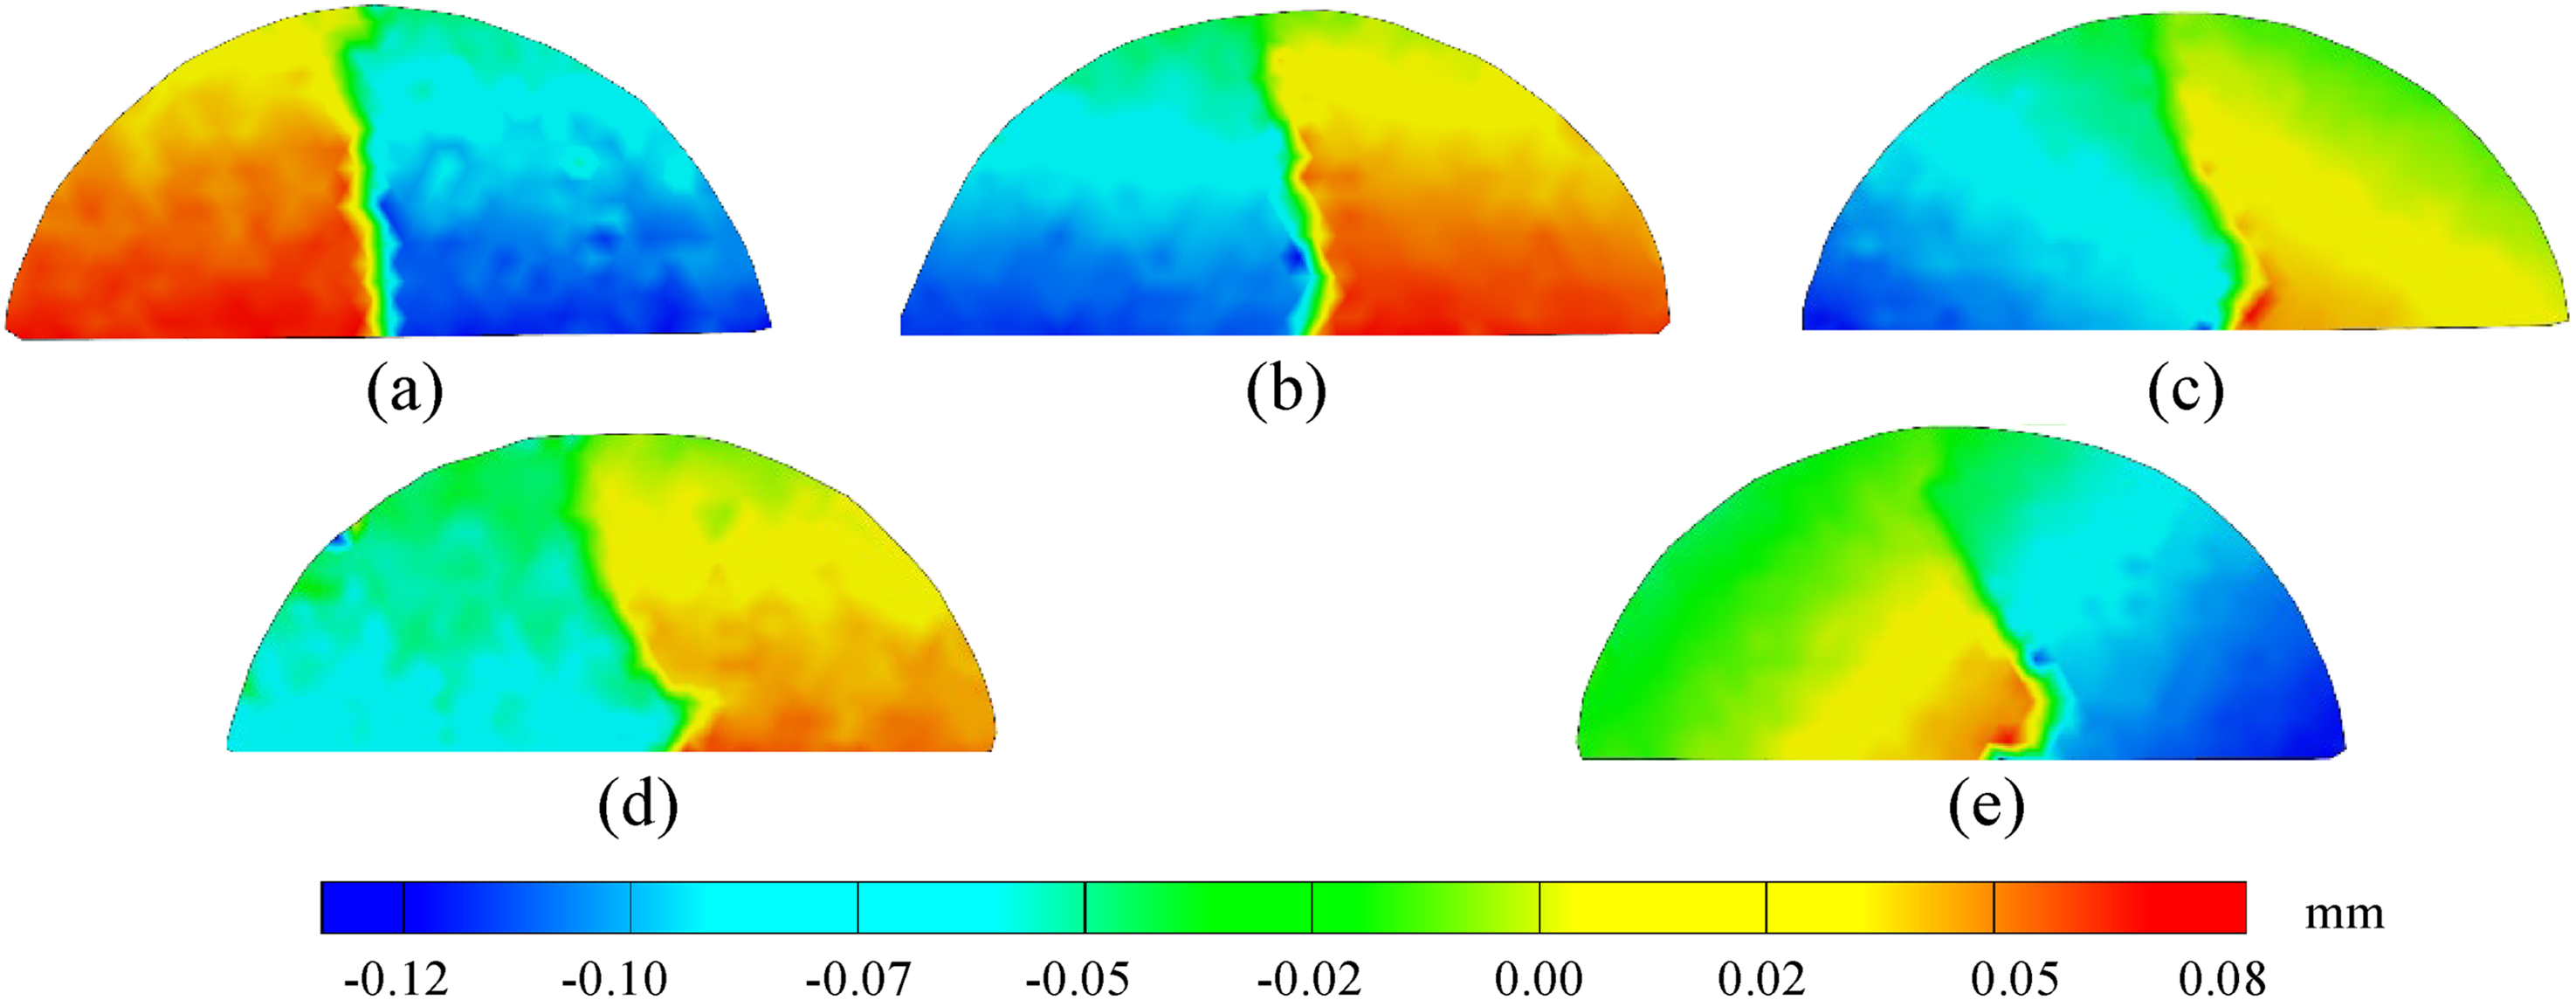
Horizontal displacement of coal specimens. (a) β=0°. (b) β=15°. (c) β=30°. (d) β=45°. (e) β=54°.
Horizontal displacement of sand-mudstone specimens. (a) β=0°. (b) β=15°. (c) β=30°. (d) β=45°. (e) β=54°.
Horizontal displacement of sandstone specimens. (a) β=0°. (b) β=15°. (c) β=30°. (d) β=45°. (e) β=54°.
Principal strain of coal specimens. (a) β=0°. (b) β=15°. (c) β=30°. (d) β=45°. (e) β=54°.
Principal strain of sandy mudstone specimens. (a) β=0°. (b) β=15°. (c) β=30°. (d) β=45°. (e) β=54°.
Principal strain of sandstone specimens. (a) β=0°. (b) β=15°. (c) β=30°. (d) β=45°. (e) β=54°.
By comparing the generation and progression of fracture during SCB loading Specimens with different β values, it is evident that the cracks in all three rock types originate from the tip of the pre-fracture gap. Specifically, when β = 0°, tension cracks (pure type I) are the primary cause of fracture damage in all three rocks. However, for β = 15°, 30°, 45°, and 54°, the fracture damage observed in all three rocks is attributed to the I/II Hybrid crack mode.
The crack track line deviates from the pre-fracture line, with coal exhibiting the highest curvature among the three rock types, while sandstone and sandy mudstone have relatively smaller curvatures. This variation can be attributed to the abundance of primary fractures in coal, which easily influence the crack development process. Nevertheless, the crack trajectory lines eventually deviate towards the direction of the concentrated load force. Upon the damage of SCB specimens, new cracks emerge from the tips of pre-fractured cracks, and the deformation fields exhibit symmetric distribution on both sides of the trajectories for type I cracks and hybrid I/II cracks. The displacement and strain fields reveal continuous variation in deformation at the tip of type I cracks and I/II hybrid cracks as the loading force increases. The deformation rate and range of deformation exhibit variations corresponding to the β values.
Analysis of the SCB test results
The relationship between the critical load, Pcr, and the stress intensity factors, KI and KII, of coal under the I/II Hybrid crack mode with different pre-fracture angles, β, of SCB Specimens is illustrated in Figure 13(a). The plot reveals that the critical fracture load, Pcr, of coal exhibits a non-linear trend with respect to the increase in the pre-fracture angle, β, of the SCB specimens. Specifically, as the pre-fracture angle β increases from 0° to 15°, the average critical fracture load of coal rises from 1.84 kN to 2.05 kN. Subsequently, at a pre-fracture angle of 30°, the average critical fracture load reaches its maximum value of 2.45 kN. However, as the pre-fracture angle further increases to 45° and 54°, the average critical fracture load of coal decreases to 1.71 kN and 1.32 kN, respectively.
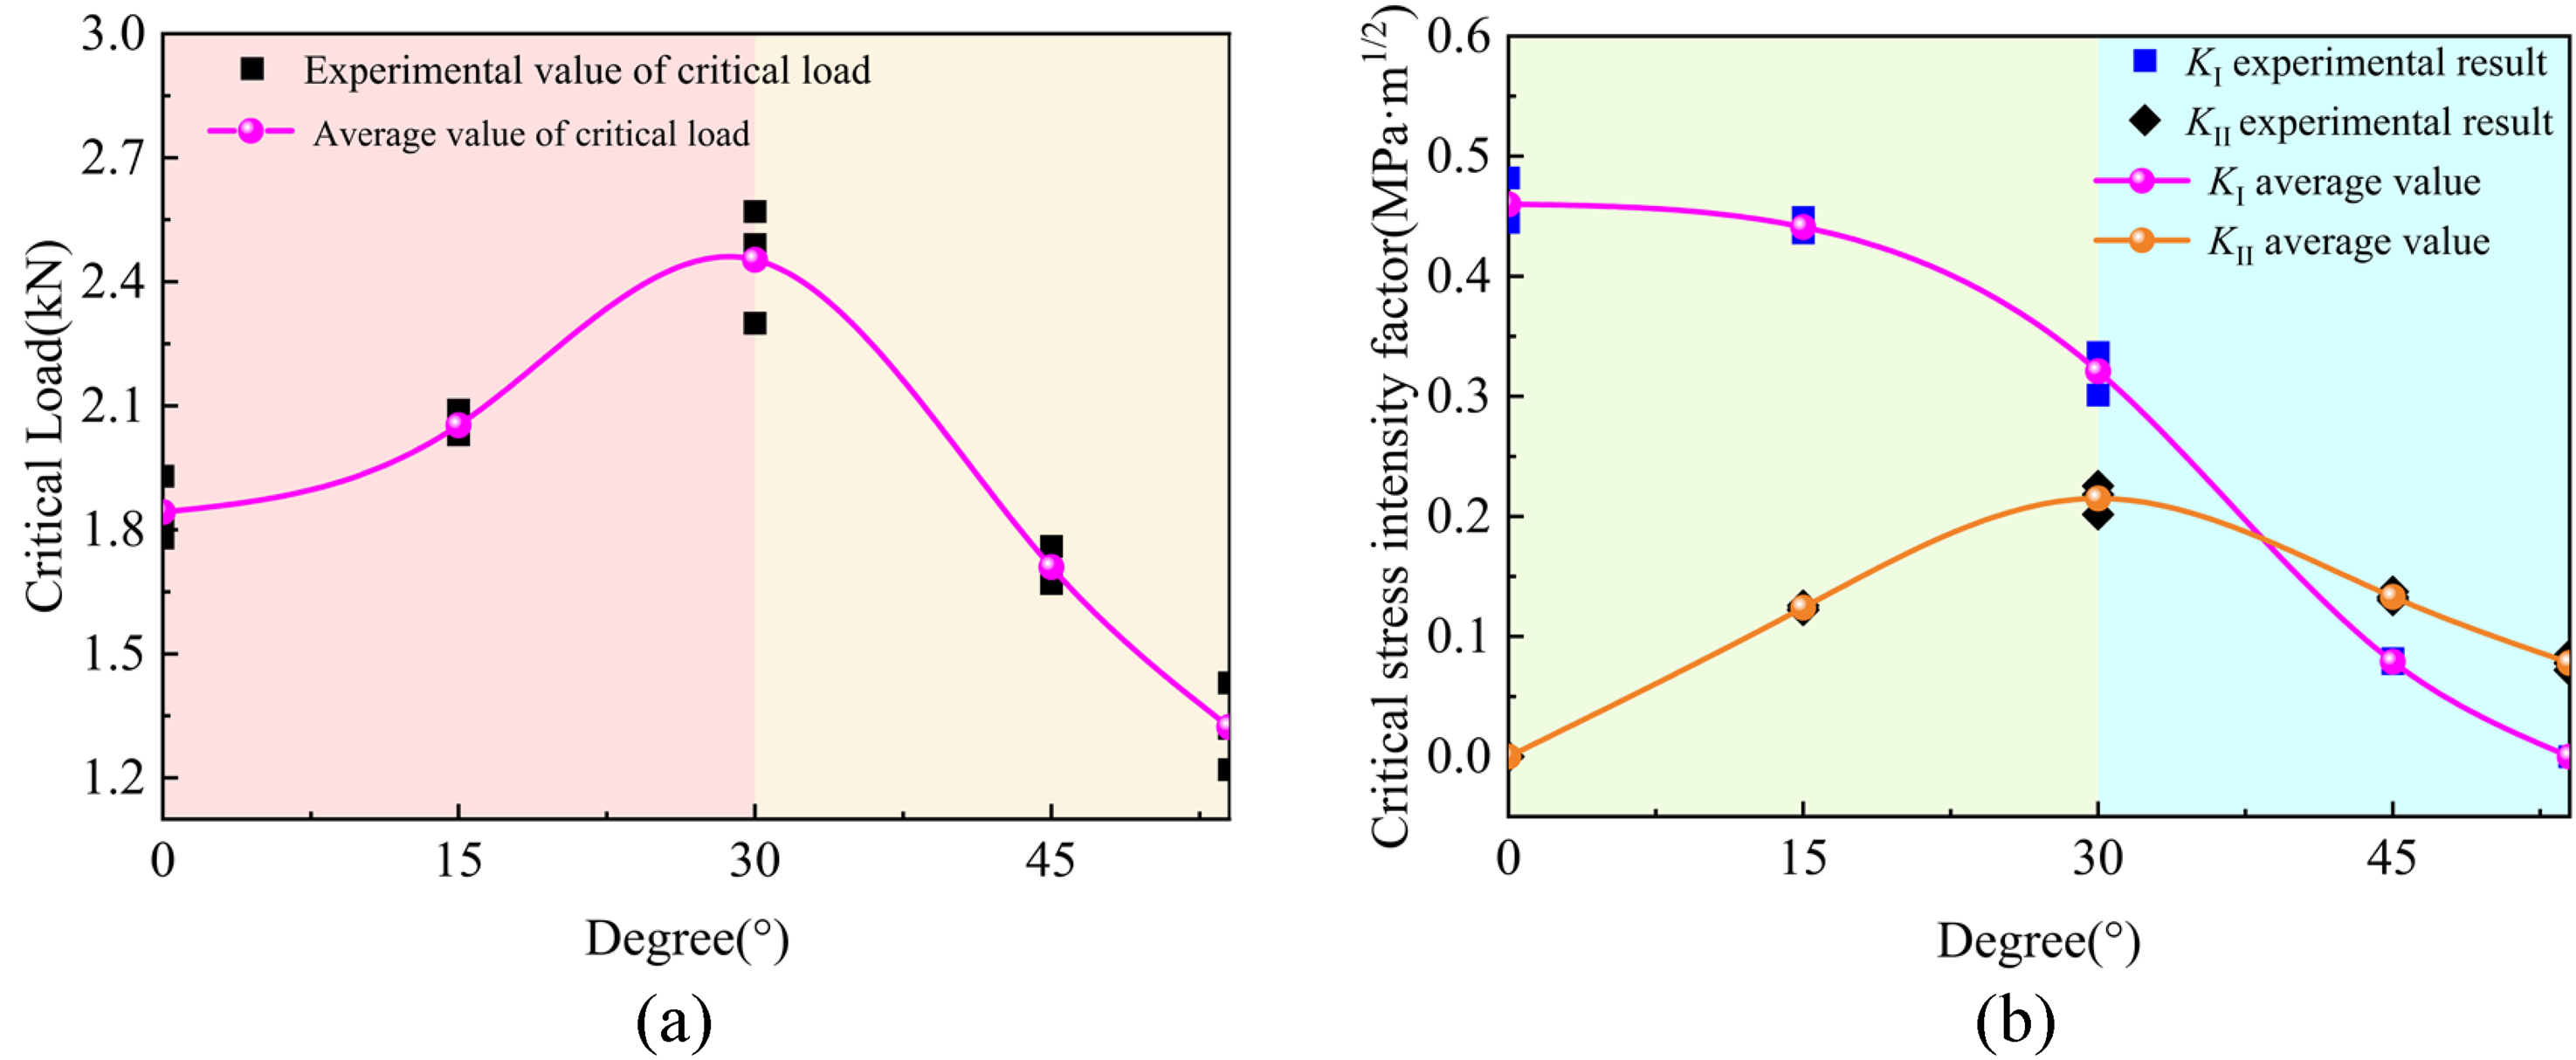
The variation of experimental results for coal. (a) The critical load. (b) The critical stress intensity factors.
The variation relationship between KI and KII of coal with the pre-fracture angle, β, of the SCB sample under the I/II Hybrid crack mode is depicted in Figure 13(b). It is evident that when β=0° and KII = 0, the fracture mode of coal corresponds to a pure type I fracture, characterized by tension damage. As the pre-fracture angle, β, increases, KI gradually decreases while KII first increases and then decreases. Specifically, for β=0°, 15°, and 30°, KI > KII, indicating a dominant tension damage mechanism. On the other hand, for β=45°, KI < KII, signifying the occurrence of mixed cracks. Nonetheless, the damage in coal is primarily caused by type I cracks, indicating tension damage. Interestingly, when β=54°, KI is equal to 0, implying that the fracture mode of coal is not purely type II. Instead, the fracture is predominantly attributed to tensile damage.
The relationship between the critical load, Pcr, and the stress intensity factors, KI and KII, of sandy mudstone under the I/II Hybrid crack mode with various pre-fracture angles, β, of the SCB Specimens is presented in Figure 14(a). It can be observed that the critical load, Pcr, exhibits a trend of initially increasing, then decreasing, and subsequently increasing again with the variation of β. Specifically, as β increases from 0° to 15°, the average Pcr for sandy mudstone rises from 2.1 kN to 2.2 kN. However, when β reaches 30°, the average Pcr decreases to 1.54 kN. Furthermore, for β=45°, the average Pcr continues to decline to 1.45 kN. Interestingly, when β equals 54°, the average Pcr for sandy mudstone shows an increment, reaching 1.72 kN once more.
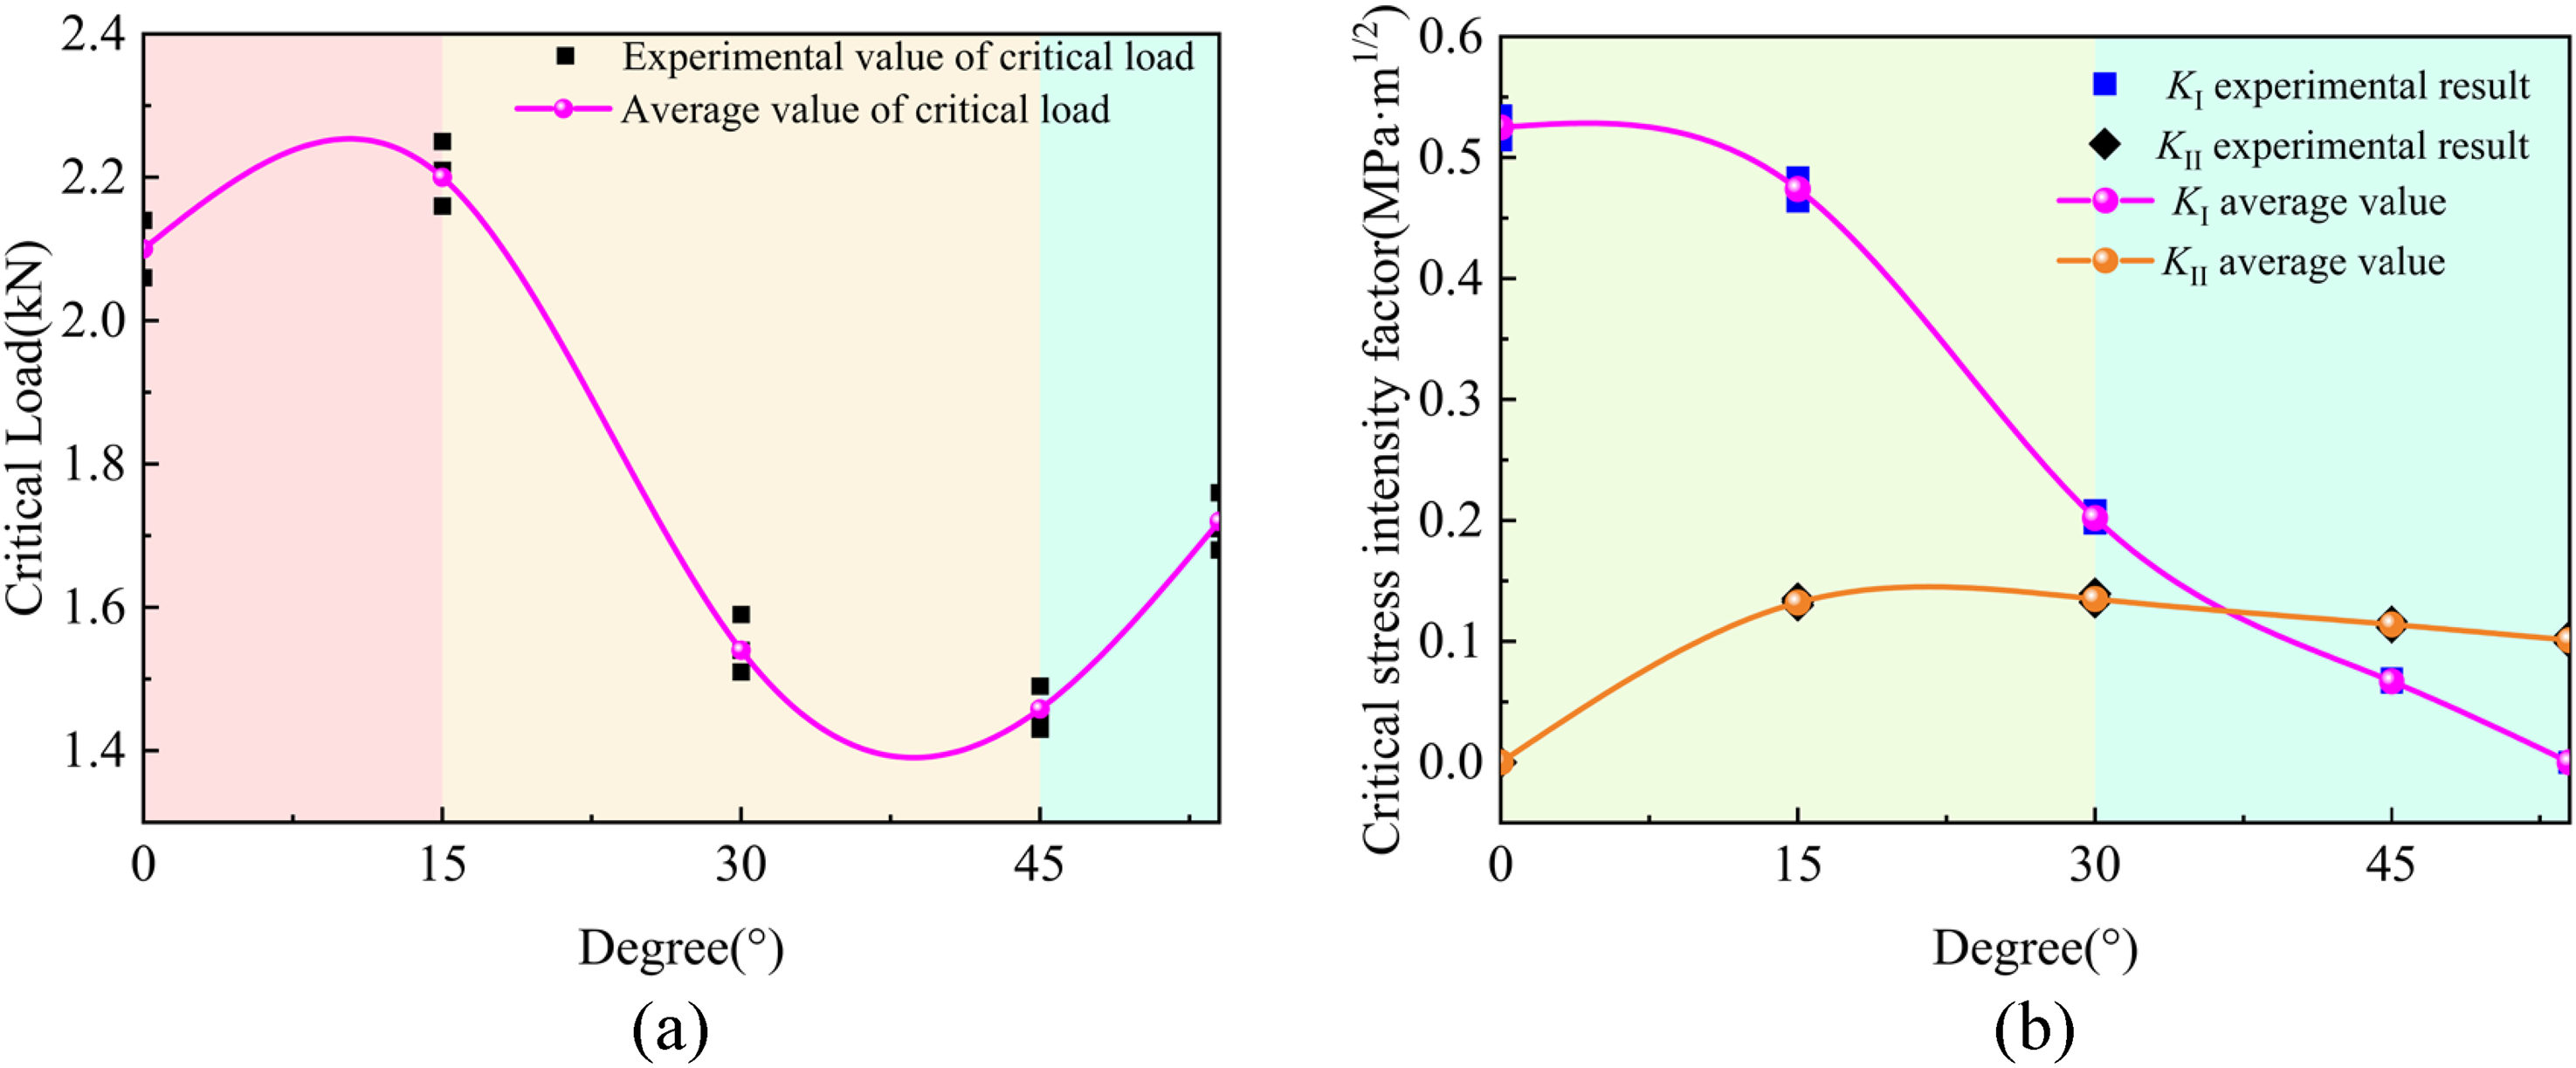
The variation of experimental results for sandy-mudstone. (a) The critical load. (b) The critical stress intensity factors.
The relationship between the stress intensity factors, KI and KII, and the pre-fracture angle, β, of the SCB Specimens for sandy mudstone under the I/II Hybrid crack mode is depicted in Figure 14(b). It can be observed that when β is 0°, KII is 0, indicating that the fracture mode of sandy mudstone is purely type I, characterized by simple tension damage. As β increases, KI decreases gradually, while KII initially increases and then decreases. Specifically, when β is 15° and 30°, KI is greater than KII, indicating a predominance of type I fracture. Conversely, when β is 45°, KI is smaller than KII, suggesting a shift towards a Hybrid crack mode, although type I fracture still dominates. Notably, when β is 54°, KI is 0, indicating that the fracture mode of sandy mudstone is not purely type II, with the fracture primarily caused by tensile damage.
The relationship between the critical load (Pcr) and stress intensity factors (KI and KII) of sandstone under the I/II Hybrid crack mode, corresponding to different pre-fracture angles (β) of SCB Specimens, is depicted in Figure 15(a). It can be observed that the Pcr of sandstone exhibits a gradual increase followed by a rapid growth as β increases. Specifically, the average Pcr of sandstone increases from 3.06 kN to 3.14 kN as β increases from 0° to 30°. Furthermore, the average Pcr increases to 4.95 kN when β reaches 45°, and further rises to 5.45 kN when β reaches 54°.
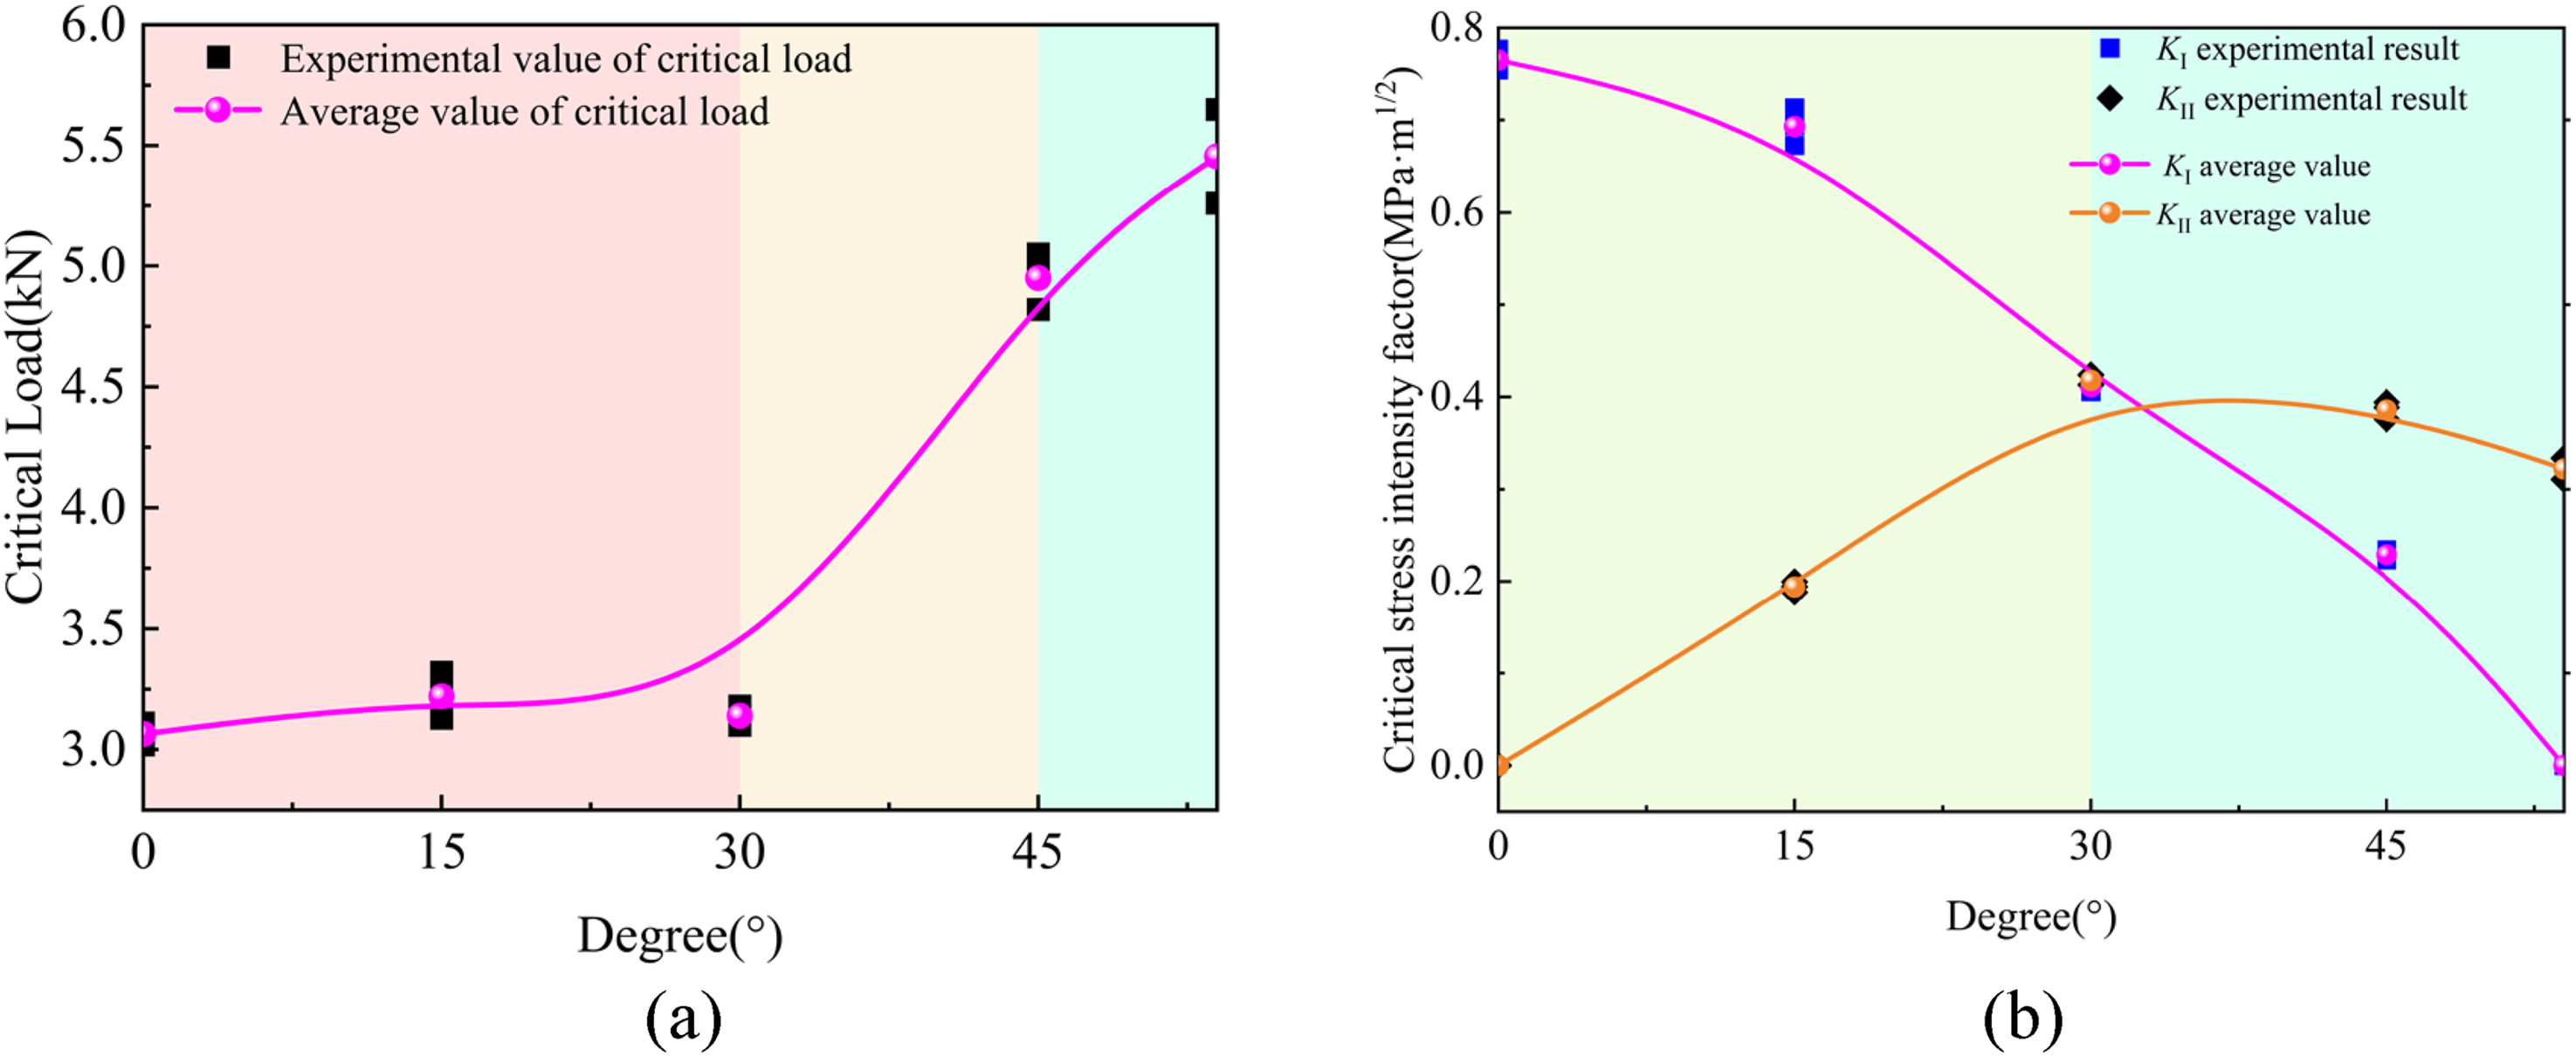
The variation of experimental results for sandstone. (a) The critical load. (b) The critical stress intensity factors.
Figure 15(b) illustrates the variation relationship between KI and KII with β for the sandstone Specimens in the I/II Hybrid crack mode. It is observed that when β is 0°, KII is 0, indicating a pure type I fracture mode characterized by pure tension damage in sandstone. As β increases, the value of KI decreases, while KII initially increases and then decreases. Specifically, when β is 0° and 15°, KI is greater than KII, while when β is 30°, KI is approximately equal to KII, suggesting a Hybrid crack mode where type I fracture predominates in sandstone. Notably, when β is 54°, KI is 0, indicating that the fracture mode of sandstone is not purely type II, with the fracture primarily caused by tensile damage.
Overall, when β is 0°, the fracture mode of coal, sandy mudstone, and sandstone is pure tensile damage caused by type I fractures. When β is 15°, 30°, 45°, and 54°, the fracture mode of these rocks is mainly tension damage caused by type I fractures. Consequently, as β increases, the damage mode transitions from pure tensile damage to mixed tensile-shear damage in coal, sandy mudstone, and sandstone.
Discussion
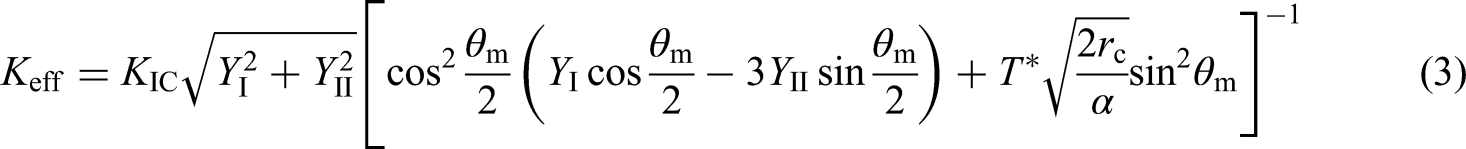
In their study, Ayatollahi and Aliha (Ayatollahi and Aliha, 2004) provided comprehensive data on the values for various pre-fracture angles (β = 0°, 5°, 15°, 30°, 45°, and 54°), specifically for isotropic materials characterized. The investigated rock specimens, namely coal, sandy mudstone, and sandstone, belong to the coal measure sedimentary rock masses. While these rocks inherently exhibit jointing and microfractures due to ground stress and engineering disturbances, coal in particular demonstrates a notable abundance of joints and fractures. However, the utilization of small-sized semi-circular bending (SCB) Specimens and a meticulous selection process involving rocks with more uniformly distributed joints and fissures during sampling and sample processing justify the treatment of coal, sandy mudstone, and sandstone as homogeneous materials in this study. Consequently, the obtained parameters are judiciously applied to Eqs. (1) and (2) to ascertain the fracture toughness values of coal, sandy mudstone, and sandstone under the I/II mixed crack conditions. The hybrid crack toughness (Keff) is then computed using equation (10) and subsequently compared with the experimentally obtained Keff values for a thorough analysis. To visually present the results and facilitate a comprehensive understanding, Figure 16 exhibits the mean fitted curves of Keff obtained from the three-point bending test of SCB Specimens conducted under different pre-fracture angles, accompanied by the modified MTS theoretical value (MMTS) curve. Encouragingly, a substantial degree of agreement is observed between the test results obtained for the three rock types under the I/II Hybrid crack mode conditions and the corresponding MMTS theory curves, reinforcing the reliability and applicability of the MMTS theory in this context.
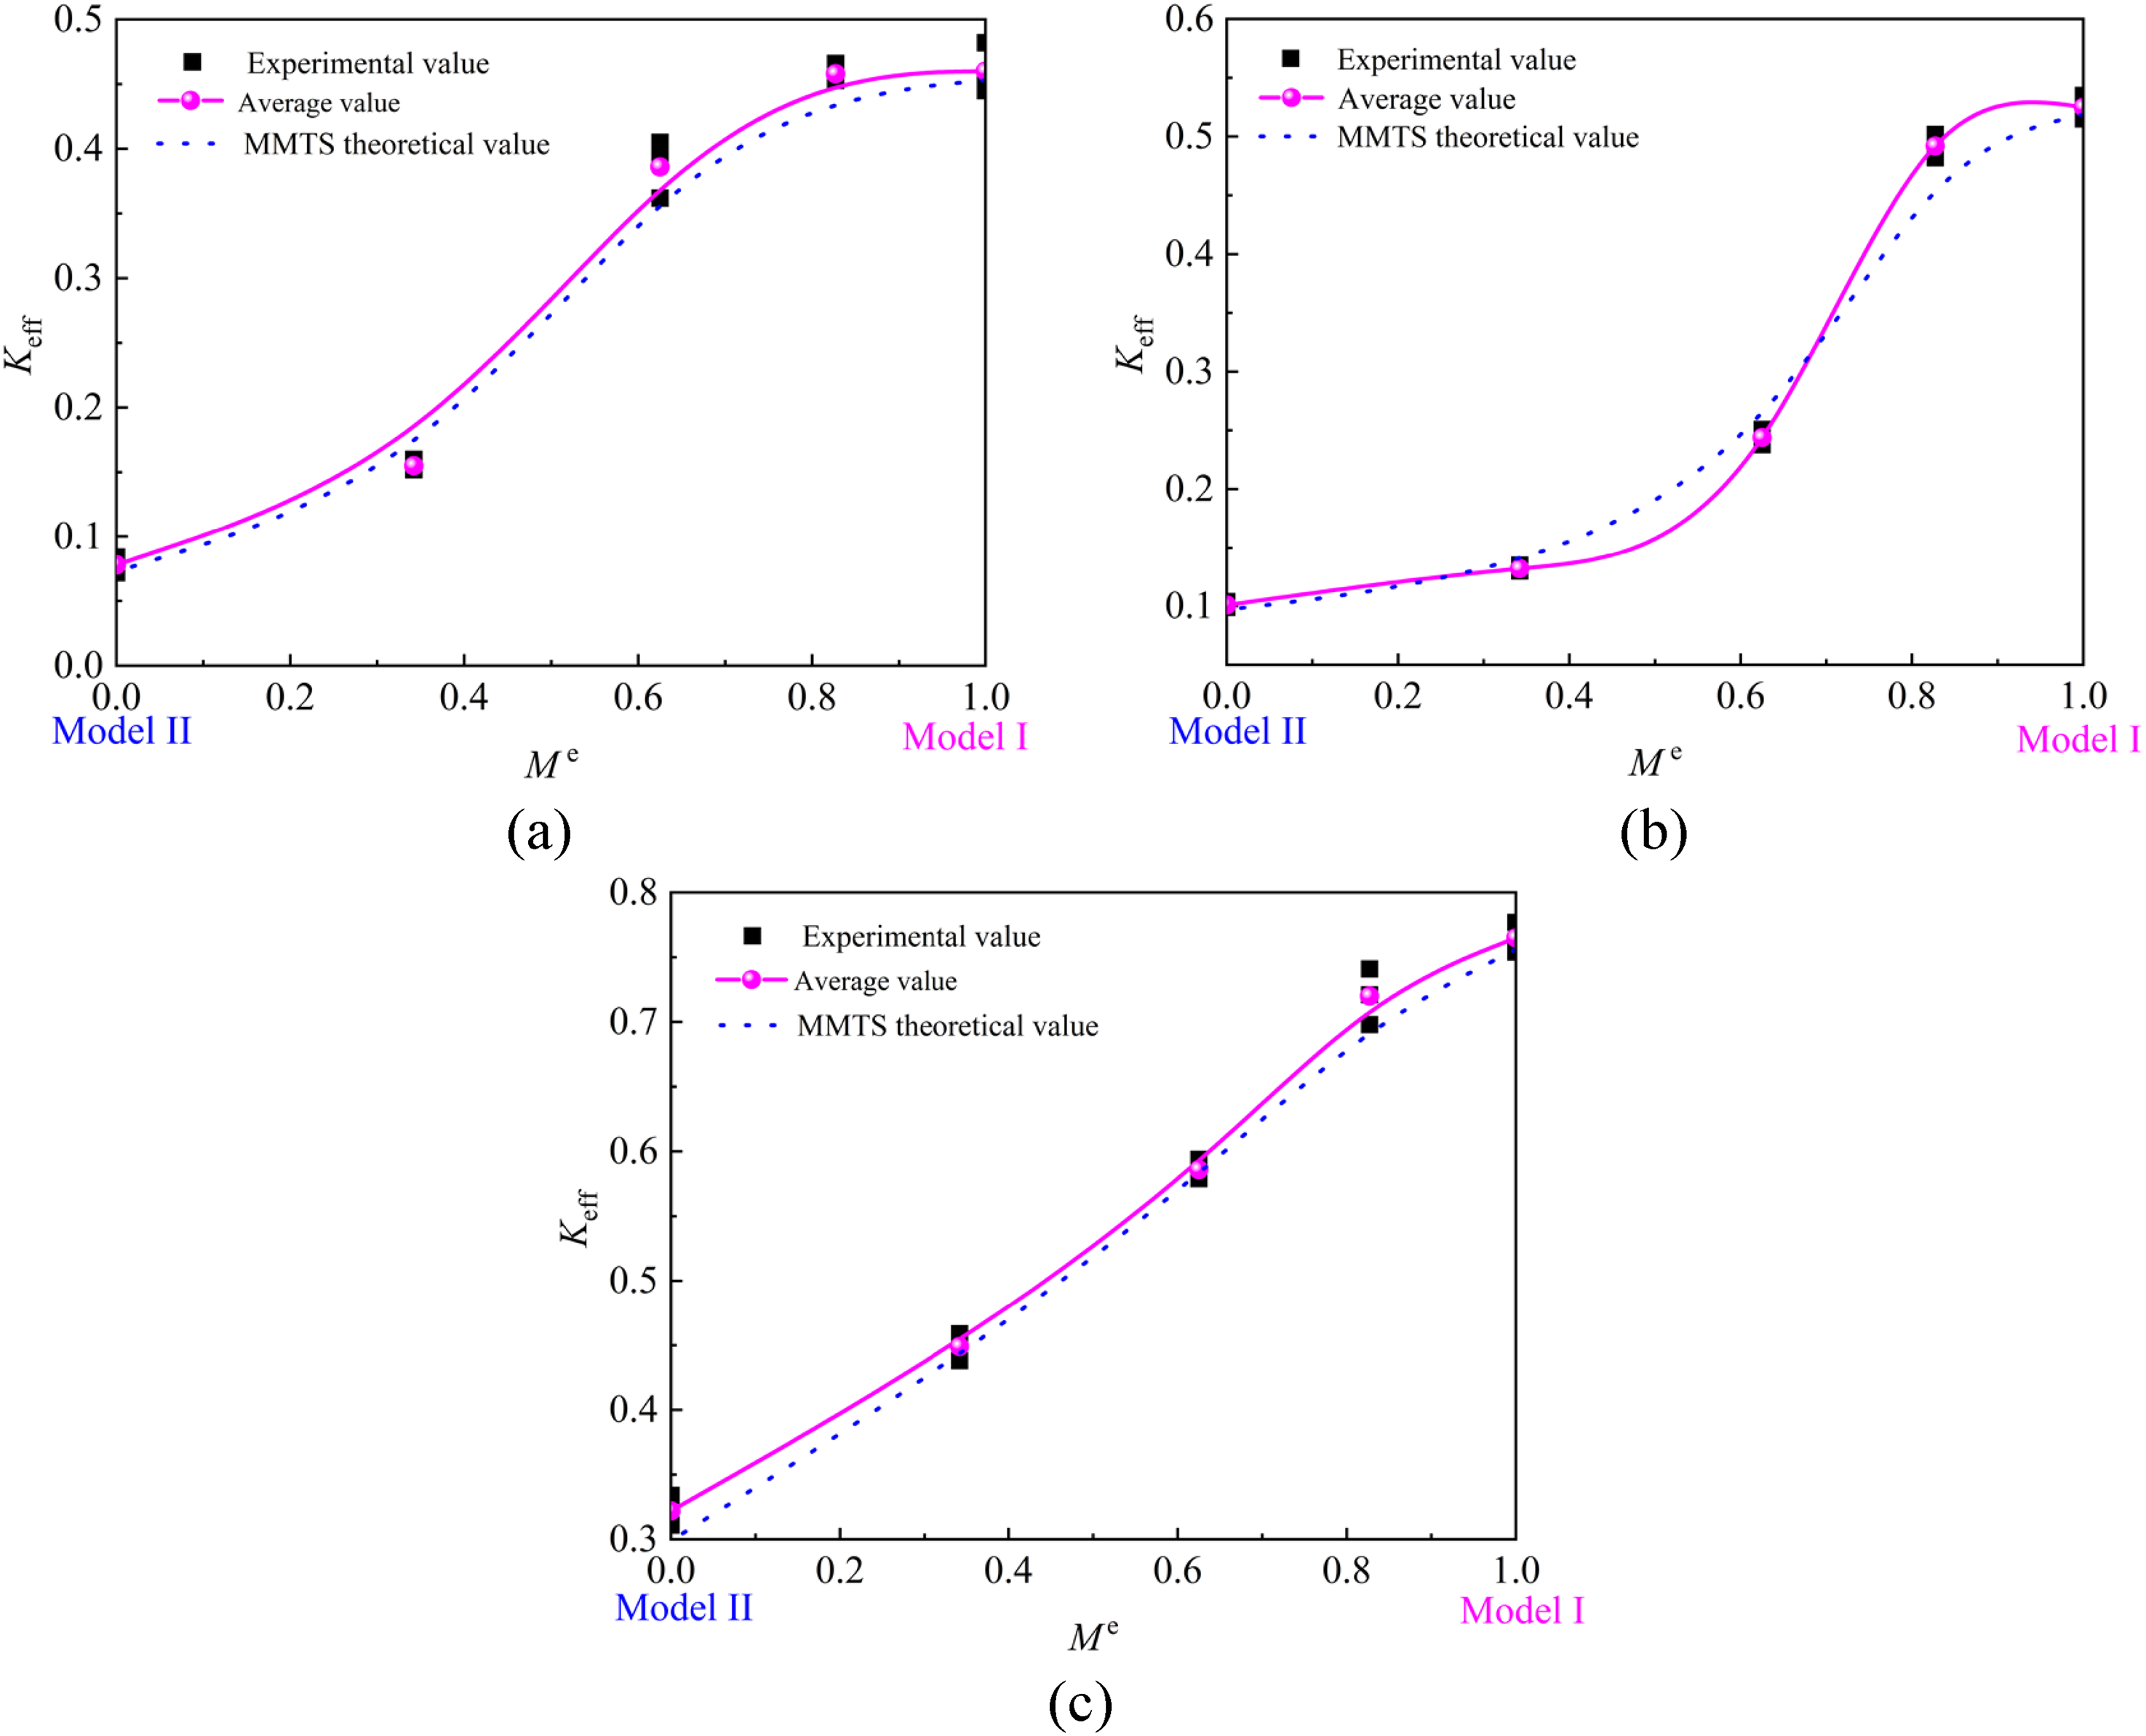
Comparison of Keff values from SCB tests with the theoretical value based on the MMTS criterion. (a) coal. (b) sandy-mudstone. (c) sandstone.
This study investigates the Mode-I, Mode-II, and mixed-mode fracture characteristics and fracture mechanics parameters of three distinct rock types (coal, sandstone, and sandy mudstone) under varying pre-existing crack angles, aiming to understand their differences in fracture mechanical properties. The coal seam exhibits significantly more developed bedding planes compared to sandstone and sandy mudstone - a distinctive feature that substantially influences its fracture mechanical behavior. Due to the challenges in ensuring sample homogeneity in laboratory testing, numerical simulation has been widely adopted as a supplementary approach (Ren et al., 2025; Zhang et al., 2022, 2024). We will further employ numerical simulation methods in subsequent research to deepen our investigation.
This study provides valuable engineering insights into hydraulic fracture propagation mechanisms at coal measure stratum interfaces, addressing the growing research focus on fracture behavior in multi-lithologic layered coal measures - particularly the critical interaction mechanisms between hydraulic fractures and stratum interfaces Ma et al., 2023a, 2025). The experimental results demonstrate that when hydraulic fractures encounter stratum interfaces during propagation through coal-bearing formations, their trajectories undergo significant deviations due to three key factors: interface mechanical properties, interface dip angles, and lithological contrasts across interfaces - all of which substantially influence hydraulic fracturing effectiveness. Since fracture toughness represents a fundamental parameter governing hydraulic fracture initiation and propagation, our systematic investigation of fracture mechanical property variations among different lithologies offers crucial theoretical guidance for both understanding the fundamental mechanisms controlling hydraulic fracture development in coal measures and optimizing target horizon selection for engineering applications, ultimately enabling more effective hydraulic fracturing design in coal-bearing formations.
Conclusions
In this study, the SCB test method was utilized to investigate the behavior of coal, sandy mudstone, and sandstone specimens under I/II mixed-mode fracture conditions, considering various prefabricated crack shapes. The displacement and strain fields in the specimens under different pre-fracture angle conditions were monitored using digital scattering methods, allowing for a comprehensive analysis of their fracture characteristics. The combination of loading force-time curves and acoustic emission signals provided valuable insights into the fracture processes of coal, sandy mudstone, and sandstone, shedding light on the mechanisms governing their occurrence and extension under I/II mixed-mode fracture conditions. Additionally, this analysis enabled the determination of the Hybrid crack mechanical parameters.
The experimental findings revealed a correlation between the critical load (Pcr) and the inclination angle (β) of the cracks. Specifically, the critical fracture load of coal exhibited an initial increase followed by a decrease as β increased. In contrast, the critical fracture load of sandstone showed a gradual and then rapid increase with increasing β. Sandy mudstone displayed a pattern of increase, decrease, and subsequent increase in the critical fracture load as β changed. Moreover, the stress intensity coefficient (KI) for mode I fractures gradually decreased with increasing β, while the stress intensity coefficient (KII) for mode II fractures initially increased and then decreased with increasing β. Analysis of the loading force-time curves and deformation fields of the SCB specimens unveiled a three-stage fracture process consisting of crack sprouting, stable crack expansion, and destabilization damage. Digital Image Correlation Method (DICM) results indicated that new cracks initiated from the tip of the prefabricated crack notch in the SCB specimens of coal, sandy mudstone, and sandstone. These crack trajectories deviated from the prefabricated crack line but ultimately converged towards the direction of the concentrated load, suggesting an attractive effect of the load concentration force on crack extension. The fracture toughness ratios of the three rock types, coal, sandy mudstone, and sandstone, under I/II Hybrid crack mode conditions were subjected to comparison and analysis. The experimental results for the mixed fracture toughness (Keff) were found to be consistent with the predictions derived from the modified maximum circumferential stress theory (MMTS).
Footnotes
Funding
The authors received no financial support for the research, authorship, and/or publication of this article.
Declaration of conflicting interests
The authors declared no potential conflicts of interest with respect to the research, authorship, and/or publication of this article.
Data availability statement
Data is available on request from the authors.