
Abstract
The small punch test initially used mainly in the nuclear sector proved to be an efficient method of estimating the mechanical properties of materials, including fracture toughness. In general, the fracture toughness is estimated based on a correlation with equivalent biaxial fracture strain. However, the latter depends on knowing the onset of the unstable fracture. In this article, the acoustic emission technique is used within the small punch test for estimating the unstable fracture initiation and determining the corresponding punch displacement from the load–displacement curve. Although, the acoustic emission signal can be slightly altered due to the location of the sensor, the results confirm the potential of the acoustic emission technique for detecting the onset of the unstable cracking and thus accurately estimating the equivalent biaxial fracture strain. The accumulated energy during the small punch test is one of the relevant acoustic emission parameters in estimating the fracture onset since it can be associated with the accumulated strain energy released by the deformed material.
Introduction
The nuclear power industry utilises steel materials in the construction of safety critical structures such as reactor high pressure vessels due to their excellent mechanical properties under irradiation and high temperature, including creep resistance and high thermal conductivity. However, the material properties can degrade under the radiation and thermal-mechanical cycle. It is therefore essential to monitor the degradation of mechanical properties to reduce the risk of failure and protect lives. Moreover, due to the changes in properties resulting from irradiation, the traditional mechanical tests such as uniaxial tensile and creep tests, hardness, fracture toughness and V-notch testing need to be conducted on in-service material1,2 and traditional methods require large volumes of material. This is evidently not practical due to the specimen size and as so the use of a small punch test (SPT) is an active research area.
Manahan et al. 3 have introduced the SPT to determine the mechanical behaviour of unirradiated and irradiated materials. This approach allows small volumes of material (8-mm disc of thickness less than 1 mm) which would not severely affect and damage an in-service component. A typical SPT is presented in Figure 1.
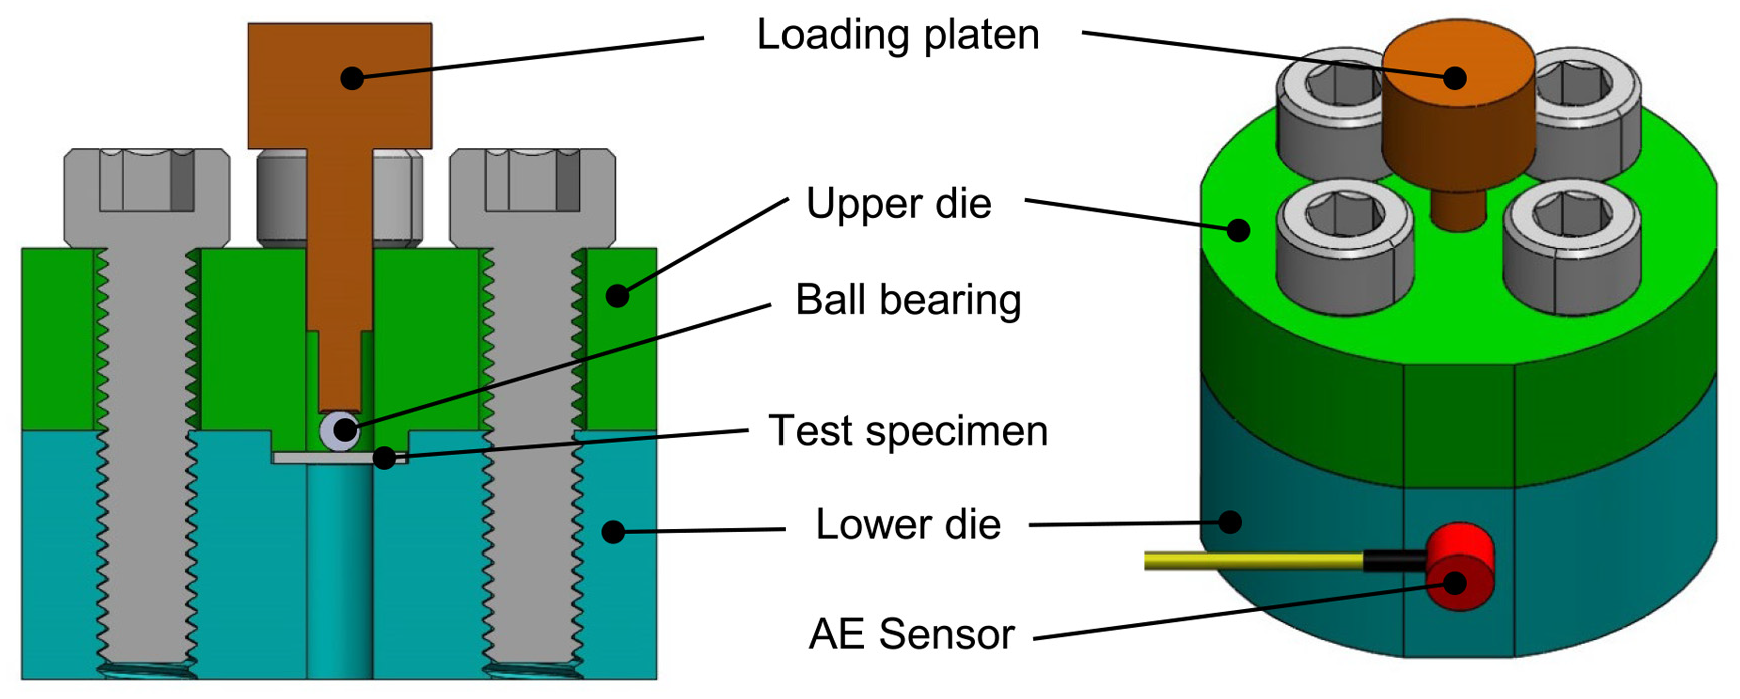
Small punch test rig.
SPT has been used to evaluate a wide variety of mechanical properties of steel materials. A standard procedure for mechanical properties evaluation of metallic materials by small punch testing was launched by Bruchhausen et al. 4 Also, considerable efforts have been made to standardise a small punch creep (SPC) methodology by carrying out an inter-laboratory testing programme and respectively preparing within the European Committee for Iron and Steel Standardisation a draft standard EN. 5 Three assessment methodologies for describing the equivalent stresses in SPC tests were analysed by Holmstrom et al. 6 for three different steels. The prediction of equivalent stress value is highly dependent by the accuracy of measuring the total deflection in SPC testing. There was also found a correlation between minimum deflection rate and the inversed time to rupture in SPC which is material independent. Dobes and Milicka 7 investigated the relationship between SPT results and creep results. Based on an empirical comparison of experimental results, it was found that the ratio of force from SPTs to stress from tensile creep tests decreases with increasing time to rupture. Also, a ratio between the minimum deflection rate from SPC and minimum creep rate from tensile creep tests was found to be highly dependent on temperature and time to rupture. Isselin et al. 8 made a comparison between SPT and ball indentation tests to determine the material tensile constitutive law of 15 MnMoV steel with a banded ferrite–bainite structure. An inverse method based on finite element simulation of an SPT was used to find the two parameters of Hollomon’s constitutive law. Yu et al. 9 investigated the use of SPT and acoustic emission (AE) technique for stress corrosion cracking of a high-strength steel. The fracture energy and the stress corrosion cracking susceptibility of specimens in the SPT are dependent on the loading rates in the synthetic sea water environment.
A typical SPT load–displacement curve on ductile materials maintains certain characteristics. There is a linear elastic region (Zone I), followed in Zone II by plastic bending extending over the entire sample as the load increases. Most of the deformation occurs in the region of ductile membrane stretching behaviour (Zone III), while ahead of the maximum load, failure micromechanics are observed, leading to necking and a visible crack formation (Zone IV). This is considered the plastic instability failure stage, Figure 2.
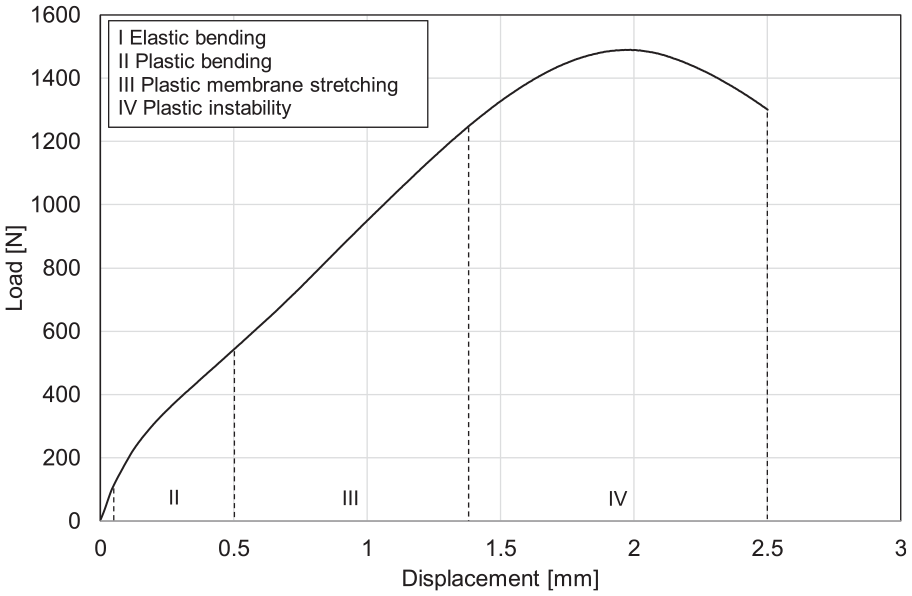
Four stages of specimens’ deformations.
In addition, research has been carried out into how the SPT can be used to calculate or rather estimate the fracture toughness of the material. 11 Mao et al. 12 authored one of the earliest papers exploring the use of the SPT to evaluate the fracture toughness. In their work, the fracture toughness was related to the biaxial fracture strain, which can be determined from the SPT. A linear relationship has been found between the fracture toughness and biaxial fracture strain that can be represented by equations (1) and (2)
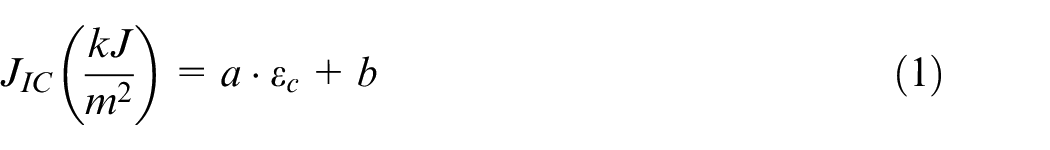
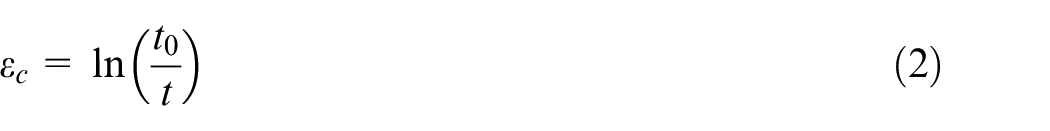
where a and b are the constants related to the material properties and the specimen dimensions, respectively, εc is the biaxial fracture strain, t0 is the initial thickness of the specimen and t is the thinnest thickness at failure, Figure 3.
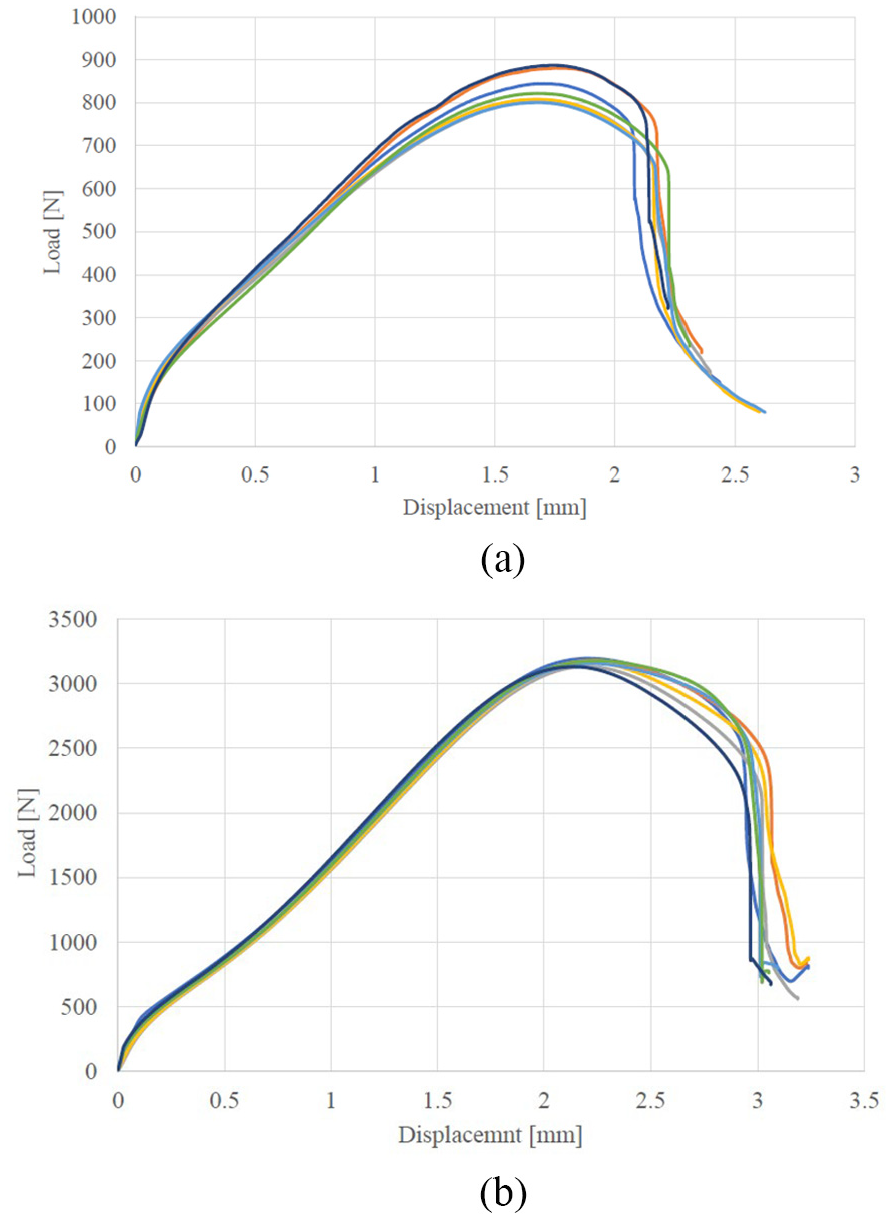
The load–displacement curves from small punch tests. (a) 5251 aluminium specimens and (b) 316 stainless steel specimens.
The relationship (1) has been extensively explored for a variety of metallic materials including aluminium alloys. 13
The biaxial fracture strain can also be calculated from equation (3)
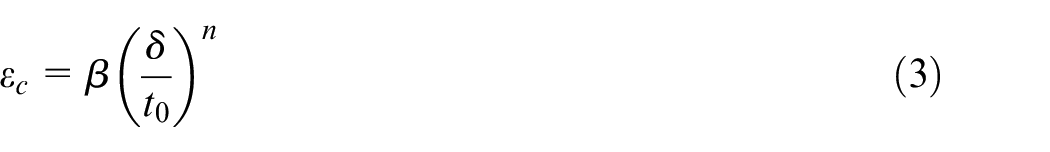
where δ is the SPT displacement at the point of fracture and β and n are the constants dependent on material and test setup, respectively.
Equation (3) provides a more direct way of measuring the biaxial strain directly from the SPT load–displacement curve if the point of fracture is known. Equation (2) does not require knowledge of the point of fracture, but to obtain the required measurements, the specimen needs to be cut into half, set it in resin and then analysed using a scanning electron microscope (SEM). This process consists of many time-consuming steps. However, the downside of equation (3) is that the constants are different depending on the test environment and material. Also, it assumes knowledge of when the fracture occurs. This is not easily acquired from the load–displacement curve, and thus, the displacement at maximum load is often used in such calculations. Combined with the finite element method, SPT proves to be a highly efficient method in fracture toughness evaluation.14–16
A further approach to identify the onset of fracture is AE. The AE technique is often reported for uses including mechanical behaviour of materials, structural integrity assessment and structural health monitoring. The AE phenomenon is based on the released energy caused by damage processes (e.g. cracking, plastic deformation), which travels as a stress waveform through the body of the material. The AE waves cause microscopic vibrations along the material surface which can be captured by a piezoelectric sensor and converted into an electrical signal.
The difficulty with using AE detection with the SPT is that usually a piezoelectric sensor will be attached to the surface of the specimen being tested. However, due to the dimensions of the SPT and the nature of the test, the sensor cannot be attached directly to the specimen. The sensor must be attached to the SPT rig which introduces a more complex geometry into the process of detecting and capturing the AE signals. However, Kasiviswanathan et al. 17 carried out promising work which could lead to the equivalent biaxial strain being calculated more accurately by using AE detection alongside the load–displacement curve. Using the root mean square (RMS) voltage from AE recordings, this work highlighted the usefulness of AE detection during an SPT to determine the mechanical properties of a material. It is also a possibility therefore that AE can be used with the SPT to detect certain points of interest to aid in the calculation of the fracture toughness. Budzakoska E et al. 18 sought to find the correlation between the equivalent biaxial fracture strain and the fracture toughness for 6061 aluminium. Using a system of two charged-coupled device (CCD) cameras attached to the SPT setup, it was observed that the displacement at fracture occurred before the maximum load in the tested aluminium alloy, in contrast to certain steels. Thus, further work with AE could be used to investigate this claim and to inform the fracture toughness calculations.
In this article, AE technique is used in small punch testing of two ductile materials. Steel and aluminium alloy specimens were tested to evaluate the equivalent biaxial fracture strain. Also, AE accumulated absolute energy in correlation with the load–displacement curve was used to identify the fracture initiation point.
Experimental procedure
An SPT test rig was manufactured based on the design and dimensions of Ule et al. 19 and as shown in Figure 1. The rig had three flats machined vertically (Figure 1), to allow for the rig to be clamped in place and to provide a flat area for mounting an AE sensor. Test specimens of 316 stainless steel and 5251 aluminium alloy of thickness 0.7 mm and diameter 8 mm were laser cut from a larger sheet. It is acknowledged that this would not be the approach for specimen preparation in industry. To ensure that specimens were not adversely affected by the laser cutting, hardness tests were completed across the diameter of an aluminium and respectively steel specimen. The hardness test was completed using an Innovatest hardness-testing machine with a load of 5 kgf and an impression time of 15 s.
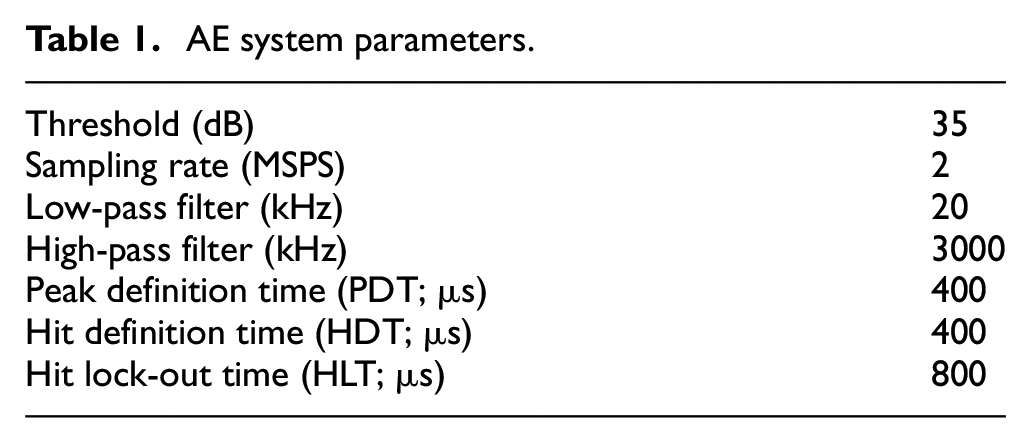
A Mistras Pico AE sensor (frequency range: 200–750 kHz, resonant frequency: 250 kHz) was bonded to the SPT rig using cyanoacrylate, which also acts as a couplant. The sensor was selected due to its small diameter and broad frequency response. A Mistras Express-8 AE system was used to capture collected AE data. The AE system collected hit data (individual signals), waveforms and load and displacement data (Table 1). A pencil lead fracture adjacent to the sensor, in line with ASTM E976, was used to ensure the sensor was mounted correctly. A Zwick Z50 50-kN screw thread universal testing machine connected to an Applied Measurements Ltd. 5-kN load cell was used for all experiments. A series of tests were completed at a load rate of 0.5 mm/min. Load and displacement data were recorded by the load machine at a frequency of 1 Hz.
AE system parameters.
To complete an SPT, a disc specimen was mounted into the recess on the lower die. The upper die was then positioned, so the three flats were inline. Socket head cap bolts were then tightened with a calibrated torque driver to 6 N m to ensure a consistent clamping force through all experiments. A steel ball bearing of diameter 2.5 mm was positioned below the loading platen (Figure 1). The ball material is a high-carbon chrome bearing steel quenched and tempered with very high strength (1370-MPa yield strength and 1570-MPa tensile ultimate strength) and hardness (697–830 HV) properties. The SPT rig was then secured in a machining vice clamped within the load machine. The test was completed when a significant drop in load was observed, at which point specimens were removed from the rig and labelled for further inspection. Also, after each test, the ball was carefully examined without observing any damage.
On completion of all testing, six specimens (three steel and three aluminium samples) were analysed using an SEM. The specimens were cut through the diameter using wire electrical discharge machining (EDM), prior to being mounted in resin. Once mounted, the specimens were polished and inspected using a Zeiss SEM. SEM images were used to investigate the fracture zone and thickness measurement in the fracture area, respectively.
Results and discussion
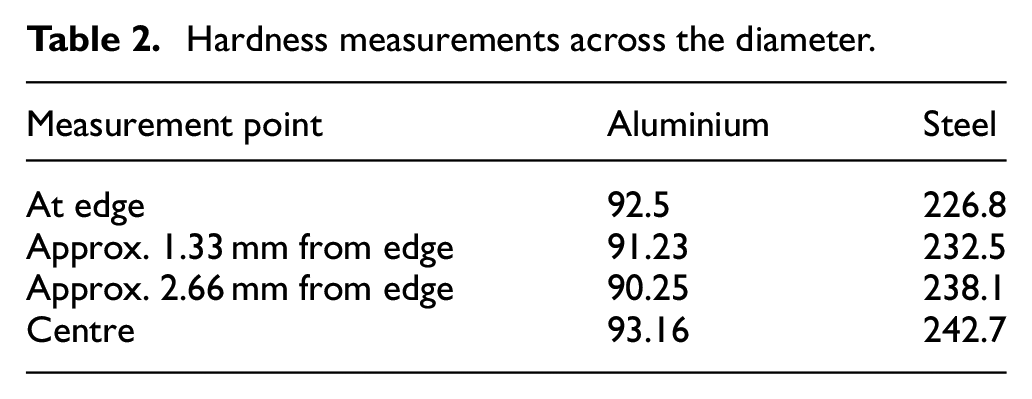
Hardness tests were carried out at three arbitrary positions on the steel and aluminium specimens. The mean values of Vickers hardness are 90.8 HV for aluminium and 244.5 HV for steel specimens. Further hardness measurements were carried out across the diameter. A reading was taken from the edge, then at two points towards the centre before another reading was taken from the centre. The results can be seen in Table 2 and demonstrate that the laser cutting process has a very small impact (reduction in hardness of 6.5%) at the specimen’s edge. Figure 3(a) and (b) present the load–displacement curves from the SPT of aluminium and steel specimens. The curves show a behaviour similar to that observed in the SPTs and described by the four areas indicated in Figure 2. The test results have a good repeatability and consistency in the case of both materials. Only the aluminium results display a slight scatter around the maximum load, which is due to the inhomogeneous character of the aluminium alloys.
Hardness measurements across the diameter.
The AE accumulative energy function of the displacement of the punch during the tests is given in Figure 4(a) and (b). Apart from the dispersed character, the curves have a ‘step like’ variation, similar to the usual AE in mechanical behaviour of materials. The AE accumulative energy encompasses the energy of the acoustic signal captured by the sensor during testing. This energy of the acoustic signal includes the accumulated strain energy coming from elastic deformations, the released strain energy that comes from plastic deformation or ductile fracture initiation in tested specimen, but it can include kinetic energy components from the other sources outside the tested specimen (e.g. vibrations from the universal testing machine, friction between the contact surfaces, waves travelling through the SPT rig). Except for the elastic-plastic deformation of the sample (where the strain energy comes from), the other energy generating mechanisms are produced differently from one test to another. Moreover, these mechanisms are difficult to identify within the AE signal. All these reduce the degree of repeatability of the acoustic signals, explaining the variations in Figure 4(a) and (b). For this reason, the AE accumulative energy cannot be quantified in value, but its variation can provide information regarding the fracture initiation.
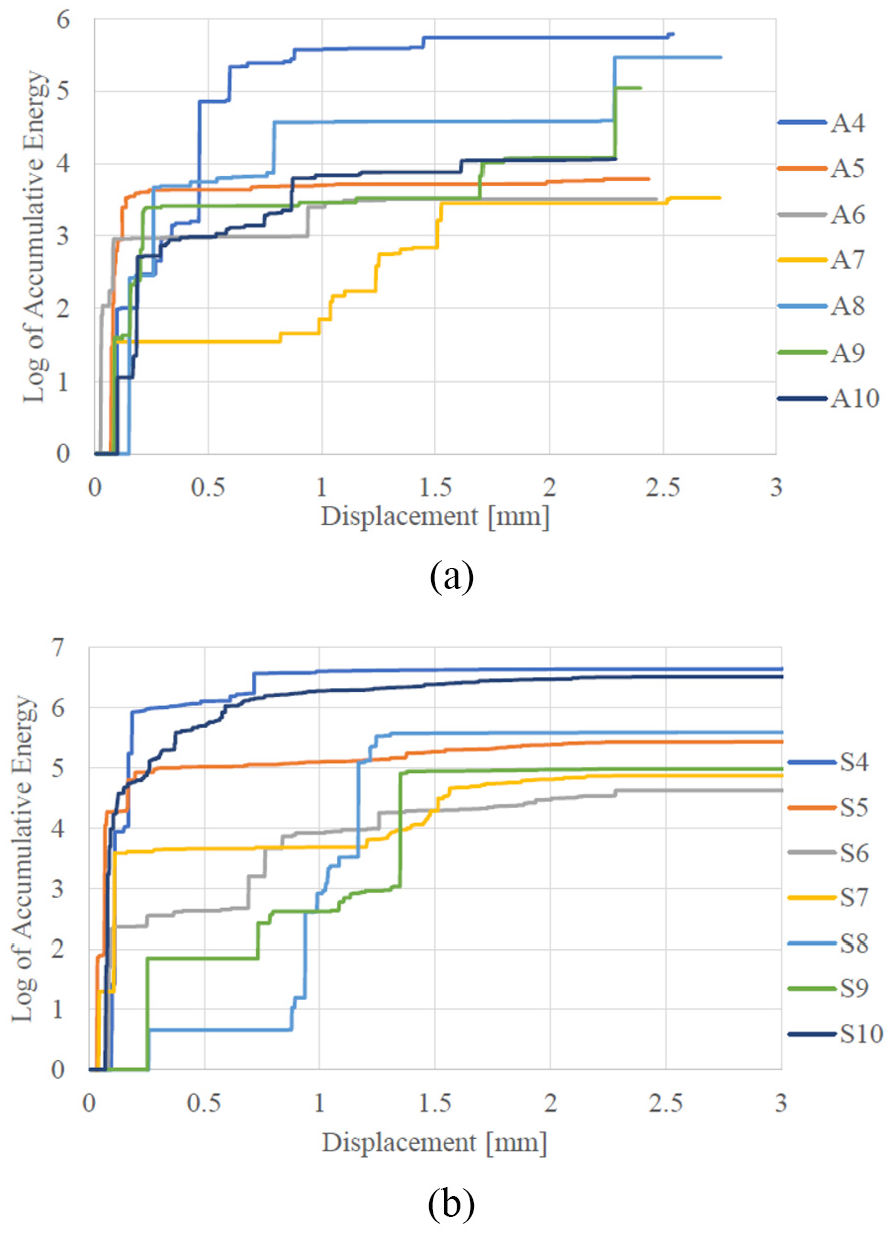
The AE accumulated energy in small punch tests. (a) 5251 aluminium specimens and (b) 316 stainless steel specimens.
Figure 5(a)–(c) depicts the load–displacement curves for specimens A4, S5 and S9, respectively, with the accumulative absolute energy plotted against the displacement on a secondary axis. They demonstrate the three main categories of AE data collected during the SPT. The accumulated absolute energy curve of A4 in Figure 5(a) displays a step-like shape. This was observed in all aluminium samples. It consists of significant steps in the absolute energy with definitive ‘quiet’ periods disturbed only by hits of small plastic energy waves. Figure 5(b) demonstrates an accumulative absolute energy curve (S5) which is constructed by a series of small steps. There are no signals which have a significant larger absolute energy than others. The third category is represented in Figure 5(c) and was observed only for specimens S8 and S9. In this case, one hit has a much larger absolute energy than any of the others detected during the SPT.
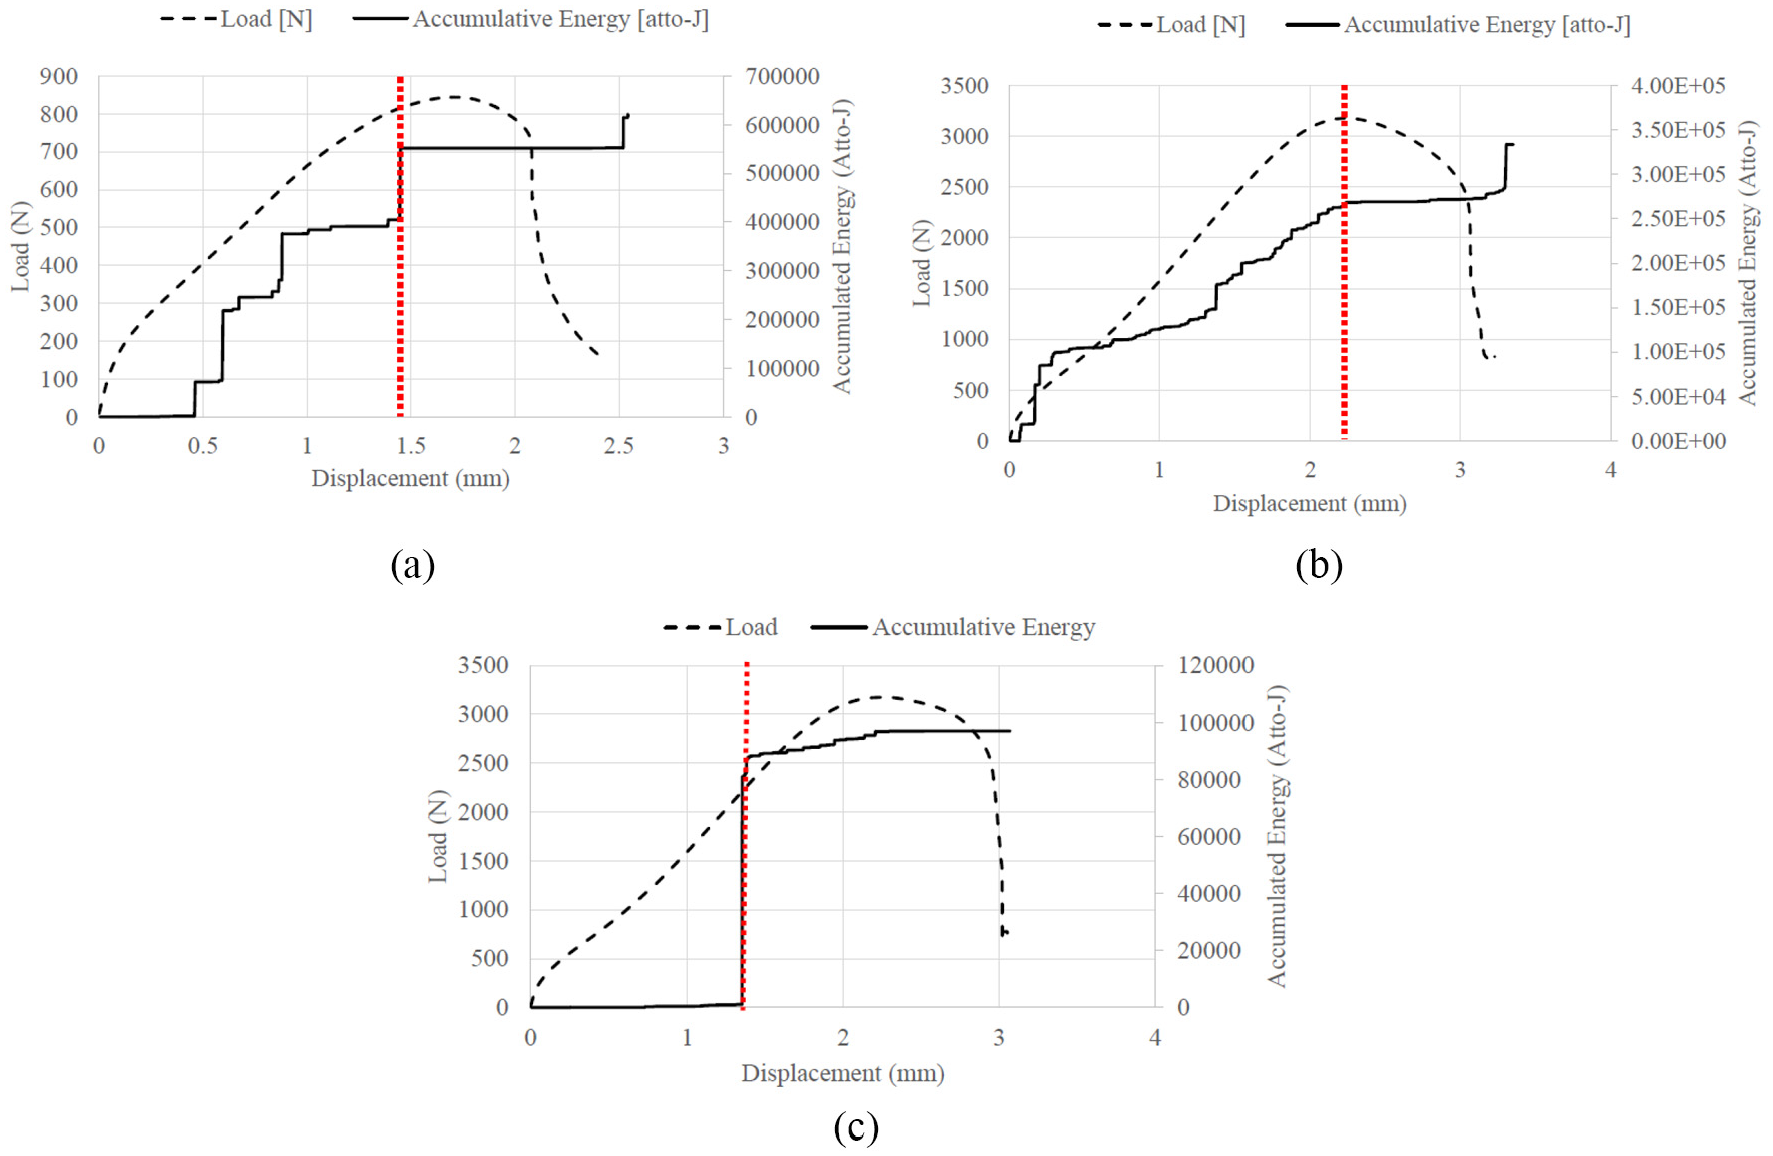
The load–displacement curves and AE accumulated absolute energy in SPT. (a) A4 sample, (b) S5 sample and (c) S9 sample.
The only commonality between the three figures is the final shelf (or ‘quiet’ period) in the accumulative absolute energy approaching the maximum load point. This could be due to the material failing having cracked. It might also be the start of the plastic instability deformation typically expected as the SPT approaches the maximum load point. The point at which this occurs will be taken as the fracture point in the following analysis.
The assumed displacement to fracture indicated by AE data (dotted line on Figure 5(a)–(c)) was used in comparison with displacement at maximum load to evaluate the equivalent biaxial fracture strain. The results are given in Table 3.
The equivalent biaxial fracture strain calculations.
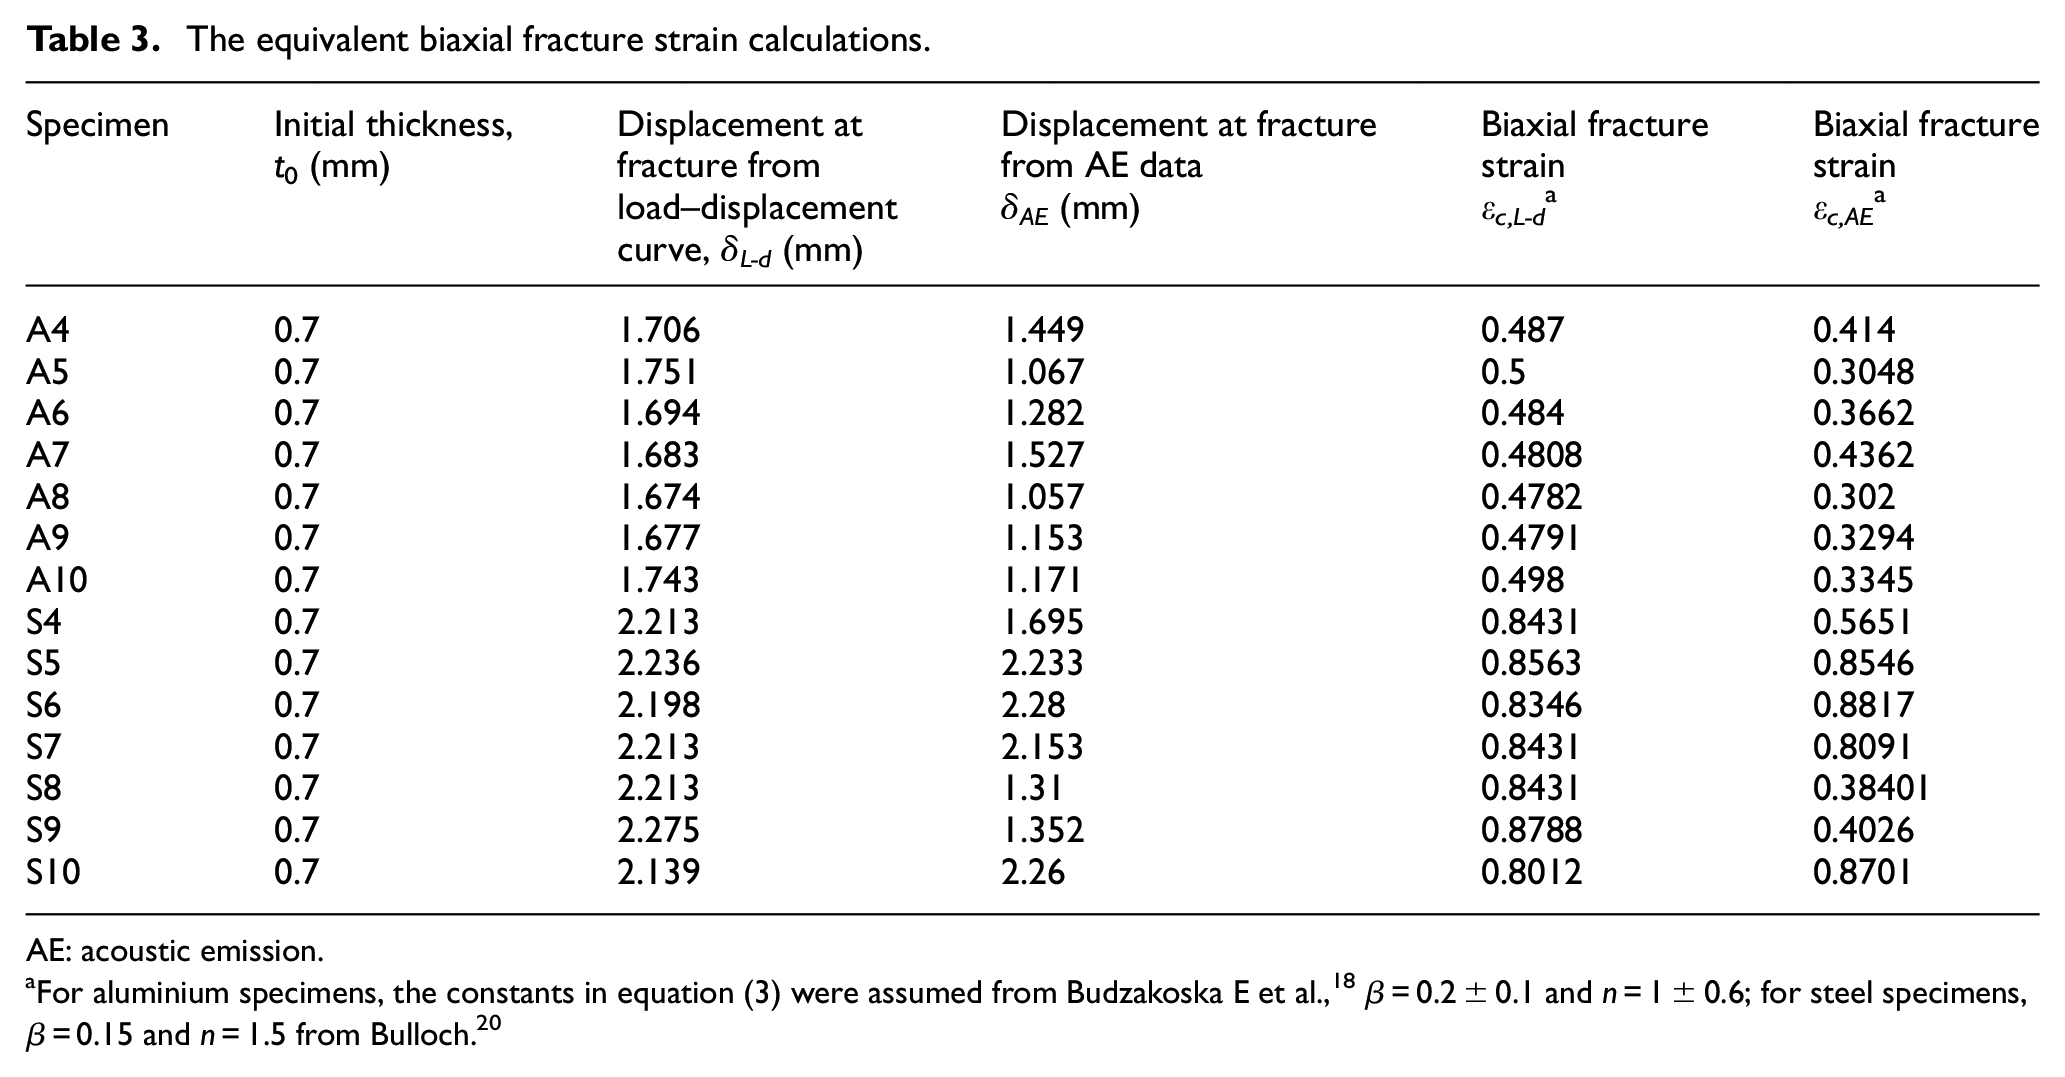
AE: acoustic emission.
For aluminium specimens, the constants in equation (3) were assumed from Budzakoska E et al., 18 β = 0.2 ± 0.1 and n = 1 ± 0.6; for steel specimens, β = 0.15 and n = 1.5 from Bulloch. 20
Two samples of aluminium and steel, respectively, were analysed after small punch testing by SEM, to determine the thinnest thickness in the fracture area, Figure 6.
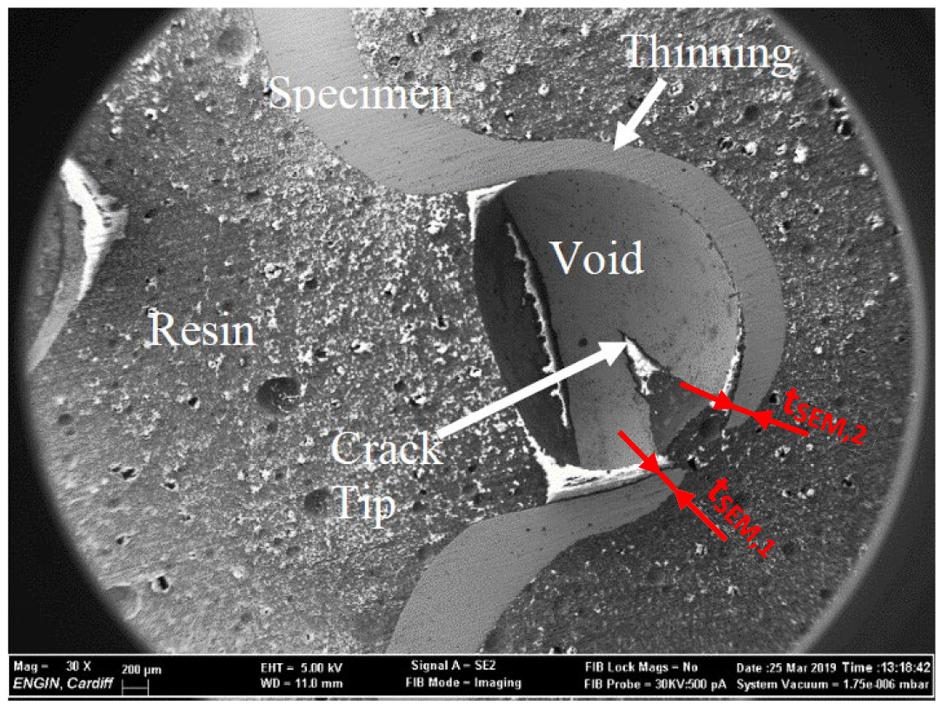
The SEM image of small punch tested specimen.
Thinning is clearly visible on the sides of the specimen which results in the top and bottom caps illustrated by Budzakoska et al. The crack propagation path is visible, and its origin is seen to coincide with the thinning of the specimen. It can be deduced that during the SPT, the sample reduces in thickness until it reaches a critical thickness at which it cannot withstand the resulting stress, leading to failure. For the following analysis, the thickness before the final step reduction in thickness was taken as the thickness at fracture. The first and second readings (indications 1 and 2 in Figure 6) were taken from the bottom and top caps, respectively. Both values were used in equation (2) to calculate an equivalent biaxial fracture strain value. The results can be seen in Table 4.
The equivalent biaxial fracture strain calculations from SEM images.
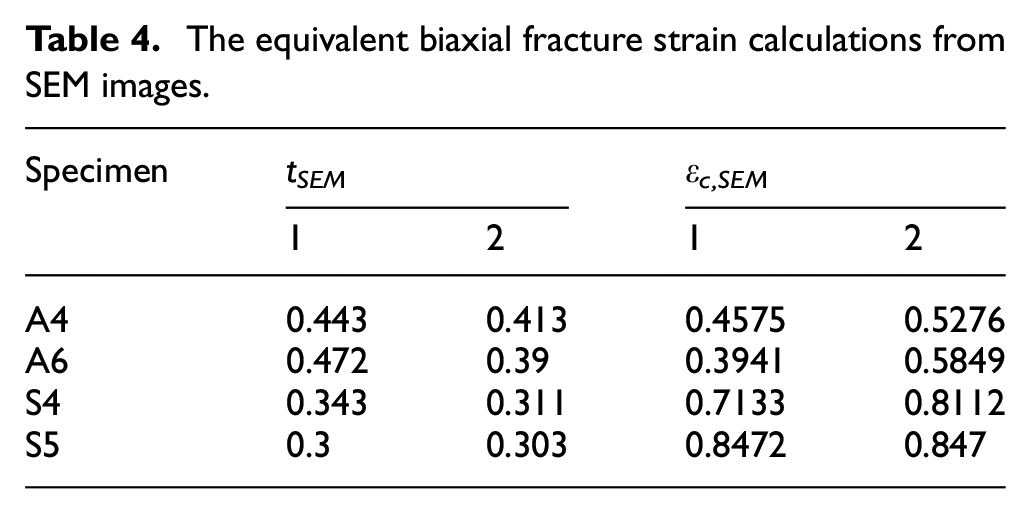
Although it is difficult to determine the thinnest thickness in the fracture zone, especially for materials with high ductility, the results have a good consistency. The thickness measured on the bottom part and the resulting biaxial fracture strains are compared with the results presented in Table 3, Figure 7.
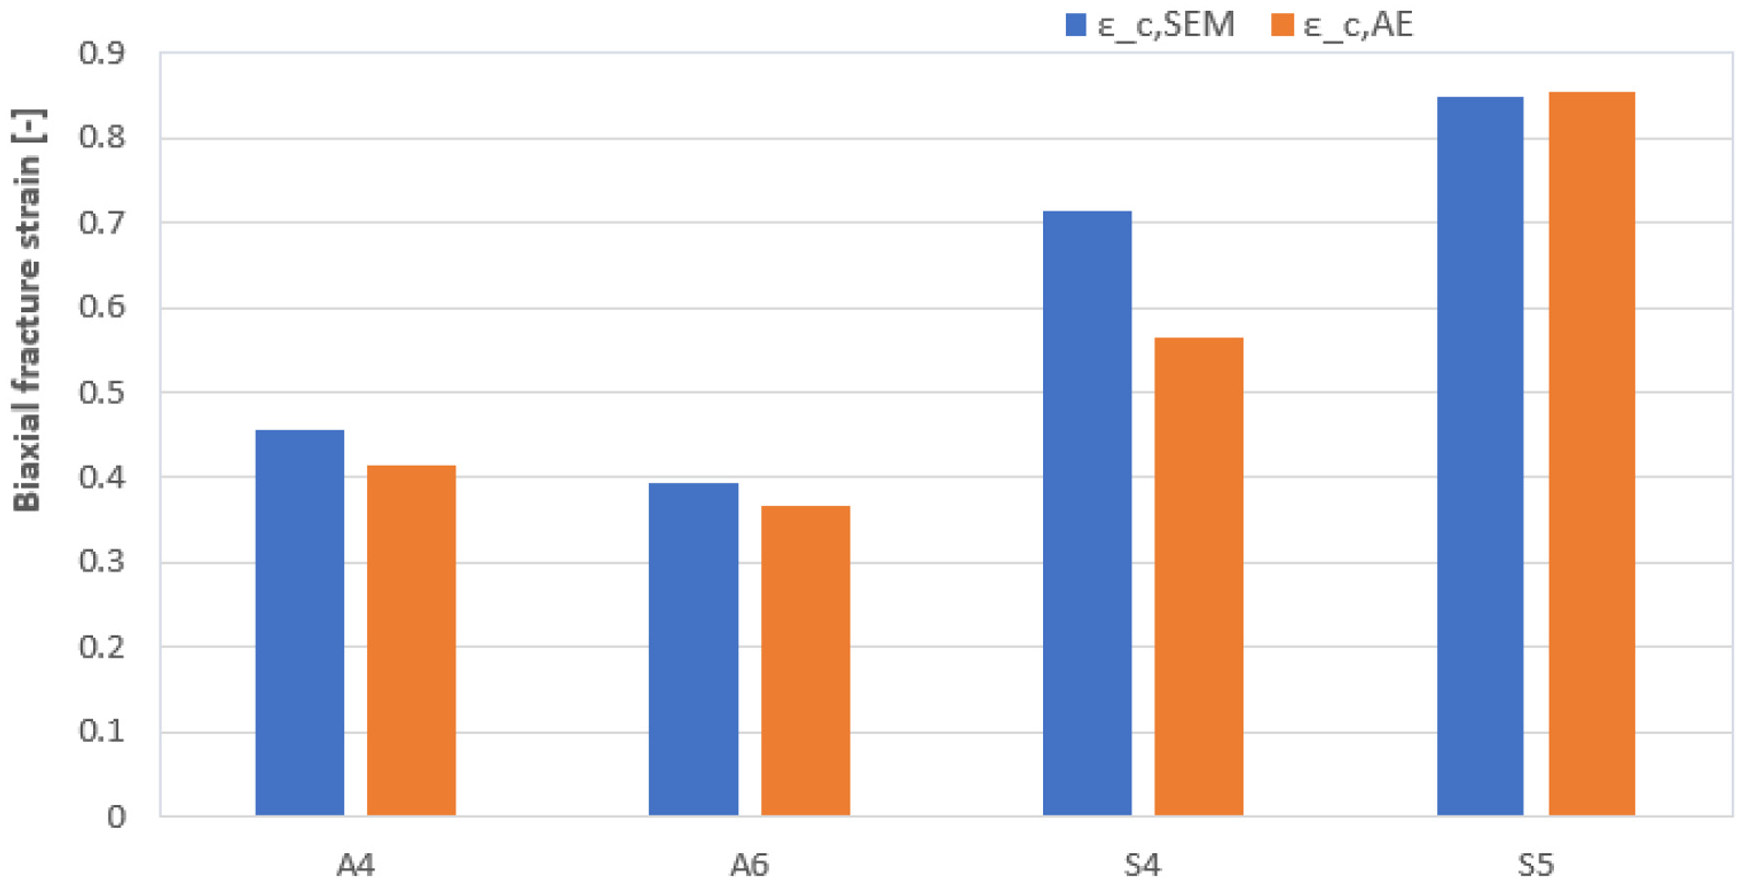
The comparison of equivalent biaxial fracture strain from SEM measurements and AE recordings (The deviation between values is 10.5%, A4; 7.59%, A6; 26.2%, S4; and −0.85%, S5).
The equivalent biaxial fracture strain from the SEM measurements corresponds well to the value obtained from AE data. These results indicate that in the case of both aluminium and steel samples, the fracture initiation occurred before the peak load. Also, the results confirm the potential of the AE technique in estimating the fracture initiation and the corresponding punch displacement, respectively.
Conclusion
The SPT is a highly repeatable test which can be used to calculate various material properties. Its attractiveness is due to the small specimen size required and that it is a test that fractures the specimen. The hardness measurements highlighted that the laser cutting of the specimens from the sheet metal did not greatly affect the material properties. The greater the displacement at fracture, the higher the biaxial strain at fracture. Fracture has been observed to propagate before the point of maximum load. SEM and AE results have confirmed this. In case of the SEM analysis, it must be emphasised that the location at which the thickness at fracture is measured needs to be better defined. Also, using the maximum load as the point at which fracture occurs will give an overestimate of the material’s fracture toughness. This analysis is a first step that confirms the possibility of using AE technique as an additional tool in SPT for evaluating the fracture initiation and the biaxial strain, respectively.
A further study is planned, that will include a redesign of the SPT rig allowing the AE sensor to be placed closer to the specimen and the installation of a CCD camera to observe the fracture initiation moment.
Footnotes
Declaration of conflicting interests
The author(s) declared no potential conflicts of interest with respect to the research, authorship, and/or publication of this article.
Funding
The author(s) disclosed receipt of the following financial support for the research, authorship, and/or publication of this article: This study is partly supported by the project grant FADAMES no. 792652, funded by Marie Curie Individual Fellowship Program from Horizon 2020, European Commission.