
Abstract
This study addresses production challenges in the Mishrif Formation reservoirs of Y oilfield, including uneven water injection efficiency, and unclear water flooding characteristics. Combining geological, logging, and production data, we examine the macro-scale heterogeneity of these reservoirs and their impact on water injection. Results show that the inter-layer coefficient of permeability variation (VK), permeability rush coefficient (Tk), and permeability contrast (Jk) are high, indicating strong heterogeneity. Barriers in the formation fall into three main categories: lagoonal, incised valley, and swamp facies. These barriers affect water flooding, with high-permeability zones flooding more readily, while residual oil accumulates at the base of barriers and in facies transition zones. The intra-layer rhythmicity is mainly positive rhythm (70.2%), with the intra-barrier lithology primarily consisting of argillaceous limestone (0.5–2.5 m thick). Water flooding concentrates along high-permeability layers, leaving more residual oil at the top of these layers. In areas with homogeneous or reverse rhythmicity, water flooding is more uniform, yielding better development results. Horizontal heterogeneity is characterized by strip-like tidal channels and sheet-like bioclast shoals. The tidal channels exhibit directional distribution, while the bioclast shoals are more uniform. The variation in physical properties is controlled by sedimentary microfacies, resulting in significant horizontal heterogeneity. Water flooding efficiency is influenced by the distribution of these microfacies and the optimization of the injection-production well pattern, which determines the remaining oil distribution across the plane.
Keywords
Introduction
Once entering the development phase of oil reservoirs, 30%–35% of recoverable reserves fail to be effectively extracted due to reservoir heterogeneity, particularly in carbonate reservoirs, which account for 47.5% of global remaining recoverable oil and gas reserves (approximately 200 billion tons) (Flett et al., 2007; Liu et al., 2022; Park et al., 2014; Shen et al., 2019). The impact of reservoir heterogeneity on development outcomes exhibits global universality. Studies in the Rub’ al-Khali Basin of the Middle East demonstrate that for every 0.1 increase in permeability variation coefficient, water flooding recovery efficiency decreases by 4.7%. Therefore, in-depth research on carbonate reservoir heterogeneity could significantly enhance global hydrocarbon resource development efficiency. Reservoir heterogeneity refers to spatial variability and physical property variations within reservoirs, serving as a critical factor influencing subsurface fluid flow and hydrocarbon recovery (Li et al., 2020; Shang et al., 2021). Porous carbonate reservoirs undergo complex sedimentary, diagenetic, and tectonic processes during formation, characterized by multiple sedimentary microfacies types, complex lithology, variable pore structures, and significant pore-throat distribution differences. While their storage spaces primarily consist of pores with limited dissolution pores/caves and essentially no fractures, these reservoirs still exhibit strong heterogeneity, posing challenges in characterization and impeding development adjustments, thereby severely constraining the exploitation efficiency of porous carbonate reservoirs (Qiao et al., 2024). Although previous studies have extensively investigated the Cretaceous Mishrif Formation in Y Oilfield regarding reservoir characteristics, controlling factors, genetic mechanisms, distribution patterns, and sedimentary/reservoir formation processes (Bai et al., 2019; Sun et al., 2020, 2024), research on reservoir heterogeneity remains relatively limited (Jassim et al., 2021; Sabouhi et al., 2022). As the primary oil-producing layer in Y Oilfield, the Mishrif Formation currently faces production challenges after over a decade of development, including uneven water injection efficiency, inconsistent vertical/horizontal reservoir utilization, development of high-permeability layers within injection-production well patterns, and ambiguous water flooding characteristics—all significantly impacting field development efficiency. This highlights an urgent need to better understand Mishrif Formation heterogeneity, identify controlling factors of remaining oil distribution, and optimize water flooding strategies. This study focuses on the Cretaceous Mishrif Formation in Y Oilfield, integrating well logging, production data, and geological information to investigate interlayer, intra-layer, and planar heterogeneity characteristics of carbonate reservoirs and analyze their impacts on water flooding development. The research aims to provide a geological basis for predicting remaining oil distribution patterns, adjusting late-stage water flooding strategies, and optimizing development plans. The findings not only facilitate oil stabilization and water control in the Mishrif Formation reservoirs of Y Oilfield but also enhance vertical utilization efficiency and planar sweep efficiency, significantly improving field development performance while providing comparative case studies for efficient development of similar oilfields.
Overview of the study area
Structurally located in the southern foredeep belt of the Mesopotamian Basin (Qiao et al., 2022; Sun et al., 2020), Y Oilfield presents a broad and gentle long-axis anticline with NW-SE orientation, maintaining a relatively intact structural configuration (Al-qayim, 2010; Champagne et al., 2012) (Figure 1(a)). The study area is situated in the central-northern portion of Y Oilfield, specifically the mid-northwestern section of the long-axis anticline (Figure 1(b)). The depositional environment is characterized as a weakly rimmed carbonate ramp, with principal facies including a restricted platform, platform margin, and open platform. The identified microfacies comprise: Subtidal zone, Tidal channels (deeply incised conduits facilitating water exchange between open marine and lagoon environments, exhibiting fluvial-like behaviors. Classified into meandering and migratory types, dominated by thick-bedded grainstones with cross-bedding, characterized by low-amplitude box-shaped GR curves and high acoustic values (76–88 μs/ft)), Bioclastic banks, Bank margins, Lagoon, Swamp, Incised valley microfacies (Ahmed et al., 2021; Cantrell et al., 2020). Lithologies comprise grainstones, packstones, wackestones, and mudstones, demonstrating significant vertical and lateral sedimentary variations. The target reservoir is the Cretaceous Mishrif Formation, subdivided into 5 third-order and 10 fourth-order sequences (Bai et al., 2019). The Mishrif reservoir exhibits: Diverse pore types, Complex pore-throat structures, Poor correlation between porosity and permeability, Average gross thickness: 300 m, Average net pay: 85 m, Porosity range: 14%–22%, Permeability range: 18–65 mD. The presence of high-permeability streaks and subtle barriers creates strong heterogeneity, impeding effective exploration and development. Since production commencement in April 2005, over 190 wells have been drilled in Mishrif Formation, including 72 production wells, 39 water injection wells, and 1 coring well. Waterflood patterns employ irregular five-spot and edge-bottom injection configurations. Current development utilizes a depletion drive mechanism with progressively increasing water cut. The study focuses on a 26.79 km2 block in northern anticlinal area containing 67 production wells (12 injectors, 44 producers), and 1 core well.
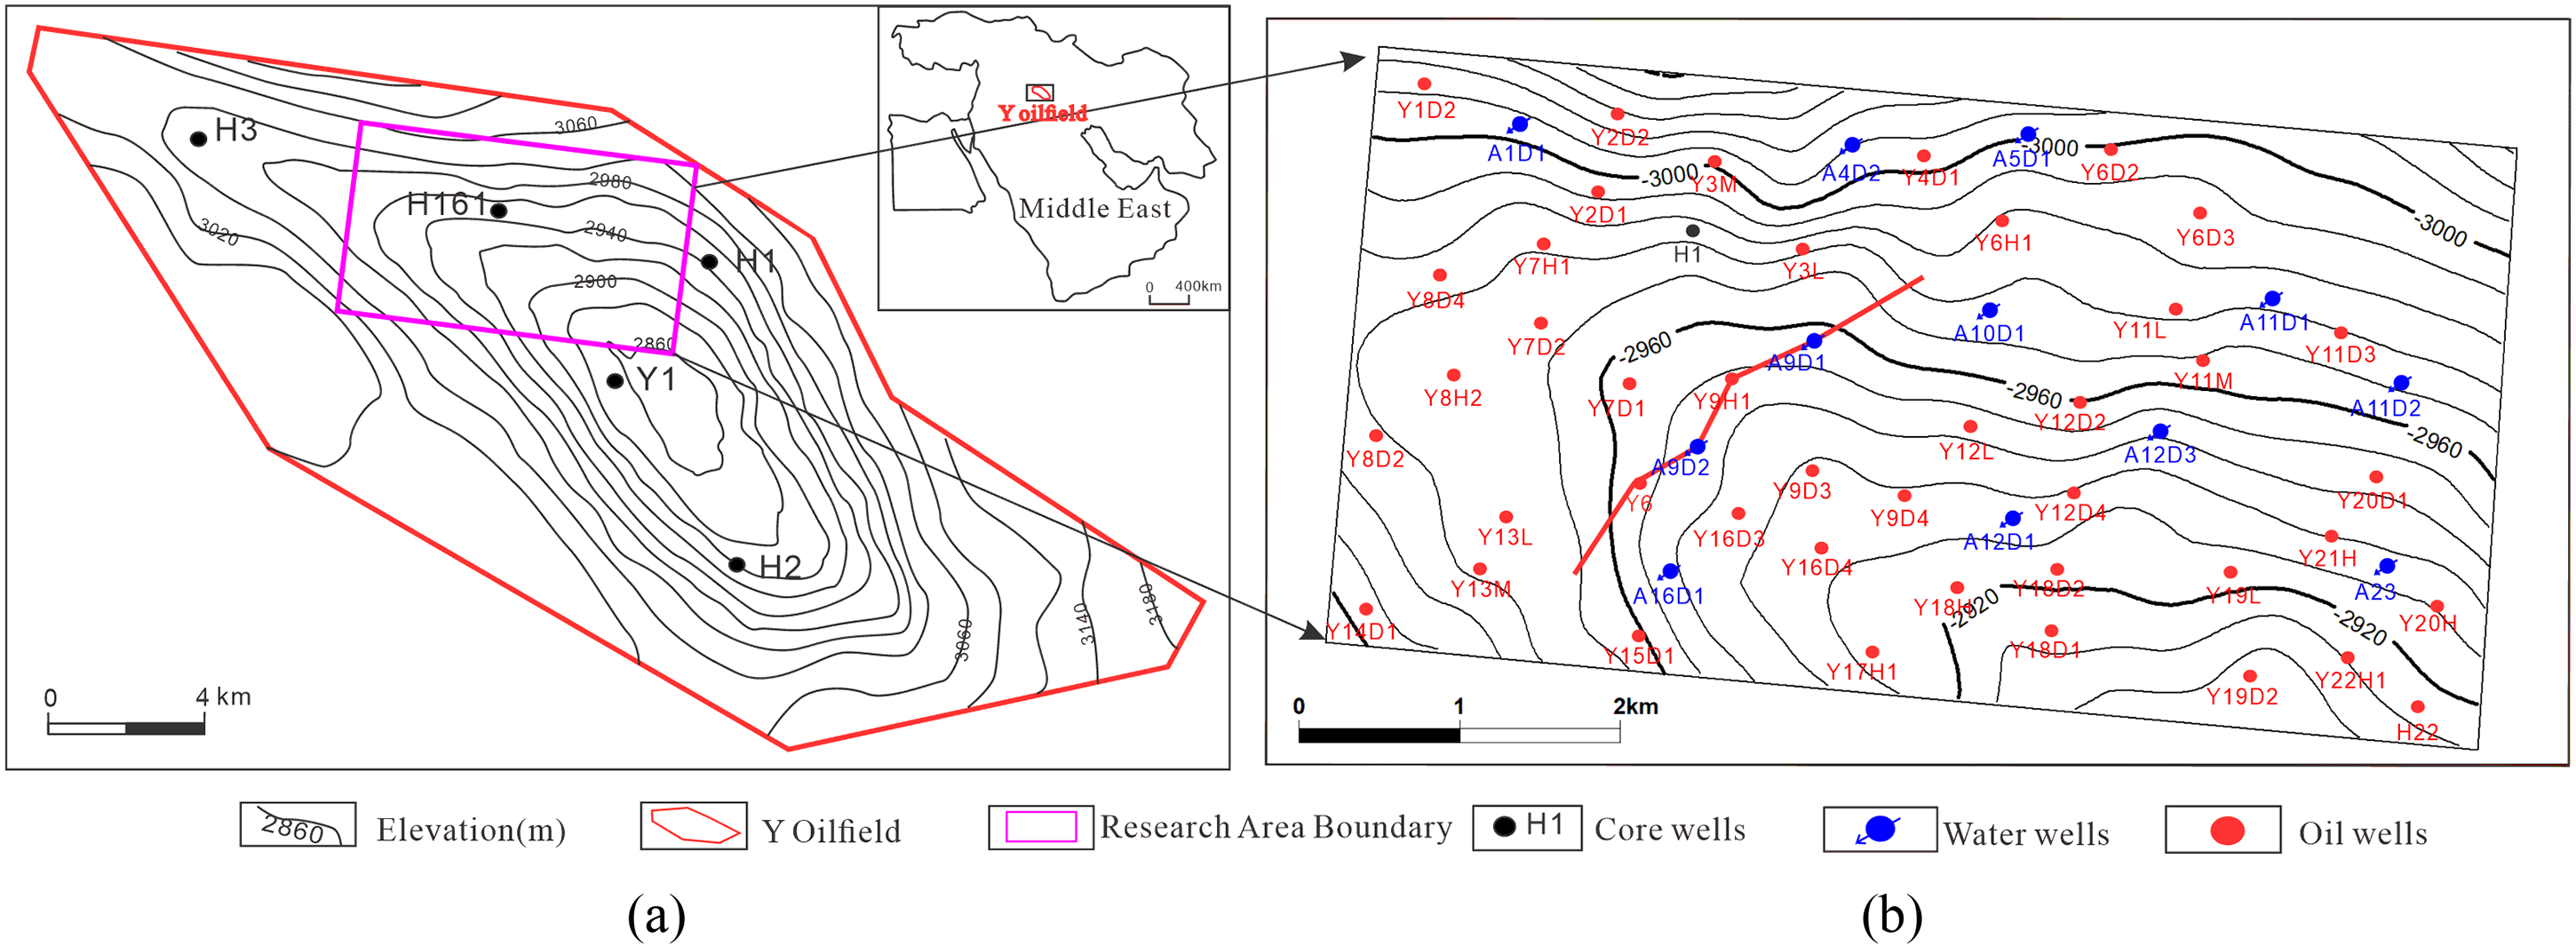
(a) Structure and well location distribution map of Y Oilfield in the Middle East ; (b) Structural features and well location distribution map of anatomical area.
3D geological modeling and reservoir numerical simulation based on fundamental geological research
Stratigraphic characteristics
The penetrated strata in Y Oilfield encompass Tertiary, Cretaceous, and Jurassic formations. The target Tertiary and Cretaceous sequences exceed 4400 m in total thickness. The Cretaceous system, with a thickness of 1830–1920 m, comprises Upper, Middle, and Lower Cretaceous units: Upper Cretaceous: Shiranish Formation: Marlstone, limestone, and bioclastic limestone. Hartha Formation: Chalky limestone interbedded with calcareous shale. Sadi Formation: Marlstone, limestone, and thin-bedded shale. Tanuma Formation: Limestone interbedded with calcareous shale. Khasib Formation: Bioclastic limestone with thin shale layers. Middle Cretaceous. Mishrif Formation: Reef limestone rich in bioclasts. Rumaila Formation: Argillaceous limestone interbedded with chalkified limestone. Ahmadi Formation: Limestone with chalky limestone interbeds. Mauddud Formation: Limestone interbedded with mudstone and dolomite. Nahr Umr Formation: Limestone alternating with sandy mudstone. Lower Cretaceous: Shuaiba Formation: Chalky limestone, shale, and marlstone. Zubair Formation: Sandstone-mudstone alternations. Ratawi Formation: Limestone and mudstone. Yamama Formation: Foraminiferal limestone with thin mudstone interbeds. The Mishrif Formation is subdivided into four members (MA, MB1, MB2, and MC) and 15 sub-members (Figure 2(a)), forming five third-order sequences. Each third-order sequence boundary is defined by tidal channels, incised valleys, or unconformities representing significant sea-level falls. Primary Production Zones MB2 Member: Dominated by coarse-grained bioclastic limestone (∼30 m thick), exhibiting good physical properties and high productivity. MB1 Member: ∼100 m thick, divided into. MB1-1 Sub-member: Dense micritic limestone (10–20 m thick), essentially non-reservoir. MB1-2 Sub-member: Further subdivided into three layers (MB1-2A, MB1-2B, MB1-2C), composed of fine-grained carbonate rocks dominated by packstone and wackestone, with minor coarse-grained bioclastic limestone interbeds. This sub-member hosts substantial reserves but exhibits strong reservoir heterogeneity (Figure 2(b)).
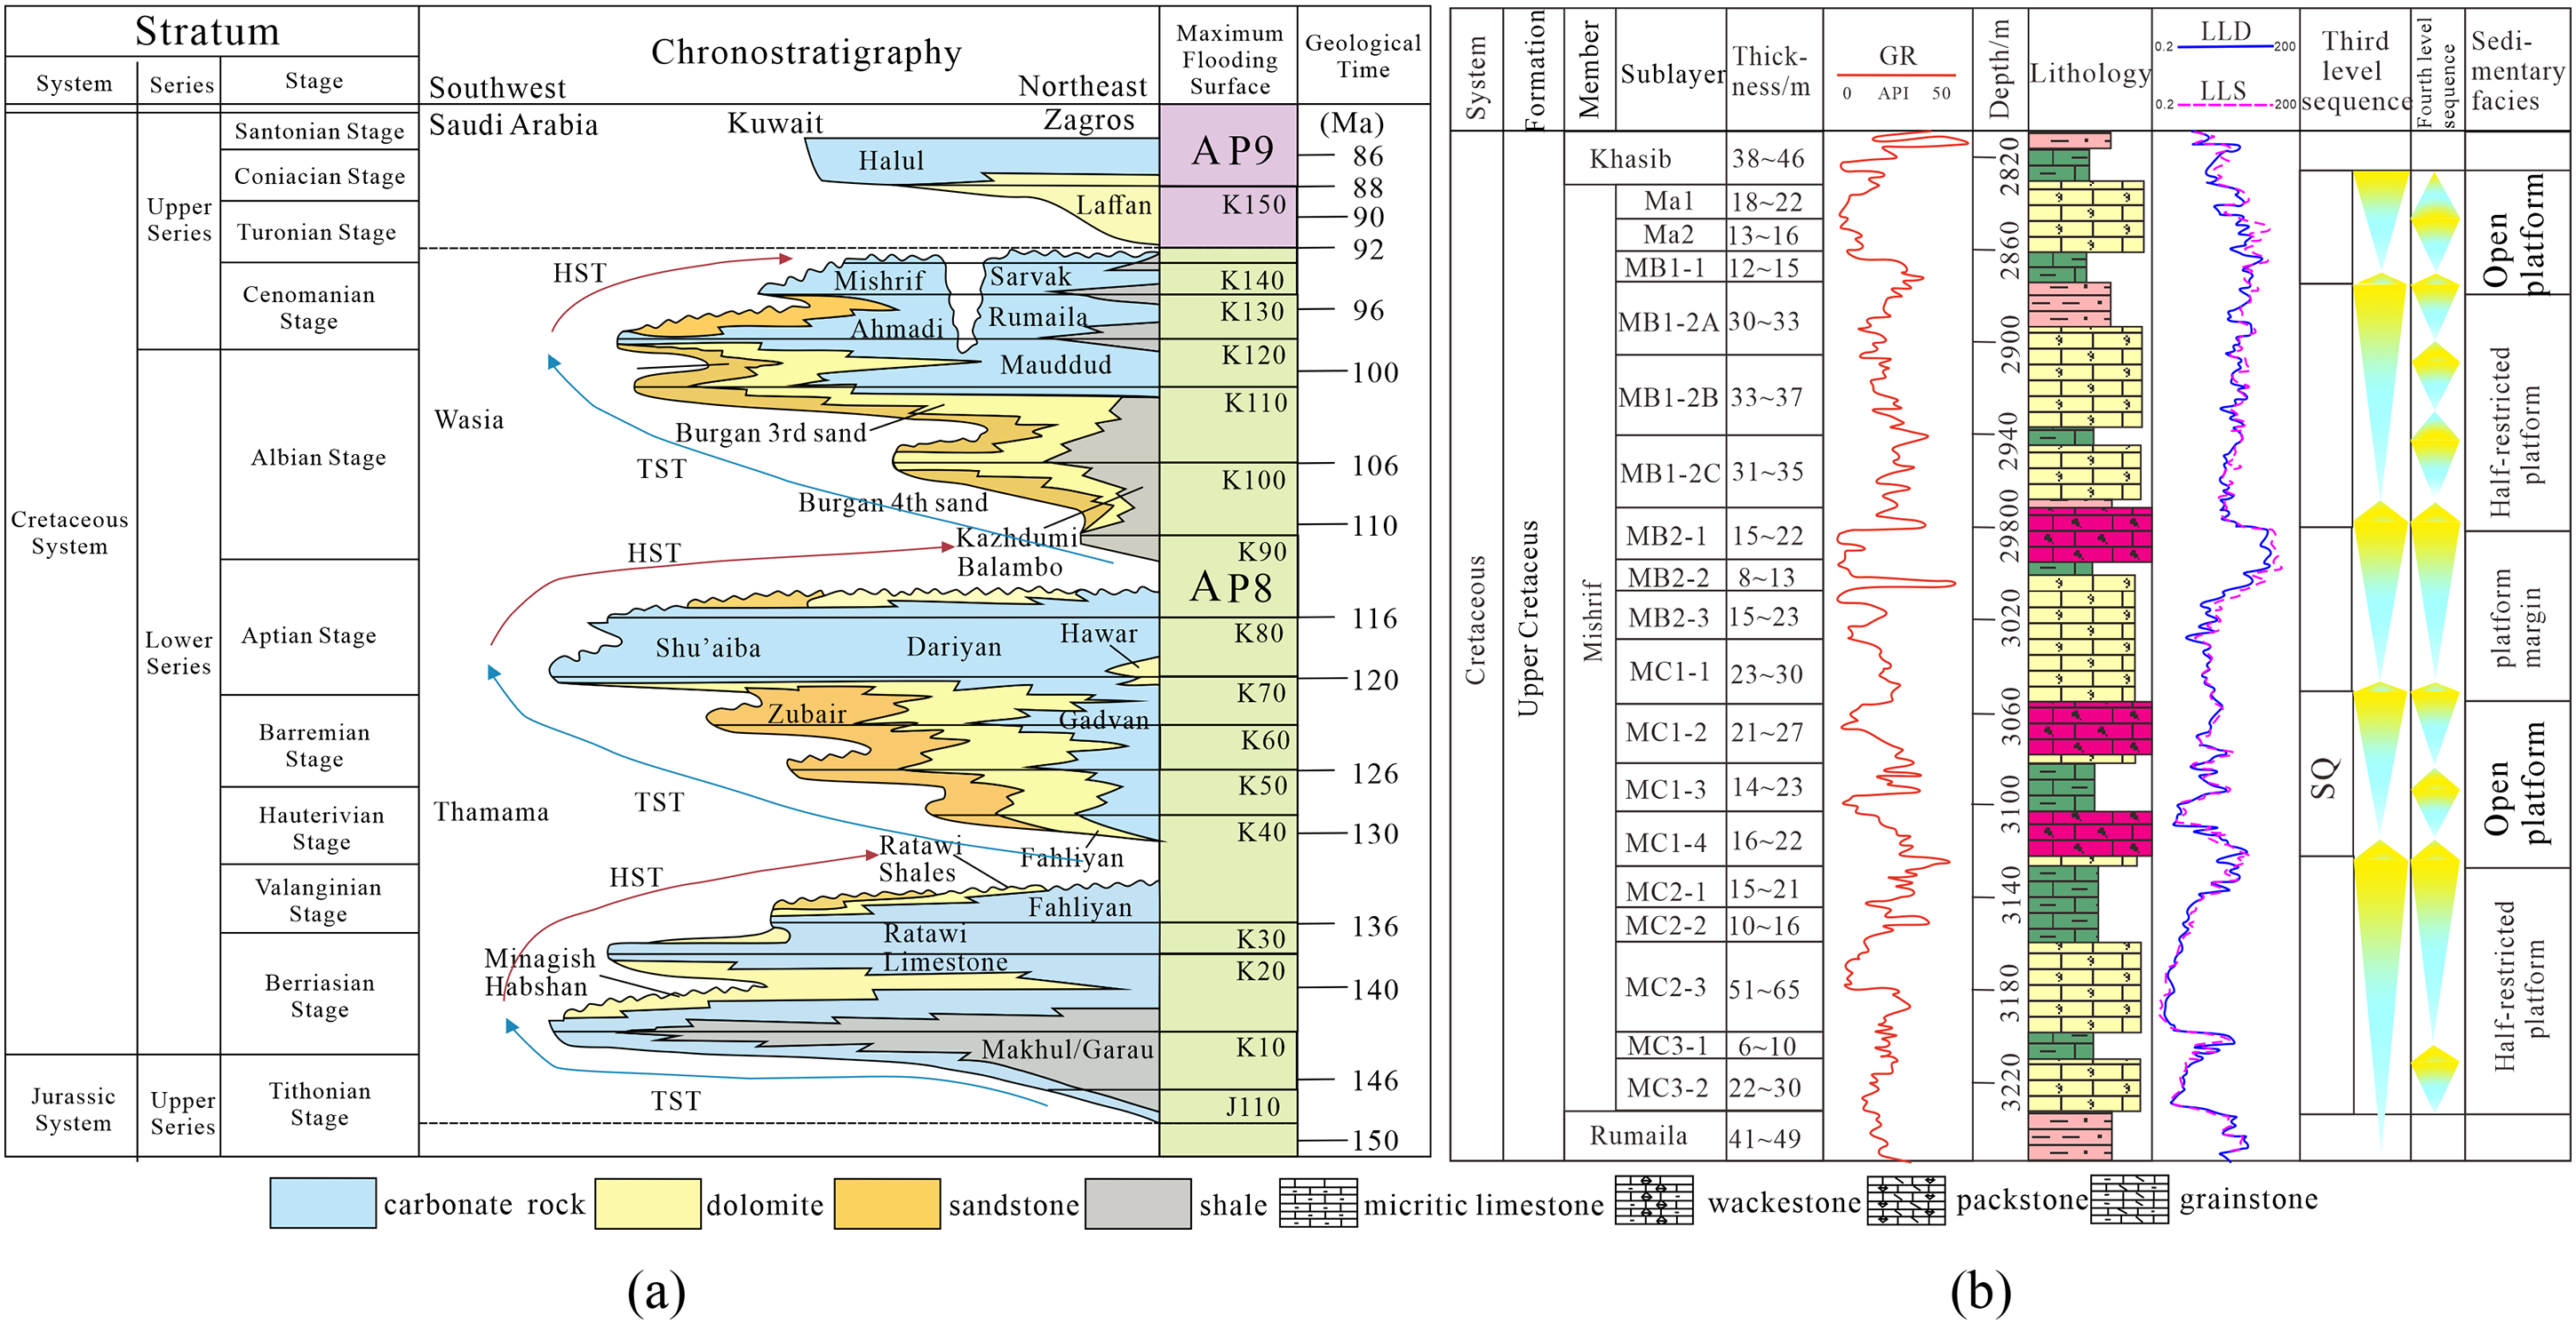
(a) Sequence stratigraphic characteristics of Y Oilfield in the Middle East; (b) Composite stratigraphic column of the Mishrif Formation (modified from PetroChina Hangzhou Research Institute of Geology).
Characteristics of sedimentary microfacies
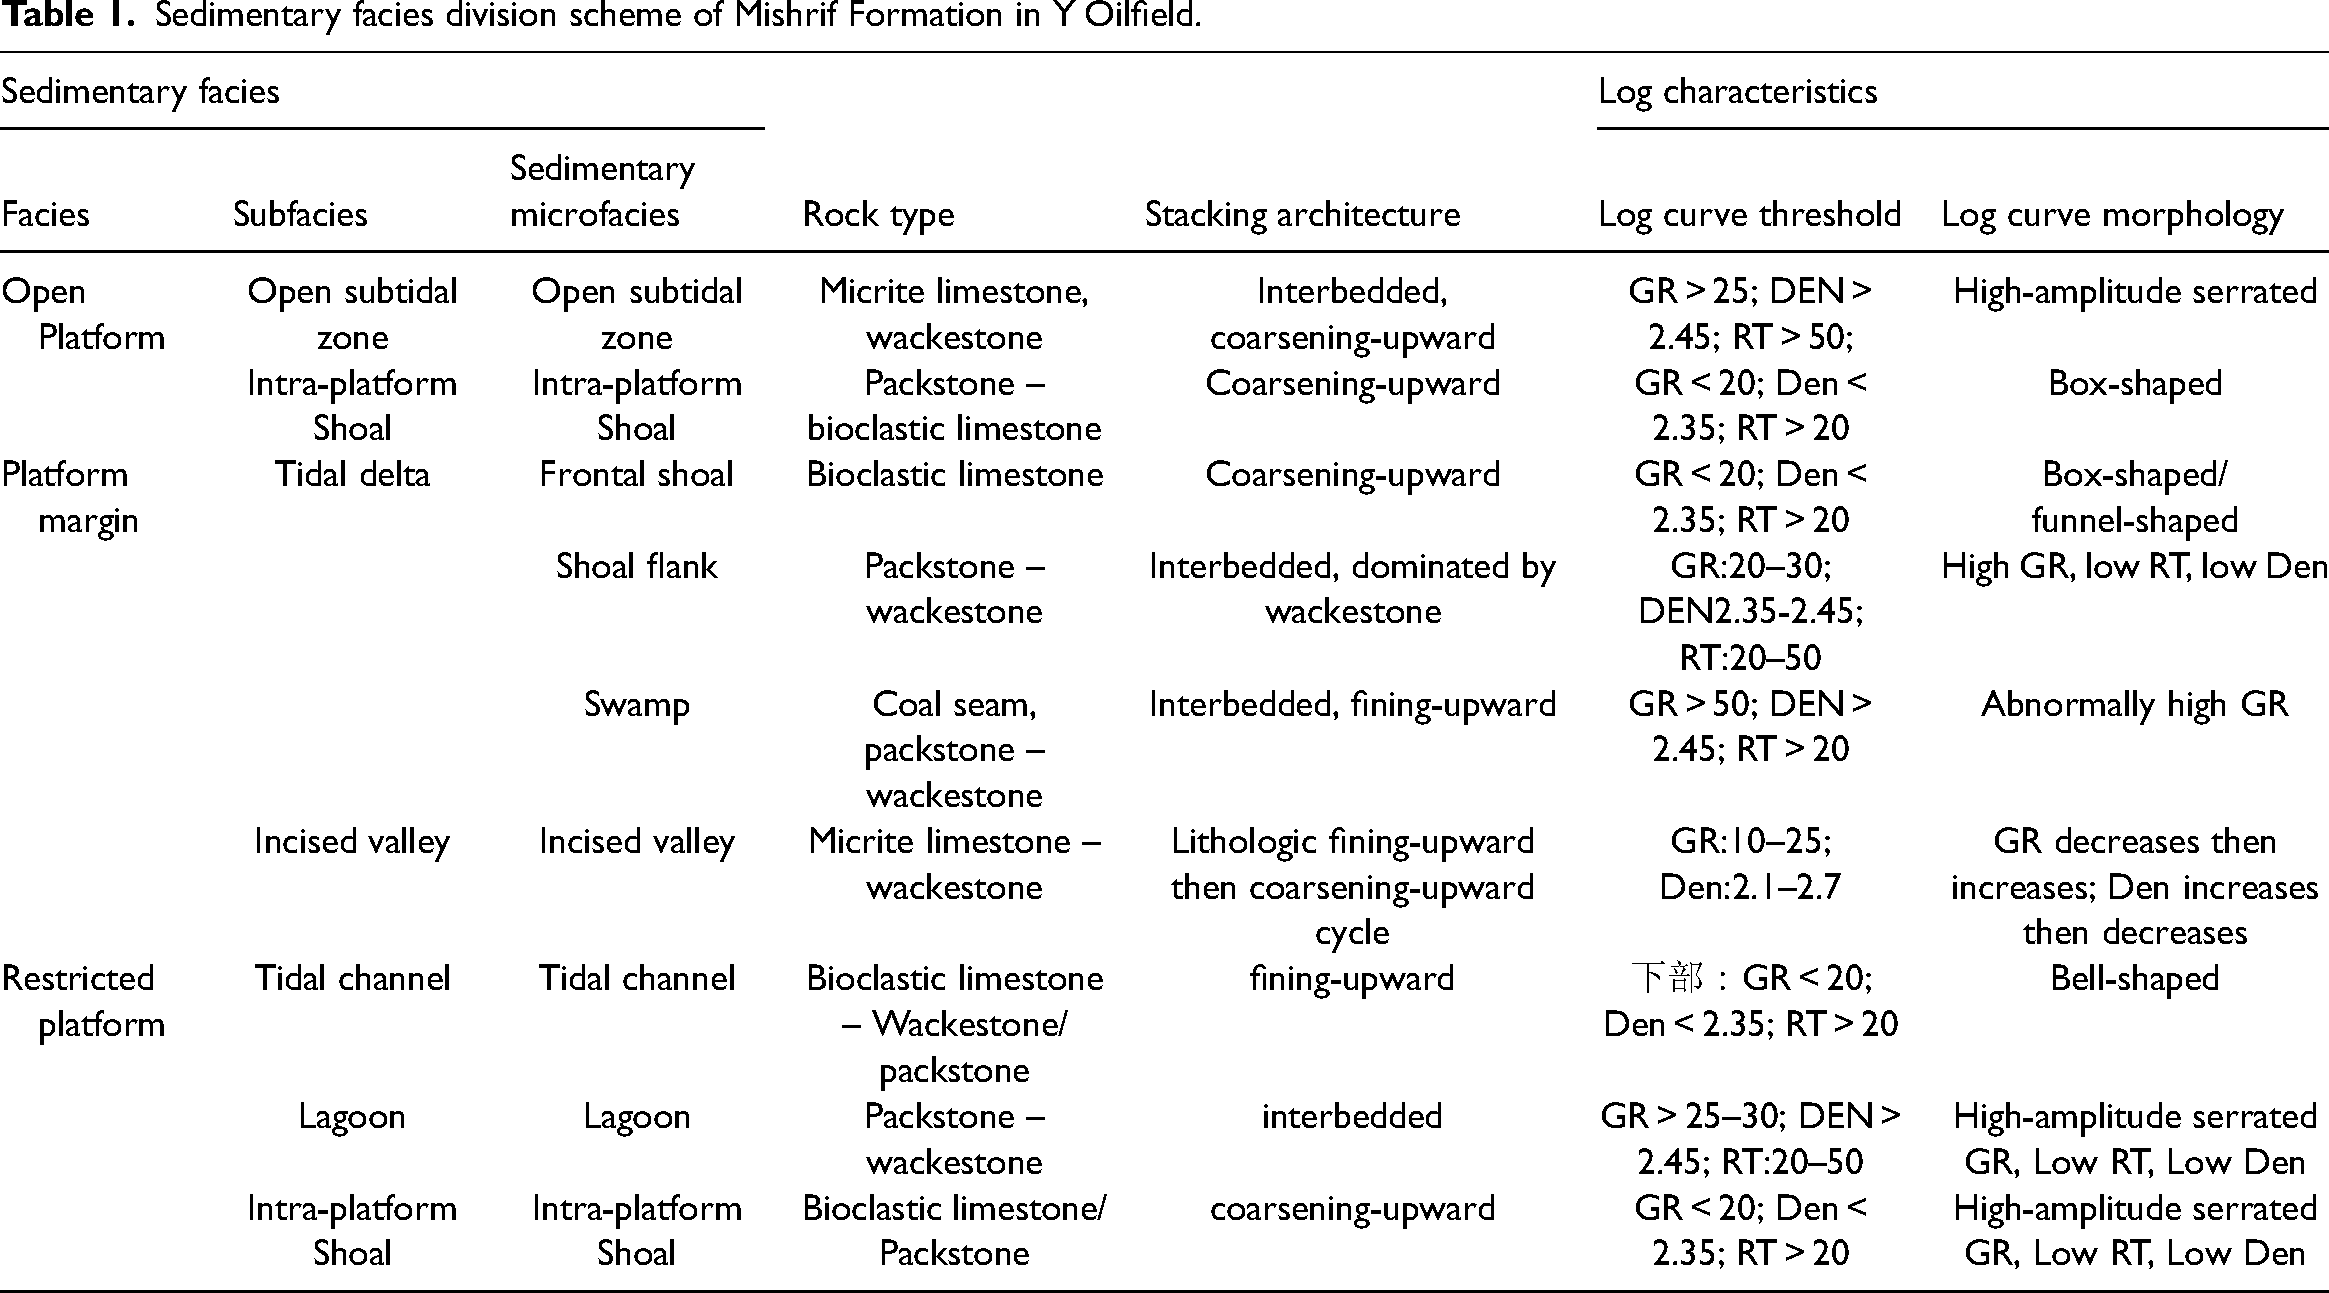
During the depositional period of the Mishrif Formation, the sedimentary facies belts in the Middle East exhibited an NW-SE trending distribution along the Neo-Tethys Ocean. In the study area of Y Oilfield, controlled by the uplift of the Amara paleo-uplift and a falling sea level, the deposition of the Mishrif Formation evolved from open marine shelf deposits to reef-front slope, reef flat, and shoal deposits, ultimately transitioning to inner shelf deposits in later stages (Shao et al., 2022). Based on core samples, thin sections, and analytical data, the Mishrif Formation reservoir is classified into three sedimentary facies, seven subfacies, and nine sedimentary microfacies. Distinct depositional environments correspond to specific rock types and stacking patterns. The rock types, stacking architectures, typical log curve values, and morphologies of key sub-members in the Mishrif Formation are summarized in Table 1. Reservoir characteristics of major microfacies and rock type associations are as follows: Tidal channel facies (grainstone-packstone reservoirs): Dominated by intergranular pores, with an average porosity of 24.5% and permeability of 72.97 × 10⁻³ μm2, representing Class I high-quality reservoirs. Tidal channel wackestone reservoirs: Average porosity of 18.49% and permeability of 12.80 × 10⁻³ μm2, generally non-effective reservoirs. Bioclastic bank-bank margin microfacies: Average porosity of 18.29% and permeability of 14.39 × 10⁻³ μm2, with upper grainstone-packstone intervals forming high-quality reservoirs. Lagoon facies (wackestone-mudstone): Dissolution-modified wackestones develop micropores, dissolution pores, and fractures, achieving maximum porosity of 29.06% (average: 14.99%) and peak permeability of 185.43 × 10⁻³ μm2 (average: 5.00 × 10⁻³ μm2), forming high-quality to high-permeability reservoirs.
Sedimentary facies division scheme of Mishrif Formation in Y Oilfield.
Unmodified wackestone-mudstone: Despite porosities exceeding 15%, permeabilities are mostly <1 × 10⁻³ μm2, acting as baffles or barriers.
Reservoir characteristics and diagenesis
The Mishrif Formation reservoir lithology is primarily composed of massive reef limestone and bioclastic limestone, with interbedded dense limestone. The entire formation has a thickness of approximately 400 m in the Y Oil Field, with burial depths generally ranging from 2800 to 3300 m. The average reservoir thickness is 300 m, while the maximum effective thickness encountered in a single well exceeds 150 m, averaging 85 m. Overall, it exhibits transgressive shelf deposition: the lower reef and bioclastic limestones are purer with greater single-layer thickness and better physical properties, gradually deteriorating upward with increased dense layers. Sun Wenju analyzed 402 thin sections and porosity-permeability data, revealing a strong correlation between sedimentary microfacies, rock types, and physical properties in the MB1-2 sub-member of the Y Oil Field. These were classified into three reservoir types: (1) Tidal channel grain-packstone reservoirs, (2) Bioclastic shoal grain-packstone reservoirs, and (3) Lagoon wackestone dissolution-modified reservoirs. Current mainstream views suggest that the Mishrif Formation reservoirs experienced cementation, dissolution, neomorphism, dolomitization, and pressure solution, with pressure solution being considered most critical (Aqrawi, 1998; Aqrawi et al., 1998; Sadooni and Alsharhan, 2003). Jin Zhimin's research on diagenesis of the Mishrif Formation reservoirs indicates: Early diagenetic dissolution predominantly controls pore structure heterogeneity, while other diagenetic processes have relatively weaker impacts. Early-stage karstification in this area exhibits distinct facies-controlled characteristics and plays a significant positive role in pore structure modification (Jin et al., 2018).
Geological modeling and reservoir numerical simulation
The Mishrif Formation in the Y Oil Field hosts porous carbonate reservoirs with limited influence from fractures and vugs. However, these reservoirs significantly differ from clastic reservoirs, particularly in their sedimentary microfacies: they lack the distinctive external morphology and geometric characteristics typical of clastic reservoir microfacies, making it challenging to precisely characterize the spatial distribution of carbonate reservoir microfacies. To address this, the project team employed machine learning methods by assigning specific labels to different sedimentary microfacies, enabling the construction of an accurate sedimentary microfacies model for typical blocks. The model was designed with a horizontal grid spacing of 25 m × 25 m and vertical grid units of 0.5 m, totaling 272 × 290 × 330 = 26,030,400 cells. Building on this framework, secondary log interpretation data was processed through vertical grid discretization and normal score transformation to ensure normal distribution. After data analysis and variogram optimization, high-resolution porosity and permeability models were established under microfacies constraints (Shao et al., 2023).
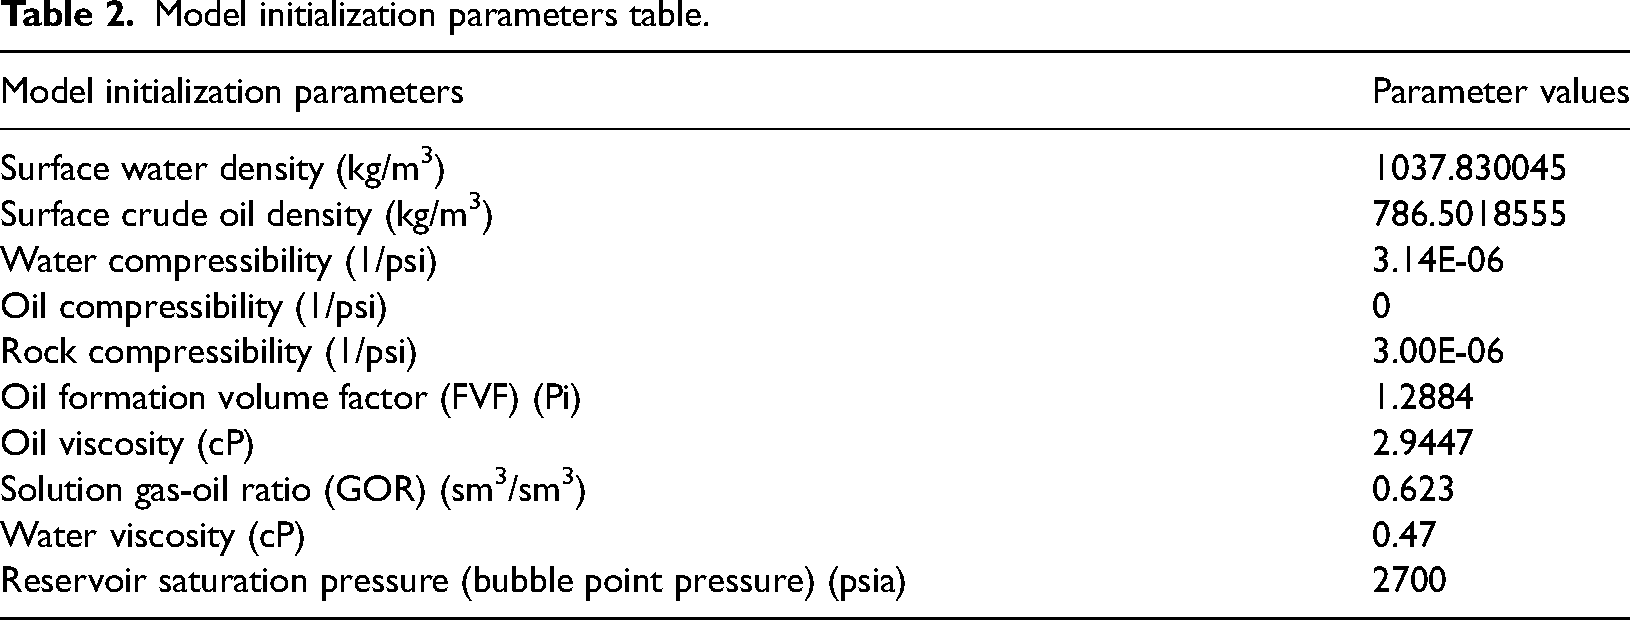
Based on the high-resolution 3D geological model, numerical simulation was conducted for the central dissection area (26.5 km2) of the Mishrif carbonate reservoir in the Y Oil Field. Due to the model's grid count exceeding the computational capacity of the Eclipse reservoir simulation software, the 3D geological model was upscaled to balance geological fidelity and computational efficiency: horizontal grid spacing was adjusted to 100 m × 100 m, vertical grid units to 1 m, resulting in a total of 5,143,500 cells. As of now, the block contains 52 injection-production wells (31 active: 18 production wells and 13 water injection wells), spanning vertically from the top of MB1-2A to the base of MB2-3. Fluid parameters for the simulation were derived from actual field well data, as detailed in Table 2.
Model initialization parameters table.
A theoretical model was developed using Eclipse software for historical matching, aiming to identify reservoir parameters that align simulated historical dynamics with actual production data—essentially a model validation process. During liquid production rate matching, operational constraints were set as constant injection rates for water injectors and constant liquid production rates for producers. By adjusting near-well petrophysical parameters, excellent matching accuracy (0.8%) was achieved across the entire block, with matching curves illustrated in the accompanying figures (Figure 3).
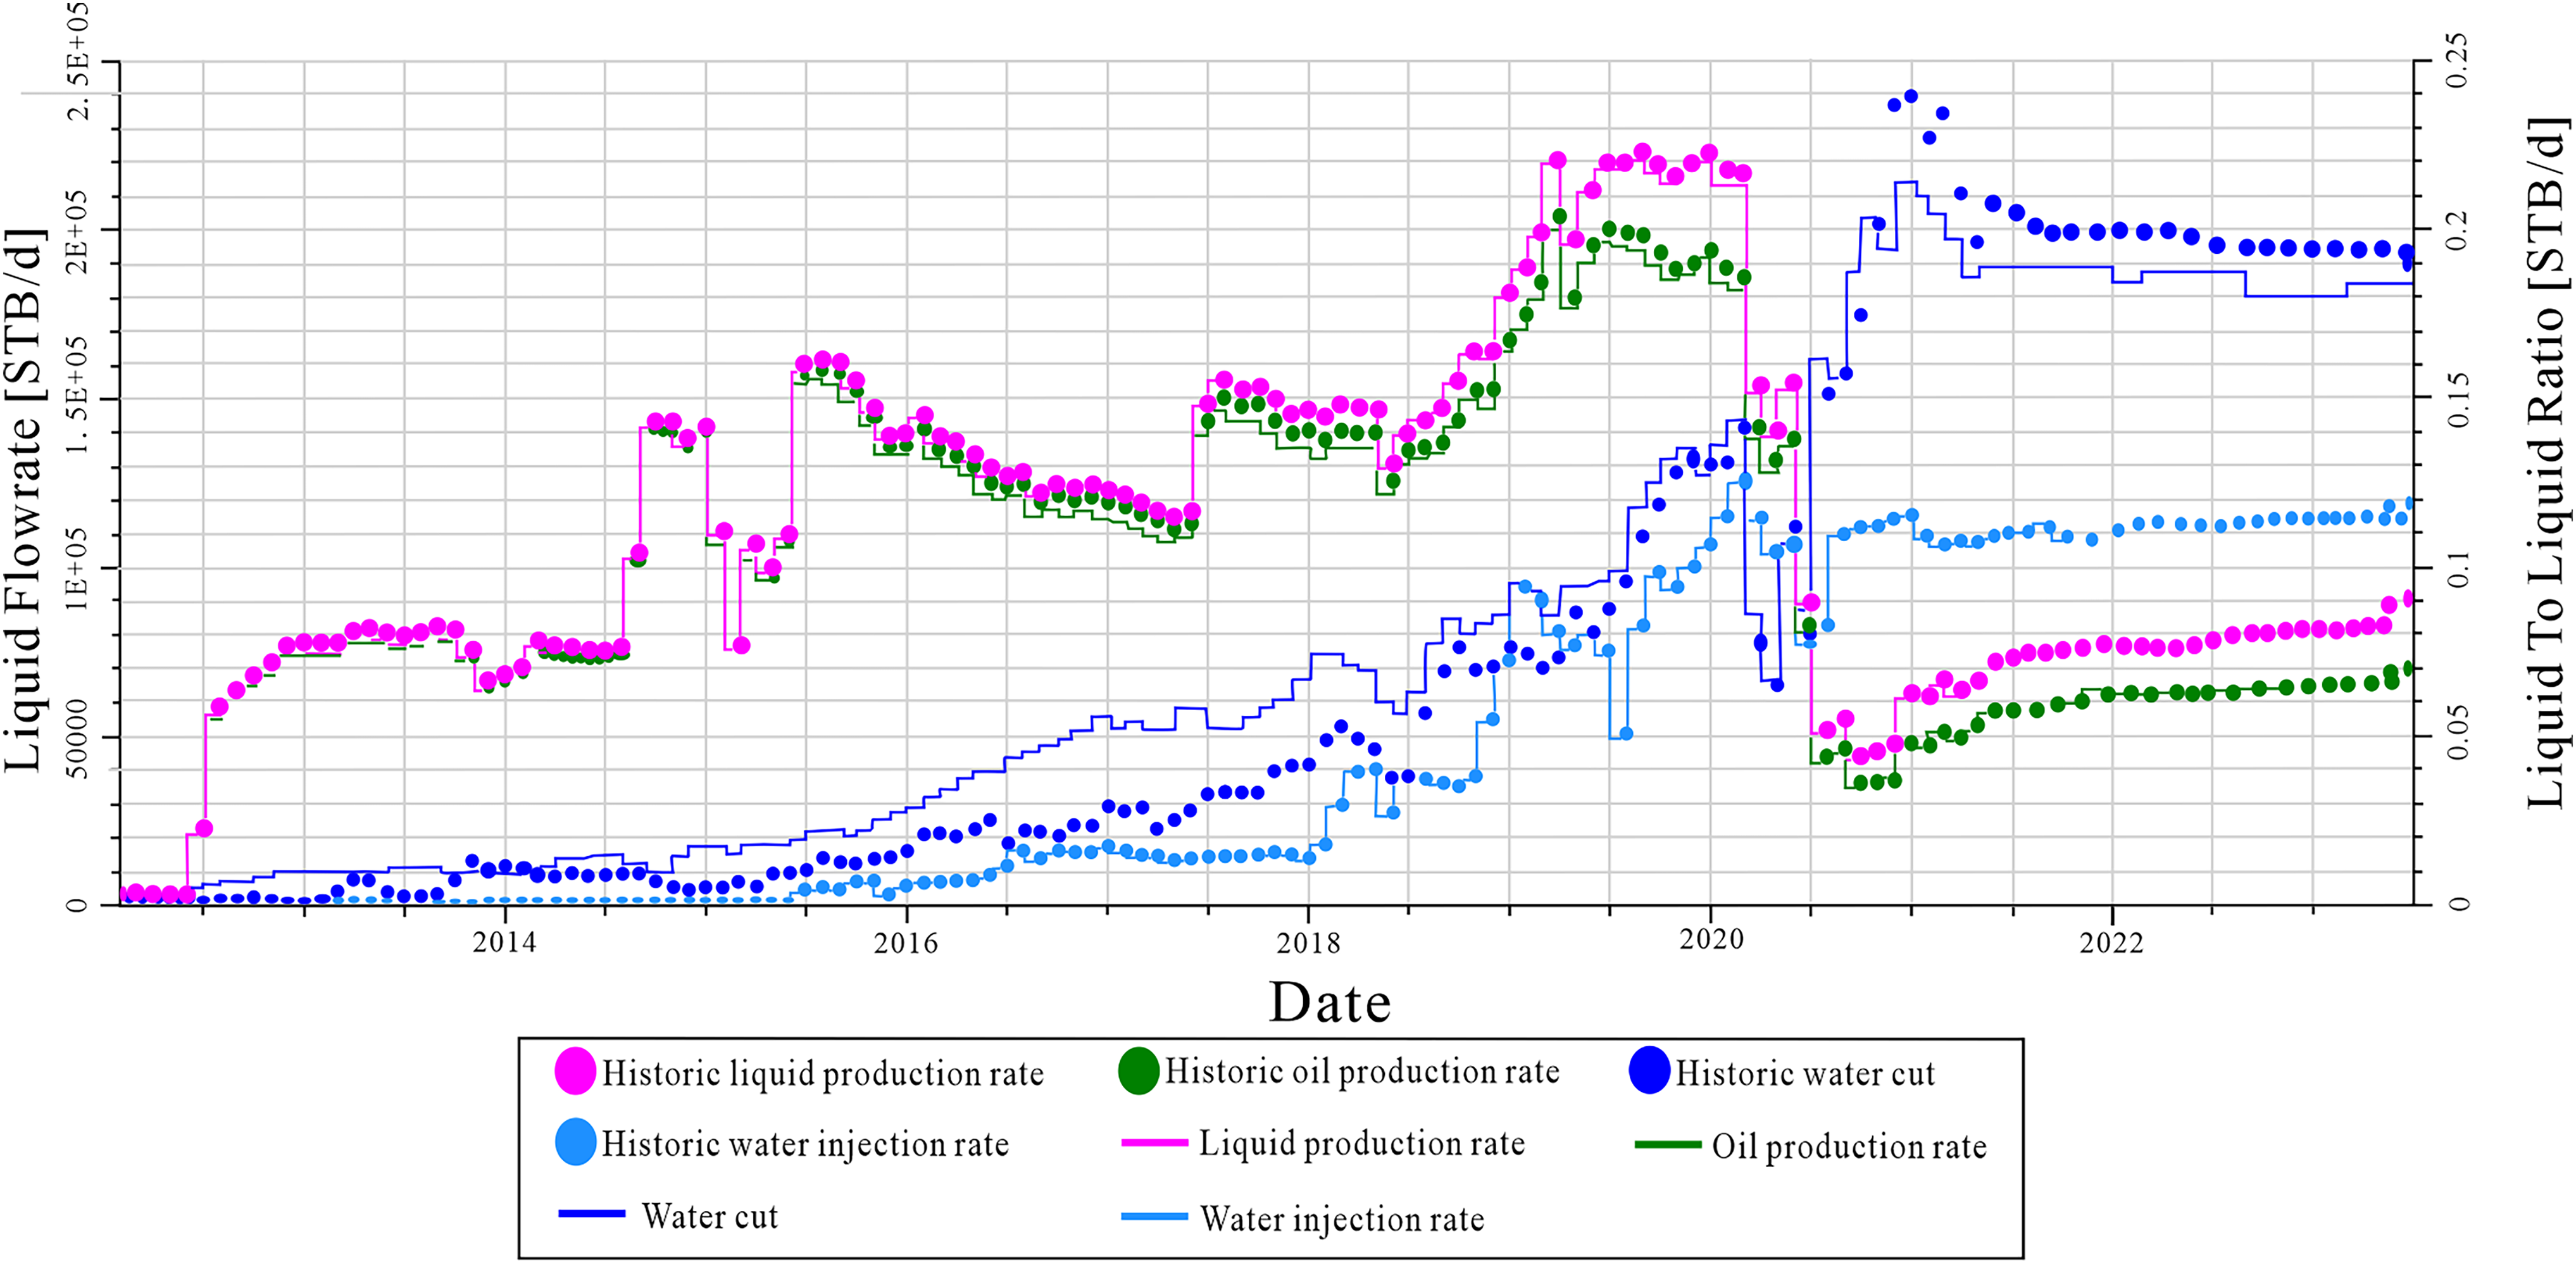
Production dynamic fitting curve of anatomical area.
Inter-heterogeneity and its impact on water injection development
Degree of inter-layer permeability heterogeneity
Inter-layer heterogeneity refers to the differences in properties between adjacent reservoir layers. This heterogeneity plays a crucial role in the formation of inter-layer intrusion and interference during water injection. It is commonly used to quantify using three parameters: the coefficient of permeability variation (VK), permeability rush coefficient (Tk), and permeability contrast (Jk) (Cao et al., 2018; Gong et al., 2019; Ma et al., 2017).
Permeability Variation Coefficient (VK)
Permeability rush coefficient (Tk)
Permeability contrast (Jk)
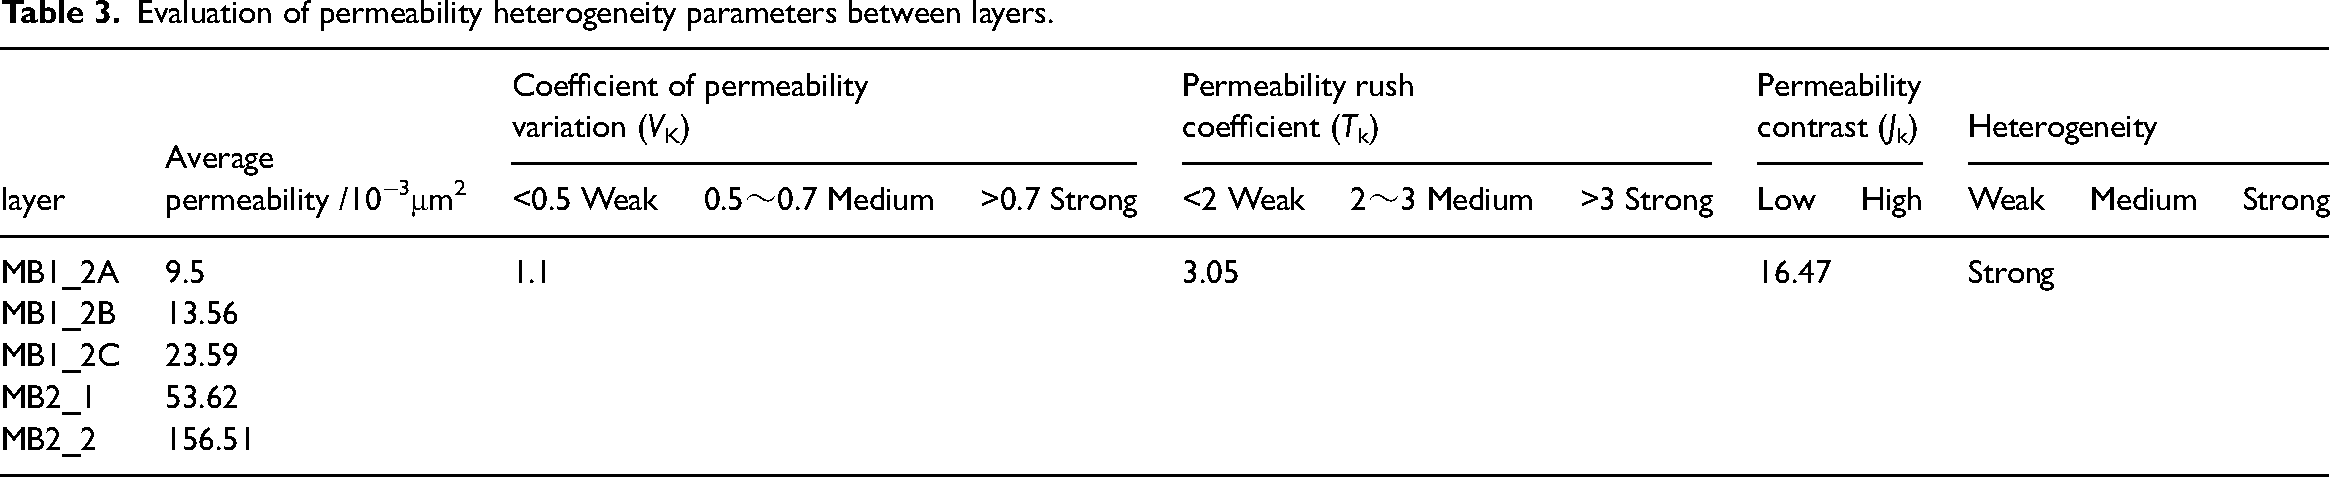
A higher value of these parameters indicates stronger heterogeneity, while a lower value signifies weaker heterogeneity. As shown in Table 3, the average permeability of each layer in the study area was statistically analyzed to calculate the coefficient of permeability variation (VK), permeability rush coefficient (Tk), and permeability contrast (Jk) of the target layers. These parameters provide a macroscopic view of the longitudinal inter-layer heterogeneity of the reservoir. The results indicate that the MB2_2 layer has the highest average permeability, at 156.51 × 10⁻³ μm2, followed by the MB2_1 layer with an average permeability of 53.62 × 10⁻³ μm2. The MB1_2A layer has the lowest permeability, with a value of only 9.5 × 10⁻³ μm2. Based on the average permeability values of each layer, the coefficient of permeability variation (VK) of the inter-layer permeability was calculated to be 1.1, the permeability rush coefficient (Tk) was 3.05, and the permeability contrast (Jk) was 16.47. These results, derived from the quantification of permeability heterogeneity, indicate a high degree of permeability heterogeneity within the inter-layers of the Mishrif Formation.
Evaluation of permeability heterogeneity parameters between layers.
Characteristics of the distribution of barriers
Barriers refer to impermeable layer with a certain thickness and wide distribution range. The barriers prevent vertical fluid seepage and are crucial for delineating the development of the reservoir system. Unlike clastic reservoirs, carbonate reservoirs typically contain concealed physical barriers, which play a significant role in blocking or delaying the movement of oil and water during development. Through a comprehensive study of the stratigraphy, sedimentation, and diagenesis of the Mishrif Formation in the Y oilfield, the barriers in the study area have been categorized into three types based on their genesis. The first category is lagoonogenic barriers. These barriers are primarily composed of micrite and wackestone, deposited in deeper water environments. The original sedimentary facies is a low-energy lagoon, characterized by high gamma, high resistivity, high density, and low acoustic values on well logs, which is a logging response indicative of tight limestone (Sun et al., 2024). Lagoonogenic barriers are mainly developed in the MB1-2 layer, with thicknesses ranging from 2.5 m to 12 m, and they are distributed as layers or sheets (Figure 4).
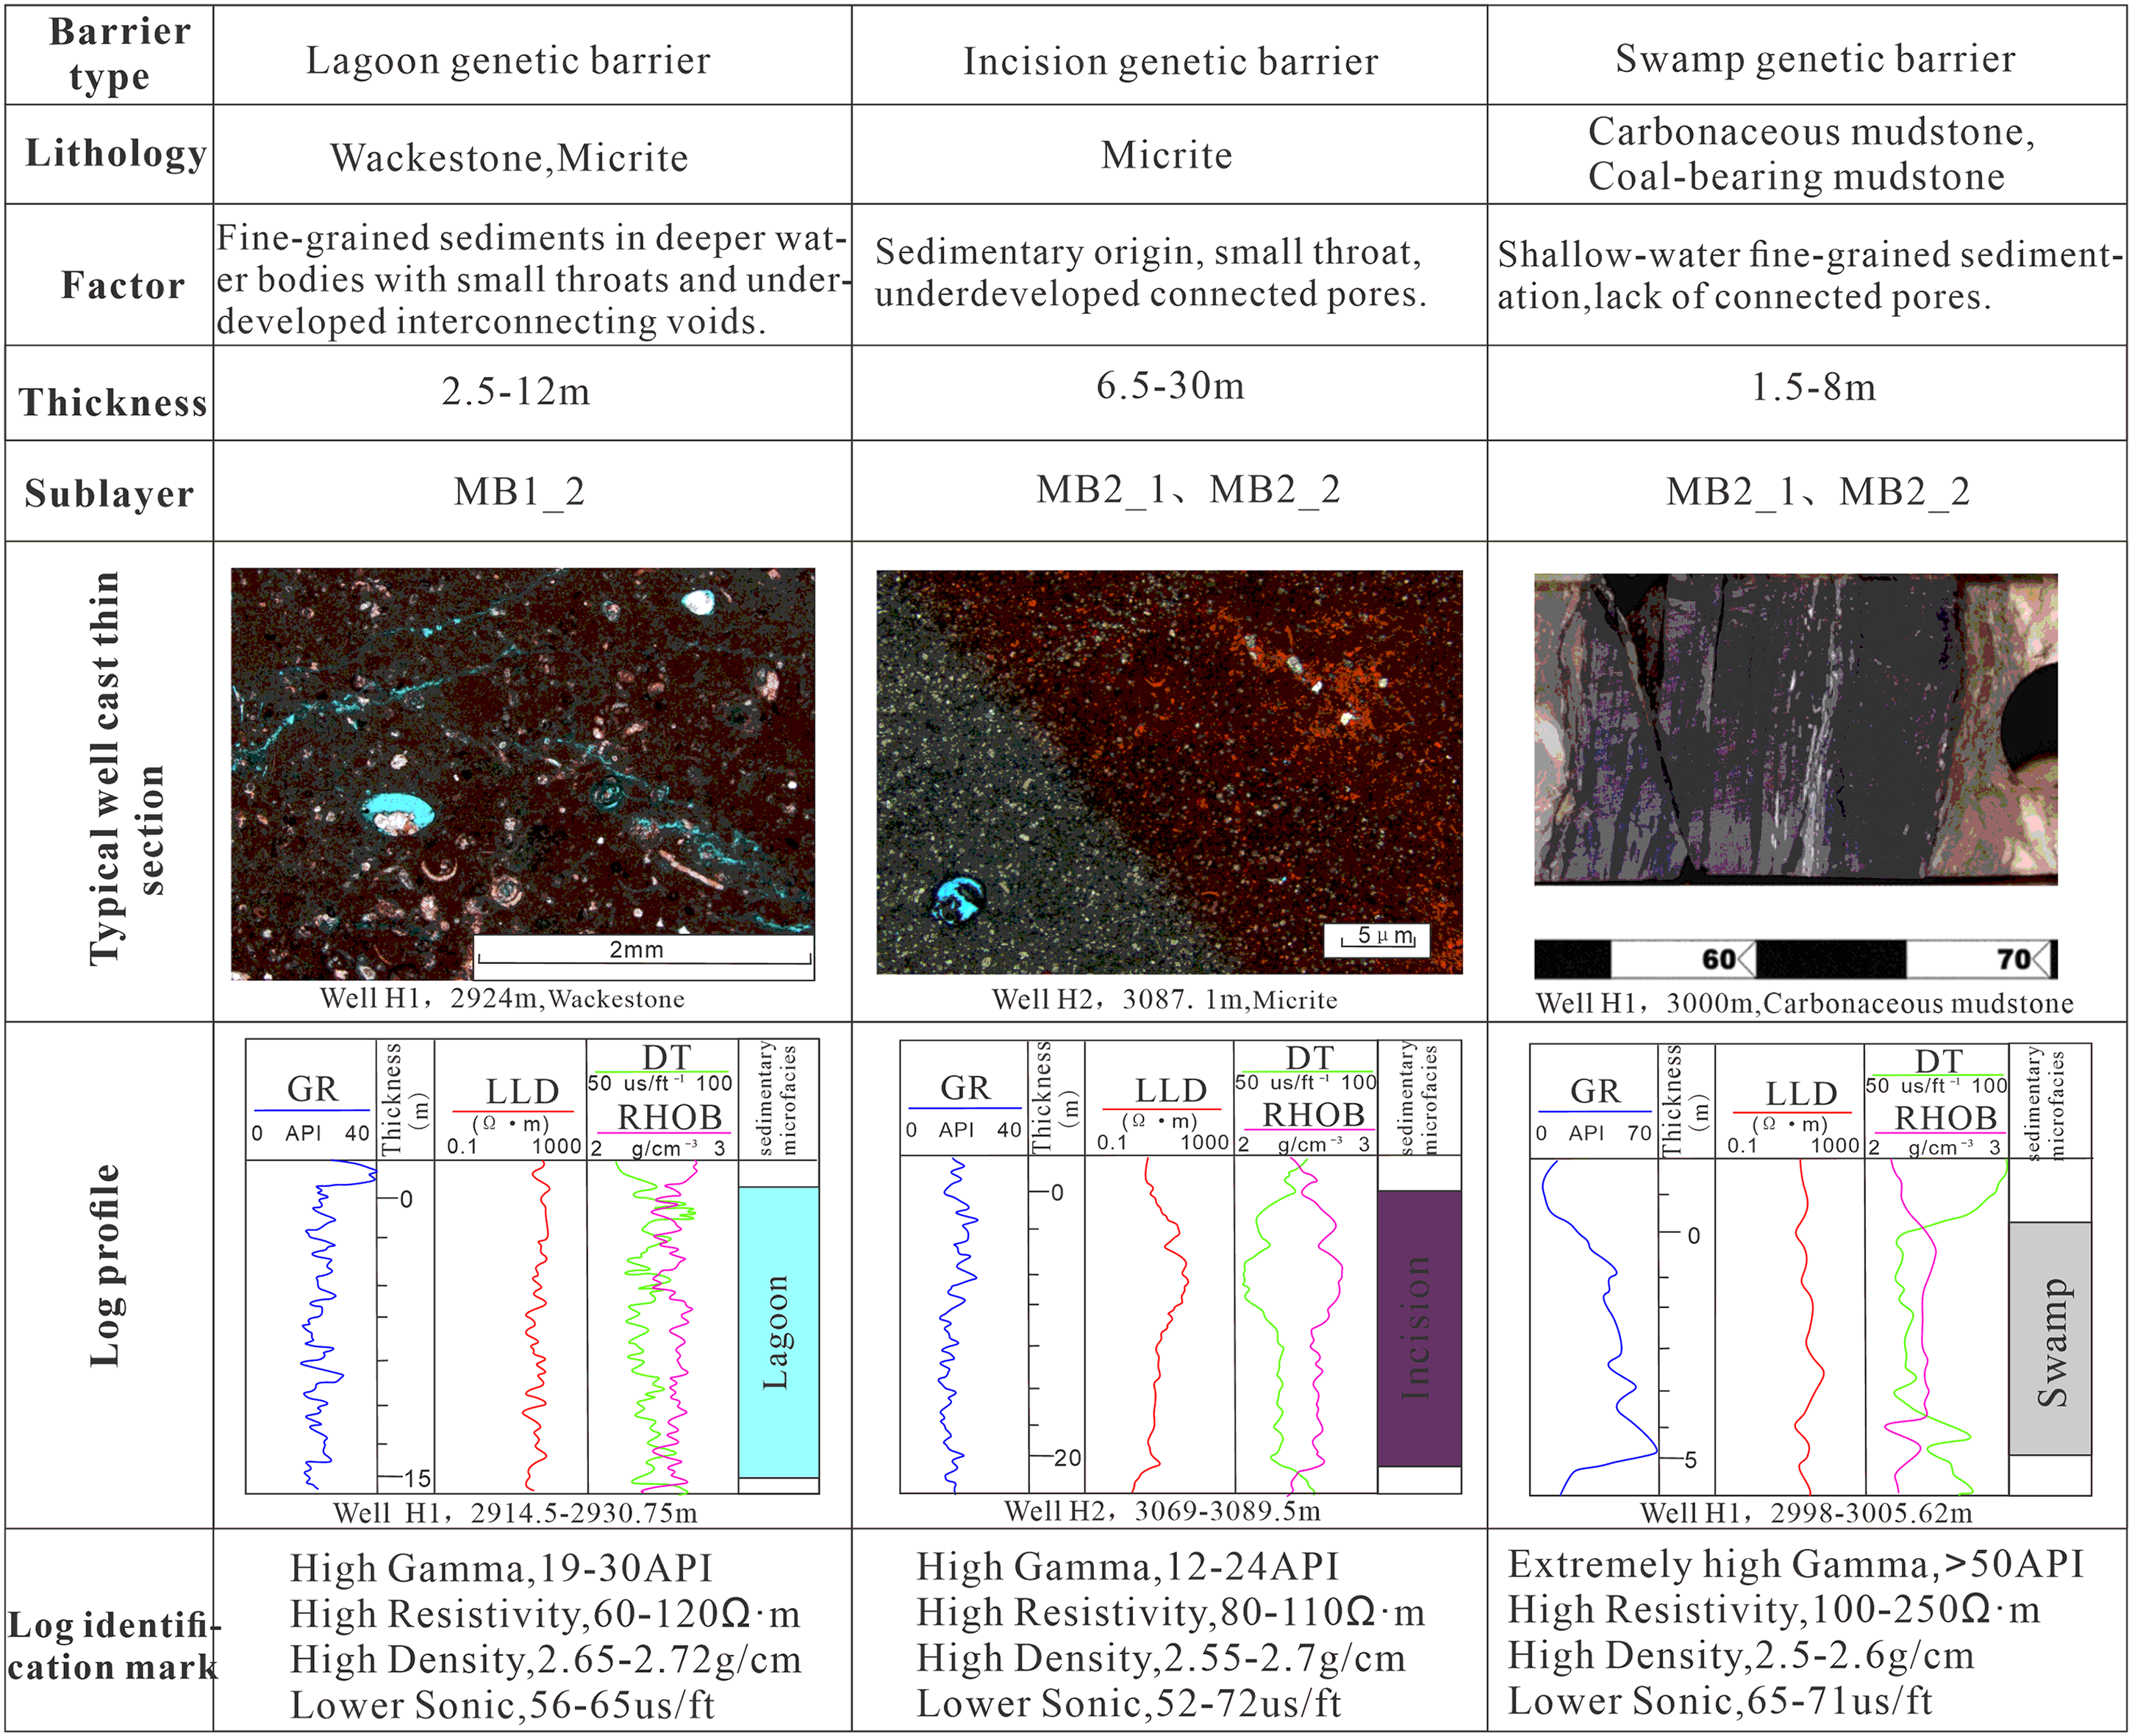
Development characteristics and identification of different genetic layers in Mishrif Formation of Y Oilfield.
The second category consists of incised valley-fill barriers. These barriers originate from incised valley fill deposits, predominantly composed of micrite (micrite consists almost entirely of carbonate mud with particle sizes of 0.001–0.004 mm, containing minimal allochems. In contrast, lagoonal limestones may include more bioclasts, such as coral and algal fragments, whose biological activity influences the texture and composition of the limestone). The incised valley exhibits a “U"-shaped external cross-sectional profile and vertical aggradational internal stacking patterns. The fill is dominated by micrite and wackestone with chert nodules. Gamma-ray (GR) log responses show weak bell-to-funnel shapes, and acoustic log values are low (initially decreasing then increasing, ranging from 52 to 76 μs/ft). These features represent elongated topographic depressions formed by fluvial erosion, filled with shallow-water nodular and argillaceous carbonate sediments (micrite). The lithofacies transition from floatstone with large bioclasts to wackestone containing rudist fragments. The basal section displays silicification and dolomitization, with meso- to sparry calcite cement filling burrows and fractures. On regional seismic amplitude maps, incised valleys exhibit slightly sinuous morphologies. These barriers primarily develop in the MB2-1 unit, forming laterally elongated, ribbon-like distributions. Their vertical thickness often exceeds 30 m, resulting in significant lateral compartmentalization (Figure 4).
The third category is the swamp barriers. These barriers are composed mainly of carbonaceous mudstone and coal-bearing mudstone deposited in shallow environments. They exhibit abnormally high gamma values on well logs. Swamp barriers are mainly developed in the MB2-1 and MB2-2 layers, with thicknesses ranging from 1.5 m to 8 m, and they are distributed in the form of thin beds (Figure 4). The various types of barriers are stacked and distributed both vertically and horizontally, with a wide planar spread and good continuity. These barriers are found in more than 85% of the oil-bearing area, indicating strong reservoir heterogeneity. This heterogeneity restricts the effective exploration and development of the reservoir to a certain extent.
Impact of interlayer heterogeneity on water injection development
In the Mishrif Formation of Y oilfield, the longitudinal physical properties of reservoirs vary significantly due to differences in their genesis. The transition of different sedimentary microfacies leads to substantial variations in the vertical and horizontal distribution of these properties. High-permeability strips and concealed physical barriers are present within the reservoirs, and various types of reservoirs and barriers intersect and overlap both vertically and horizontally. As a result, in the case of multi-layer co-production, problems such as single-layer breakthrough in water injection wells and inter-layer interference in oil production wells are common. High-permeability layers form dominant seepage channels with low residual oil saturation, while low-permeability layers exhibit poor water flooding utilization (Dou et al., 2002). Reservoir numerical simulation studies indicate that differences in inter-layer permeability heterogeneity significantly affect water injection development. Taking the MB1_2B layer of wells Y6 and A9D2 as examples (Figure 5), the upper part is dominated by tidal channel deposition with high permeability. Due to the strong permeability heterogeneity and gravity differentiation of injected water, the injected water from well A9D2 causes a single-layer breakthrough in the high-permeability layer, leading to uneven water flooding and the formation of a dominant seepage channel.
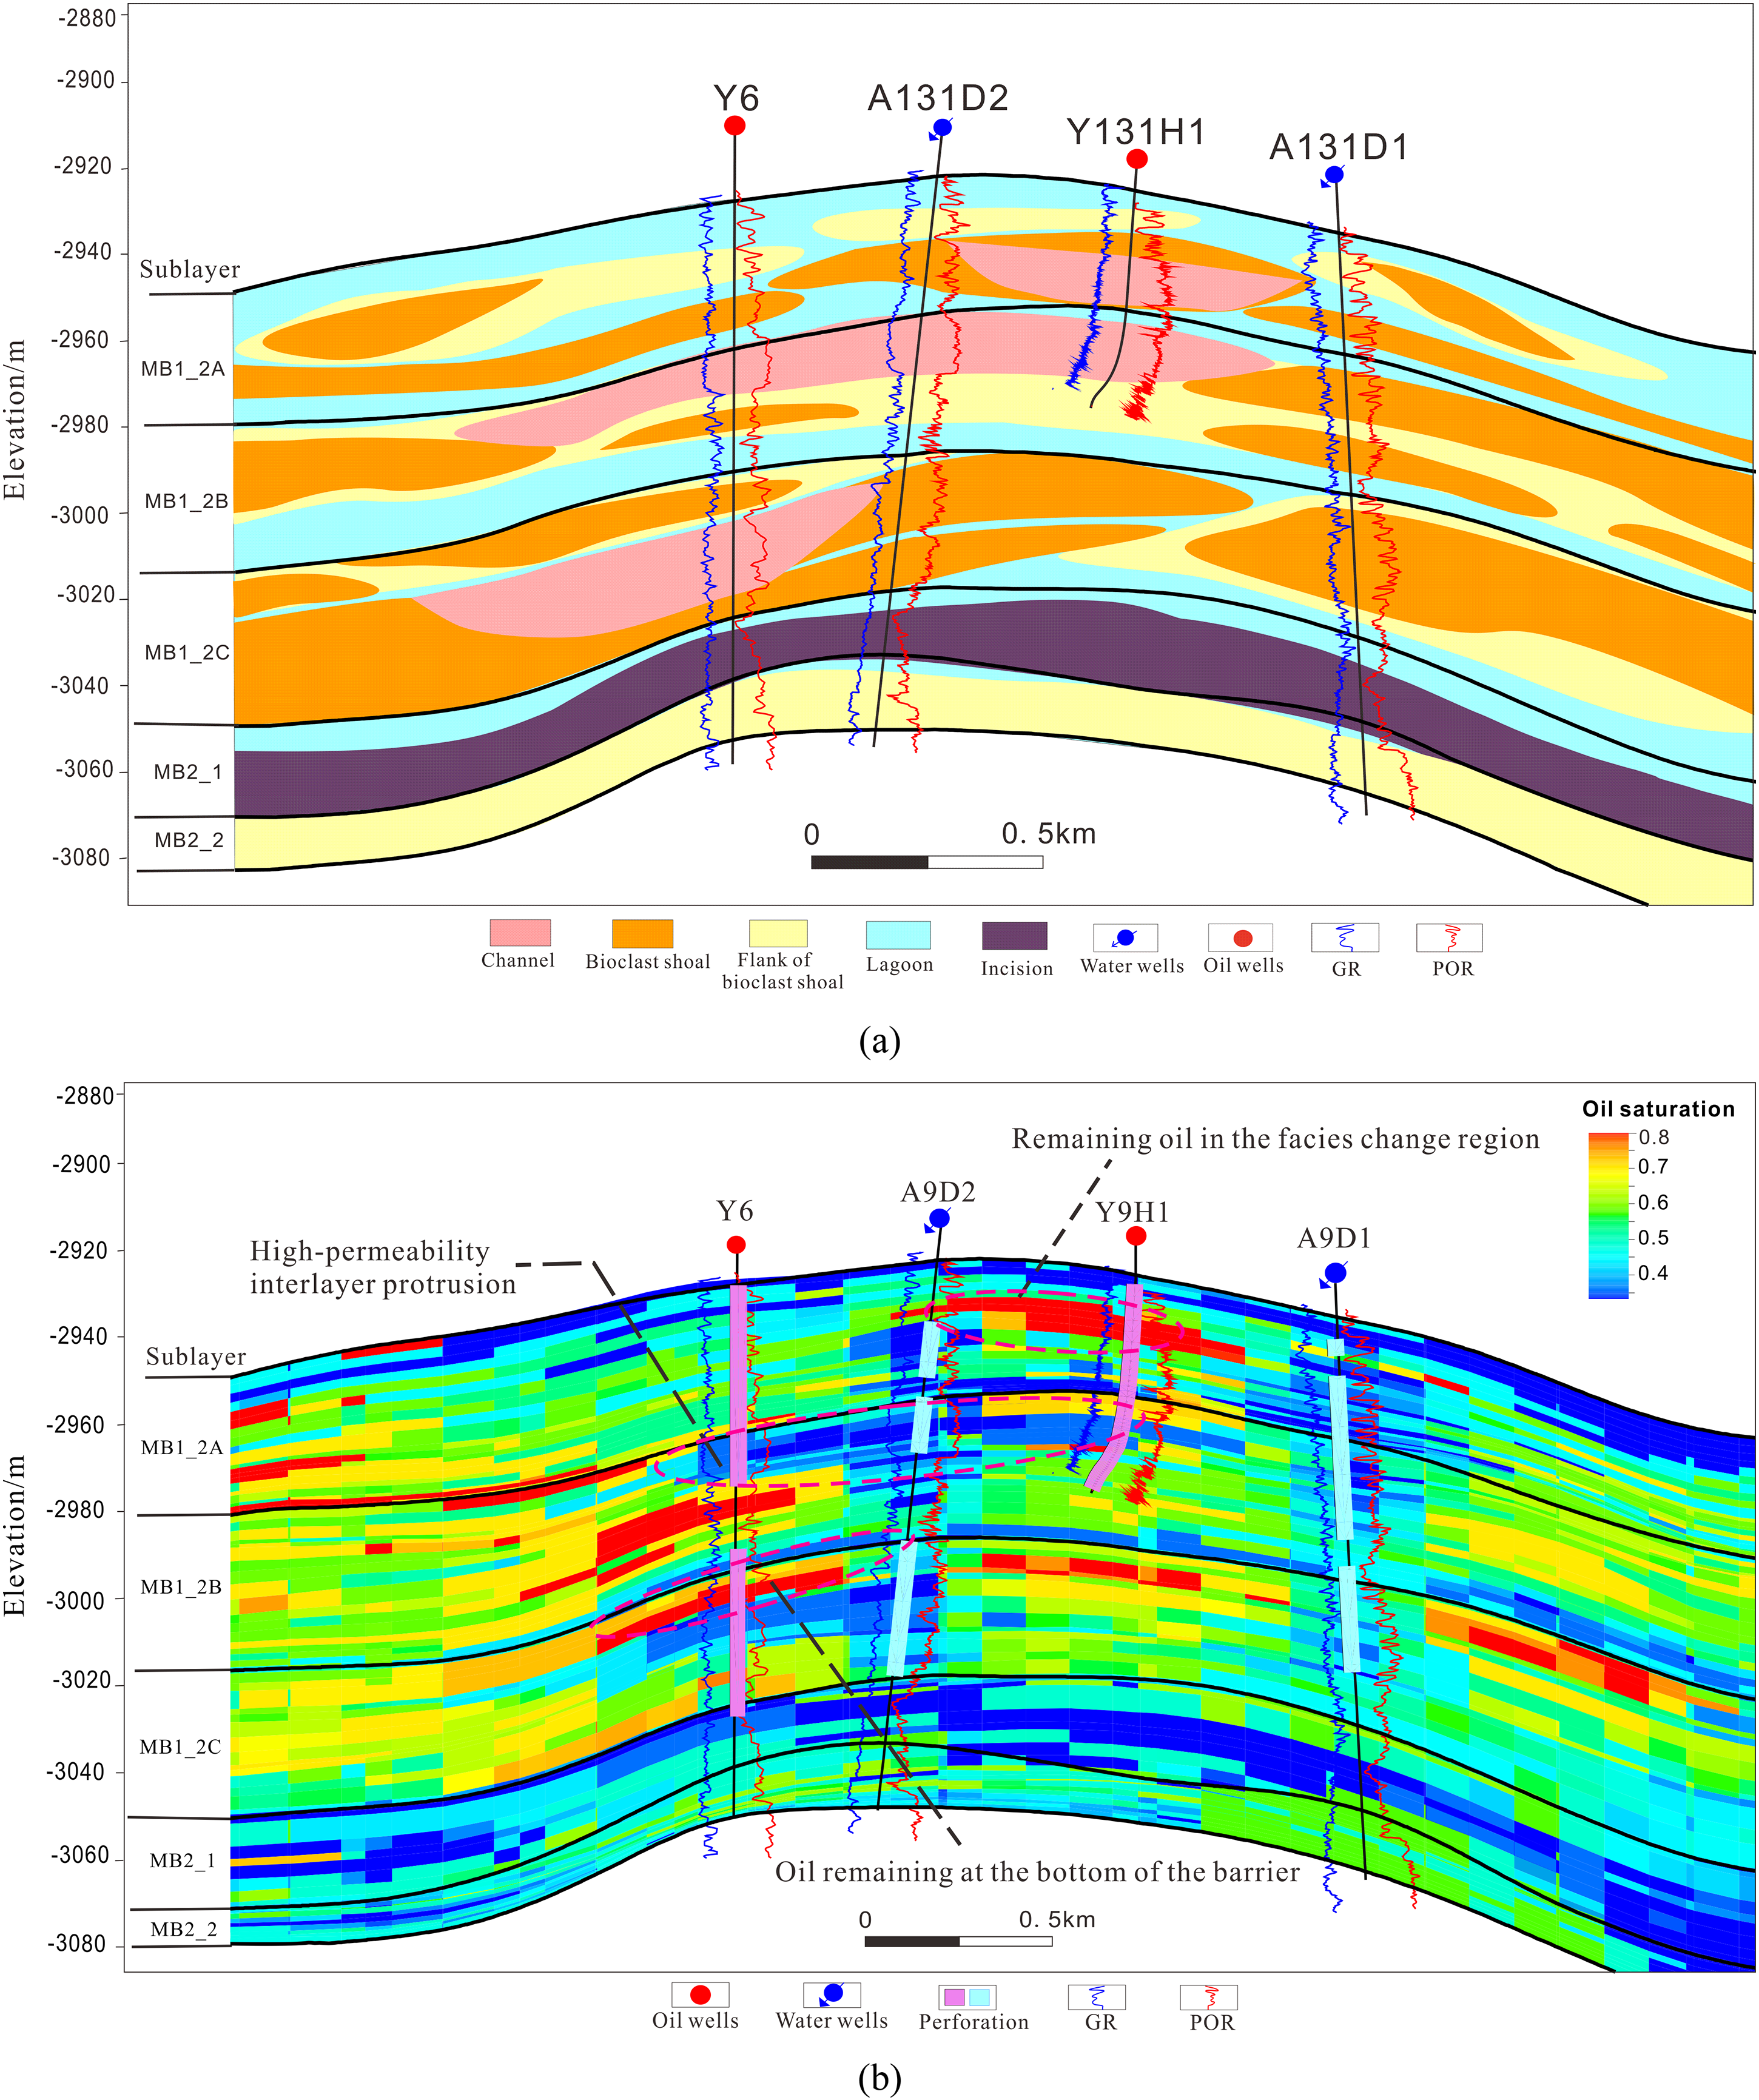
(a) Sedimentary microfacies profile through well Y6-A9D2-Y9H1-A9D1; (b) Remaining oil saturation profile through well Y6-A9D2-Y9H1-A9D1. The location is shown in Figure 1(a) (red profile).
Additionally, the distribution of interval barriers also influences the distribution of remaining oil and the advancement of water injection. For example, in the MB1_2C sublayer of wells Y6 and A9D2 (Figure 5(a)), a stable lagoon system is separated by impermeable layers. Due to the barrier effect, fluid flow is restricted, leading to uneven displacement at the base of the barrier and poor water flooding efficiency. Consequently, residual oil is more concentrated at the bottom of the barrier (Figure 5(a)).
The physical property differences caused by sedimentary microfacies changes also impact the distribution of remaining oil. For instance, in the MB1_2A sublayer of wells Y9H1 and A9D2, well A9D2 penetrated a bioclast shoal, while well Y9H1 encountered a Tidal channel (Figure 5(a)). The large differences in physical properties between these reservoirs lead to lateral facies changes, which can cause inter-layer interference during development. Well A9D2 shows weak water absorption at the top of the MB1-2A layer, where injected water either does not penetrate or penetrates weakly. In contrast, the water flooding efficiency in the adjacent well Y9H1 is also limited. As a result, well Y9H1 retains a significant amount of residual oil at the top of the MB1-2A layer. However, at the top of the MB1-2B layer, where the Tidal channel reservoir has good physical properties, the water flooding degree is higher, and only a small amount of remaining oil is present at the edges between wells (Figure 5(b)).
In summary, strong inter-layer heterogeneity can lead to issues such as layer breakthrough and inter-layer interference. To address these problems, specific development measures, such as subdividing development layers and implementing stratified water injection, should be adopted to enhance reservoir quality.
Intra-heterogeneity and its impact on water injection development
Intra-layer heterogeneity refers to the variation of reservoir parameters within a single layer, including the rhythmic characteristics of dominant sedimentary microfacies, types and properties of Interlayer, etc. It is a key geological factor that controls and influences the vertical sweep efficiency of injected fluids and the distribution of remaining oil within the layer. This study primarily focuses on the rhythmic characteristics of sedimentary microfacies and the influence of intra-layer barriers.
Rhythm of vertical permeability
The sedimentary facies of the MB1_2 submember of the Mishrif Formation are primarily characterized by restricted platform sedimentation. The main sedimentary microfacies include channels, bioclast shoals, shoal flanks, and lagoons. A study of the logging curve characteristics and core observations from the Mishrif Formation in the Y oilfield reveals that the rhythmic patterns in this formation can be classified into positive rhythm, reverse rhythm, and homogeneous rhythm. Among these, positive rhythm accounts for 70.2%, reverse rhythm accounts for 10%, and homogeneous rhythm accounts for 18%. Positive rhythm is predominantly developed in channel or bioclastic shoal facies. These two microfacies are the primary reservoirs in this area and exhibit favorable physical properties. The lithology is mainly packstone and grainstone, with a thickness of about 10–12 m. The corresponding logging curves show low gamma values and increasing resistivity (Figure 6(a)).
Different rhythm types and logging response characteristics. (a) Positive rhythm; (b) homogeneous rhythm and (c) reverse rhythm.
Secondly, Homogeneous rhythm is mainly developed in bioclastic shoal sedimentary environments. The lithology consists primarily of bioclastic grainstone with a small amount of grainstone. The thickness of each channel is relatively large, generally ranging from 10 to 20 m. The logging curve typically displays a box-like shape, with a clear abrupt change at the base of the sedimentary cycle (Figure 6(b)).
Furthermore, reverse rhythm is predominantly developed in shoal flank facies. The lithology is mainly packstone, with a small amount of wackestone. Shoal flank microfacies typically form at the edge of bioclast shoal facies, and their primary porosity is less developed compared to bioclast shoals. The thickness of these layers is relatively thin, generally ranging from 5 to 8 m. The corresponding logging curves exhibit high gamma values and low resistivity, showing a funnel-shaped pattern with an upward increase and a downward decrease. These curves are notably toothed, indicating medium porosity but poor permeability (Figure 6(c)).
Characterization of interlayer
Interlayer are relatively small impermeable or very low-permeability layers that directly affect the vertical permeability changes within a reservoir. Detailed core observations indicate that the argillaceous limestone interlayer is the most common type, characterized by clay grain sizes smaller than 0.005 mm. The thickness of this interlayer is generally small, typically ranging from 0.5 to 2.5 m. Composed mainly of wackestone and micrite, these interlayer form within channels or bioclast shoals, serving as barriers created by argillaceous sediments between reservoir units. Their physical property values are significantly lower than those of the surrounding reservoir rocks. The logging curves typically show high gamma values, with acoustic and resistivity curves slightly lower than those of the reservoir.
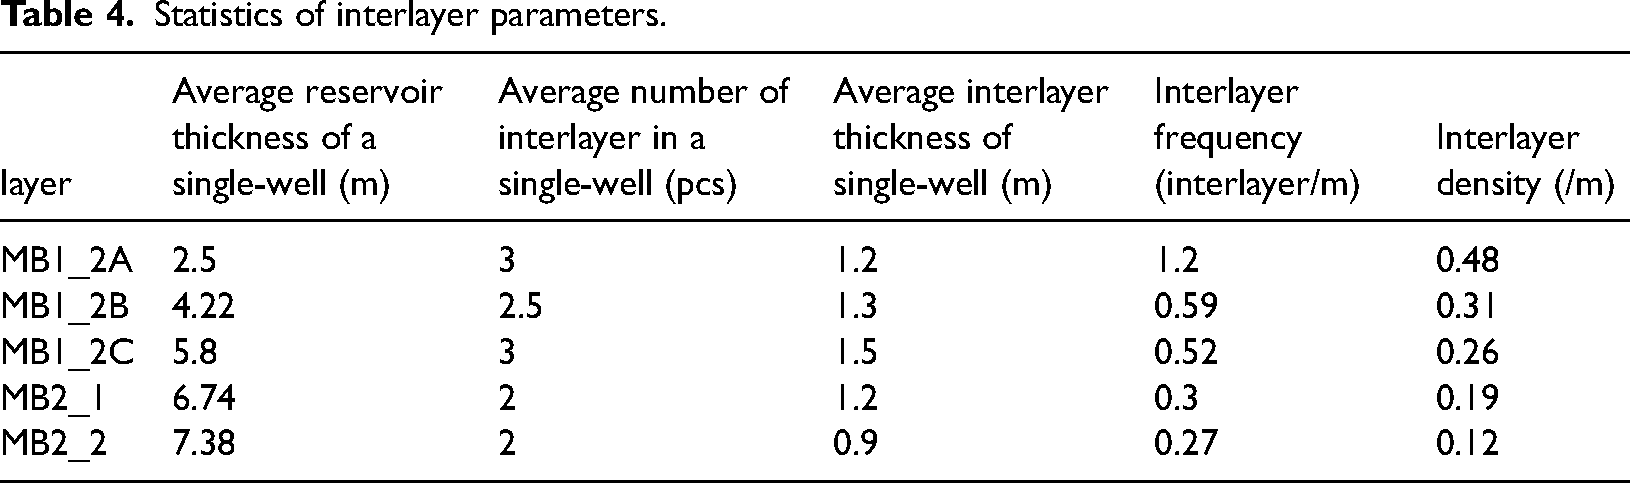
Quantitative statistics of interlayer density and thickness from 67 wells in the study area reveal that the MB1_2A reservoir has the thinnest layers but the highest interlayer frequency, reaching 1.2 layers/m. In contrast, the MB1_2B and MB1_2C reservoirs are thicker, with lower interlayer frequencies of 0.3 and 0.27 layers/m, respectively (Table 4). Regarding intra-barrier density, the MB1_2A interlayer has the highest density at 0.48 layers/m, while the interlayer density in MB2_2 is the lowest, at just 0.12 layers/m. Therefore, the interlayer in the upper layers, such as in MB1_2A, are well developed, while the interlayer in the lower layers, particularly in MB2_1 and MB2_2, are less developed. Interlayer Frequency is defined as the number of interlayer layers per unit thickness of the formation (layers/meter, layer/m). Interlayer Density refers to the ratio of the total thickness of interbedded layers to the total thickness of the reservoir (including interlayer).
Statistics of interlayer parameters.
Impact of intra-layer heterogeneity on water injection development
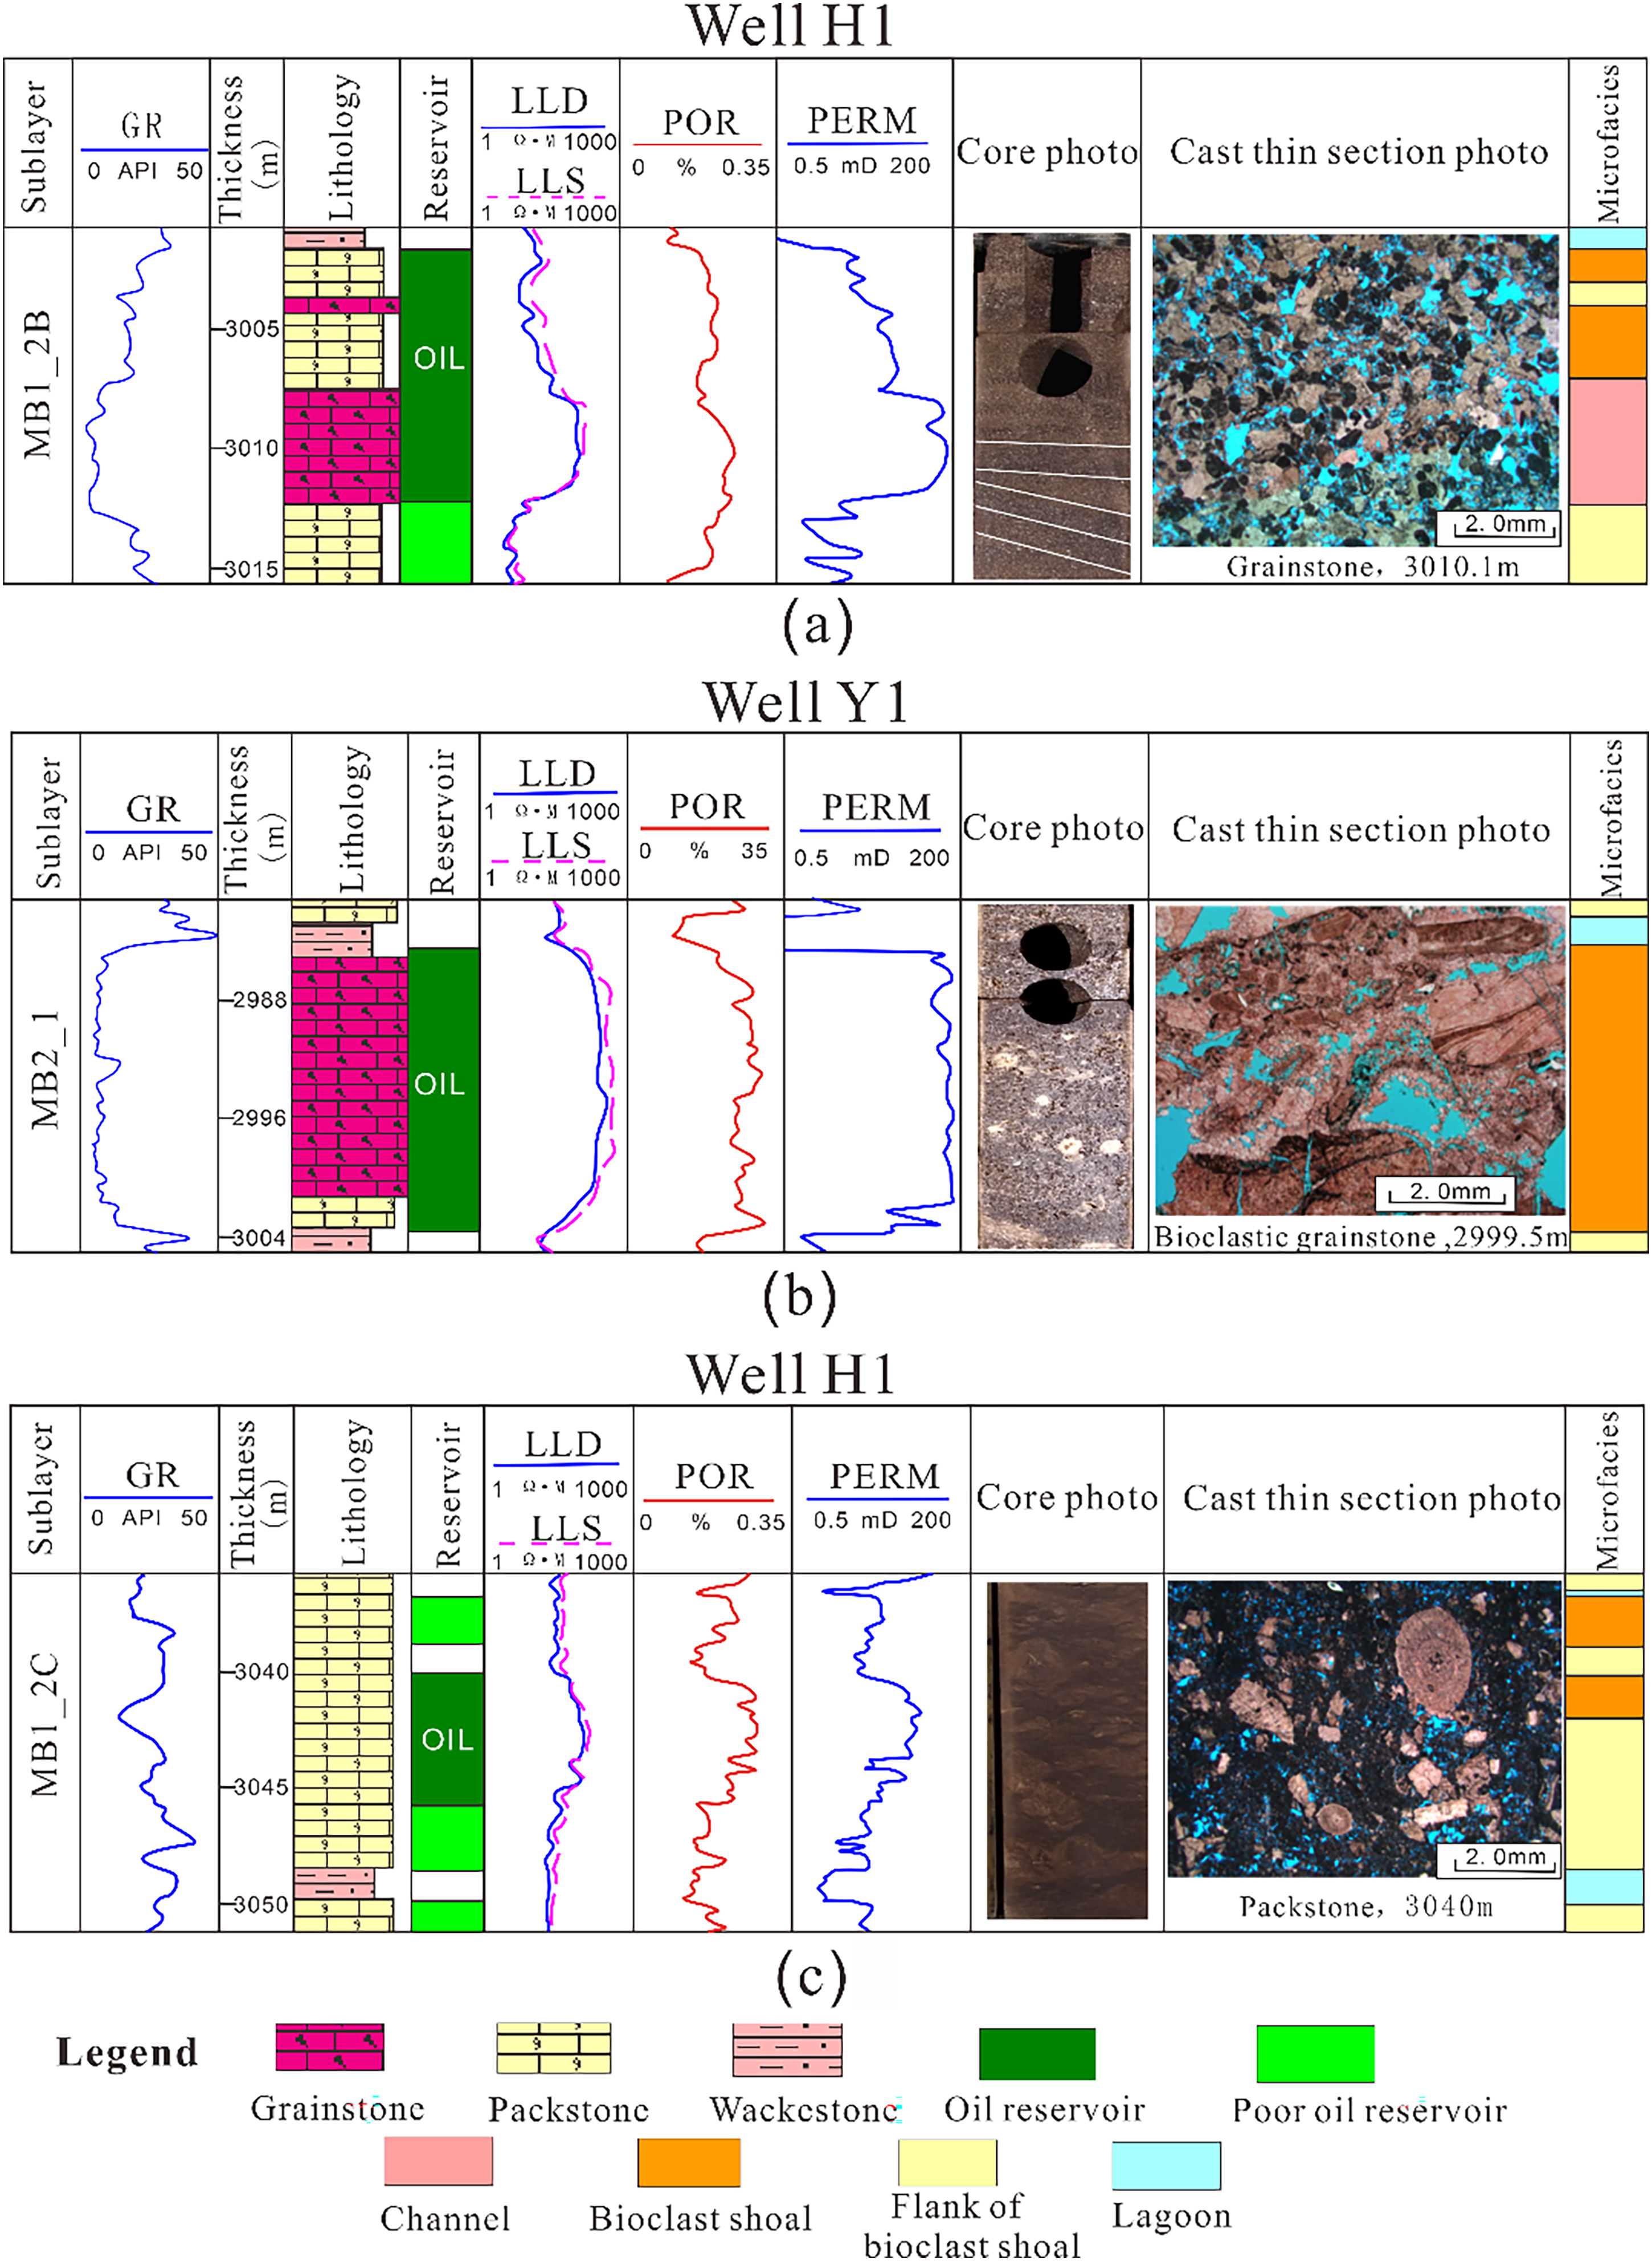
Due to the differences in vertical permeability, the intra-layer heterogeneity leads to significant variations in permeability, which in turn results in distinct rhythmic characteristics of vertical permeability and different patterns of remaining oil enrichment. The positive rhythm in bioclast shoals and channel microfacies characterizes the permeability of the MB1_2B layer in well H1. Affected by the strong intra-layer heterogeneity, the injected water preferentially flows to the bottom of the positive rhythm, leading to a high degree of oil displacement at the bottom. As a result, the oil saturation decreases significantly, and the remaining oil is not easily accumulated. Conversely, at the top of the positive rhythm, the influence of injected water is minimal, the water absorption capacity is weak, and the oil displacement efficiency is poor, resulting in a higher degree of remaining oil enrichment at the top (Figure 7).
Remaining oil distribution patterns under different prosodic characteristics.
Secondly, the MB2_1 layer in well Y1 is characterized by a homogeneous rhythm, typical of a single bioclastic shoal microfacies. Due to the good physical properties and weak intra-layer heterogeneity, water flooding is uniform, resulting in a high overall oil displacement efficiency. As a consequence, the remaining oil is not easily accumulated, and the remaining oil saturation is low (Figure 7).
Additionally, the MB1_2C layer in well H1 exhibits reverse rhythm characteristics, with bioclastic shoal and shoal flank microfacies. The bottom of the reverse rhythm has poor physical properties, while the top has better physical properties. Due to the gravity differentiation of oil and water, injected water preferentially flows to the bottom of the reverse rhythm. This leads to the displacement of crude oil in the low-permeability bottom layer, improving the water flooding efficiency. Consequently, this layer also shows characteristics of homogeneous displacement (Figure 5).
It can be concluded that the vertical permeability rhythm causes finger-like water absorption within the layer, with water preferentially flowing along the high-permeability layers. The low-permeability layers exhibit poor water absorption capacity. As a result, the remaining oil is primarily enriched at the top of the positive rhythm, while the remaining oil in the homogeneous and reverse rhythms is less concentrated, leading to better oil displacement efficiency.
Plane heterogeneity and its influence on water injection development
Plane heterogeneity in a reservoir refers to the variability in reservoir properties, such as porosity and permeability, caused by the shape of the reservoir and spatial changes within it (Feng et al., 2013). The degree of plane heterogeneity directly impacts the extent of water flooding and the efficiency of water injection, thereby controlling the distribution of remaining oil across the plane. Therefore, the following discussion focuses primarily on the characteristics of reservoir plane shape and the distribution of reservoir physical properties.
Characterization of reservoir distribution
Reservoir geometry is primarily controlled by sedimentary facies, and the complexity of reservoir shapes is a key factor influencing planar heterogeneity. The MB1_2 sub-member of the Mishrif Formation is characterized by a restricted platform depositional environment. Previous studies based on core and well-log analyses identified three dominant microfacies within the restricted platform: tidal channels, intra-platform shoals, and lagoons. Among these, tidal channels and bioclastic shoals constitute the main reservoirs. Taking the MB1_2B layer as an example (Figure 8), the reservoir exhibits overall favorable development. Two major tidal channels are identified in the study area:
One extends north-south, with a length of ∼3.2 km and width of ∼0.65 km. The other trends are northeast-southwest, spanning ∼4.7 km in length and ∼0.8 km in width.
Microfacies plan of MB1_2B sublayer.
Tidal channels display internal architectures dominated by vertical aggradation or lateral accretion, with lithology primarily comprising thick-bedded grainstone and abundant cross-bedding. Externally, they exhibit a meandering morphology and a cross-sectional profile characterized by a concave base and flat top. Bioclastic shoals are composed of grainstone and packstone with aggradational bedding. Internally, they form vertically aggradational bodies (convex base and convex top) with retrogradational and progradational stacking patterns. Externally, they appear as wedge-shaped or lenticular bodies. These shoals are distributed around tidal channels and along shoal margins, forming sheet-like planar distributions. Tidal channels and bioclastic shoals show good connectivity (Figure 8).
Between shoal margins, lagoon facies are present. The lagoon’s internal structure is dominated by vertical aggradation. Due to its widespread distribution and low-energy depositional setting, the lagoon floor serves as an area for muddy sedimentation. Its significant heterogeneity in physical properties impedes fluid flow between tidal channels and bioclastic shoals, making it the background facies of the study area.
Distribution characteristics of plane physical properties
Spatial variations in reservoir planar physical properties are among the key parameters for evaluating reservoir planar heterogeneity (Liu et al., 2019). The spatial distribution of these properties is primarily controlled by sedimentary microfacies and overall reservoir architecture, which are critical geological factors influencing hydrocarbon migration and accumulation (Yin et al., 2015). Taking the MB1_2B layer as an example (Figure 9), a high-precision porosity and permeability model was established based on the following workflow: ① Model Framework: A high-resolution sedimentary microfacies model was first constructed using Petrel software. ② Data Processing: Log curves from 67 wells in the dissection area were discretized, subjected to normal score transformation, and analyzed via variogram methods. ③ Property Modeling: Porosity and permeability models were generated under sedimentary facies constraints, from which planar contour maps of porosity and permeability were extracted. Statistical analysis reveals: ① Porosity ranges from 8% to 22%, averaging 14%. ② Permeability varies between (0.8–199) × 10−3 μm2, with a mean of 13.56 × 10⁻³ μm2, indicating moderate reservoir quality. A clear correlation exists between planar physical properties and sedimentary microfacies: ①Highest porosity/permeability occurs in tidal channel facies. ②Values gradually decrease toward bioclastic shoals and shoal flanks. ③Lowest properties are observed in lagoon facies. These trends highlight significant planar heterogeneity across different reservoir units.
Changes in physical properties of MB1_2B sublayer. (a) Contour plan of porosity in MB1_2B sublayer; (b) Contour plan of permeability in MB1_2B sublayer.
Influence of plane heterogeneity on water injection development
The plane effect of water injection is primarily controlled by the distribution of different sedimentary microfacies. By analyzing the remaining oil saturation map of the MB1_2B layer, the characteristics of reservoir plane heterogeneity and its influence on development are discussed (Figure 10). As injected water displaces reservoir fluids, it diffuses radially outward from the water injection wells, with a noticeable decrease in remaining oil saturation at the center. The extent of water flooding across the plane is mainly controlled by the spatial distribution of sedimentary microfacies and their physical properties. Due to the uneven permeability distribution within each microfacies, water flooding across the plane is also uneven. The areas with the highest remaining oil enrichment are primarily located in the tidal channel microfacies around Wells H1 and Y7D1 in the western part of the study area. This is largely attributed to the directional permeability, which causes oil to accumulate. Additionally, these areas lack an effective injection-production well network. As shown in the remaining oil saturation map, the water flooding is limited in these regions, resulting in poor displacement efficiency, with remaining oil accumulation between multiple production wells. In contrast, the injection-production well network in the eastern channel is relatively well-developed.
Contour plan of remaining oil saturation in MB1_2B sublayer.
Taking three water injection wells, A11D1, A12D3, and A12D1, as examples, the injected water displaces along dominant seepage pathways within tidal channels and sandbank flanks. This results in improved waterflood efficiency and expanded sweep coverage, consequently leading to lower residual oil saturation in these areas. In conclusion, based on planar heterogeneity characteristics and residual oil distribution patterns, waterflood efficiency in underperforming zones can be enhanced by converting production wells to injection wells or implementing well pattern densification. This approach improves oil displacement efficiency, reduces flow resistance, and enlarges water injection sweep area.
Conclusion
(1) Inter-layer Heterogeneity: The coefficient of permeability variation (VK), permeability rush coefficient (Tk), and permeability contrast (Jk) of the Mishrif Formation are high, indicating strong inter-layer heterogeneity. The barriers are primarily categorized into three types: lagoon, incision, and swamp, which are stably distributed throughout the region. The impact of inter-layer heterogeneity on water injection development is significant. The permeability differences between layers greatly affect water injection efficiency, with high-permeability layers prone to water flooding in a single direction. At the bottom of the barriers, the water flooding degree is low, resulting in higher remaining oil saturation. Additionally, the physical property variations caused by facies changes can lead to inter-layer interference, further complicating water flooding effectiveness.
(2) Intra-layer Rhythm: The intra-layer rhythm is predominantly positive-rhythm, accounting for 70.2% of the formation. In contrast, reverse rhythm and homogeneous rhythm are less common, accounting for 10% and 18%, respectively. The intra-barrier is primarily composed of argillaceous limestone, with a thickness ranging from 0.5 m to 2.5 m. Water injection development observations show that injected water primarily flows along the high-permeability layer at the bottom of the positive rhythm, resulting in significant displacement of oil at the bottom. Consequently, the remaining oil at the top of the positive rhythm is relatively enriched. In the case of homogeneous rhythm and reverse rhythm, water flooding is more uniform, leading to lower remaining oil accumulation and better overall development efficiency.
(3) Plane Heterogeneity: The plane heterogeneity is influenced by the distribution of tidal channels and bioclast shoals. The tidal channels are strip-shaped with clear directionality, while the bioclast shoals are distributed in a sheet-like pattern. The spatial variation in reservoir physical properties is largely controlled by the distribution of sedimentary microfacies. The physical properties of different layers exhibit considerable variation, contributing to strong plane heterogeneity. The range of water flooding across the plane is primarily affected by the distribution of sedimentary microfacies and the injection-production well pattern. The channel facies exhibit a strong directional flow, with the high-permeability layers forming a tongue-shaped water front. However, in areas with imperfect injection-production well networks, water flooding efficiency is poor, and remaining oil tends to accumulate between multiple production wells.
Footnotes
Declaration of conflicting interests
The authors declared no potential conflicts of interest with respect to the research, authorship, and/or publication of this article.
Funding
The authors disclosed receipt of the following financial support for the research, authorship, and/or publication of this article: This study was funded by the PetroChina Science and Technology Major Project (grant number 2023ZZ19-1), the Science and Technology Research Program of Chongqing Municipal Education Commission [grant number KJQN202101546], and the Science and Technology Innovation Fund for Postgraduates of Chongqing University of Science and Technology [grant numbers YKJCX2320129 and YKJCX2320142].