
Abstract
Precisely forecasting coke reactivity index (CRI) plays a critical role in the metallurgical industry, as it enables optimization of coke quality, leading to cost-effective production and efficient resource utilization. In this research, several machine learning predictive models based on extra trees, decision tree, support vector machine, random forest, multilayer perceptron artificial neural network, K-nearest neighbors, convolutional neural network, ensemble learning, and adaptive boosting using a dataset gathered from a coke plant are developed to predict CRI. To minimize overfitting in each algorithm, K-fold cross-validation methodology is employed during the training phase. The efficacy of each algorithm is visually represented through graphical methods and quantitatively evaluated using performance metrics. The findings indicate that maximum fluidity and mean maximum reflectance (MMR) exhibit a direct correlation with CRI while being indirectly relevant to moisture content, ash content, sulfur content, basicity index, plastic layer thickness, and MMR. Among the various predictive models evaluated, the random forest model emerged as the most accurate tool, according to the performance metrics of R-squared, mean square error, and average absolute relative error (%), with numerical values of 0.958, 3.718, and 2.545%, respectively, for the total datapoints. The developed tool can be easily used to accurately estimate CRI without needing experimental or field data reliably.
Keywords
Introduction
Coke plays an essential role in the metallurgical industry, functioning as both a reducing agent and a fuel in steel and iron manufacturing. The quality of coke significantly influences the efficiency and expense of metallurgical operations (Feng et al., 2024; Kardas and Pustějovská, 2019; Wang et al., 2024a; Yu et al., 2024). Coke is recognized for its capability to withstand the burden in a blast furnace for a defined duration. To assess the performance of coke under such conditions, coke-making facilities rely on two critical metrics: the coke strength after reaction (CSR) and the coke reactivity index (CRI). CSR determines the hot strength of coke, indicating its capability to support the furnace burden, whereas CRI evaluates its resilience by determining the mass loss following its reaction within the blast furnace (Nishi et al., 1982; Xie et al., 2024). As a result, CSR and CRI continue to serve as key quality standards for evaluating coke production.
Extensive research on coke production has demonstrated that its quality is shaped by several factors, including ash content, volatile matter, sulfur concentration, and the existence of a plastic layer. Consequently, various mathematical models have been developed to analyze the complicated correlation between properties of coke and coal blends (North et al., 2018a). However, developing a reliable model that precisely captures this relationship remains a significant challenge owing to the complex coal nature and the intricacies of the coke-making process (Agarwal et al., 2021). Recently, several methods have been employed to forecast coke quality via coal blends, including regression models, statistical analyses, and machine learning algorithms. Both linear and nonlinear regression models have been extensively utilized to establish relationships between coal blend properties and coke quality. While these models deliver accurate predictions when applied to consistent ovens and similar coal types, their reliability diminishes significantly when the composition of the coal blend changes or when used across different facilities (Bao et al., 2024; Lv et al., 2024; Stankevich and Zolotukhin, 2015).
In addition to regression models, statistical analysis methods have proven to be advanced tools for uncovering complex relationships between coal properties and coke performance metrics, such as CSR and CRI, in blast furnaces. PCA (principal component analysis), in particular, is a dimensionality reduction method that transforms numerous input variables into a smaller set of new features, retaining most of the essential information from the original data set (Lech et al., 2019; Zhang et al., 2025). This transformation allows PCA to simplify complex datasets, streamline calculations, and provide insights into the correlation between coke quality and coal properties. While conceptually similar, partial least squares (PLS) regression takes a different focus. Unlike PCA, which prioritizes dimensionality reduction, PLS regression emphasizes maximizing the predictive power of input variables (Ding et al., 2019; Feng et al., 2023). Despite this distinction, both approaches demonstrate comparable effectiveness. MARS, on the other hand, is specifically designed for handling complex non-linear regression problems, making it an ideal choice for forecasting coke quality (Chelgani et al., 2011). MARS (multivariate adaptive regression splines) employs a set of simple linear functions with constraints to address complex non-linear regression problems. Although statistical analysis techniques are effective in illustrating the correlation between coal characteristics and coke quality indices, they often require numerous variables and can be influenced by the choice of coal samples, resulting in constrained predictive accuracy.
Recently, the machine learning and artificial network algorithms (Yang et al., 2023) have emerged as powerful tools in various disciplines (Ghorbani et al., 2022, 2023a; Hajihosseinlou et al., 2024; Madani et al., 2017; Zhang et al., 2024). For example, Soltanian et al. (2024) successfully put forth data-driven models to predict the thermodynamic properties of hydrogen using state-of-the-art machine learning models. Abdi et al. (2021) predicted the adsorption capacity of carbon dioxide by porous metal organic frameworks using tree-based machine learning algorithms. Razavi et al. (2020) introduced accurate models to estimate carbon dioxide absorption by various solutions of amino-acids. The metallurgical industry has embraced the rapid progress of machine learning, which excels in uncovering complex relationships between predictor and response variables, offering superior predictive accuracy compared to traditional regression models (Chen and Bai, 2013). Recent research has focused on support vector machines (SVMs) and artificial neural networks (ANN), both of which have demonstrated effectiveness in accurately predicting coke quality (North et al., 2018b). Kang et al. utilized ANNs to examine the gasification of petroleum and coal coke (Kang et al., 2022). Yu demonstrated that a four-layer artificial neural network could successfully predict the hot strength of coke for a set of 10 samples, achieving predictions within an acceptable margin of error (Sidorov and Aristova, 2020). Zhang and Chen applied SVMs to study the impacts of ash content on furnace performance and the cold strength of coke, providing valuable insights into these critical relationships (Zhang et al., 2022). Their study demonstrated that SVM is capable of accurately predicting key variables in coke production. However, applying machine learning methodologies to forecast CSR and CRI remains limited, and their performance across diverse coal samples has yet to be thoroughly investigated (North et al., 2018a). Therefore, developing a comprehensive forecasting model that can reliably and accurately predict CSR and CRI across diverse coal blends is essential.
In this study, a comprehensive database from a coke production facility is collected and examined, with a focus on identifying outliers and suspected data points. Sensitivity examination is conducted using a relevancy index to investigate the impact of various input parameters such as moisture content, ash content, sulfur content, mean maximum reflectance (MMR), volatile matter content, plastic layer thickness, maximum fluidity, and basicity index on the CRI. Subsequently, multiple machine learning models are developed, leveraging algorithms such as decision tree, extra trees, K-nearest neighbors (KNN), random forest, multilayer perceptron (MLP) artificial neural network (ANN), SVM, convolutional neural network, ensemble learning, and adaptive boosting. These models are designed to accurately estimate the CRI based on its influencing factors. The robustness of the data-driven models is assessed via several metrics and visualized through graphical plots. The complete methodology in this paper is visually summarized in Figure 1.
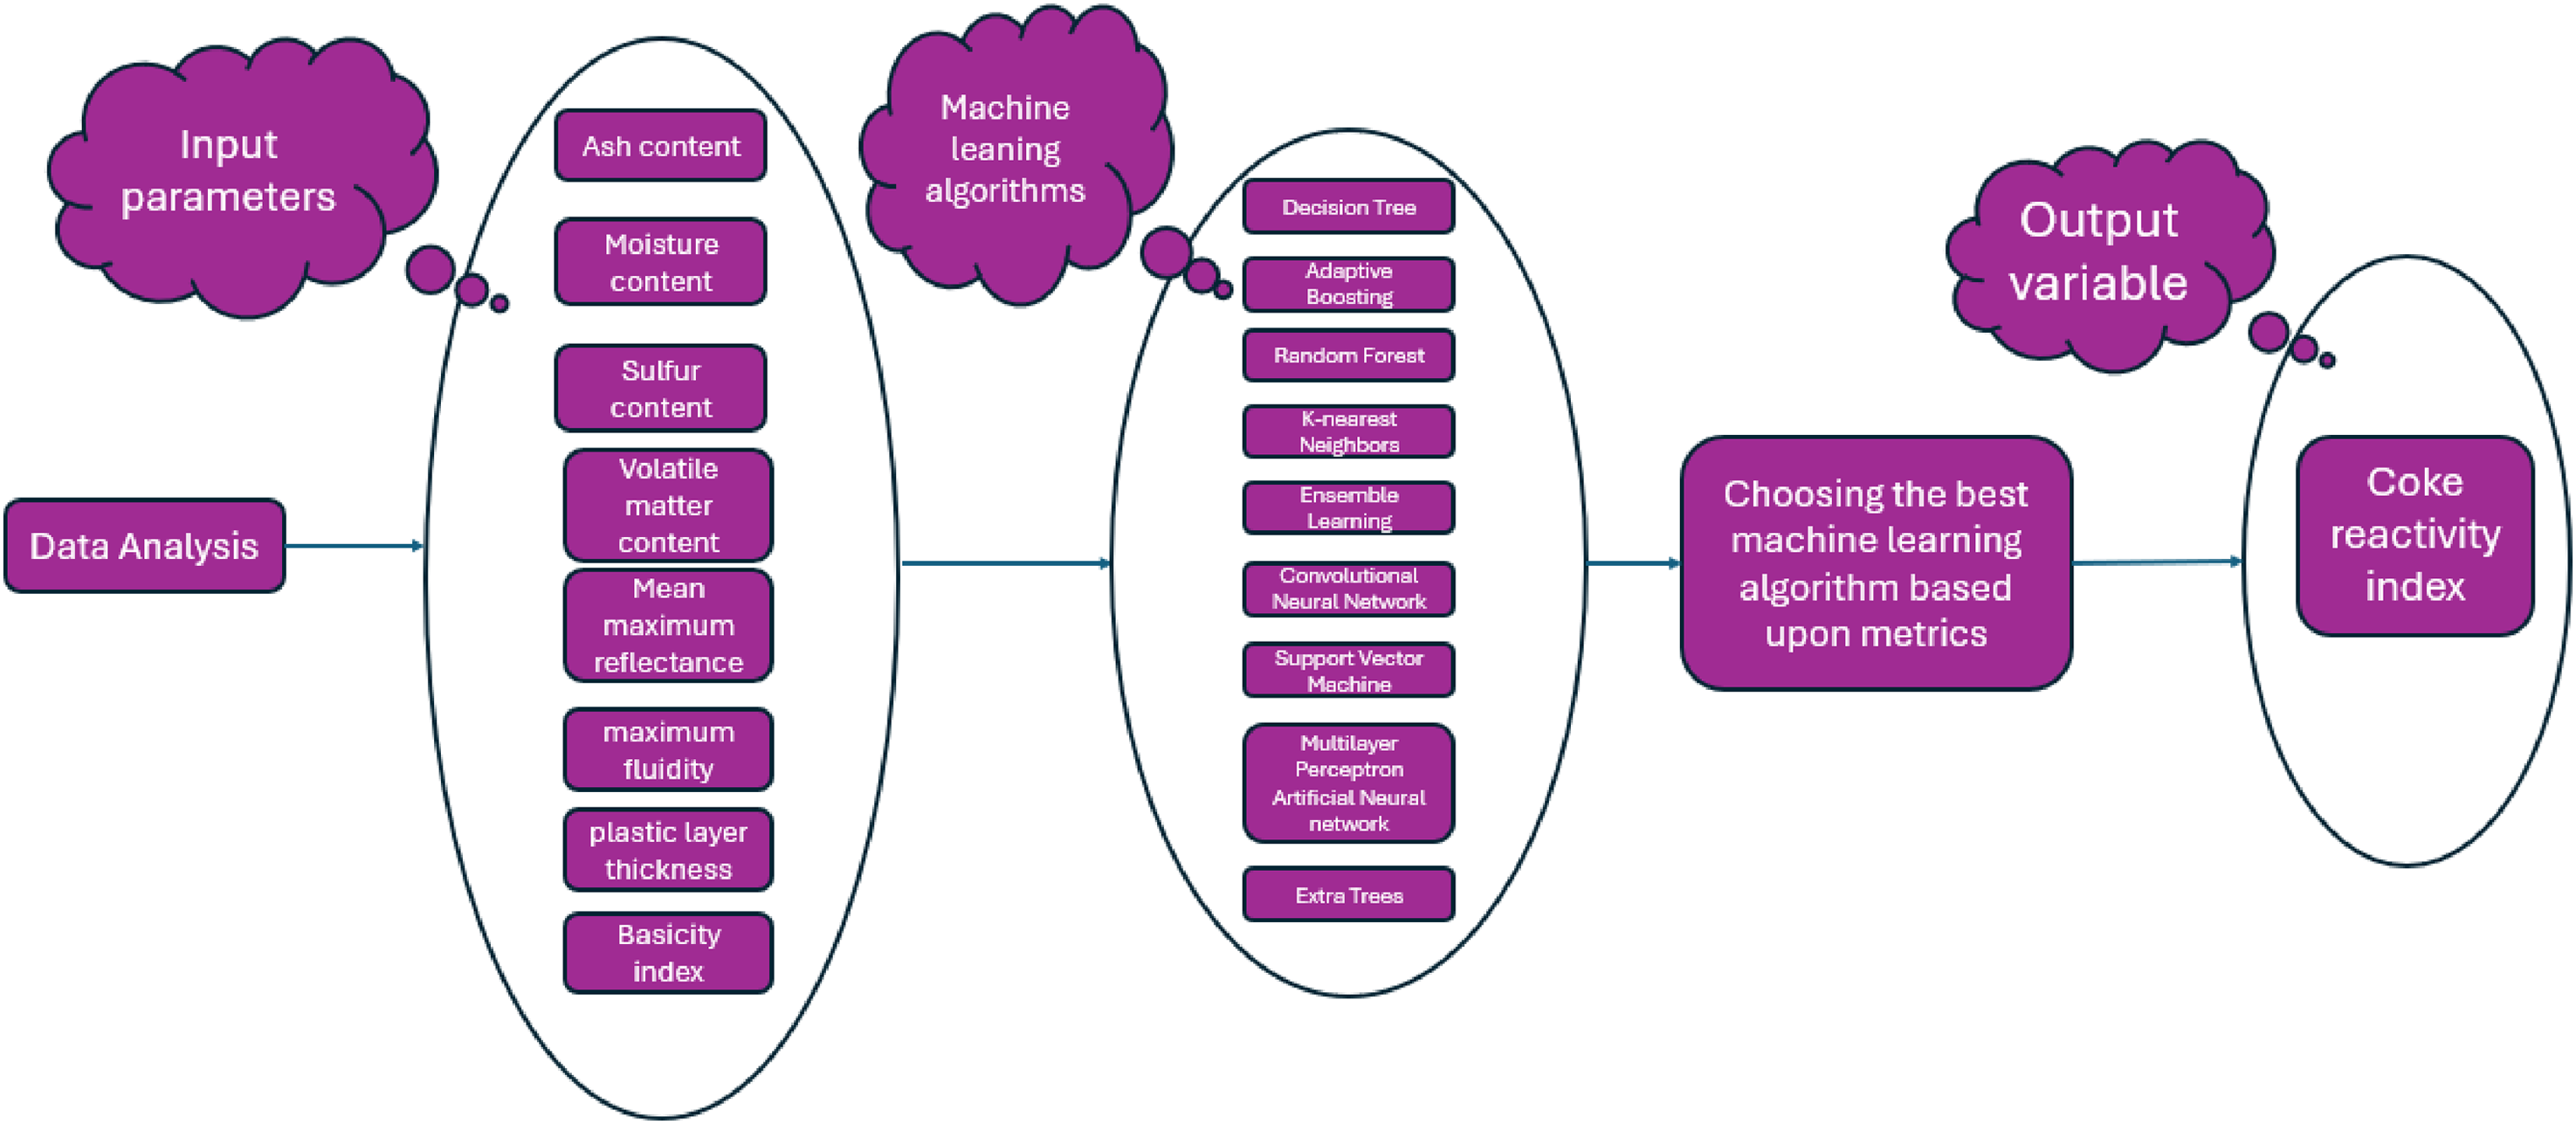
Methodological workflow to predict coke reactivity index using various machine learning models.
Machine learning backgrounds
Decision tree
A decision tree is an interpretable and versatile machine learning method known for both regression and/or classification jobs. It operates by segmenting the dataset into sub-portions based on feature values, represented as a tree-like structure of branches and nodes. At each internal node, a decision is made using a specific feature, with branches representing the possible outcomes of that decision. This procedure is repeated until a criterion like reaching a maximum depth is met. The terminal nodes, known as leaves, contain the final predictions or outcomes. This structure enables the algorithm to copy human decision-making methods, making it extremely instinctual and easy to visualize (Shi et al., 2023).
Decision Trees are typically easy in their structure, but they are also inclined to overfitting when trees are too complex. Despite their limitations, Decision Trees are extensively utilized across numerous areas including healthcare, finance, and marketing owing to their capability to work with both categorical and numerical data, interpret results clearly, and perform well on moderately sized datasets (Myles et al., 2004).
Adaptive boosting
Adaptive Boosting (AdaBoost) is a powerful ensemble learning technique that aggregates several weak classifiers, typically decision trees, to generate a powerful classifier. It is functioned by consecutively training several weak learners with each concentrating on correcting the mistakes of its predecessor. In this iterative process, datapoints that have been misclassified by the preceding learner are assigned higher weights, increasing their importance in the training of the next learner. This ensures that the model pays more attention to challenging examples, progressively improving its accuracy. The ultimate forecast is made using a weighted vote or combination of all the weak learners, emphasizing those with better performance (Lin et al., 2024).
AdaBoost is highly effective in reducing variance and bias, creating it a robust choice for many classification problems. However, it is delicate to outliers and noisy data as these may disproportionately influence the model due to the weight adjustment mechanism. AdaBoost works best with weak learners that perform somewhat more suitable than random guessing like shallow decision trees (also known as decision stumps). Its applications span numerous fields, including spam detection, face recognition, and medical diagnosis, where it is valued for its adaptability and ability to handle diverse datasets (Feng et al., 2020).
Random forest
Random Forest is a robust ensemble learning algorithm commonly applied to both classification and/or regression problems. It operates by constructing numerous decision trees while training and compounding their model outputs to generate an ultimate prediction. The training for each tree is conducted via a randomly selected subset of the data using bootstrap sampling and evaluates a random subset of inputs when determining splits at each node. This randomization promotes diversity among the trees, which aids to reduce the issue of overfitting and enhance the model's overall reliability. For classification tasks, the ultimate forecast in Random Forest is estimated by majority voting among the trees, whereas for regression jobs, it is computed as the mean of predictions from all the trees (Ghorbani et al., 2023b).
Random Forest is recognized for its flexibility and capability to work with large data sets with high dimensionality, including datasets with missing values or categorical features. It is less prone to overfitting respective to discrete decision trees because the aggregation of various trees smoothens out noise and prevents the model from focusing too much on detailed designs in the training data. While it offers high accuracy and interpretability through feature importance measures, it can be computationally intensive and may not perform as well on datasets with very sparse or unbalanced classes. Random Forest is commonly implemented in arenas like healthcare, finance, and ecology for tasks such as risk assessment, disease prediction, and species classification (Oshiro et al., 2012).
K-nearest neighbors
The KNN algorithm is a simple yet effective supervised method appropriate to classification and/or regression jobs. KNN identifies the k closest data points (neighbors) to a query point within the feature space using a specified distance measure, such as Manhattan or Euclidean distance. For classification, KNN assigns the query point to the most typical class between its k neighbors. In regression, KNN predicts the output by averaging the values of the k nearest neighbors. This versatile algorithm provides a straightforward approach to solving various predictive problems. KNN is an instance-based algorithm, meaning it does not explicitly build a model during training but rather relies on the training data directly during prediction (Zhang et al., 2017).
KNN is valued for its simplicity and flexibility, as it can handle multi-class problems and non-linear decision boundaries. However, it may be computationally costly with huge data sets, because predictions require calculating distances to all training samples. Moreover, its performance depends heavily on the choice of kk and the distance metric, as well as the scale and quality of the data. Proper normalization or scaling of features is often necessary to prevent bias towards variables with larger ranges. KNN finds applications in pattern recognition, anomaly detection, and recommendation systems where its ease of implementation and capability to capture local data structure are advantageous (Sha’Abani et al., 2020).
Ensemble learning
Ensemble learning is a machine learning method that combines the outputs of multiple models to improve overall prediction accuracy known as “base learners,” to build a more precise and reliable predictive method. The underlying principle is that a group of models working together can find more suitable functionality and generalization than any solitary model as different models may capture diverse patterns in the data or correct each other's errors. Ensemble methods can be largely segmented into two sorts: boosting and bagging. Bagging, exemplified by Random Forest, minimizes variance by training various models independently on randomly selected sub-portions of the dataset and combining their predictions, typically through averaging. Boosting, such as AdaBoost, tackles bias by training models sequentially, with each new model prioritizing the correction of errors made by its predecessors (Dong et al., 2020).
Ensemble learning is extensively made use of in both regression and/or classification tasks because of its capability to improve model accuracy, reduce overfitting, and enhance robustness against noisy data. It can integrate various base models including decision trees, neural networks, and SVMs, making it highly flexible. Popular ensemble methods such as Random Forest, Stacking and Gradient Boosting have become staples in competitions and real-world applications in many areas like healthcare, finance, and natural language processing. Despite its strengths, ensemble learning can increase computational complexity and may reduce interpretability, as the combined model's behavior becomes harder to explain than that of individual models (Sagi and Rokach, 2018).
Convolutional neural network
Convolutional neural networks (CNNs) are a specialized deep learning architecture for processing grid-structured data, including audio. Inspired by the human visual system, CNNs are adept at handling spatial hierarchies and patterns in tasks like object detection, image classification, and video analysis. Their typical architecture comprises pooling layers, convolutional layers, and fully connected layers, enabling efficient processing and learning from spatial data. Within the structure of convolutional layers learnable filters (kernels) are utilized to excerpt local features from input data, identifying patterns such as edges, shapes and textures. Pooling layers, such as max pooling, decrease the spatial feature maps dimensions, thus enhancing computational efficiency and providing robustness to spatial transformations like scaling and translation. This combination of layers lets CNNs to efficiently detect and process spatial and hierarchical features in data (Wang et al., 2024b; Wu, 2017).
One of CNNs’ important gifts is its capability to automatically learn hierarchical feature representations, where deeper layers capture more abstract and complex patterns. This makes CNNs highly effective for analyzing structured data with spatial relationships. Applications of CNNs extend beyond image processing to include natural language processing (e.g. text classification), medical imaging (e.g. tumor detection), and even audio signal analysis (e.g. speech recognition). While CNNs are powerful, they require substantial computational power and huge values of data for effective training. Advances like transfer learning and pre-trained models have helped address these challenges, broadening CNNs’ accessibility and impact across diverse fields (Wang et al., 2024c; Yamashita et al., 2018).
Support vector machine
SVMs are popular supervised learning algorithms used for regression and classification tasks. SVM's core principle involves finding an optimal hyperplane that divides data into different classes in high-dimensional space. It maximizes a margin, known as support vectors, to enhance generalization and improve performance on unseen data. When data cannot be linearly separated, SVM employs the kernel trick, a technique that projects the data into higher-dimensional space, enabling the creation of non-linear decision boundaries. This adaptability makes SVMs a powerful tool for various predictive modeling applications. This transformation enables the algorithm to create non-linear decision boundaries, making it effective for handling complex datasets (Hearst et al., 1998).
SVM is highly efficient for handling high-dimensional datasets and is especially well-suited for scenarios where count of input factors surpasses count of samples. Its flexibility comes from the ability to apply various kernel functions, like polynomial, linear, and radial basis function (RBF), allowing it to adapt to diverse data types. However, SVM can be computationally demanding when working with huge datasets, and its performance heavily relies on meticulous tuning of hyperparameters like adjusting parameter (C) and the kernel-specific parameters. SVM has found applications in fields like bioinformatics (e.g. gene classification), text categorization, and image recognition, where it is valued for its accurateness and capability to cope with complex decision boundaries (Pisner and Schnyer, 2020).
Multilayer perceptron artificial neural network
The MLP, a prominent type of ANN, is widely recognized for its effectiveness in supervised learning tasks like classification and regression. The architecture of a standard artificial neural network comprises three primary components: an input layer, one or more hidden layers, and an output layer, each comprising interconnected neurons. Neurons perform computations by aggregating weighted inputs, applying an activation function such as ReLU, sigmoid, or tanh, and forwarding the outcome to subsequent layers. The hidden layers play a vital role in seizing intricate, non-linear patterns within the data, making MLPs particularly suitable for addressing complex challenges (Lu et al., 2024; Luo et al., 2022; Wang et al., 2024d).
MLPs are trained using the backpropagation algorithm, which optimizes the weights by reducing a loss function through gradient descent. While MLPs are effective for structured data and relatively small-scale problems, their performance can degrade on high-dimensional or unstructured data (e.g. audio or images) compared to specialized architectures like CNNs. Despite this, MLPs remain a versatile and essential component of machine learning, often used in fields like finance (e.g. credit scoring), healthcare (e.g. disease prediction), and marketing (e.g. customer segmentation), due to their simplicity, adaptability, and effectiveness for a broad range of applications (Chen et al., 2025; Wang et al., 2024e; Zhu et al., 2024).
Extra trees
Extremely Randomized Trees (Extra Trees) is an ensemble learning method that extends the principles of decision tree-based algorithms like Random Forest. It is designed for both regression and/or classification jobs. The primary distinction of Extra Trees lies in how it builds individual decision trees. Unlike Random Forest, where trees are trained using bootstrap sampling and splits are determined by optimizing a criterion (e.g. Gini impurity or information gain), Extra Trees uses the entire dataset without bootstrapping and selects split points randomly from a range of values for each feature. This increased randomness improves the model's generalization capability and diminishes the commonly-occurring issue of overfitting (Martiello Mastelini et al., 2022).
Extra Trees offers several advantages, such as computational efficiency due to simplified split selection and robust performance on datasets with noisy or irrelevant features. Its high degree of randomness makes it less sensitive to small changes in the data, improving stability. However, like other tree-based ensembles, it can become resource-intensive with very large datasets or high-dimensional feature spaces. Extra Trees is broadly utilized in tasks like image recognition, fraud detection, and bioinformatics, where its balance of simplicity, speed, and predictive power is especially valuable (Alfian et al., 2022).
Database analysis and modeling methodology
Statistical analysis of the gathered coke database
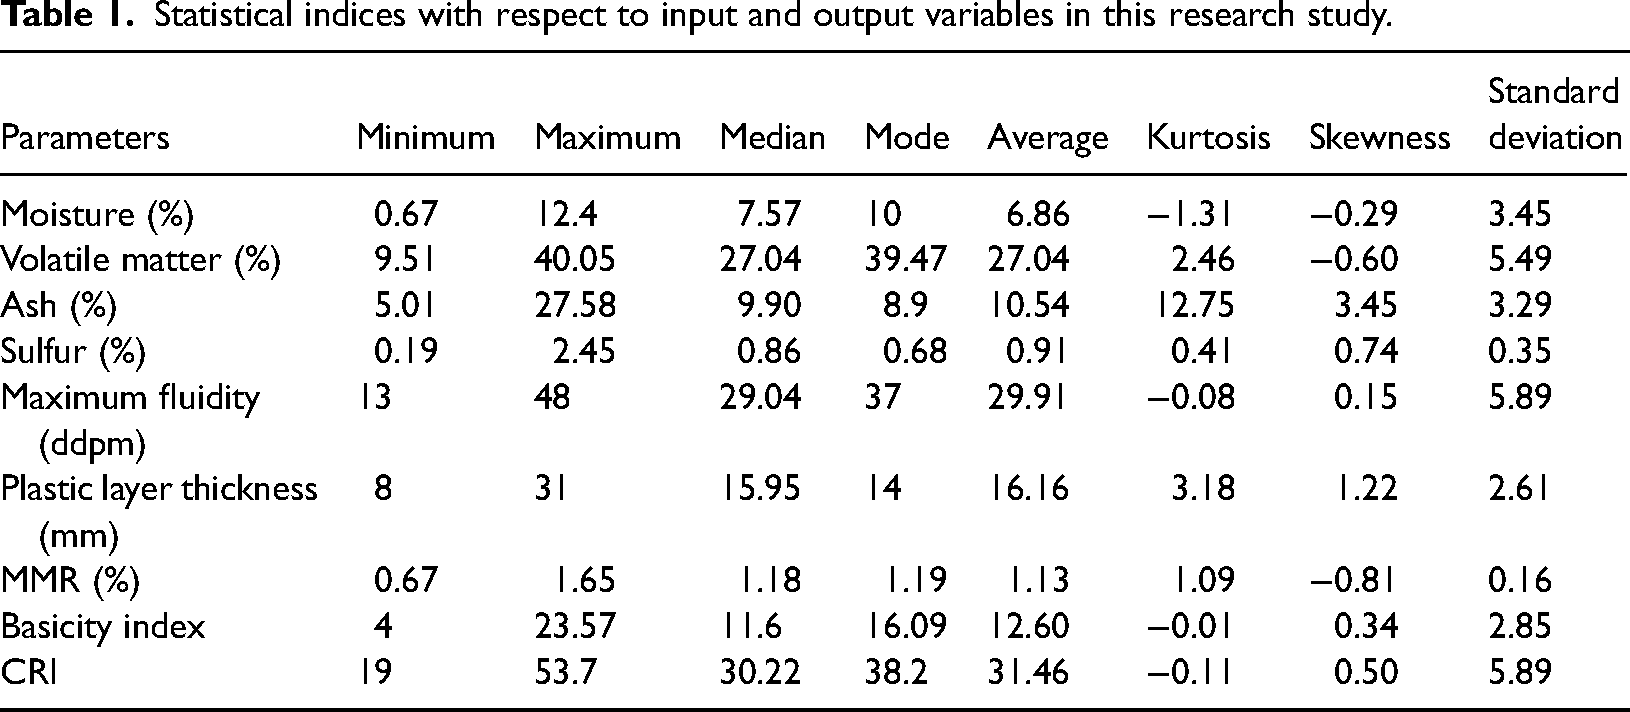
The dataset utilized in this study contains measurements of CRI and various predictor variables obtained from proximate analysis, ultimate analysis, petrographic analysis of coals, and coking properties. These variables are strongly associated with CRI and were selected based on their relevance to the coke-making process and data availability. The chosen predictors include moisture content, ash content, volatile matter content, maximum fluidity, sulfur content, MMR, basicity index and plastic layer thickness. The dataset consists of 616 samples collected from a coke plant, representing a diverse range of coal origins and characteristics. The predictor variables and CRI values were measured using standard methodologies, including those organized by the American Society for Testing and Materials (ASTM). This comprehensive dataset serves as a robust foundation for analyzing and predicting CRI in the context of coke production (Astm et al., 1950). Table 1 provides the statistical characteristics of input and/or output parameters.
Statistical indices with respect to input and output variables in this research study.
Modeling methodology
K-fold cross-validation is a popular statistical technique for evaluating the functionality of machine learning models. It partitions the training dataset into k equal-sized sub-portions called “folds.” Them, the training phase is carried out using k-1 folds and subsequently is validated on the residual fold. The so-called procedure is iterated k times, allowing each fold to serve as the validation set for one time. The final functionality indices are estimated by getting the average value of the outcomes due to all folds, yielding a reliable estimate of the model's effectiveness. K-fold cross-validation reduces the risk of overfitting or underfitting, ensuring a more dependable model assessment. K-fold cross-validation mitigates overfitting or underfitting risks associated with a single train-test split, ensuring a more reliable model evaluation (Wong and Yeh, 2019). The main benefit of K-fold cross-validation lies in its efficient use of data, particularly for small datasets where reserving a large portion for testing may limit the data available for training. K-fold cross-validation makes sure each datapoint is utilized once for testing and k-1 times for training, thereby providing a more balanced and unbiased assessment of the model's performance. This consistency makes K-fold cross-validation a reliable approach for model comparison and hyperparameter tuning, offering a thorough and equitable assessment. Additionally, it helps mitigate overfitting, especially when working with limited data samples (Jung, 2018). The choice of k is critical in shaping the effectiveness of K-fold cross-validation. Commonly used values, such as k = 5 or k = 10, strike a balance between computational efficiency and reliable performance estimates (Anguita et al., 2009; Li et al., 2024; Nti et al., 2021). Figure 2 illustrates the framework of K-fold cross-validation.
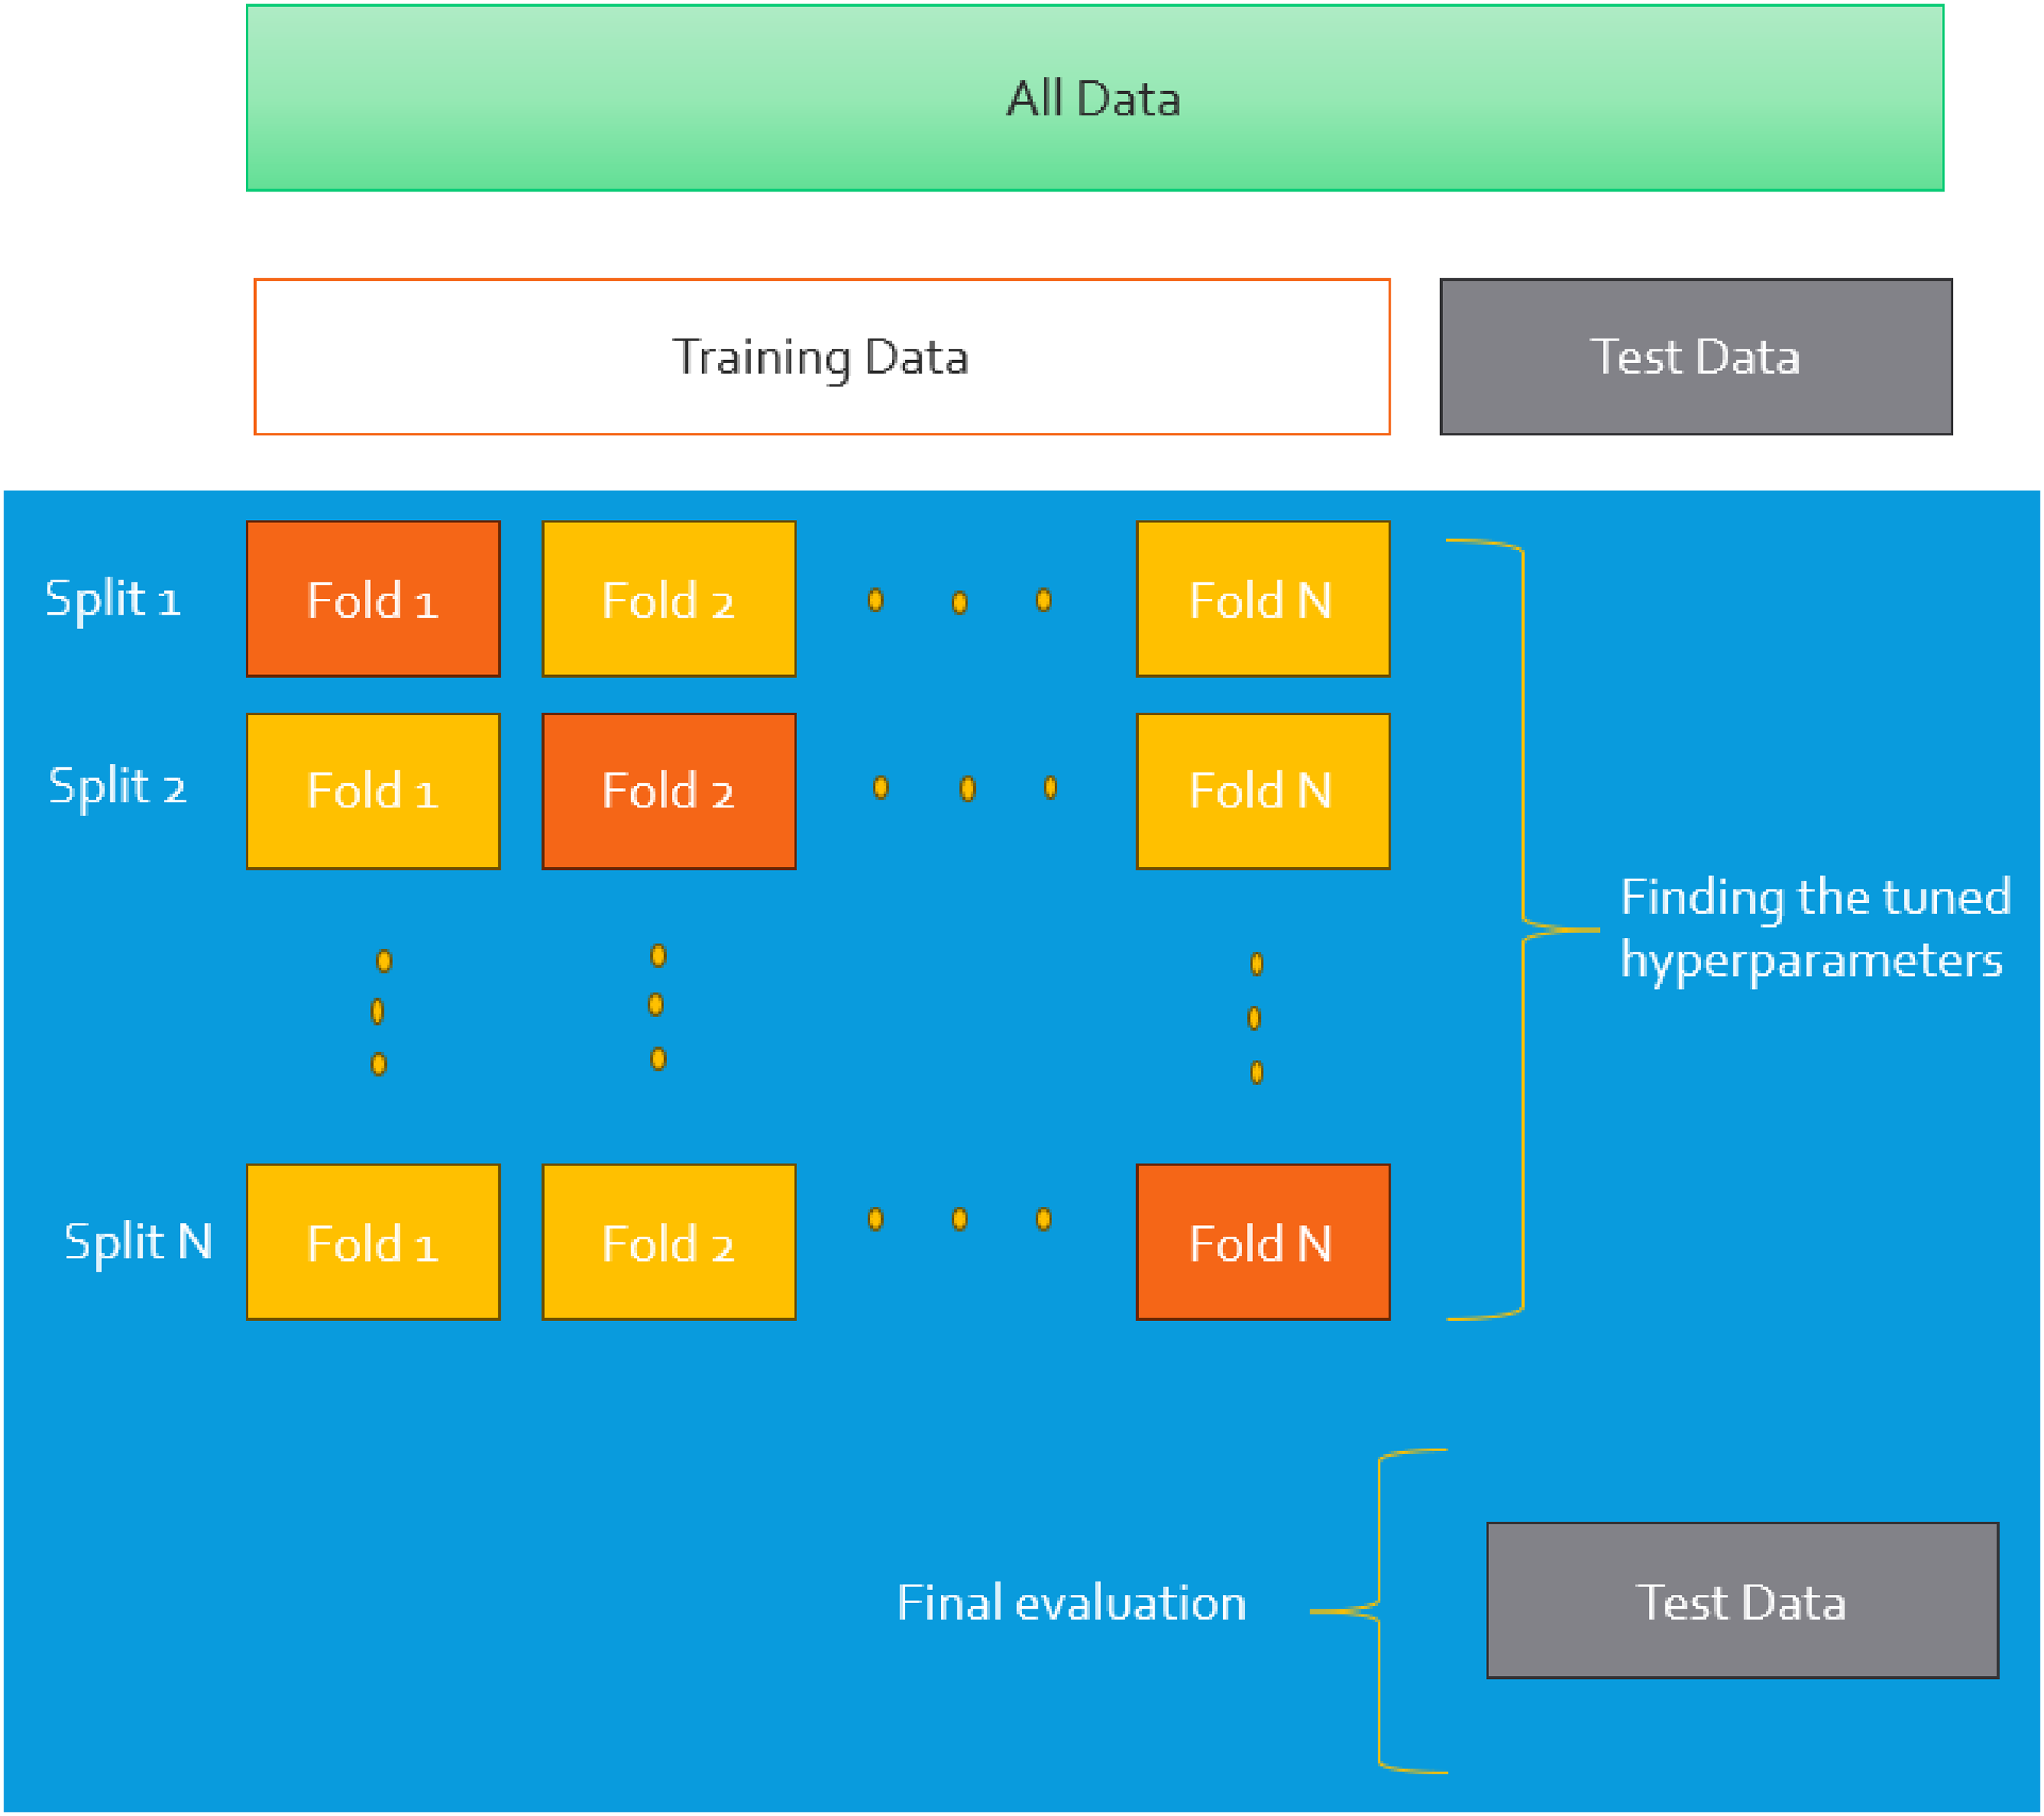
Structure of k-fold cross validation technique used within the machine learning training process.
This study employs 5-fold cross-validation while doing the training and optimization stages of the machine learning algorithms. To assess the predictive functionality of each model, a number of evaluation indices is calculated, as detailed in the subsequent sections (Bassir and Madani, 2019a, 2019b; Bemani et al., 2023; Guan et al., 2025; Madani et al., 2021):


Results and discussion
Identification of suspected datapoints
The Leverage methodology is employed to detect datapoints that involve huge deviations. This approach integrates the Hat matrix (H) with the standardized residuals, with the following relation to estimate the Hat matrix (Bemani et al., 2023; Madani et al., 2021):

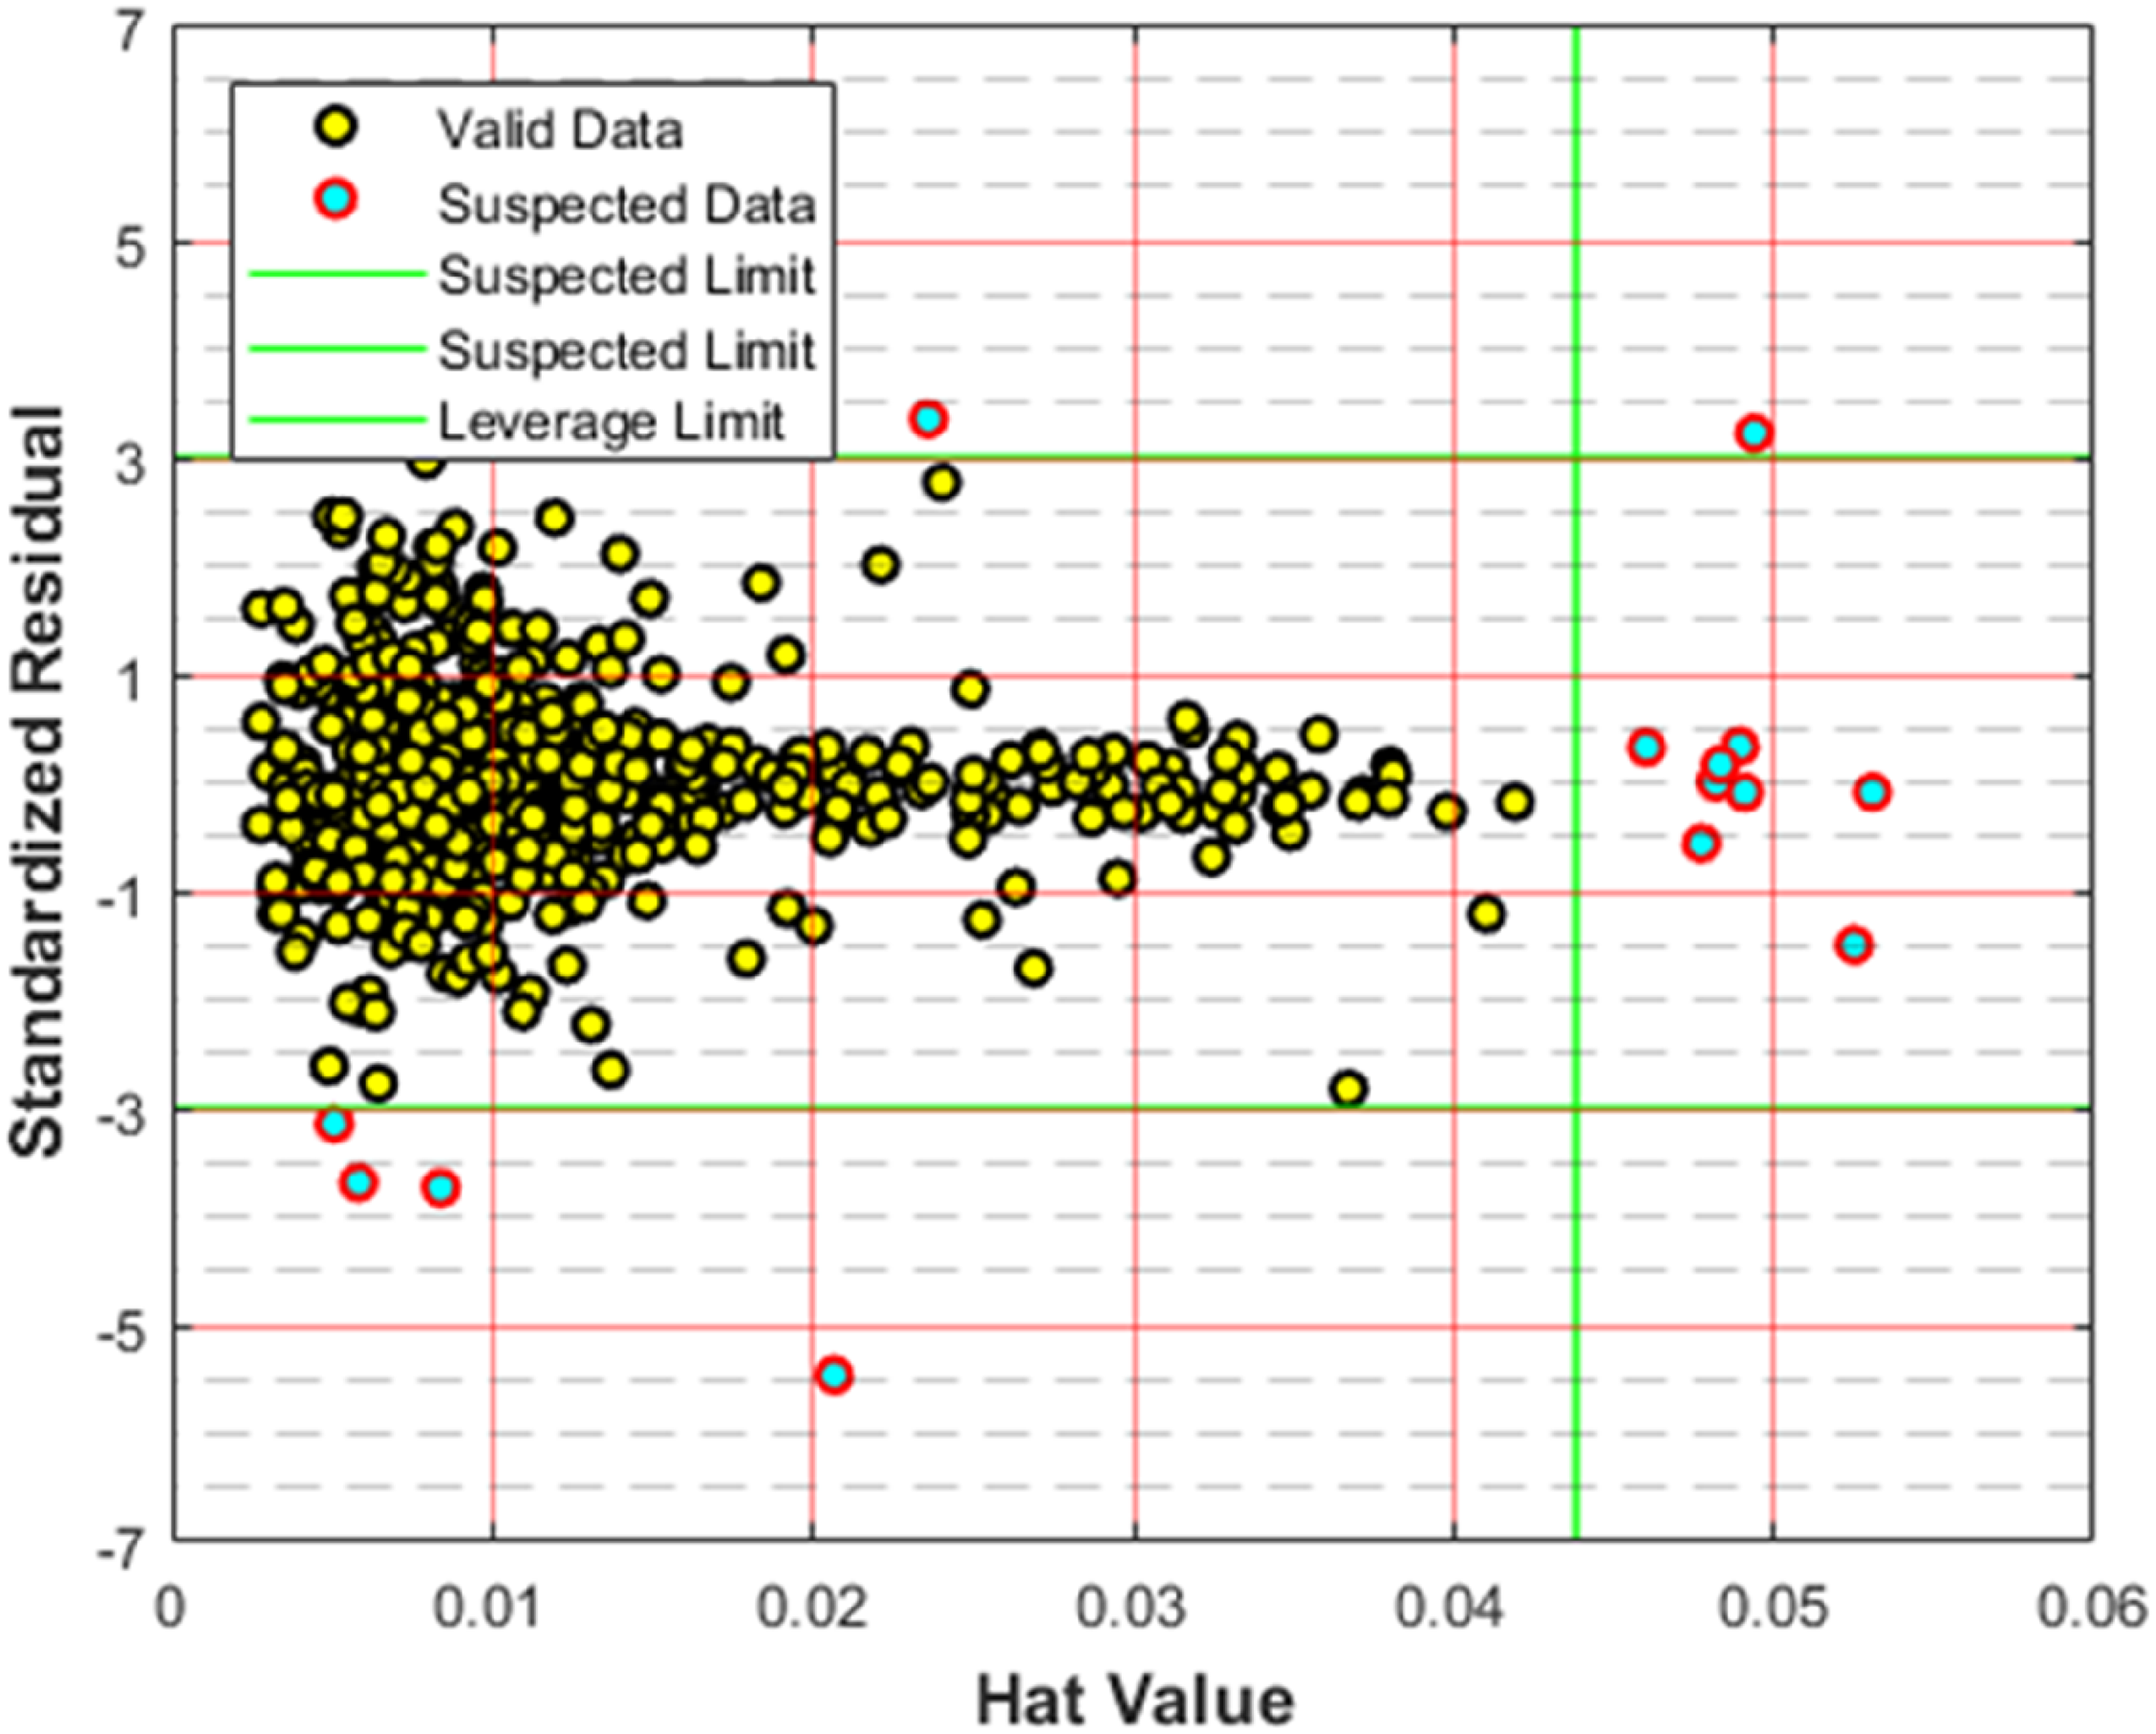
Detection of suspected datapoints via the highly-recognized leverage method.
Sensitivity study
In this segment, we focus on evaluating the influence of each input factor such as moisture content, ash content, volatile matter content, maximum fluidity, sulfur content, MMR, basicity index, and plastic layer thickness on the CRI. This analysis considers the specific rank value of all input factors using the concept of relevancy index which is computed via (Abbasi et al., 2023; Bemani et al., 2023; Hasanzadeh and Madani, 2024; Madani et al., 2021):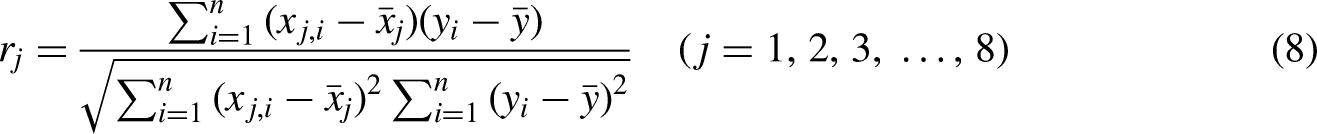
Relevancy index calculated for all the input parameters with respect to coke reactivity index.
Models’ optimization
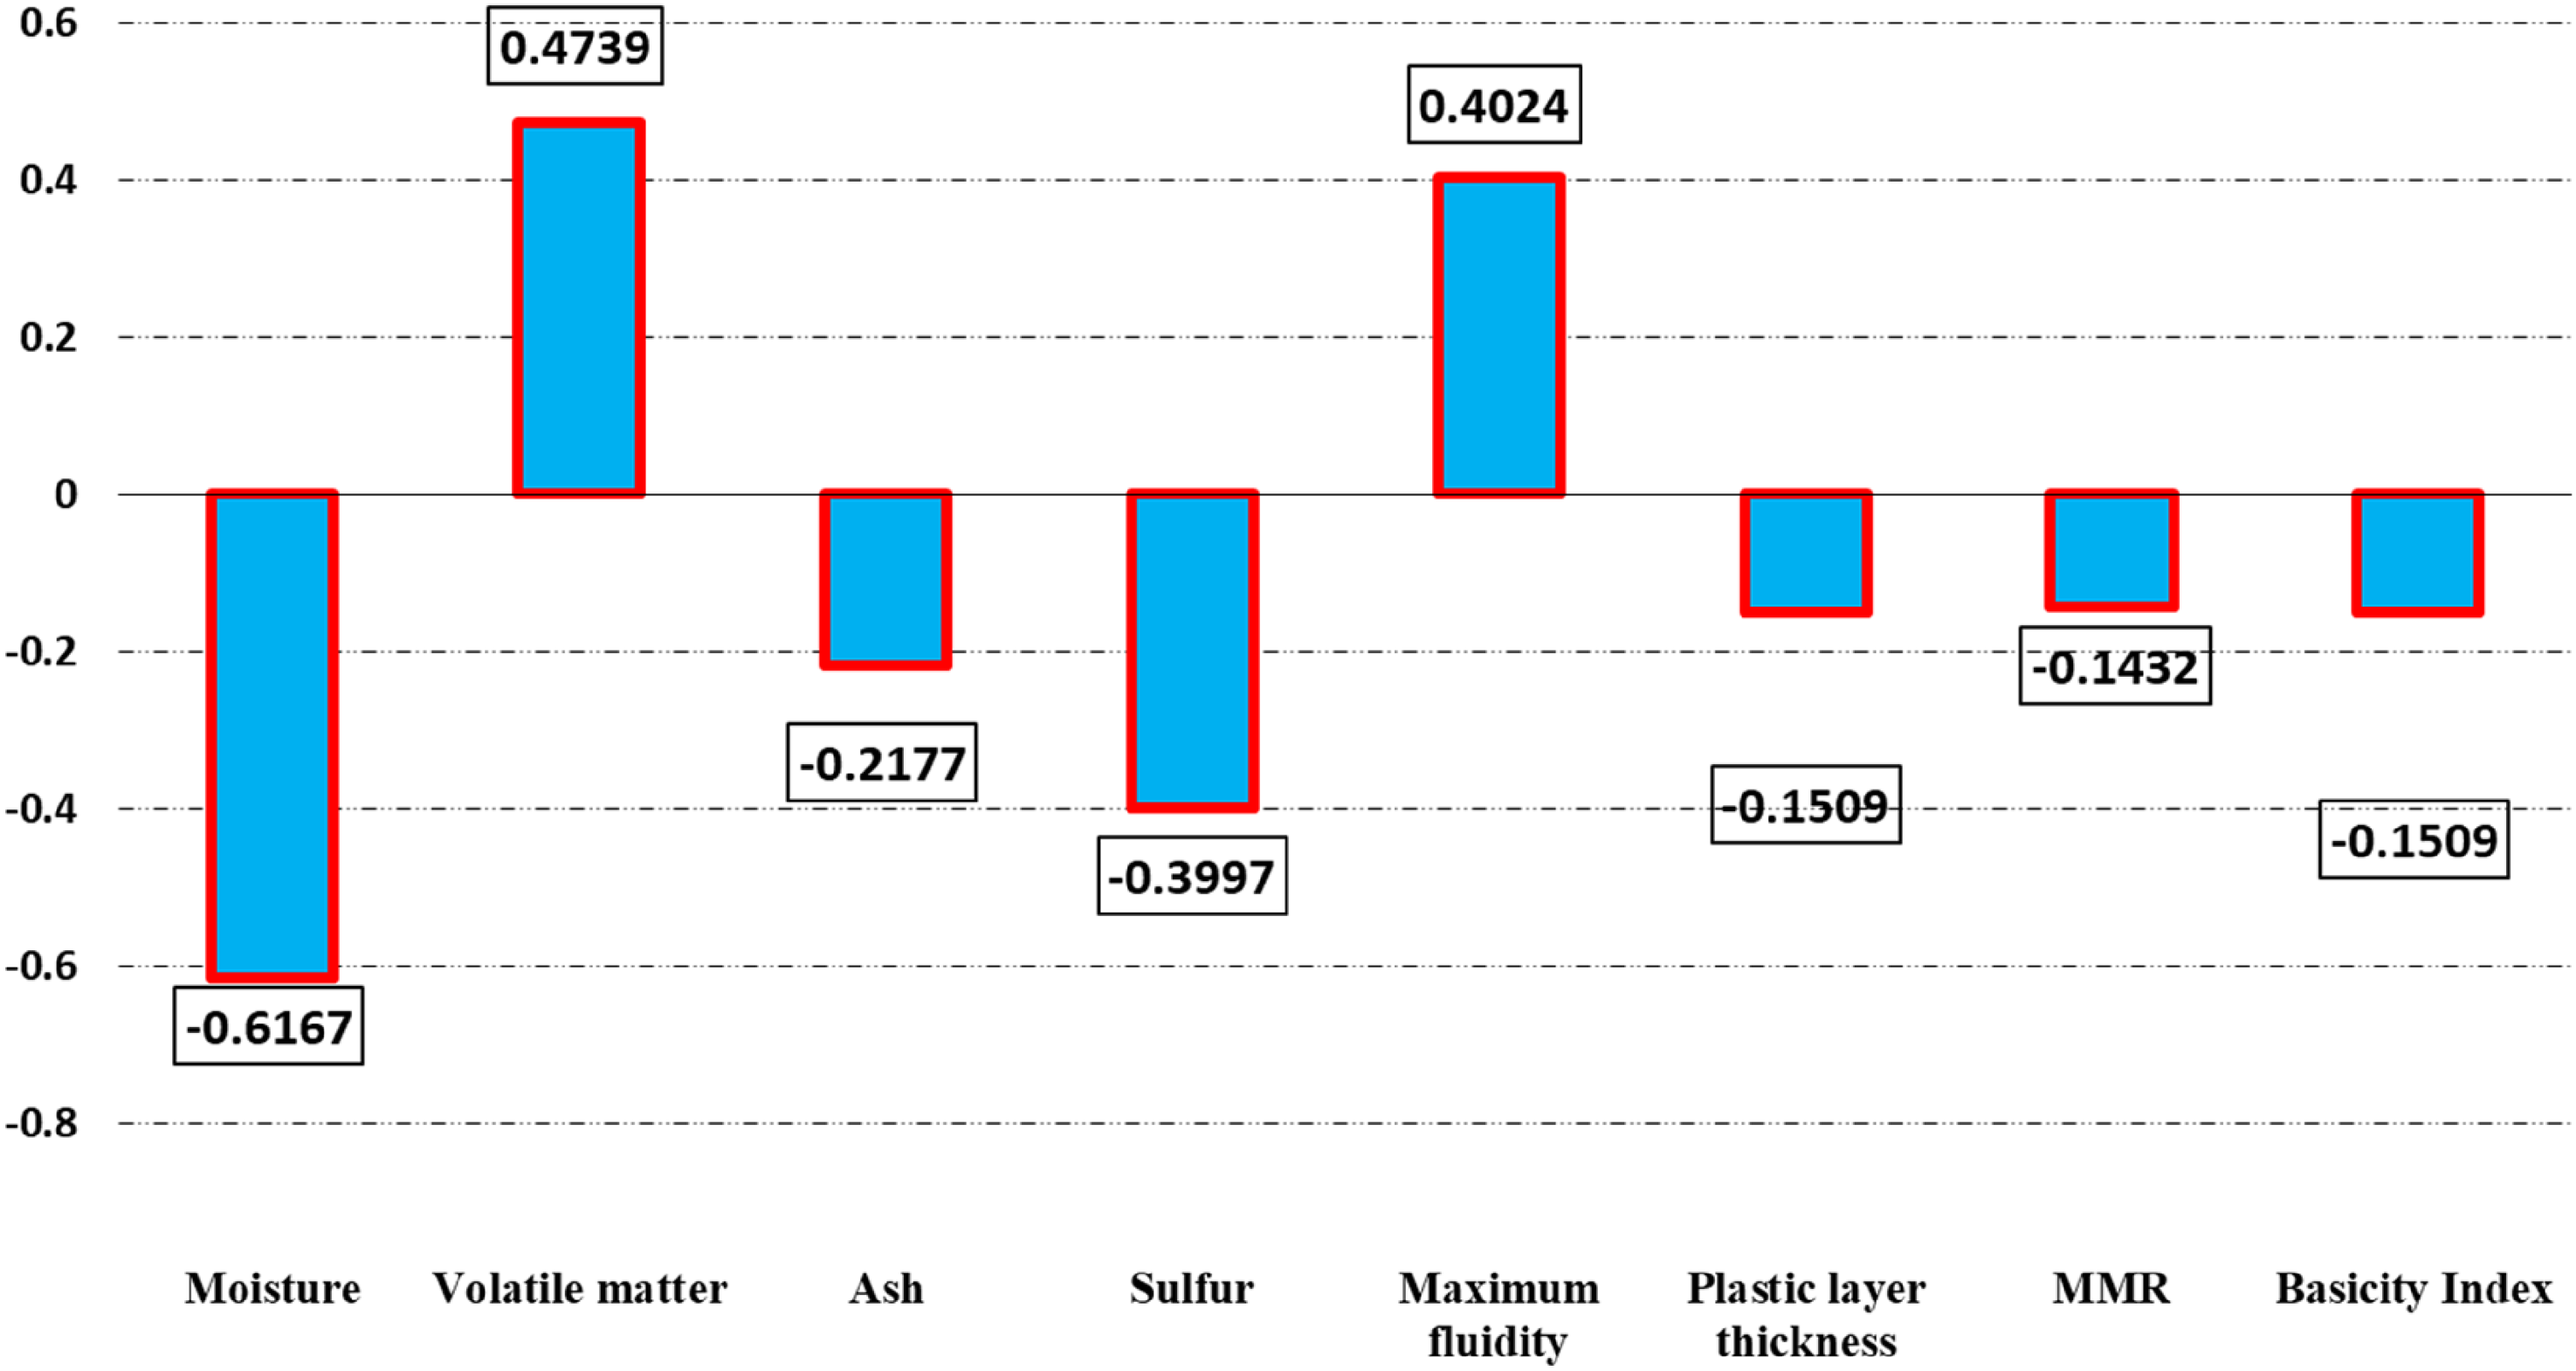
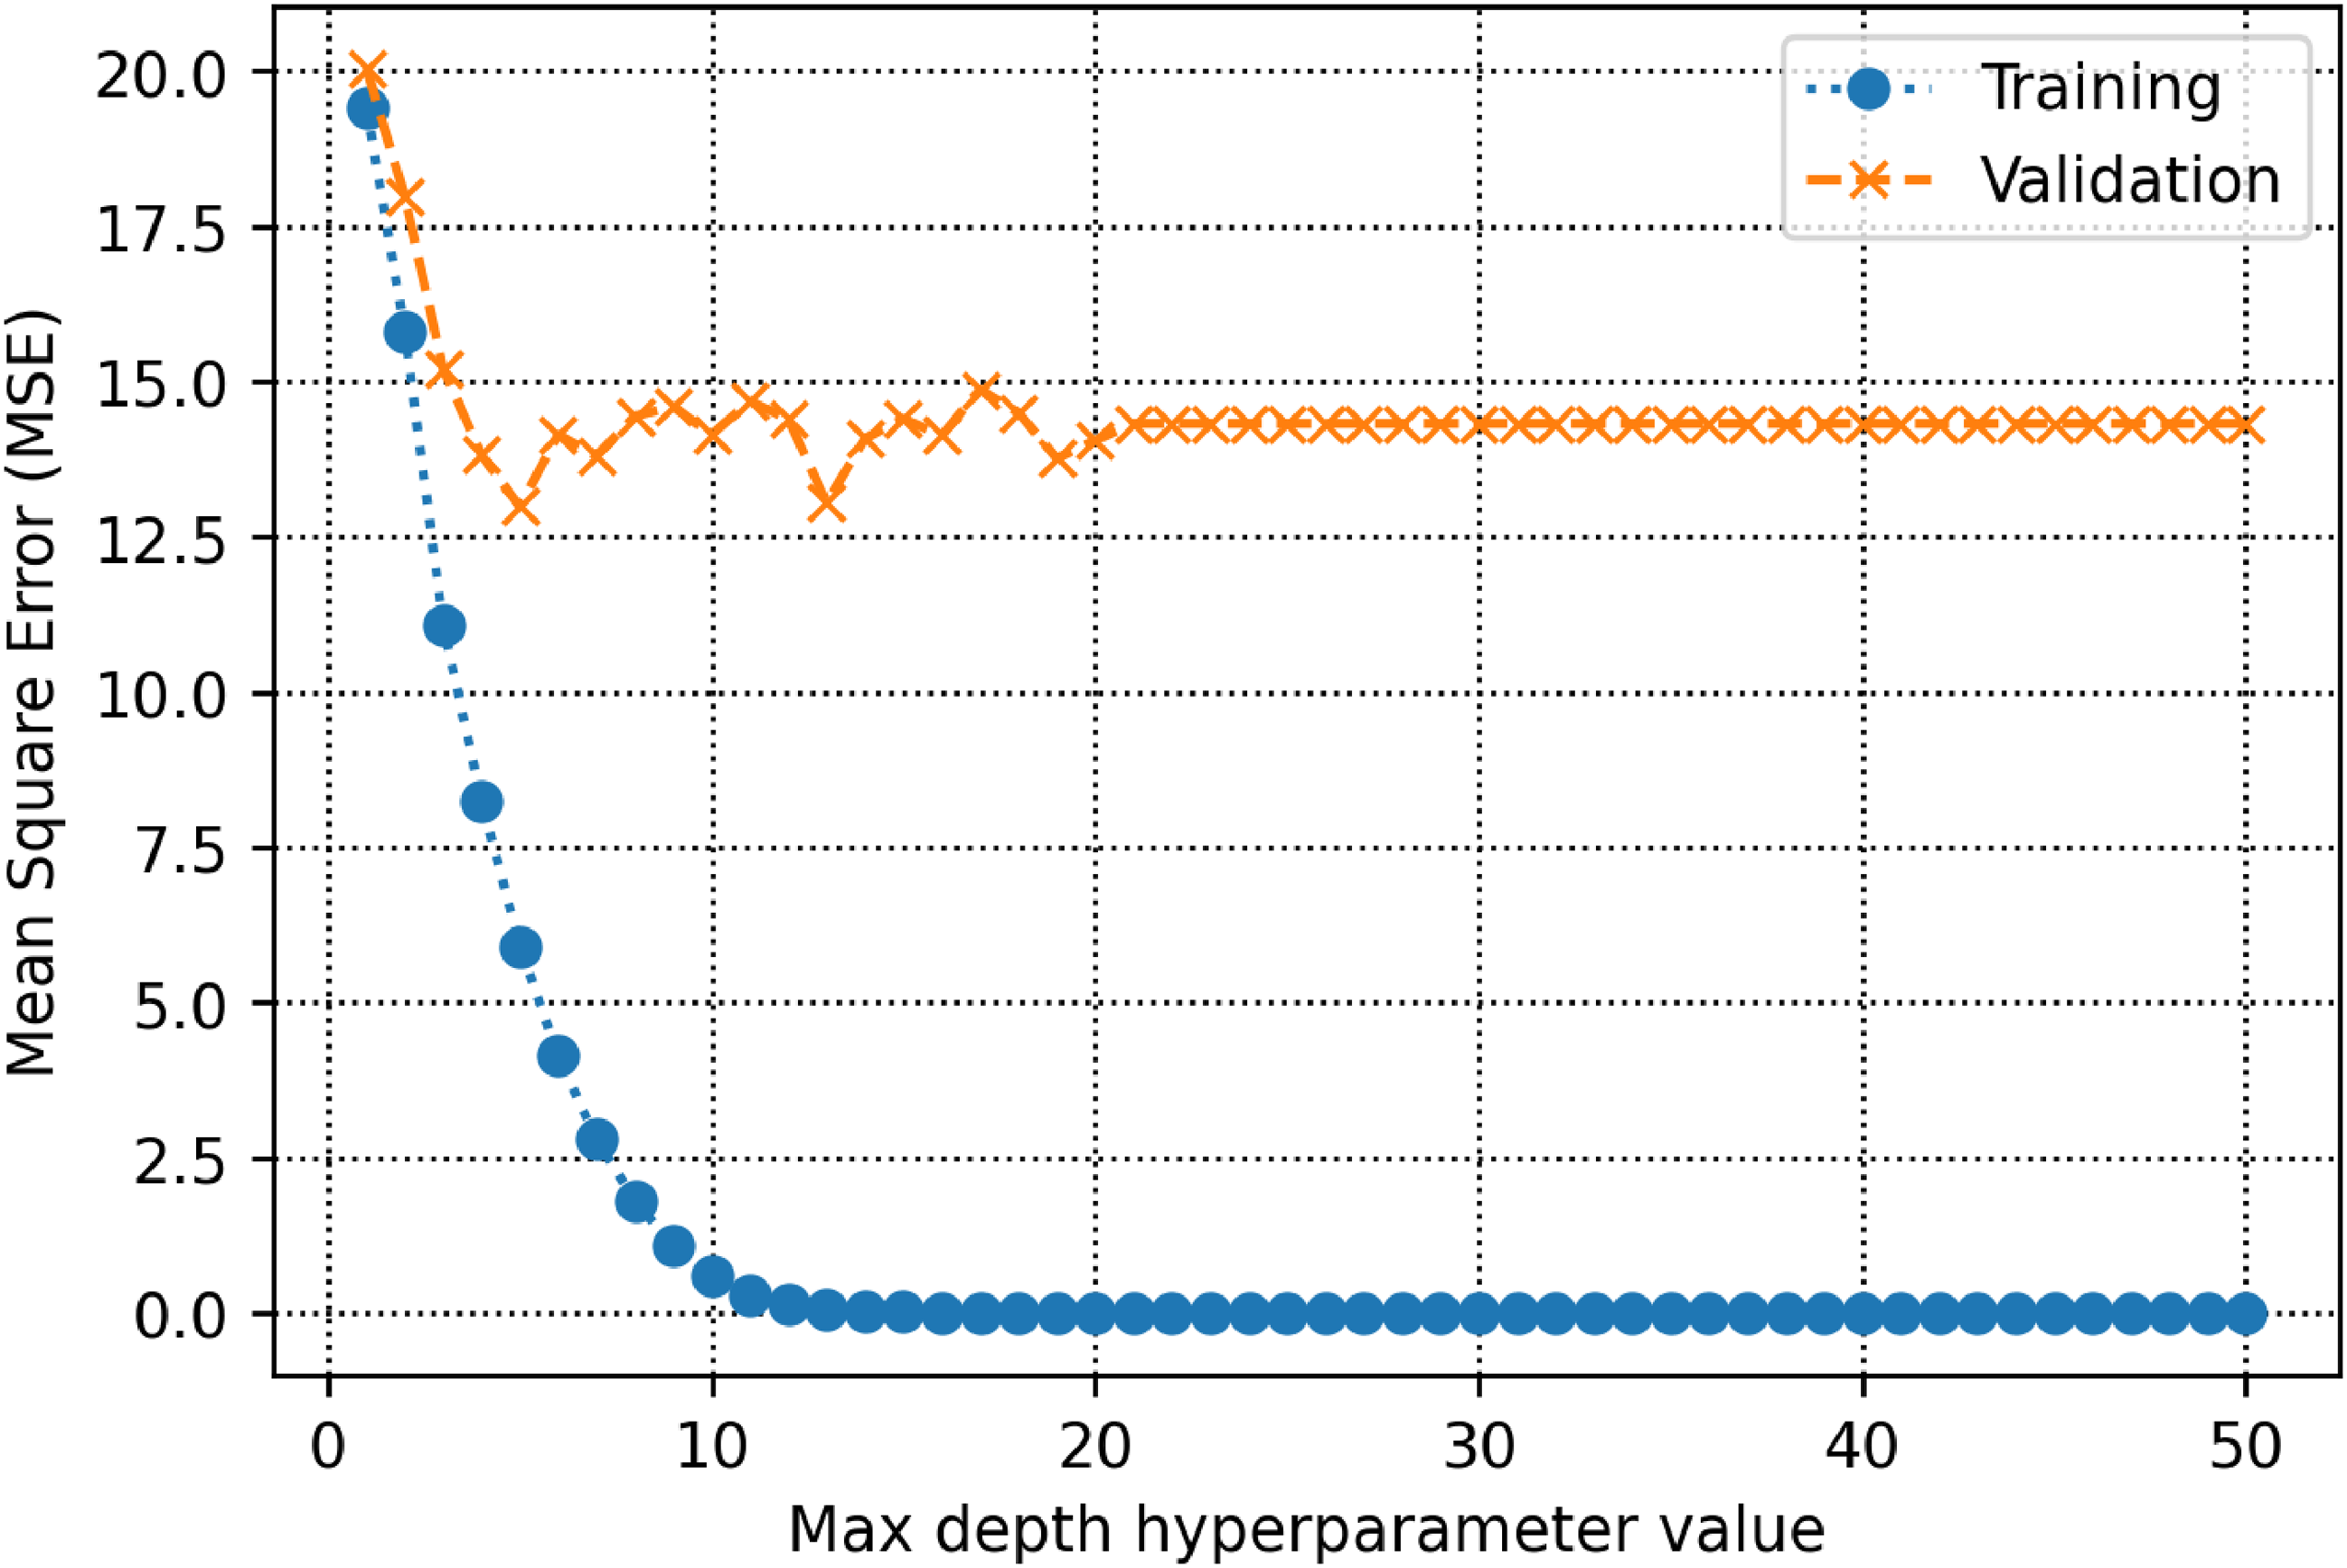
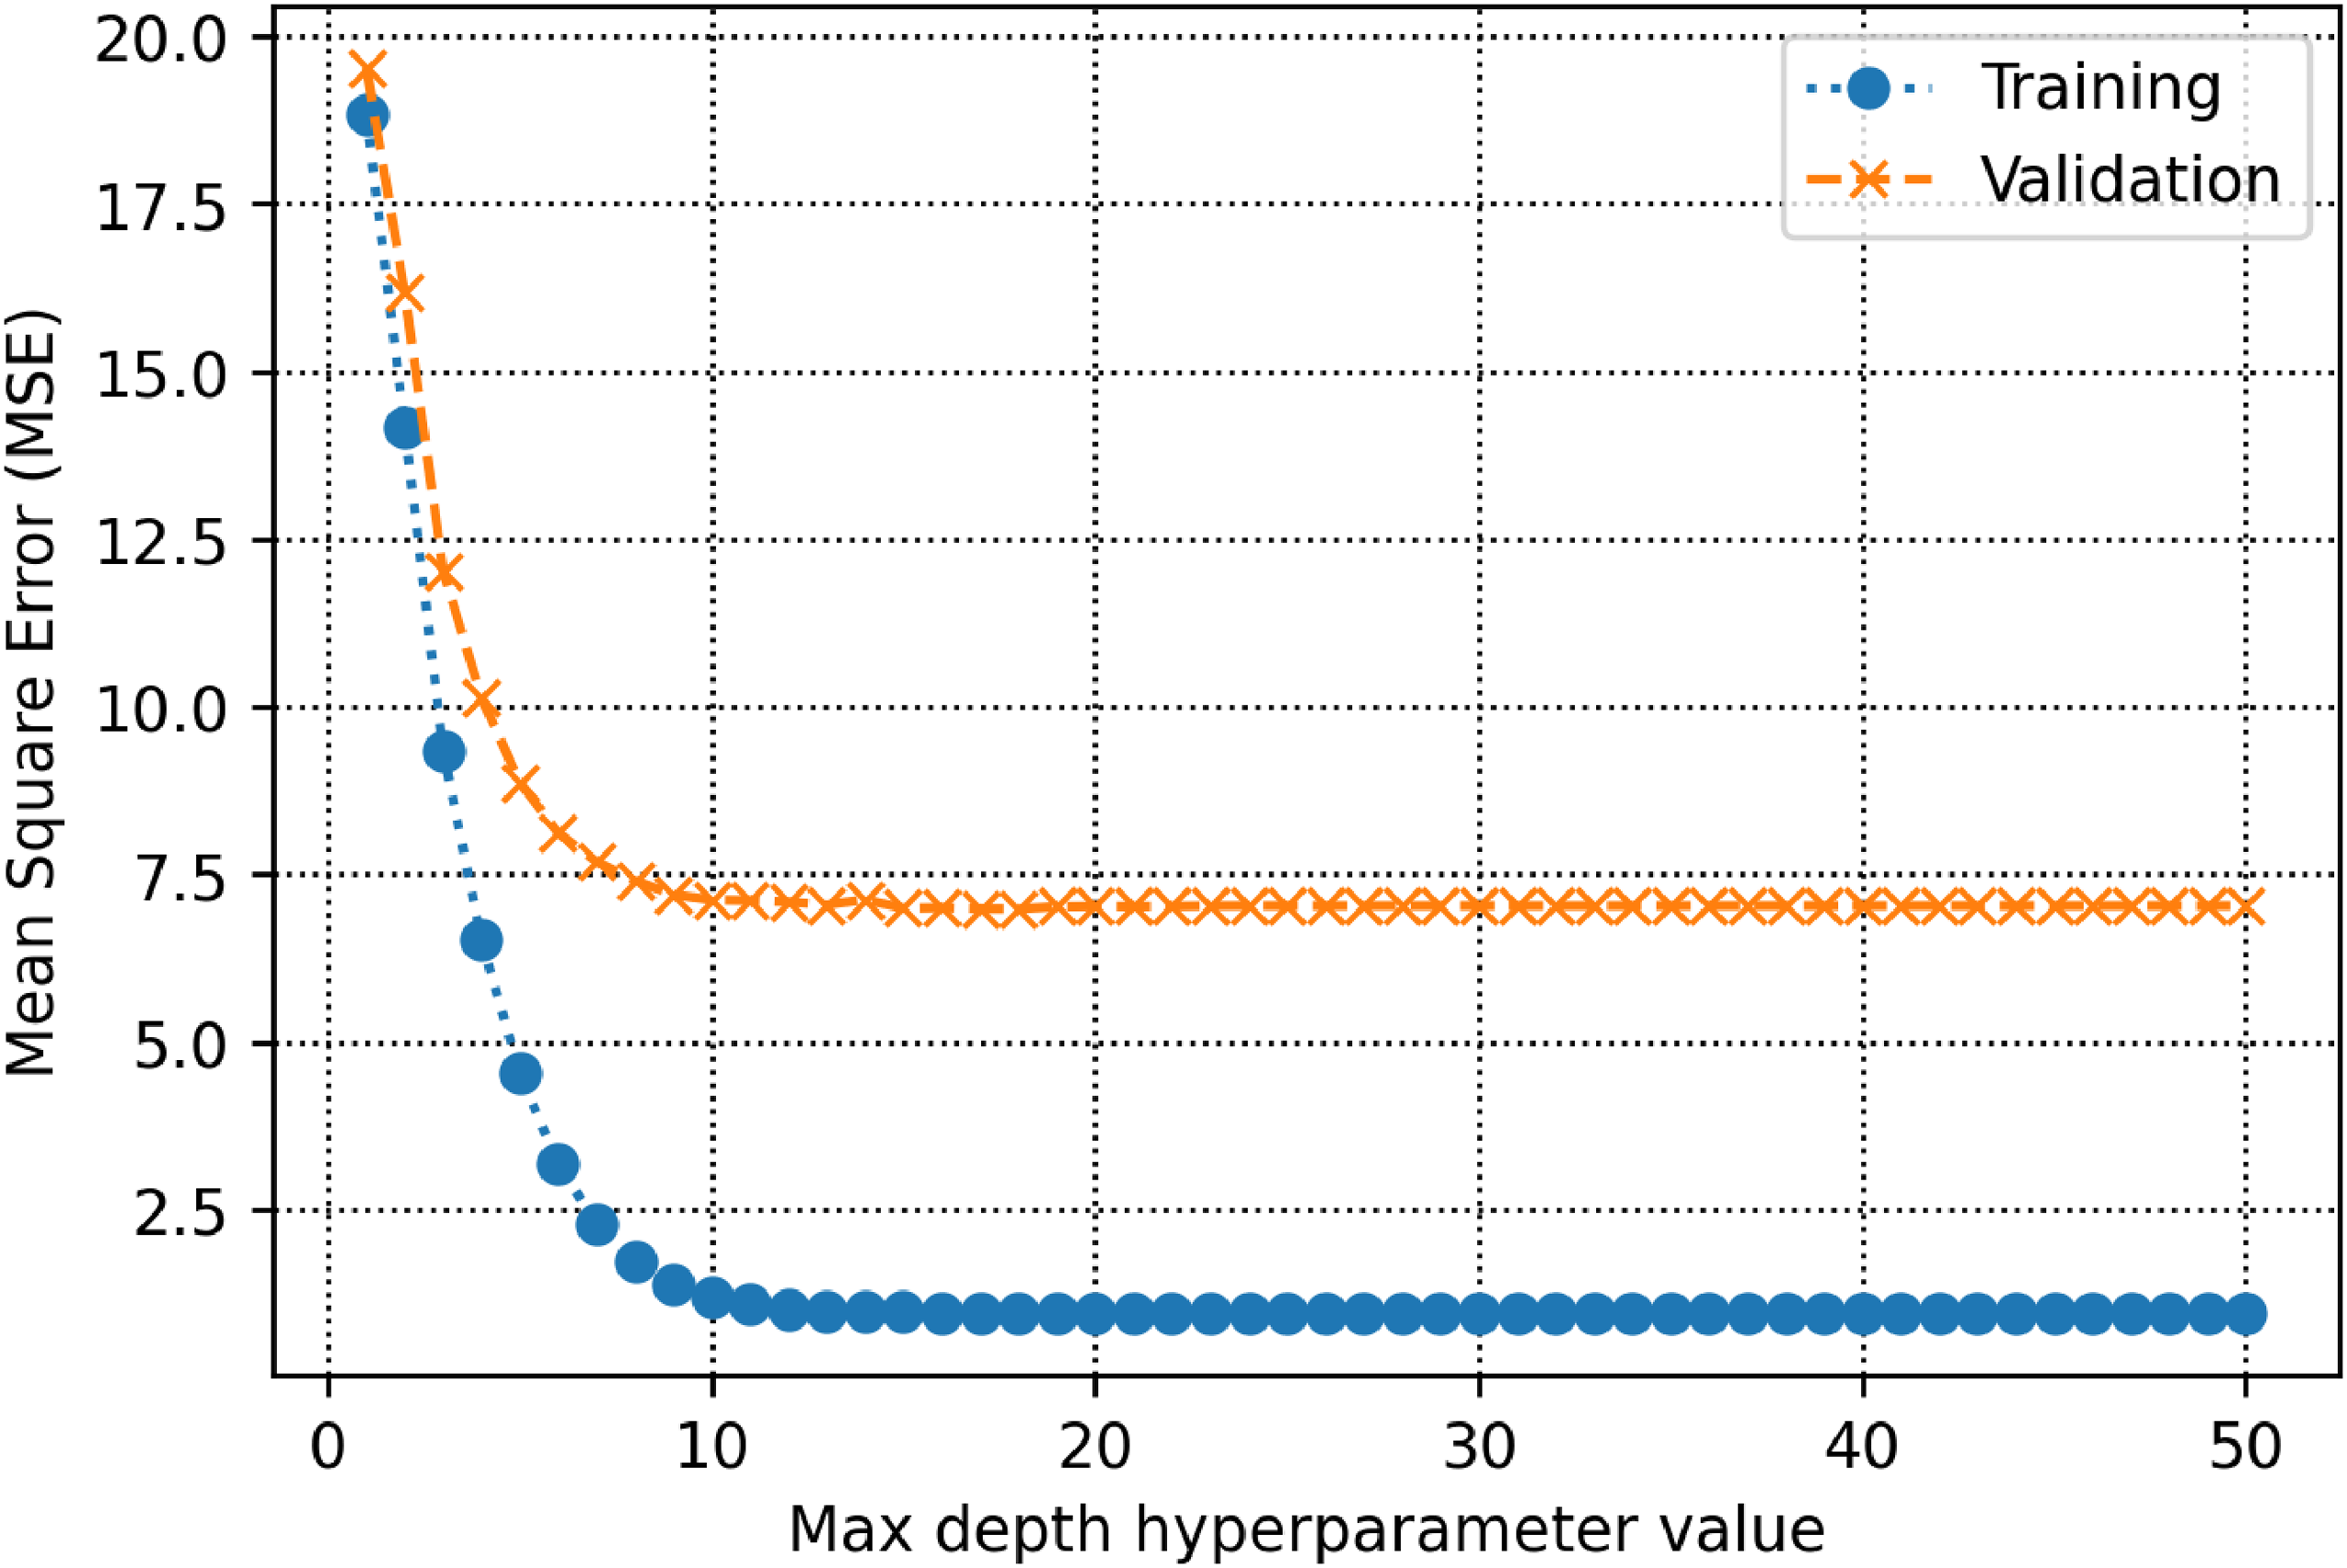
The training and validation subsets are used to determine parameters and hyperparameters of different algorithms. For the decision tree model, there is a hyperparameter, namely max-depth which is calculated to be 13 (See Figure 5). As shown in Figure 6, the count of estimators in the AdaBoost model is determined to be 71. For the random forest model as shown in Figure 7, max depth is estimated to be 16. In the KNN model, the K value is estimated to be 2 as shown in Figure 8. The extra trees model has a tuned number of estimators equal to 39 as shown in Figure 9. The SVM model contains a hyper parameter indicated by c. The value of this hyper-parameter is calculated equal to 27 as illustrated in Figure 10. The loss values of CNN and MLP-ANN models which are mean square error (MSE) in this study, are reported for different iterations in Figures 11 and 12. Notice that the KNN, random forest, adaptive boosting and decision tree, with their tuned parameters are considered for the ensemble learning methodology.
MSE as a function of max depth within the decision tree algorithm.
MSE as a function of number of estimators within the adaptive boosting algorithm.
MSE as a function of max depth within the random forest algorithm decision.
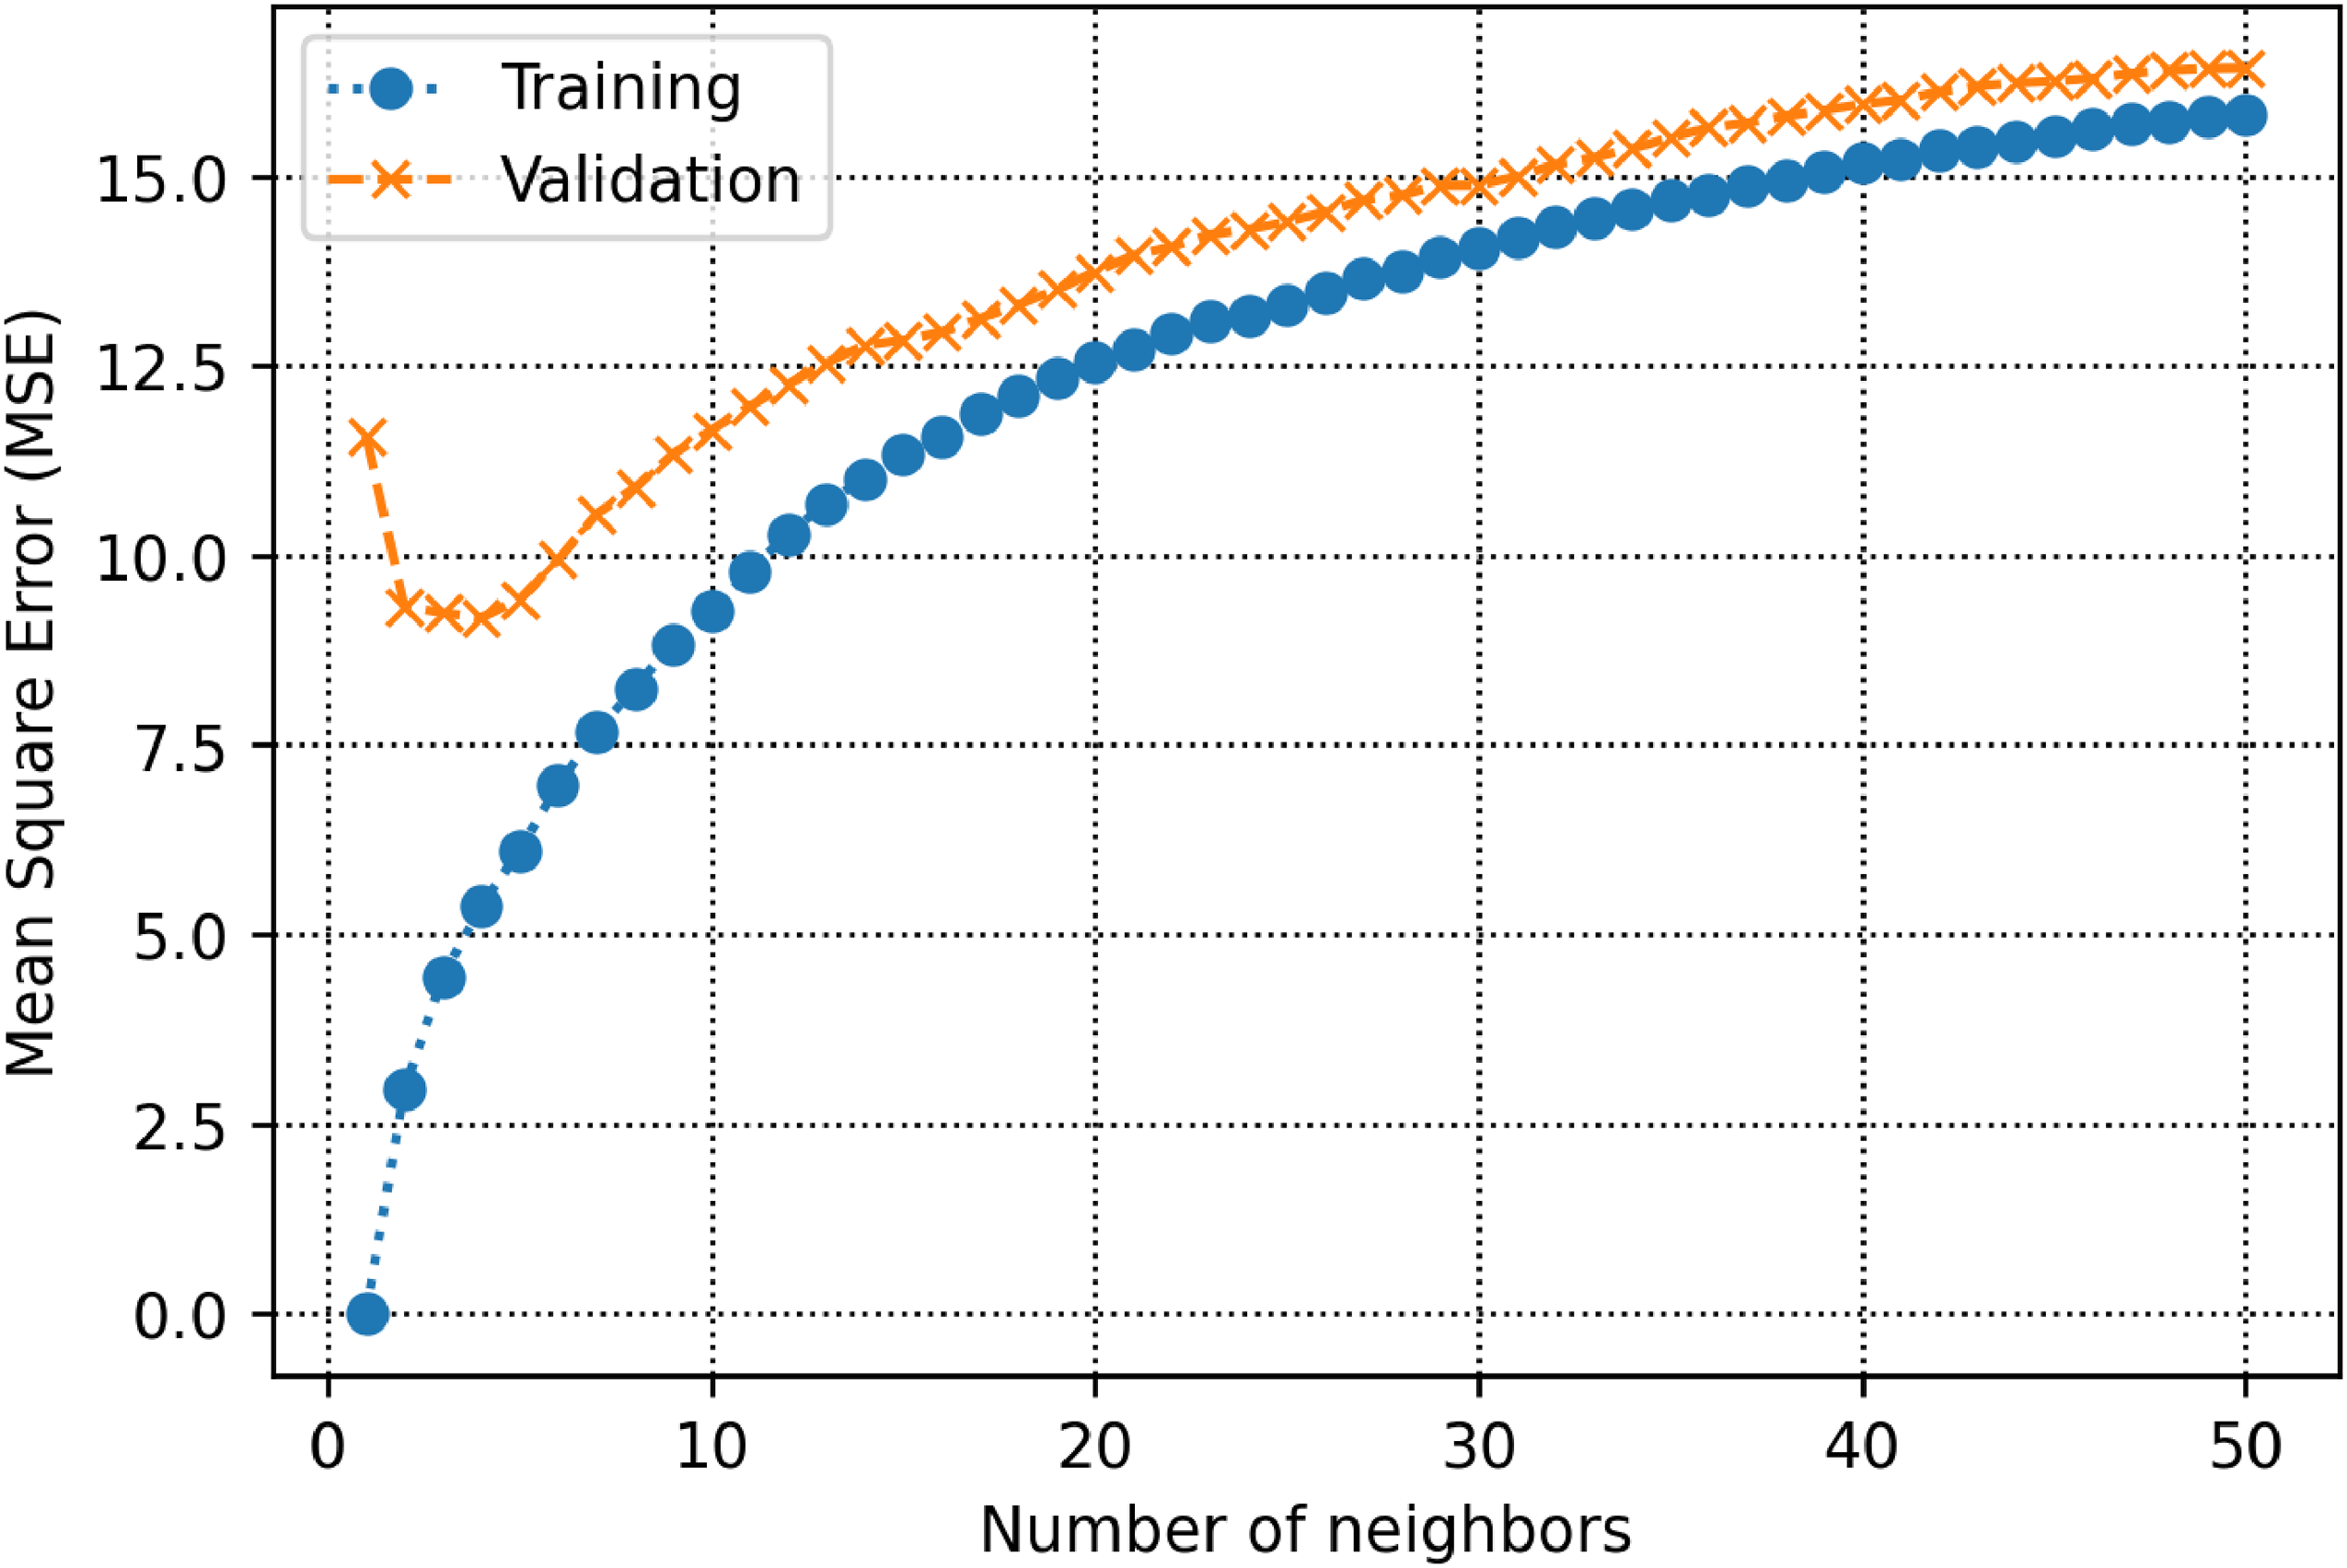
MSE as a function of number of neighbors within the k-nearest neighbors algorithm.
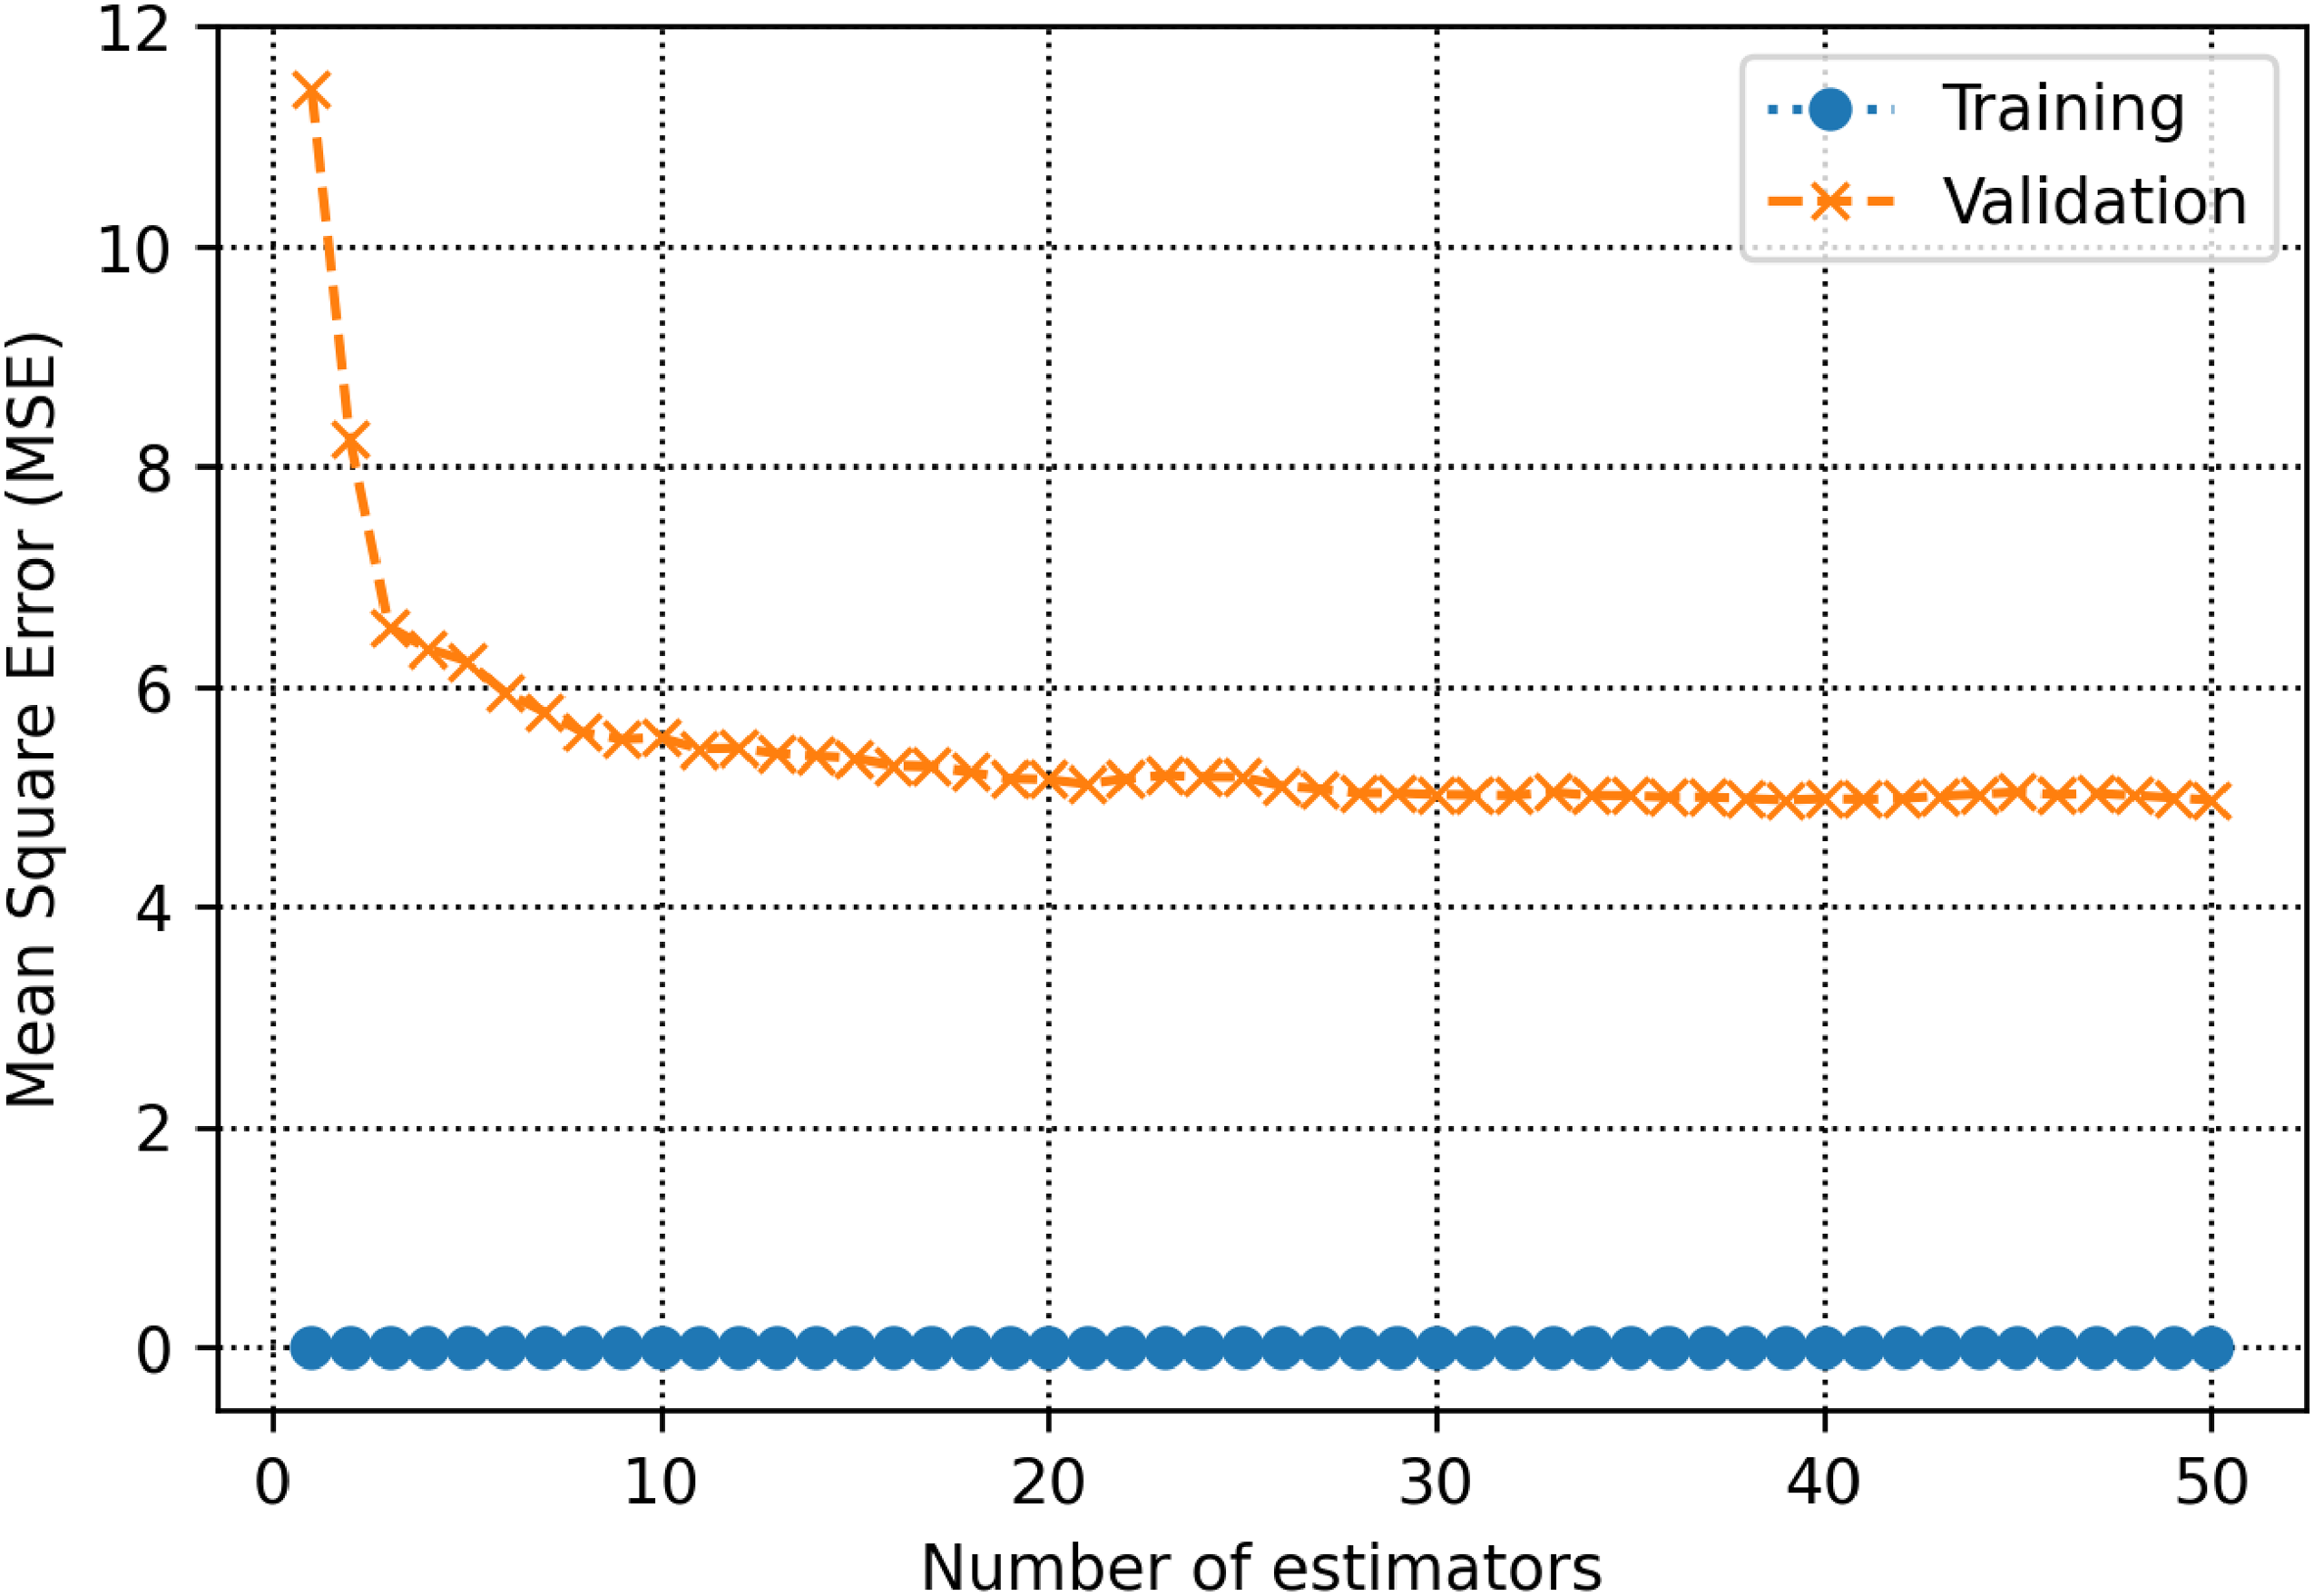
MSE as a function of number of estimators within the extra trees algorithm decision.
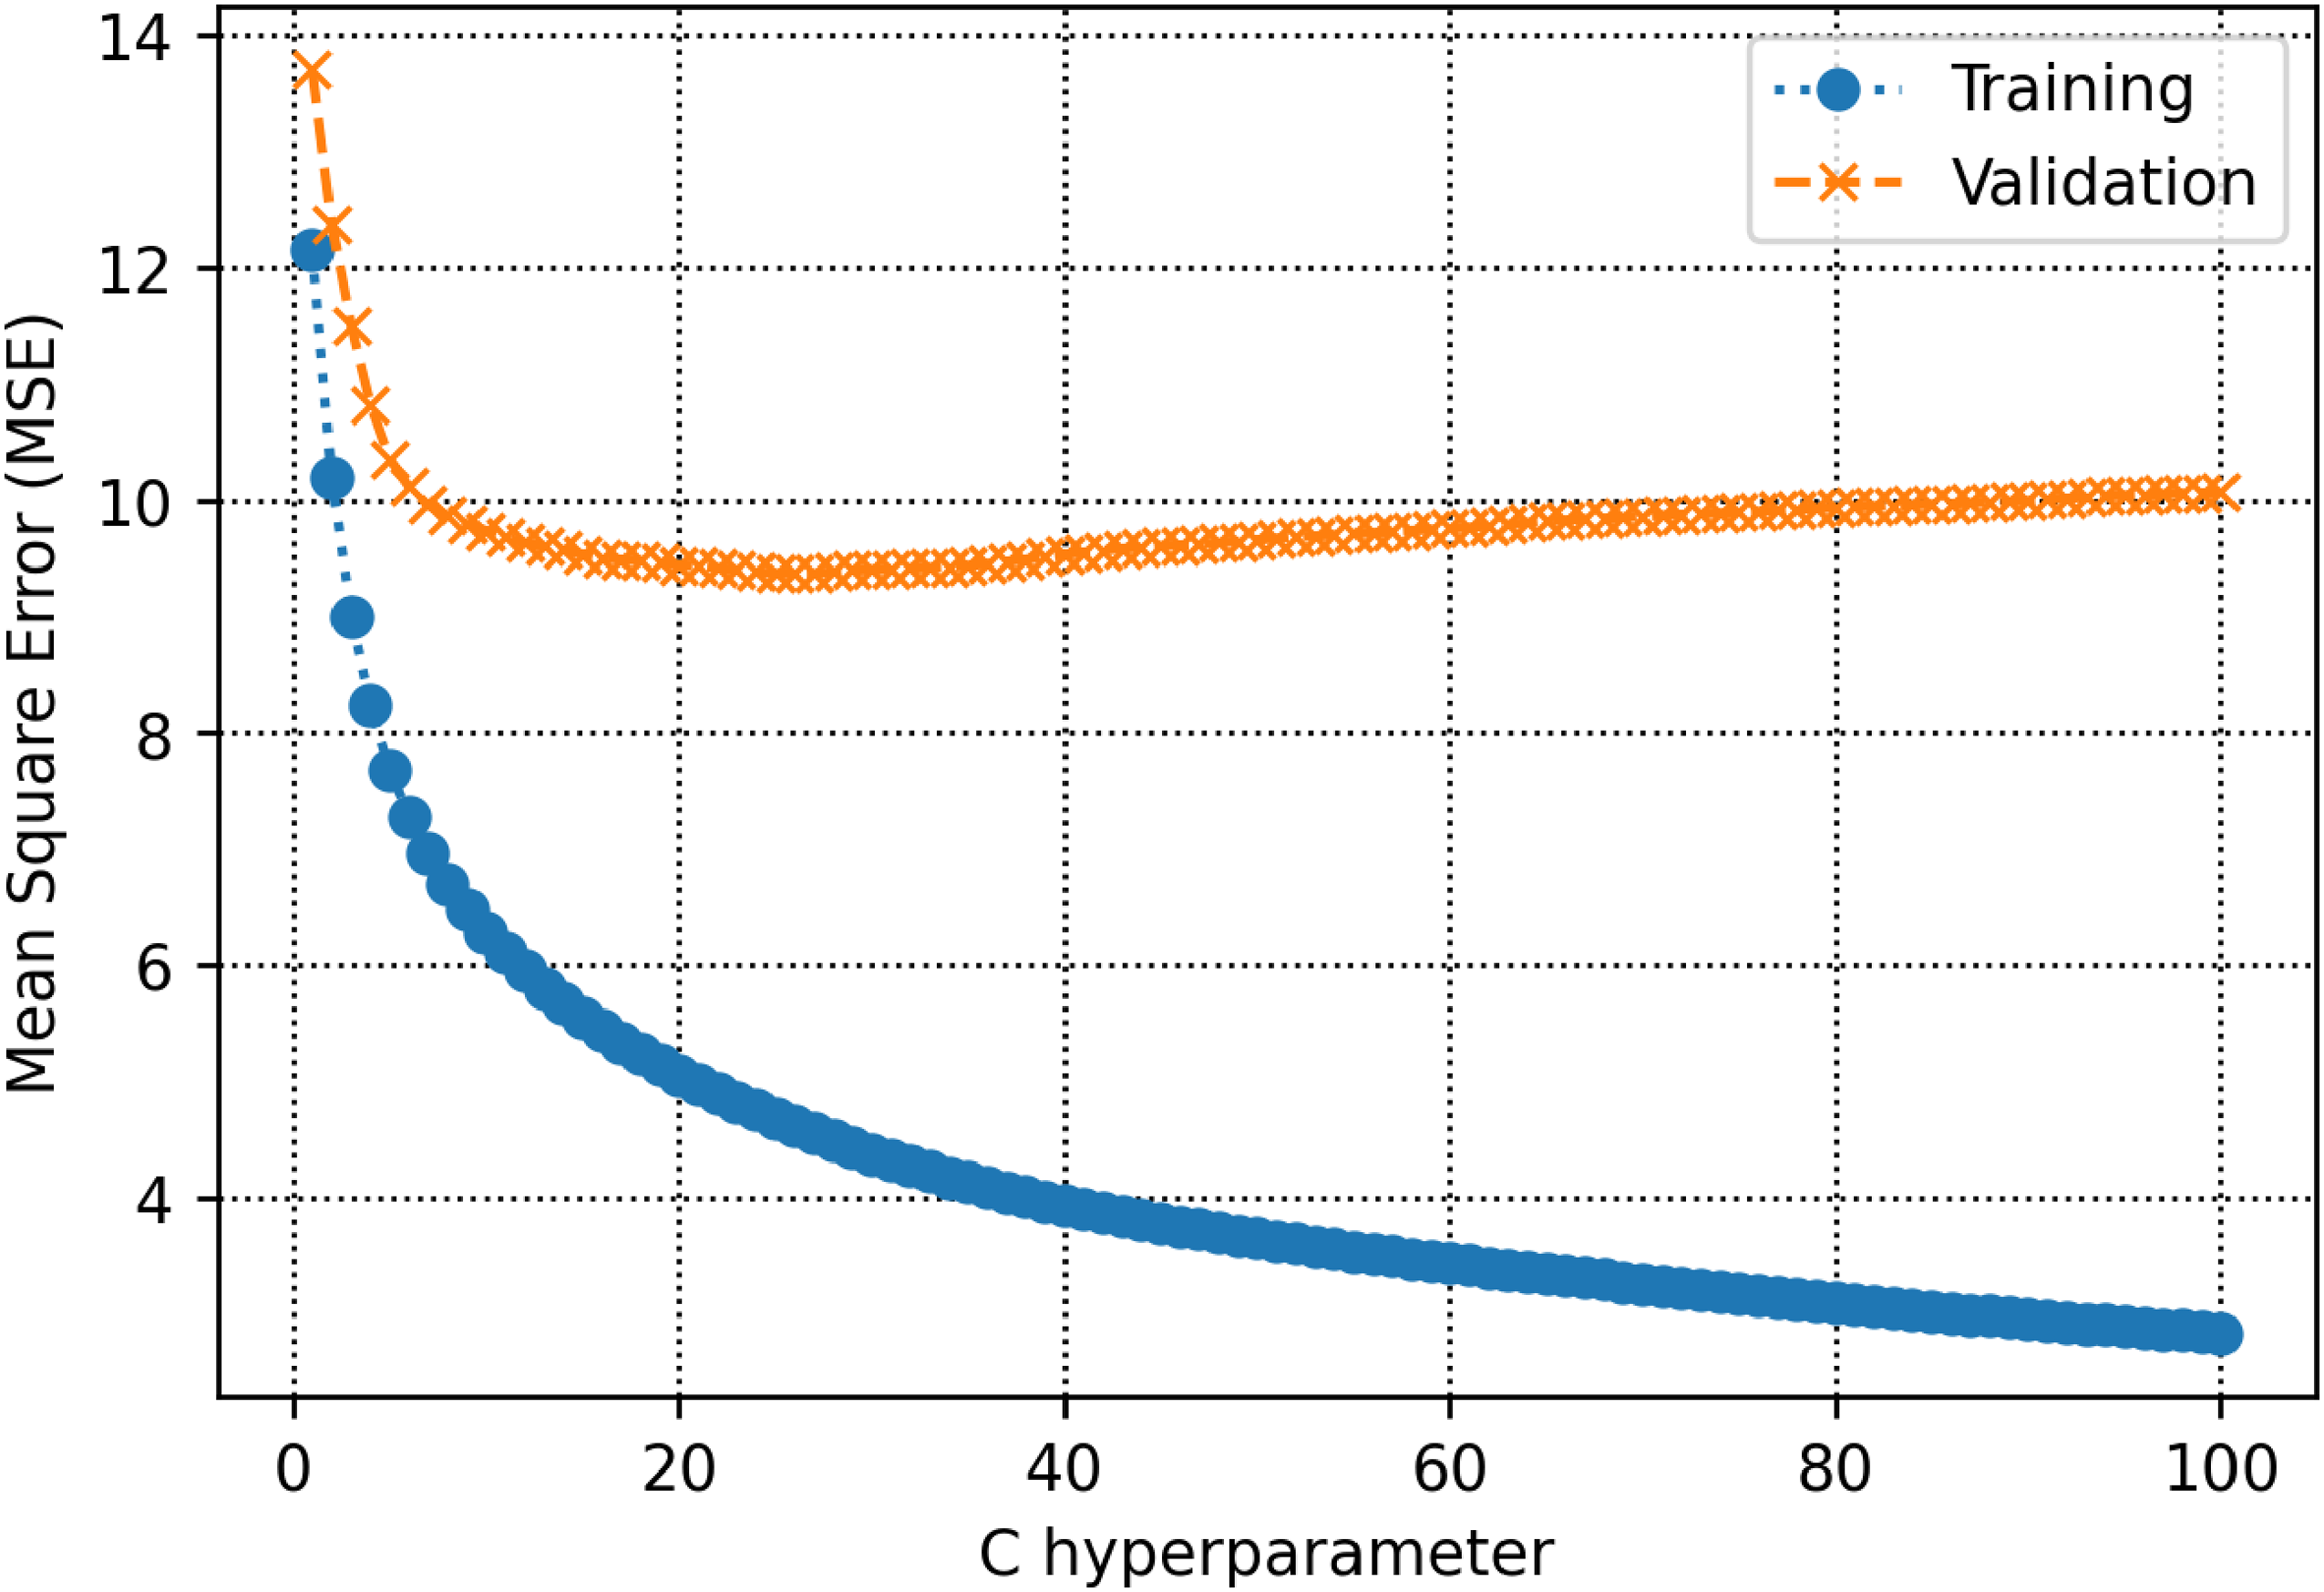
MSE as a function of C hyperparameter within the support vector machine algorithm.
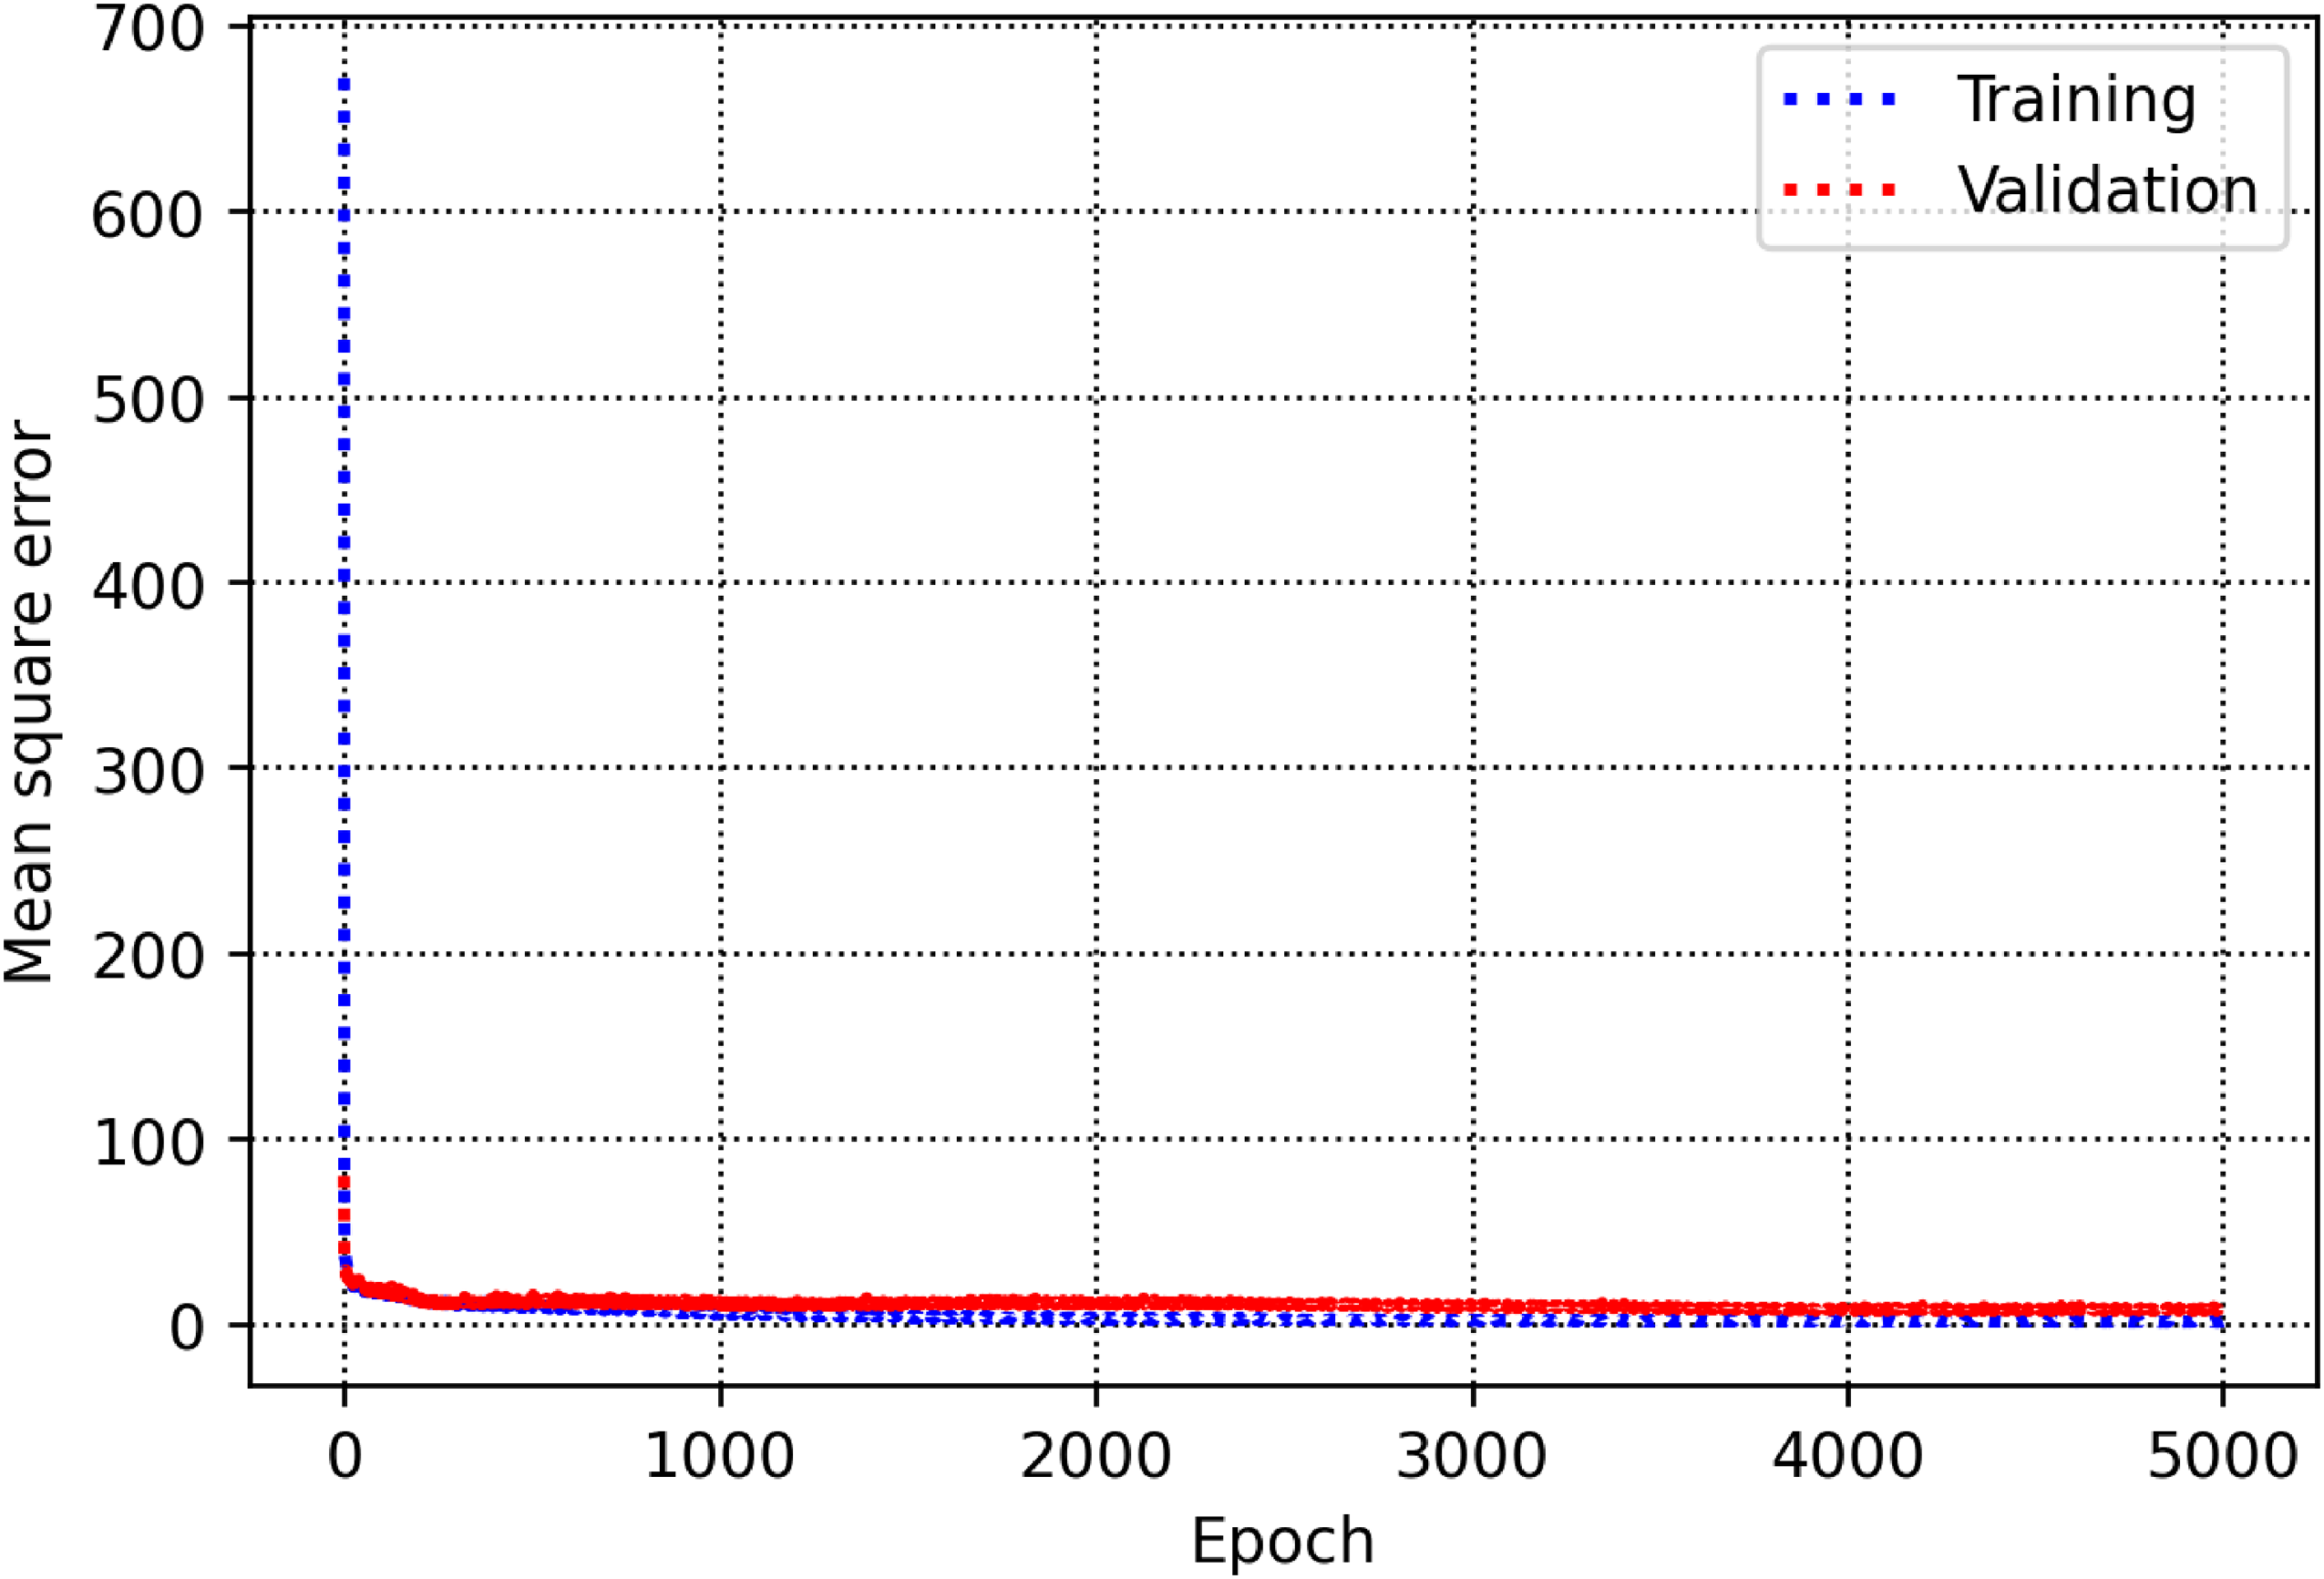
MSE as a function of epoch within the convolutional neural network.
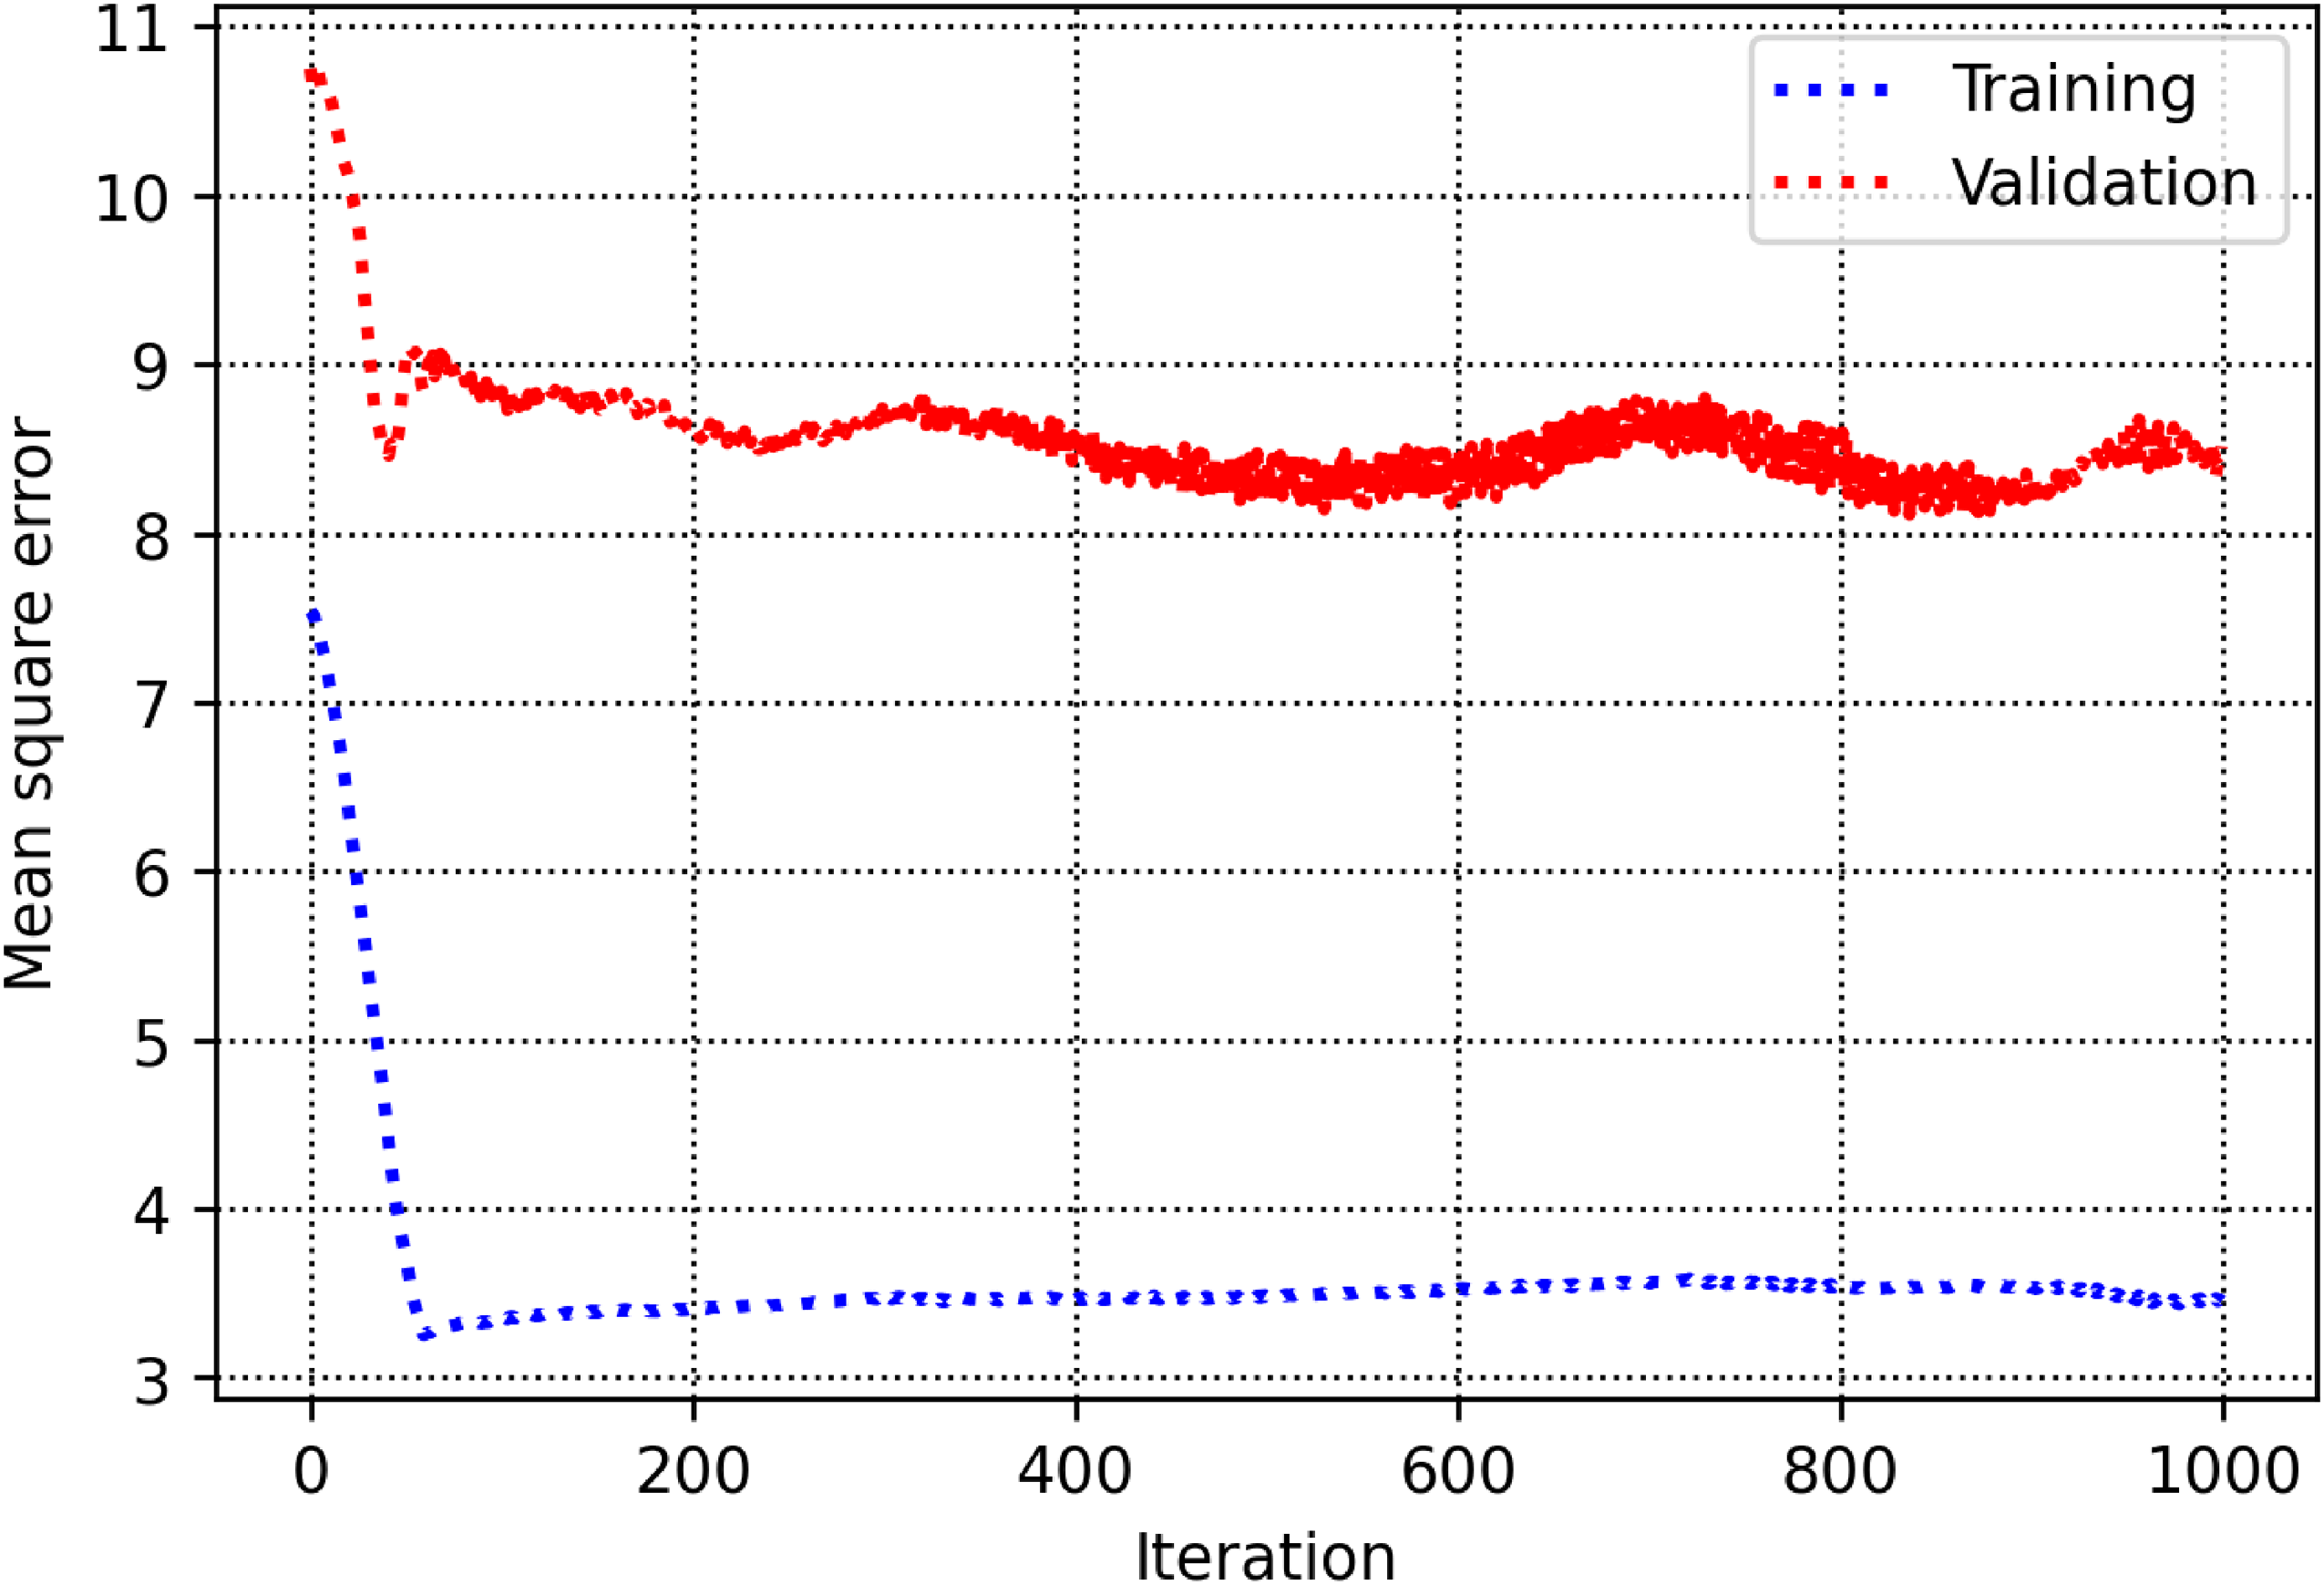
MSE as a function of iteration within the multilayer perceptron artificial neural network.
Models’ evaluation
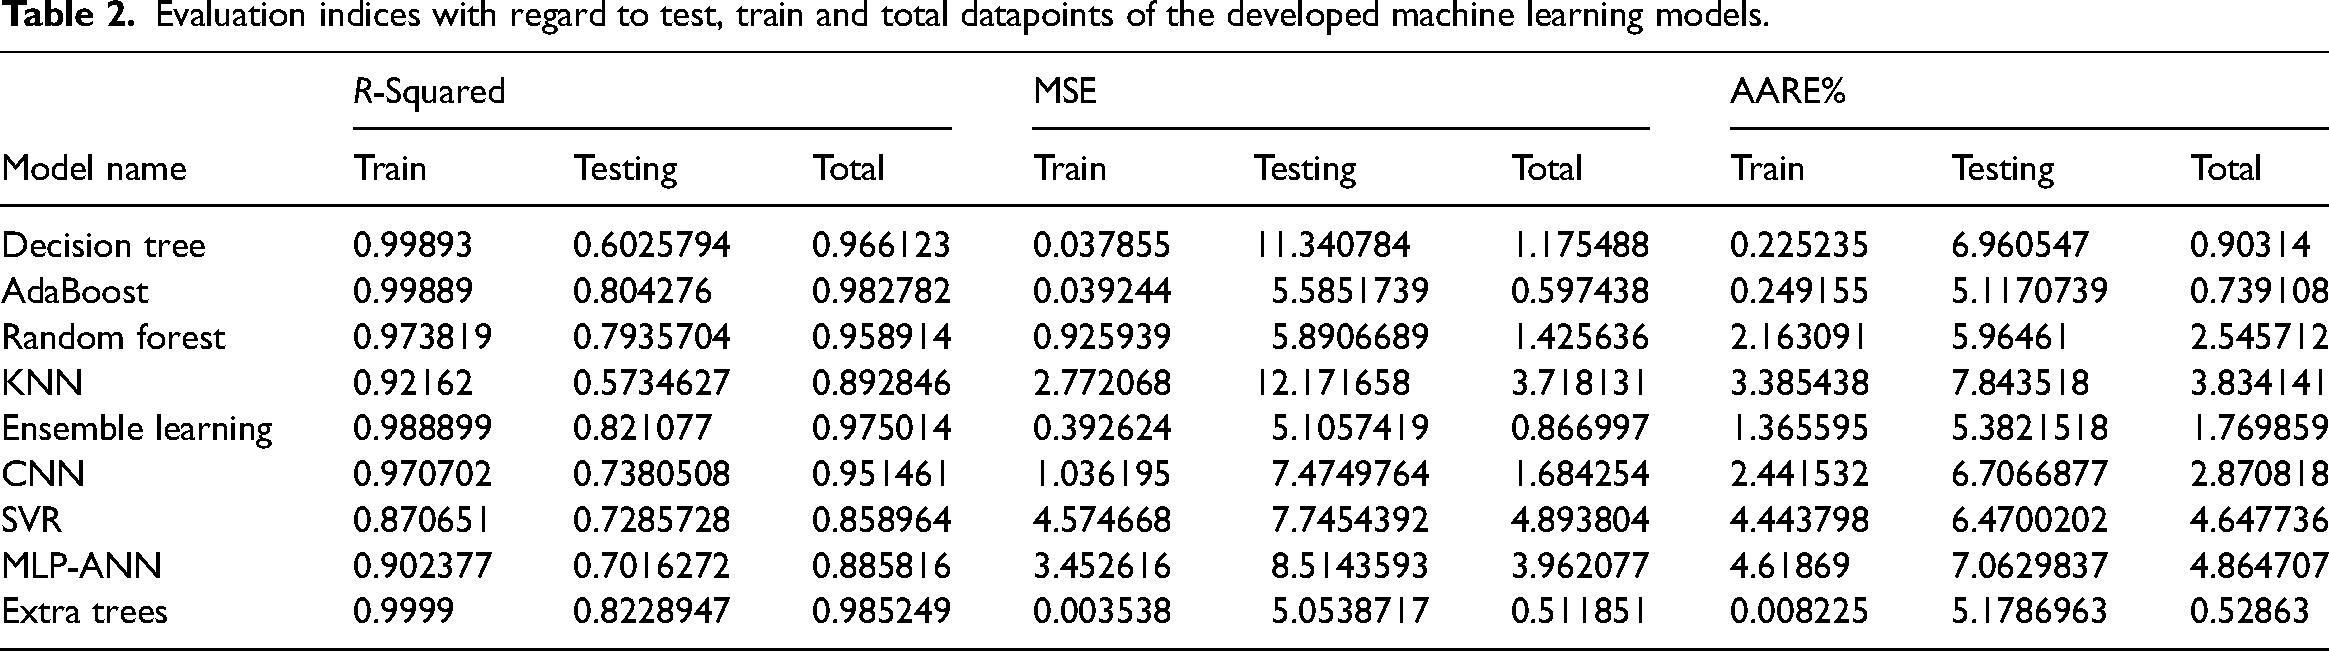
Table 2 displays the performance metrics, including the and average absolute relative error (AARE%), coefficient of determination (R-squared), and MSE based upon intelligent models developed in this research. To provide a comprehensive evaluation, Figure 13 illustrates these factors in test phase, offering a visual representation of the models’ predictive capabilities. First, as can be seen by the comparison of MSE values of train and test stages with significant differences for extra trees and adaptive boosting, these models suffer hugely from overfitting issues although they are re-enforced with the k-fold cross validation method. Ensemble learning is also not considered as a reliable method because one of its estimators is adaptive boosting. Random forest appears to be the most accurate and robust model based off of the emerged MSE, AARE% and R2 for both train and test stages.
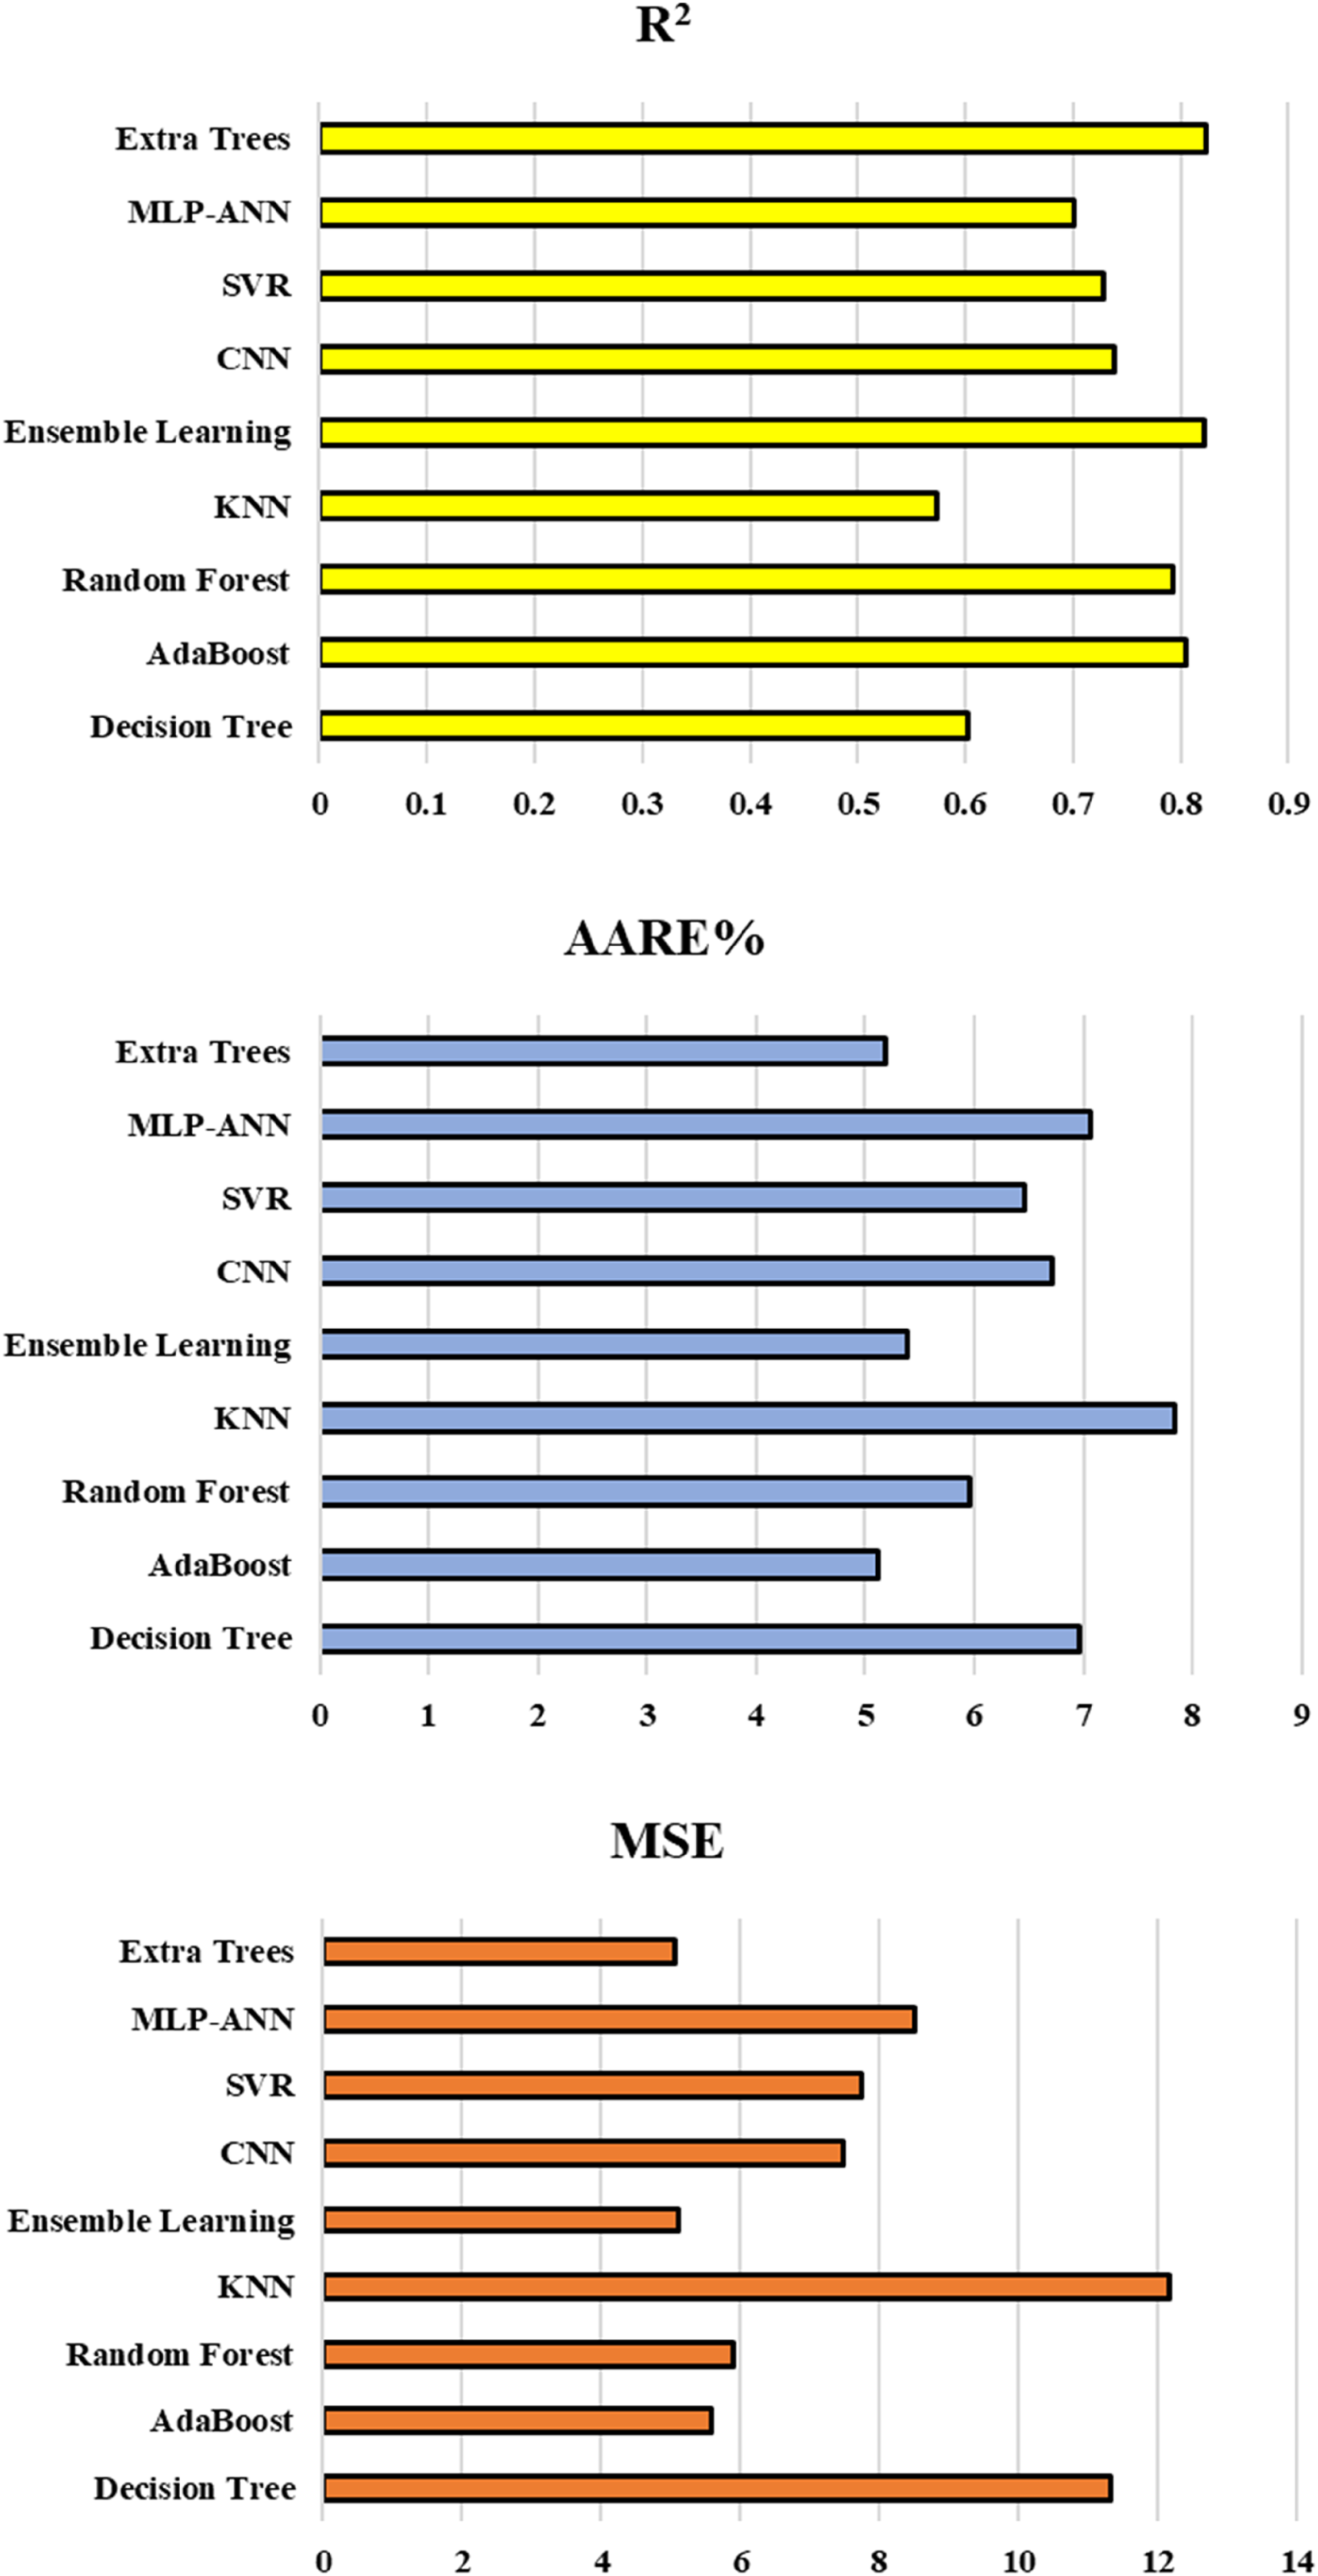
MSE, R2, and AARE% with regard to testing stage for all the developed models.
Evaluation indices with regard to test, train and total datapoints of the developed machine learning models.
To evaluate the robustness and accuracy of the trained algorithms, various graphical subplots are applied in the current research work. Initially, crossplots for suggested predictive models are created, as depicted in Figure 14. In the random forest model, the grouping of points of data near unit-slope line shows a strong indication of precision. Additionally, equations resulted due to fitted lines on the aforementioned datapoints closely approximate the bisector line. Figure 15 shows spreading of relative deviation based upon all models. A tighter grouping of data points along the y = 0 line indicates improved accuracy of the estimator. According to this graph, the random forest machine learning approach stands out as the most efficient predictive method for estimating the CRI. The visual analysis of these plots contributes to a comprehensive assessment of the models’ performance and supports the selection of the random forest model as the preferred choice for accurate predictions.
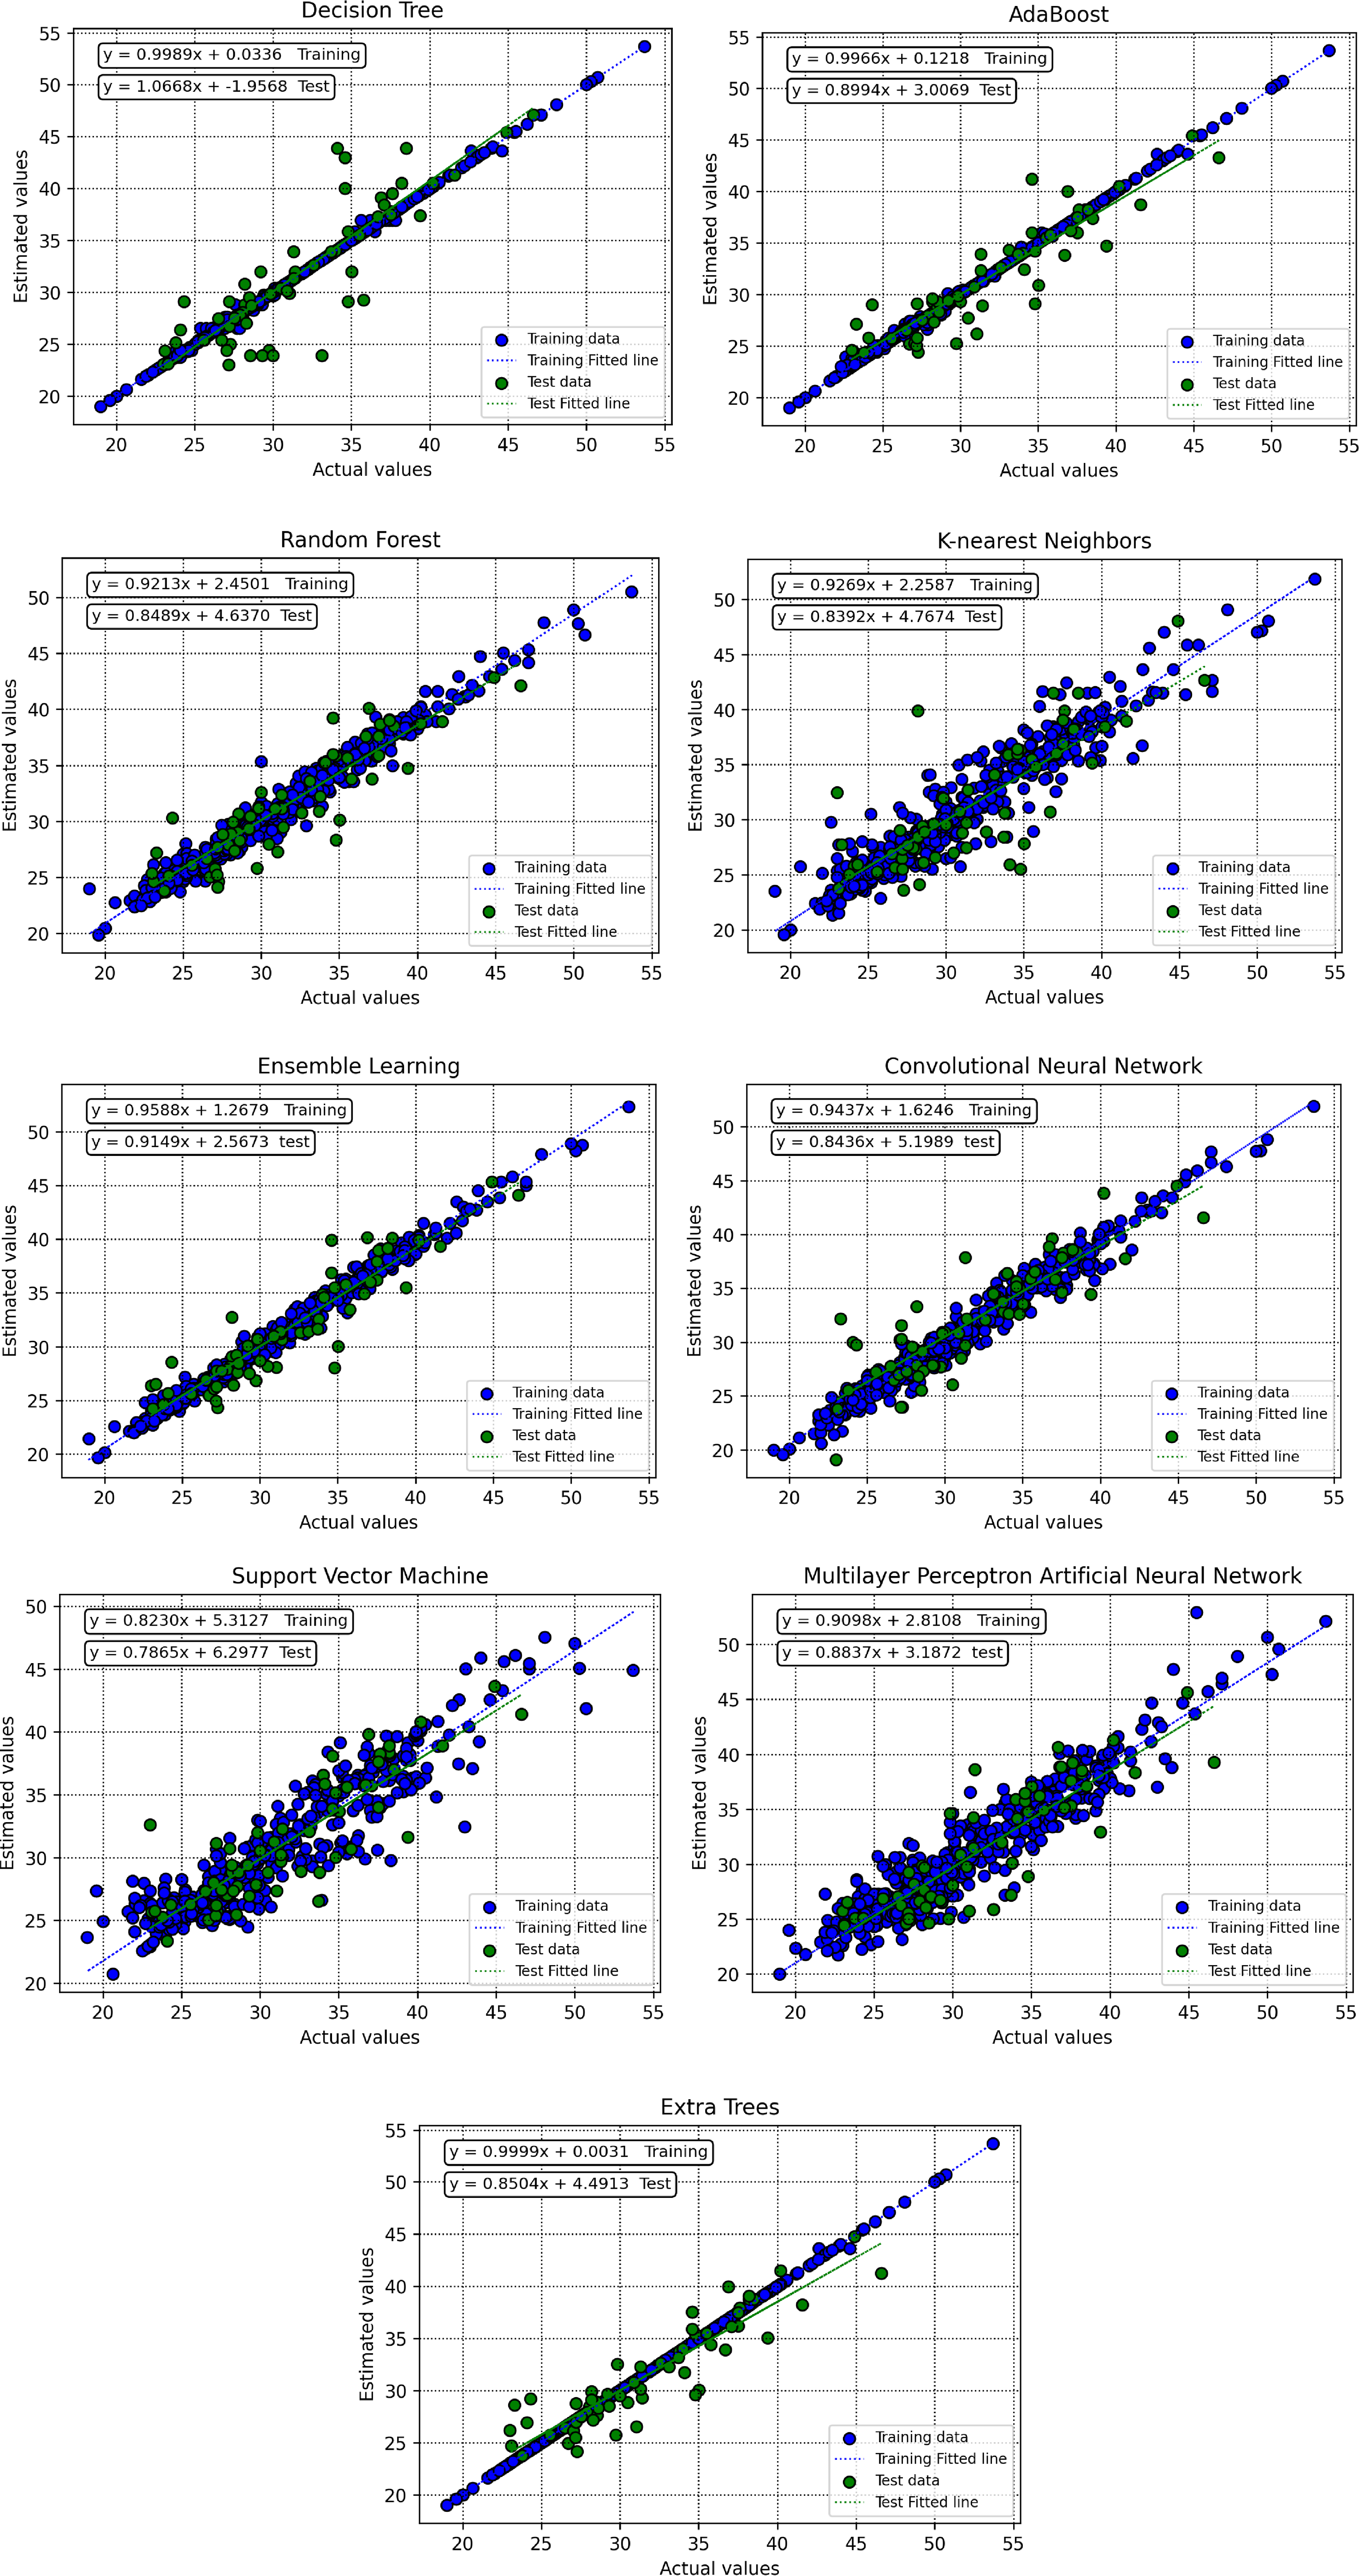
Crossplots of real versus modeled datapoints based upon train and test segments for all the constructed predictive models.
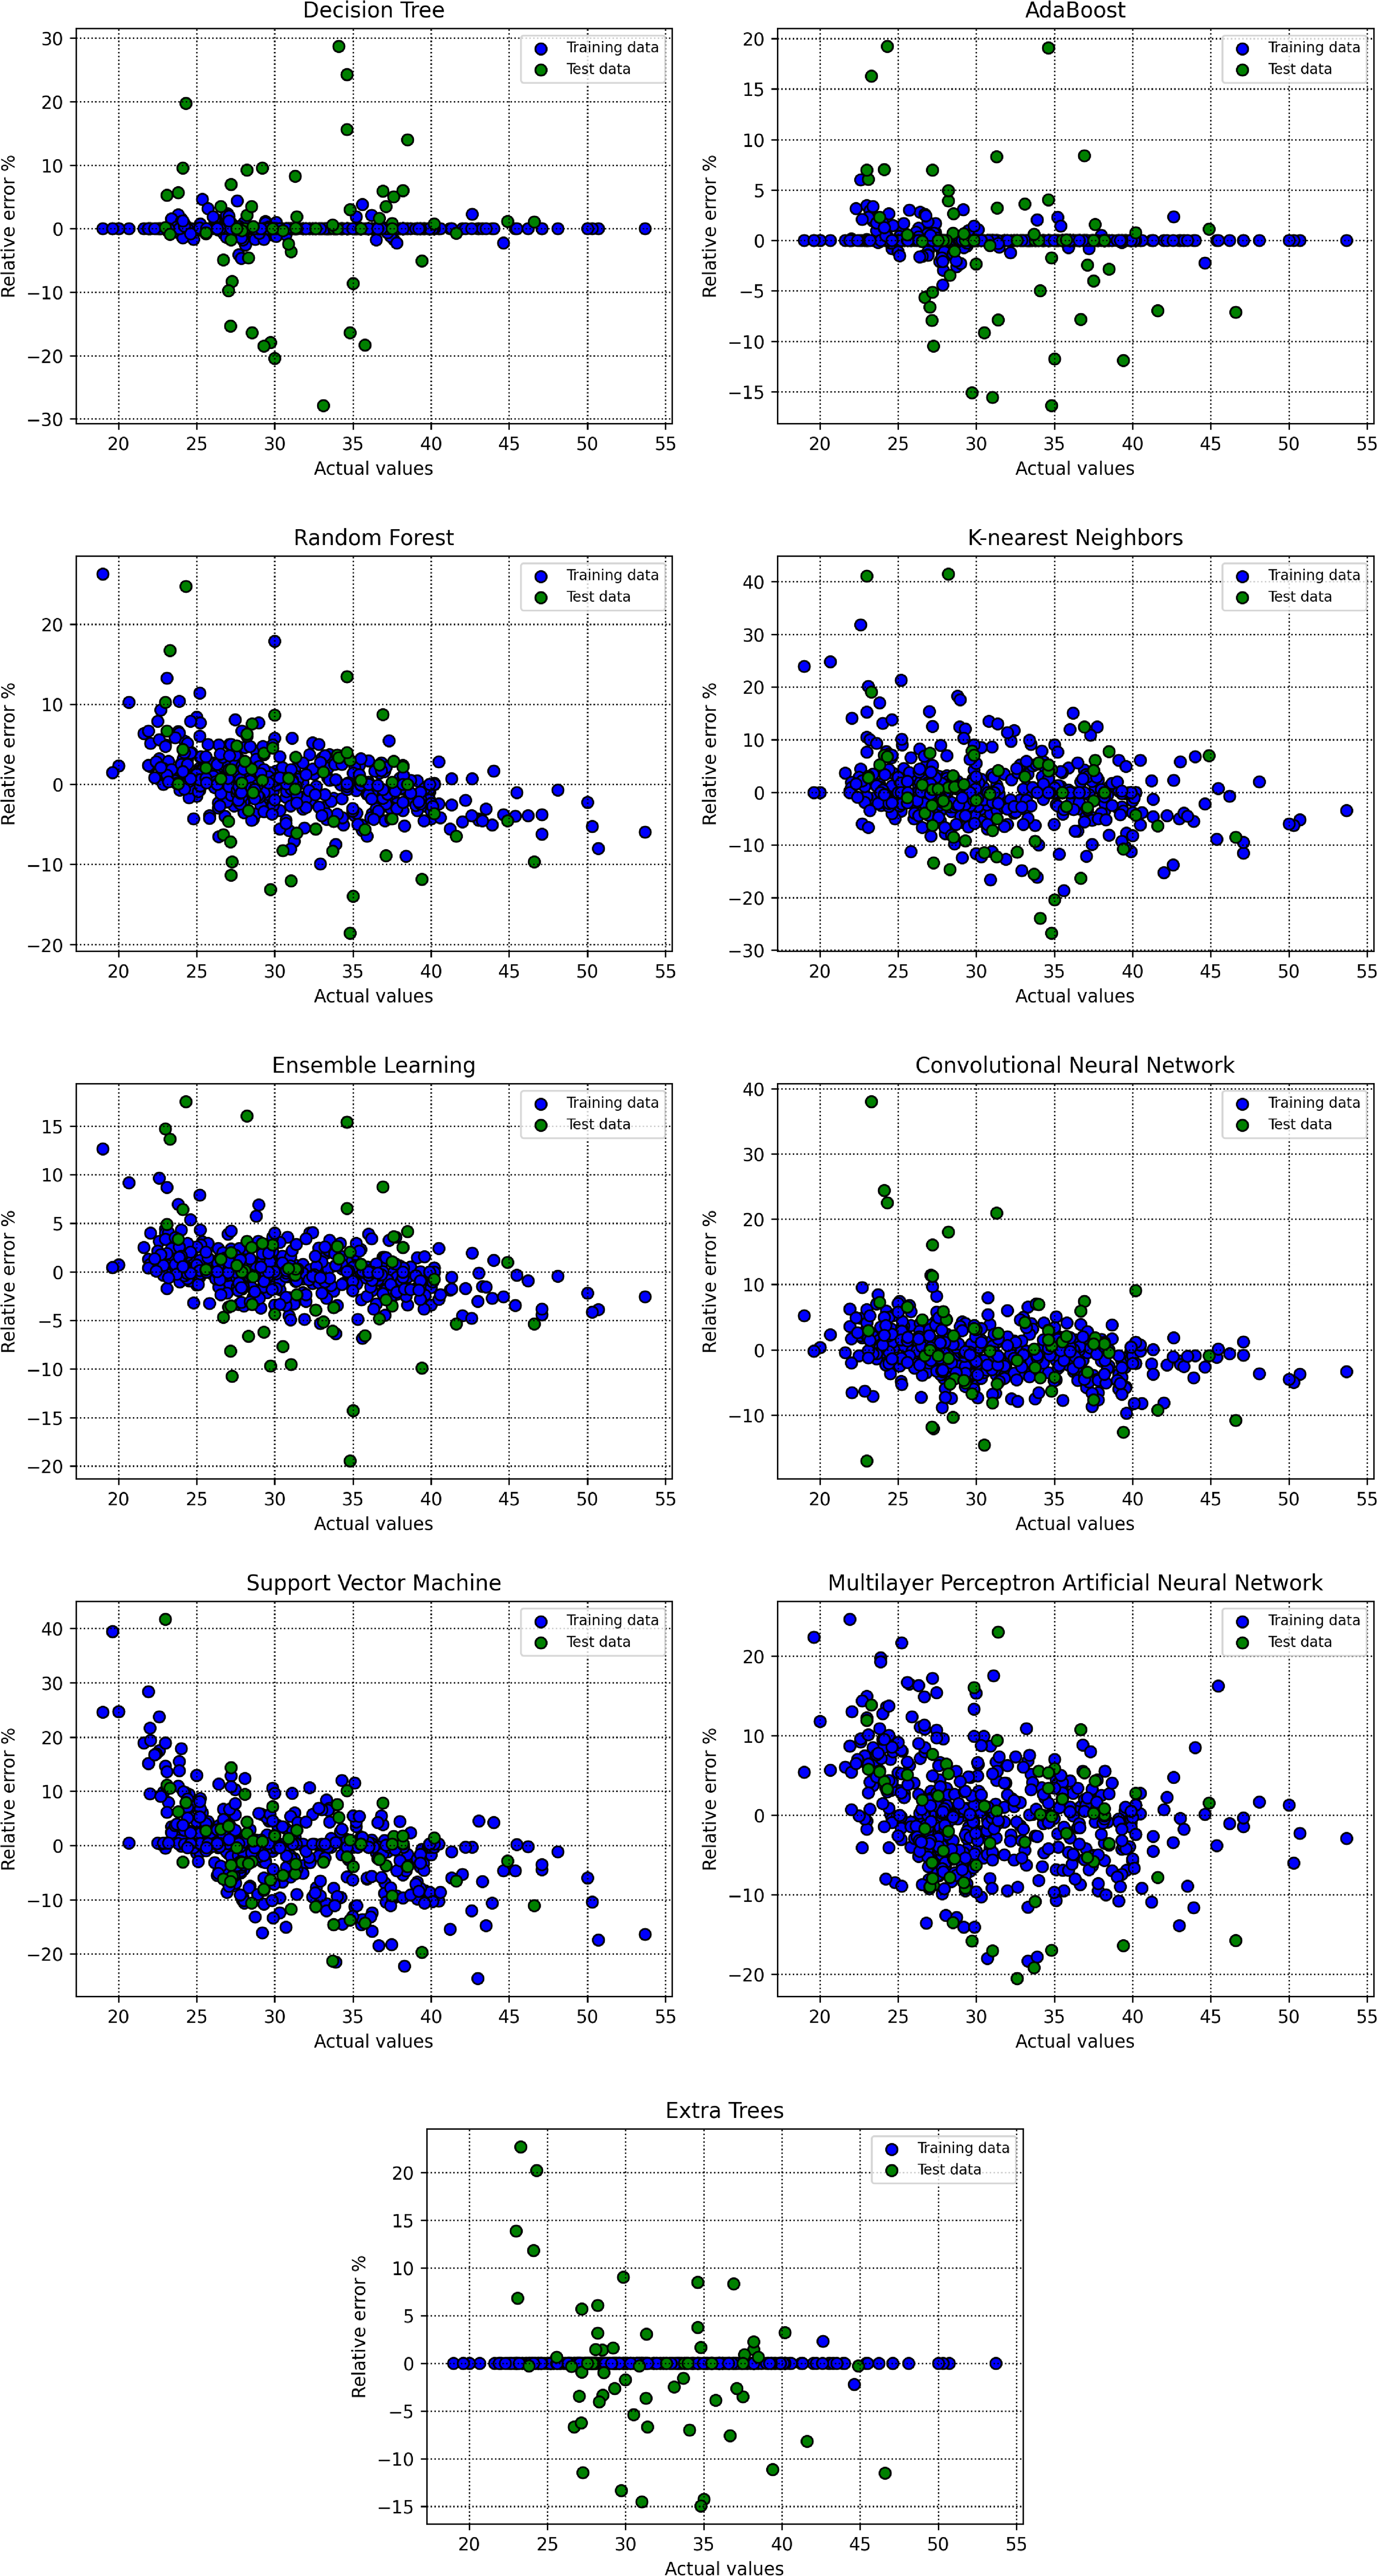
Crossplots of relative error percent versus real points based upon train and test segments for all the constructed predictive models.
The findings of this study have significant practical implications for the metallurgical industry, particularly in optimizing coke quality for blast furnace operations. By reliably predicting the CRI, plant operators can fine-tune the selection and blending of raw materials to achieve the desired reactivity levels. This approach minimizes the reliance on costly experimental procedures and reduces waste, contributing to cost-effective and sustainable production processes. Furthermore, understanding the relationship between key parameters such as maximum fluidity, MMR, and basicity index with CRI offers actionable insights for improving coke formulation strategies, ensuring consistent performance across different batches. For example, targeting specific ranges of maximum fluidity and controlling ash content can enable a more efficient adjustment of coke reactivity to meet operational requirements.
Beyond its practical utility, the study also highlights broader contributions to the field of machine learning in metallurgical applications. The superior performance of the random forest model, with high R-squared values and low error rates, demonstrates the robustness of ensemble methods in handling complex, nonlinear relationships between process variables and CRI. This reinforces the potential of machine learning models as reliable tools for predictive analytics in industrial processes. Moreover, the study's methodology, that is, employing K-fold cross-validation to mitigate overfitting, can serve as a template for future work aiming to predict other critical metrics in coke or steel production. These findings not only enhance the industry's understanding of coke reactivity but also underscore the role of data-driven approaches in advancing metallurgical research and operational excellence.
Conclusions
In this study, robust machine learning models based on decision tree, extra trees, random forest, KNN, SVM, MLP ANN, convolutional neural network, ensemble learning, and adaptive boosting were successfully constructed to predict CRI based on the influencing parameters. The dataset employed in this study is sourced from a coke plant, aiming to predict CRI. To mitigate the issue of overfitting during the training phase, the study adopts the K-fold cross-validation methodology, which enhances the reliability and robustness of the machine learning models. The performance of each algorithm is evaluated through evaluation metrics and depicting figures. The results show that maximum fluidity and MMR exhibit a direct correlation with CRI while it is indirectly correlated with moisture content, ash content, sulfur content, basicity index, plastic layer thickness, and MMR. The model of random forest appeared as best algorithm for precise prediction of CRI, according to AARE%, R-squared, and MSE of 2.545%, 0.958, and 3.718, respectively, based on total datapoints.
Footnotes
Data availability statement
Data is made available with reasonable request from the corresponding author.
Declaration of conflicting interests
The authors declared no potential conflicts of interest with respect to the research, authorship, and/or publication of this article.
Funding
The authors received no financial support for the research, authorship, and/or publication of this article.