
Abstract
Coke strength after reaction (CSR) is a critical parameter in metallurgical applications, and its accurate prediction is essential for optimizing coal blends and coking processes. This research develops a data-driven method to model CSR by eight input variables, including moisture content, volatile matter, ash percentage, sulfur content, maximum fluidity, plastic layer thickness, mean maximum reflectance (MMR), and the basicity index. A dataset comprising 630 coal samples with diverse properties was analyzed using advanced techniques such as Pearson correlation analysis, the Monte Carlo outlier detection technique in data integrity assessment, and machine-learning models with five-fold cross-validation. Multiple algorithms were implemented, including random forests, decision trees, adaptive boosting, convolutional neural networks, support vector regression, multilayer perceptron-artificial neural networks, and an ensemble learning approach, with hyperparameter optimization and evaluation metrics like mean squared error, R2, and mean and average absolute relative error. The random forest model decisively outperformed all other contenders, demonstrating its superior predictive power through consistently high R2 values and minimal error rates. Furthermore, Shapley additive explanations analysis revealed the influence of each input variable, with volatile matter having a predominantly negative effect on CSR, while features like MMR and moisture showed positive correlations. This systematic methodology underscores the importance of robust data assessment and machine-learning models in enhancing predictive accuracy for CSR.
Keywords
Introduction
Coke plays a pivotal role in metallurgical applications, serving as both a fuel and a dropping agent in the production of steel. The efficiency and cost-effectiveness of metallurgical processes are significantly influenced by coke quality (Aghdam et al., 2022a, 2022b; Jha et al., 2020; Sharma and Tiwari, 2024). A crucial property of coke is its ability to maintain sufficient strength over time to support the burden in a blast furnace during operation. Two critical indices are employed to evaluate coke performance under these conditions: coke strength after reaction (CSR) and coke reactivity index (CRI). CSR represents coke's hot strength, reflecting its capacity to sustain the furnace burden, while CRI measures coke's durability by assessing mass loss following gas–solid reactions in a blast furnace (Lundgren et al., 2009; Wang et al., 2016). As such, CSR and CRI are regarded as key benchmarks for assessing coke quality during manufacturing.
Widespread research on coke production has identified several factors that impact coke quality, such as ash content, sulfur levels, volatile matter, and the presence of a plastic layer (Niu et al., 2022; Zhang et al., 2025). As a result, numerous precise models have been established to explore the complex relationships between coal blends and coke properties (Abdel Hady and Abd El-Hafeez, 2024; Abdel Hady et al., 2024; Badawy et al., 2021; Eliwa et al., 2024). Accurate and reliable modeling of the complex relationships between coal composition and the coke production process is exceptionally difficult. The inherent variability and intricate nature of coal, coupled with multifaceted coke manufacturing processes, presents substantial hurdles in developing a precise predictive model (Alekseev et al., 2023; Bulaevskii and Shved, 2010; Pusz and Buszko, 2012; Ulanovskiy, 2014).
Recent advancements have introduced approaches such as regression models, statistical analysis, and machine learning to improve the predictability of coke quality regarding the coal blend characteristics (Aghdam et al., 2022a, 2022b; Khezerlooe-ye Aghdam et al., 2019; Qiu et al., 2024a, 2024b; Rejdak et al., 2021). When it comes to understanding how coal's makeup influences coke's characteristics, linear and nonlinear regression models have proven incredibly useful in defining those connections. While these models can provide precise predictions with uniform coal blends and similar coking ovens, their performance deteriorates significantly when the coal blend composition changes or when applied across various machines (Agarwal et al., 2021; Qiu et al., 2024a, 2024b; Ziqi et al., 2022).
In addition to regression frameworks, statistical techniques have been utilized to uncover intricate correlations between coke quality indices such as CSR and CRI and coal properties. Examples of these methods include partial least squares (PLS) regression, multivariate adaptive regression splines (MARS), and principal component analysis (PCA) (Adhab et al., 2025; Qiu et al., 2024a, 2024b; Sabancı et al., 2023). PCA is often applied to reduce dimensionality by condensing multiple input features into a minor set of parameters while retaining the greatest of the original information. By simplifying the inputs, PCA facilitates better insights into the underlying structure of the data and the relations between coke quality and coal properties (Zhang et al., 2017a, 2017b; Zhou et al., 2022). On the other hand, PLS regression, while also capable of dimensionality reduction, is specifically designed to prioritize predictive power by focusing on maximizing the covariance among inputs and the target variable, making it principally suited for regression tasks where the primary goal is prediction (Zhang et al., 2022b; Zhao et al., 2011; Zhu et al., 2019). MARS, designed for modeling complex nonlinear regressions, is particularly suited for predicting coke quality by employing flexible basis functions to address nonlinear interactions. While statistical analysis methods are good at finding relationships between coal properties and coke quality, their accuracy often suffers. This is because their predictive performance depends a lot on the specific coal samples used and the complexity of the input variables, which often limits how reliable their predictions are (Tao et al., 2021; Wang et al., 2024a; Yang et al., 2023a).
The metallurgical industry is increasingly turning to machine learning because its models are proving to be more accurate than traditional regression methods. They are much better at understanding the complex connections between different factors and their results (Abbasi et al., 2017; Bassir and Madani, 2019a, 2019b; Elmessery et al.; 2024 Farghaly, et al., 2020a, 2020b). For example, methods like artificial neural networks (ANNs) and support vector machines (SVMs) show real promise for predicting coke quality with high accuracy (Mostafa et al., 2024a, 2024b; Omar and Abd El-Hafeez, 2024). In fact, ANNs have already been successfully used to model the co-gasification of coal and petroleum coke, producing predictions that closely match what's observed in experiments (Qiu et al., 2024a, 2024b; Wang et al., 2024b; Yang et al., 2022).
Research has also shown that multilayer ANNs can effectively predict coke hot strength within acceptable margins of error. Similarly, SVMs have been applied to investigate variables such as ash content and its influence on coke properties, achieving high predictive accuracy. Despite the promise of these machine-learning techniques, they have only been minimally applied to predict, and their reliability across diverse coal blends has yet to be meticulously evaluated. Therefore, there is a critical need for the development of an inclusive predicting model capable of consistently and precisely predicting CRI and CSR across a wide range of coal mixtures (Xiang et al., 2021; Zhao et al., 2024).
To address the complexities associated with predicting CSR, this paper adopts a systematic and robust workflow. The study initiates with data gathering and analysis, including the application of statistical tools to assess distributions, correlations, and critical patterns. To guarantee the integrity and reliability of our dataset, we're using Monte Carlo outlier detection (MCOD) to identify and address any unusual data points. We are then developing and fine-tuning a range of machine-learning models, including random forests, adaptive boosting (AdaBoost), decision trees, convolutional neural networks (CNNs), support vector regression (SVR), multilayer perceptron-artificial neural networks (MLP-ANNs), and various ensemble methods. Each of these models will undergo five-fold cross-validation to ensure they can generalize well to new data. We will be comparing their performance using key metrics such as R2, average absolute relative error (AARE%), and mean squared error (MSE), to determine which models are most effective.
Additionally, Shapley additive explanations (SHAP) analysis offers detailed insights into feature relevance, refining the understanding of the complex interrelationships between input variables and CSR. Collectively, the paper aims to establish a data-driven approach for CSR prediction, offers practical insights into feature contributions, and provides researchers and industry professionals with tools for optimizing coal blend strategies. Table 1 indicates the modeling process and flowchart in different steps.
Modeling process and flowchart in different phases.
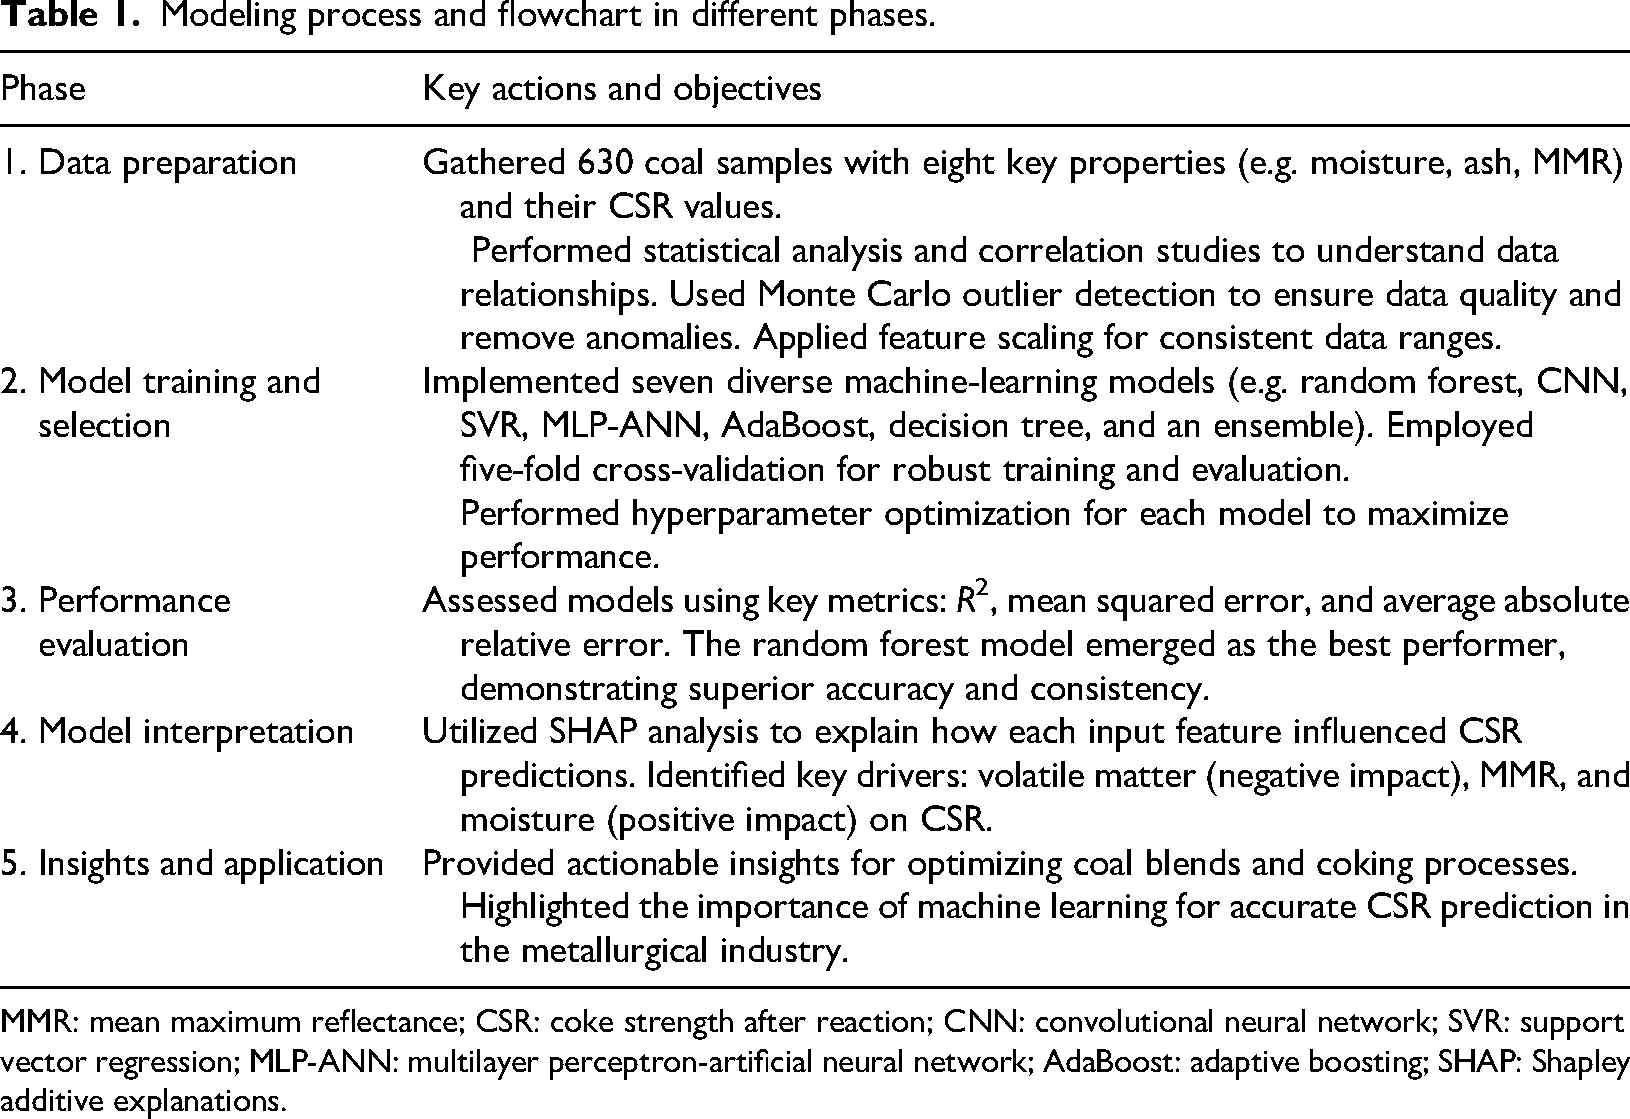
MMR: mean maximum reflectance; CSR: coke strength after reaction; CNN: convolutional neural network; SVR: support vector regression; MLP-ANN: multilayer perceptron-artificial neural network; AdaBoost: adaptive boosting; SHAP: Shapley additive explanations.
Figure 1 illustrates the overall workflow of this research.
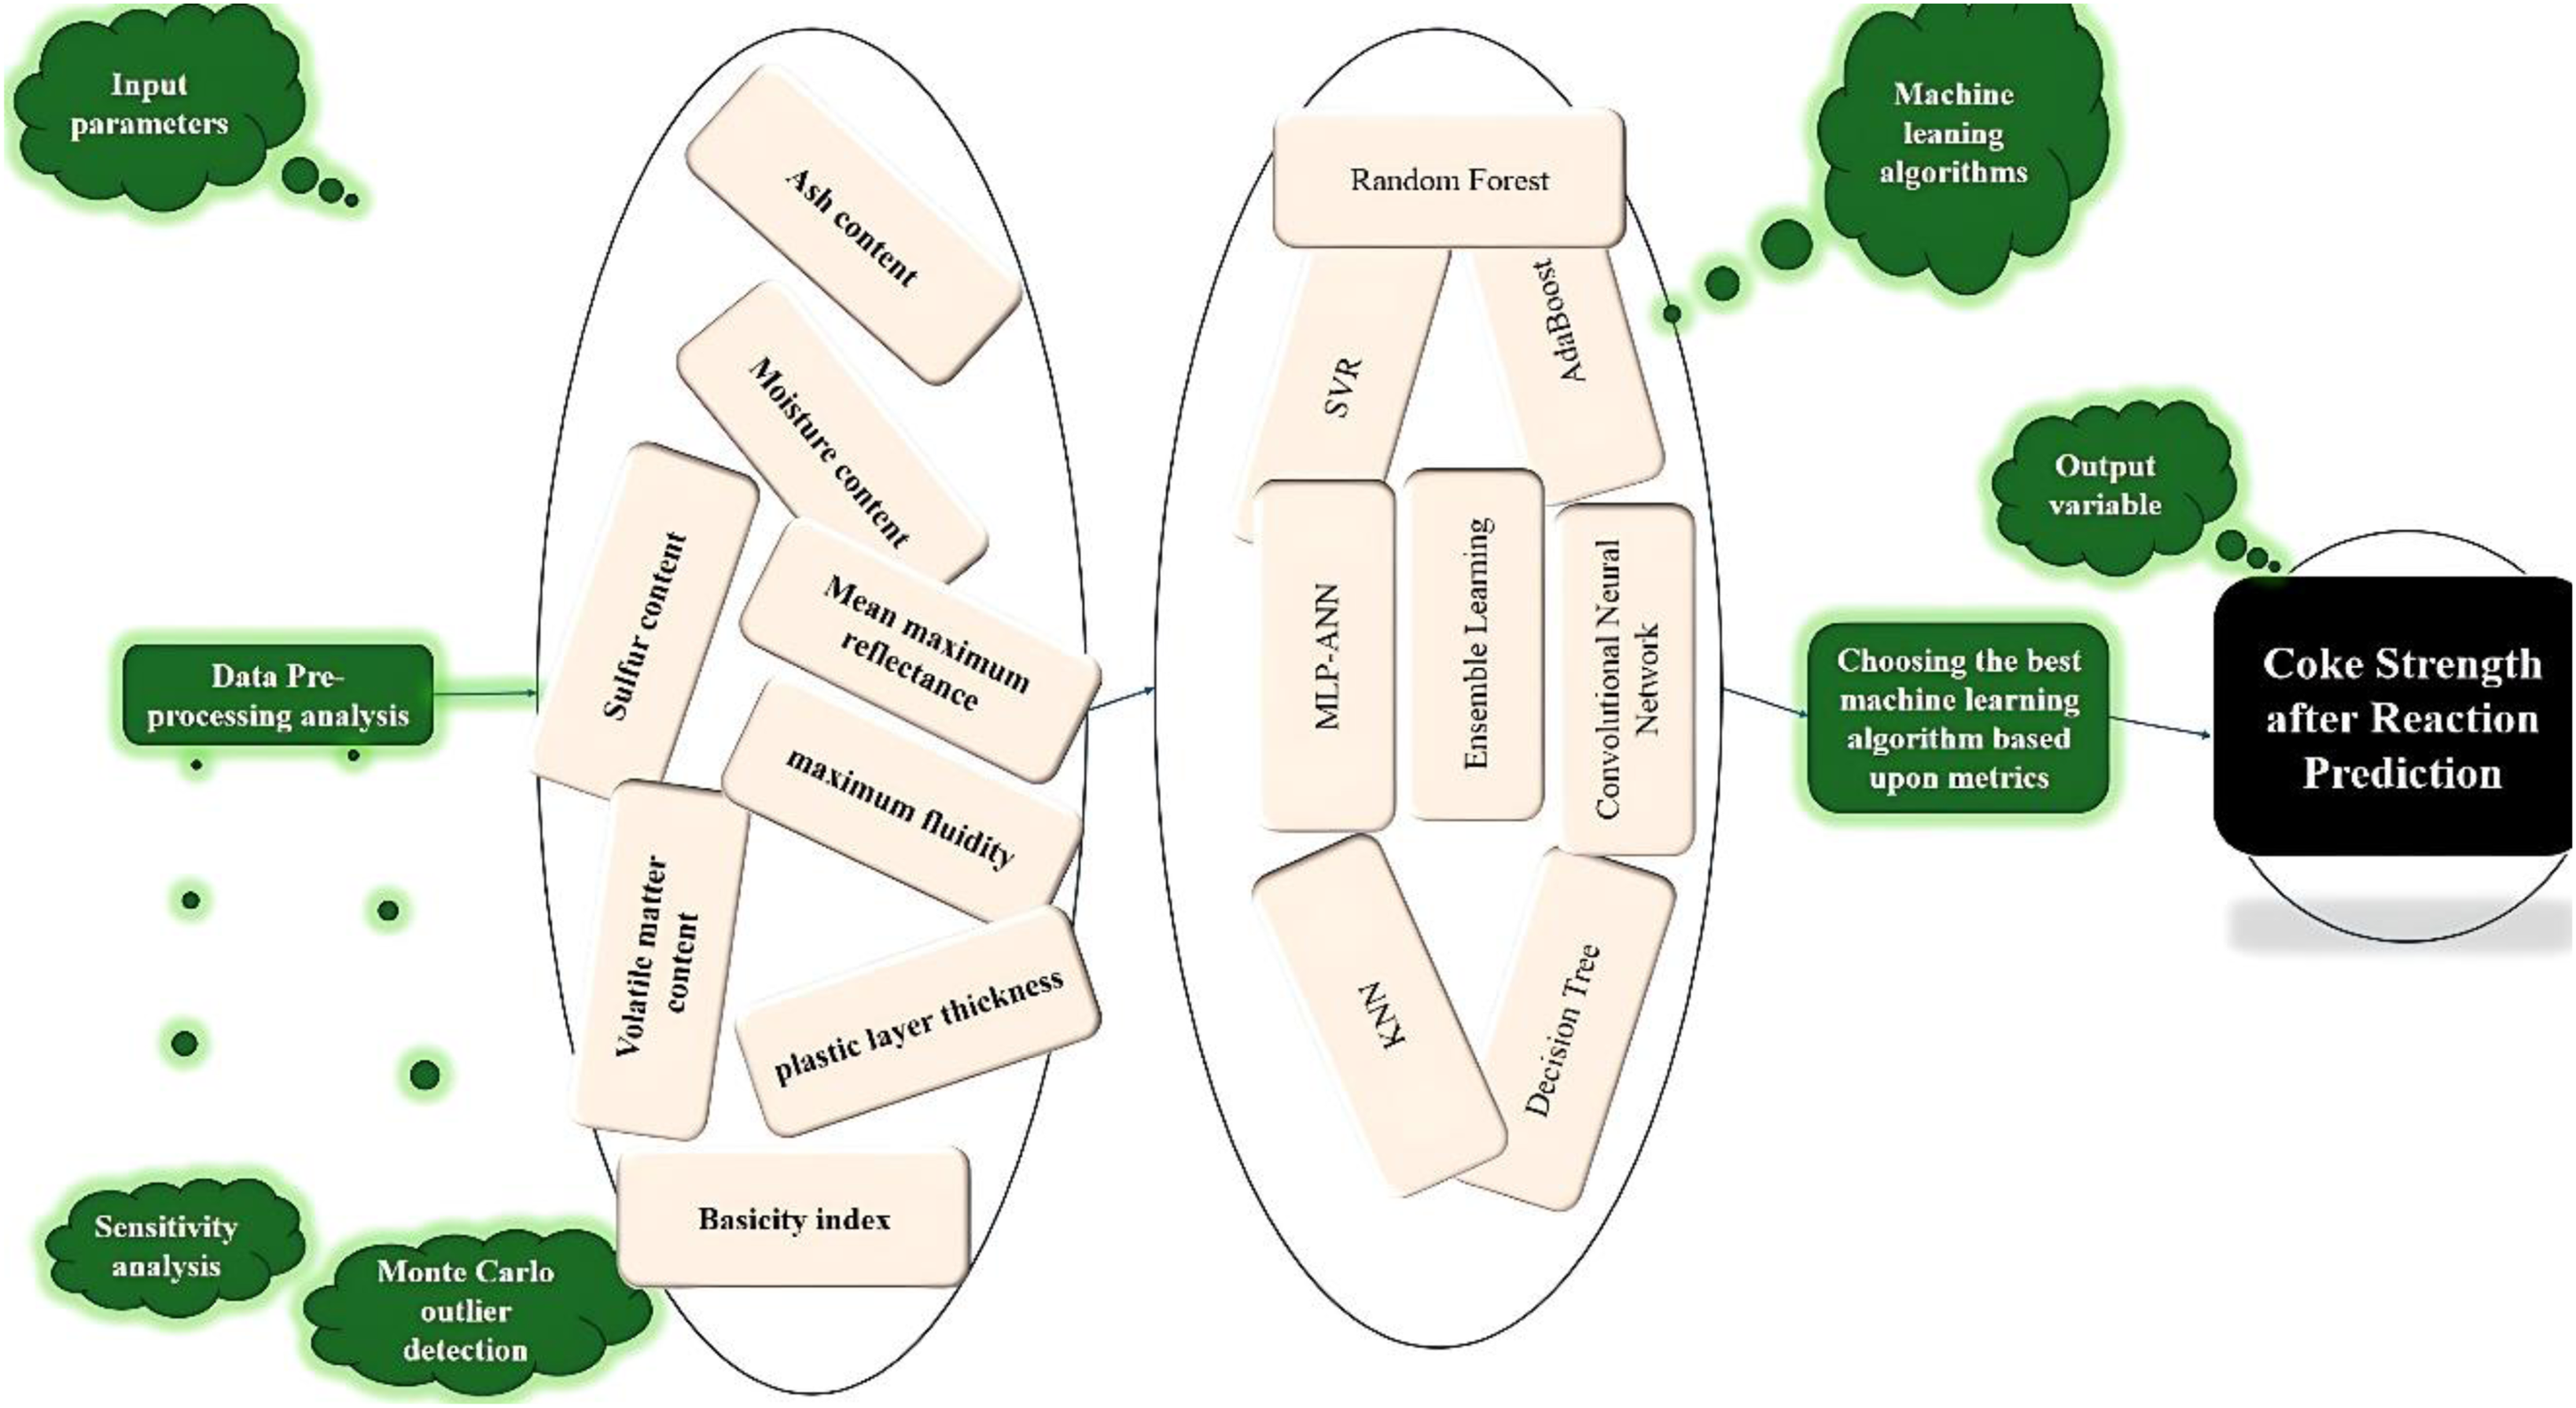
Study's data-driven modeling process.
Fundamentals of machine learning
Ensemble learning
It is a powerful framework that combines predictions from multiple base learners to construct accurate and reliable predictive models. By integrating diverse algorithms, ensemble methods enhance performance, stability, and generalization capabilities, often surpassing individual models. A key advantage of this approach lies in its error-canceling effect: aggregating predictions from independently trained models reduces bias and overfitting, makes it especially well-suited for working with complex or high-dimensional datasets. As illustrated in Figure 2, while ensemble learning can involve various algorithms, this study specifically incorporates random forests, decision trees, and AdaBoost methods to achieve optimal results (Mamun et al., 2022; Yaghoubi et al., 2024; Zhang et al., 2022a).
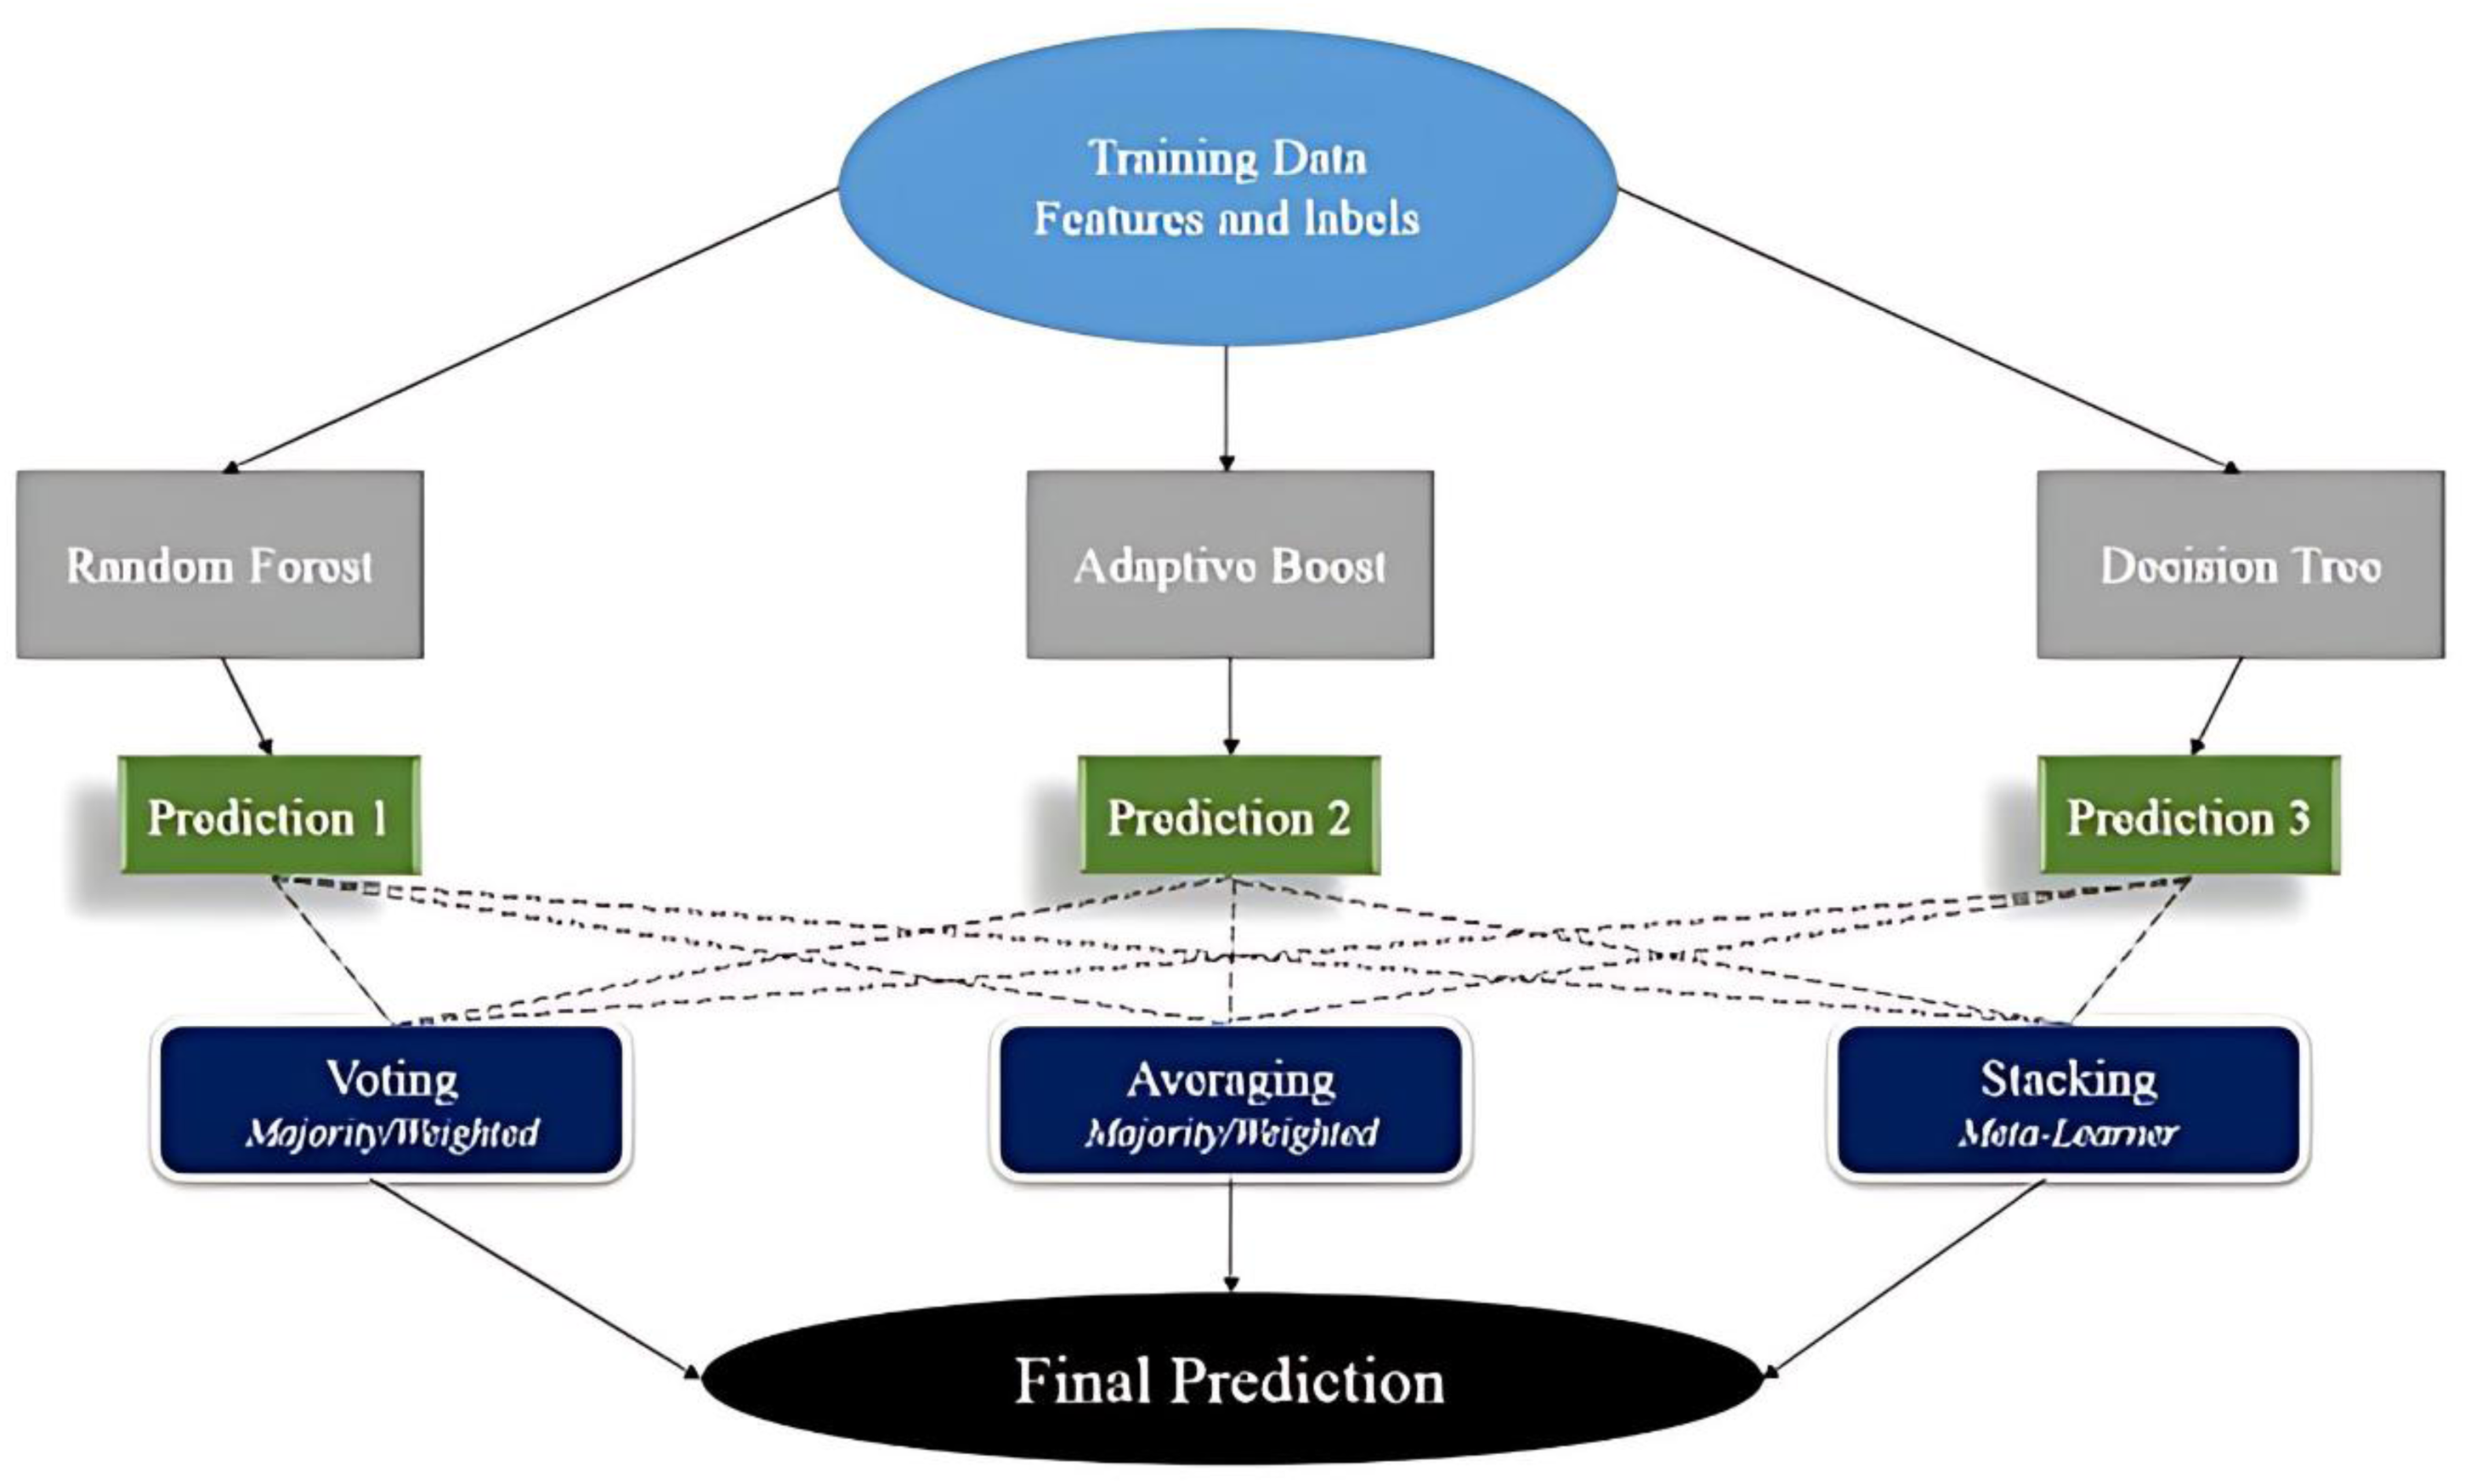
Diagram of the ensemble learning machine-learning technique.
Recognized for its power in detecting subtle patterns and relationships, this method is now a core component of applications like regression, classification, and anomaly detection. Ensemble methods are widely utilized across different domains, including finance for credit scoring and fraud detection and healthcare, where they support disease prediction and medical image analysis. Their significant presence in artificial intelligence allows for greater predictive reliability and superior decision-making. The ability of ensemble learning to maximize predictive accuracy makes it highly valuable, particularly in competitive machine-learning environments. However, effective implementation requires careful consideration to ensure optimal performance across a range of practical applications (Mhawi et al., 2022; Tan et al., 2022; Yang et al., 2023b). Note that in Figure 2, “voting” and “averaging” refers to classification and regression tasks, respectively.
Adaptive boosting
AdaBoost functions by iteratively aggregating less accurate classifiers into a robust predictive model. Created by Freund and Schapire, AdaBoost enhances predictive accuracy iteratively by concentrating on incorrectly classified instances, assigning them greater weight in the following iterations. This flexible mechanism allows the algorithm to handle intricate decision boundaries, successfully minimizing bias and variance. The process involves training weak learners, such as decision stumps, on altered iterations of the training data, where the input for each learner is weighted based on its performance, giving greater influence to more accurate classifiers on the final prediction. The algorithm's sequential approach, which focuses on misclassified instances for future iterations, significantly contributes to its effectiveness, making it ideal for both classifications and regressions. The effectiveness of every weak classifier is assessed through its weighted error rate, denoted 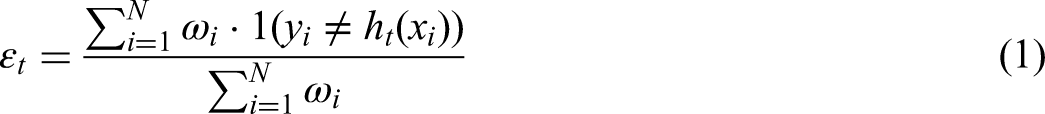
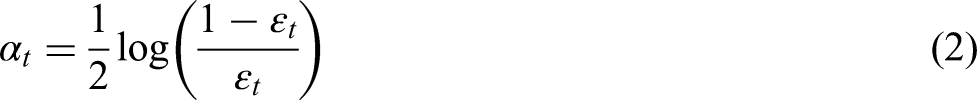
This weighting system guarantees that more precise classifiers have a greater impact on the final prediction, whereas less precise classifiers exert diminished influence. The ensemble model's output is achieved by merging the results from each weak classifier, modified based on their αt values. In classification tasks, the final prediction H(x) is determined as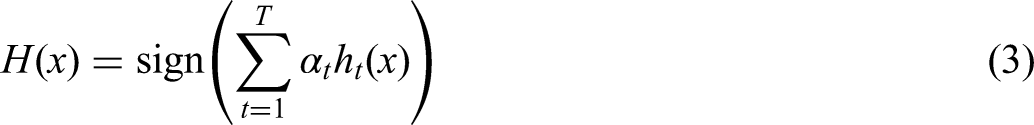
In this context, T refers to the count of weak classifiers, while sign(⋅) assigns the predicted class label according to the combined votes of the ensemble model. The adaptability of AdaBoost has led to its widespread application. Its capacity to be customized for particular tasks, compatibility with various base learners, and efficiency in processing high-dimensional data render it a useful resource for numerous applications. Nonetheless, AdaBoost has drawbacks, particularly its vulnerability to noisy data and outliers. If not properly controlled, the algorithm's inclination to increase the significance of misclassified instances can result in overfitting, as it might highlight erroneous data points. Furthermore, its training method is sequential, which can require considerable computational resources, and the intricate nature of the final ensemble model may lead to difficulties in interpretation.
In spite of these drawbacks, AdaBoost continues to be an effective ensemble technique, particularly when implemented thoughtfully and suitable preprocessing measures are employed to handle outliers and noise. Its capacity to flexibly rectify mistakes and merge weak learners into a robust predictive model maintains its importance in machine-learning research and practical uses. With its benefits, drawbacks, and adaptability, the method offers a significant and powerful resource for numerous predictive modeling tasks when appropriate preprocessing is executed (Ghorbani et al., 2020; Mohebbanaaz et al., 2022; Ren et al., 2022).
Decision tree
This approach is a broadly utilized and intuitive technique designed for regression and classification tasks. It works by systematically partitioning a dataset into subsets with similar target variable characteristics. The process relies on feature-based decisions at each internal node to maximize the homogeneity of the resulting partitions. The splitting criteria are typically based on indications like Gini impurity or information gain and continue until predefined stopping criteria are met, like reaching a highest tree depth or possessing a lowest number of samples in a leaf node. Predictions are made by tracing an instance's feature values through the tree, leading to a terminal leaf node, which provides the forecasted class label. This structured and hierarchical approach mimics human decision-making processes, rendering the model both interpretable and user-friendly.
One of the key strengths of decision trees is their interpretability, allowing for a clear understanding of how features influence the target variable. Their inherent transparency makes them invaluable in fields such as healthcare and finance, where model interpretability is essential. However, decision trees are vulnerable to overfitting, mainly when overly deep and complex, which can hinder their performance on new data. To address these issues, techniques such as pruning, limiting tree depth, and employing ensemble manners like gradient boosting and random forests are commonly utilized. These strategies improve predictive accuracy and enhance model robustness by combining multiple trees’ predictions or simplifying tree structures.
In summary, despite some limitations, decision trees remain an essential tool due to their simplicity, interpretability, and ability to highlight feature relationships. When integrated with ensemble learning techniques, they achieve higher predictive performance and overcome overfitting, ensuring their continued importance in machine-learning applications where accuracy and transparency are critical (Navada et al., 2011; Tang et al., 2015).
Multilayer perceptron-artificial neural networks
MLPs are vital structures of ANNs designed to model intricate, nonlinear relationships in data. With an input, output, and multiple hidden layers, MLPs are built from interconnected neurons characterized by adjustable weights and biases. The network's training procedure consists of forward propagation, in which data flows through layers to produce predictions, and backpropagation, where the calculated error is used to modify the biases and weights by means of optimization techniques.
In every neuron, aside from the input layer, The primary function entails computing a weighted total of its inputs, incorporating a bias term, and utilizing an activation function: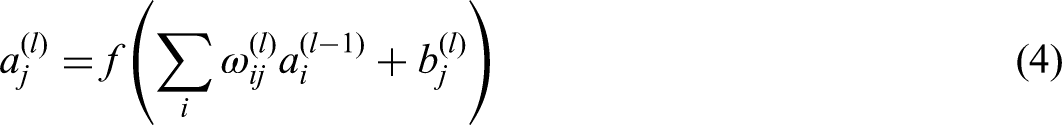
In the above formula, 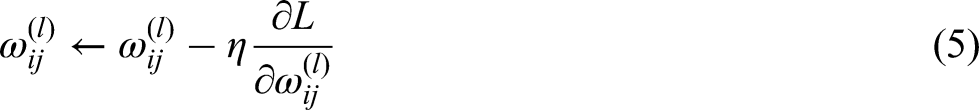
MLPs have attained widespread success because of their ability to represent nonlinear relationships and generalize well. Nonetheless, they possess constraints, including their inclination to overfit, significant computational expense with extensive datasets, and the need for precise hyperparameter tuning. In spite of these obstacles, MLPs continue to be an essential element in machine learning. Their capability to approximate any functions has resulted in their extensive use in regression, classification, pattern recognition, natural language processing, and specific applications, like medical diagnosis systems and financial forecasting. The efficacy of MLPs highlights their importance as independent models and as foundational components for more advanced deep-learning systems (Foddis et al., 2019; Itano et al., 2018; Mustafa et al., 2013).
k-Nearest neighbors
This is a learning method utilized for classifications and regressions. Unlike parametric models, k-nearest neighbors (k-NN) directly rely on the training dataset and assume that similar data points are located close to one another. During prediction, the algorithm identifies the k-nearest training examples to a given query point using a specified distance metric, like Euclidean distance. Predictions are then generated based on the classes or values associated with these k neighbors. Due to its flexibility, k-NN is well-suited for capturing complex decision boundaries that parametric approaches may struggle to model. The selection of the parameter k is critical and is often determined through cross-validation to balance between sensitivity to noise and excessive smoothing.
For classification, the predicted class is determined by the majority class between the closest neighbors, while for regression, techniques like weighted averaging, where closer neighbors have greater influence, can be applied. Its nonparametric nature enables k-NN to perform effectively when there are no specific assumptions regarding the data distribution. However, the algorithm's computational cost increases with the size of the dataset, and its performance is deeply predisposed by the selection of k and the distance measure. Additionally, k-NN may face issues with imbalanced datasets, which can disproportionately affect the neighbor selection process and, consequently, the predictions.
To conclude, k-NN is a highly effective algorithm, particularly for small datasets or problems with complex decision boundaries. However, careful consideration must be given to the selection of hyperparameters, data preprocessing, and computational demands. The lack of a parametric model limits its generalizability since the algorithm relies entirely on the stored training data (Balabin et al., 2011; Bansal et al., 2022; Hazbeh et al., 2021; Zamouche et al., 2023).
Support vector regression
SVR modifies SVMs specifically for regression tasks. Unlike SVMs, which prioritize finding an ideal hyperplane to categorize data distinctly, SVR aims to find a function that models the relation between input features and continuous outputs, keeping prediction errors within a defined tolerance. The core principles of SVR, such as margin maximization and the application of support vectors, remain unchanged but are adapted for regression applications.
The core objective of SVR is to bargain a regression function f(x) that predicts y from x while minimizing deviations from the true values. Nonetheless, instead of reducing all deviations, SVR focuses only on those that exceed a designated threshold ε, establishing an epsilon-insensitive tube around the predicted function f(x). Points within this tube are regarded as accurately predicted, even if they differ from the valid values. The SVR regression function is
Within this framework, W denotes the vector, X is the input feature vector, and b is the basis term. The SVR optimization problem is mathematically formulated as
Here, ||w||2 serves as the regularization term which assurances the solution remains as straightforward as can be,
SVR provides various significant benefits for regression issues. It is resilient to outliers because of the epsilon-insensitive loss function and works especially well in high-dimensional feature spaces where other regression methods may have difficulty. Employing kernel functions enables SVR to represent intricate nonlinear relationships without the need for explicit data transformation, which enhances its flexibility. In addition, the convex optimization approach guarantees that the solution is globally optimal, sidestepping problems like local minimal (Bansal et al., 2022; El-Sebakhy, 2009; Wandekokem et al., 2011; Zhang and O'Donnell, 2020).
Convolutional neural networks
The approach represents a cornerstone in deep learning, particularly acclaimed for its exceptional performance in image analysis tasks. CNNs are designed to hierarchically extract increasingly complex features from visual data, enabling them to excel in tackling a wide range of challenging problems. Their architecture consists of a sequence of interconnected layers, where the initial layers detect fundamental features like edges and corners, and deeper layers capture more intricate patterns and structures. The core components of CNNs are convolutional layers, which utilize small filters (kernels) that traverse the input data to act as localized feature detectors. The shared-weight mechanism, inherent to this method, guarantees translation invariance. This crucial property allows CNNs to detect patterns consistently, regardless of their position within the input. Following this, pooling layers strategically down sample feature maps, often via max or average pooling, effectively highlighting essential features while simultaneously lowering computational demands.
Toward the end of a CNN, fully connected layers are often used. These layers take the features that the earlier parts of the network have extracted and combine them to make the final prediction, whether it's for classifying something or predicting a value. In these layers, every neuron is connected to every neuron in the layer before it. This comprehensive connectivity allows the network to learn complex, high-level patterns from the more basic features identified in the preceding layers. This structure allows CNNs to synthesize information from different levels to generate a comprehensive and accurate output. Due to their ability to perform automatic and robust feature extraction, CNNs have become indispensable for applications like face recognition, object detection, and medical imaging. Moreover, advancements like transfer learning and pretrained models have extended the scope of CNNs, enabling fine-tuning for domain-specific tasks with smaller datasets.
In summary, CNNs have revolutionized the fields of image processing, medical imaging, and even speech and language tasks through their powerful hierarchical feature extraction and generalization capabilities. Their adaptability and ongoing advancements ensure that CNNs continue to be a vital tool in the development of artificial intelligence systems (Aloysius and Geetha, 2017; Chagas et al., 2018; Lopez Pinaya et al., 2020; Sohn et al., 2021).
Random forest
This approach utilizes the collective power of multiple decision trees to achieve superior predictive accuracy, improved generalization, and enhanced robustness compared to a single decision tree. The algorithm follows two main steps: tree construction and prediction aggregation. In the tree construction phase, decision trees are built using bootstrapping, a technique that involves sampling the training data with replacement. Furthermore, when splitting nodes, a random set of characteristics is evaluated, adding another layer of randomness. This dual randomization strategy increases diversity among the trees in the ensemble, reducing the likelihood of overfitting and allowing each tree to contribute unique insights to the final model, thereby improving generalization.
When a random forest makes a prediction, each tree in the forest contributes its own individual forecast. For classification tasks, the final prediction is resolved by majority voting. The class that gets the most “votes” from all the trees is chosen as the ultimate prediction. For regression tasks, the predictions from all the trees are averaged. The mean of these individual tree outcomes becomes the final prediction. For classification problems, the algorithm typically employs the Gini impurity metric to evaluate splits, while for regression tasks, it uses MSE. By combining randomization, tree-based learning, and prediction aggregation, a random forest significantly reduces bias and variance, resulting in more accurate and reliable predictions.
In summary, the random forest algorithm stands out as a highly adaptable and dependable method, proving effective for tackling both regression and classification problems. It offers strong generalization, reduces overfitting, and can also provide valuable interpretative insights, making it a widely applicable machine-learning technique (Ao et al., 2019; Cha et al., 2021; Mohapatra et al., 2020; Rigatti, 2017; Sarica et al., 2017).
Proposed model architecture
To provide a clear understanding of our methodology, Table 2 illustrates the architecture of our proposed machine-learning ensemble model for predicting CSR. This framework is designed to leverage the strengths of multiple diverse algorithms, thereby enhancing predictive accuracy and robustness.
Proposed model architecture.
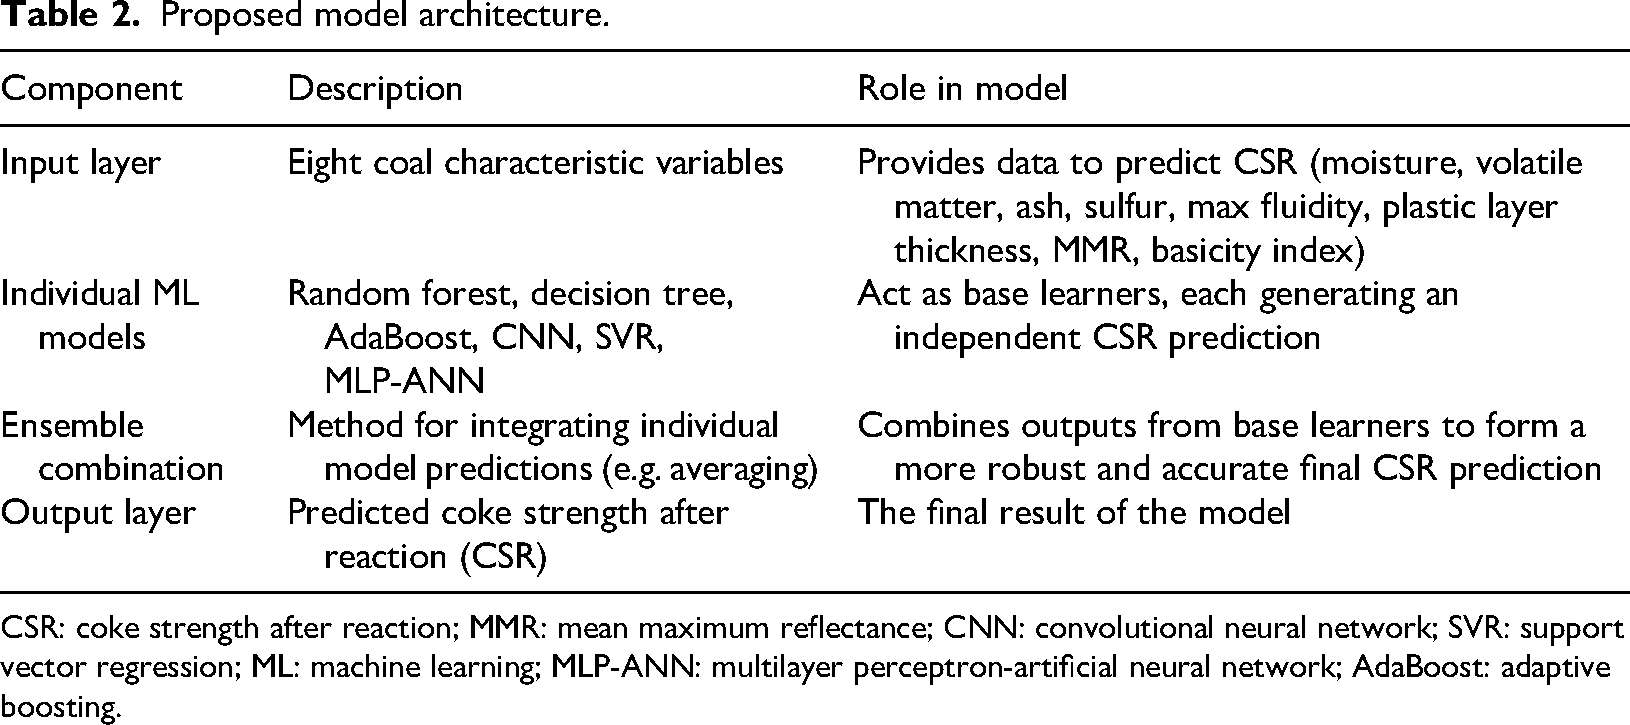
CSR: coke strength after reaction; MMR: mean maximum reflectance; CNN: convolutional neural network; SVR: support vector regression; ML: machine learning; MLP-ANN: multilayer perceptron-artificial neural network; AdaBoost: adaptive boosting.
As depicted in Table 2, the process begins with the input layer, which consists of eight critical coal characteristic variables: moisture content, volatile matter, ash percentage, sulfur content, maximum fluidity, plastic layer thickness, mean maximum reflectance (MMR), and the basicity index. These features are simultaneously fed into an array of individual machine-learning models, which serve as our base learners. Specifically, the ensemble incorporates predictions from random forest, decision tree, AdaBoost, CNN, SVR, and MLP-ANN models.
Data gathering and analysis
Statistical analysis of the dataset
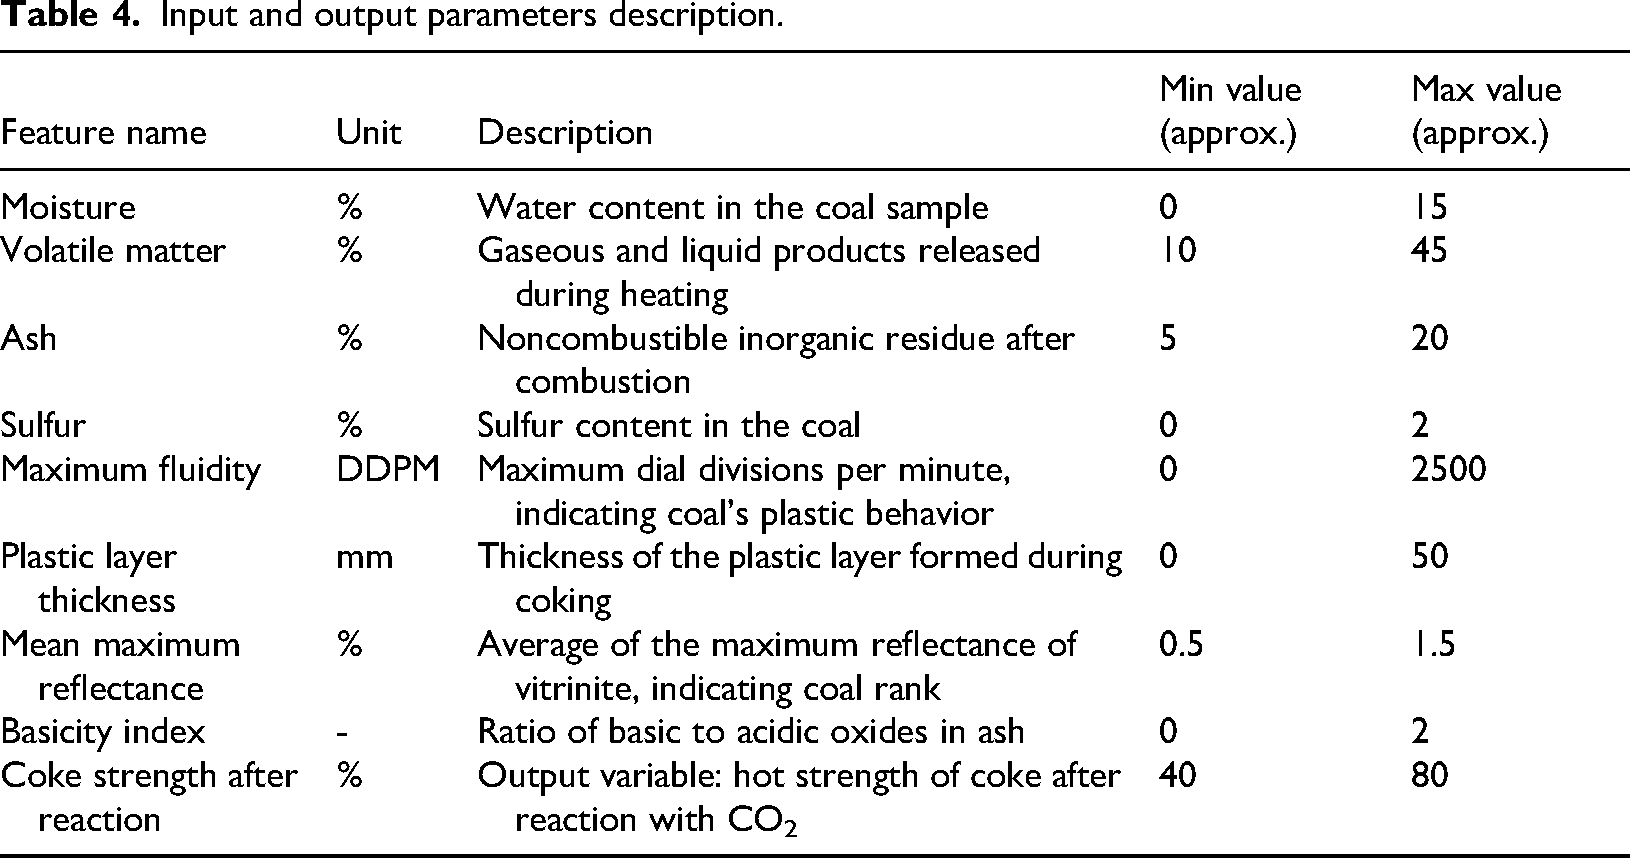
The data employed in this work includes measurements of CSR along with various predictor variables. The input variables consist of moisture (%), volatile matter (%), ash (%), sulfur (%), maximum fluidity (DDPM), plastic layer thickness, MMR (%), and the basicity index, with the output being CSR. The dataset, sourced from a coke plant, contains 630 samples from coals of diverse origins and characteristics. Standard methodologies, such as those outlined by the American Society for Testing and Materials (ASTM) (Astm et al., 1950), were employed to measure the predictor variables and evaluate the CSR values.
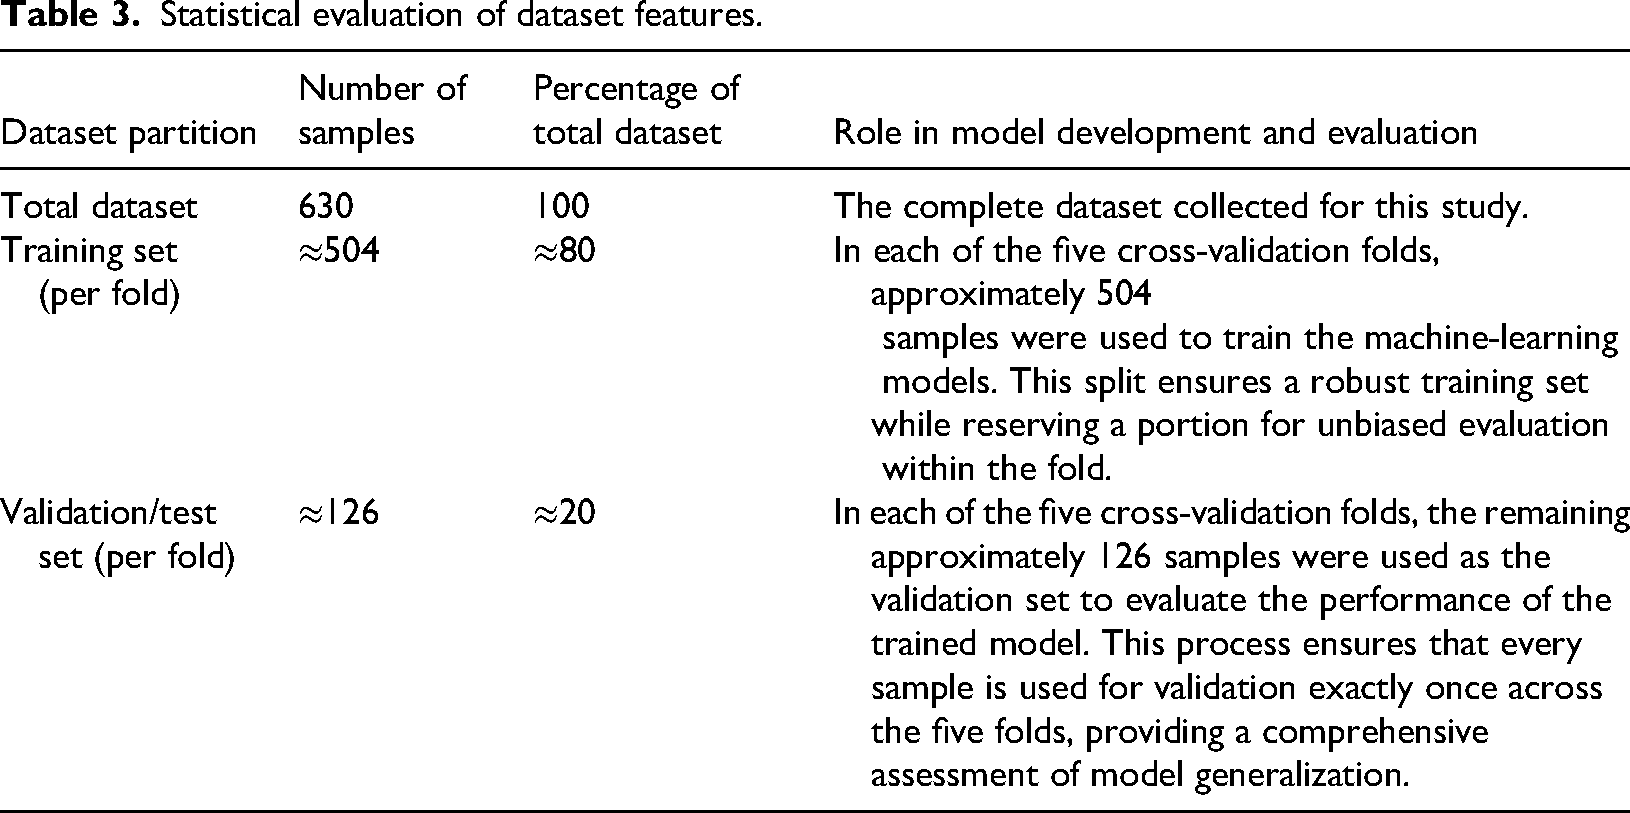
Figure 3 graphically presents the frequency plots and cumulative distributions of all parameters. The data is visually analyzed to provide insights into its distribution and range, as depicted in Figure 4. Figure 5 illustrates the Pearson correlation coefficients for each pair of variables, traditionally represented as a heatmap. This analysis indicates that moisture content, ash content, plastic layer thickness, and MMR content positively influence the output variable, CSR, with MMR content emerging as the most impactful parameter. Conversely, the remaining parameters exhibit a negative effect on CSR magnitude. Tables 3 and 4 describe dataset features in more details.
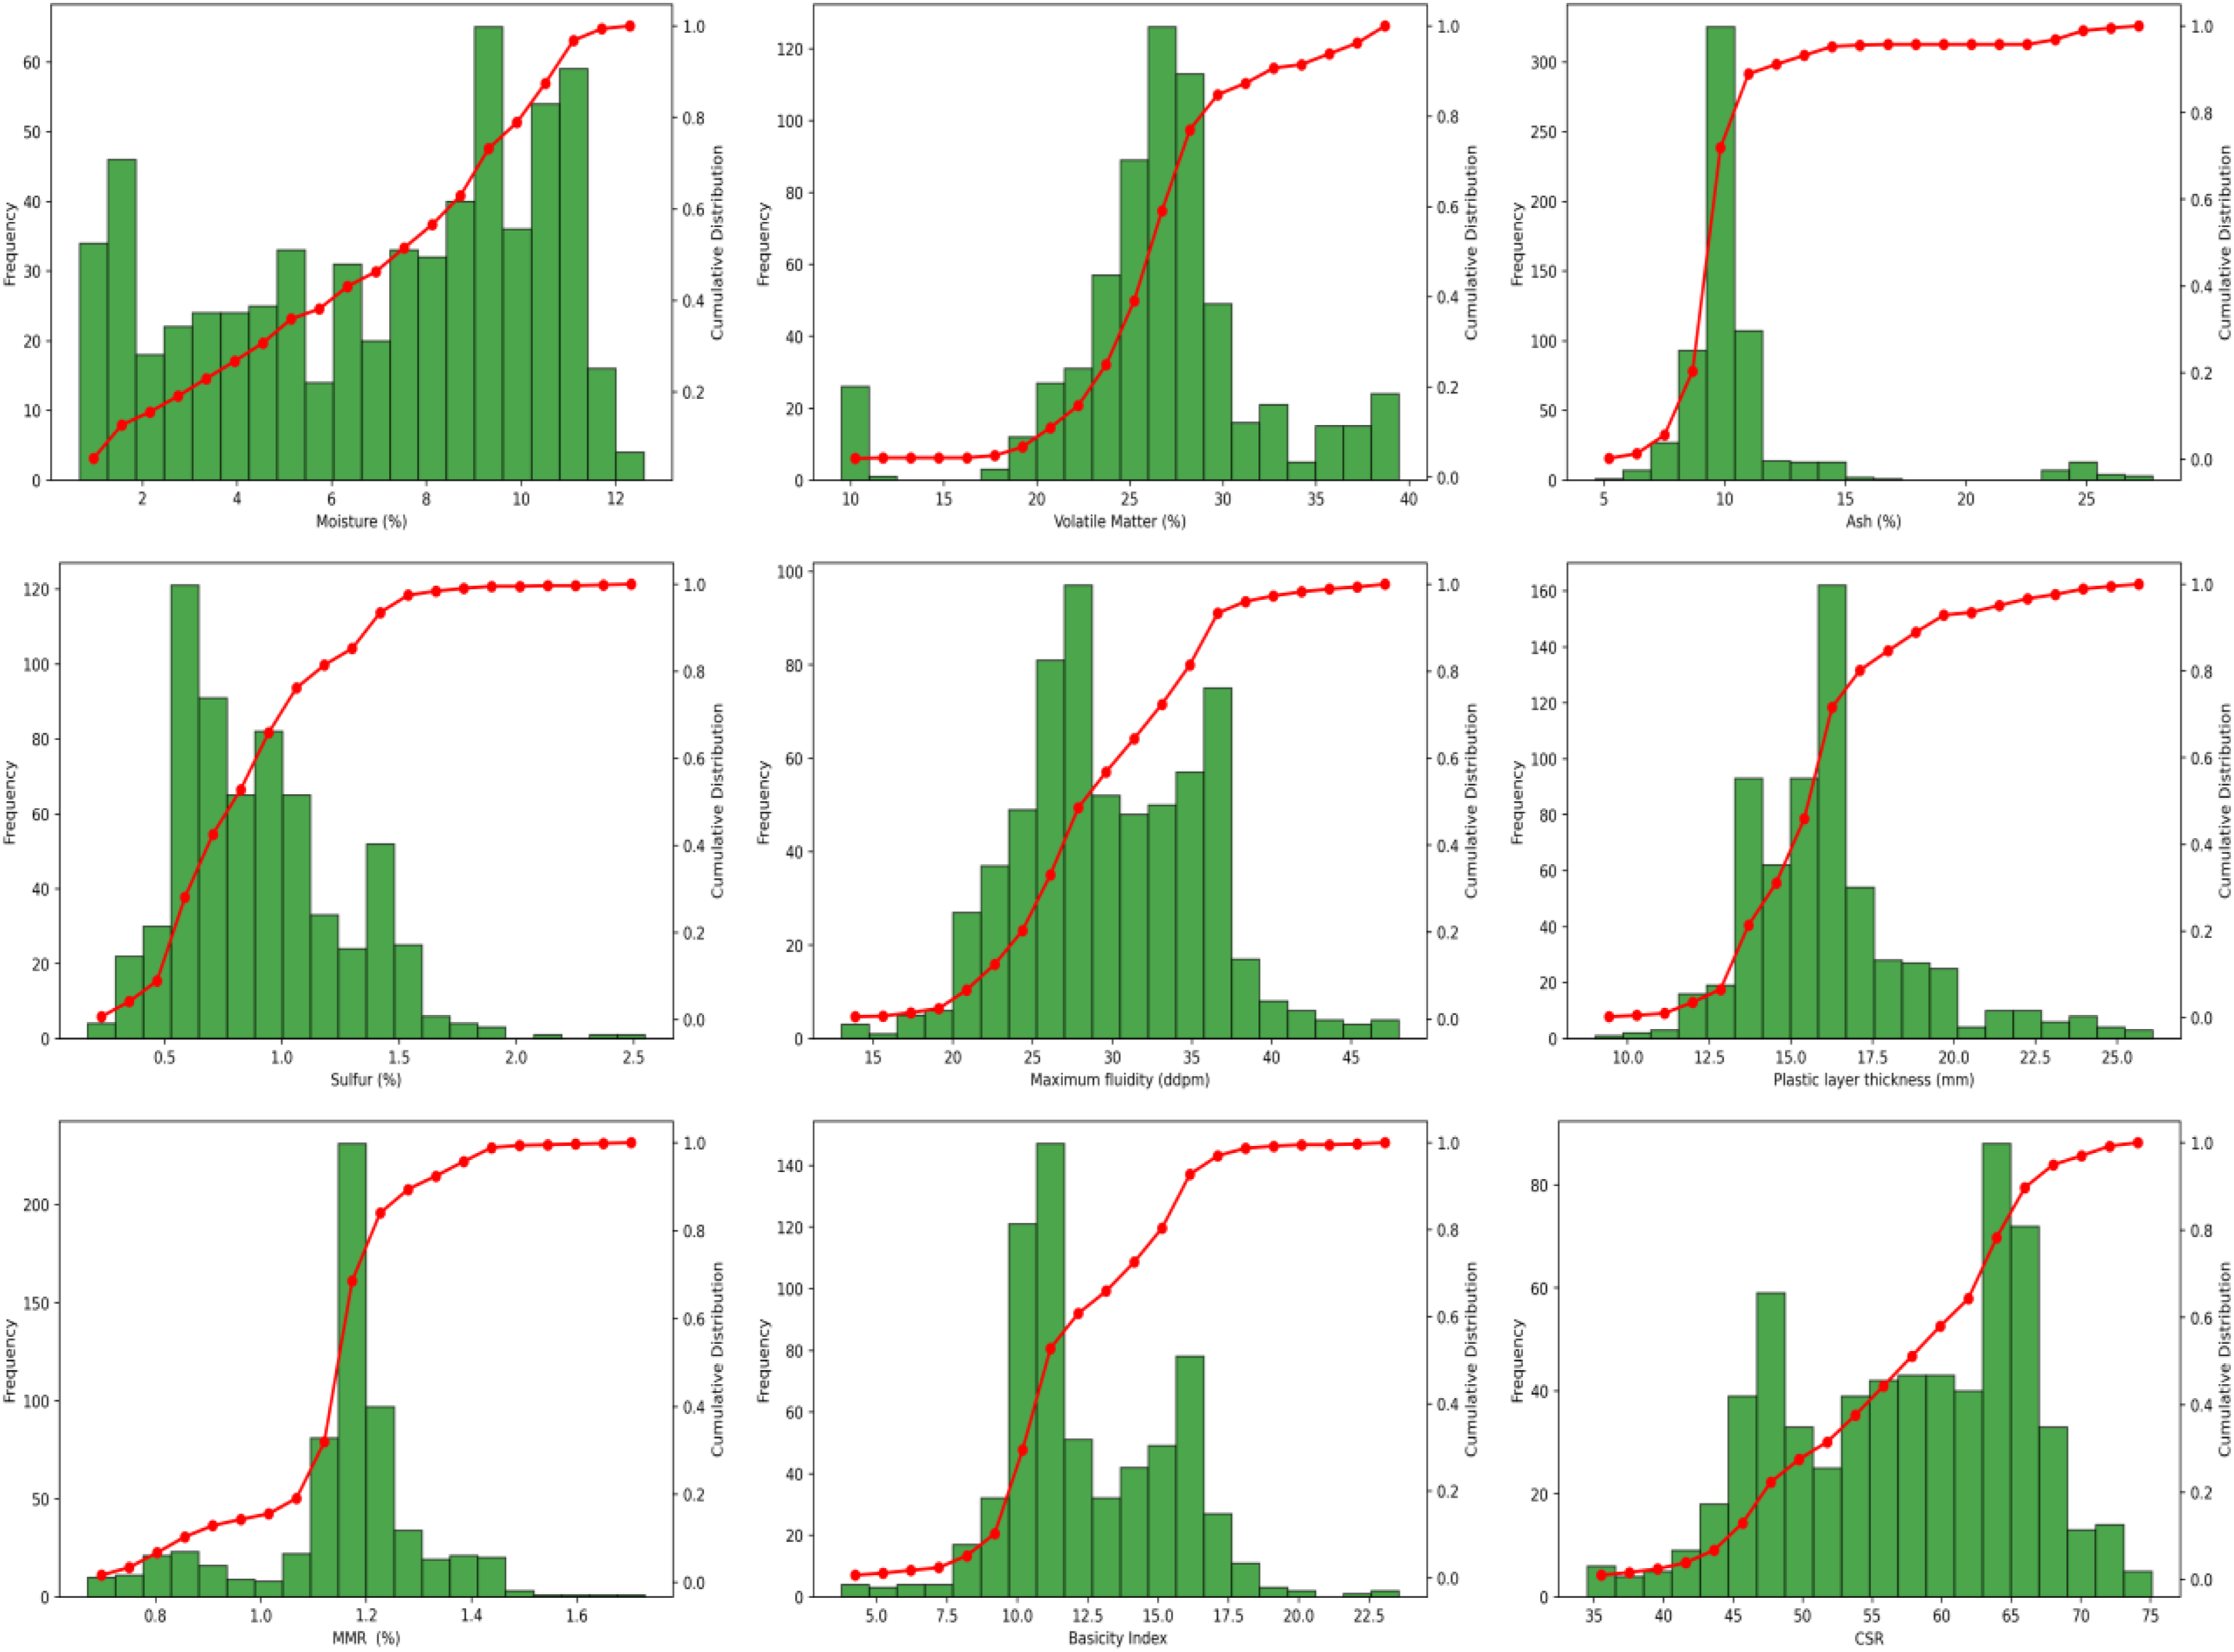
Frequency and cumulative distribution of all the parameters.
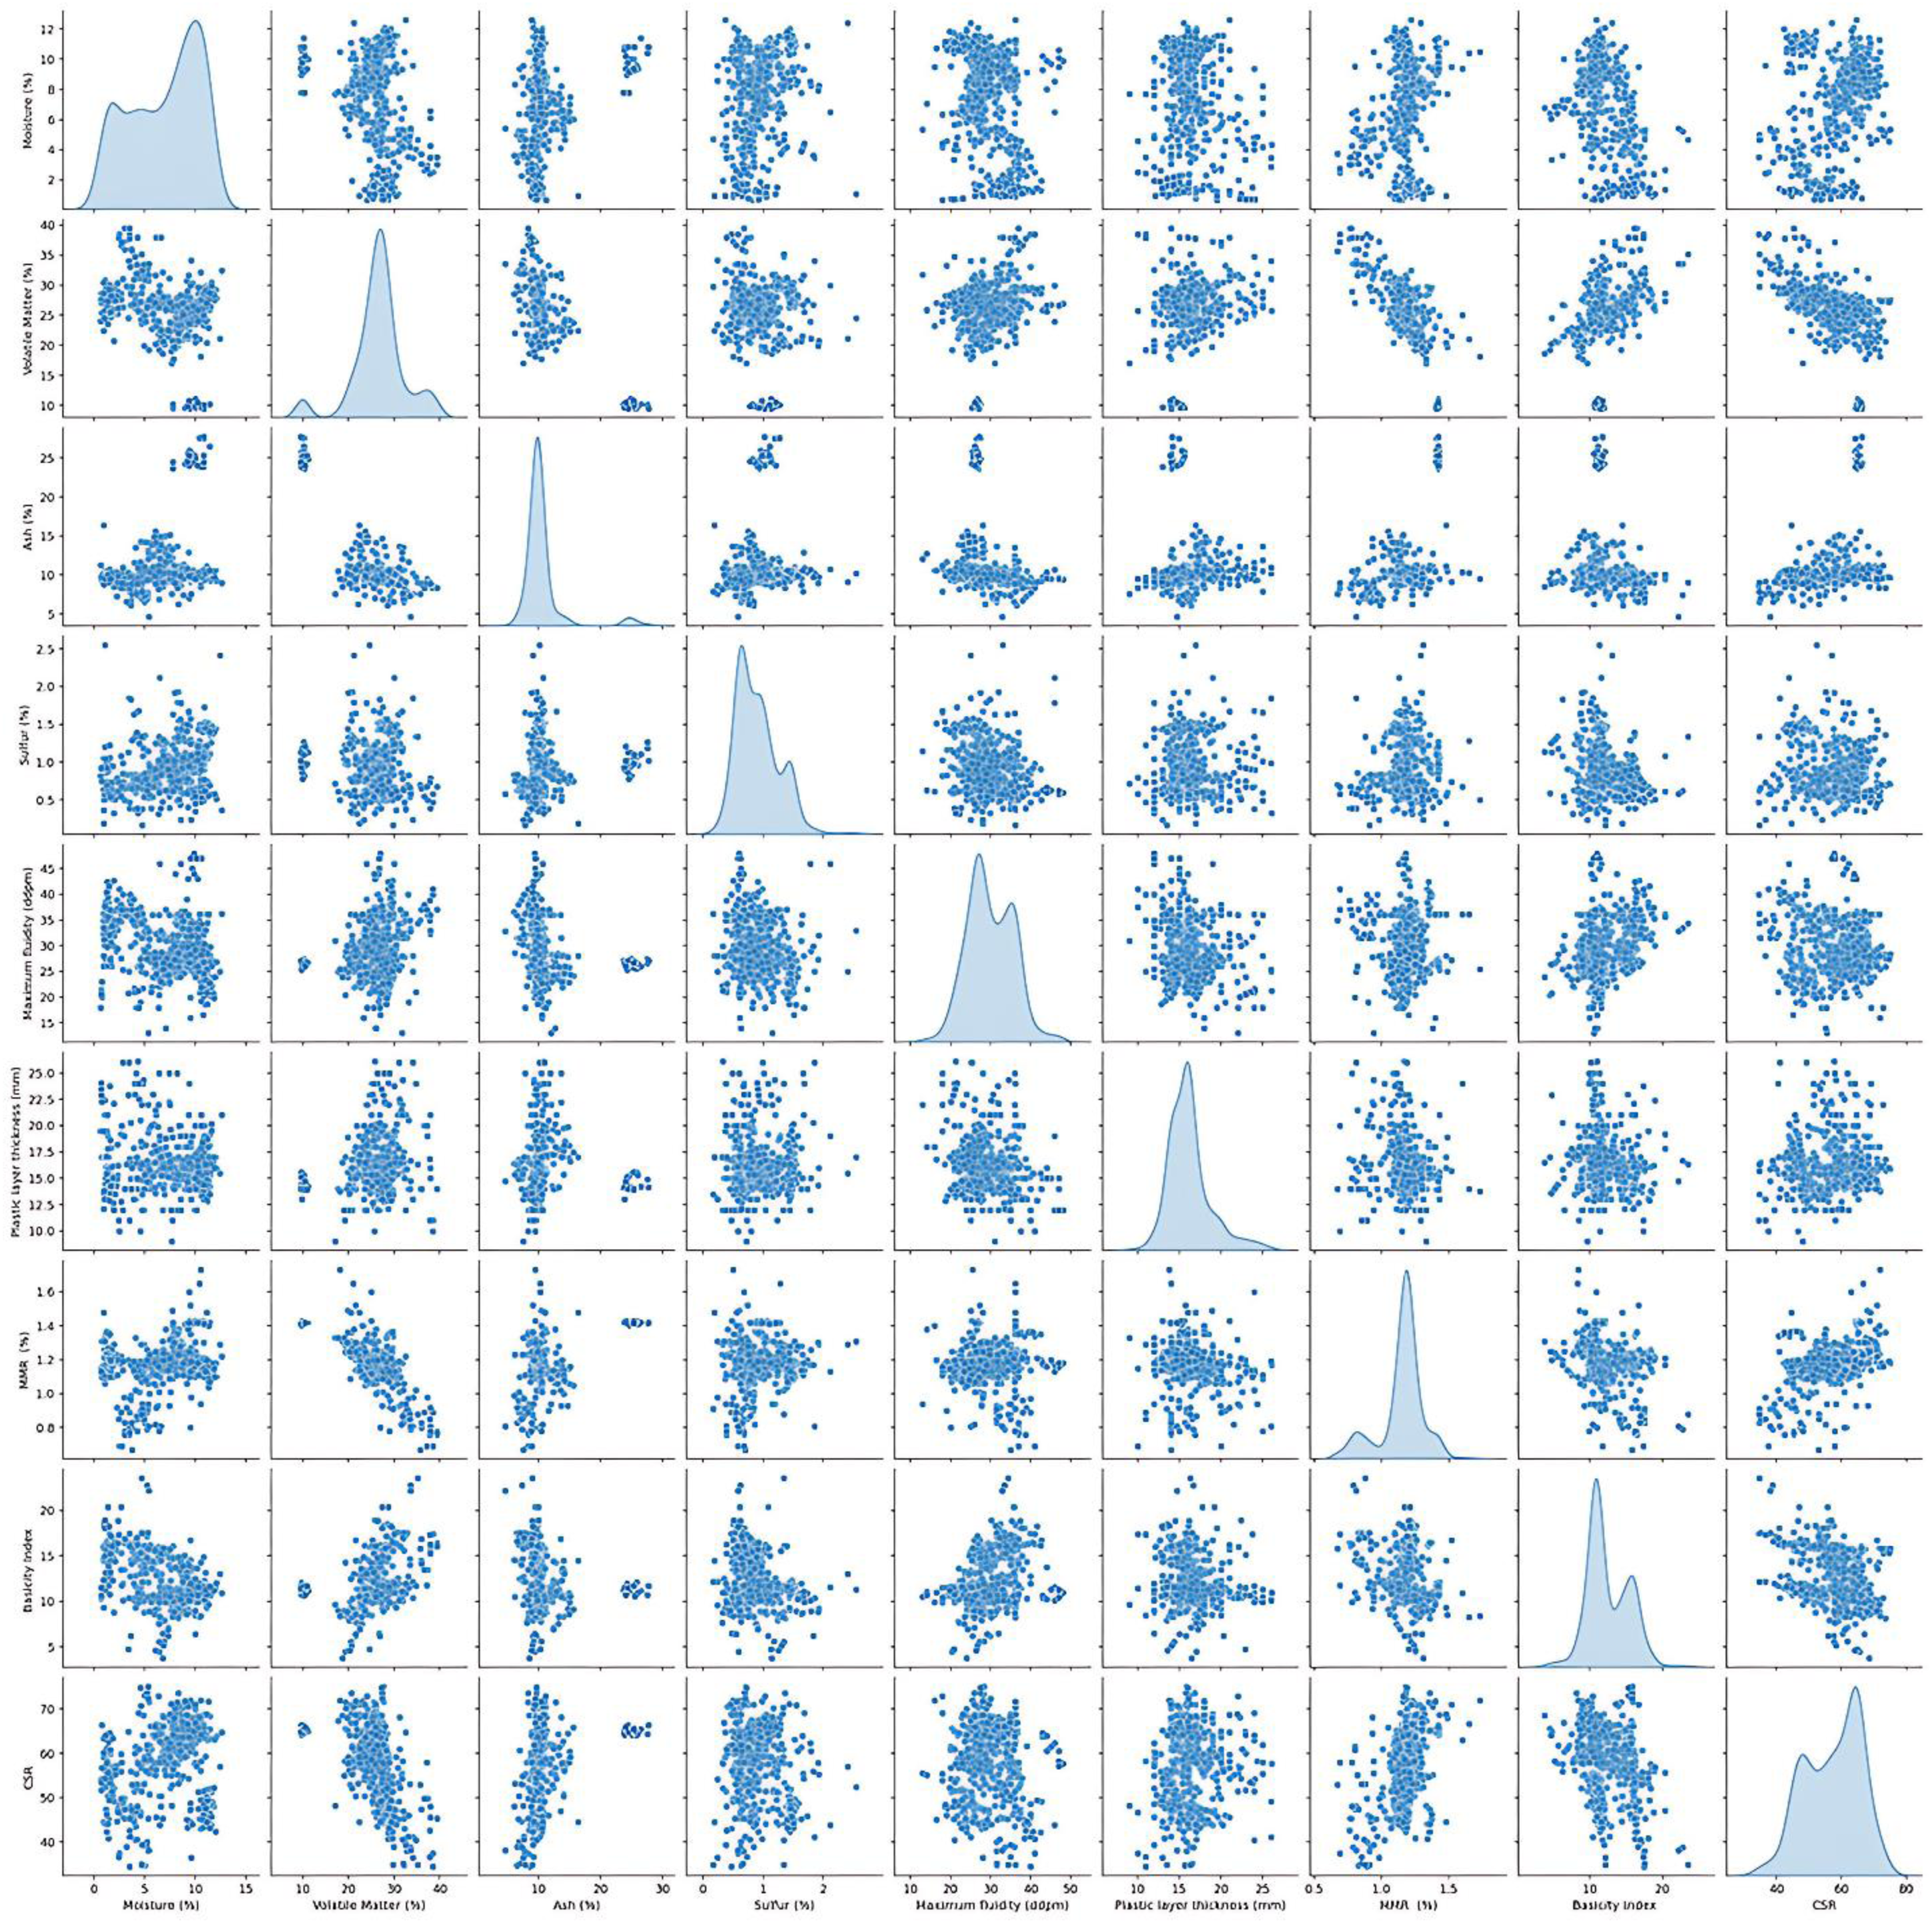
Scatter plot of input and output variables.
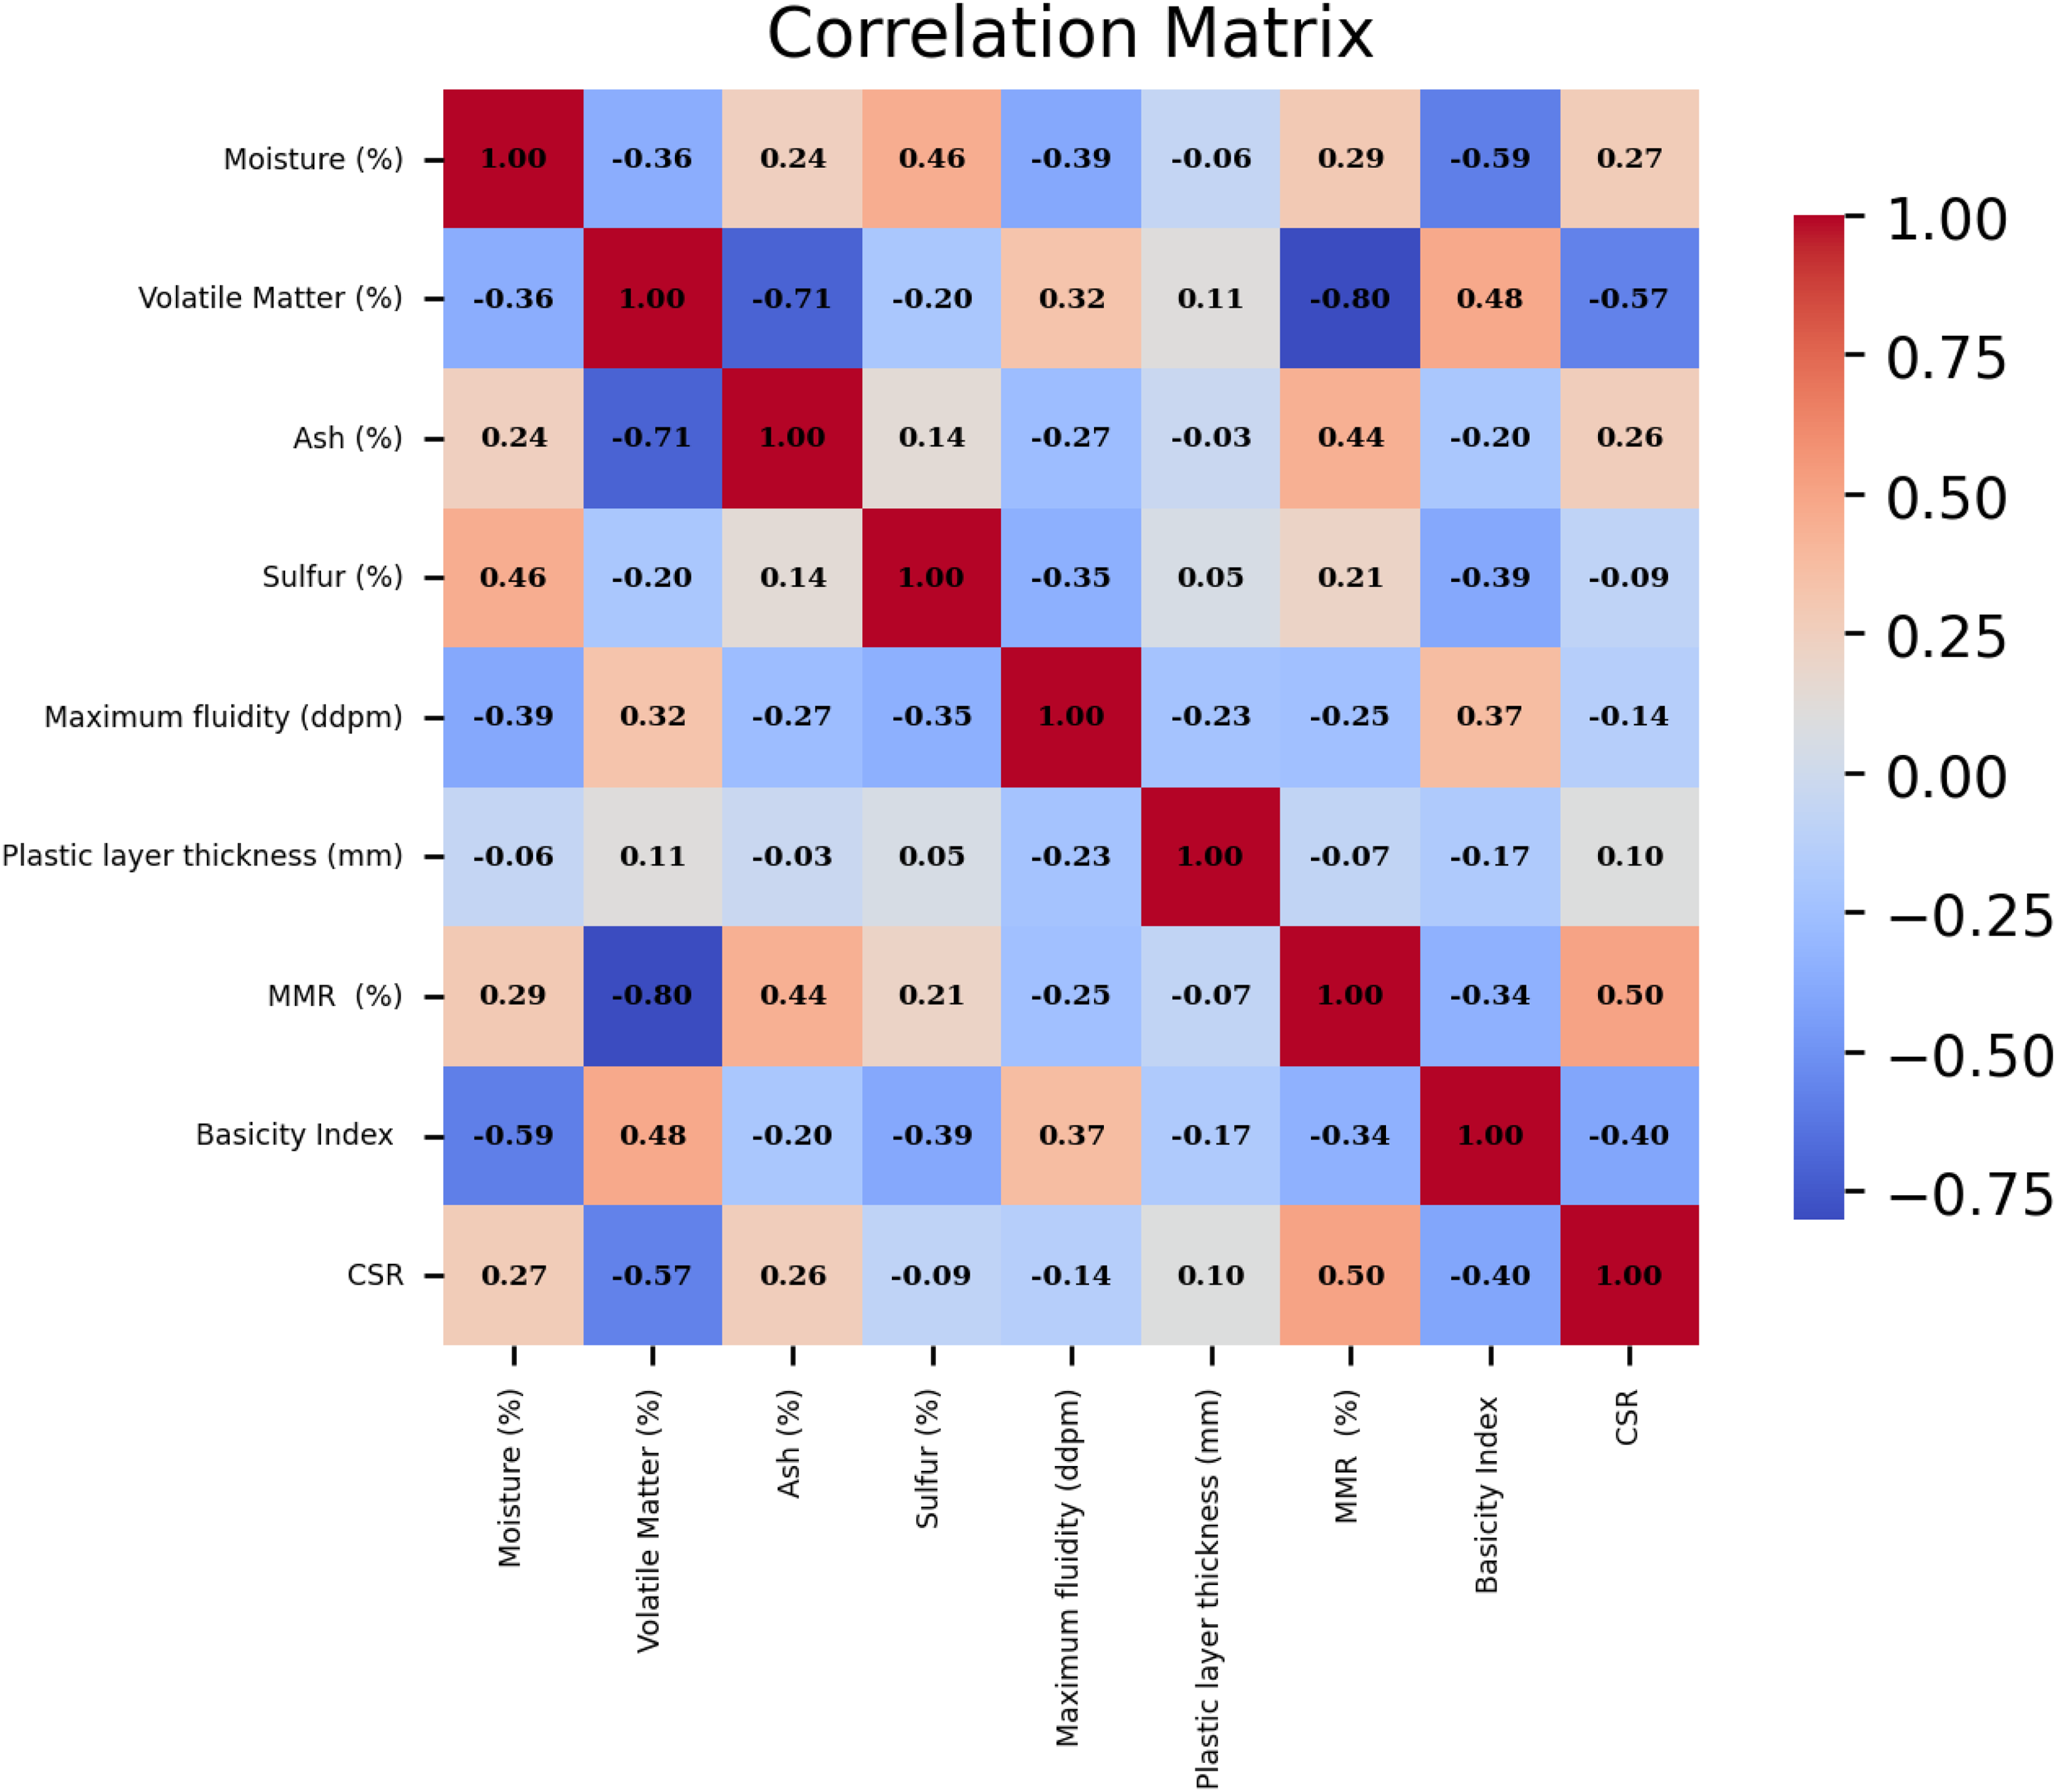
Heatmap matrix for determining 2 v 2 relation between parameters.
Statistical evaluation of dataset features.
Input and output parameters description.
Suspected data identification
An initial visual inspection of the data, including frequency plots and cumulative distributions (Figure 3), and univariate checks via boxplots, revealed no gross or obvious univariate anomalies, suggesting the absence of simplistic recording errors. However, recognizing that boxplots primarily identify outliers based on interquartile range in a single dimension, and that more subtle or multivariate anomalies might exist, we proceeded with a more sophisticated approach: the MCOD technique to identify potential deviations within the multidimensional feature space.
In this research, we opted for MCOD technique due to its demonstrated efficacy and efficiency, especially with extensive datasets. MCOD leverages a combination of random sampling and density estimation to pinpoint outliers, offering a resilient method for detecting data points that diverge significantly from their local neighborhood in terms of data density. This involves evaluating data distribution patterns, enabling the detection of anomalies that might otherwise be missed.
The MCOD approach operates by selecting a representative subset of the entire data by Monte Carlo sampling, significantly reducing the computational burden typically associated with outlier detection. This random sampling enables scalability and makes it advantageous for use with high-dimensional datasets, limiting the necessity for complete dataset evaluation. The approach is computationally efficient as well, making it appropriate for extensive datasets and real-time applications where resources are constrained. However, there's a trade-off to consider: the trustworthiness of the results depends on factors like the sample numbers and the nearest neighbors’ configuration (k). More samples usually lead to better accuracy, but this comes with longer computation times. Meanwhile, the choice of k affects how sensitive the outlier detection is (Liu et al., 2008; Marx, 2015; Rofatto et al., 2020; Zhang et al., 2016).
While MCOD is a robust method and doesn't assume a specific data distribution, its effectiveness can be influenced by highly skewed features. In such cases, valid extreme values might appear as low-density points and be inadvertently flagged as outliers. Removing these genuinely extreme, yet valid, data points risks introducing sampling bias, which could limit the model's capability to generalize across the full spectrum of real-world conditions. To mitigate this, we rigorously reviewed all identified outliers with domain expertise, distinguishing true errors from legitimate extreme observations. Additionally, our chosen ensemble machine-learning models, like random forests, are inherently less sensitive to outliers, further buffering against any negative impact from remaining or inadvertently removed extreme values.
Still, MCOD is a useful tool for finding outliers and exploring data, especially when you only need approximate results or have limited computing power. Its capacity to balance efficiency with effectiveness becomes essential in the context of complex, high-dimensional datasets, where conventional outlier detection techniques may be excessively slow or computationally infeasible. By providing a scalable yet reliable solution, MCOD streamlines the procedure of identifying and handling outliers, consequently enhancing the overall quality of the dataset and improving the strength of ensuing machine-learning models.
Figure 6 presents a boxplot illustrating the data distribution of this research, shedding light on data range and quality, which are fundamental for model development. The boxplot captures data spread effectively, focusing on central tendency, interquartile range, and possible outliers. Most data points fall within the predictable range, suggesting the dataset is well-suited for machine-learning model training. This distribution confirms there are no major anomalies or outliers that could negatively affect model performance. The utilization of the complete data range enhances the models’ ability to identify underlying patterns and variations throughout the entire dataset. This is particularly crucial when dealing with intricate data structures, allowing the models to cultivate a more refined comprehension of the factors influencing the target variable. As a result, the model's predictive accuracy is likely to improve when trained on a comprehensive and representative set of data points. The approach adopted in this study, therefore, amplifies both the dependability and the performance of the machine-learning methods, ultimately leading to more meaningful and precise predictions (Jia et al., 2018; Rocco and Moreno, 2002).
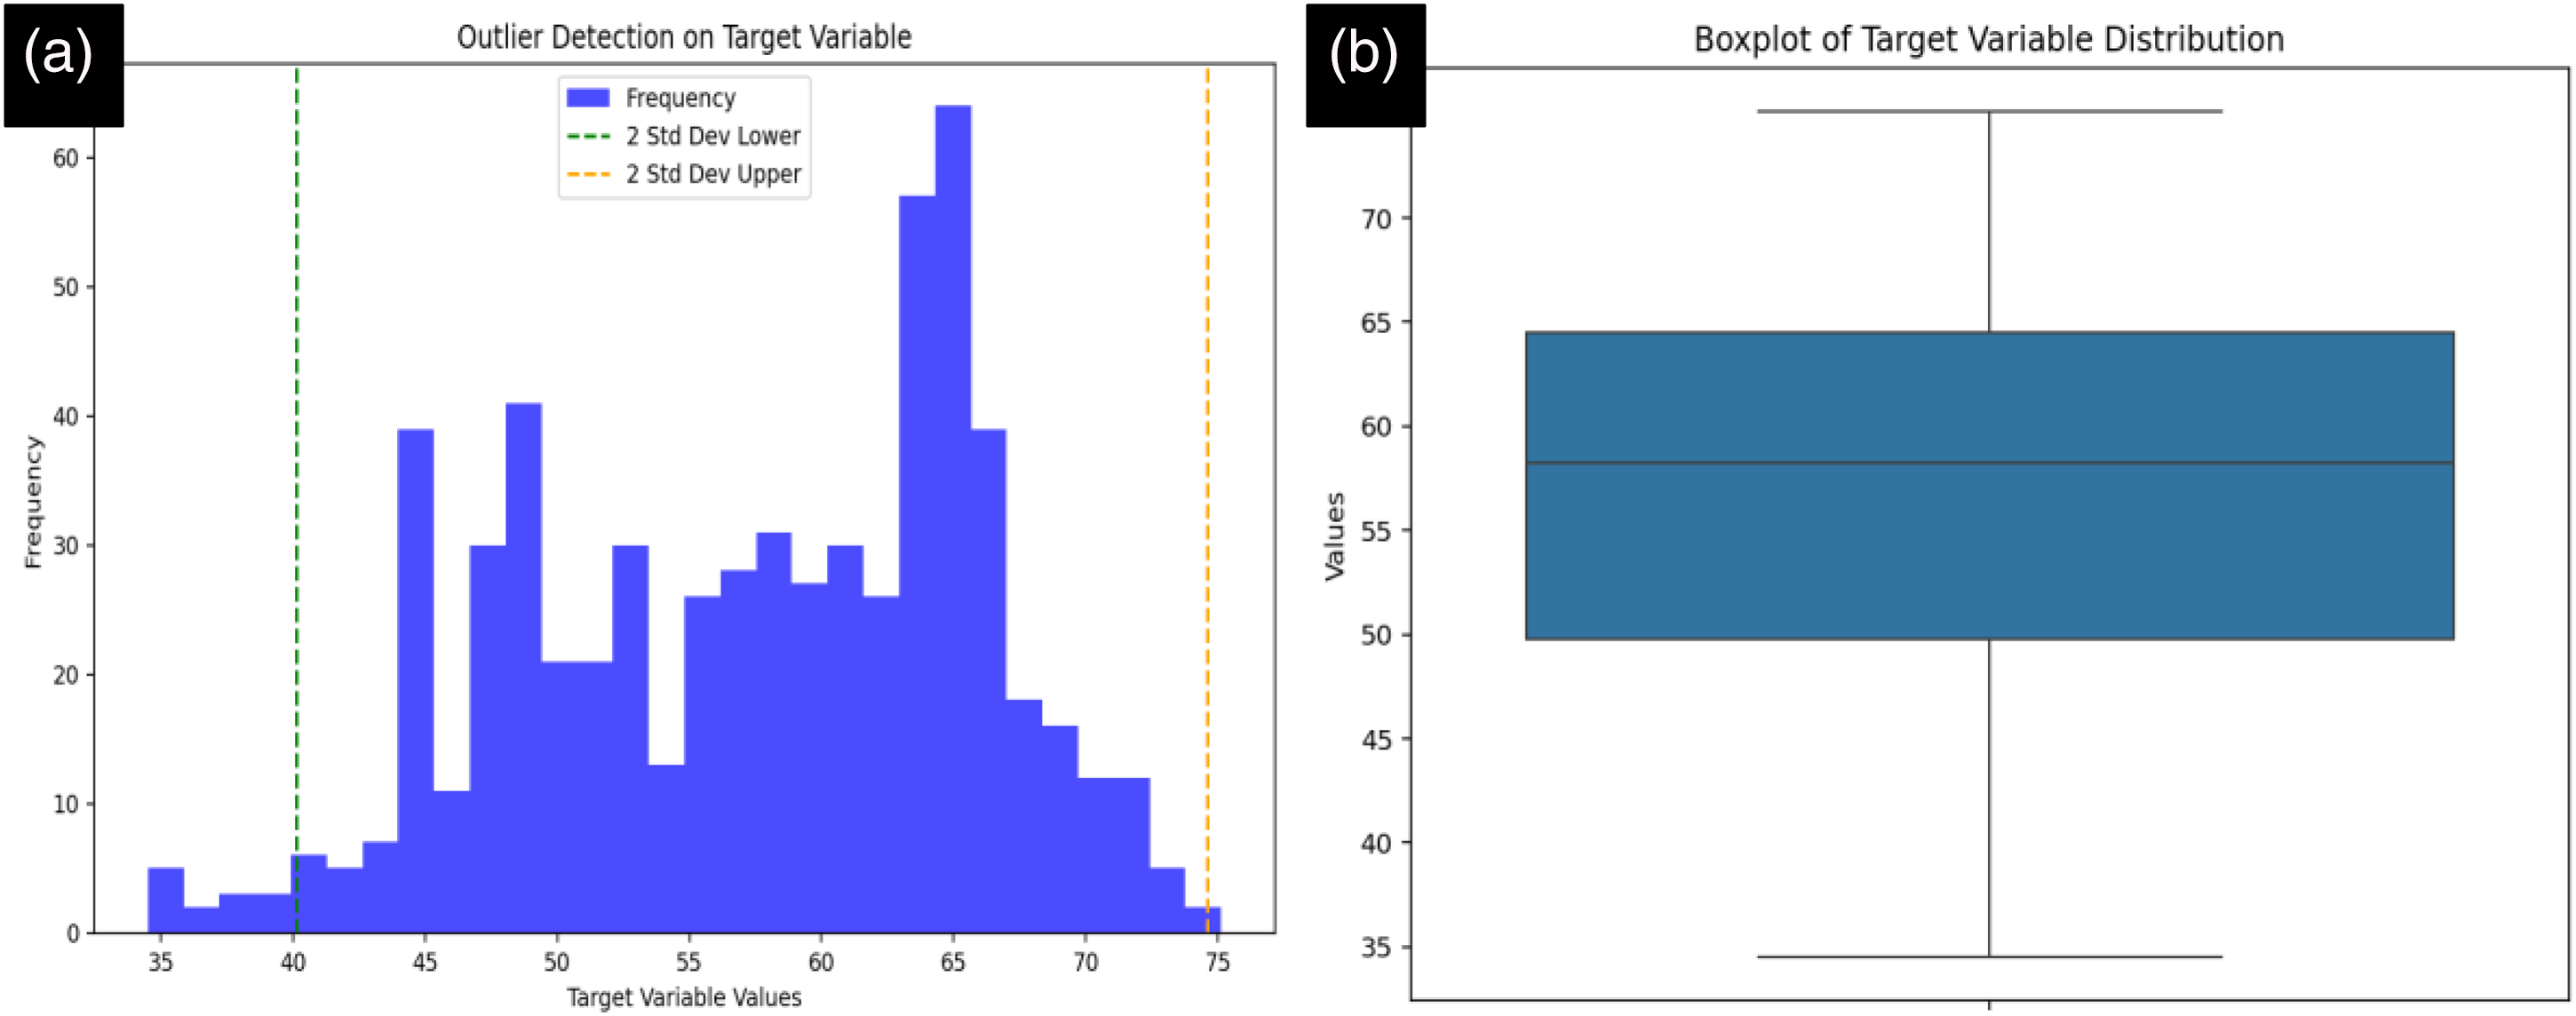
(a) Outlier data detected by Monte Carlo algorithm and (b) boxplot of data.
Modeling methodology
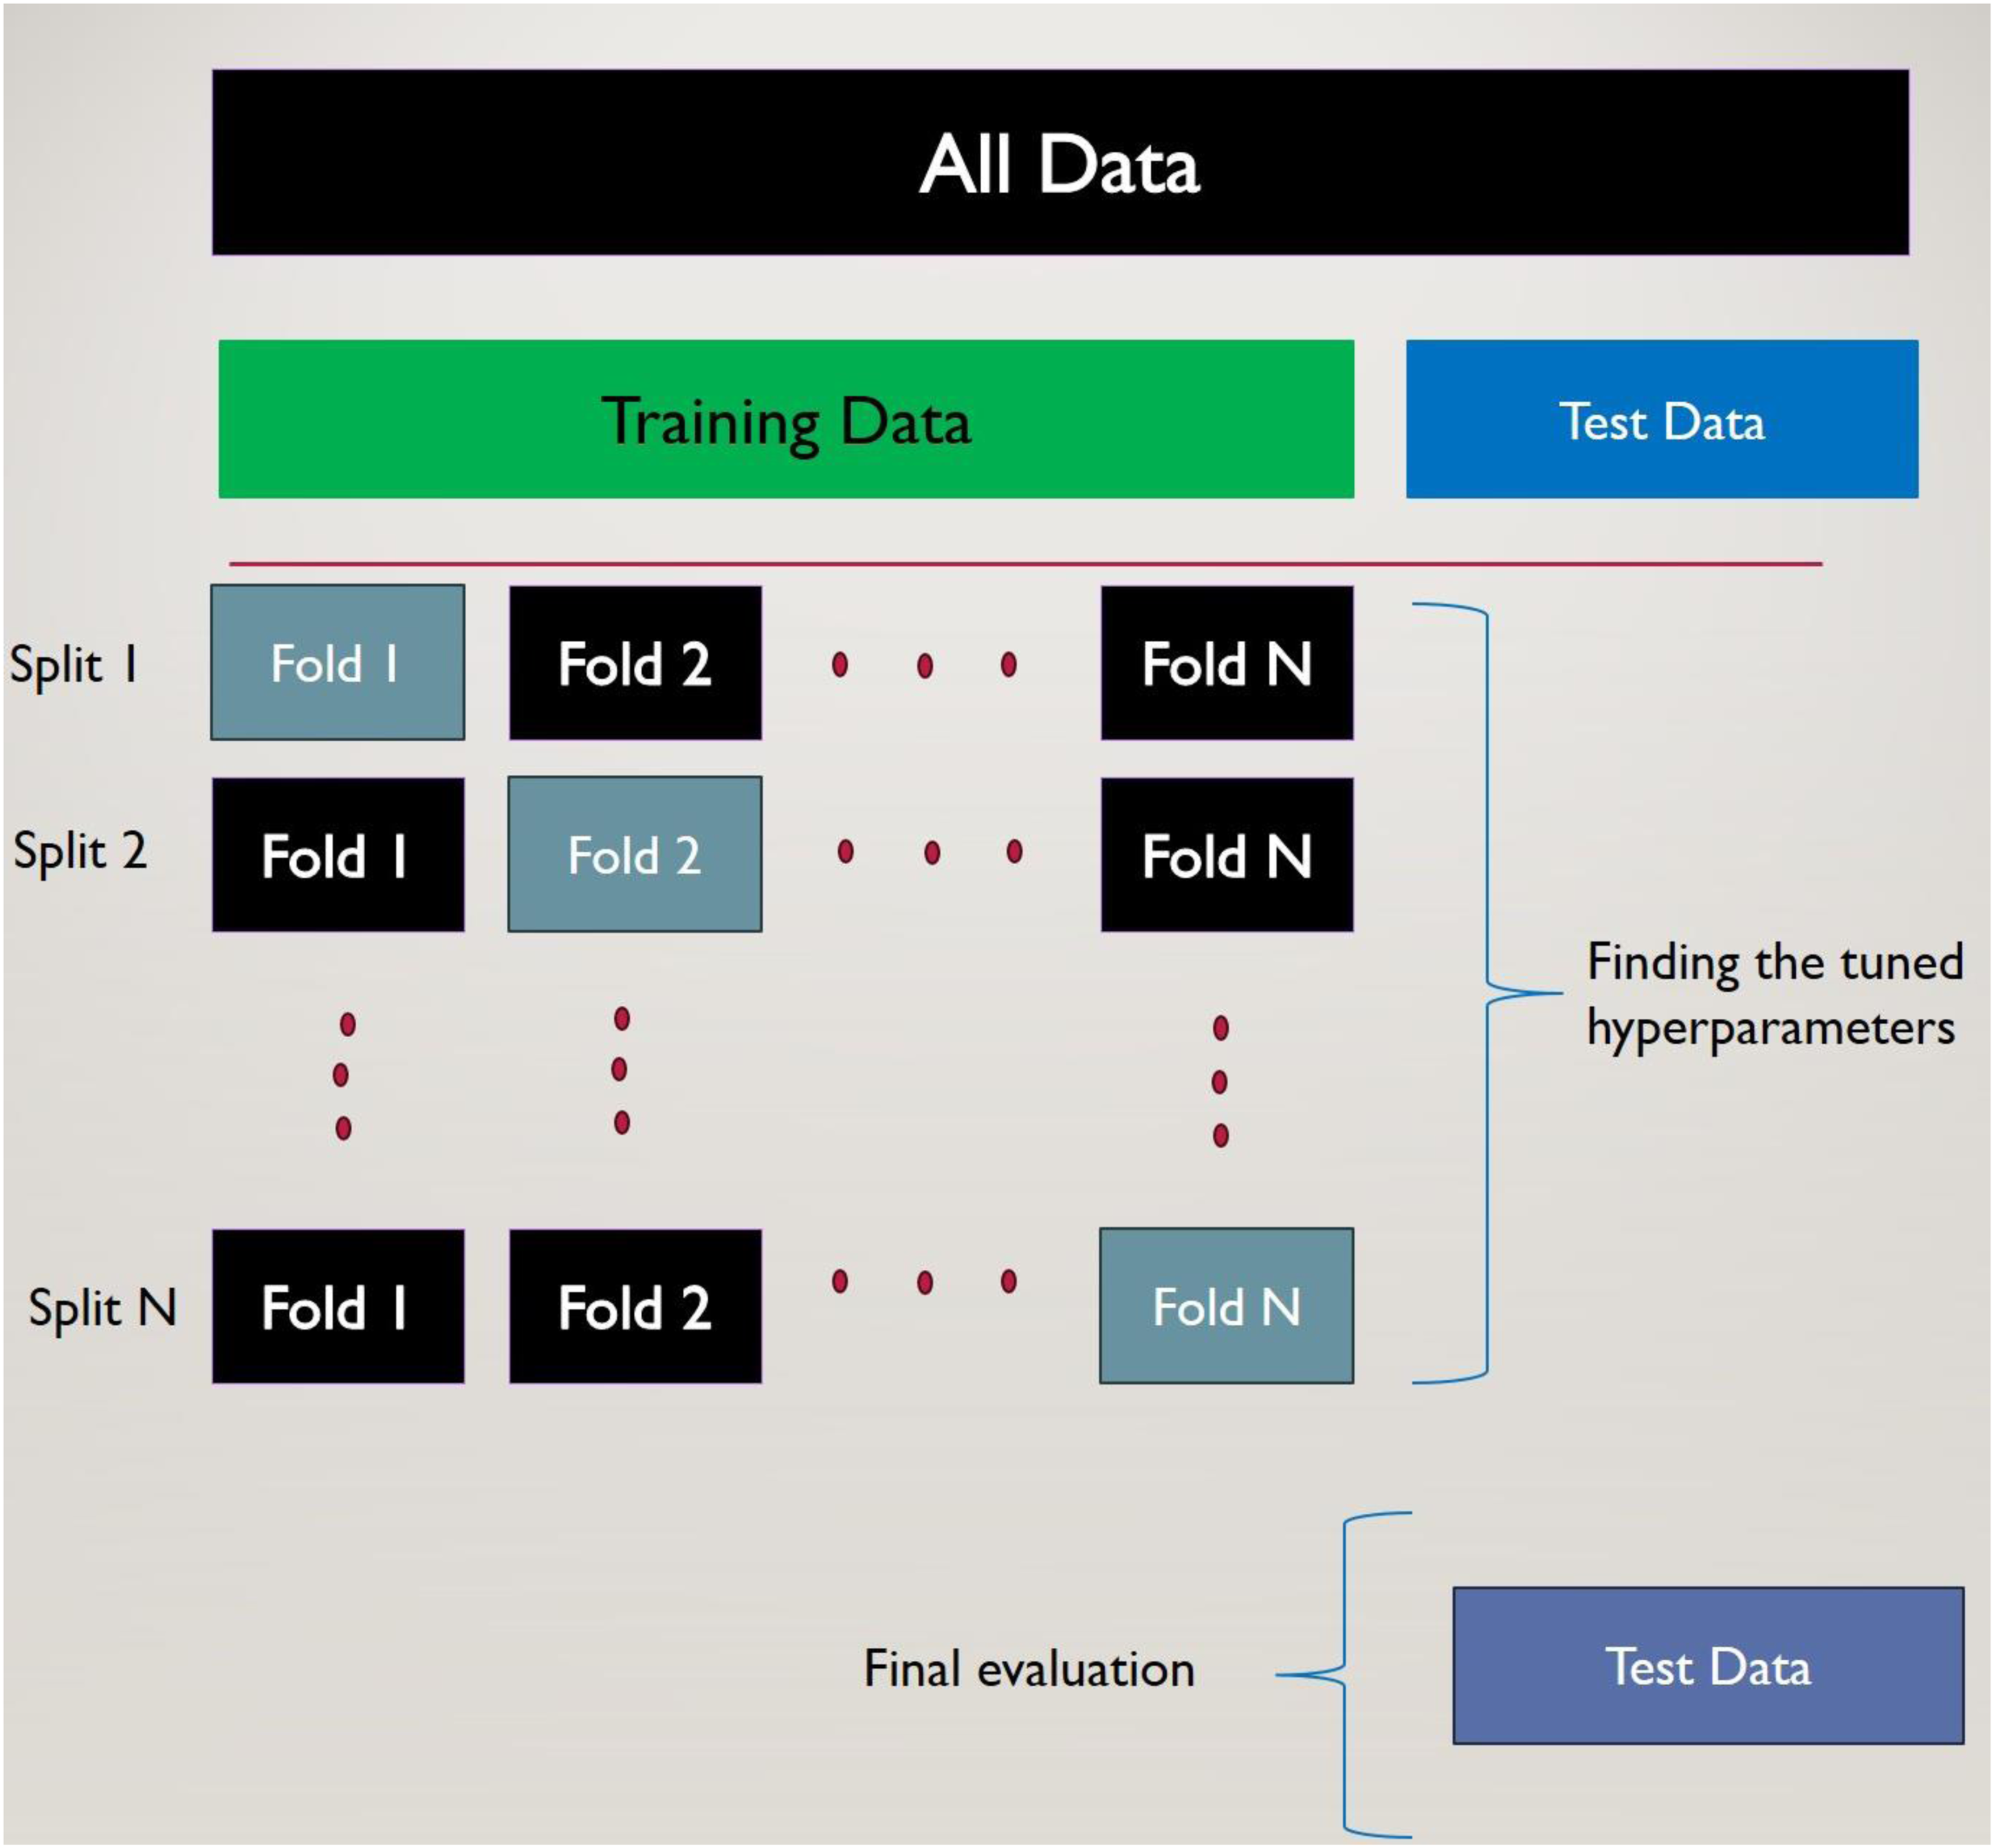
K-fold cross-validation is a robust resampling manner designed to evaluate the performance of models, particularly when working with limited data samples. Its primary objective is to accurately quantify a model's capacity for generalization to independent, unseen datasets.
The methodology is as follows: the complete data is partitioned into K subsets of equal size, referred to as “folds.” Iteratively, across K cycles, one fold is designated as the validation set for model evaluation, while the remaining K − 1 folds constitute the training data. This sequential execution ensures that each of the K folds serves as the validation set precisely once. The performance metrics derived from each cycle are subsequently averaged to yield a unified and more representative assessment of the model's prophetic. This process is shown in Figure 7.
Diagrammatic illustration of the K-fold cross-validation method employed during the training procedure.
Specifically, in five-fold cross-validation, the dataset undergoes division into five equivalent sections. The model is trained on four of these sections and subsequently evaluated against the fifth, held-out section. This iterative process is executed five times, with a different fold acting as the validation set in each iteration. This systematic rotation guarantees that every data point within the dataset is used for validation exactly once. The aggregation (averaging) of performance metrics across these five iterations provides a more statistically reliable estimate of the model's actual performance compared to a singular train/test split. This approach is exceptionally advantageous for constrained datasets, as it maximizes the utility of available data for both model training and validation, thereby mitigating the risk of overfitting and furnishing a more dependable evaluation of the model's ability to generalize effectively (Jung, 2018; Rodriguez et al., 2009; Wong and Yeh, 2019).
In this research, five-fold cross-validation is used during the train and optimization step of the random forest algorithm. To obtain the precision of each created hybrid model, RE%, AARE%, MSE, and R2 are calculated as outlined below (Abbasi et al., 2023; Bassir and Madani, 2019a, 2019b; Bemani et al., 2023; Madani et al., 2021; Madani and Alipour, 2022):
In the above equations, “i” refers to an individual data point. The terms “pred” and “exp” represent the predicted values from the model and the actual observed values, respectively. “N” signifies the total number of data points. The input features used for developing the models include ash content, moisture content, sulfur content, volatile matter content, MMR, maximum fluidity, plastic layer thickness, and basicity index, with CSR serving as the output variable.
Results and discussion
Hyperparameter determination and optimization efficiency
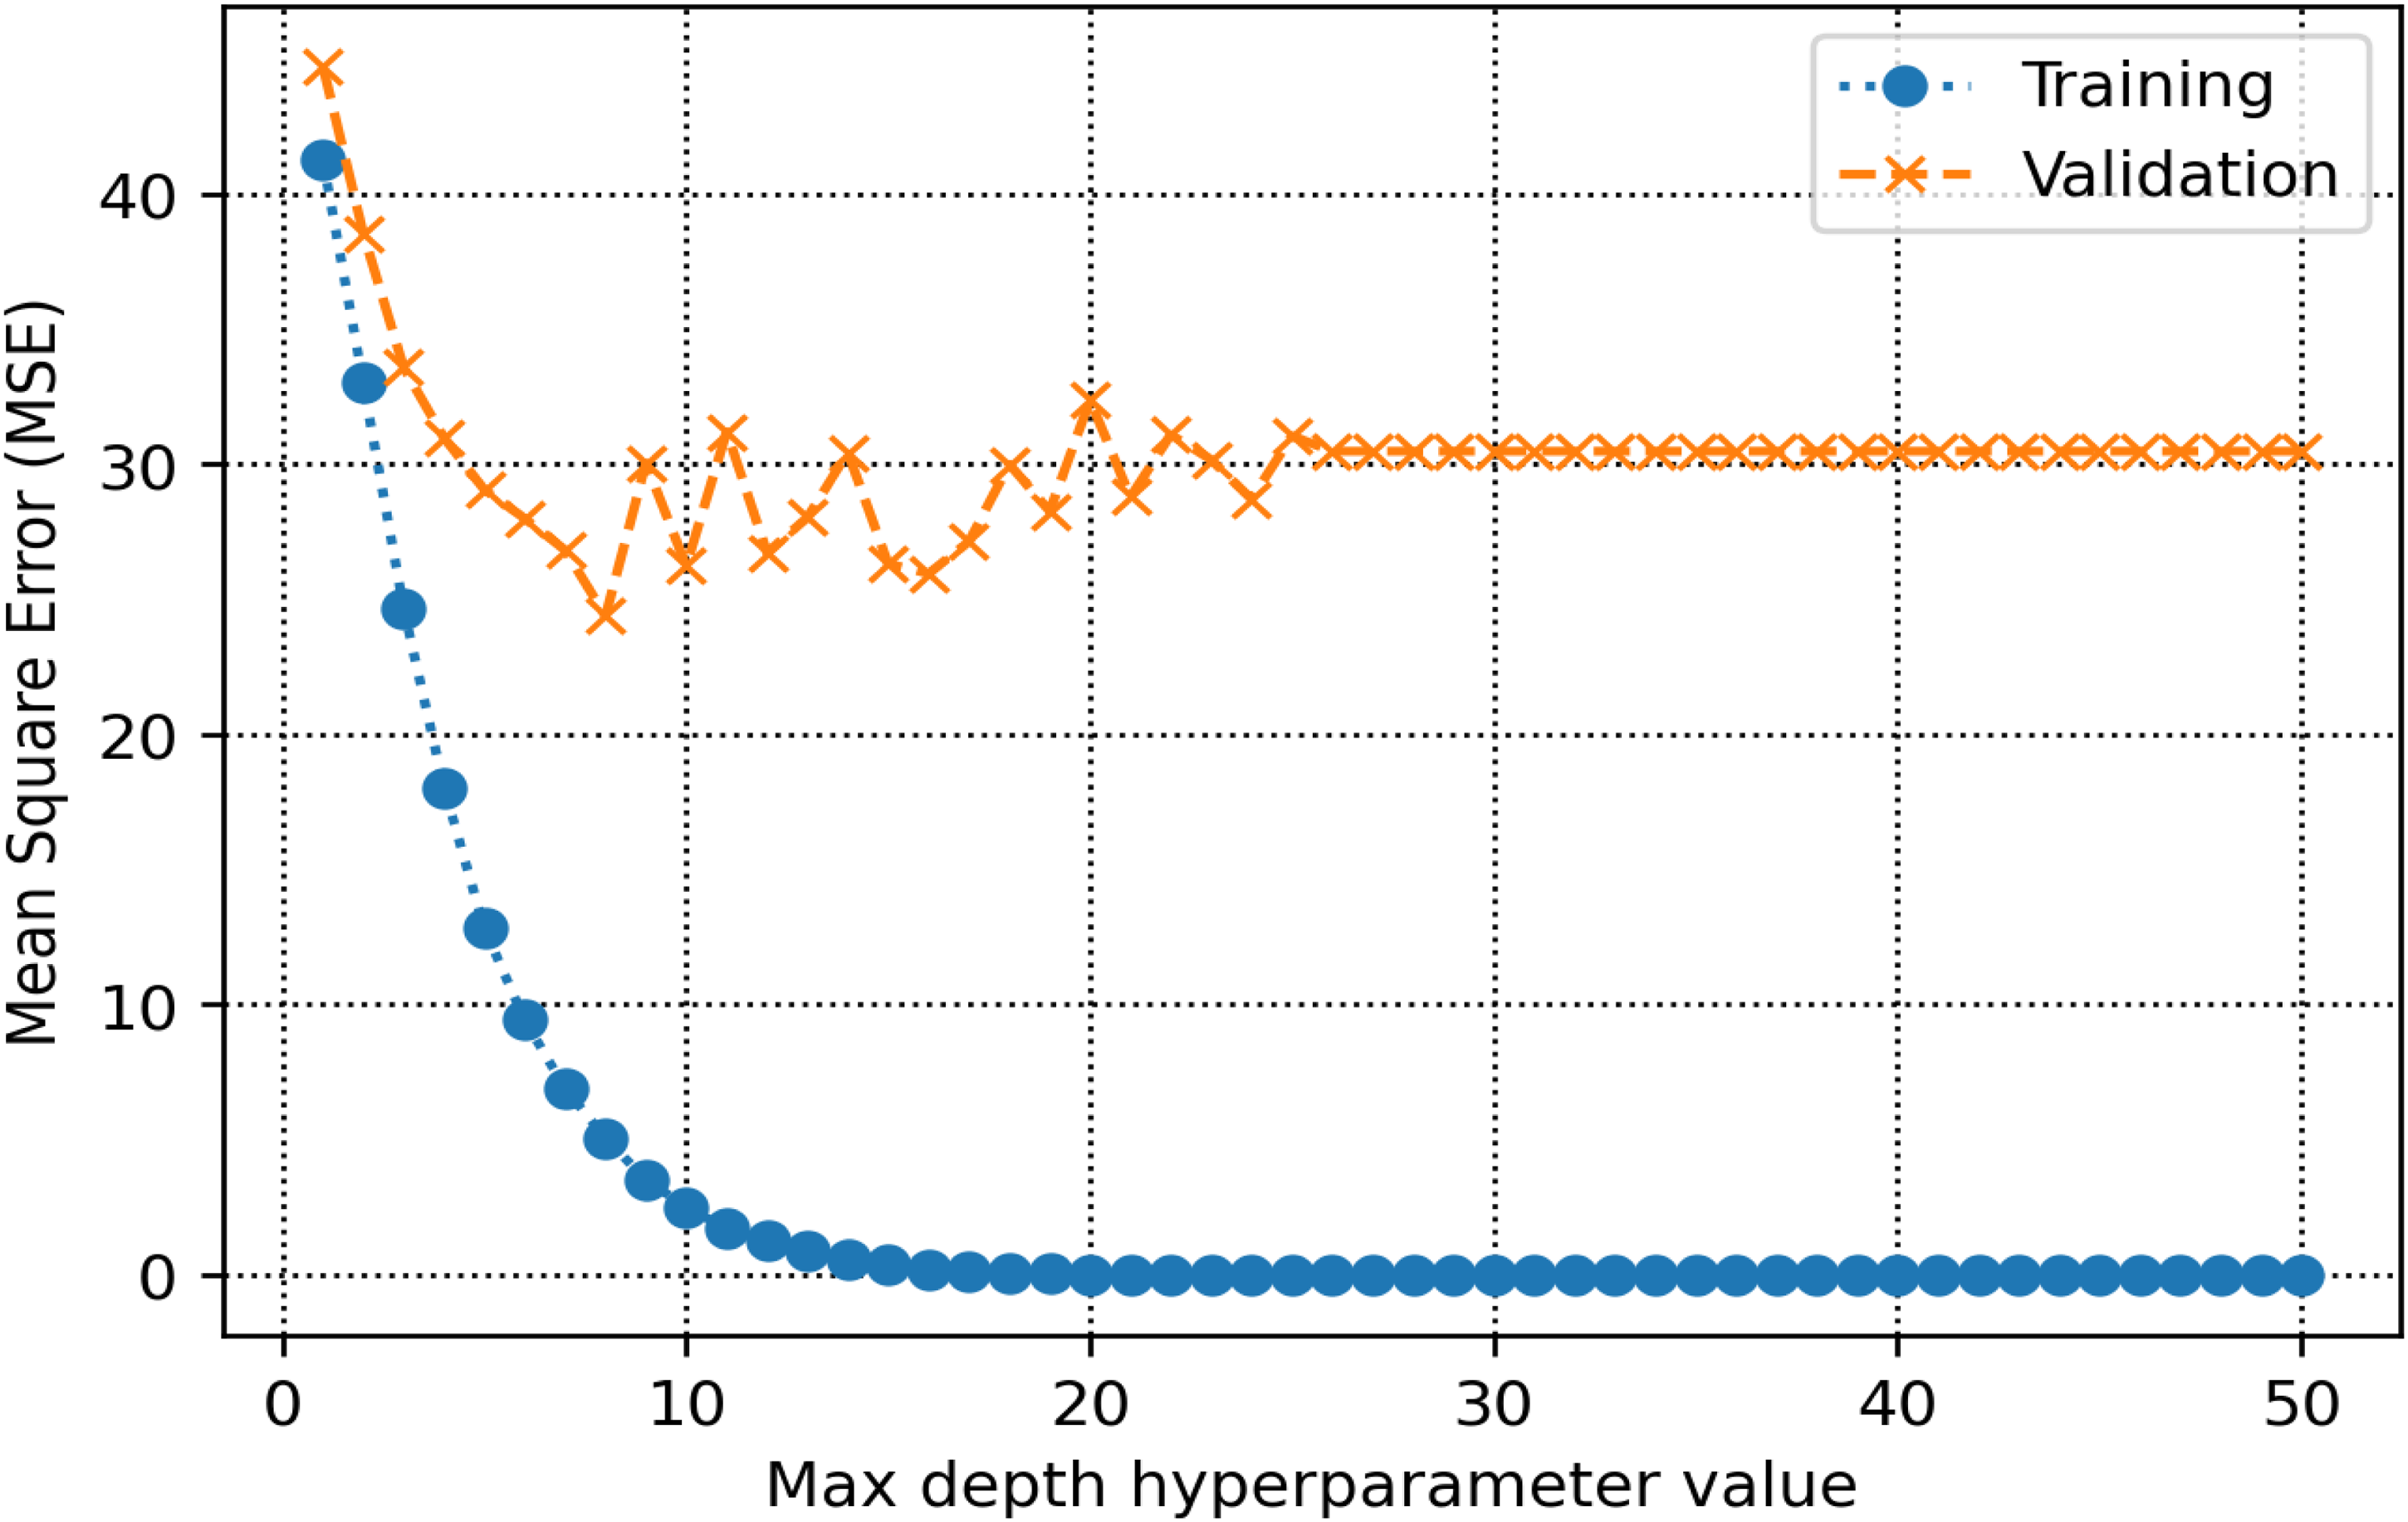
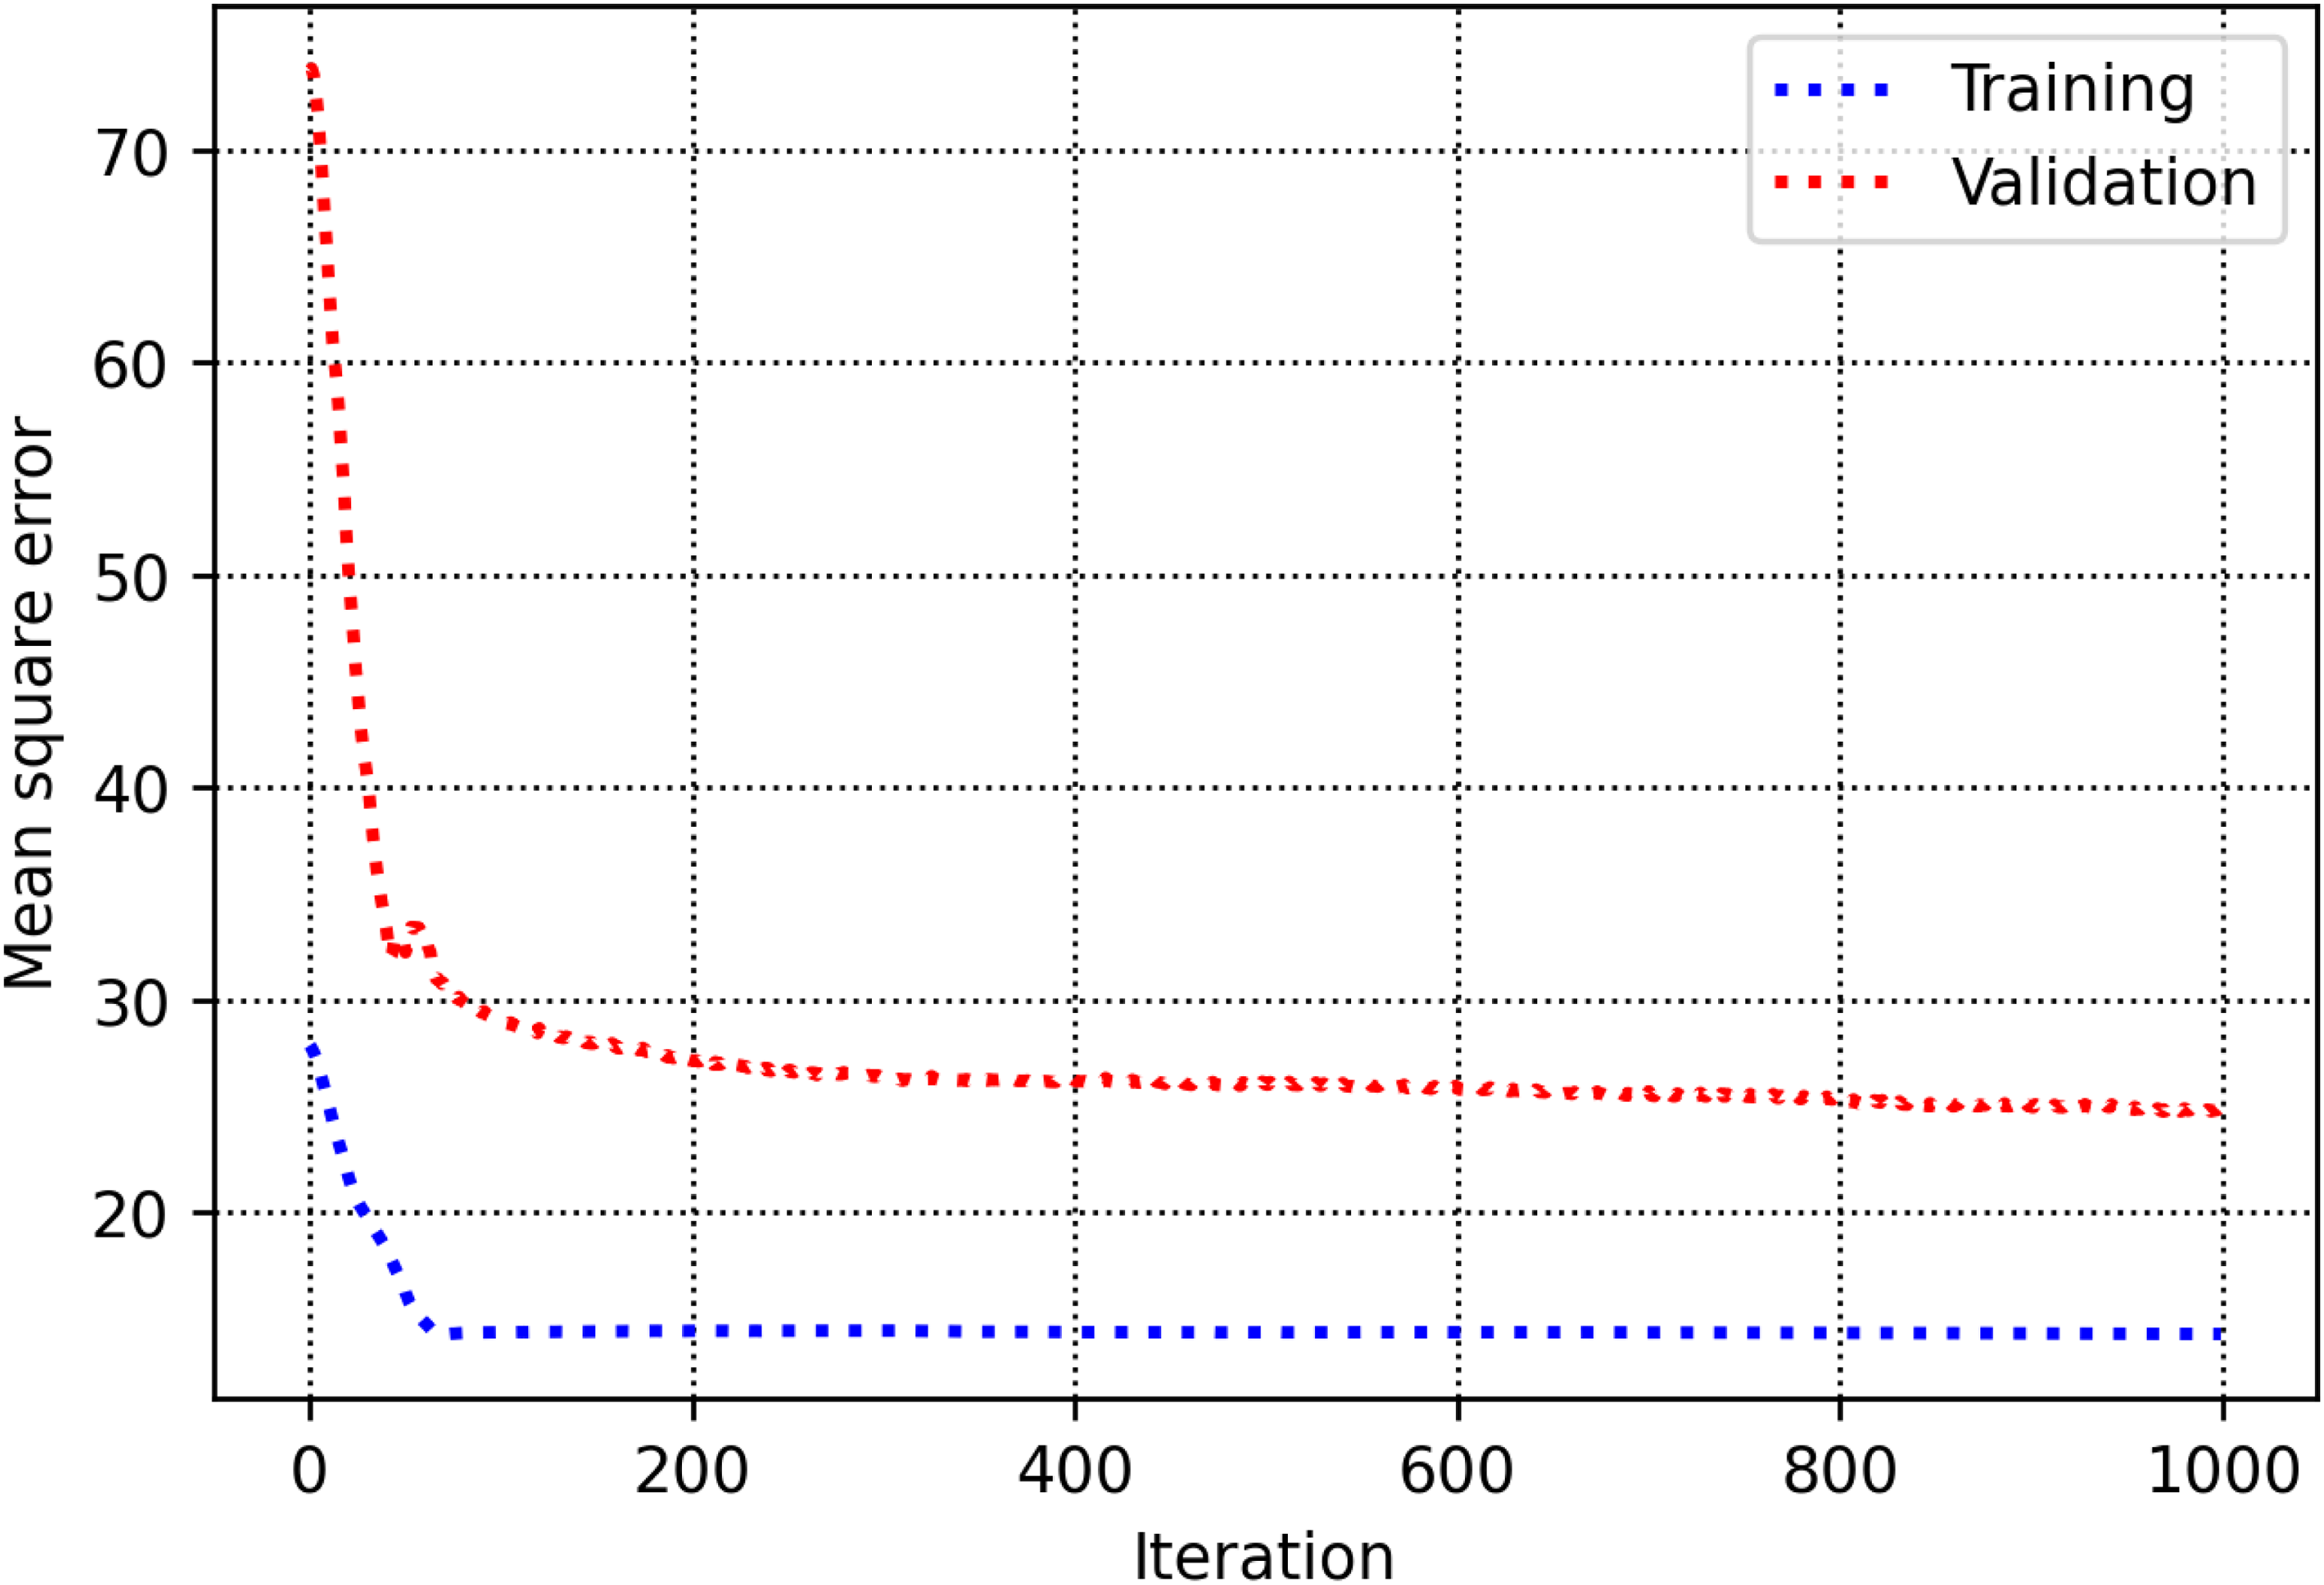
The training and validation sets are essential for establishing parameters and hyperparameters in various methods. In the decision tree, the hyperparameter known as max-depth is configured to 16 (refer to Figure 8). As illustrated in Figure 9, the AdaBoost model employs 30 estimators. The k-NN model is configured with a K-value of 2, as shown in Figure 10. Figure 11 illustrates that the maximum depth for the random forest technique is adjusted to 20. As shown in Figure 12, the MSE loss values for the CNN model are assessed across various iterations. In Figure 13, it is established that the C hyperparameter of the SVR model is 20. Figure 14 shows that the iterative tuning of the number of iterations for the MLP-ANN is configured to 400. It is essential to note that the random forest, decision tree, and AdaBoost methods, together with their optimized parameters, are combined as an ensemble learning approach. Note that the training times for MLP-ANN, CNN, decision tree, random forest, SVR, AdaBoost, and k-NN were recorded as 14.65, 21.67, 5.43, 6.87, 7.31, 5.23, and 4.98 s, respectively. These algorithms were run within the Python environment programming language on a machine with 16 GB RAM and Core-i7 CPU specifications.
Selection of the optimal max-depth hyperparameter in decision tree.
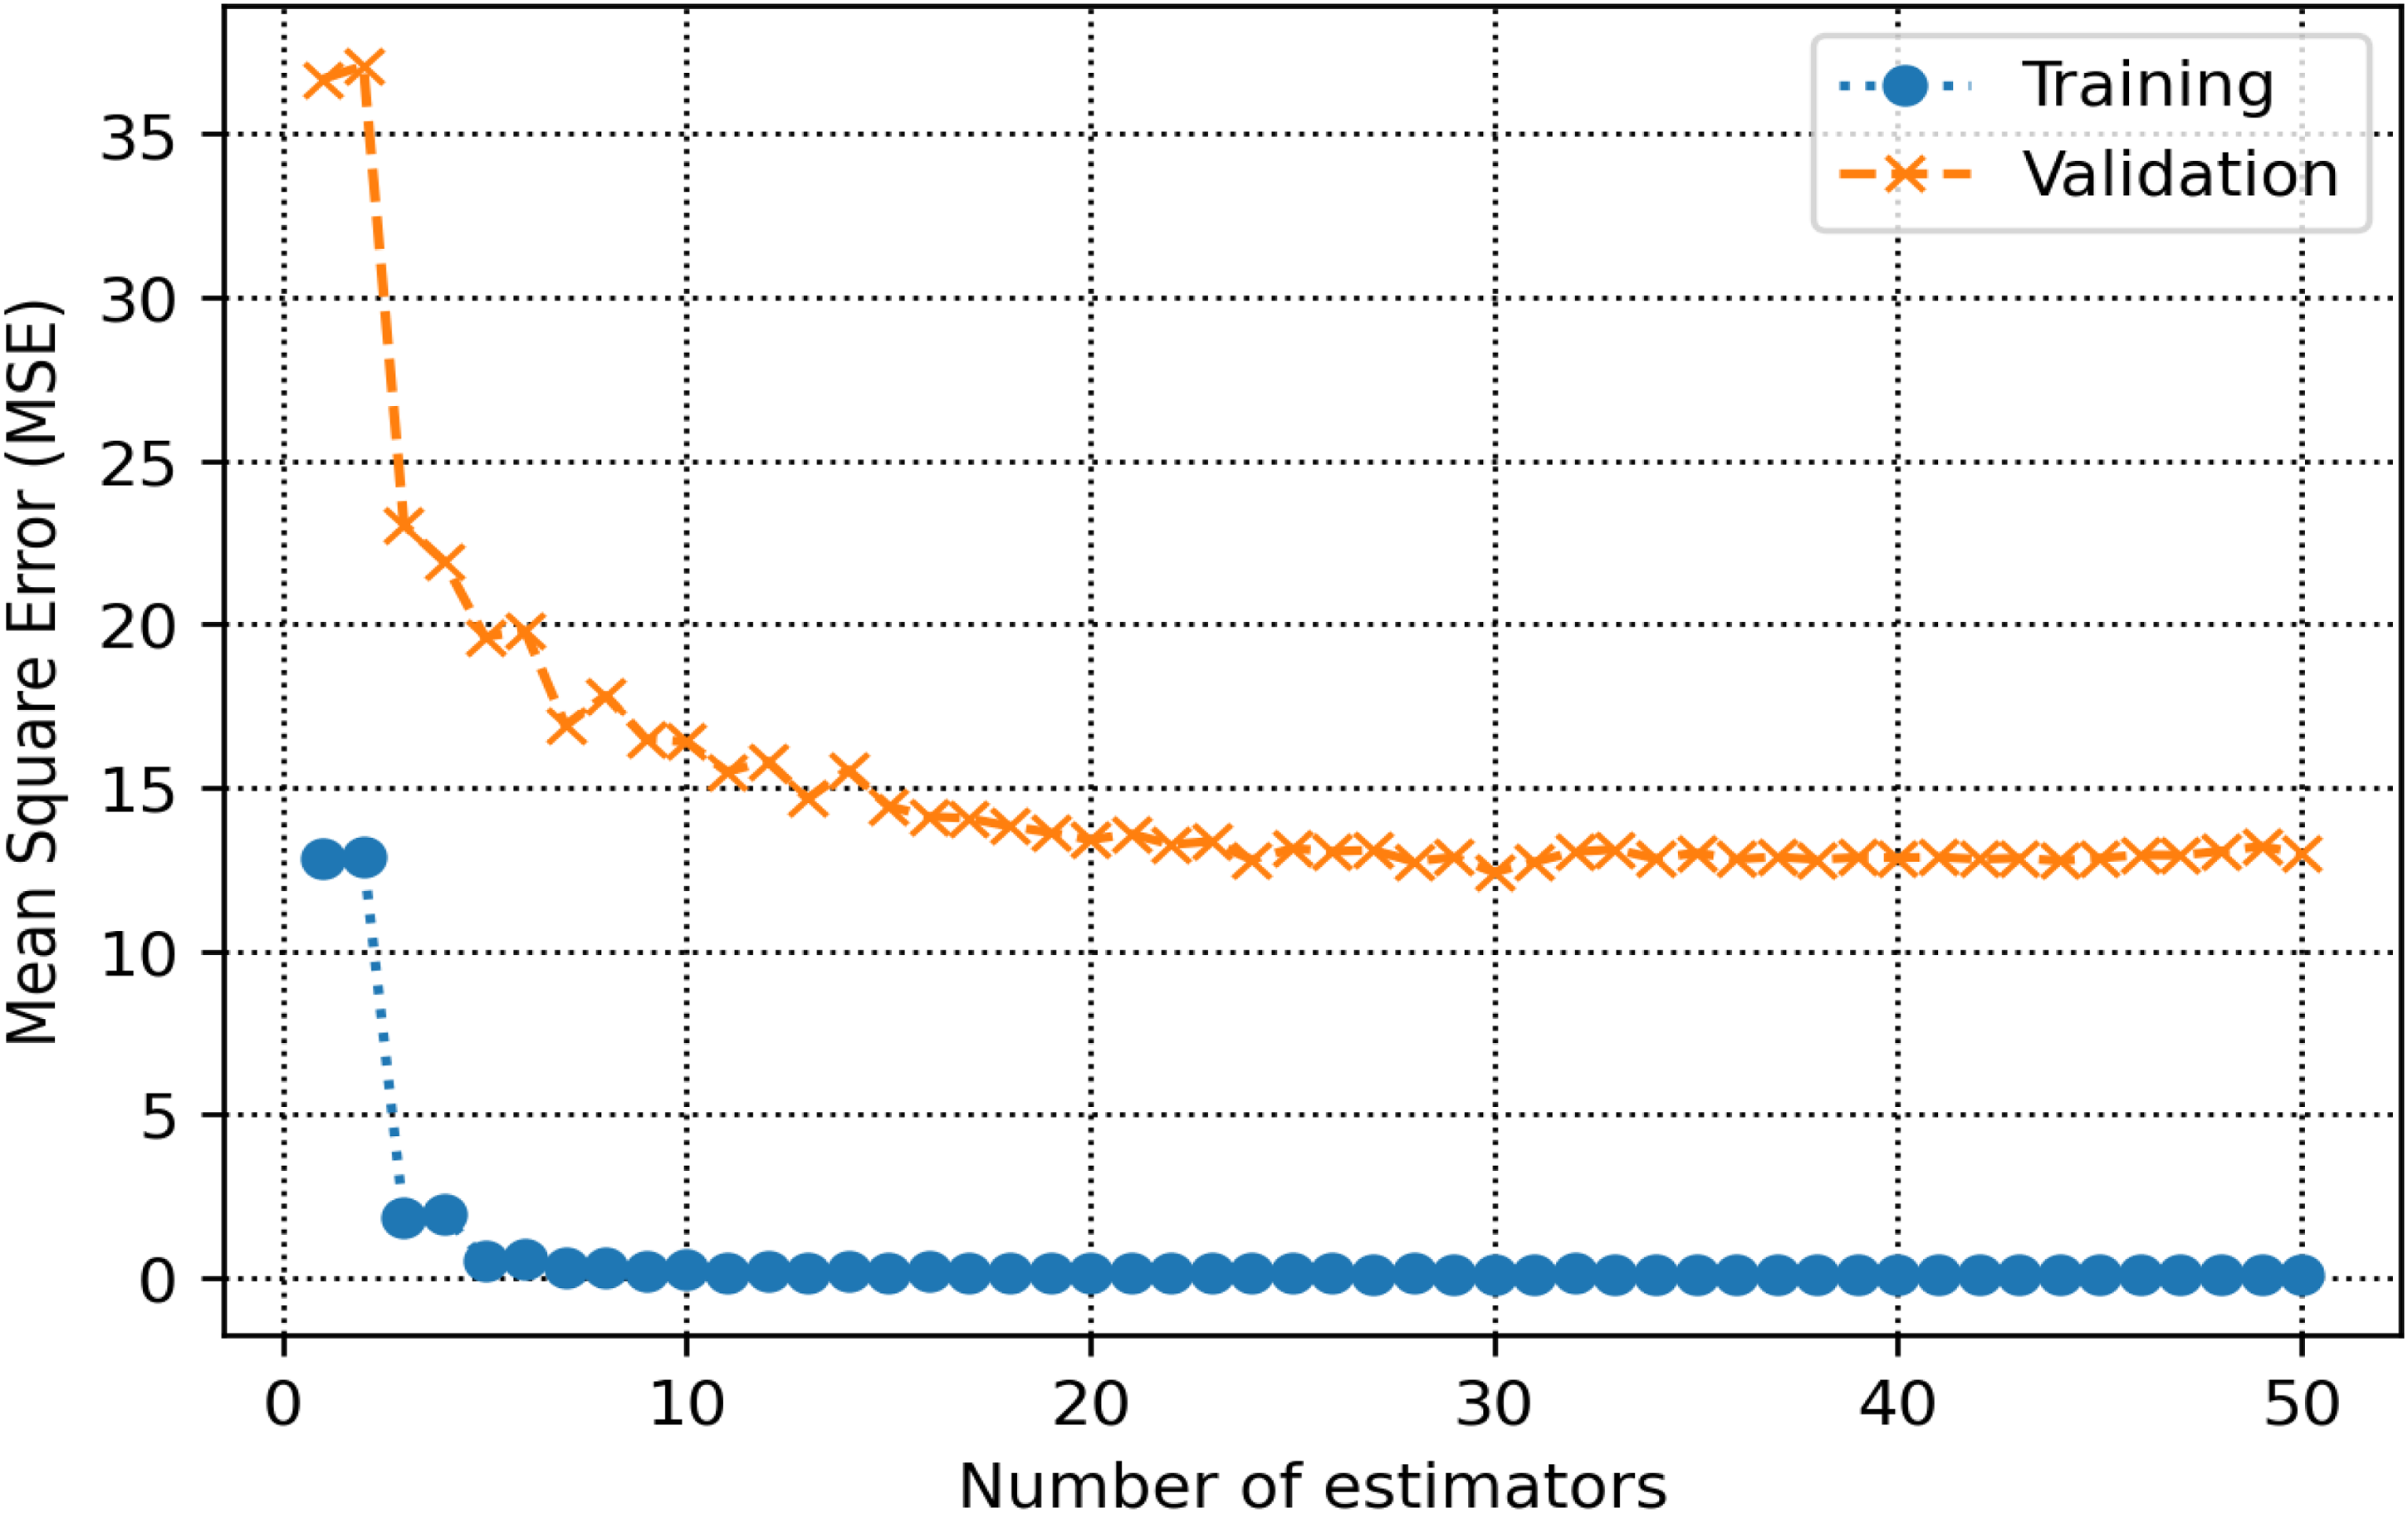
Identification of the optimal number of estimators for the AdaBoost algorithm. AdaBoost: adaptive boosting.
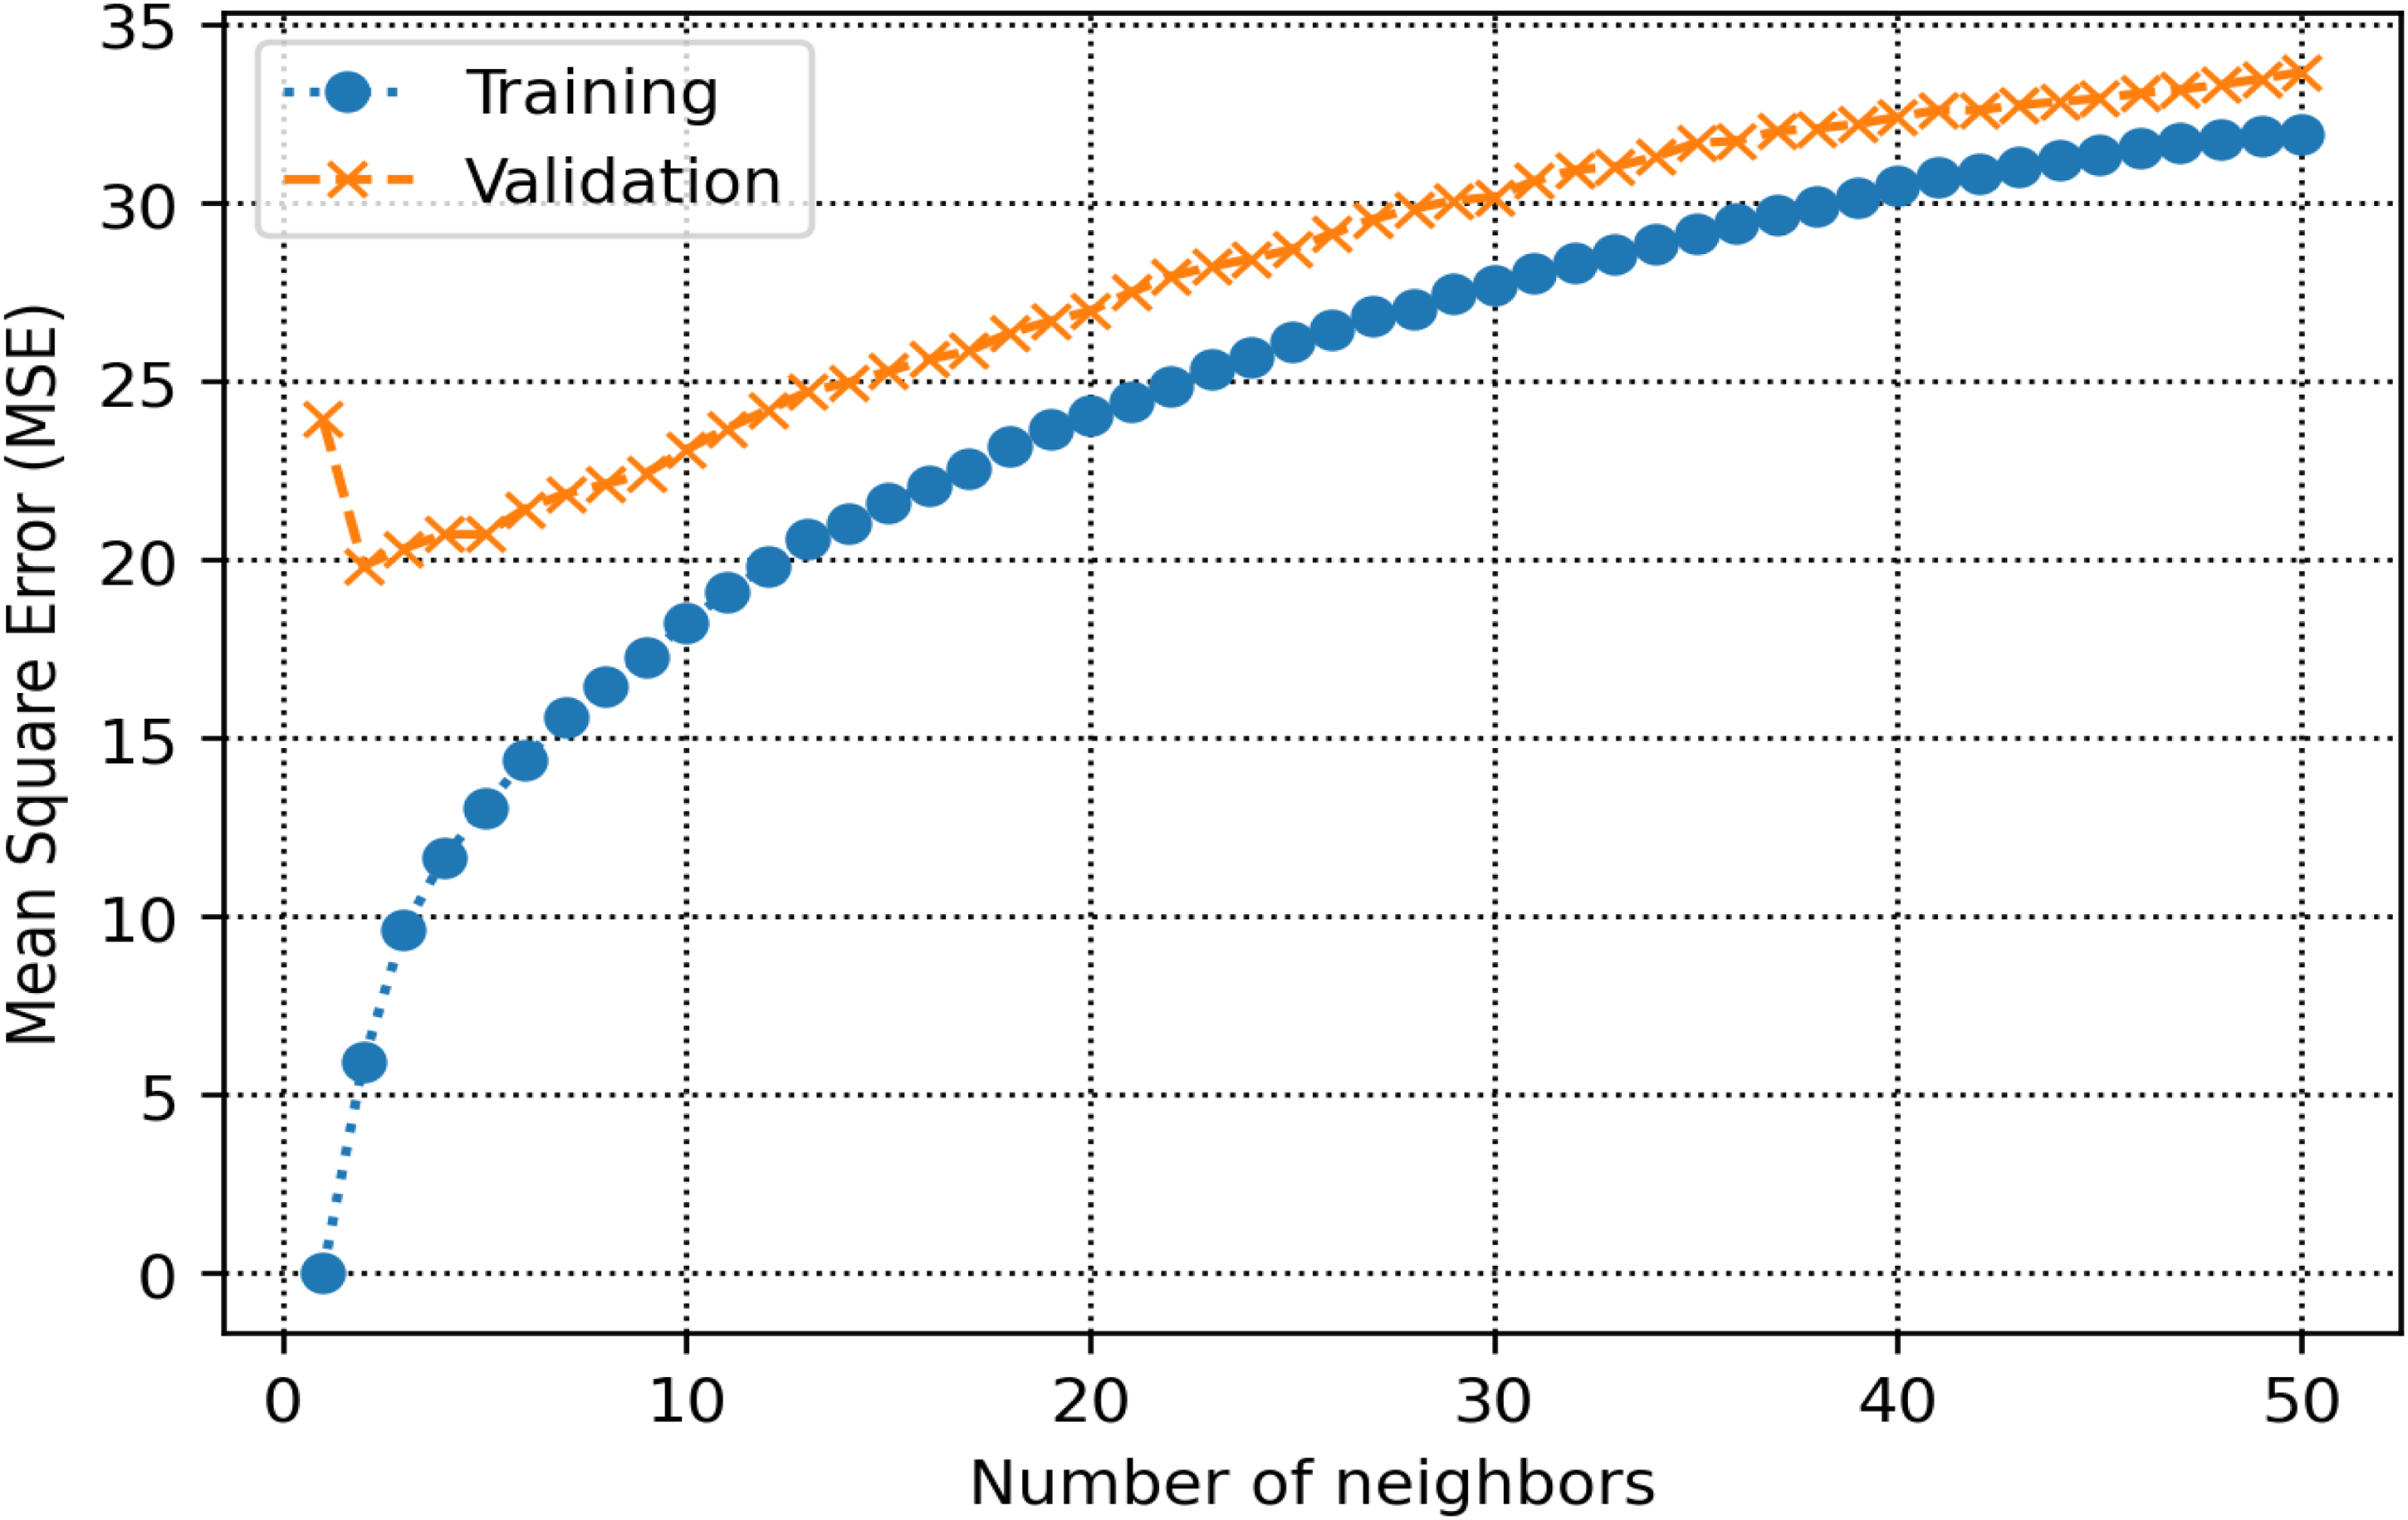
Tuning the optimal K value for k-NN. k-NN: k-nearest neighbor.
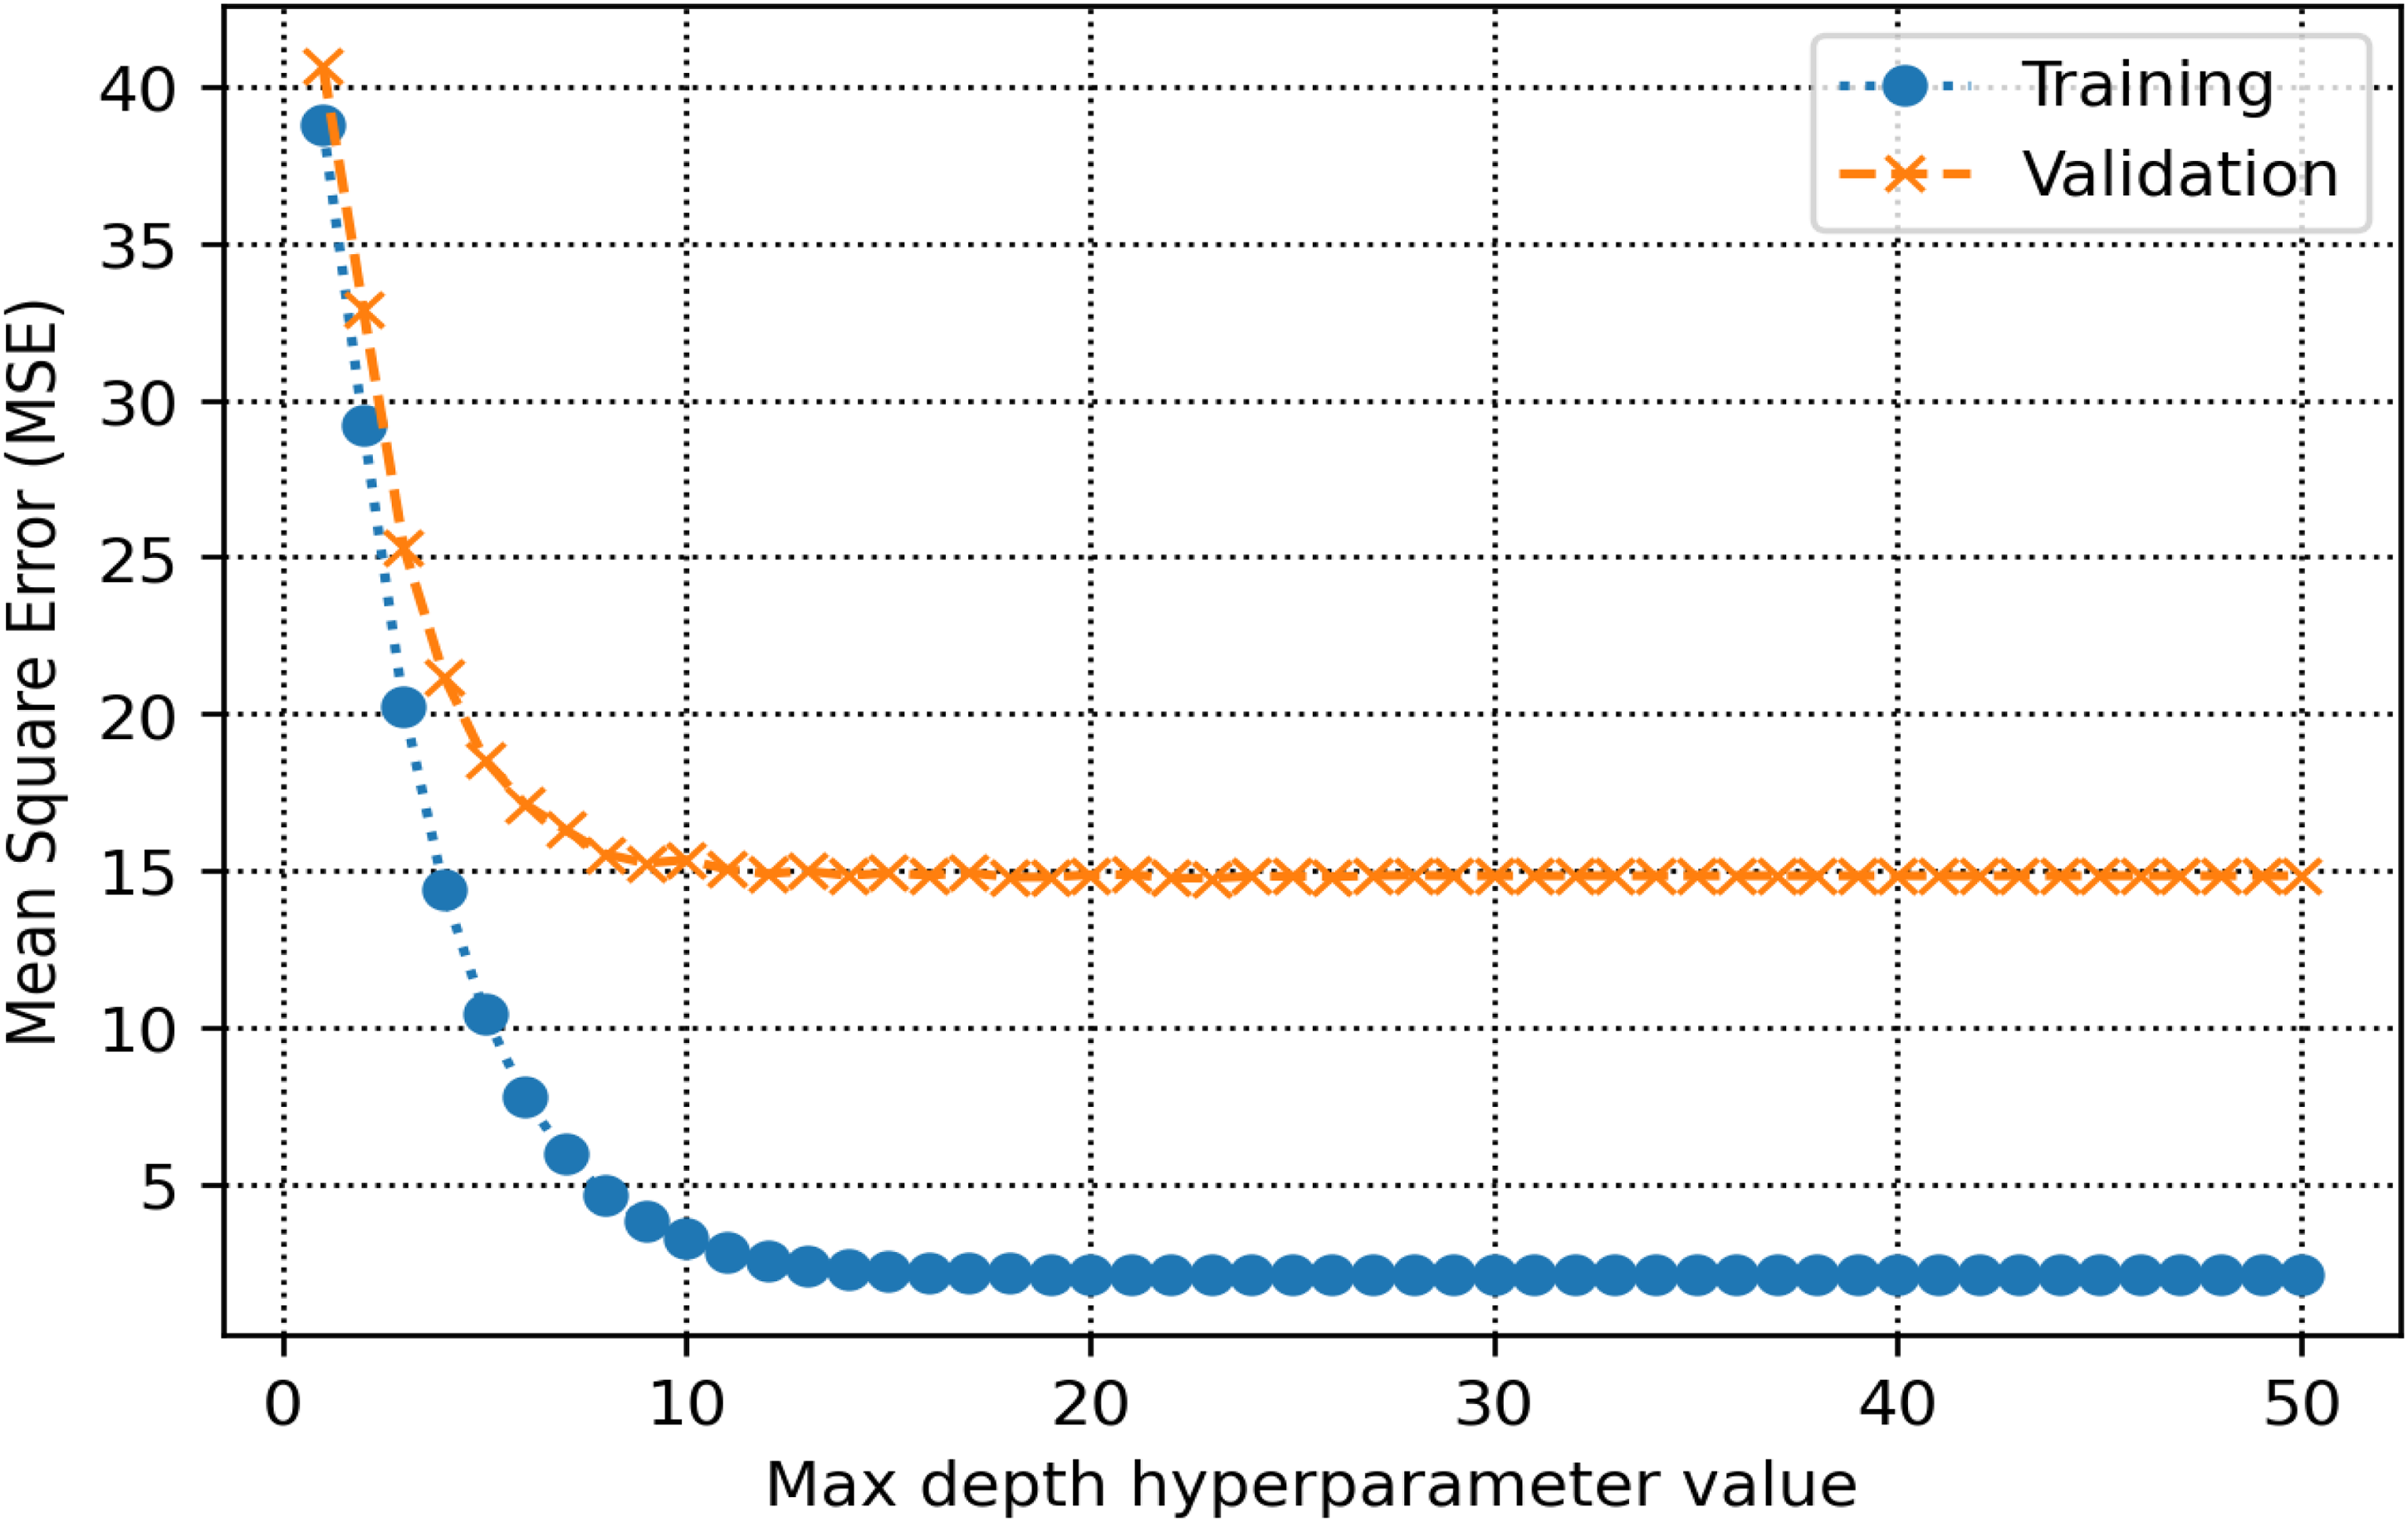
Selection of the optimal max-depth hyperparameter for the random forest.
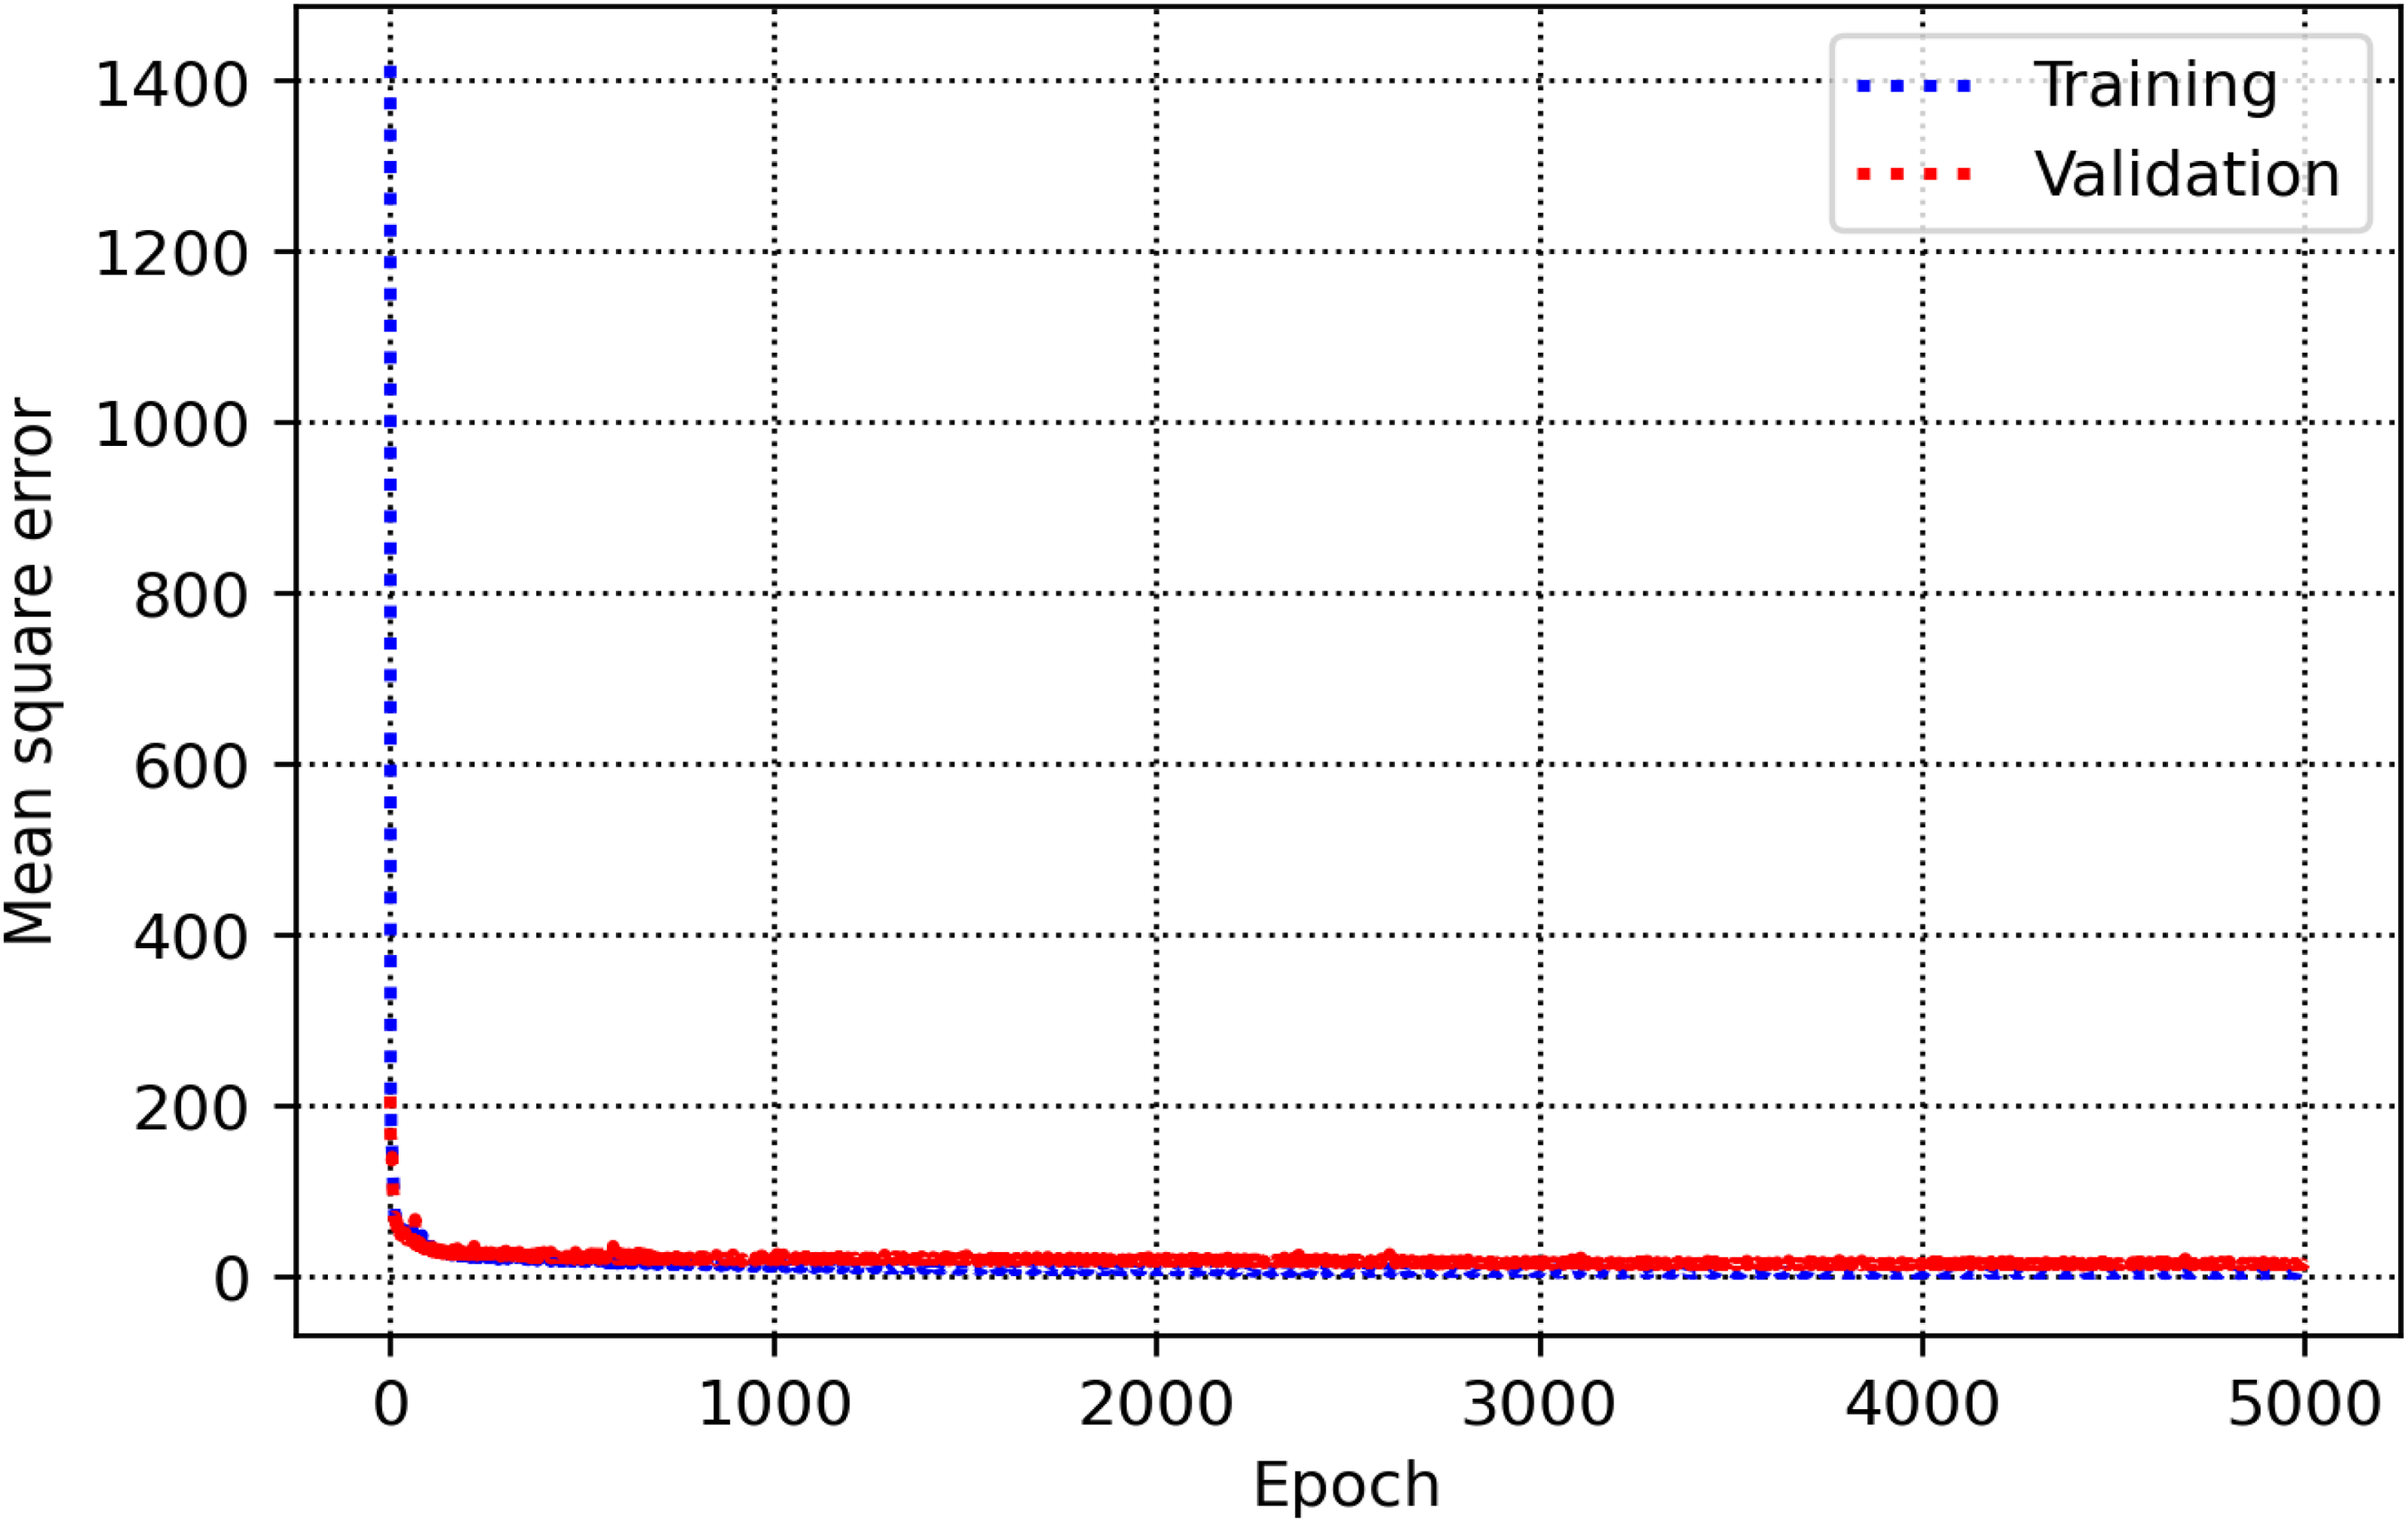
Plot of mean squared error (MSE) versus epochs for the CNN model. MSE: mean squared error; CNN: convolutional neural network.
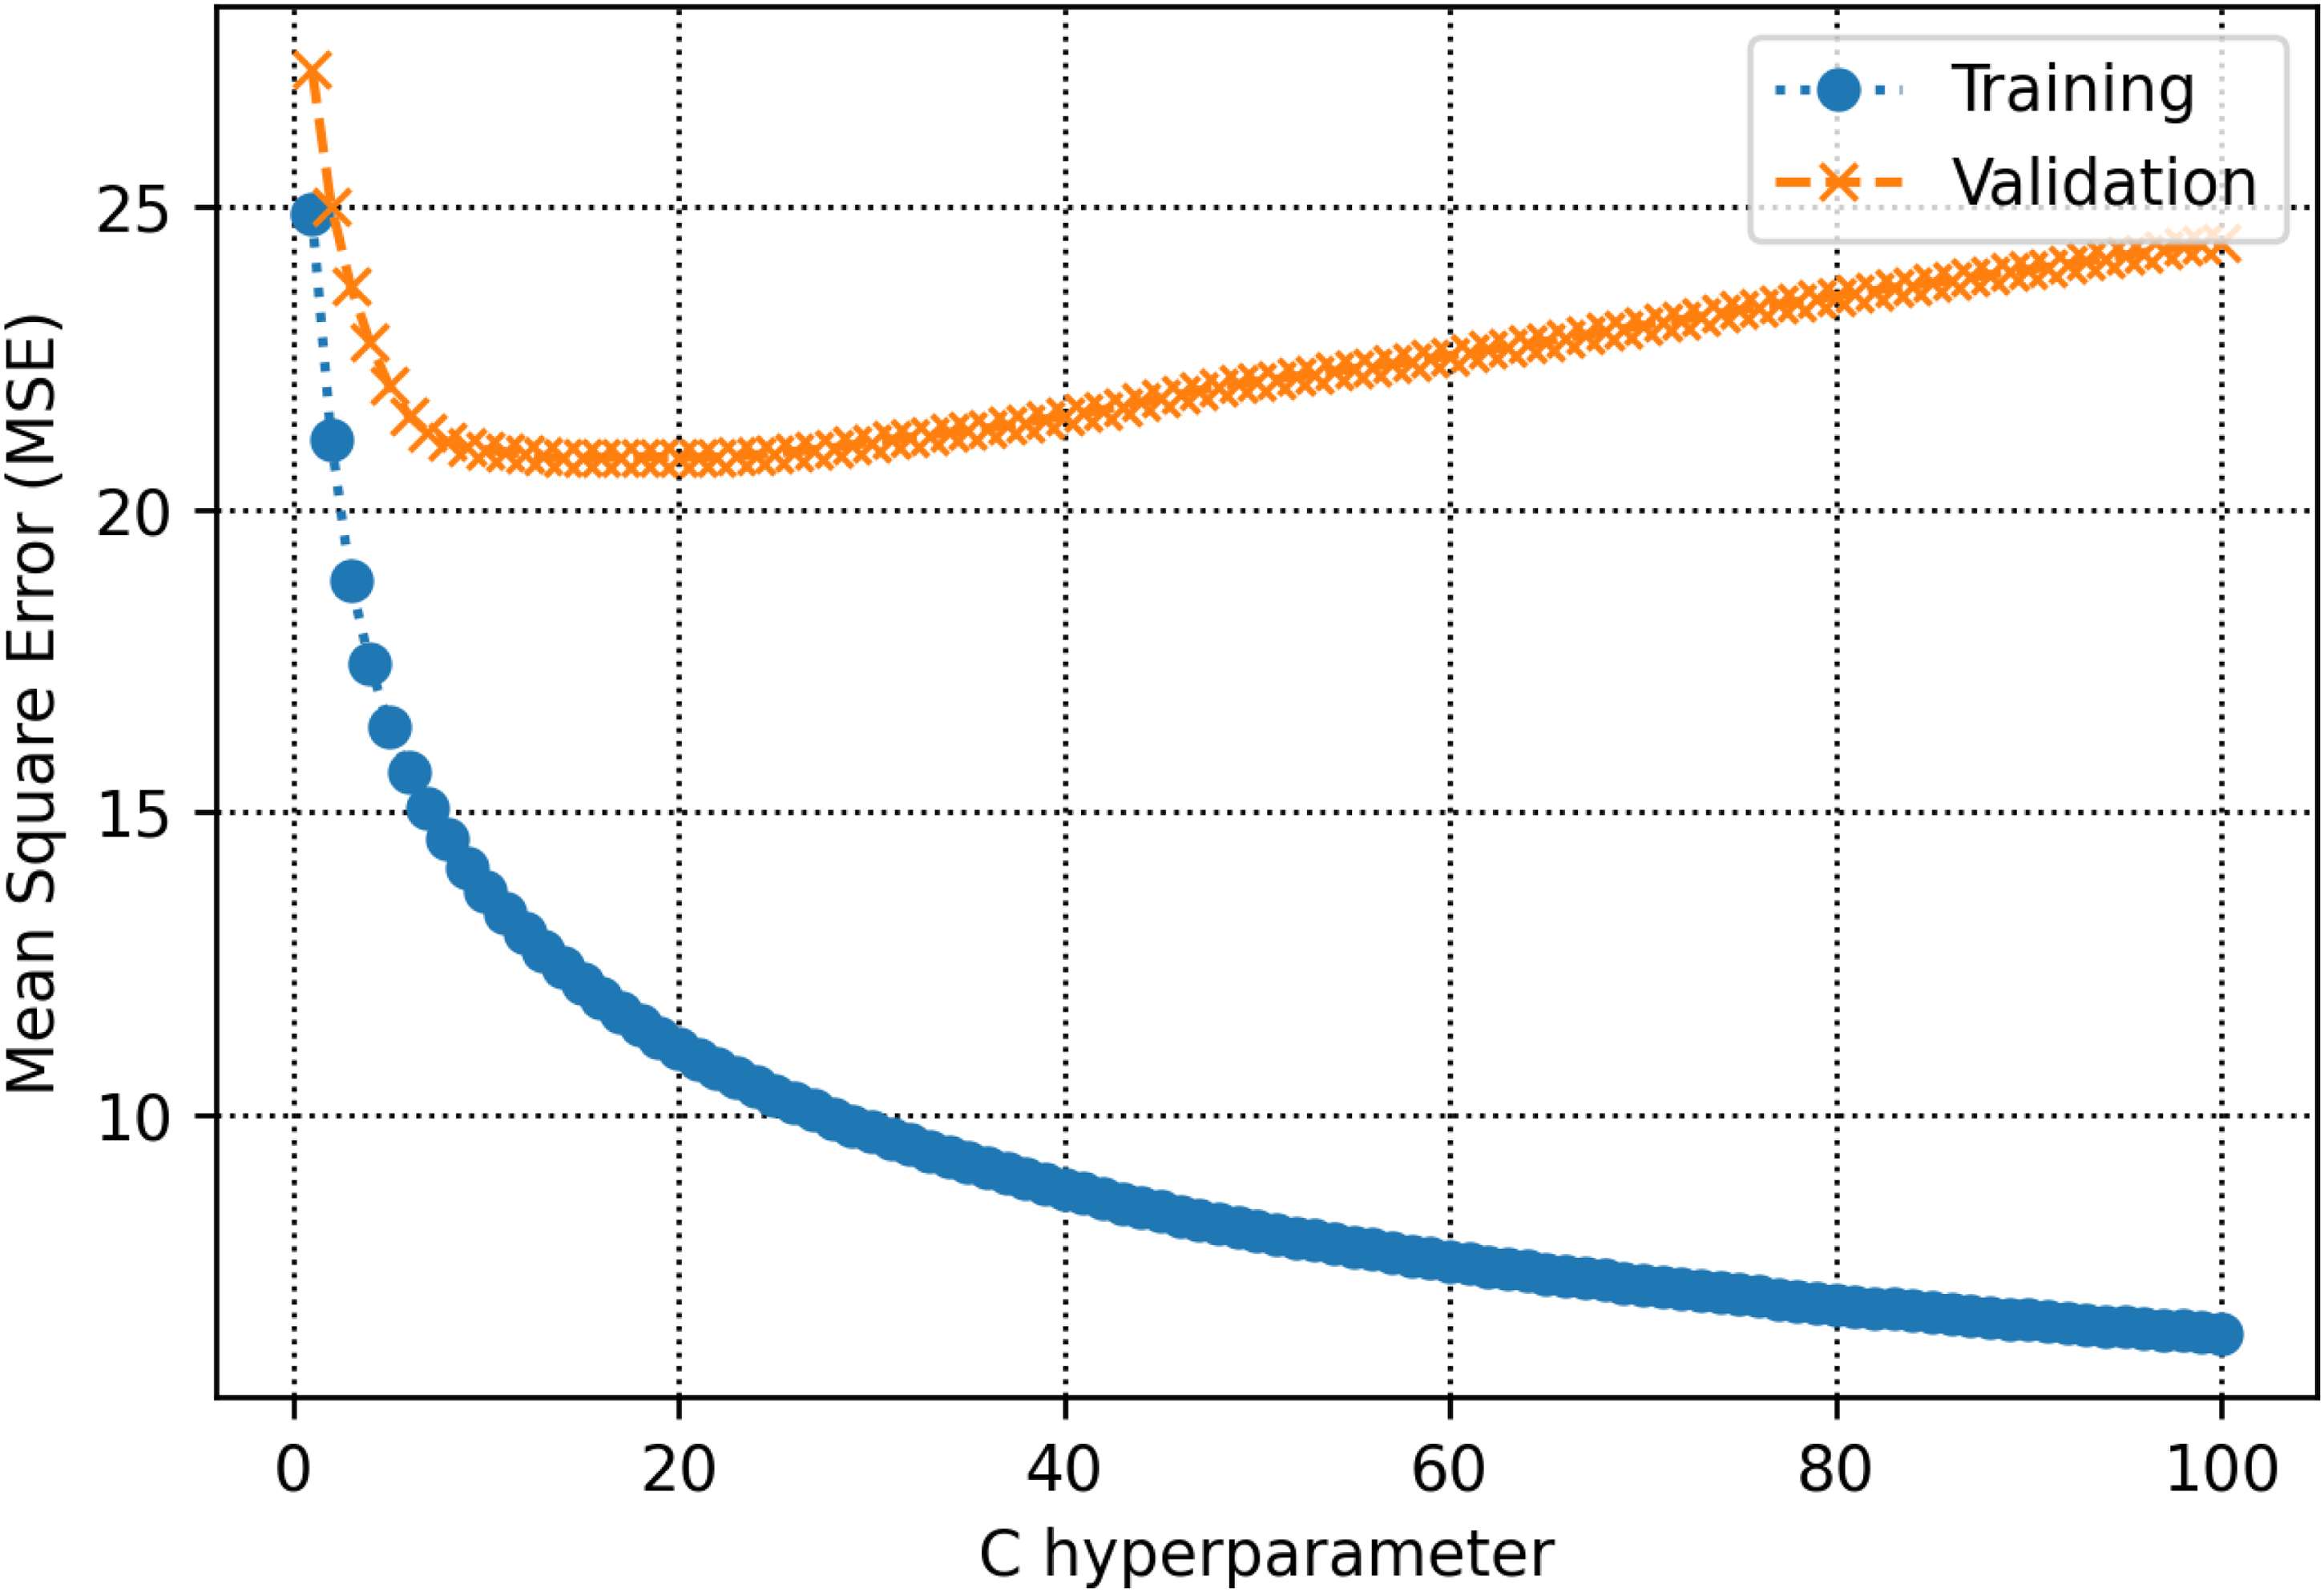
Determination of the optimal C hyperparameter for the support vector regression (SVR) technique. SVR: support vector regression.
Determining iterative tuning of the number of iterations for the MLP-ANN. MLP-ANN: multilayer perceptron-artificial neural network.
Modeling evaluation
Table 5 presents the evaluation metrics obtained from the data-driven models developed for the prediction of CSR, encompassing training, testing, and overall datasets. Three mathematical evaluation metrics, R2, MSE, and AARE% were used to appraise the performance of the proposed soft computing techniques rigorously. Based on these criteria, the random forest model emerged as the superior estimator for CSR prediction. Specifically, the random forest model achieved testing R2, MSE, and AARE% values of 0.82, 12.35, and 4.5, respectively. While the decision tree and AdaBoost models exhibited comparatively lower performance metrics, they also demonstrated evidence of overfitting during the training phase, rendering them less suitable for this prediction task. A graphical representation of the testing evaluation metrics is provided in Figure 15, facilitating a clear comparative analysis of the developed models.
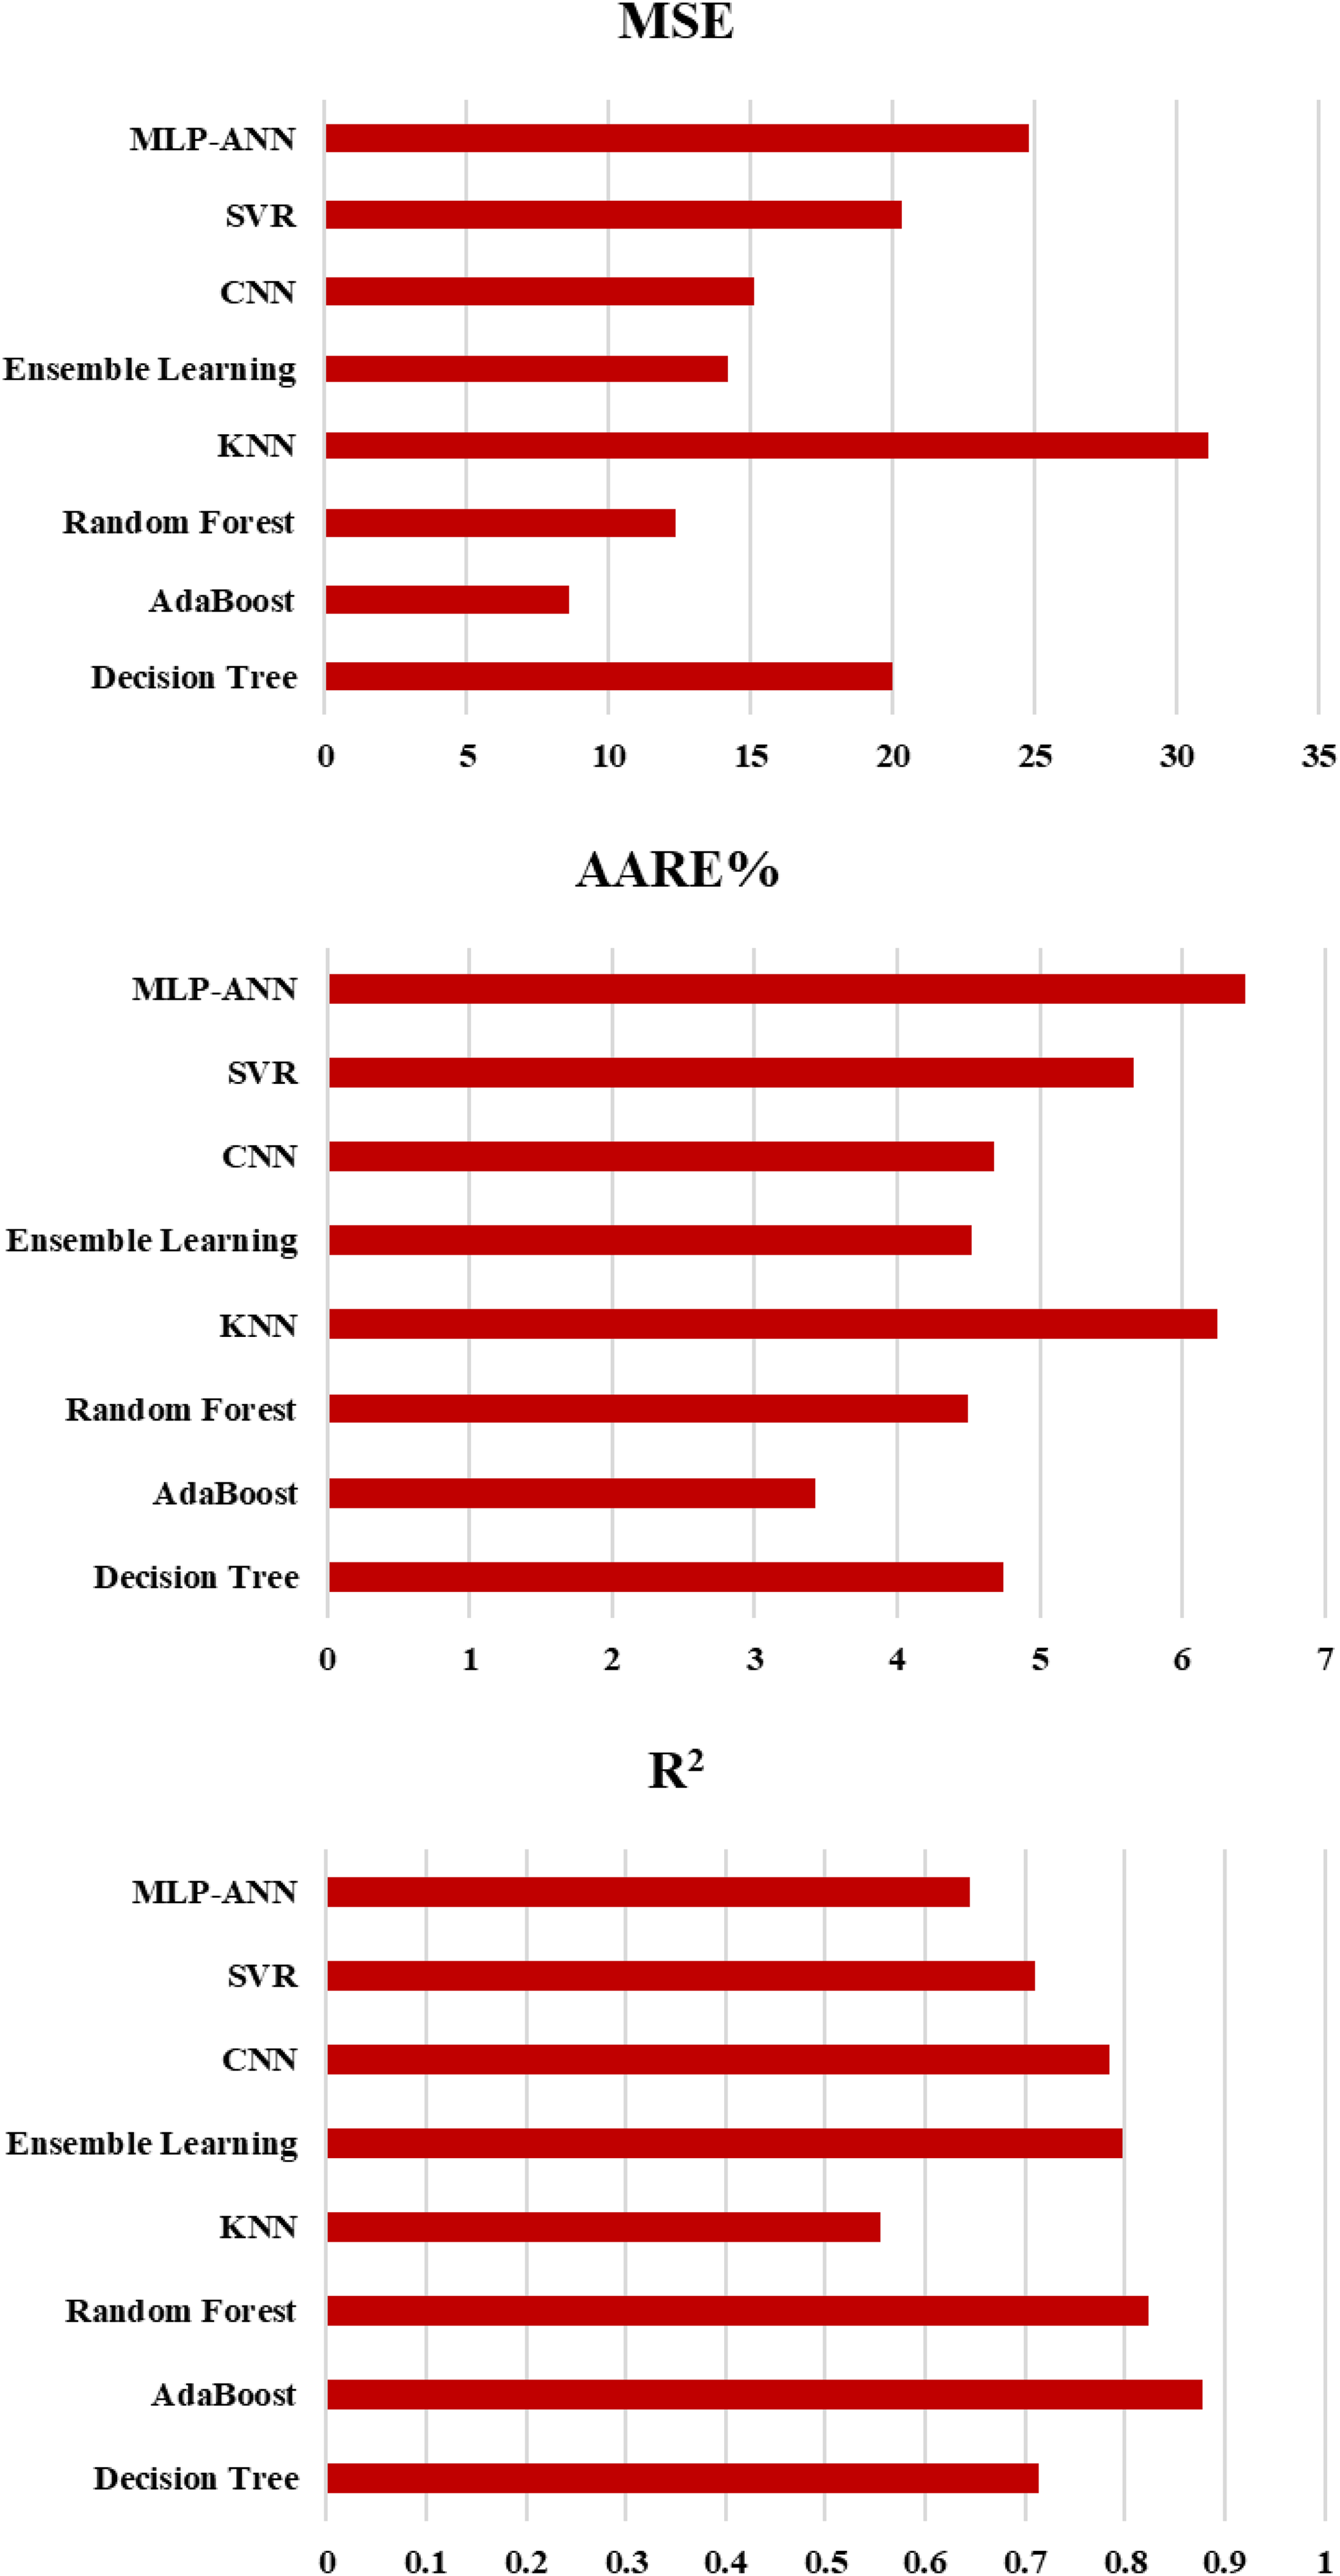
Evaluation indices of R2, MSE, and AARE% for all the models. MSE: mean squared error; AARE%: average absolute relative error.
Statistical evaluation indices, R2, MSE, and AARE% for various models.
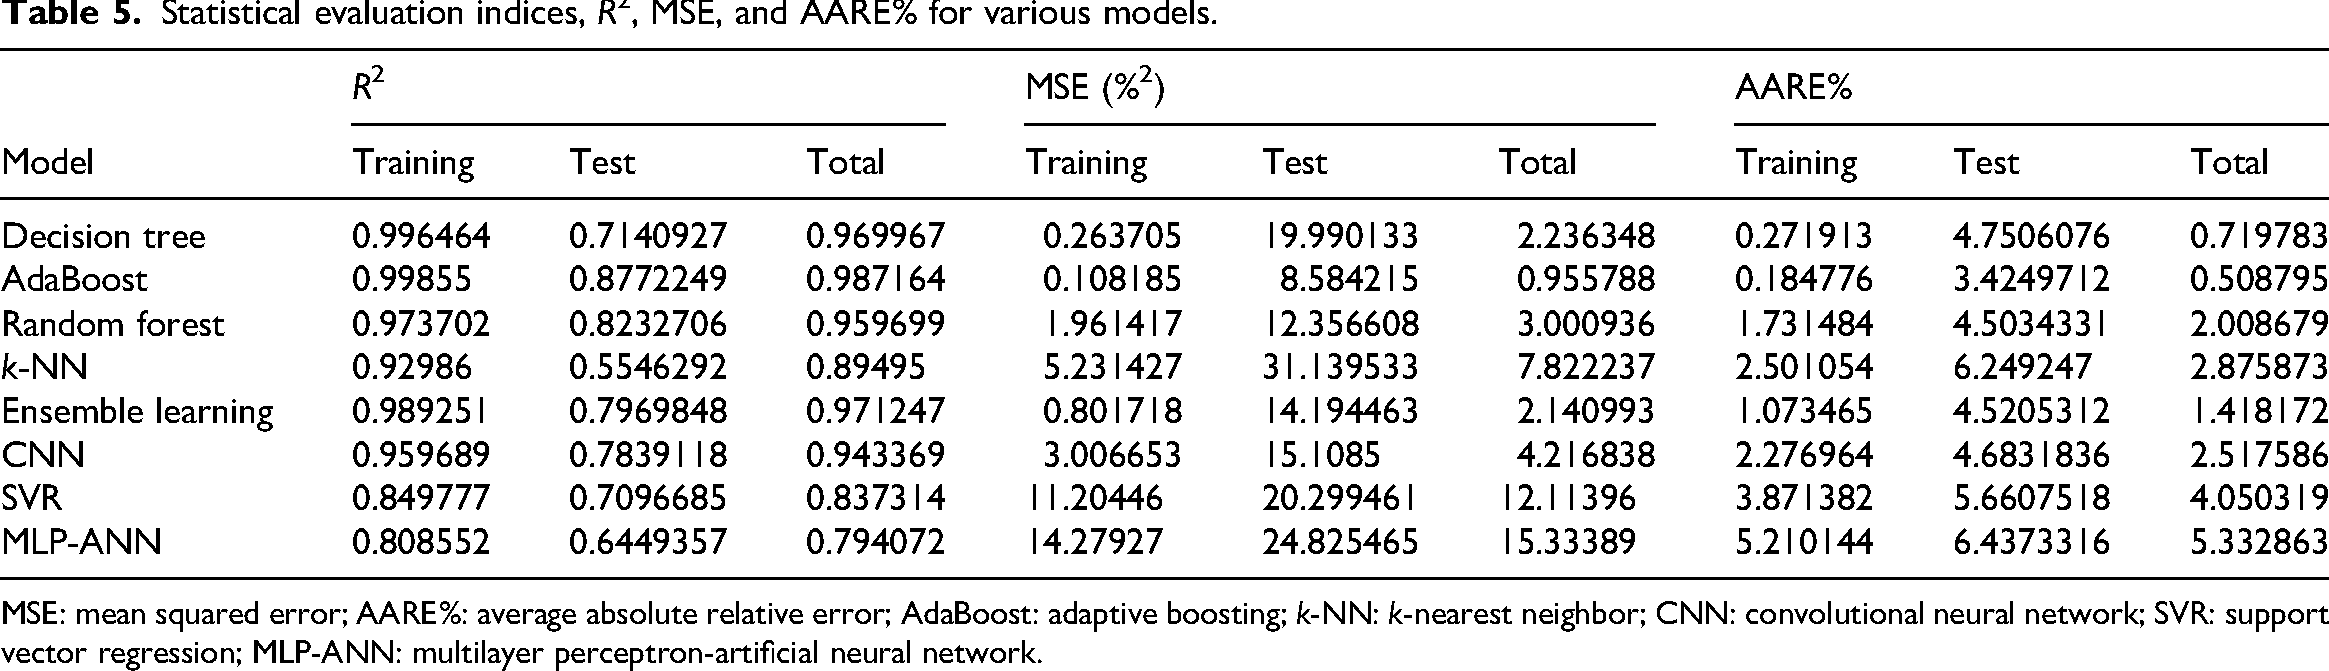
MSE: mean squared error; AARE%: average absolute relative error; AdaBoost: adaptive boosting; k-NN: k-nearest neighbor; CNN: convolutional neural network; SVR: support vector regression; MLP-ANN: multilayer perceptron-artificial neural network.
In this study, two visualization techniques, including relative error plots and crossplots, are used to determine the accuracy of the machine-learning methods. Figures 16 and 17 provide a visual comparison between the real and predicted CSR values for the various algorithms used in this research. The random forest model shows a strong agreement between its predictions and the actual values. This is evident in the cross-plot, where the data points are tightly grouped along the bisector line (y = x). The equations for the fitted lines also closely match y = x, further confirming the model's accuracy in predicting CSR.
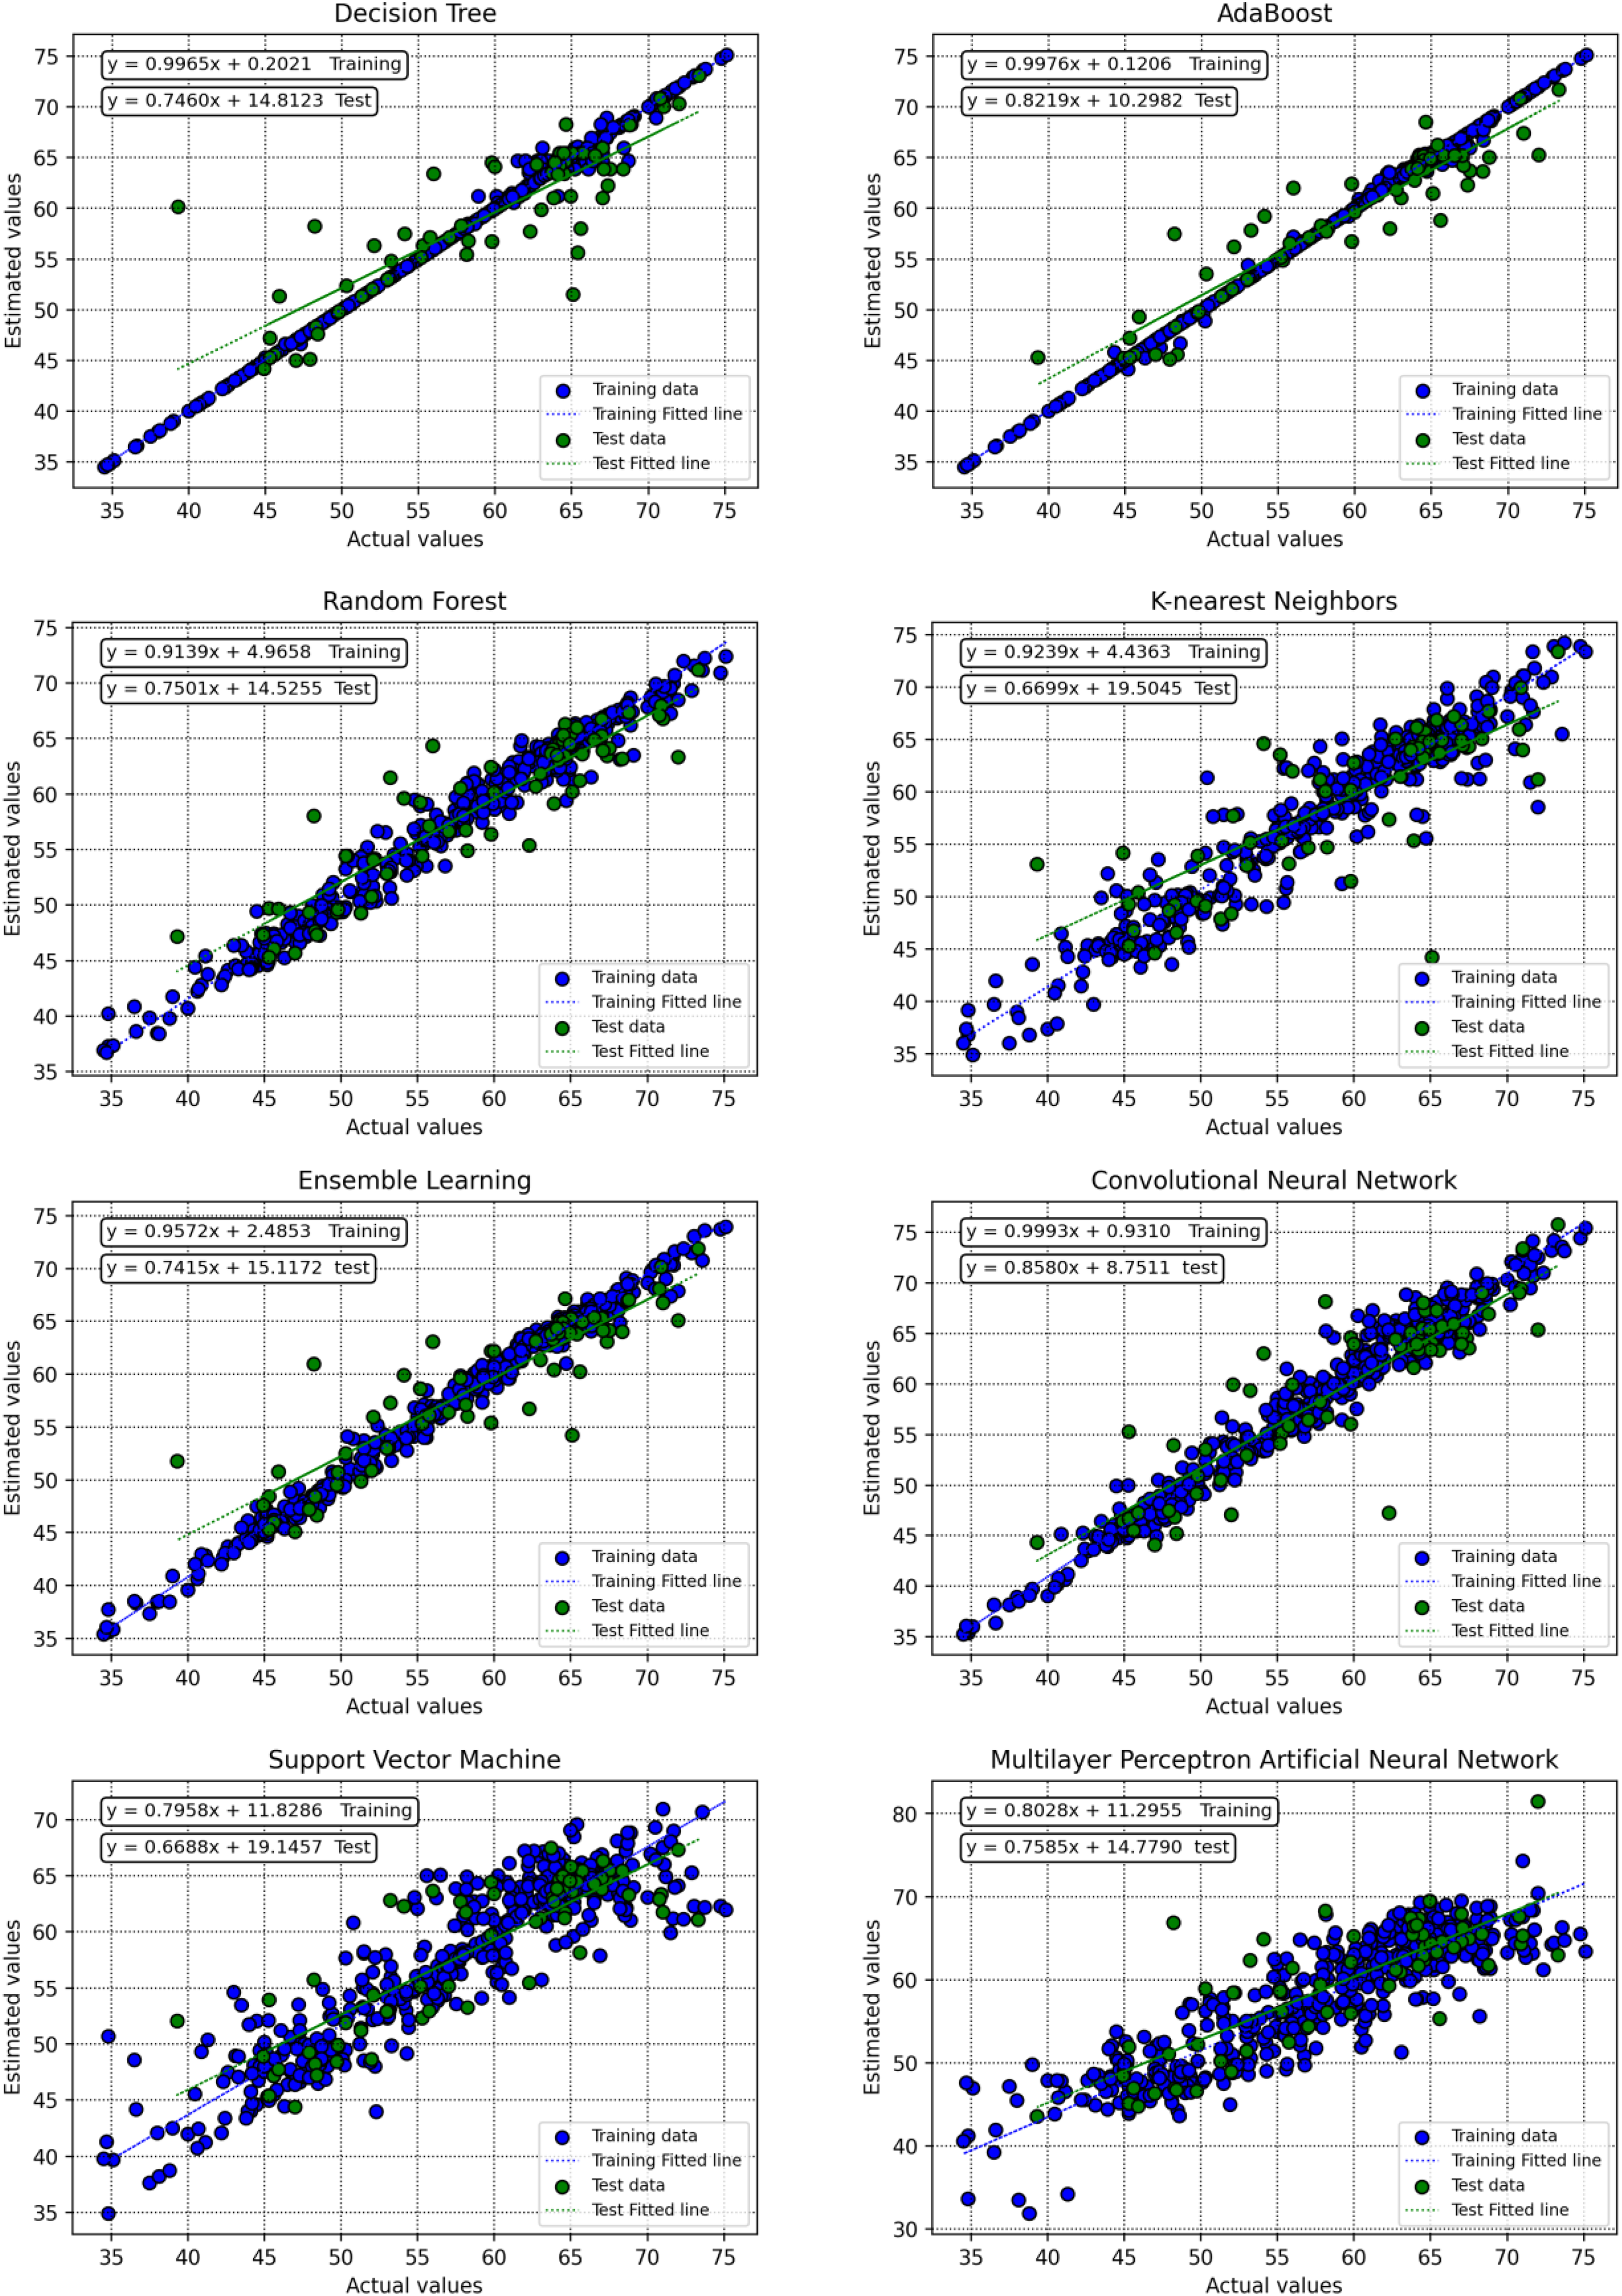
Appraised versus real points regarding train and test samples for all models.
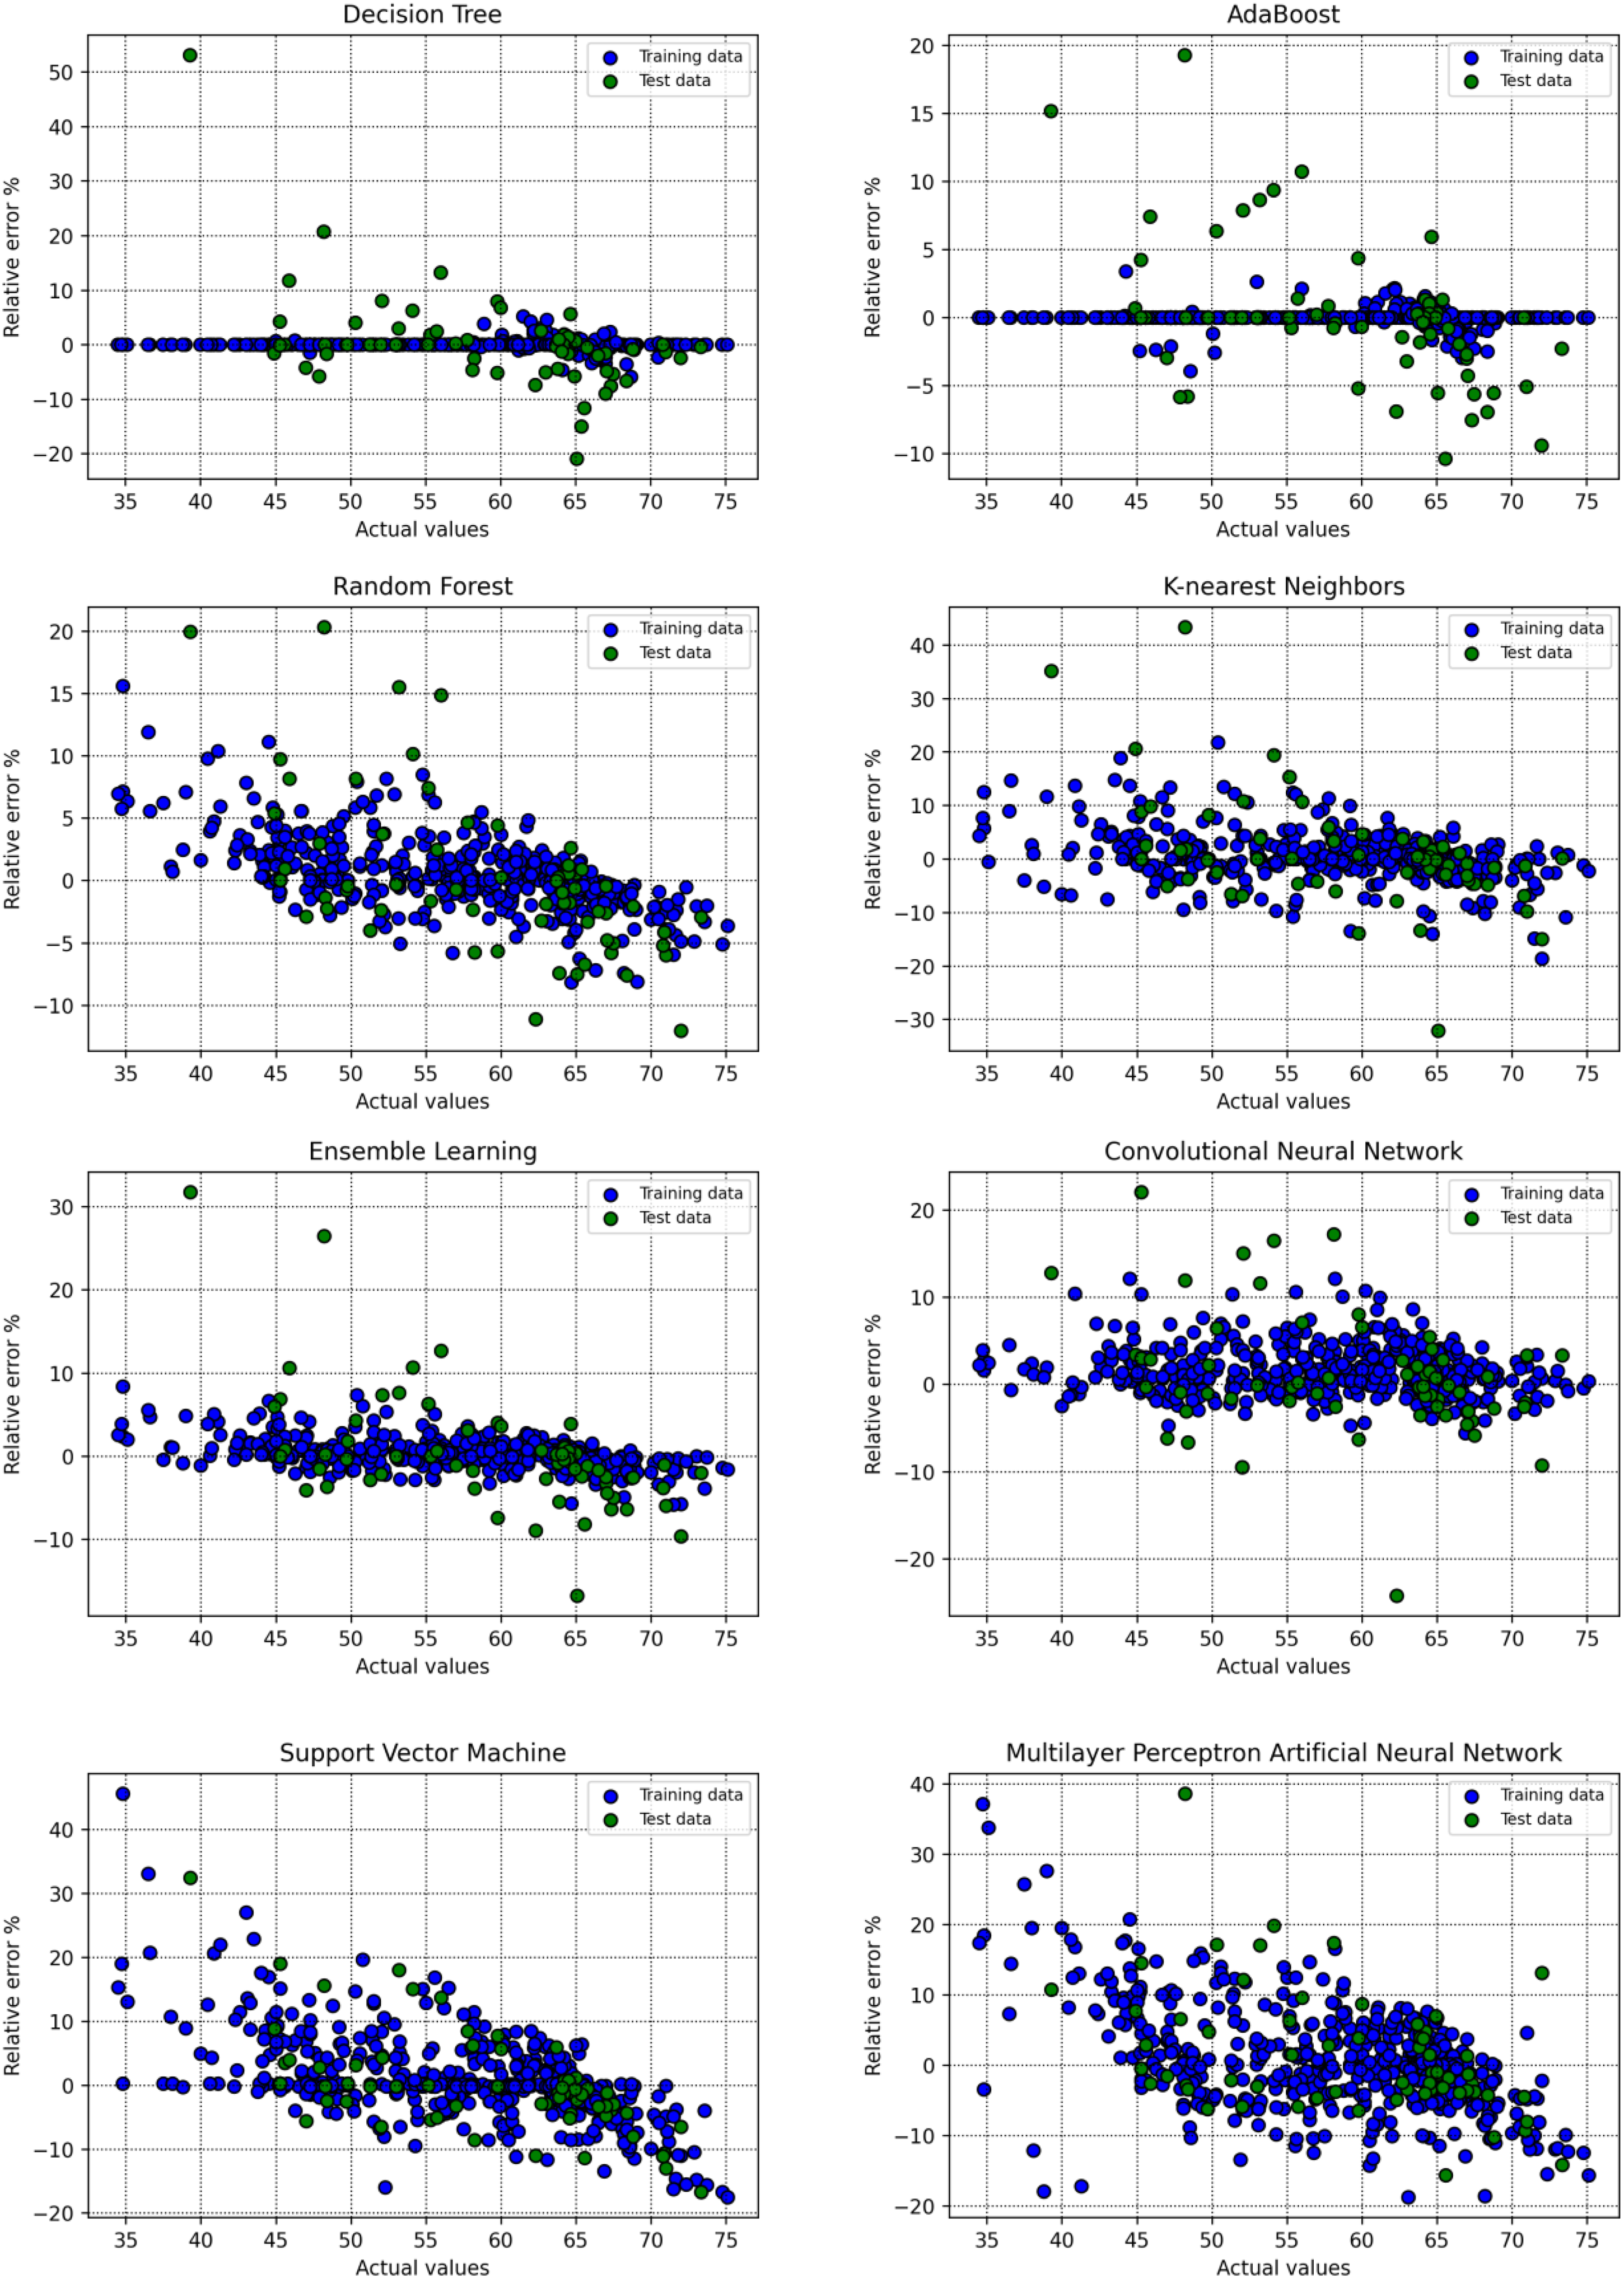
Relative error percent versus actual points regarding the train and test samples for all the developed models.
Figure 17 presents scatter plots of the relative errors, which reveal that the error distribution for the random forest model is tightly centered around the x-axis, reinforcing its high accuracy. These visualization techniques also confirm a strong agreement between the real CSR values and the predictions generated by the AdaBoost model. However, as clearly demonstrated in Figures 16 and 17, both the decision tree and AdaBoost models exhibit signs of overfitting during the training phase. This overfitting provides a compelling reason to exclude them as reliable approaches for CSR prediction.
Sensitivity analysis and relevance study
Understanding which input features are important is crucial for knowing how they affect predictions in machine learning. In the current study, we used the SHAP to discover the complex relations between our input features and their individual importance. As a robust framework grounded in game-theoretic principles, SHAP provides a transparent and interpretable assessment of how individual features contribute to a model's predictions. Figure 18 illustrates a ranked list of input parameters based on their influence on CSR predictions, displayed in the descending order of significance. The analysis reveals that the volatile matter content (%) is the most critical factor affecting CSR.
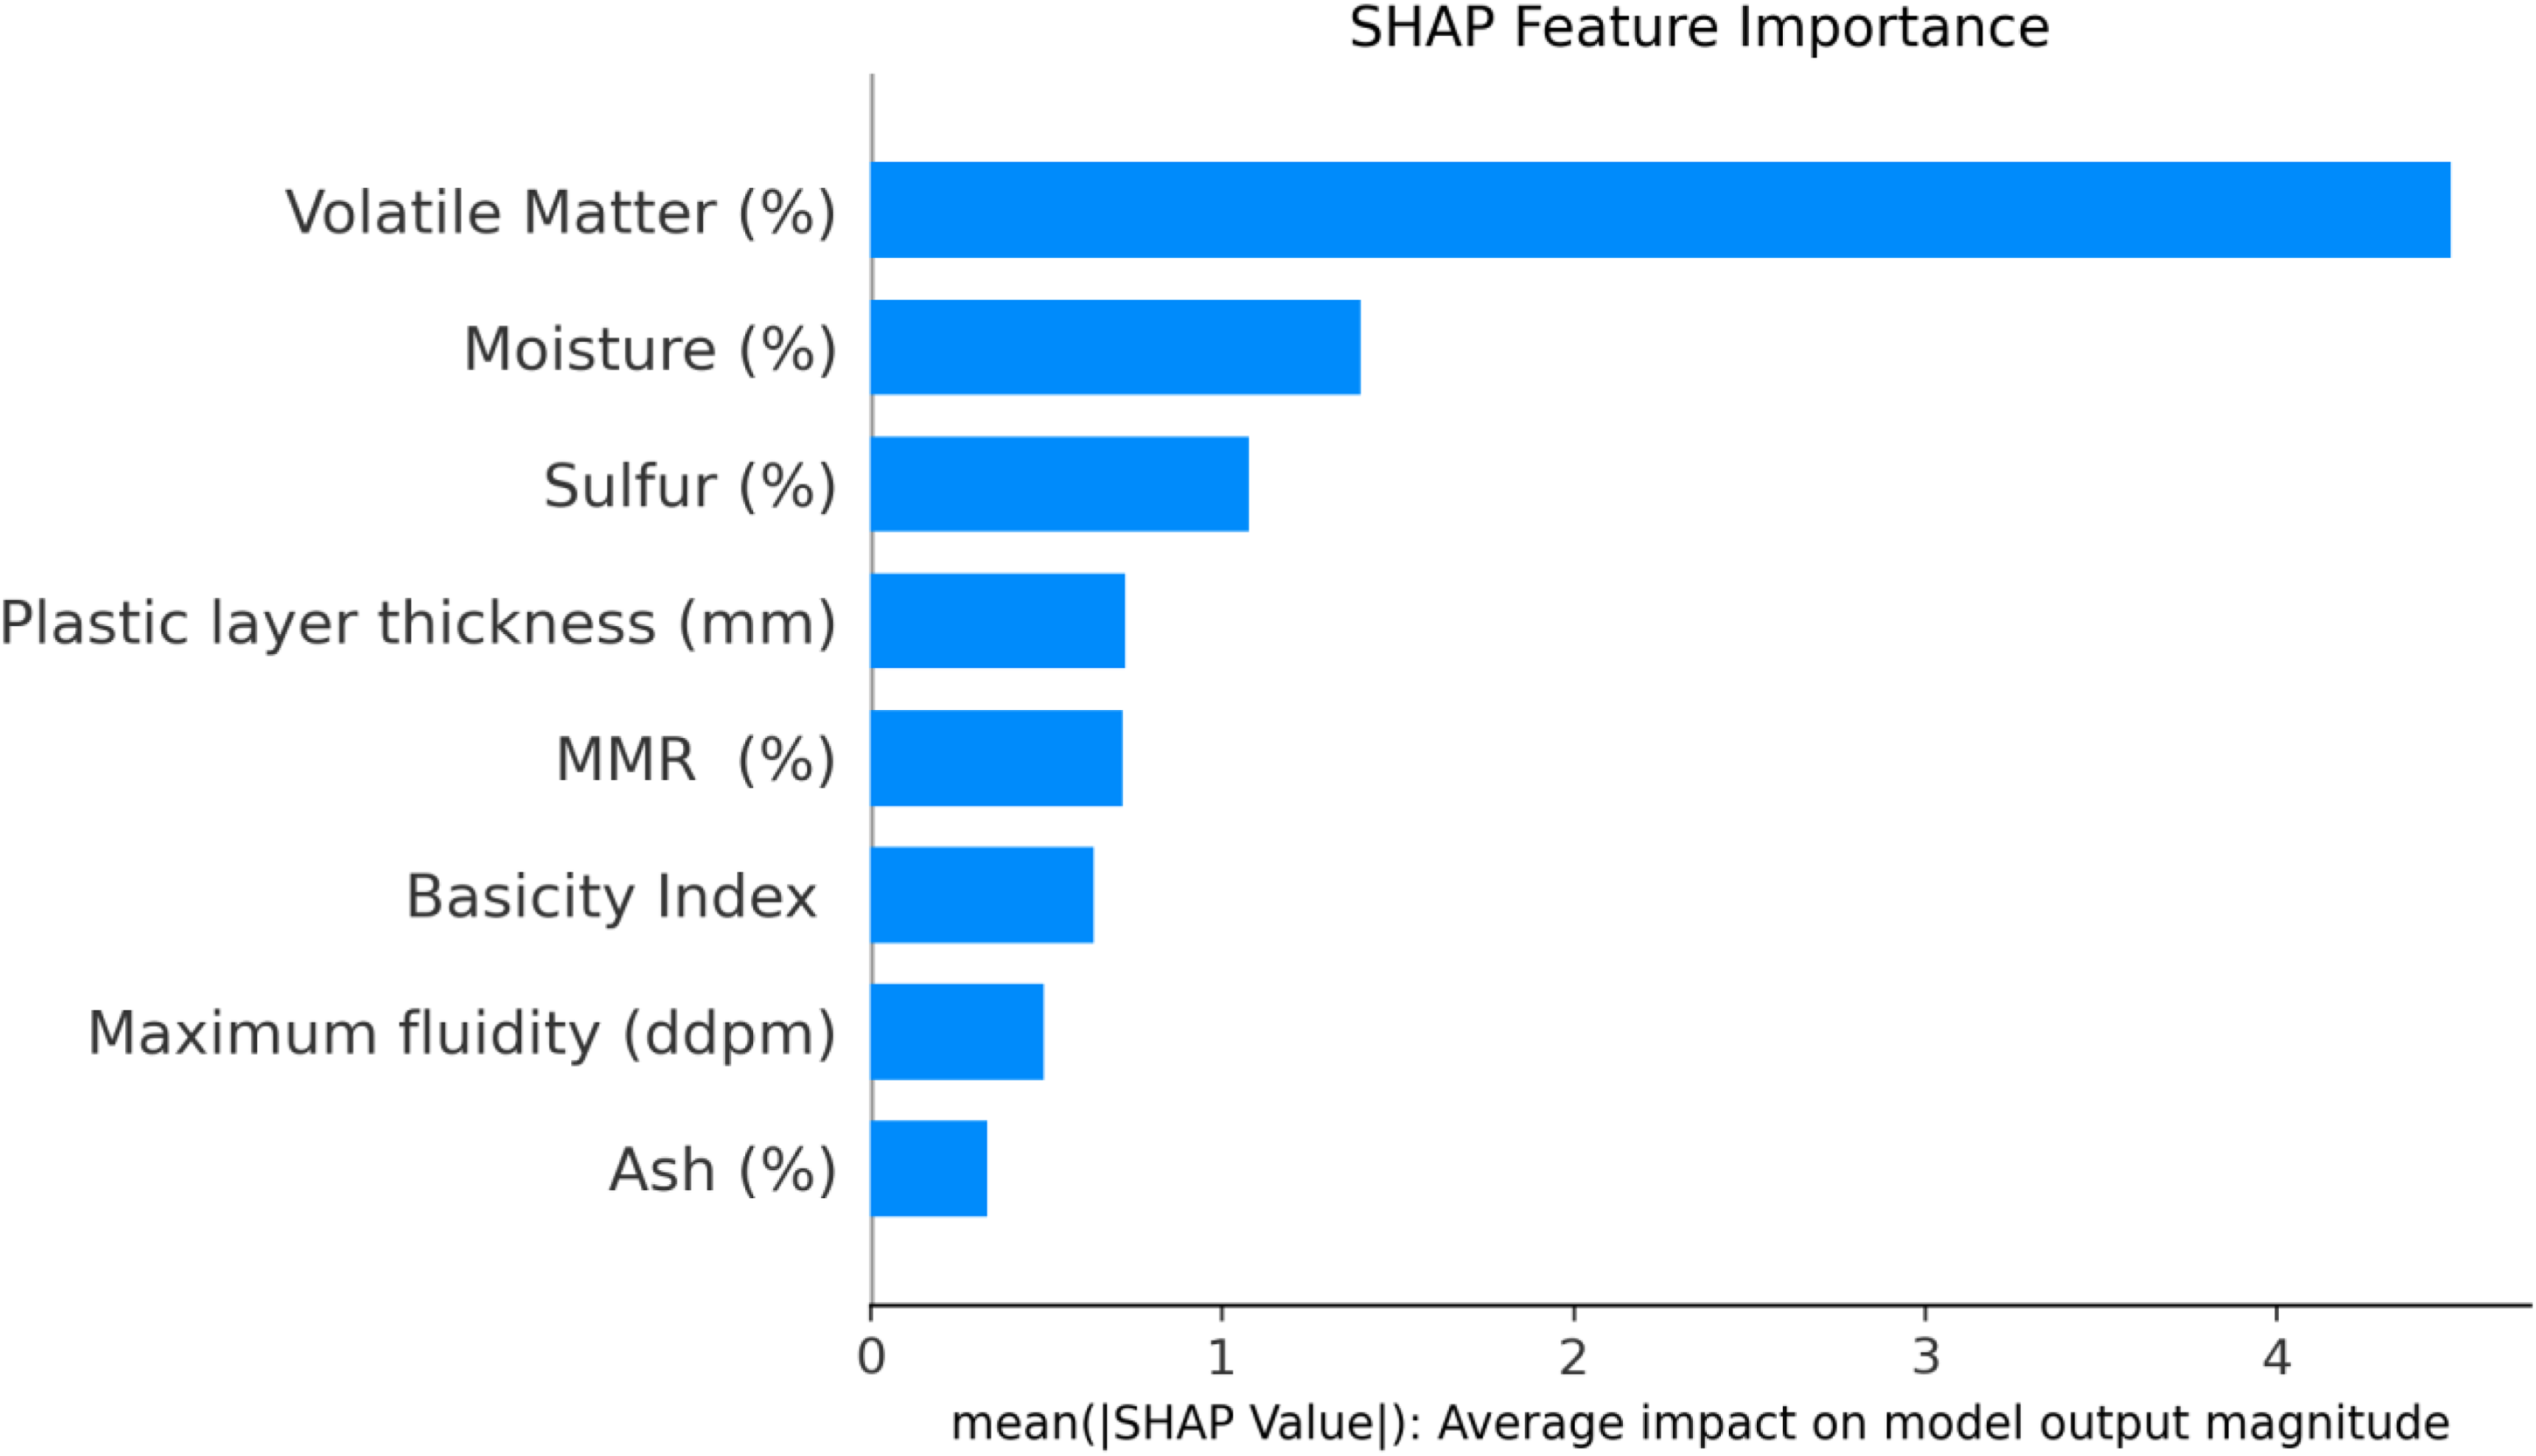
Ranked feature importance determined using SHAP. SHAP: Shapley additive explanations.
The SHAP feature contribution graph, presented in Figure 19, offers a detailed visualization of the effect of each input variable on the model's results. This graph employs a color gradient to represent feature values, where red dots correspond to higher values and blue dots to lower ones. For volatile matter content (%), the dominance of red points on the negative side of the plot suggests its adverse impact on CSR, confirming its role as the most influential determinant. Furthermore, elevated values of sulfur content (%) and the basicity index are similarly associated with a negative effect on CSR. In contrast, higher values of features such as moisture, plastic layer thickness, MMR, and maximum fluidity exhibit a positive correlation with CSR. These findings align with observations previously reported in the literature.
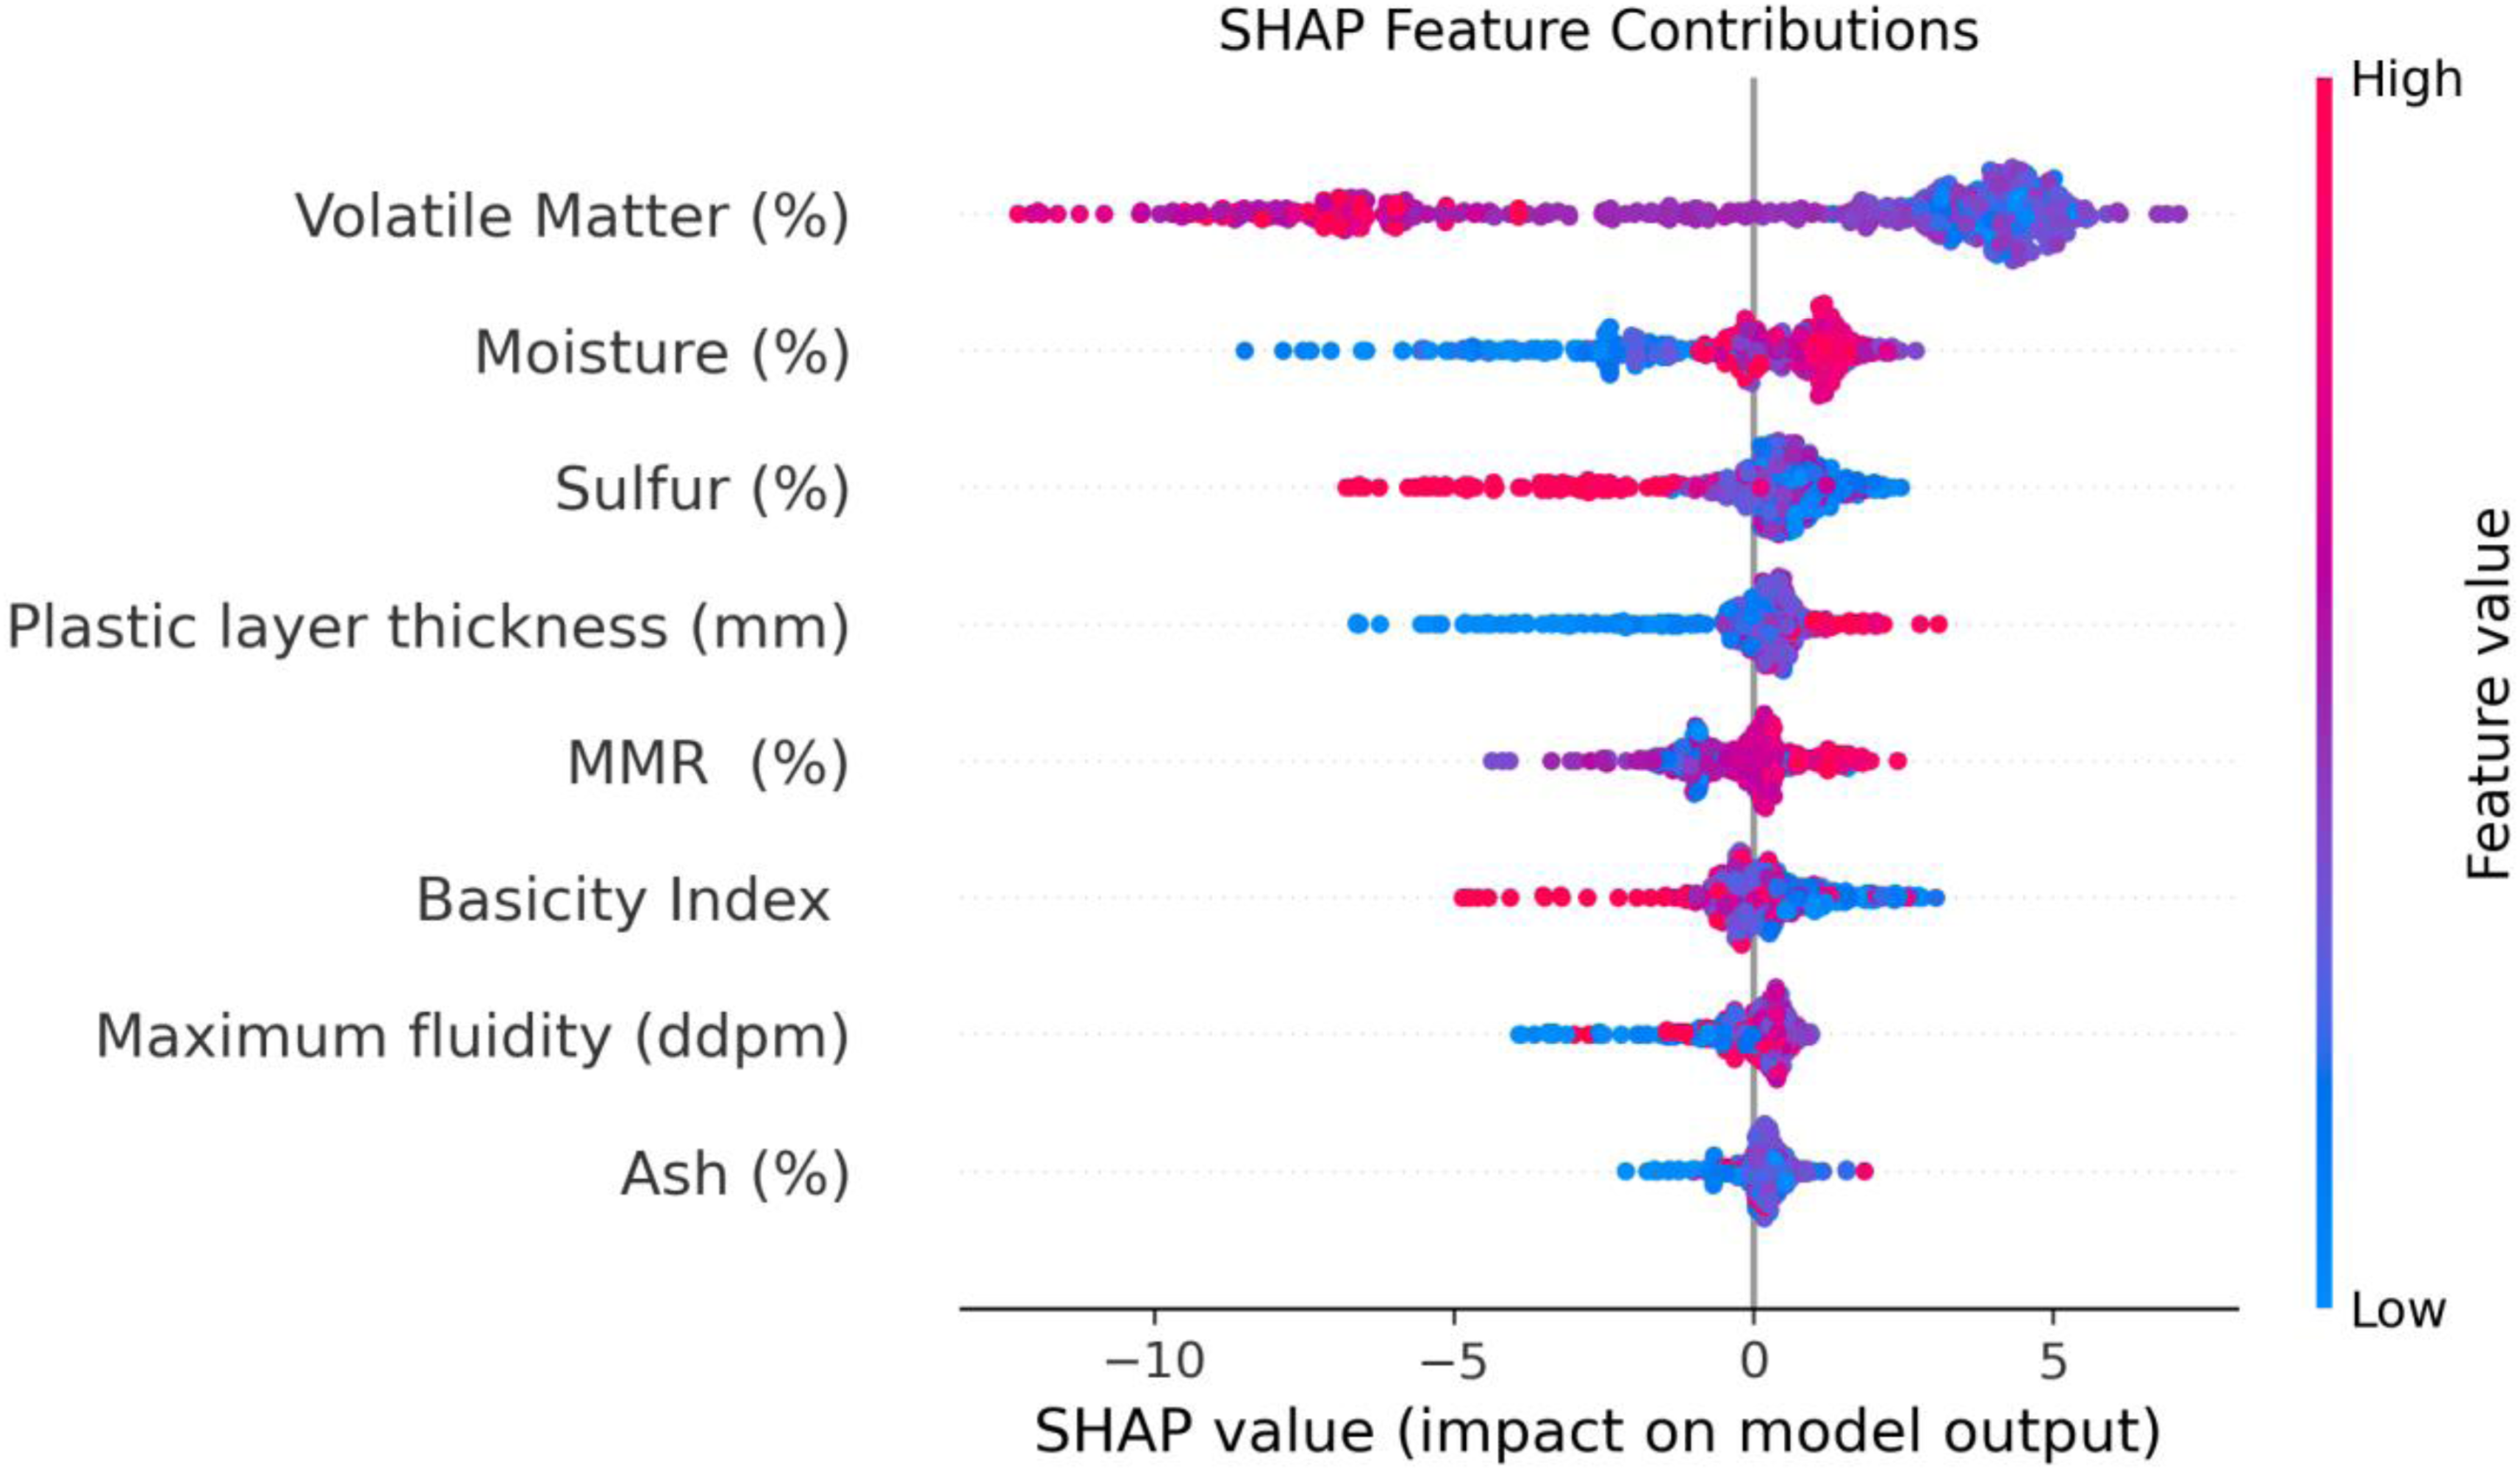
SHAP feature contributions graph. SHAP: Shapley additive explanations.
Discussion
This study successfully developed and evaluated a robust machine-learning pipeline for predicting CSR, a critical parameter in the metallurgical industry. This section discusses the key findings, explores their practical implications, acknowledges the study's restrictions, and outlines directions for future study.
Interpretation of results
Our comprehensive evaluation demonstrated that machine-learning models, particularly random forests, can accurately predict CSR based on a diverse set of coal properties. The random forest model consistently outperformed other implemented algorithms (decision tree, AdaBoost, CNN, SVR, MLP-ANN, and the general ensemble approach), achieving the highest R2 values and lowest error rates (MSE, AARE%). This superior performance can be attributed to random forest's inherent power to handle complex nonlinear relationships, its robustness to overfitting through ensemble averaging, and its capacity to manage high-dimensional data effectively.
The MCOD technique proved instrumental in enhancing model reliability, as evidenced by our ablation study. Removing outliers led to a significant improvement in predictive accuracy, underscoring the importance of rigorous data integrity assessment in real-world industrial datasets.
Furthermore, the SHAP analysis provided critical insights into the feature importance. Volatile matter was consistently identified as having a predominantly negative correlation with CSR, suggesting that higher volatile content tends to result in weaker coke. Conversely, MMR and moisture content exhibited positive correlations, indicating their contribution to improved coke strength. These findings align with metallurgical principles, where coal rank (reflected by MMR) and controlled moisture levels can influence coking behavior and final coke quality.
Practical implications and industrial relevance
The accurate prediction of CSR is paramount for optimizing coal blend selection and coking process parameters in steel and iron production. The robust predictive model developed in this study offers several practical implications for coke plants:
Optimized coal blending: By accurately predicting CSR from coal properties, plant operators can refine coal blends, ensuring optimal coke quality while potentially reducing raw material costs. Process control: The model can serve as an early warning system, allowing for proactive adjustments in the coking process to maintain the desired CSR levels, thereby preventing costly quality deviations. Resource efficiency: Enhanced prediction capabilities can lead to more efficient utilization of coal resources, minimizing waste and improving overall productivity. Decision support: The interpretability offered by SHAP analysis provides domain experts with clear, actionable insights into how specific coal characteristics influence coke strength, aiding in informed decision-making.
This data-driven approach contributes significantly to achieving greater efficiency and cost-effectiveness in metallurgical operations.
Limitations of the study
While this study presents a robust framework for CSR prediction, certain limitations should be acknowledged:
Dataset scope: The dataset, while comprising 630 diverse coal samples, originates from a specific coke plant. Although efforts were made to ensure diversity, the model's generalizability might benefit from validation on datasets from multiple different plants with varying operational conditions and coal sources. Input variable exclusivity: The model was developed using eight specific input variables. Other potentially influential factors, such as coking conditions (e.g. heating rate, carbonization time, oven type), or more detailed petrographic analyses of coal, were not included in this study due to data unavailability. Their inclusion could further enhance predictive accuracy and model robustness. Static model: The current model is static, trained on historical data. Real-time operational data streams and dynamic process changes are not directly incorporated into the model's training loop. Focus on CSR: While CSR is a critical index, CRI is equally important. This study focused solely on CSR prediction, and a combined or sequential prediction of both indices could offer a more holistic quality assessment.
Future work
Building on the success of this research, future work could explore several promising avenues:
External validation: Validate the developed models, particularly the random forest model, on independent datasets from different coke plants to rigorously assess their generalizability and robustness across varied operational environments. Integration of process parameters: Expand the input feature set to include critical coking process parameters (e.g. heating rates, blend charge densities) to develop a more comprehensive predictive model that accounts for both coal properties and operational conditions. Multi-output prediction: Extend the current framework to simultaneously predict both CSR and CRI, providing a more complete assessment of coke quality. Real-time prediction system: Develop a dynamic, real-time prediction system that can continuously monitor coal properties and coking parameters, providing live CSR predictions and facilitating immediate process adjustments. Advanced ensemble techniques: Investigate more sophisticated ensemble learning or deep-learning architectures (e.g. transformers for sequential process data) that might capture even more intricate relationships within the coking process data. Uncertainty quantification: Incorporate methods for quantifying the uncertainty of predictions, which is valuable for decision-making in industrial settings.
Conclusions
This study provides an innovative and comprehensive methodology for predicting CSR using advanced data analysis and novel machine-learning methods. The implementation of MCOD demonstrated the effectiveness of ensuring dataset reliability, which significantly enhanced the models’ predictive capabilities. Among the tested algorithms, random forest achieved the best performance in terms of predictive accuracy, evidenced by its high R2 and minimal errors across training and testing datasets. SHAP analysis further elucidated the influence of input variables like volatile matter, moisture content, and MMR on CSR, offering actionable insights into improving coking processes. Importantly, the findings validate the importance of employing robust data preprocessing, feature evaluation, and ensemble machine-learning methods for tackling complex prediction tasks. This work lays a foundation for scaling data-driven approaches to other metallurgical applications and reinforces the role of machine learning in process optimization across the steel industry.
Beyond these specific technical advancements, a crucial area for future work involves continuously refining the data acquisition and feature engineering processes. As real-world operational conditions and raw material characteristics evolve, ensuring the quality, consistency, and representativeness of incoming data will be paramount for sustained model performance. Further research could explore advanced methods for feature extraction from raw plant sensor data, integrate more nuanced domain-specific knowledge into feature selection, or investigate transfer learning approaches to adapt models rapidly to new operational settings or different coke plants. This iterative refinement of data and features is essential for maintaining the models’ predictive power and ensuring their long-term applicability in dynamic industrial environments.
Footnotes
Funding
The authors disclosed receipt of the following financial support for the research, authorship, and/or publication of this article: 2024 Jiangsu Provincial Educational Science Planning Project (Grant No. B-b/2024/02/33); Soft Science Research Project of Jiangsu Provincial Department of Agriculture and Rural Affairs (Grant No. 24ASS074); and Yangzhou City Social Science Key Project (Grant No. 2024YZD-029).
Declaration of conflicting interests
The authors declared no potential conflicts of interest with respect to the research, authorship, and/or publication of this article.
Data availability statement
Data is accessible on request from the corresponding authors.