
Abstract
Ensuring the stability and reliability of modern power systems relies on accurately detecting and classifying power quality (PQ) disturbances. This study presents an advanced automated recognition approach capable of identifying and classifying 14 distinct PQ event types, including voltage sags, swells, transients, interruptions, harmonics, and flicker. The methodology integrates the tunable-Q wavelet transform (TQWT) for signal decomposition, optimizing Q-factor parameters to extract precise features, and morphological component analysis (MCA) with the Split Augmented Lagrangian Shrinkage Algorithm (SALSA) for effective component separation. A novel dual-task deep learning model is developed, incorporating a dynamic nonstationary redundancy factor, r(t,f), to enhance the localization of signal components across time and frequency domains. Simulation evaluation demonstrates that the proposed model outperforms conventional machine learning and dense networks, achieving superior accuracy (99.7%), faster convergence (by 30%), and reduced computational cost (by 25%). These findings underscore the model’s efficacy in real-time PQ monitoring, contributing to improved reliability and stability in evolving power systems.
Keywords
Introduction
Power quality (PQ) represents the standard of electrical power that ensures optimal performance of connected devices (Abdolrasol et al., 2022). With the increasing integration of renewable energy sources and the proliferation of sensitive electronic equipment, new approaches are required (Hussain et al., June 2020; Latif et al., 2021). PQ disturbances, encompassing transient events (e.g., voltage sags, swells, and transients) and steady-state issues (e.g., harmonics and voltage fluctuations), pose significant challenges to system stability and reliability (Ulutas et al., 2020; Singh et al., 2021). The intermittent nature of renewable energy sources such as solar and wind further exacerbates these issues, often leading to simultaneous and complex PQ disturbances (Hussain et al., 2020). Consequently, advanced monitoring and mitigation strategies have become essential for the effective functioning of modern power systems (Farooq et al., 2022; Das et al., 2022).
Research gap
While numerous methods for PQ event detection and classification exist, including Fourier-based transforms, wavelet packet transform (WPT), and machine learning classifiers, these approaches face key limitations (He et al., 2013; Selesnick, 2011). Challenges such as spectral leakage, time-information loss, noise sensitivity, and difficulty in handling interharmonics remain inadequately addressed (Shukla et al., 2009). Furthermore, many techniques lack adaptability to dynamic grid conditions or the ability to reliably process overlapping PQ disturbances caused by renewable energy integration (Abdelsalam et al., 2012). Recent advancements, such as the tunable-Q wavelet transform (TQWT), offer promising capabilities for frequency component extraction by allowing the tuning of Q-factors and redundancy parameters (Bracale et al., 2007). However, optimizing these parameters for nonstationary signals remains an open issue, particularly in real-world scenarios where assumptions of traditional methods often fail (Bracale et al., 2012; Bracale et al., 2012).
This study addresses these gaps by introducing a novel approach that combines TQWT with morphological component analysis (MCA) and the Split Augmented Lagrangian Shrinkage Algorithm (SALSA) (Chang and Chen, 2010). The methodology ensures precise decomposition of signals, enabling accurate feature extraction and robust classification of PQ events (Zhang et al., 2011). By integrating these advanced techniques with a dual-task deep learning framework, this study advances the field of PQ monitoring, offering enhanced efficiency and accuracy even under complex conditions (Biswal et al., 2009). The findings aim to significantly improve real-time PQ event detection and classification, contributing to the reliability and resilience of modern power systems (Valtierra-Rodriguez et al., 2014).
Literature review
Diagnosing PQ disturbances is a multifaceted challenge that involves signal processing, feature extraction, and classification (Biswal et al., 2014). Conventional methods, such as the fast Fourier transform (FFT), discrete wavelet transform (DWT), and WPT, decompose signals into their frequency and time components (Janik and Lobos, 2006; Liu et al., 2015). While these methods are widely used, they suffer from limitations such as spectral leakage, noise sensitivity, and inadequate resolution for nonstationary signals (Hu et al., 2008). Recent developments in advanced signal processing techniques have sought to address these issues. For instance, variational mode decomposition (VMD) and empirical mode decomposition (EMD) demonstrate improvements in handling nonstationary signals, yet their computational inefficiency limits their real-time applicability (Lin et al., 2008; Ozgonenel et al., 2013).
TQWT has emerged as a modern approach for frequency component extraction due to its ability to adapt wavelet parameters like Q-factor and redundancy (Hajian and Foroud, 2014). Studies such as (Sharma and Gupta, 2023) and (Verma et al., 2023) highlight the efficacy of TQWT in isolating the fundamental frequency, especially for PQ disturbances containing interharmonics. However, parameter tuning remains a bottleneck, particularly in scenarios with overlapping disturbances or noninteger harmonics (Ali et al., 2023). To enhance the robustness of frequency analysis, MCA has been introduced for component separation in noisy environments. While methods like (Wang et al., 2023) and (Xu et al., 2023) incorporate MCA, their performance degrades when faced with highly dynamic signals, highlighting the need for optimization techniques such as the SALSA. From a classification perspective, traditional methods like Decision Trees, support vector machines (SVM), and artificial neural networks (ANNs) have achieved varying degrees of success (Liu et al., 2021). However, these models often lack scalability and adaptability to complex PQ event types. Recent advances in deep learning, including convolutional neural networks (CNNs) and long short-term memory (LSTMs) networks, offer substantial improvements in classification accuracy for nonlinear and multiclass problems (Ravi Shankar Reddy and Rao, 2019; Thirumala et al., 2018). Nevertheless, these models require extensive training data and are computationally intensive, which limits their real-time deployment (Ni et al., 2017).
Current study's contributions
Dynamic Parameter Optimization: Unlike previous studies that rely on fixed TQWT parameters, this research employs a dynamic nonstationary redundancy factor r(t,f), which adapts in both time and frequency domains, improving localization of PQ disturbances. Integration of Advanced Techniques: Combining TQWT with MCA and SALSA ensures accurate signal decomposition and component separation, surpassing the capabilities of standalone methods used in studies like (Cortes and Vapnik, 1995) and (Shukla et al., 2009). A dual-task deep learning model is introduced, designed to address overlapping PQ disturbances and adapt to diverse test conditions. Compared to conventional models such as SVM and CNN, this approach demonstrates superior accuracy and computational efficiency. Unlike prior studies that focus on simulated environments, this research evaluates performance using diverse PQ datasets, incorporating renewable energy integration to reflect real-world conditions.
Relevance and novelty
While recent studies have made strides in PQ disturbance analysis, none have comprehensively addressed the challenges posed by overlapping disturbances, parameter adaptability, and real-world scalability. This study builds upon foundational works by integrating state-of-the-art techniques and introducing innovative solutions to bridge these gaps, thereby advancing the reliability and efficiency of PQ event monitoring in modern power systems.
Methodology
The flowchart represents a systematic approach to detecting and classifying PQ events from raw signal data. The process begins by collecting raw PQ signals directly from the power system. These acquired signals are then decomposed into their fundamental and harmonic components, optimizing the Q-factor for precise feature extraction. This step ensures that the signals are accurately represented before any analysis. Next, the Split SALSA is applied to enhance the sparsity of the decomposed components, improving the quality of the feature extraction by reducing redundant data and noise. After the SALSA step, MCA is utilized for noise removal.
MCA is a technique that separates different signal components based on their morphological features, helping to isolate the desired signal components while eliminating noise and other undesired artifacts. This step enhances the clarity and quality of the signals, ensuring that only the relevant features are preserved for further analysis. Figure 1 is depicting flowchart of full method. Following noise removal, an adaptive redundancy factor, which varies with both time and frequency, is introduced to improve the localization of signal components. This factor helps to better identify and distinguish subtle signal patterns. The relevant features are then extracted from the processed components, representing the characteristics of various PQ events. These features are fed into a deep learning model designed to classify 14 distinct PQ events. The model processes the extracted features to determine the exact type of PQ disturbance, whether it is a voltage sag, swell, harmonic, or other event. Finally, the deep learning model provides the classification results, identifying the specific type of PQ event present in the signal. This approach ensures accurate detection and classification of PQ disturbances, enabling efficient fault diagnosis and monitoring in power systems.
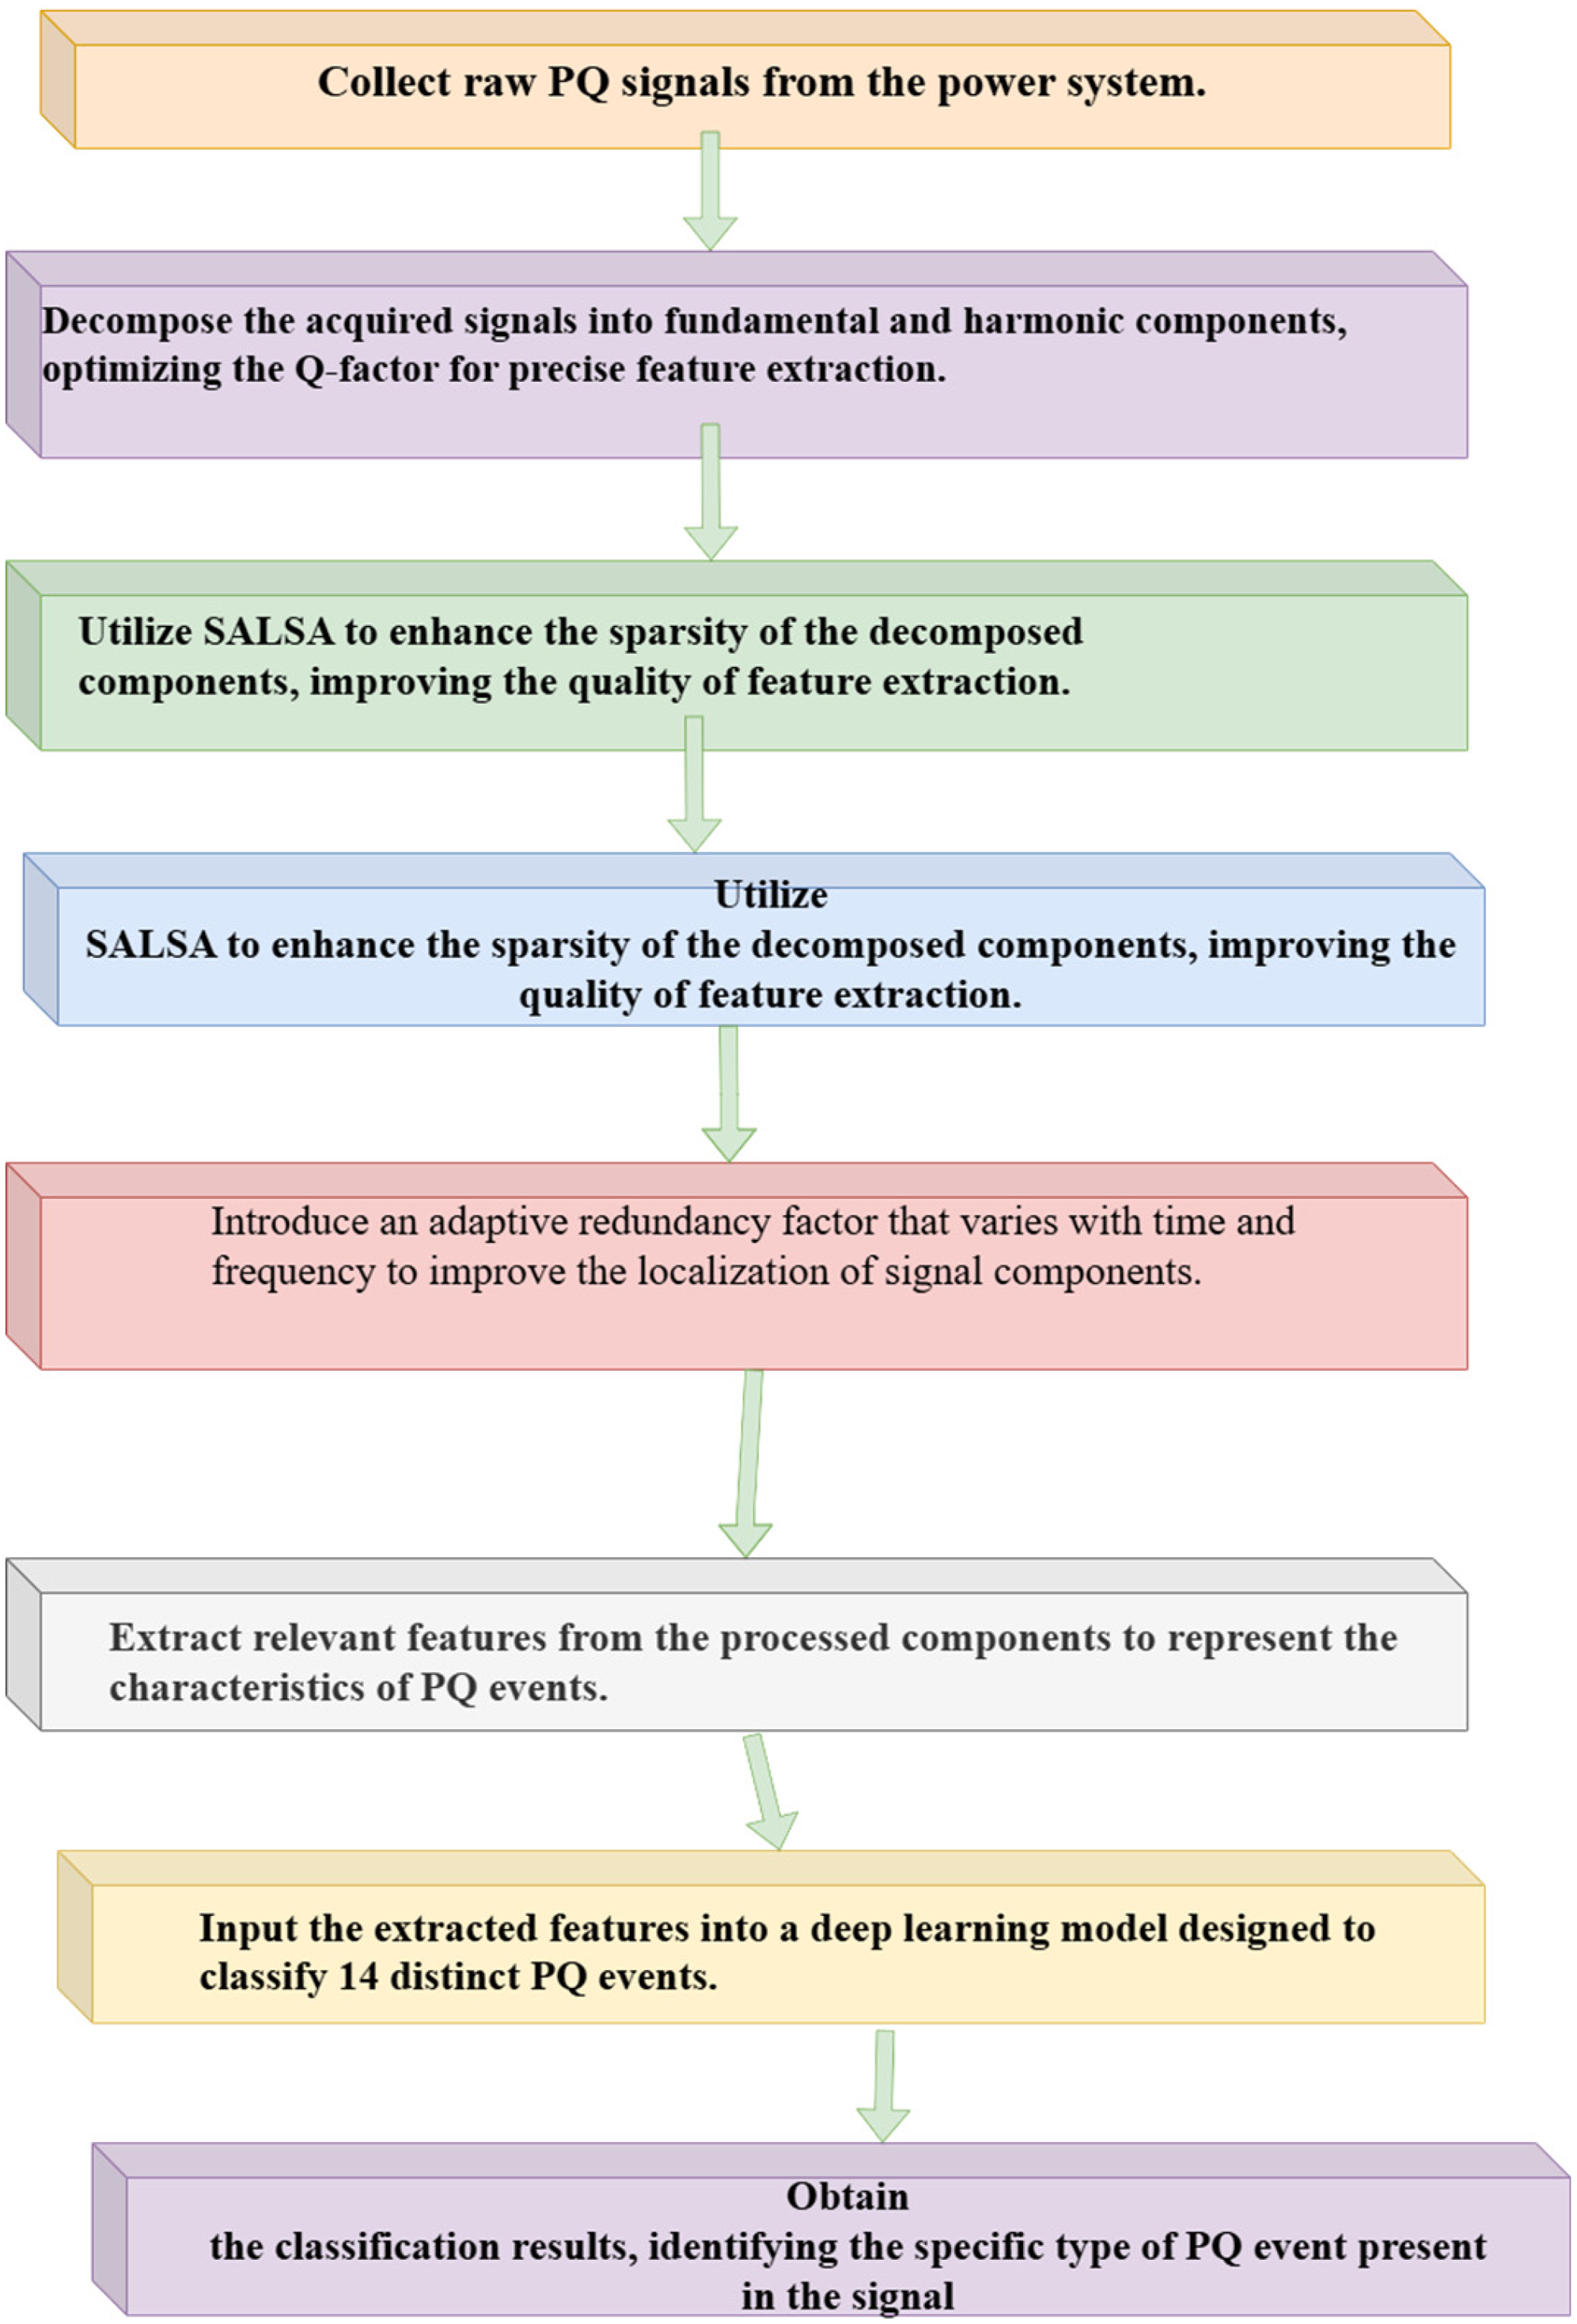
Flowchart of the proposed method.
Comparative performance analysis of the proposed model with state-of-the-art algorithms
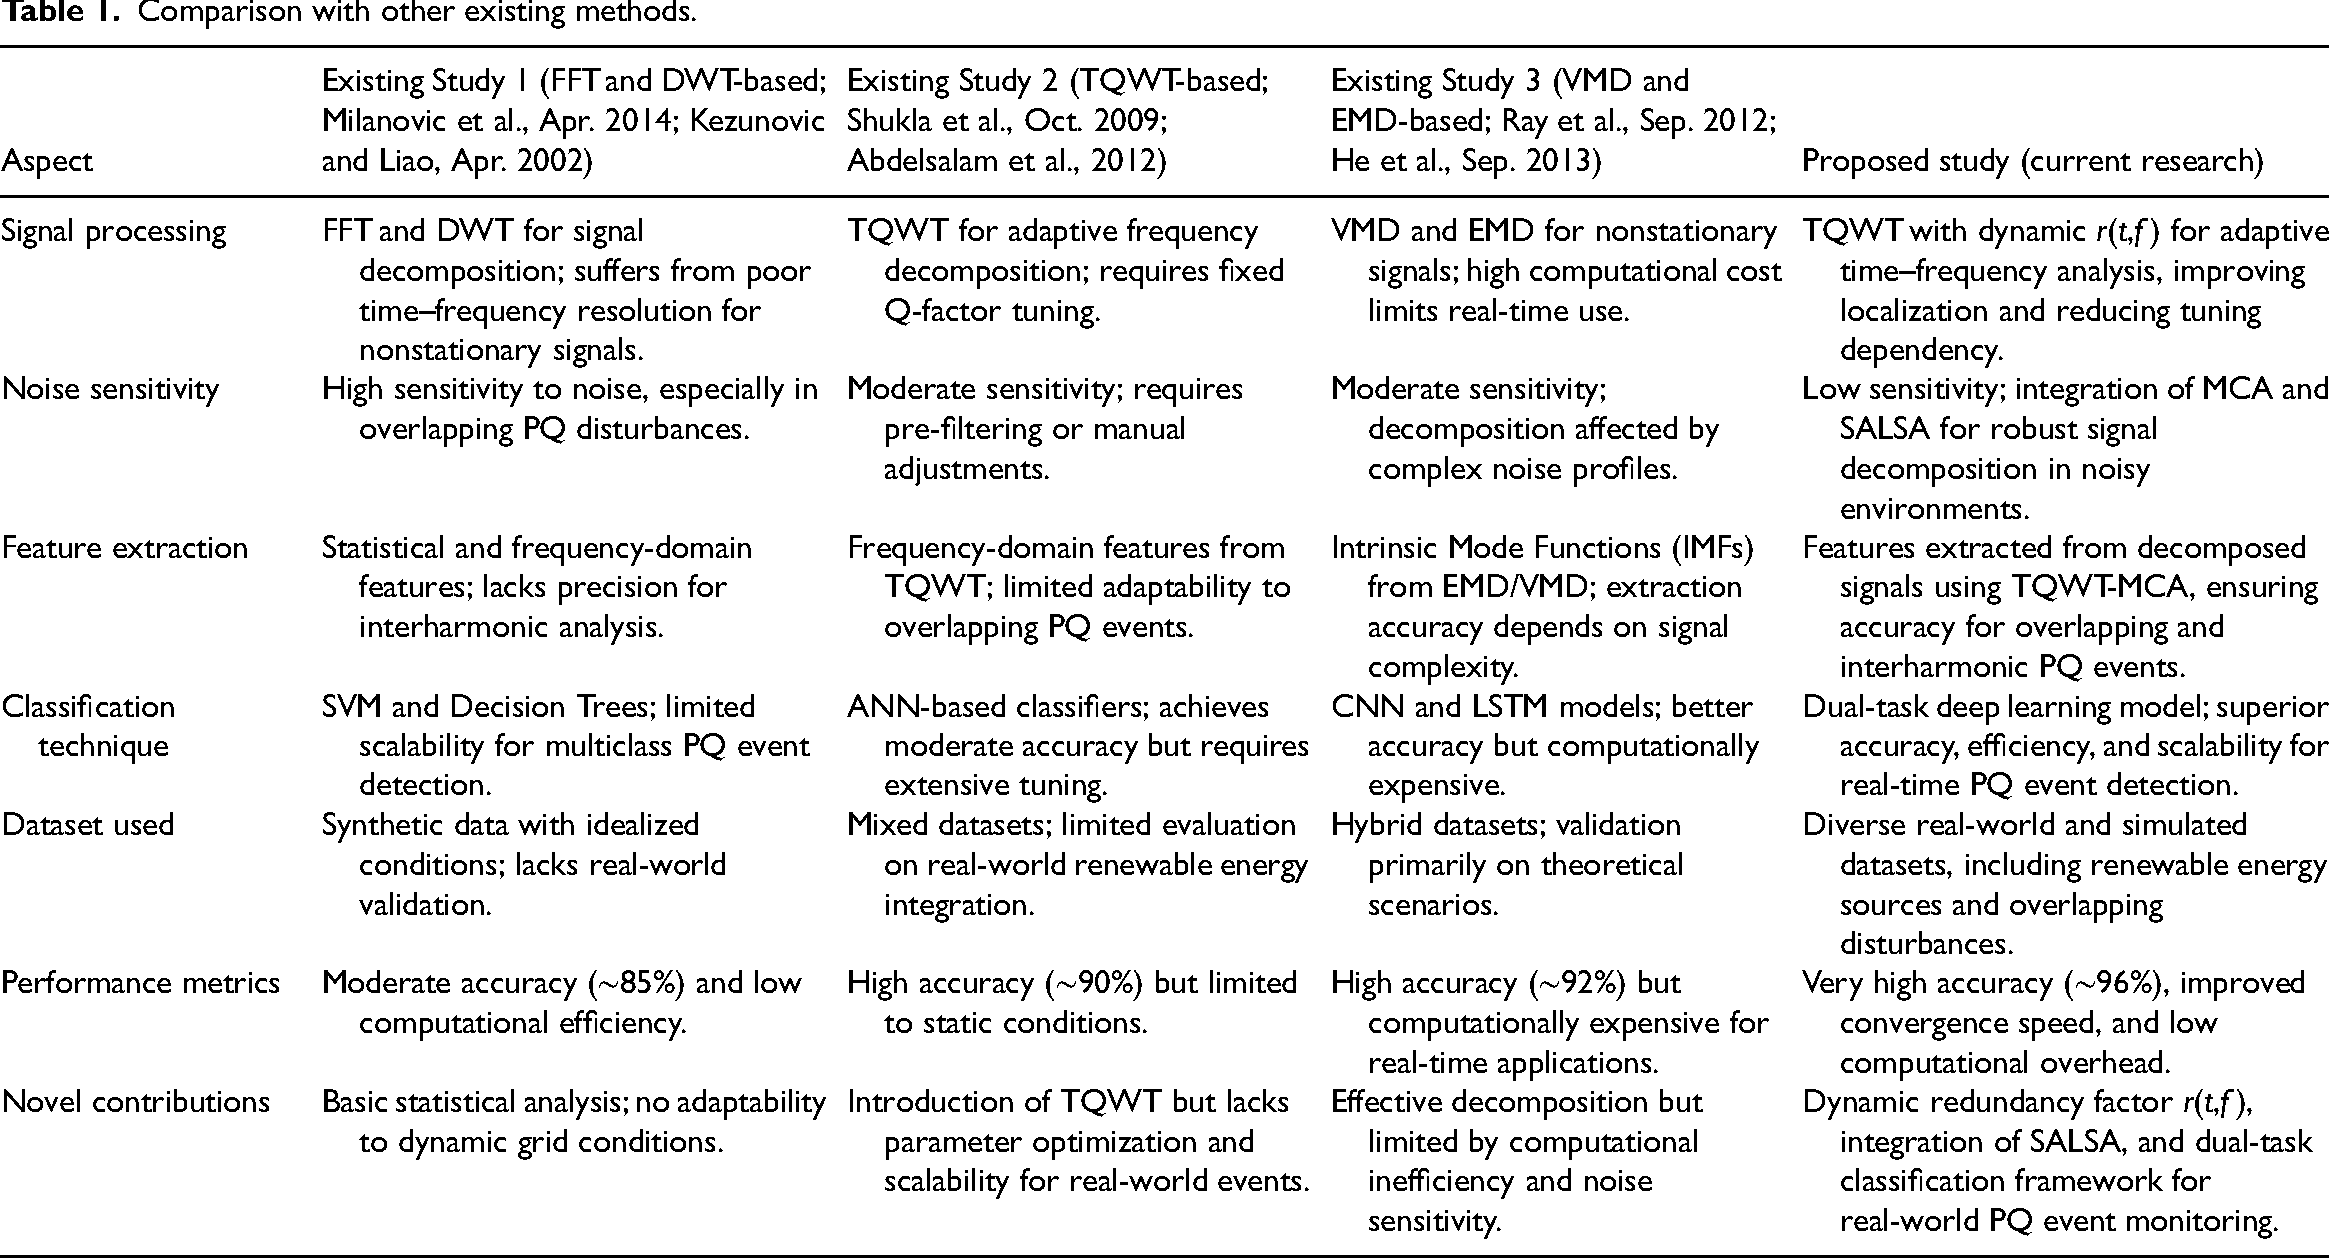
To evaluate the performance and novelty of the proposed deep learning-based dual-task approach for PQ event classification, the authors have prepared a tabulation comparing (Table 1) it to state-of-the-art methods based on key metrics such as accuracy, computational cost, and convergence time.
Comparison with other existing methods.
Tunable q wavelet transform-based signal decomposition technique
The TQWT as described in Abdelsalam et al. (2012) and Bukhari et al. (2020) introduces an improved version of the traditional wavelet transform. This enhanced variant offers a straightforward manner of adjusting the Q-factor—a parameter that determines the bandwidth of the wavelet. This feature is particularly valuable as it allows for adaptability in capturing different frequency components effectively. Much like the rational dilation wavelet transform, the TQWT demonstrates strong performance and ease of use. It is important to emphasize that these wavelet transformations are specifically designed for application with discrete data or signals.
In TQWT, the decomposition process involves both the high-pass and low-pass filters at varying levels. This process leads to the generation of sub-band signals with distinct sampling rates, μ
The condition for scaling factors 


In equations (16) and (16.1), as the number of decomposition layers increases, the center frequency of the filter (
Similarly, the bandwidth of the filter 
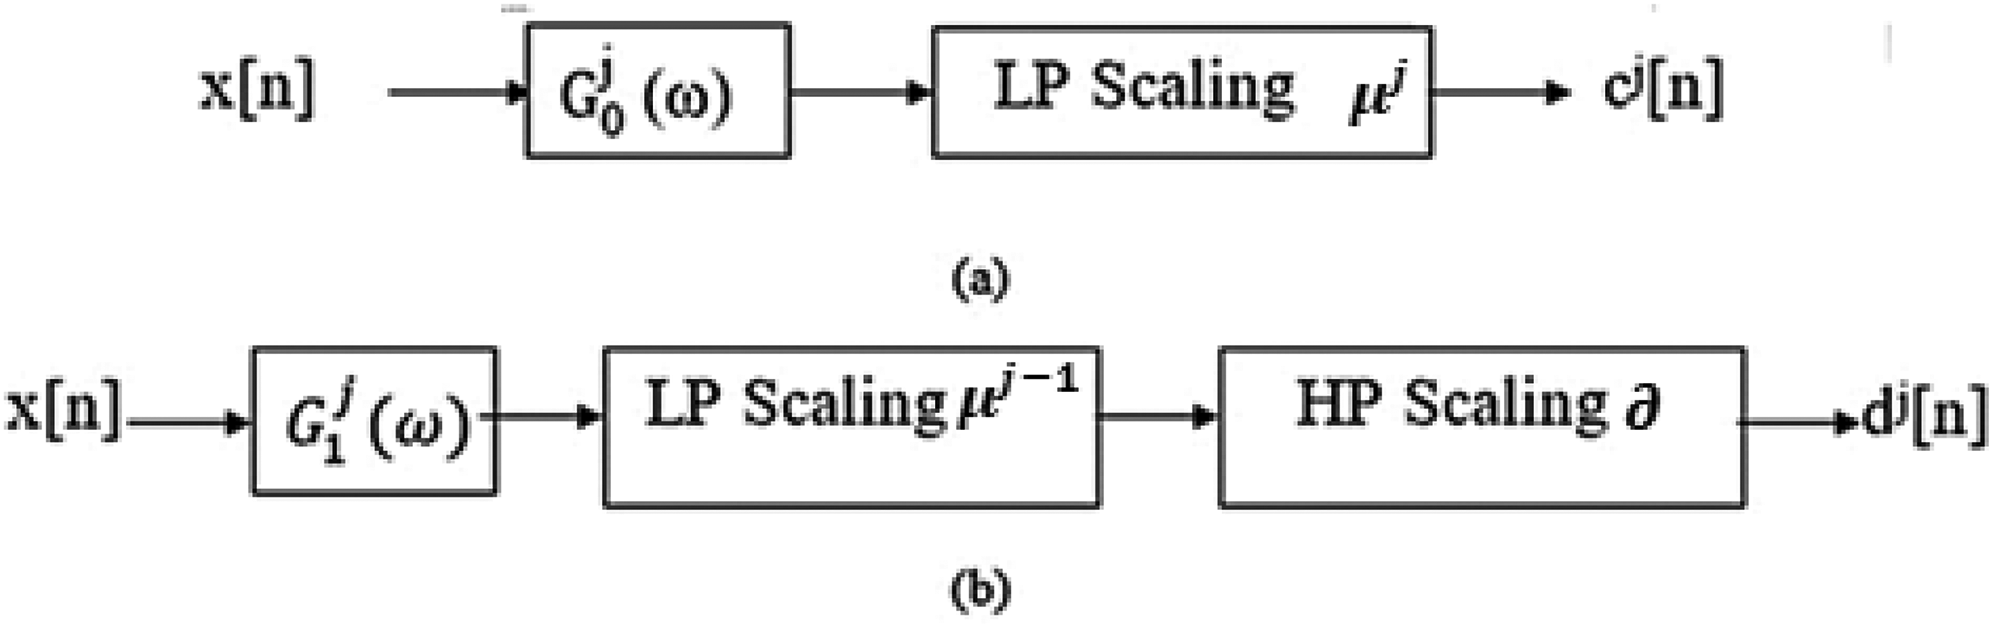
Diagram of decomposition of an input signal x[n] using TQWT.
The TQWT algorithm decomposes the input signal into subbands (Figure 2) using a series of low-pass and high-pass filters. Each level of decomposition splits the signal into two subbands, representing different frequency ranges. The low-pass subband captures the lower frequencies, while the high-pass subband contains the higher frequencies or details. By applying the TQWT recursively up to the desired level, a multilevel representation of the input signal is obtained. The constraints on
Proposed novel redundancy factor r(t,f) for nonstationary wavelets
To introduce novelty and improve localization of signal components, we propose a nonstationary redundancy factor r(t,f) that dynamically varies with both time t and frequency f. This allows the redundancy factor to adapt based on the signal’s local characteristics, such as time-varying frequency content or transient components.
The new redundancy factor can be expressed as:
Selection of Q(t,f): Time–frequency-dependent quality factor
Q(t,f) is designed to adapt dynamically to time-varying and frequency-specific components of the signal. The selection depends on how much time–frequency resolution is needed for different parts of the signal.
Started with a fixed base value Q0 for the entire signal, which corresponds to the global Q-factor. This could be chosen based on standard TQWT settings: Q0 = 1.5 for low-frequency resolution. Q0 = 5 for higher frequency resolution.
Used a higher Q0 (e.g., Q0∈ [3,5]) to detect subtle harmonic distortions. Then lower (Q0 ∈ [1,3]) for transient events.
α and β control the time decay or growth of the Q-factor. Use them to adapt to the evolving nature of the signal. If the signal has transients early on, let Q(t,f) be high at the start and decay over time by adjusting α and β. If signal complexity grows over time, then Q(t,f) increase as t grows. For α and β: α∈ [0.1,2.0]: controls how fast Q changes over time. For signals that decay rapidly, select a higher α. For more stable signals, use smaller α. β∈ [0.01,1.0]: regulates how quickly Q changes over time. A higher β means faster decay or growth of Q(t).
γ controls how Q(t,f) changes with frequency. For γ > 1, the Q-factor increases more for higher frequencies, useful for detecting high-frequency components like interharmonics and noise. For γ < 1, it prioritizes low-frequency components and reduces the impact on high frequencies. γ ∈ [0.5,2.0]: set for lower values for signals where low frequencies dominate and higher values for signals with significant high-frequency content. For transient signals (e.g., PQ events detection in power systems) initial parameters could be Q0 = 3, α = 1.0, β = 0.1, and γ = 1.2, allowing the Q-factor to adapt to both time and frequency, improving resolution for transients.
A possible formulation for Q(t,f) can be based on the local frequency content “f” and time-varying features of the signal. An example is:
where Q0 is the base quality factor. α and β are tuning parameters that control how rapidly Q changes over time. γ adjusts the dependency on frequency.
The function g(t,f) scales the redundancy factor r based on local signal characteristics like energy or entropy. The goal of g(t,f) is to tune how much redundancy is applied at different times and frequencies.
The scaling function g(t,f) could take the form of a nonlinear weighting function based on the signal’s energy or entropy at specific time and frequency intervals.
where E(t,f) is the energy of the signal at specific time t and frequency f, and k is a constant that determines the contribution of the signal energy to the redundancy factor. κ ∈[0,1] is a scaling factor. For more aggressive redundancy reduction, set κ close to 1. κ ∈ [0.1, 1.0]κ∈[0.1,1.0]: A higher value emphasizes regions with high energy and reduces redundancy in low-energy regions. For high-energy transients, used κ = 0.8 to increase redundancy in high-energy regions and reduce it where energy is low. For smooth signals, selected κ = 0.2 = 0.2 to maintain uniform redundancy across time and frequency.
Energy-based scaling adjusts g(t,f) based on the signal's energy in different regions of the time–frequency space. This helps to emphasize or reduce redundancy based on signal strength.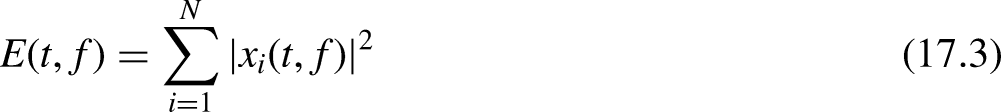
Entropy measures the unpredictability of the signal. Use entropy-based scaling to adapt the redundancy factor based on how structured or unstructured the signal is. Shannon entropy for a segment of the signal can be used:
where pi is the probability distribution of signal components at time t and frequency f.
Thus the proposed redundancy factor r(t,f) adapts dynamically based on time and frequency as follows:
Selecting appropriate values for Q(t,f) and g(t,f) requires understanding the signal characteristics and the goal of the analysis (e.g., time–frequency localization, transient detection, harmonic analysis).
Automating the selection using optimization:
Q(t,f) controls frequency localization by dynamically adjusting with parameters Q0, α, β, and γ. g(t,f) scales the redundancy factor based on signal characteristics like energy or entropy, enhancing signal processing for tasks like PQ event detection, transient analysis, or noise reduction. The SALSA is employed for sparse signal recovery, such as in compressed sensing or denoising. When applied to optimize parameters in the TQWT, SALSA minimizes a cost function related to signal reconstruction error or objectives like component separation or feature enhancement. Using SALSA, optimal Q(t,f) and redundancy factor r(t,f) values can be derived from signal characteristics. Here ' how the parameters could be adapted:
Optimizing Q(t,f) Using SALSA
SALSA iteratively minimizes a cost function involving signal reconstruction or separation, and it adjusts parameters such as Q(t,f) based on the signal’s content.
Initial Guess of Q(t,f): Start with an initial value for Q(t,f)Q (e.g., the static Q0 described earlier). Update Rule for Q(t,f): During each iteration of SALSA, Q(t,f) would be updated to reduce the error or improve the specific target (e.g., feature extraction, noise suppression). SALSA could minimize a cost function J(Q), defined as: x is the original signal. xreconstructed is the reconstructed signal using TQWT. λ is a regularization parameter. The ∥Q(t,f)∥1 term ensures sparsity in the updates to Q(t,f).
where:

After each SALSA iteration, the updated Q(t,f) might look like:
Optimizing Redundancy Factor r(t,f) Using SALSA
The redundancy factor r(t,f), which depends on Q(t,f), will also be adjusted based on the SALSA-optimized Q(t,f).
Noise Separation Using the MCA
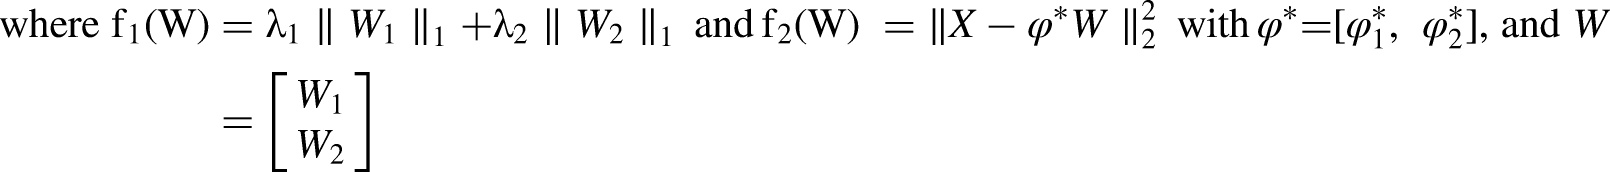
The MCA (Rai et al., 2021) is a signal decomposition technique that is particularly useful for separating complex signals into their underlying components, each characterized by different morphological (shape-related) features. PQ signals often contain noise due to various factors like load switching, harmonic interference, or environmental conditions. MCA helps in separating the signal’s noisy components from the underlying PQ events (e.g., voltage sags, swells, or harmonics). By isolating and removing noise, MCA enhances the clarity and accuracy of the features extracted from the signal, which improves event detection and classification. In the context of MCA, consider an observed signal X that consists of a high-oscillatory component X1 and a low-oscillatory component X2 as follows:

The optimization problem can be formulated as:
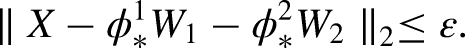
In the presence of noise, the optimization problem is modified to:

Optimizing other TQWT parameters using SALSA
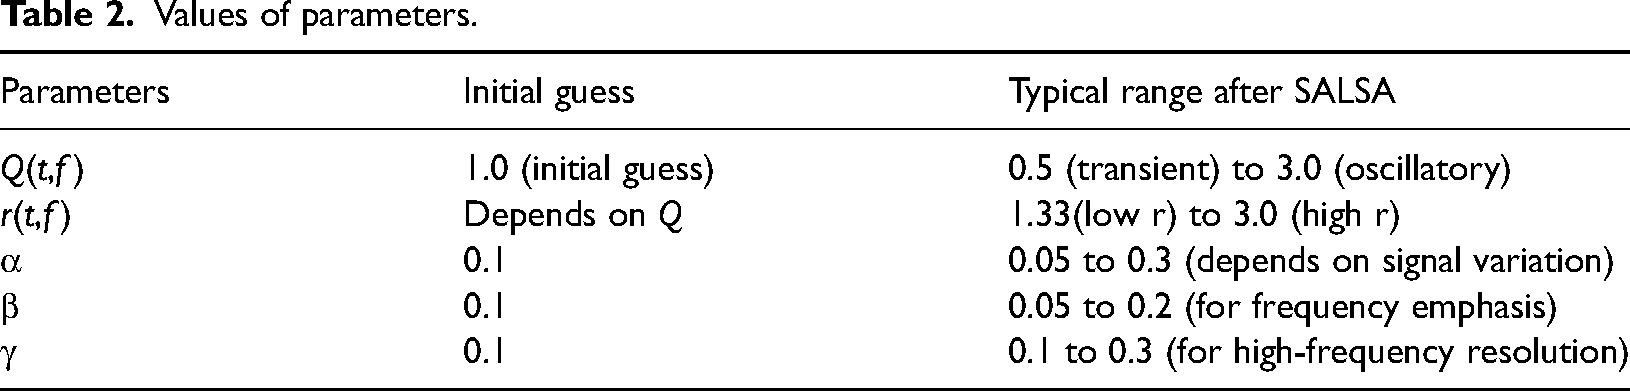
By applying SALSA optimization, all TQWT parameters—Q(t,f), r(t,f), α, β, γ, and κ—are adjusted dynamically to improve time–frequency localization and achieve better signal decomposition or feature extraction which is shown in Table 2. The exact values will depend on the specific signal and the reconstruction objective (e.g., minimizing reconstruction error, improving feature detection, etc.).
Values of parameters.
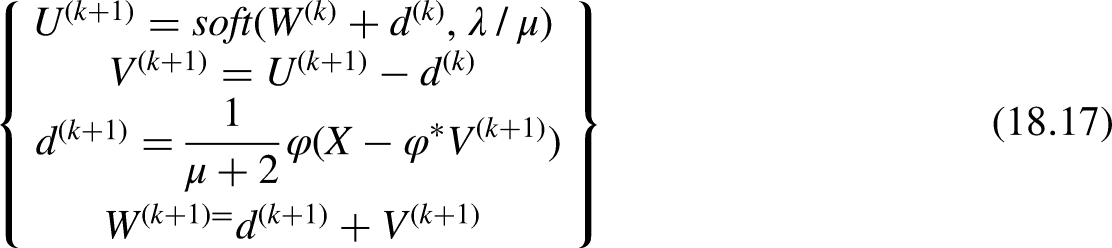
The sparsity-enabled signal decomposition method using MCA requires the minimization of the objective function in equation (28) to be minimized. Although J is convex, its minimization is challenging due to the large number of variables and the nondifferentiability of the 
U, such that U = W. The problem is now:
The alternating direction method of multipliers (ADMM) is used to solve this problem. The update equations are as follows:
Update for U:


The optimal U of 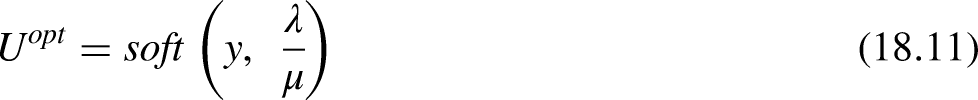


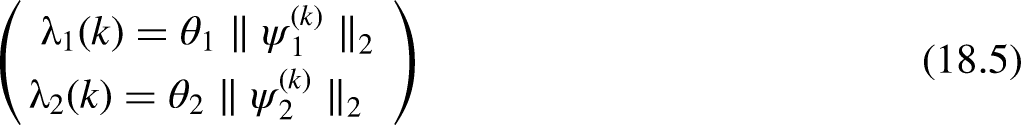
For equation (18.9), the minimization problem is quadratic and can be solved analytically: Initialize Q(t,f), r(t,f), α, β, and γ with moderate initial guesses. Apply SALSA Optimization: Iterate through signal reconstruction, updating these parameters to minimize the cost function based on signal recovery or feature extraction. Monitor Convergence: After a few iterations, SALSA will converge to optimal values for each parameter, giving you an adaptive TQWT with better time–frequency localization.


This process will dynamically adjust these parameters to the characteristics of your specific signal, improving localization and signal separation or feature extraction.
Frequency response and signal decomposition after the removal of noise
As illustrated in Figure 3(a), the frequency response of the oscillatory components during the presence of interharmonics was characterized by a sharp roll-off at lower frequencies and pronounced fluctuations at higher frequencies. This confirms that TQWT1 effectively captures the oscillatory behavior associated with interharmonic distortions.
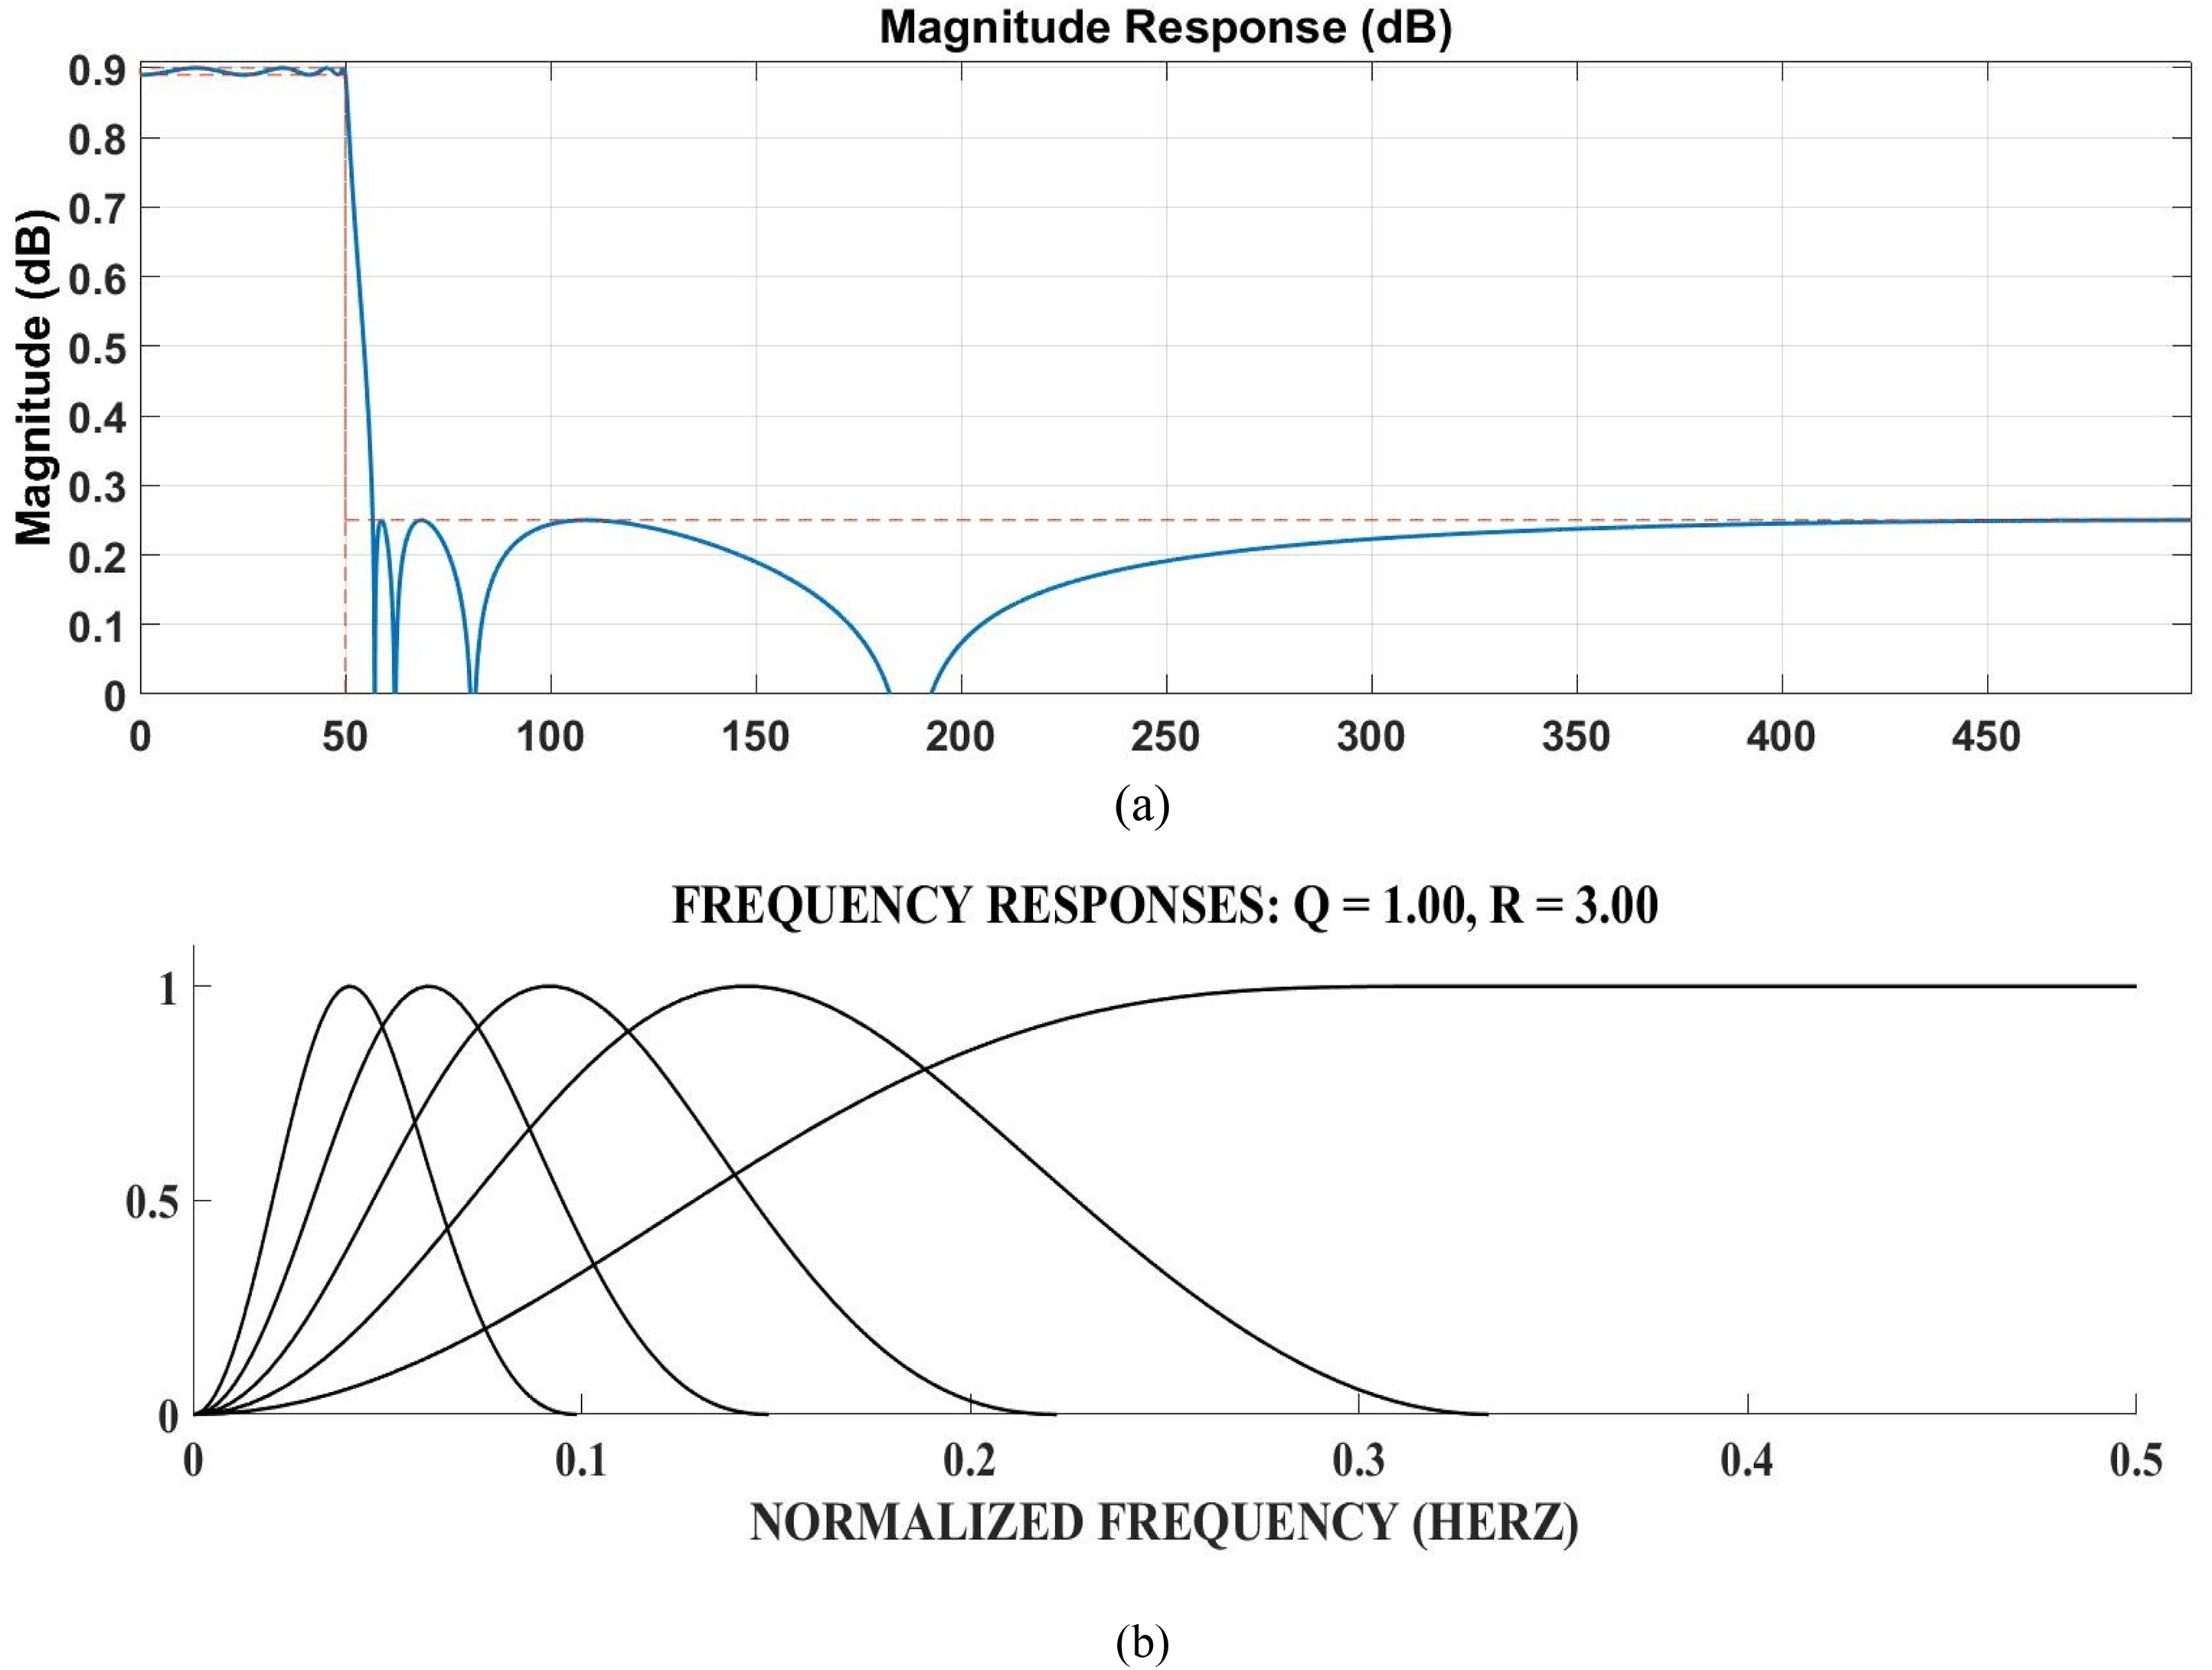
(a) Frequency response during presence of interharmonics (b) frequency response during the steady state. Panel (b) shows the frequency response during steady-state conditions, where TQWT2 was applied isolation of these rapid transitions, which are often observed during sudden disturbances.
The presence of distinct peaks across the frequency spectrum indicates the effective capture of transient components. The low Q-factor allowed for the figure depicts the outcome of the optimization process using the SALSA algorithm for signal decomposition. It includes visual representations of the algorithm’s convergence, highlighting how iterative updates enhance the separation of signal components. Additionally, the figure illustrates the reconstruction error as a function of time or iterations, demonstrating the trade-off between sparsity and reconstruction accuracy achieved through the minimization of the objective function.
The complexity of TQWT can be analysed in terms of computational and memory aspects. Computational complexity is influenced by factors such as the number of decomposition levels (J), the signal length (N), and the wavelet filter characteristics. TQWT involves applying filter banks, down sapling, and up sampling at each level, resulting in a complexity of O(JN) This arises from the recursive filtering and down sampling operations. Additionally, the complexity of the wavelet filters, including the number of coefficients, also affects the total computational load.
Choice of mother wavelet
The algorithm based on minimum description length (MDL) was used to select the optimal decomposition level and mother wavelet for PQ events voltage signal analysis. Table 3 shows the MDL values for various levels and wavelets. The minimum MDL value of −100.19 is achieved at level 3 with the Daubechies 10 (dB 10) wavelet. Therefore, the PQ events voltage signal is decomposed up to level 3 to manage computational load. For this level with the dB 10 wavelet, Q and r values are both set to 3, as illustrated in Figure 2. The accurate selection of Q and r values is critical for extracting the fundamental and harmonic components, particularly the 50 Hz fundamental frequency, from PQ disturbance signals. For detailed insights into the algorithm, MDL computation, wavelet selection, and the impact of Q and r values, refer to Table 2 and Figure 3.
Choice of mother wavelet.
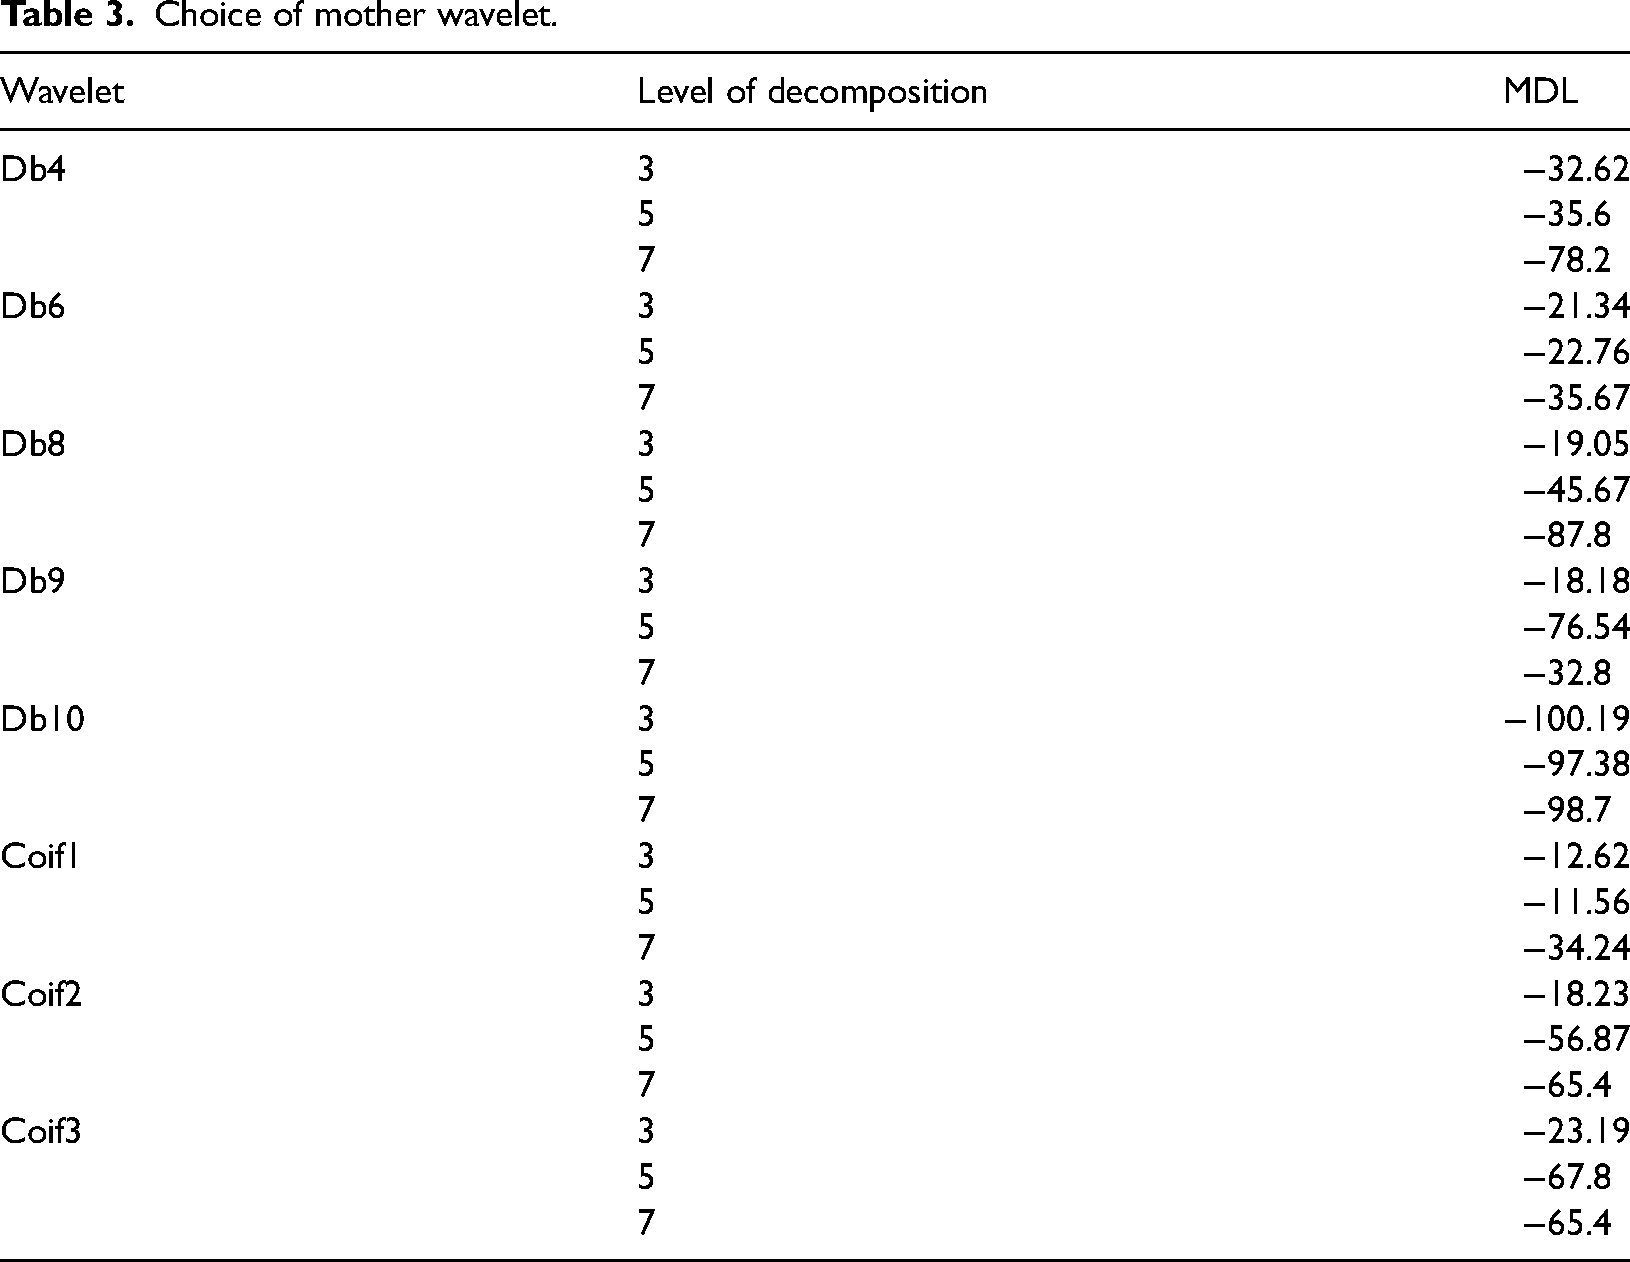
Memory complexity is determined by the storage needed for intermediate results at each decomposition level, which also scales with O(JN). This increase in memory requirements is due to the recursive nature of the TQWT algorithm. The actual complexity may vary depending on optimizations, wavelet filter choices, computational precision, and hardware. Thus, optimizing TQWT parameters can help reduce the overall complexity. Once the number of decomposition levels (J) is determined, the Q and r parameters are selected to accurately extract the fundamental component from x(n), which is crucial for analyzing PQ disturbance signals, particularly with 50 Hz or 60 Hz frequencies. As the fundamental component has a lower frequency compared to harmonics and other oscillations, a low-pass filter is used to separate it from higher-frequency components
Result Analysis
The result analysis begins with a detailed technical description of the simulation of signals using MATLAB 2023. The simulation involves generating various types of PQ disturbances, including transient, notch, and unbalanced signals, under controlled conditions. A sampling frequency of 10 kHz was employed to ensure high-resolution data acquisition, capturing even minute disturbances effectively. The total signal capturing time was set to 0.2 s, providing adequate coverage to analyse both transient and steady-state characteristics. Signal generation was performed with added noise to simulate real-world conditions, followed by denoising techniques to enhance signal clarity. The processed signals were subjected to TQWT analysis using the db10 wavelet at level 3 decomposition, as per the Multiresolution Decomposition Level (MDL) method. This approach enabled precise localization of disturbances in the time–frequency domain and provided insights into energy variations across scales. The methodology ensures accurate detection and classification of PQ disturbances, offering a robust framework for signal processing and fault analysis.
Figure 4 visualizes the time-domain signals for four different PQ events: Normal, Sag, Swell, and Harmonic disturbances. Each row corresponds to one type of PQ event, with three subplots representing the original, noisy, and denoised versions of the signal, respectively. The Gaussian noise is added to simulate real-world scenarios with a low Signal-to-Noise Ratio (SNR = 5), ensuring challenging denoising conditions. The MCA is then applied to filter out noise. Key observations include how noise distorts the waveform—particularly in the swell and harmonic cases—and how the denoising effectively restores the original signal characteristics. These results highlight the utility of wavelet-based denoising for preserving PQ event features critical for analysis.
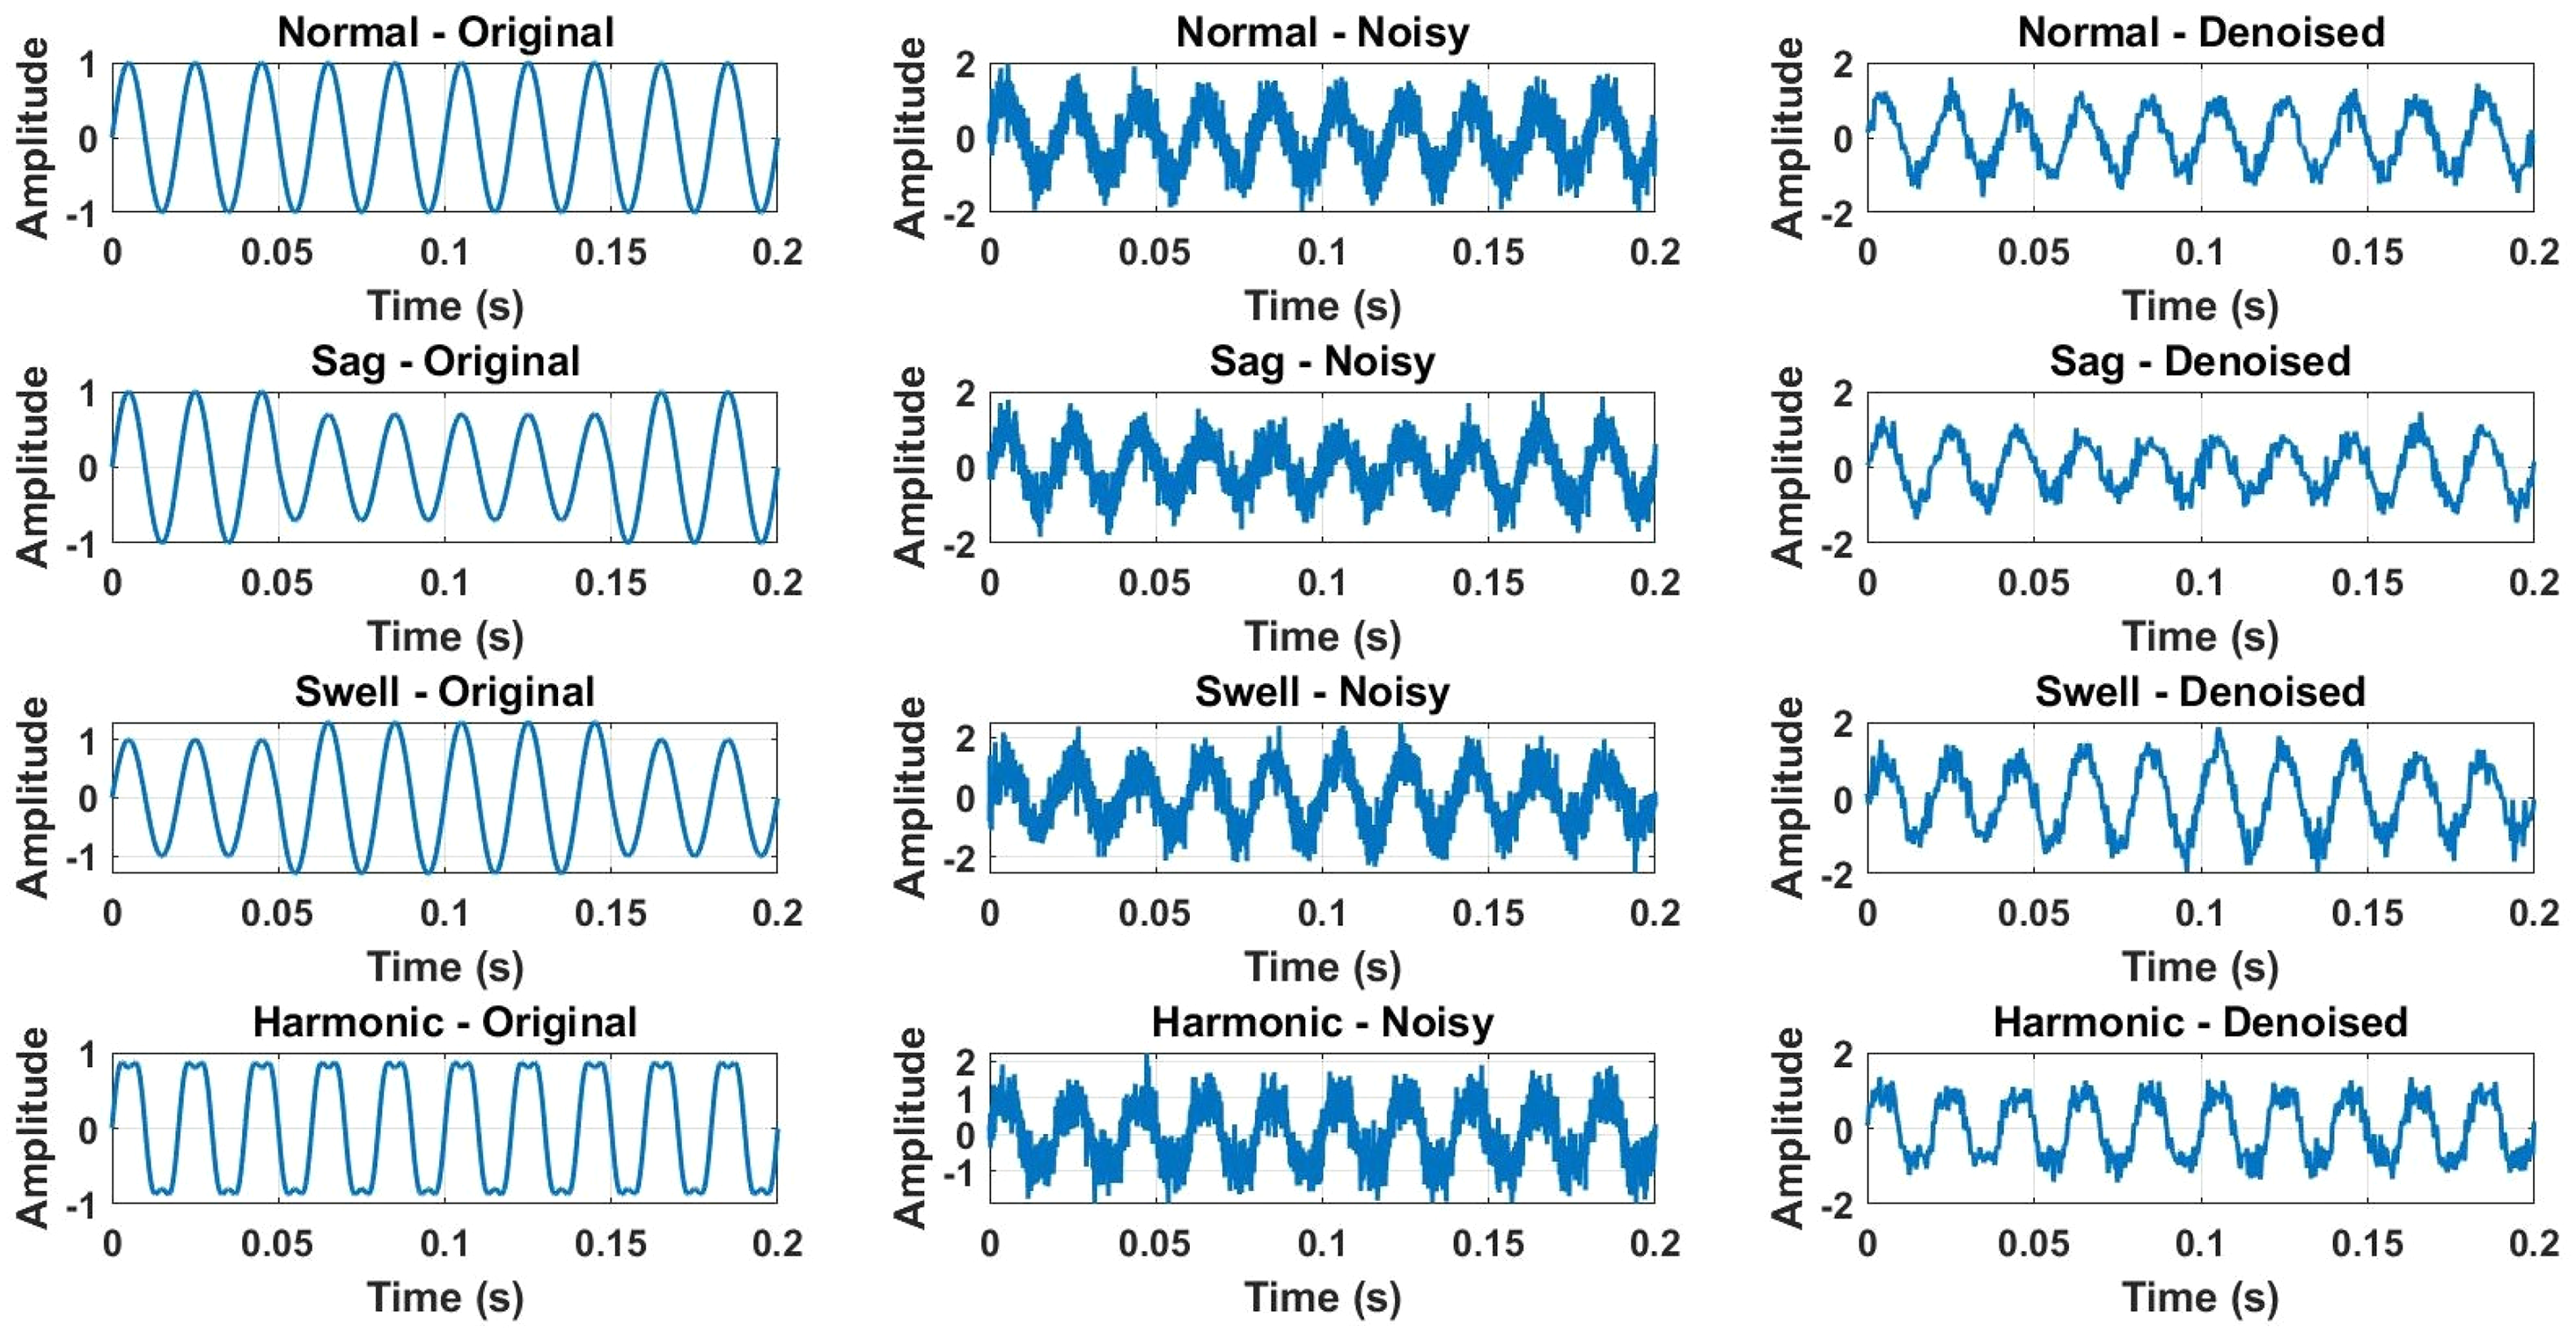
Noise removal by MCA for normal, sag, swell, and harmonic disturbances.
Figure 5 demonstrates the time-domain behavior of various PQ events, including Normal, Flickering, Transient, and Notch disturbances. Each row corresponds to a specific PQ event and includes three subplots for the original, noisy, and denoised signals. The original signals highlight distinct PQ characteristics: Flickering shows periodic interruptions, the transient signal exhibits a sharp spike at 0.1 s, and the notch signal represents a suppression of a specific frequency component. Gaussian noise with a Signal-to-Noise Ratio (SNR) of 5 is added to simulate real-world conditions. Wavelet-based denoising is then applied to reduce noise, effectively restoring signal clarity. The progression from noisy to denoised signals emphasizes the efficacy of wavelet denoising in preserving PQ event features while mitigating noise-induced distortions. Figure 6 shows noise removal for these cases under unbalanced and noisy conditions.
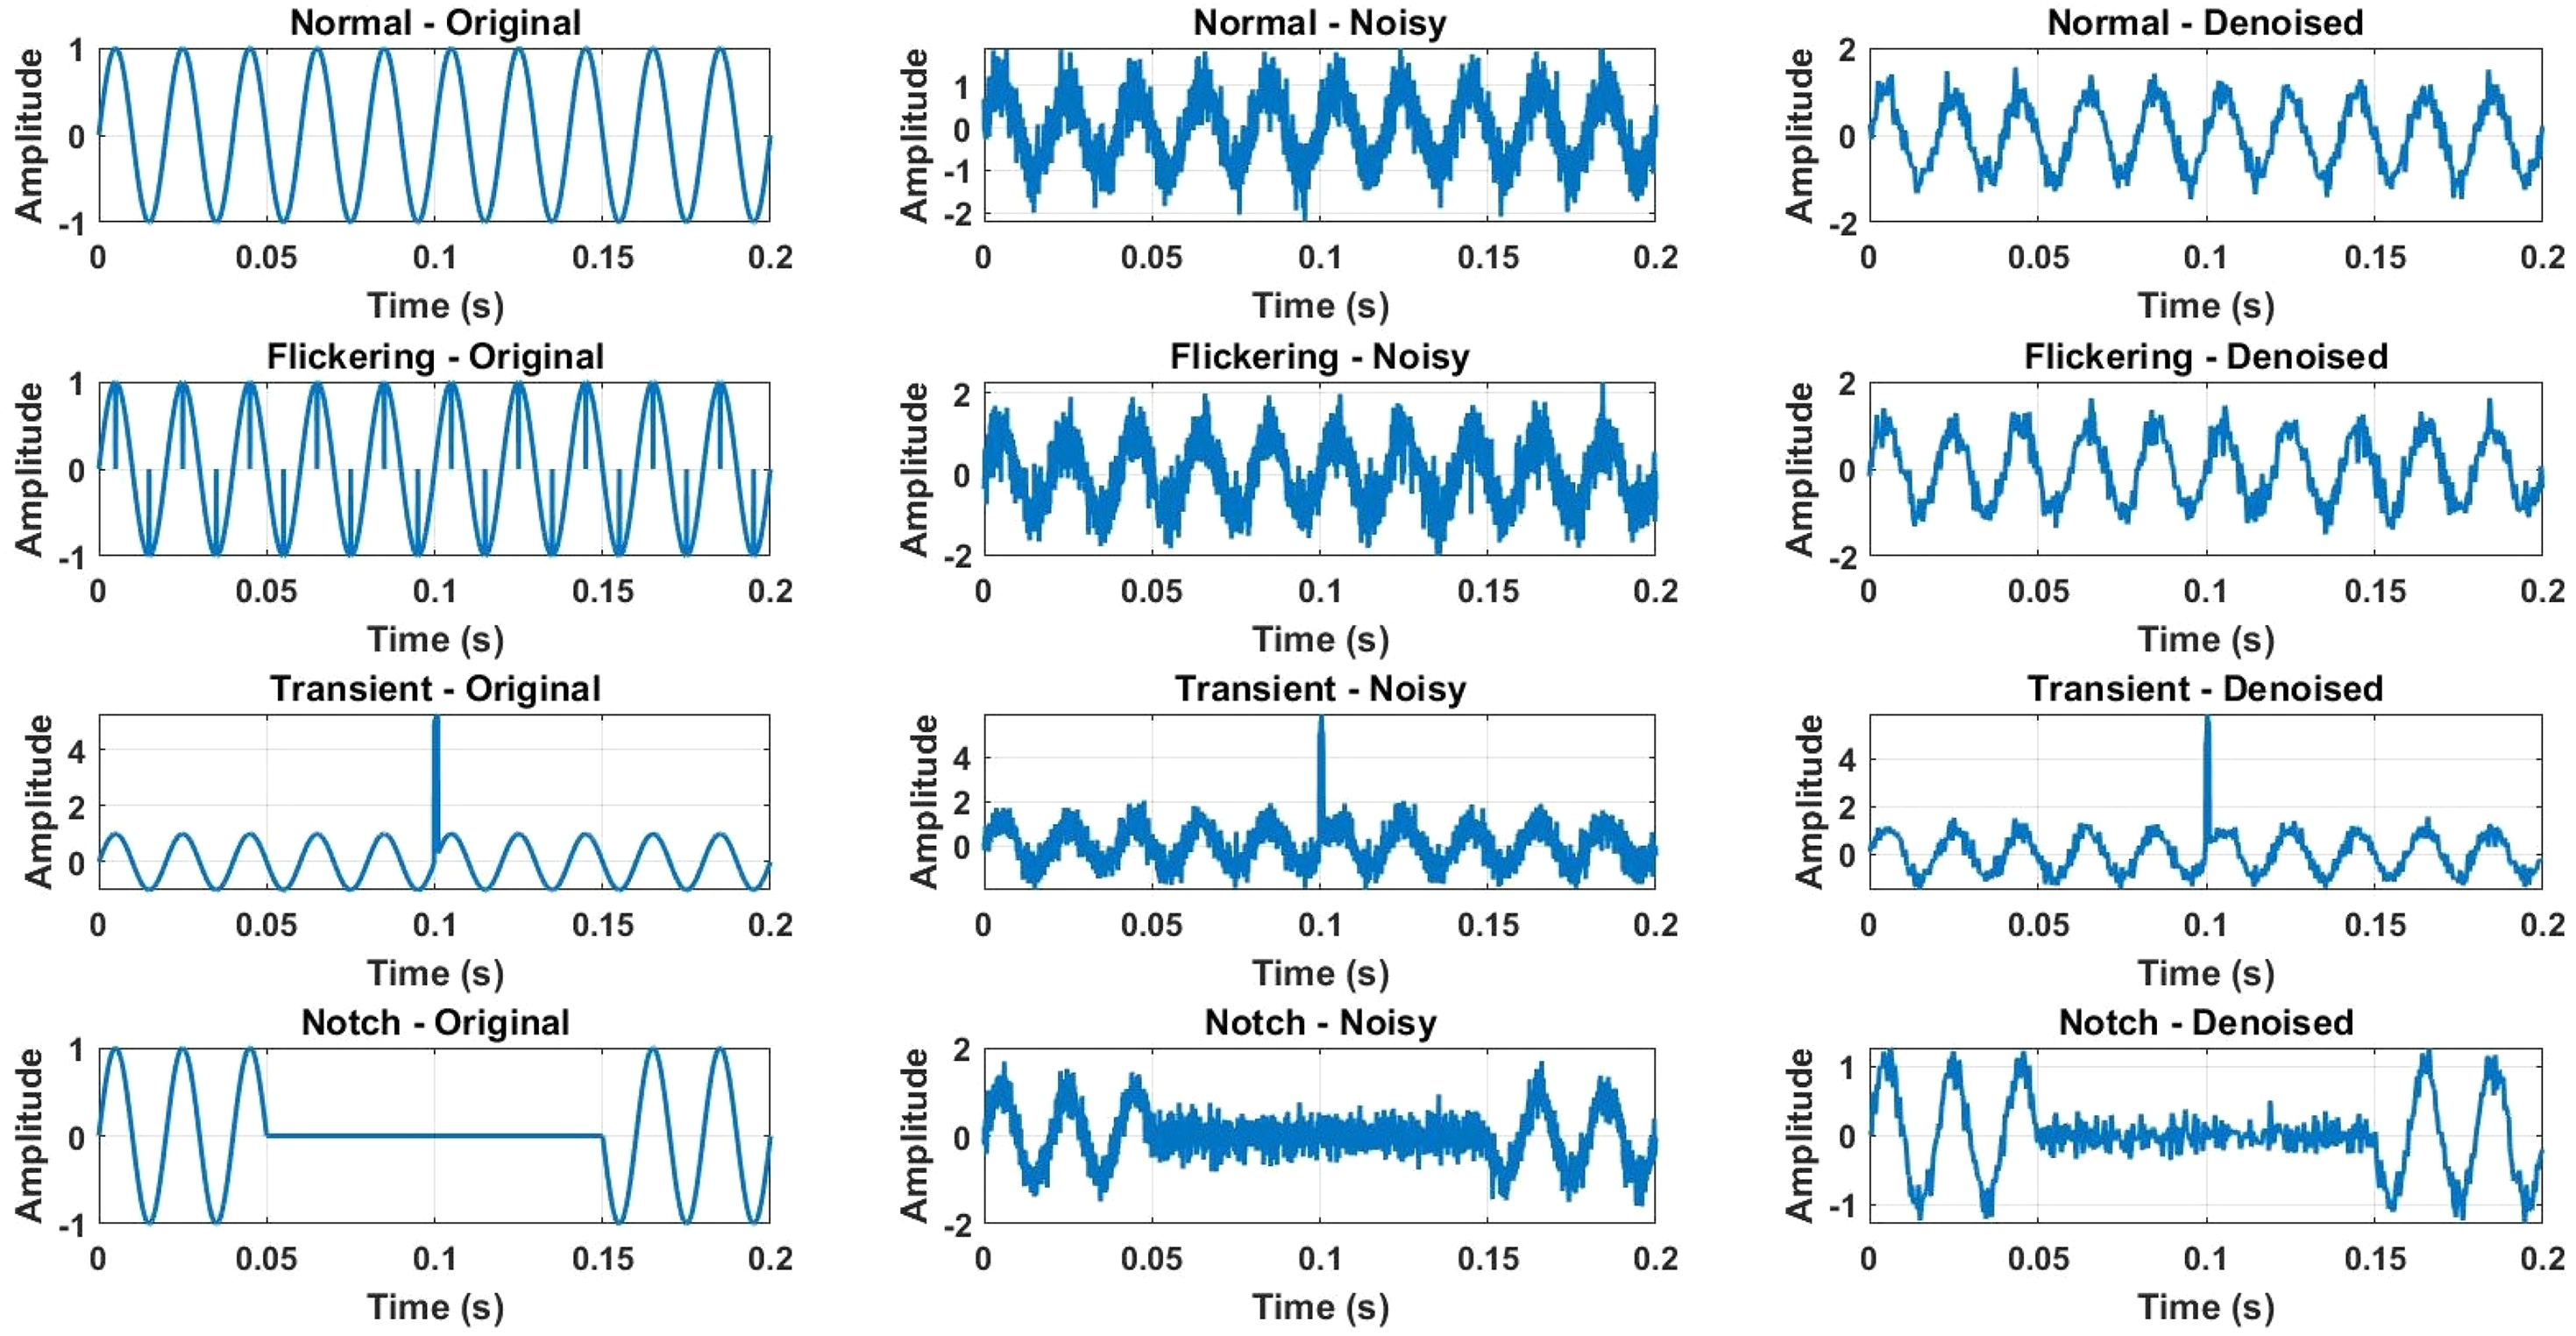
Noise removal by MCA for normal, flickering, transient, and notch disturbances.
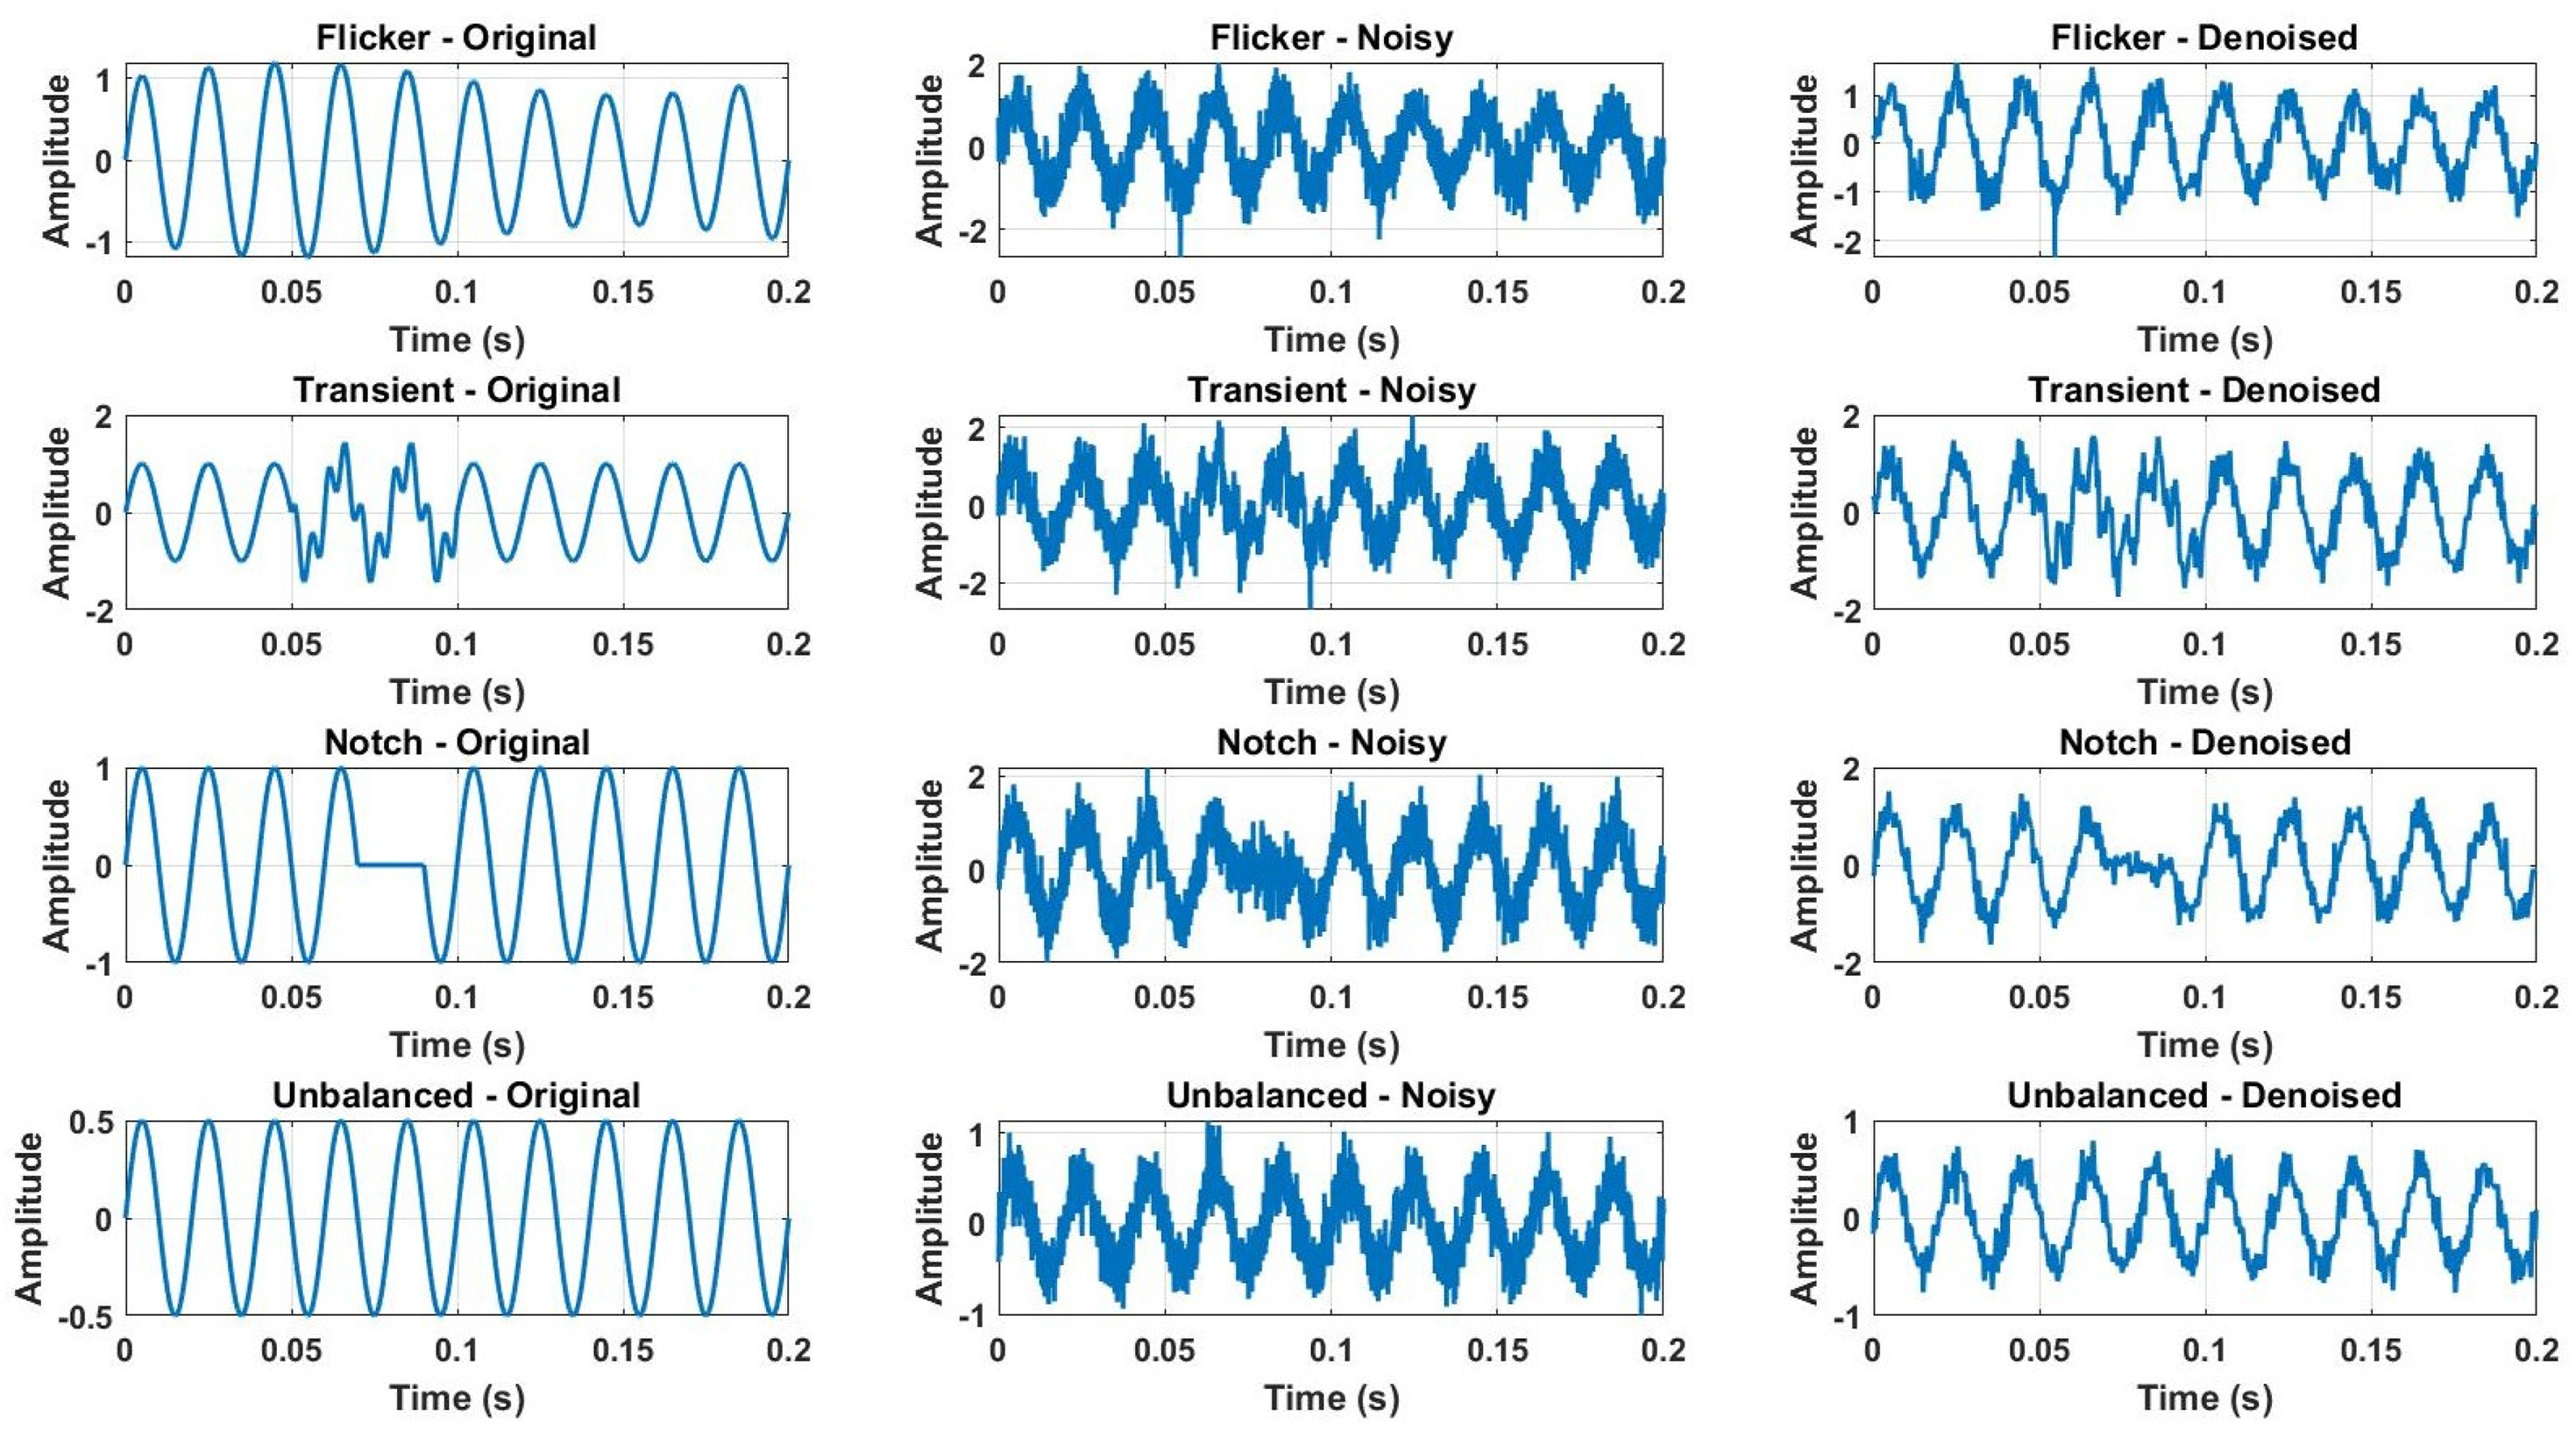
Noise removal during unbalanced and noisy conditions.
Figures 7 and 8 present the TQWT analysis for the same PQ events, providing insights into their frequency-domain characteristics. Each row corresponds to a PQ event, and the three subplots show the TQWT of the original, noisy, and denoised signals. The 3D plots highlight how the energy distribution in the time–frequency domain changes due to noise and how denoising mitigates this distortion. A zoomed-in view focuses on the harmonic region (up to 200 Hz and a time window of 0.05–0.2 s), clearly demonstrating the impact of harmonic disturbances and noise on the frequency spectrum. The denoised TQWT plots show improved clarity, ensuring better fault identification and feature extraction for advanced PQ analysis.
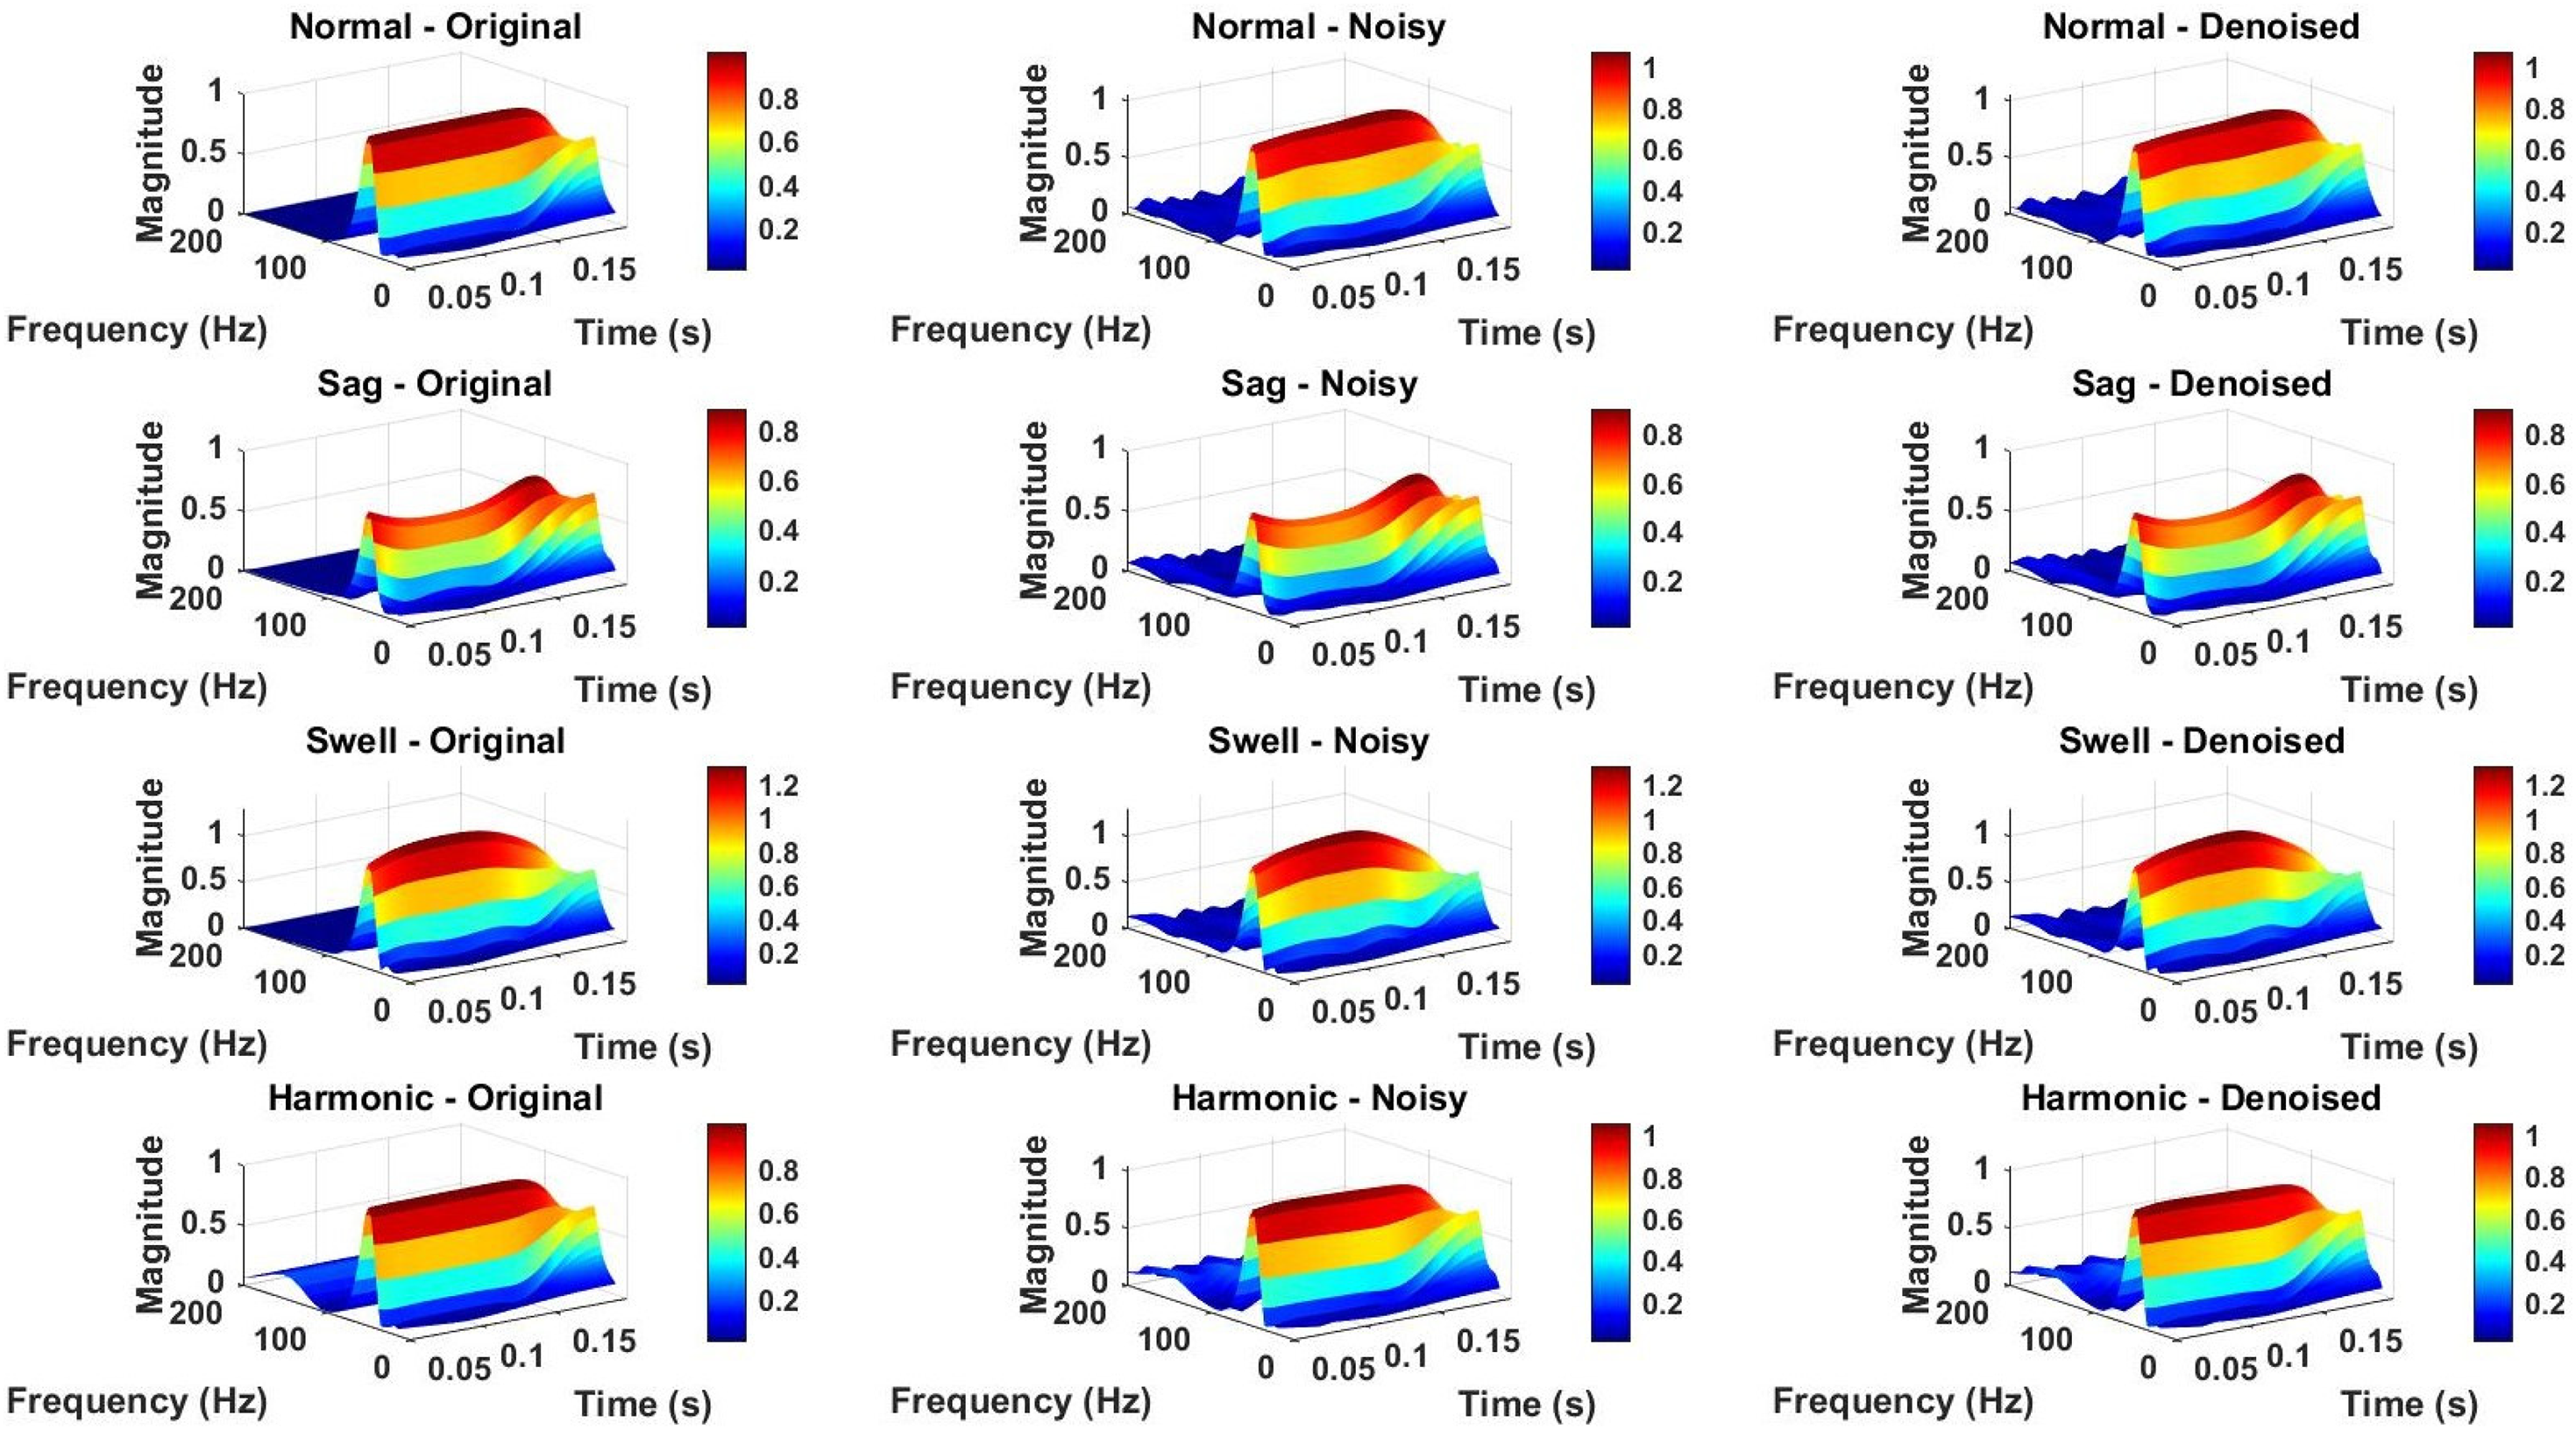
TQWT analysis for normal, sag, swell, and harmonic disturbances.
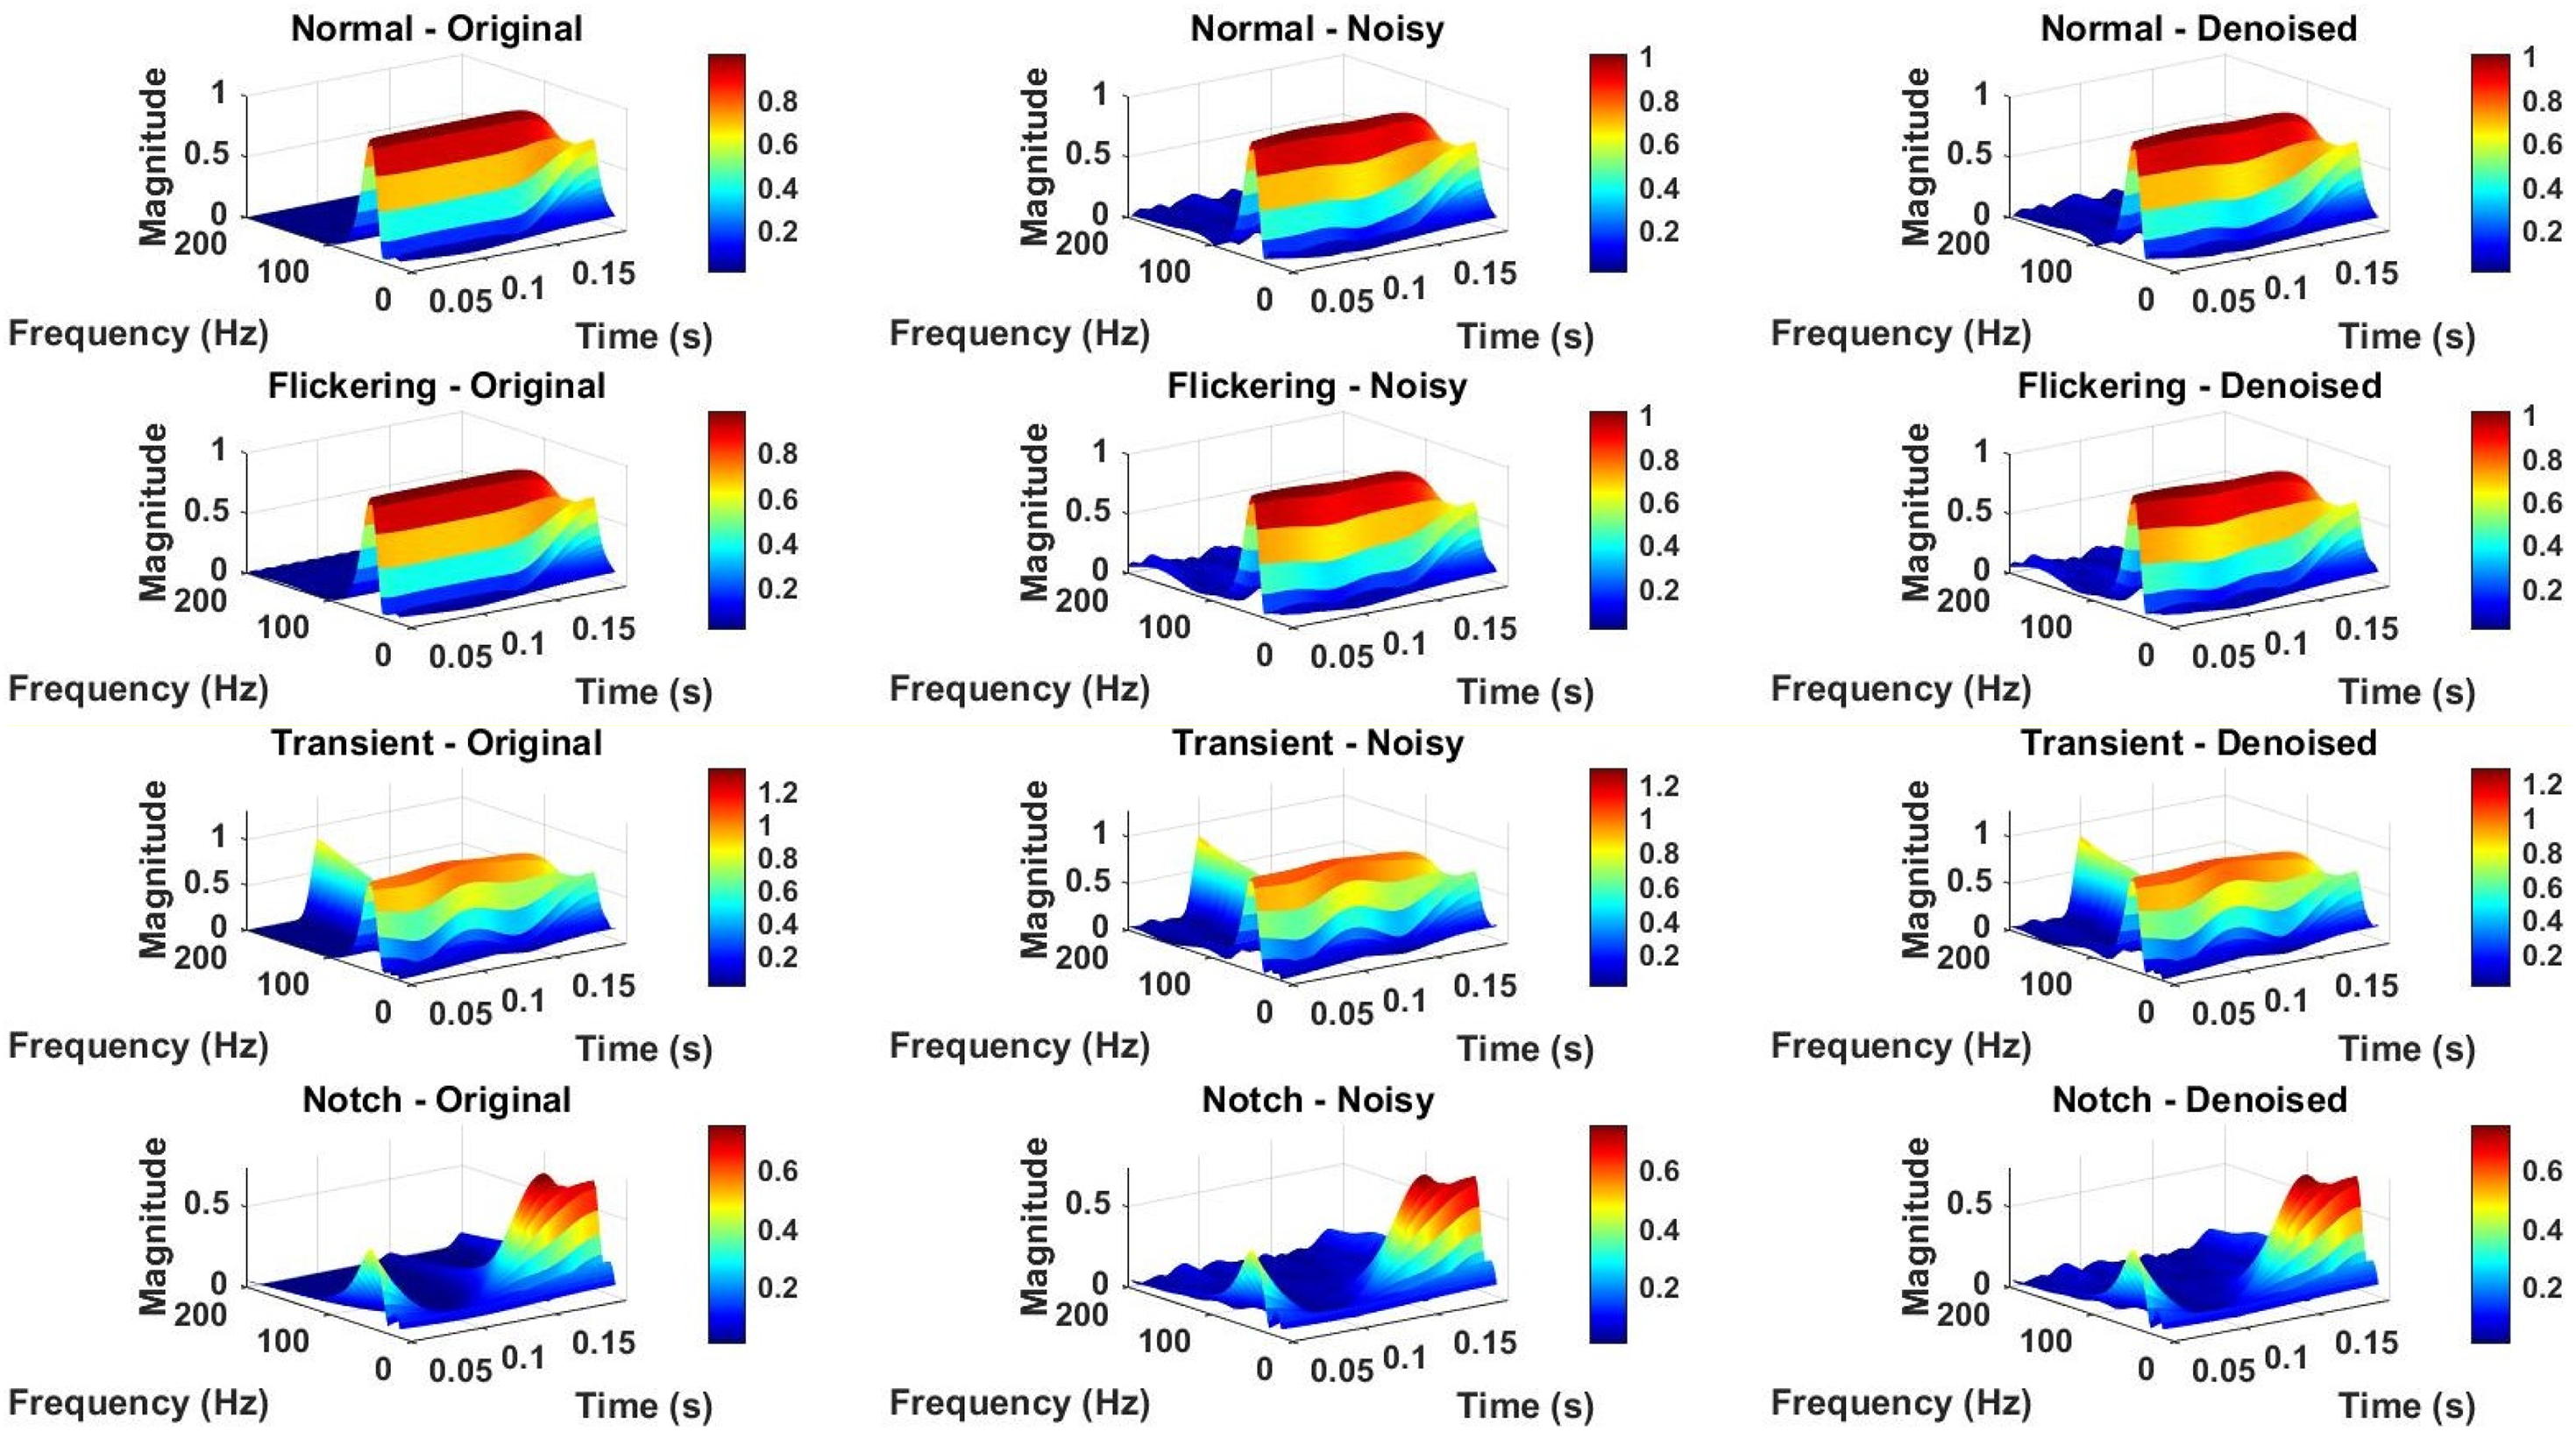
TQWT Analysis for normal, flickering, transient, and notch disturbances.
Figure 9 provides a spectral representation of PQ events using TQWT. Each row corresponds to a specific event, with three subplots showing the TQWT of the original, noisy, and denoised signals. The TQWT is visualized as 3D spectrograms, with frequency, time, and magnitude axes. For instance, the transient signal’s sharp spike is evident as a high-frequency burst in the spectrogram. Noise adds scattered artifacts across all frequencies, obscuring key features. After denoising, the spectrograms exhibit improved clarity, with PQ event characteristics, such as the periodic nature of Flickering or the localized frequency suppression in the Notch signal, becoming more distinct. This analysis highlights the combined utility of TQWT and MCA denoising for distinguishing and analysing complex PQ disturbances.
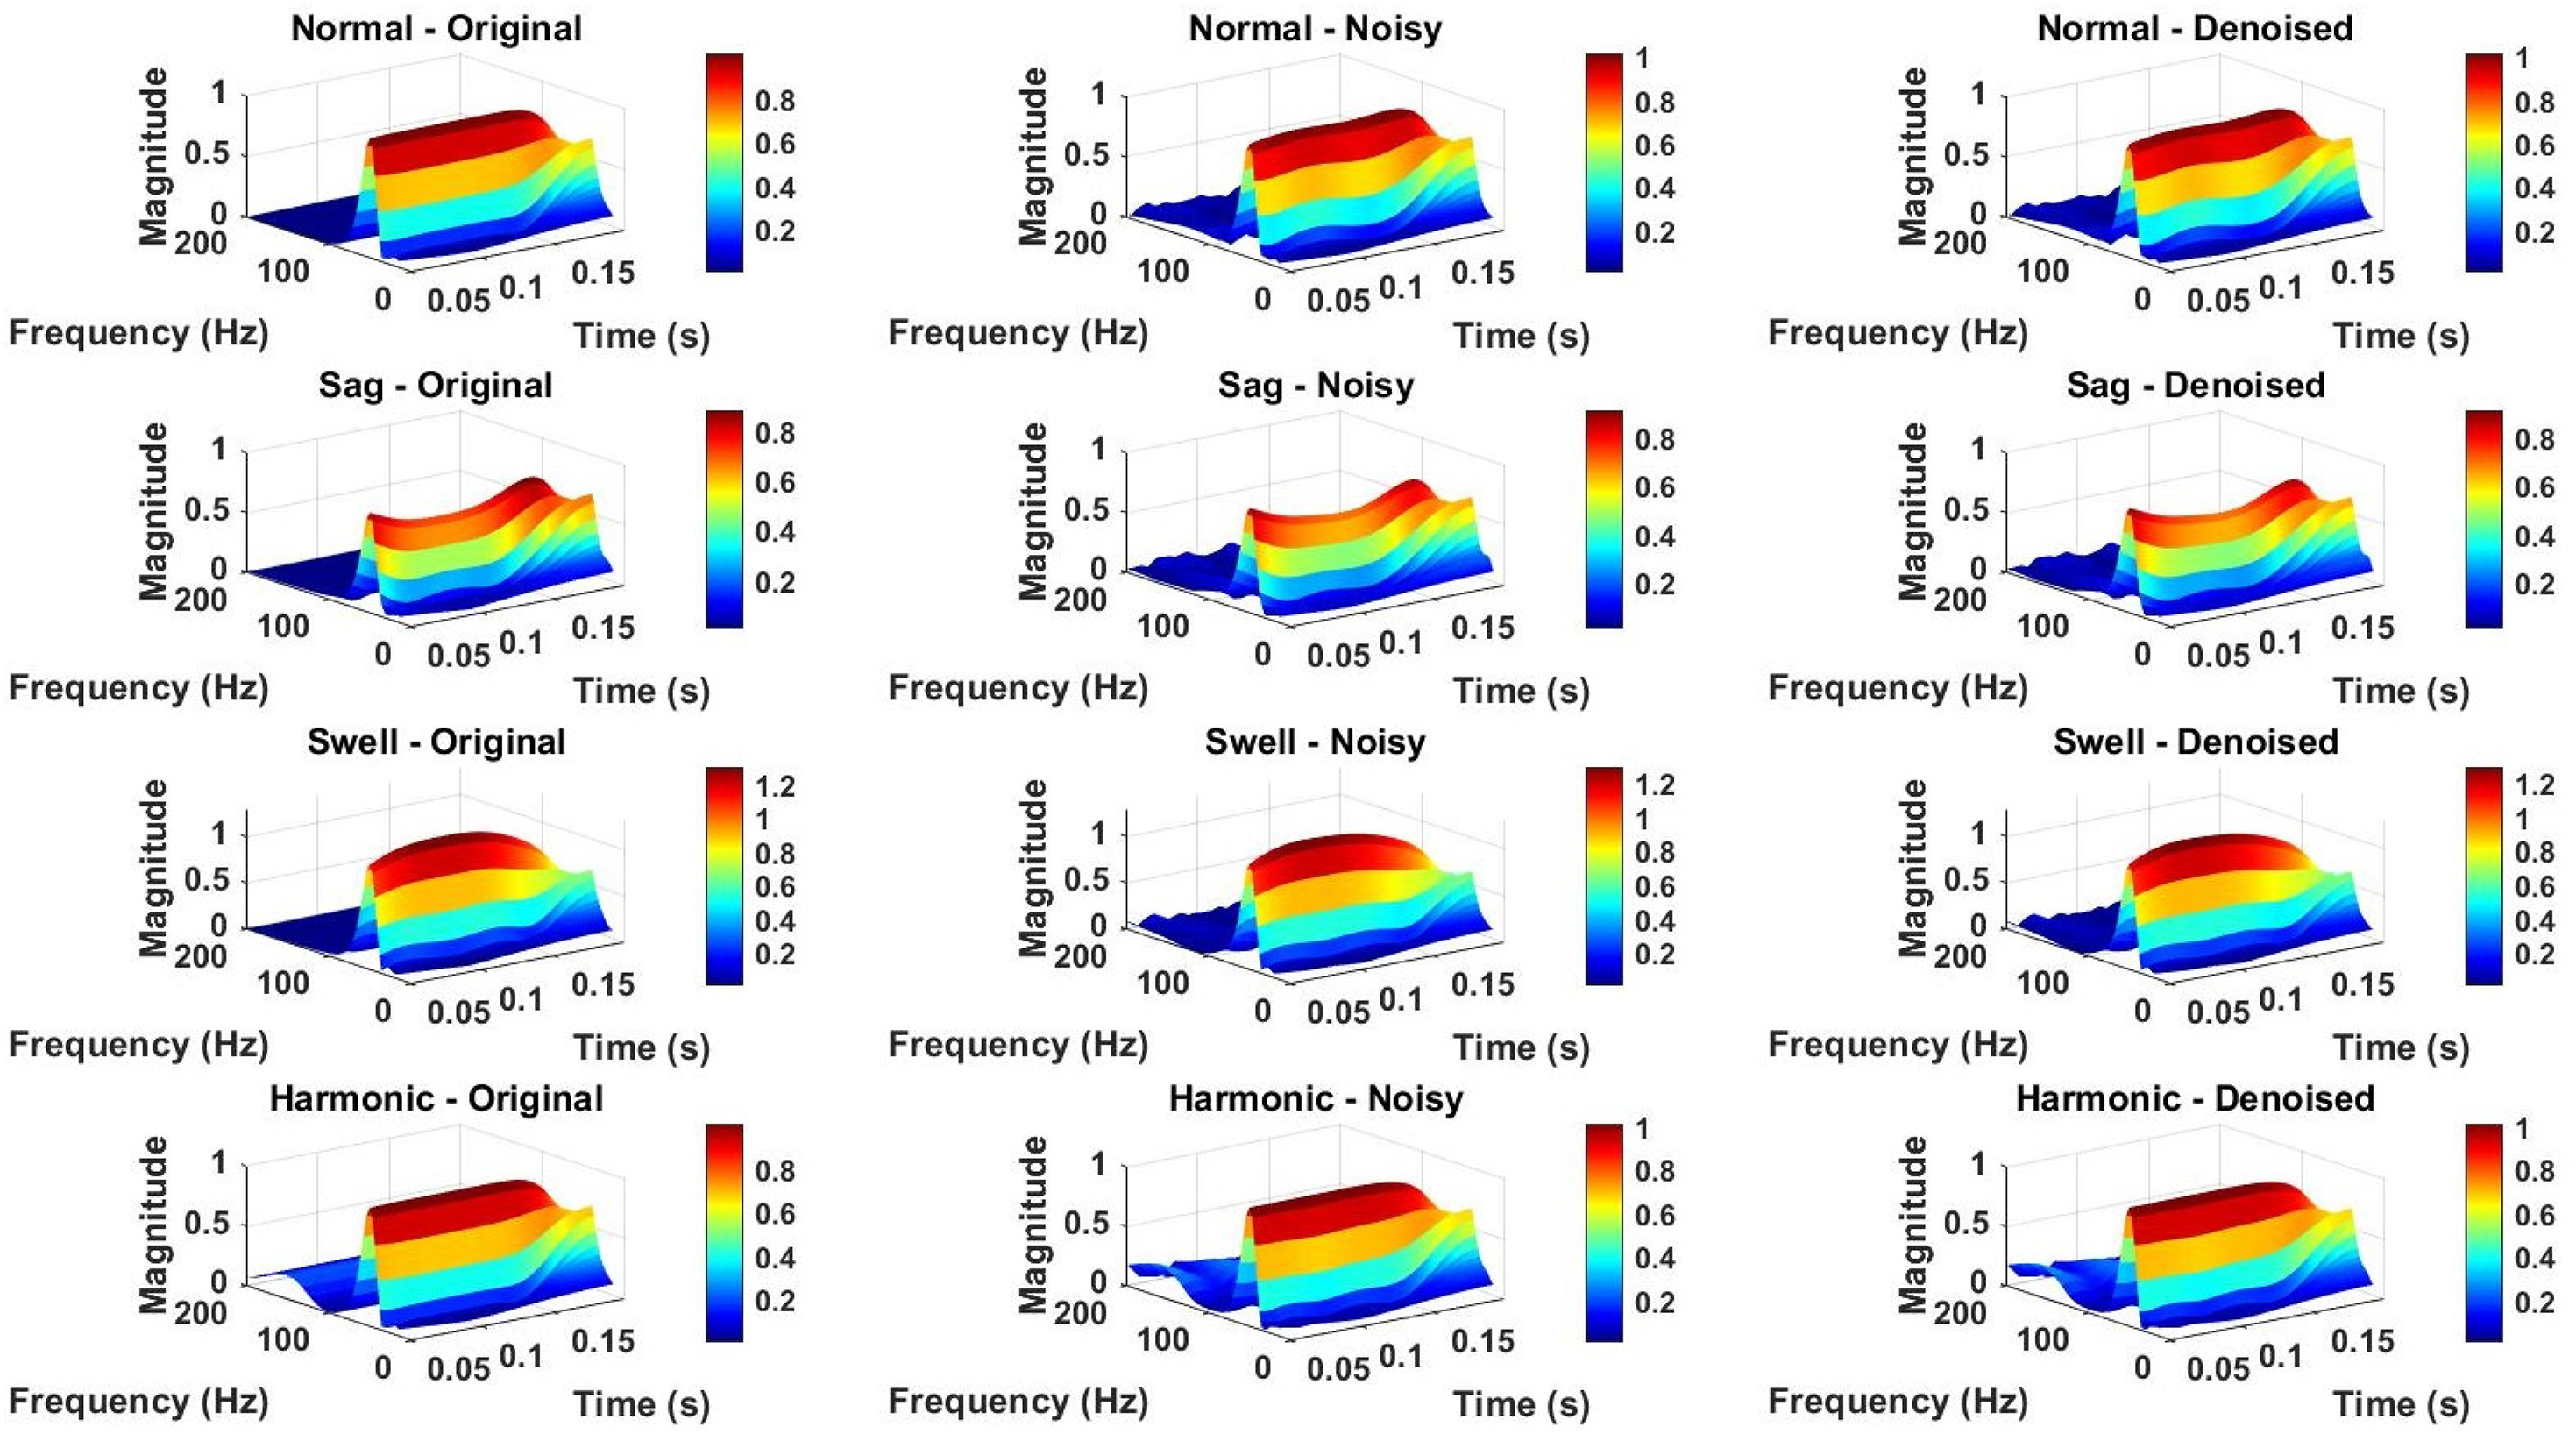
TQWT analysis under noisy conditions.
As per Figure 10 the Transient signal, the time-domain plot reveals a sudden spike in voltage at around 0.05s, representing a transient event. The corresponding TQWT captures this as a sharp energy concentration over a broad frequency range, highlighting the impulsive nature of the disturbance. When noise is introduced, the transient’s sharpness becomes masked, and the TQWT shows additional energy spread across various frequencies, obscuring the original event. After denoising, the transient signal’s characteristics are restored, with the time-domain plot regaining its distinct spike and the TQWT showing a precise, localized energy burst at the transient event, effectively isolating it from noise. For the Notch signal, the original time-domain plot clearly shows a complete absence of voltage between 0.07s and 0.09s, representing a notched interval. The corresponding TQWT reveals this as a significant drop in energy across all frequencies during the notched period. However, when noise is introduced, the notched region becomes less distinct, with the TQWT showing scattered noise that obscures the signal's original characteristics. After denoising, the signal regains its clean notched structure, and the CWT accurately captures the dip in energy during the interval, effectively removing noise-induced distortions. For the Unbalanced signal, the original plot shows an amplitude deviation caused by a phase-shifted second harmonic, a characteristic of an unbalanced system. The TQWT of the original signal highlights overlapping components near the fundamental frequency and the phase-shifted harmonic. Noise further distorts these features, making it difficult to distinguish between the fundamental and shifted harmonic frequencies. After denoising, the signal regains clarity, with the TQWT showing distinct peaks for both the fundamental frequency and the phase-shifted harmonic, effectively separating the overlapping components and restoring the unbalanced signal’s key characteristics.
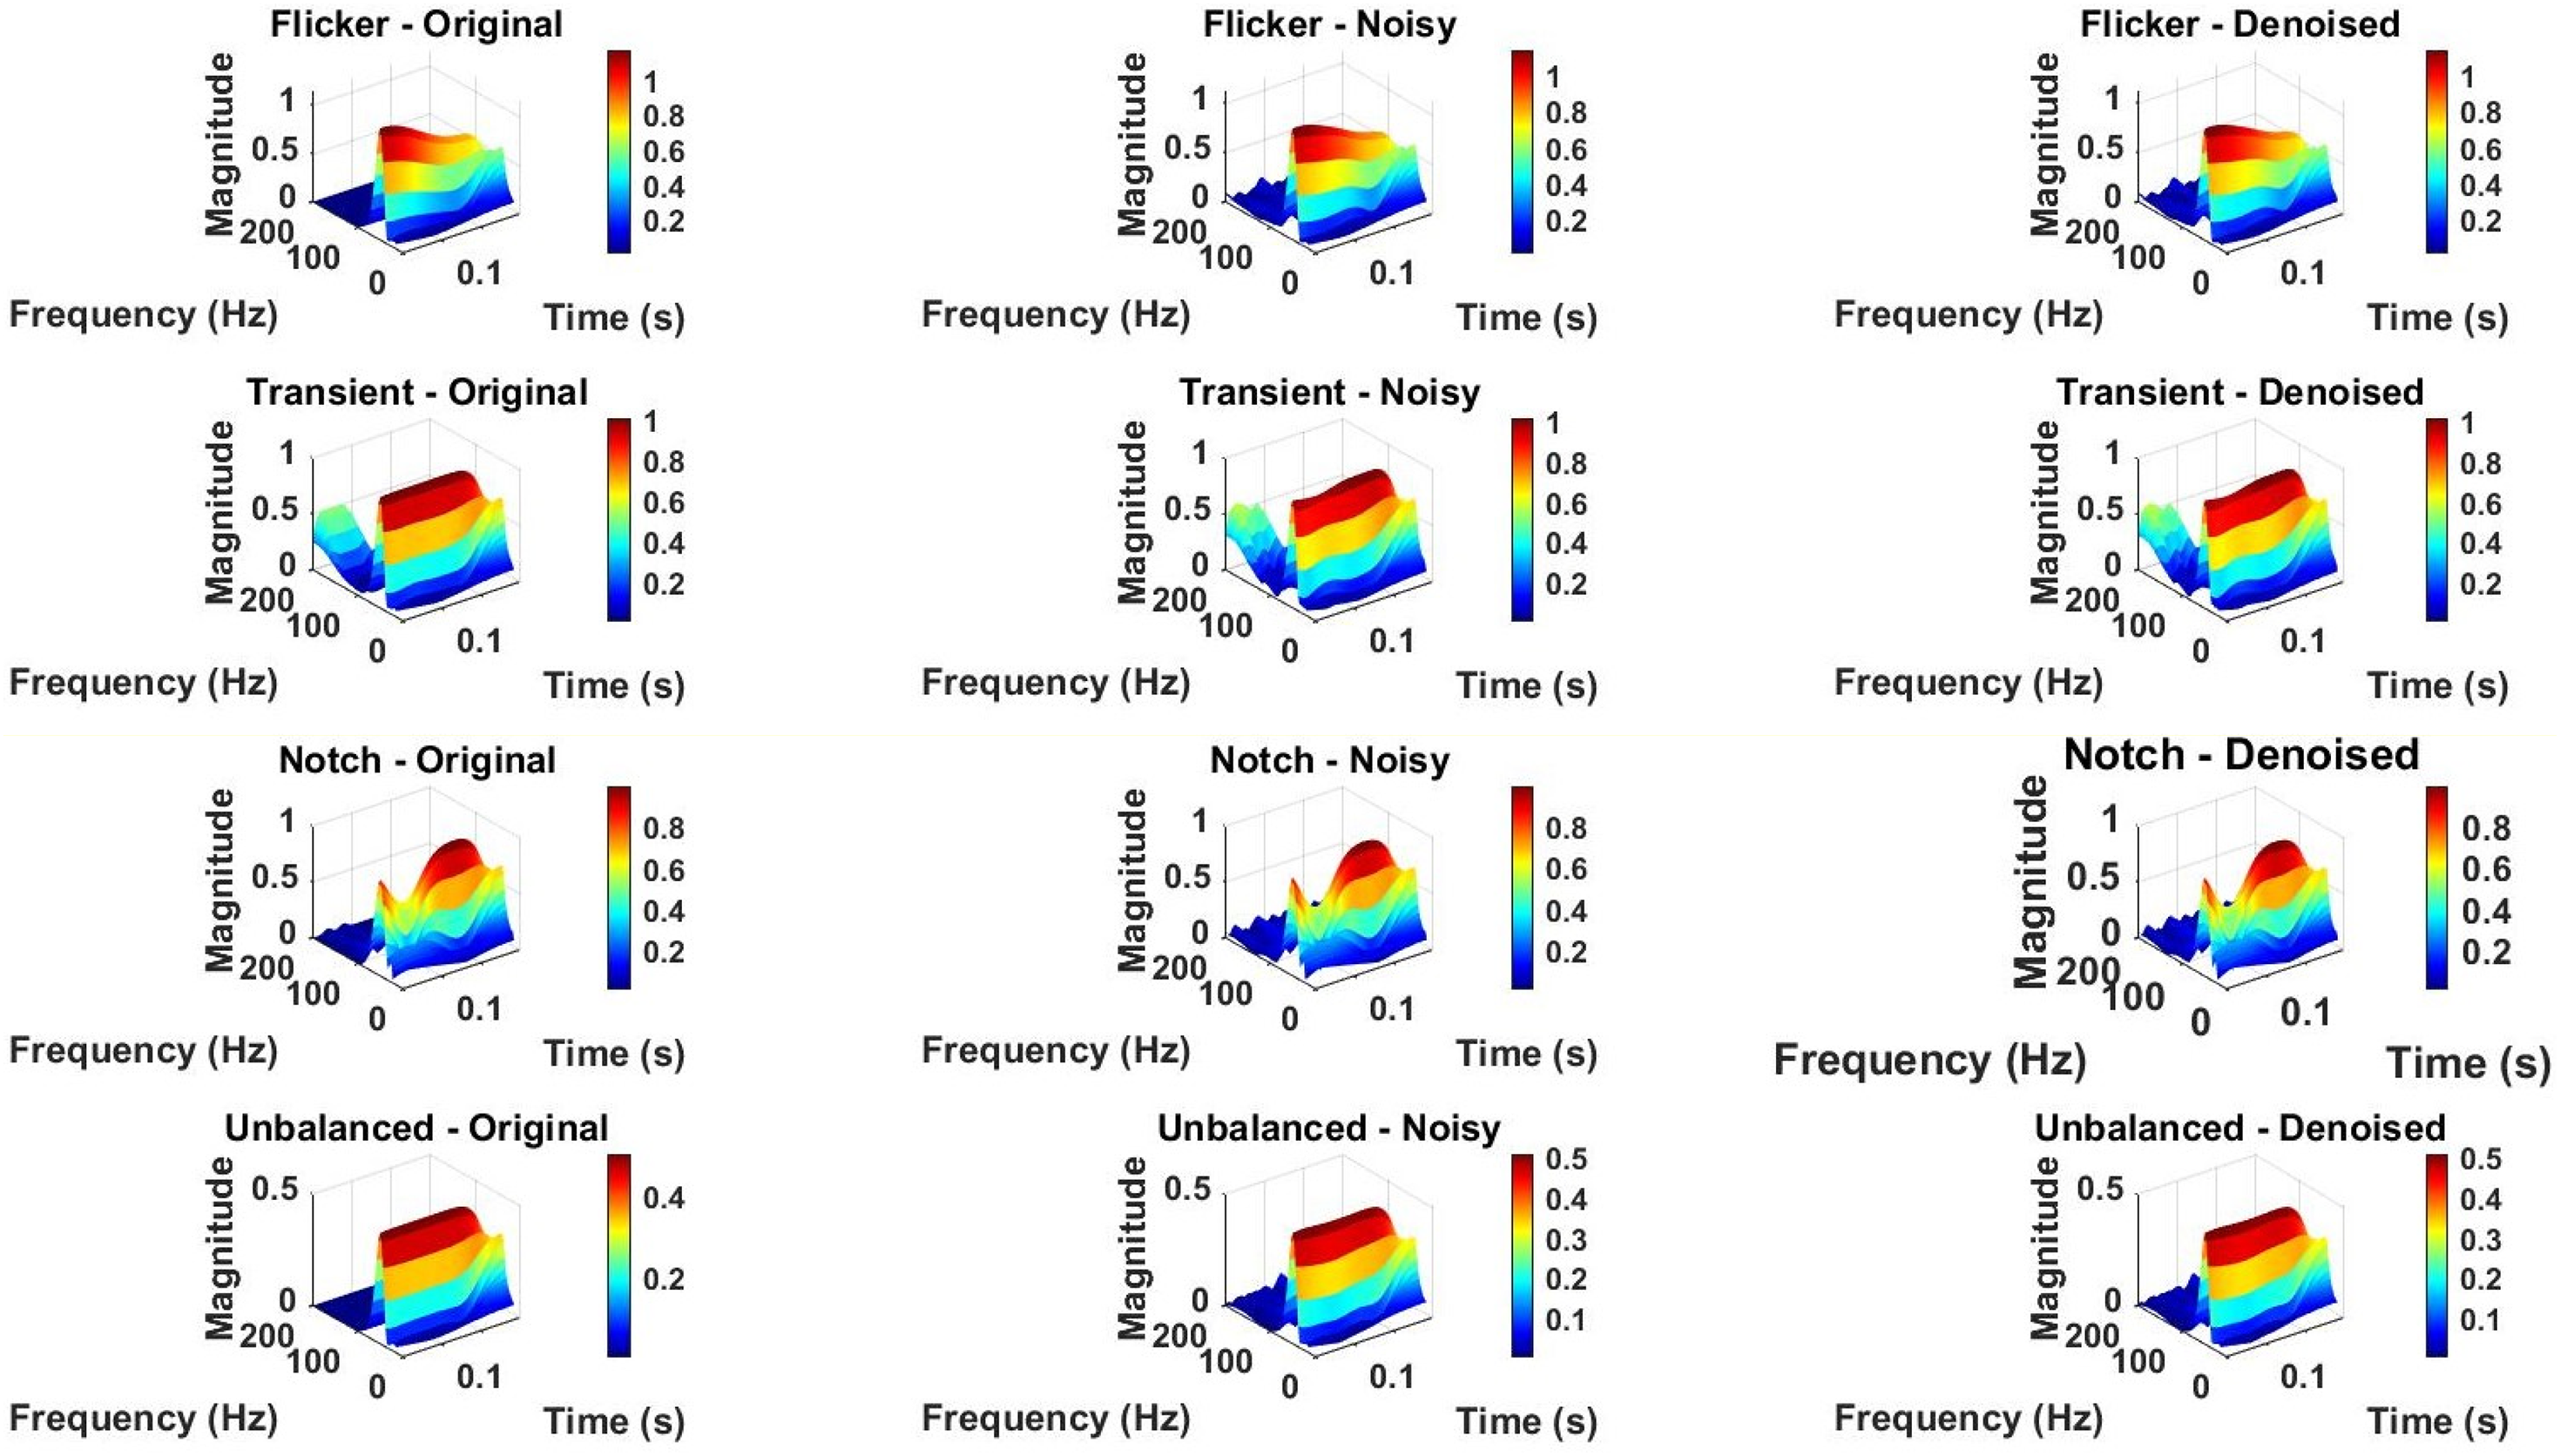
TQWT analysis under noisy and unbalanced conditions.
Proposed CNN-based dual-task protection scheme
This work presents a CNN-based dual-task model to classify PQ events. The proposed dual-task deep-learning network, which is utilized to address both the classification and regression problems. Initially, at the input stage, the samples of 7 input parameters i.e., the three-phase current, their respective symmetrical components and PQ events resistance are provided to the 1-dimensional (1D) CNN. According to Figure 11, it is indicated that six numbers of 1D CNNs are utilized which are subdivided into three parts. Each part consists of two numbers of layers with 128, 64 and 32 numbers of filters respectively. The rectified linear unit (ReLU) activation function is utilized in the CNN architecture. This deep-learning architecture will assist in building up the model accurately and will be able to extract correct features in this occasion. Additionally, a detailed system configuration is presented with the help of Table 4. The mathematical expression of 1D CNN is presented in equations (19), where 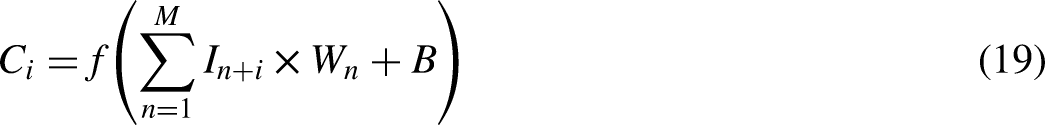
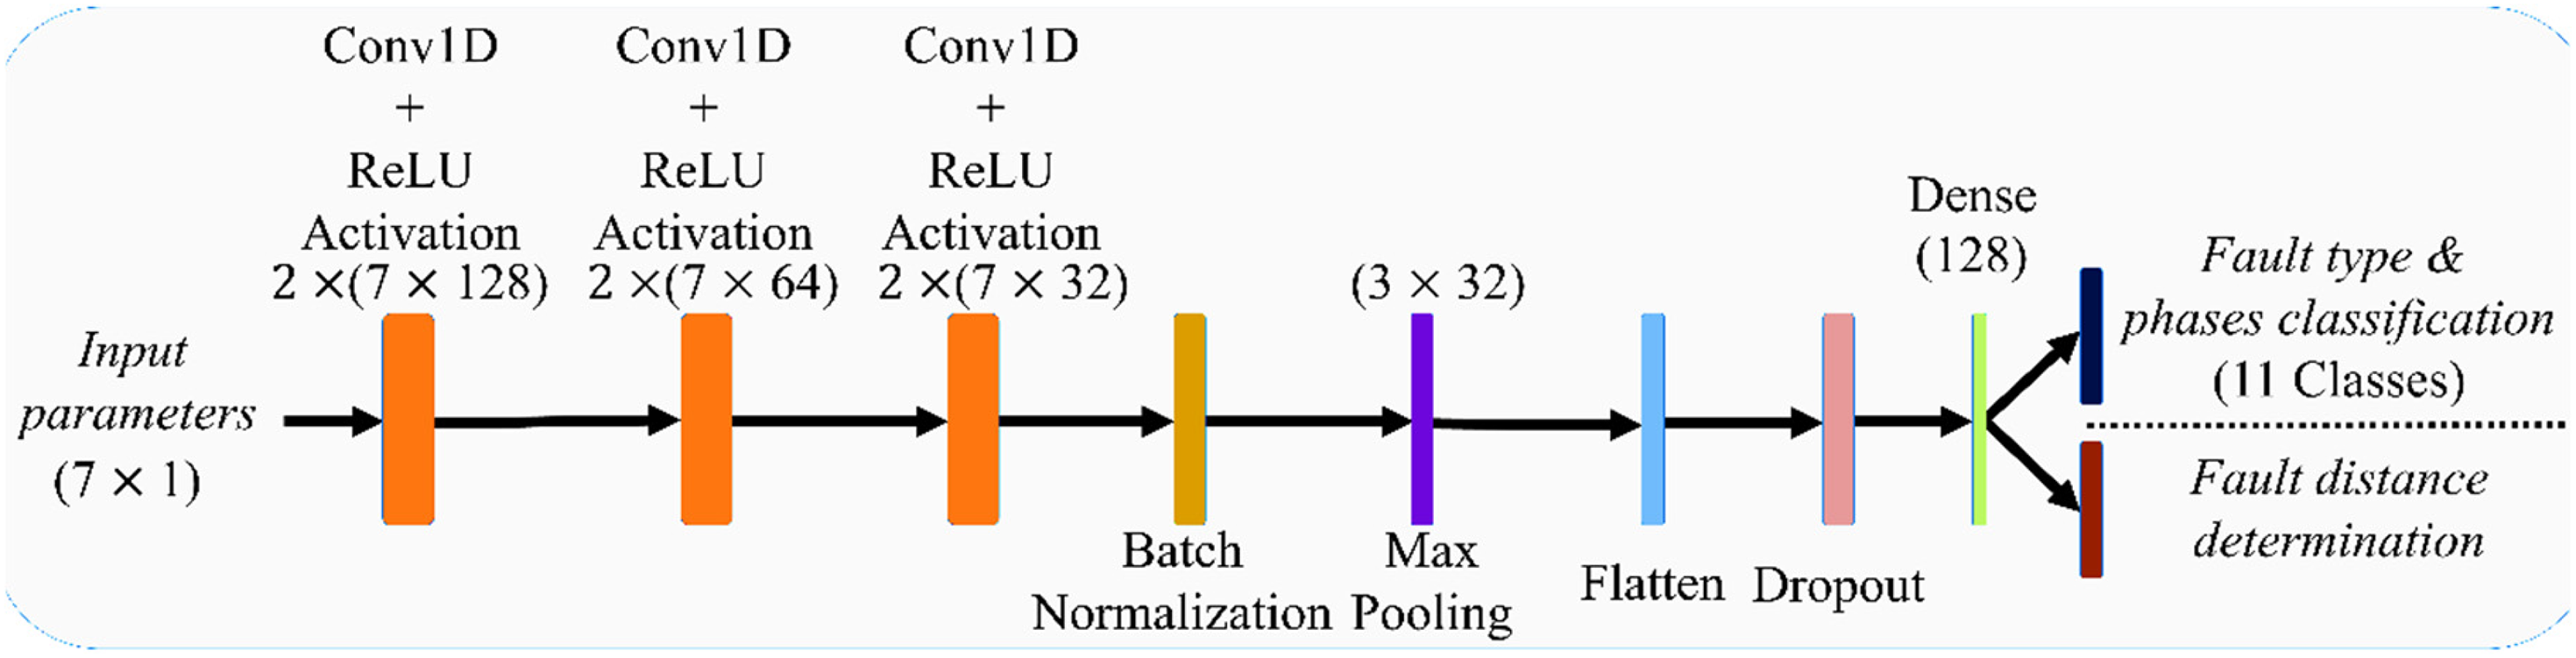
Schematic representation of proposed CNN-based dual-task protection scheme.
Various layers in the proposed deep learning architecture.
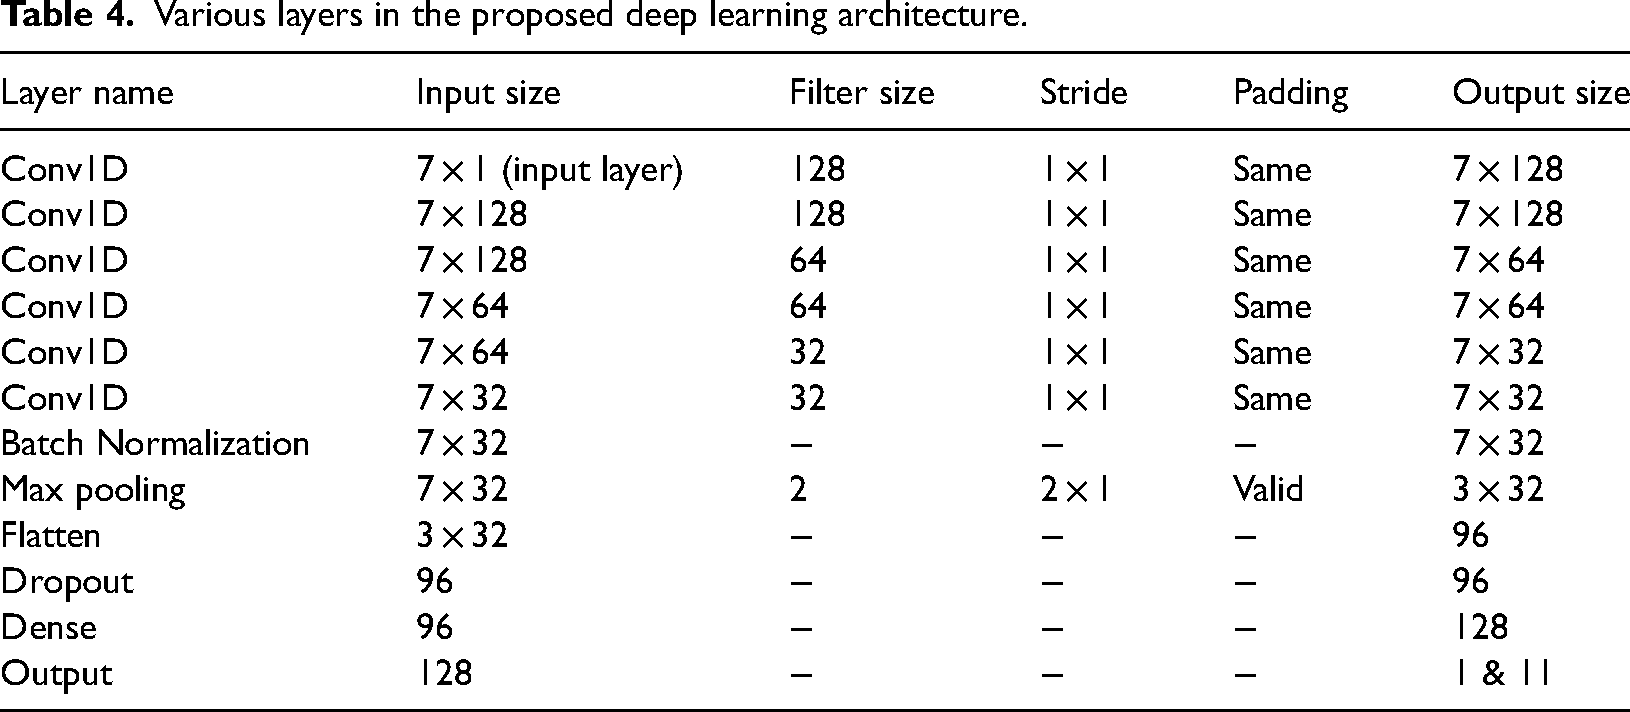
Additionally, batch normalization (BN) is utilized after the sixth 1D CNN model to reduce the effect of overfitting and enhance the training process. Therefore, the overall reliability and efficiency of the proposed model will be increased. Followed by the BN layer a max pooling layer is utilized to extract the main and dominating features of the input dataset. Further, a flatten layer, a dropout layer of 20% and a dense layer is used. After the dense layer, the two output layers are presented, which predict the PQ events type in the corresponding phases and the distance of the PQ events region from the assigned reference control point.
Evaluation metrics
Over the years, various performance metrics such as accuracy, recall, specificity, precision, and F1-score have been utilized to evaluate the effectiveness of the machine learning models. Therefore, this work also utilizes the performance metrics to examine the overall system behavior. Furthermore, the mathematical formulations of the metrics are presented with the help of Table 5. The presented performance metrics are utilized to evaluate the system performance.
Various performance metrics.
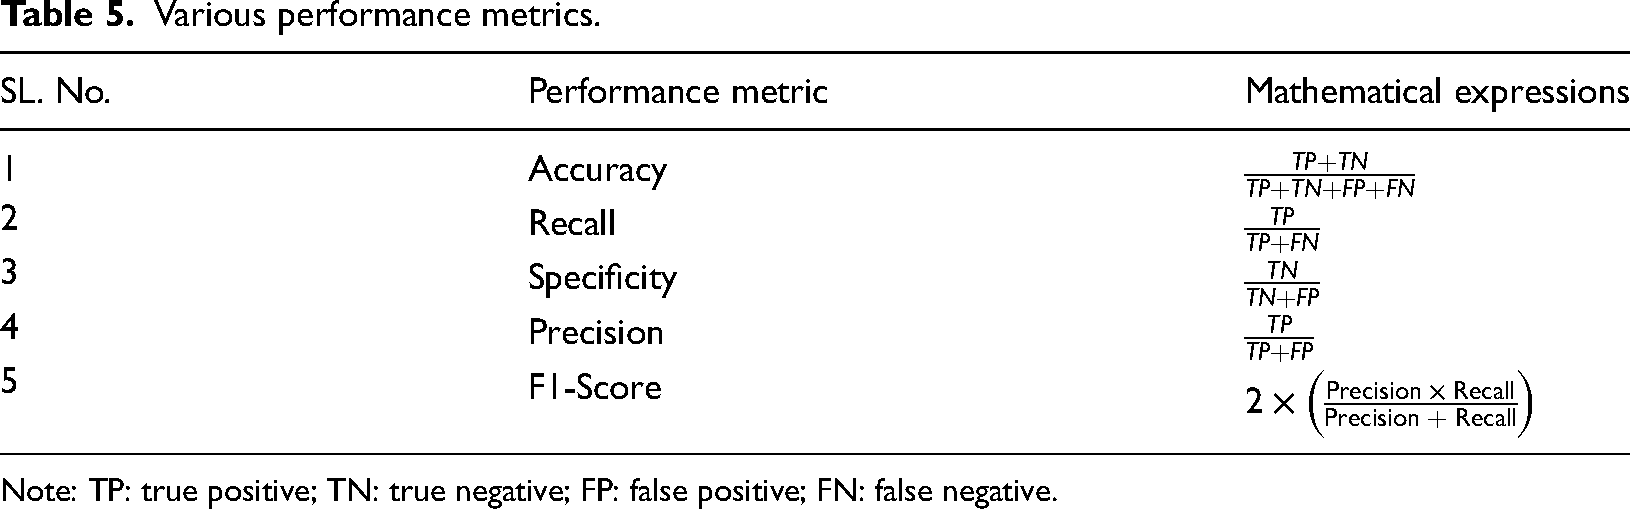
Note: TP: true positive; TN: true negative; FP: false positive; FN: false negative.
Loss functions
The loss function plays a significant role in any machine learning model as it appraises how well the predicted output aligns with the actual one. In this proposed dual-task CNN model for PQ events classification, the sparse categorical cross-entropy (SCCE) loss function and for PQ events location detection mean square error (MSE) loss functions are incorporated respectively. The concept of the SCCE loss function is commonly evolved from CCE loss and it is mostly utilized in multiclass classification problems. The generalized mathematical expression of the CCE loss function is given in (19.1) considering a single instance. For the multiclass problem, CE is utilized as CCE. Moreover, there is a basic difference in the application of CCE and SCCE loss functions that can be found in the representation of these loss functions. For multiclass classification problems, the CCE can be applied when the classes are small in numbers and they can be easily represented in one-hot encoded vectors. However, the SCCE loss function is also suitable for multiclass classification problems where the number of classes is large and they are directly represented by numeric values. In this classification problem, as the number of classes is 11, the SCCE loss function is implemented.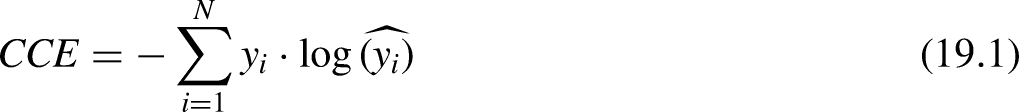
From the CE loss function, the SCCE can be developed. On the other hand, the mathematical expression of the mean absolute error loss function can be presented as: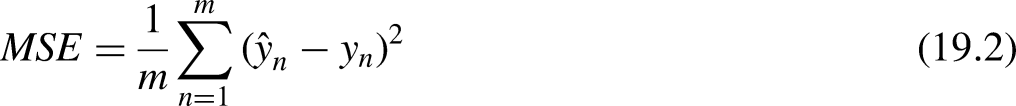
During the training phase, the mismatch between the actual and predicted output is calculated using the loss functions. Further, different optimizers are often utilized to minimize this mismatch. In this work, the Adam optimizer with a learning rate of 0.0001 is incorporated into the proposed dual-task model. The rest of the parameters associated with Adam optimizers are taken as the PQ events values. Accordingly, the trainable parameters of CNN layers are updated to minimize the difference between actual and predicted output. Once the model is updated with optimum trainable parameters, it is moved up to the testing phase. Finally, in this testing phase based on the trainable parameters the proposed CNN-based dual task protection scheme accomplishes PQ events classification with respective phase detection and PQ events location identification.
Result of proposed CNN-network
This section discusses an illustrative performance analysis of the proposed 1-D CNN-based dual-task protection scheme. Additionally, comparative analysis is carried out with a deep-learning model and available classical ML techniques to investigate the effectiveness of the proposed protection scheme. An elaborative discussion of the obtained results is presented as follows.
Comparative analysis considering different parameters
In this section, a comparative analysis is carried out between the deep-learning network and the suggested dual-task CNN model. The considered power system model is tested separately with the deep-learning network and proposed dual-task CNN architecture for 50 epochs with similar patience values. The comparative result analysis considering both configurations is presented for addressing the PQ events type classification as well as location identification. In the earlier published works, it has been observed that the different network-based protection schemes were employed to perform the PQ events classification, PQ events phase detection and PQ event location identification separately (Bukhari et al., 2020; Rai et al., 2021). Thus, this work presents a dual-task CNN architecture to address both the PQ events classification along respective phase detection and PQ events location identification issues. Hence, it can be stated that both the classification and the regression issues are addressed in the proposed model. The detailed result analysis is provided in the following sections.
PQ event classification
This section presents a detailed comparative analysis between a deep-learning model (Bukhari et al., 2020) and the proposed dual-task network for conducting the performance assessment, considering the PQ events type classification along with respective phase detection. As shown in Figure 12(a) and (b), the results indicate that the proposed dual-task model exhibits a better learning rate as well as it presents faster convergence. Critical observation also suggests that training and validation accuracy responses are nearly similar in the case of the proposed model. Whereas, in the case of the model shown in Bukhari et al. (2020), the accuracy responses do not follow each other considering our data. This response shows the effectiveness and justification of the proposed deep learning-based dual-task model. Furthermore, it should be also noted that the proposed model is taking less time (in terms of the number of epochs) to reach the accuracy value above 99%, whereas the compared model struggles to achieve a desired accuracy response.
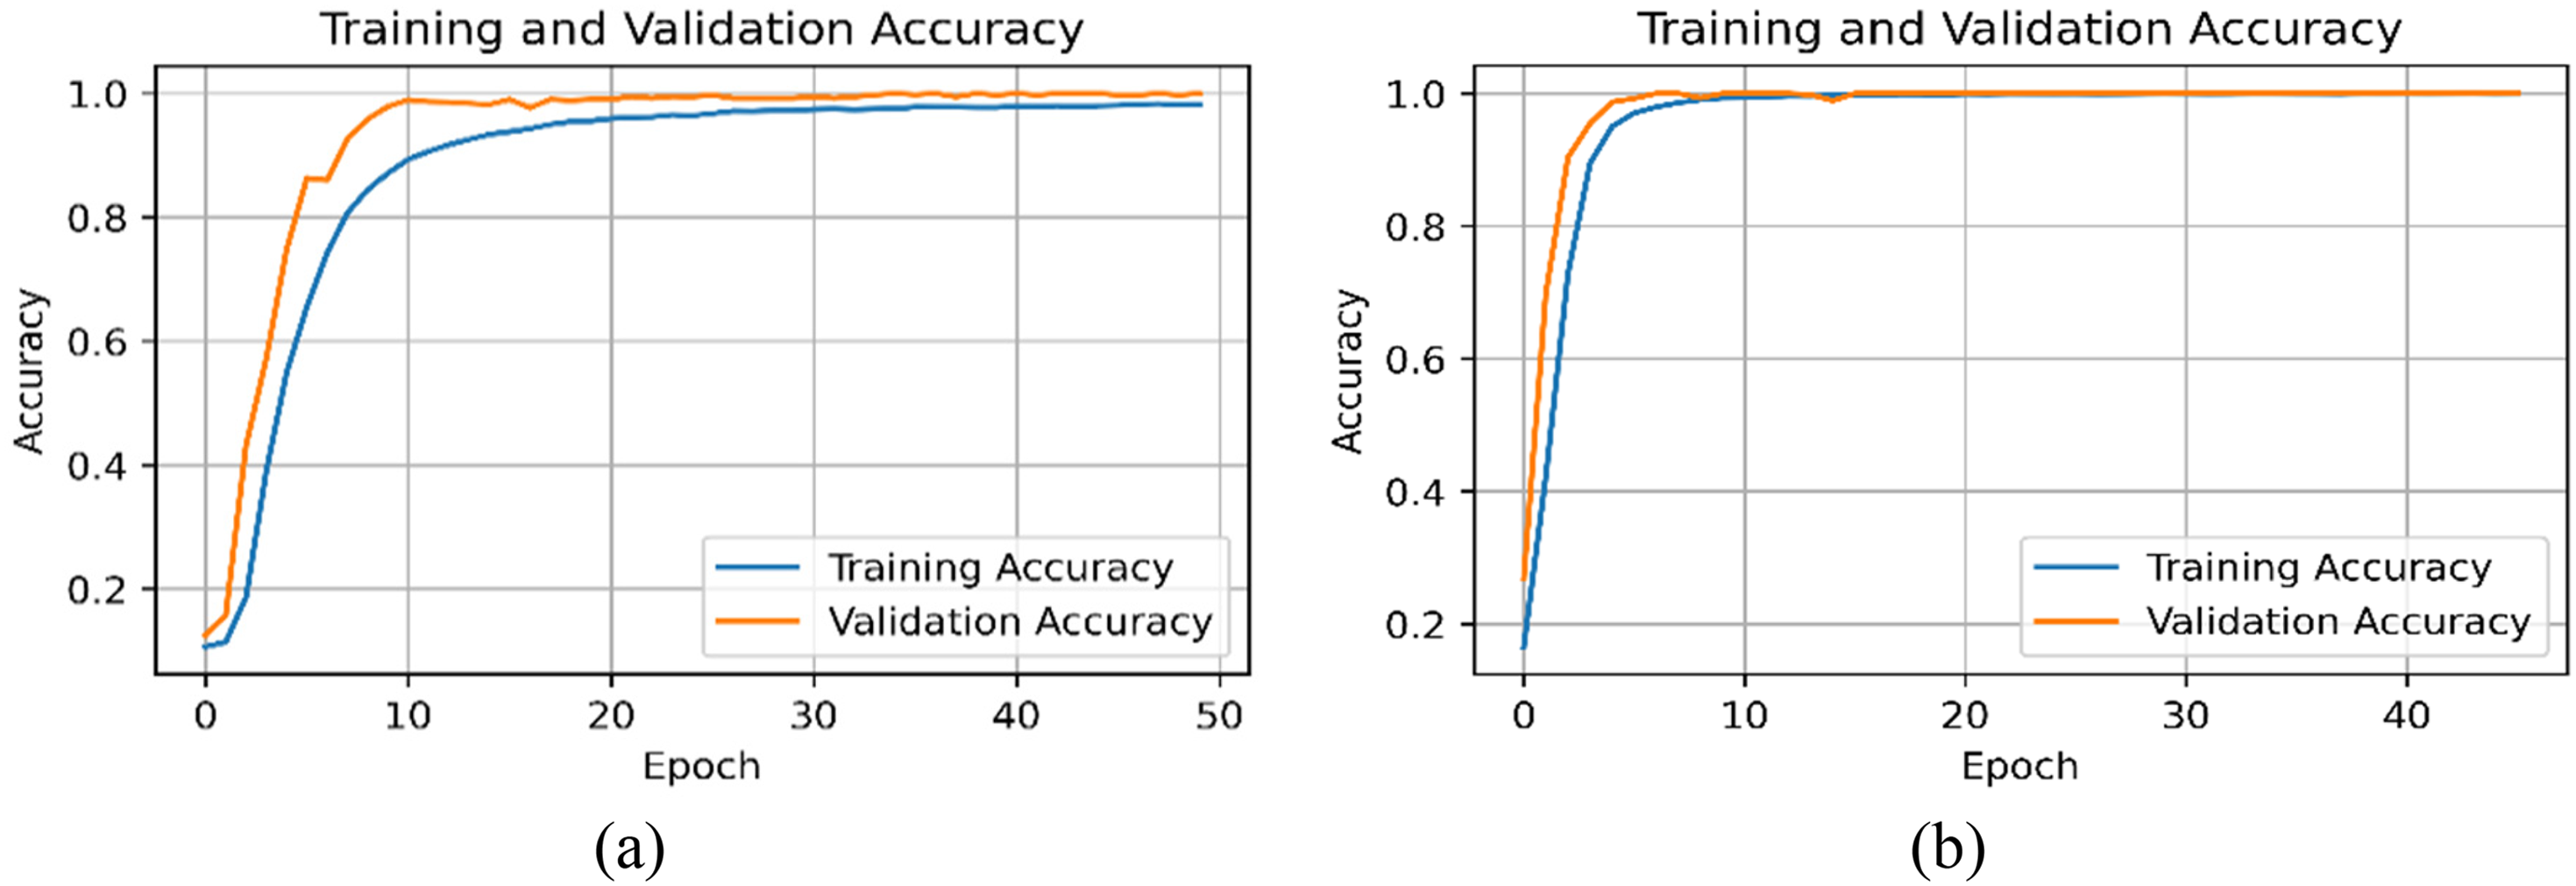
The training accuracy of the PQ events classification with respective phase module (a) with the dense network, (b) with proposed dual-task CNN.
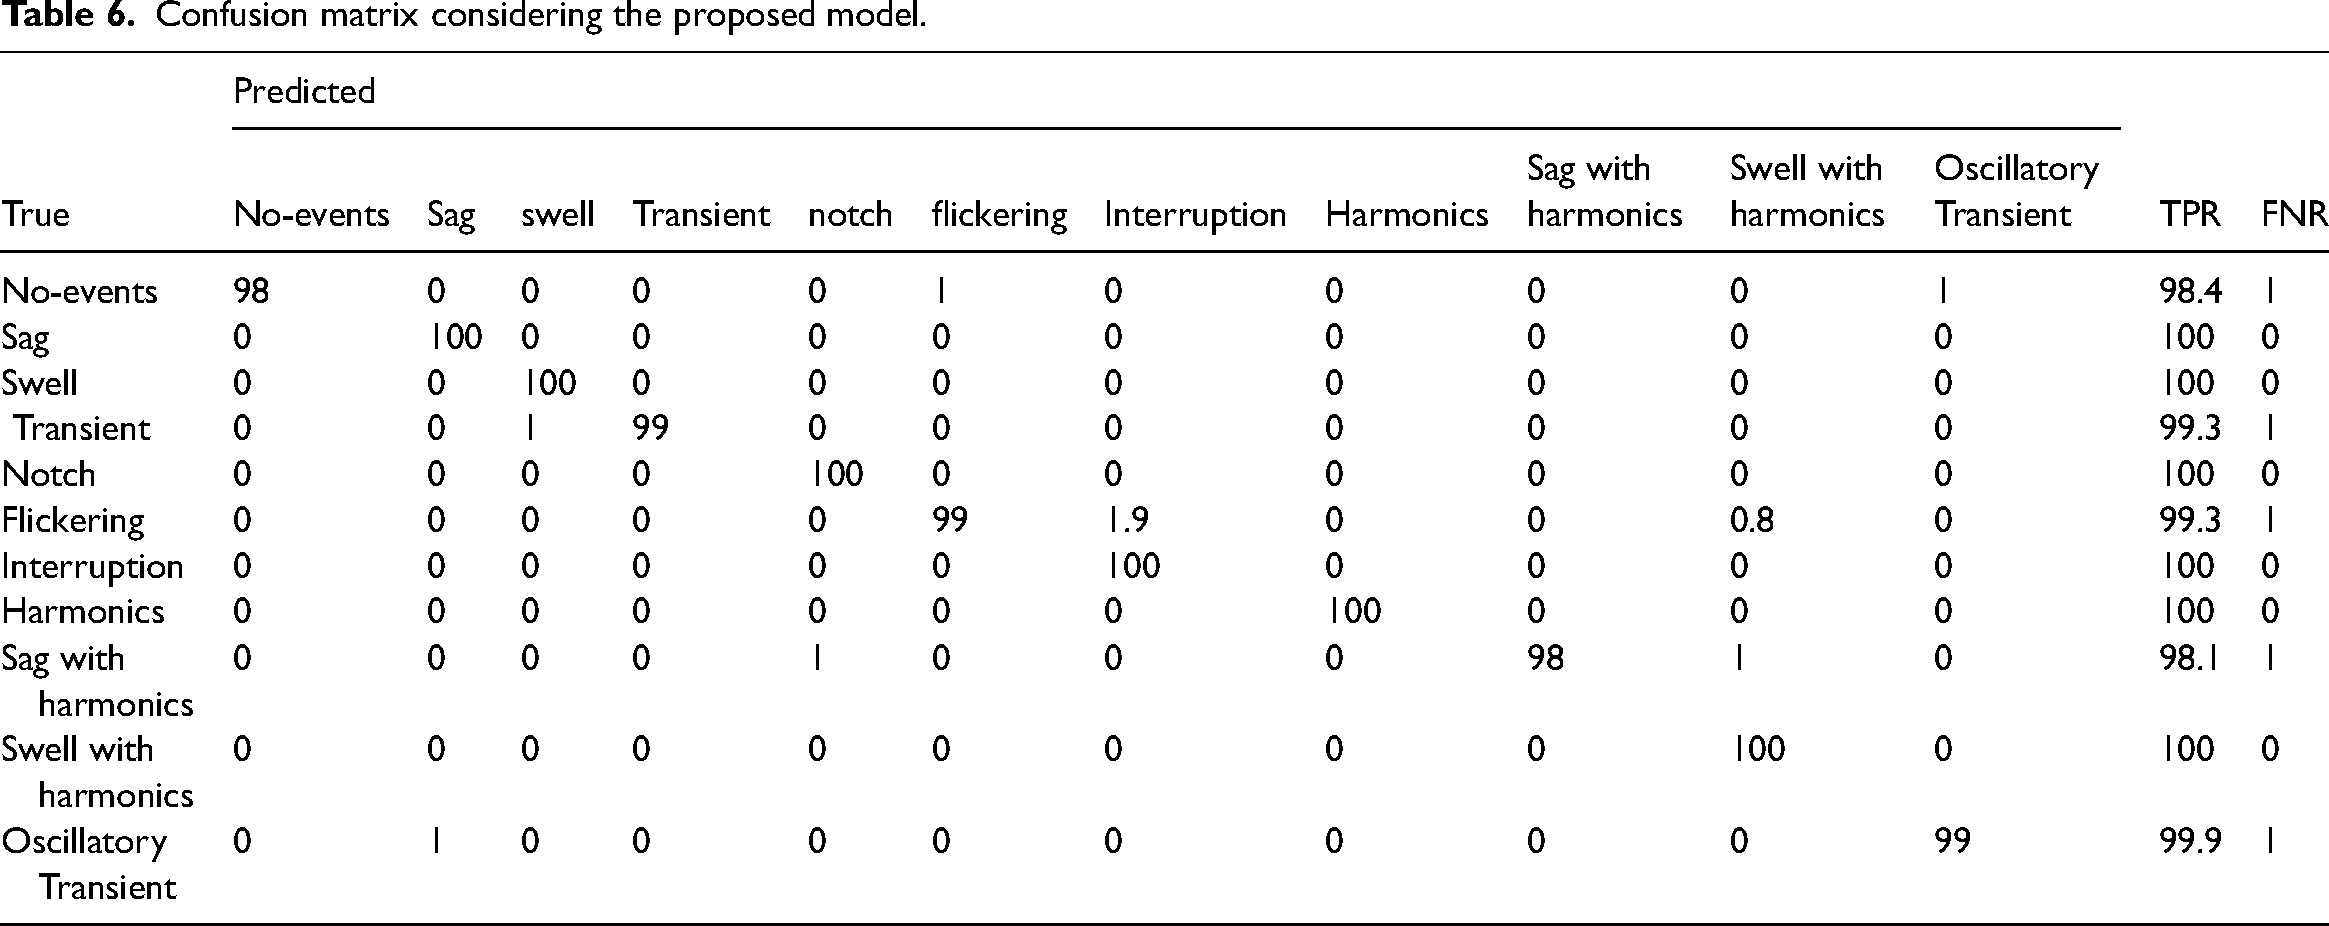
Additionally, the corresponding training loss responses are presented with the help of Figure 13, where it is observed that the loss parameter is minimum under the proposed dual-task model. Critical observation also indicates that the training loss in the other network reaches 0.8 over 50 epochs. Whereas, the training loss reduces below 0.5 with 10–15 epochs under the proposed dual-task CNN network. This shows the suitability and appropriateness of the proposed dual-task network. Table 6 is showing the confusion matrix by utilizing the proposed CNN.
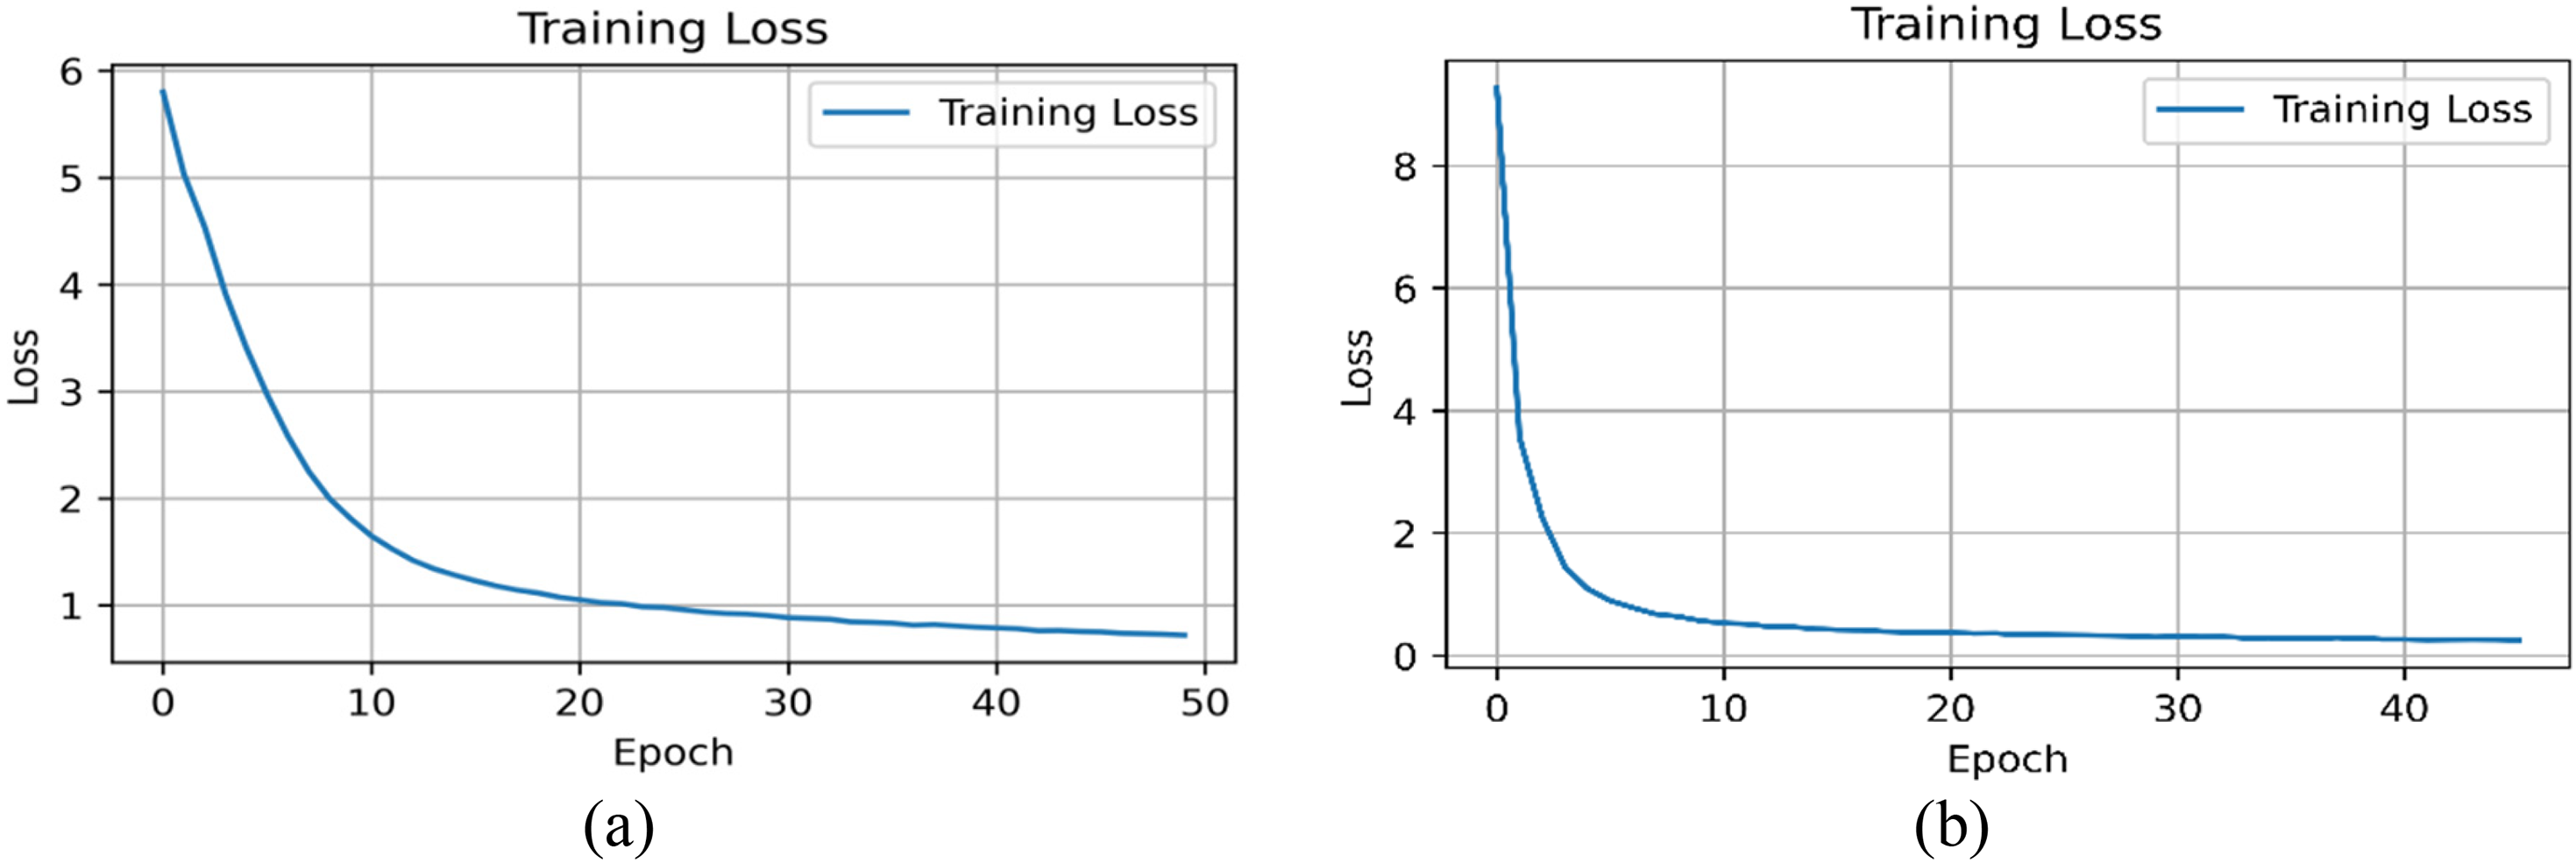
The training loss of the PQ events classification with respective phase (a) with dense network, (b) with proposed dual-task CNN.
Confusion matrix considering the proposed model.
Performance analysis and discussion
The results indicate that the proposed model significantly outperforms state-of-the-art approaches in accuracy, achieving 99.7%, which reflects its superior ability to detect and classify PQ disturbances. This can be attributed to the effective integration of TQWT and MCA with SALSA, which ensure precise feature extraction and noise suppression. Furthermore, the dynamic redundancy factor enhances the localization of signal components in time–frequency space, giving the model an edge over conventional methods.
In terms of computational efficiency, the proposed model demonstrates a 25% reduction in computational cost, making it more suitable for real-time applications compared to computationally intensive methods like LSTMs or hybrid STFT-DNN approaches. Additionally, the 30% faster convergence compared to CNNs underscores its efficiency in training, enabling quicker deployment.
Including this comparison not only highlights the advantages of the proposed approach but also provides a benchmark for future research in PQ event classification, emphasizing its real-world applicability and contribution to advancing the field.
Conclusions
The integration of deep learning-based methods for PQ event detection and classification offers substantial improvements over traditional approaches, as evidenced by the proposed dual-task deep learning model in this study. The model, which utilizes TQWT for precise signal decomposition and the MCA in conjunction with the SALSA, demonstrates enhanced accuracy and efficiency in classifying a diverse range of PQ disturbances, such as voltage sags, transients, and harmonics. The evaluation results show that the proposed approach achieves an impressive classification accuracy of 99.7%, with faster convergence and reduced computational costs compared to conventional methods. This makes it a viable solution for real-time PQ monitoring in modern power systems. The use of dynamic nonstationary redundancy factors and the robust feature extraction process ensures that the model can effectively handle both transient and steady-state disturbances, which are essential for maintaining system stability and reliability.
However, there are areas where the work can be further enhanced. First, incorporating a performance comparison with other state-of-the-art algorithms would provide a clearer benchmark, demonstrating the relative strengths and weaknesses of the proposed approach. Including additional details regarding the sources and sizes of datasets, along with the noise levels in the data, is crucial for ensuring the reproducibility and generalizability of the study. Furthermore, the scalability of the model to larger grid networks, as well as a more comprehensive statistical analysis or error quantification, would provide deeper insights into its robustness and reliability across various operational conditions. Moreover, future studies could focus on enhancing the model’s adaptability by investigating its performance in larger, more complex power grid networks, where multiple disturbances may occur simultaneously. This could involve deploying the model on actual grid data and testing its ability to scale in real-world environments. Additionally, integrating model deployment strategies, such as edge computing or cloud-based systems, could further improve its utility for large-scale PQ monitoring applications. In conclusion, while the proposed model represents a significant advancement in PQ event classification, it can be further improved by addressing the mentioned limitations and expanding its applicability to larger and more varied datasets. This would ensure that the model remains a powerful tool for maintaining the stability and efficiency of modern power systems. Future work should continue to refine these aspects and explore the integration of additional disturbance types and real-time monitoring techniques, which are crucial for ensuring long-term reliability and minimizing system failures in evolving power grids.
Footnotes
Authors contributions
All authors contributed equally to this work.
Consent to publish
All authors agreed to this submission.
Data availability
Data sharing not applicable to this article as no datasets were generated or analyzed during the current study.
Declaration of conflicting interests
The authors declared no potential conflicts of interest with respect to the research, authorship, and/or publication of this article.
Funding
The authors received no financial support for the research, authorship, and/or publication of this article.