
Abstract
Accurate estimation of overlying strata subsidence and surface deformation caused by coal extraction is crucial for assessing the impact of mining activities on surface infrastructure. In this study, we investigated the subsidence evolution of overlying strata and ground surface induced by underground mining using finite element simulation and focus on a mining district in the Yu-Heng mining area of the central Ordos Basin and then, the influence of underground longwall mining on the surface roads was evaluated. A three-dimensional geological model of the mining district was constructed, considering the actual stratum structures and the deterioration effect of water on rock mechanical properties. The whole coal mining process was simulated to predict the evolution of the subsidence basin at different mining stages, and the surface deformation characteristics caused by coal mining were calculated. Results showed that the subsidence characteristics by numerical simulation were highly consistent with the records of surface subsidence in the adjacent areas, indicating that the constructed geological model can accurately reflect the actual geological conditions and the deformation behaviors of overlying strata. A comparative study revealed that the mechanical properties of the generalized layers determined by processing the mechanical parameters of dry core samples will be much higher than those of the natural strata under the in situ water-saturated condition, and then the subsidence caused by coal mining will be significantly underestimated. Thus, the water-induced mechanical property deterioration of overlying strata must be fully considered when constructing geological models.
Keywords
Introduction
Safety is a key indicator for evaluating the feasibility of coal mining activities (Fathi et al., 2017; Helm et al., 2013; Marschalko et al., 2012). Under the background of coal mining continuously developing and gradually migrating from no man's land to human activity areas, accurately evaluating the impact of coal mining on infrastructures such as buildings and roads has become a difficulty that hinders large-scale and efficient coal exploitation (Chen et al., 2016; Luo et al., 2019). Taking China as an example, the highway safety problems caused by coal mining subsidence are becoming increasingly severe in the vast majority of coal industrial production bases, such as Taiyuan, Yangquan, Lvliang and Changzhi of Shanxi Province (Hao et al., 2020), Fushun, Benxi and Fuxin of Liaoning Province (Nie et al., 2017; Yang, 1998), and Huaibei and Huainan of Anhui Province (Liu et al., 2023b). Therefore, it is of great significance to reveal the rules and mechanisms of coal mining subsidence. Scholars have used multiple methods to reveal the rules and mechanisms of coal mining subsidence, including theoretical and numerical calculation, field measurement, numerical simulation, and physical simulation methods.
Theoretical analysis and calculation are the most economical and efficient methods for predicting surface subsidence. Scholars have proposed various theories and analysis models to describe the deformation and movement rules of overlying strata, including the key layer control theory (He et al., 2005; Qian et al., 1996; Yu et al., 2018), the dual medium coupling models (Gu et al., 2013; Ma et al., 1997; Song et al., 2003), and the three-medium coupling models (Yuan and Yang, 2017). In addition, numerical methods such as section function, typical curve, and influence function methods, have been widely adopted to predict coal mining subsidence. The influence function method has been most widely used, because of their precise physical meanings of function parameters (Ren et al., 2010). The probability integration method, derived from Litwiniszyn's stochastic medium theory (Litwiniszyn, 1974), was proposed by Liu and Dai (2016). However, as the probability integration method was created based on horizontal homogeneous medium theory, its applications in steeply inclined coal seams are limited. Besides, the movement laws of overlying strata and the essential mechanical mechanisms of deformation and movement are less involved.
The field measurement method is the most reliable technology for investigating coal mining subsidence (Zhang et al., 2015, 2022). However, due to the shortcomings of time-consuming, high cost, and hysteresis, the field measurement method was mainly used to analyze the influencing factors of subsidence behaviors and was less applied in predicting rock deformation and surface subsidence characteristics. Based on the field measurement data, Wang and Xia (2013) found that the surface subsidence under thin bedrock is more intensive than that under normal thickness bedrock. Xu et al. (2016) revealed the influence of geological conditions on the surface movement parameters by analyzing the recorded surface movement data. Wang et al. (2023) obtained and analyzed the long-time series surface deformation results by adopting the time series Interferometric Synthetic Aperture Radar (InSAR) monitoring technology.
The physical simulation method is an effective method for studying the deformation and displacement laws of overlying strata (Whittaker et al., 1990; Whittaker and Reddish, 1989), which constructs geological models by using similar materials to investigate the mining subsidence rules and the corresponding mechanisms (Xie et al., 2009). By adopting a physical simulation, Dai et al. (2010) found that the loose layers had an alleviated effect on the mining-induced damages (the maximum subsidence value of surfaces was smaller than that of rock layers) but increased the influence areas of subsidence. Wang et al. (2013) summarized the distributions of caving zones, fractured zones, and bending subsidence zones and the movement and failure laws of overlying strata during coal mining by conducting similar material simulation experiments. Ghabraie et al. (2015) designed a physical experimental model and studied the surface subsidence characteristics in the overlapping areas of goafs. However, the physical simulation method has unavoidable shortcomings, including time-consuming and complicated operations. Besides, due to the difficulty in simulating the bonding characteristics of interfaces between different strata, it is impossible to reconstruct the stress state of natural strata, which may result in significant deviations between the subsidence prediction results and the actual subsidence values.
Compared with the physical simulation, the numerical simulation method can take the geometrical shape of geological bodies, the topography of the surface, and the nonlinear deformation behaviors of underlying strata into account (Sainsbury et al., 2011; Salmi et al., 2016; Zuo et al., 2017). There has been much research on studying coal mining-induced subsidence by using the numerical simulation method and considering the actual geological conditions (Unlu et al., 2013; Xu et al., 2013). Ghabraie et al. (2016) simulated the development processes of rock caving, deterioration, and subsidence during multilayer mining using a finite element simulation method. Sepehri et al. (2017) established a three-dimensional (3D) elastoplastic finite element model to predict the surface subsidence due to underground mining activities. Zhao and Konietzky (2020) investigated the surface movement during active longwall mining and during the flooding after mine closure by adopting numerical analysis. Liu et al. (2023a) established a surface deformation calculation model under different loose layer-to-bedrock thickness ratios (LBR) and discussed the influence of LBR on the surface deformation parameters.
However, in the previous research, the influence of some essential geological conditions, such as the weak layer interbeds in overlying strata and the strength reduction of strata caused by water–rock interactions, was usually neglected. Consequently, the simulation results of surface subsidence may be underestimated.
For this study, we focus on the Balasu coal mine of the Yu-Heng mining area of Shaanxi (China) as an example. We constructed a 3D geological model by considering the stratigraphic textures and rock mechanical properties and conducted the numerical simulation of the coal mining process. Based on the simulated subsidence values of each node on the surface, the surface deformation parameters were calculated, and the impact of coal mining activities on the surface highways was evaluated. It is important to note that the fractured layer interbeds and the deterioration effect of water saturation on rock mechanical properties were fully considered while determining the mechanical parameters of generalized layers. The insights gained from this study on surface subsidence and deformation patterns can be valuable for the design and safety evaluation of under-highway coal mining operations.
Geological settings
The Yu-Heng mining area is tectonically located in the south-central part of the Shaanbei slope (Figure 1), a secondary tectonic unit in the central Ordos Basin, China. The structural framework of this mining area is controlled by a monoclinic structure that slightly inclines to the NWW direction.
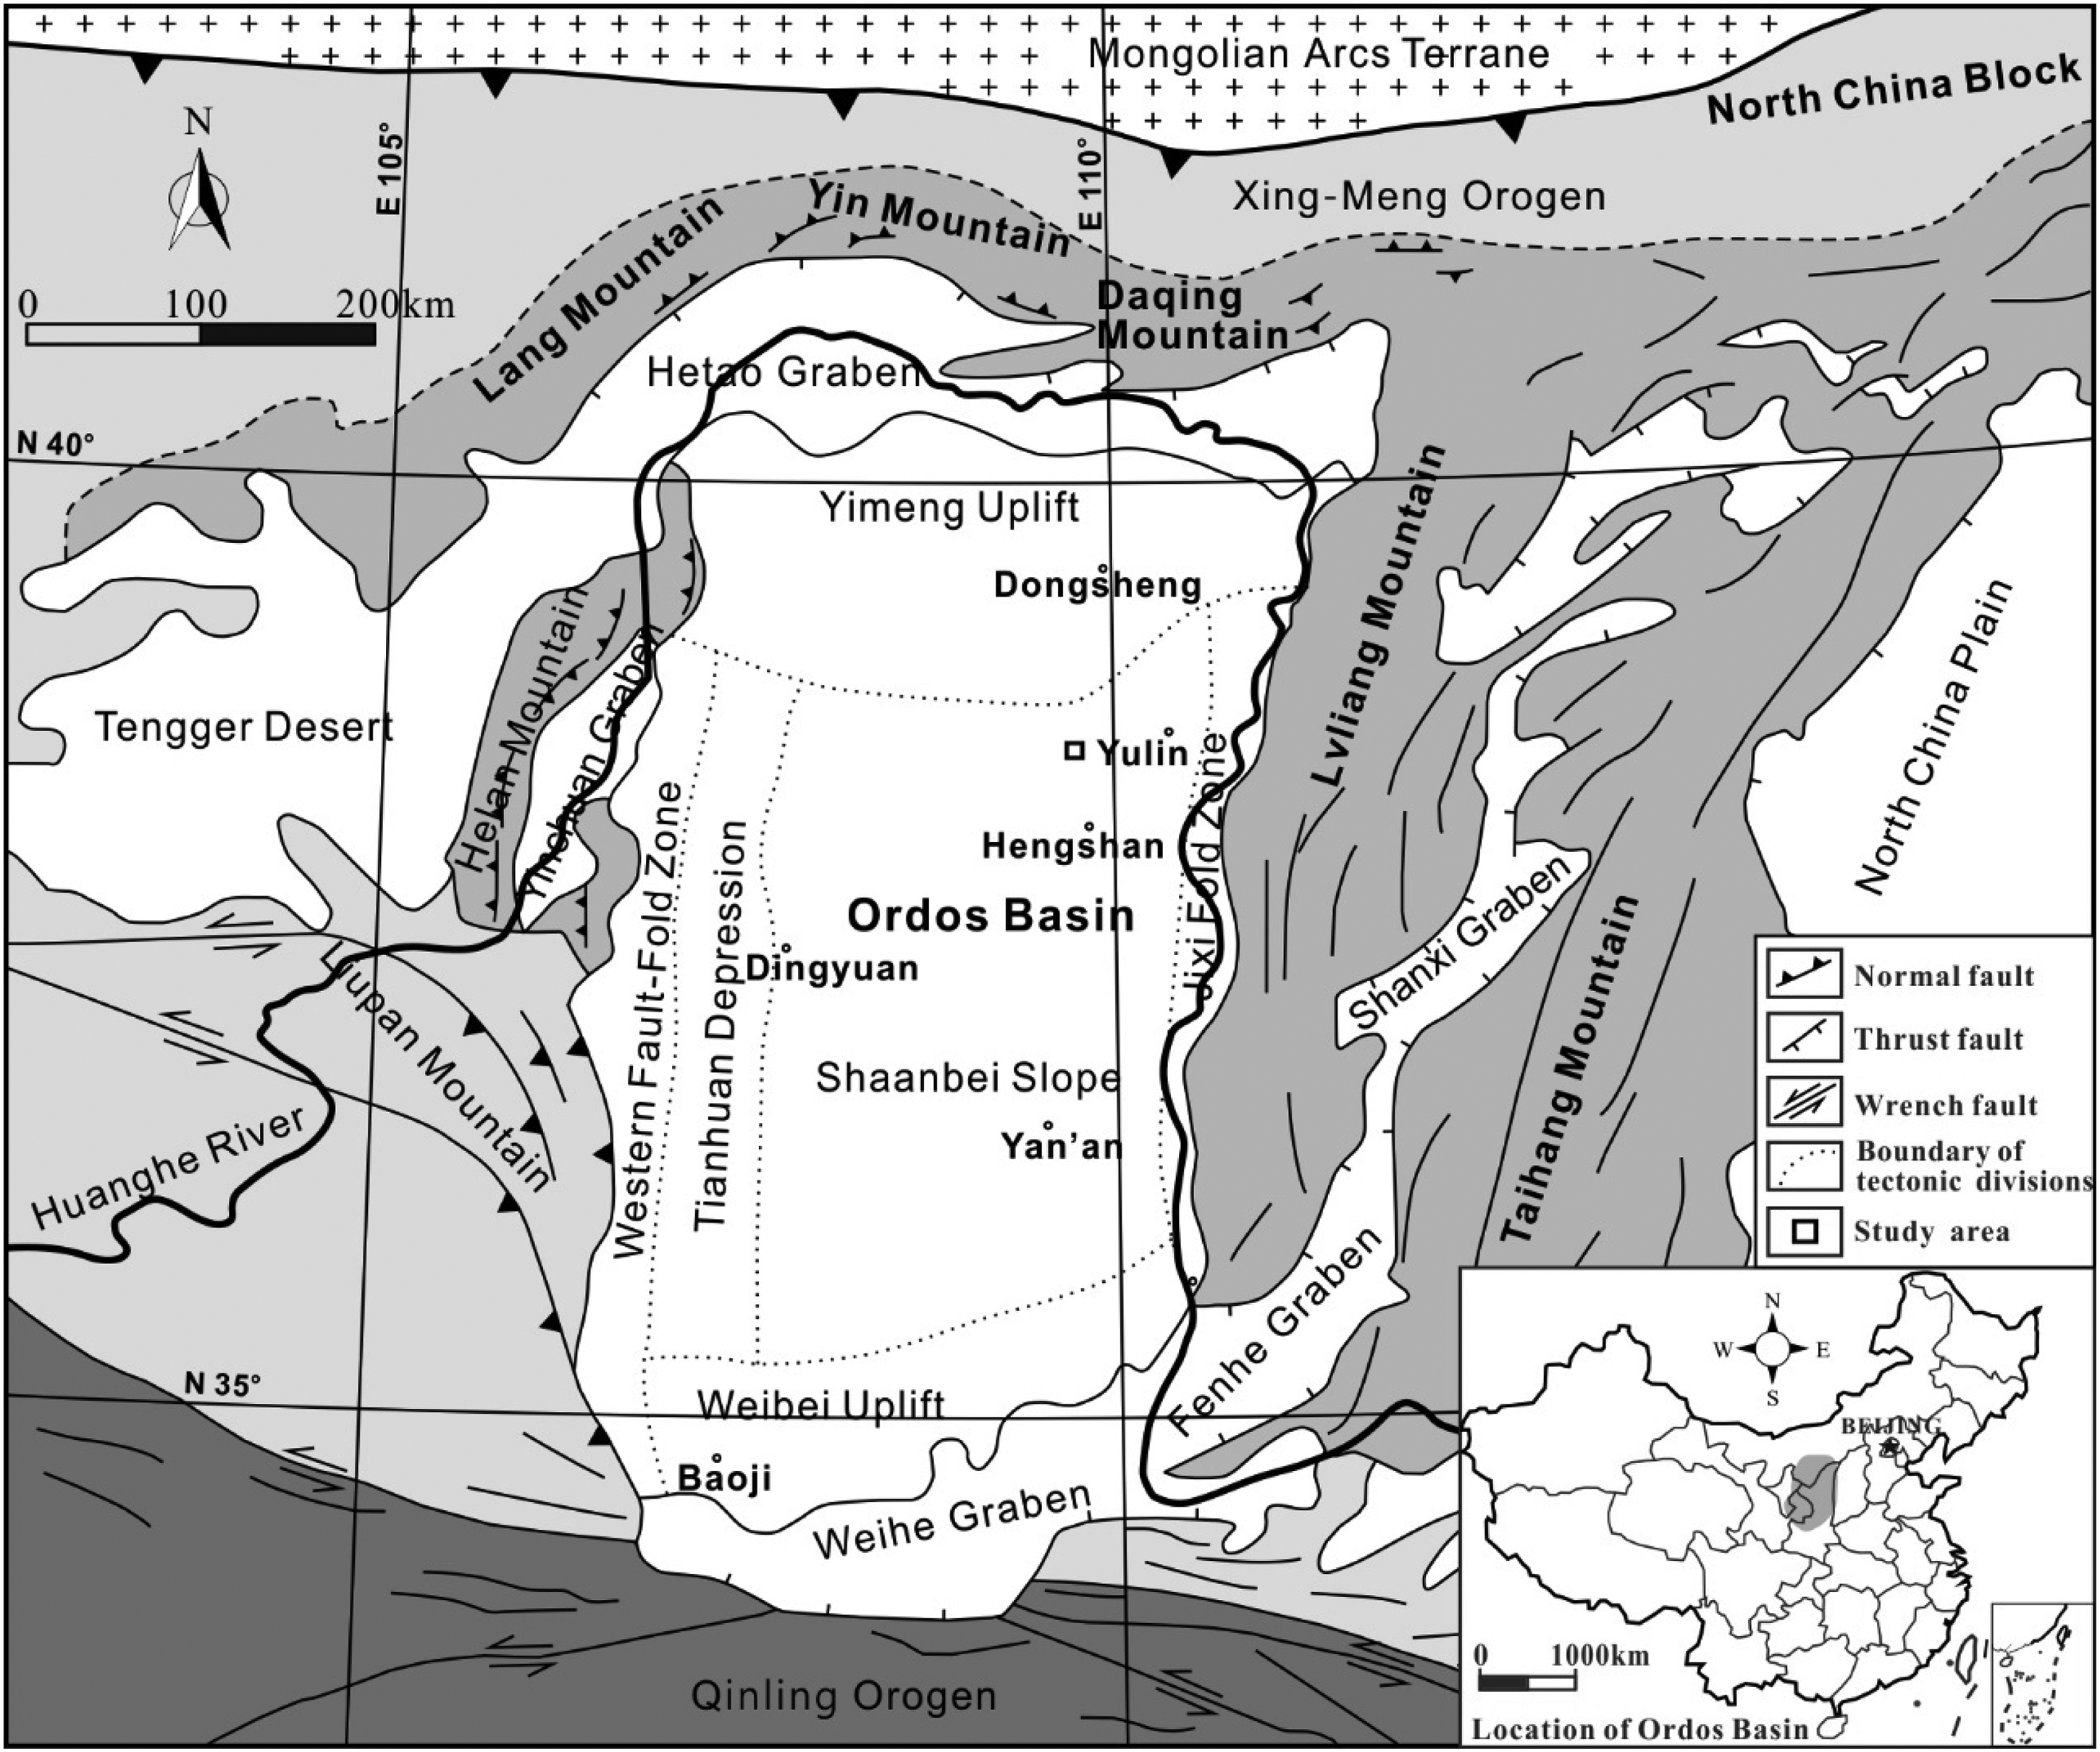
Geographical position and structural zoning of the Ordos Basin.
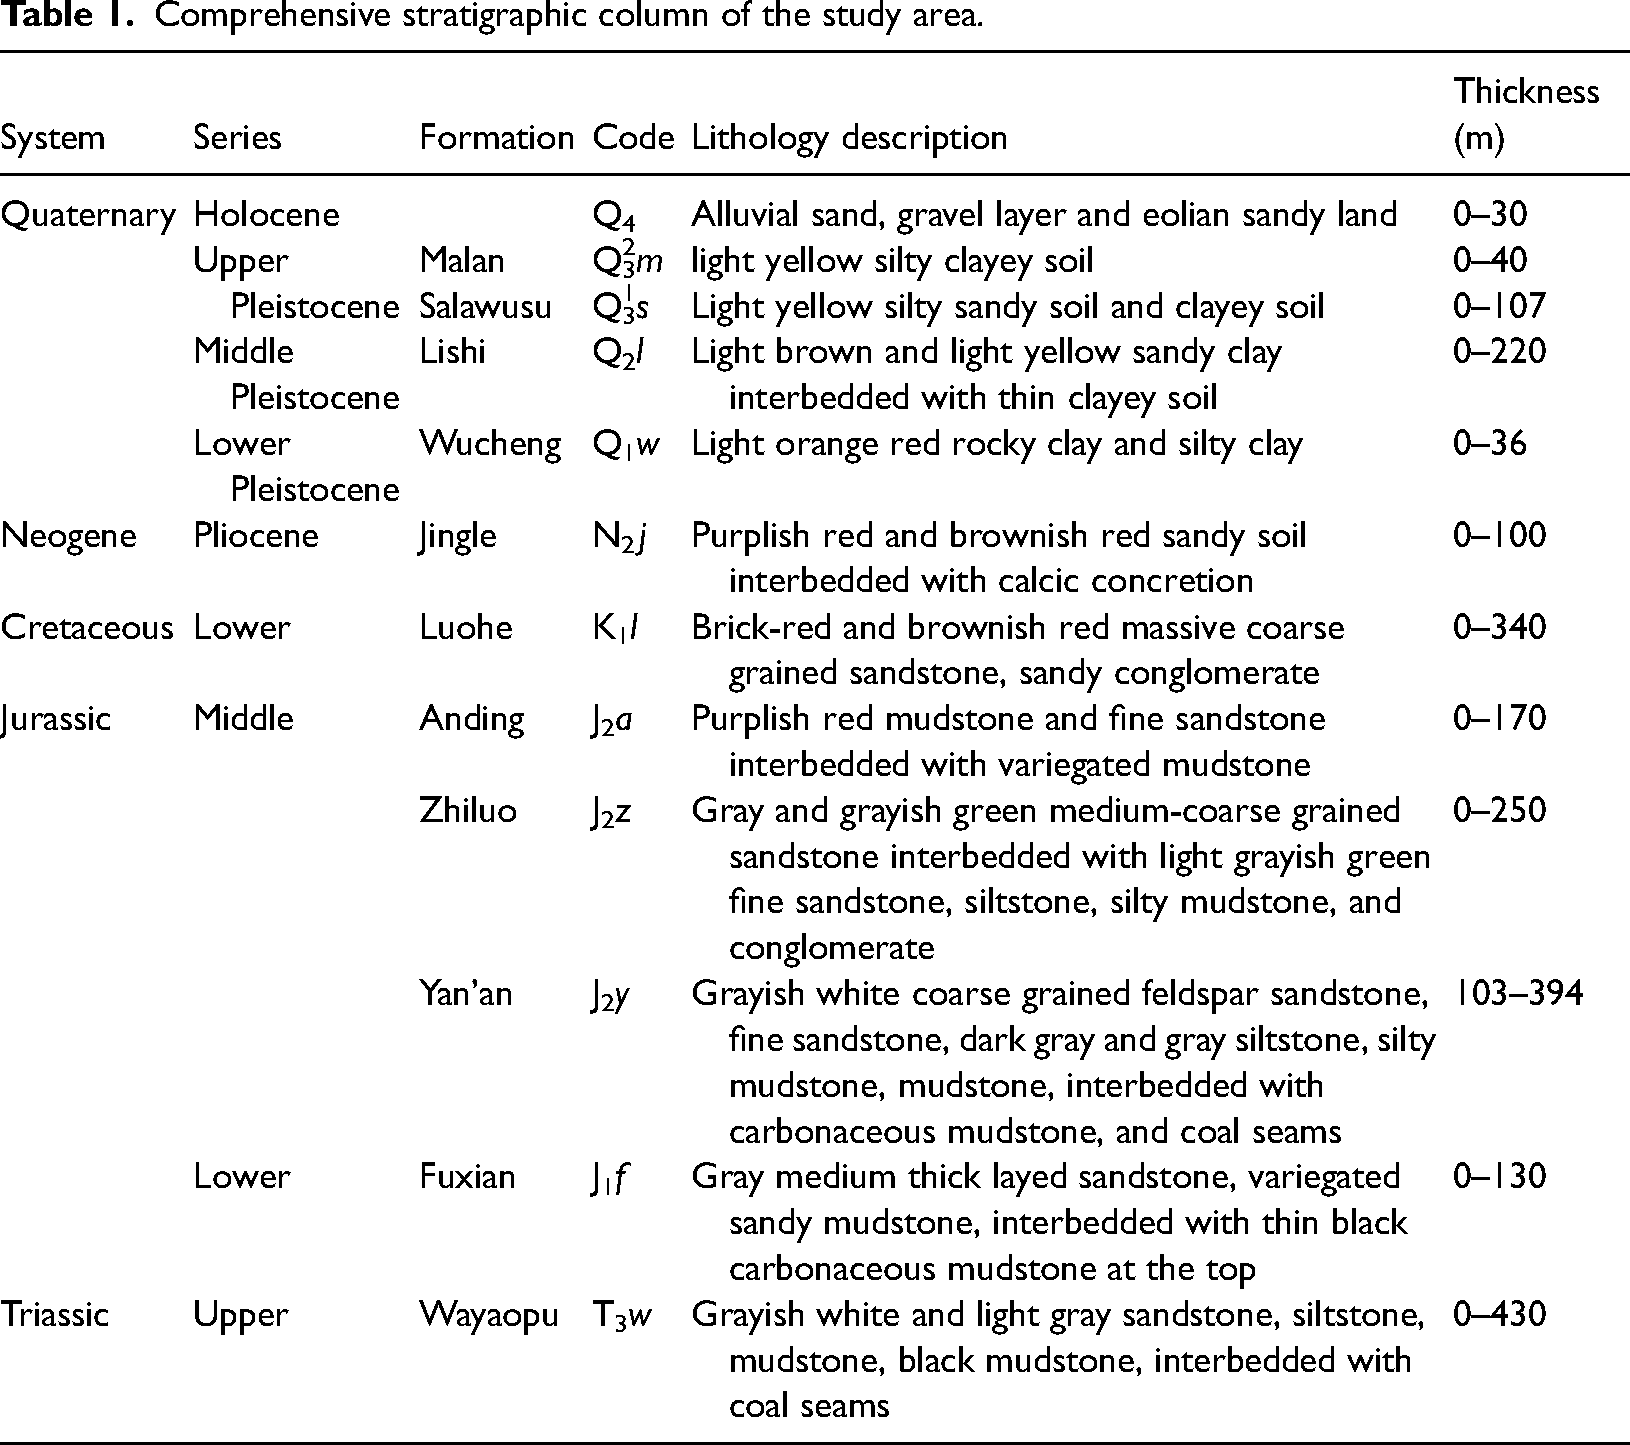
The strata in the study area are consistent with the geological formations found in the Dongsheng-Huanxian region, which is part of the Ordos Basin subregion in North China. According to the drill core observations (Table 1), the strata over the Upper Triassic series mainly includes, from the older to the younger, the Fuxian Formation (J1l) of the Lower Jurassic, the Yan’an Formation (J2y), Zhiluo Formation (J2z), and Anding Formation (J2a) of the Middle Jurassic, the Luohe Formation (K1l) of the Lower Cretaceous, the Jingle Formation (N2j) of the Pliocene, and the Quaternary (Q). The Yan’an Formation is the main coal-bearing stratum of the study area and contains eight coal seams that can be compared regionally, of which coal seams #2, #3, and #8 are minable coal seams in the whole or most of the mining areas.
Comprehensive stratigraphic column of the study area.
Geological model construction and surface deformation parameter calculation
In this study, a mining district of the Balasu coal mine was selected as the study area. The mining district extends from east to west and is about 360 m wide from north to south. The mining district is being mined from east to west and will cross the Yubu Road and the internal roads of the coal mine. First, we constructed a 3D geological model based on the geological information such as the stratigraphic textures, the test results of rock mechanical properties, and the records of surface subsidence in the adjacent areas. On this basis, we stimulated the under-highway coal mining process to estimate the mining-induced subsidence of overlying strata and surface and discussed the influence the water-induced deterioration on surface subsidence characteristics. Then, the surface deformation parameters were calculated and used to evaluate the influence of mining activities on the safety of surface roads.
Numerical simulation platform and assumptions
The numerical simulations of coal mining across highways were carried out on the Mechanical APDL platform of the Ansys 18.0 software, which is based on the Ansys Parametric Design Language. Powered by the scripting language, the Mechanical APDL platform can easily and efficiently realize parametric modeling, parametric loading and solution, and the display of parametric postprocessing results.
Similar to other finite element simulations, the following assumptions were contained to simplify the geological model and improve the calculation efficiency. (a) Assumption of homogeneous and isotropic material properties, that is, the material properties of each generalized layer (including density, elastic modulus, Poisson's ratio, cohesion, and internal friction angle) were assumed to be homogeneous and isotropic. (b) The linear elastic assumption, that is, the deformation of generalized layers was assumed to conform to the linear elastic constitutive relation. The specific parameters, including the structure and size of the geological model, mechanical parameters of generalized layers, boundary conditions, and time step settings, were introduced in detail in the “Geological model design and construction” through “Time step setting for coal mining simulation” sections.
Geological model design and construction
The width of the mining district is set to 360 m. Since the constraint effect of boundary walls will significantly affect the displacement and subsidence prediction values of numerical simulation, the numerical model should be appropriately larger than the target area. The geological model was set to be 2000 m long from east to west and 1200 m wide from north to south and roughly centered on the mining district.
As illustrated in Table 1, the overlying strata consist of, from the older to the younger, the fourth member of the J2y Formation, the J2z Formation, the J2a Formation, the K1l Formation, and the Quaternary. The fourth member of the J2y Formation is mainly composed of mudstone, silty mudstone, and medium-fine feldspathic sandstone. The J2z Formation can be divided into three members based on the characteristics of sediment particle size changes, and each member generally exhibits a positive sedimentary cycle of “medium sandstone, fine sandstone, siltstone, muddy siltstone, and mudstone.” The J2a Formation can be divided into two members: the lower member is mainly composed of medium and fine feldspathic sandstone; the upper member is mainly composed of mudstone and silty mudstone. The K1l Formation mainly consists of medium and fine sandstone and exhibits uniform lithology.
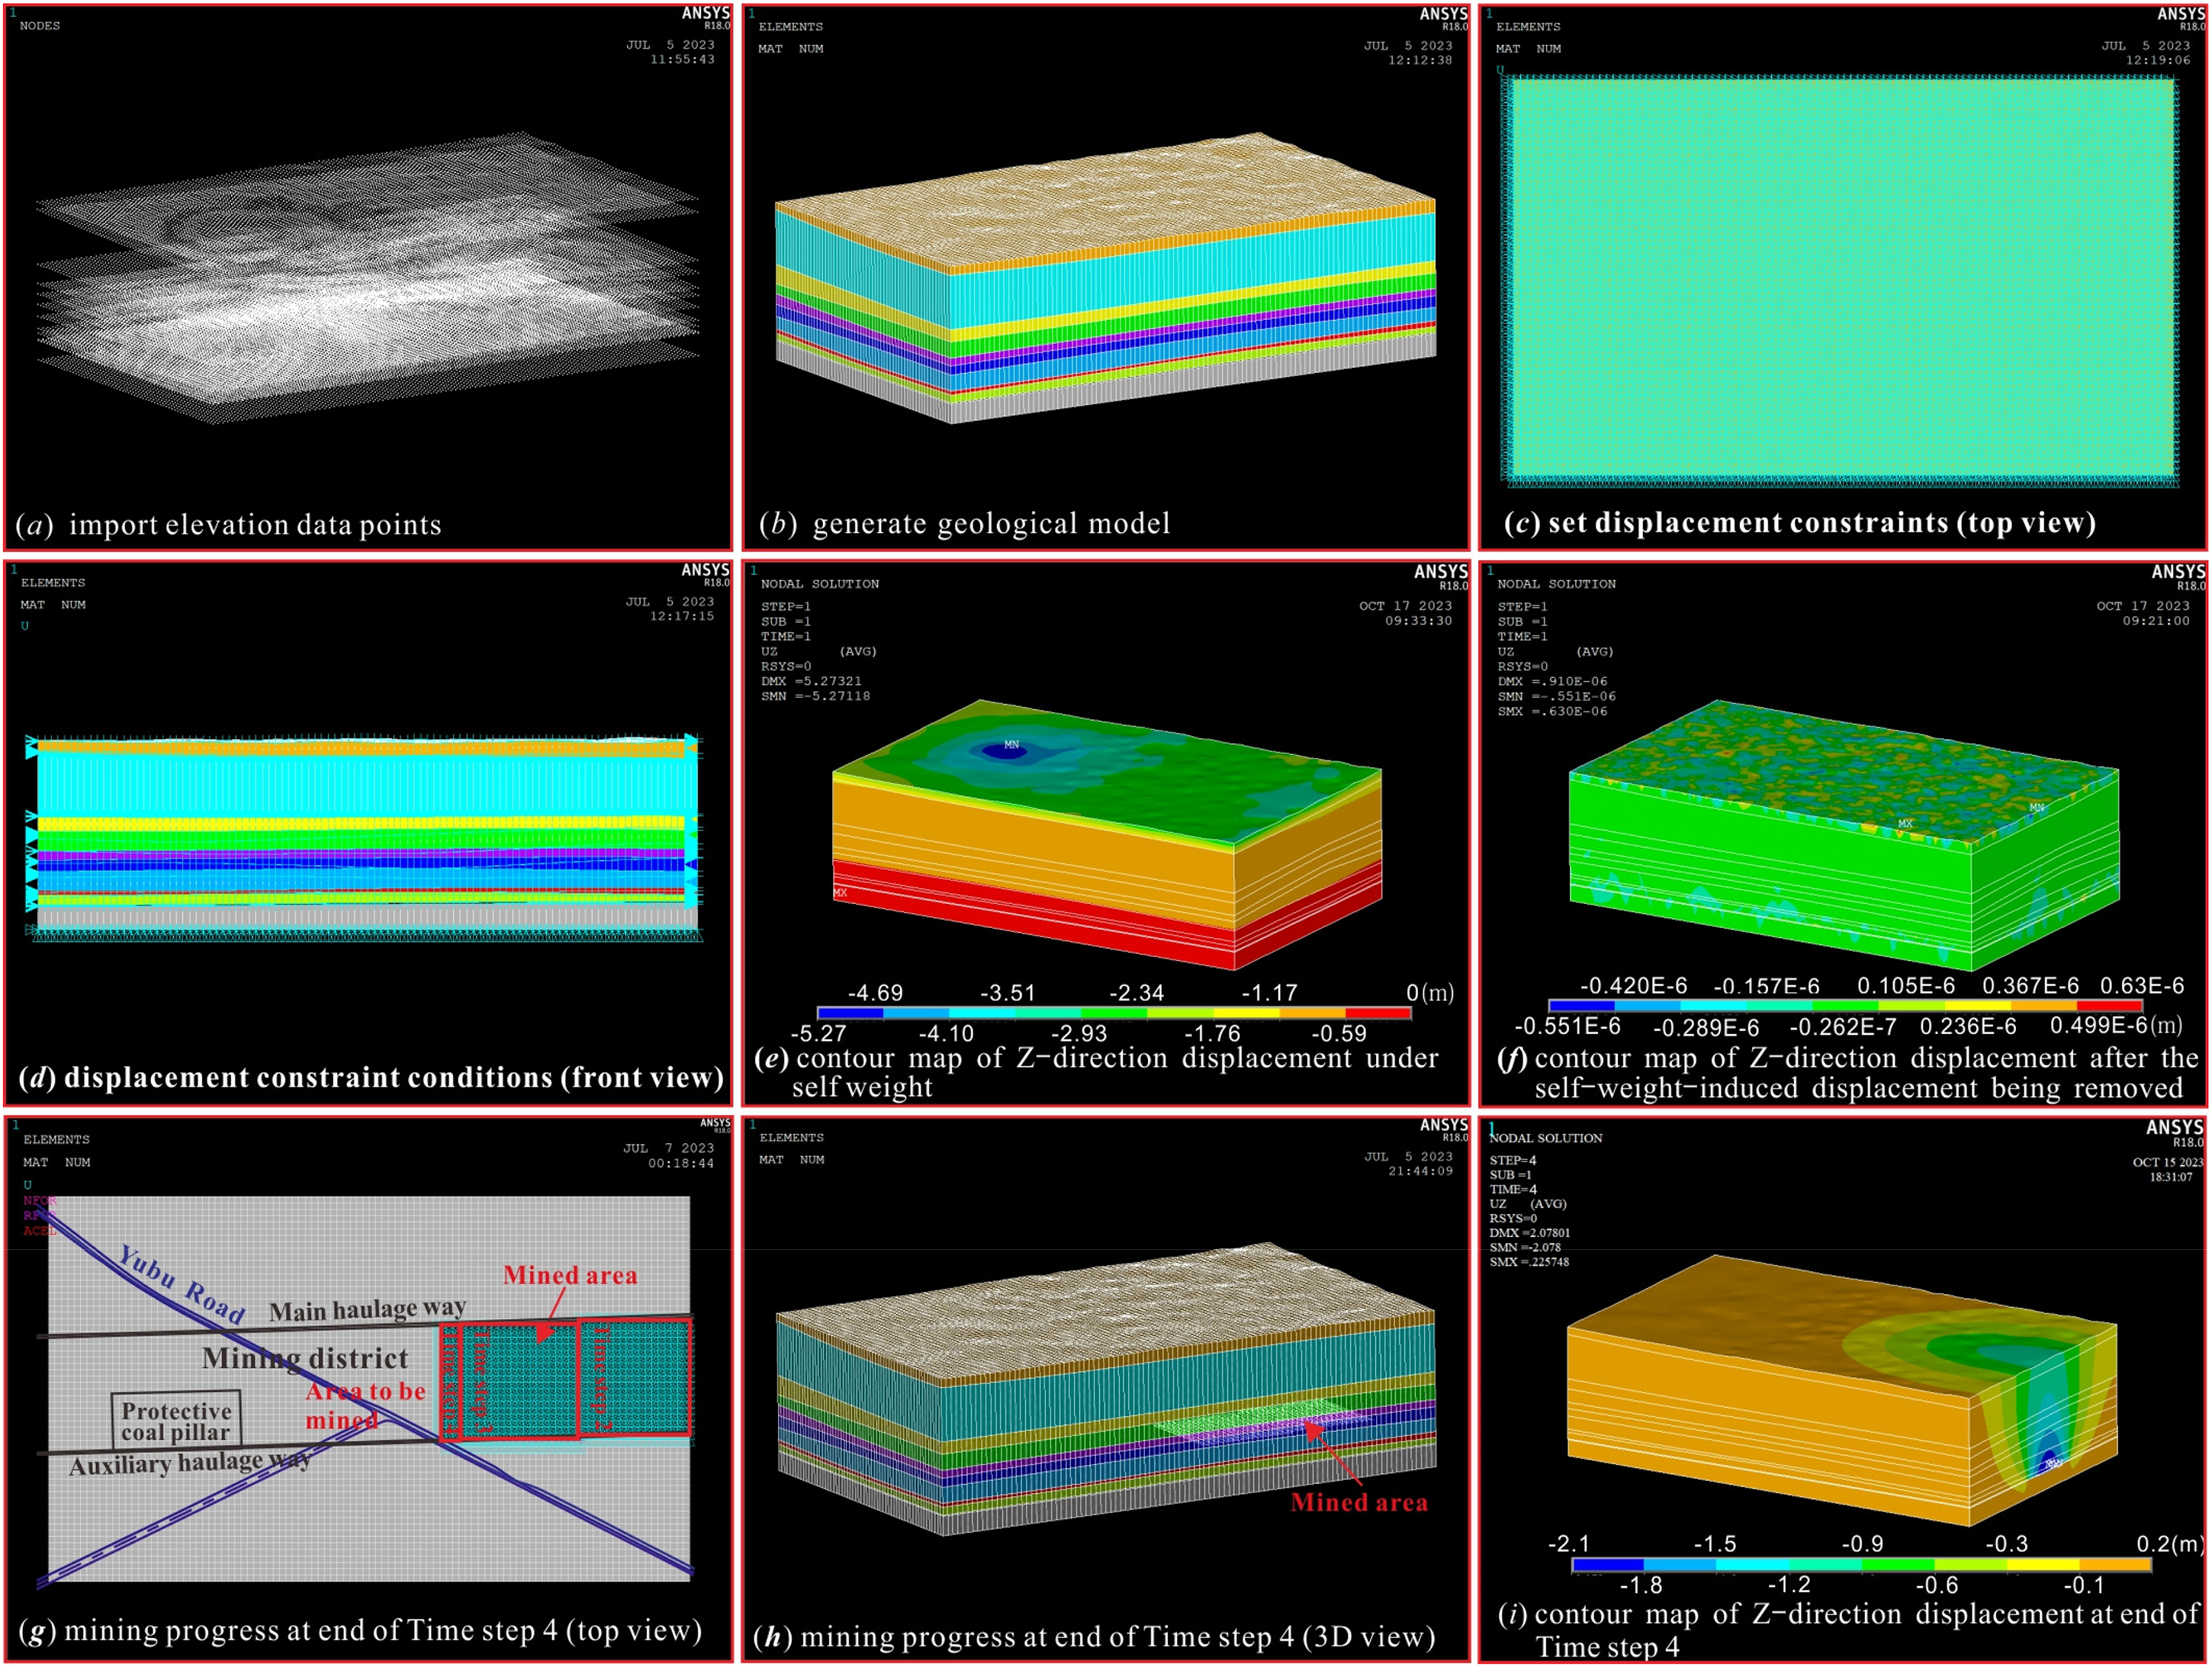
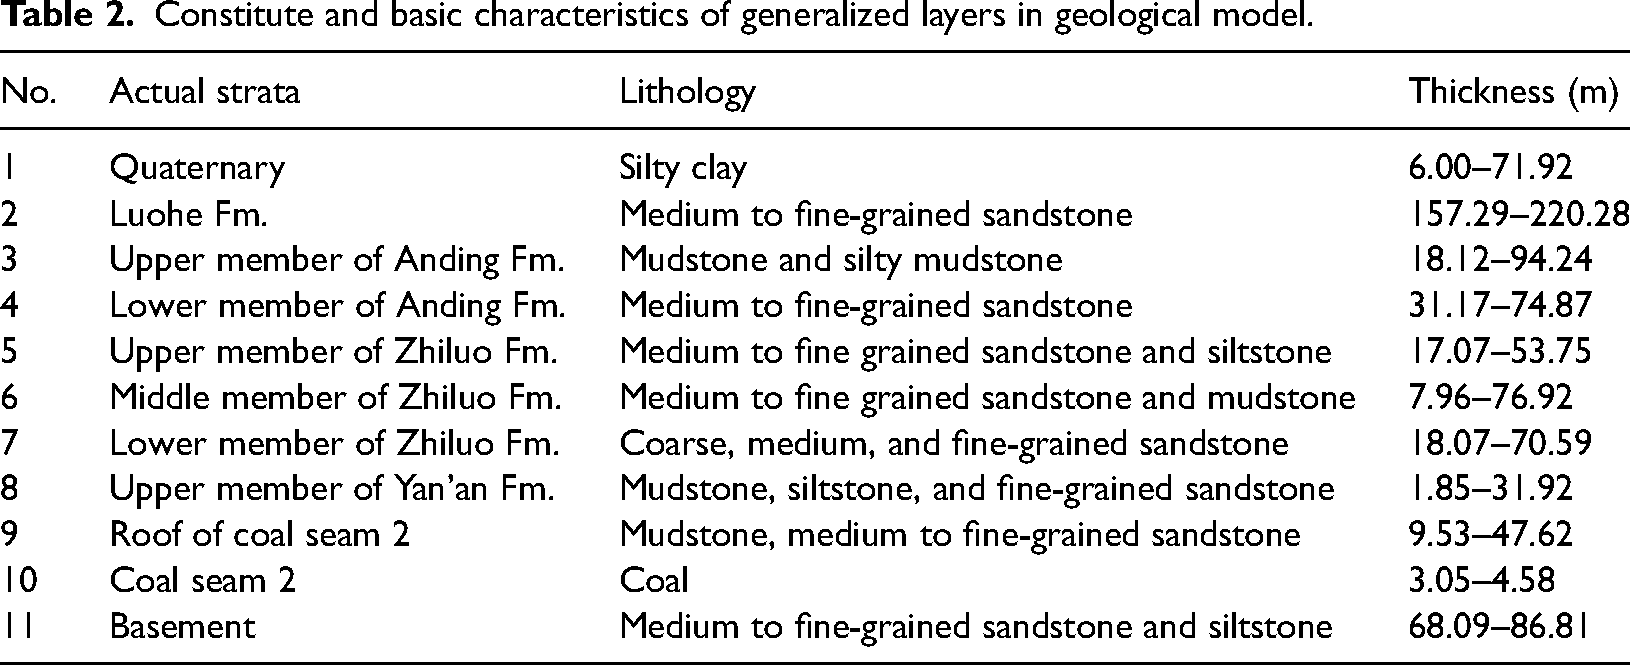
According to the stratigraphic texture, the geological model includes 11 generalized layers (Table 2). The thickness distribution of each generalized layer was obtained from the 13 coal drill holes distributed in the study area. The elevation point data was first extracted from the drill reports and imported to the Suffer software to generate the elevation area data, which was then imported to the Ansys software to construct the 11 generalized layers (Figure 2(a)). The length and width of the basic unit were set to 20 m. Each generalized layer contains 6000 units, and the entire model contains 66,000 units (Figure 2(b)).
Schematic diagram of geological model construction and numerical simulation process.
Constitute and basic characteristics of generalized layers in geological model.
Value assignment of mechanical properties of generalized layers
The calculation of the mechanical properties of generalized layers can be explained by taking the generalized layer #4 as an example. The generalized layer #4 mainly includes medium sandstone, fine sandstone, mudstone and silty mudstone, siltstone, and muddy siltstone. The mechanical properties of the three sublayers of medium sandstone in the same section have been measured. The mechanical parameter results of water-saturation basis were adopted, and the thickness of the three sublayers was taken as the weight to determine the mechanical parameters of medium sandstone layers within the section (equation (1)). Repeat this step to get the mechanical parameters of each lithologic strata in this section. Meanwhile, according to the thickness statistics results, the thickness proportions of the five lithologic types were 43.34%, 28.11%, 23.20%, 3.19%, and 2.17%, respectively. Subsequently, the mechanical parameters of the generalized layer #4 were determined by multiplying the mechanical parameters of each lithologic type by the corresponding thickness proportion and adding them together (equation (2)). Repeat the above process to determine the mechanical parameters of the other generalized layers (Table 3).
Mechanical parameters of generalized layers.
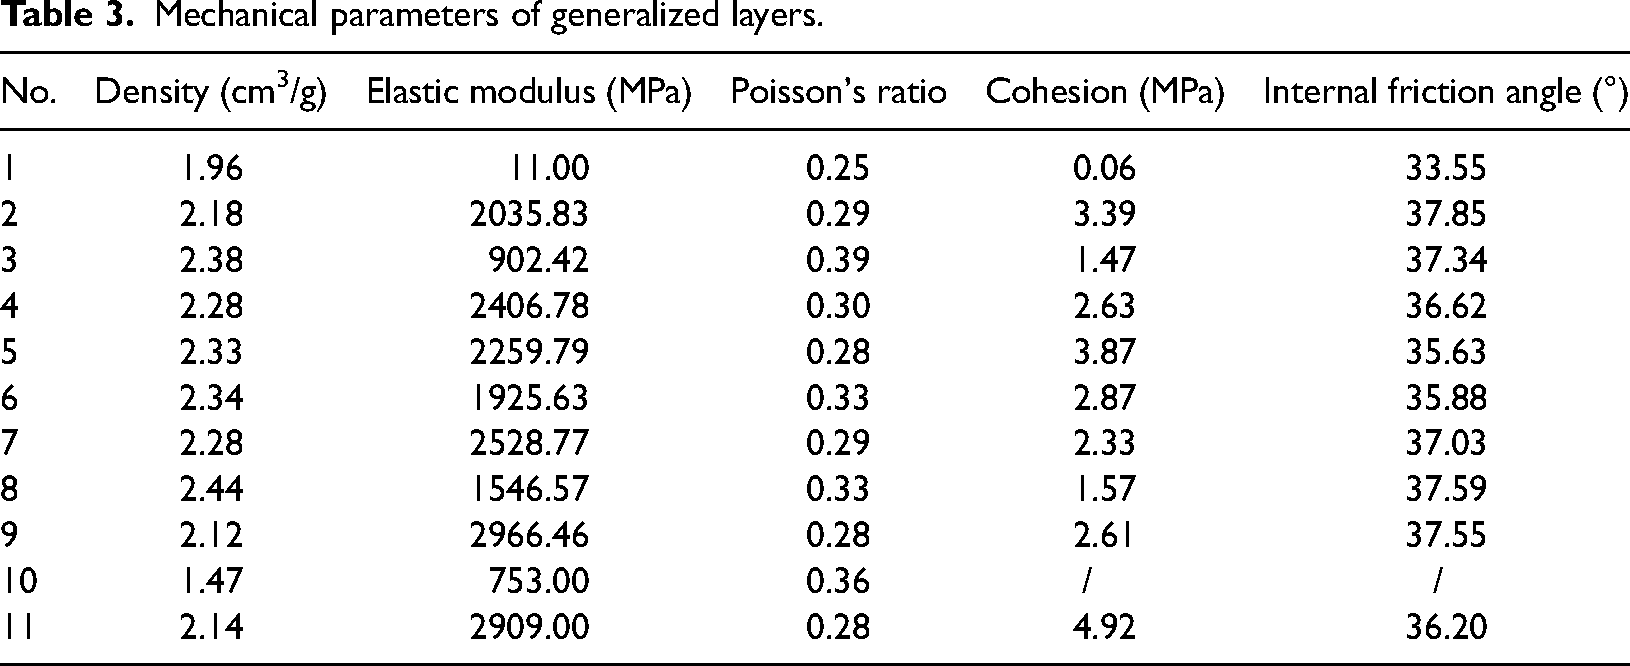
where Ma means the mechanical parameter M of the lithologic type a in the generalized layer, which consists of n layers; Ma1, Ma2, …, and Man mean the test results of the mechanical parameter M of each a-lithology stratum in the generalized layer. Wa1, Wa2, …, and Wan mean the thickness values of each a-lithology stratum in the generalized layer.
where Mlayer−i means the mechanical parameter M of the i-th generalized layer. Ma, Mb, …, and Mn mean the mechanical parameter M of the lithologic type a, b, …, and n. Wa, Wb, …, and Wn mean the cumulative thickness of each lithologic type in the i-th generalized layer.
Boundary constraint conditions and initial settlement elimination
The east and west boundaries (the boundaries in the X-direction) were set to have no X-direction displacement, and the north and south boundaries (the Y-direction) were set to have no Y-direction displacement (Figure 2(c) and (d)). The gravity was applied to the entire model in the Z-direction (with a gravitational acceleration of 9.8 m/s2) to simulate the gravity field.
Figure 2(e) illustrates that the maximum displacement in the Z-direction induced by the self-weight of the geological model was −5.27 m (the displacement in the positive directions of the X, Y, and Y axes was set to positive). In other words, without coal mining activities and only under the self-weight of the geological model, the upper surface of the Quaternary generalized layer can display a settlement up to 5.27 m. Although it may happen in the geological history duration (millions of years), such significant self-weight-induced subsidence cannot occur during the relatively short period of coal mining activities. In this study, the internal stress files of all nodes in the geological model under the self-weight condition were exported and then loaded into another geological model. This way, the self-weight-induced settlement was eliminated by applying internal stresses to each node. Figure 2(f) showed that after the above processing, the maximum Z-direction displacement in the surface was <1 × 10⁻⁵ m, indicating that the long-term self-weight-induced settlement was effectively eliminated.
Time step setting for coal mining simulation
The entire coal mining process of the simulation was divided into 23 time steps. In time step 1, the initial self-weight-induced strain in the model was eliminated, as stated in the “Value assignment of mechanical properties of generalized layers” section (Figure 2(e)). Time steps 2–3 and 23 simulated the coal mining activities in the eastern and western areas far from the surface roads, respectively. In time steps 4–22, the coal mining progressed from east to west at a speed of 60 m per time step (Figure 2(g)–(i)).
Calculation of surface deformation parameters
The influence of coal mining activities on surface roads and constructions was usually quantified and evaluated by parameters such as the horizontal deformation value, inclination value, and curvature value.
Horizontal deformation value
Horizontal deformation value refers to the ratio of the horizontal displacement difference between two adjacent measurement points to their horizontal distance. For node Z5 on the surface (Figure 3), eight horizontal deformation values, ε5–1, ε5–2, ε5–3, ε5–4, ε5–6, ε5–7, ε5–8, and ε5–9, can be obtained. In this study, the maximum value of the absolute values of the eight horizontal deformation values was taken as the horizontal deformation value at node Z5.
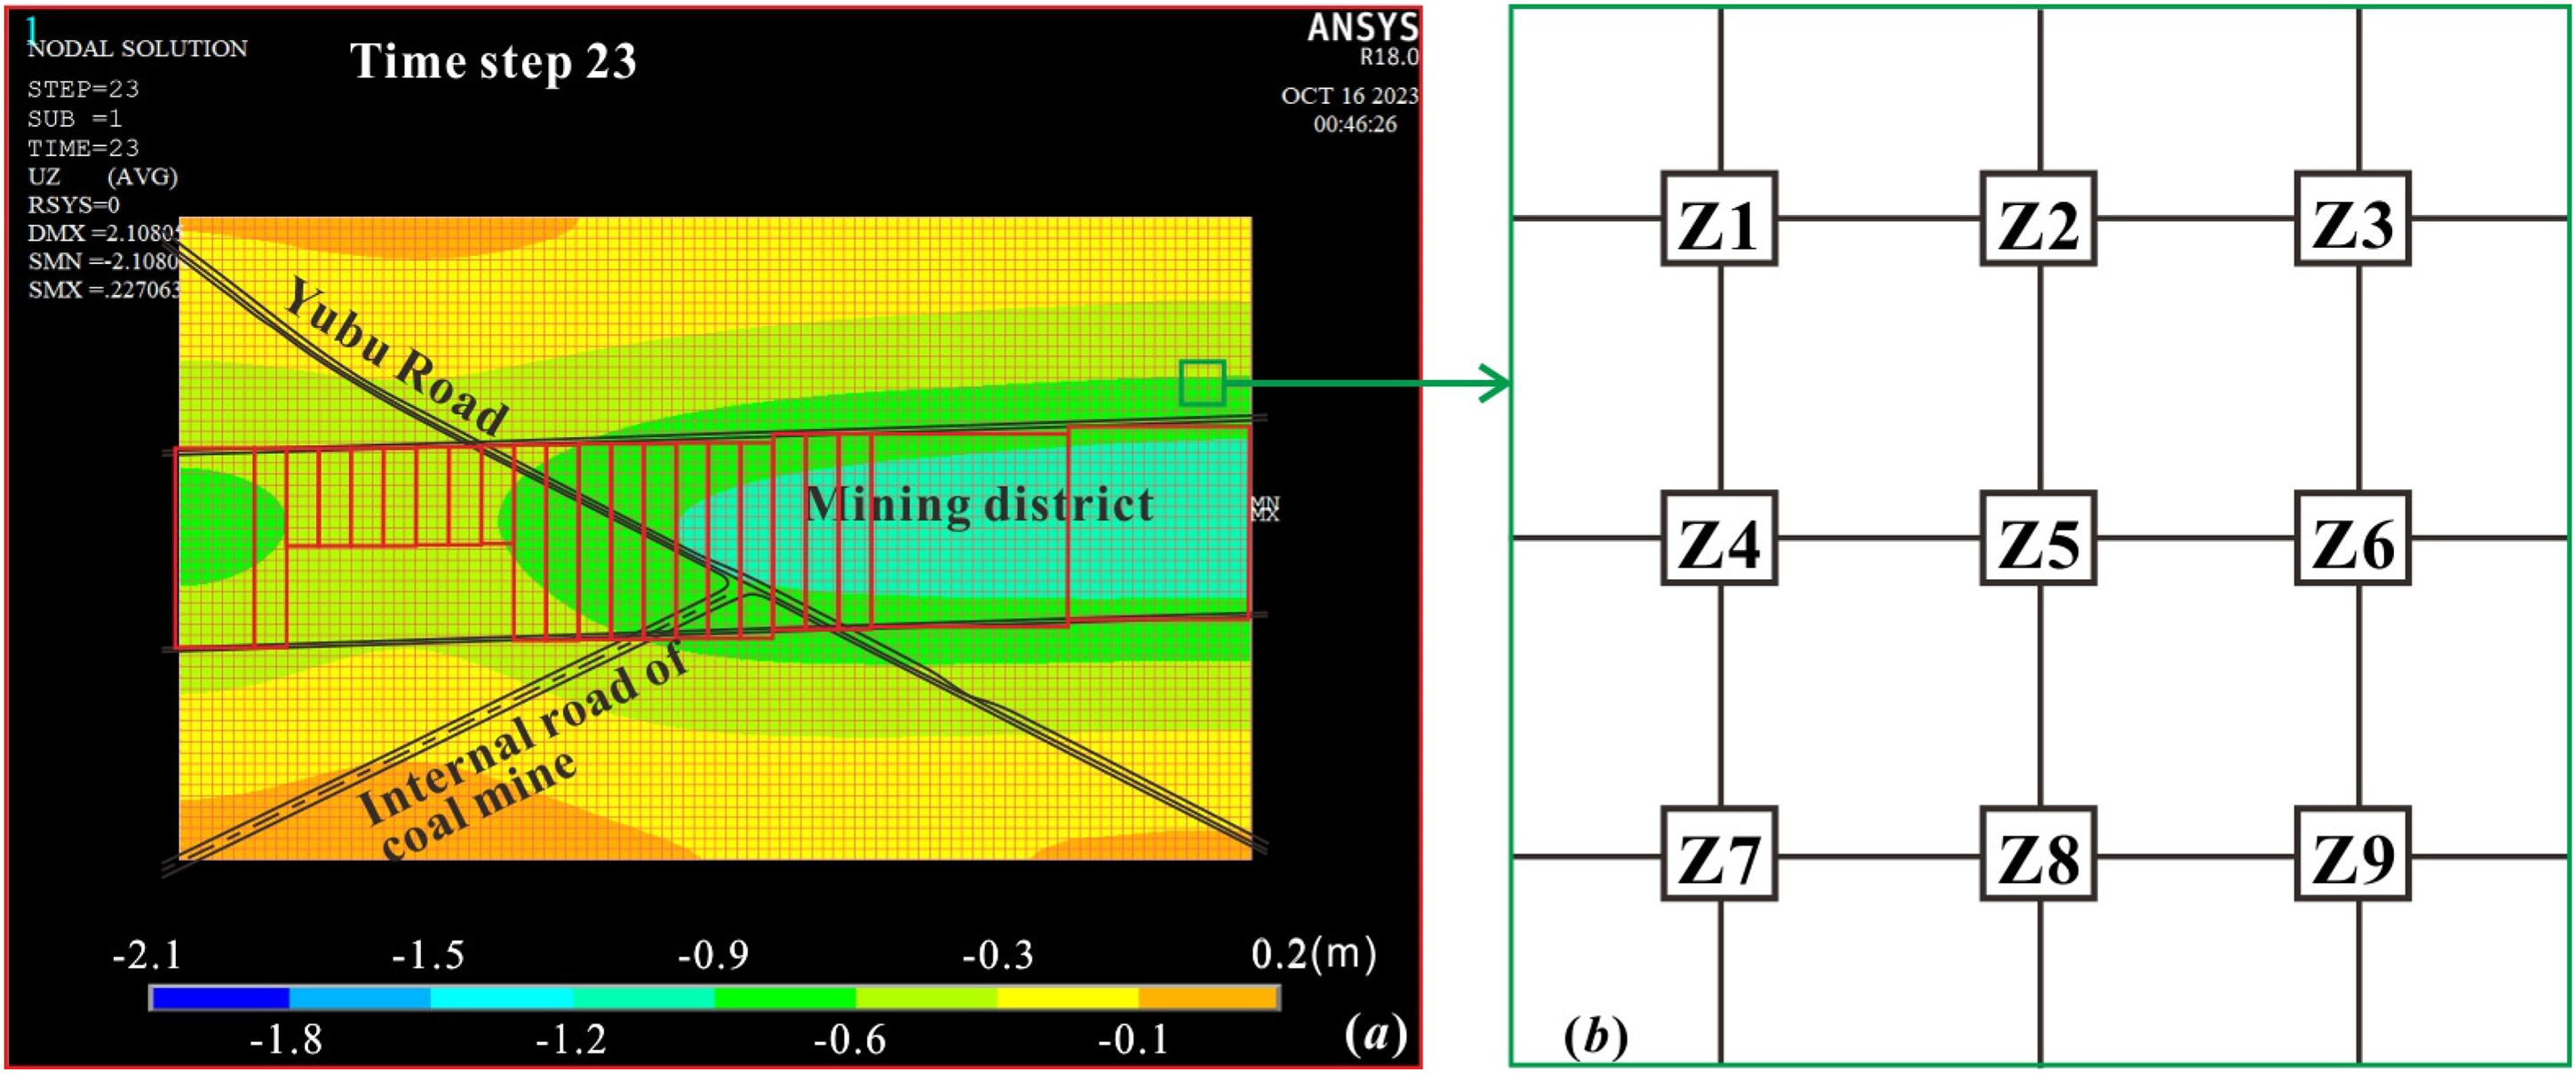
Schematic diagram of 3 × 3 grid on surface.
With equation (3), the horizontal displacement (Uxy) at each node can be calculated by the displacement components in the X and Y directions (Ux and Uy). As the modulus of the horizontal displacement difference vector of adjacent nodes is approximately equal to the modulus differences of the horizontal displacement vectors, the absolute value of the difference between the Uxy of adjacent nodes was taken as the difference of horizontal displacement, and the ratio of the Uxy difference to the horizontal distance of these two nodes is the horizontal deformation value (equation (4)).


where
Surface inclination value
The surface inclination value refers to the ratio of the subsidence difference between two adjacent points on the surface in the vertical direction and its horizontal distance (equation (5)), reflecting the inclination of the surface in a specific direction.
In this study, the substance value at each node is the displacement value in the Z direction (Uz), and the maximum value of the absolute values of the eight inclination values along the surrounding directions was regarded as the surface inclination value at the node.
Surface curvature value
A 3D geological body has the curvature concepts of mean curvature, Gaussian curvature, and principal curvatures (including maximum and minimum principal curvatures). In this study, the principal curvature with a larger absolute value at each surface node is regarded as the surface curvature value.
First, the mean curvature and Gaussian curvature at each surface node were calculated by adopting the quadratic trend surface fitting method, which fits the quadratic trend surface according to the altitude values of the eight adjacent nodes and calculates the curvatures at the node. If the quadratic trend surface equation obtained by fitting the central node Z5 and the eight adjacent nodes is recorded as Z (equation (6)), the coefficients in the quadratic trend surface equation will meet the equations (7)–(12).


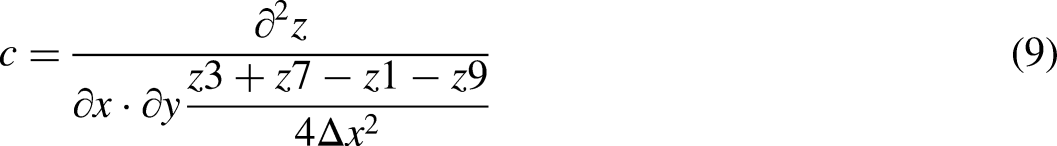
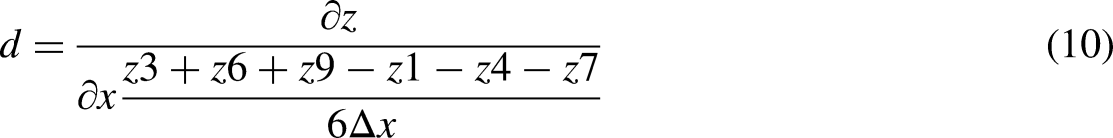
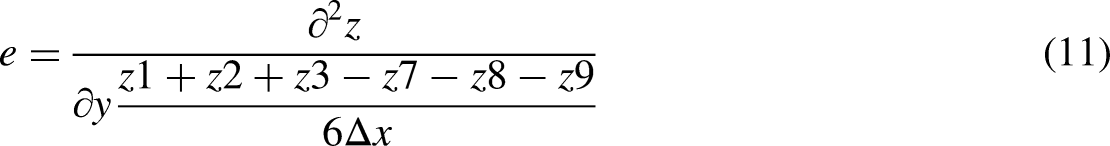

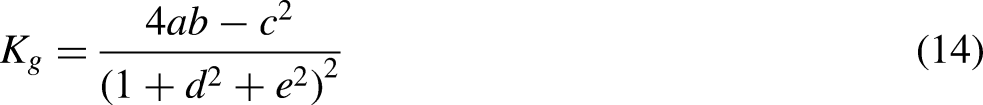
Then, the mean curvature and Gaussian curvature at node Z5 can be calculated by the coefficients of the quadratic trend surface equation using the equations (13) and (14), respectively.


Results and discussion
After verifying the reliability of the constructed geological model in the Model validation section, we conducted coal mining settlement simulations on the model. The extremum and distribution of coal mining subsidence in the overlying strata and surface, as well as the evolution characteristics of coal mining subsidence, were presented in the “Subsidence basin and its evolution characteristics” section. In the “Surface deformation characteristics and safety evaluation of coal mining under highway” section, we illustrated the distribution rules of the three surface deformation parameters calculated based on the simulated surface subsidence results and discussed the impact of coal mining activities on surface highways. In the “Influence of water induced rock mechanical property deterioration on surface subsidence prediction” section, the influence of sample conditions on the simulation results of surface subsidence was discussed.
Model validation
After constructing the 3D geological model, verifying numerical simulations were first conducted. The Z-direction displacement components on the outer section of the east side were extracted, and the surface subsidence curves at key time steps were drawn.
Generally, the surface subsidence basin predicted by numerical simulation exhibited distribution characteristics similar to those by field measurement (Figure 4). Specifically, the maximum surface subsidence values were both located at the center of the mining district, and the surface subsidence decreased rapidly in an inverted parabolic shape from the center of the mining district to the sides. At 300 to 400 m outside the mining district, the surface subsidence value decreased to 0.1 to 0.2 m. These similar change rules of surface subsidence indicate that the constructed geological model can represent the actual geological conditions and that the predicted surface subsidence basin can accurately reflect the surface subsidence characteristics caused by under-highway coal mining activities.
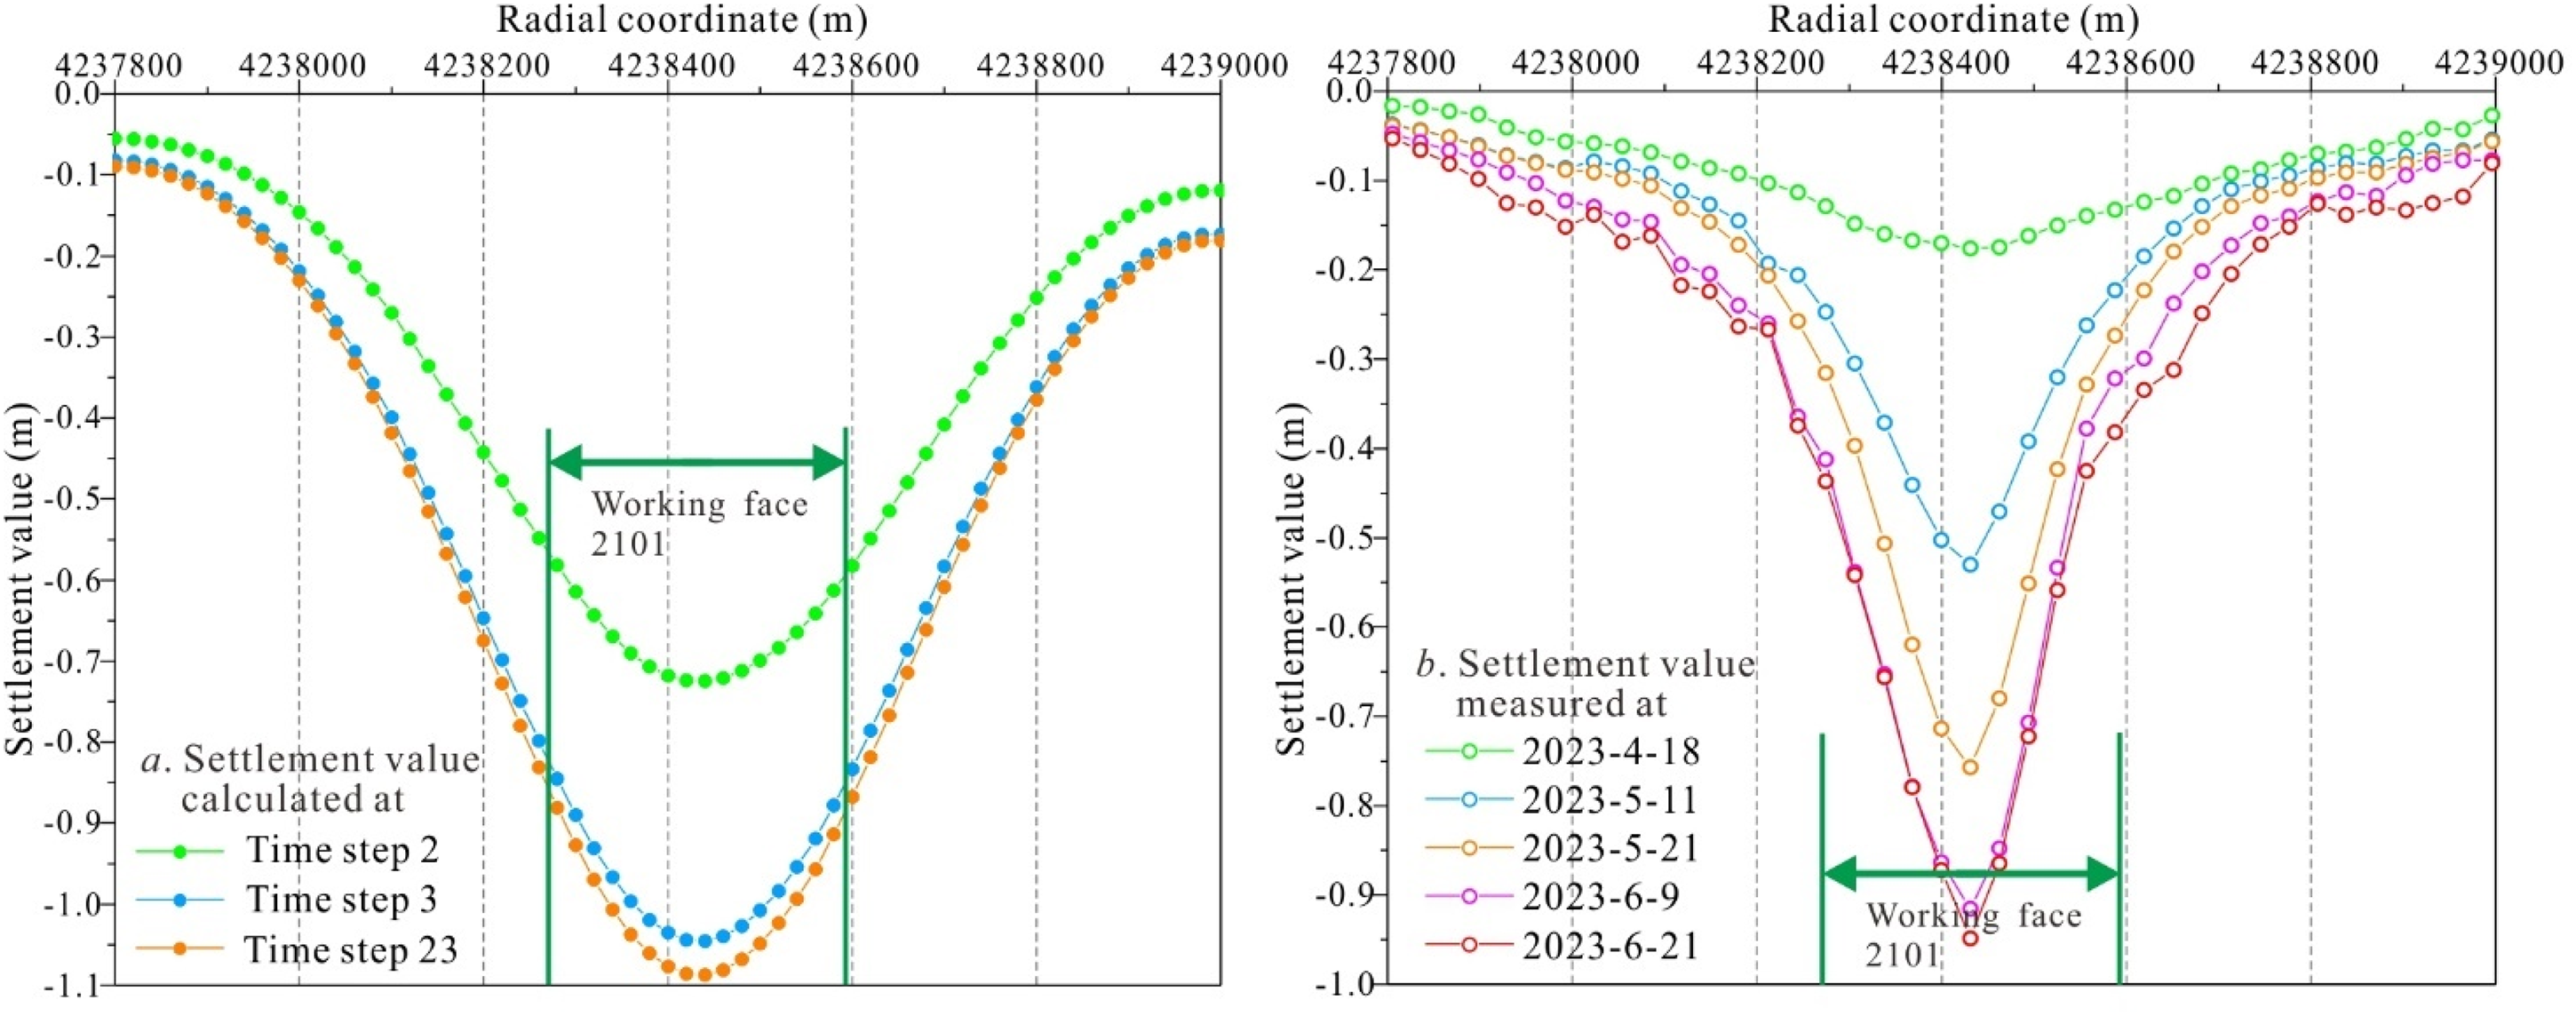
Comparison between predicted surface subsidence curves of study area and the measured subsidence curves in adjacent area.
Subsidence basin and its evolution characteristics
Surface subsidence characteristics
During the process of the working face advancing from east to west, the surface subsidence contours gradually developed in a fold shape (Figure 5), with the centerline of the mining district as the symmetrical axis, and the fold shape gradually elongated until an approximately parallel linear shape. In addition, due to the influence of the protective coal pillar of oil and gas wells, the surface subsidence contours in time step 15–22 slightly shifted to the north of the study area (the upper part of Figure 5), and the surface subsidence contours of the influence area in time step 23 showed a saddle structure.
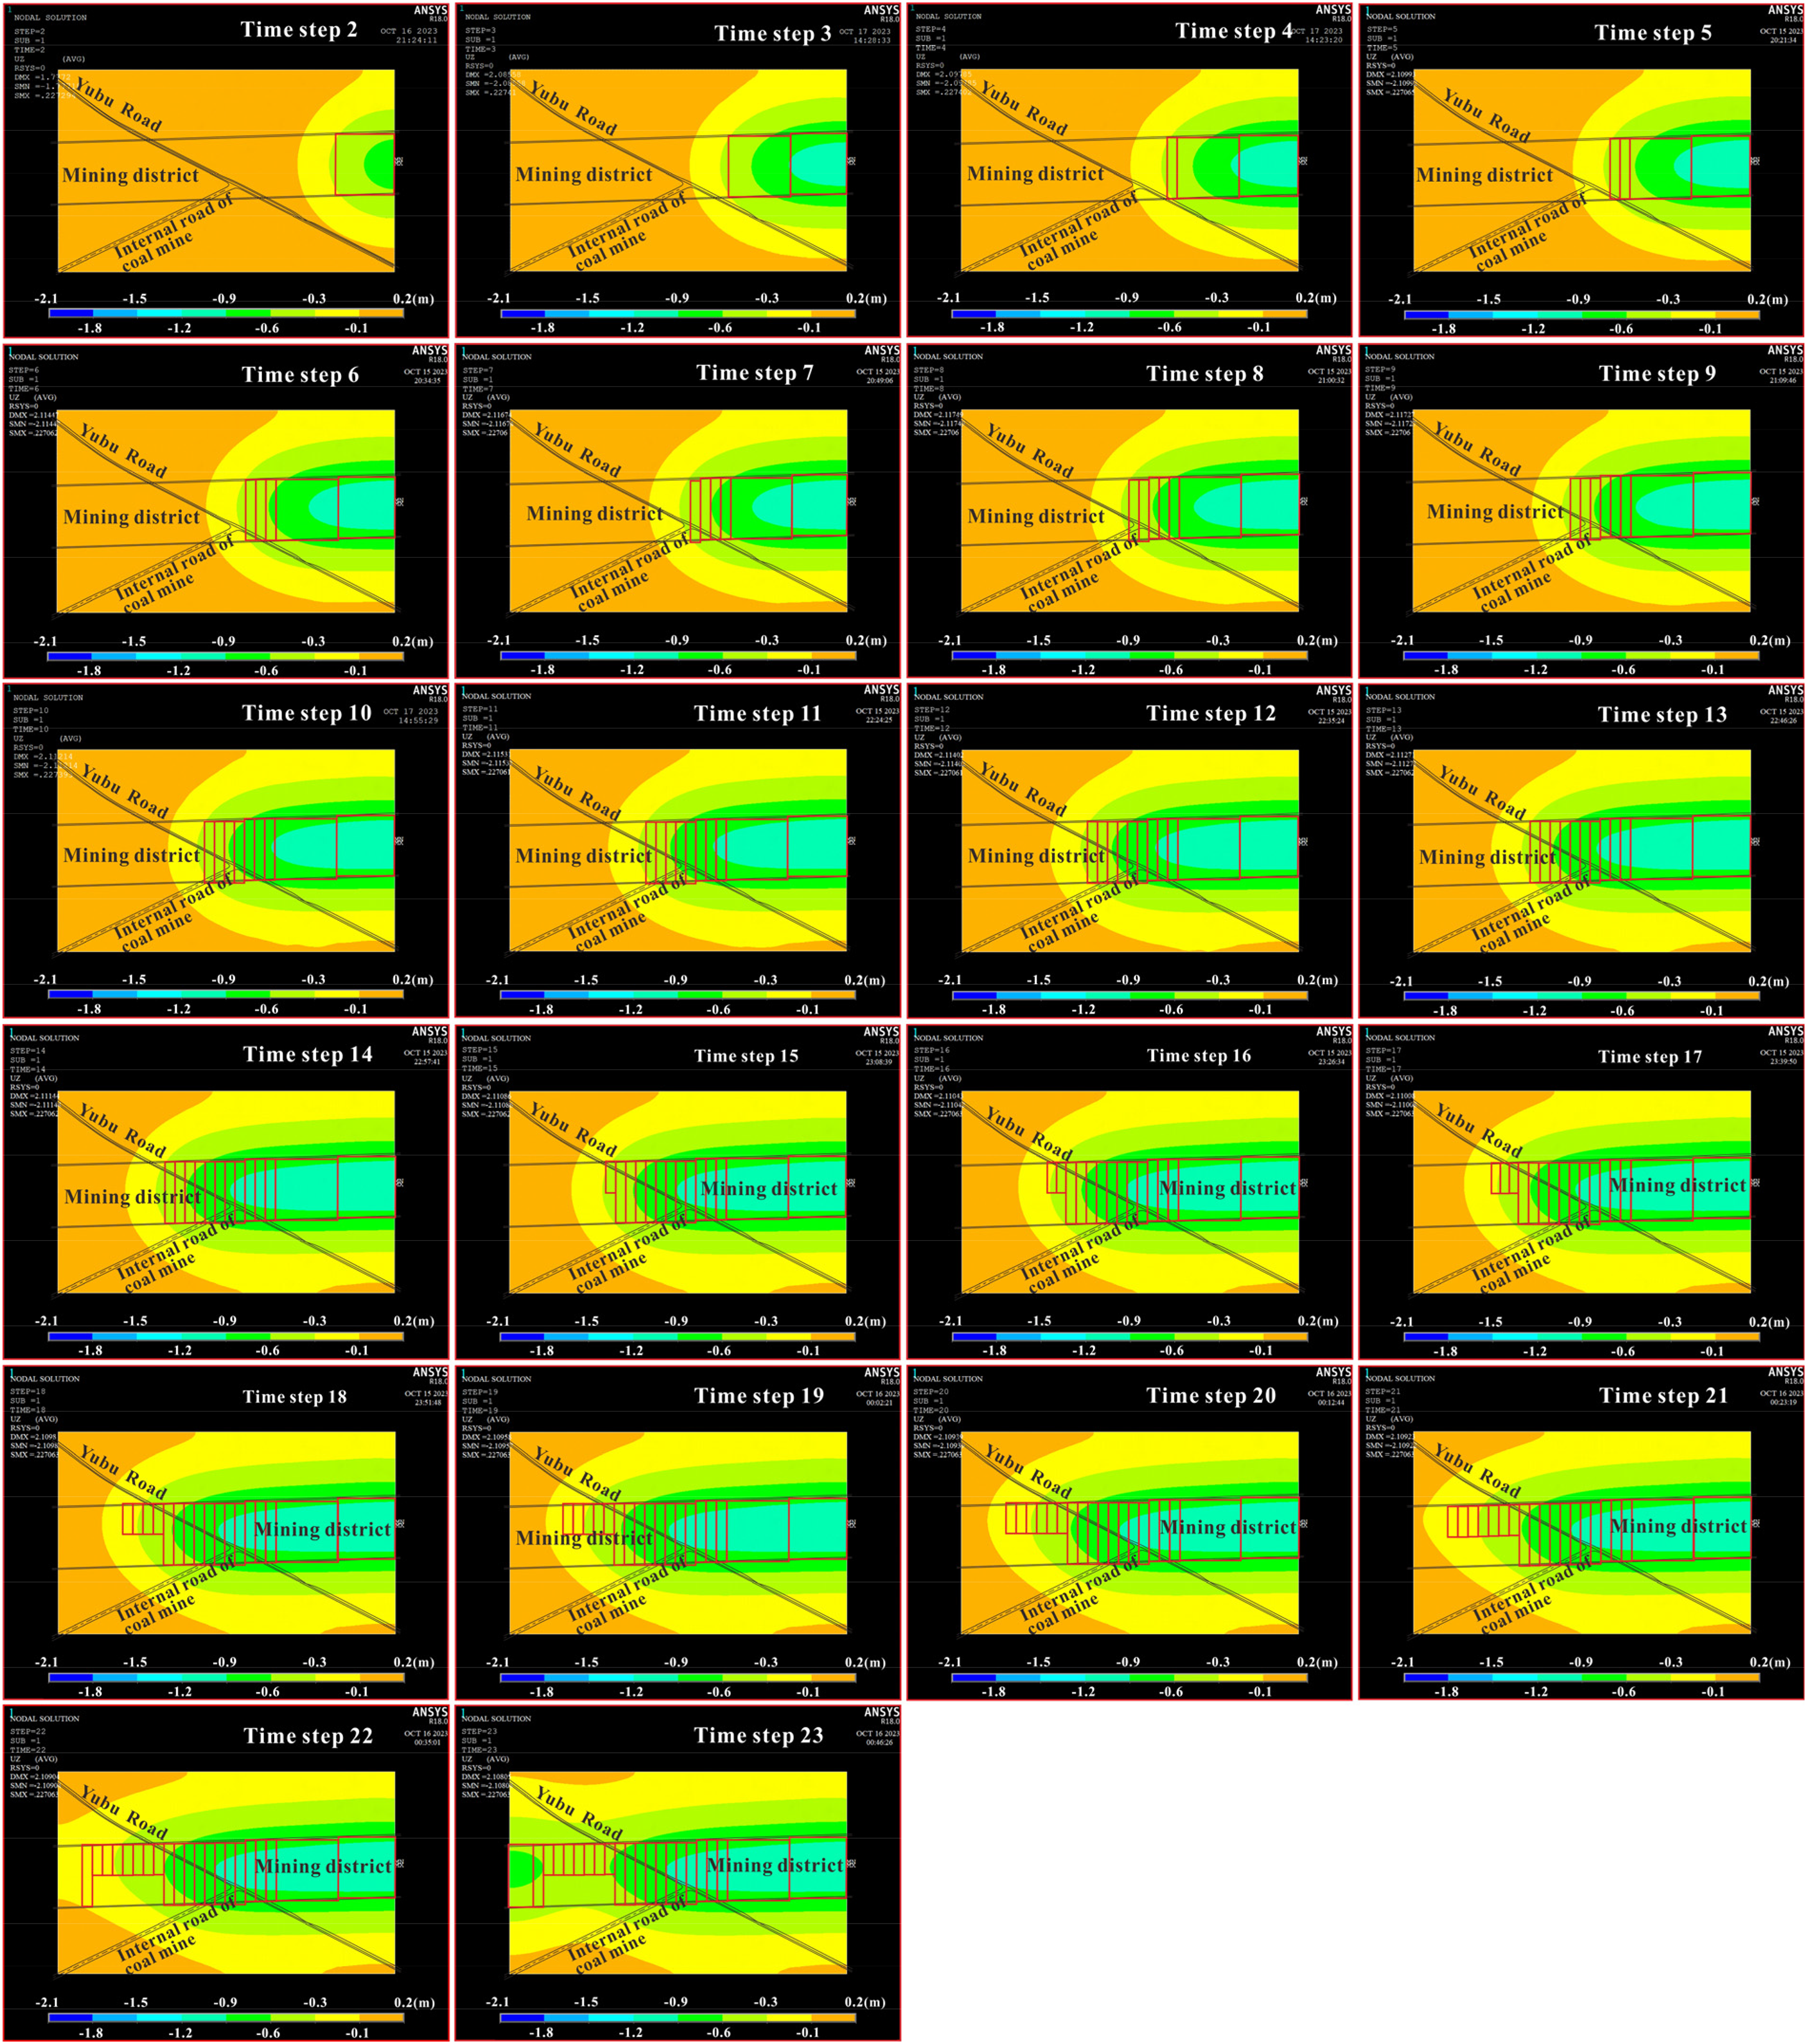
Evolution of surface subsidence contours at different time steps.
The maximum surface subsidence value was between 0.9 and 1.2 m and was observed in the middle of the calculation domain. From time step 3 (working face advanced to about 60 m from the intersection of the Yubu road and the auxiliary haulage way, referred to as “the right intersection point”), the surface road began to be affected by coal mining activities, with a surface subsidence of 0.1 to 0.3 m. In time steps 4–16, the surface subsidence values gradually increased. The maximum surface subsidence value of surface road areas reached 0.3 to 0.9, 0.6 to 0.9, and 0.9 to 1.2 m at time step 5 (working face exceeded the right intersection point of about 60 m), time step 9 (working face exceeded the right intersection point of about 300 m), and time step 17 (working face exceeded the intersection of the Yubu road and the main haulage way of about 60 m, referred to as “the left intersection point”), respectively. During the mining stage of time steps 18–23, the maximum surface subsidence of surface road areas increased slowly within the range of 0.9 to 1.2 m, and the high-value area gradually expanded.
The extremum and velocity of surface subsidence were usually adopted to evaluate the influence of surface subsidence on surface infrastructure and property (Zhu et al., 2023). Yan et al. (2022) used the magnitude of surface subsidence velocity to characterize the degree of damage to the surface and determined the scope of severe surface damage by the critical value of 18 mm/d. Lupo (1998) and Van As (2003) proposed a division scheme of the impact zones of subsidence on the surface based on the surface vertical displacement (i.e. the surface subsidence), in which the influencing areas were classified into the caved zone (with subsidence > 4 m), cracking zone (or fractured zone, with subsidence ranging from 2 to 4 m), and continuous subsidence zone (with subsidence ranging in 0.1–2 m). Later, scholars used the evaluation method to assess the impact of surface subsidence caused by underground mining on surface infrastructure (Parmar et al., 2019; Vyazmensky, 2008). According to the classification scheme, the surface subsidence induced by the mining of the target coal seam is much smaller than the formation conditions of the caved and fractured zones. Therefore, the coal mining activities in the mining district are expected to form a continuous basin-shaped subsidence zone on the surface.
In addition to directly analyzing the impact of coal mining subsidence on surface facilities based on subsidence extremum or velocity, it was also widely used to calculate surface movement and deformation parameters based on the surface subsidence data or the morphological parameters of subsidence basins and evaluate the influences on surface facilities accordingly (Li et al., 2023; Ministry of Transport of China, 2019). The evaluation strategy was also adopted in this study. Specifically, the horizontal deformation, surface inclination, and curvature values were calculated by processing the simulated surface subsidence results. Then, the influence of coal mining activities on surface highways was estimated based on these surface deformation parameters. The detailed discussions are presented in the “Surface deformation characteristics and safety evaluation of coal mining under highway” section.
Horizontal and vertical variations of coal mining subsidence at key time steps
Figure 6 illustrates the subsidence contours on the typical longitudinal section and cross-sections at key mining stages, such as time steps 5, 10, and 16, corresponding to mining stages of the working face advancing to the right intersection point, the intersection of the Yubu road and the centerline of the mining district (the middle intersection point), and the left intersection point, respectively.
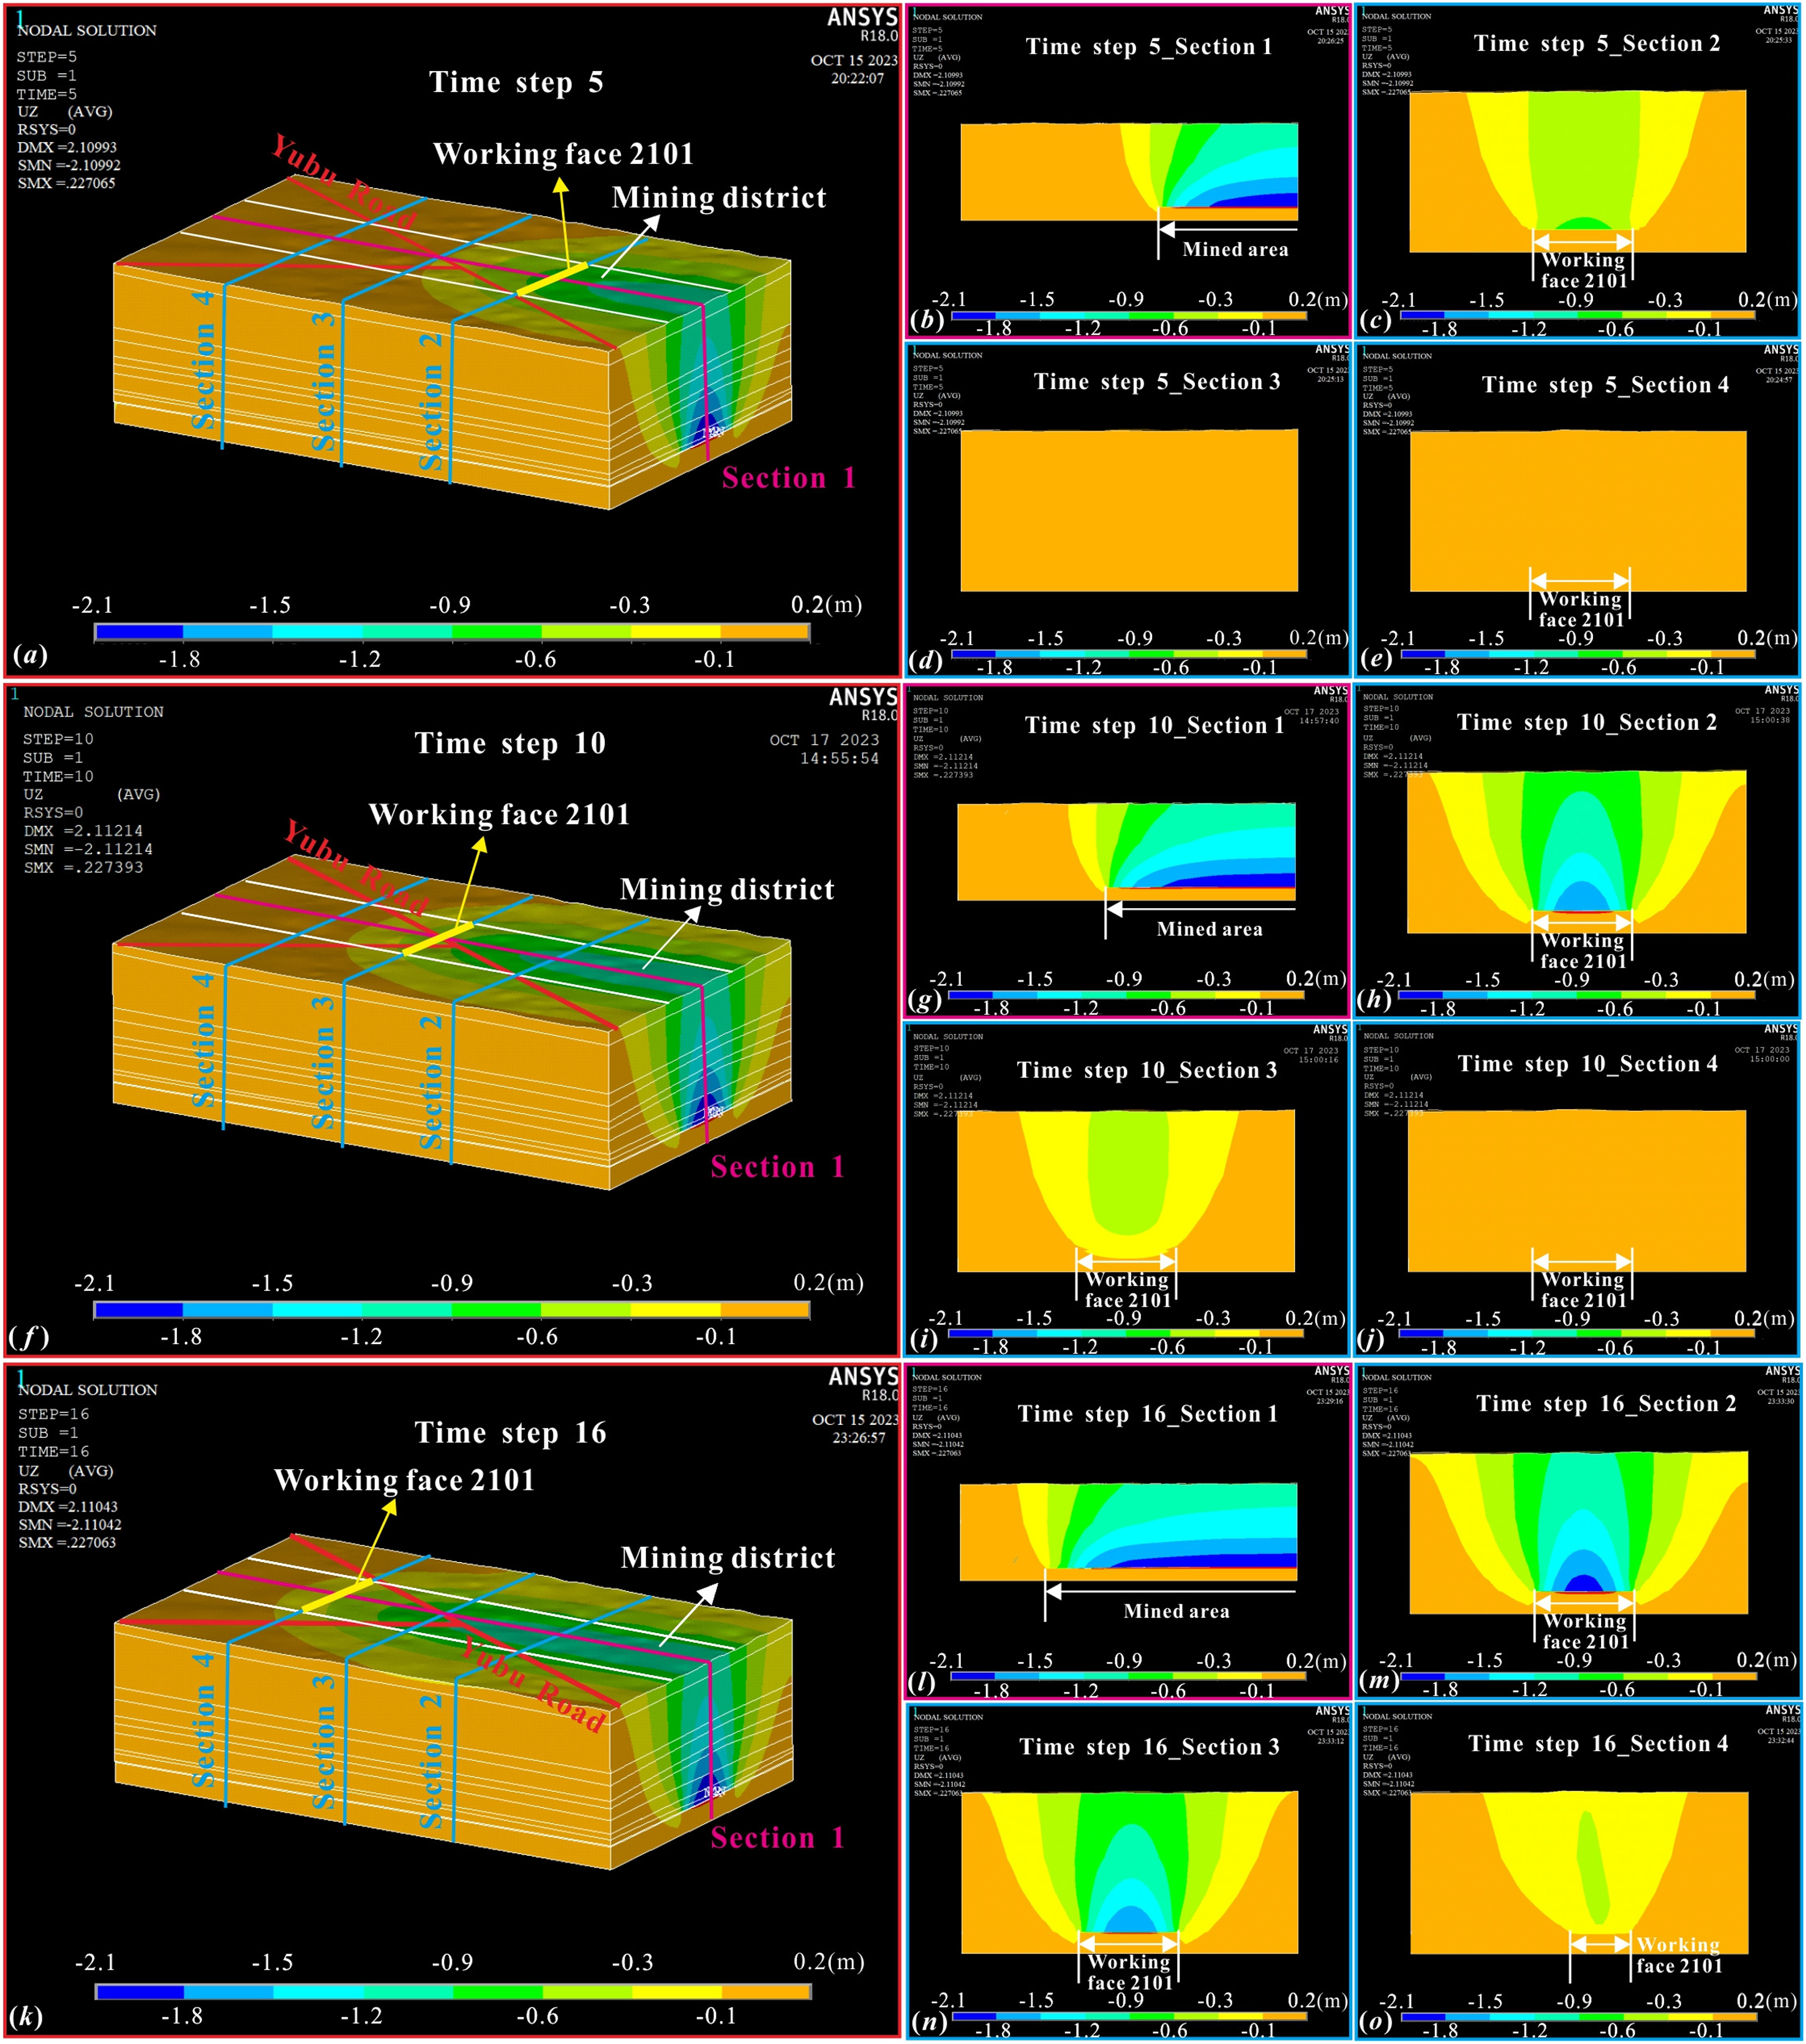
Evolution of 3D and key section contours of Z-direction displacement component at partial time steps.
The subsidence contours on the longitudinal sections exhibited as a series of arc curves gradually extending to the front of the working face. In addition, the initiation of surface subsidence was slightly ahead of the coal mining activities. Yan et al. (2022) analyzed the distribution and evolution rules of surface subsidence caused by coal mining and found that the high-speed subsidence and serious damage zones were distributed at approximately 1/5 of the working face width in front of the working face. Thus, in the actual coal mining process, it is suggested to start real-time observation of the subsidence of the surface roads at the corresponding mining stage of time step 2.
The subsidence contours on the cross-sections were in funnel shapes with steep tops and gentle bottoms and were axisymmetric to the center point of the working face. With the working face moving from east to west, the funnel shapes gradually grew wider, and the high-value contours gradually expanded outward from the center of the working face, indicating the influence area and amplitude of surface subsidence enhanced gradually. In addition, although the working face exceeded the left intersection point at time step 16, the subsidence value on the cross-section passing through the intersection point at time step 16 did not reach the subsidence values on the middle and right cross-sections. This indicates that the evolution of surface subsidence is a long-term and developmental process, and the surface subsidence on the left cross-section continuously increased during the subsequent mining stages of time steps 17–23. Thus, in the actual coal mining activities, even if the working face completely exceeds the surface roads, the surface subsidence should be continuously observed in the subsequent coal mining stage.
To further analyze the surface displacement evolution characteristics of surface roads in the entire mining process, three simulated survey lines were placed in the three intersection points. The Z-direction displacement component data of the surface nodes of the three cross-sections at each time step was extracted and then, the surface subsidence evolution curves on the three survey lines were obtained (Figures 7–9).
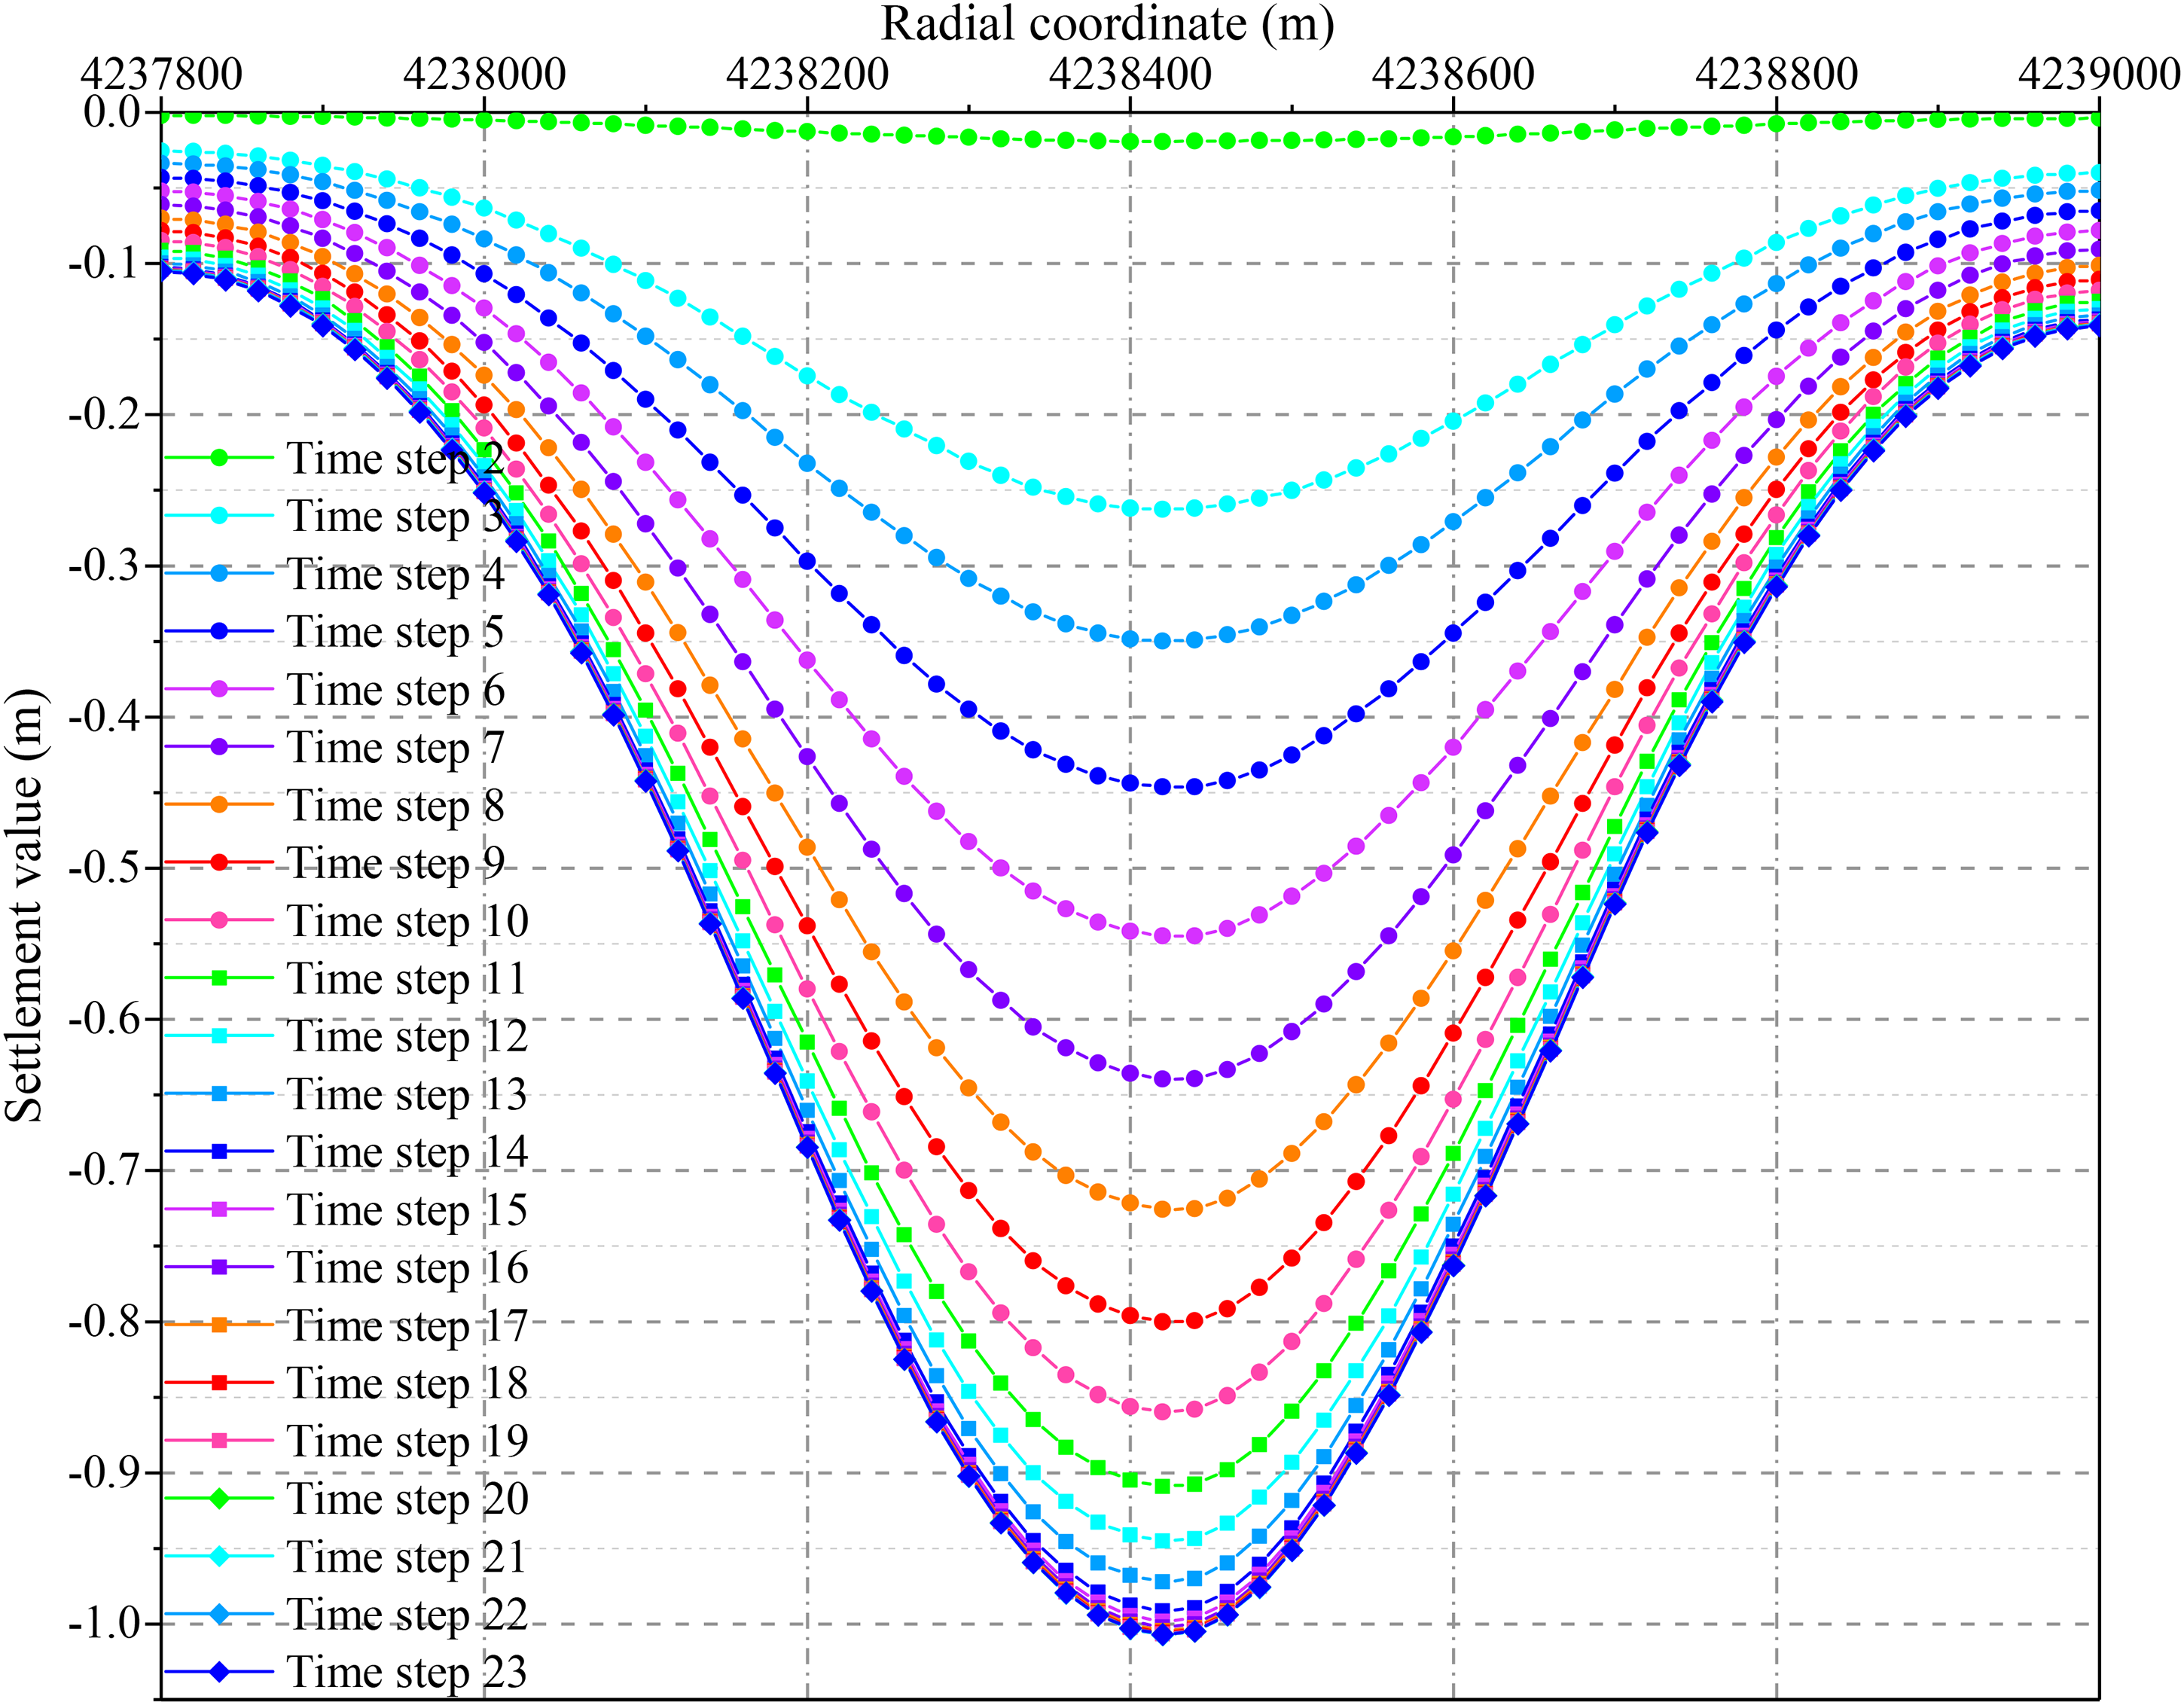
Surface subsidence evolution curves on the survey line passing through the right intersection point.
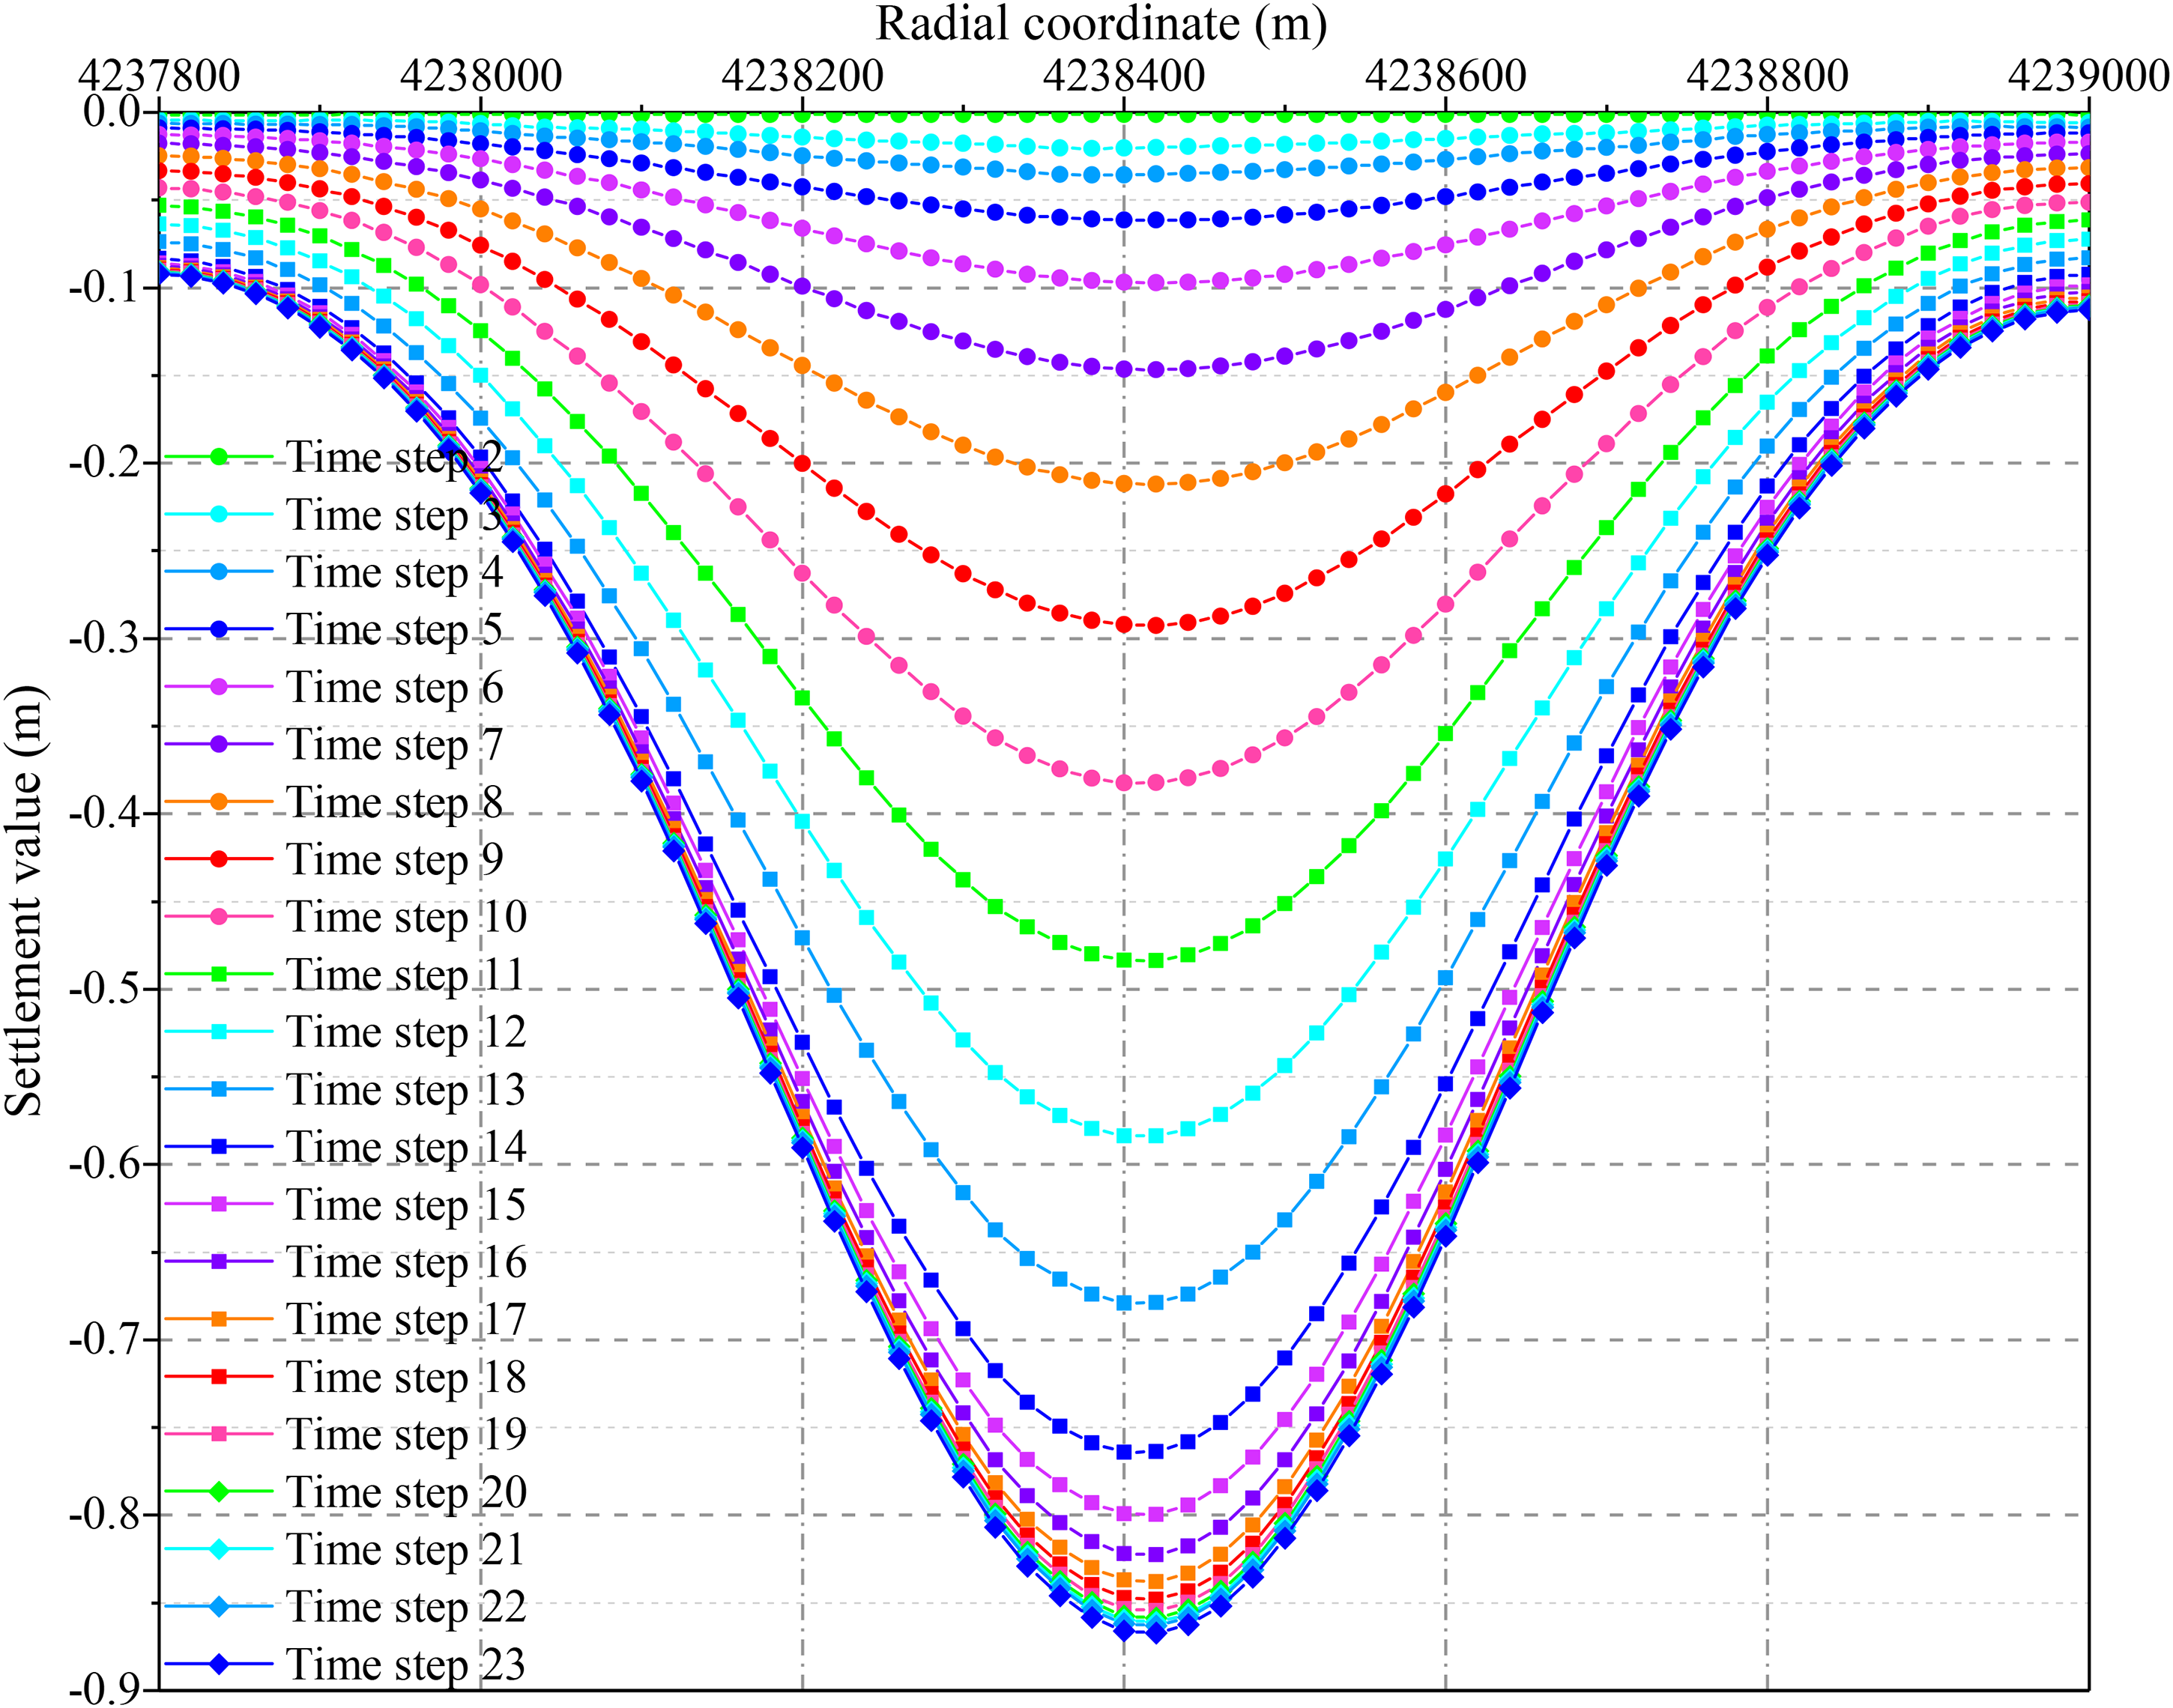
Surface subsidence evolution curves on the survey line passing through the middle intersection point.
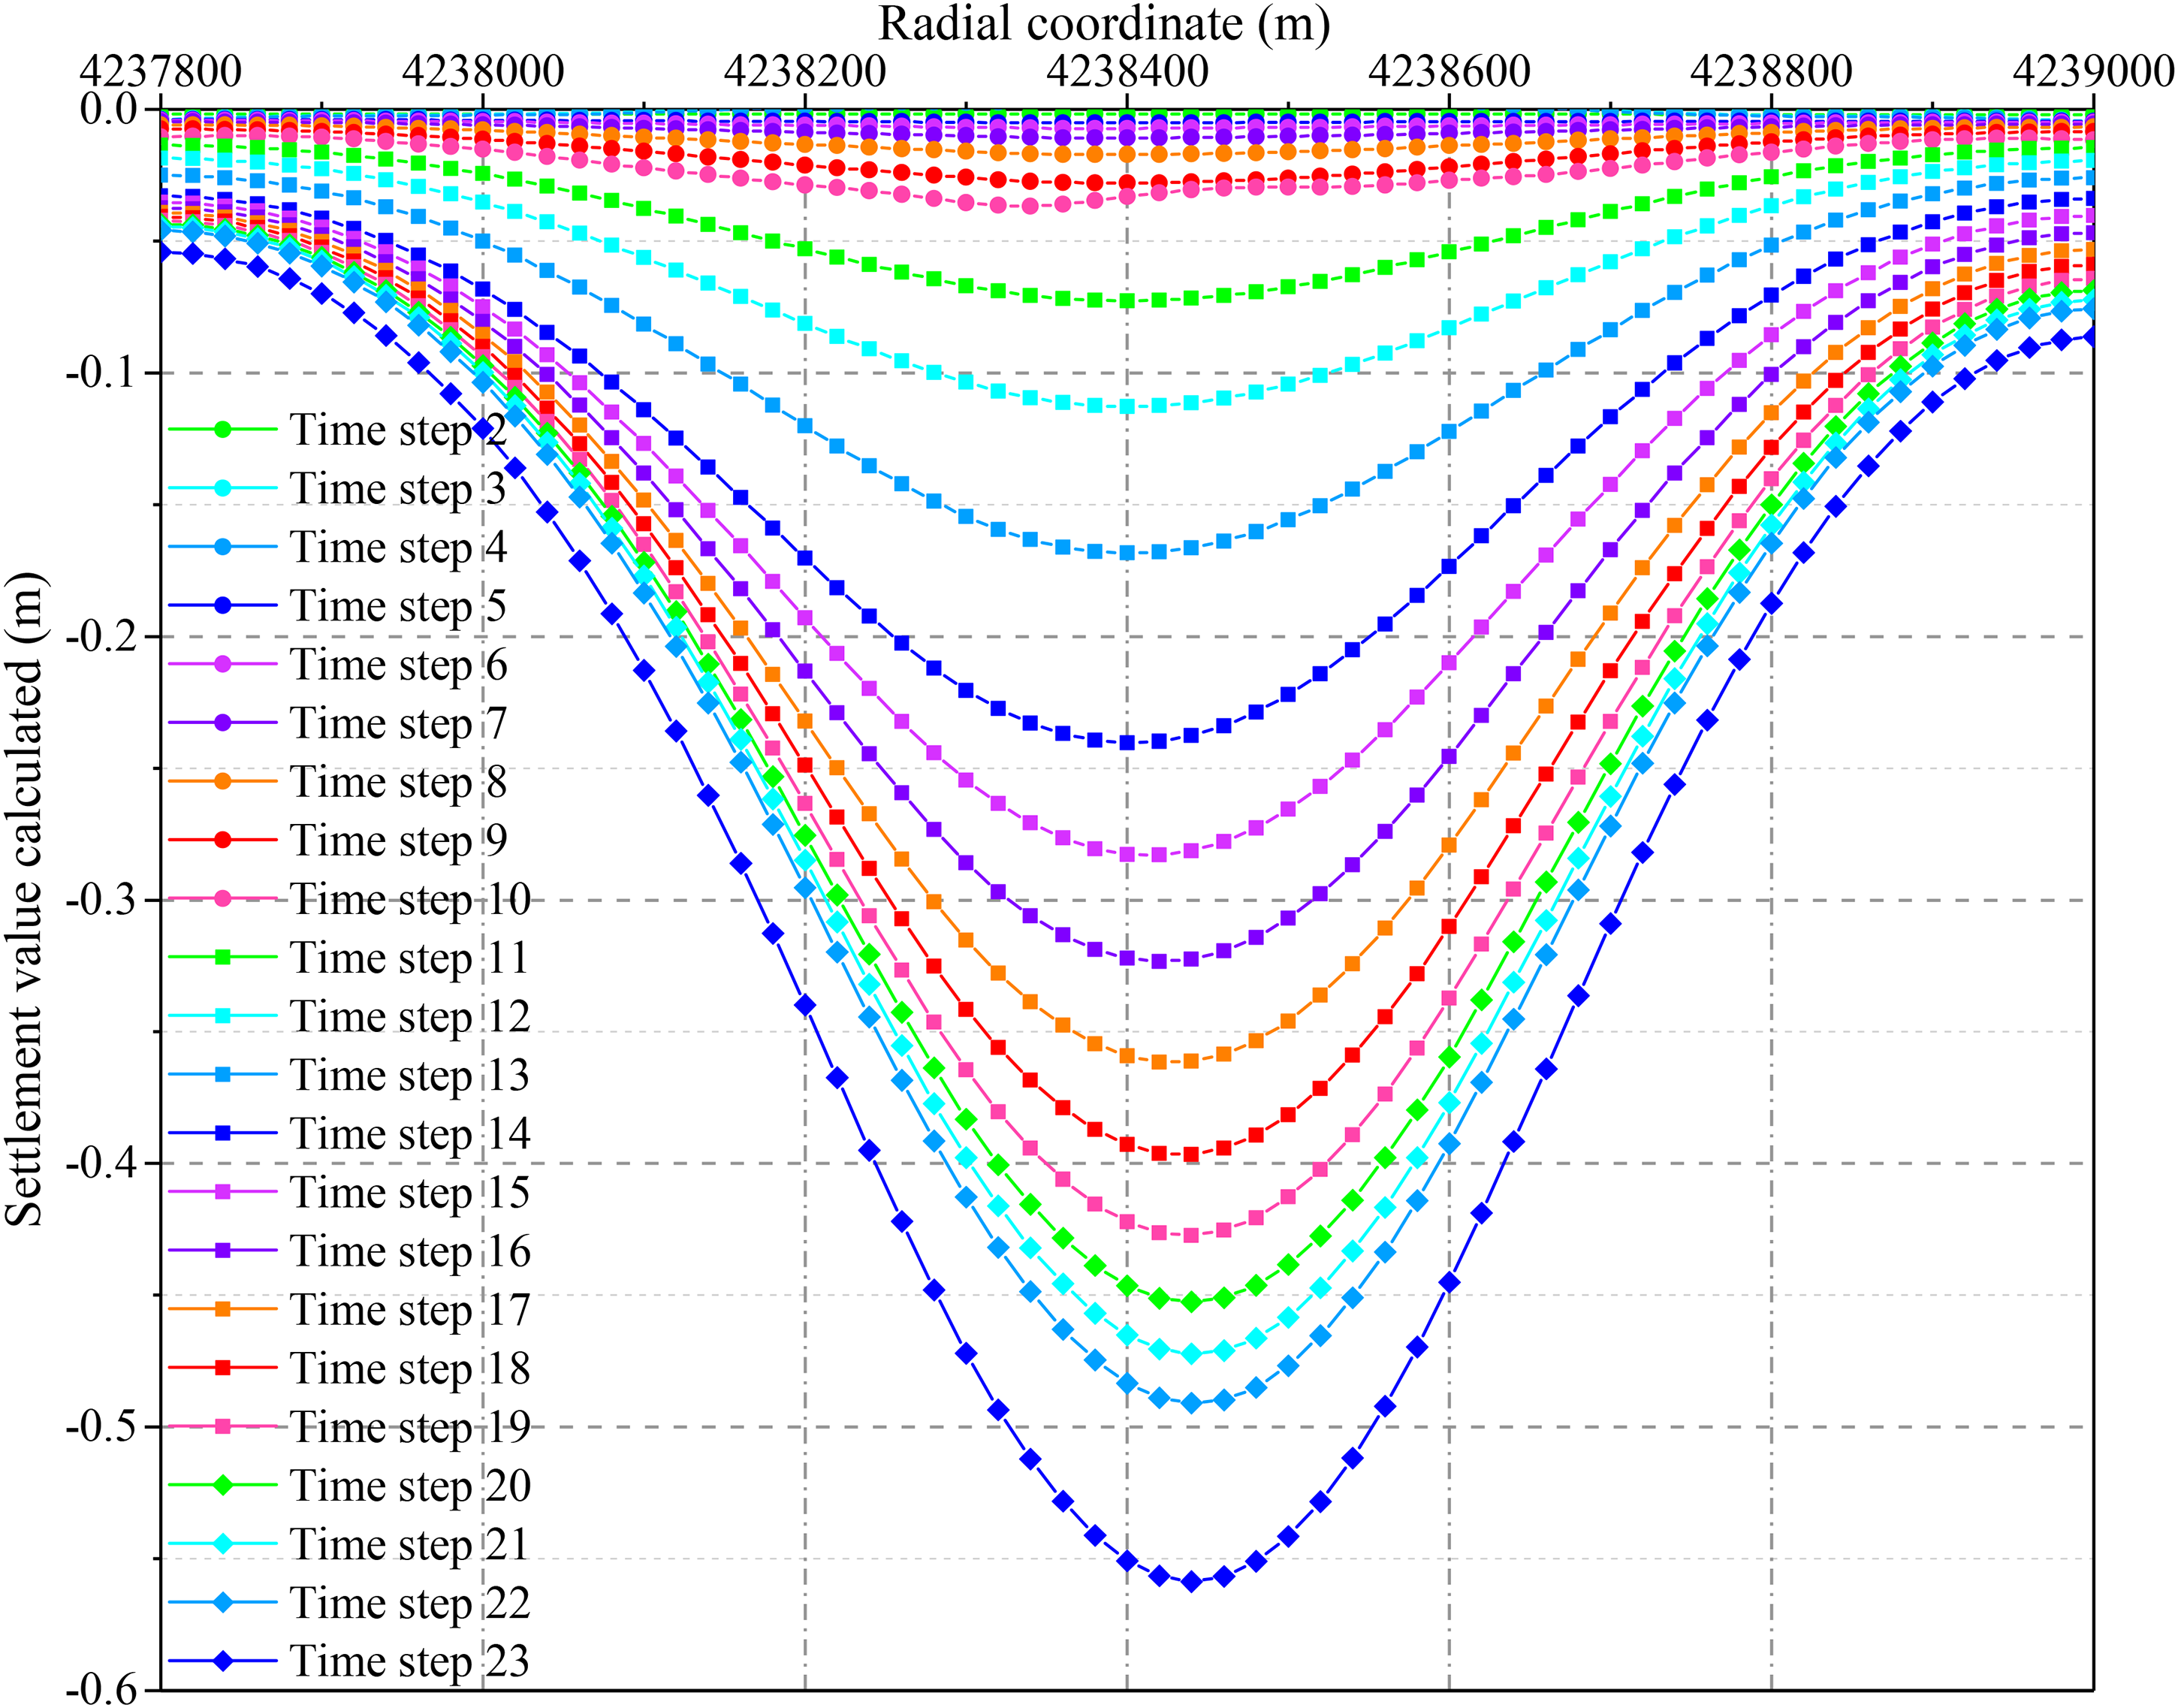
Surface subsidence evolution curves on the survey line passing through the left intersection point.
Figure 7 showed that the surface subsidence values on the right survey line increased steadily from time step 3 (working face advanced to about 60 m from the right intersection point) to time step 14 (working face exceeded the right intersection point about 600 m). During the subsequent mining stages (time steps 15–23), the increase of surface subsidence was insignificant.
The surface subsidence values on the middle survey line displayed a limited increase during the coal mining stages of time steps 2–5, with a maximum value of <0.1 m. In time steps 6–17 (largely corresponding to the stages of under-highway mining), the surface subsidence value gradually increased to 0.85 m, and the growth rate first increased and then decreased and reached its maximum value at time step 10 (working face advanced to the middle intersection point) (Figure 8).
On the left survey line, the surface subsidence was insignificant during the mining stages of time steps 2–10 (coal mining stages before the middle intersection point). In time steps 11–22, the surface subsidence on the survey line gradually increased (Figure 9). The maximum subsidence increment of adjacent time steps was observed in time steps 12–14 rather than the expected time step 16 (inferred from the subsidence variation trend on the right and middle survey lines). This is mainly due to the reduction of the working face at time step 15, resulting in a slight decrease in the subsidence increment in time steps 15–21. The reduction of the mining area also caused the relatively low surface subsidence on the left survey line at time step 23 (0.55 m) compared to the subsidence values on the right survey line at time step 14 and on the middle survey line at time step 19, in which the working face exceeded the corresponding survey lines by the same distance.
Surface deformation characteristics and safety evaluation of coal mining under highway
Distribution characteristics of horizontal deformation values
The contours of horizontal deformation values on the ground surface exhibited as strips largely parallel to the extension direction of the working face and were axisymmetric with the centerline of the mining district (Figure 10). The high-value zones (2–2.75 mm/m) were mainly distributed in the middle of the eastern part of the mining district. There are two low-value areas at the south and north outer sides of the mining district, with horizontal deformation values of <1 mm/m.
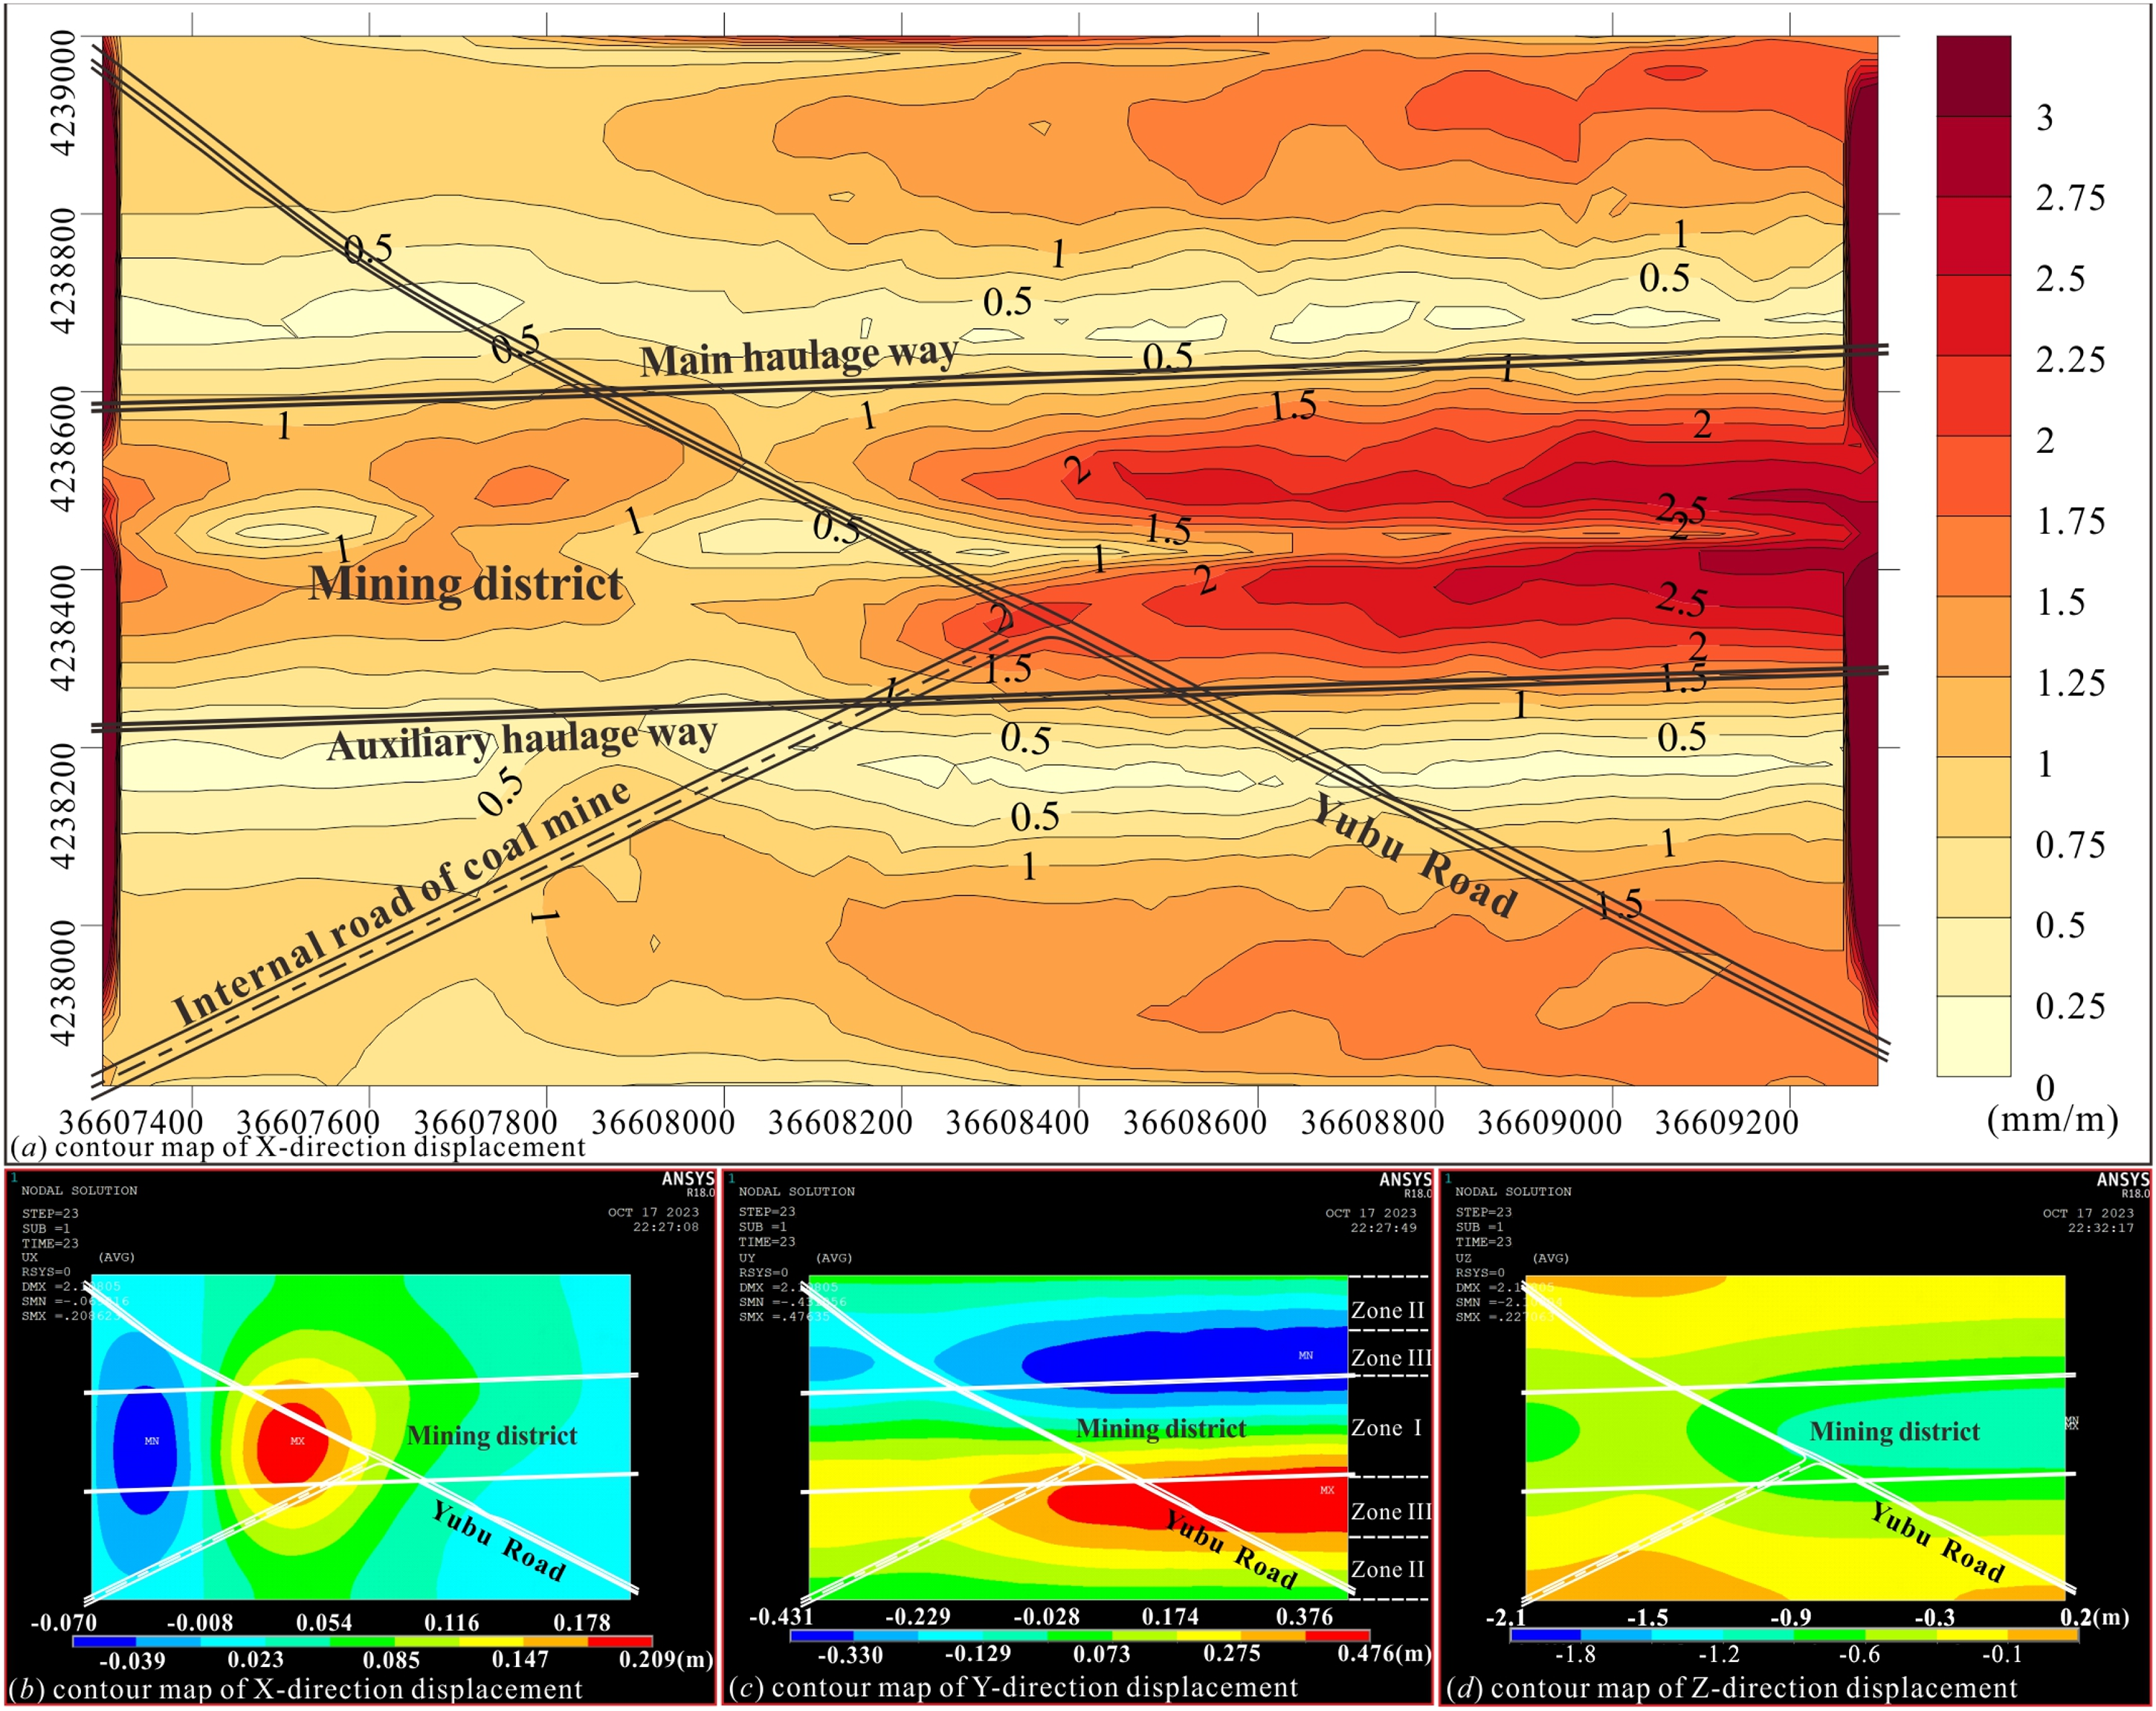
Contour map of surface horizontal deformation values and displacement components in X, Y, and Z directions at time step 23.
The distribution of horizontal deformation values conforms to the distribution characteristics of surface displacement components in X and Y directions obtained by numerical simulations (Figure 10(b) and (c)). The X-direction displacement values ranged between −0.07 and 0.209 m and were significantly smaller than the Y-direction displacement values (−0.431–0.476 m), indicating that the surface movement in the Y-direction occupied a dominant position in the surface horizontal displacement. In addition, the dense distribution areas of the Y-direction displacement contours were mainly located within the mining district, particularly in the middle of the mining district (Zone I of Figure 10(c)), followed by the areas away from the mining district (Zone II of Figure 10(c)). The areas near the outer sides of the mining district were symmetrically distributed with the sparse distribution areas of minimum and maximum values of the Y-direction displacement (Zone III of Figure 10(c)). Thus, after coal extraction, the area within the mining district will exhibit the larger horizontal displacement differences per unit distance (i.e. horizontal deformation value) and is the key monitoring area of horizontal deformation values while evaluating the stability of surface road foundation.
Distribution characteristics of surface inclination values
Figure 11 illustrates that after coal mining activities within the study area, the contours of surface inclination values were roughly symmetrically distributed around the centerline of the mining district. The low-value areas were in the middle of the mining district and the areas far from the mining district (less affected by coal extraction), with inclination values of <1.5 mm/m. The high-value areas (2–2.75 mm/m) were distributed near the outer roadway of the mining district, roughly overlapping with the low-value areas of horizontal deformation values in Figure 10(a).
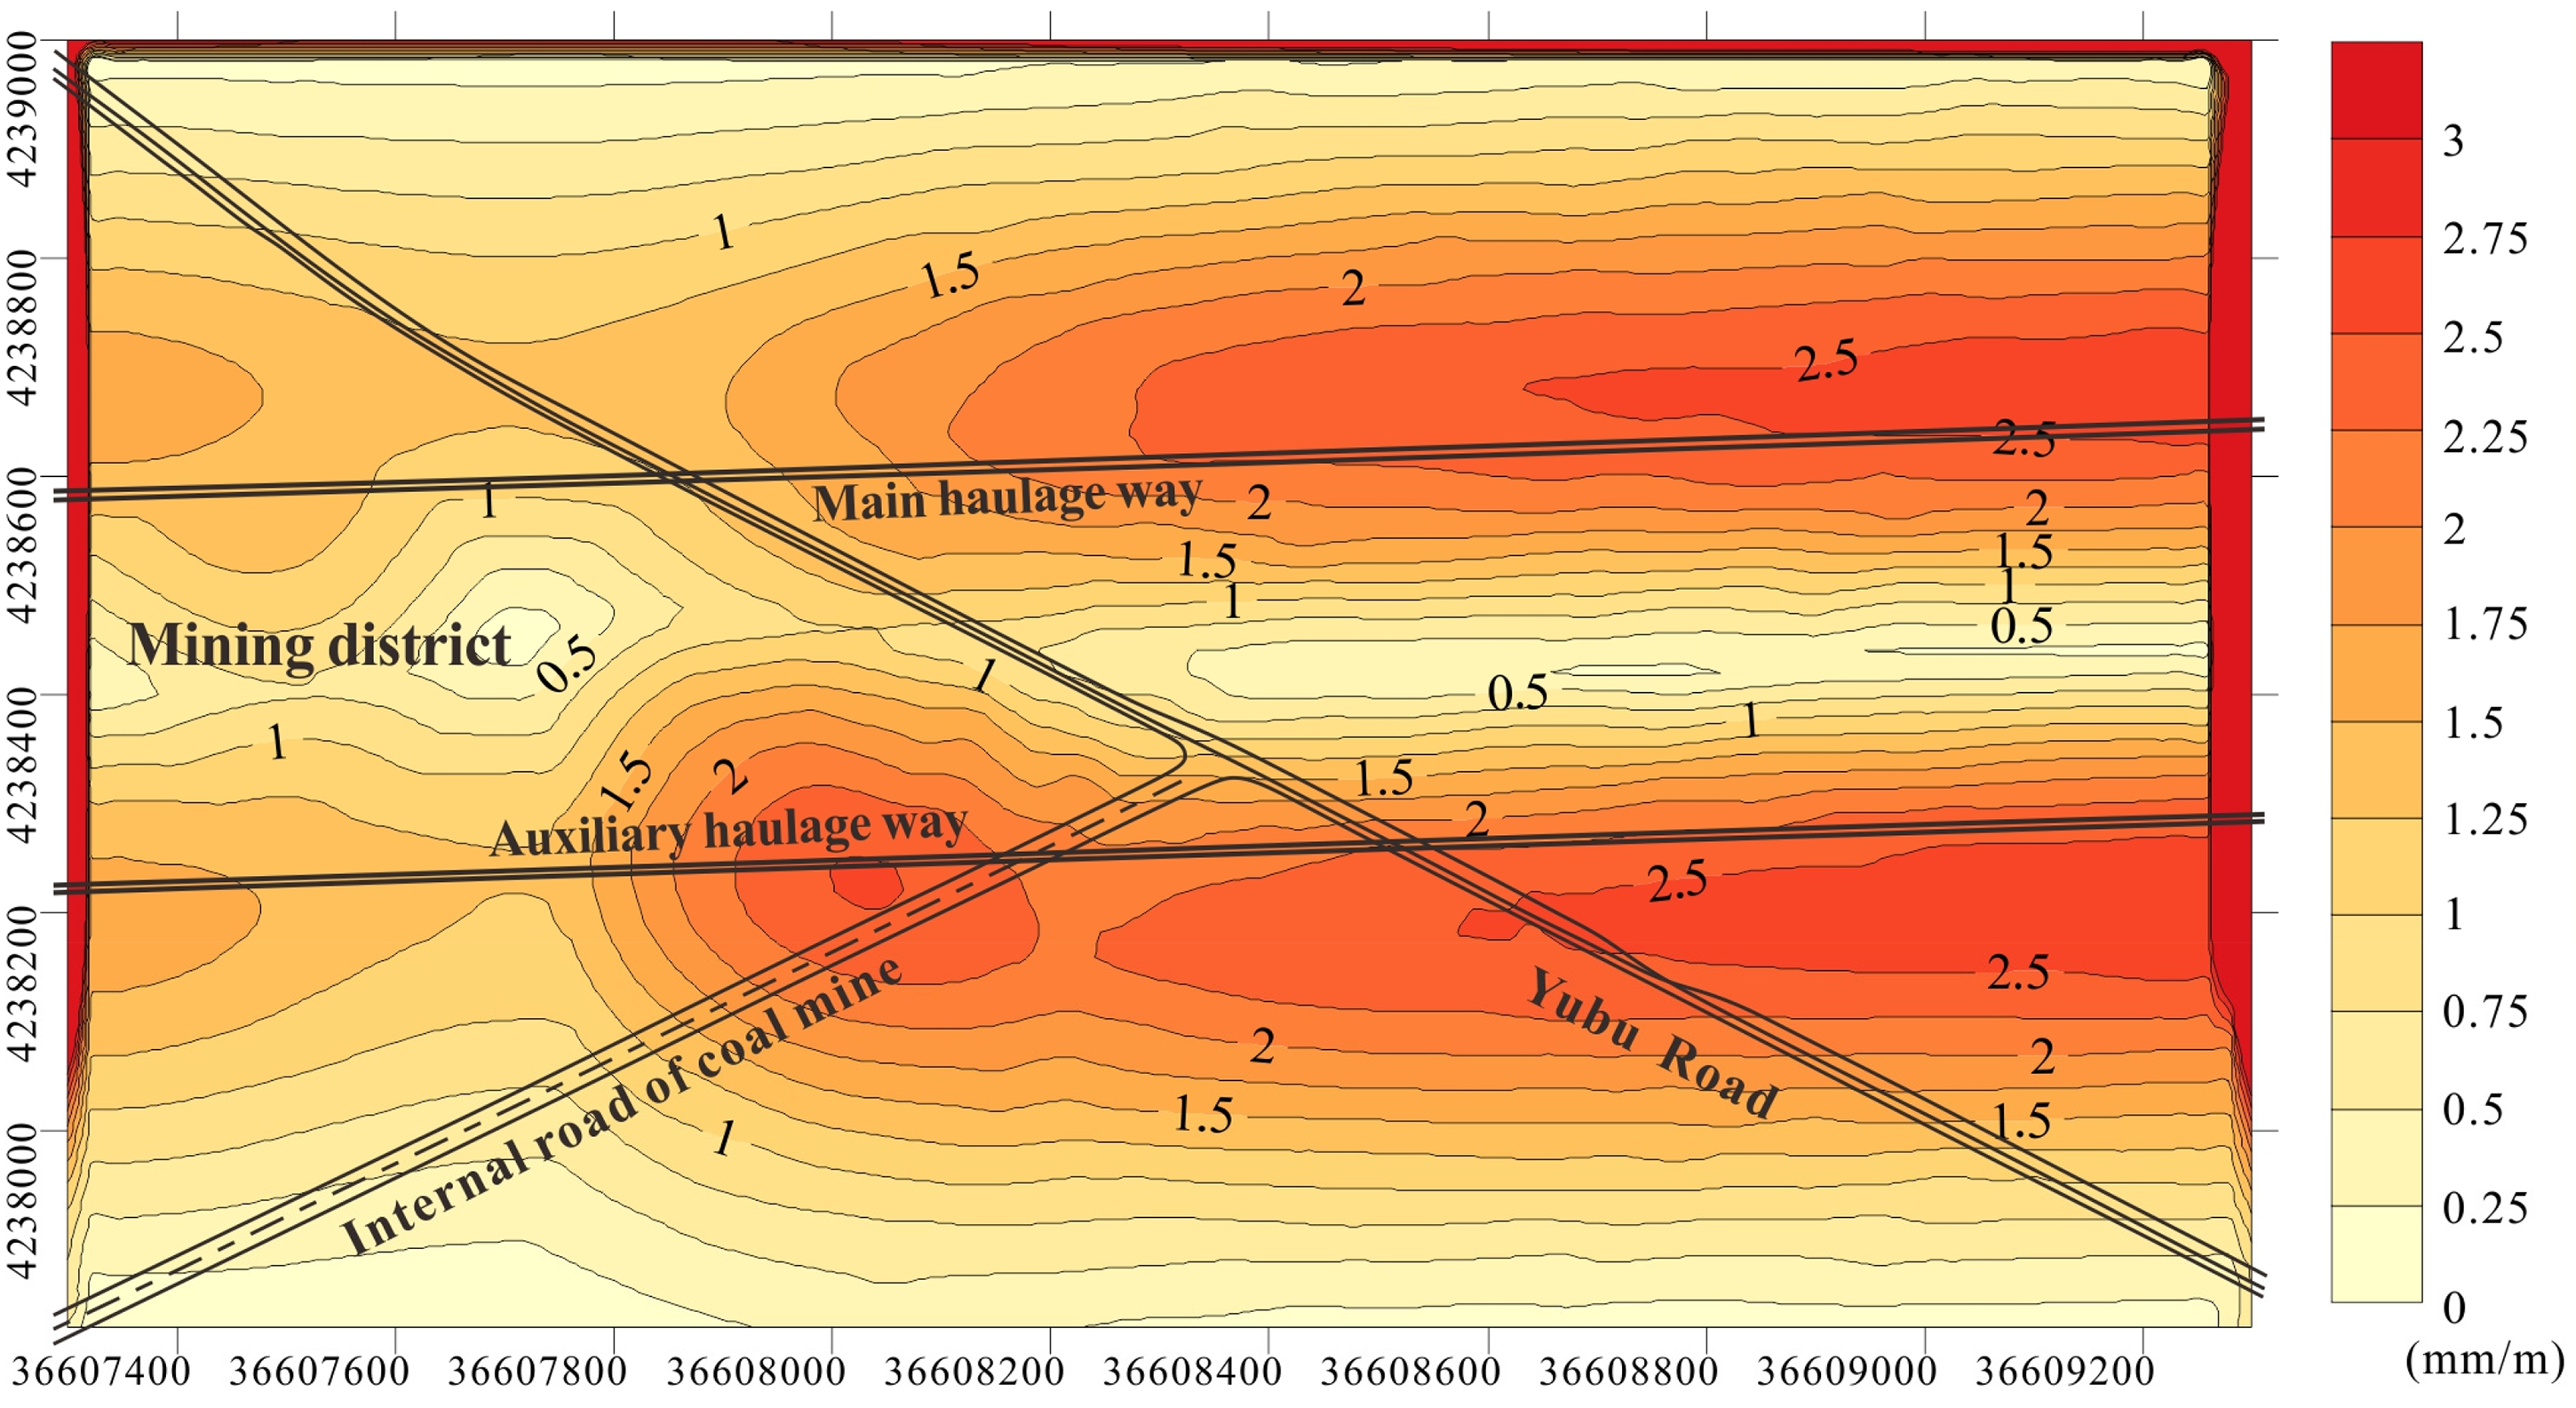
Contour map of surface inclination values at time step 23.
The high-value areas of surface inclination values conformed to the dense distribution areas of the contours of the Z-direction displacement. Figure 10(c) showed that the contours of Z-direction displacement on the surface at time step 23 were generally axisymmetric with the centerline of the mining district. Meanwhile, in the areas near the north and south roadways of the mining district, the contours were more densely distributed, indicating that the difference in subsidence values within a unit horizontal distance was higher in these areas.
Distribution characteristics of surface curvature values
As illustrated in Figure 12, the surface curvature values caused by coal mining activities ranged from −0.012 × 10⁻³ /m to 0.008 × 10⁻³ /m, and the contours exhibited as strips roughly axisymmetric with the centerline of the mining district. The surface curvature values within the mining district varied in the range from −0.006 × 10⁻³ to −0.002 × 10⁻³ /m, while those of outer areas ranged from −0.004 × 10⁻³ to 0.006 × 10⁻³ /m.
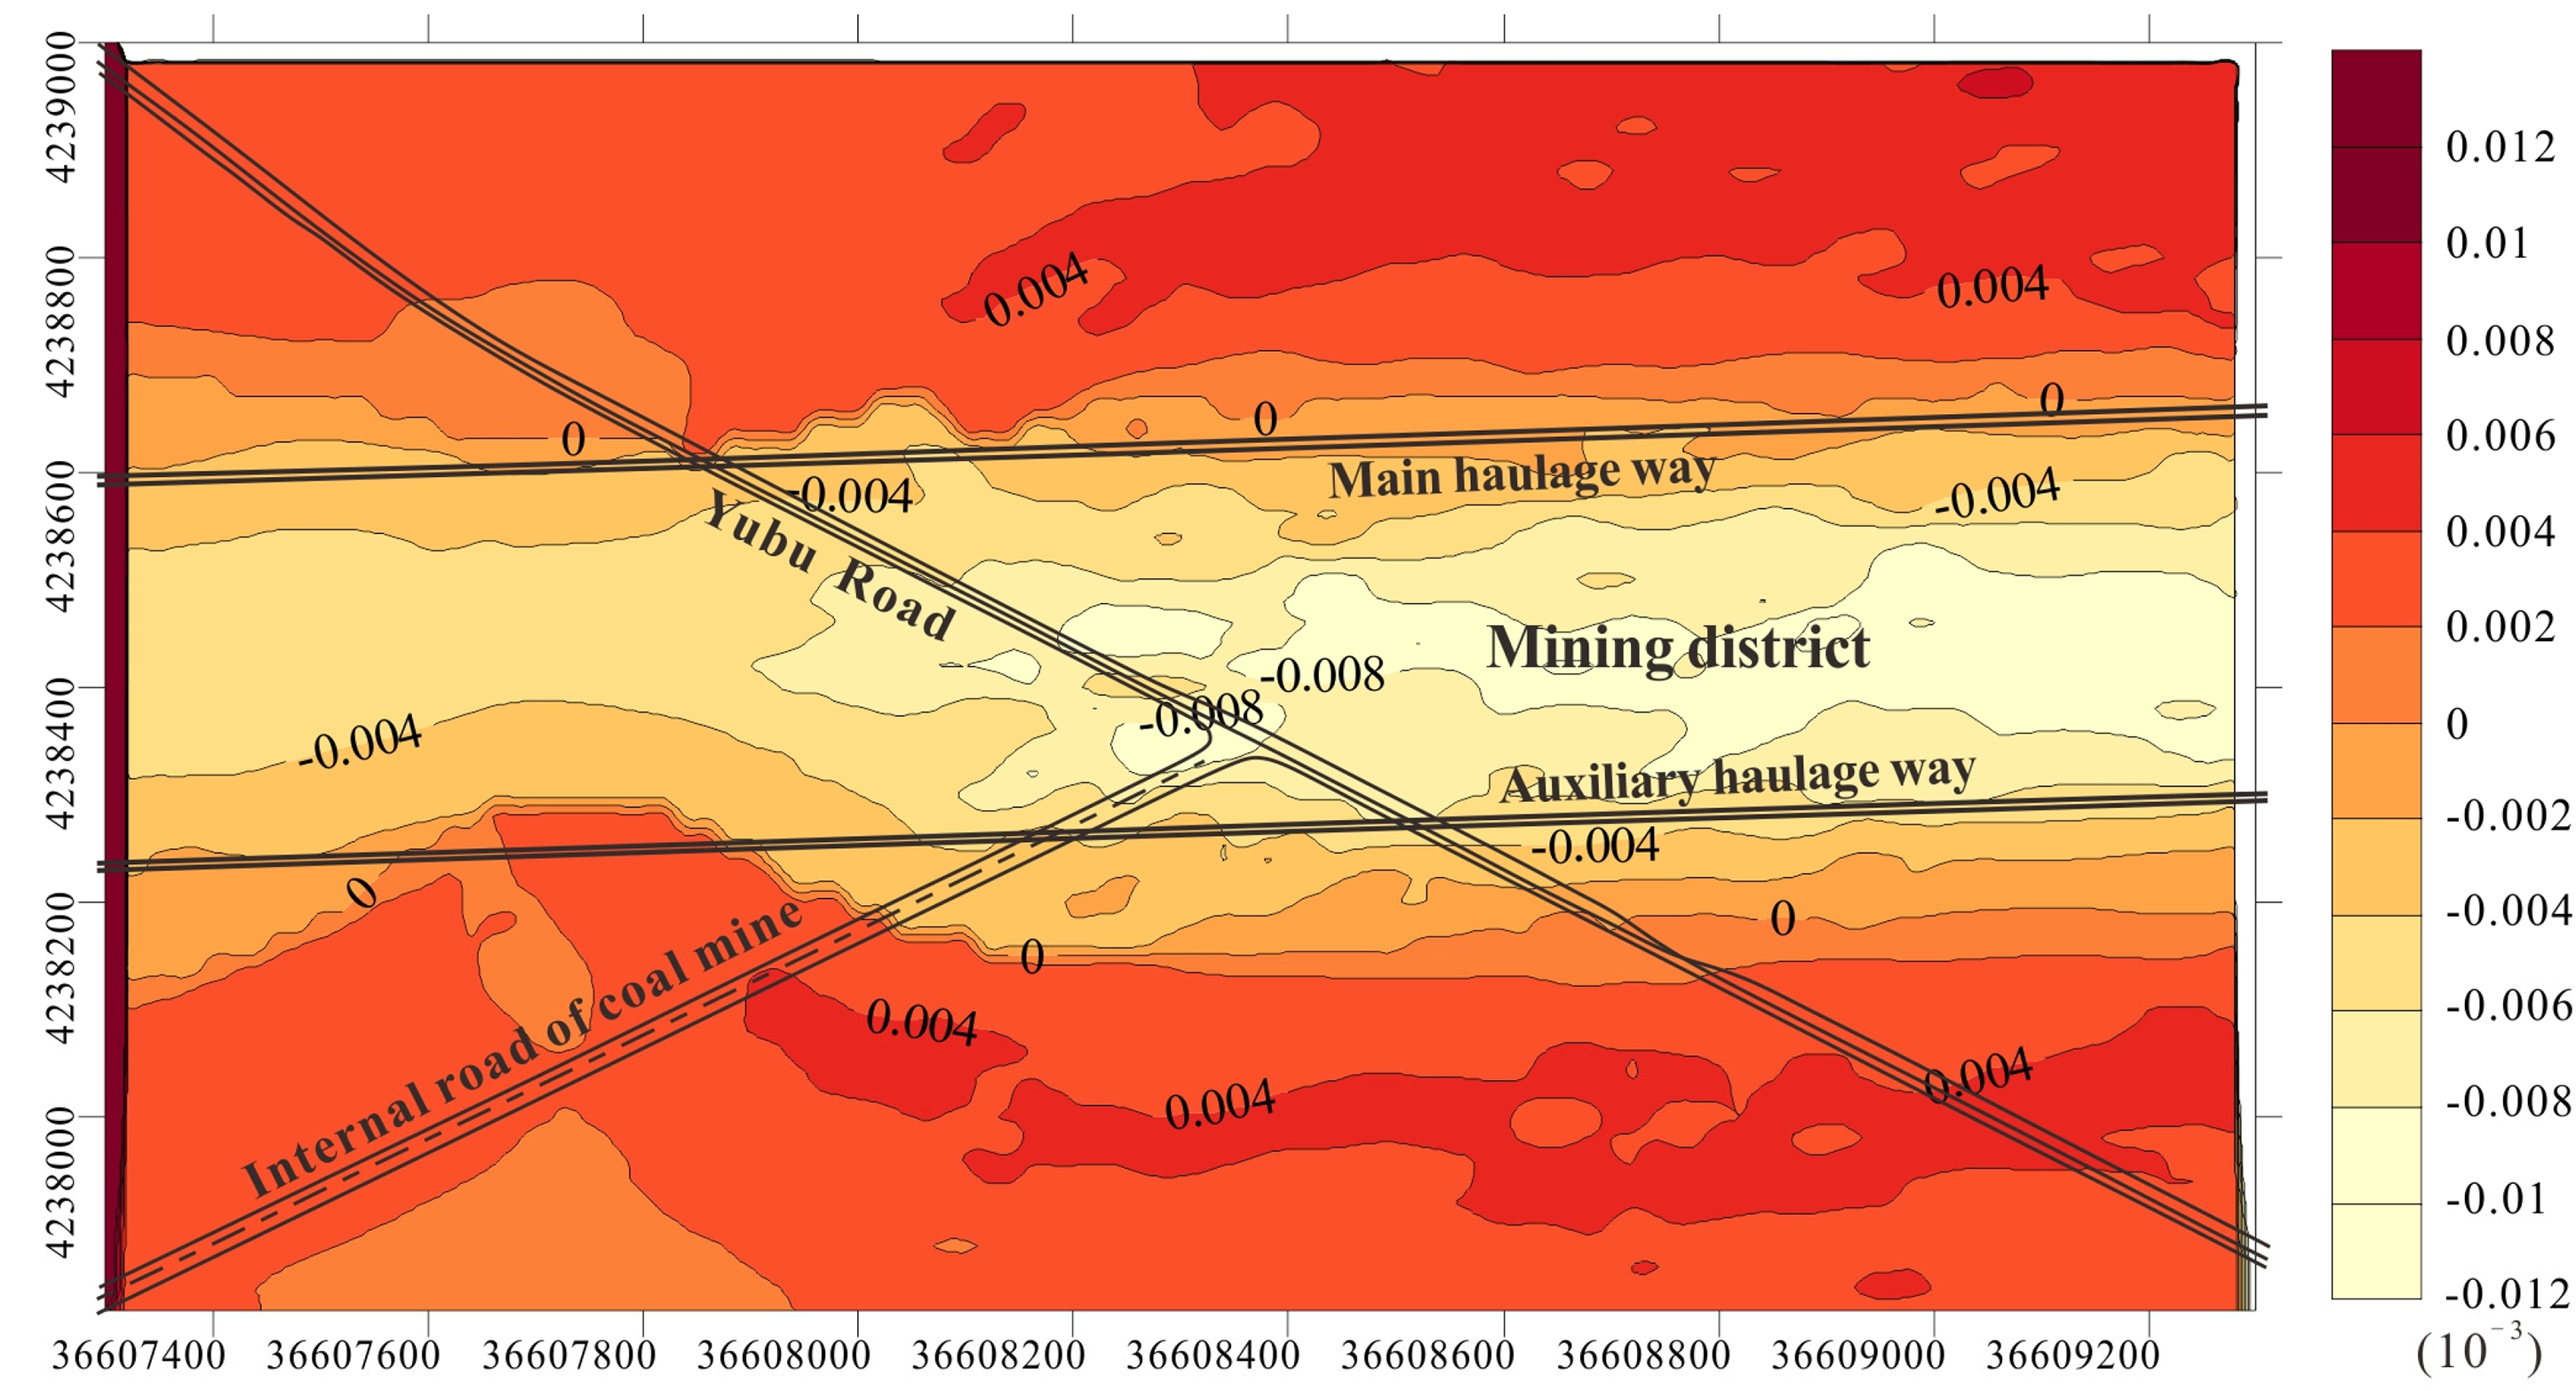
Contour maps of surface curvature values at time step 23.
The contour map of Z-direction displacement (Figure 10(c)) and the contour map of mining subsidence on the typical cross-sections (Figure 6) both showed that the surface subsidence values gradually decreased from the centerline of the mining district to the roadways and that the funnel centers were located near the centerline of the mining district. Thus, the distribution characteristics of surface curvature values that were obtained by processing the Z-direction displacement data of surface nodes conform to the expected surface subsidence characteristics.
Stability evaluation of surface road fundament during coal mining activities
According to the industry standard of “Technical specifications for design and construction of highway engineering in mined-out area” awarded by Ministry of Transport of China, the stability of the roads and buildings in mined areas can be evaluated by the allowable surface deformation values of engineering foundations (Ministry of Transport of China, 2019). As for the Yubu road (second-class highway) in the study area, the criteria of foundation stability evaluation are horizontal deformation value ≤4.0 mm/m, surface inclination value ≤6.0 mm/m, and surface curvature value ≤0.3 × 10⁻³/m.
As shown above, except for the east and west boundary areas of the geological model, the horizontal deformation values on the surface were <2.5 mm/m, the surface inclination values were <2.75 mm/m, and the surface curvature values ranged within −0.012 × 10⁻³ to 0.006 × 10⁻³ /m. As for the surface highways, that is the Yubu Road and the internal road of the coal mine, the three surface deformation parameters range within 0–2.25 mm/m, 0–2.75 mm/m, and −0.006–0.002 × 10⁻³ /m, respectively. Obviously, the surface deformation induced by the coal extraction of the No.2 coal seam did not exceed the allowable deformation values of the foundation of second-class highways, indicating that the coal mining activities in the study area meet the stability requirements of the Yubu road foundation.
Influence of water induced rock mechanical property deterioration on surface subsidence prediction
Figure 13 illustrates the test results of mechanical parameters of core samples in different intervals. Obviously, the elastic modulus of water-saturated samples was much lower than that of dry samples, indicating that the water-saturated samples will experience much more elastic deformation under the same stress conditions. Thus, during the numerical simulation of coal mining activities, there will be a much greater downward displacement (subsidence) on the overlaying strata and surface. The cohesion and internal friction angle of water-saturated samples were also lower than those of dry samples, indicating the shear strengths of water-saturated samples were lower than those of dry samples; consequently, the shear failures and shear slip deformation along the fracture planes were more easily to develop in water-saturated samples under the same differential stresses, which will affect the shape of subsidence basins. The Poisson's ratio of water-saturated samples was slightly higher than that of air-dried samples. As a result, the water samples will exhibit greater lateral displacement during coal mining activities. Plenty of rock deformation experiments also support the conclusion that an increase in water content can lead to a significant decrease in the strength, stiffness, elastic modulus, fracture toughness and cohesion of rocks (especially clay-rich rocks) (Chen et al., 2019; Erguler and Ulusay, 2009; Liu et al., 2021; Noël et al., 2021; Wong et al., 2016). Taking the research of Erguler and Ulusay (2009) as an example, the strength and elastic modulus of clay-bearing rocks reduced by more than 90% with the sample state changing from the oven-dried state to the water-saturated state. Thus, constructing geological models and conducting coal mining simulation using the mechanical parameters of water-saturation basis will produce significantly different results from that of using dry samples.
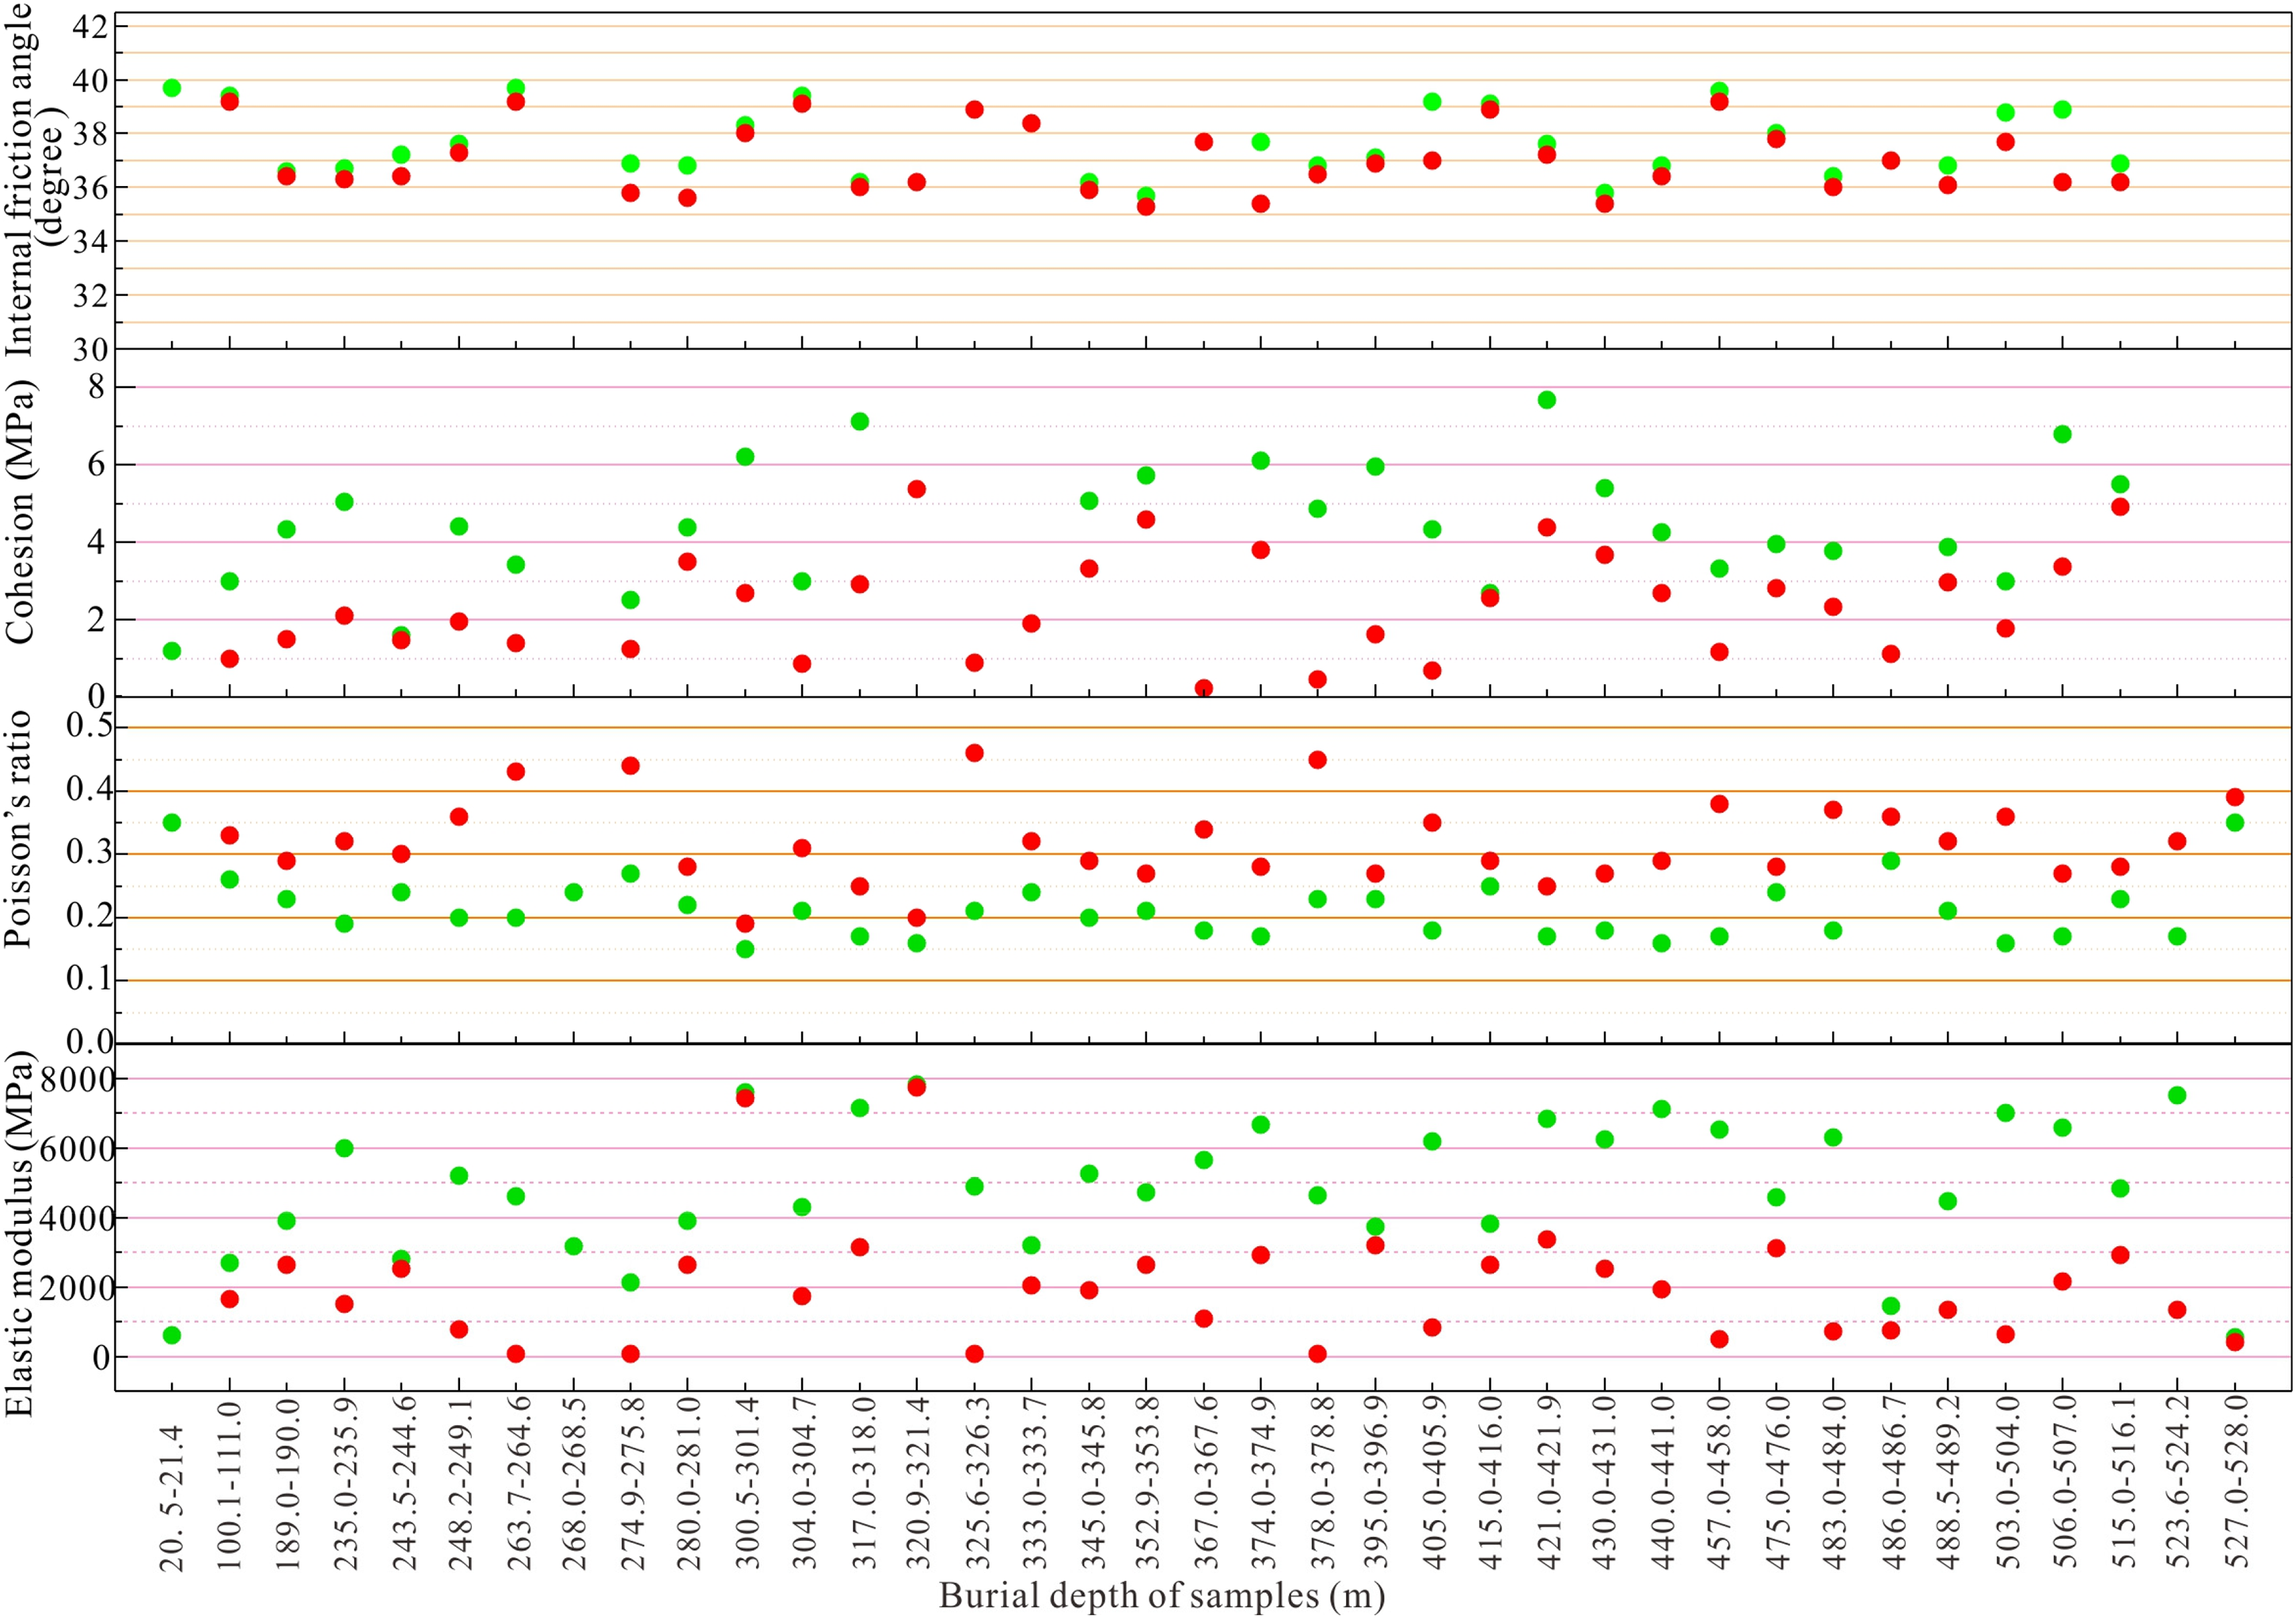
Variations in mechanical parameters between dry and water-saturated samples.
Additionally, the uniaxial compressive strength of dry samples in partial layers was much lower than that of dry samples of the similar horizon and same lithology, indicating the existence of microfractures and structural failures. Some core samples even disintegrated during the water-saturating treatment. In previous research, the test results of mechanical parameters of the representative intact samples were usually directly adopted as the mechanical parameters of the generalized layers, without considering the distinct mechanical properties and deformation behaviors of these deformed or microstructural modified layers.
In this study, the softening coefficient (the ratio of the mechanical parameters of water-saturated samples to those of dry samples) was calculated and used to quantify the influence of these mechanically weak layers on coal mining subsidence prediction. Specifically, the mechanical parameters of water-saturated samples of the mechanically weak layers were estimated by multiplying their mechanical parameters of dry samples with the corresponding softening coefficients of the similar horizon and same lithology.
Figure 14 illustrates that the surface subsidence values at time step 23 on the geological model of dry samples were much lower than those of water-saturated samples. The maximum surface subsidence of the former was between 0.6 and 0.9 m, significantly lower than the latter of 0.9 to 1.2 m. In addition, the influence area of the surface subsidence basin obtained in the geological model based on dry samples was significantly smaller than that based on water-saturated samples, which can be proved by the contour maps on the surface (Figure 14(a) and (d)) and the cross-sections passing through the right intersection point (Figure 14(b) and (e)). Meanwhile, the subsidence contour maps on the longitudinal sections at time step 16 showed that in the geological model based on water-saturated samples, a larger area in front of the working face was affected by coal mining activities (Figure 14(c) and (f)).
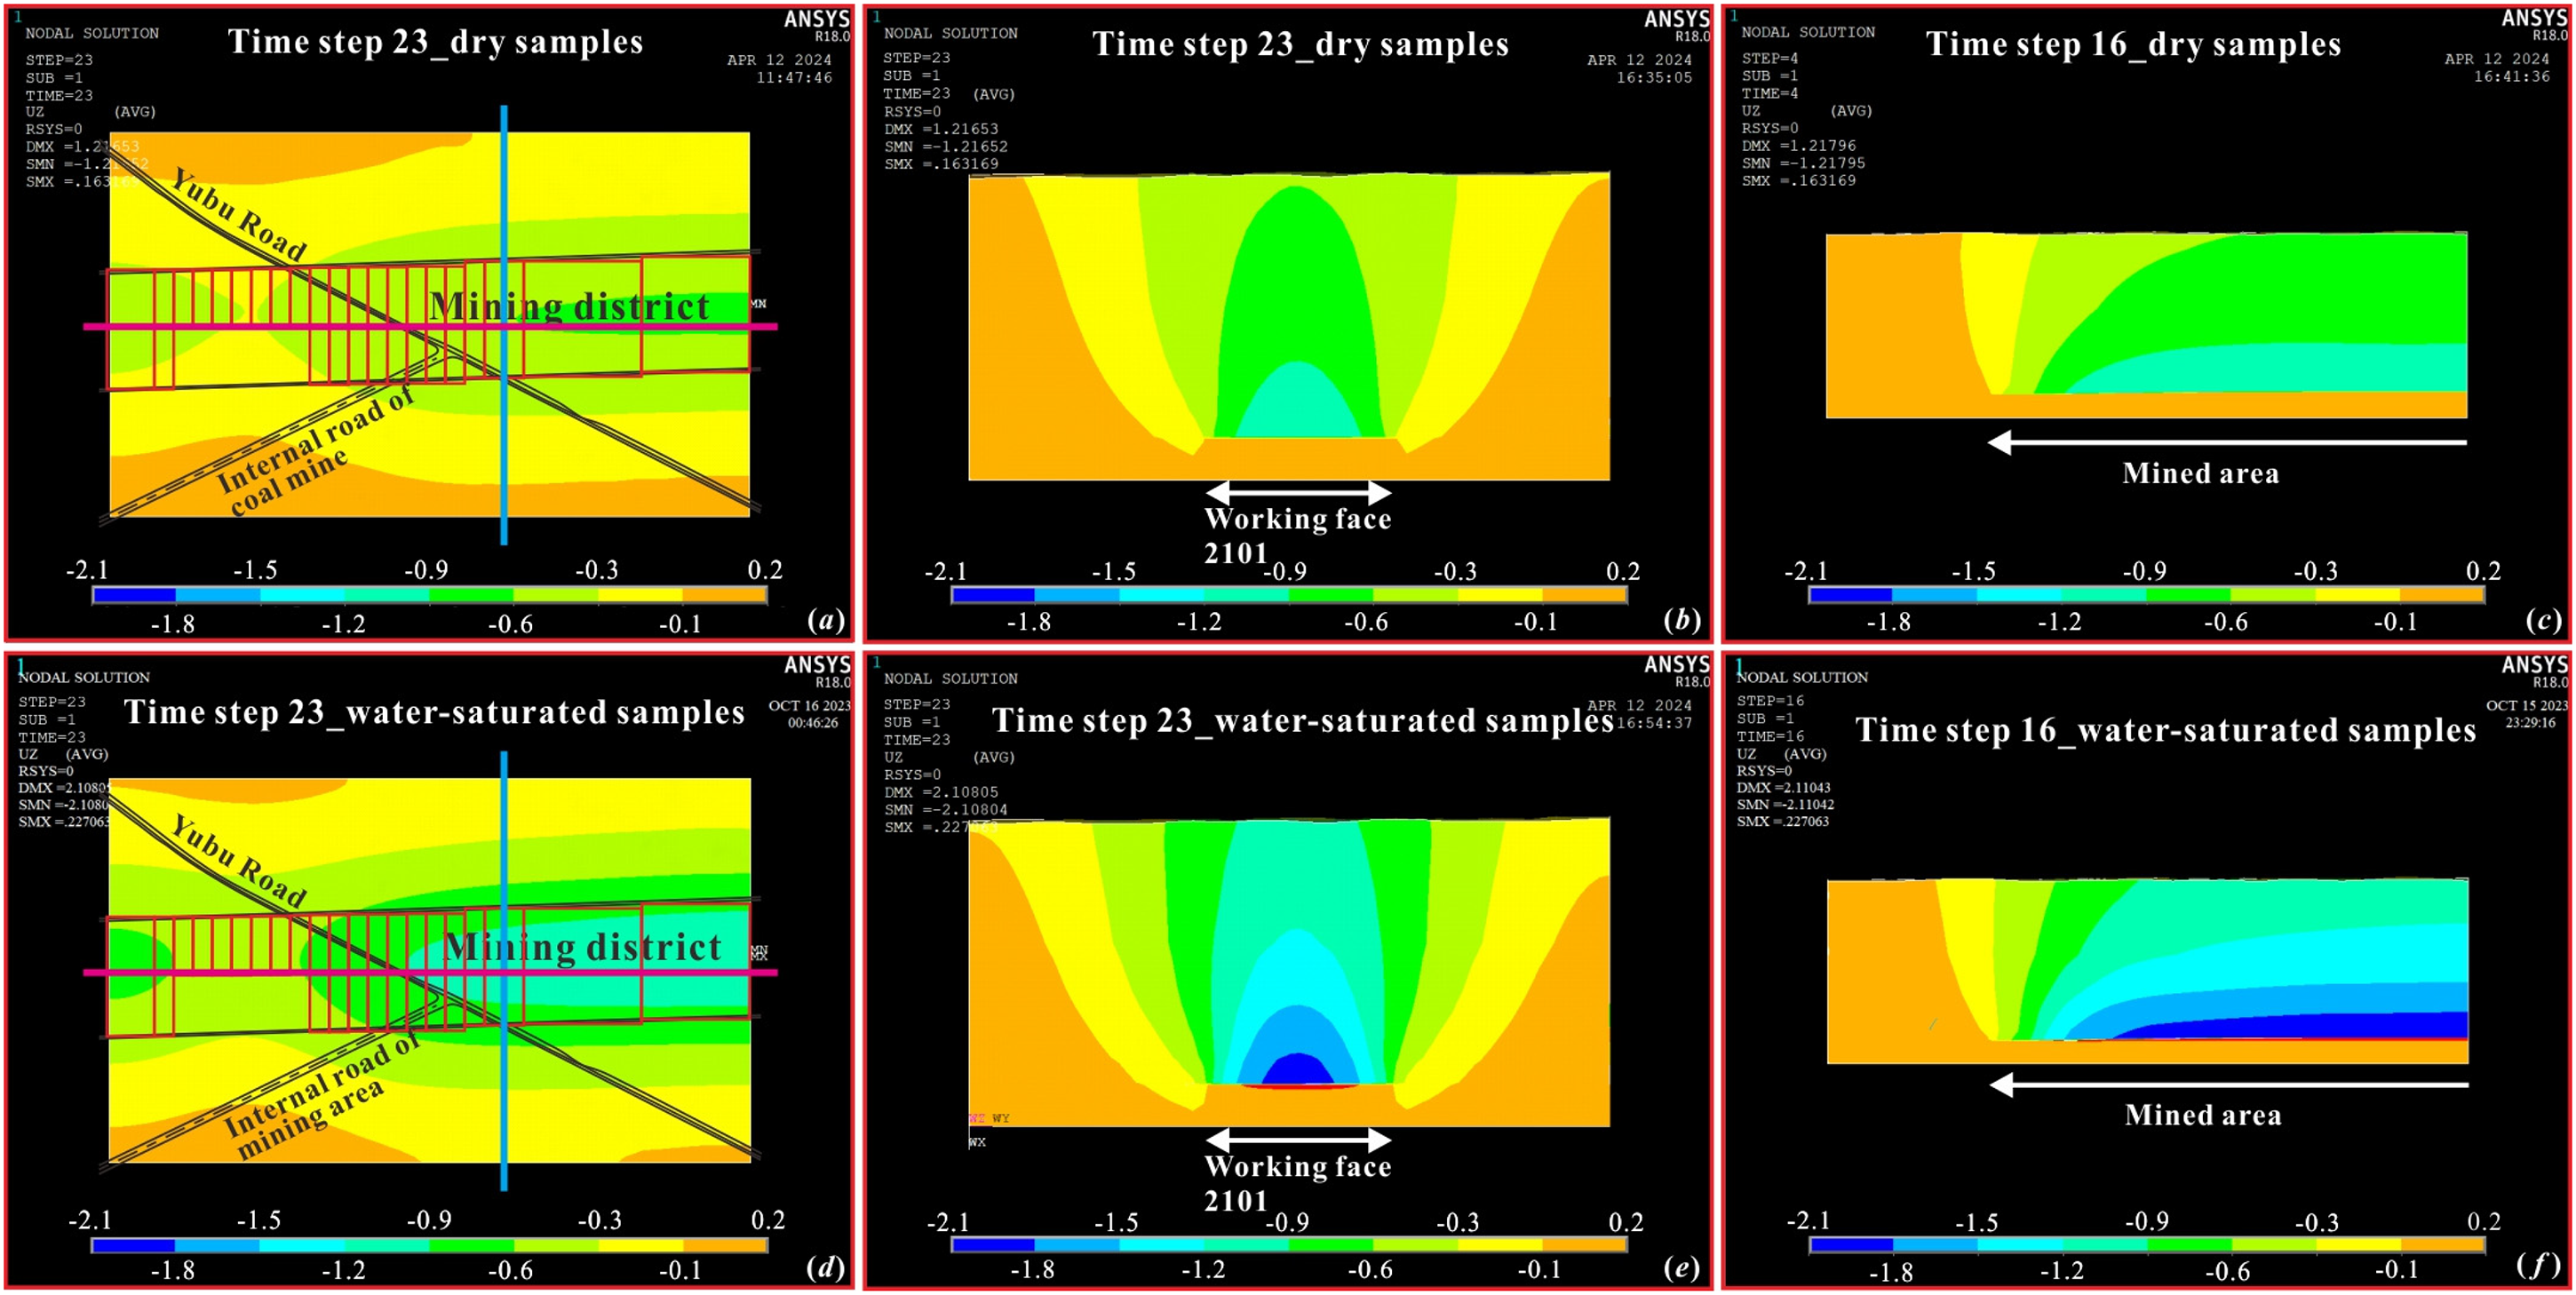
Difference in subsidence characteristics between models constructed using mechanical parameters of dry and water-saturated samples.
To sum up, using the test results of mechanical parameters of dry samples will cause the generalized layers to have a higher elastic modulus and strength and a lower Poisson's ratio. Consequently, the subsidence values calculated will be noticeably lower than those recorded during actual coal mining activities, and the influence area of coal mining subsidence will also be underestimated. Thus, constructing the geological model using the mechanical property test results of water-saturated samples is essential to obtaining reliable and accurate subsidence characteristics. As for the mechanically weak layers of which the mechanical properties cannot be easily obtained, it is practicable and necessary to determine their mechanical parameters of water-saturated state by considering their mechanical parameters of dry state and the softening coefficients of the same lithology.
Conclusion
After coal extraction, the studied mining district exhibited a subsidence basin characterized by approximately parallel lines. The surface within a range of about 400 m on either side of the mining district was affected by coal mining activities, with the maximum surface subsidence ranged from 0.9 to 1.1 m. The horizontal deformation values and inclination values on the surface induced by coal mining were <2.75 mm/m, and the surface curvature values were between −0.012 and 0.006 /m. As for the main highways in the study area, that is, the Yubu road and the internal road of the Balasu coal mine, the maximum surface subsidence was expected to be 0.9 m, and the 3 surface deformation parameters ranged within 0–2.25 mm/m, 0–2.75 mm/m, and −0.006–0.002 × 10⁻³ /m, respectively. The coal extraction under surface roads in the study area can meet the stability requirements of the highway foundation.
A numerical simulation method was proposed, by which the natural geological structures and mechanical parameters of water-saturated samples were considered to establish the 3D geological model, and the evolution rules of displacement and subsidence of overlying strata and surface during coal extraction were predicted by simulating the under-highway coal mining process. The surface subsidence basin predicted by numerical simulation exhibited extremum values and distribution characteristics similar to those by field measurement.
The traditional numerical simulation research that constructed geological models based on the mechanical parameters of dry samples underestimated the influence area and values of the coal mining-induced displacement and subsidence of the overlying strata and surface. Therefore, during the numerical simulation research of predicting coal mining subsidence, it is necessary to fully consider the influence of water-induced deterioration on the mechanical properties of the overlying strata, which is essential in constructing the geological model that conforms to the actual structures and deformation response of the strata. In this way, we can obtain a reliable understanding of the evolution of strata displacement and surface subsidence during coal mining activities.
There are still some limitations in this study. First, the strata were simplified to a great extent due to the limitation of computer memory. As a result, each generalized layer contains multiple lithological layers, and there may be deviations between the adopted unified mechanical parameters of generalized layers and the actual deformation response of the strata. In future research, the actual structures of strata can be more accurately simulated to obtain more reliable and precise prediction results of the coal mining subsidence by introducing more generalized layers. Second, the mechanical parameters of some mechanically weak layers on a water-saturation basis were estimated according to their mechanical parameter results of dry samples and the softening coefficients of the similar horizon and same lithology, which may introduce some divisions. In future research, numerical simulations using the discrete element method can be considered to study the mechanical parameters and deformation behaviors of these deformed or microstructural modified layers.
Highlights
Numerical simulations were conducted to evaluate the influence of longwall coal mining on surface roads.
The under-highway coal mining process was simulated using the finite element simulation method.
A 3D geological model, considering the textures and thickness distribution of strata was constructed.
The deteriorating effect of water saturation on rock mechanical properties was taken into account.
Footnotes
Authors’ contribution
GC was involved in methodology, investigation, data curation, formal analysis, funding acquisition, and writing—original draft; HL in methodology, funding acquisition, and writing and proofreading for the original draft; FL in visualization, original draft proofreading, and data curation; QW in data curation and geological condition investigation; and PC in geological condition investigation.
Declaration of conflicting interests
The authors declared no potential conflicts of interest with respect to the research, authorship, and/or publication of this article.
Funding
The authors disclosed receipt of the following financial support for the research, authorship, and/or publication of this article: This work was supported by the Observation and Research Station of Ground Fissure and Land Subsidence, Ministry of Natural Resources (grant number 2022-05), Key R&D Plan Project in Shaanxi Province (grant number 2023-YBGY-320), Natural Science Foundation of Jiangsu Province (grant number BK20231083), China Postdoctoral Science Foundation (grant number 2023M733744), and Fundamental Research Funds for the Central Universities (grant number 2023QN1023).