
Abstract
The relationship of P- and S-wave velocities, density, and P-wave velocity provides a physical basis for the interpretation, inversion, and prediction of the well-logging and geophysical data of the carbonate reservoir, which is of great significance for deep geothermal exploration and exploitation. This paper takes the carbonate karst geothermal reservoir in the Niutuozhen geothermal field in North China as the research object, based on the physical property parameters such as P-wave velocity, S-wave velocity, and density obtained by petrophysical experiment and the geophysical exploration data of two-dimensional seismic and well-logging. The change rule of P- and S-wave velocities with temperature and pressure increases in carbonate rock is studied using mathematical statistics. The results show that the P-wave velocity of carbonate rocks increases with the increase in temperature below 50 °C, decreases with the rise in temperature above 50 °C, and tends to be stable above 100 °C. The change rule of S-wave velocity with temperature increasing is not apparent. Both P- and S-wave velocities increase with the increase in surrounding pressure, with the most extensive increase range of 10–15 MPa. At the same time, mathematical models of the P-S wave velocity relation and density-P-wave velocity relation applicable to the study area were also established. The density of the Wumishan formation of the Jixian System in borehole D15 was predicted under the constraint of well-logging. The results were in good agreement with the measured data, which proved the applicability of the constructed petrophysical model in the study area. It helps improve the accuracy and reliability of geophysical exploration data interpretation and reservoir prediction, and it has important practical application and theoretical value.
Keywords
Introduction
The petrophysical experiment is the most basic research method to obtain physical property parameters. The change rule and correlation of various parameters under different temperature and pressure conditions can provide scientific constraints for interpreting ground geophysical exploration results and effectively reduce its uncertainty or multiple solutions (Yang and Jin, 1998). Due to the importance of the reflection seismic method in geophysical exploration, since the 1870s, research in rock physics has focused on seismic characteristics, the critical parameter of which is elastic wave velocity (Gary et al., 2003).
Many scholars at home and abroad have conducted experimental research and theoretical analysis on the physical properties of rocks under different temperature and pressure conditions; most of them are sandstone, limestone, shale, and basalt, and there are few related researches on carbonate rocks. Petrophysical experiments in the eastern Pearl River Estuary Basin reveal that the P- and S-wave velocities of Tertiary sandstones, siltstones, carbonate rocks, and their transitional rocks increase with confining pressure (Wu, 2003). Based on Biot's theory, the P-wave velocity equation of sand mudstone and carbonate rock in an oilfield in western China is established to explain the characteristics of P-wave velocity in abnormally high-pressure formations (Yu et al., 2014). When the confining pressure is low, the wave velocity of carbonate rock in a particular area increases nonlinearly with the increase in the confining pressure. When the confining pressure is high, the increase rate slows down. There is a specific deviation between the exact measurement of P-wave velocity and the theoretical prediction. In contrast, the deviation between the actual measurement and the theoretical value of S-wave velocity is slight (Xiao, 2020). The P- and S-wave velocities of the saturated formation water core decrease slightly as the temperature of carbonate rocks in Dengying formation in the Hechuan-Tongnan area of the Sichuan Basin increases gradually. With the increase in confining pressure or temperature, the primary frequency amplitude of P-wave and S-wave increases gradually (Hou et al., 2023). The overpressure rock physical simulation experiment of carbonate rock samples in the Maoba area of northeast Sichuan found that the P- and S-wave velocities of dry rock samples increased with the increase in confining pressure (effective stress). The P- and S-wave velocities varied greatly under low-confining pressure, mainly affected by the closure of microfractures and soft pores under low-confining pressure (Liu et al., 2019).
In 1974, Gardner proposed the exponential relation between P-wave velocity and density of rock, which is mainly applicable to clastic rock with regional solid characteristics. In practical application, it is necessary to adjust the coefficient of the relation by combining logging or drilling data, but for carbonate rock, it needs to be corrected (Gardner et al., 1974). To further improve the accuracy of Gardner's relation, Castagna proposed a P-wave velocity-density polynomial and exponential relation for different lithologies (shale, sandstone, limestone, and dolomite), which is suitable for high-porosity reservoirs and also has regional limitations (Castagna et al., 1985). Ursenbach combined the velocity and density parameters of P- and S-wave and proposed the generalized Gardner relation (Ursenbach, 2001). Hilterman summarized the relationship between velocity and density of carbonate rocks and found that the correlation coefficient could have been higher (Russell et al., 2003). Lv summarized a general formula for the relationship between P-S wave velocity under in-situ conditions of carbonate rocks in Tahe Oilfield. Still, there needed to be a clear linear relationship between velocity and density (Lv, 2012). Wang analyzed the distribution rule and variation characteristics of wave velocity in northeast Sichuan under different temperature and pressure conditions and concluded that the P-wave velocity of sand and mudstone is significantly related to the depth and density of strata. At the same time, that of carbonate rock is not significantly related (Wang et al., 2011).
The above research results show that the complexity of rock physical properties, such as elastic wave velocity and density, varies with lithology and region, especially for carbonate rocks. The primary variation rule of rock acoustic parameters has both universality and particularity, which affects the accuracy of the interpretation of ground geophysical exploration results.
Geological setting
Located in the northern part of the North China Plain, the Niutuozhen geothermal field is located in the central uplift area of Jizhong Depression (Grade III) within the North China Basin (Grade II) of the Mid-Korean platform (Grade I). It straddles Rongcheng Uplift, Niubei slope, Niutuozhen Uplift, Baxian Sag, and other structural units. It is adjacent to the Langgu Sag to the north, the Rongcheng Uplift to the west, and the Baxian Sag to the southeast. To the south and southwest are the Raoyang Sag, Lixian slope, and Gaoyang Low Uplift, respectively. The fault structure trends that have an essential impact on the Niutuozhen geothermal field are mainly NE trending, followed by EW, NNE, and NW trending, including Niudong fault, Daxing fault, Rongcheng fault, Niunan fault, and Xiongxian fault (Wang et al., 2020; Zhang et al., 2019) (Figure 1).
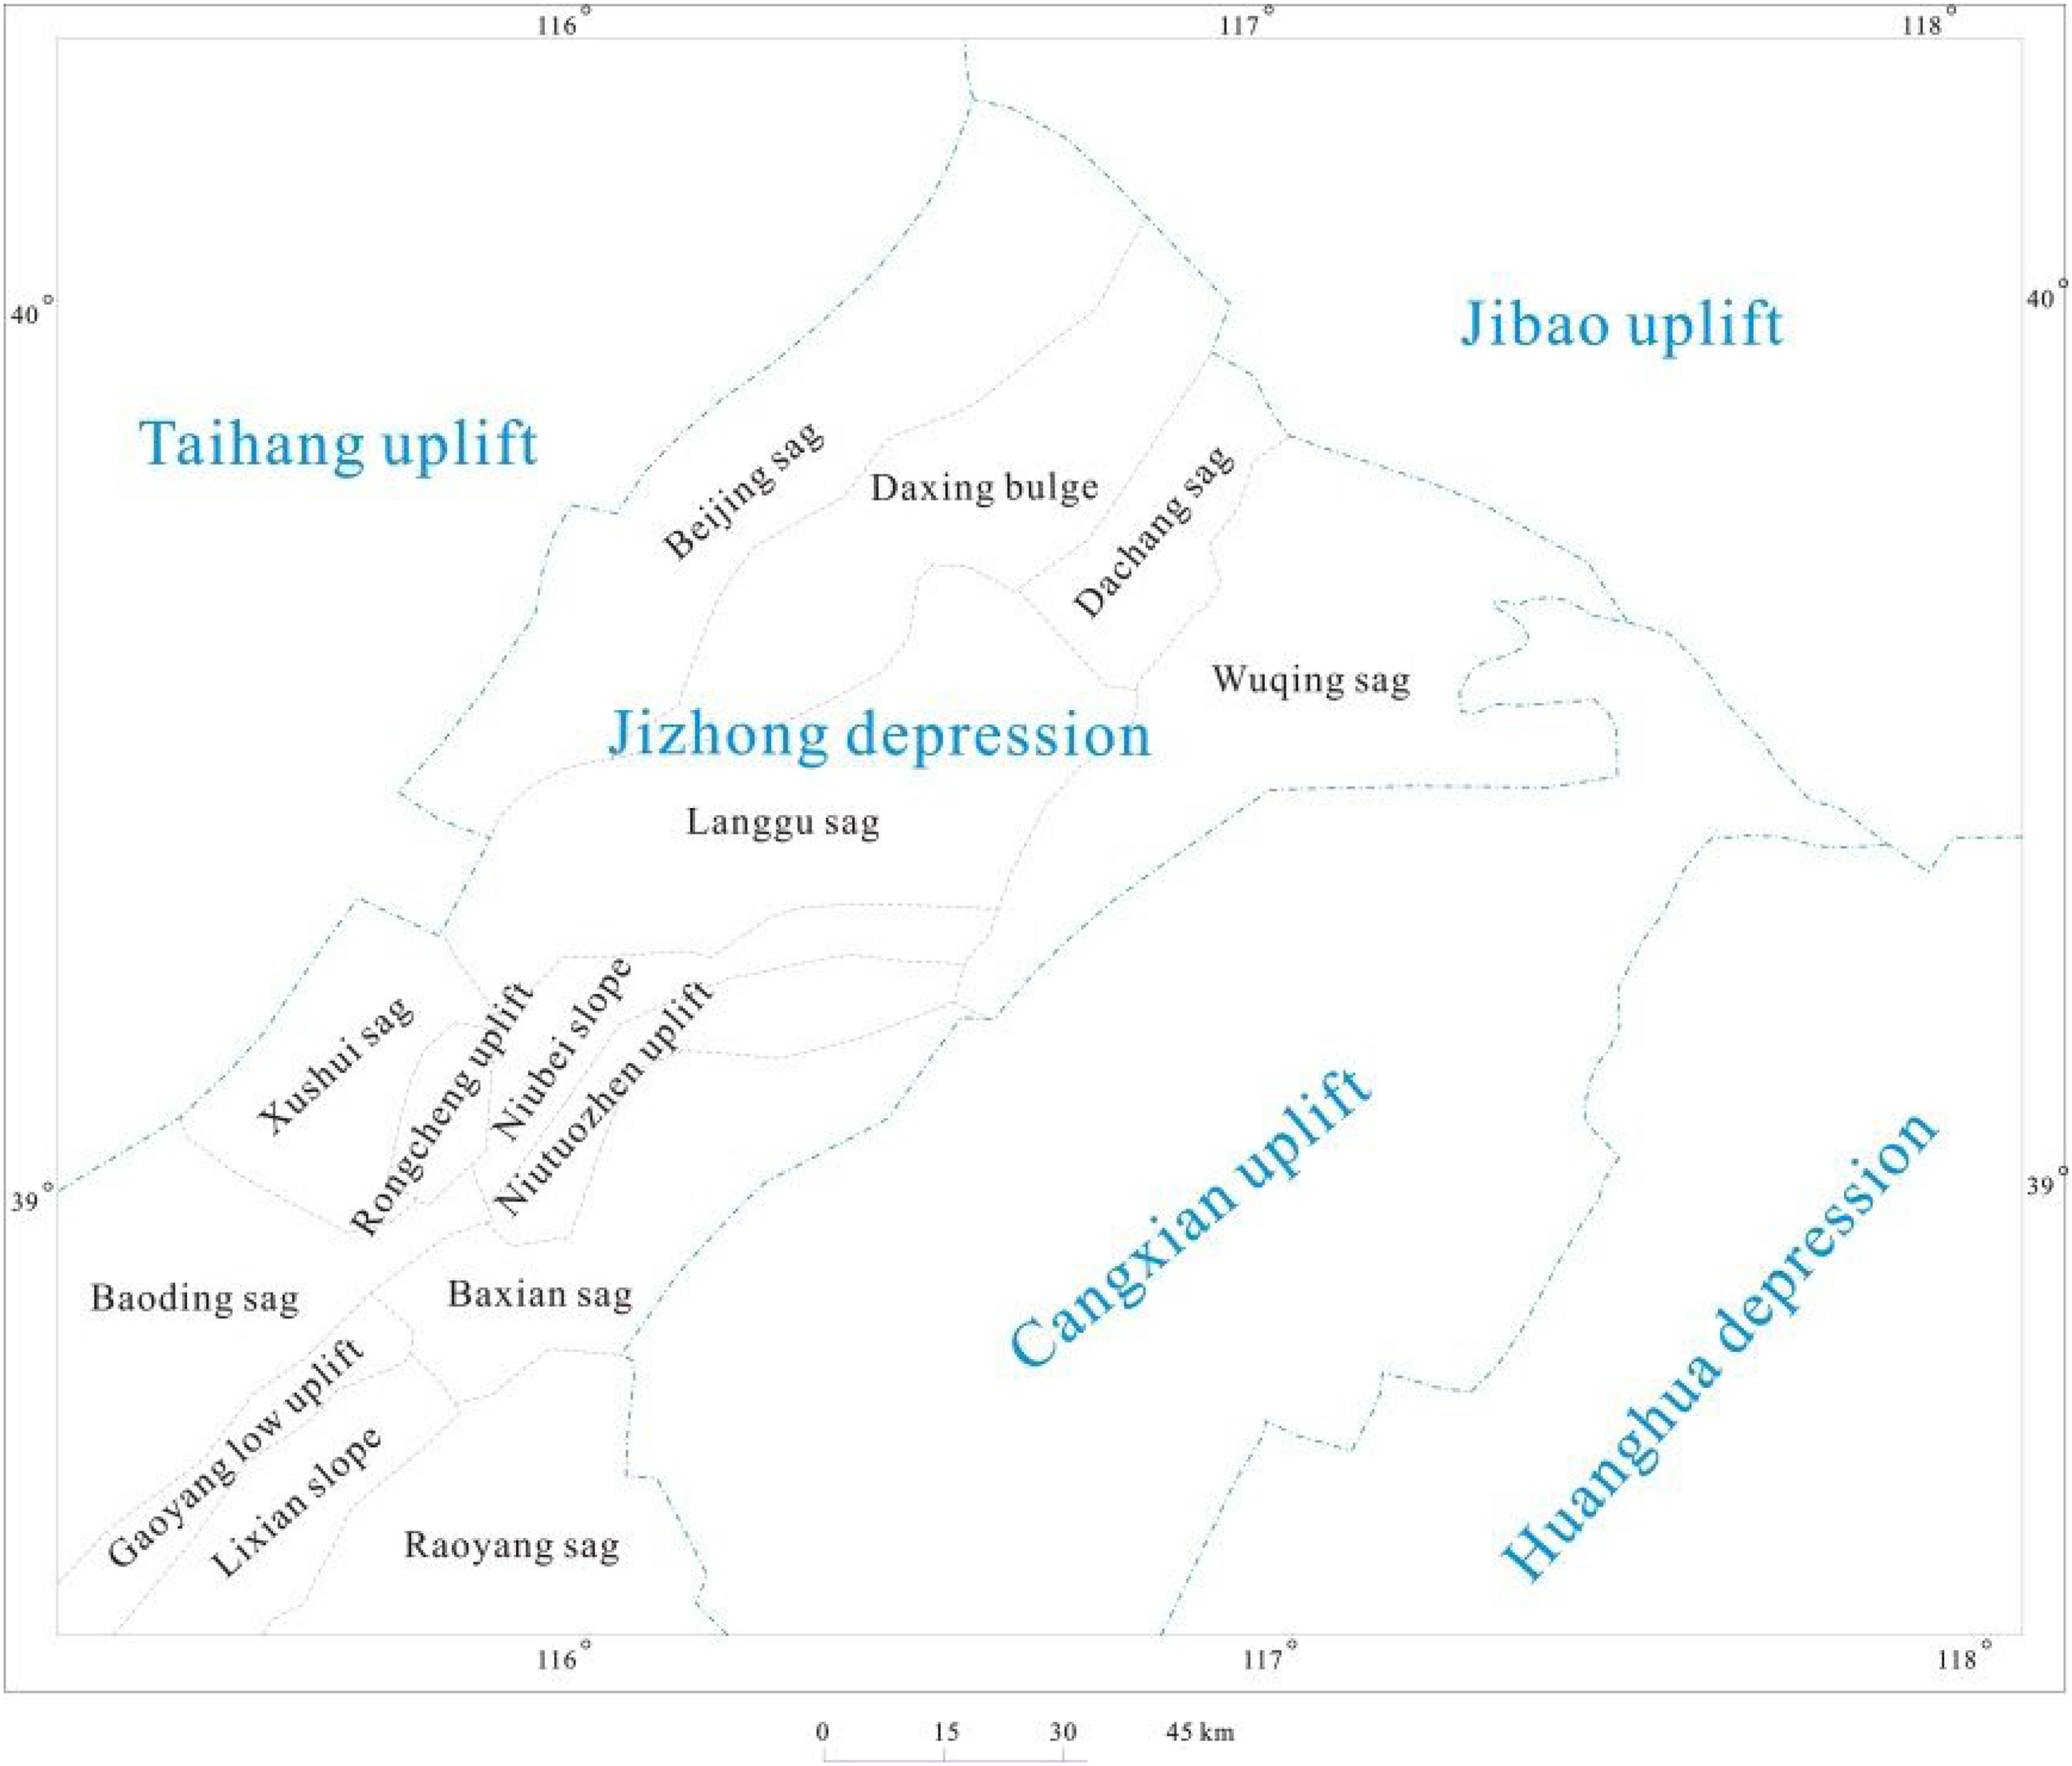
Geotectonic map of the study area.
The Cenozoic deposits in the tectonic area are drape deposits with the distribution of uplift and depression, the quaternary loose beds and Neogene sandstones, conglomerates, and mudstones are nearly horizontal, and the Palaeogene sandstones, conglomerates, and mudstones are inclined gently. The underlying strata are Ordovician, Cambrian, Qingbaikou, Jixian, and Archean metamorphic rocks.
Characteristics of geothermal reservoir
The geothermal resources in the fault depression area of North China mainly exist in karst cave-fissure geothermal reservoir in carbonate rock and porous geothermal reservoir in clastic rock. The carbonate geothermal reservoir is developed in the middle-upper Proterozoic Wumishan formation, Gaoyuzhuang formation, and the Lower Paleozoic Cambrian-Ordovician strata. The lithology mainly includes karst breccia, mud-silty dolomite, finely crystalline dolomite, medium-coarse crystalline dolomite, sandy dolomite, algal dolomite, siliceous dolomite, chert dolomite, and lime dolomite, the fracture rate is high, and the karst pores are well developed. The distribution area of the geothermal reservoir is large, and the geothermal heat flow is a combination of heat conduction, heat convection, and deep circulation. The clastic rock geothermal reservoir is developed in the Neogene Minghuazhen formation and Guantao formation; lithology is sandstone, gravel sandstone, and sand conglomerate, with high porosity, strong permeability, good connectivity, gentle occurrence, large distribution area, and stability, heat flow is mainly heat conduction, and the Neogene Minghuazhen formation and Guantao formation geothermal reservoir is the main protective layer, which restricts the exploitation and utilization.
Petrophysical experiment
Experimental system and method
The elastic wave velocity and density of 16 groups of dry carbonate rock samples from boreholes D01, D02, D03, D17, and D16 in Xiongan New Area were measured under varying temperatures and pressure by using the “Automatic Experiment System for Petrophysical parameters” (MTS Physical Property Experiment System) of State Key Laboratory of Oil and Gas Reservoir Geology and Exploitation, Chengdu University of Technology. The stratigraphic ages of the rock samples include 13 groups of the Wumishan formation, two groups of the Gaoyuzhuang formation and one group of the Yangzhuang formation in the Jixian System, which have strong regional representation. The elastic wave velocity is measured by the standard pulse penetration method, and the density is calculated by the standard weighing method. The simulated formation pressure ranges from 2 to 120 MPa, and the simulated temperature ranges from 25 to 120 °C. The experimental pressure is applied by a hydraulic chamber and heated by a resistance wire. The pressure deviation is less than 0.1 MPa, and the temperature deviation is less than 0.1 °C. The density experiment at different temperatures and pressures can be completed simultaneously with the velocity experiment. The sample volume change at various pressures and temperatures can be obtained by installing the displacement sensor on the sample. The measured temperature and pressure range are consistent with the velocity measurement.
Experimental measurement results
The statistical velocity experimental results show that the P-wave velocity distribution of 16 rock samples under normal temperature and pressure conditions ranges from 6438.36 to 7887.68 m/s, with an average of 7446.15 m/s. The S-wave velocity is concentrated in 3719.02–4562.01 m/s, with an average of 4228.47 m/s. Under the same temperature and pressure conditions, the velocity of the P-wave is much higher than that of the S-wave. According to the density experimental results, the density distribution of 16 rock samples ranges from 2.51 to 2.81 g/cm3, with an average of 2.70 g/cm3. The sample density of the Wumishan formation ranges from 2.61 to 2.81 g/cm3, with an average of 2.72 g/cm3, which is higher than that of the Gaoyuzhuang formation, which ranges from 2.51 to 2.60 g/cm3, with an average of 2.56 g/cm3, and that of the Yangzhuang formation, with a density of 2.76 g/cm3. The average density of dolomite in the Wumishan formation and Yangzhuang formation is relatively high.
Study on change rule of elastic parameter
Changes rule of elastic wave velocity with temperature
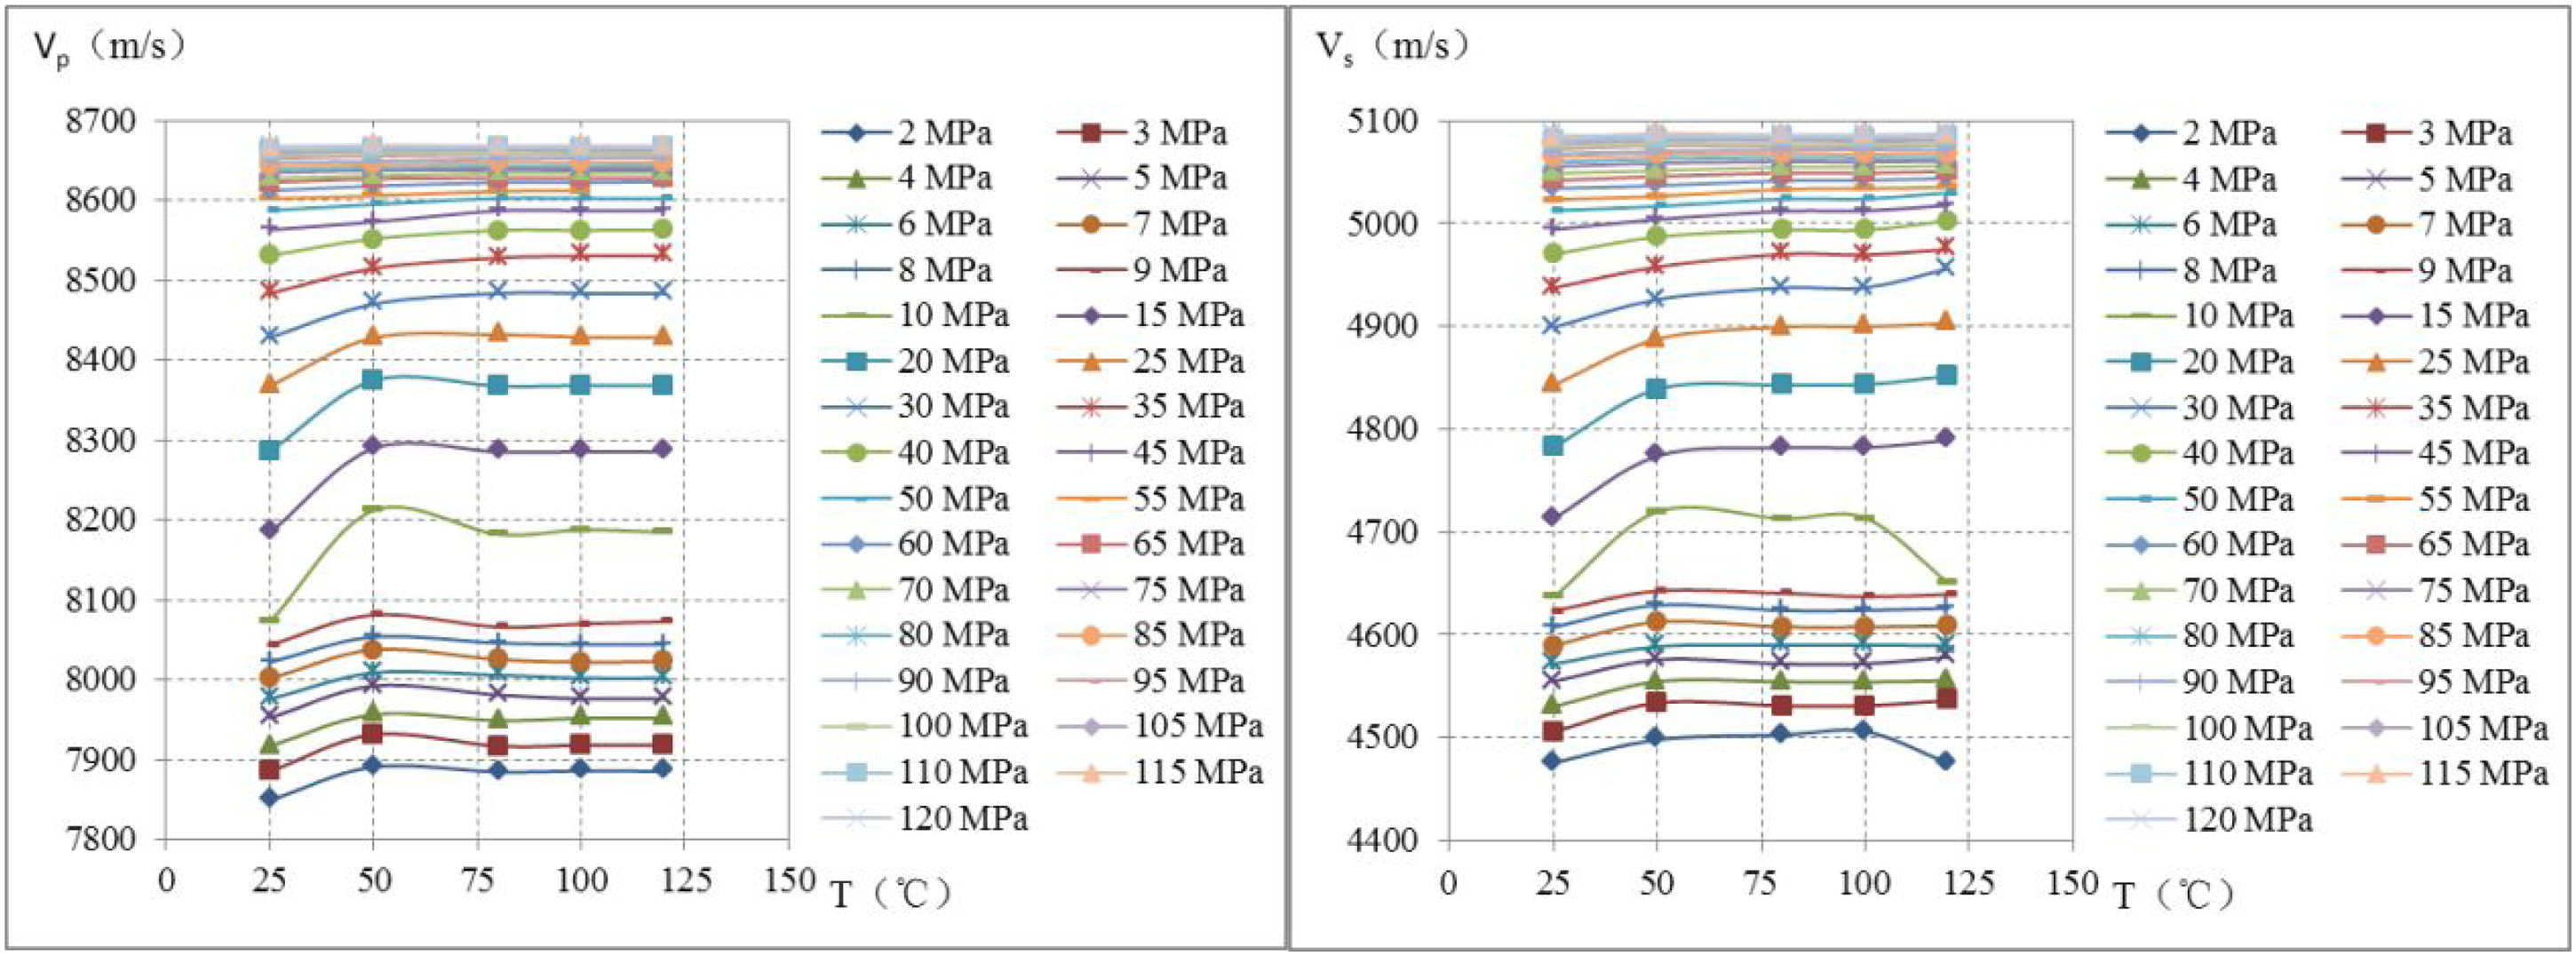
Eight groups of samples, including XAR-01, XAR-05, XAR-08, XAR-12, XAR-16, XAR-18, XAR-25, and XAR-35, the P-wave velocity increases or decreases between −119.04 and 118.10 m/s in the range of 25–80 °C, and S-wave velocity increases or decreases between −73.98 and 73.99 m/s. The P- and S-wave velocities tend to be stable when the temperature is greater than 80°C. Under the same surrounding rock pressure condition, the P-wave velocity presents the characteristics of “increase–decrease” at the temperature measuring points of 25 °C, 50 °C and 80 °C, and the velocity reaches its maximum at 50 °C (Figure 2). The increase in temperature makes the rock cement soft and the elastic constant decreases. Meanwhile, the expansion of rock minerals can cause the change of pores. With the different mineral composition of rocks, the P-wave velocity will increase first and then decrease with the increase in temperature under different temperature conditions, reaching a peak value at 50°C. At 50 °C, with the increase in confining pressure, the amplitude of P-wave velocity first increases and then decreases. The amplitude of wave velocity increase is the largest at 25 MPa, about 117.02 m/s (Figure 3). Under the same surrounding pressure condition, the S-wave velocity at 25 °C, 50 °C and 80 °C presents an “increase–decrease” from 2 to 25 MPa (the increase or decrease is the largest at 15 MPa, with the maximum increase of 21.00 m/s and the maximum decrease of 20.76 m/s); 30–120 MPa presents a “decrease–increase” feature (95 MPa presents the largest increase or decrease, with a maximum increase of 73.81 m/s and a maximum decrease of 73.98 m/s) (Figure 4).
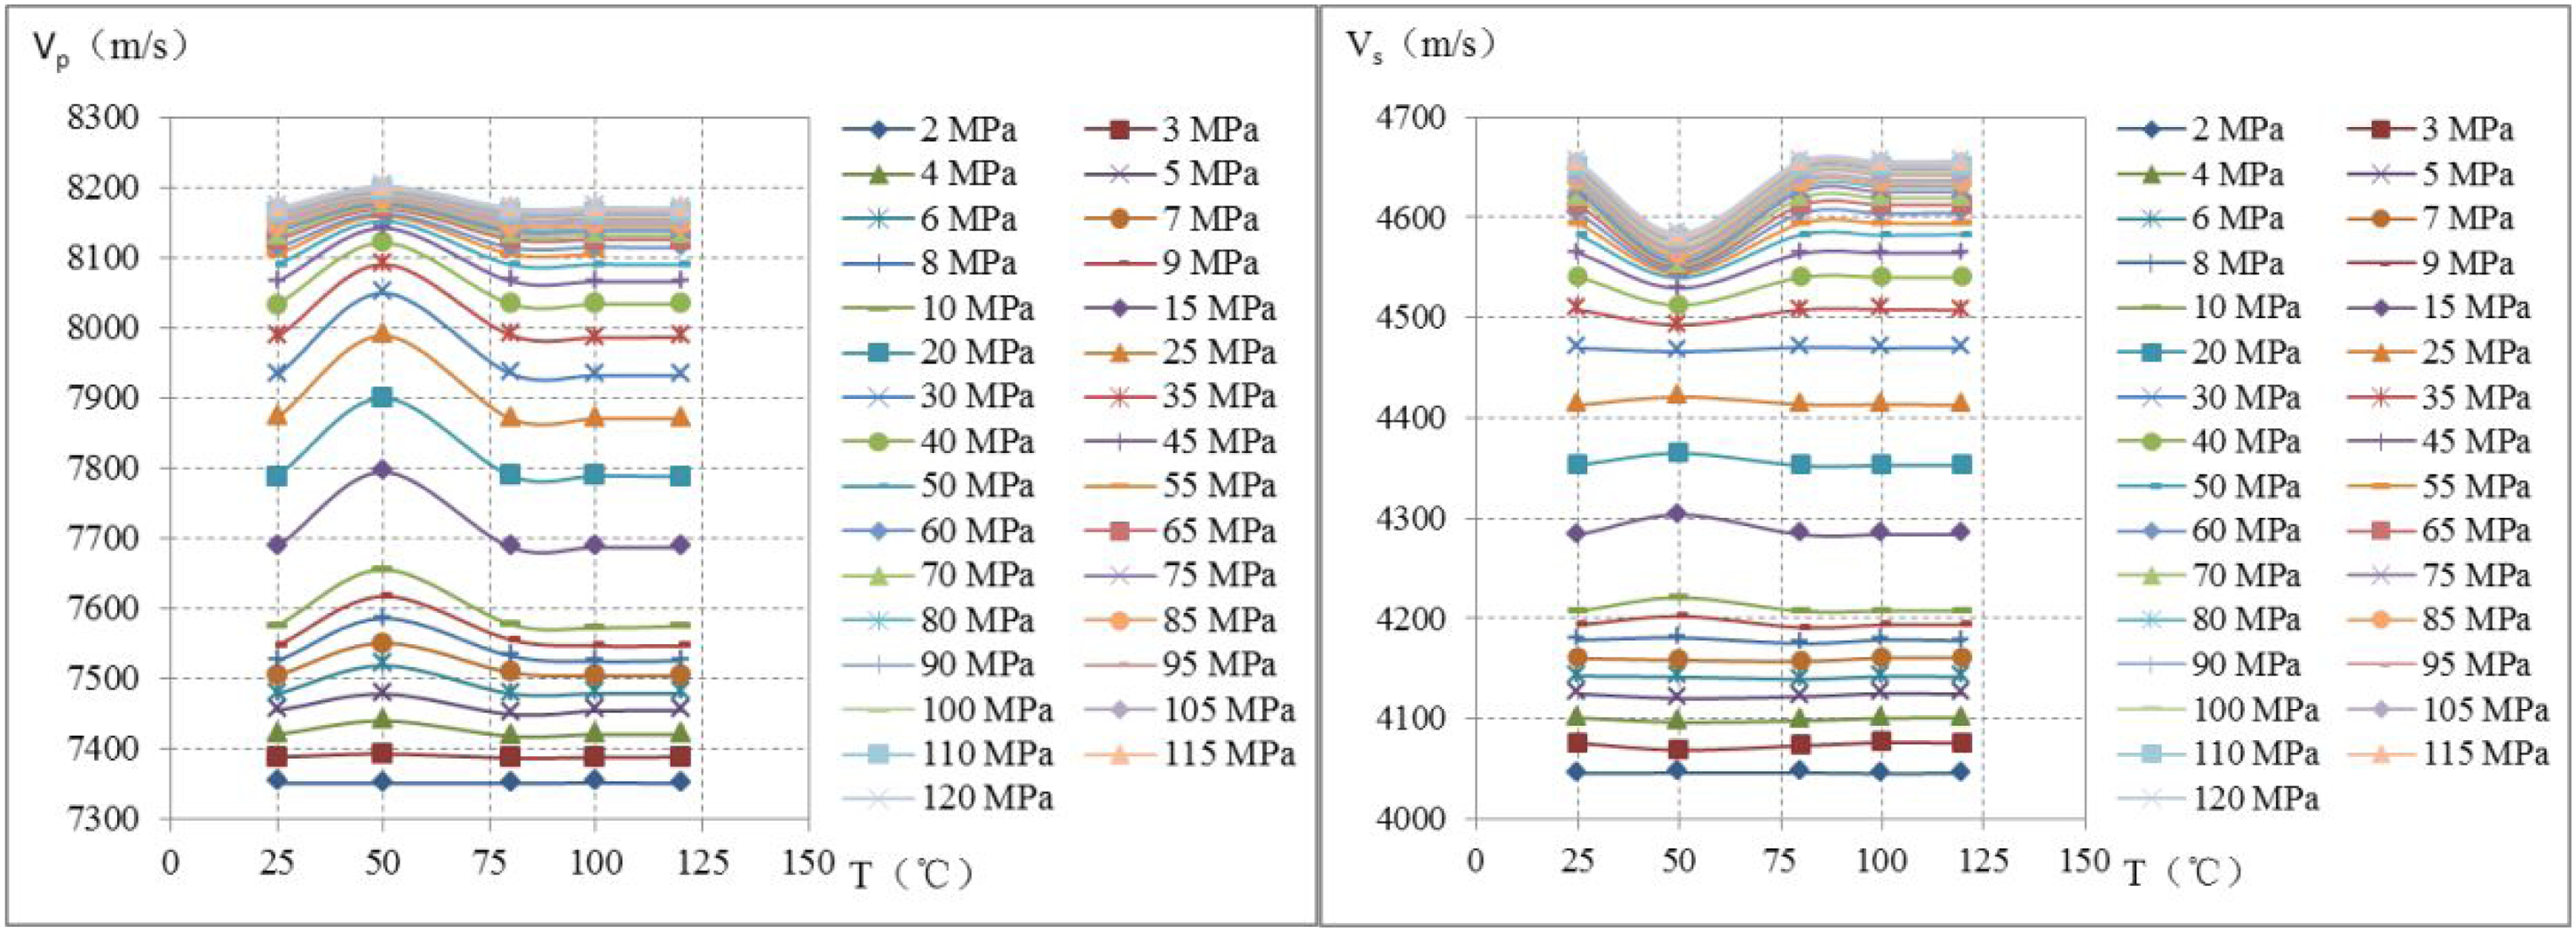
The cross plot between P/S wave velocity and temperature under different pressure conditions of XAR-01 and the other seven groups.
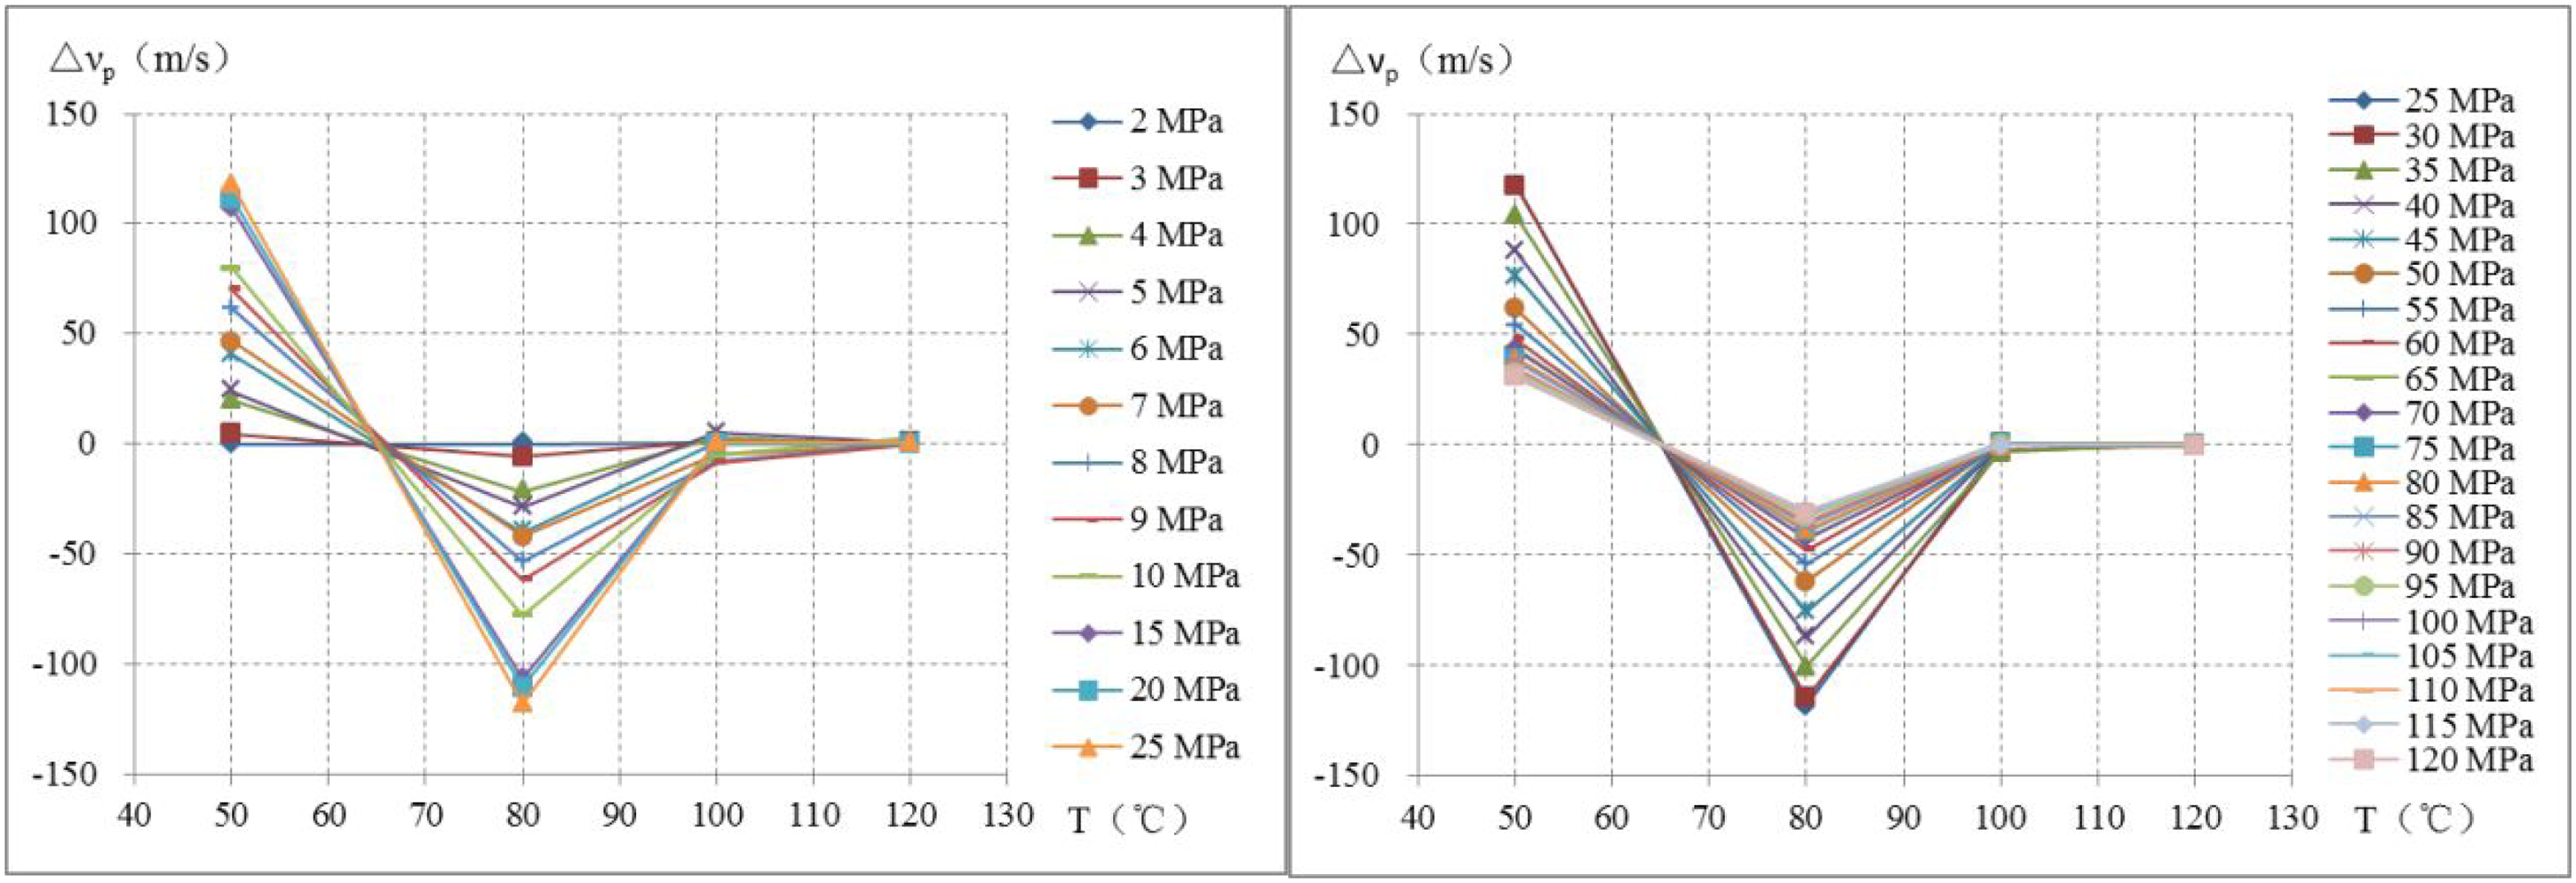
The change map of P-wave velocity with temperature increasing under 2–25 MPa and 25–120 MPa of XAR-01 and the other seven groups.
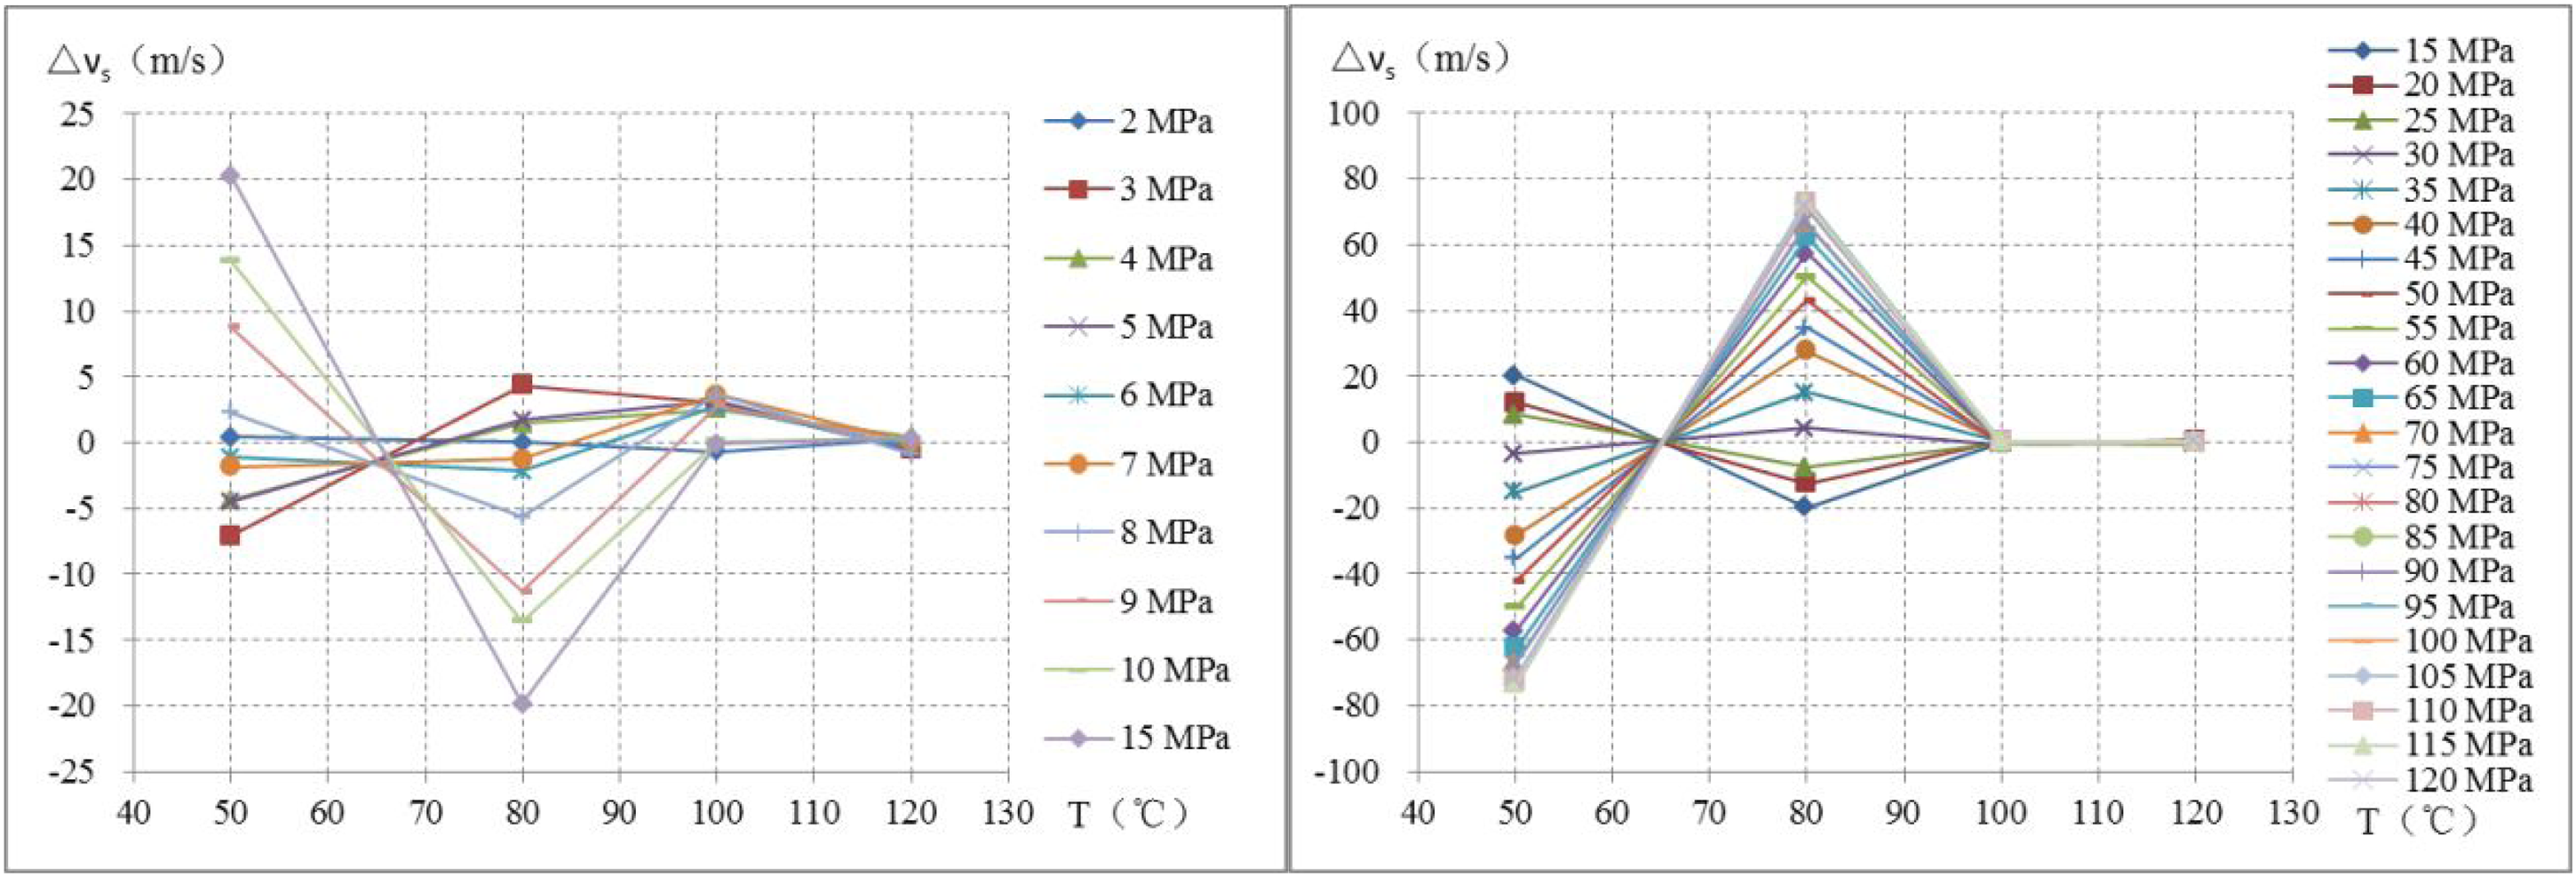
The change map of S-wave velocity with temperature increasing under 2–15 MPa and 15–120 MPa of XAR-01 and the other seven groups.
Eight group of samples, including XAR-22–XAR-24, XAR-27–XAR-28, XAR-30, XAR-32, and XAR-34, the P-wave velocity increased or decreased between −30.03 and 139.66 m/s in the range of 25–80 °C, and S-wave velocity increases or decreases between −63.64 and 83.06 m/s. The P- and S-wave velocities tend to be stable when the temperature is greater than 80°C. Under the same surrounding pressure condition, the P-wave velocity at 25 °C, 50 °C and 80 °C presents the characteristics of “increase–decrease,” and the velocity reaches its maximum at 50 °C (Figure 5). At 50 °C, with the increase in confining pressure, the amplitude of P-wave velocity increases first and then decreases, and the increased amplitude is the largest at 10 MPa, about 139.11 m/s (Figure 6). The S-wave velocity presents the characteristics of “increase–decrease” at 2 MPa, and the turning point is 100 °C, and it presents the characteristics of “increase–decrease–increase–decrease” at 10 MPa, and shows an increasing trend under other confining pressure conditions. The largest change was observed at 10 MPa, with an increase in 81.76 m/s at 50 °C (Figure 7).
The cross plot between P/S wave velocity and temperature under different pressure conditions of XAR-28 and the other seven groups.
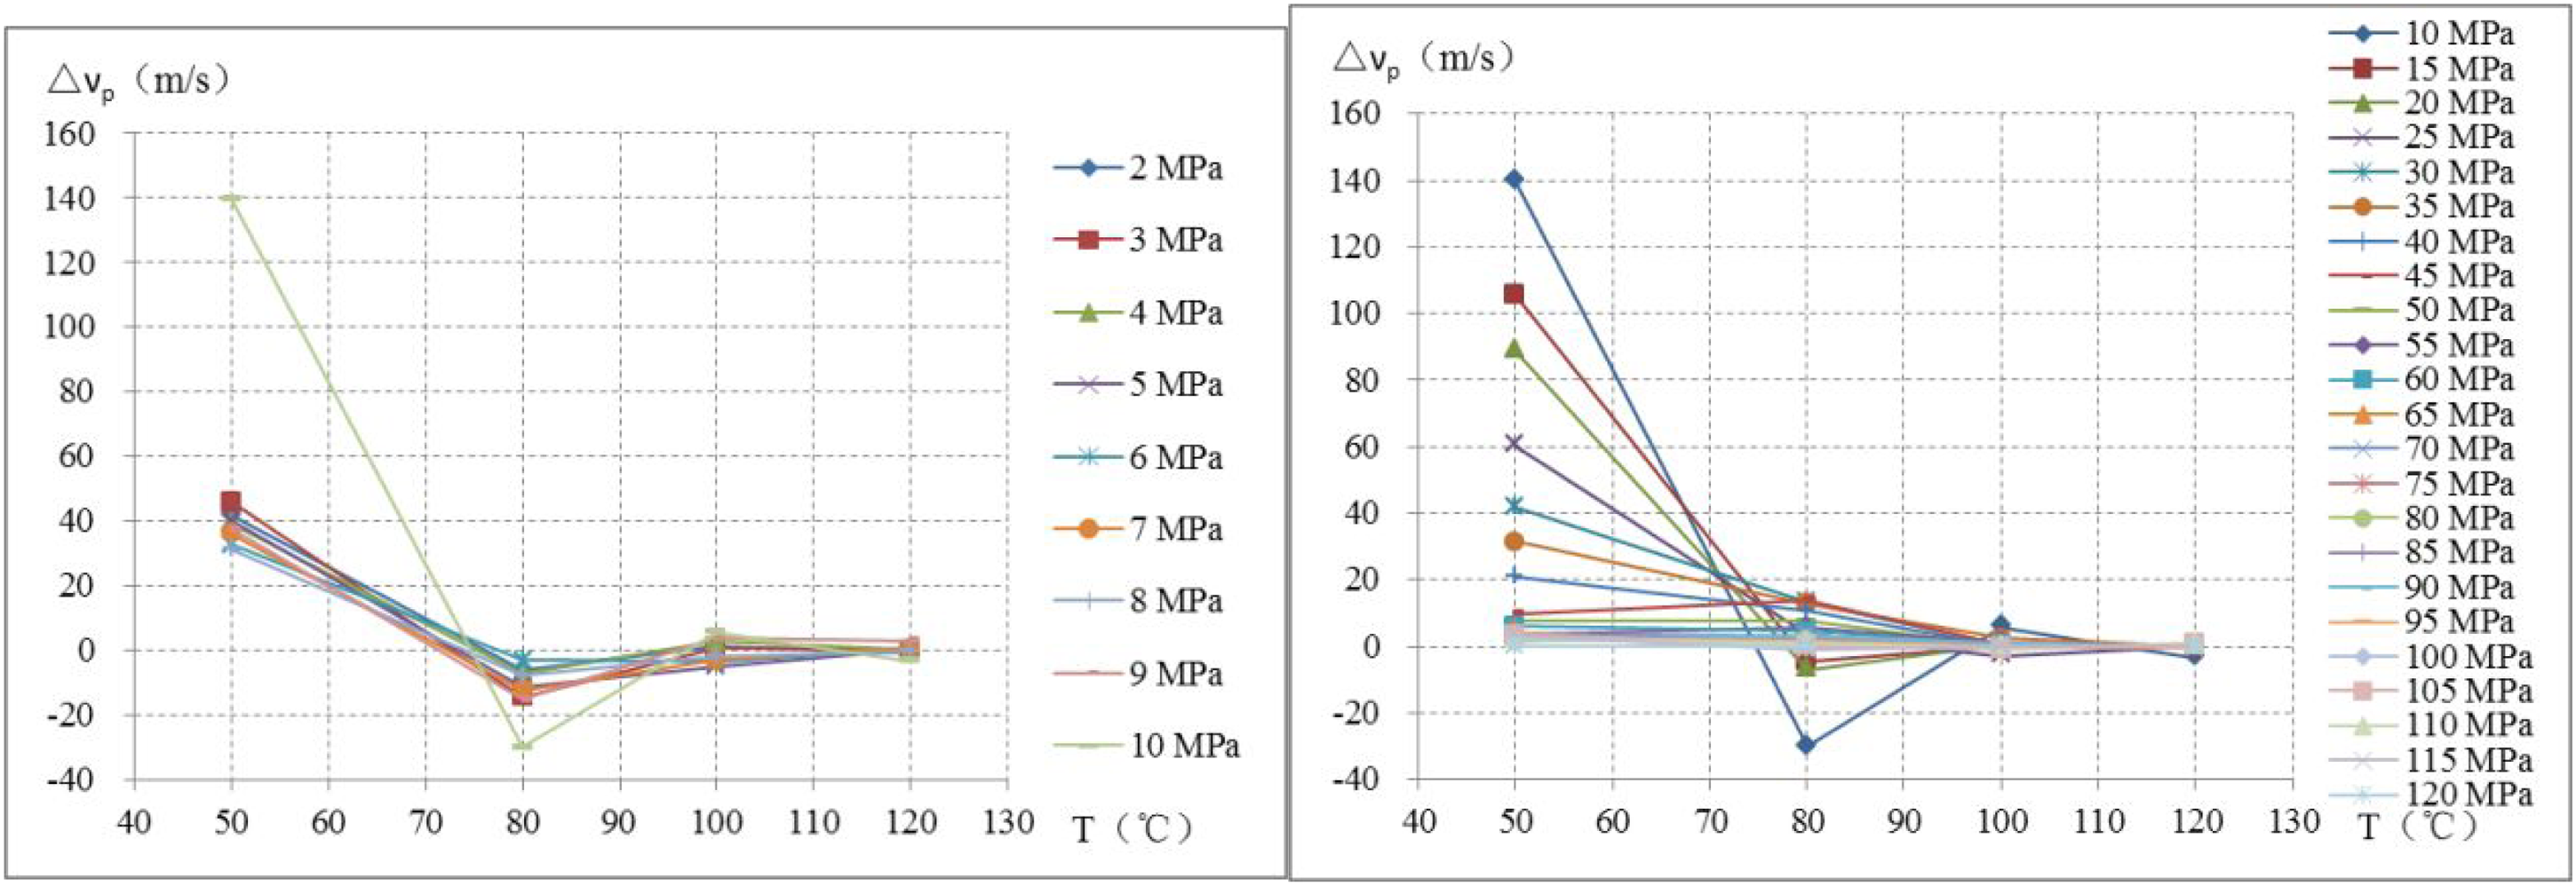
The change map of P-wave velocity with temperature increasing under 2–10 MPa and 10–120 MPa of XAR-28 and the other seven groups.
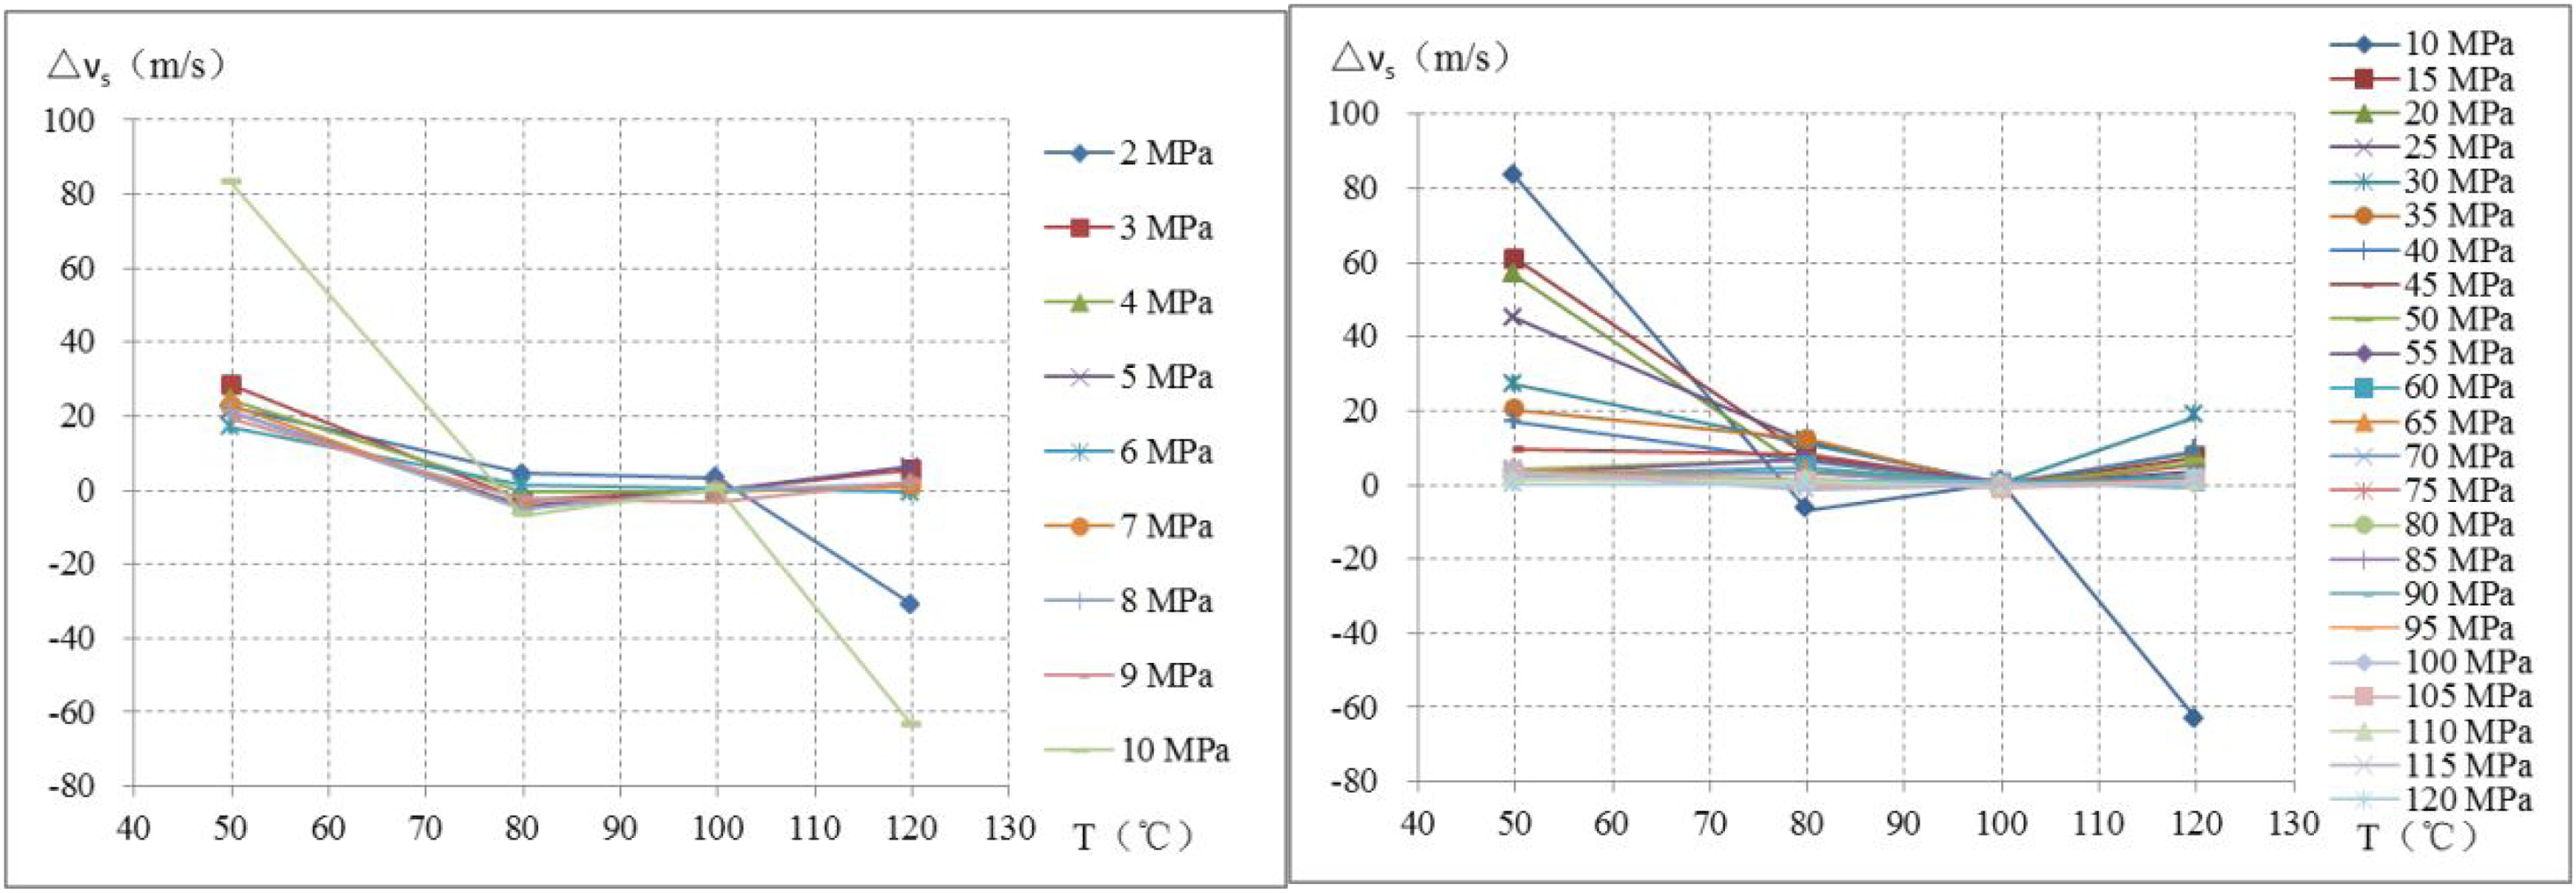
The change map of S-wave velocity with temperature increasing under 2–10 MPa and 10–120 MPa of XAR-28 and the other seven groups.
Changes rule of elastic wave velocity with pressure
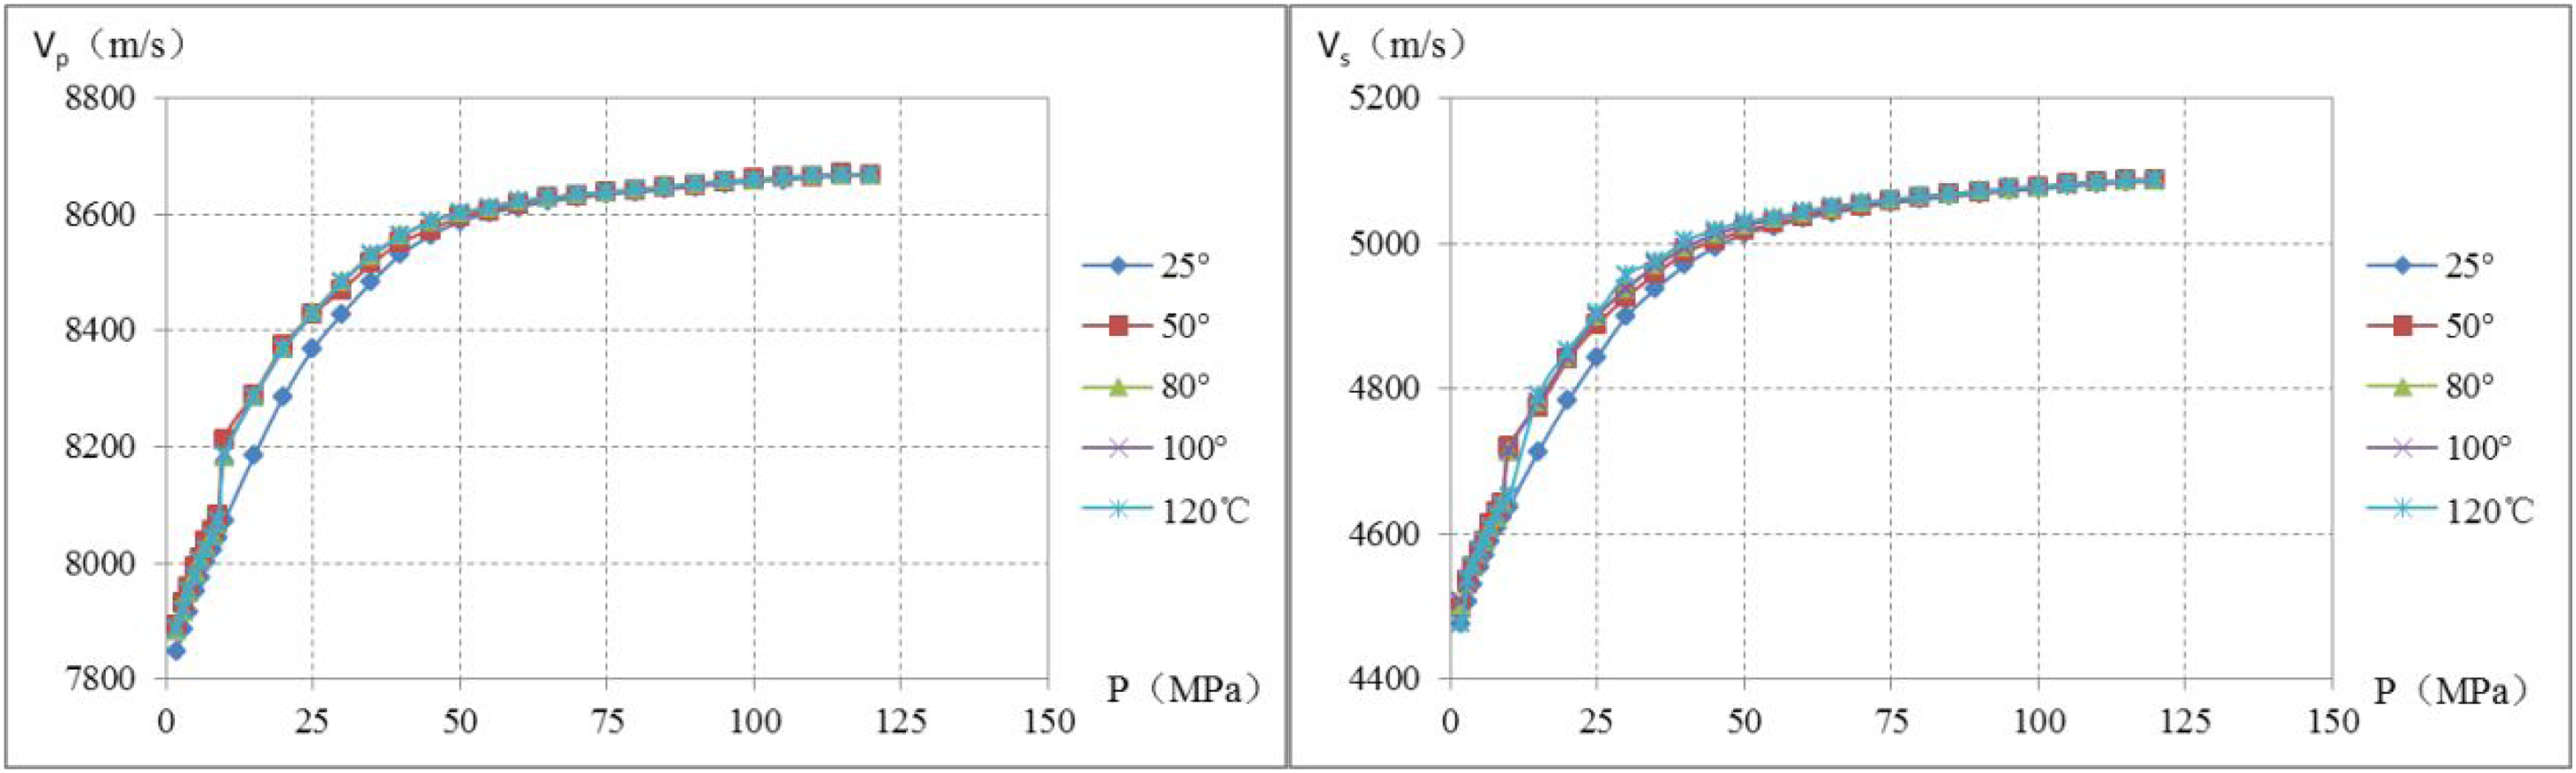
The P-wave velocity of XAR-01, XAR-05, XAR-08, XAR-12, XAR-16, XAR-18, XAR-25, and XAR-35 samples increase range is between 1.05 and 139.60 m/s in the range of 2–120 MPa, and S-wave velocity increases between 1.37 m/s and 83.36 m/s. Under the same temperature condition, the P- and S-wave velocities tend to increase with the increase in surrounding pressure (Figure 8), and the increased amplitude is characterized by “decrease–increase–decrease.” The turning point is 8 MPa and 15 MPa, respectively, and the increase is the largest at 15 MPa and the smallest at 120 MPa. The maximum increase in P-wave velocity is about 117.29 m/s, and the maximum increase in S-wave velocity is about 77.67 m/s (Figure 9). This is because, in carbonate formations, the type and size of secondary pores have a decisive effect on the elastic wave velocity. As the confining pressure increases, the microcracks in the rock will gradually close and the internal pores will collapse, so the elastic wave velocity through the sample will increase.
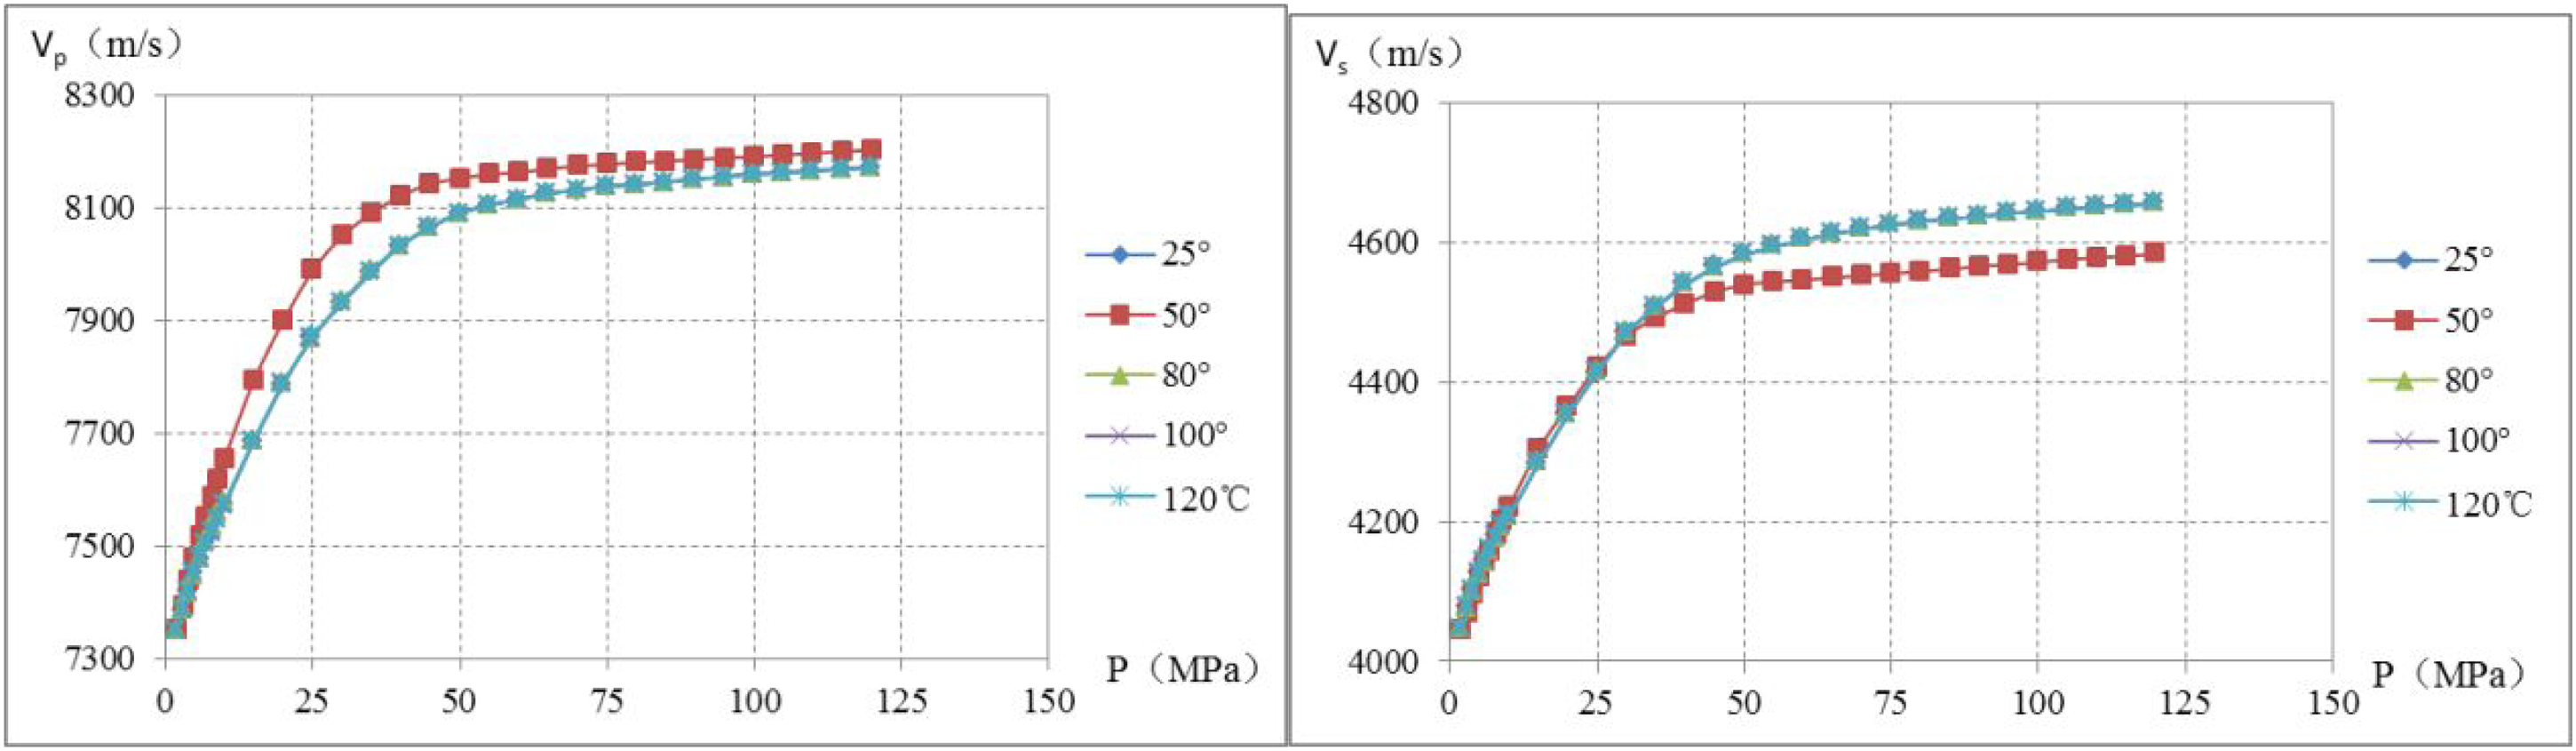
The cross plot between P/S wave velocity and pressure under different temperature conditions of XAR-01 and the other seven groups.
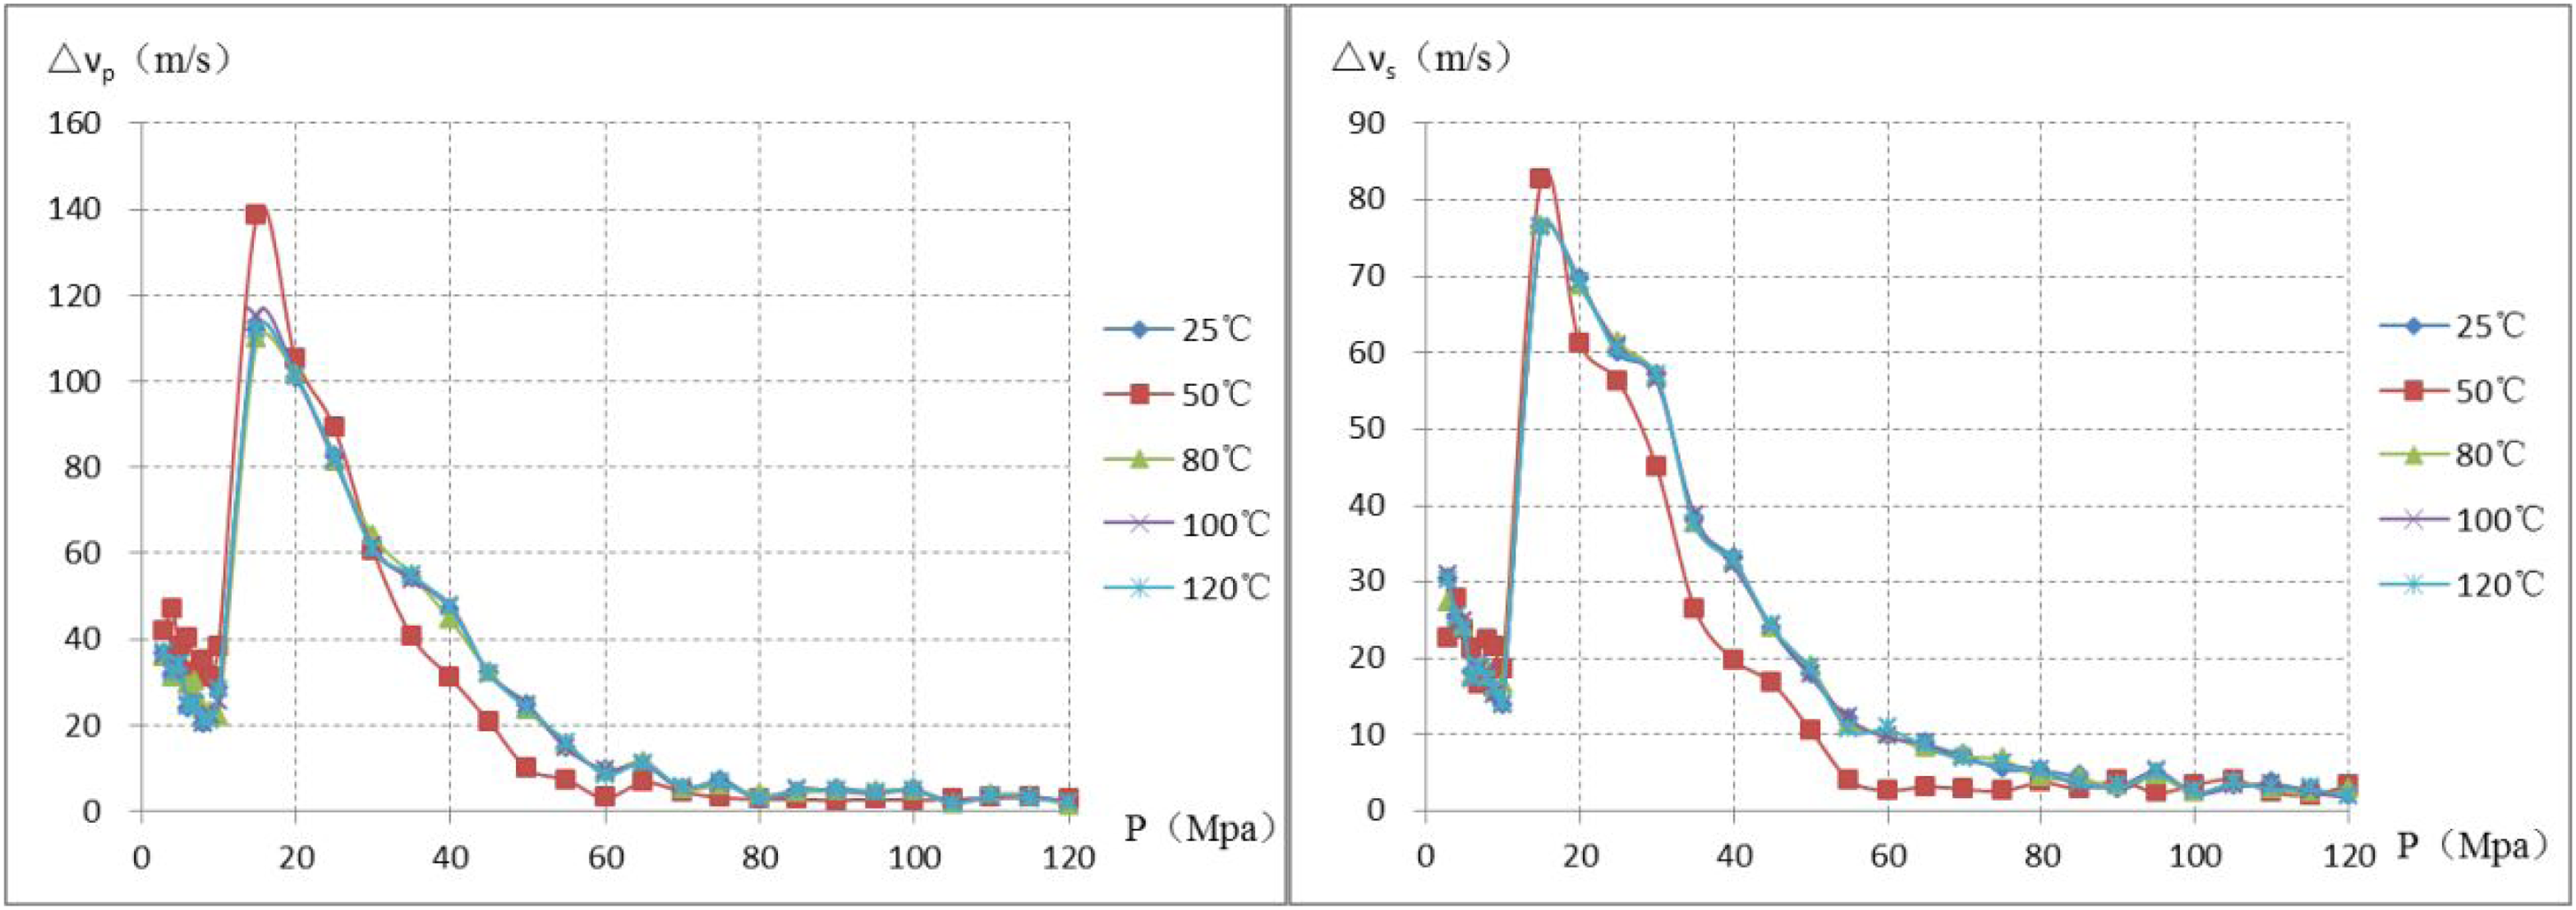
The change map of P/S wave velocity with pressure increasing of XAR-01 and the other seven groups.
For eight groups of samples, including XAR-22–XAR-24, XAR-27–XAR-28, XAR-30, XAR-32, and XAR-34, the P-wave velocity increases between −1.27 m/s and 131.06 m/s in the range of 2–120 MPa, and the S-wave velocity increases between −1.77 and 139.79 m/s. Under the same temperature condition, the P- and S-wave velocities increase with the increase in surrounding pressure (Figure 10), and the increased amplitude is characterized as “decrease–increase–decrease.” At 25 °C, the increase in 15 MPa is the largest, the P-wave velocity increase is about 111.85 m/s, and the S-wave velocity increase is about 76.45 m/s. When the temperature is >50°C, the increase in 10 MPa is the largest; the increase in P-wave velocity is about 130.42 m/s at 50 °C, and the increase in S-wave velocity is about 76.61 m/s. The increase in 120 MPa is the smallest, which is unchanged (Figure 11).
The cross plot between P/S wave velocity and pressure under different temperature conditions of XAR-28 and the other seven groups.
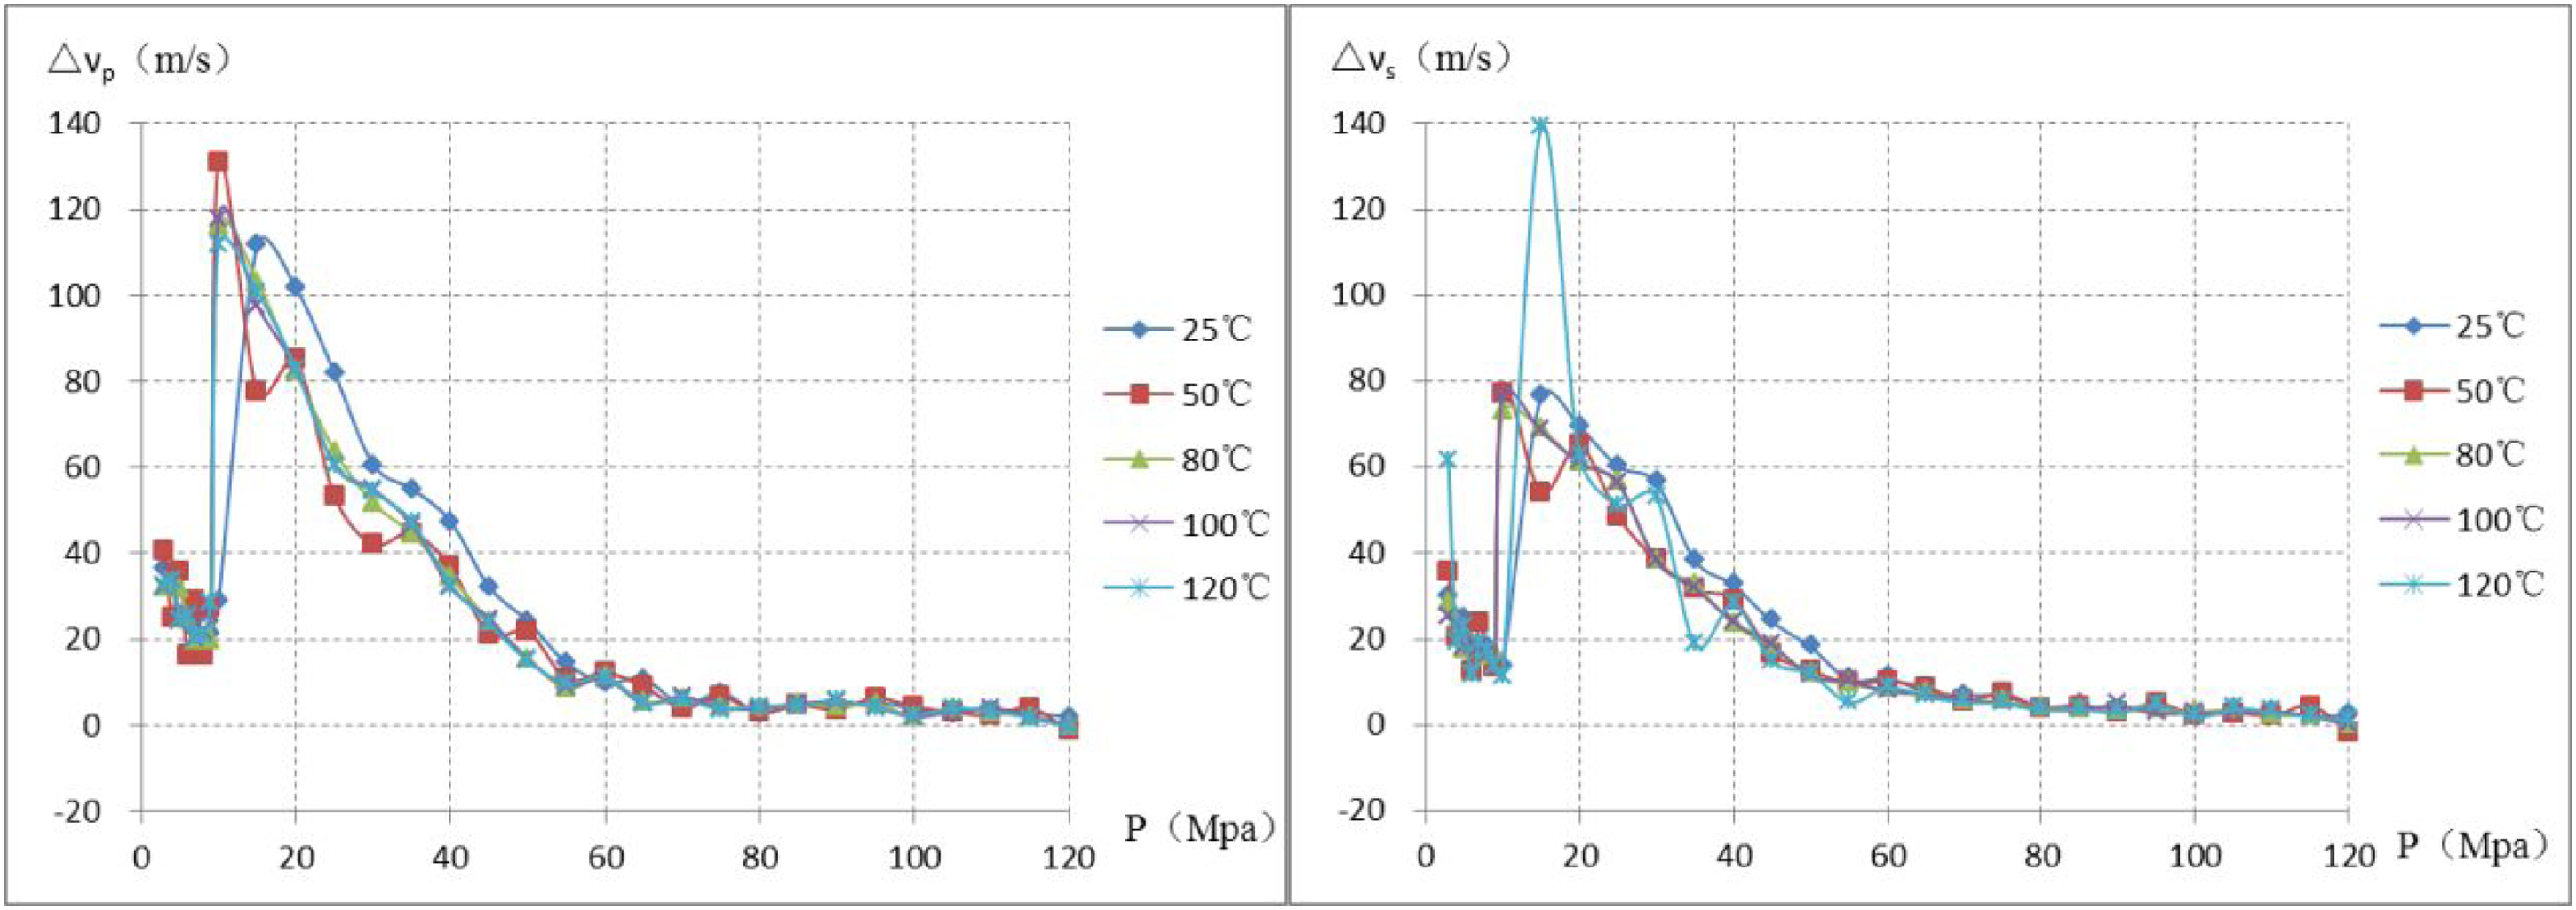
The change map of P/S wave velocity with pressure increasing of XAR-28 and the other seven groups.
Analysis of elastic parameter relation
Relation between P-S wave velocities
The relationship between P- and S-wave velocities is often used as the critical basis for determining lithology and identifying pore fluid to detect oil and gas in seismic or well-logging data. For this reason, the relationship between P- and S-wave velocities has become an essential content of petrophysical research. By using the mathematical statistics method, regression analysis was conducted on the P- and S-wave velocities measured in the Jixian system carbonate rocks in the study area, and a more accurate mathematical model of the P-S wave relationship was obtained under normal temperature and pressure conditions, which was suitable for the area (Figure 12). Compare and analyze the measured data and the data from the new fitting formula, and calculate the relative error; the relative error is between 0.00 and 0.03, with an average of 0.02.

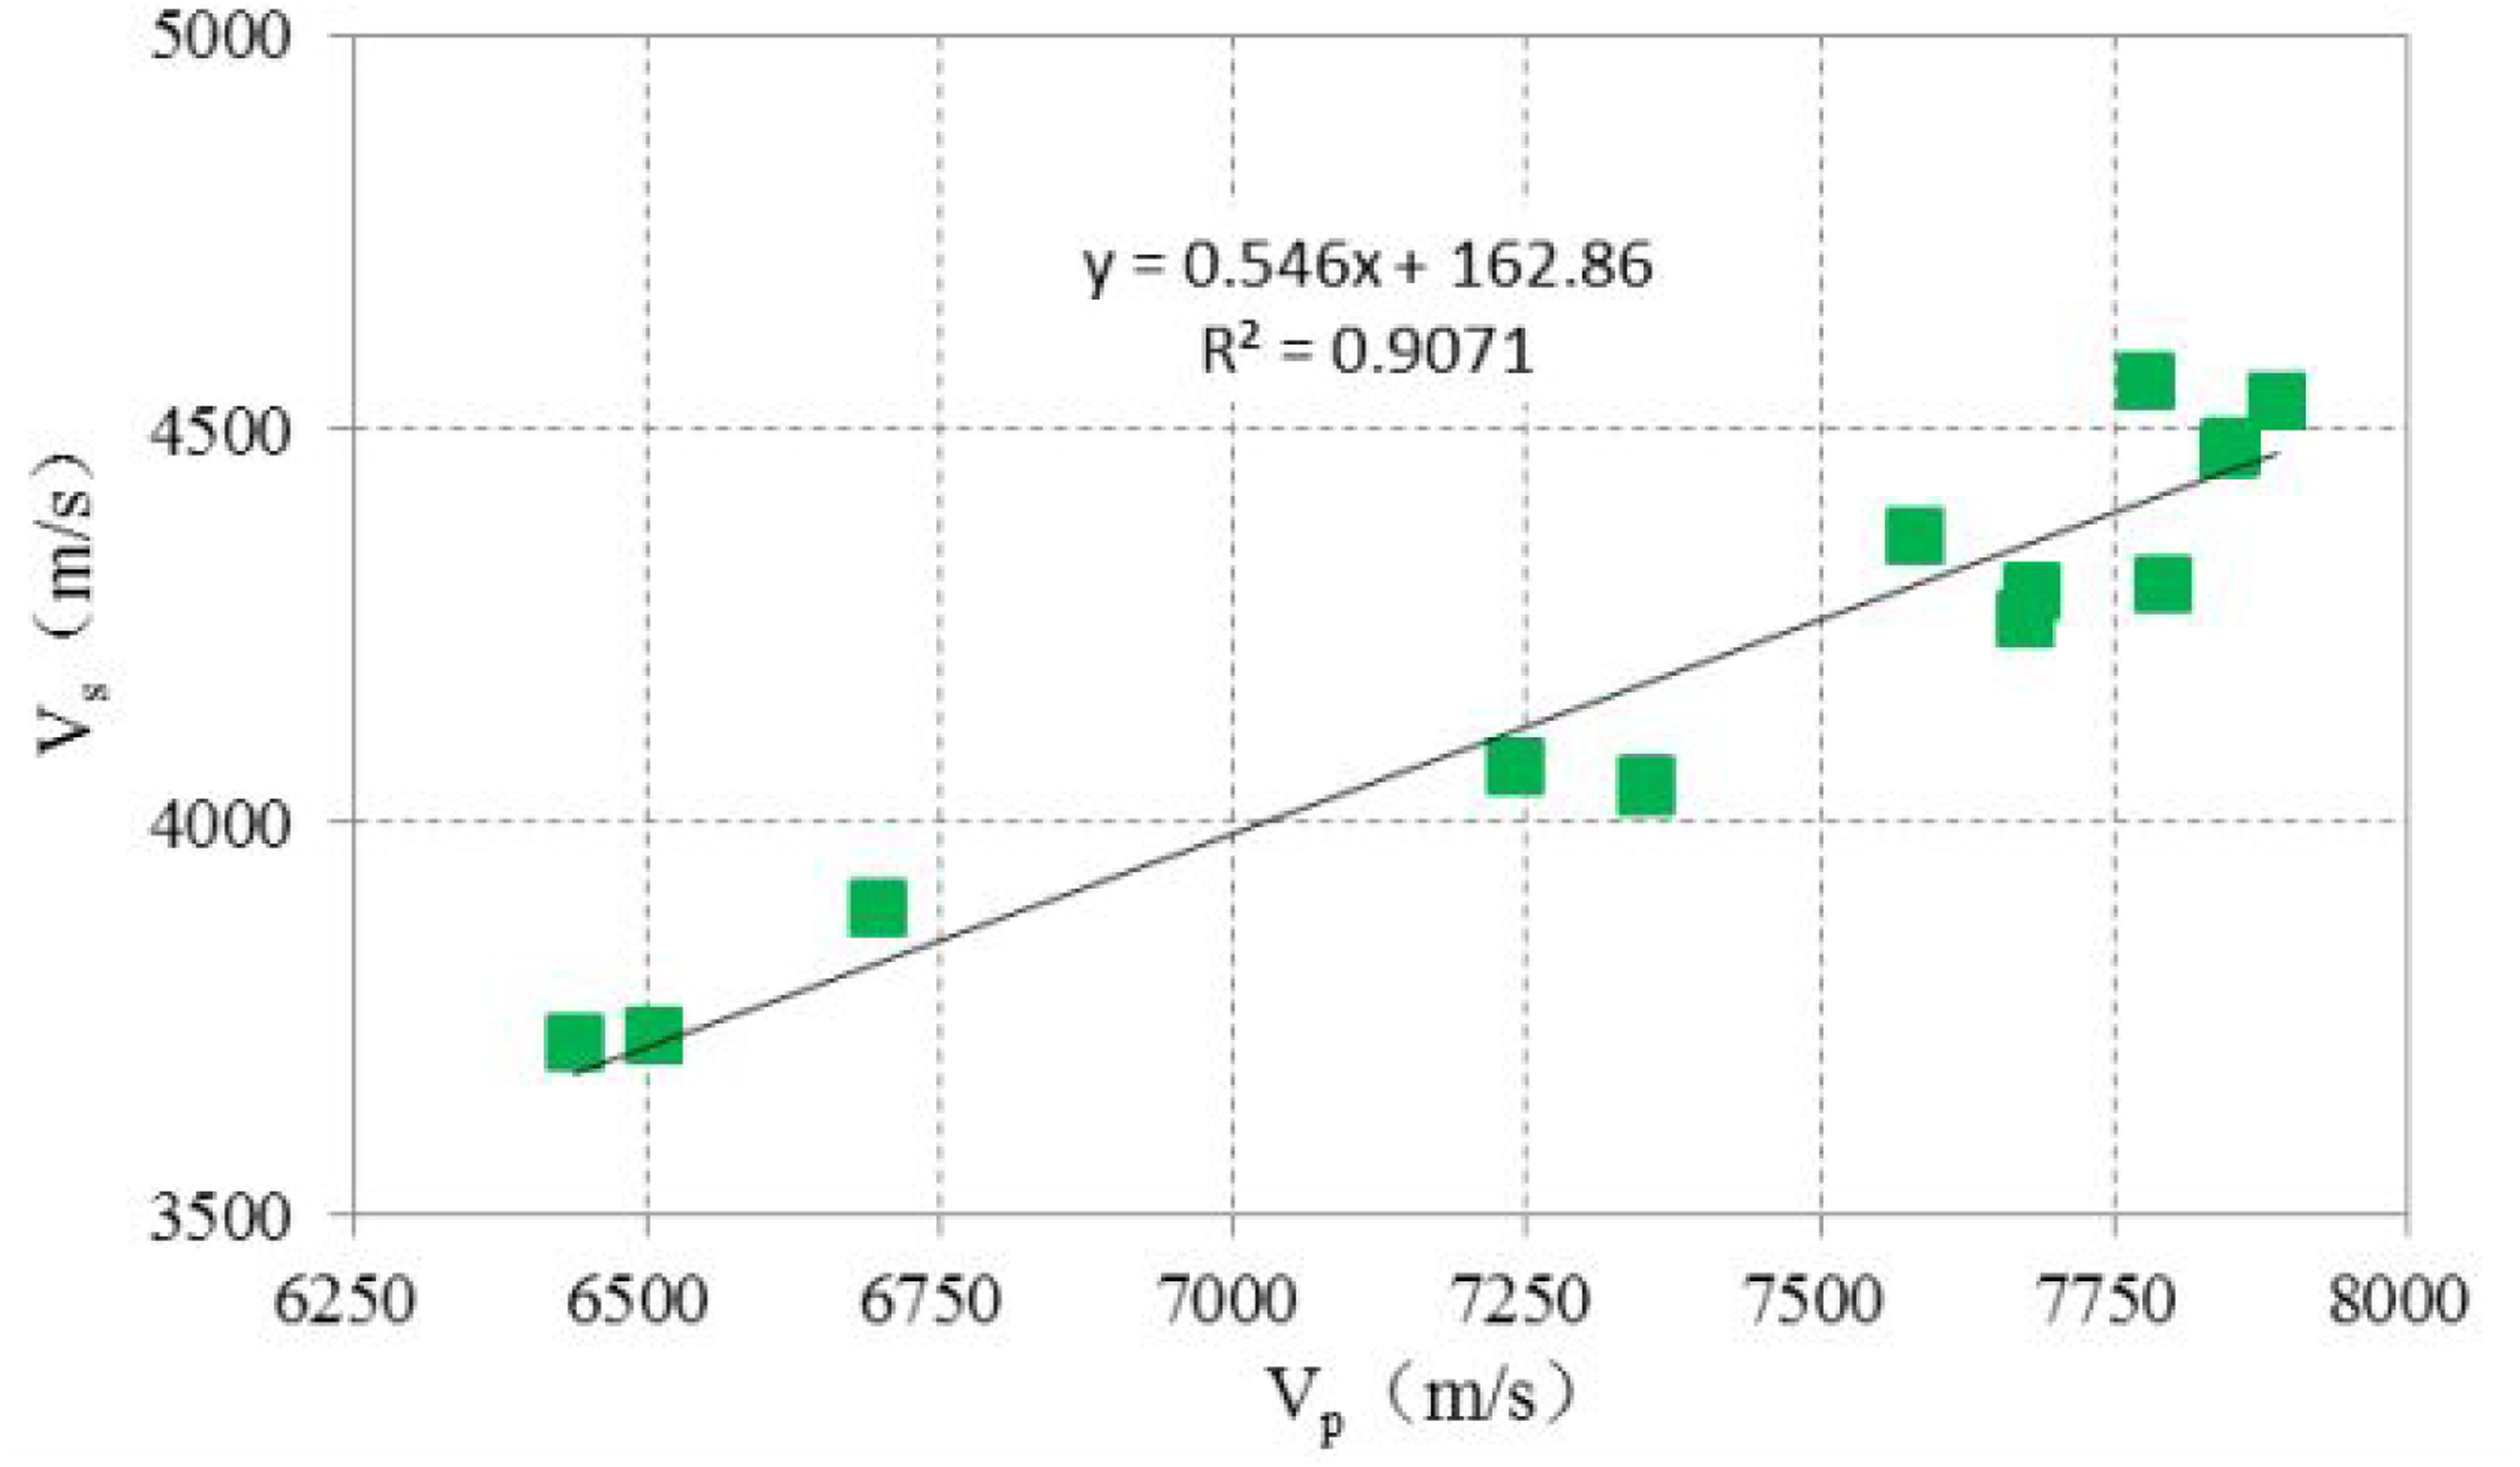
The cross plot of P-S wave velocities at normal temperature and pressures.
Relation between density and P-wave velocity
The P-wave velocity and density data of 16 dolomite samples from five boreholes of the Jixian system under normal temperature and pressure are analyzed by regression analysis, and the mathematical model of the P-wave velocity and density is obtained. It can be seen from the cross plot of discrete points of density and P-wave velocity that under the same temperature and pressure conditions, the higher the density of dolomite, the higher the P-wave velocity (Figure 13).
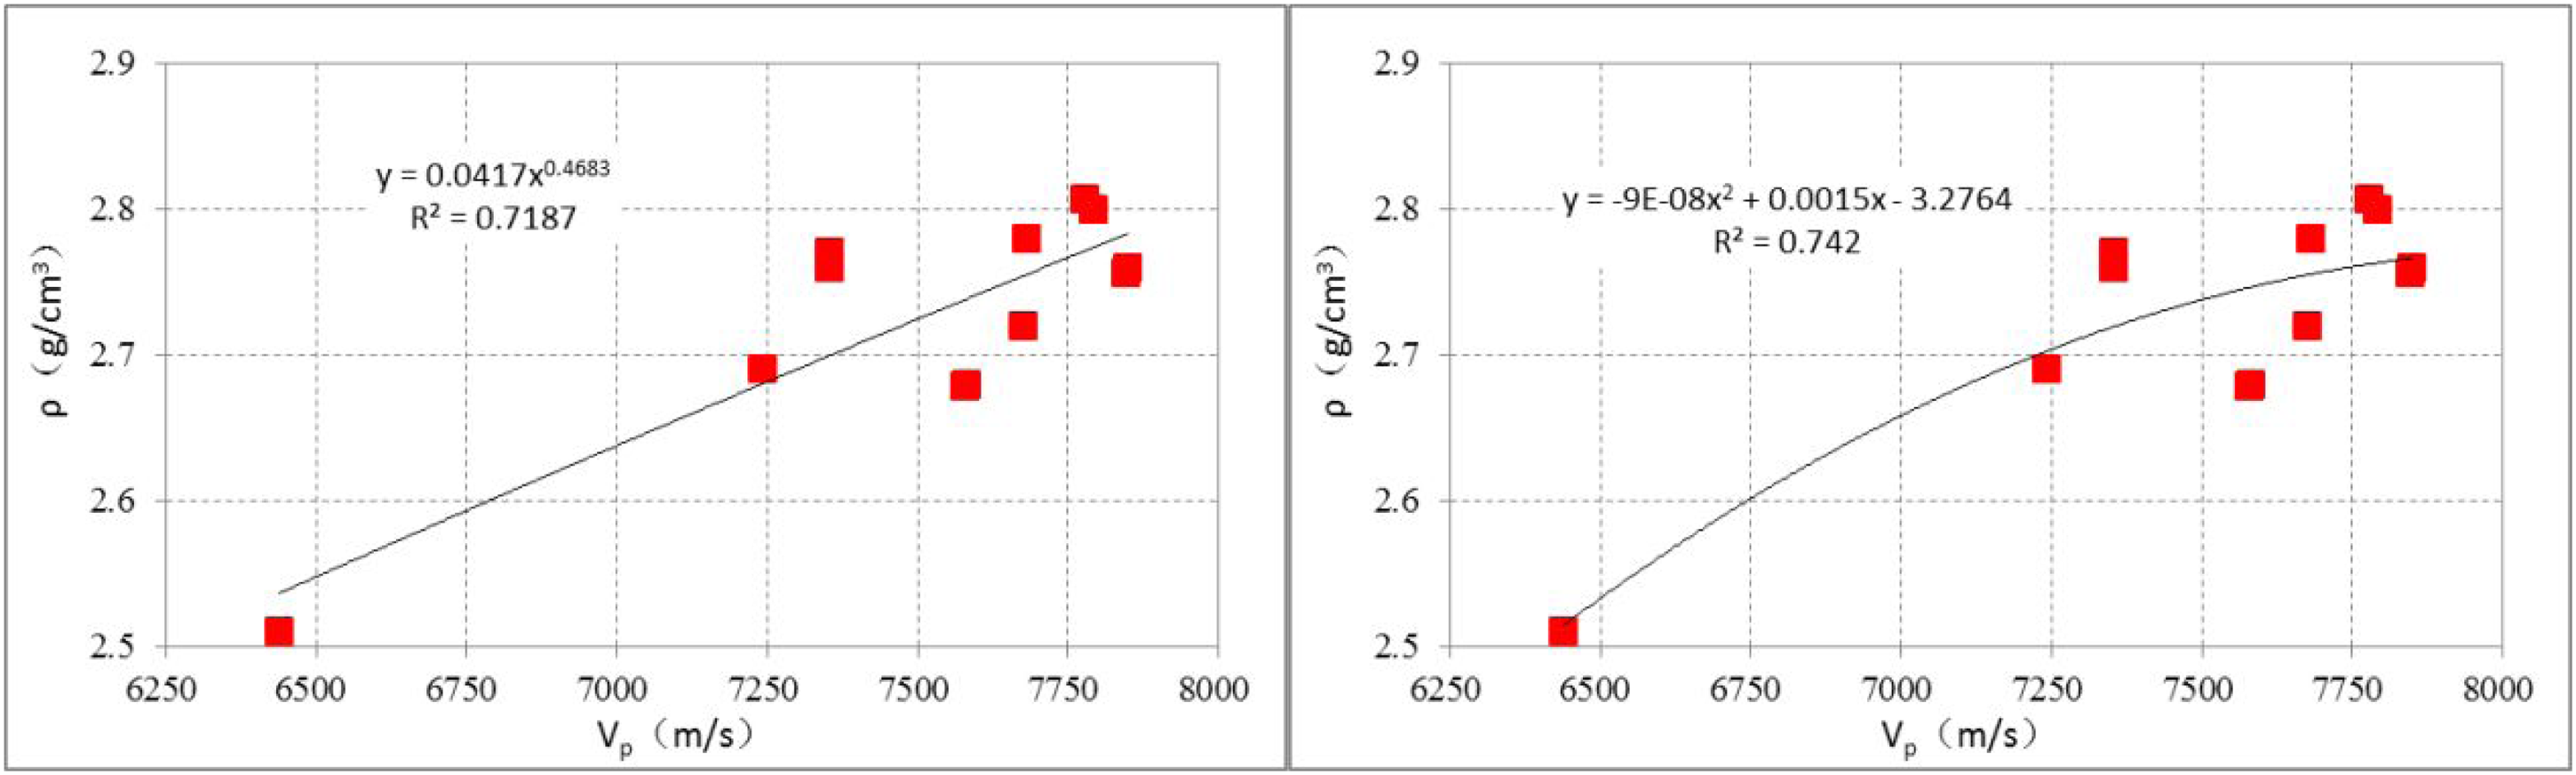
The cross plot of P-wave velocity and density at normal temperature and pressures.
Exponential relation:
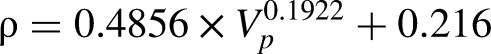
Polynomial relation:
In order to compare the polynomial and exponential relation of P-wave velocity and density of dolomite proposed by Castagna et al. with the new fitting relation derived this time, the relation of P-wave velocity and density of dolomite rock is analyzed using the above test data of dolomite rock samples under normal temperature and pressure.
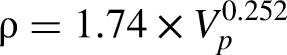
According to Castagna's formula, the relation of P-wave velocity and density of dolomite is as follows:

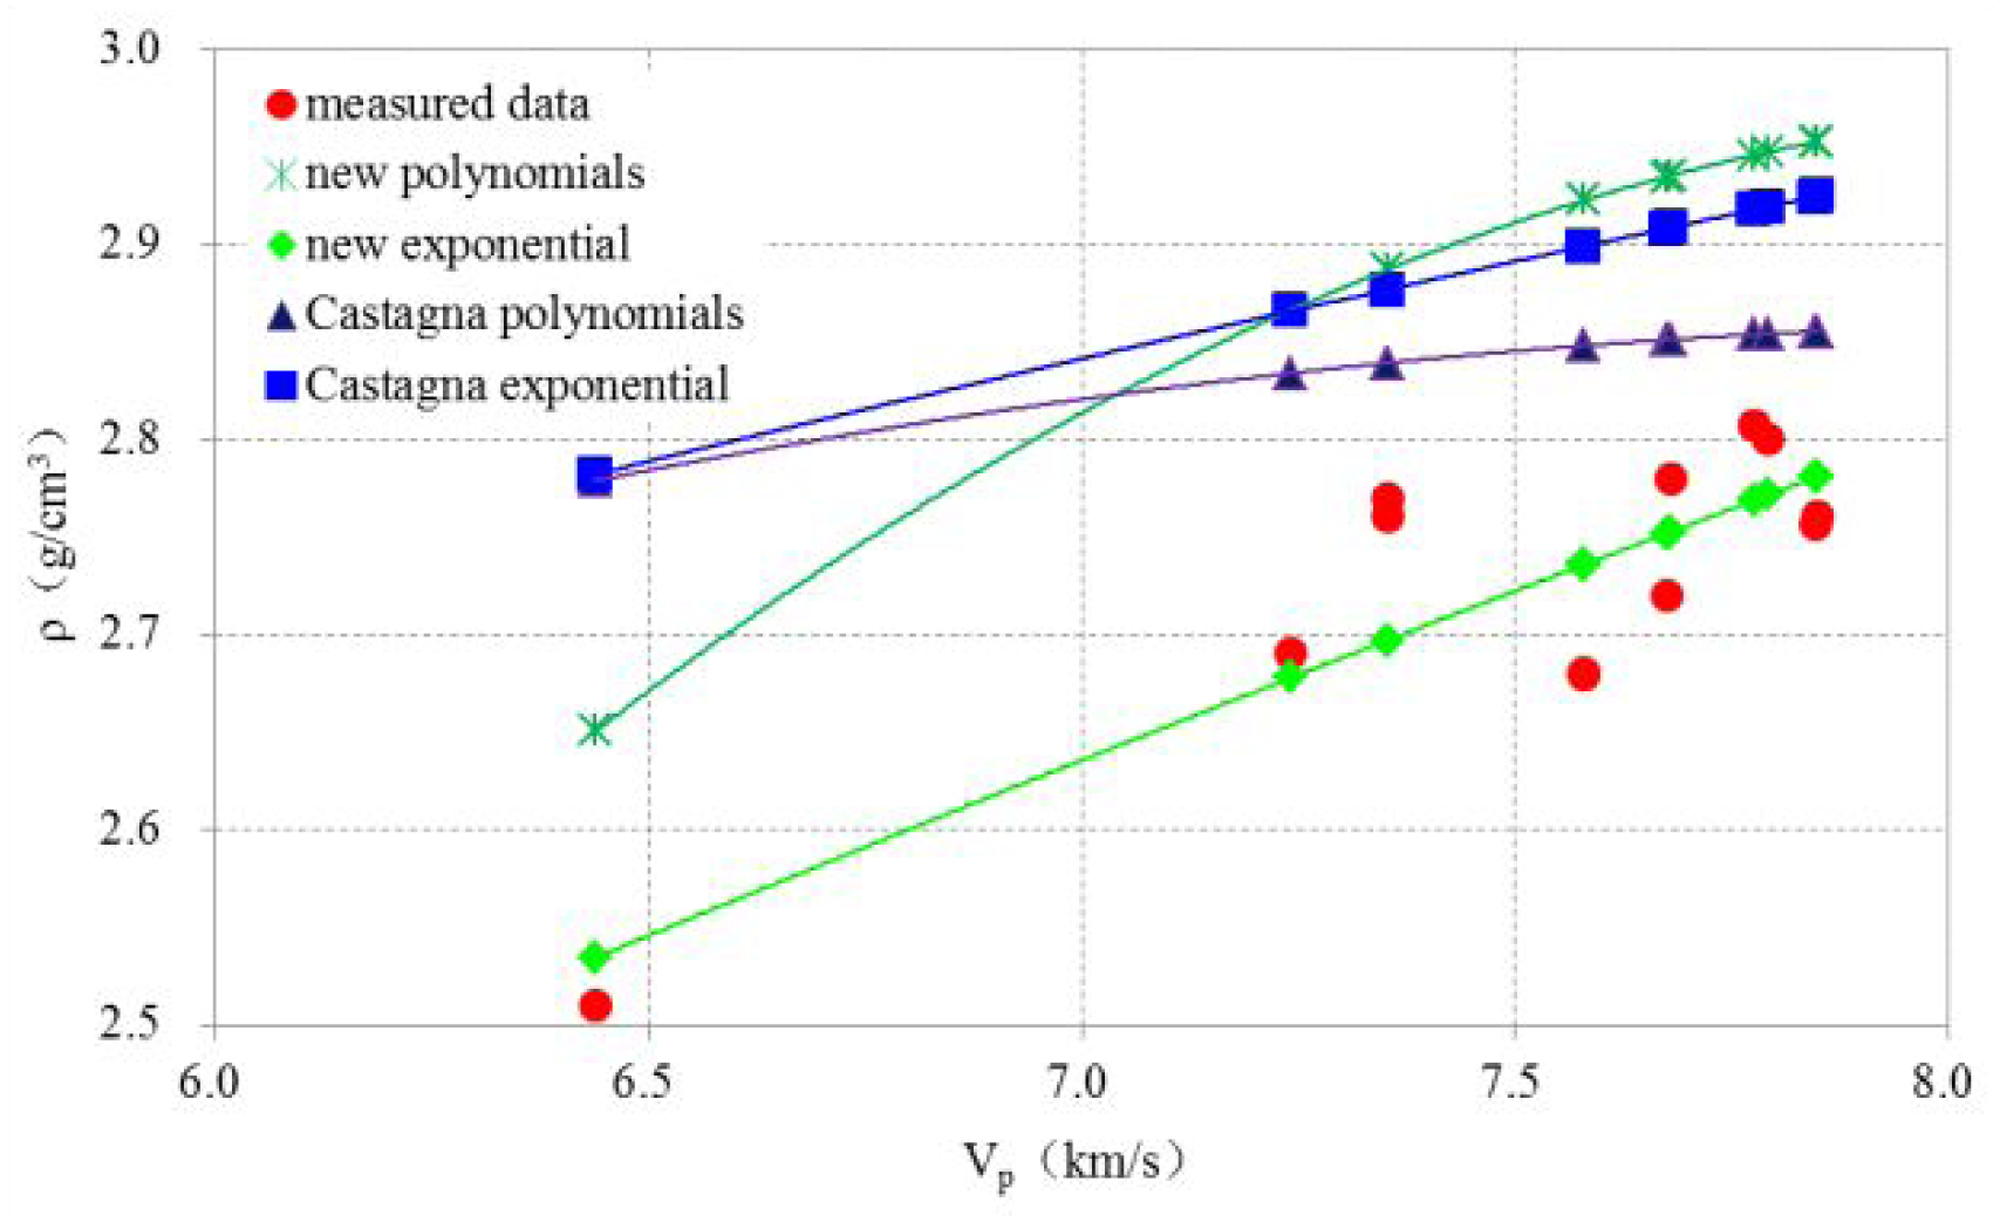
The correlation chart of new fitting formulas, Castagna polynomials, Castagna exponential relations, and measured data.
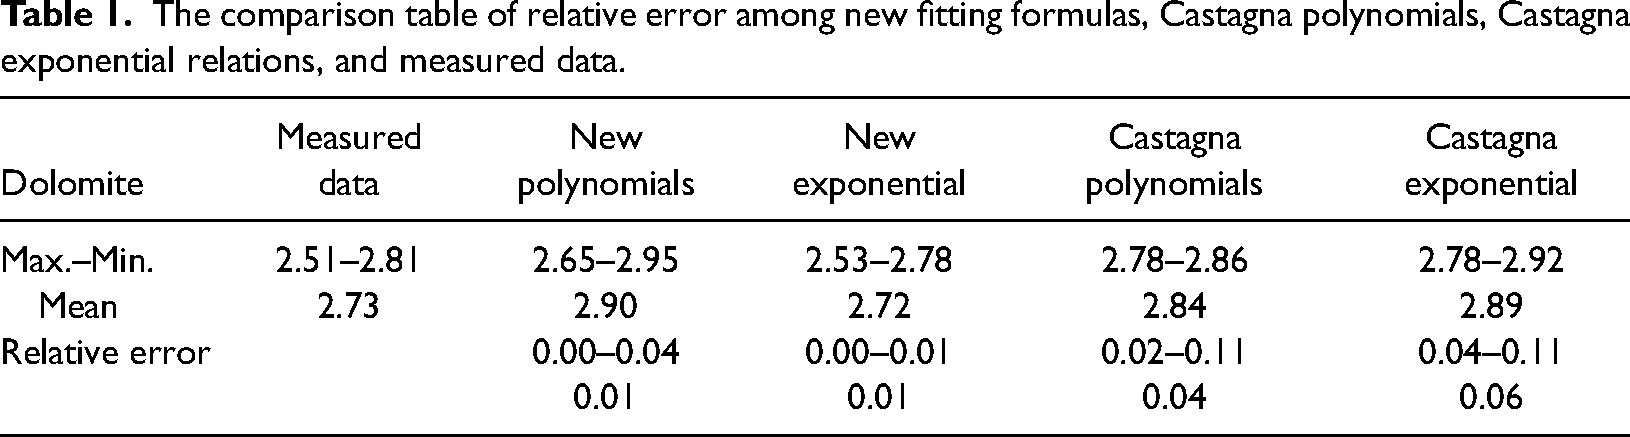
The comparison table of relative error among new fitting formulas, Castagna polynomials, Castagna exponential relations, and measured data.
Practical applications
Determination of temperature and pressure under formation conditions
The Wumishan formation of the Jixian System in the Middle and Upper Proterozoic borehole D05 of Xiongan New Area was selected for density prediction. The Wumishan formation of borehole D05 is 2185–3002 m, and the thickness is 817 m. The lithology is mainly dolomite. According to the measured temperature curve of borehole D05, the temperature at the bottom 4014 m is 97.71 °C, and the overall geothermal gradient of the Jixian system is 1.98 °C/100 m, among which the geothermal gradient of Wumishan formation is 1.81°C/100 m, and the formation temperature varies from 61.83 °C to 76.19 °C. According to the geological conditions of the study area, the normal formation pressure varies between 21.56 MPa and 31.46 MPa.
Density prediction
The density and P-wave velocity relation under the formation temperature and pressure condition can be obtained using the above method: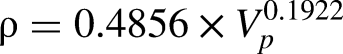
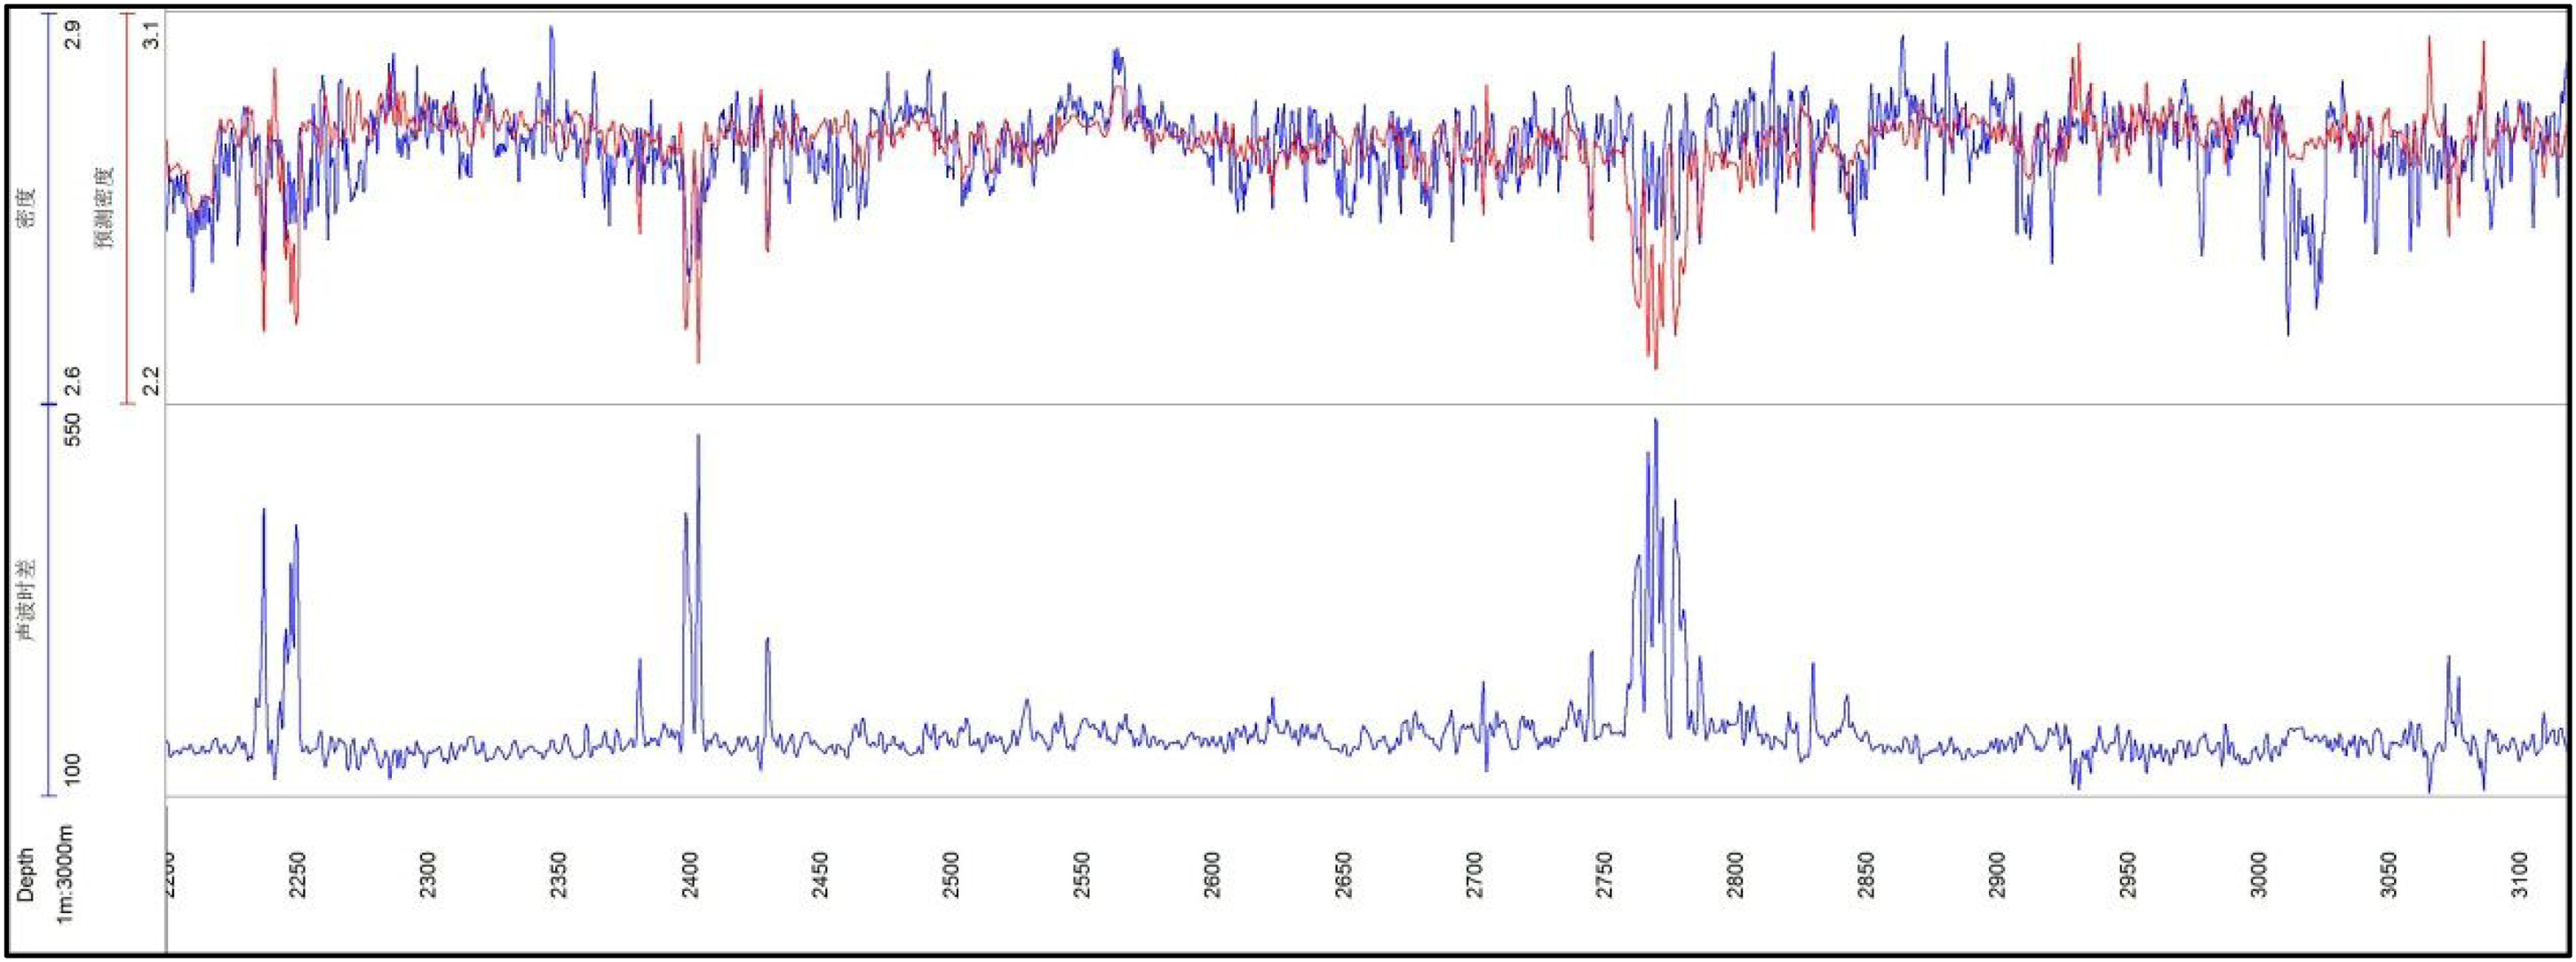
The comparison of measured data and density prediction results.
There is a high coincidence in the depth where the acoustic travel time curve is relatively stable. The depths with significant errors are 2234–2252 m, 2397–2405 m, 2760–2788 m, etc. From the description of the borehole core and logging interpretation results, the strata in these depths are relatively broken. The internal fissures and solution cavities are highly developed, and the response characteristics of low resistivity, high acoustic travel time difference, and low density are displayed on the well-logging. The relative error analysis shows that the relative error of density is between 0 and 0.167, and the overall error is small, which proves the applicability of the constructed petrophysical model in the study area.
Conclusion
The measurement results of elastic parameters of carbonate reservoir samples have supplemented and improved the database of geophysical parameters such as P-wave velocity, S-wave velocity, and density in Xiongan New Area.
The P-wave velocity of carbonate rocks in Xiongan New Area increases first and then decreases with the increase of temperature in the range of 25–80 °C. The P-wave velocity reaches the maximum at 50 °C, and the temperature above 100 °C has little effect. The change characteristics of S-wave velocity with increasing temperature are not prominent. The P- and S-wave velocities increase with the increase in surrounding pressure, and the increased amplitude is “decrease–increase–decrease,” with the maximum increase between 10 and 15 MPa.
The relation between P- and S-wave velocities, P-wave velocity and density, density under normal temperature, and pressure conditions and formation conditions are obtained through the fitting of experimental data. The correlation coefficient is high, and compared with the measured data, the relative error is small, which has high applicability to the study area and can be carried out research on reservoir prediction. The results of density prediction show that fracture has a more significant influence on the seismic elastic properties of carbonate reservoirs than the influence of temperature and pressure changes; the more developed the fractures, the more important the change in elastic wave velocity and density change.
Limited by the number of experimental samples and the type of rock samples, the law of fitting curves still needs to be revised. It is suggested that many experimental studies on various kinds of rocks be carried out and the influence of porosity change and fracture development degree during experimental measurement be considered to generalize the rule of universal applicability.
Footnotes
Declaration of conflicting interests
The author(s) declared no potential conflicts of interest with respect to the research, authorship, and/or publication of this article.
Funding
The author(s) disclosed receipt of the following financial support for the research, authorship, and/or publication of this article: This work was supported by the China Geological Survey project, Open Project Program of Key Laboratory of Groundwater Resources and Environment (Jilin University), Ministry of Education, (grant number DD20221680, 202306ZDKF03).