
Abstract
Frequent water inrush disasters in deep coal seam mining pose a significant threat to the safety of coal extraction operations. Due to the complexity and non-linearity of water inrush factors, evaluating the risk of water inrush in coal seam floor is challenging and the results can vary significantly. To achieve more accurate evaluations, the weighted rank-sum method and Grey-TOPSIS method were employed, alongside a master control indicator variable-weight model, for assessing the risk of water inrush in coal seam floor. Validation of the evaluation zoning map against actual conditions revealed that both methods produced accurate assessment results, thus affirming the reliability of the new evaluation approach. Compared with the water inrush coefficient method, the diversification of index factors weakened the absolute control effect of the water inrush threshold. The evaluation outcomes were more systematic and comprehensive, providing a new methodology and perspective for deep coal seam mining.
Introduction
China possesses abundant coal resources, which account for >90% of the proven fossil energy resources, making coal one of the most significant energy sources in the country. China's resource structure dictates that coal will remain the primary source of national energy production and consumption in the long term (Jia et al., 2021). Safe and efficient exploitation of coal resources is integral to the development of China's national economy and society. Dong et al. (2022) studied water inrush patterns of Ordovician limestone in North China Coalfield based on hydrochemical characteristics, revealing the evolution processes of water inrush in this region. Dong et al. (2023) established a hydraulic model of roof (floor) water inrush in near-fault coal mining under “double pressure” control, deriving a new method for calculating the width of waterproof coal (rock) pillars in coal mining on large normal faults. More recently, Dong et al. (2024) constructed a dynamic monitoring and prewarning system for coal seam roof water inrush risk based on deep learning and joint advanced detection, which provides a new method for preventing water disasters in coal seam roofs. As shallow coal resources in China are depleting, coal mining operations are increasingly moving to deeper areas. However, this shift brings new challenges, including the development of geological structures such as faults and folds (Li et al., 2023), rupture of thin water barriers under mining conditions, and the risk of high pressure in strong water-rich limestone aquifers. These factors pose significant hazards in deep coal mines. Therefore, objectively and accurately assessing the risk of water inrush from deep coal seam floors has become an unavoidable research topic for coal mine practitioners.
The evaluation of the risk of water inrush on coal seam floors is a multidisciplinary task that involves coal geology, tectonic geology, hydrogeology, geomechanics, mathematical geology, and other fields (Fan et al., 2024). As early as 1944, Hungarian scientist REIBIEZC first introduced the concept of a relative water barrier for floor water inrush and provided an initial description of it. In 1948, Soviet scientist Slisalif systematized the theory of water inrush and proposed a formula for the thickness of a safe water barrier, laying the groundwork for further scientific research on water inrush (Pan, 1986). In 1964, Chinese researchers, utilizing unique data from Chinese mining areas, proposed the water inrush coefficient method based on the mechanisms of water inrush (Yao et al., 2024). Although this method may not be universally applicable, it remains the most commonly used approach for evaluating floor water inrush in China. In the twenty-first century, Wu et al. (2007a, 2007b) proposed the establishment of a main control index system for floor water inrush. They comprehensively and systematically introduced indices related to the floor water inrush. Based on the factors of the main control indices, they adopted the vulnerability index method to classify the risk of coal seam floor water inrush using GIS. This results in a more accurate evaluation. Subsequently, under this mode of thinking, various mathematical methods had been continuously explored and applied to the evaluation of floor water inrush, such as vulnerable index method based on Surfer (Zhang et al., 2020a) and TOPSIS (Li et al., 2022). The diverse theories and evaluation methods developed have been widely applied to guide the prevention and control of water inrush on mine floors. However, in practical applications, even with the same data from the same mine, the evaluation results of the mine using different evaluation methods still have large differences. Therefore, applying different methods to assess the risk of coal seam floors in the same mine is crucial for accurate evaluations.
We adopted two innovative mathematical methods, the weighted rank-sum ratio (WRSR) and Grey-TOPSIS, to evaluate the risk of floor water inrush. The rank-sum ratio (RSR), as a carrier of composite information, can process the information of multi-indicator factors affecting coal seam floor water inrush through rank substitution. This is done to form a new statistical metric to analyze nonlinear indicator information and evaluate the floor water inrush risk. Compared with other methods, it has the advantages of large capacity, strong relevance, and plasticity; is effective in quantifying research information; and is easy to popularize and apply (Tian, 2002). The Grey-TOPSIS method is a new method for evaluating floor water inrush, which is based on the traditional TOPSIS method and is introduced by combining it with the grey correlation theory. The TOPSIS method is a multi-objective decision analysis approach. It considers the influence of the difference in each indicator information while considering the information of the indicators affecting the floor water inrush. This method makes full use of the original indicator information and reflects the degree of fit between the data. As a result, it has been widely used in the evaluation of floor water inrush risk (Wang et al., 2021). However, the traditional TOPSIS method is prone to disorder when the distance of the index factors from the positive and negative ideal solutions is equal. It also has certain limitations when reflecting the difference between the internal trend of the index factors and the ideal condition. The grey correlation theory addresses the shortcomings of the TOPSIS method. It analyzes the potential connection between indicators by calculating their degrees of correlation, allowing for the assessment of each indicator's expected impact on the evaluation system. Therefore, this approach reflects the proximity of each evaluation indicator to the ideal situation in terms of trend similarity. By combining the two methods, the data in the analyses of the degree of fit and the degree of trend fit complement each other (Zhang et al., 2020c), which can effectively improve the accuracy of the evaluation compared with a single method.
This study used the Sitai wellfield of the Datong coal field (Figure 1) as the research object and established the main control index system containing three aspects of aquifer performance, water barrier performance, and geological structure by integrating multi-factor considerations. In order to target the characteristics of the water inrush indicators and obtain more accurate evaluation results. WRSR and Grey-TOPSIS mathematical methods, combined with a variable weight model, were used to evaluate the risk of water inrush in the 8# coal seam threatened by limestone karst water in the Sitai mine. The lithological column of the study area is shown in Figure 2. The results were compared with the water inrush coefficient method based on the actual water inrush situation to verify their relative accuracy. The aim was to provide a reference for water control work in the Sitai wellfield and a new direction for the evaluation of water inrush risk in the coal seam floor.
Study area
Establishment of the master control index system
At the core of establishing an indicator system, the selection of the main control indicators is the basis for the two evaluation methods to perform an accurate evaluation. Based on the analysis of the hydrogeological conditions and geological structure of the mine, a system of main control indices for water inrush in the coal floor was established. The system includes the aquifer water pressure, aquifer water richness, water-barrier thickness, floor damage depth, brittle-plastic rock thickness ratio, and tectonic complexity. This system was combined with previous ground investigation data from the study area of the Sitai wellfield to evaluate the risk of floor water inrush.
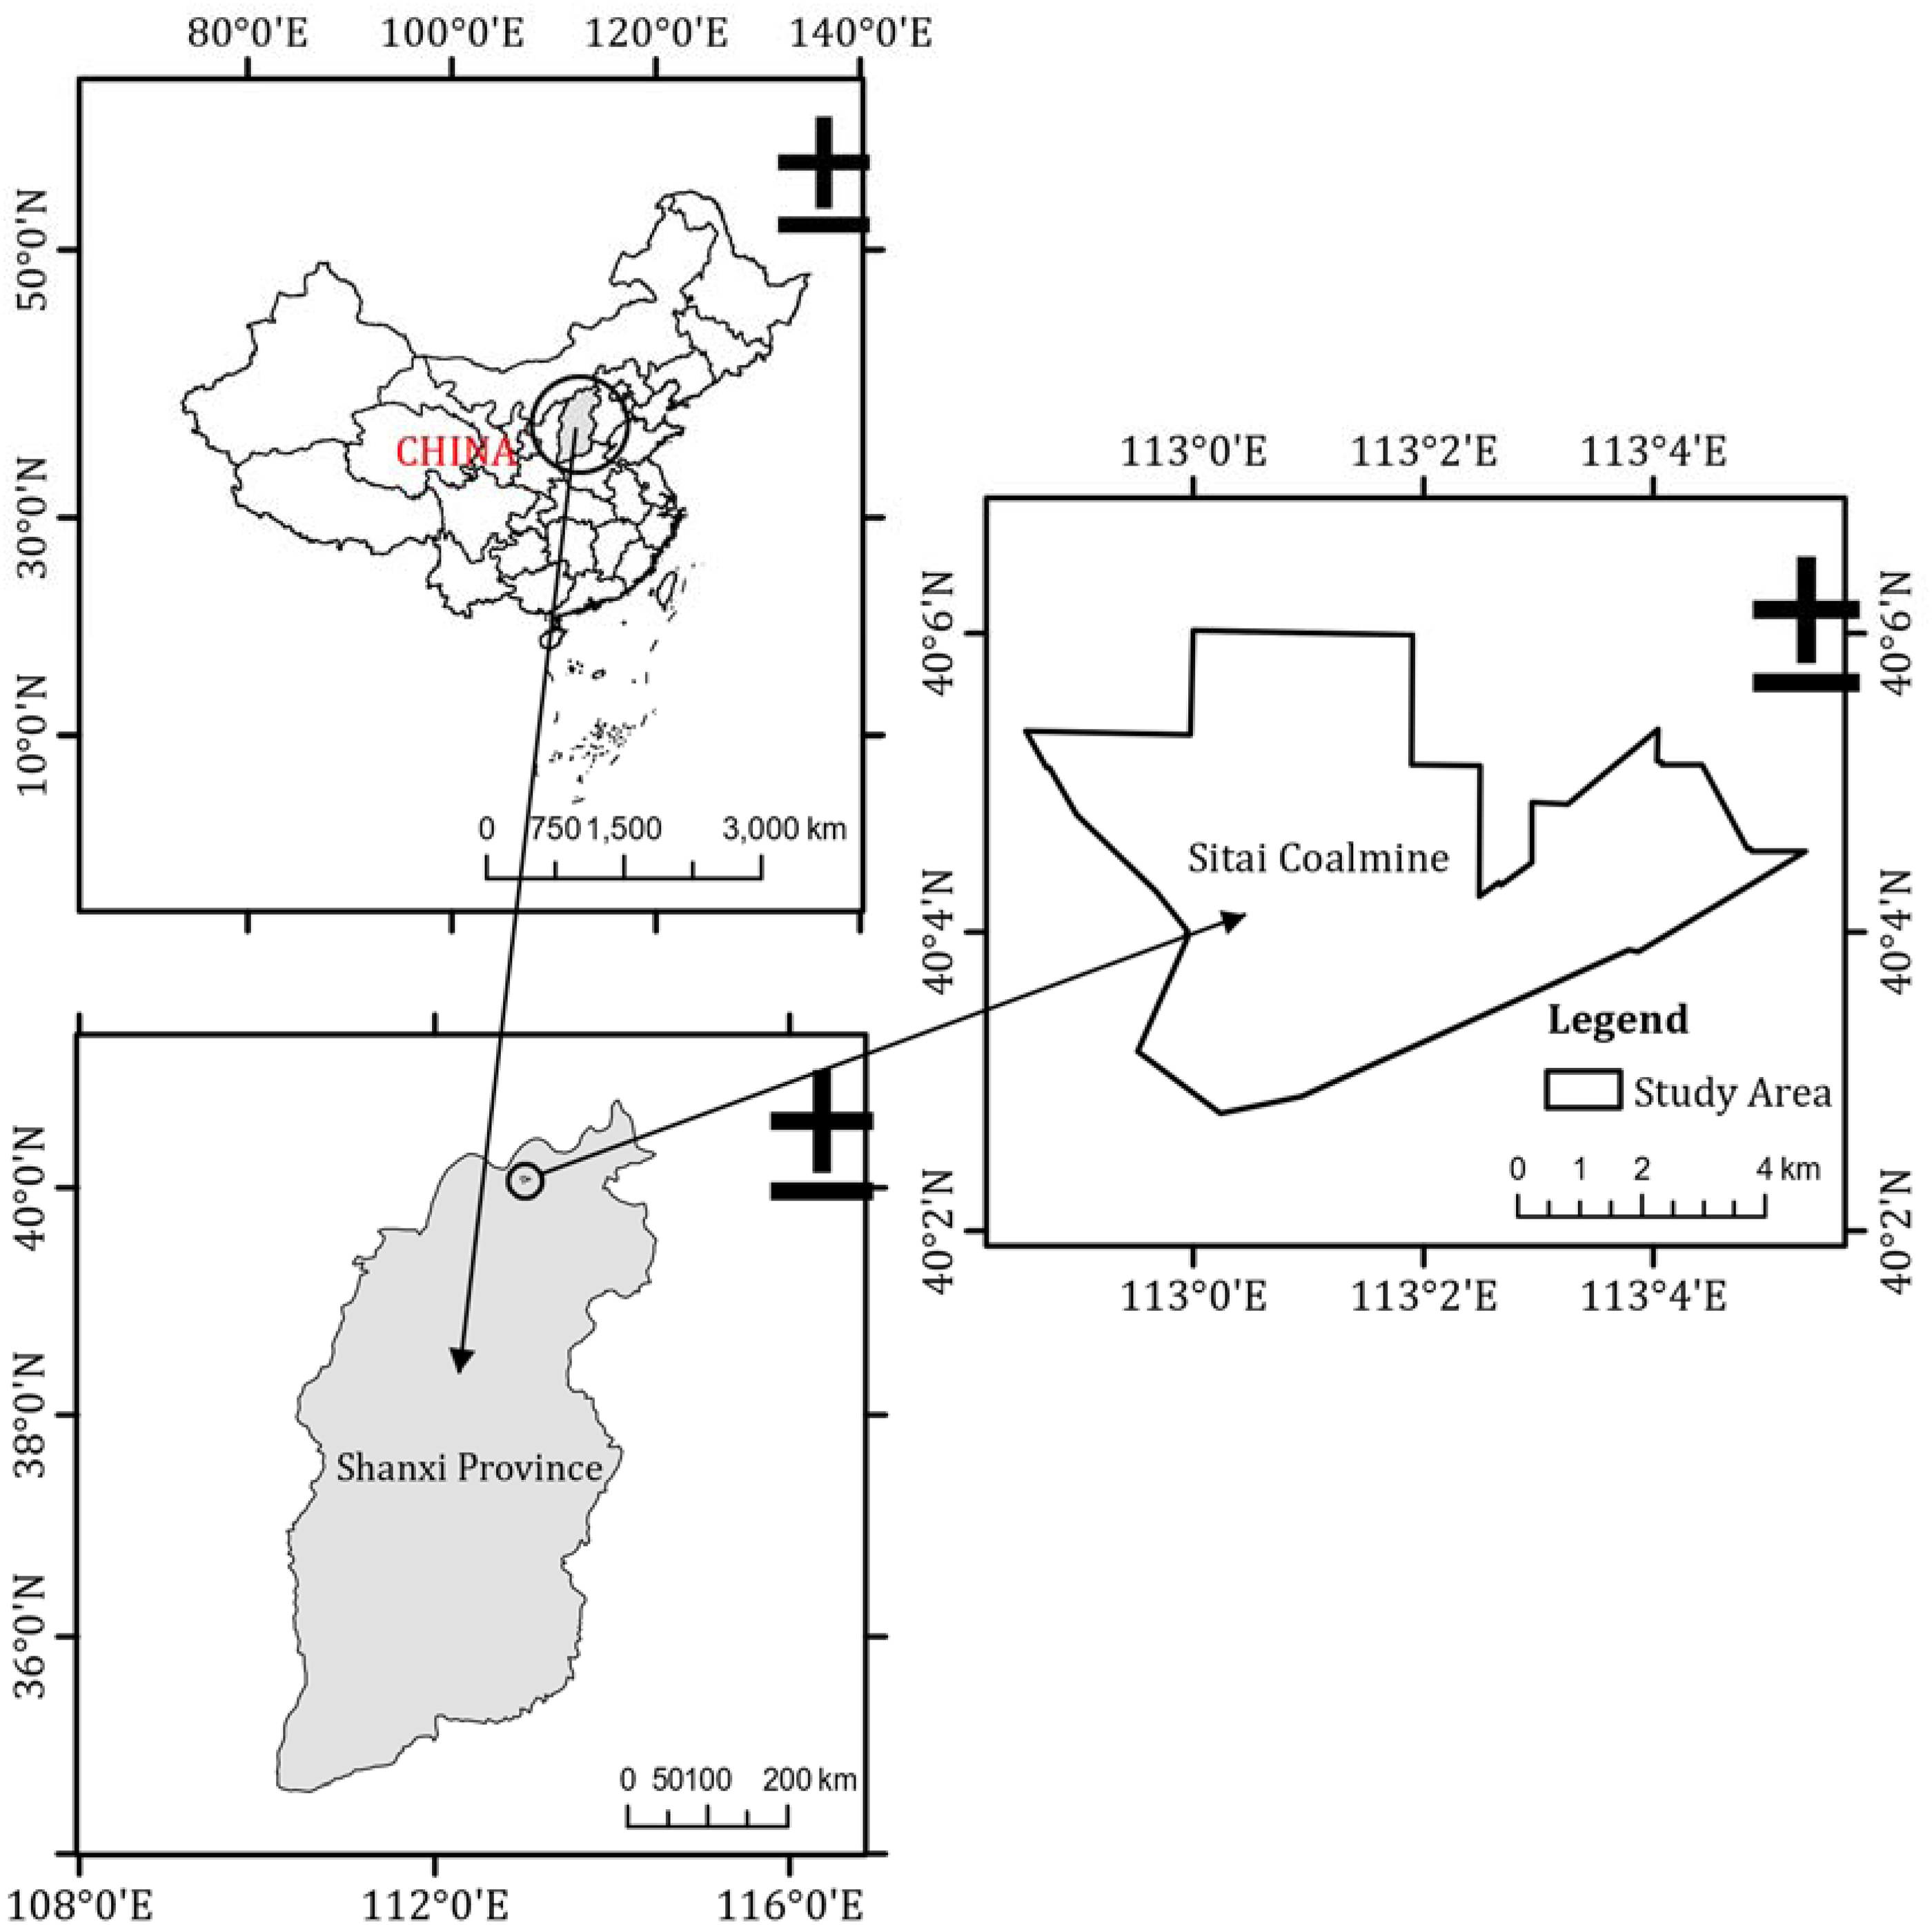
Geographic location of the Sitai wellfield.
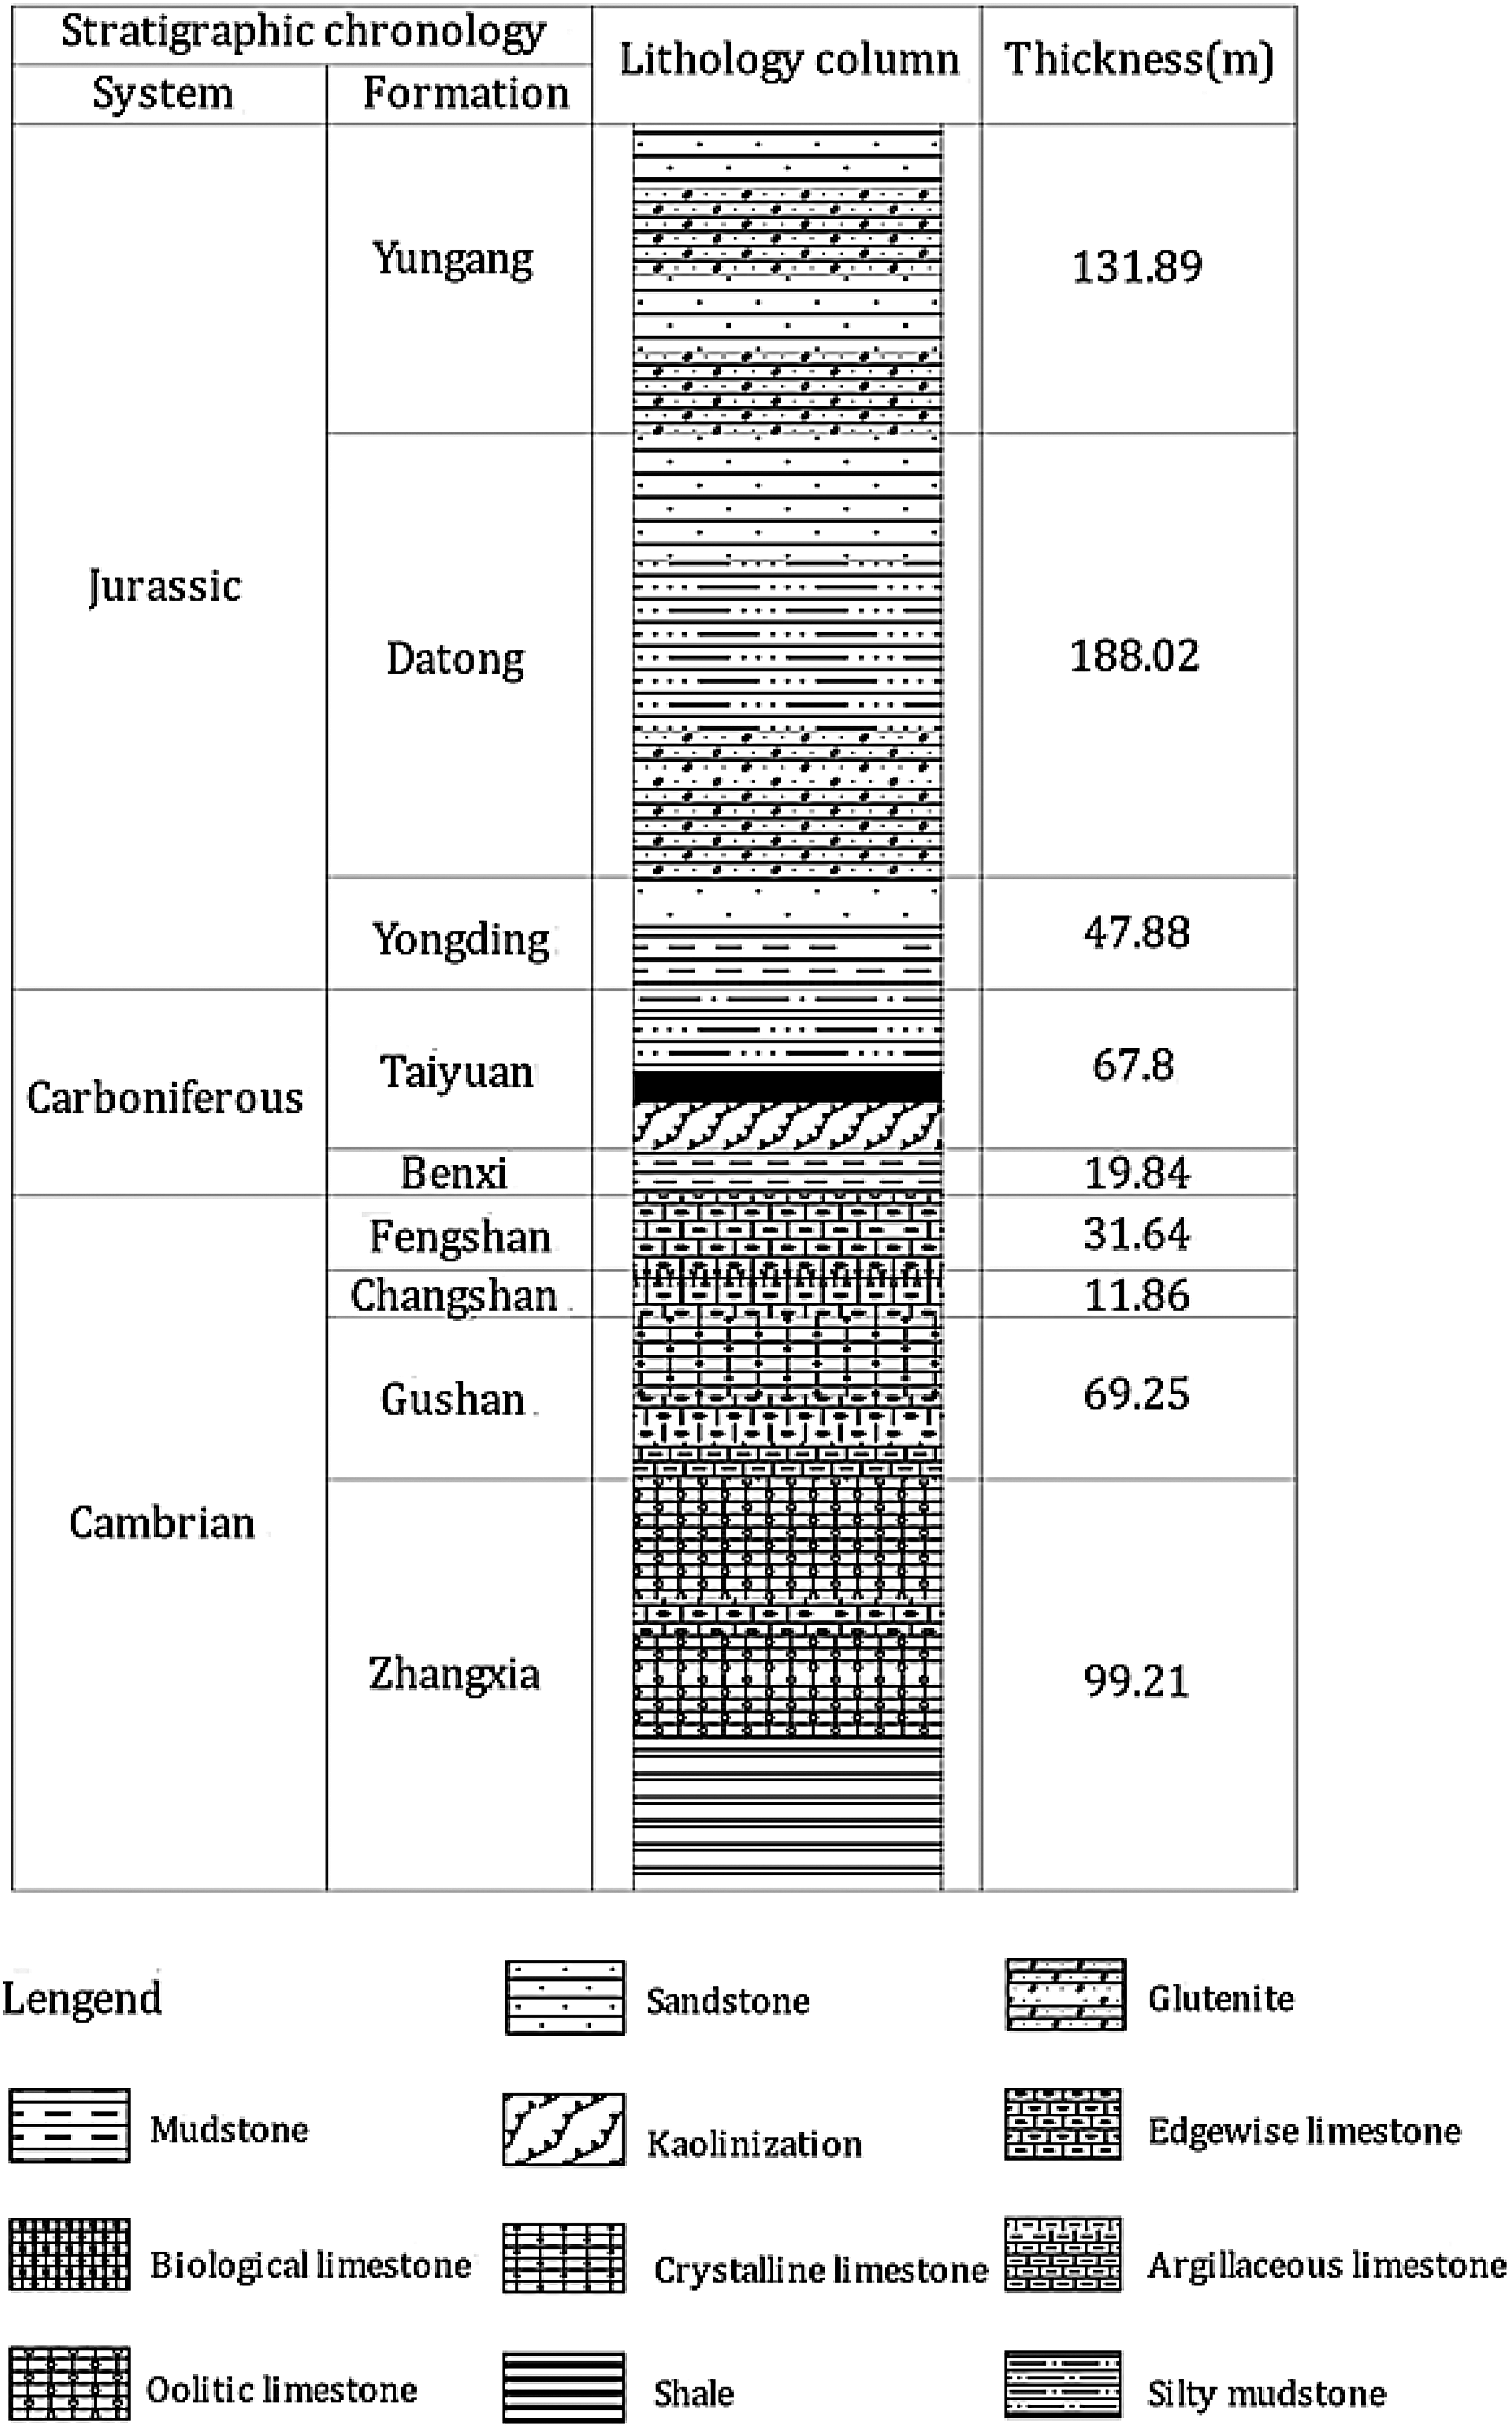
Lithological column of the study area.
Aquifer water pressure
Aquifer water pressure is the power source of floor water inrush in the coal seam. When the head pressure exceeds the water-barrier strength, floor water inrush occurs. Therefore, the probability of water inrush increases with water pressure in the aquifer. The value of water pressure can be determined based on the water level and elevation of the Cambrian limestone.
Aquifer water richness
Aquifer water richness refers to the ability of an aquifer to release water, which reflects its water content and determines the intensity of water filling. Evaluating water richness per unit of borehole using borehole pumping test data is the main basis for determining water richness.
Water-barrier thickness
The layer between the coal seam and water-bearing layer serves as a protective barrier, hindering and weakening the head pressure. Its primary function is to prevent confined water from entering the mining space. The thickness of this layer determines its water-blocking ability and risk of floor water inrush. The thickness of the coal seam can be determined by comparing the elevation of its floor with that of the Cambrian limestone roof.
Floor damage depth
During coal seam mining, the rock layer beneath the coal seam is damaged by mining pressures and other factors, resulting in the formation of fissures. These fissures can become water-conducting channels, thereby increasing the risk of floor water inrush. The depth of destruction of the coal seam floor refers to the vertical distance between the floor of the mined coal seam and deepest part of the mining fissure zone, which can be calculated using Eq. (1) (Liu et al., 2021b):

Brittle-plastic rock thickness ratio
Brittle rock possesses high mechanical strength, and exhibits strong anti-surge properties. In contrast, plastic rock possesses low mechanical strength and poor anti-surge performance. Therefore, a higher thickness ratio of brittle to plastic rock in the water barrier results in better anti-water-rupture performance and reduces the risk of floor water inrush. The thickness ratio of the brittle to plastic rock deposits was determined statistically using the drill core accumulated in the wellfield.
Tectonic complexity
Tectonic distribution is characterized by a non-linear distribution (Ma et al., 2020), and its complexity can be quantified using fractal dimension analysis. To calculate the fractal dimensions, the study area was divided into four exponentially increasing square grids (1000 m × 1000 m, 500 m × 500 m, 250 m × 250 m, and 125 m × 125 m) using the grid coverage method. The complexity of the tectonic distribution was assessed by counting the number of grids containing fault traces in different cells. A double logarithmic coordinate system was established for the grid edge lengths and number of fault traces. The curves were fitted to calculate the capacity dimensions of each grid (Xu et al., 2021). The capacity dimension is defined using Eq. (2):

After establishing the master control index system, the quantitative value of each master control index was calculated. Combined with known borehole coordinate data, six contour thematic maps were generated (Figure 3) using the kriging interpolation method in Surfer software to achieve the visualization of the master control index values.
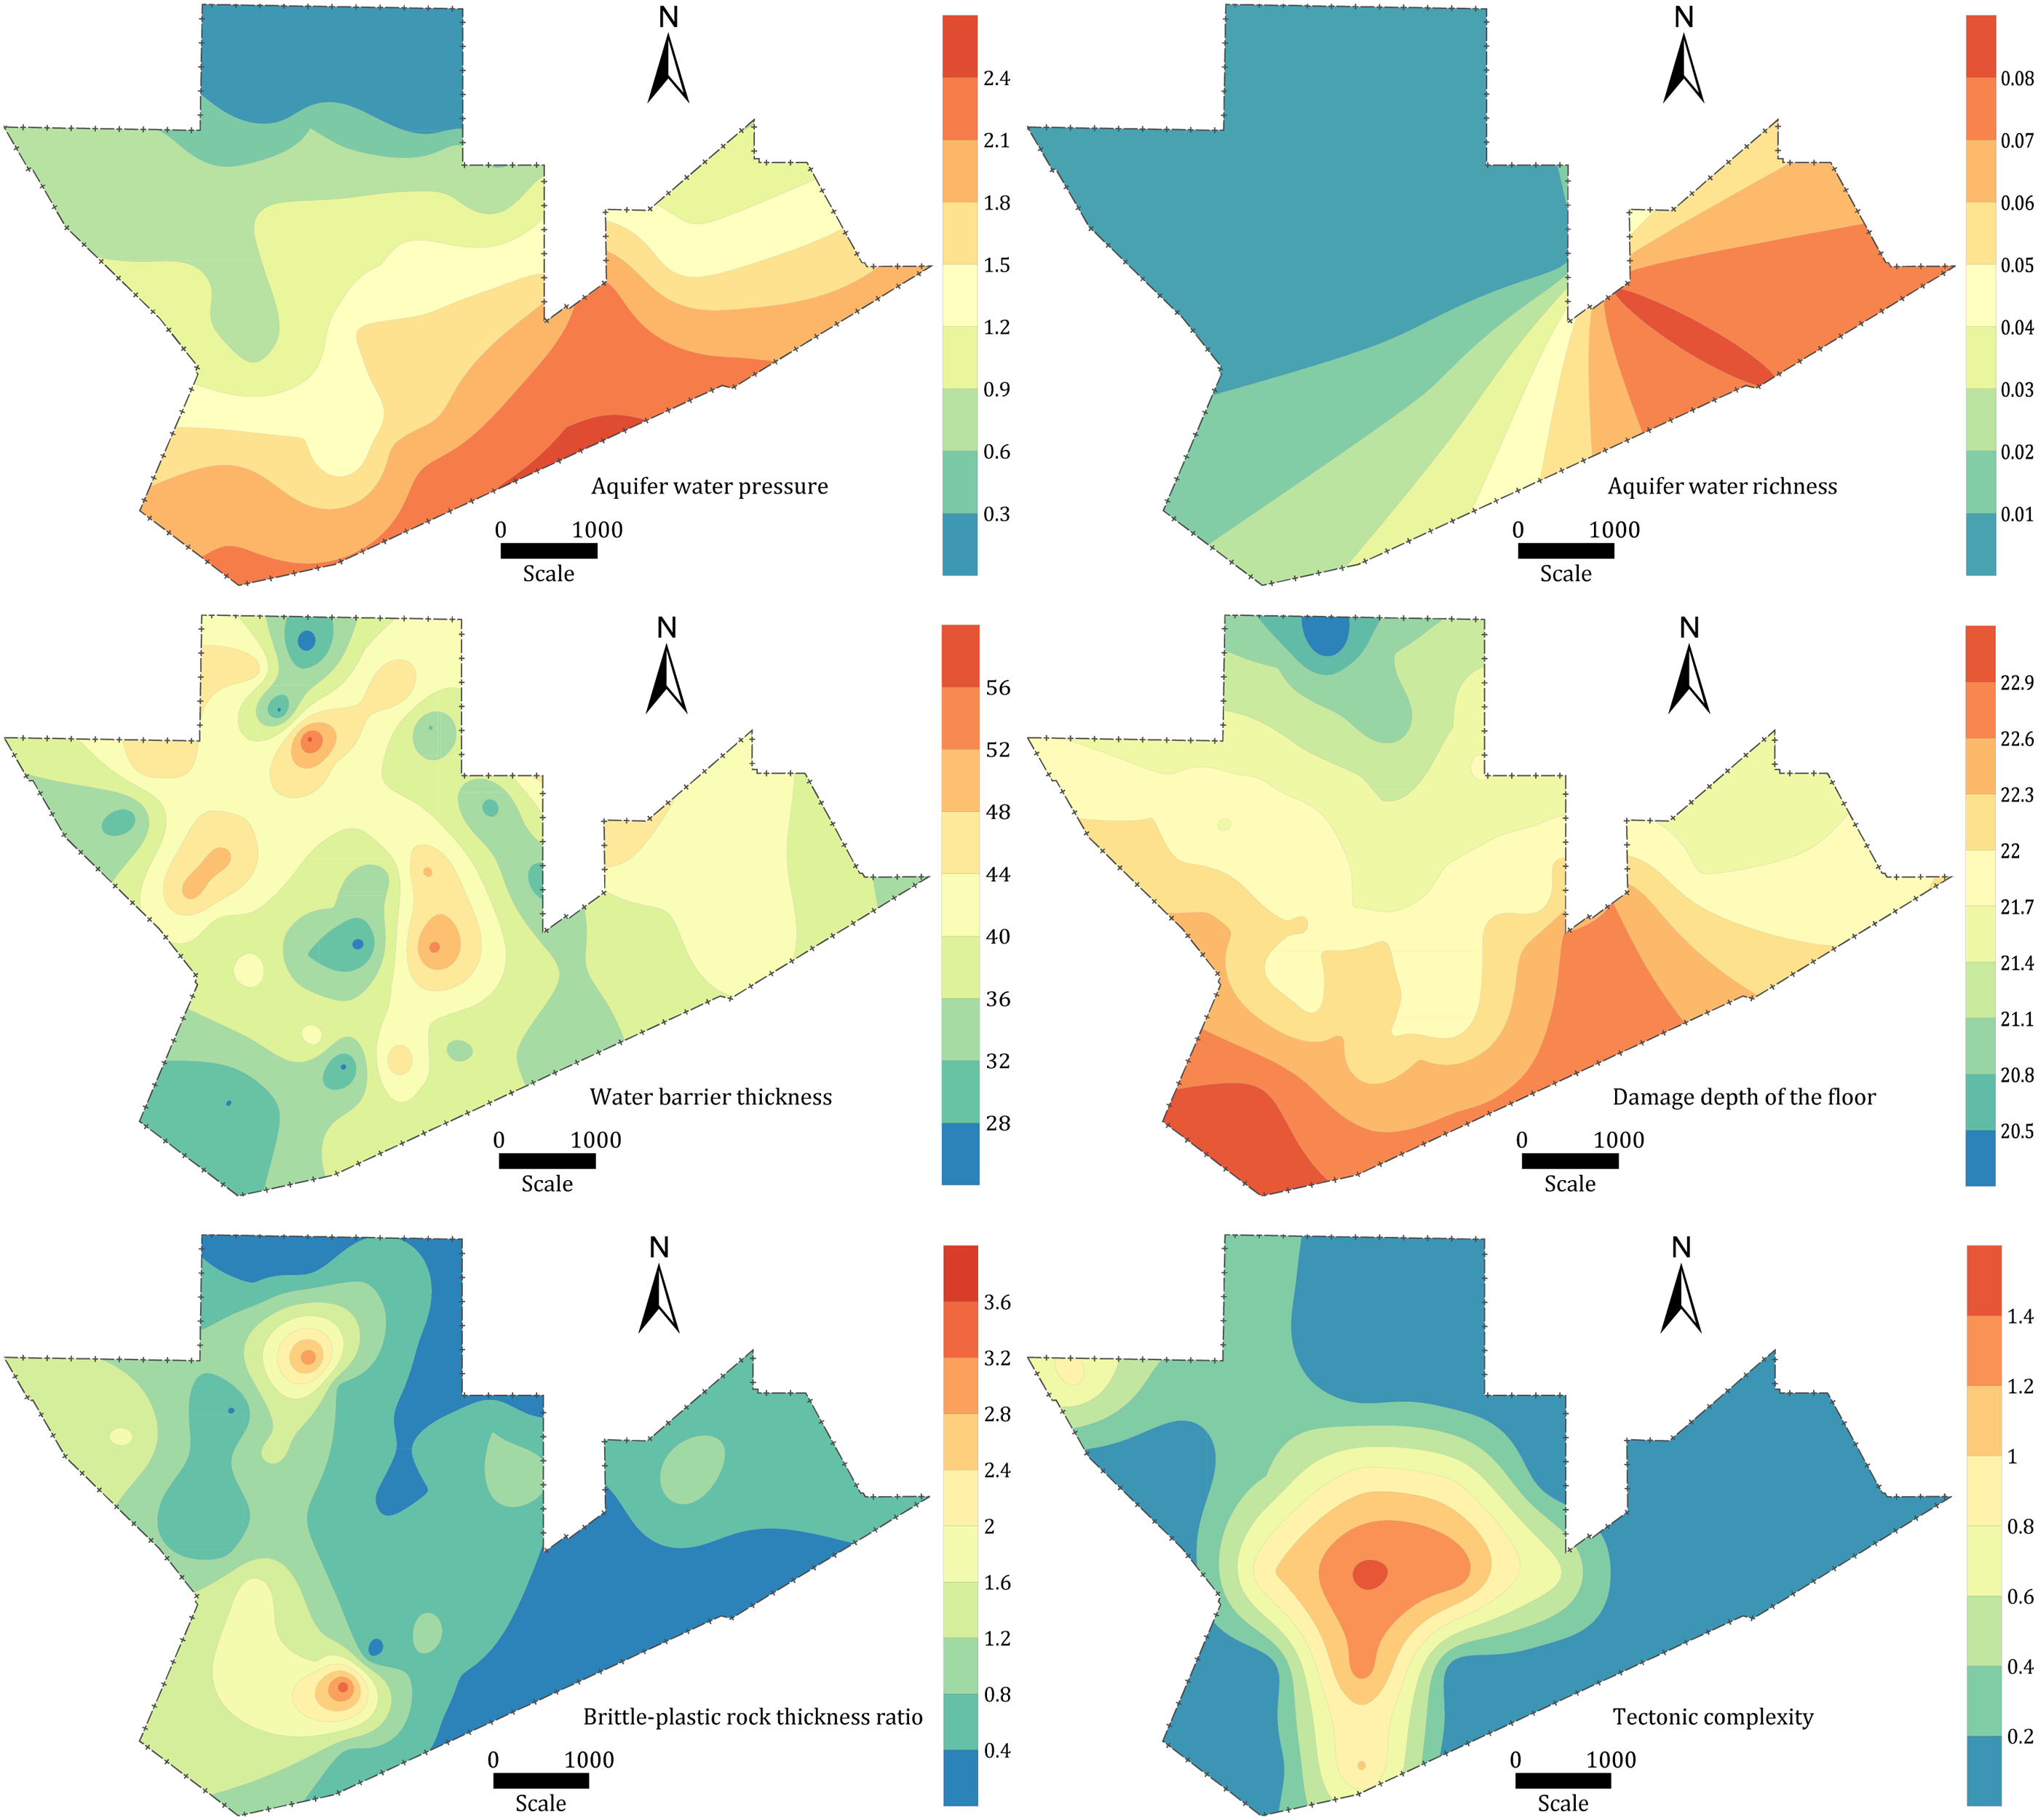
Thematic maps of master control index factors.
Determination of weights for master control index
Standardization of index factors
After establishing the master control index system, the different measurements of the index factors were not directly comparable. To eliminate the differences in unit measurements between index factor values, it is necessary to standardize the main control index values such that the data are comparable, statistically significant, and easy to evaluate and analyze. For the index factors, the larger the value of the index is, the higher the risk of floor water inrush is used in Eq. (3). On the other hand, the smaller the value of the index, the higher the risk of floor water inrush is used in Eq. (4):


Determination of comprehensive constant weights
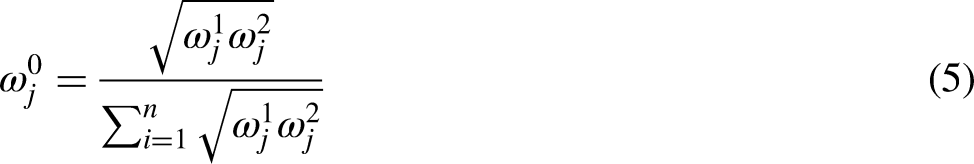
Establishing the main control index system is the basis for the evaluation of floor water inrush risk. To ensure the reliability and accuracy of the evaluation results, the selection of a reasonable method to assign weights to the indicator factors is key to the evaluation process. When determining the constant weight of the indicator factors, a single assignment method is prone to bias, which affects the accuracy of the evaluation results. By employing a combined approach of subjective and objective weighting, this approach integrates the expert knowledge and experience from subjective weighting with the inherent relationships between indicators in objective weighting, thereby enhancing the scientific rigor and effectiveness of the weighting process (Wei et al., 2021). In this study, the AHP method was adopted for subjective empowerment. The principle of AHP involves establishing an ordered hierarchical structure based on the evaluation of floor risk indicators. By employing different levels of scaling for comparative assessment across the hierarchical indicators, quantitative assessment weights for the respective factors can be derived. Objective weighting was conducted using the CRITIC method, which analyzes the comparative intensity among indicators and their correlations. This approach fully leverages the intrinsic properties of the data to determine weights through objective evaluation. After the subjective and objective weights are determined, based on the principle of minimum relative information entropy (Ren et al., 2022), an optimal combination of assignment model is established to determine the comprehensive weights ω0 j, which is calculated as Eq. (5):
Establishment of variable weight model
The constant weight model can reflect the relative importance of different indicators to some extent, but in the context of water inrush assessment, evaluation results depend not only on the fundamental significance of each indicator but also on the variations in their state values and combinations. The variable weight model addresses the limitation of having a single fixed weight for indicator factors in the evaluation process. Moreover, it clarifies the controlling mechanisms and variation patterns of these factors related to water inrush in coal seam floors (Zhang et al., 2020b). Consequently, the establishment of indicator weights is more accurate and reflective of practical scenarios. The specific contents and steps of the indicator variable weight model are as follows.
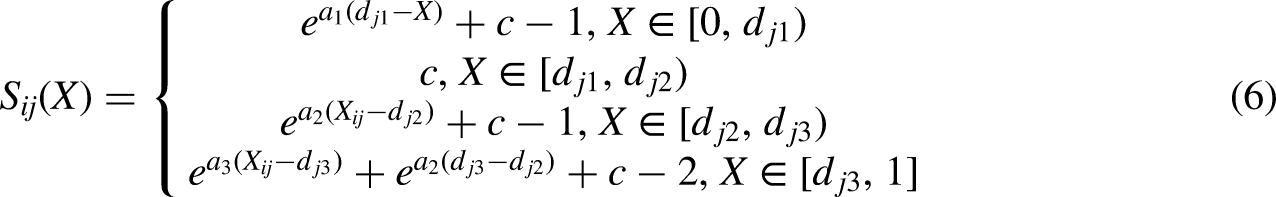
Construction of state variable weight vector: Considering the characteristics of the variable weight theory, the ability of the variable weight model to accurately address sudden changes in the values of the main control indicators is critical to the reliability of the model prediction results. The vector construction introduces two modes: “incentive” and “penalty.” Dynamic assignment of indicator weights is applied in response to sudden changes in indicator factor values, facilitating or hindering water inrush assessment. This approach effectively reflects the impact of sudden variations in main control indicator values on the overall evaluation. Combined with an analysis of the state variable weight vector model, Eq. (6) was applied: Determination of the variable weight interval of the main control factors: In previous studies, the K-means clustering method was used for the classification thresholds of variable weight intervals (Liu et al., 2021a). However, this method may inadequately categorize data points located between two cluster centers (Zuo and Chen, 2016), resulting in reduced classification accuracy of sample data during the application of variable weights. Given the complexity and uncertainty of the factors influencing floor water inrush, fuzzy clustering methods present advantages over K-means clustering, particularly in situations involving multiple evaluation indicators, where decision boundaries are ambiguous and lack clear delineation (Zhu and Song, 2021). Therefore, this study employed a more widely applicable and scientifically rigorous clustering method—fuzzy C-means clustering. Based on the state variable weight vector, fuzzy C-means clustering was used to categorize the data of each master controlling indicator into four classes. The classification results were then utilized to determine the threshold values for each master controlling factor and to compute the variable weight interval thresholds using Eqs. (7), (8), and (9). where fj is the classification threshold for the variable weight interval of index j. Model parameter solution: In the constructed state variable weight vector, the parameters control and regulate the variable weight results (Liu et al., 2021a). Here, a1 regulates the magnitude of the weight change in the penalty interval, a2 regulates the magnitude of the weight change in the initial incentive interval, a3 regulates the magnitude of the weight change in the strong incentive interval, and c controls the magnitude of the change in the entire variable weight model. The parameters in the solution must select a determined evaluation unit based on knowing its indicator factor constant weight and ideal variable weight. Matlab software can be used to derive the state variable weight vector parameter values.
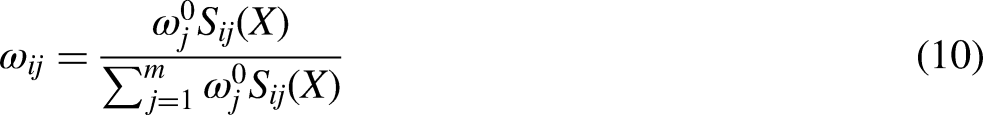
Through the construction of the state variable weight vector, the division of the variable weight interval and the solution of the variable weight parameter, the application of the partition variable weight model can be conducted to determine the variable weight of the main control index. Its calculation formula is shown in Eq. (10):


Risk assessment of water inrush
WRSR method
The WRSR method was first proposed by Tian (1991) and was first applied to index statistics and comprehensive evaluation in the field of healthcare. The principle involves calculating the WRSR of the evaluation matrix, utilizing probit values for sorting and categorization to obtain the final evaluation results. The detailed steps are as follows:
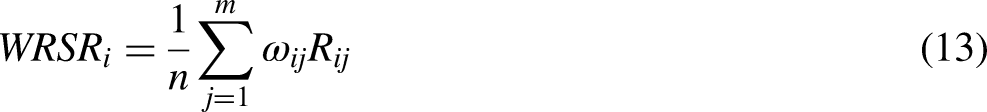
Establishment of data matrix: The evaluation object i was designated as the rows and the indicators j as the columns, arranging the raw data into an m × n matrix. The water-barrier thickness and brittle-plastic rock thickness were classified as “high-preference indicators”. Conversely, the aquifer water pressure, aquifer water richness, floor damage depth, and tectonic complexity were categorized as “low-preference indicators”. Non-integer method ranking: Compared with the integer method ranking, the non-integer method ranking can establish a certain linear correspondence with the original index value, which overcomes the drawback of losing quantitative information in the integer method ranking. The calculation formulas of its high-optimality indicators and low-preference indicators are shown in Eqs. (11) and (12): Calculate the WRSR and rank: By incorporating the variable weights of different indicators for each evaluation object, the WRSR is calculated according to Eq. (13). The rank values are then arranged in descending order. Determination of the RSR distribution: The probit model is a generalized linear model that adheres to a normal distribution. The distribution of the RSR can be expressed using specific cumulative frequencies of the probability unit Probit values. Through a series of transformations between rank ordering and probit values, the correspondence between the WRSR and probit can be established. Calculate the linear regression equation: A linear regression equation is established with the probability unit probit as the independent variable and the WRSR as the dependent variable. The regression equation is subject to testing, as outlined by Eq. (14). Probit sorting: After the regression equation test, the Delphi method (Tian, 1993) was used to sort the probit corresponding to the WRSR value, completing the threshold division for the evaluation of floor water inrush risk.


Grey-TOPSIS method
The TOPSIS method was first proposed by Hwang and Yoon in 1981 (Zhang et al., 2021). As a multi-attribute decision-making technique, its principle involves ranking the indicator factors influencing floor water inrush based on their proximity to an ideal state. This approach employs Euclidean distance to conduct a comprehensive evaluation, analysis, and processing of the relative merits of the indicator factors, ultimately facilitating the assessment of the risk of floor water inrush. As a systematic correlation analysis method, the grey correlation method determines the dominant and subordinate factors within a system by calculating the degree of correlation among indicators. It reveals the nonlinear relationships and trends among the indicator data. Based on the principles and characteristics of both methods, the Grey-TOPSIS method effectively integrates the Euclidean distance with the grey correlation degree in evaluating indicators (Surya et al., 2023). By assessing the comprehensive relative closeness, the process reflects the risk of floor water inrush.
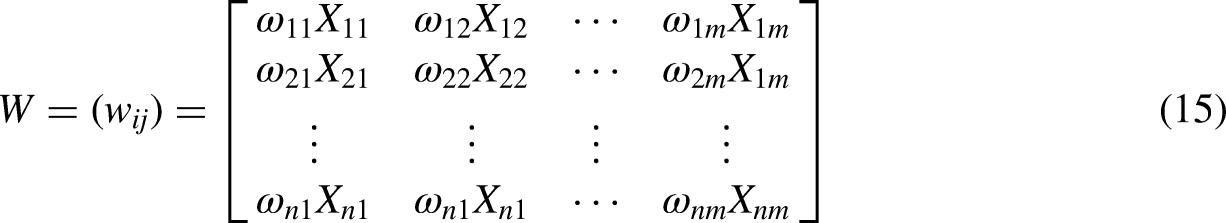
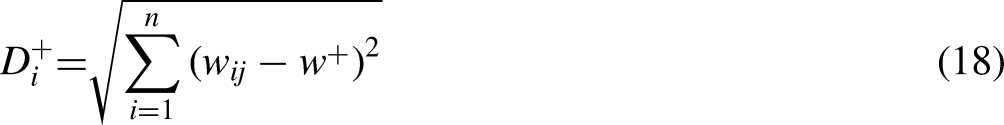
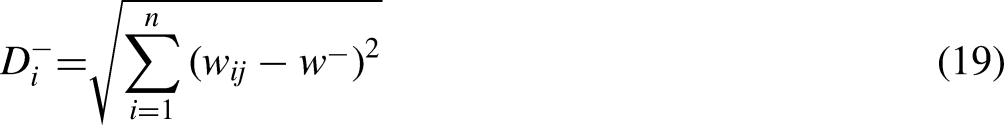
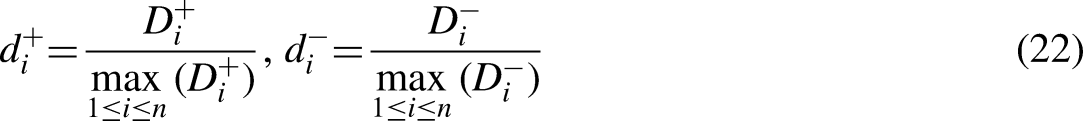
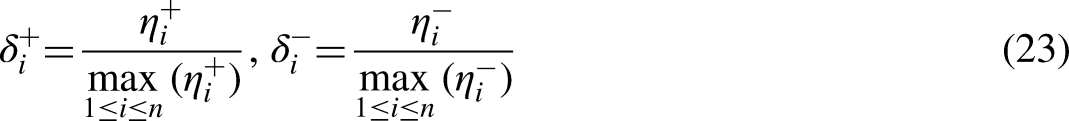
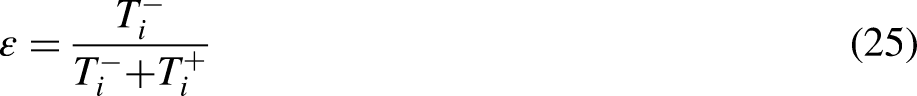
1. Construct a weighted standardized matrix: Based on the standardized value of the indexes of each evaluation object, combined with variable weights, establish a decision matrix, as in Eq. (15): 1. 2. Determination of positive and negative ideal solutions: Based on the established decision matrix, the maximum and minimum values of the positive indexes, that is, aquifer water pressure, aquifer water richness, floor damage depth, and tectonic complexity, are taken as the positive and negative ideal solutions of the evaluation system, respectively. The minimum and maximum values of the negative indexes, that is, the brittle-plastic rock thickness ratio and water-barrier thickness, are taken as the positive and negative ideal solutions of the evaluation system, respectively, and their calculation formulas are shown in Eqs. (16) and (17): Calculation of the Euclidean distance: The Euclidean distance between each evaluation object and the positive and negative ideal solutions was calculated using Eqs. (18) and (19): Calculate the grey correlation degree: Based on the definition of the reference sequence and comparison sequence in the calculation of grey correlation coefficient, the positive and negative ideal solutions are set as the reference sequence, and the weighted value of each sample index is set as the comparison sequence. The grey correlation coefficient matrix is then calculated following Eqs. (20) and (21). The average the grey correlation coefficient of each sample is used to obtain grey correlation degrees Dimensionless processing: The Euclidean distance and grey correlation are dimensionless and can be calculated using Eqs. (22) and (23), respectively: Calculation of comprehensive relative closeness: The Euclidean distance and grey correlation after dimensionless processing were combined to calculate the comprehensive relative closeness. The larger the values of Threshold division of comprehensive relative closeness: First, the K-means clustering algorithm is used to divide the comprehensive relative closeness into 10 classes. Thereafter, using the Delphi method, these 10 classes are divided into four levels to complete the threshold division of comprehensive relative closeness (Yin et al., 2020).


Results and discussion
Constant weight model
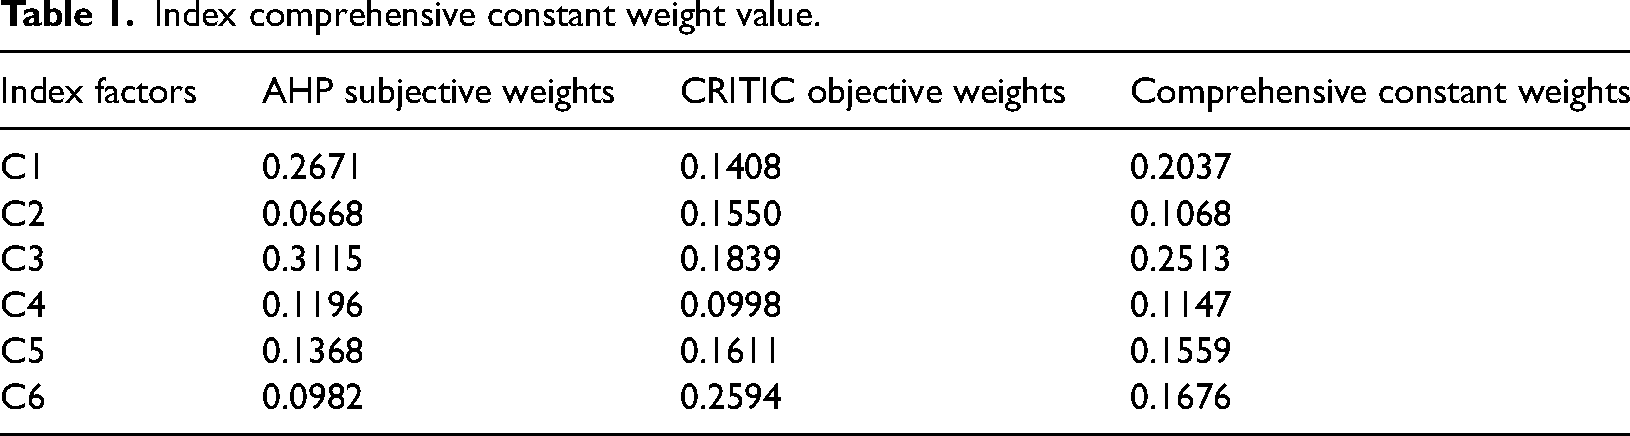
The AHP and CRITIC methods were used to determine the subjective and objective weights, yielding the results of the comprehensive constant weights shown in Table 1. Due to the different starting points and perspectives in assigning these weights, the subjective and objective weights derived from the same indicators may exhibit significant discrepancies. This confirms the lack of rigor in unilateral weighting methods, indicating that a comprehensive weighting approach is more accurate and effective.
Index comprehensive constant weight value.
Variable weight model
The classification threshold values for the water-barrier thickness determined using the fuzzy C-means clustering algorithm was
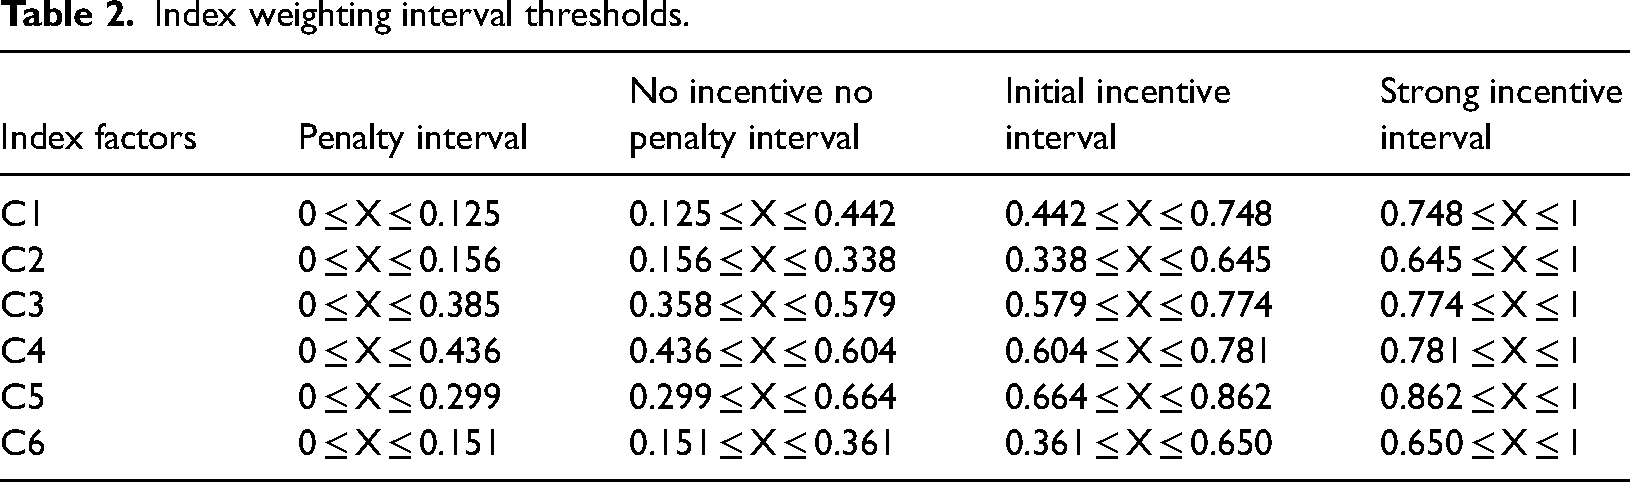
Similarly, the thresholds for the weighted intervals of aquifer water pressure, aquifer water richness, floor damage depth, brittle-plastic rock thickness ratio, and tectonic complexity can be calculated using the same method. The “incentive” and “penalty” of the weights were determined, and the results were shown in Table 2.
Index weighting interval thresholds.
When solving the parameters of the variable-weighting model, borehole ST704 was selected as the computational unit for parameter solving. The normalized values of aquifer water pressure, aquifer water richness, water-barrier thickness, floor damage depth, brittle-plastic rock thickness ratio, and tectonic complexity were
Taking borehole ST101 as an example, its normalized index value was
Variable weighting of partial borehole indexes.
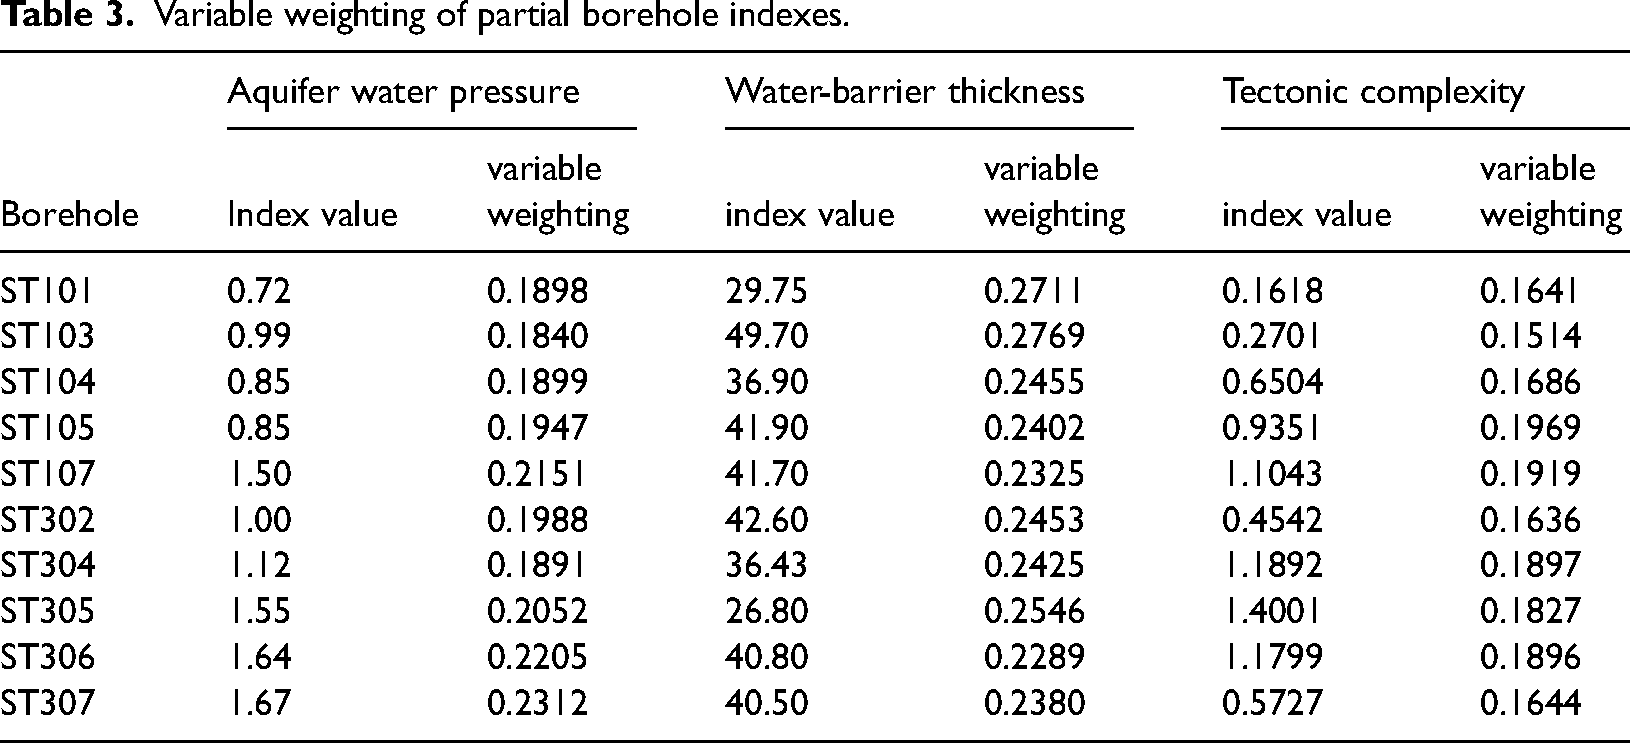
Faults have a significant control effect on the floor water inrush, and there is often an inseparable relationship between them. In the table, the normalized value of the indicator
WRSR method
The non-integer method was applied to rank the main control indicators of the boreholes. Subsequently, the weighted value of each borehole was calculated by combining the variable weights. The data was then arranged in ascending order to obtain the cumulative frequency, which was converted into a percentage. The Table of Comparison between Percentage and Probability Units (Yao et al., 2022) was consulted to derive the corresponding probit value, and some of the results were shown in Table 4.
Partial borehole WRSR and probit control values.
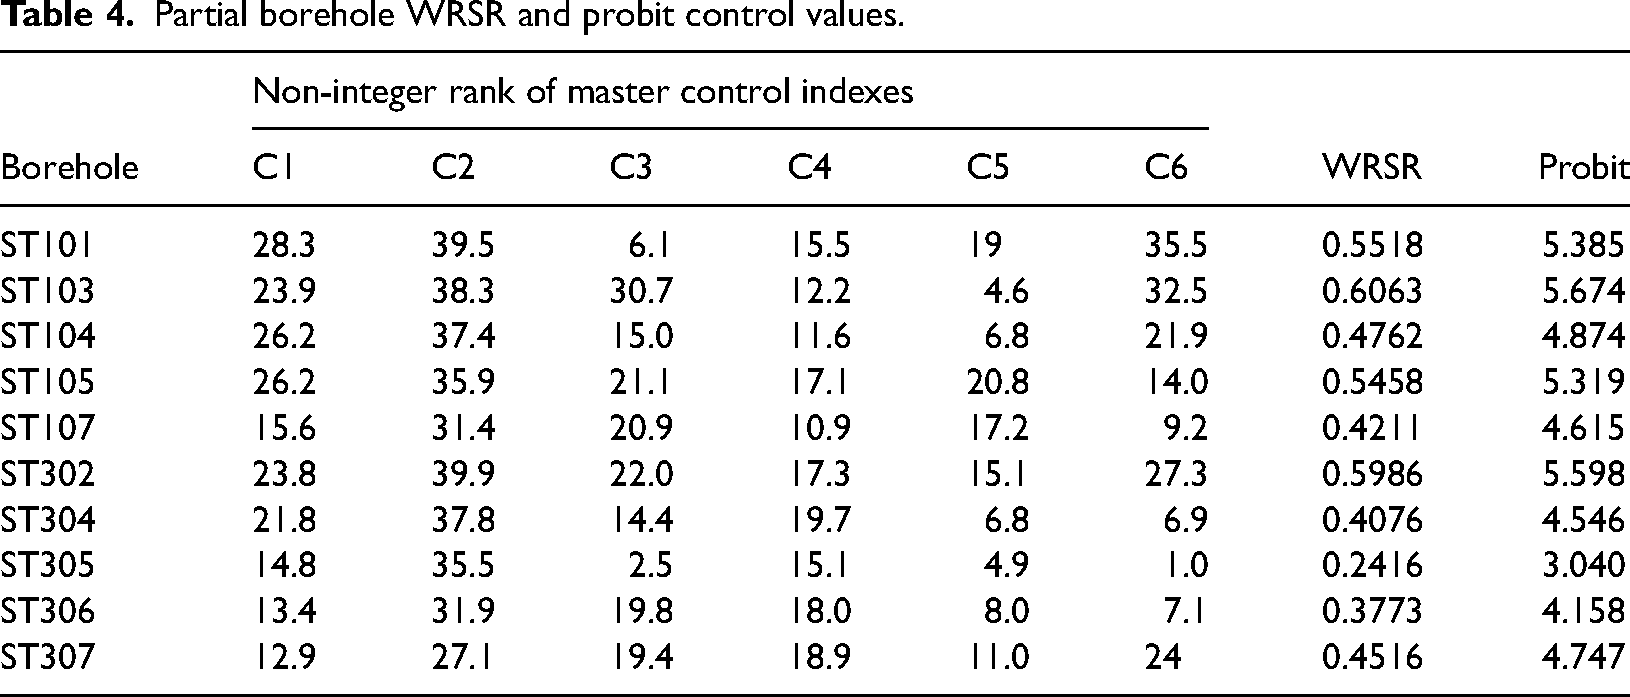
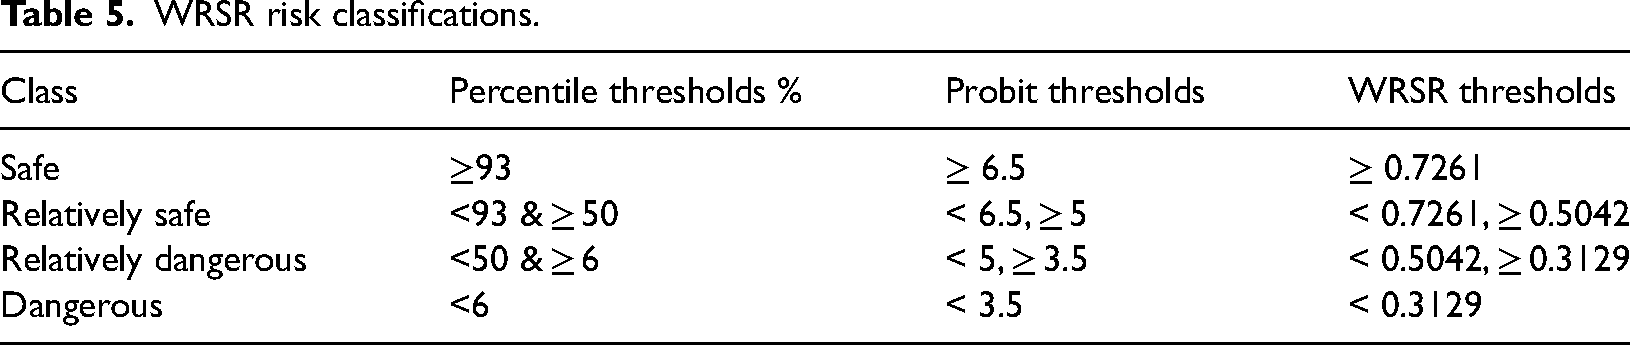
The regression equation established with the probit value as the independent variable and the WRSR value as the dependent variable was
WRSR risk classifications.
Grey-TOPSIS method
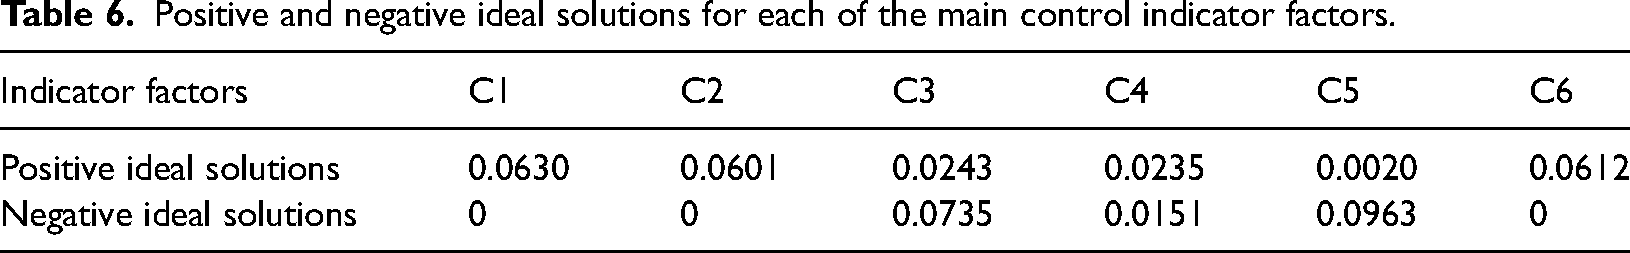
Establishment of a weighted normalization matrix based on variable weight model calculations: The positive and negative ideal solutions for each borehole indicator data according to Eqs. (16) and (17) are presented in Table 6. Subsequently, the Euclidean distance and grey correlation coefficient of the indicator data based on the positive and negative ideal solutions were determined using Eqs. (18) and (19) and Eqs. (20) and (21), respectively, and are made dimensionless using Eqs. (22) and (23). Then, according to Eqs. (24) and (25), the Euclidean distance and grey correlation of the dimensionless data were combined to obtain the comprehensive relative closeness, and the results are presented in Table 7.
Positive and negative ideal solutions for each of the main control indicator factors.
Calculated results of Grey-TOPSIS method evaluation for partial boreholes.
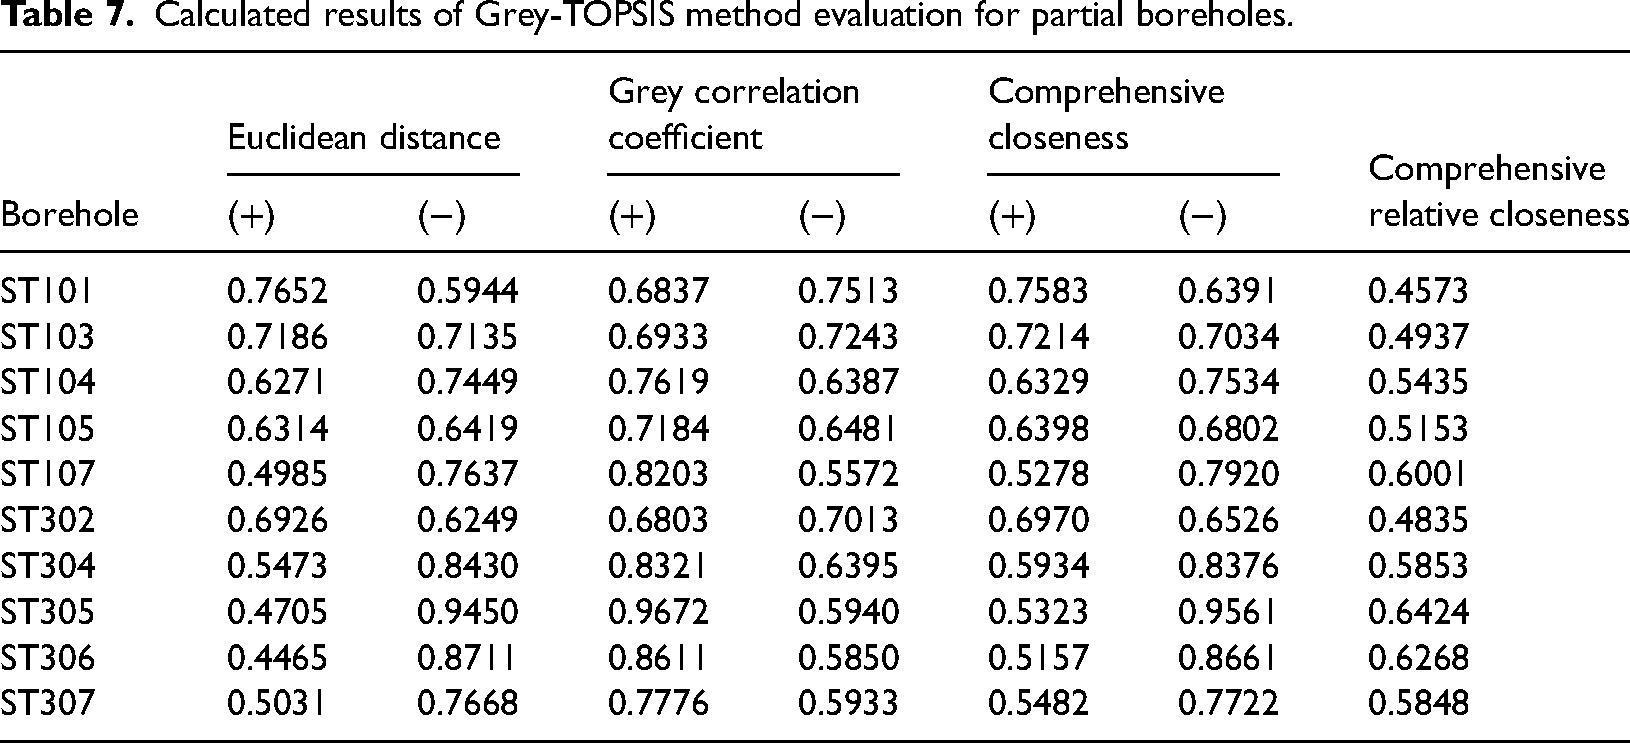
The comprehensive relative closeness integrated the Euclidean distance and grey correlation degree, thereby addressing issues related to the disorder caused by equidistance. This can be considered as the risk coefficient of water inrush in the evaluation, where a higher value indicates a greater risk of water inrush from the floor.
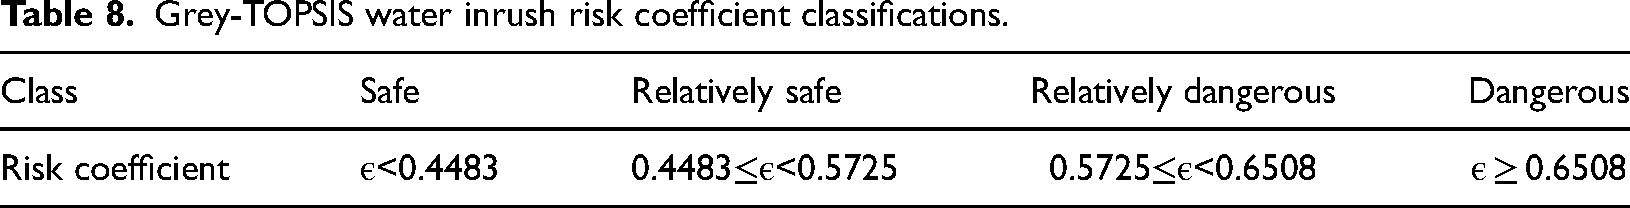
Based on the actual situation, the K-means clustering algorithm combined with the Delphi method was used to classify the water inrush risk coefficient, as listed in Table 8.
Grey-TOPSIS water inrush risk coefficient classifications.
Using Surfer software, the Kriging interpolation was employed to map the evaluation zones based on the classification thresholds established by the two different methods, as depicted in Figure 4.
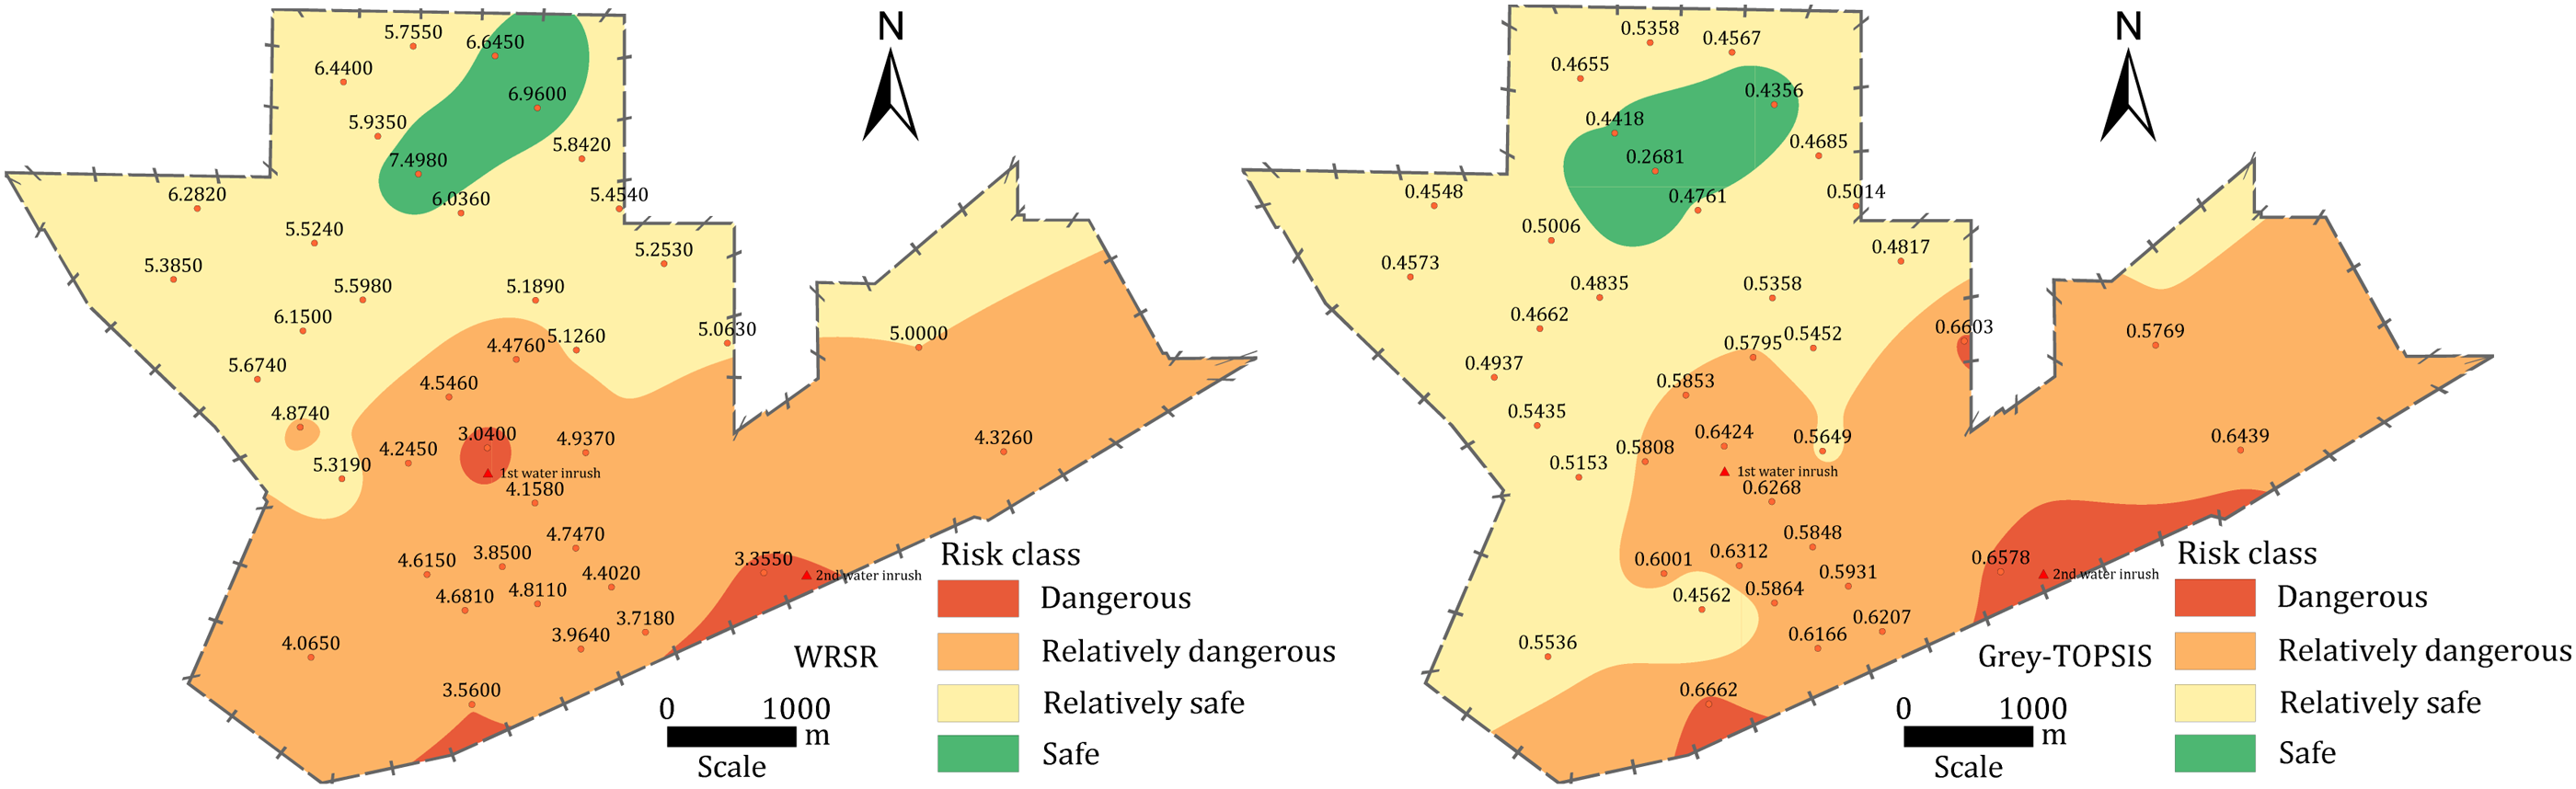
Evaluation partition diagrams for the two mathematical methods.
From the viewpoint of the criteria for dividing the area, the higher the probit value in the WRSR evaluation zoning map, the lower the evaluation risk level, and the safer the area was classified as. The higher the comprehensive relative closeness in the Grey-TOPSIS evaluation zoning map, the higher the evaluation risk level, and the more dangerous the area was classified as. The difference in the evaluation methods presented two different evaluation criteria. However, from the viewpoint of the division area, the danger level of the two evaluation methods tended to be the same, and both gradually increased from north to south. The safe area was concentrated in the northern part of the wellfield, the dangerous area was concentrated in the southern boundary, with both occupying relatively small areas; the rest of the relatively safe and dangerous areas accounted for most of the wellfield area. Therefore, during the actual extraction process, focused preventive measures should be implemented in the southern areas of the wellfield. Key detection should be conducted on potential water-conducting faults or weak zones using methods such as geophysical exploration and drilling. Additionally, continuous monitoring of water level changes in the limestone aquifer is essential. Prompt resolution of any identified issues is necessary to mitigate the risk of water inrush in these areas.
In addition to the analysis of the overall trend presented by the two evaluation methods, the difference between the two methods in terms of zoning details should also be noted. In the evaluation zoning map of the WRSR method, a small part of the center of the wellfield was classified as a hazardous area, and the classification level was differed from the overall trend presented by the two methods. Notably, one of the two past water inrush incidents occurred within this dangerous zone identified by the WRSR. On-site analysis revealed that the cause of the water inrush was a fault that connected to the aquifer during the mining process. The WRSR method, utilizing a variable weight model in conjunction with the main control indicators, effectively predicted this water inrush, receiving strong validation from the actual events. The second water inrush occurred in the southern part of the mining area, which also falls within the dangerous zones delineated by both evaluation methods. The Grey-TOPSIS method similarly yielded satisfactory validation results, reflecting a relatively accurate assessment. In subsequent mining operations, the integration of both evaluation methods is anticipated to facilitate targeted prevention and control measures for potential water inrush risk areas, thereby reducing the probability of water inrush accidents.
Comparison with the water inrush coefficient method
The water inrush coefficient of each borehole was calculated using Eq. (26) (Cao et al., 2022). According to the actual situation of the wellfield, the water-barrier thickness in the wellfield was <60 m. Furthermore, based on the thin plate theory and the statistical law of the number of water inrush coefficients (Li and Li, 2022), the regional risk level was divided by a critical value of 0.06 MPa/m to obtain the evaluation zoning map presented in Figure 5.
Water inrush coefficient method evaluation zoning map.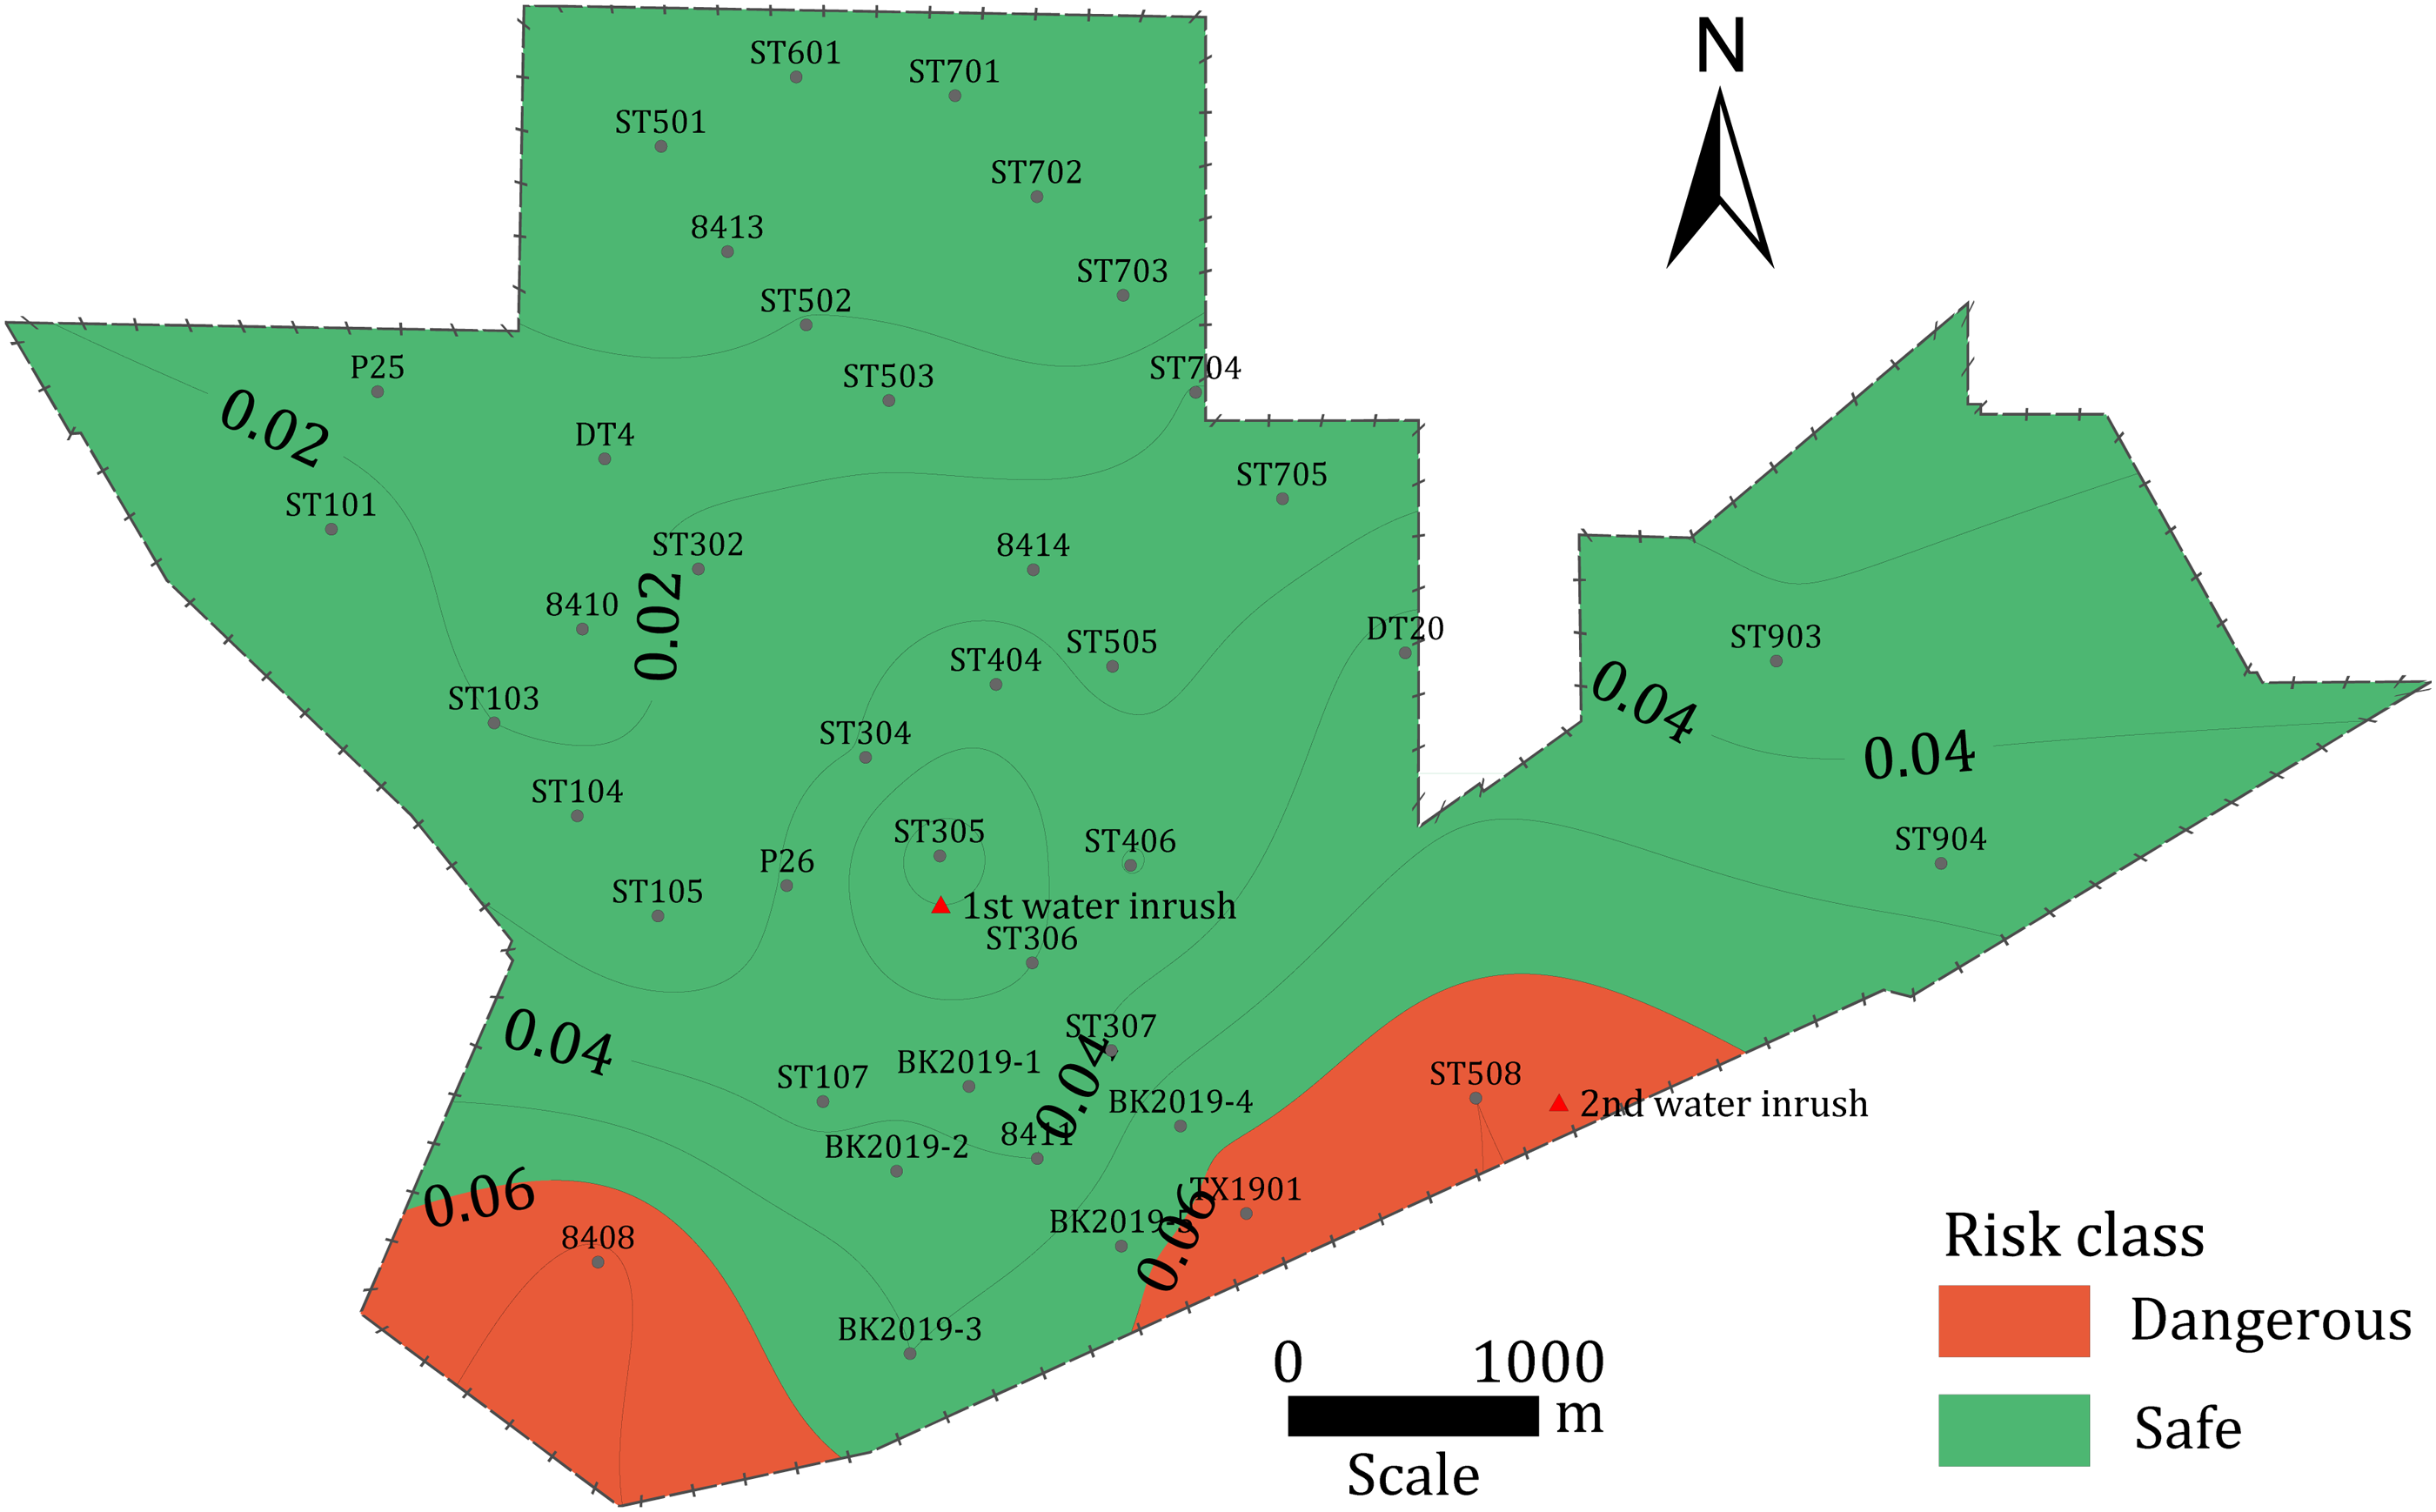

Comparing Figures 4 and 5, the three methods had certain similarities in the trend of risk distribution. However, in the classification of risk areas, the water inrush coefficient method roughly divided the wellfield into safe and dangerous areas. This classification was simple and not comprehensive enough, which was obviously not as detailed as the WRSR and Grey-TOPSIS methods in the classification of areas. From the actual water inrush situation, a water inrush was located in a safe area divided by the water inrush coefficient method, which was less than the critical value of 0.06 MPa/m. The result was inconsistent with the actual situation. This is because the water inrush coefficient method only involves the aquifer water pressure and water-barrier thickness; it cannot recognize the water inrush risk caused by other index factors and has certain limitations. However, the WRSR method and the Grey-TOPSIS method introduced other index factors, including aquifer water pressure and water-barrier thickness, into the selection of index factors. This augmentation of information not only enhanced the analytical depth but also reduced the adverse effects associated with the absolute control of the water inrush coefficient threshold. In the case of the Sitai wellfield, the two new methods extend the applicability of the water inrush coefficient method, address the limitations of the evaluation results obtained by the water inrush coefficient method, and enhance the accuracy and rationality of the assessment outcomes.
Conclusions
To address the nonlinear complexity of factors influencing floor water inrush in coal seams, this study employed the WRSR and the Grey-TOPSIS methods, adapted from other fields, for application in deep coal extraction. Furthermore, in terms of weight assignment, the study innovatively integrated a variable weight model, which enhanced the precision of the evaluation. As a result, novel evaluation models for predicting floor water inrush based on variable weight theory were developed.
Considering the set of evaluation factors comprehensively, including aquifer performance, water barrier performance, and geological structure, six index factors, namely aquifer water pressure, aquifer water richness, water-barrier thickness, floor damage depth, brittle-plastic rock thickness ratio, and tectonic complexity, were selected to establish a system of the main control indices for evaluation. A variable weight model centered on the idea of variable weight theory was established based on the comprehensive constant weights established by the AHP and CRITIC methods. During the evaluation process using the variable weight vector, an “incentive” and “penalty” mechanism was implemented to adjust the weights of the evaluation indicators. This approach overcame the limitations of constant weight models, which fail to capture the control effects under varying states of multiple indicators. A comparative analysis between the results of the variable weight model and the constant weight model revealed that the variable weight model provided superior weight assignment effects, aligning more closely with actual conditions. Combining the WRSR and Grey-TOPSIS methods with the variable weight model, an evaluation model of floor water inrush risk was established, and the two mathematical models were visually represented using the evaluation zoning diagram. Combined with the water inrush coefficient method, through the comparison of the actual water inrush situation and the evaluation partition map, it was found that the two mathematical methods were more accurate, and the evaluation model results were more effective, providing valuable insights for research on risk assessment methods for floor water inrush.
Footnotes
Acknowledgements
The authors acknowledge the financial support from the National Natural Science Foundation of China (42302199), Natural Science Foundation of Hebei Province (D2020402013&D2022402040), Hunan Provincial Key Research and Development Program (2022SK2070), and Science Research Project of Hebei Education Department (CXY2023010).
Declaration of conflicting interests
The authors declared no potential conflicts of interest with respect to the research, authorship, and/or publication of this article.
Funding
The authors disclosed receipt of the following financial support for the research, authorship, and/or publication of this article: This work was supported by the National Natural Science Foundation of China, Natural Science Foundation of Hebei Province, Department of Science and Technology of Hunan Province, Department of Education of Hebei Province, (grant number 42302199, D2020402013, D2022402040, 2022SK2070, CXY2023010).