
Abstract
To address a bi-objective optimization configuration problem of battery energy storage system (BESS) in distributed energy system (DES) considering energy loss and economy, a perturbation and observation approach (P&O) is proposed in this article. First, in a DES, the configuration model of BESS is established. Then, a novel way is designed that transforming a bi-objective optimization problem into a single objective optimization problem with variable conditions. And the P&O process of the proposed method is presented. Finally, in a simulation case, compared with a single optimization objective of energy loss or economy, the P&O method improves 5.71-fold or 2.94-fold in each direction, respectively and effectively balances the contradiction between them. In addition, with the efficiency and electricity cost of BESS increasing, the rated capacity of BESS changes by approximately 10%. And the location is a key factor affecting the configuration scheme of BESS in DES.
Keywords
Introduction
Motivation
The energy utilization rate and economy of DES have become two key factors restricting further development of distributed energy (Meng et al., 2023). Battery energy storage system (BESS) has played a crucial role in optimizing energy utilization and economic performance and is widely applied in the distributed energy system (DES) (Fan et al., 2021; Li et al., 2023). However, between them, the potential conflicts often lead to significant discrepancies in BESS capacity configuration outcomes (Mehrjerdi, 2019). Therefore, a capacity configuration method that balances the contradictions has become a core issue for the further application of BESS.
Literature review
About the issue of BESS capacity configuration, many research and discussions have conducted by extensive experts (Awadallah and Venkatesh, 2019; Sheibani et al., 2018). As a relatively novel technology in Turkey, the higher unit generation costs of BESS resulted in its lower scores in sociopolitical and sustainability indices (TorulYürek et al., 2024). The findings have indicated that BESS capacity configuration is a complex optimization problem with numerous constraints (Alharbi and Bhattacharya, 2018; Khastieva et al., 2018). For instance, an energy storage system planning method is established and the optimal capacity and dispatch strategy for BESS is addressed by using particle swarm optimization (PSO) (Hemmati et al., 2017). A bi-level planning method for BESS is proposed that aims to minimize system costs, renewable energy consumption and load shedding reduction. This method describes the potential risks of BESS planning schemes through the operational boundaries of BESS defined by boundary constraint techniques (Yang et al., 2023). As the demand for electricity services increases, the capacity configuration schemes of BESS need to balance multiple optimization objectives (Ma et al., 2024b).
In existing research, a conventional approach to solving a multiobjective optimization problem (MOP) involves the aggregation of multiple optimization objective functions through summation. By a detailed division of the profits, a method for accounting energy storage profits is proposed. Using this approach, various optimization objectives have been converted into equivalent benefits for the BESS. Then, a single objective optimization problem (SOP) is conducted for the planning of the BESS (Yan et al., 2022). A weighted sum method is used to transform MOP into SOP. The moth search optimization and PSO are applied to complete the capacity configuration of BESS, respectively (Premkumar et al., 2023; Thokar et al., 2021). The multiple optimization objective functions are considered simultaneously, including BESS costs and lifespan, wind turbine availability, expected unsupplied energy, load hour losses and wind power curtailment. The analytic hierarchy process is proposed to assign weights to different optimization objective functions. Then, the optimal available scheme for the BESS is determined (Paul et al., 2019). In the optimal size and type of distributed energy resources, their economic and environmental are considered. Then, a Pareto front is constructed by the ∊-constraint method (Terada et al., 2024). The different solutions are successfully identified along the Pareto front. The advantage of these methods is their effectiveness in transforming MOP into a solvable SOP. However, the principle of assigning weights among multiple optimization objective functions is immature and can significantly impact the configuration results of BESS.
As another approach to solving MOP, swarm intelligence algorithms are proposed and applied to obtain a series of nondominated solutions under multiple optimization objective functions. Subsequently, the optimal planning result will be recommended (Grisales et al., 2017; Peng et al., 2021; Priya et al., 2023; Su et al., 2023). Some studies discuss a comprehensive understanding of the tradeoffs among different objective functions. Then, a more balanced and informed decision-making process in the configuration of BESS. For example, a bi-level multiobjective optimization model is introduced for the planning of DES. The butterfly particle swarm algorithm is utilized to assess the configuration capacity and locations of DES for reducing the total power loss and emission costs (Wankhede et al., 2022). The multiobjective genetic algorithm and cuckoo search optimization methods are been applied to solve the configuration of various hybrid renewable energy system. Then, as a key finding, the importance of BESS efficiency is emphasized for overall system performance (Megaptche et al., 2024). To address the issue of premature convergence associated with traditional Fick's law algorithms, a dynamic lens imaging learning strategy is proposed based on oppositional learning. Then, to reduce power loss, smooth voltage distribution and enhance supply reliability, the configuration scale of BESS is optimized (Alanazi et al., 2023). An adaptive multiobjective crow search algorithm is proposed to address the tradeoff between cost and sustainability in an optimization problem. This method has significantly lowered the total cost of the energy community and enhanced the sustainability index and promoted the sustainable development of smart grids and renewable energy sources (Afzali et al., 2023). In an islanded microgrid, the optimal capacity of the storage system is developed by an immunity-based algorithm. Then, it is discussed that exploring Pareto optimal solutions in this MOP (Hong et al., 2018). By minimizing energy costs and the probability of supply shortage, it is presented that long-term capacity planning of an off-grid microgrid with wind turbines, photovoltaics, battery packs, and diesel generators (Bukar et al., 2020). An improved fuzzy Nondominated Sorting Genetic Algorithm II (NSGA-II) method is employed to optimize the deployment of solar photovoltaic systems, BESS, and distributed static compensators, enhancing power quality and supply reliability (Ghatak et al., 2018). In a planning of DES, a long-term mixed-integer nonlinear programming multiobjective stochastic optimization planning model with three long-term objectives: total cost, power loss, and voltage deviation. Then, a hybrid approach combining NSGAII and multiobjective PSO are an improved sine-cosine algorithm are respectively employed (Ahmadi et al., 2022; Ba-swaimi et al., 2024). In additional, to optimize the allocation scheme of DGs and BESSs faster, an innovative method, parallel multiobjective multivariate optimization, is proposed to solve the dual objective optimization problem of voltage violation and operating cost. Using this parallel approach, the optimization process has been significantly accelerated (Behbahani et al., 2024). The configuration studies of BESS capacity are summarized as shown in Table 1.
Relevant research review.
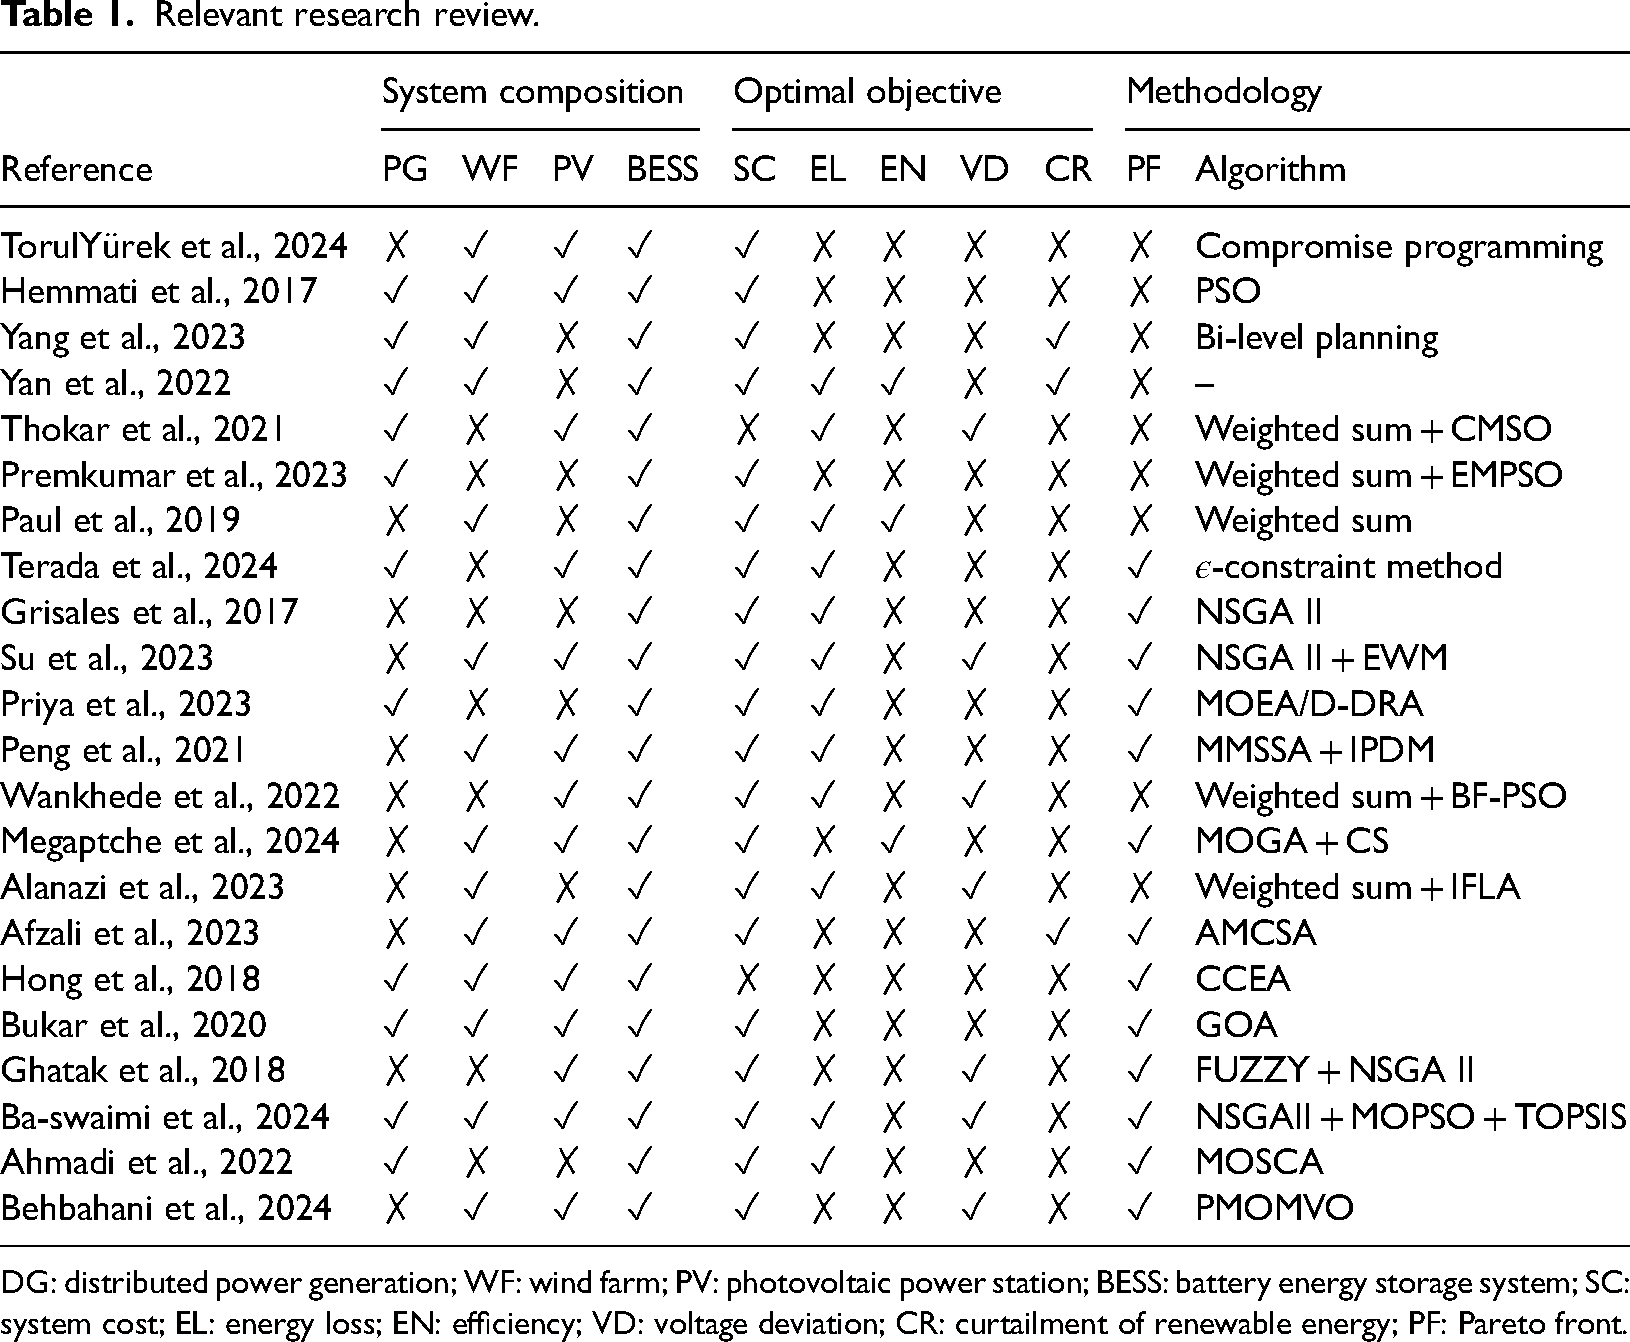
DG: distributed power generation; WF: wind farm; PV: photovoltaic power station; BESS: battery energy storage system; SC: system cost; EL: energy loss; EN: efficiency; VD: voltage deviation; CR: curtailment of renewable energy; PF: Pareto front.
Research gap
Based on the summary in Table 1, the research gaps are further analyzed as follows.
In some studies of the BESS configuration (Paul et al., 2019; Premkumar et al., 2023; Thokar et al., 2021), the MOP is transformed into an SOP by weighted summation. However, the dimensional differences of many optimization objective functions are ignored and the influence of each objective function weight on the optimization results is rarely noticed.
Numerous studies have adopted swarm intelligence optimization algorithms to address the capacity problem of BESS in the MOP (Grisales et al., 2017; Peng et al., 2021; Priya et al., 2023; Su et al., 2023). Then, the Pareto front can been obtained by these methods. However, the Pareto front is a feasible solution set composed of many nondominated solutions. Then, some evaluation methods are applied to obtain a unique recommended solution in above solution set. But this unique result is selected from a limited number of feasible solutions by these evaluation methods. This may cause some bias and the morphology characteristics of Pareto front are missing.
It is notable that there is a certain degree of randomness in the iterations process of swarm intelligence optimization algorithm. The drawing of Pareto front is lacks controllability.
Based on the literature review, system cost and energy consumption are focused as two common optimization indicators in the capacity planning of BESS. However, in terms of energy consumption, there is relatively little research on the overall energy consumption including the abandonment of new energy source, BESS losses, and line losses.
Contributions and paper organization
In the DES, energy utilization rate and operational cost are paramount. Additionally, a controllable Pareto front consisted of many nondominated solutions and selecting a reasonable recommended solution is key to balancing the contradiction between energy utilization rate and operational cost in the DES. The contributions of this study is concluded as follows.
The energy utilization and operational costs of the DES are simultaneously considered in this article. The abandonment of renewable energy and the idleness of BESS are added in the calculation of energy loss. The investment, maintenance, and recycling costs of BESS are incorporated into the application cost. Then, a configuration model for the BESS has been established. This article has proposed a transform approach that the bi-objective optimization problem (BiOP) of the DES with BESS is changed into an SOP by specific conditions. By introducing a controllable conditional variable, the descriptiveness of Pareto front is enhanced in BiOP. It will be beneficial for understanding the Pareto frontier features and selecting the recommended solution. The article has proposed a perturbation and observation approach (P&O) to analyze the variation of different nondominated solutions. Then, a best solution selection method is established by the change rates of the nondominated solution on the Pareto front. Thus, a reasonable configuration of the BESS has been achieved to the balance between energy utilization rate and operational cost in the DES. In a BiOP, a new route of selecting recommended solution has been provided.
The article is structured as follows. In the BESS configuration model in distribution energy system section, a configuration model of BESS in DES has been established. The bi-objective optimization method based on perturbation and observation section represents an optimization method based on the P&O process of Pareto front. In the simulation case study and discussion section, using the proposed method, the configuration effects of the BESS are discussed. The conclusions and future researches have been summarized in the conclusion section.
BESS configuration model in distribution energy system
Operation constraints
Figure 1 represents a DES with the BESS under the IEEE 33 bus distribution network, including two photovoltaic power station (PV), two wind farms (WF), a distributed power generation (DG), and a BESS. While the distributed power source and storage system ensure the energy balance and economic operation of the system, the distributed PV and WF provide green energy for DES. During operation, the DES need to satisfy some fundamental physical laws, such as power balance and energy conservation (Lu et al., 2022; Ma et al., 2024a) as shown in Table 2.
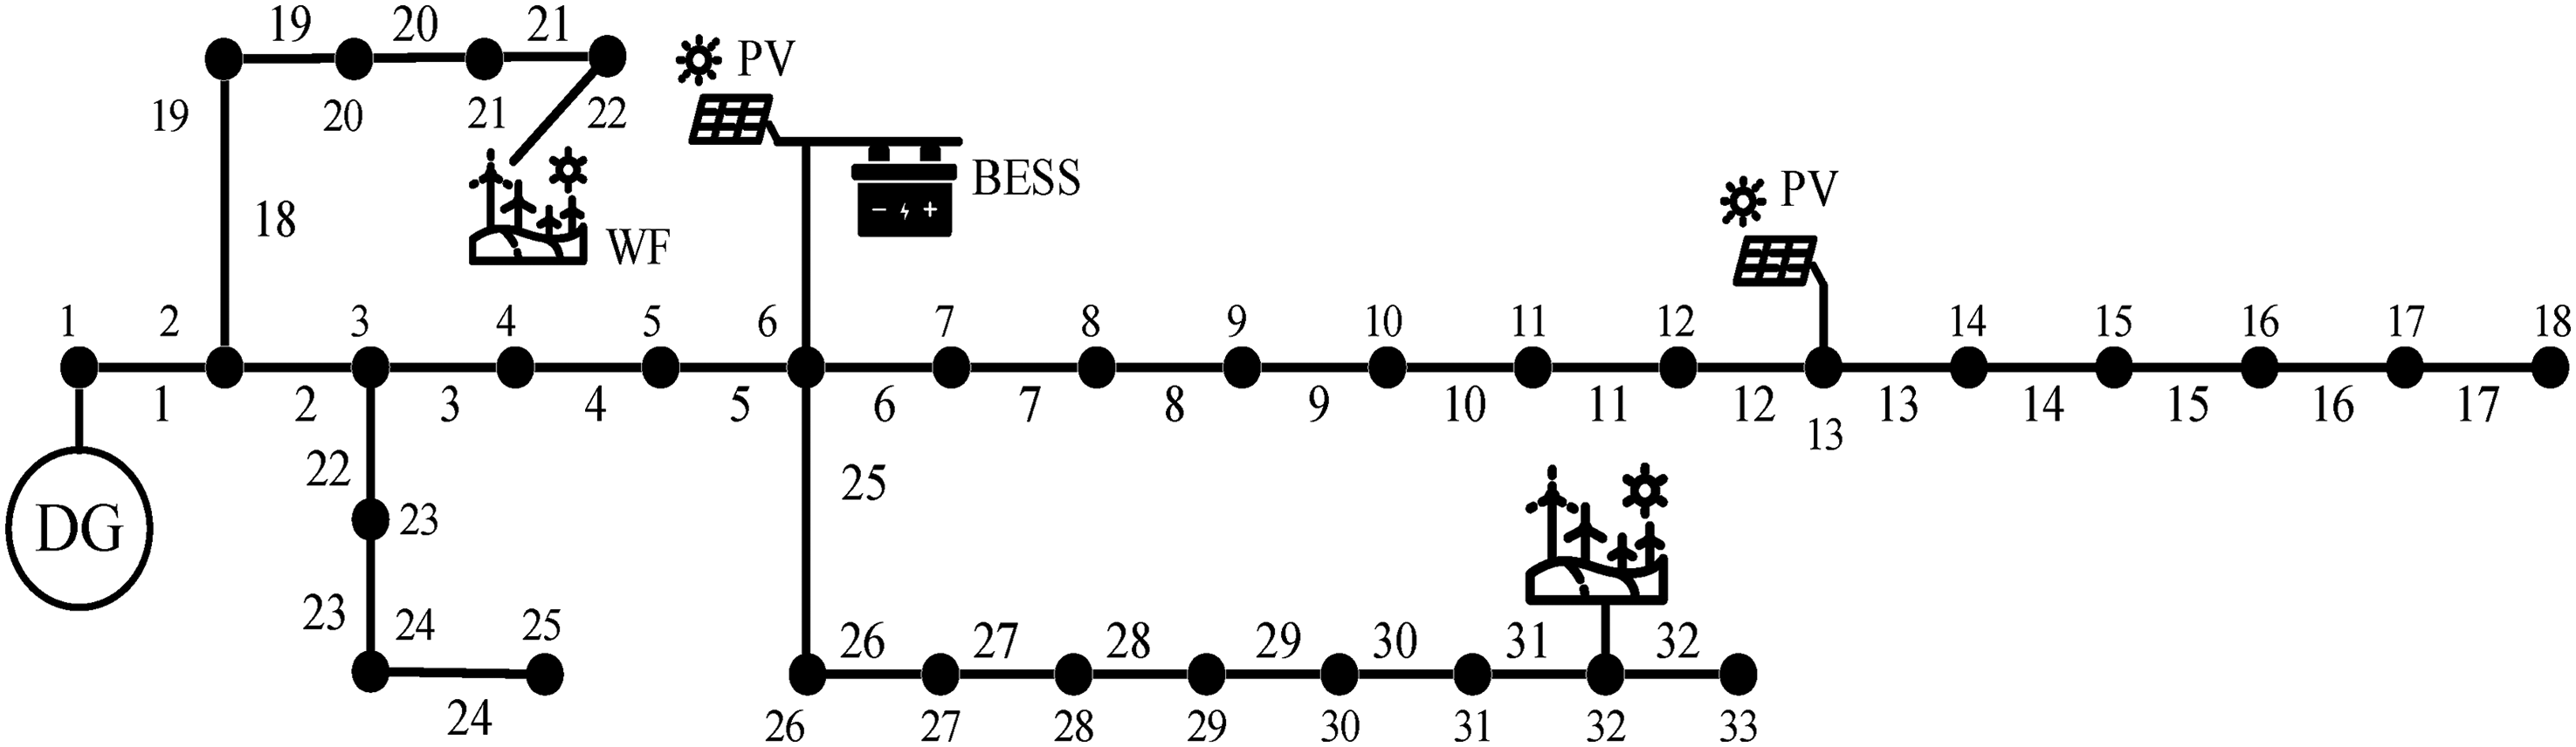
The DES with PV, WF, DG and BESS.
The operational equality constraints for DES with BESS.
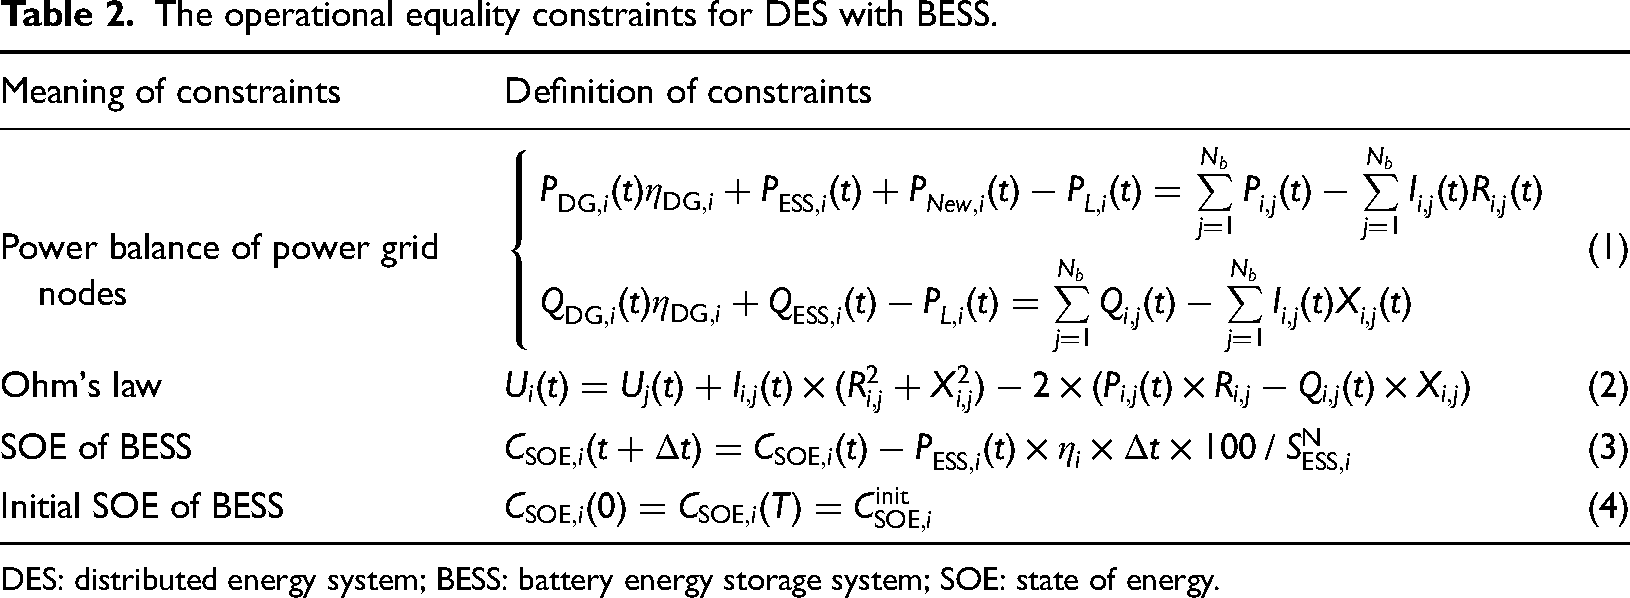
DES: distributed energy system; BESS: battery energy storage system; SOE: state of energy.
During the operation of the DES with the BESS, at time t, each ith node in the electrical network must satisfy the equality constraints of the power balance equation base on the distflow optimal power flow (Ma et al., 2024), as shown in equation (1). Where ηDG,i represents the efficiency of the DG; the active and reactive power of the DG, BESS, and load are described by PDG,i, QDG,i(t), PESS,i(t), QESS,i(t), PL,i(t), and QL,i(t), respectively; the active power of the new energy sources including PV and WF is defined by PNew,i(t). Then, from the jth node and the ith node, the active power, reactive power, branch current, resistance, and reactance are described by Pi,j(t), Qi,j(t), Ii,j(t), Ri,j, and Xi,j, respectively. The number of power node is Nb in a DES. Equation (2) shows Ohm's Law equation of ith node. Where Ui(t) represents the ith node voltage in DES. For BESS, the equation (3) represents the relationship between the state of energy (SOE) and the output power of BESS. The SOE of BESS is the result of the integration of its power over time. And, in each day, the energy balance relationship and the initial SOE is shown as the equation (4). Where the SOE of the BESS is defined by CSOE,i(t). And the efficiency, the rated capacity, the initial SOE, the starting and the ending SOE of the BESS are described by ηi, SN ESS,i, Cinit SOE,i, CSOE,i(0), and CSOE,i(T). The duration and the time interval in a day are Δt and T.
Besides the above equality constraints, some inequality constraints (Ji et al., 2017; Purlu and Turkay, 2022) of the DES with BESS are shown in Table 3. The equation (5) indicates that the actual output power of DG should be less than or equal to its rated power. Where, on the ith power node, the minimum and maximum value of active power of DG are defined by Pmin DG,i and Pmax DG,i, respectively. Then, Qmin DG,i and Qmax DG,i are the minimum and maximum value of reactive power of DG. Equation (6) shows that the actual active power and of new energy sources should be less than or equal to the maximum power at time t. Where Pref New,i(t) is the maximum active power of the new energy sources including PV and WF. For the ith BESS, the ranges of actual active power and SOE are shown as equations (7) and (8). Where PN ESS,i represents the rated power. Then, CL SOE,i and CU SOE,i are the lower and upper value of SOE. The operation rang of the power node voltage and branch current should be limited as defined by equation (9). Where Umin and Umax the minimum and maximum voltage of power node. The maximum branch current is Imax. Then, in the BESS and DG, their actual active and reactive power are restricted by the rated power. This restrictive relationship represents a quadratic inequality relationship shown as equation (10). Where SN DG,i is the rated power of ith DG and ||·||2 represent the two-norm of the vector. Finally, the equation (11) comes from the relaxation process for nonlinear equality constraints, such as the ith node power balance equation P2 i,j (t) + Q2 i,j (t) = Ii,j(t) × Ui(t).
The operational inequality constraints for distribution network with BESS.
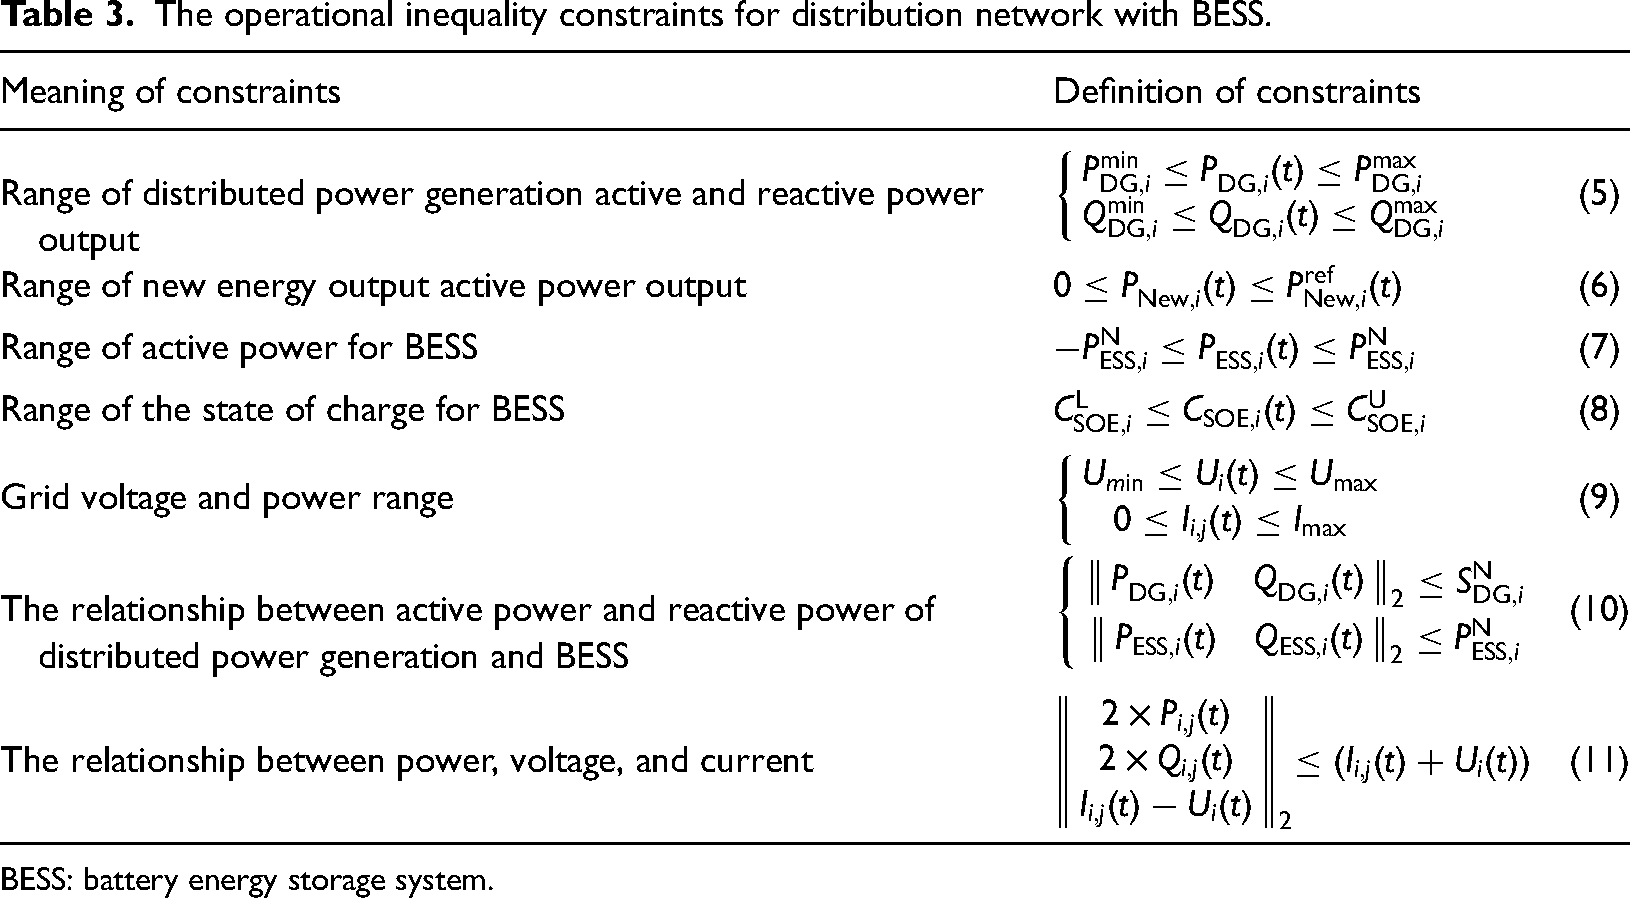
BESS: battery energy storage system.
Objective function
After ensuring compliance with the above operational constraints, the configuring the BESS requires rational calculation based on some specific objective functions. However, these objective functions are often not singular and are difficult to unify. In this article, the optimization objective functions have been considered from two perspectives: energy loss (Wu et al., 2023) and operational cost (Fakih et al., 2023; Tercan et al., 2022).
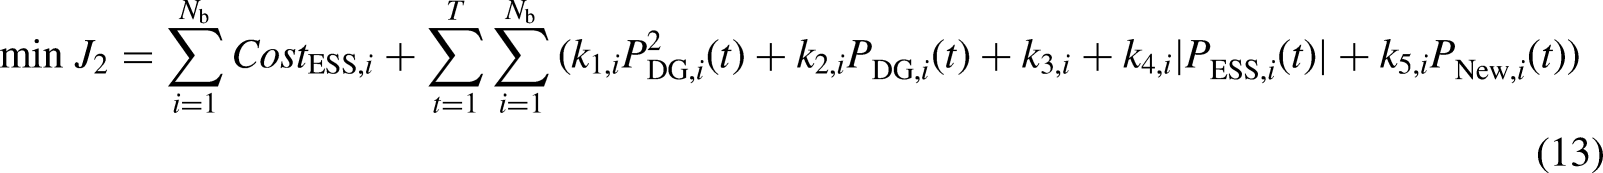
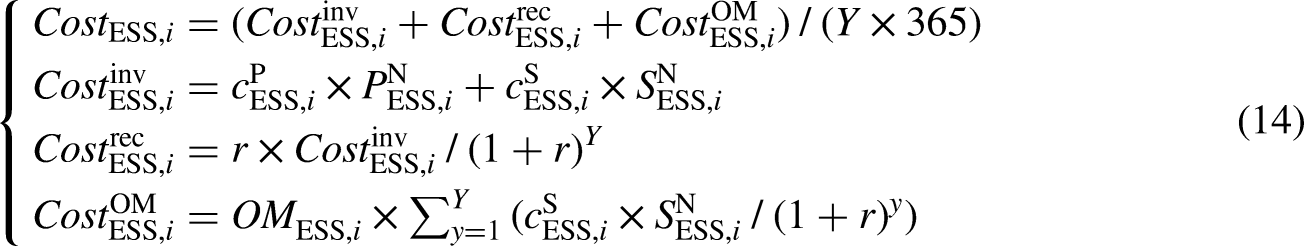
Based on the energy loss in the operation of DES with BESS, the first optimization objective function, J1, is defined as shown in equation (12). In the equation, JA 1 represents energy losses from power lines, JB 1 signifies the energy loss from unused renewable energy which are included in the DES's energy losses, JC 1 denotes the energy loss from DG, and JD 1 indicates the energy loss from BESS. Additionally, to enhance the utilization of BESS, the objective function J1 includes JE 1, the rated power and capacity of the BESS, to avoid resource idleness of BESS. For the DES with BESS, the second optimization objective function, J2 is centered around operational costs as depicted in equation (13). In addition to levelized costs of BESS, there are the power cost of DG, BESS, and new energy source in these operational costs. Additionally, the levelized cost of BESS is CostESS,i including the investment cost Costinv ESS,i, maintenance cost CostOM ESS,i, and recycling cost Costrec ESS,i. The calculation formula is indicated as equation (14). Where the cost coefficients of DG (Wu et al., 2023) are k1,i, k2,i, and k3,i, ¥/kWh2, ¥/kWh, ¥, respectively; the cost per kWh of the ESS and the new energy source (Le et al., 2021) are k4,i and k5,i, ¥/kWh.
where OMESS,i and r represent maintenance cost ratio and annual interest rate, %. Y is the retirement period of BESS. cP ESS,i and cS ESS,i are the power and capacity unit price of ith BESS, ¥/kW and ¥/kWh.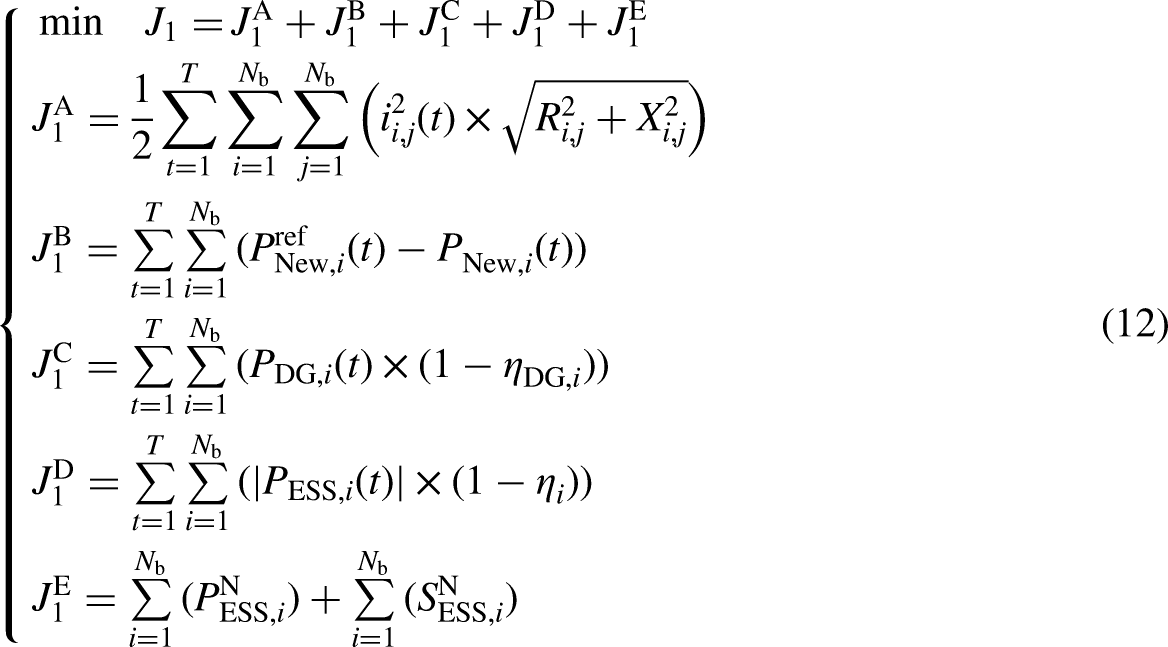
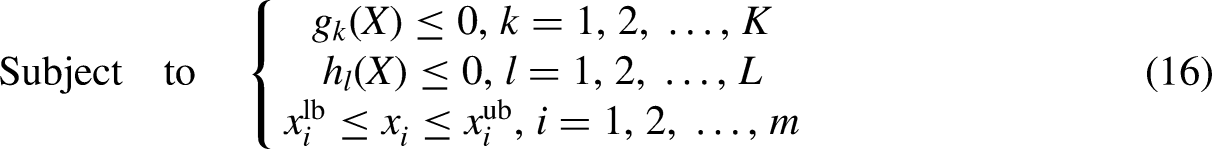
From the above optimization objective functions, it can be seen that both objective functions are quadratic. The physical dimensions of the two optimization objective functions are different. And the two optimization objective functions without dominance are used to evaluate two aspects of DES with BESS. It means that the two optimization objective functions are equivalent in BiOP. Therefore, the planning of BESS can be described as a bi-objective quadratic programming problem with a large number of complex constraints. This type of mathematical optimization problem can be described as shown in equations (15) and (16), where 
Block diagram for describing a bi-objective optimization problem.
Bi-objective optimization method based on perturbation and observation
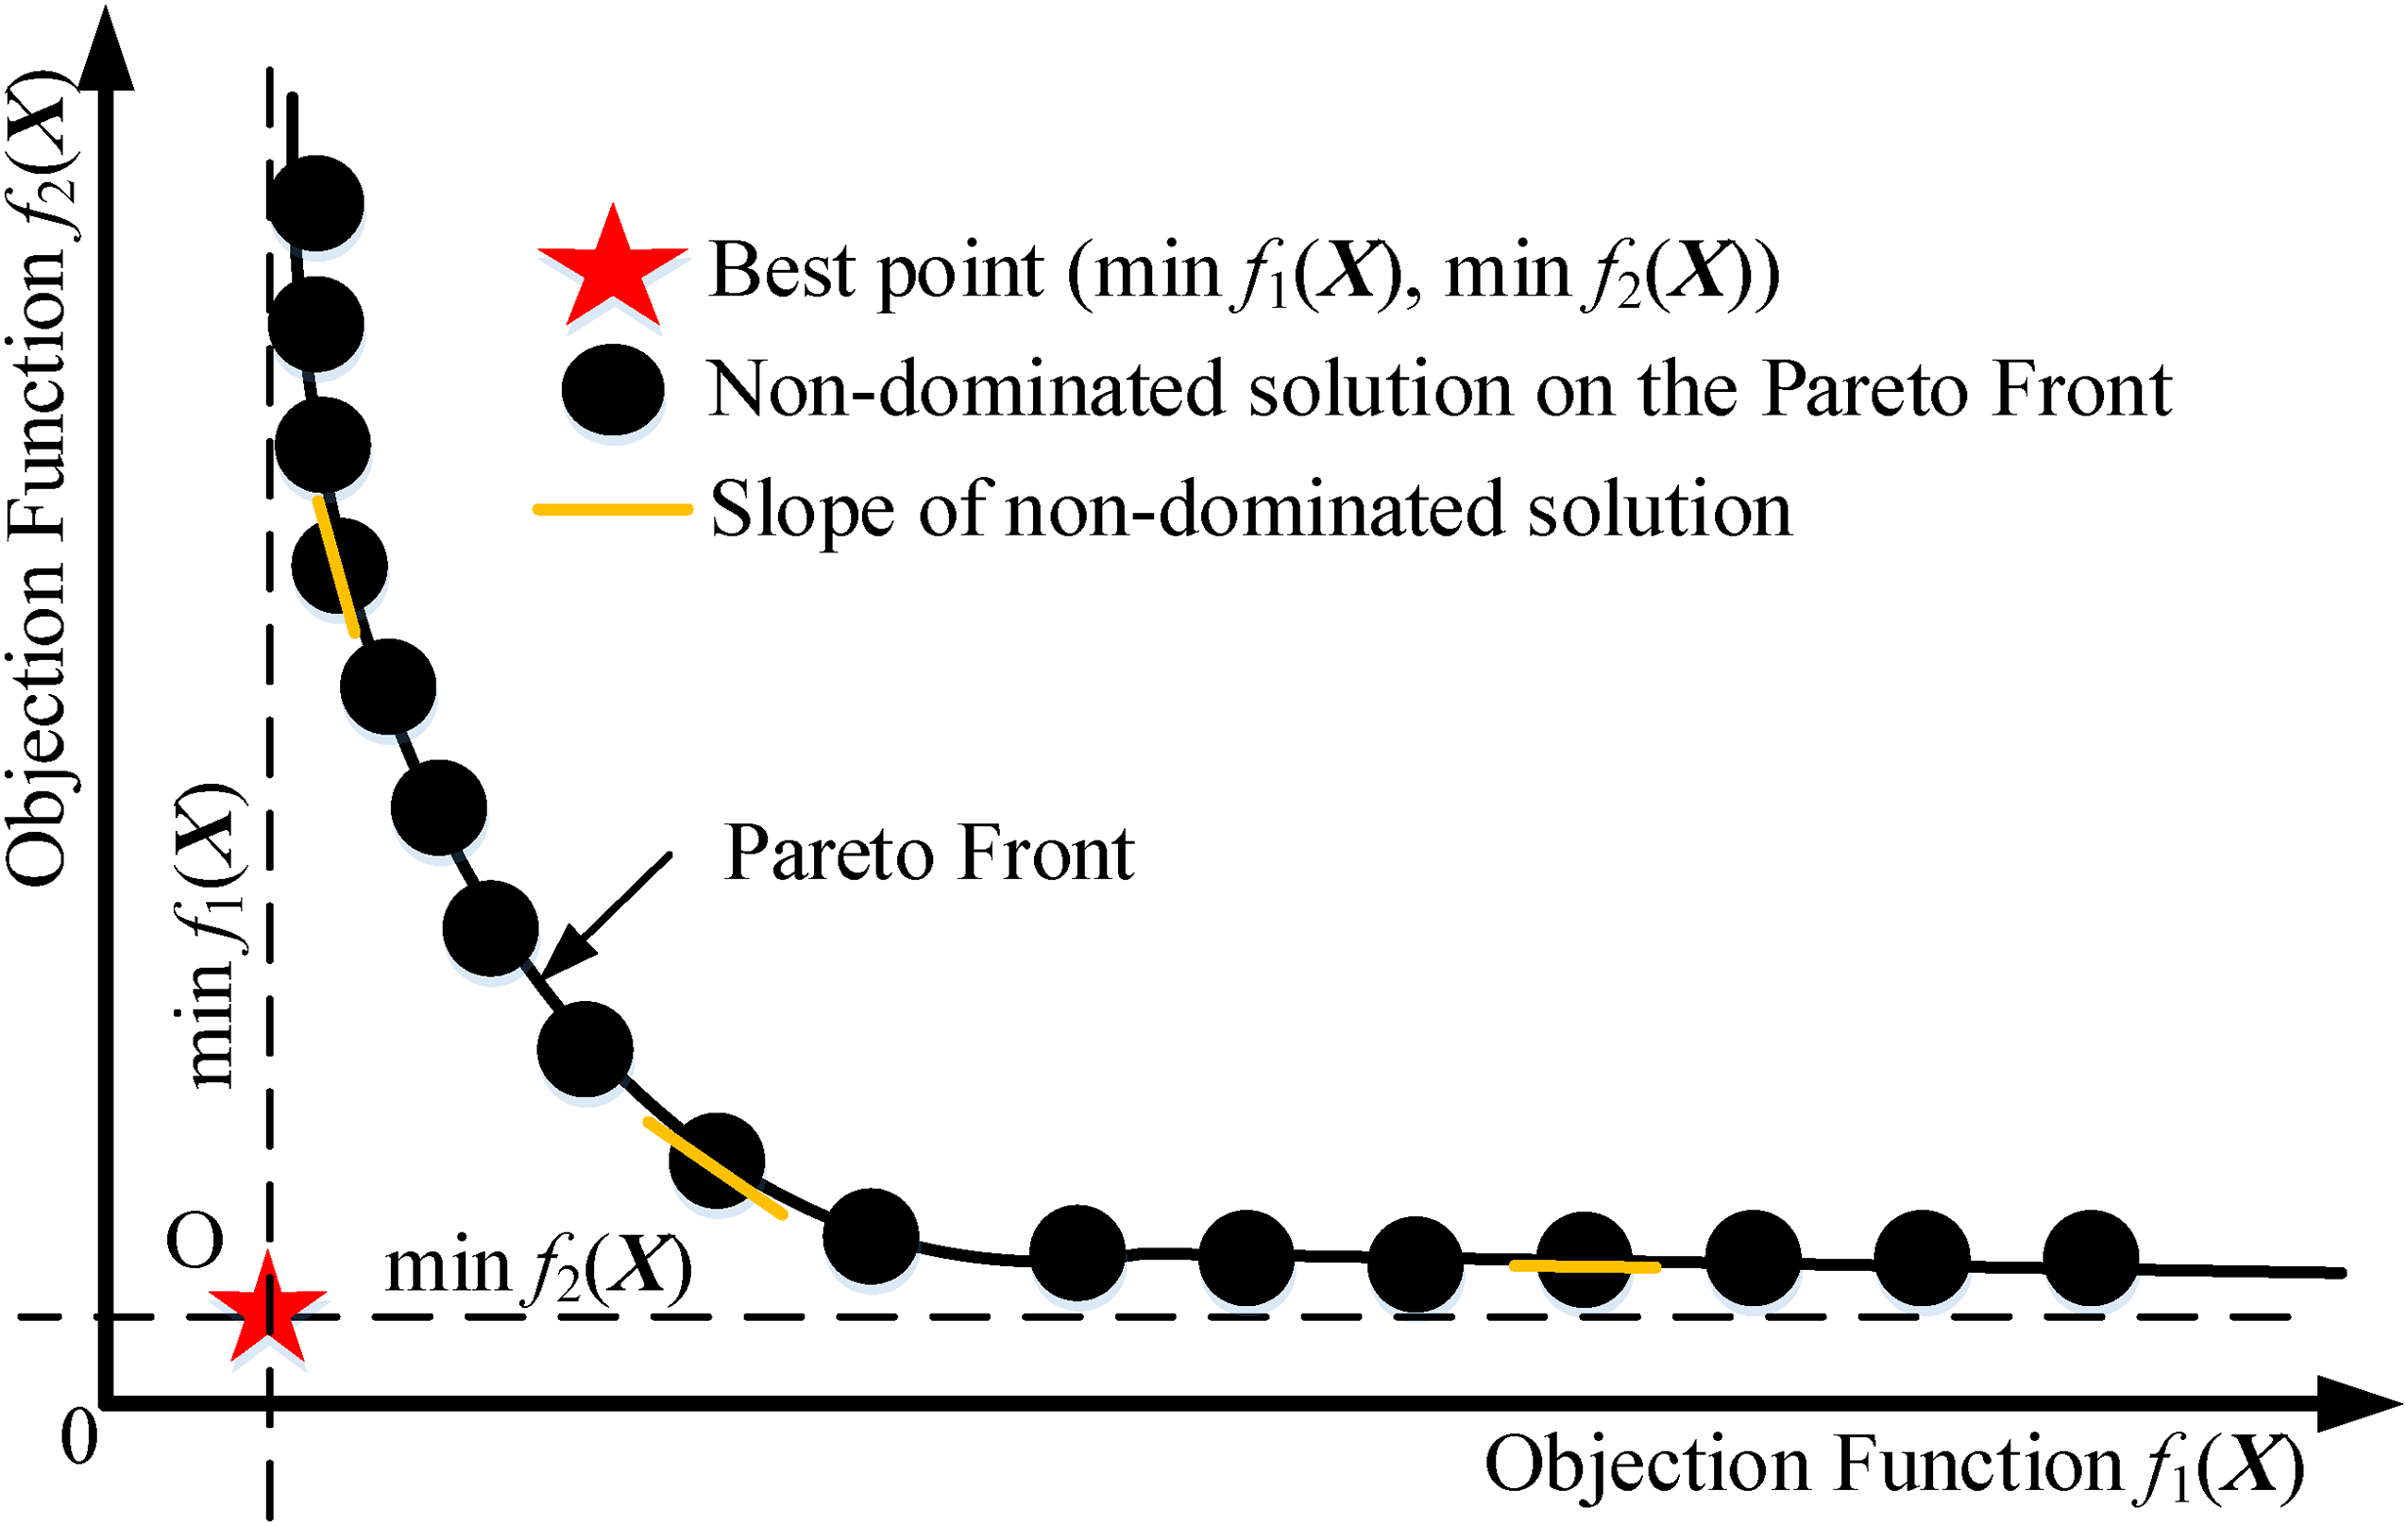
From the BiOP represented by the mathematical model of the DES with BESS in the BESS configuration model in distribution energy system section, it can be seen that calculating the variation of the two objective functions on the Pareto front is crucial to finding the recommended solution. Unfortunately, in the existing methods, an analytical expression for the Pareto front cannot be established. Therefore, this research is conducted from two perspectives that calculating the slope of the Pareto front and obtaining the recommended solution. The first step is to transform the BiOP into a conditional SOP. By changing the conditional constraints, the changes in the bi-objective functions are obtained. The conditional optimization model is defined as shown in equation (17) by introducing two optimization variables r1 and r2, which represent the deviation margin of the two optimization objective functions from their respective optimum values. The optimization objective J(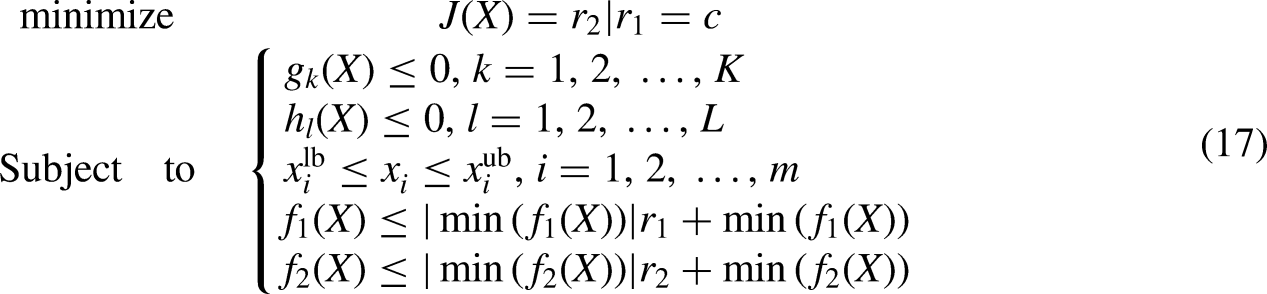
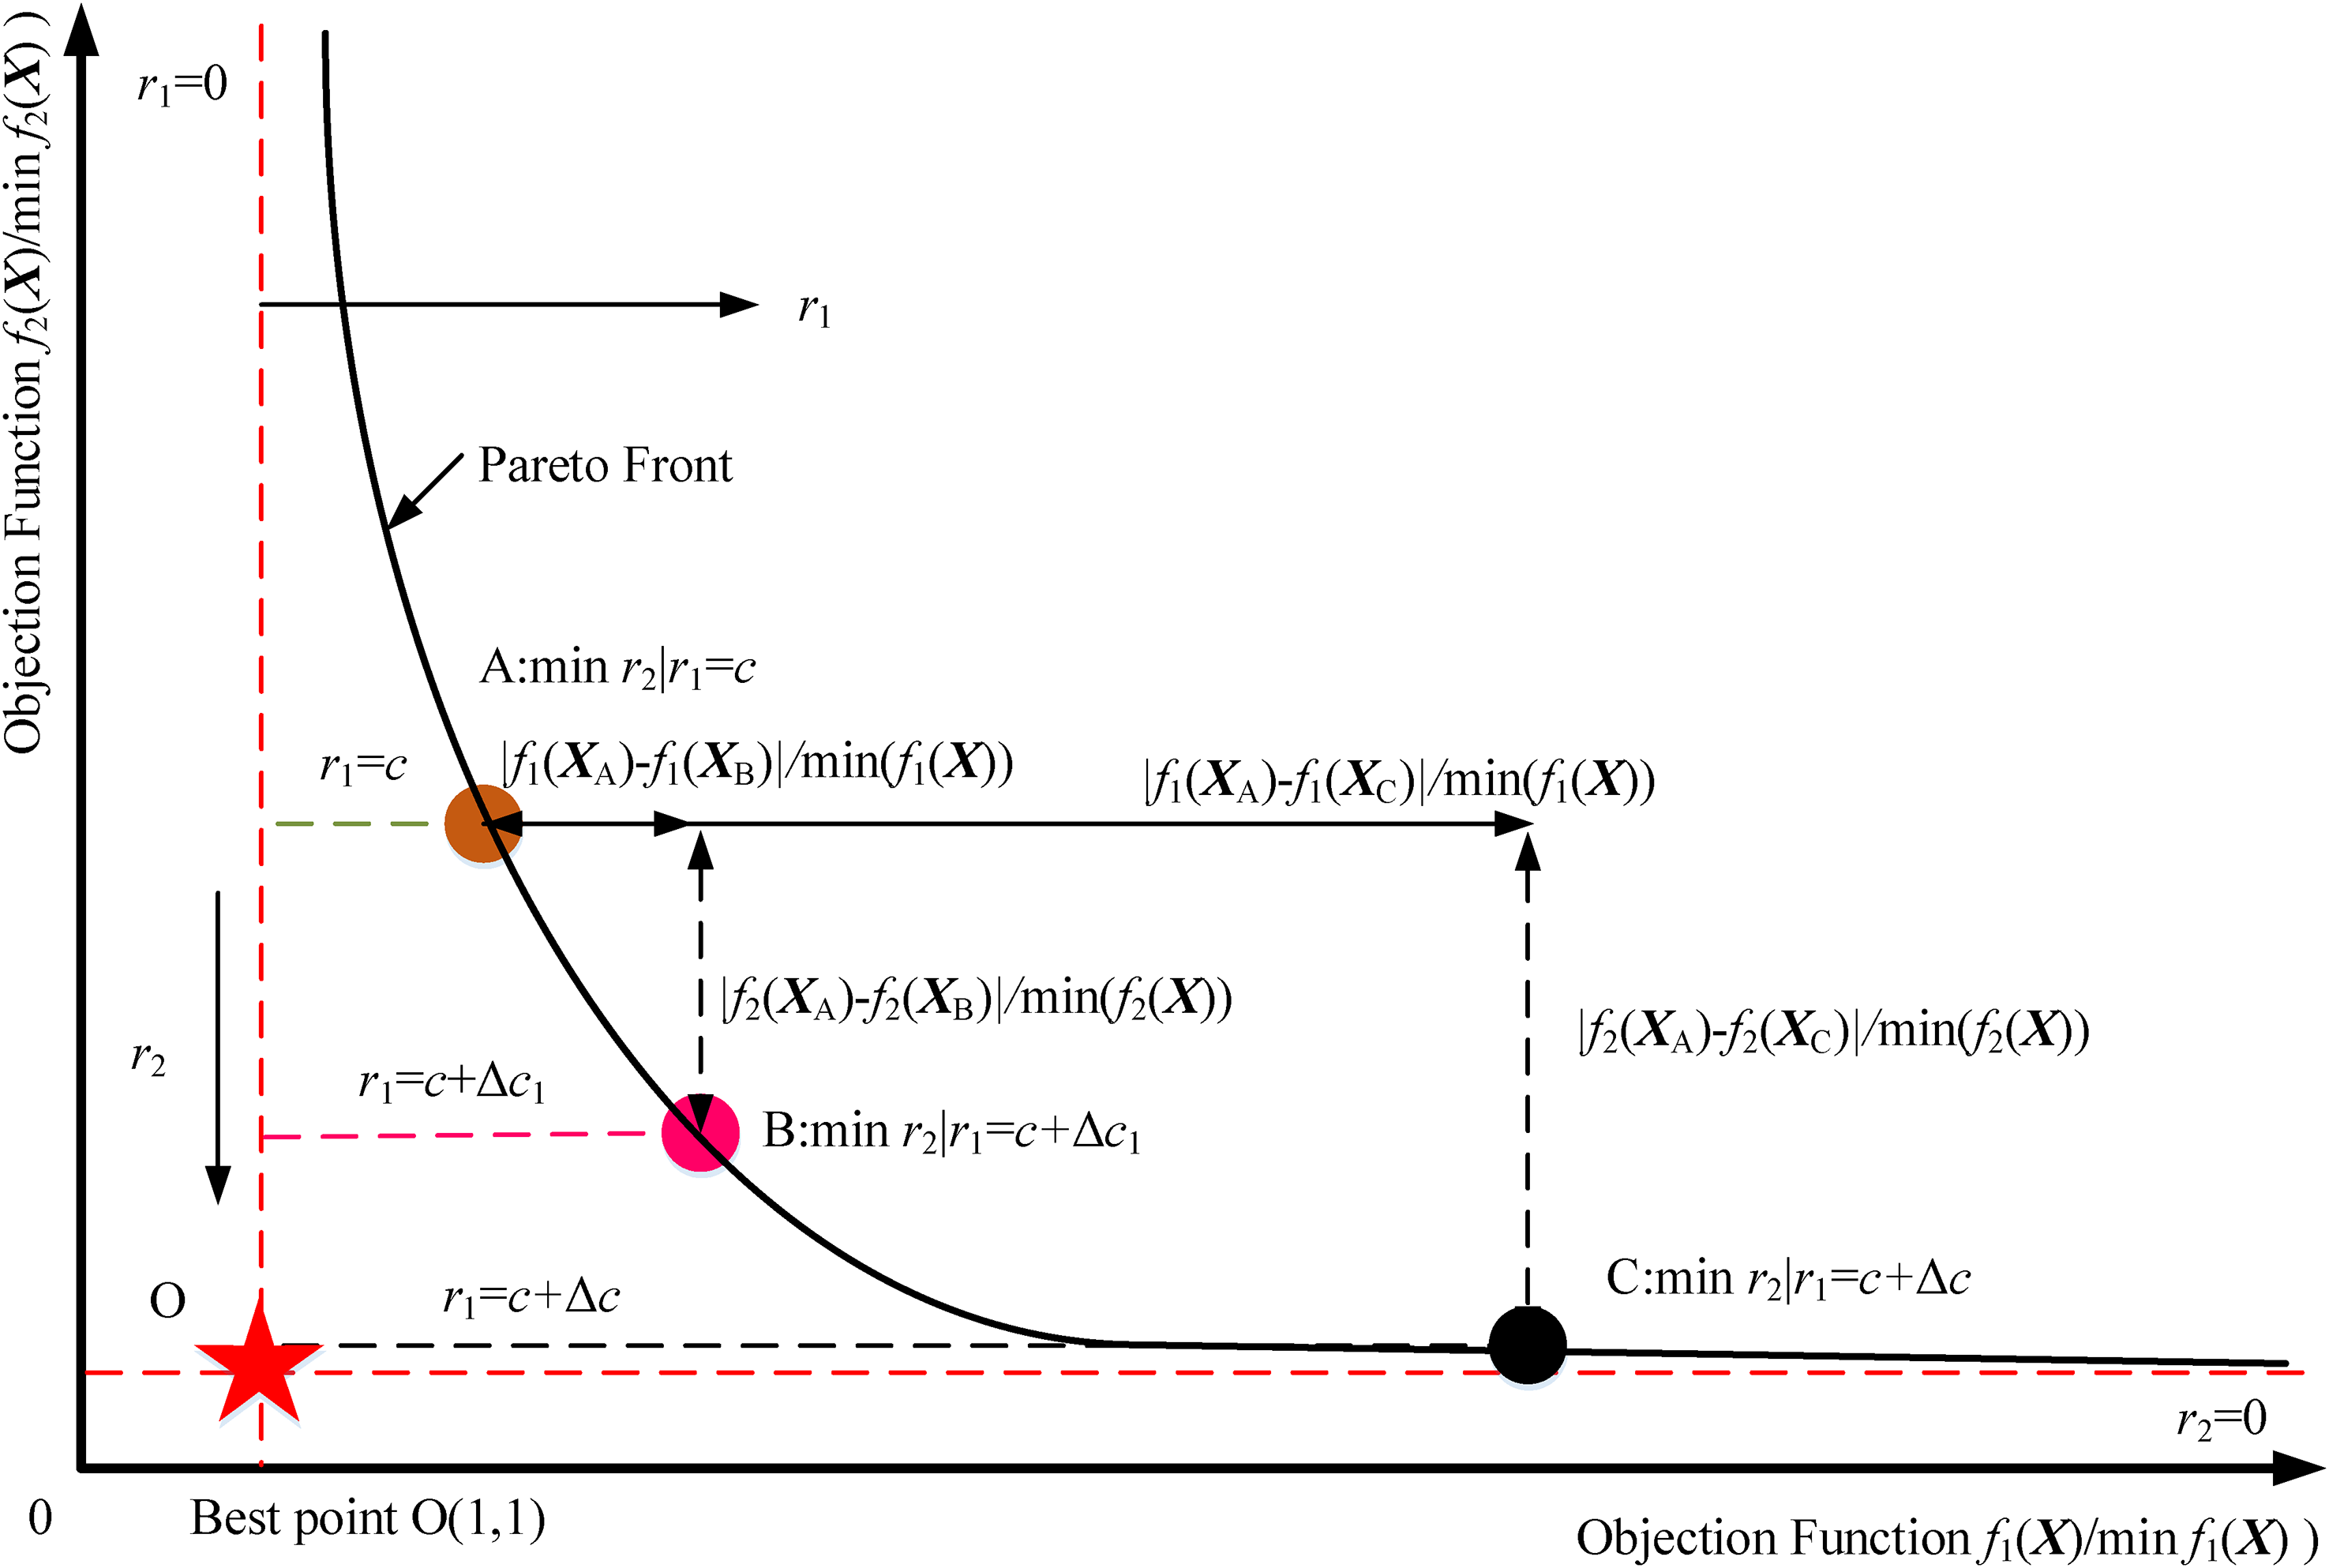
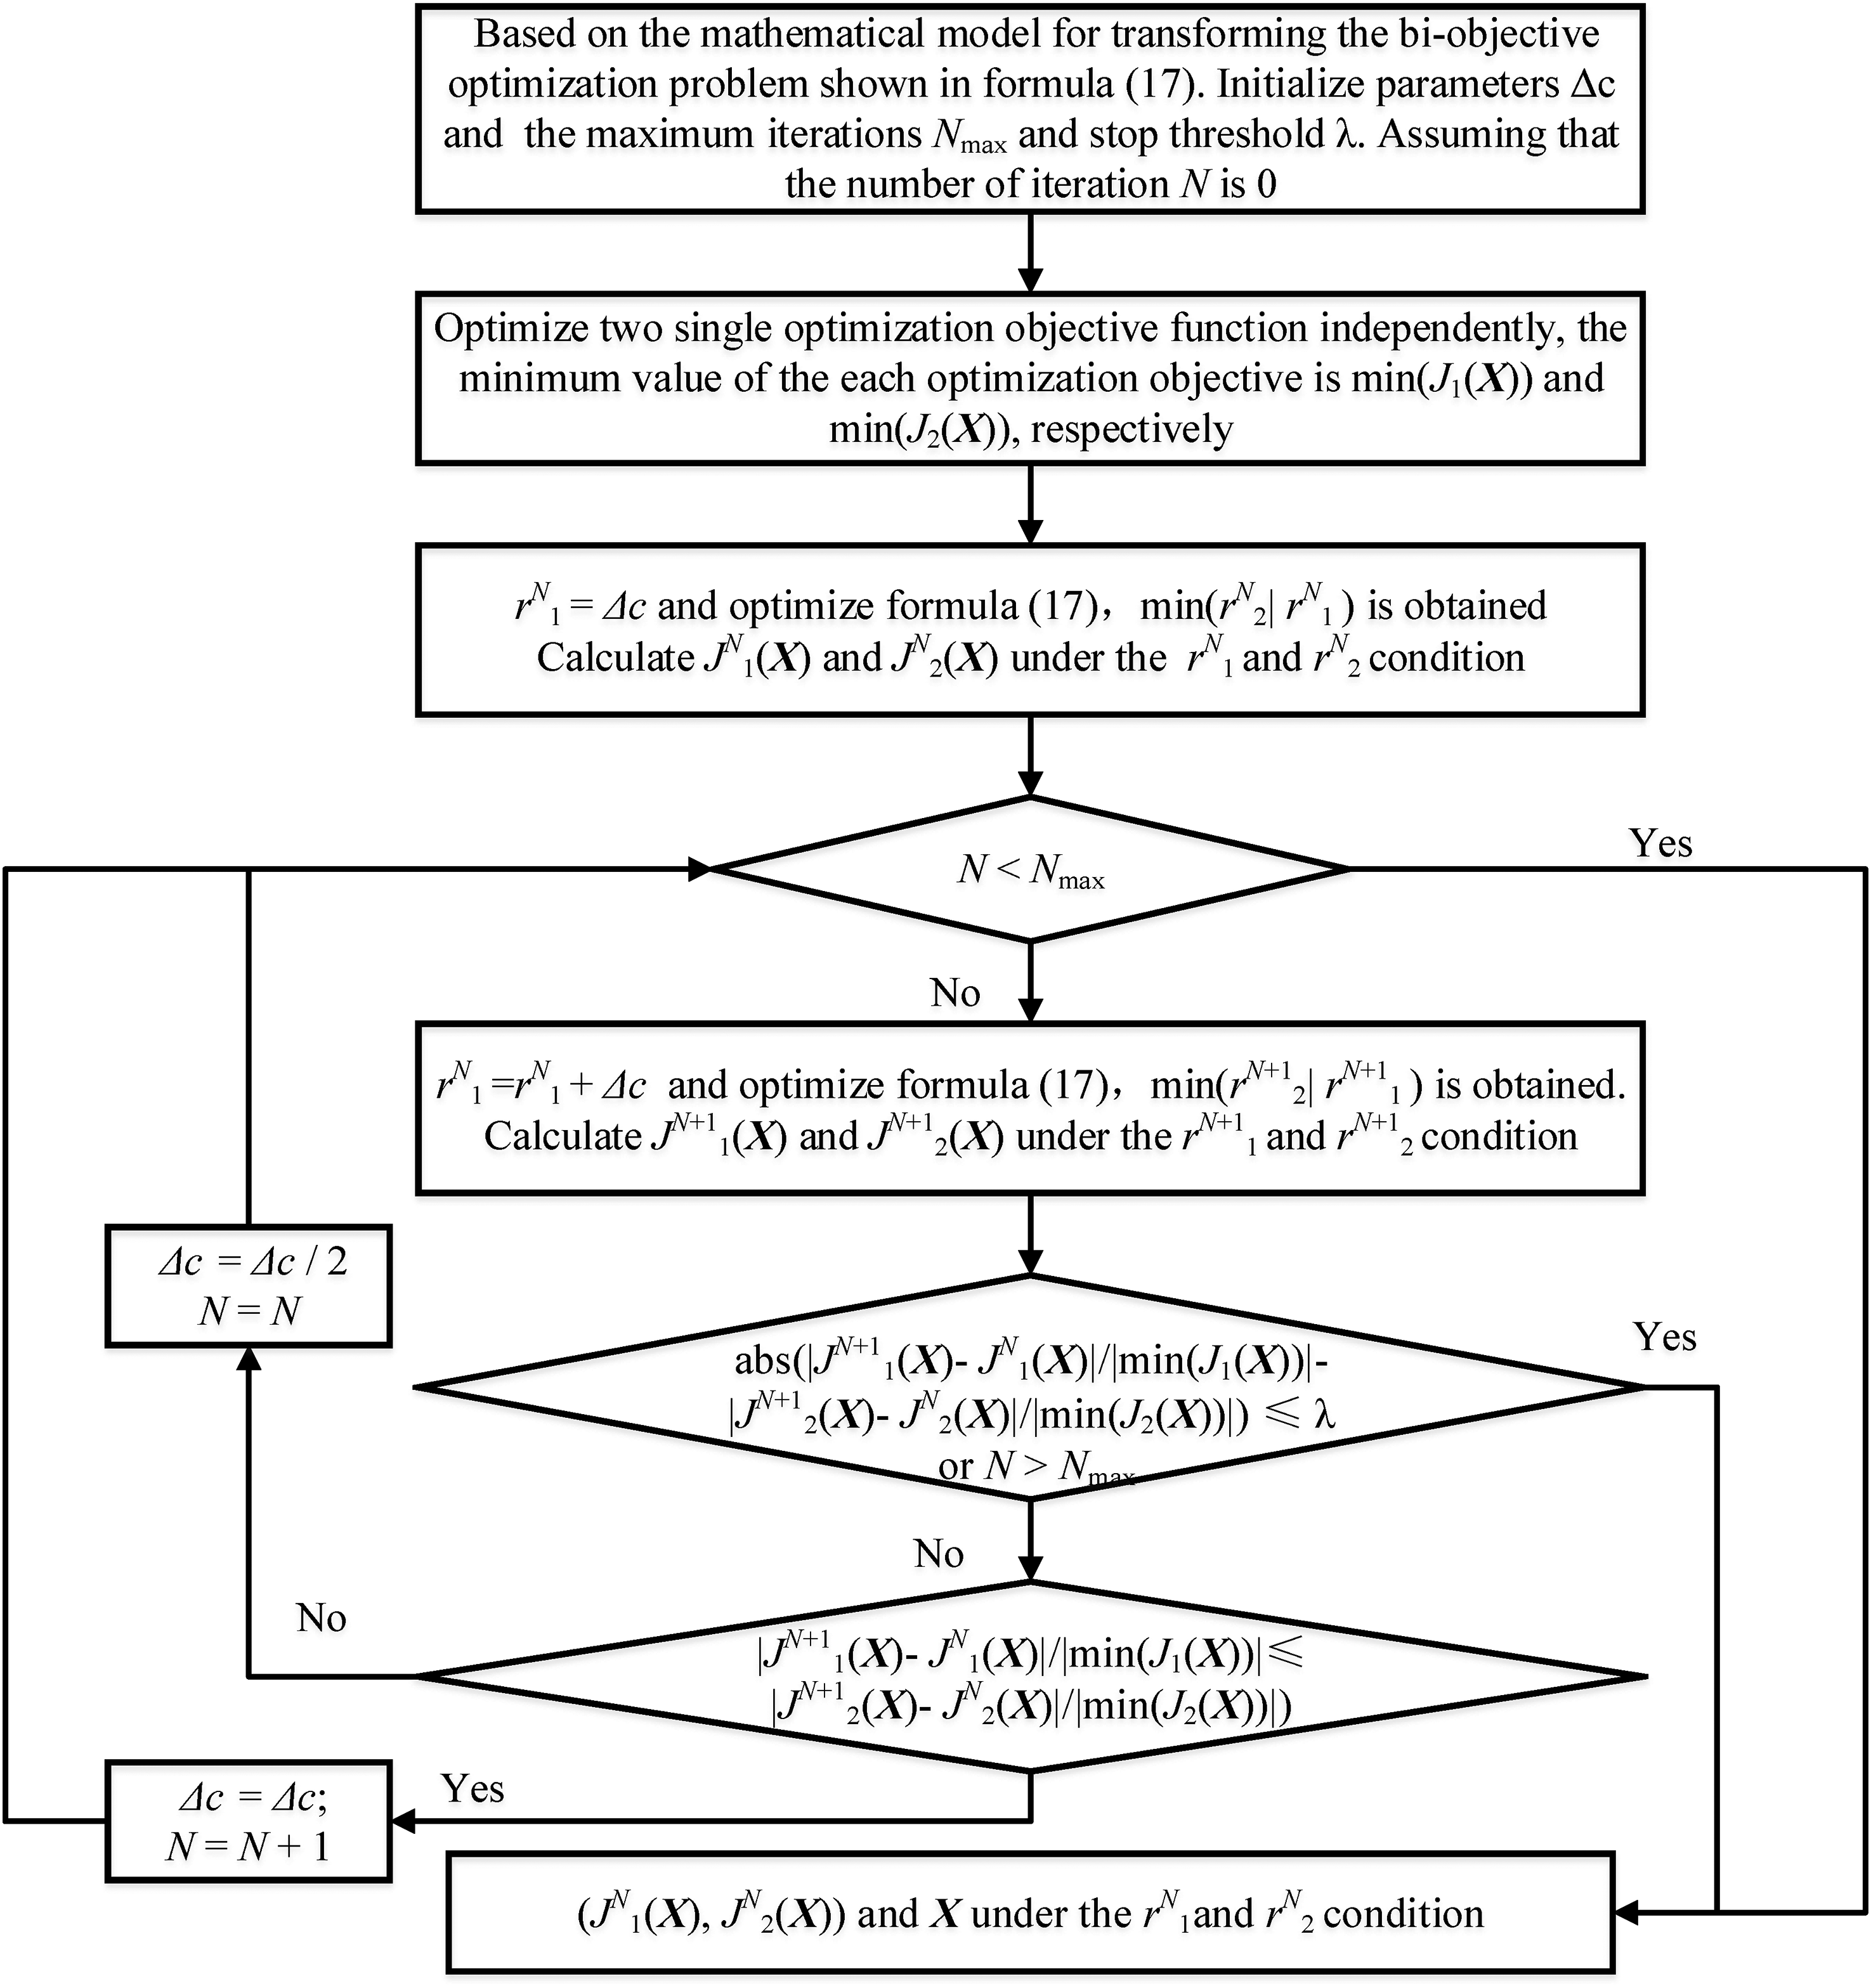
The process of the P&O method.
Assuming the current search point is A, with its coordinates obtained by optimizing the SOP described in equation (17) under the condition r1 = c, that is, the point A is min(r2|r1 = c). Then, a perturbation is applied in the direction of the objective function f1(
If the absolute value of this variation is greater than or equal to Δc, it means that the change in the optimization objective function f2(
If the absolute value of the variation in the direction of the objective function f2(
By continuously completing the above process, the deviation of the changes between the optimization objective functions f1(
The drawing chart of the bi-objective optimization method based on P&O.
The simulation case study and discussion
Simulation parameters
To analyze and verify the proposed method, Figure 1 shows a DES with BESS case based on IEEE-33. The parameters and simulation conditions of the power grid, DG, PV, WF, and BESS are shown in Table 4. Figure 5 presents the power curves of load in the DES, as well as the active power of PV and WF in a typical day, with the time interval Δt = 1 h and the duration T = 24h (Ma et al., 2024).
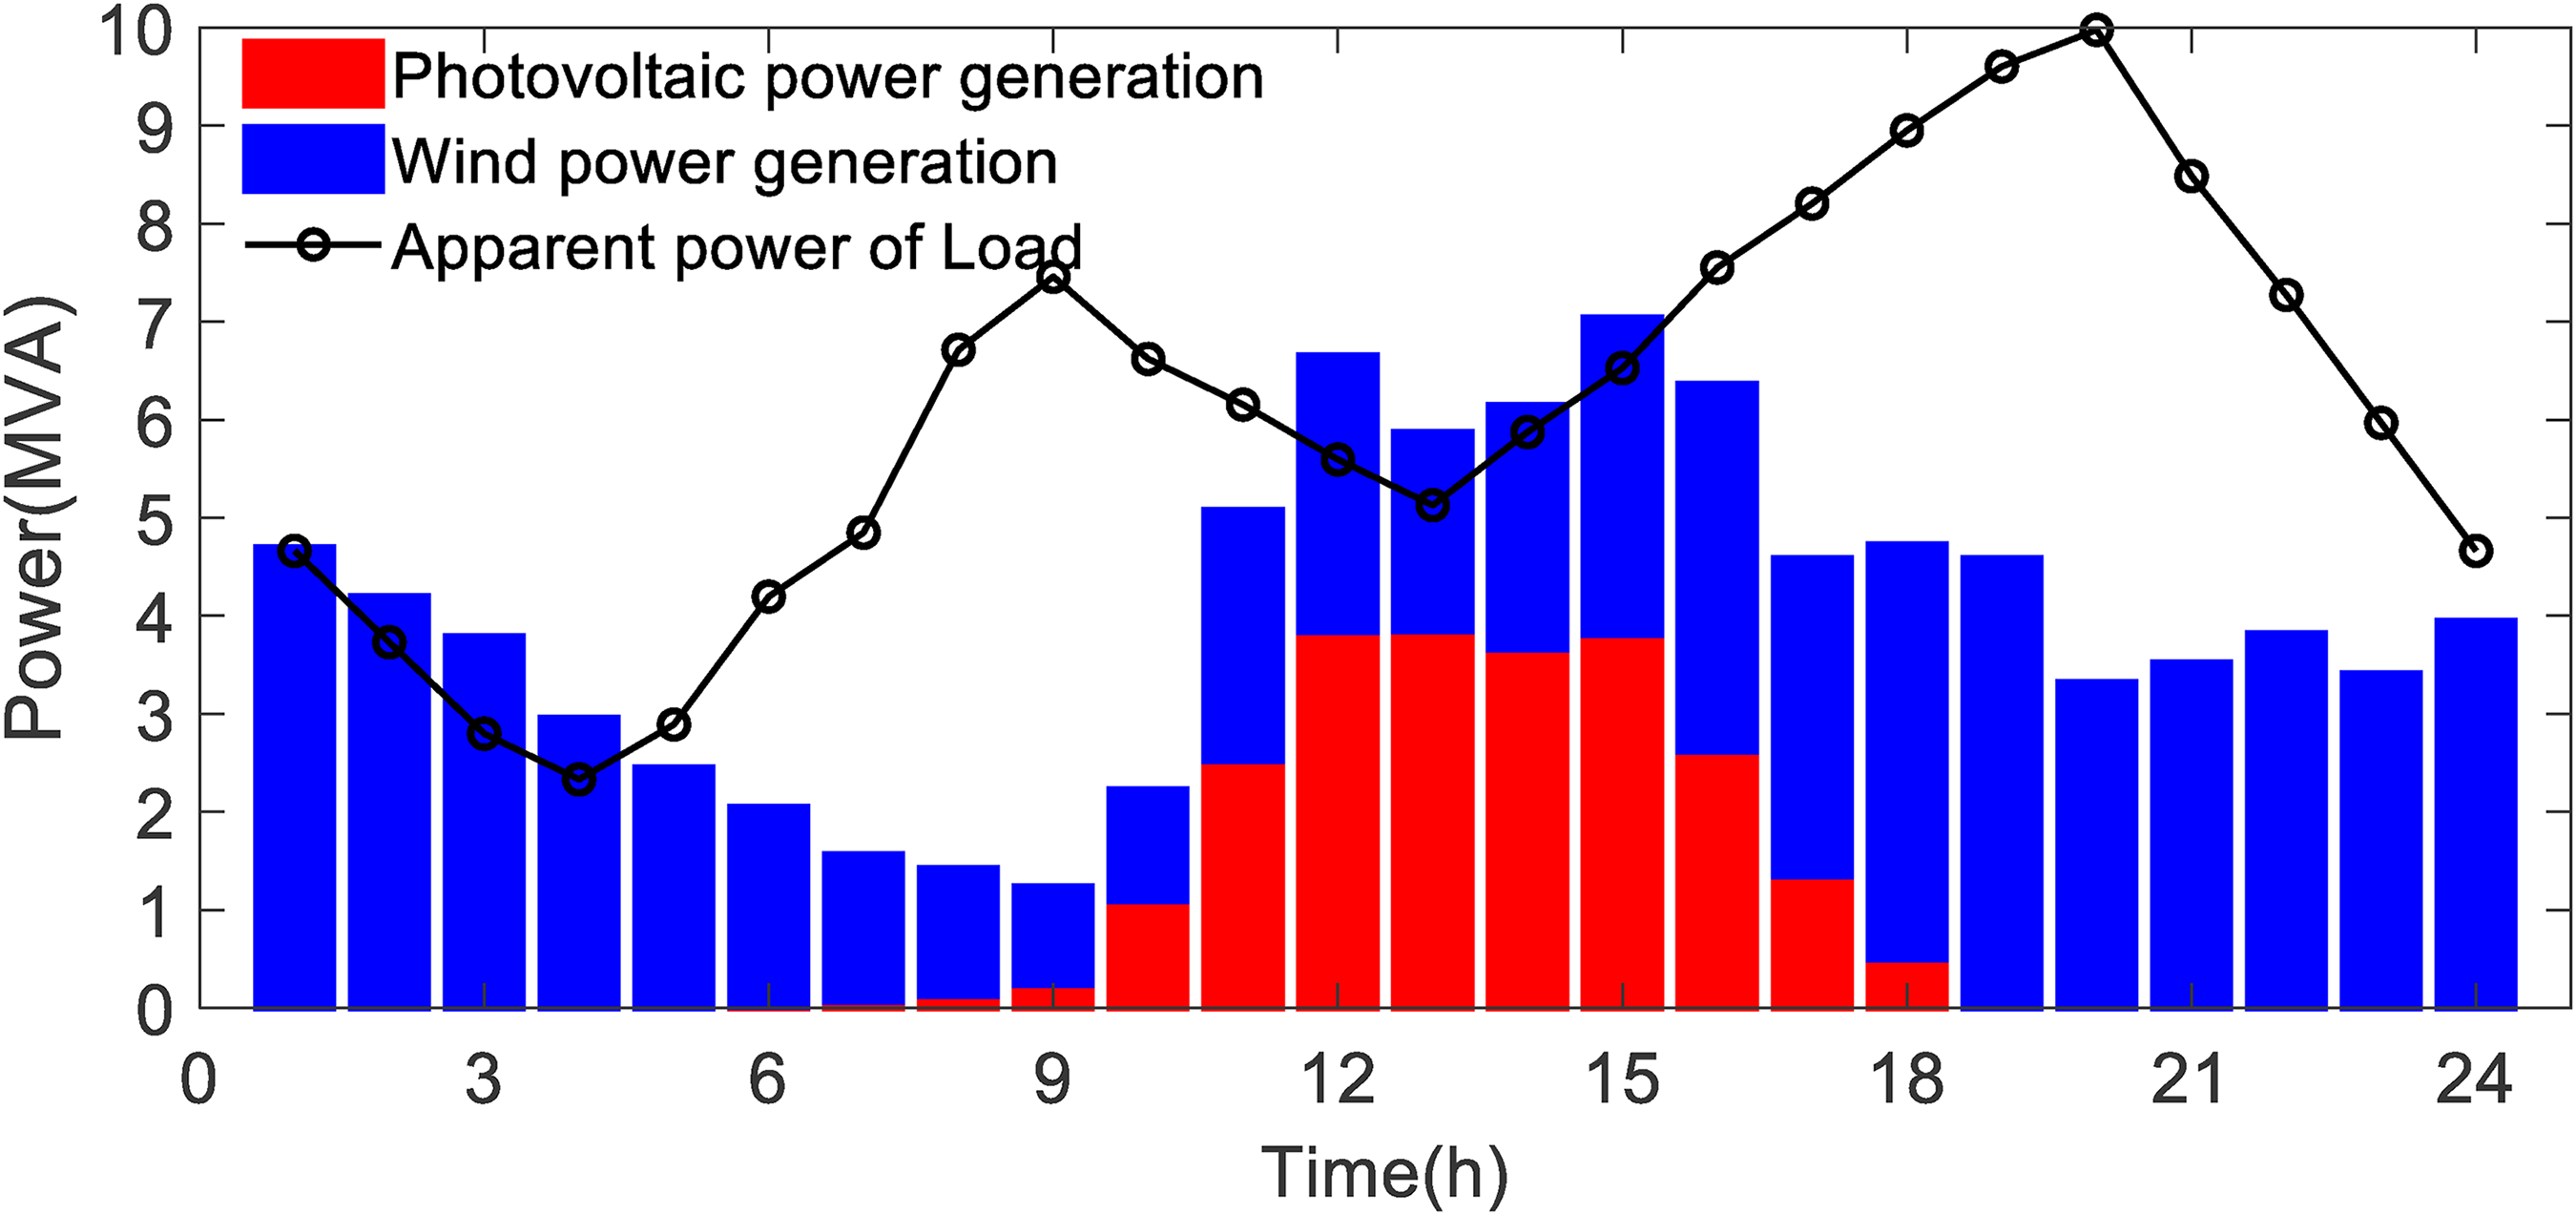
The output power of PV, WF and load in a typical day.
Simulation parameters and conditions.
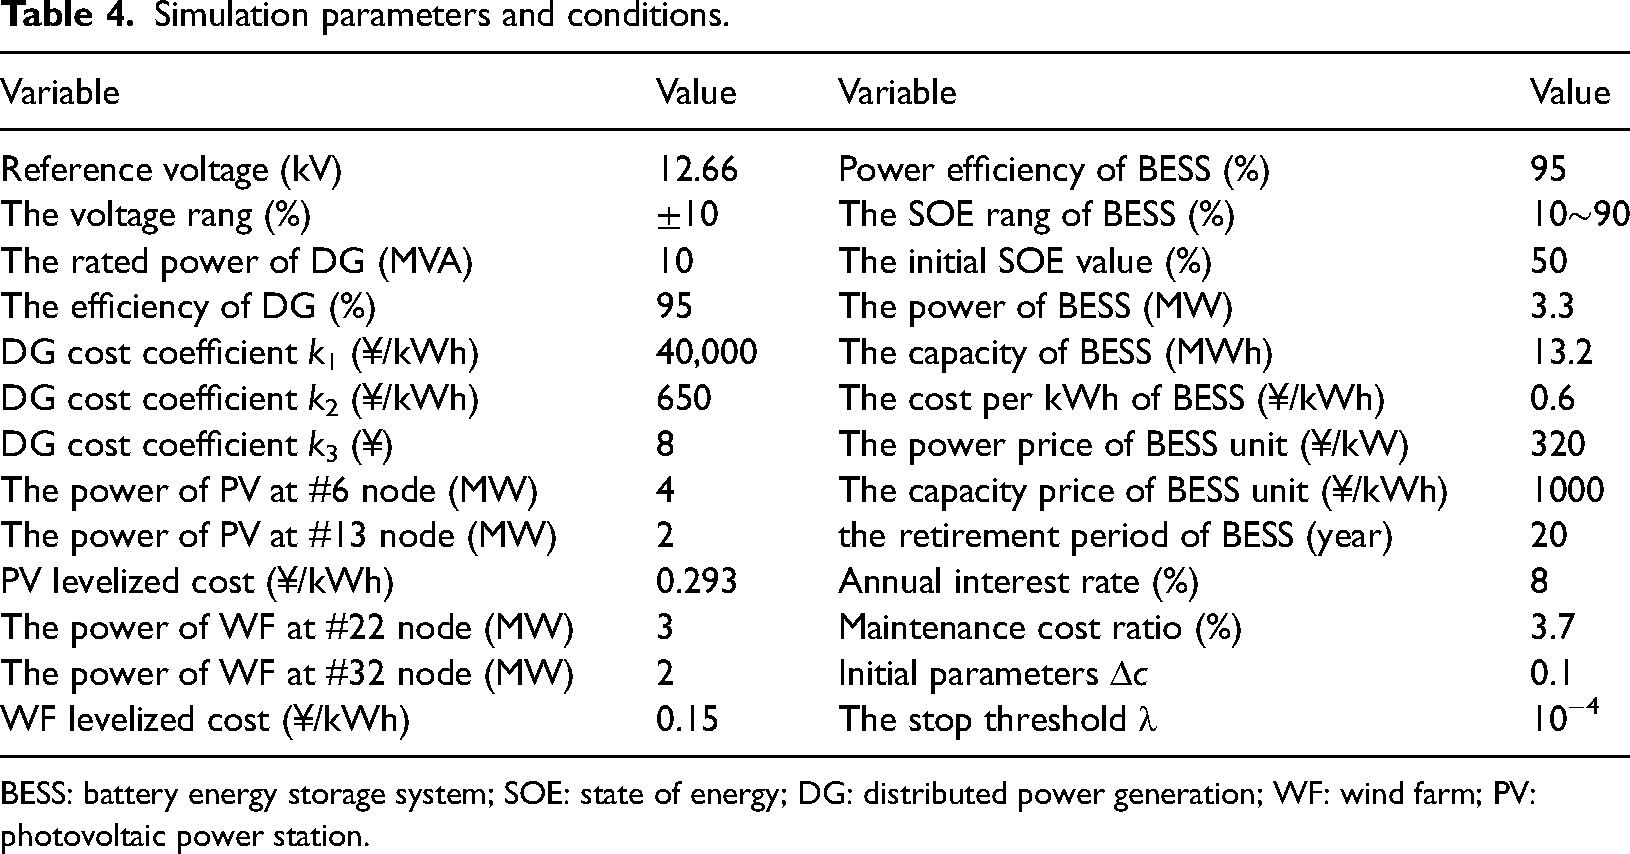
BESS: battery energy storage system; SOE: state of energy; DG: distributed power generation; WF: wind farm; PV: photovoltaic power station.
From Table 4, it is can be seen that the total installed capacity of new energy sources surpasses the rated power of the DG. In Figure 5, there is a significant discrepancy between the power generated by new energy and the power consumed by the load at different times. This situation poses a challenge for DES in balancing the active power between new energy source and load. The power output of new energy sources cannot satisfy the load demand from 5:00 to 11:00 a.m. and from 4:00 to 12:00 p.m. When BESS is not configured, the active and reactive power of DG will increase. Then, the output power of PV and WF exceeds the load demand from 1:00 to 5:00 a.m. and from 11:00 to 3:00 p.m.. It causes that some PV and WF will be abandoned. Further, there is significant variability in the power demand at different nodes and the loads with high power demand are far from the power generation system. The power losses of DES will further increase. Therefore, it is necessary to configure and control the BESS reasonably.
Result analysis
Under the above simulation parameters, based on the two objective functions of the mathematical model described in the BESS configuration model in distribution energy system section, the capacity of BESS is optimized by using a single objective function and the proposed method. Table 5 shows the numerical optimization objective functions and the configuration results for BESS under different optimization methods. Figure 6 illustrates the perturbation and observation process and the optimization results based on the proposed method. Figure 7 displays the control results of each subsystem in the DES based on various configuration results of BESS from the perspectives of DG, new energy source and BESS.
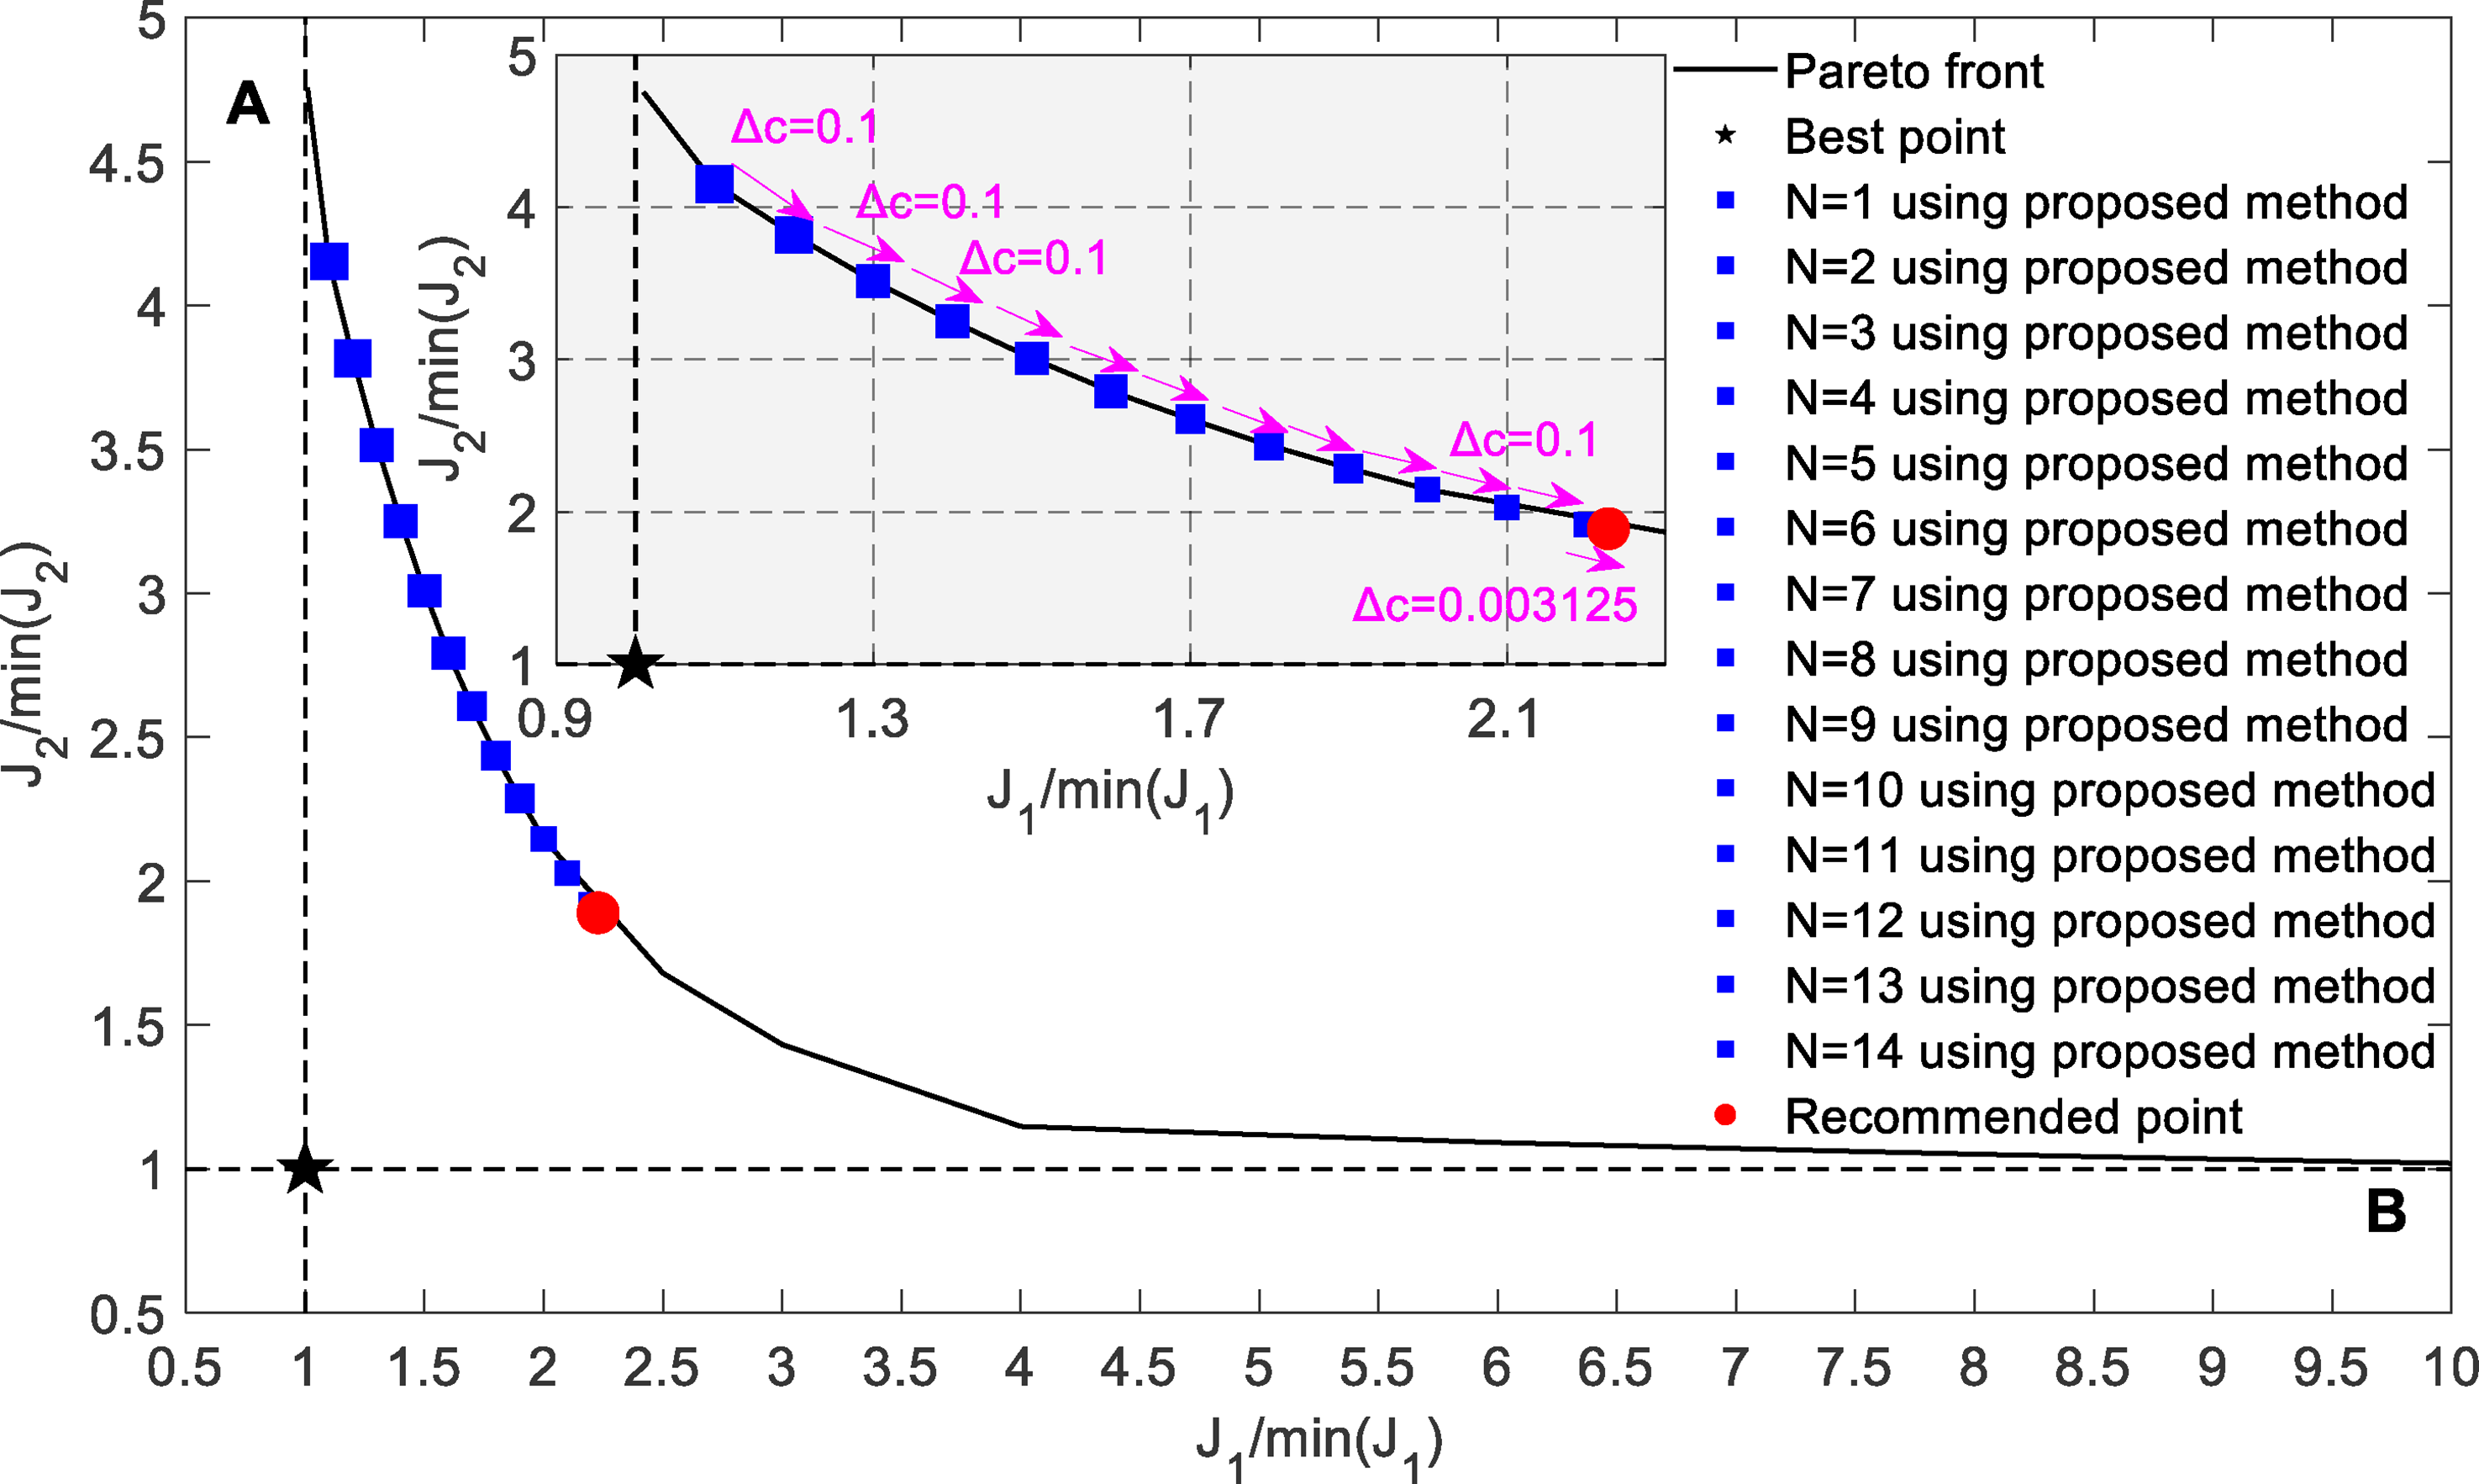
The distribution of optimization results (J1/|min(J1)|, J2/|min(J2)|) on the Pareto front using the P&O methods.
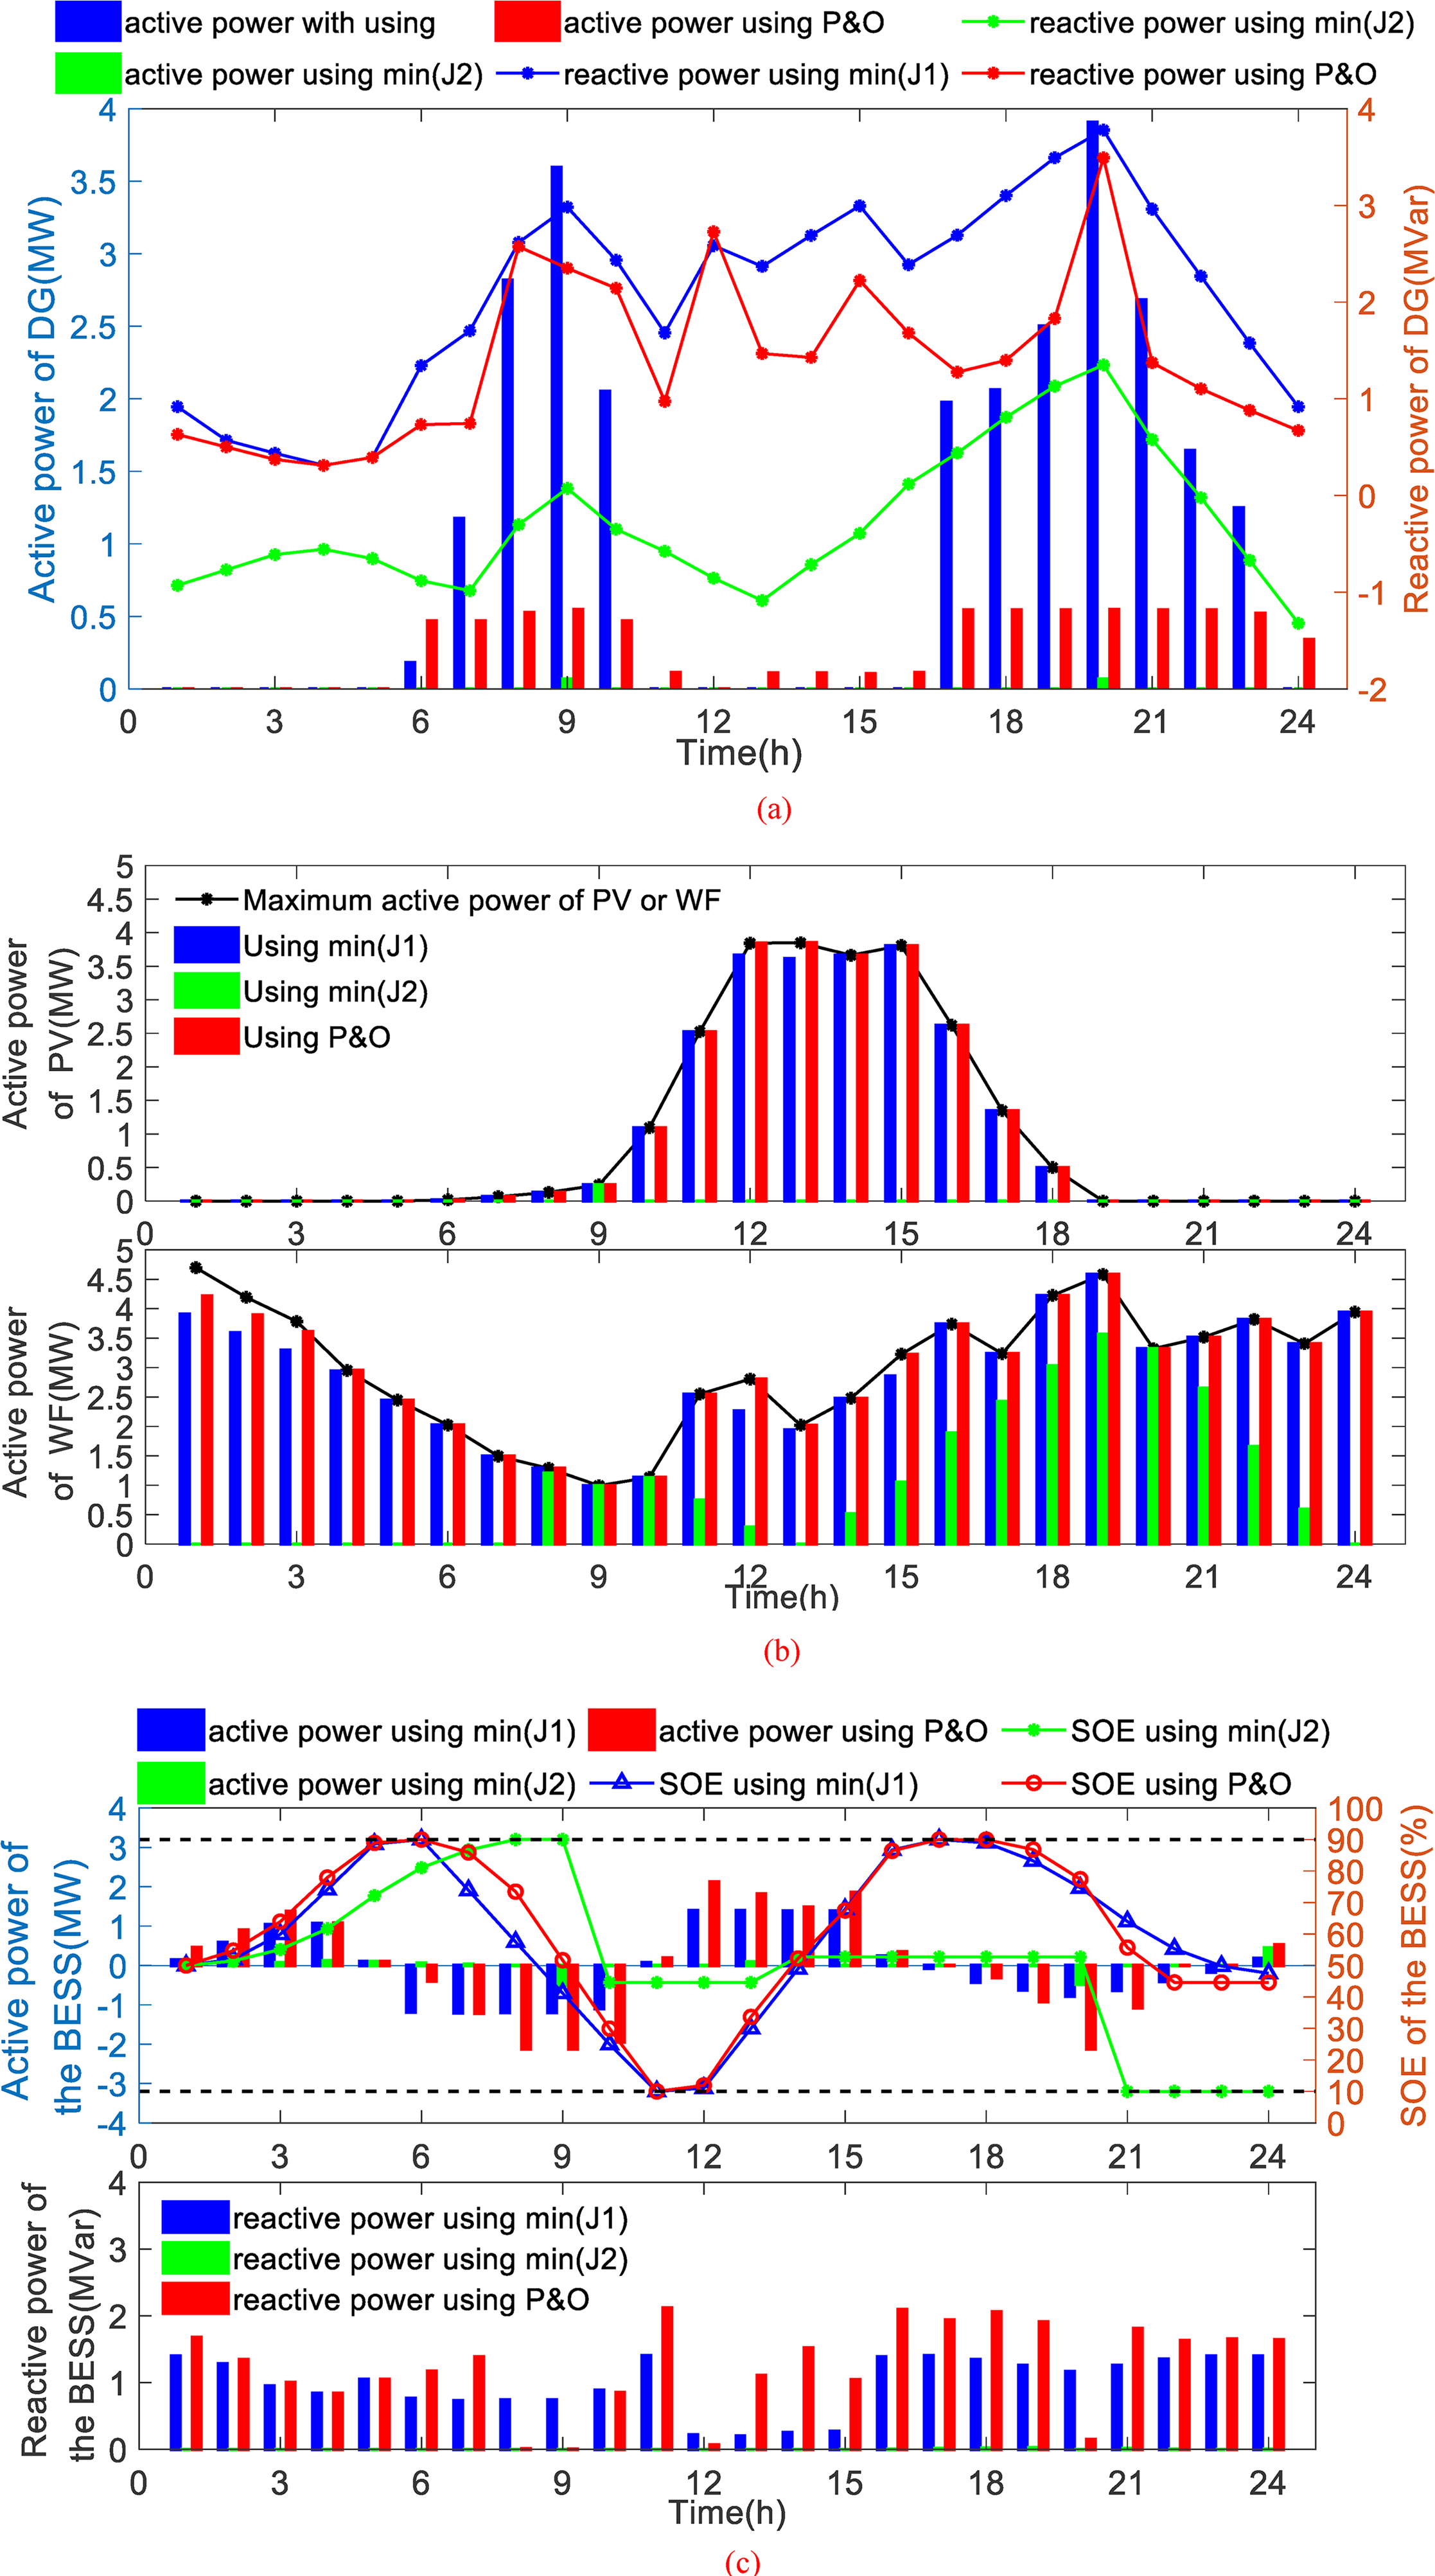
Comparison results of operational performance of distribution network under different methods. (a) The output power of the DG under different methods. (b) The output power of PV and WF under different methods. (c) The output power of the BESS under different methods.
J1 and J2 value and configuration results of BESS.
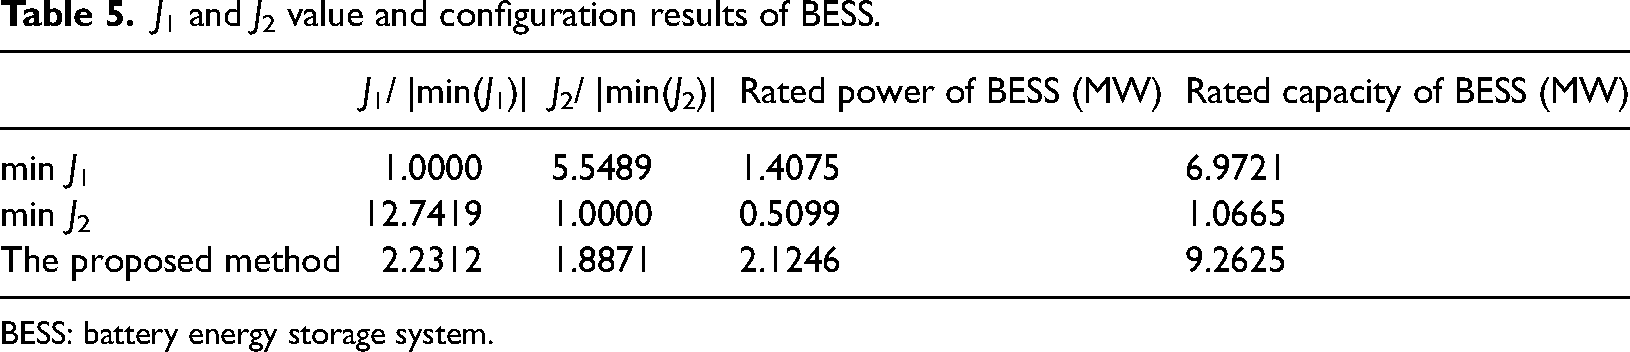
BESS: battery energy storage system.
From Table 5, it is evident that: (1) Under different optimization objective functions, the configuration results of BESS vary significantly, with the rated power differing by about four times and the rated capacity by about nine times. Therefore, selecting the appropriate optimization objective function is one of the key factors affecting the configuration results of BESS; (2) A single optimization objective can achieve the best performance in its optimization direction, but it significantly reduces the performance of other optimization objective function. For instance, when the objective function is the energy loss of DES J1, there is a 5.5-fold energy loss in the direction of operational cost J2. This means that a single optimization objective will cause an imbalance of operational performance in the overall system; (3) Compared to the results for optimization objective J1, the proposed method falls the 2.2312-fold in the J1 direction, but the 2.94-fold rises in the J2 direction. Similarly, compared to the optimization objective J2, the proposed method has deteriorated by 1.8871-fold in the J2 direction, but ameliorated by 5.71-fold in the J1 direction. It indicates that the proposed method better balances the two optimization objective functions.
In the coordinate system formed by (J1/|min(J1)|, J2/|min(J2)|), Figure 6 shows the shape of the Pareto front composed of the nondominated solution set and the P&O process of the proposed method. Based on the Pareto front of Figure 6, it can be seen that: (1) with an optimization objective function value increasing, the other decreases continuously. A clear contradiction is indicated between the two optimization objective functions. This makes it difficult to achieve an optimal value in both directions simultaneously. (2) According to the slope of the Pareto front, the absolute value of the slope from point A to point B gradually decreases. It means that the same change is improved in the J1/|min(J1)| direction, the change in the J2/|min(J2)| direction gradually decreases. In other words, in the reducing process of the J1/|min(J1)| performance, the performance in the J2/|min(J2)| direction experiences a shift from rapid to slow improvement. It indicates that there is a balance point on the Pareto front where the changes of the two optimization functions are equivalent. (3) During the P&O process, the proposed method is updated 12 times with a perturbation step size of Δc = 0.1, then gradually reduced by five times to Δc = 0.003125. When abs(J1/|min(J1)|- J2/|min(J2)|) < λ, the final recommended point is found out. This means that the P&O method is effective for exploring the balance point of changes in the two optimization objective functions. Then, a reasonable recommended solution is achieved.
In Figure 7(a), under different optimization objective functions, it is obvious that there are significant differences in the power curves of DES. When the operational cost J2 of the DES is a unique optimization function, the active power of the DES is nearly zero. The reason is that the operational cost of DG is very high. Then, DG only provides the reactive power to DES. In Figure 7(b), if the operational cost J2 of the DES is the single objective function, the output power of PV is almost zero and WF is higher. The reason is that the cost of WF is lower. However, when the energy loss J1 of the DES is considered, the actual output power of PV and WF is equal to their maximum generation power for avoiding the energy loss of new energy source. Figure 7(c) shows the active power, reactive power and SOE of the BESS. Between 0:00 and 5:00 a.m., the BESS actively charges for absorbing wind power generation exceeding the active power of load. From 5:00 a.m. to 11:00 a.m., when the active power of load exceeds the maximum output power of PV and WF, the BESS discharges to support the electricity demand of the load. Between 11:00 a.m. and 4:00 p.m., when the higher power of the new energy source exceeds load demand, the BESS charges reasonably and prepares for a deficit caused by the active power of PV decreasing. The BESS effectively balances the power between new energy source and load for ensuring the economical operation of DES.
Discussion
Analysis for different efficiencies of BESS
Based on the above analysis presented in the result analysis section, this section discusses the influences of the power efficiency, operational cost per kWh and the deployment location for BESS. Table 6 and Figure 8 show the objective function values and the capacity configuration results under different BESS efficiencies, respectively.
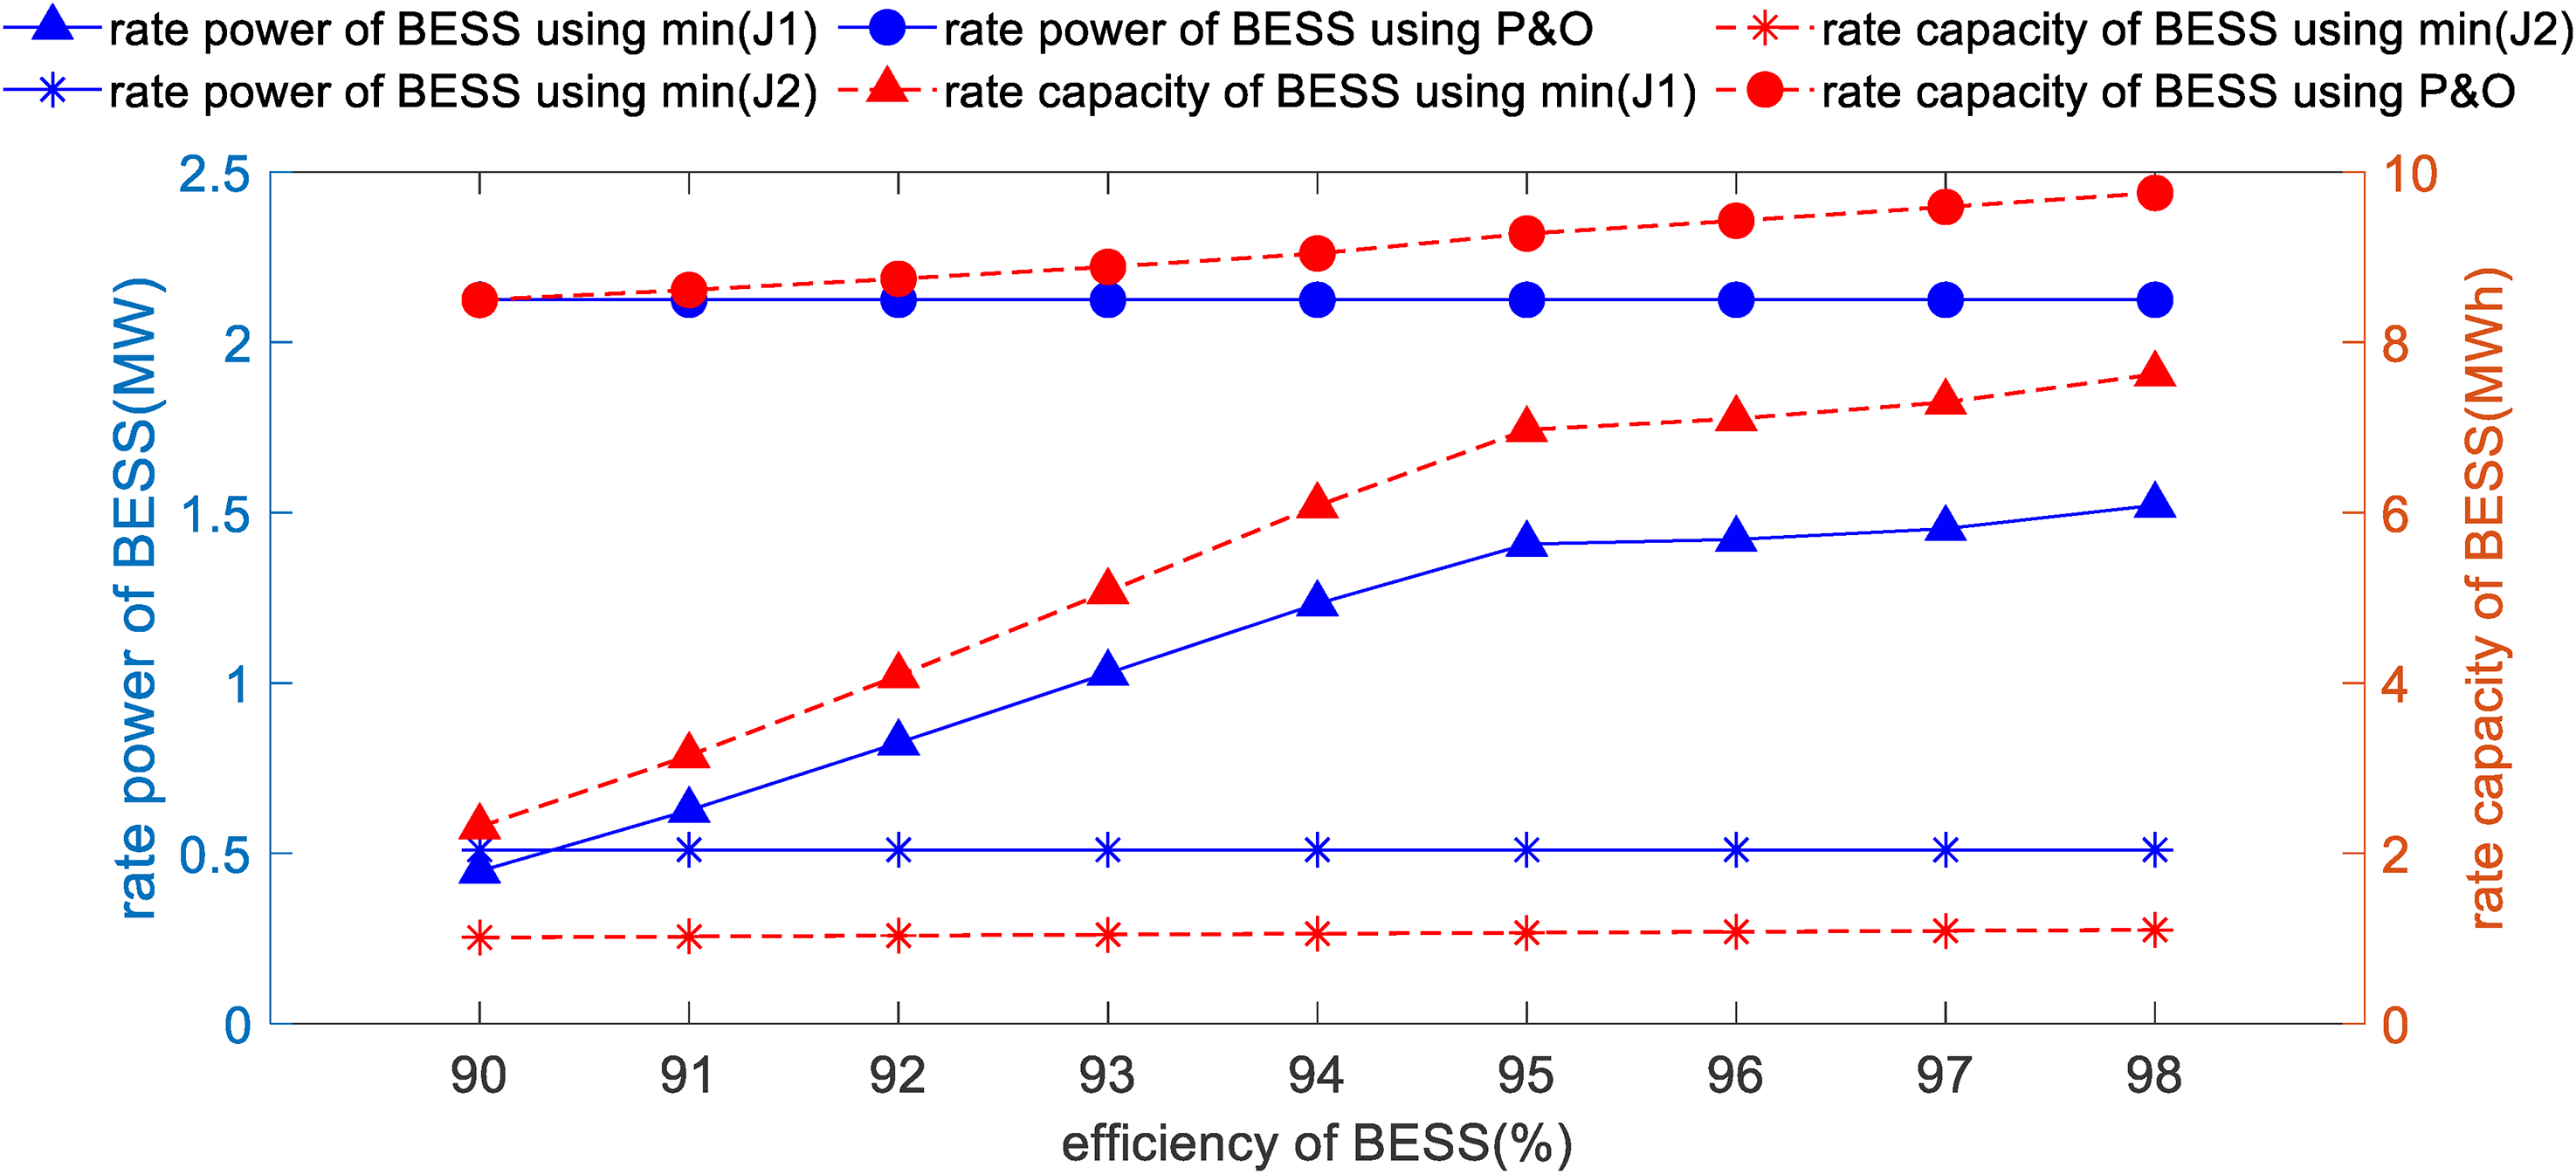
Rate power and capacity of BESS under the different efficiencies of BESS.
J1 and J2 value of optimization results under the different efficiencies of BESS.
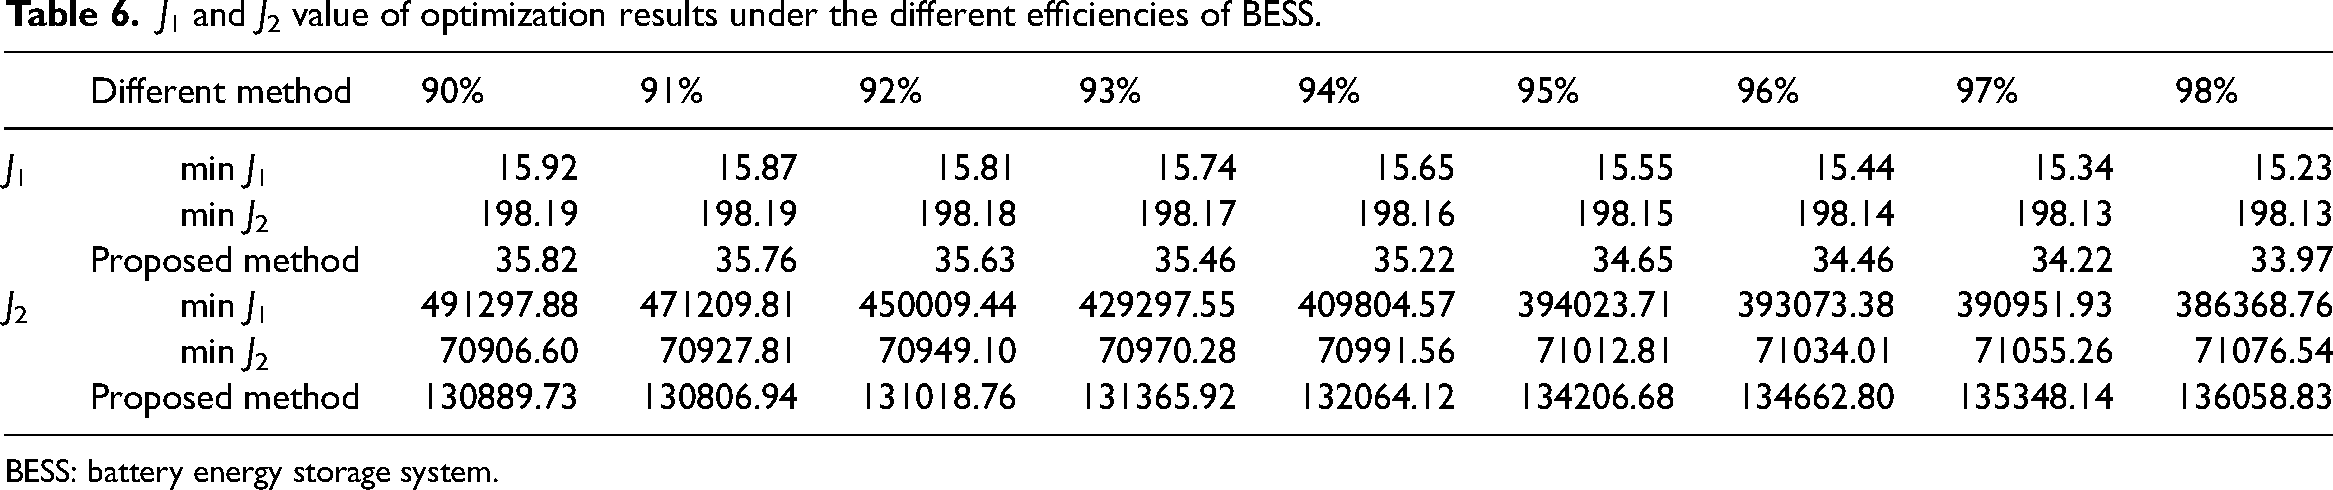
BESS: battery energy storage system.
In Table 6, when the power efficiency of the BESS is improved, the value of the optimization objective function J1 will gradually decrease. It indicates that the energy loss of the DES is reducing. The reason is that the higher efficiency of the BESS leads to lower electricity losses. Under the condition of min(J1), with the efficiency of the BESS increasing, the output power of the BESS and DG rises and falls, respectively. Then, in the direction of optimization objective function J2, the operating cost of the DES decreases. It is the reason that the generation cost of DG is higher than that of the BESS. And under the condition of min(J2), the output power of DG has already been significantly reduced to minimize the operating costs of DES. With the efficiency of the BESS increasing, the output power and operating costs of the BESS increase. Base on the proposed method, the balance between two optimization objective functions is maintained. Then, the energy loss and the operating costs of the DES are slowly decreased by 5.16% and increased by 3.95%, respectively. The above results imply that the efficiency of the BESS directly impacts the overall performance of the DES, especially in terms of energy loss.
In Figure 8, if the optimization objective function is J1, it can be observed that with the efficiency of the BESS improving, the rated power and capacity of the BESS significantly increase by about four times. It indicates that, in supplying and consuming power, the participation duration of the BESS is continuously improved to reduce energy loss. In the case of minimizing optimization objective J2, the configuration results of the BESS remain essentially unchanged. It means that the efficiency of the BESS has little impact on the configuration of the BESS under minimizing economic cost. Using the proposed method, the rated power of the BESS remains relatively constant and the rated capacity gradually increases by 10%. It is the reason that the participation duration of the BESS is continuously increasing. Based on the above results, the efficiency of the BESS significantly impacts its actual output power and is a core factor for the configuration capacity of BESS.
Analysis for different costs of BESS
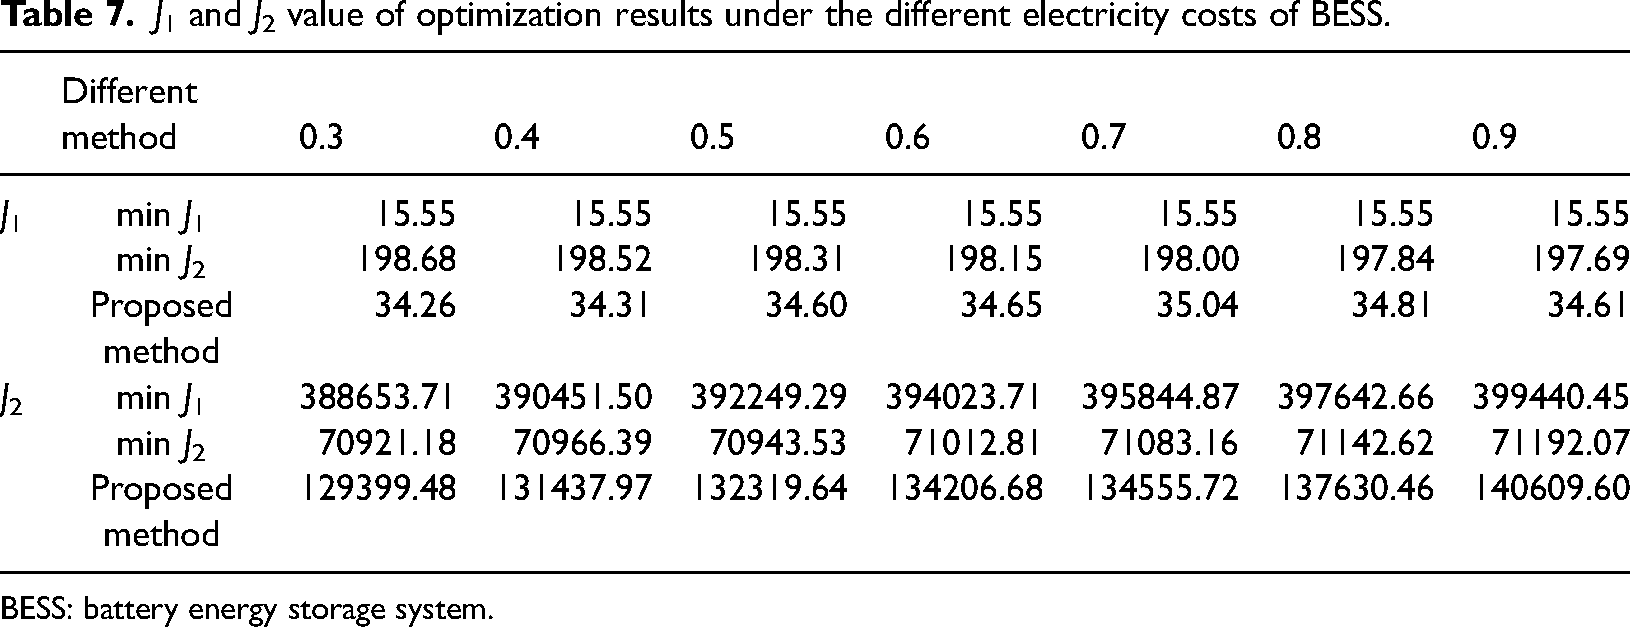
Then, the cost per kWh of the BESS is analyzed as follows. Table 7 and Figure 9 discuss the objective function values and the capacity configuration results under different costs per kWh of BESS, respectively.
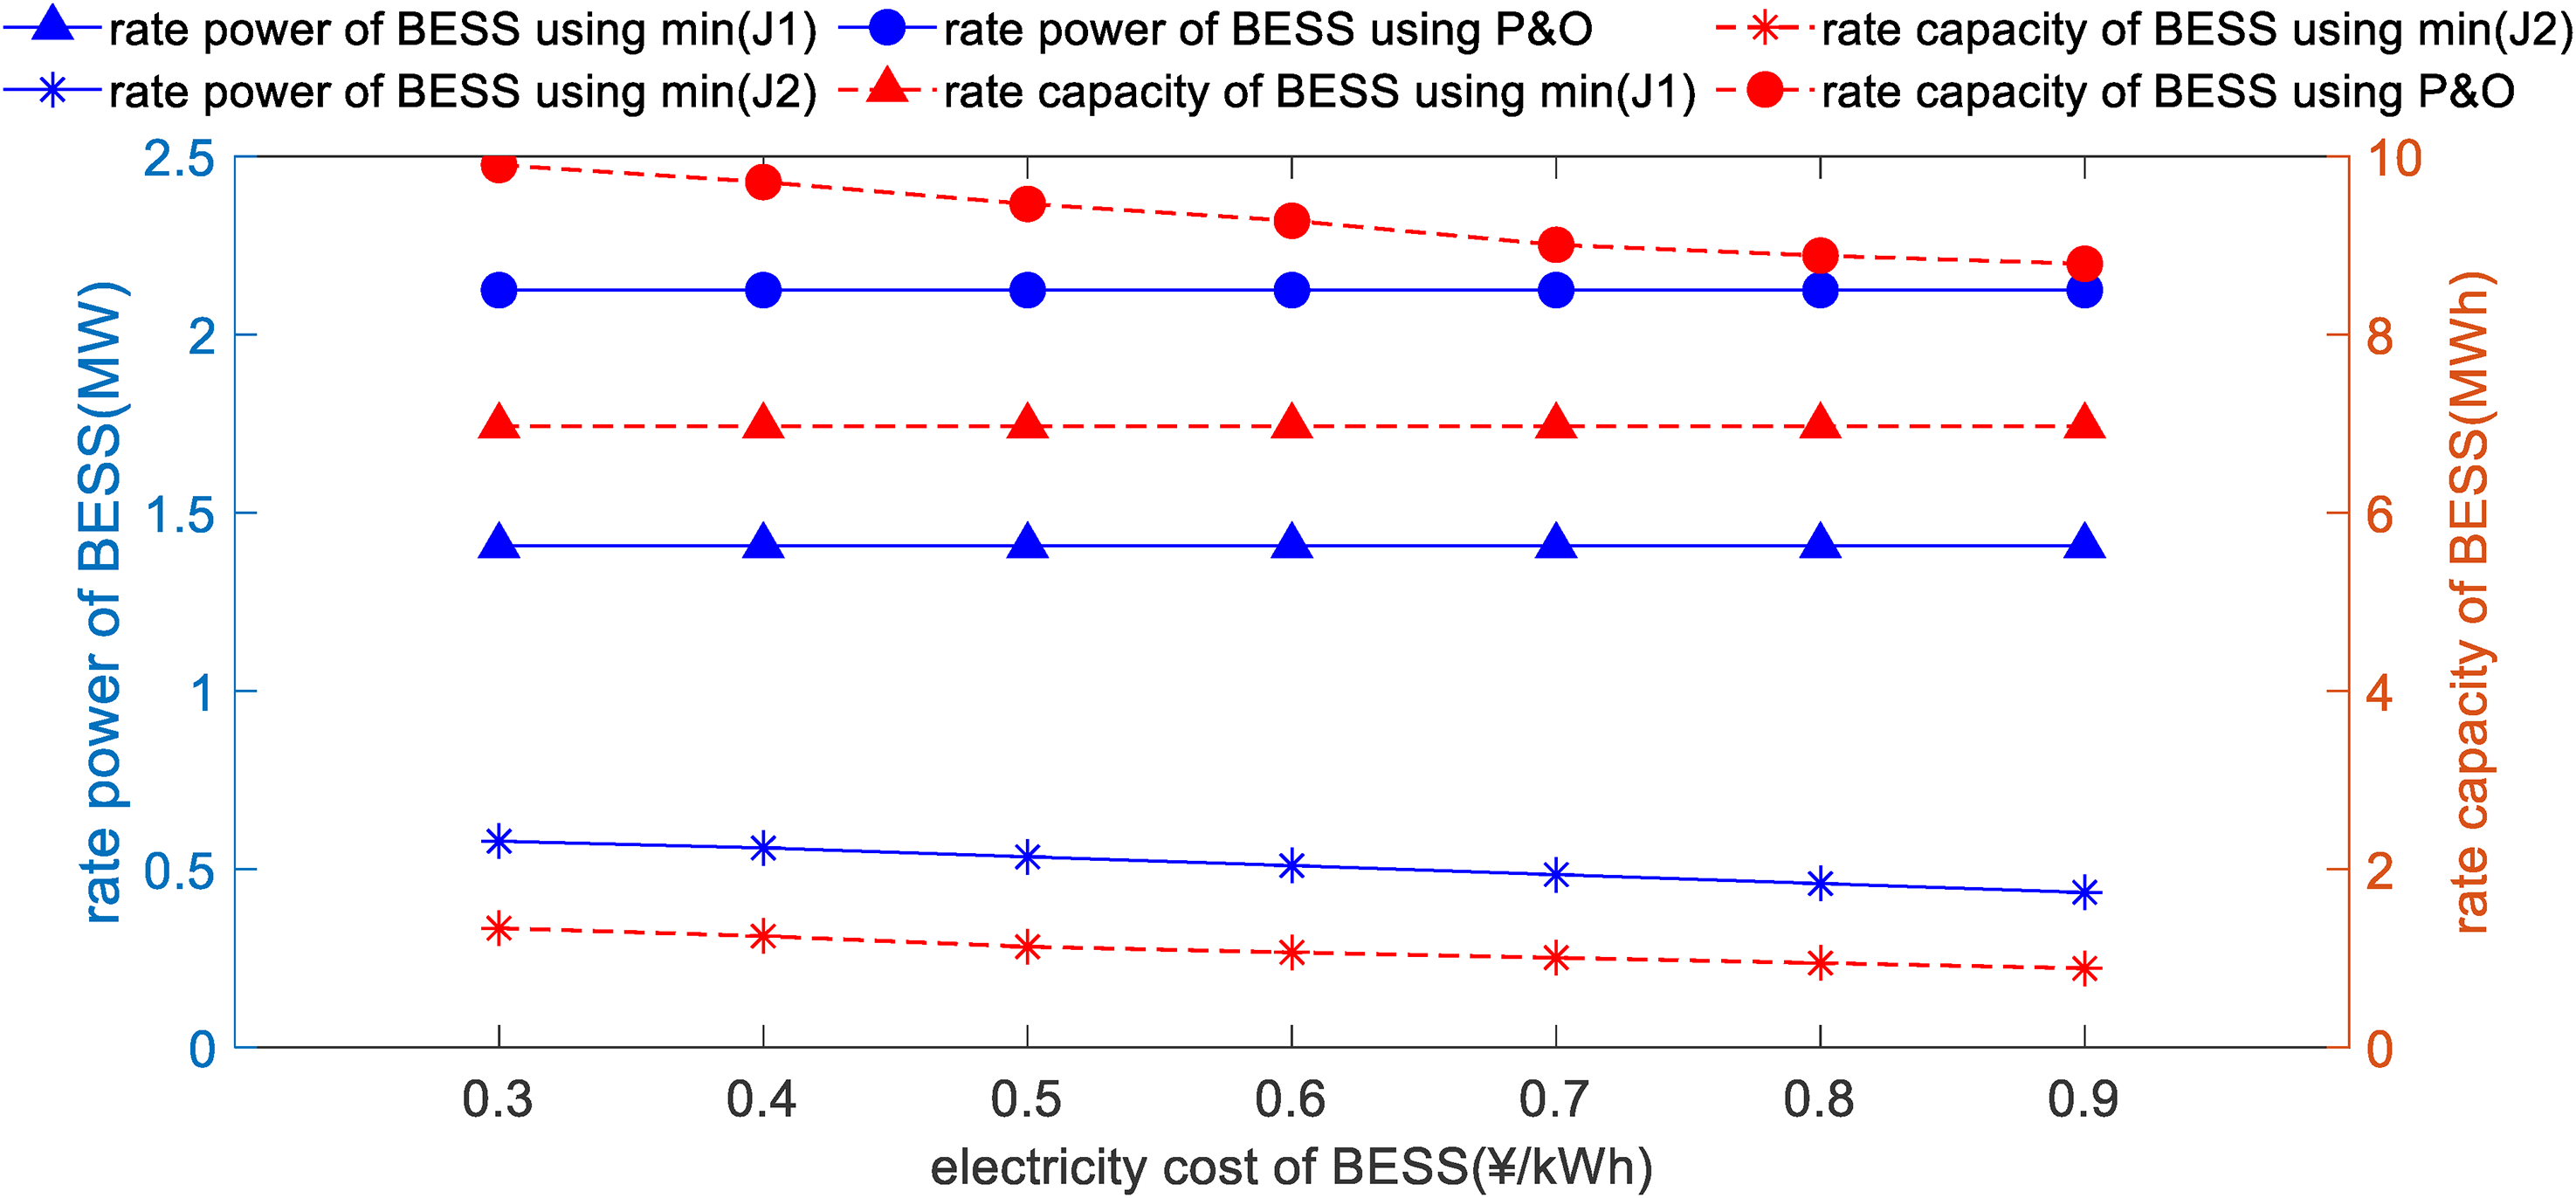
Rate power and capacity of BESS under the different electricity costs of BESS.
J1 and J2 value of optimization results under the different electricity costs of BESS.
BESS: battery energy storage system.
In Table 7, the cost per kWh of BESS has a minor impact on the value of the DES's energy loss J1, within 1%. But it has a significant effect on the DES's operational costs, up to 8.67%. The increase in cost per kWh of the BESS gradually raises the overall operational cost of DES. However, this increase is relatively slow and accounts for a small proportion of the total system costs. It implies that cost per kWh of the BESS does not constitute a high proportion of the operational costs of DES.
In Figure 9, if the optimization objective function is to minimize J1, it is evident that with the cost per kWh of the BESS increasing, there is almost no change in the rated power and capacity of the BESS. It is the reason that cost per kWh of BESS has a minor impact on energy loss of DES. However, when the optimization objective function is J2, the configuration results of the BESS drop. It is the reason that with cost per kWh of BESS rising, the output power of the BESS reduces. Further, the configuration results of the BESS can be lower. Using the proposed method, the rated power of the BESS remains essentially unchanged and the rated capacity gradually decreases. It means that to mitigate the rise of DES operational costs caused by the increase of BESS costs, the participation time of the BESS is continuously reduced. The above results indicate that cost per kWh of the BESS directly affects its actual output level and is a key element for the configuration capacity of BESS.
Analysis for different installation locations of BESS
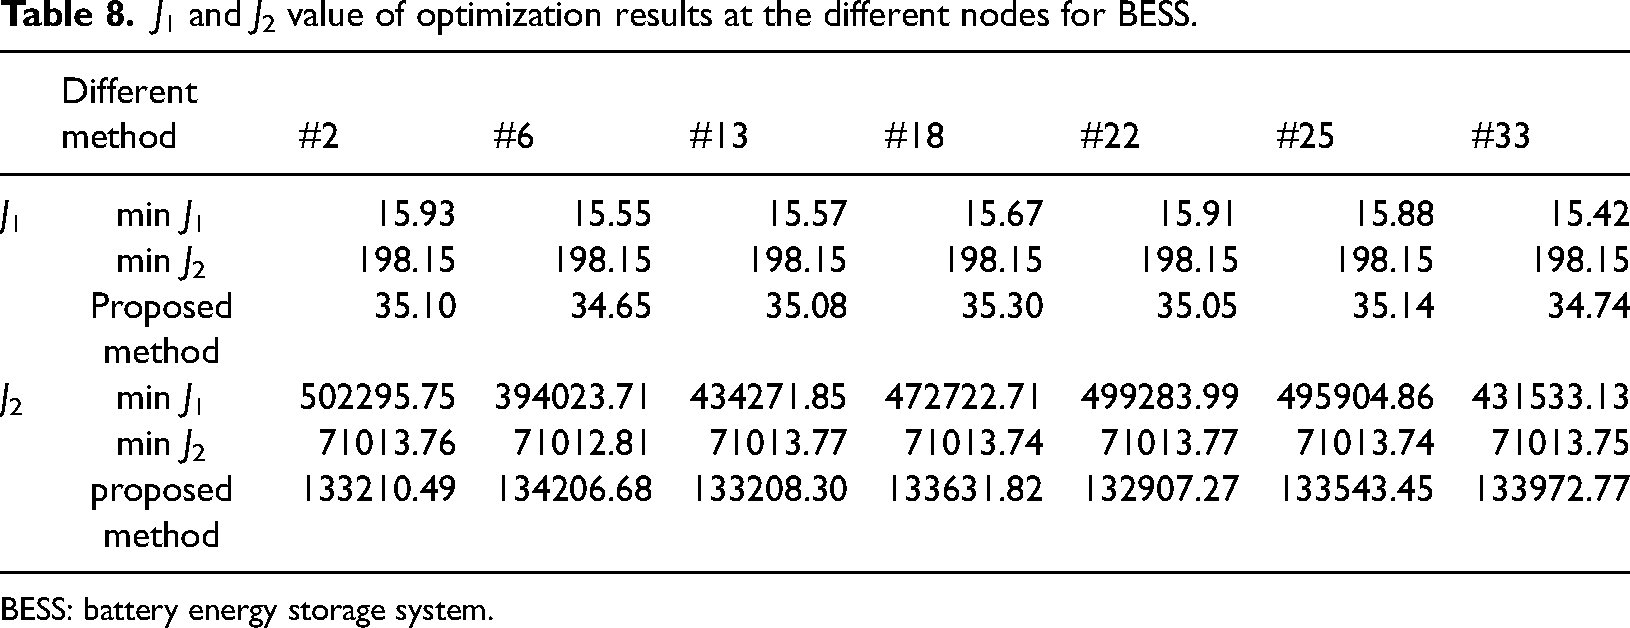
In addition to the rated power and capacity of the BESS, the deployment location of the BESS in DES has a serious impact on the operation of the overall system. Therefore, the deployment location of the BESS also can affect the capacity configuration results of the BESS. This section represents the results of deploying the BESS at some typical nodes for further analysis. Table 8 and Figure 10 show the objective function values and the capacity configuration results under the different installation locations of the BESS, respectively.
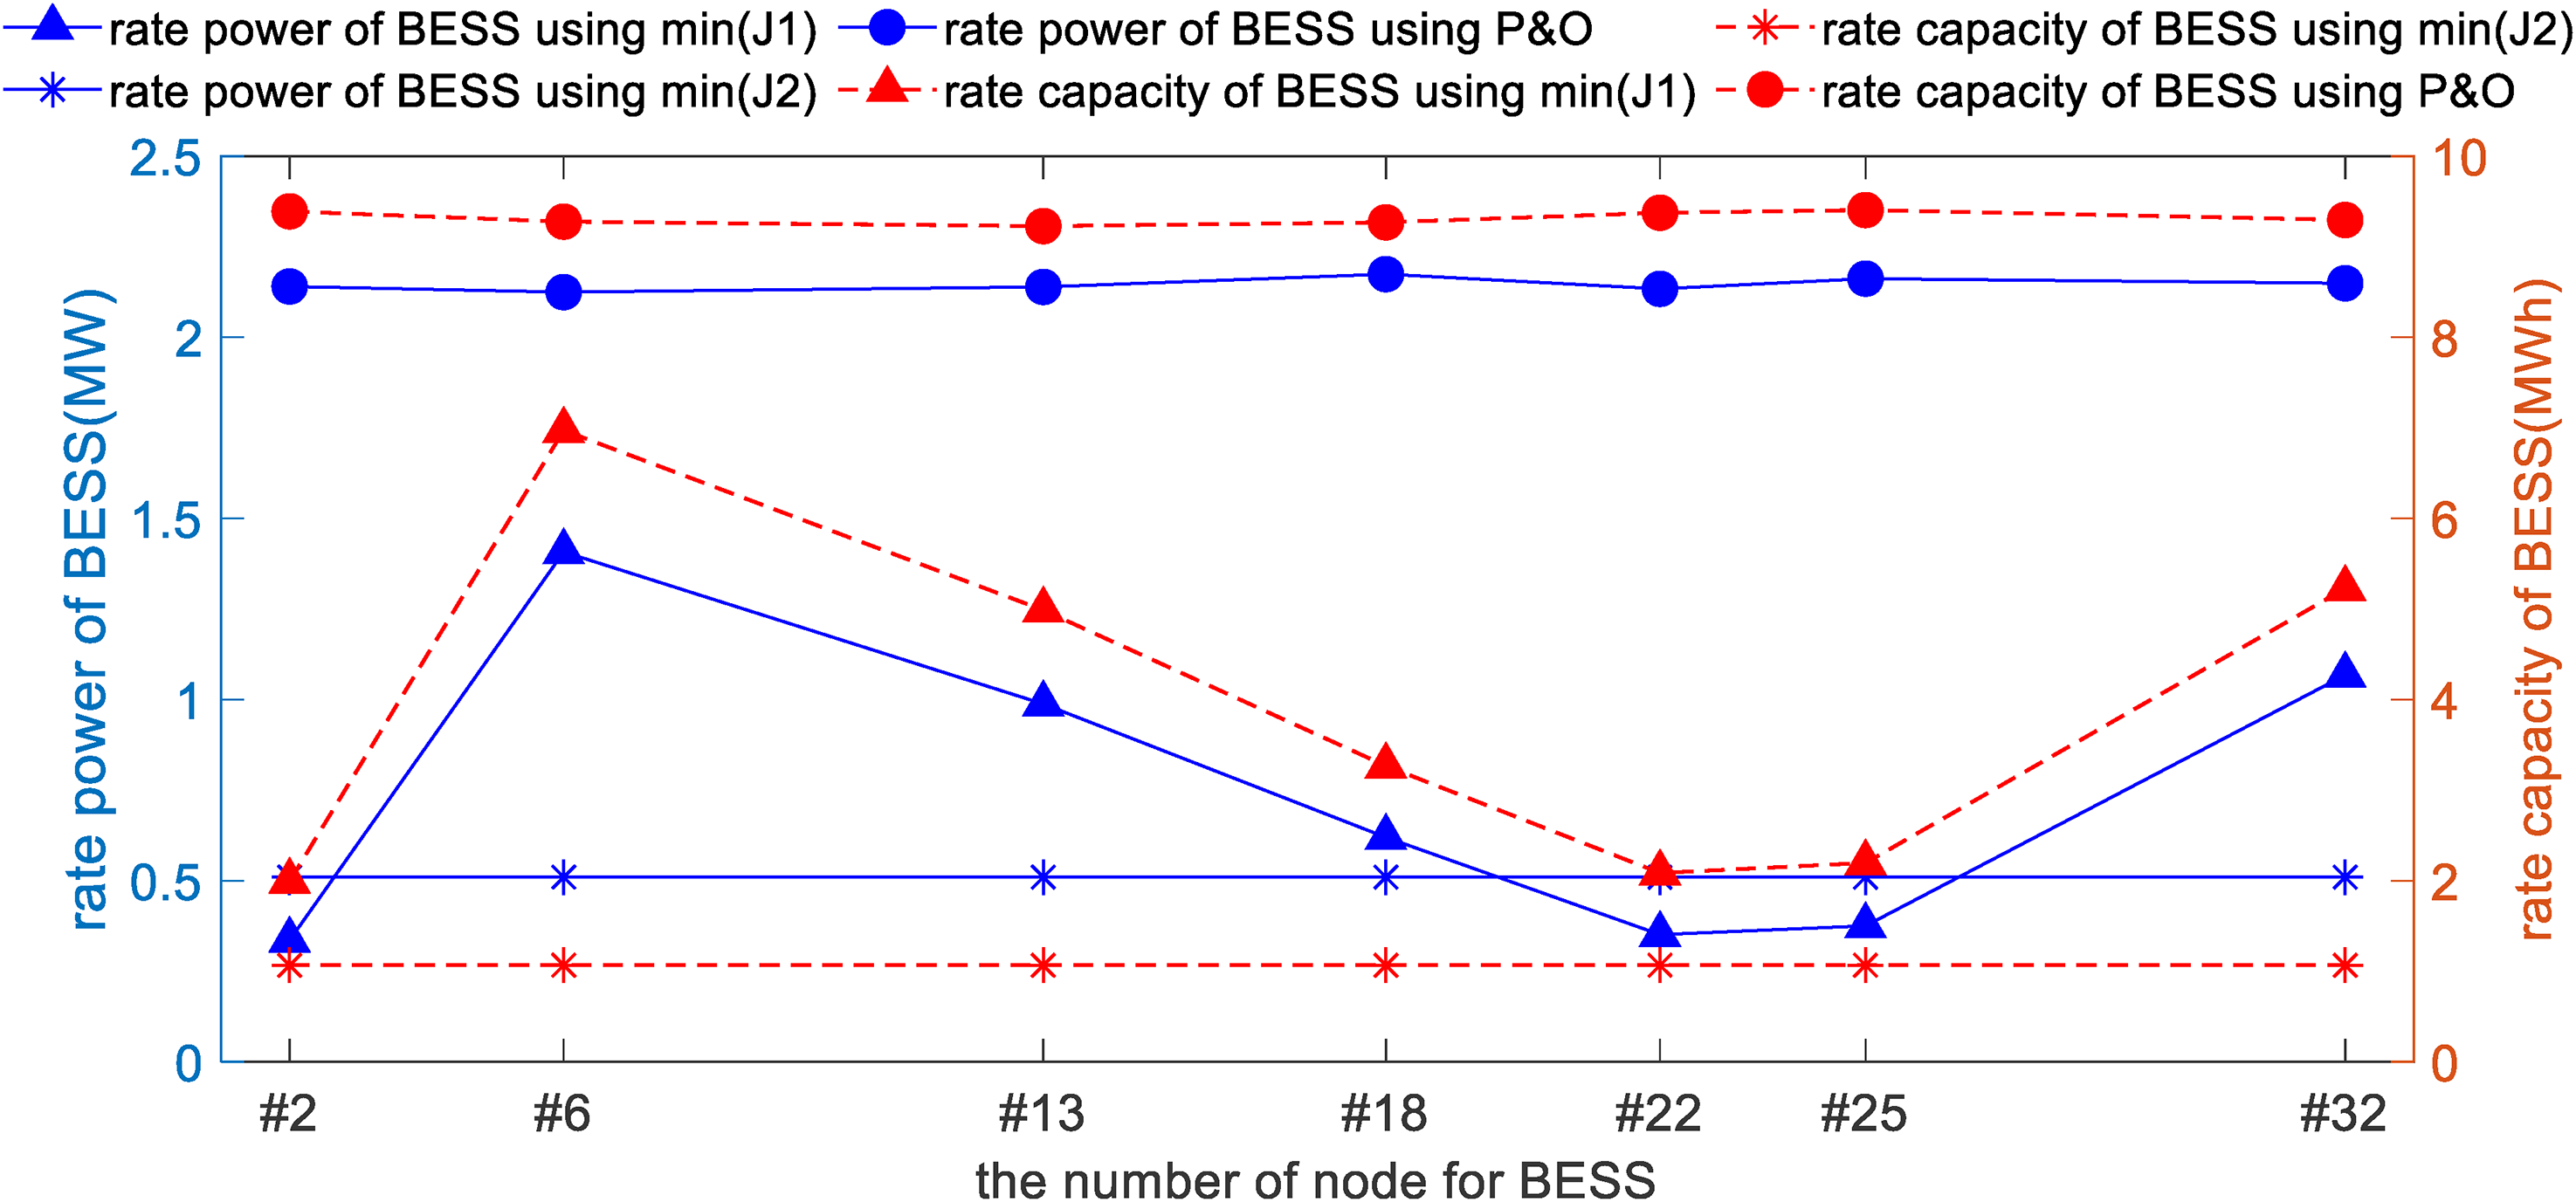
Rate power and capacity of BESS at the different nodes.
J1 and J2 value of optimization results at the different nodes for BESS.
BESS: battery energy storage system.
In Table 8, it is evident that different deployment locations of BESS can impact the energy loss J1 of the DES, but have minimal effect on the system's operational costs J2. The BESS configuration results are shown in Figure 10. Under minimizing the operational costs of the DES, the connection locations of the BESS have little impact on their configuration results. However, when considering system energy loss, the impact of different connection locations can be more than three-fold. Therefore, the energy loss is noteworthy under different connection locations of BESS. Based on the proposed method, while considering both optimization objective functions of the DES, configuration results are still influenced by the connection location of the BESS, albeit to a lesser extent.
Conclusions
To address the MOP exhibited in the configuration of the BESS in the DES, a P&O approach is proposed by the characteristics of slope changes on the Pareto frontier under a bi-objective optimization. Based on the search process of perturbation and observation, the relationship is described between the changes from the two optimization objectives to obtain a recommended solution. Compared to the results of two single objective optimization, the proposed method effectively balances the contradictions between them. The main conclusions are as follows.
Under different optimization objective functions, the rated power and capacity of BESS configurations can differ by about four and nine times, respectively. For the configuration of BESS, it is a key factor that selecting appropriate optimization objective function. A single optimization objective can easily lead to an imbalance in the overall system performance. The proposed method better balances the energy loss and economy optimization objectives. Compared with a single optimization objective J1, the proposed method decreases 2.23-fold in the J1 direction, but improves 2.94-fold in the J2 direction. And compared with J2, the proposed method increases 5.71-fold and drop 1.89-fold in the J1 and J2 direction, respectively. With the efficiency of BESS improving, the energy loss and operating costs of DES have slowly decreased by 5.16% and increased by 3.95%, respectively. And the rated power of BESS remains relatively constant, but the rated capacity gradually increases by 10%. With the electricity cost of BESS increasing, the operating cost of DES is significantly rising by 8.67%. When the economy of BESS is an objective function, it will be a key factor affecting the capacity of BESS. In addition, when the energy loss of BESS is an objective function, the configuration scheme of BESS at different nodes can differ by three-fold. The location of BESS in DES should be worth noting.
Currently, the proposed method is limited to address some BiOPs. Therefore, how to extend the proposed method to applications in an MOP involving more than two objectives will be a crucial issue of future research.
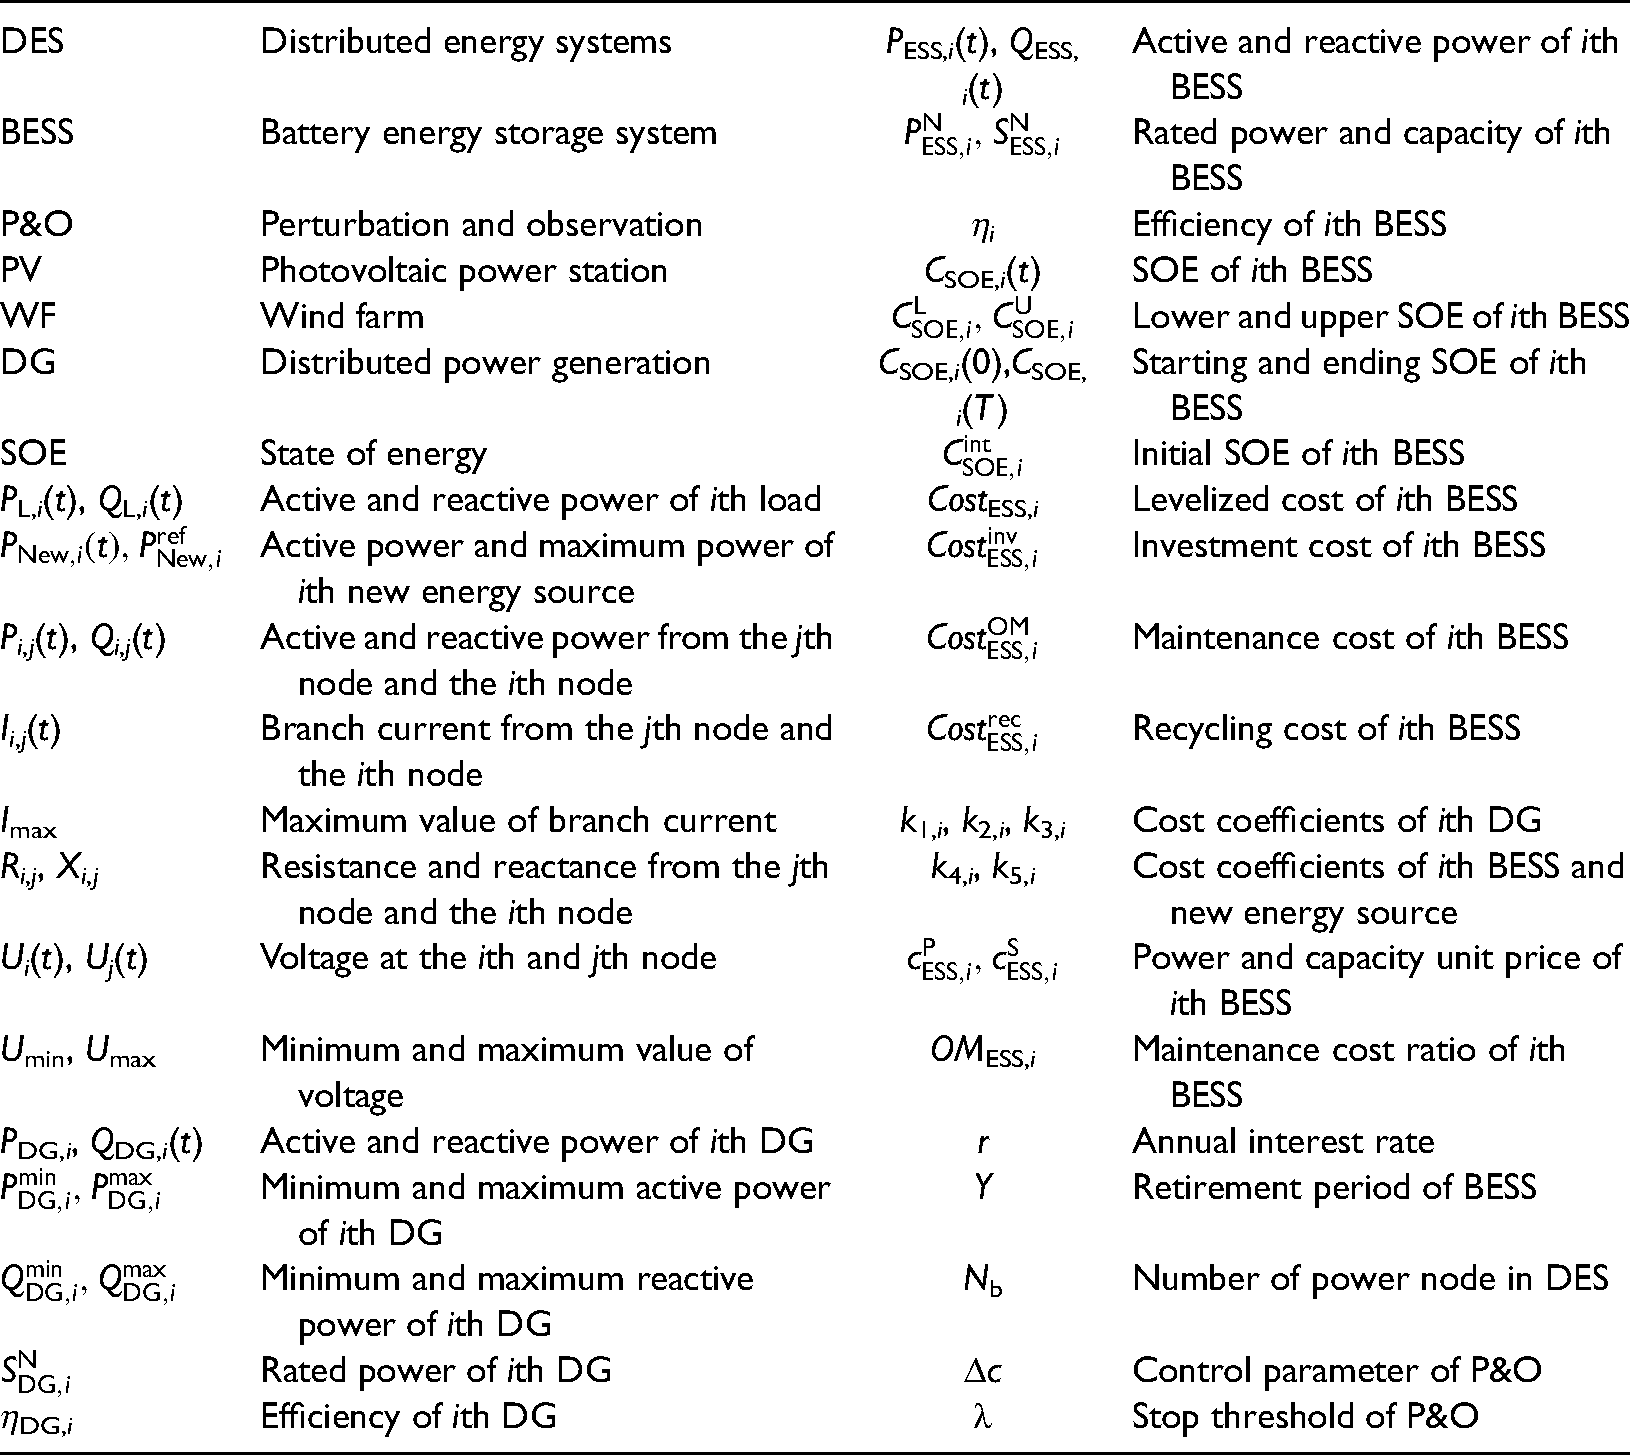
Nomenclature
Footnotes
Declaration of conflicting interests
The authors declared no potential conflicts of interest with respect to the research, authorship, and/or publication of this article.
Funding
The authors disclosed receipt of the following financial support for the research, authorship, and/or publication of this article: This research was funded by R&D Program of Beijing Municipal Education Commission (KM202410009013).