
Abstract
Wind energy systems are often located in remote areas or offshore, making maintenance and repair both expensive and logistically challenging. Fault-tolerant systems can assist in minimizing the frequency and urgency of maintenance, ultimately reducing operational costs. This study aims to design a simple and efficient Open-Phase Fault Tolerant (OPFT) control for a wind power system (WPS) based on an asymmetric six-phase induction generator using Finite-Set Predictive Power Control (FS-PPC). The suggested technique involves three key steps. Firstly, the current harmonics in the (x, y) plane are analyzed to discover faults. Then, open-phase localization is achieved using the Support Vector Machine (SVM) with hyperparameter Bayesian Optimization (BO). Finally, the phase that forms 90 degrees with the faulty phase is opened to restore the system’s stability. Importantly, this approach does not require reconfiguring the control algorithm while preserving the system’s effective performance. Simulation results demonstrate the effectiveness of the OPFT-SVM-PPC control strategy in preserving control over the machine while ensuring high energy quality for the grid with a THD of 2.71%. By implementing this fault tolerance control, the system can operate reliably and deliver high-quality power, even in the presence of open-phase faults.
Keywords
Introduction
Wind power systems (WPS) are devices that harness the energy of the wind and convert it into useful electrical energy. They play a crucial role in the development of renewable energy generation and the reduction of greenhouse gas emissions (Hamoudi et al., 2023a). WECS is made up of wind turbines, electrical generators, power conditioning units, and control systems. WECS provides benefits such as clean and inexhaustible energy, minimal operational costs, and decreased carbon emissions (Patil and Mulla, 2022). However, difficulties include inconsistent wind availability and significant environmental consequences. Despite these obstacles, wind energy conversion systems contribute to the worldwide transition towards more sustainable and greener energy sources.
Fault tolerance is crucial for the efficient and reliable operation of wind power systems. It maximizes energy production, improves safety, extends the equipment lifespan, ensures grid stability, lowers operating costs and contributes to the environmental and economic sustainability of wind energy projects. Particularly electrical faults such as open-phase fault tolerance (Ustun et al., 2012). An open-phase problem occurs when any of the machine's six phases becomes disconnected or fails. In conventional three-phase machines, an open-phase fault would typically result in the machine shutting down or performing poorly. However, six-phase induction machines exhibit enhanced tolerance to this sort of fault.
Asymmetric Six-Phase Induction Generator (ASIG) has gained significant attention due to its potential for high reliability, power segmentation, excellent power quality in critical applications, and fault tolerance (Hamoudi et al., 2023b). In the case of a fault or failure in one of the phases, the generator can continue to run and generate electricity utilizing the other undamaged phases. This redundancy enhances system reliability and availability, reducing power interruptions (Mamdouh and Abido, 2023).
The natural open-phase fault tolerance in ASIG can be attributed to the redundancy provided by the extra phases. If a phase fails, the machine can still operate using the other five phases. This redundancy enables continuous generation of torque and power, allowing the machine to operate with less disruption (Prieto et al., 2020; Yang et al., 2023).
Predictive control, a model-based control approach, has demonstrated promising results in various applications. Especially in multiphase machine control (Rodas et al., 2021). By employing FS-MPC techniques, the performance of the ASIG can be significantly enhanced in terms of power quality, dynamic response, and stability (Durán et al., 2021; Gonzalez-Prieto et al., 2021). When transitioning from healthy to fault-tolerant operation modes, existing fault-tolerant FS-MPC techniques often need extensive modifications to the control algorithm’s design (Guzman et al., 2014). Revealed the earliest application of fault-tolerant predictive current control (FT-PCC) for five-phase IM. This technique necessitates changes to both the system model and the standard vector space decomposition (VSD) transformation (Huang et al. 2012). Work by Lu et al. (2017) describes an application of this approach for six-phase PMSM, in which the cost function only checks the current of the healthy phases. Both solutions provided by Guzman et al. (2014) and Lu et al. (2017) use just one voltage vector (VV) during a sample time, resulting in significant harmonic in the (x–y) plane. To overcome this constraint, Lu et al. (2018) provided an enhanced FT-PCC with an optimum voltage vector, while the method of Lu et al. (2019) synthesizes the selected voltage vector using a carried-based PWM step. In contrast with the earlier methodologies, the FT-PCC in both Luo and Liu (2019) and Sun et al. (2022) treat this type of fault (open phase fault) as a disturbance that may be adjusted. As a result, under both healthy and fault-tolerant circumstances, the VSD transformation, cost function, and model used are the same. However, these techniques necessitate computing distinct references for every fault situation. Gonzalez-Prieto et al. (2020) provided a simplified fault-tolerant PCC technique approach that takes advantage of virtual voltage vectors (VVV). Because this approach does not regulate the x–y currents, any future conflict between the regulation of the
However, challenges remain in fully optimizing performance and handling diverse fault scenarios without introducing additional complexity (Abdolrasol et al., 2021). For that, this paper offers a novel Fault-Tolerant Predictive Power Control (FT-PPC) technique for an asymmetric six-phase generator without control reconfiguration by enhancing the solution presented by Gonzalez-Prieto et al. (2020).
This study focuses on the usage of FS-PPC developed by Hamoudi et al. (2023b) for efficient control of ASIG systems. The fundamental goal of this research is to design a control system that ensures high reliability and excellent power quality for a specific application, namely, a wind power system based on an ASIG under open phase fault. The suggested control technique is intended to address open-phase faults, which can potentially disrupt the system's operation and stability.
The control method proposed in this research involves three key steps. Firstly, fault detection is performed by analyzing the current harmonics in the (x, y) plane. This analysis allows for the detection of faults within the system. Subsequently, the open phase identification and localization are achieved using a supervised machine learning technique named Support Vector Machine (SVM), combined with hyper-parameter Bayesian Optimization (BO). This step enables not only the distinction of the open phase fault but also its exact localization, facilitating subsequent corrective actions. The final step in the suggested control approach is the opening of the phase, which forms a 90-degree angle with the faulty phase, which helps to restore system stability. Notably, this fault tolerance control approach does not require the reconfiguration of the control algorithm, thus guaranteeing that the system's behavior remains consistent with a healthy operating condition.
SVM machine learning was used to obtain accurate open-phase identification and localization. SVM, known for its capability to handle non-linear data and achieve high classification accuracy, proved to be effective in accurately localizing open-phase faults (Chen et al., 2021). Moreover, the integration of hyperparameter Bayesian optimization (BO) further enhanced the accuracy of the SVM technique.
The efficiency of the proposed fault tolerance control strategy was evaluated through extensive simulations. The results demonstrated that the OPFT-SVM-PPC (Open Phase Fault Tolerant-Support Vector Machine-Predictive Power Control) technique efficiently maintained control over the machine while ensuring good energy quality for the grid. By implementing the fault tolerance control system, ASIG-based WECS systems can operate consistently and produce high-quality power, notwithstanding the existence of open-phase defects. This is an essential need for sensitivity for critical applications that demand high reliability and excellent power quality.
The contributions of this paper are:
Application of an open phase fault tolerance PPC for the first time for the control of ASIG. Application of the machine learning algorithms with hyperparameters optimization for the localization of open phase fault. Restore the stability of the system under OPF without reconfiguration of the control algorithm by opening the phase that forms a 90 degree angle with the defective phase.
In the subsequent sections of the paper, the modelling approach for ASIG will be discussed in Modeling approach for asymmetric six-phase induction machines section. This will cover the mathematical representation of these machines, considering their unique characteristics in wind energy conversion systems. Model predictive power control section will delve into Model Predictive Power Control, explaining how this control strategy can optimize the performance of asymmetric six-phase induction machines. Proposed SVM-PPC section will focus on the proposed predictive power control using support vector machines. Configuration of the SVM algorithm section will focus on the configuration of the SVM algorithm, and its hyperparameter optimization using BO. The SVM algorithm is applied to open-phase fault localization, where the training result of the SVM classification and its test results are reported in SVM training and test results section. After all, SVM-OPFT-PPC simulation results section will showcase the simulation results of the OPFT-SVM-PPC approach, demonstrating its effectiveness in enhancing the performance and efficiency of ASIG under open-phase fault conditions.
Modeling approach for asymmetric six-phase induction machines
Multi-phase induction machines, especially asymmetric six-phase induction machines, are a promising technology in wind energy conversion systems. They provide benefits such as better fault tolerance, decreased torque ripple, and power segmentation. Modelling these machines accurately is crucial for designing efficient wind turbine systems. The modelling technique entails creating a mathematical description of their electrical and mechanical behavior, allowing analysis, optimization, and control under various conditions. Wind energy conversion system modelling must consider factors like variable wind speed, turbulence, and complex machine-grid interaction. Generator parameters, such as winding configurations, resistances, and inductances, are identified in the modelling process. Choosing the reference frame, like the stationary reference frame (abc) is important for capturing machine dynamics accurately. See Figure 1 for the ASIG wind energy conversion system.
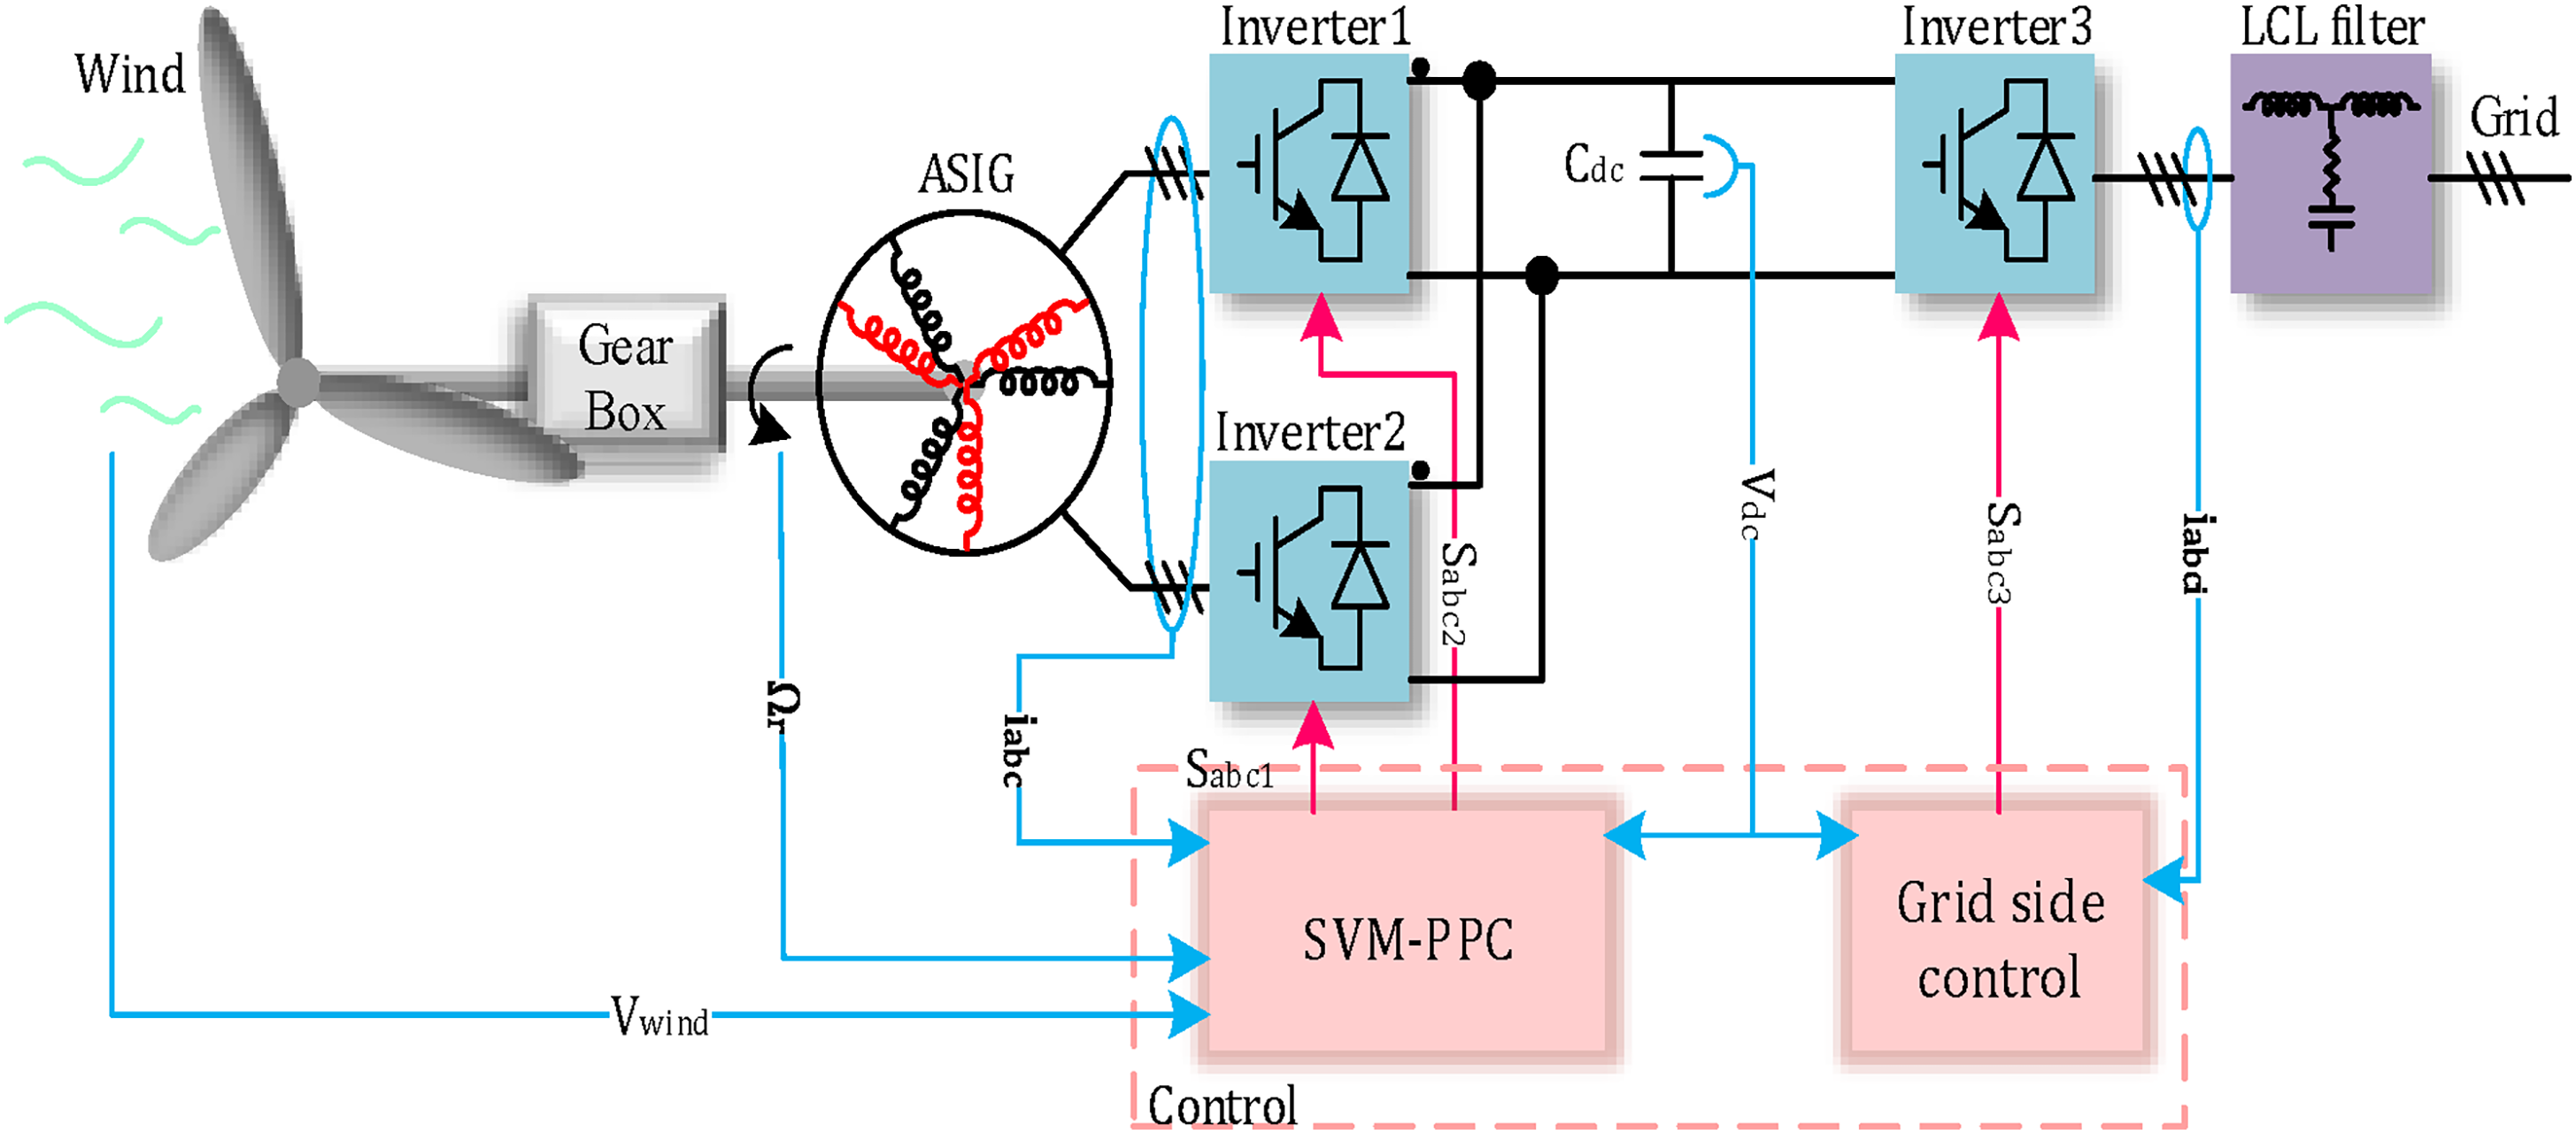
The ASIG wind energy conversion system.
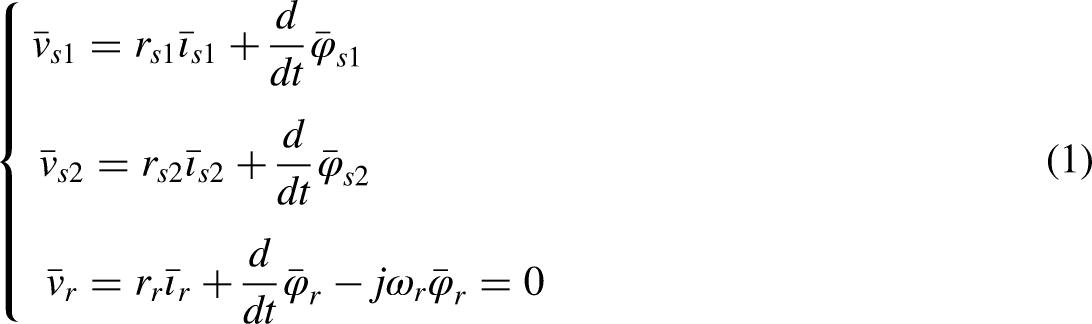
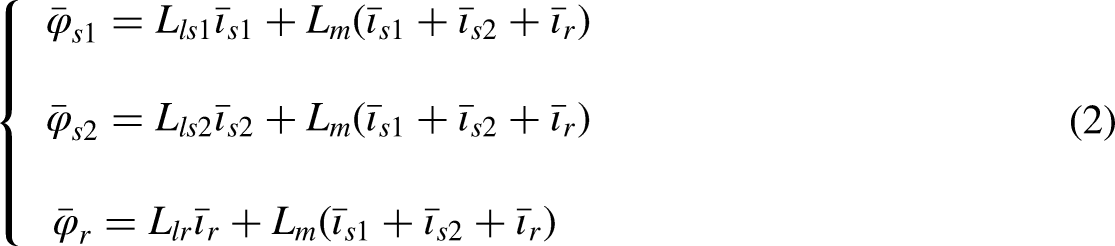
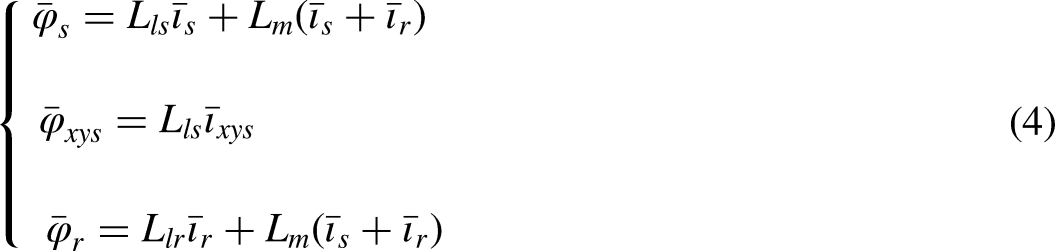
The modelling approach for asymmetric six-phase induction machines involves the essential steps, including identifying machine parameters, defining the reference frame, formulating electrical equations, considering asymmetry effects, determining mechanical equations, solving the equations, validating the model, and performing system-level analysis (Che et al., 2014; Mamdouh et al., 2022). The machine is made up of twin identical stars in the stator that shift by 30 degrees. The rotor is a squirrel cage, but for convenience, it is referred to as a short-circuited three-phase winding (Abdel-Khalik et al., 2019). The mathematical representation of the voltage equations for a six-phase induction machine as in equation (1).

Model predictive power control
Predictive control, which is a model-based control strategy, has shown promising outcomes in a range of applications.
When extending the three-phase finite set predictive Power control (FS-PPC) approach to a six-phase machine, a significant presence of current harmonics is observed. To mitigate this issue, an adaptation is required by introducing the virtual voltage vector (VVV) concept, which ensures power control and eliminates the (x, y) components of the stator currents.
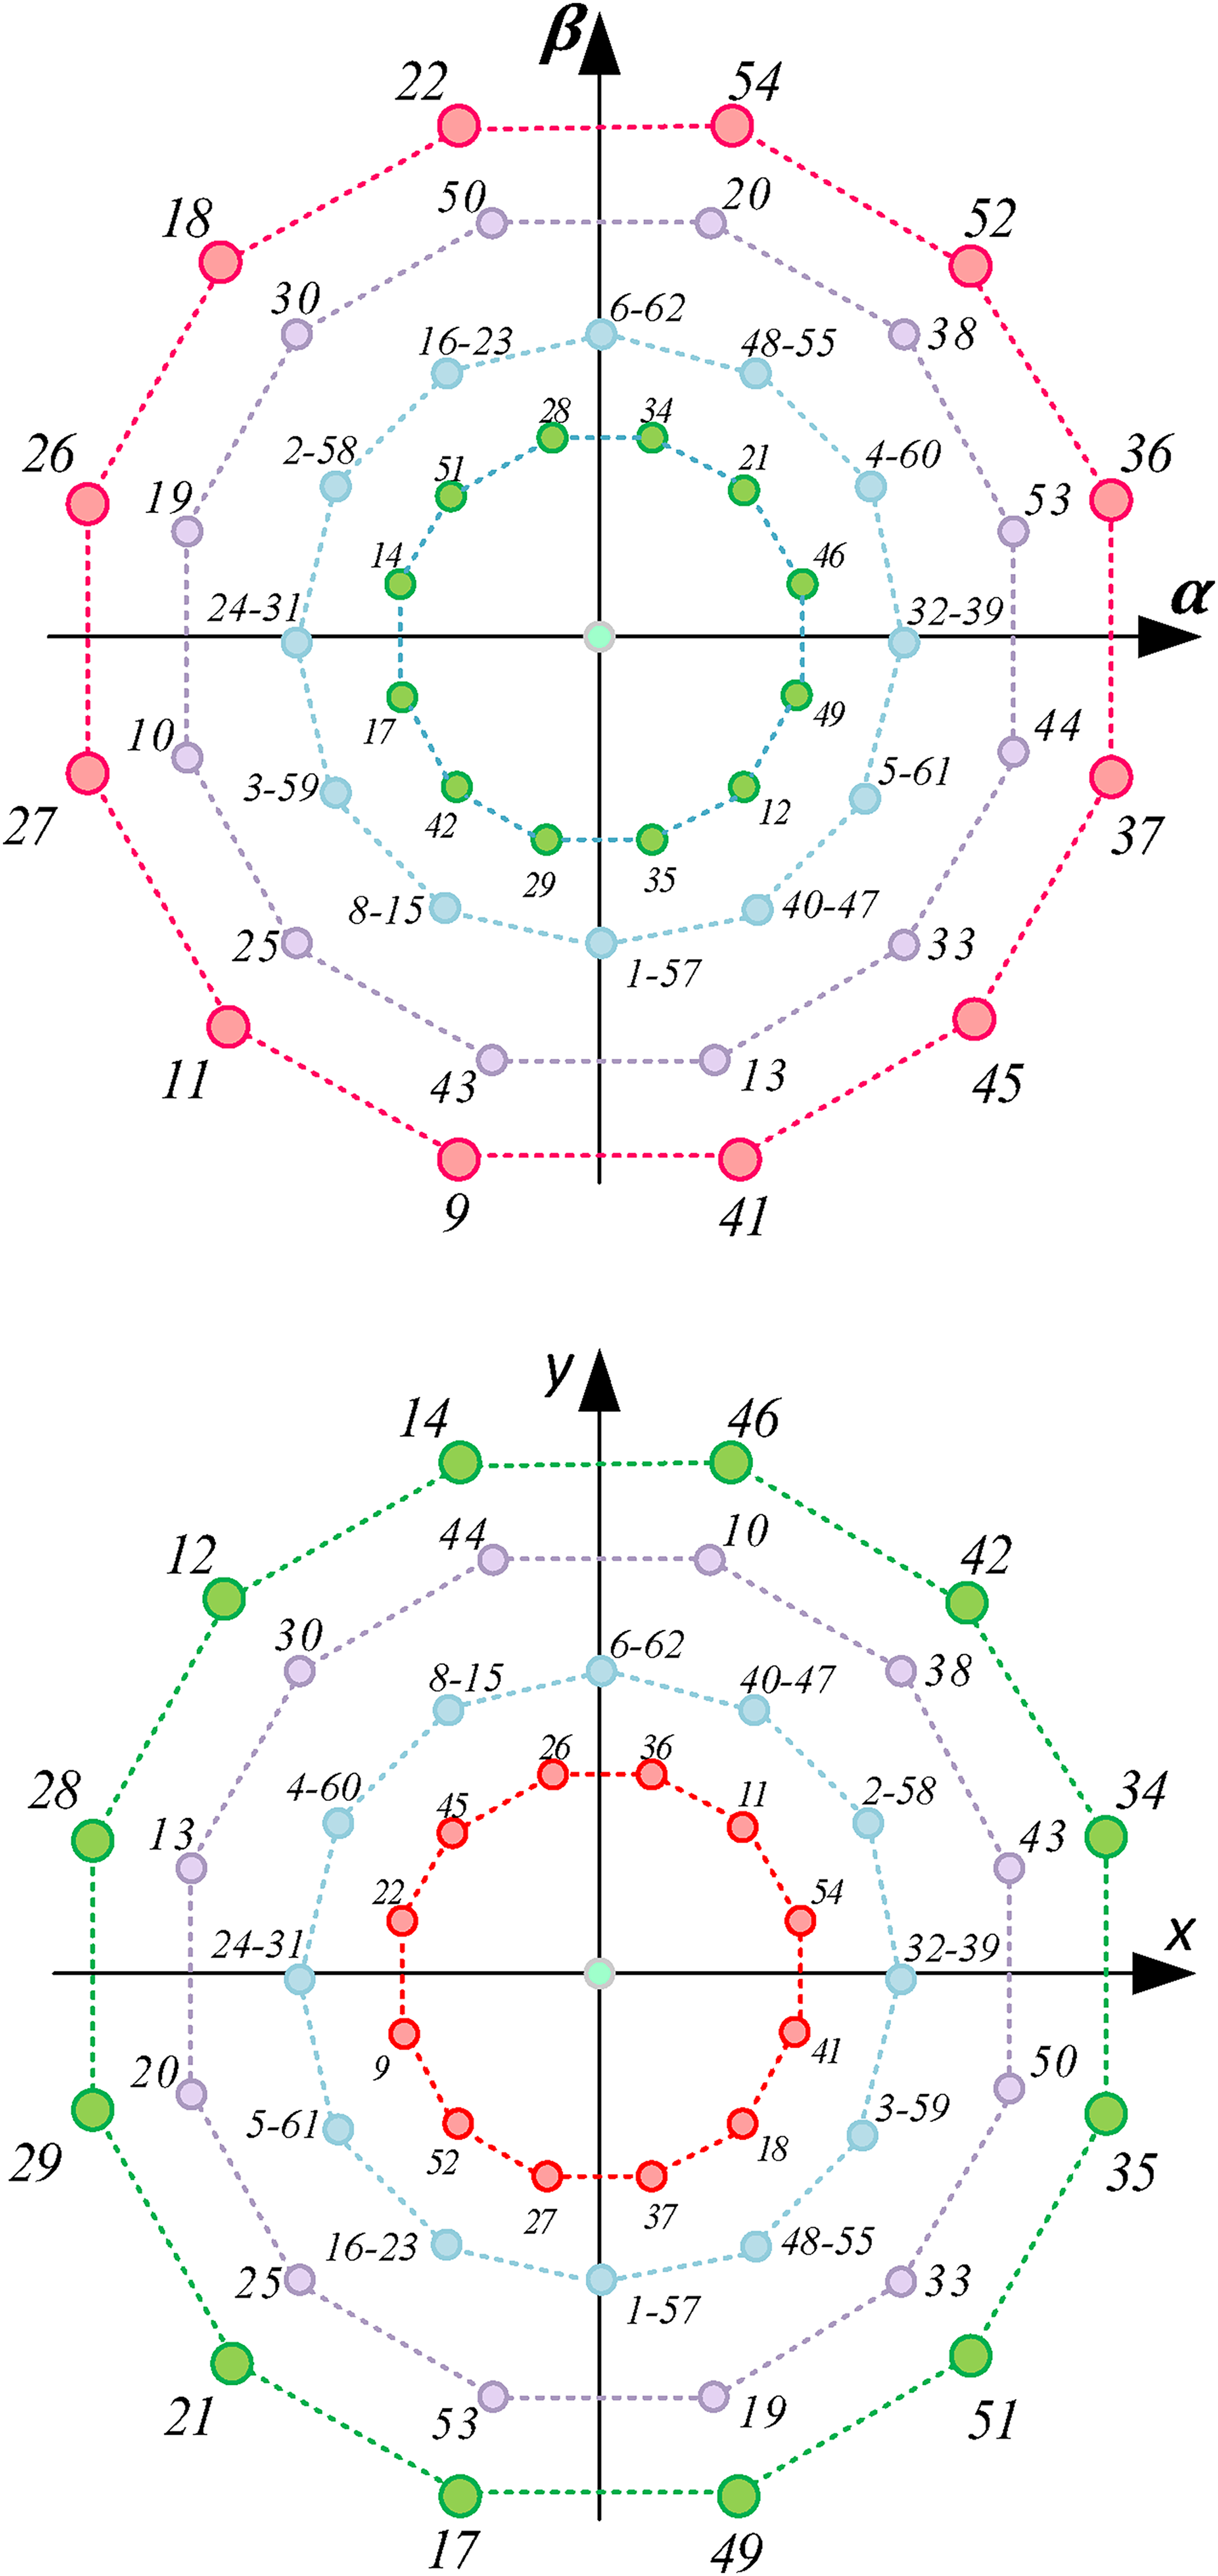
Virtual Voltage Vectors is a technique used in multiphase machines to achieve control objectives and eliminate (x, y) components of stator currents. They enhance system performance by providing flexibility in manipulating voltage vectors, reducing current harmonics, and improving power conversion efficiency. A two-level six-phase inverter may apply 64 vectors to an ASIG, 49 of which are unique. These vectors are distributed as follows: 12 large vectors, 12 medium-large vectors, 12 medium vectors, 12 small vectors, and one null vector. Each applied voltage vector contains one component in the (α,β)subspace and another component in the (x,y) subspace, see Figure 2. To eliminate the (x,y) components, two voltage vectors are applied at each sample time

Voltage vectors in the –
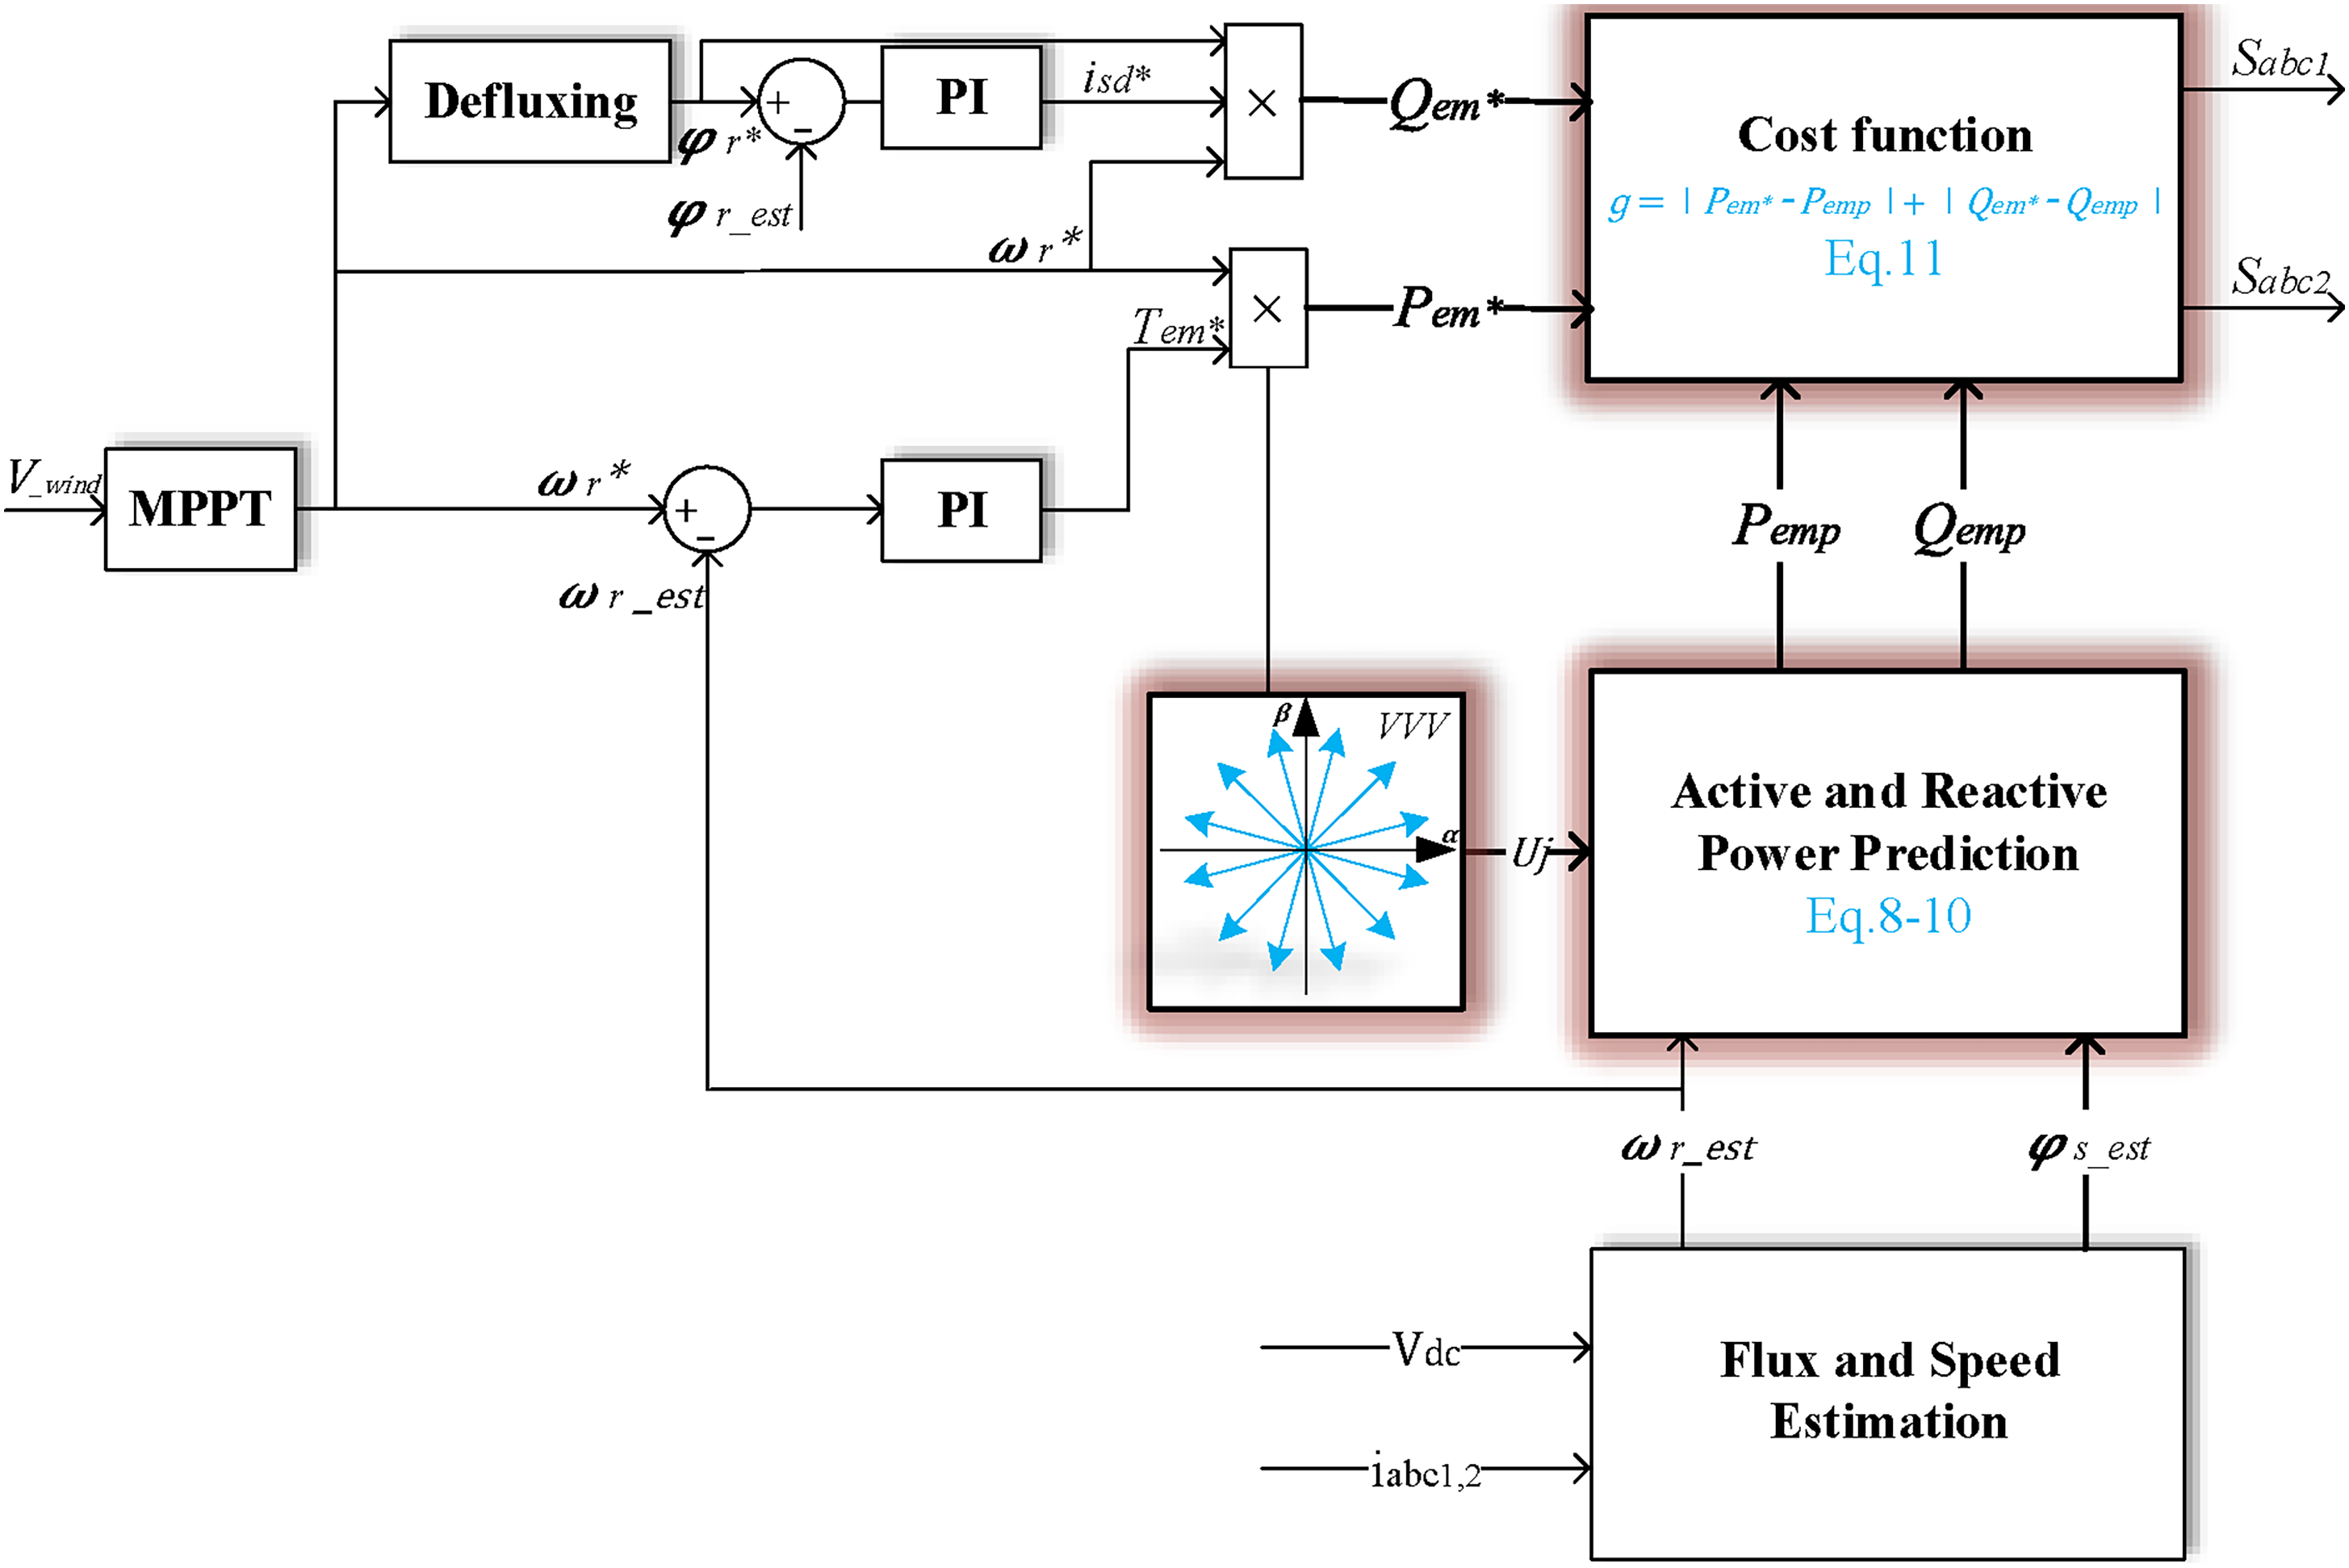
To apply the VVV in the FS-PPC control, we use the model of the ASIG presented in Modeling approach for asymmetric six-phase induction machines section. The modifications made to the FS-PPC are as follows:
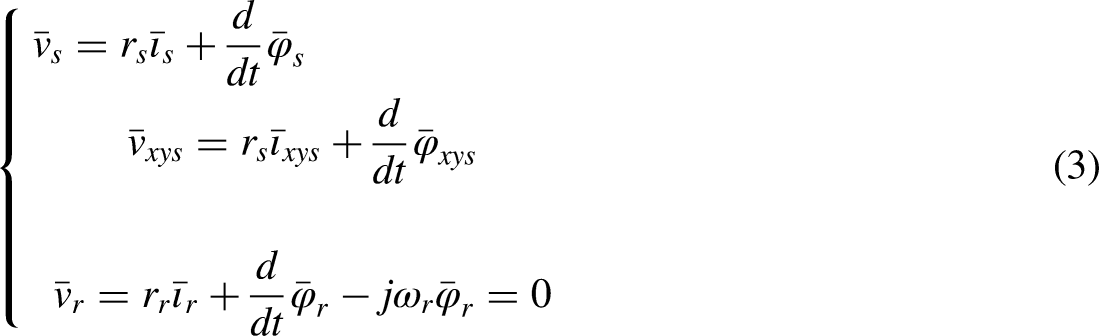
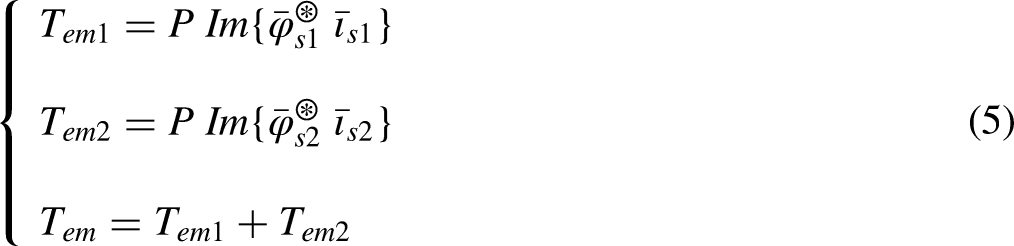
First: Prediction of the total active and reactive power through the measured currents and flux value. This prediction is made using the forward Euler discretization of the ASIG model described in Modeling approach for asymmetric six-phase induction machines section (Equations 3–6), as illustrated in the mathematical relationships for different variables in the system. Equation (8) defines the update rule for the predicted stator flux, incorporating the previous value, sampling time (


Virtual voltage vectors predictive power control.
Proposed SVM-PPC
This study focuses to enhance the FS-PPC presented in the previous section to tolerate the open phase fault. The proposed fault tolerance control is based on the ASIG stator winding being treated as three two-phase submachines, as shown in Figure 4. In healthy conditions, there are 12 virtual voltage vectors in the ASIG with the same amplitude and equitably distributed (see Figure 4(a)). After an open phase fault, these VVV are deformed and present different amplitudes, which deteriorate the ASIG control performance (see Figure 4(b)). To balance the VVV amplitudes, we propose opening a second phase that forms 90-degree angle with the defective phase, resulting in four balanced VVV are obtained (see Figure 4(c)). The ability to function with two balanced two-phase systems ensures that the machine operates smoothly, without introducing significant imbalances that could lead to excessive wear or damage to the motor or associated components.
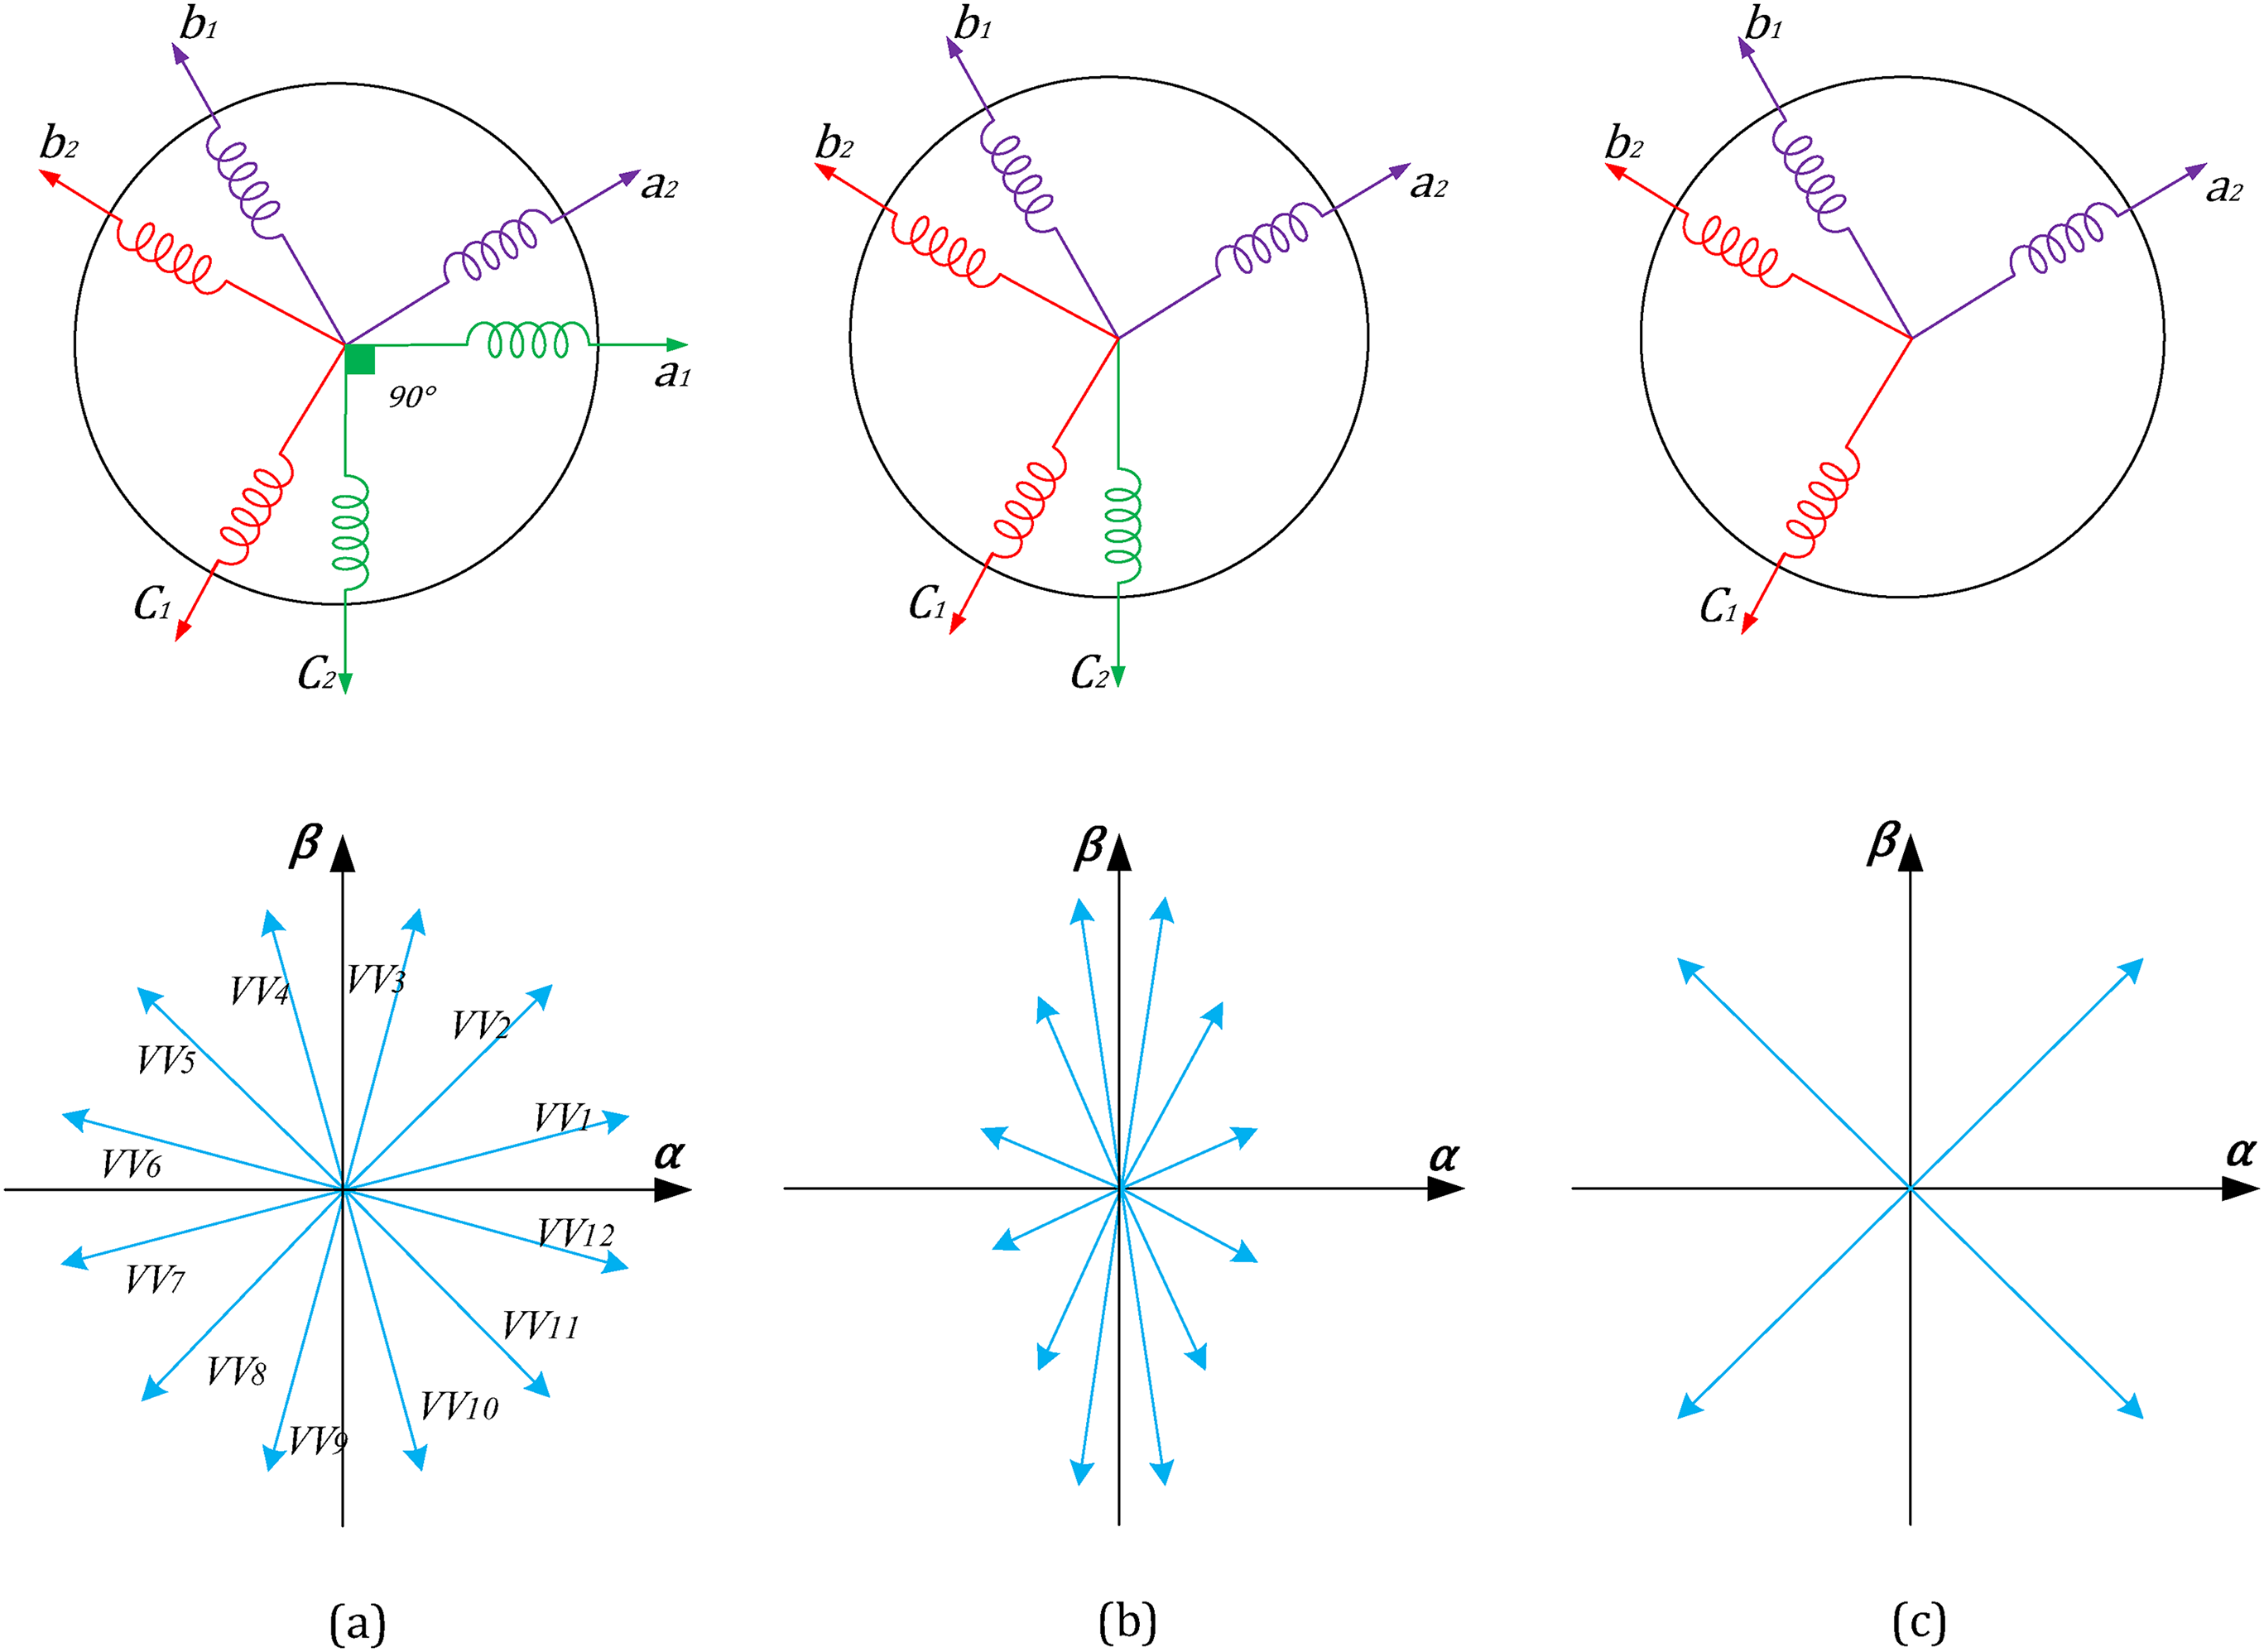
Virtual voltage vectors for: (a) healthy conditions; (b) one open phase fault; (c) after the opening of the second phase.
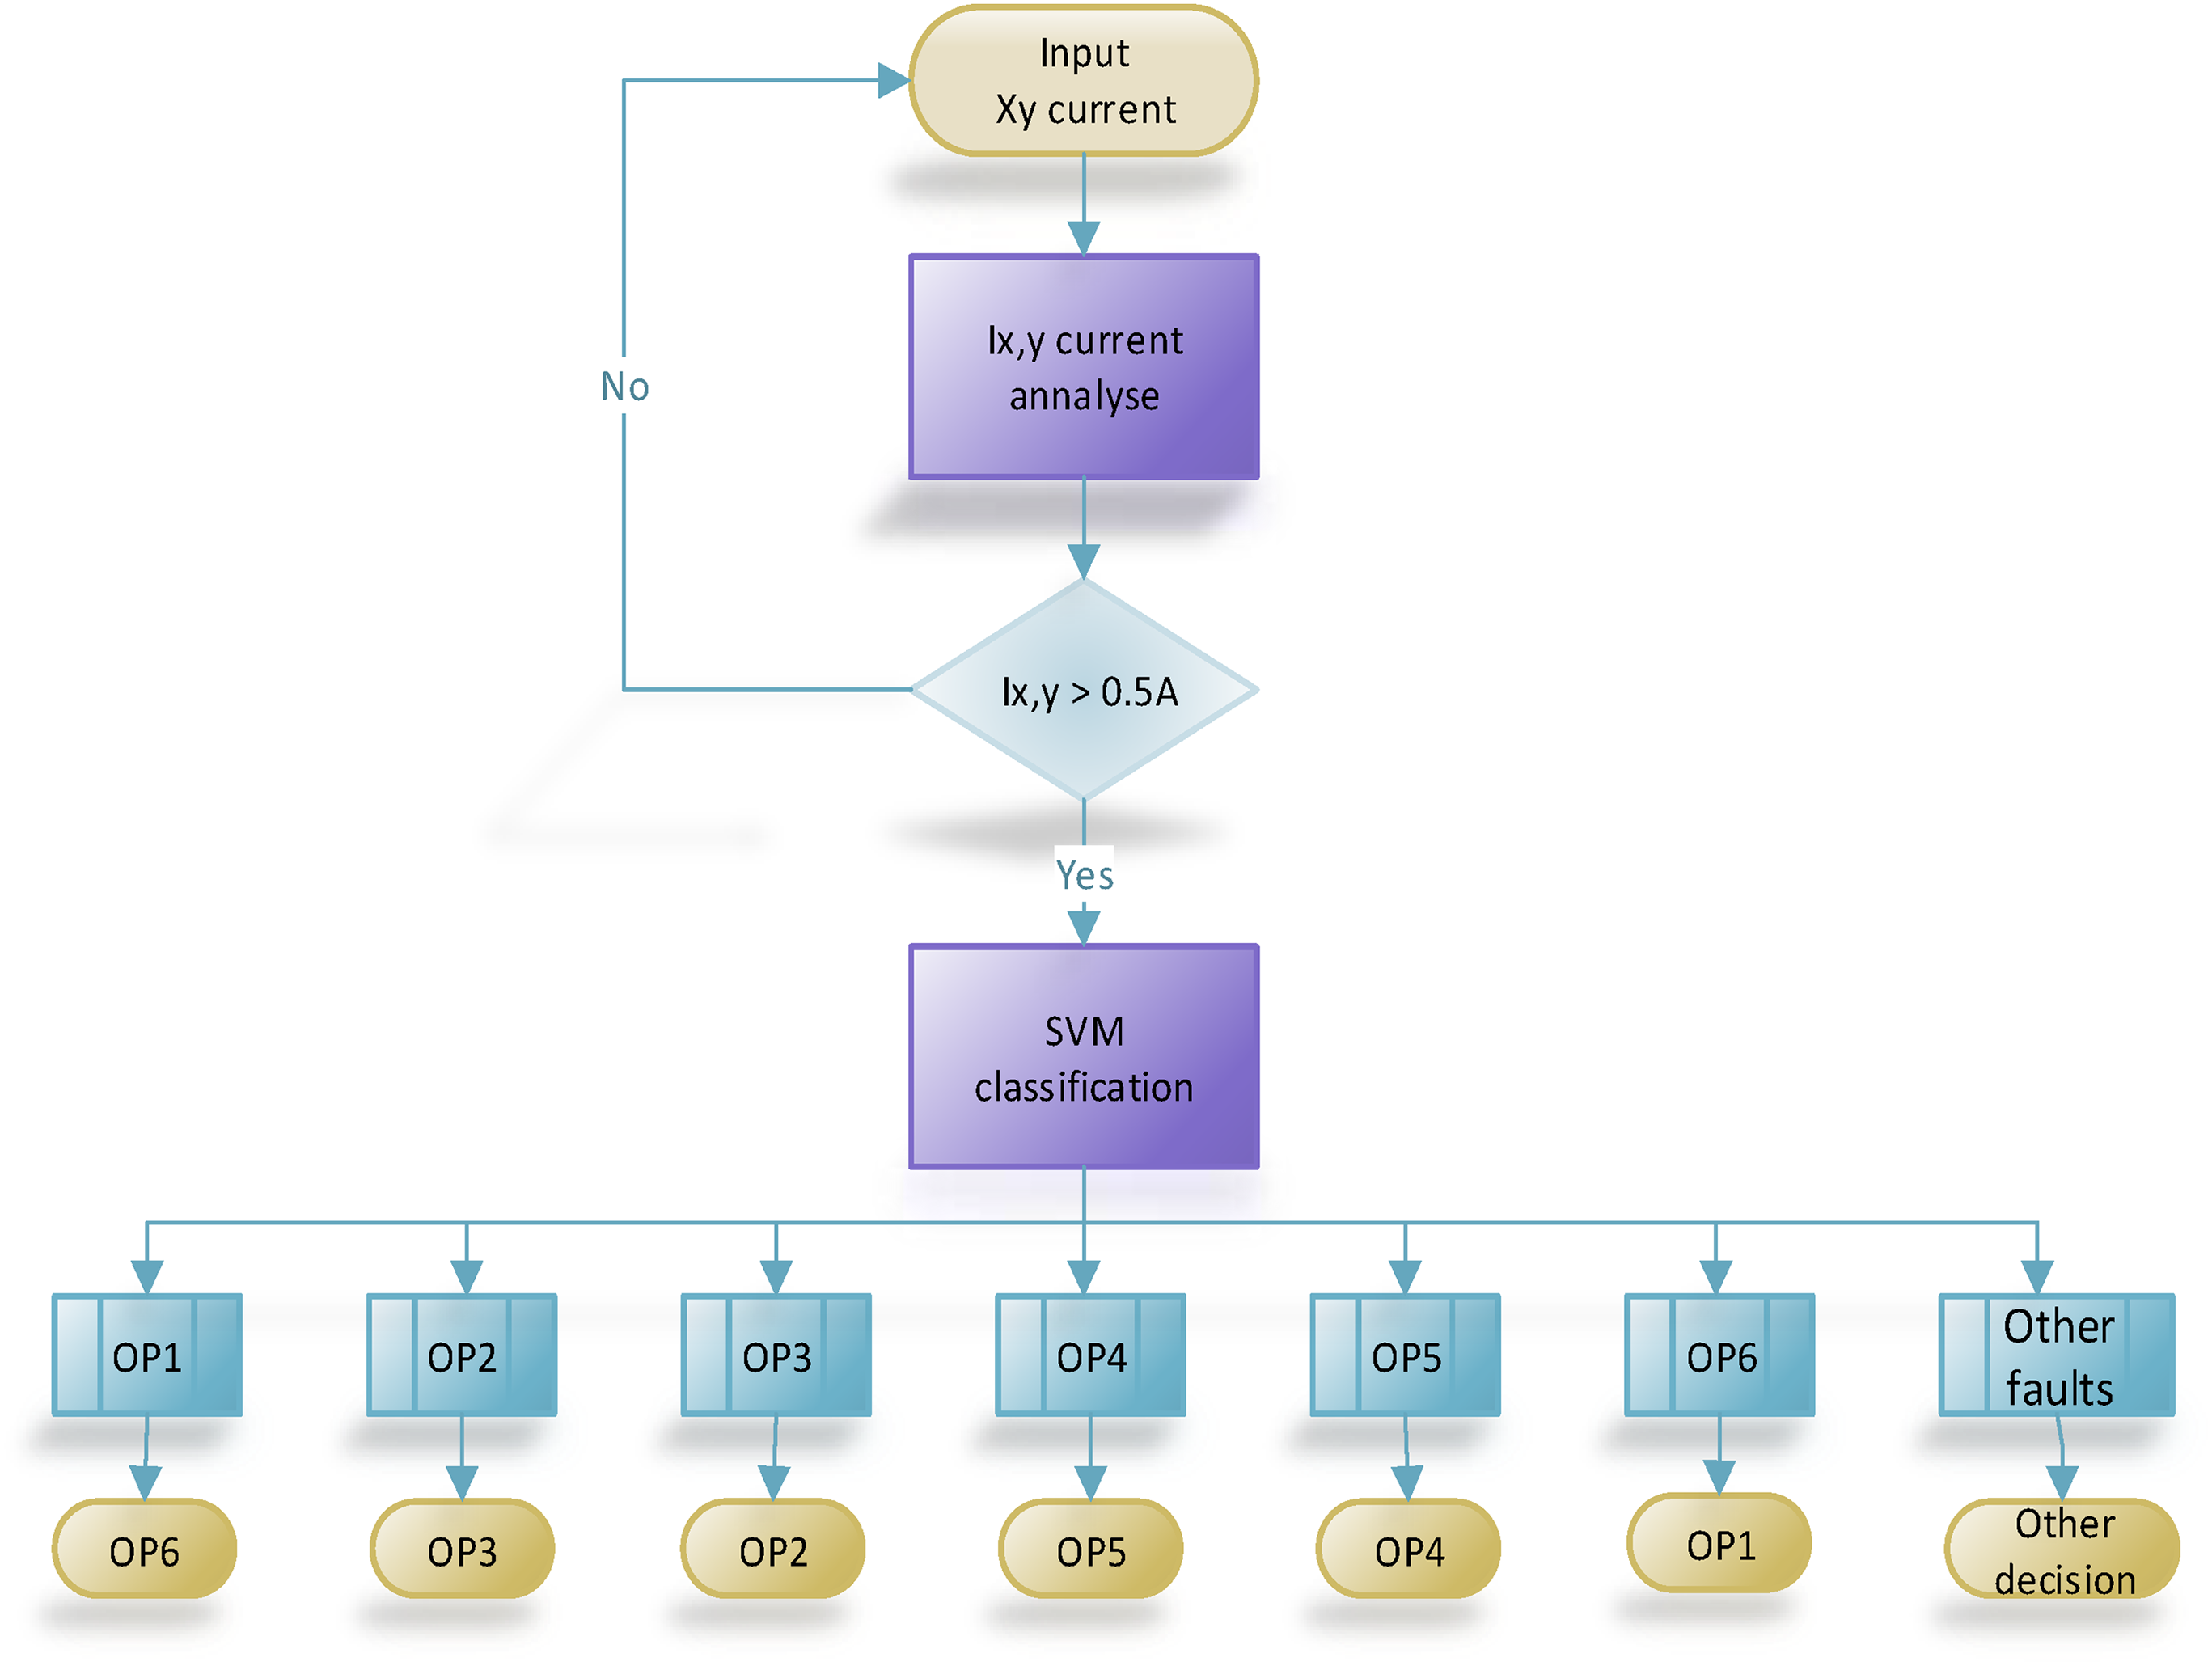
The proposed SVM-PPC control is implemented in three steps:
First step: Fault detection by analyzing the x–y stator current harmonics. Under healthy conditions, the x–y currents are regulated to zero in an open loop. In our case, they are kept below 0.5 A. If the current exceeds this value, something is wrong. This analysis allows for the detection of faults within the system
Second step: Open phase fault detection and localization are achieved using Support Vector Machine (SVM), combined with hyperparameter Bayesian Optimization (BO). This setup enables not only the distinction of the open phase fault but also its exact localization, facilitating subsequent corrective actions.
Third step: The final step in the suggested control approach is the opening of the phase, which forms a 90-degree angle with the faulty phase, which helps to restore system stability. For example, phase 1 (OP1) and phase 6 (OP6). These setups are summarized in Figure 5. In our system, each turbine is equipped with local processing units that handle real-time data from sensors and perform initial fault detection. This edge computing approach reduces the need to transmit large volumes of raw data to a central hub, which can cause bandwidth and latency issues in larger wind farms. Notably, this fault tolerance control approach does not require the reconfiguration of the control algorithm, thus guaranteeing that the system’s behavior remains consistent with a healthy operating condition. The proposed fault detection and localization technique primarily focuses on maintaining the health and safety of the wind power system. While it involves reducing energy production capacity to 2/3 of the normal state during fault conditions, this strategy is crucial for avoiding more severe damage and ensuring long-term operational stability. Importantly, the technique enhances the lifespan of the wind system by enabling early detection, reducing mechanical stress, and optimizing maintenance schedules, ultimately contributing to the overall efficiency and longevity of the wind farm.
Flux char of the proposed fault tolerance control.
Grid connection refers to the process of linking an electrical system or device, such as an ASIG, to the grid (Abdolrasol et al., 2017). In the discussed control strategy, grid connection involves transferring the energy generated by the ASIG to the 230/400 V, 50 Hz electrical grid. This is achieved by implementing a dedicated control strategy. To guarantee the quality of the energy transmitted to the grid, an LCL filter is utilized to mitigate harmonics generated by the inverter. This helps maintain grid stability and reliability, and ensures optimal power transmission. The grid connection process is vital for effectively integrating renewable energy sources into the existing electrical infrastructure (Abdolrasol et al., 2016; Ali et al., 2020; Hannan et al., 2021; Hashimoto et al., 2021; Hussain et al., 2020).
After successfully achieving the maximum power point tracking (MPPT) control of the ASIG, the focus of this section shifts to the control strategy employed for energy transfer to the 230/400 V, 50 Hz electrical grid. The specific approach used is illustrated in Figure 6, with further detailed information available in reference Hamoudi et al. (2023b). Additionally, the implementation of an LCL filter minimizes harmonic generation by the inverter, resulting in cleaner and more efficient power output.
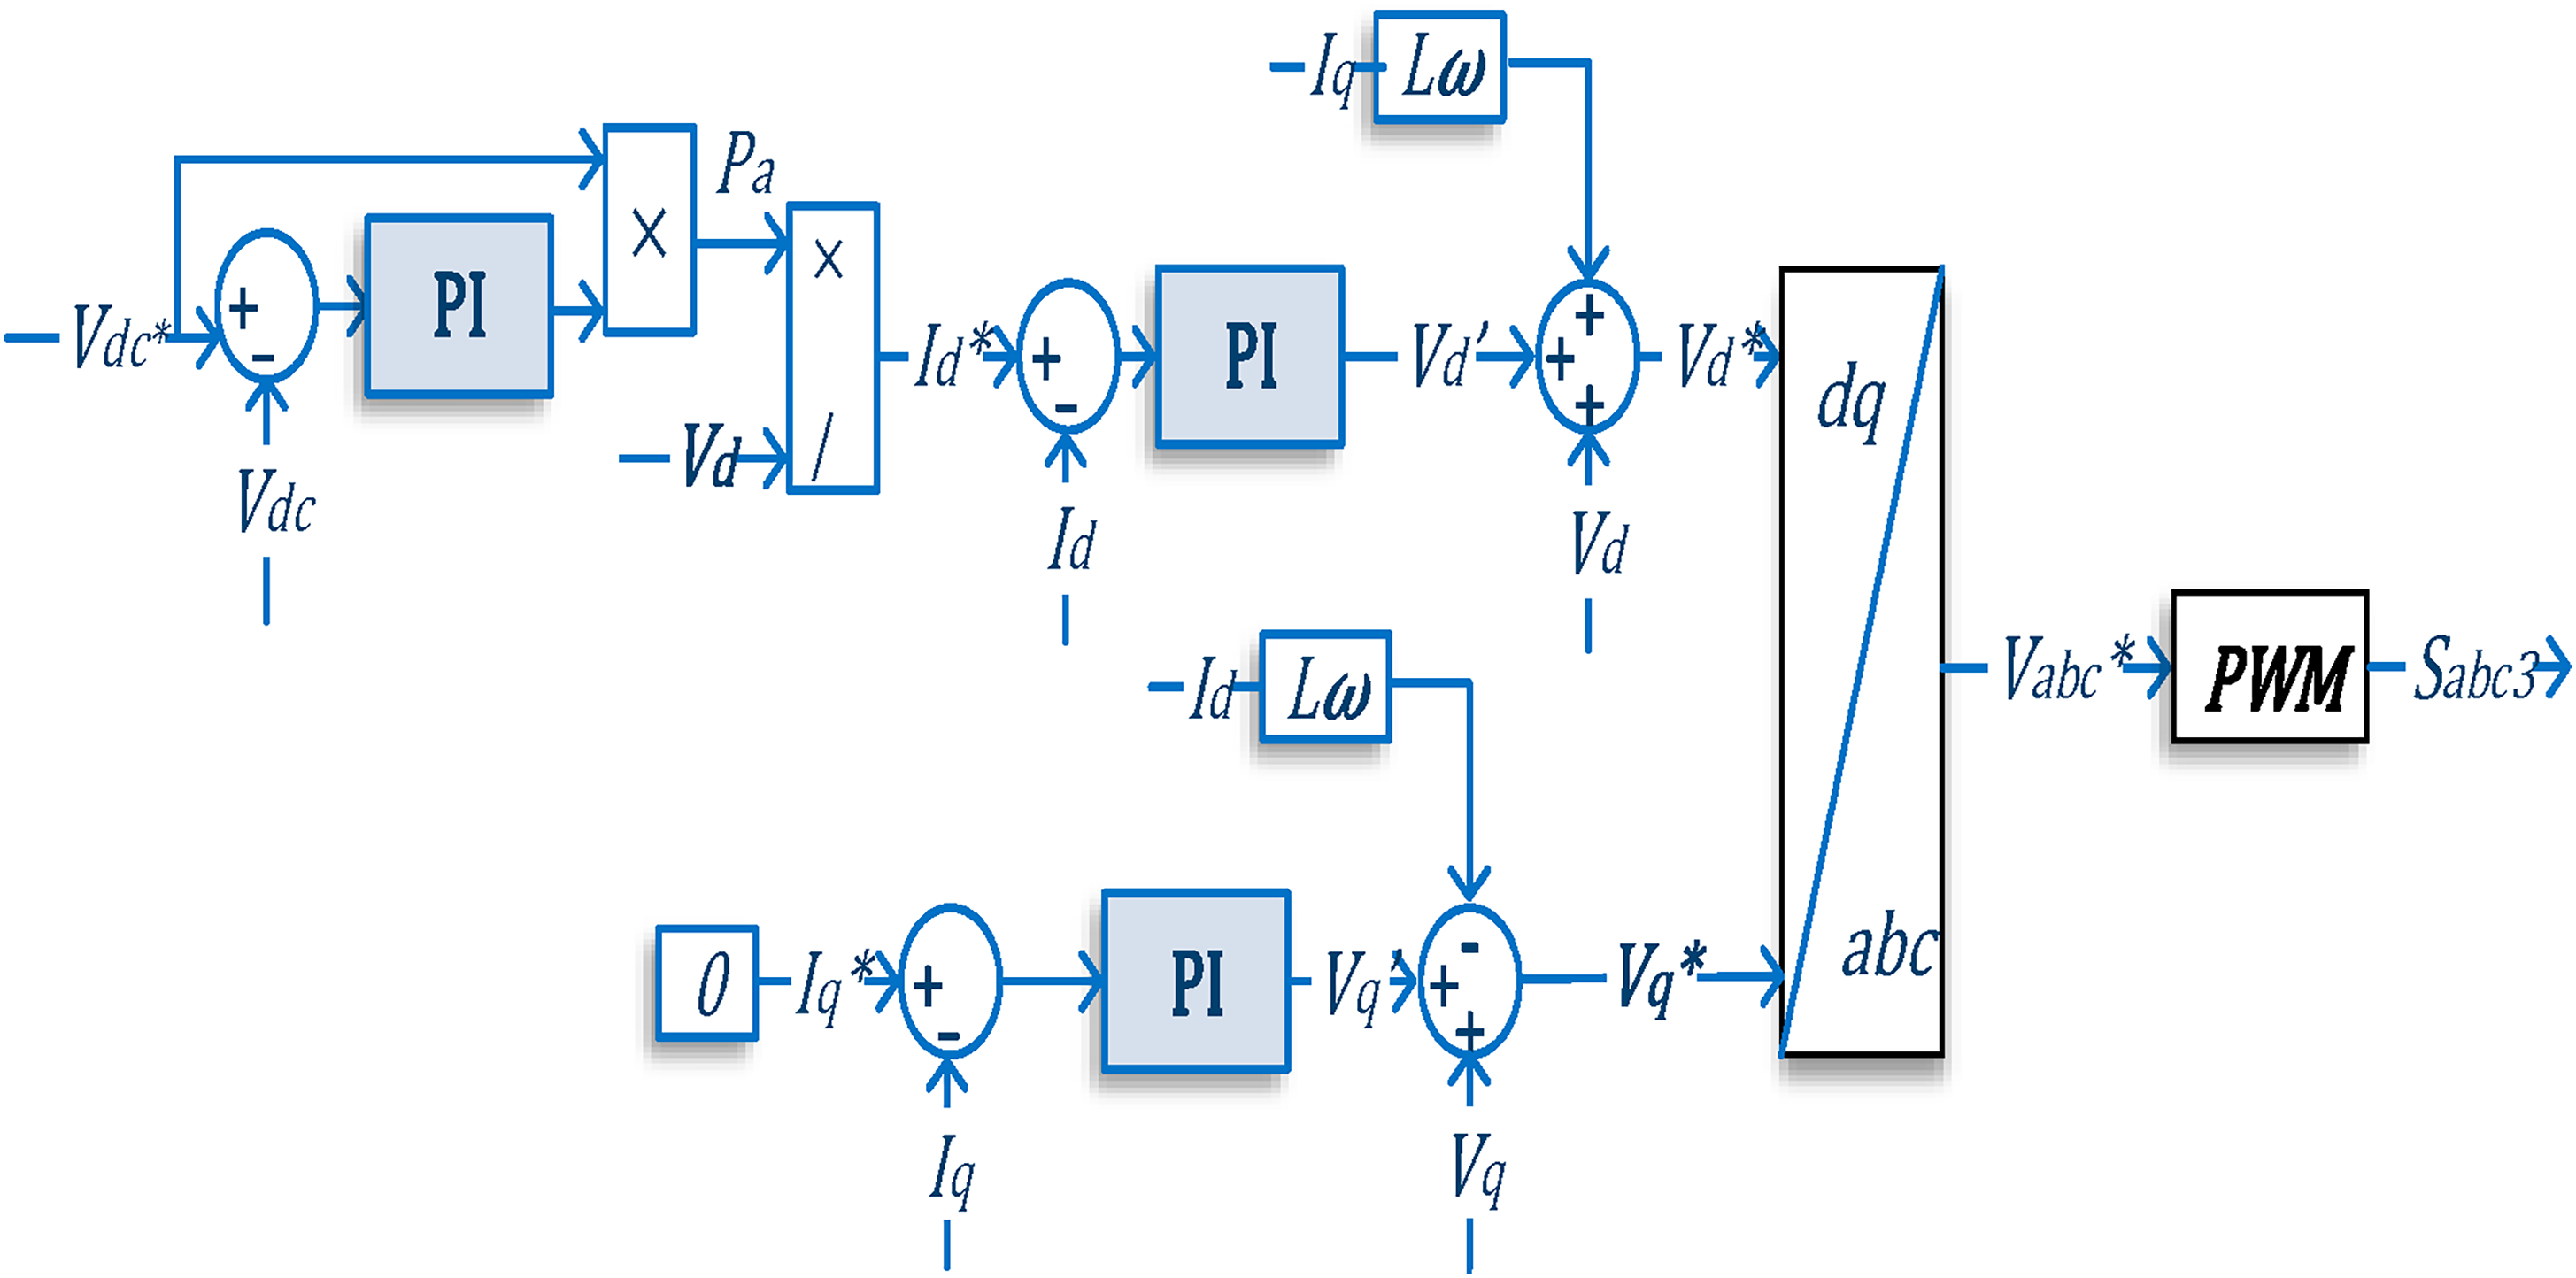
Control block diagram for the grid connection.
Configuration of the SVM algorithm
The support vector machine is a widespread machine-learning method that is used for classification applications. It is renowned for its effectiveness and adaptability in handling both linear and non-linear classification challenges with efficiency. SVM has the advantages of not converging into local minima, being prone to overfitting, being sparse, and providing a global solution (Ray and Mishra, 2016).
Support vector machine theory
The underlying principle of the SVM revolves around identifying an optimal hyperplane within the feature space, which effectively separates different classes. This hyperplane serves as the foundation for the SVM's classification setup, enabling accurate and reliable classification of data points based on their respective features (Dhiman et al., 2021; Tuerxun et al., 2021).
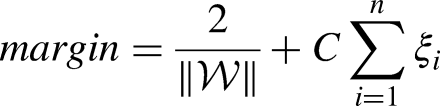
For linear classification tasks, linear SVM is used. This method employs the linear kernel function, which assumes the data is linearly separable. The goal of SVM is to provide an optimized hyperplane (decision boundary) that assures a maximum distance between classes. Making the classifier more robust to noise and improving generalization. This hyperplane is located in the middle of the two nearest data points of different classes, known as support vectors (see Figure 7).
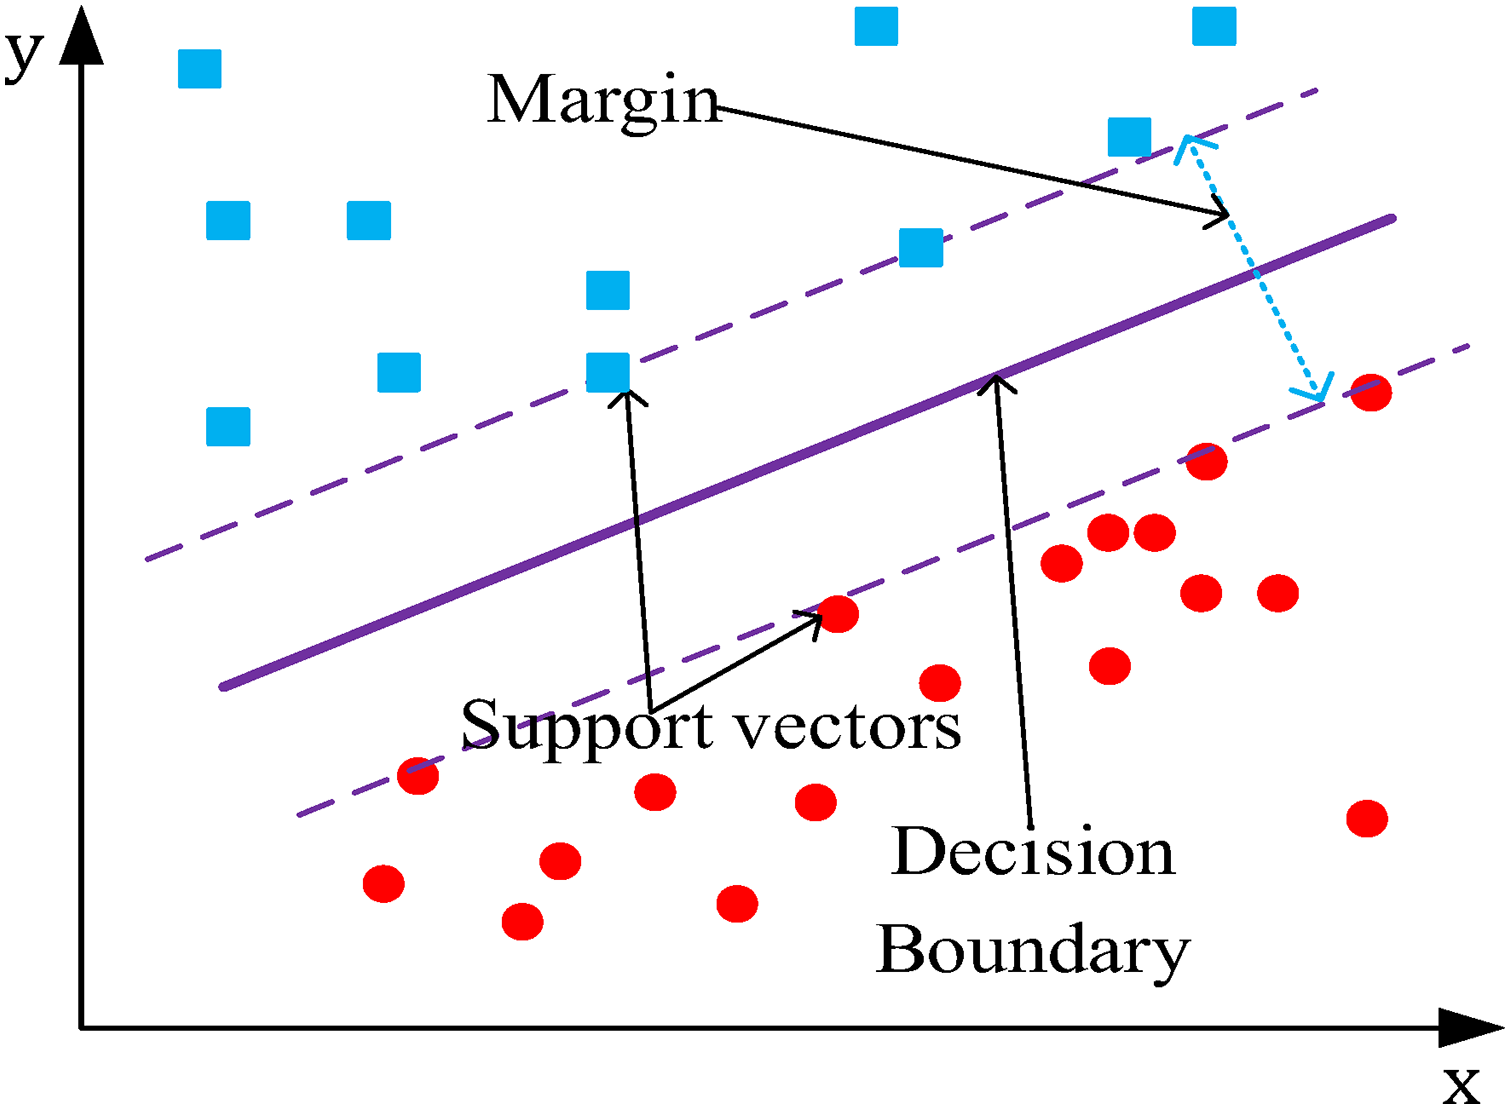
Support vector machine classification.
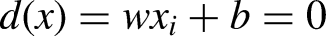
The hyperplane is represented by equation (12).
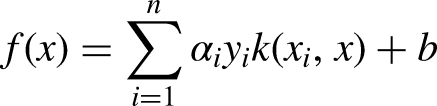
Kernel trick separable data and the kernel function is used to add one space dimension, making it possible to find a linear decision boundary in this new space. Some of the most popular kernel functions for the SVM are:
Linear kernel:
Where
Polynomial kernel:
Gaussian kernel:
RBF kernel:
Sigmoid kernel:
The kernel function used in this work is the Gaussian function.
In this research, hyperparameter optimization is used to choose the kernel function and its parameters and maximize the performance of SVM models. Many algorithms can be used for hyperparameter optimization, like grid search and randomized search. But Bayesian optimization (BO) is a widely used method that effectively explores the hyperparameter space of SVM models. By leveraging probabilistic models, it guides the search process and maintains a balance between exploration and exploitation. This approach improves the efficiency of hyperparameter tuning and ultimately enhances the performance of SVM models.
Hyperparameter Bayesian optimization of support vector machine
In this part, we use Bayesian optimization (BO) to find the optimum hyperparameters for the SVM algorithm. The Bayesian optimization algorithm generally proceeds as follows:
Define the Objective Function: This is the performance metric used to evaluate the model’s performance for a given set of hyperparameters. For example, it could be classification accuracy, F1 score, or area under the receiver operating characteristic curve (AUC-ROC). This function takes the hyperparameters of the SVM as input and returns the performance metric.
Define the Search Space: Specify the hyperparameters of the SVM. This includes parameters such as the kernel type (linear, polynomial, Gaussian, radial) and its parameters; the regularization parameter. Define suitable ranges or discrete options for each hyperparameter.
Select an Acquisition Function: The acquisition function guides the search by balancing exploration (trying new hyperparameter values) and exploitation (focusing on promising regions). Like Expected Improvement; Probability of Improvement; and Upper Confidence Bound.
Build an Initial Surrogate Model: Initially, a surrogate model (typically a Gaussian Process) is built based on a few randomly selected hyperparameter configurations and their corresponding objective function values.
Iteratively Optimize: The algorithm iteratively performs the following steps until a termination condition is met: Use the surrogate model and acquisition function to suggest the following hyperparameters to examine. Next, analyze the objective function for the suggested hyperparameters. After that update the surrogate model with the new observation. Repeat these steps until the termination condition is satisfied.
Select the Best Hyperparameters: After the optimization procedure is completed, the hyperparameters that correspond to the best-performing objective function value are chosen as the optimum hyperparameters.
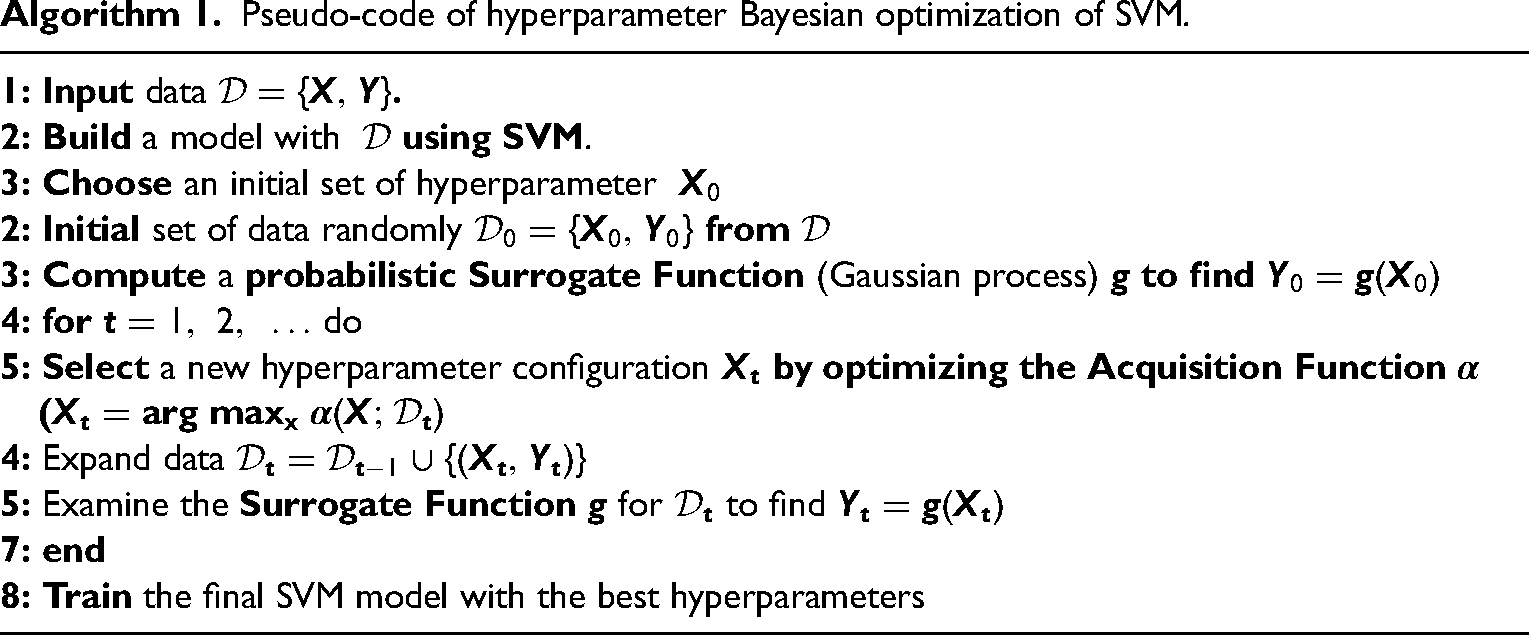
The hyperparameter BO-SVM algorithm used in this paper is explained in the pseudo-code in Algorithm 1.
Pseudo-code of hyperparameter Bayesian optimization of SVM.
SVM training and test results
In this section, an SVM-based classification model is trained to detect and localize open phases. The SVM classifier is activated when the
Machine learning classifier performance comparison.
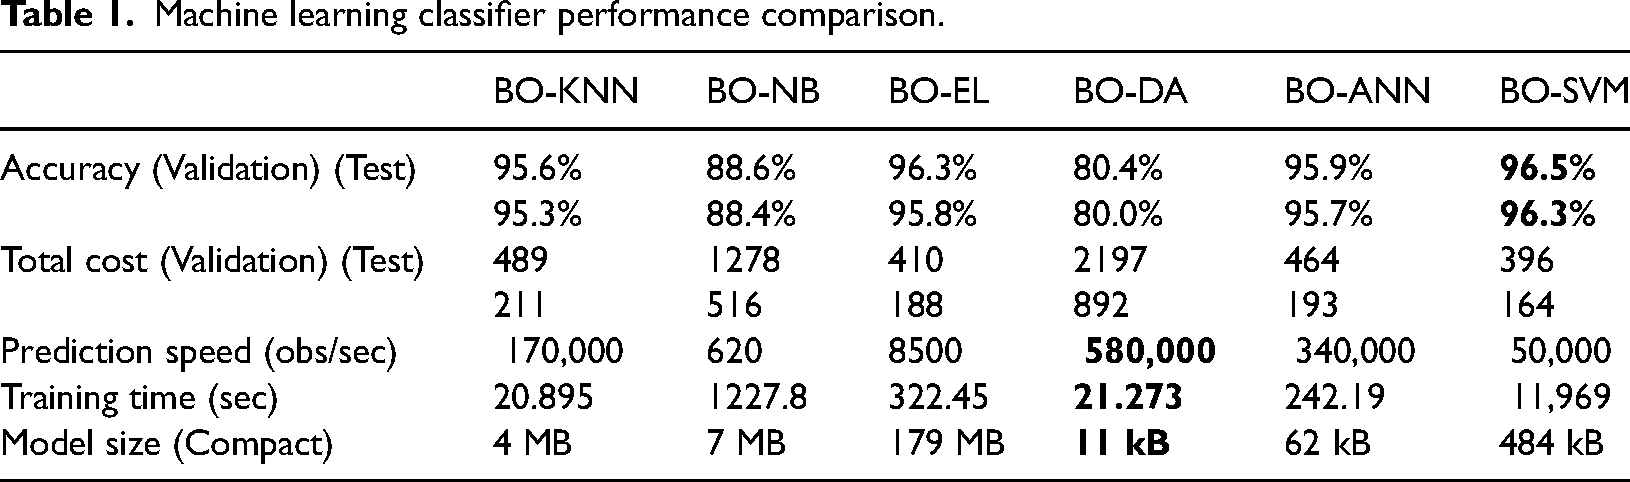
Despite processing 50,000 observations per second, the SVM classifier is not the fastest of the models evaluated. However, it performs adequately for the target application. Furthermore, the model requires 484 kB of storage space, which is considered low. These factors make the BO-SVM a robust choice for applications where both fault detection accuracy and resource efficiency are essential.
The Bayesian optimization algorithm is employed to fine-tune the hyperparameters of the SVM model, ensuring optimal performance.
Figure 8 shows the optimization process is visualized as a graph showing the classification error over the number of iterations. The lowest error achieved during optimization is 0.0352 (or 3.52%). This means that the optimized model misclassifies only 3.52% of the test data, which is a significant performance improvement.
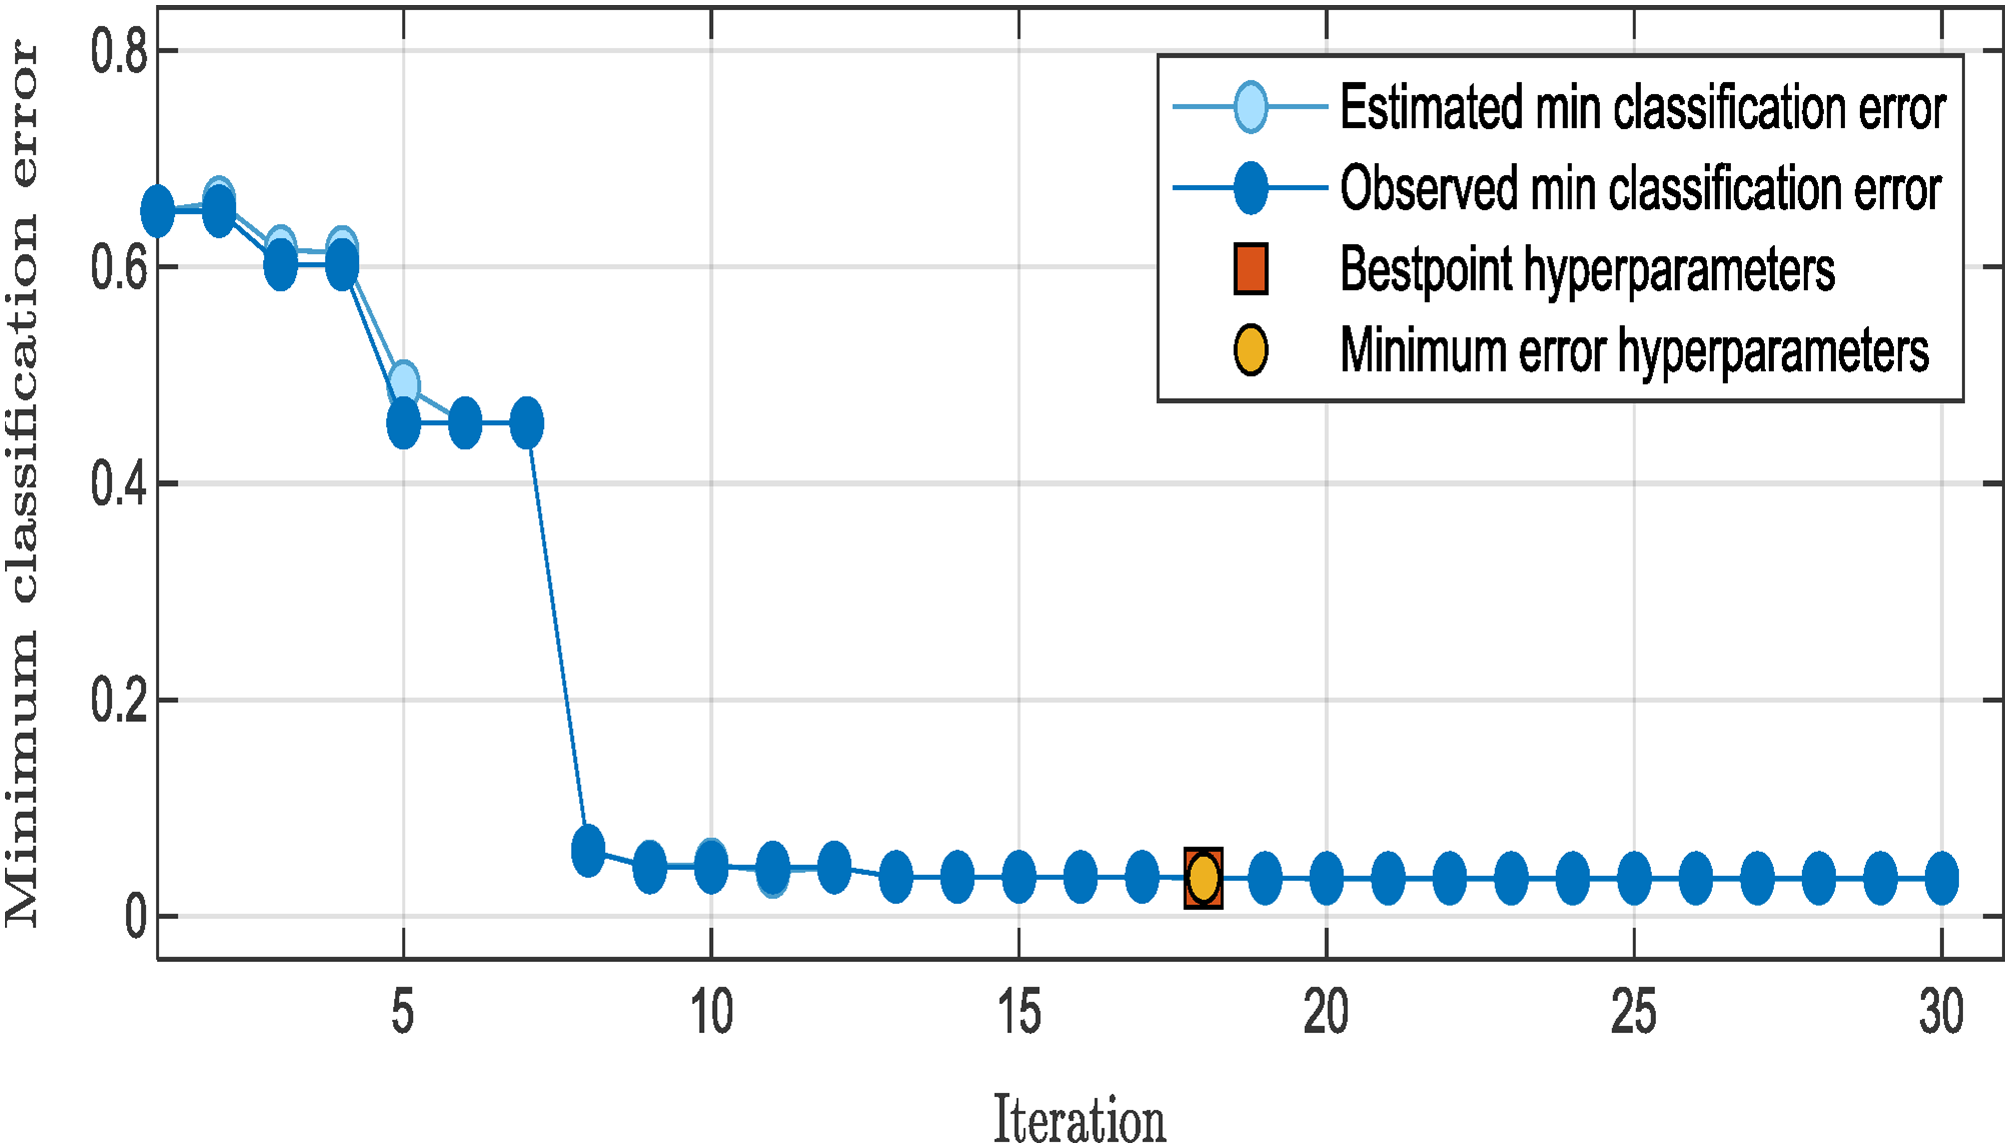
SVM minimum classification error plot.
The SVM test confusion matrix is illustrated in Figure 9, showing an average True Positive Rate (TPR) Also called sensitivity of 96.14%, means the classifier accurately detects open-phase faults and other conditions about 96.14% of the time. This indicates a high capability to identify faults when they actually occur.
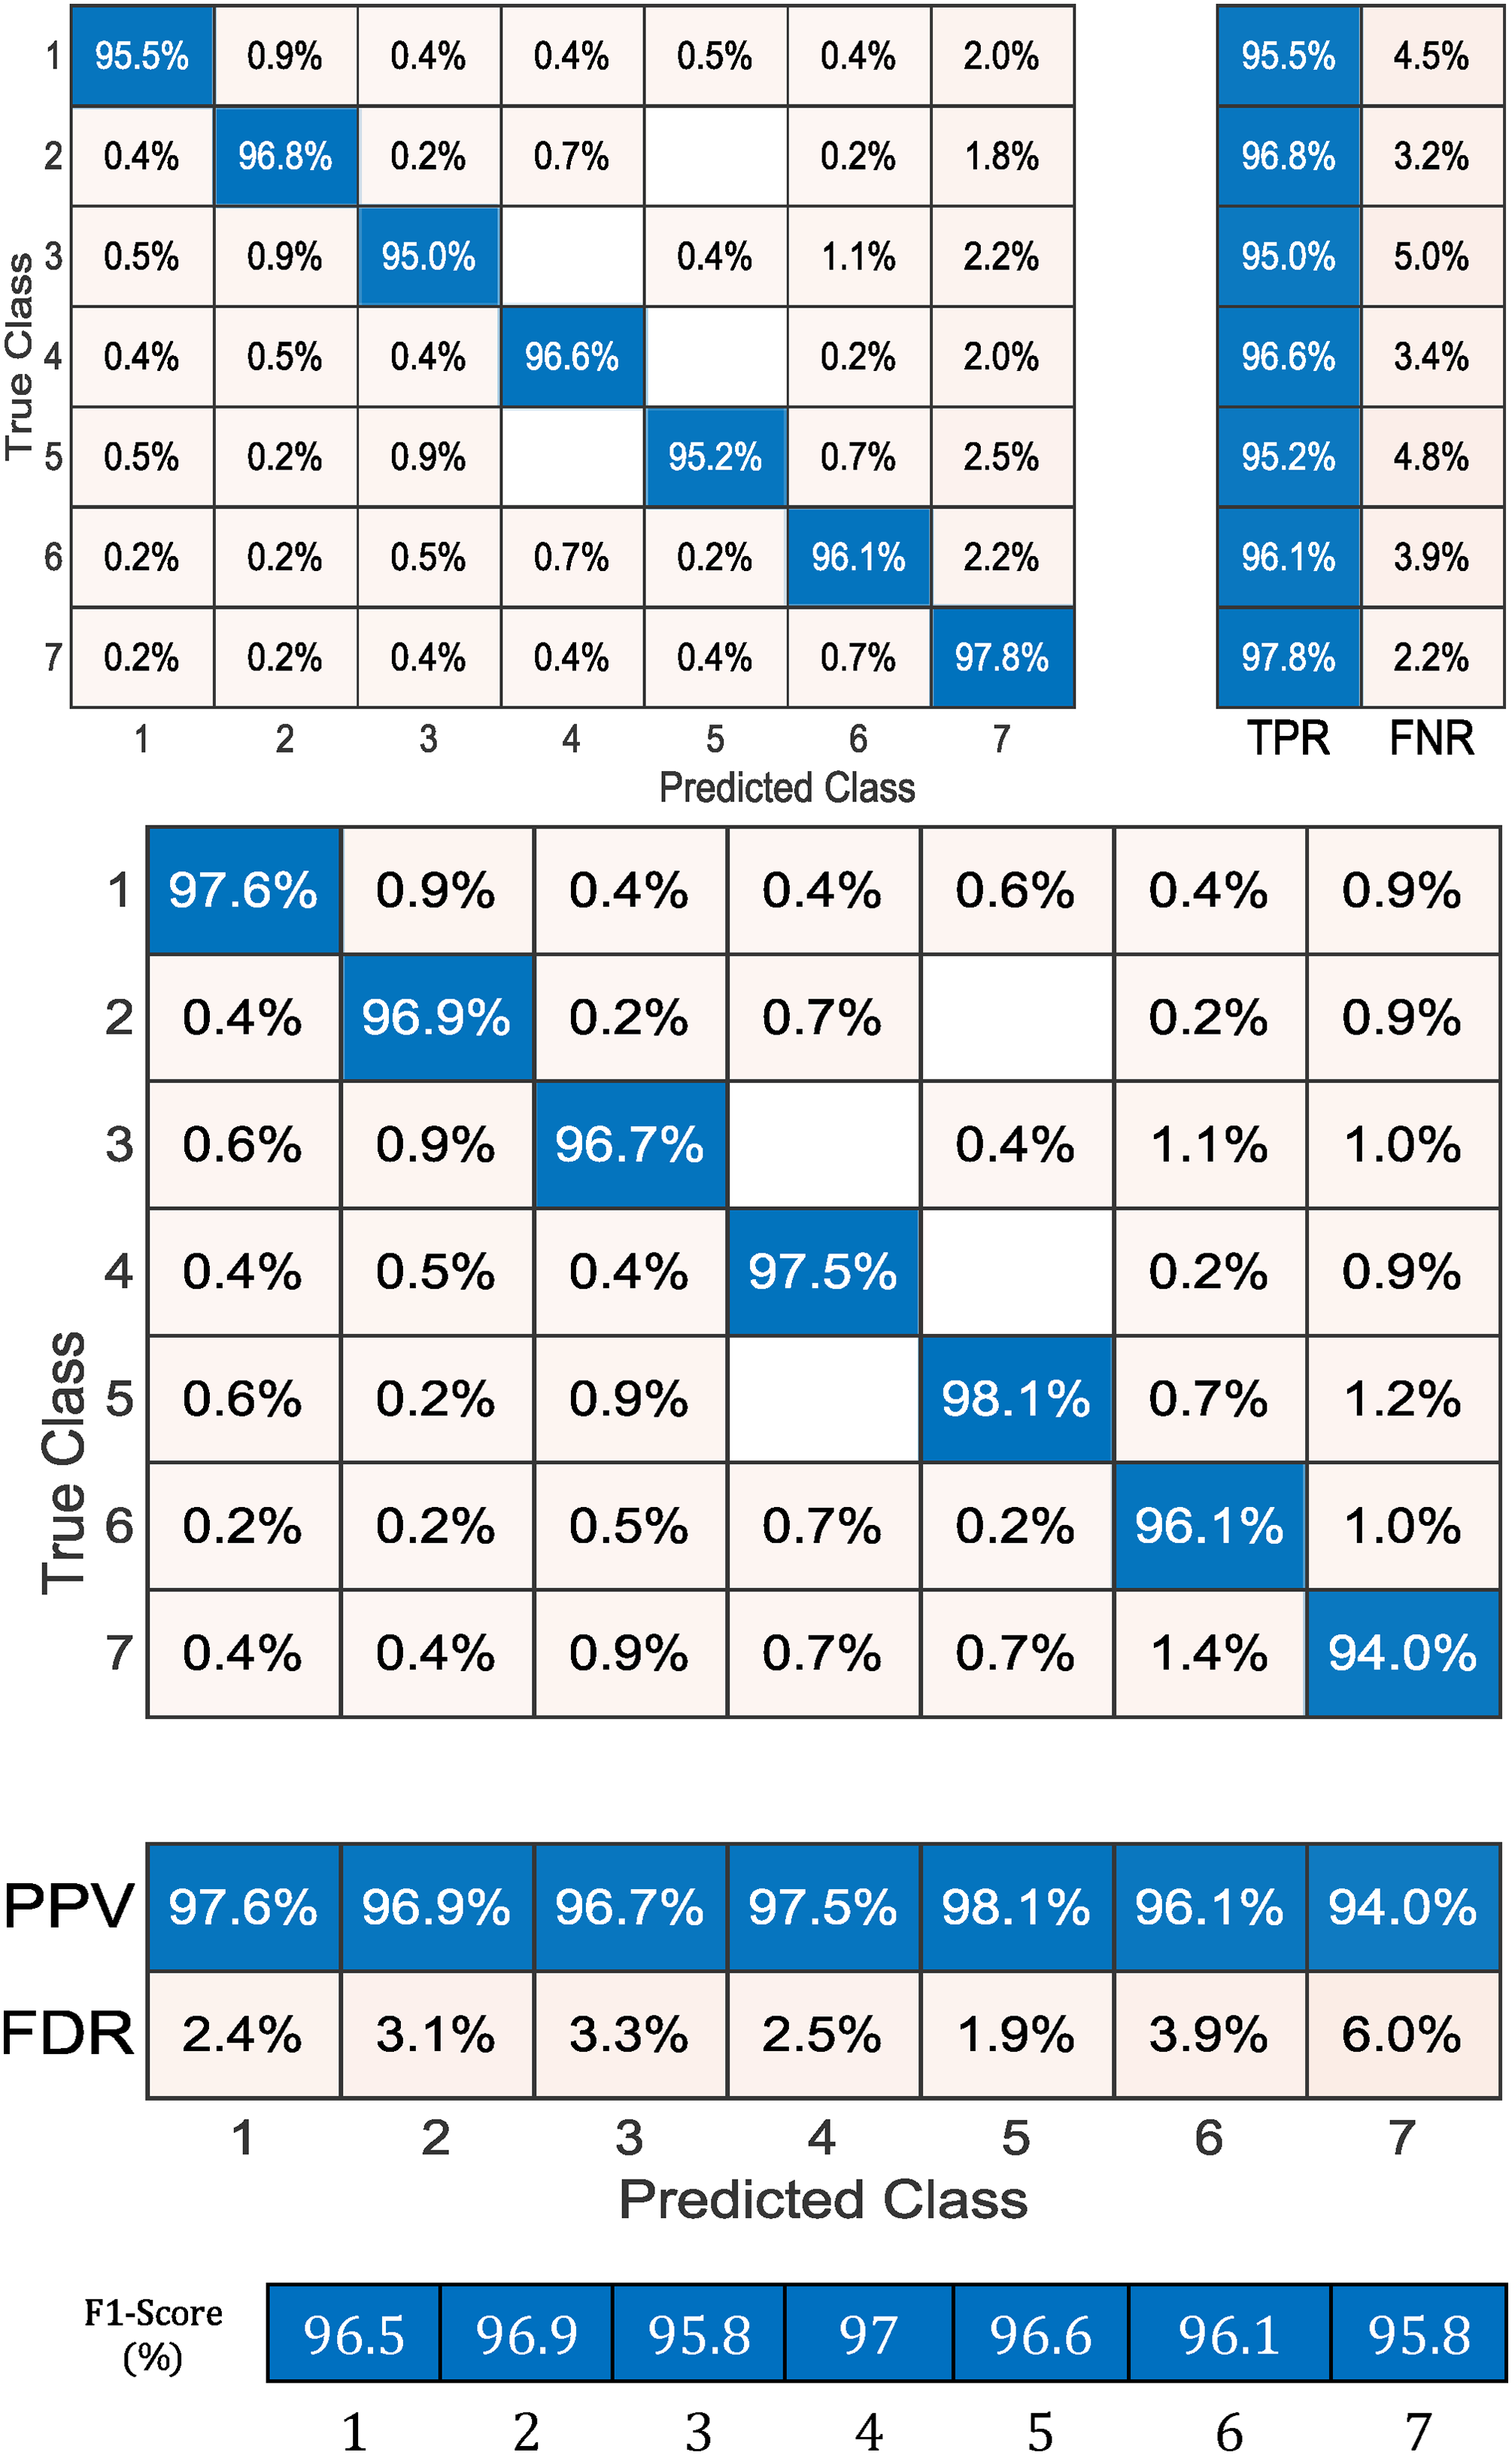
SVM test confusion matrix.
and an average Positive Predictive Value (PPV), also called precision of 96.3%, suggests that when the classifier predicts a fault, it is correct in its prediction approximately 96.3% of the time.
Average F1-score of 96.39% shows the model’s ability to balance precision and recall effectively. This high F1-score confirms that the classifier performs well in distinguishing between healthy conditions and faults. Upon analysis, it is evident that most errors occur due to confusion with the seventh class, (just 94% true), which represents faults other than one open phase.
Figure 10 showcases the SVM test Receiver Operating Characteristic (ROC), specifically for the seventh class. This curve compares the True Positive Rate (TPR) against the False Positive Rate (FPR). A steeper ROC curve indicates better classifier performance. The AUC of 0.9974 for the seventh class is remarkably high, suggesting that the classifier does an excellent job at distinguishing between the seventh class and other classes. The closer the AUC is to 1.0, the better the model is at correctly classifying positive instances and minimizing false positives. Despite a lower TPR for the seventh class (94%), the high AUC suggests that the classifier can still reliably discriminate between true and false positives for this class across various decision thresholds.
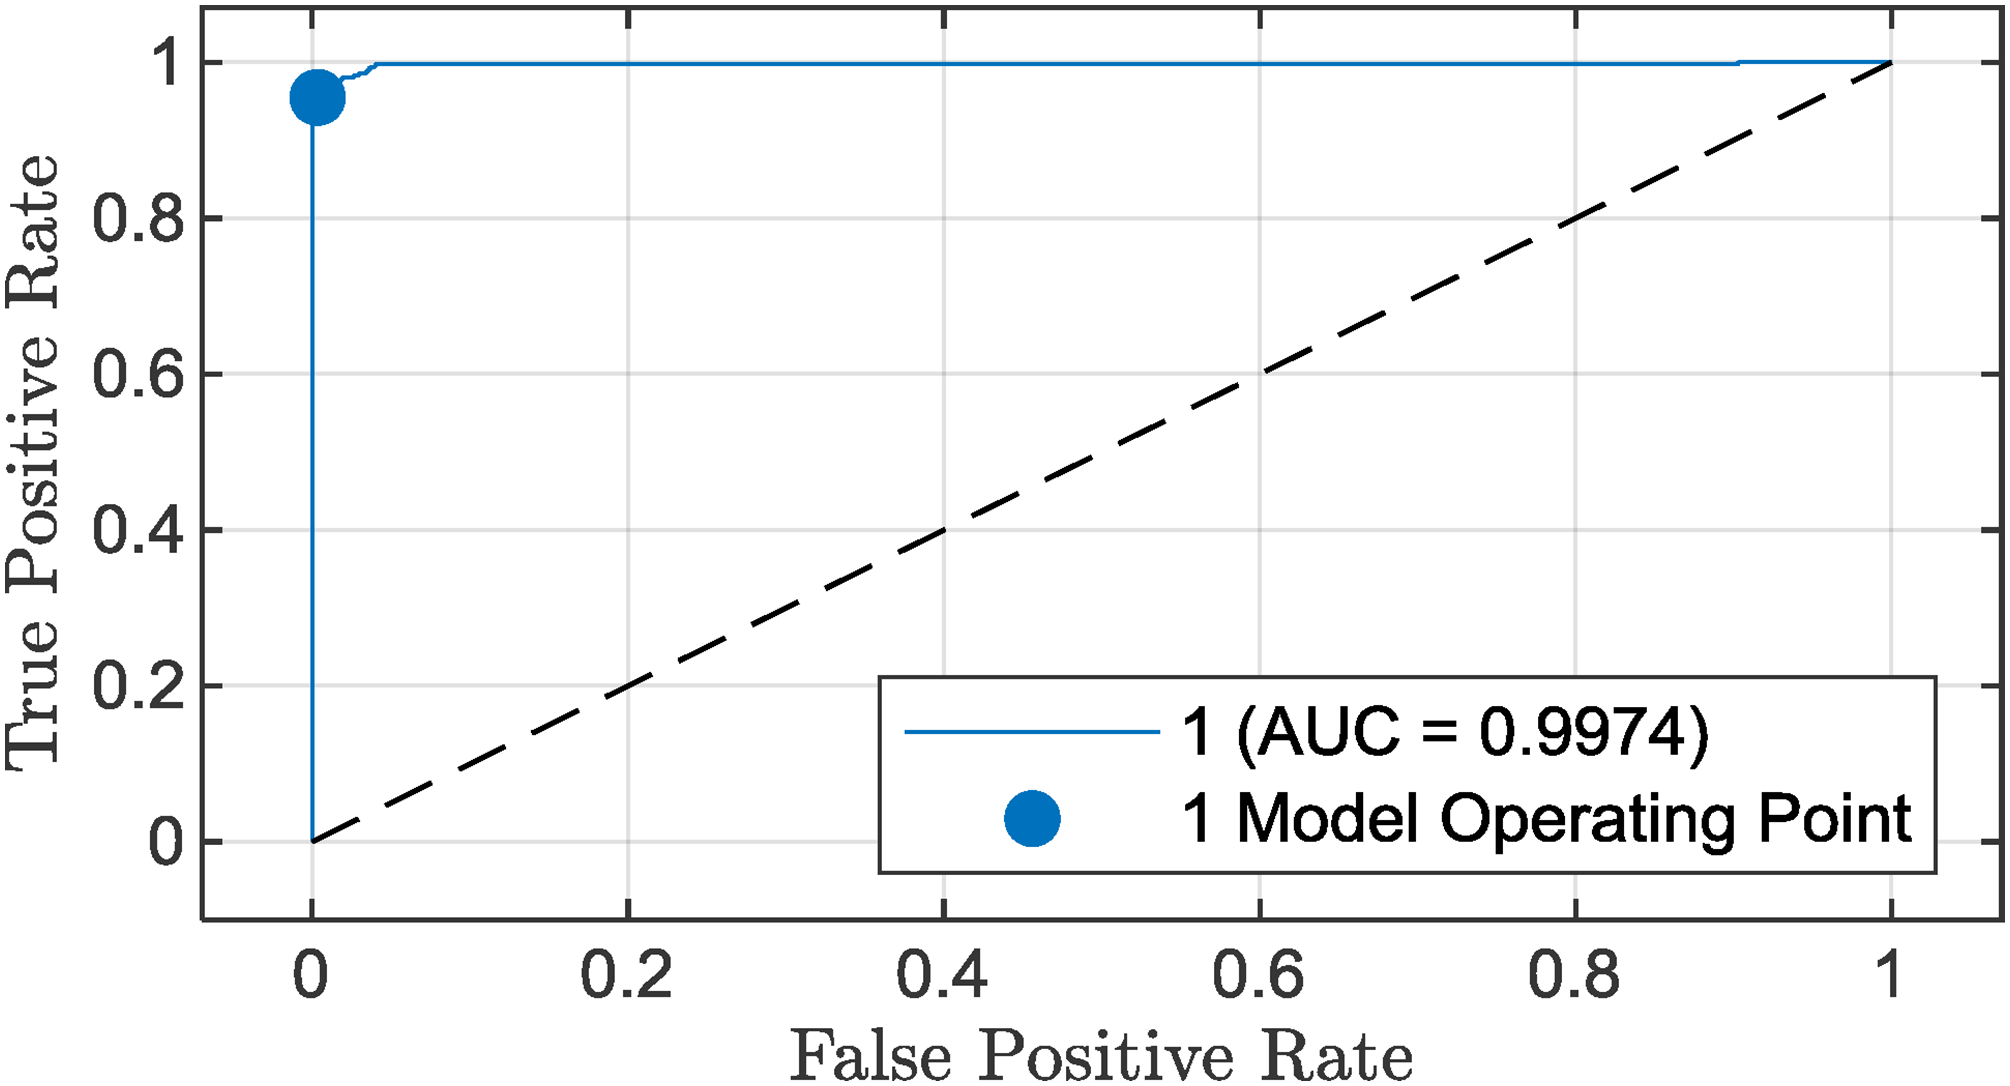
SVM test ROC curve.
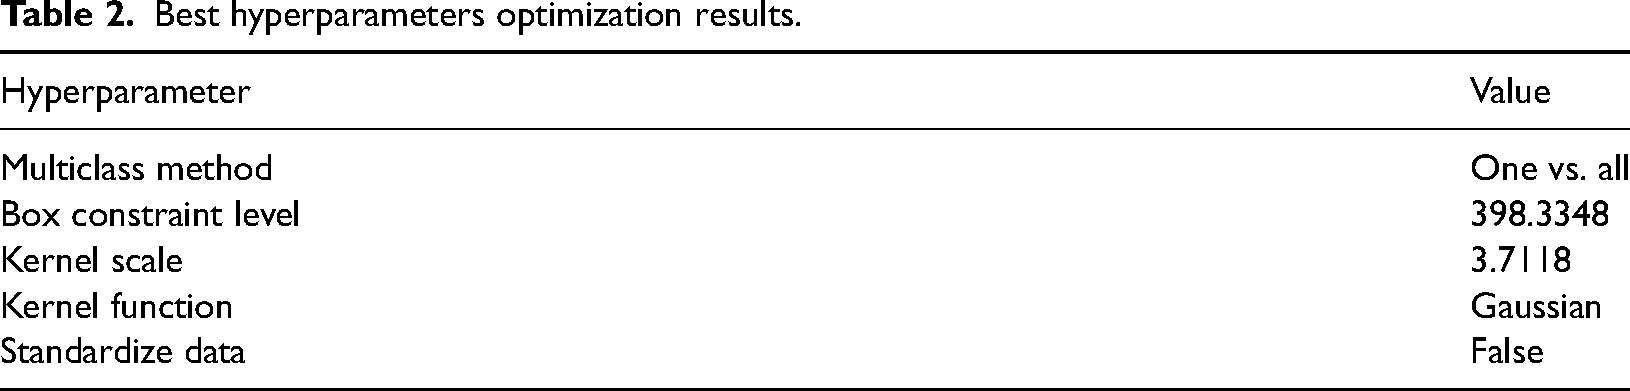
In these hyperparameters, the multiclass method used is the One vs. All, which allows us to distinguish one class from all other classes. OvA is computationally more efficient compared to other methods like “One vs. One,” especially when dealing with a large number of classes. However, it may lead to more complex decision boundaries, as each classifier operates independently. A box constraint (C) value of 398.3348: This is a relatively high value for the box constraint. A high box constraint level allows the model to fit more tightly to the training data, reducing classification error but possibly at the cost of generalization. However, since the test performance is good, it seems the model is able to generalize well despite this constraint. The Kernel scale value of 3.7118: This is a moderate kernel scale value. This moderate kernel scale suggests a balance between underfitting and overfitting. The value of 3.7118 indicates the model is capturing enough of the data structure without over-smoothing the decision boundary. The choice of the Gaussian kernel is well-suited to complex fault detection problems, as it can handle non-linear relationships between features. This flexibility is likely why the model achieves high accuracy in detecting and classifying faults, where linear separability is unlikely. The input data are not standardized because they are on the same scale (stator currents). The results that correspond to the best hyperparameters are presented in Table 2. Unlike the hyperparameters for machine learning fault classification reported in the literature, the hyperparameters for the current ML fault classifier are optimized using Bayesian optimization (BO) to achieve superior performance.
Best hyperparameters optimization results.
SVM-OPFT-PPC simulation results
The simulation results of an ASIG wind power system represented in Figure 1 using the suggested SVM-OPFT-PPC control are shown in this part. The trained SVM classification model is applied to the open-phase fault localization.
The performance of this control strategy is evaluated through three tests: comparative analysis, transient analysis, and a variable speed test. The WECS is used to feed a simple distribution system of 50 Hz/230 V. Researchers often use it as a stepping stone for understanding and improving distribution systems before tackling larger and more complex networks.
Comparative analysis
In this test, the effectiveness of the suggested SVM-OPFT-PPC is examined and compared to the conventional PPC under an open phase fault, and a fixed wind speed of 9 m/s. Specifically, an open phase is intentionally created in phase a1 at 0.04 s, followed by the opening of the corresponding 90-degree phase c2 at 0.08 s. The simulation results are presented in the figures below:
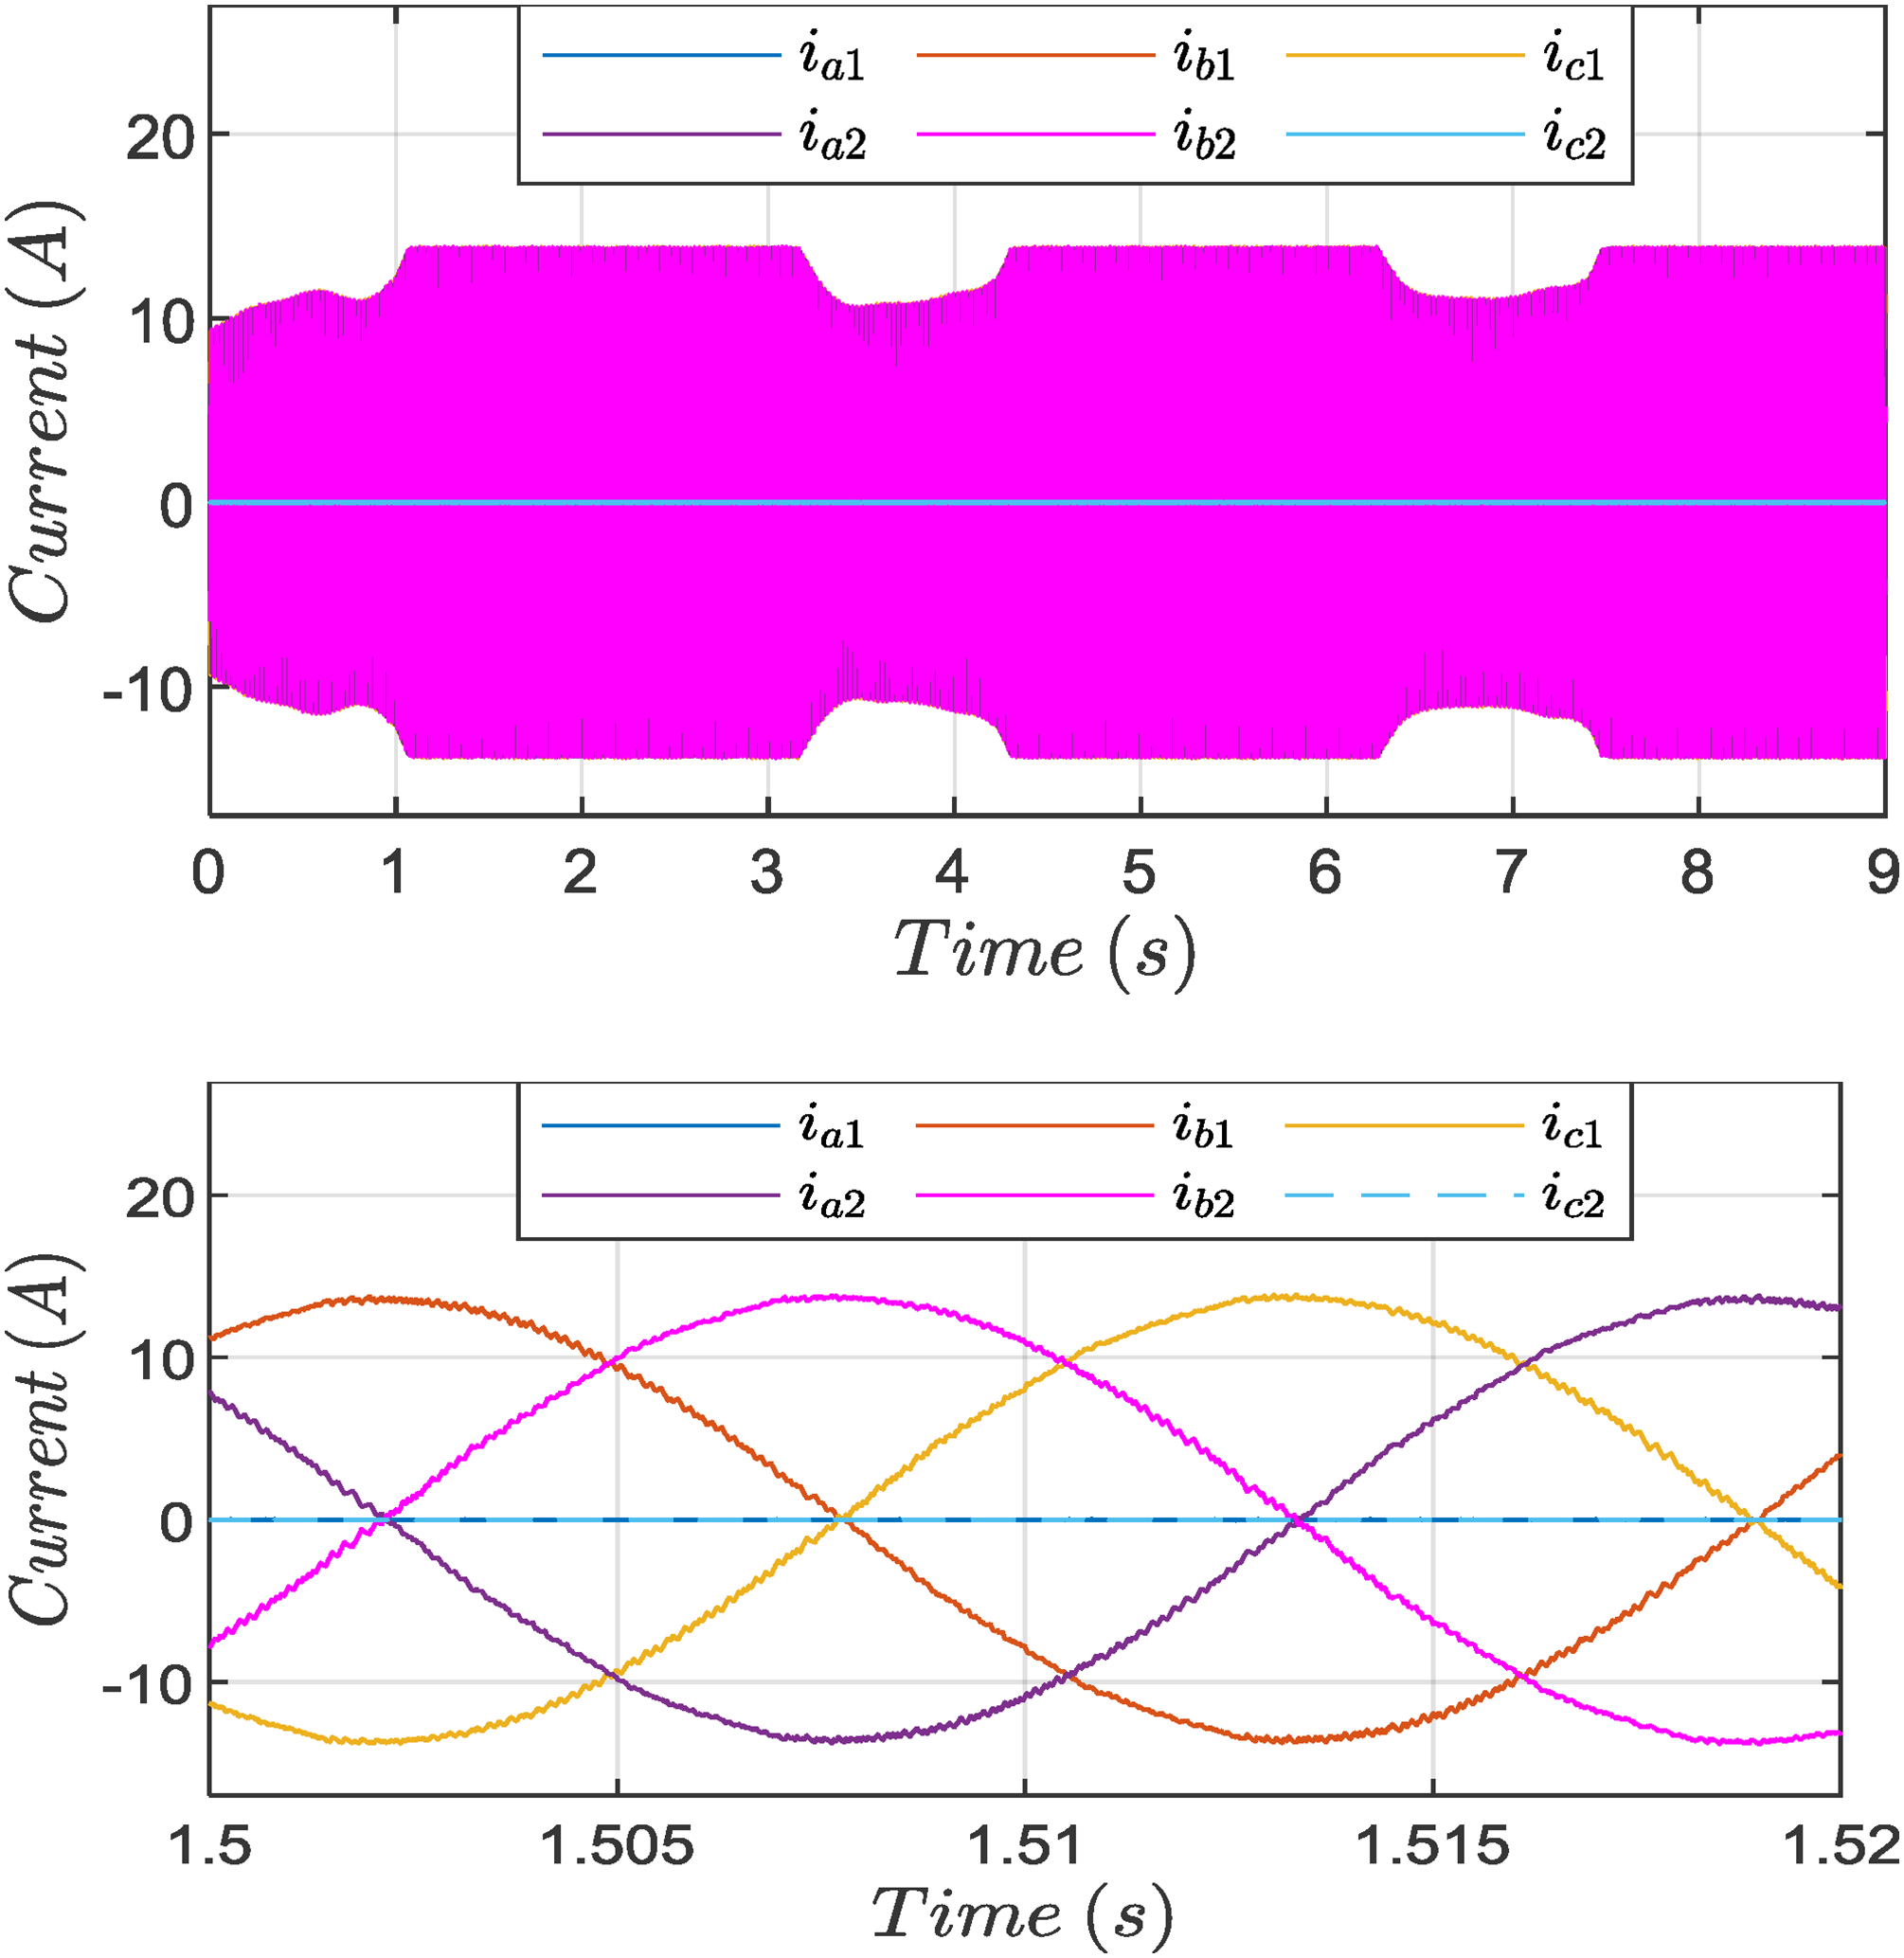
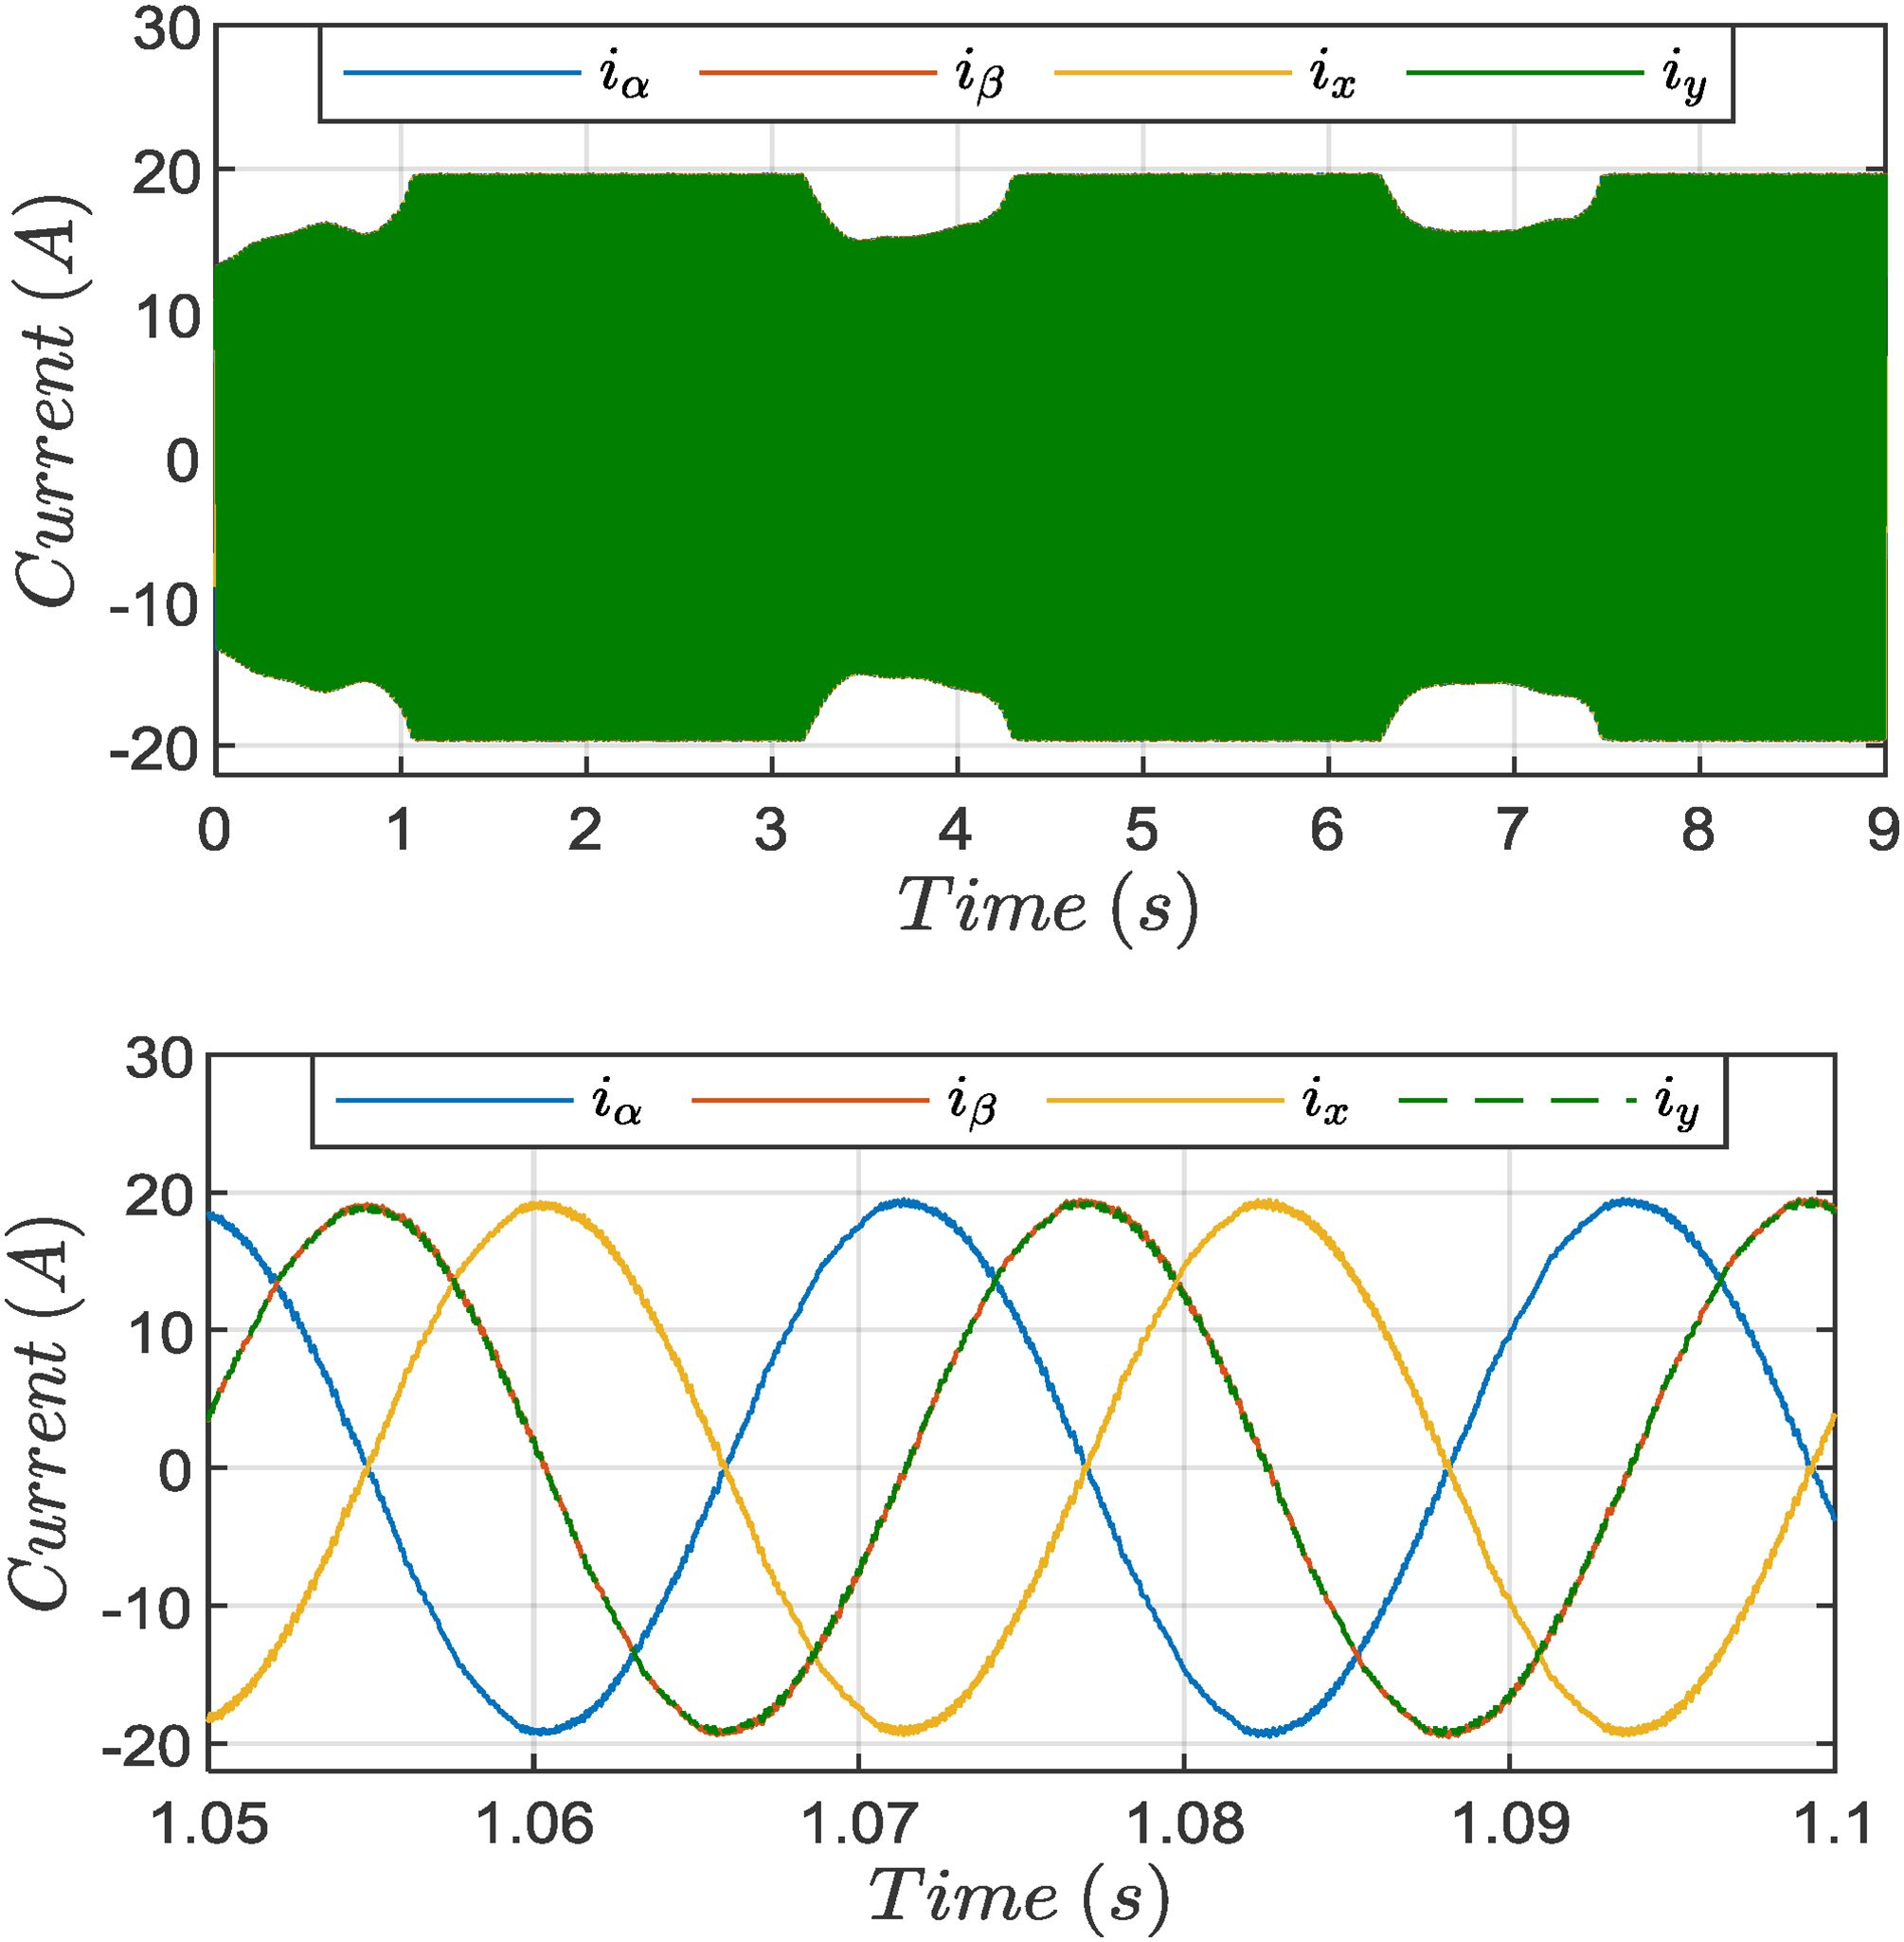
Figures 11 and 12 illustrate the stator currents in both the
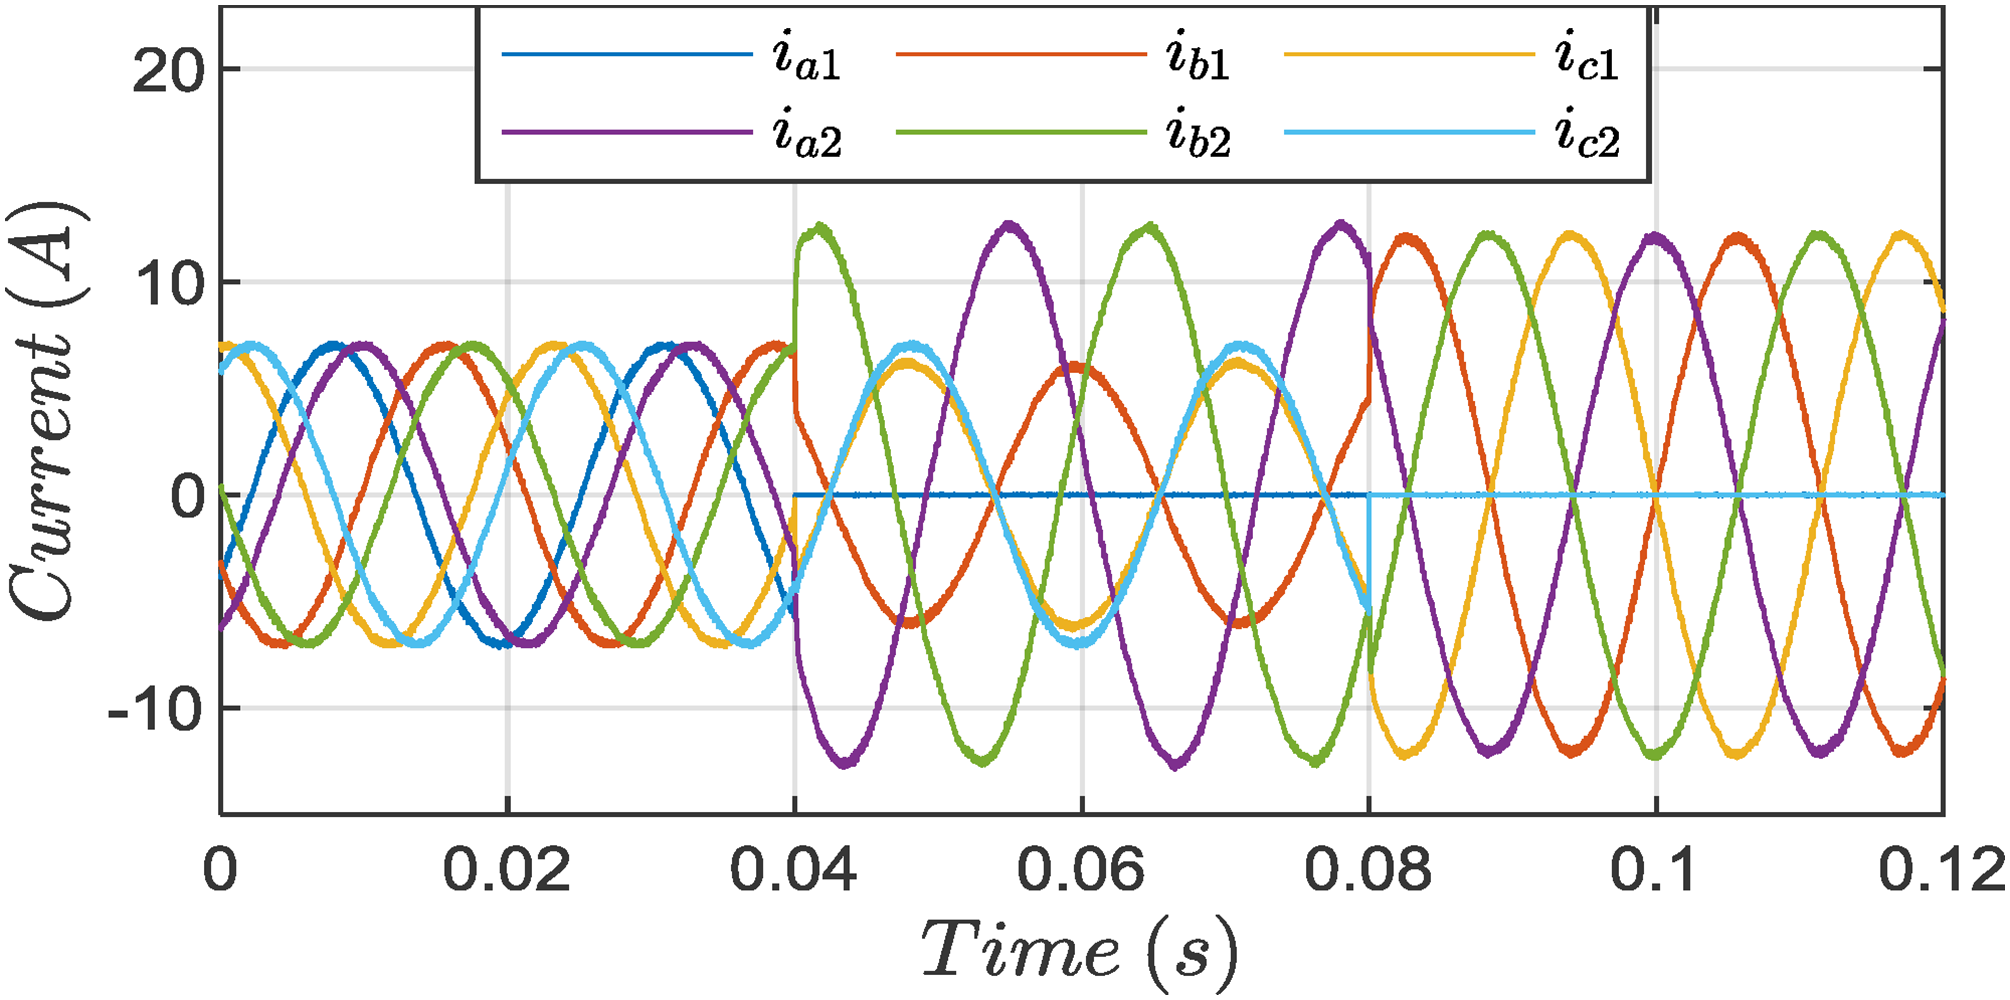
Stator currents in abc frame.
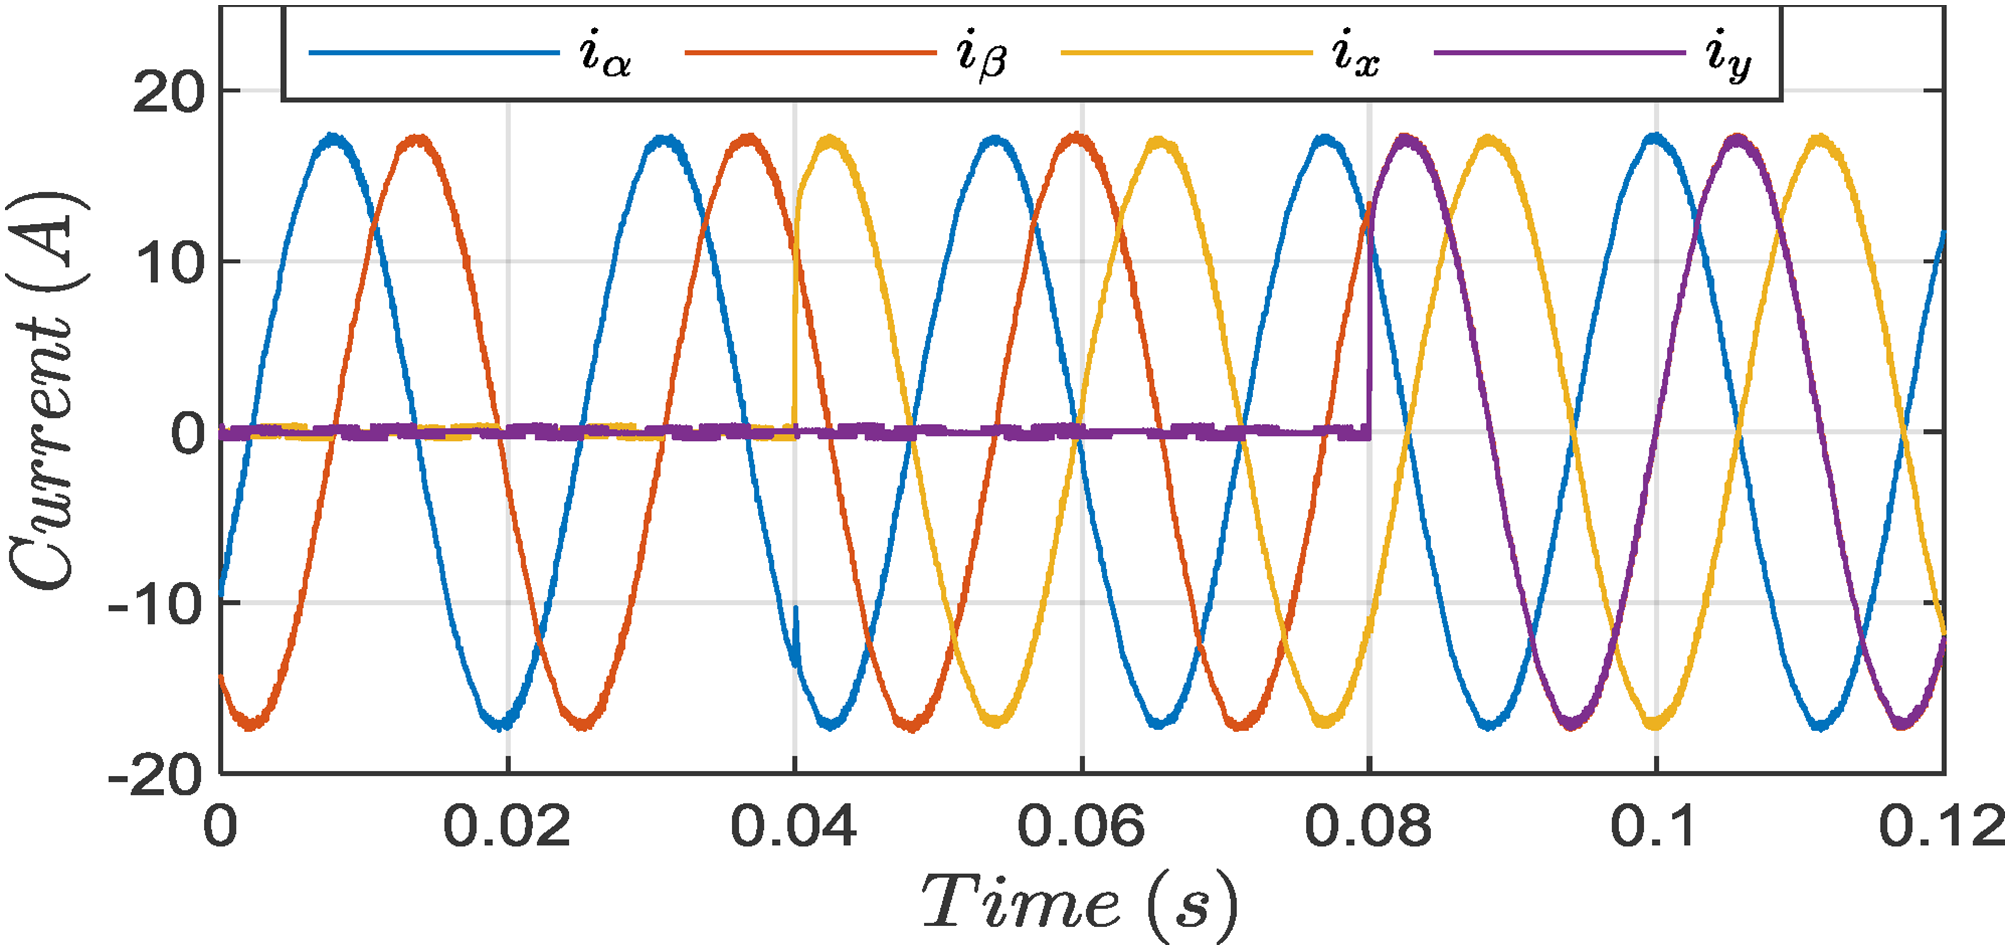
Stator currents in
Figure 13 illustrates the ASIG stator voltages. The healthy star is unaffected by the initial open phase defect, and the two healthy phases on the faulty star have the same amplitude and shifted by 120°. The second star exhibits the same faulty star behavior after the second open phase.
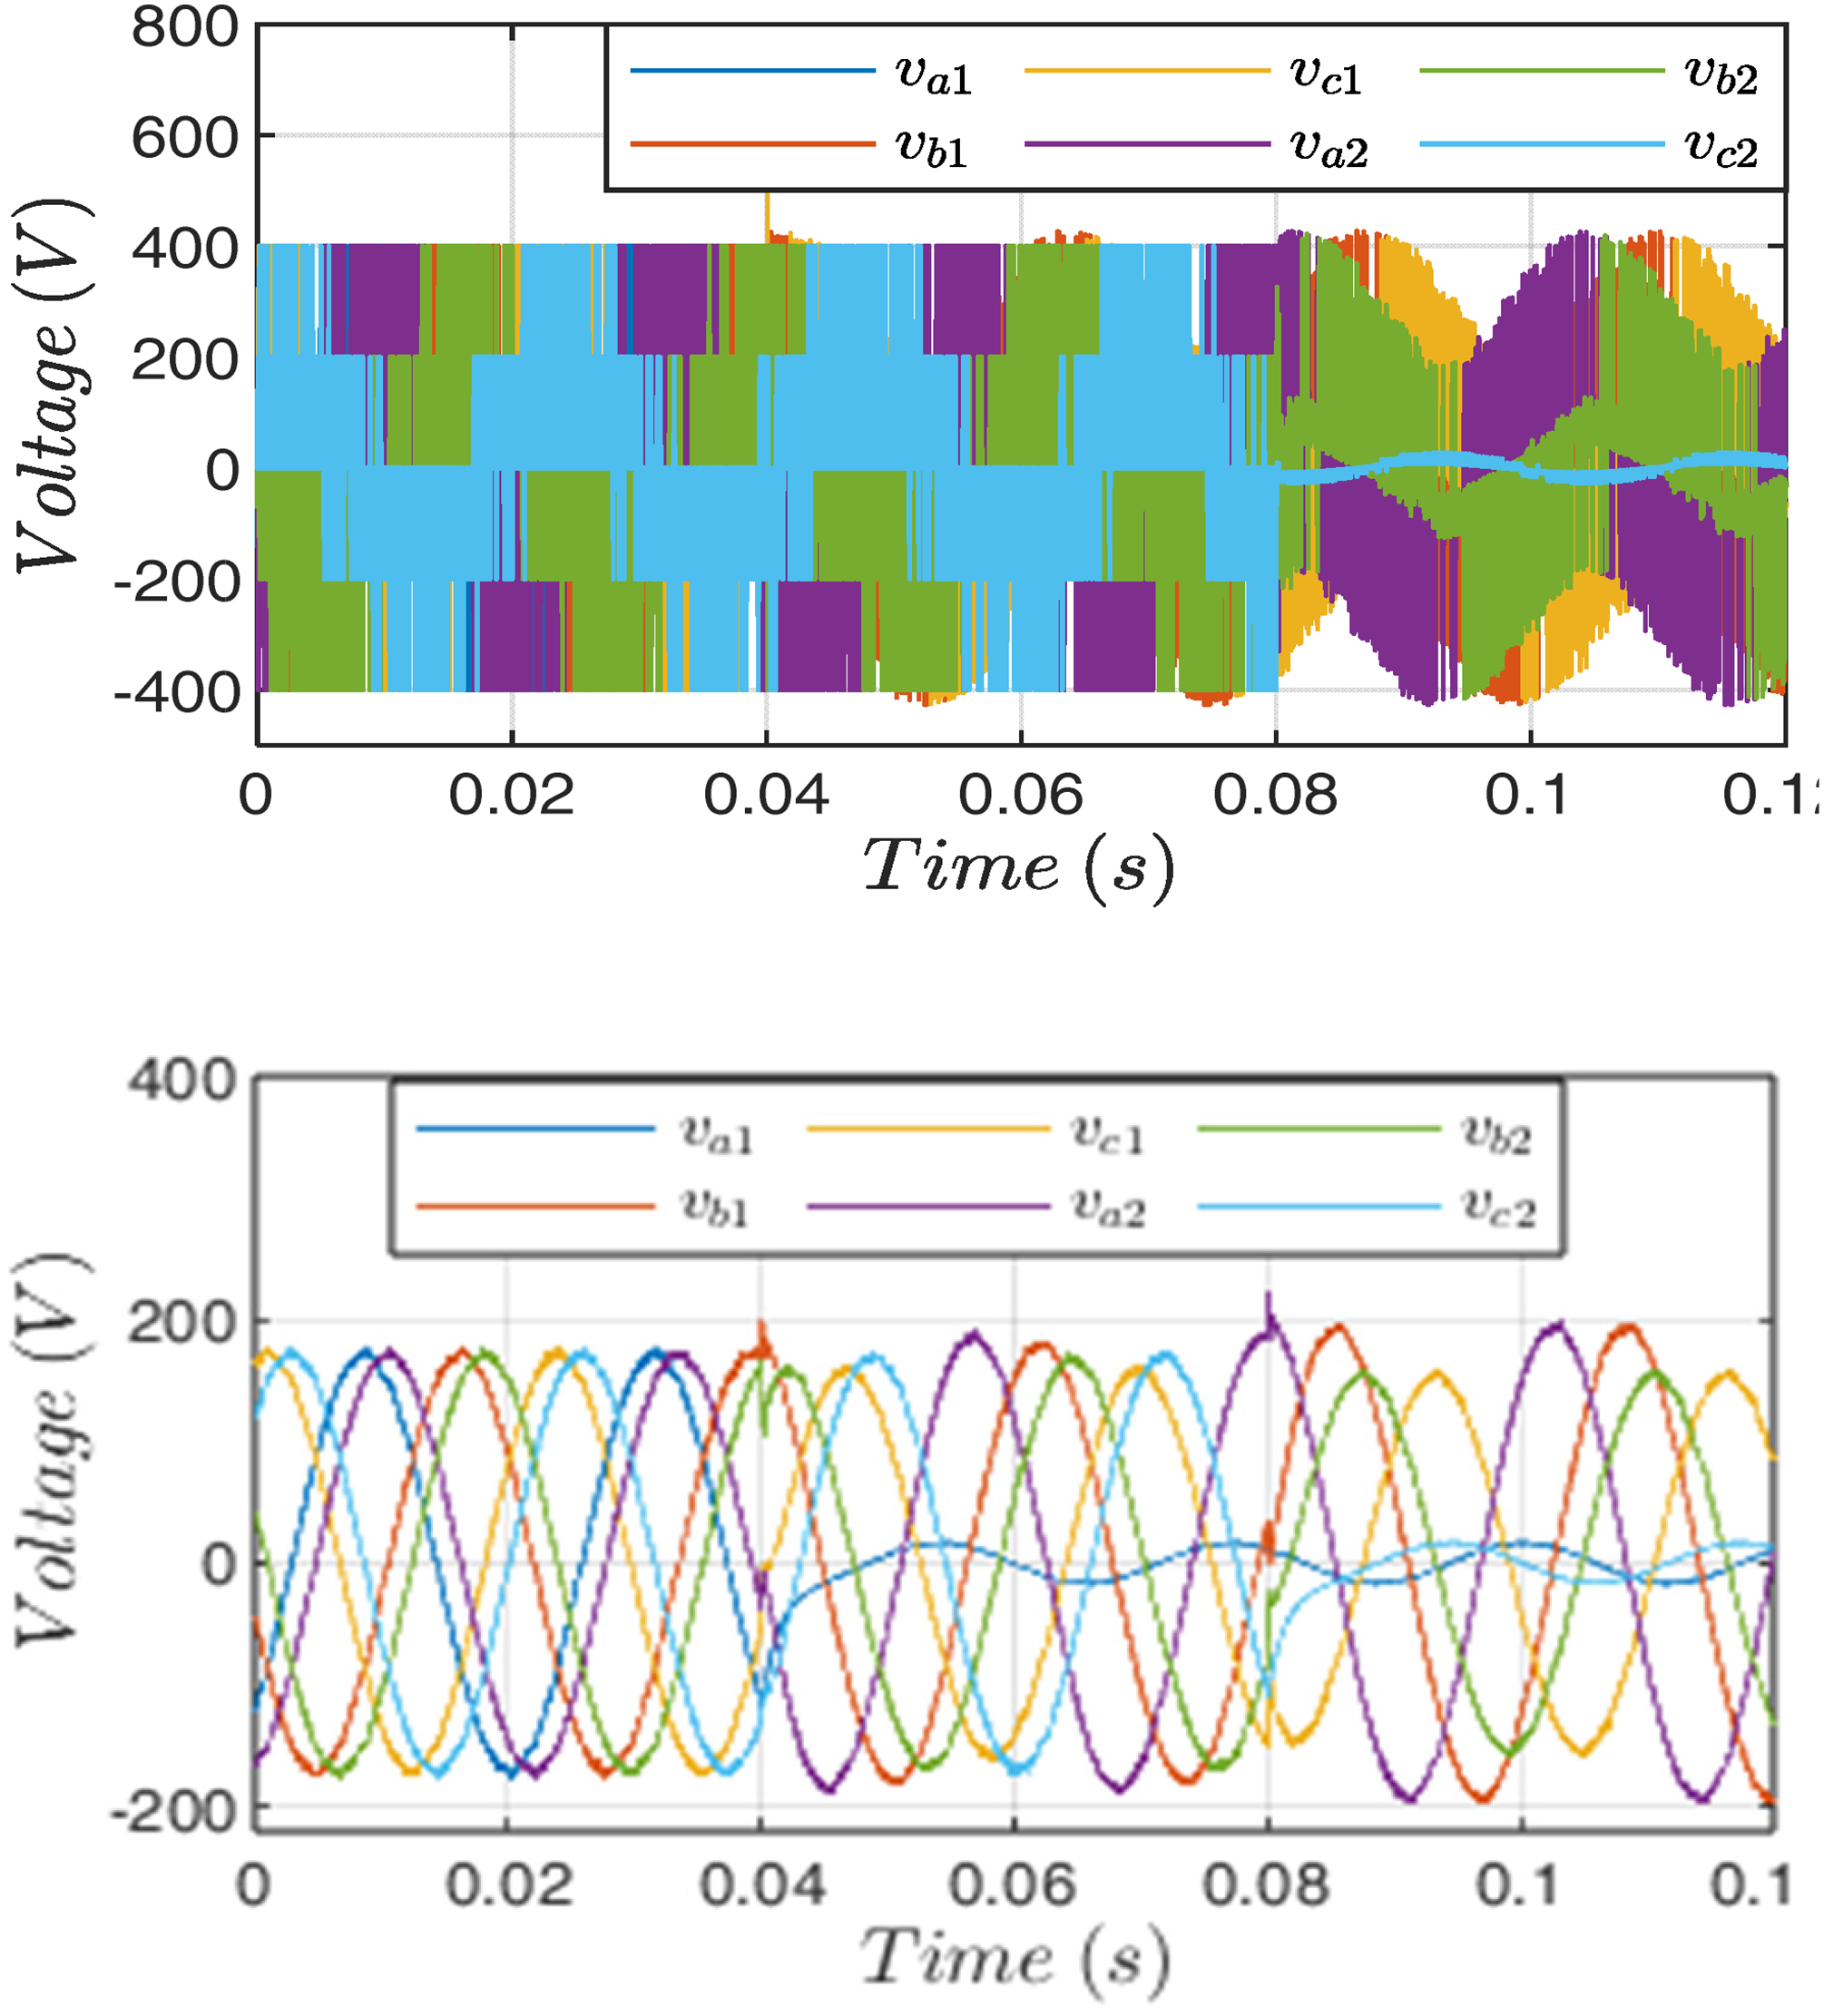
Abc stator voltage: (a) actual signal; (b) filtered signal.
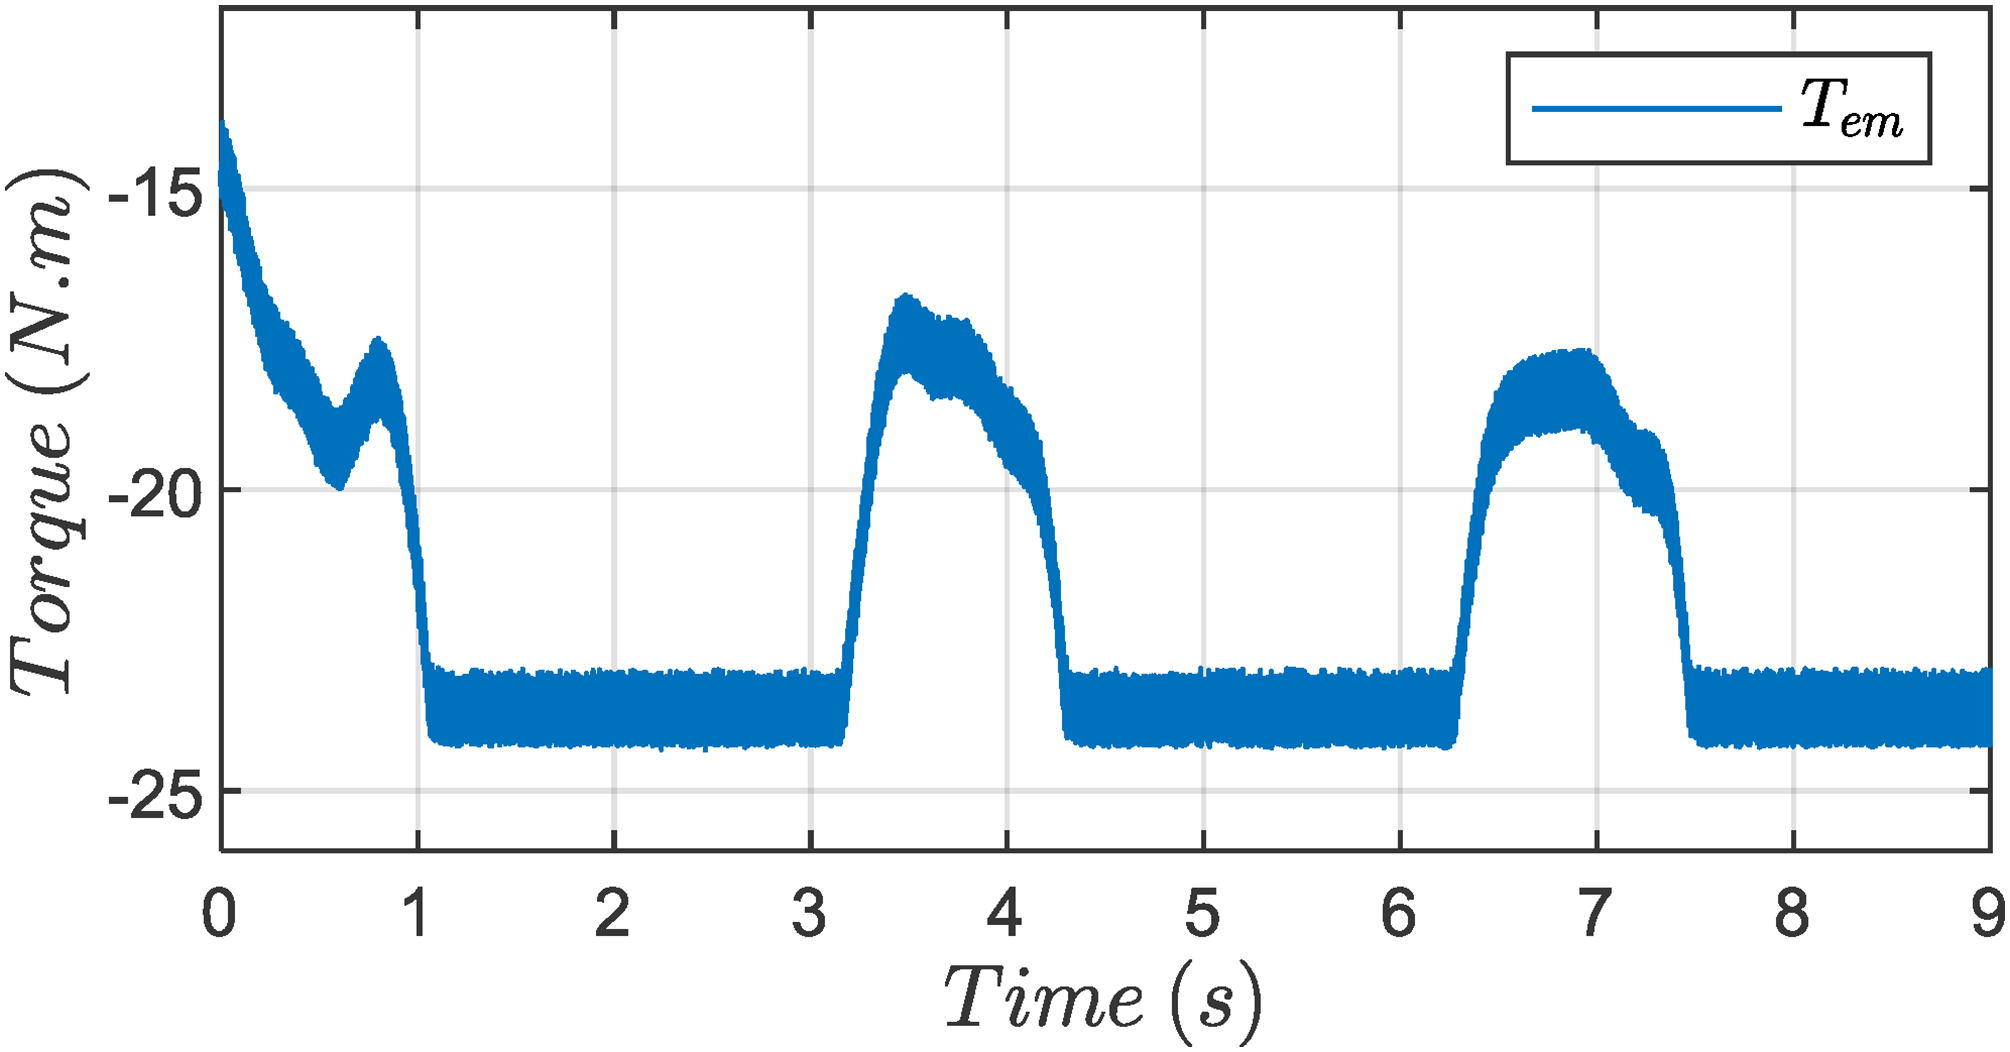
Figures 14 and 15 show the speed and torque of the machine, respectively. These quantities remain under control in all situations, thanks to the inherent fault tolerance of the ASIG and the PPC, with a speed ripple of 7
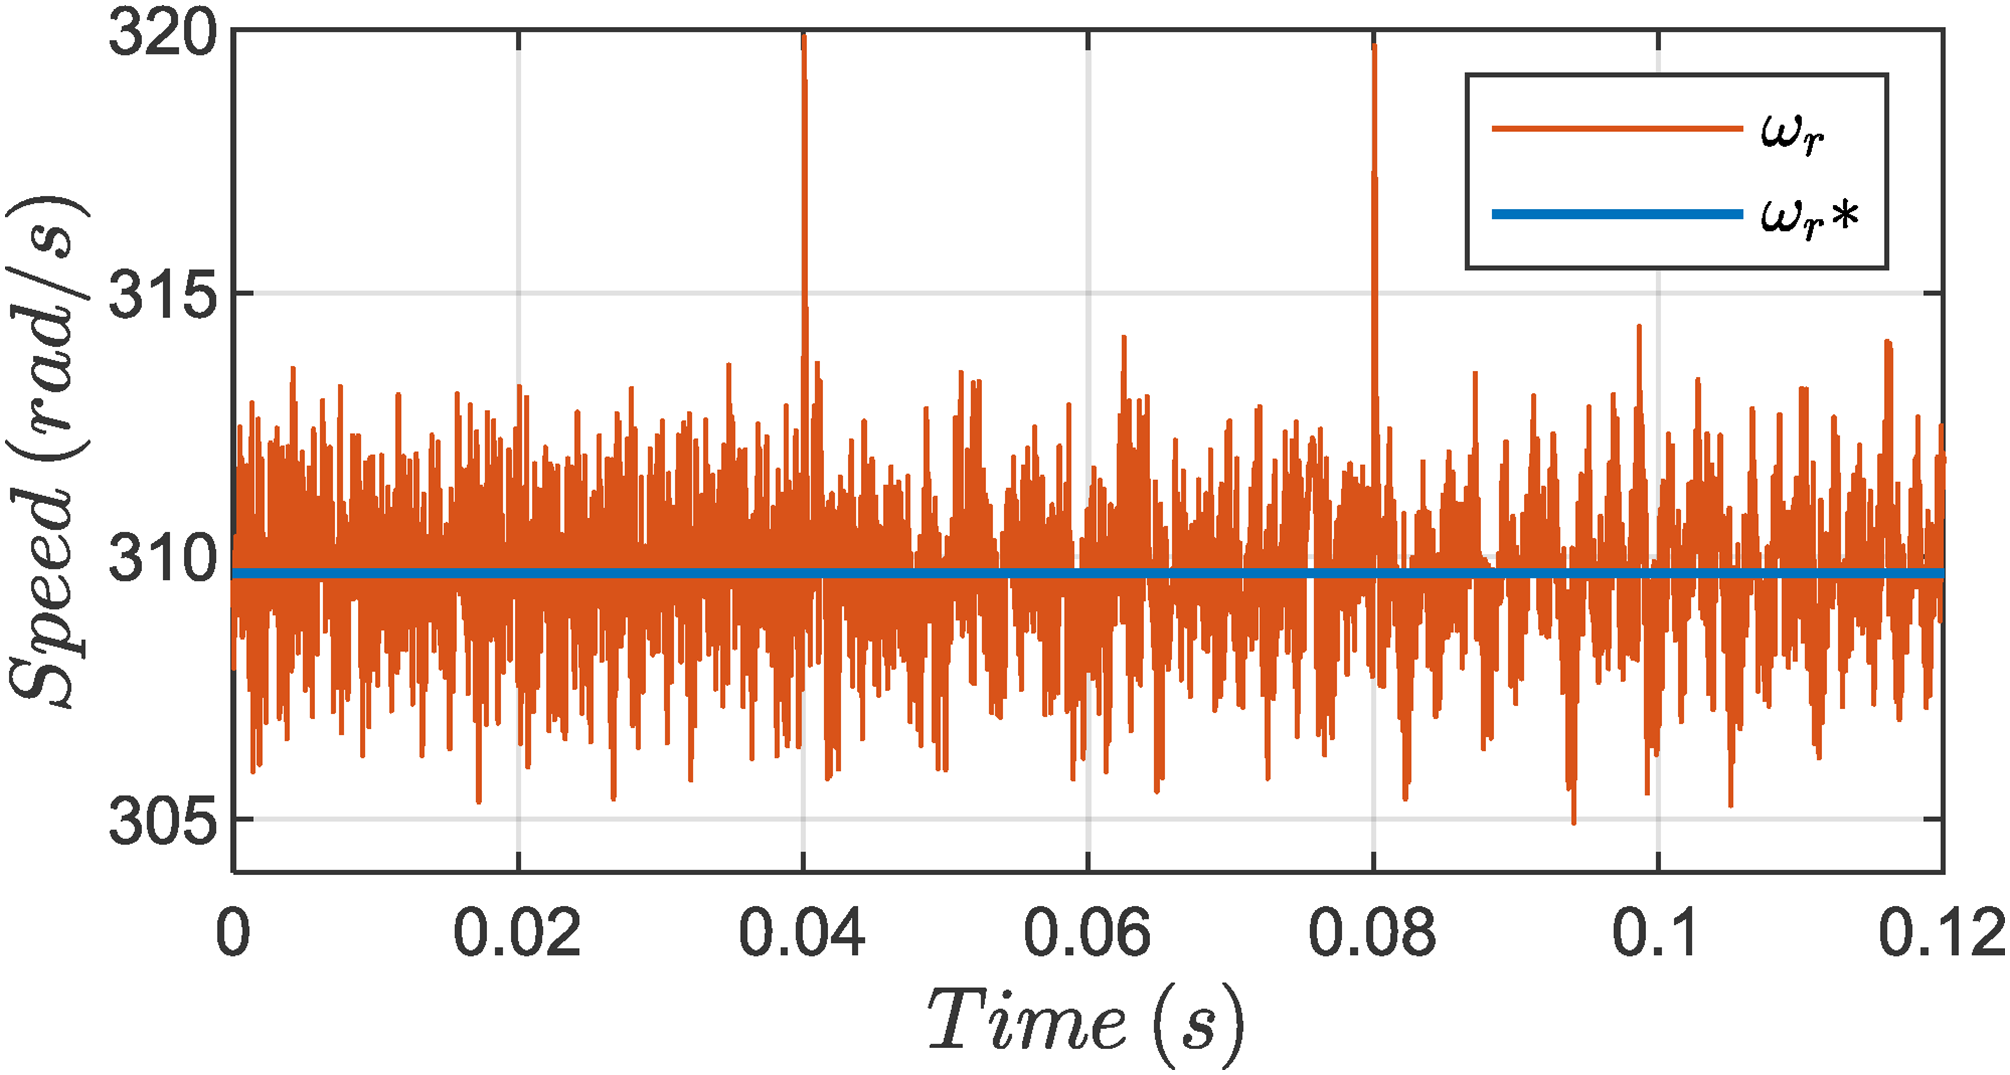
ASIG rotor speed.
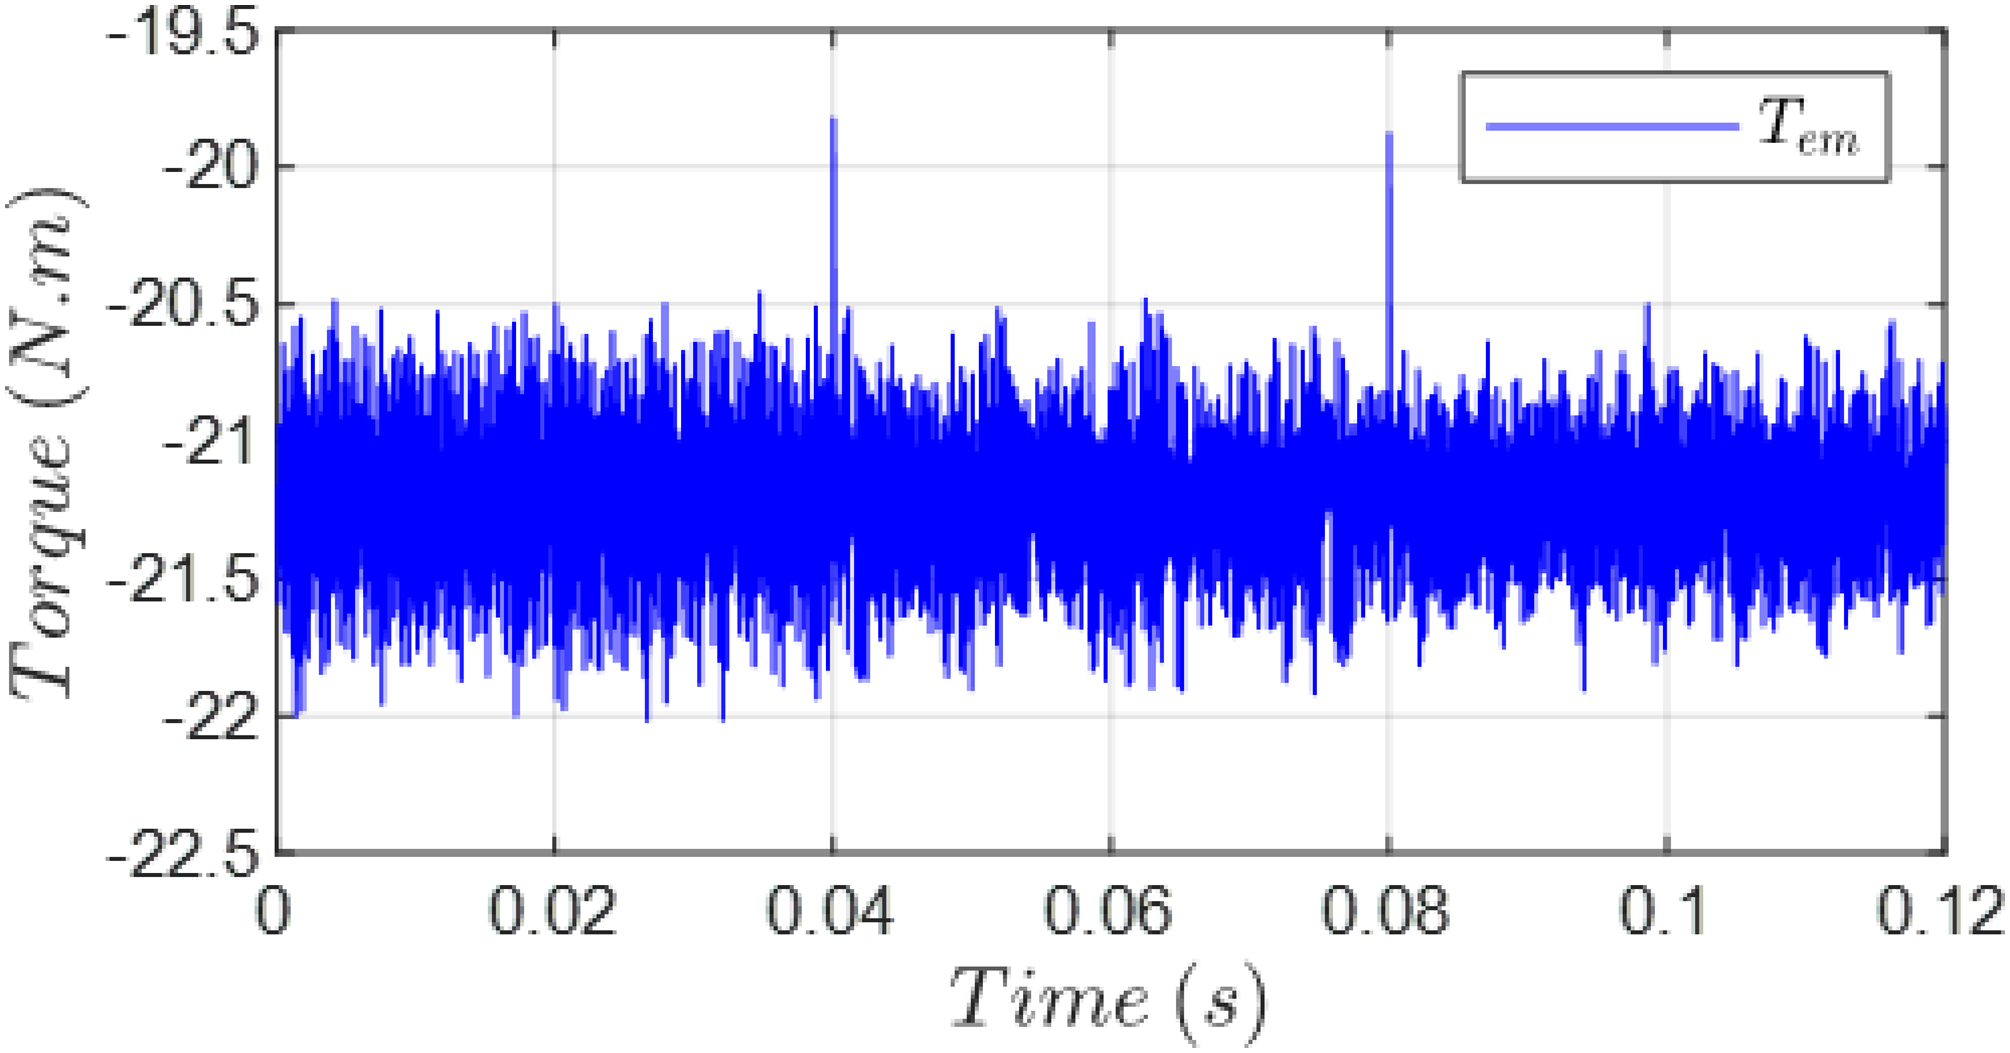
Electromagnetic torque of the ASIG.
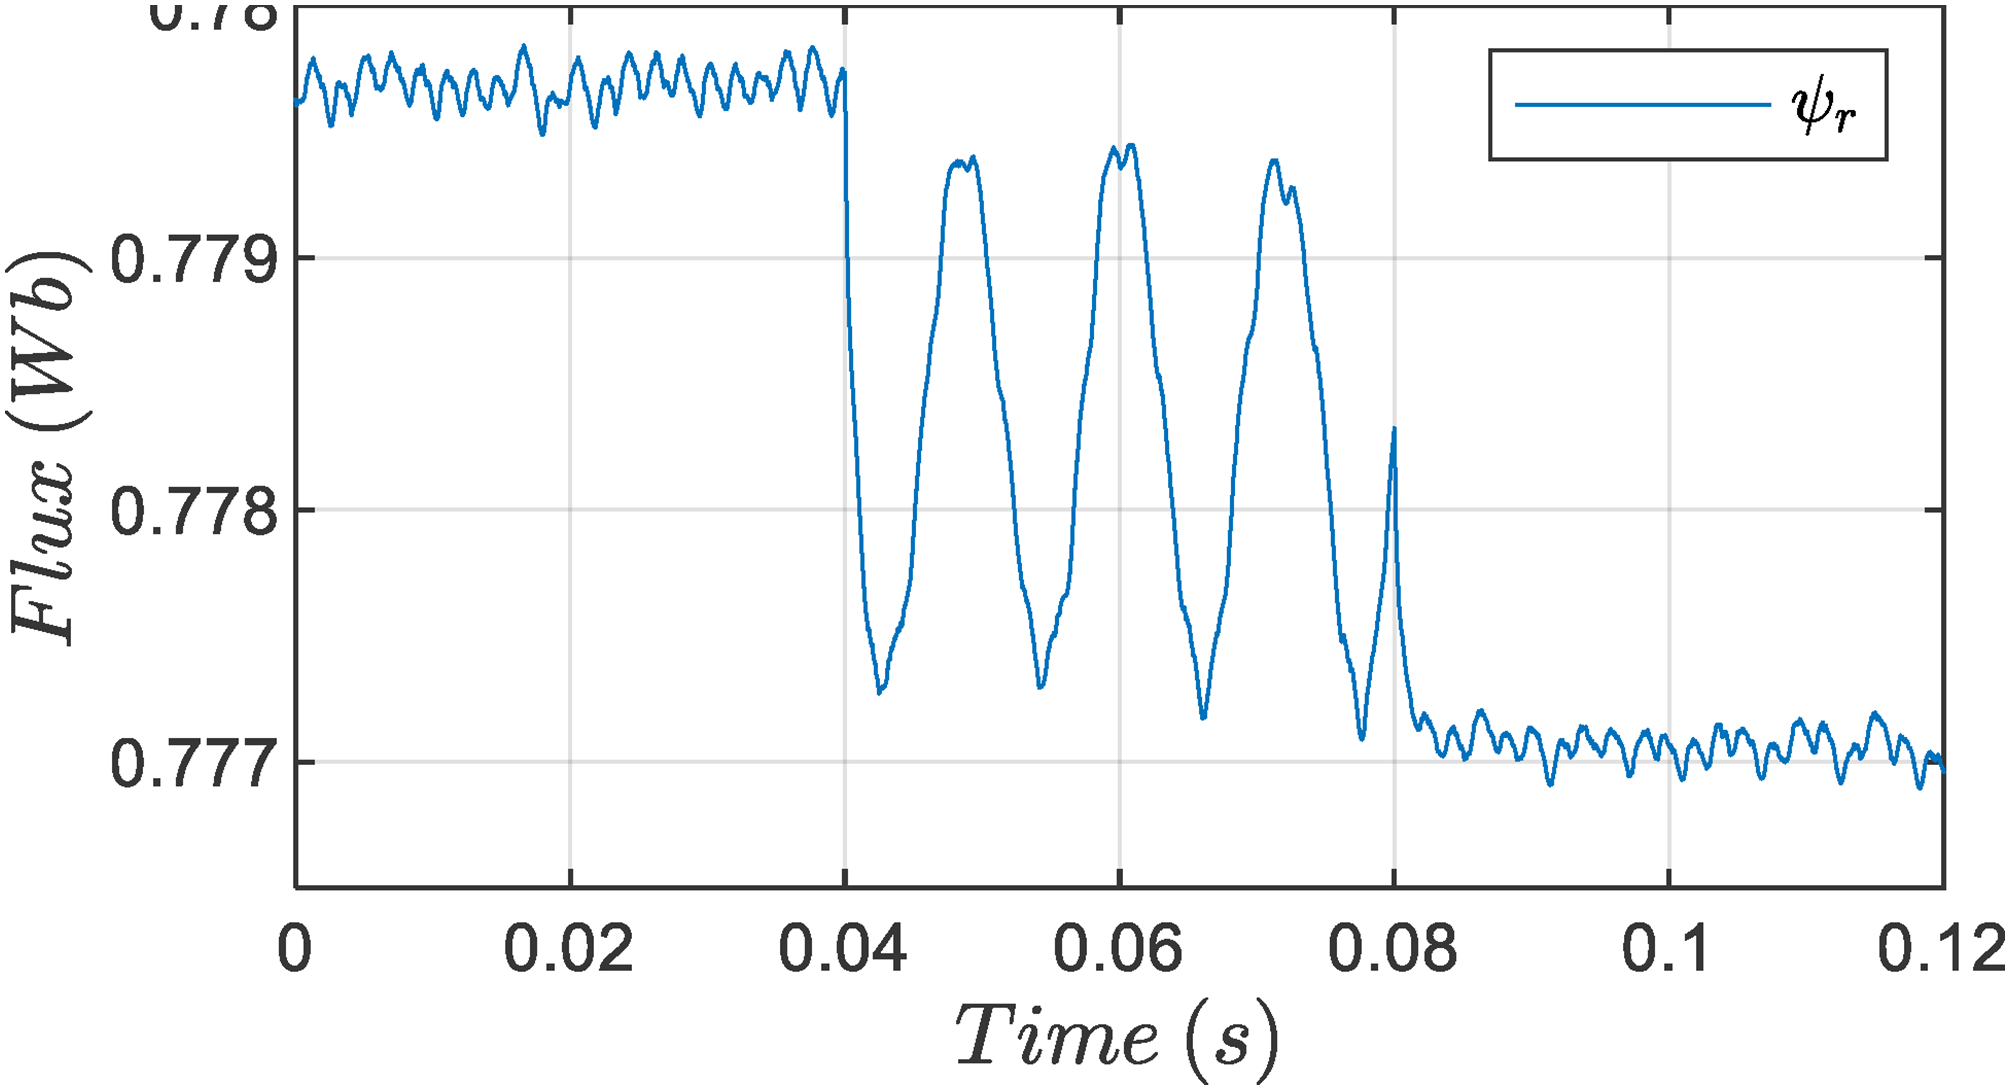
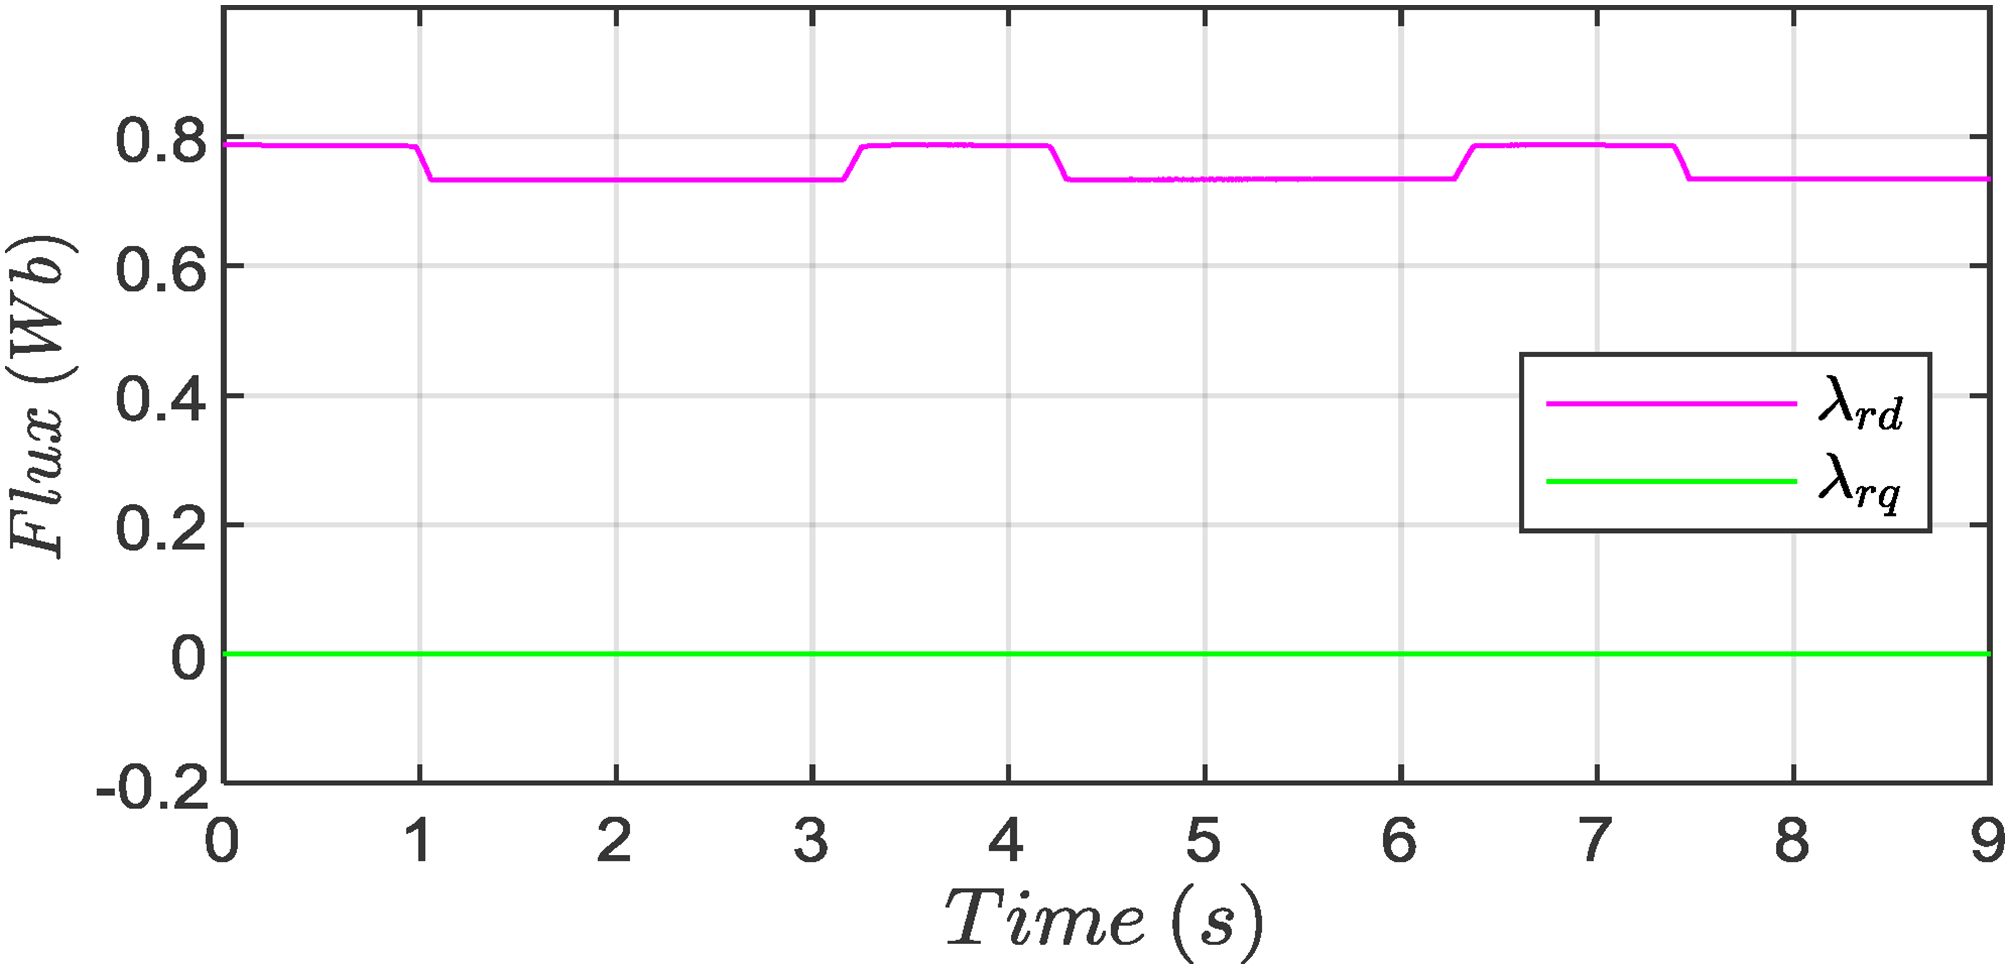
Rotor flux.
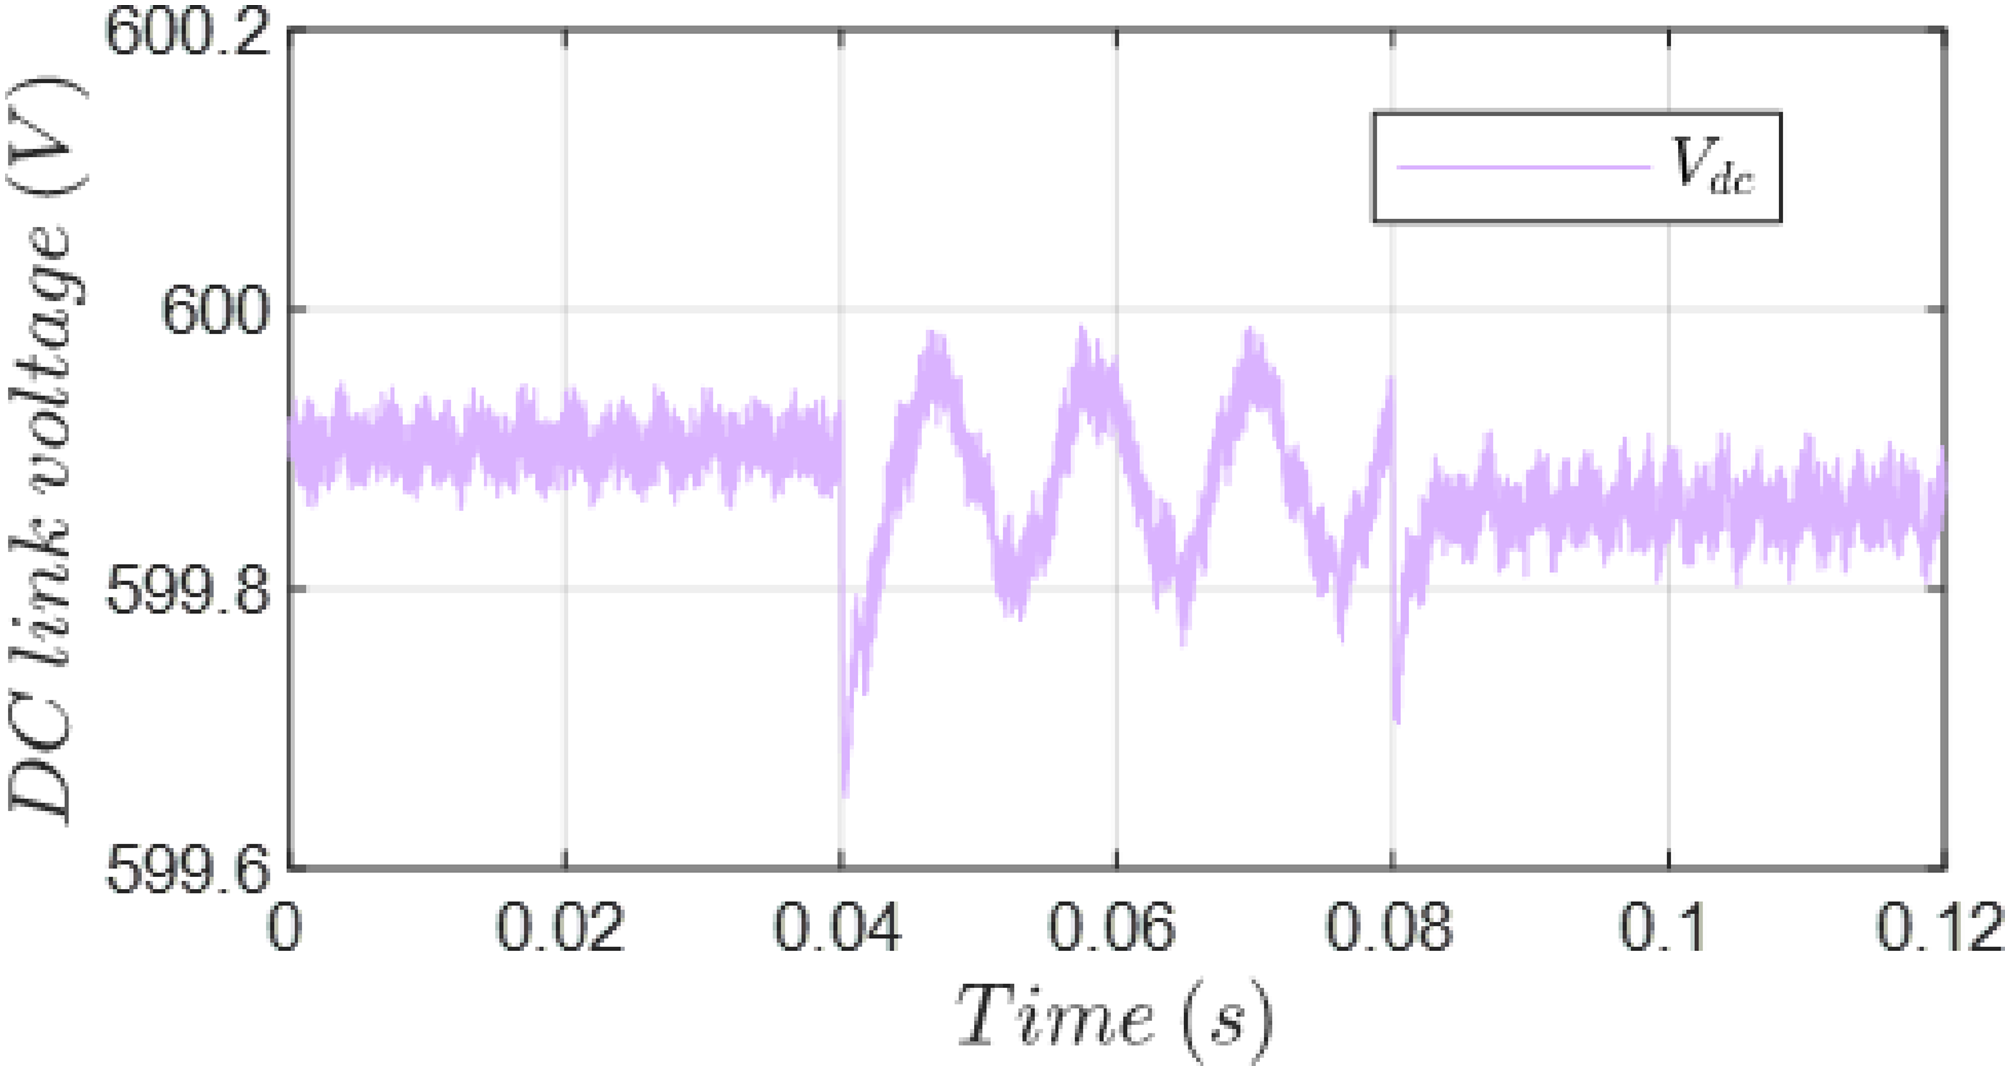
Dc link voltage.
Figure 18 depicts the ASIG’s reactive power consumption. We can observe that the machine consumes 1350 var under the usual conditions. The reactive power oscillates between 1350 and 1600 var after the open-phase failure. The reactive power used stabilized around 1600 var after the second open phase. The rise is due to the increased current value per phase.
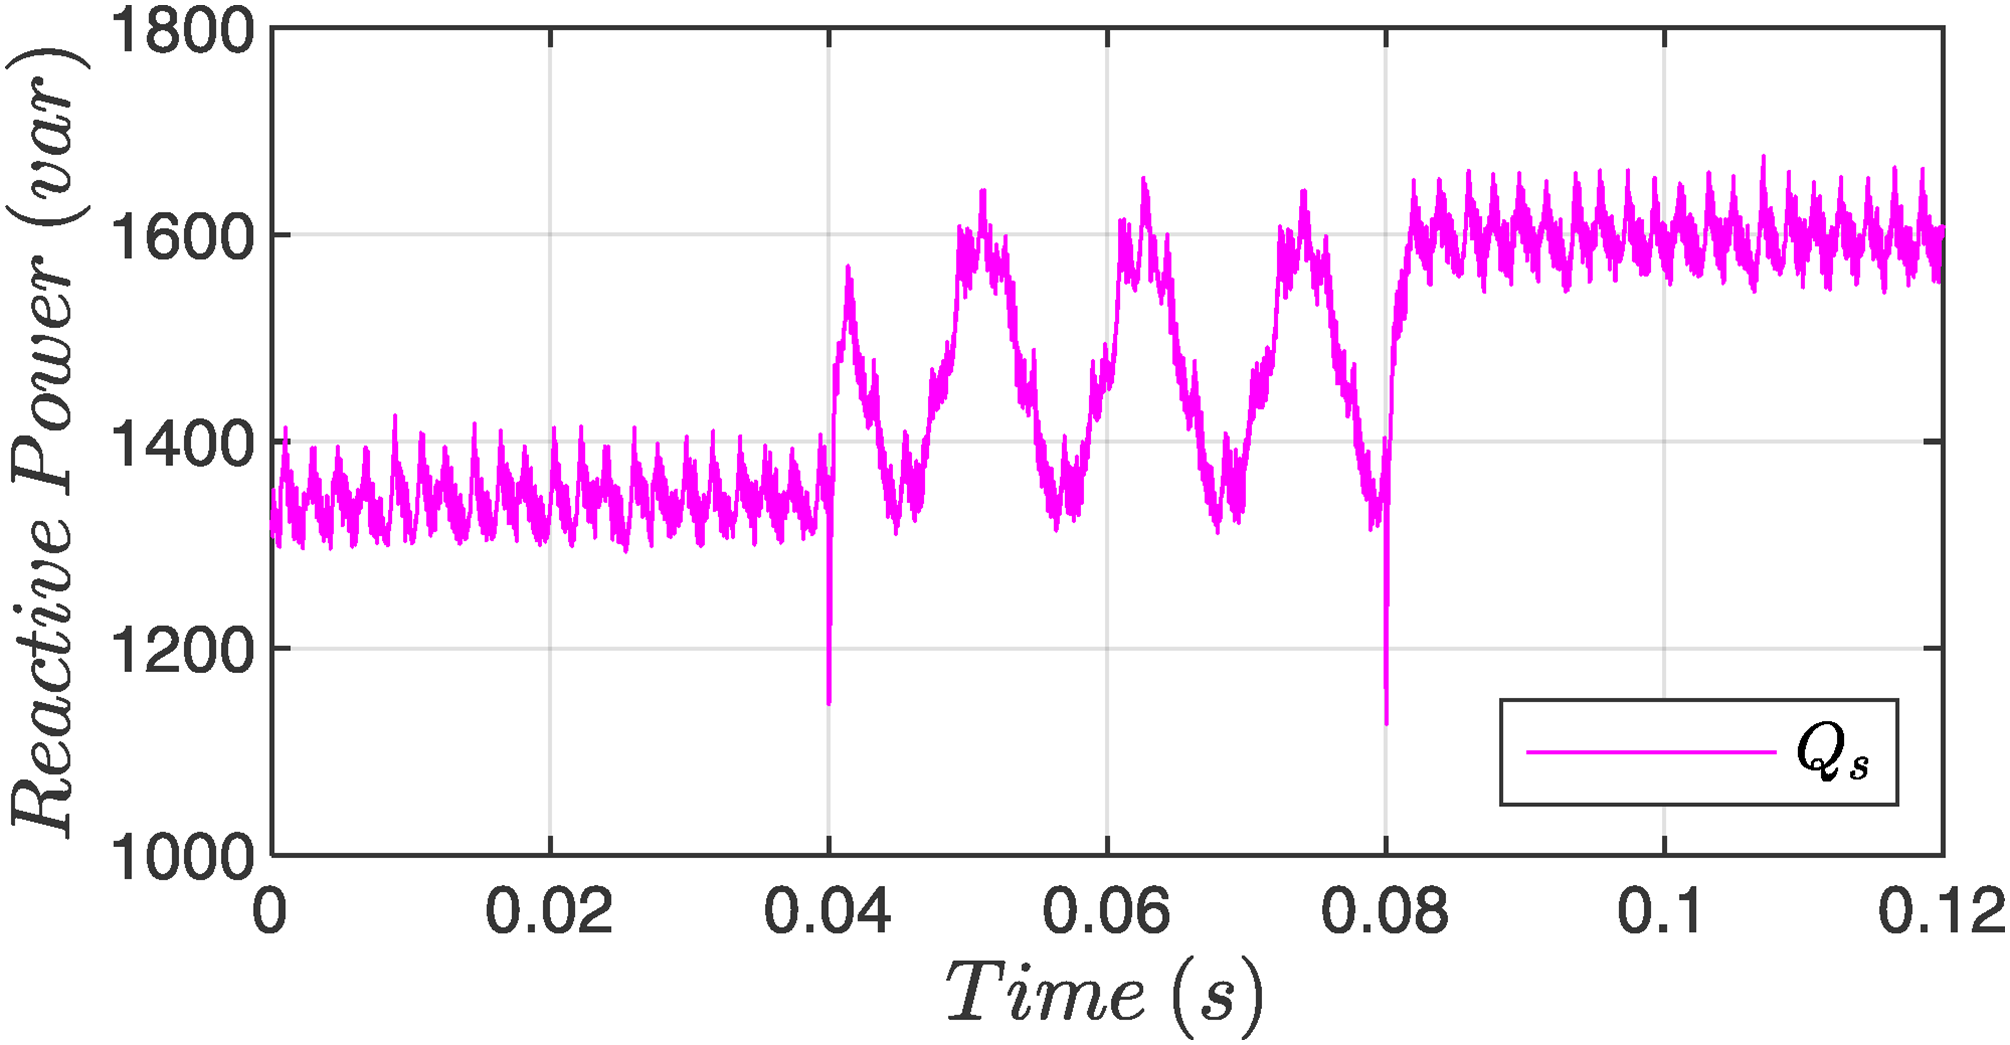
Reactive power of the ASIG.
Figures 19 and 20 depict the active and reactive power;
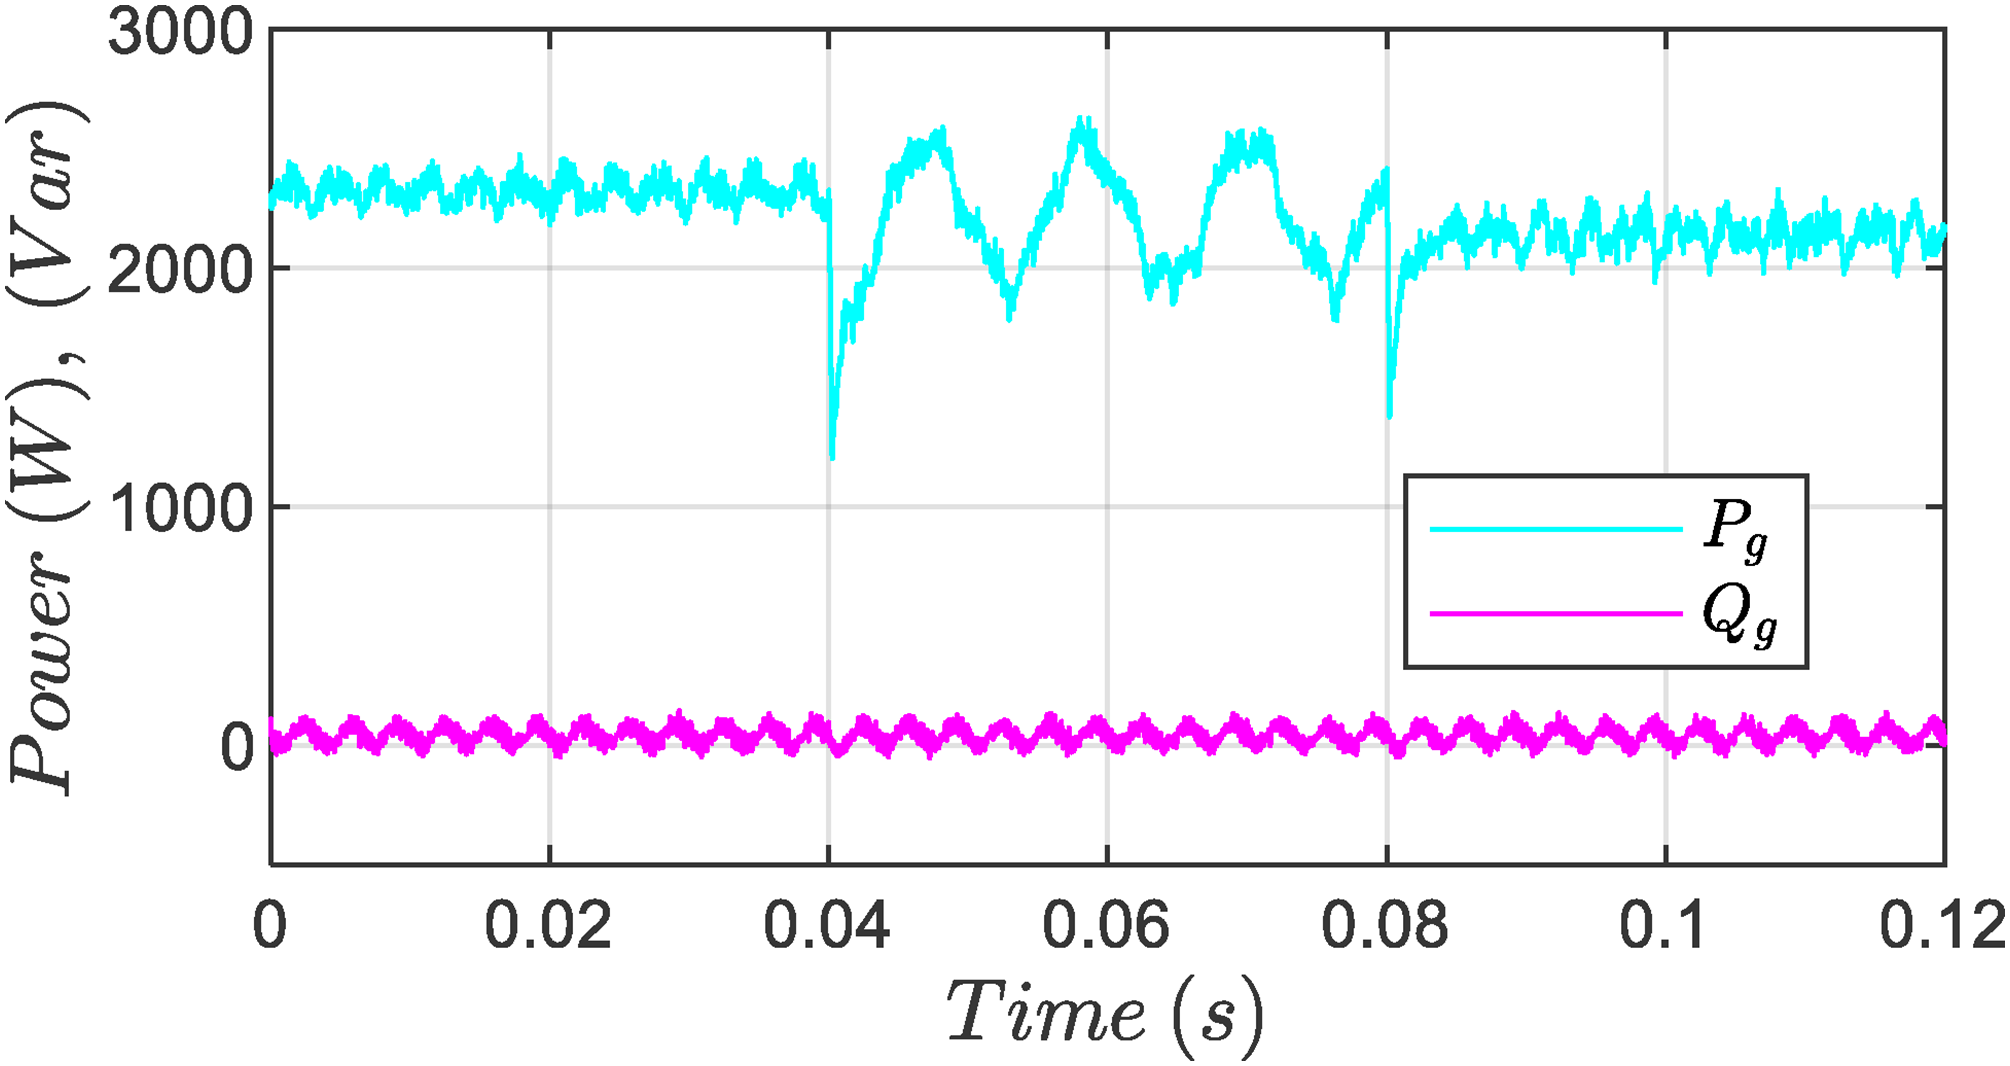
Active; reactive power supplied to the grid.
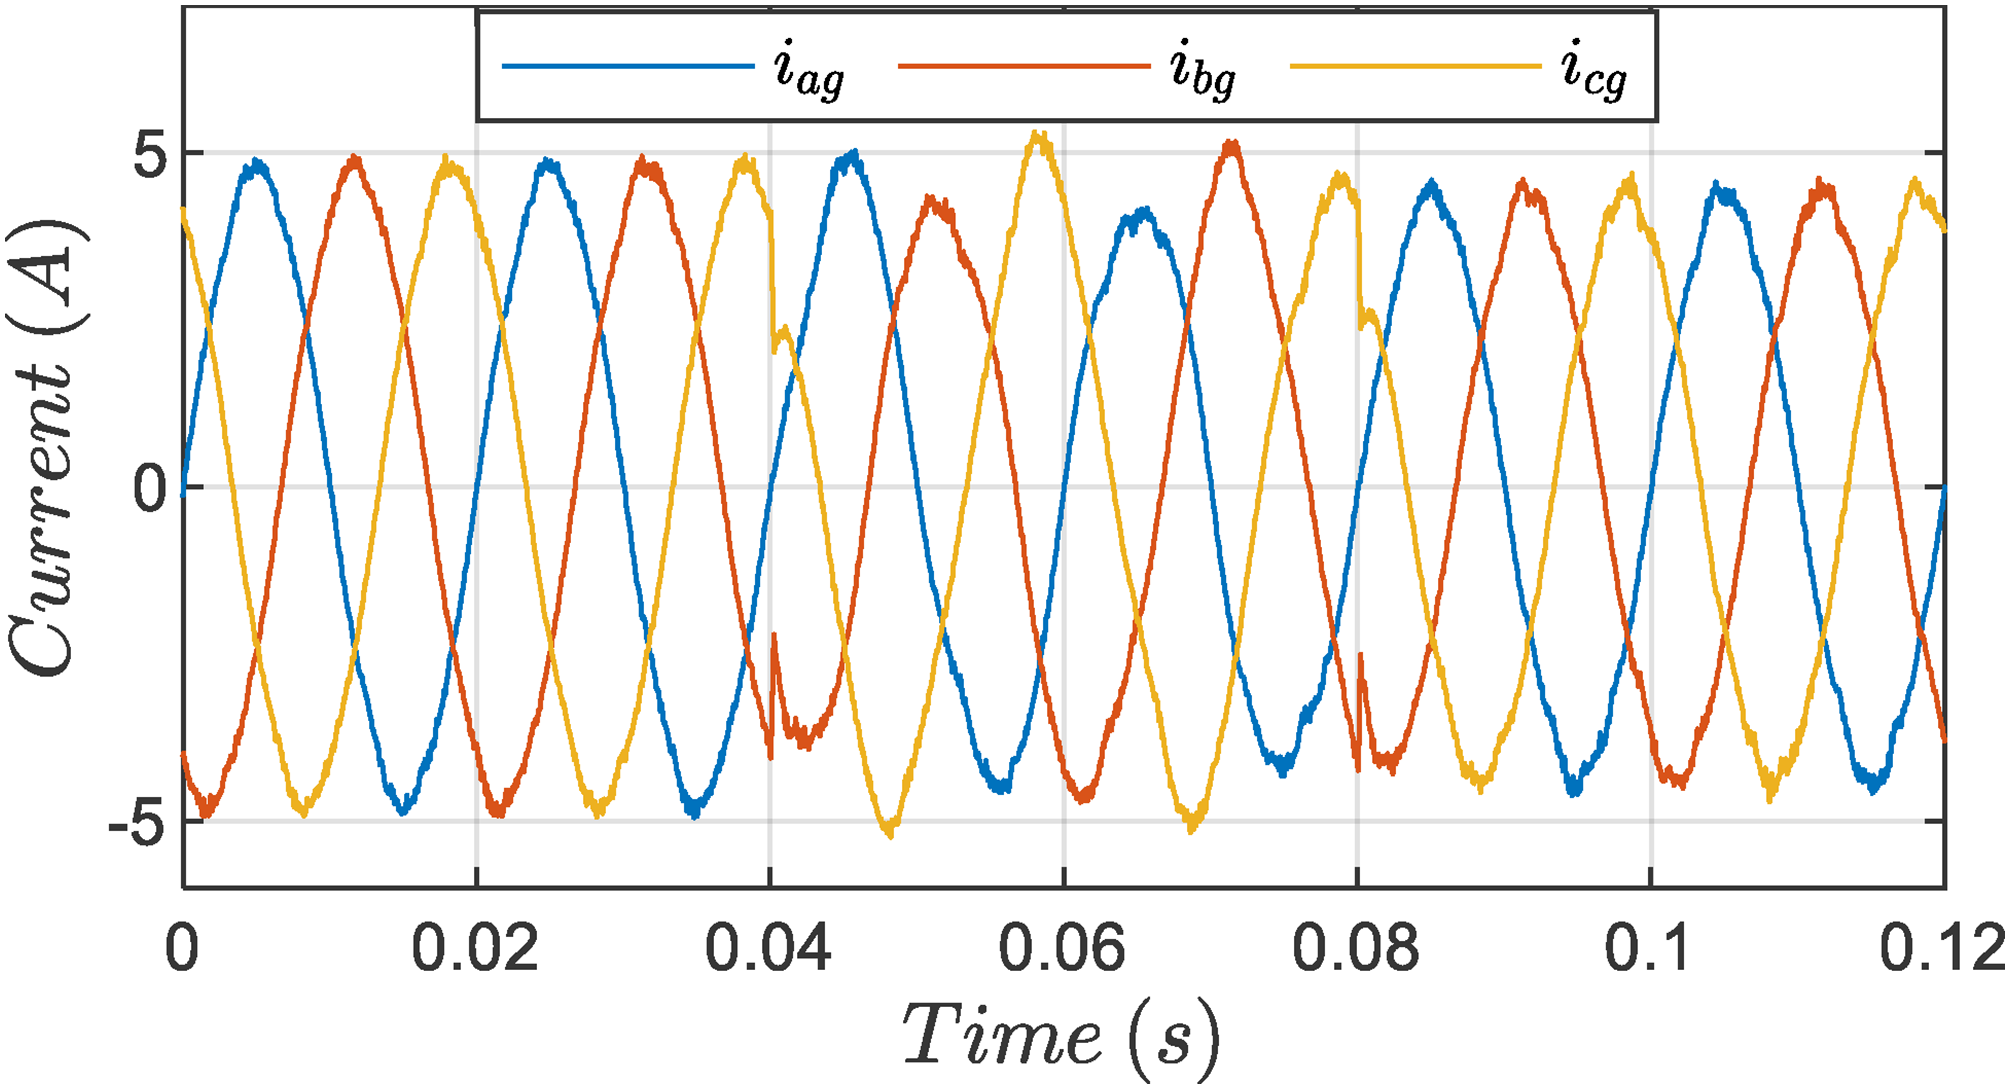
Currents injected to the grid.
Figure 21 represents the FFT signal analysis of the current injected into the grid controlled with VVV-PPC before and after the open phase fault (a-b) and controlled with the proposed OPFT-SVM-PPC in the presence of the open phase fault (c).
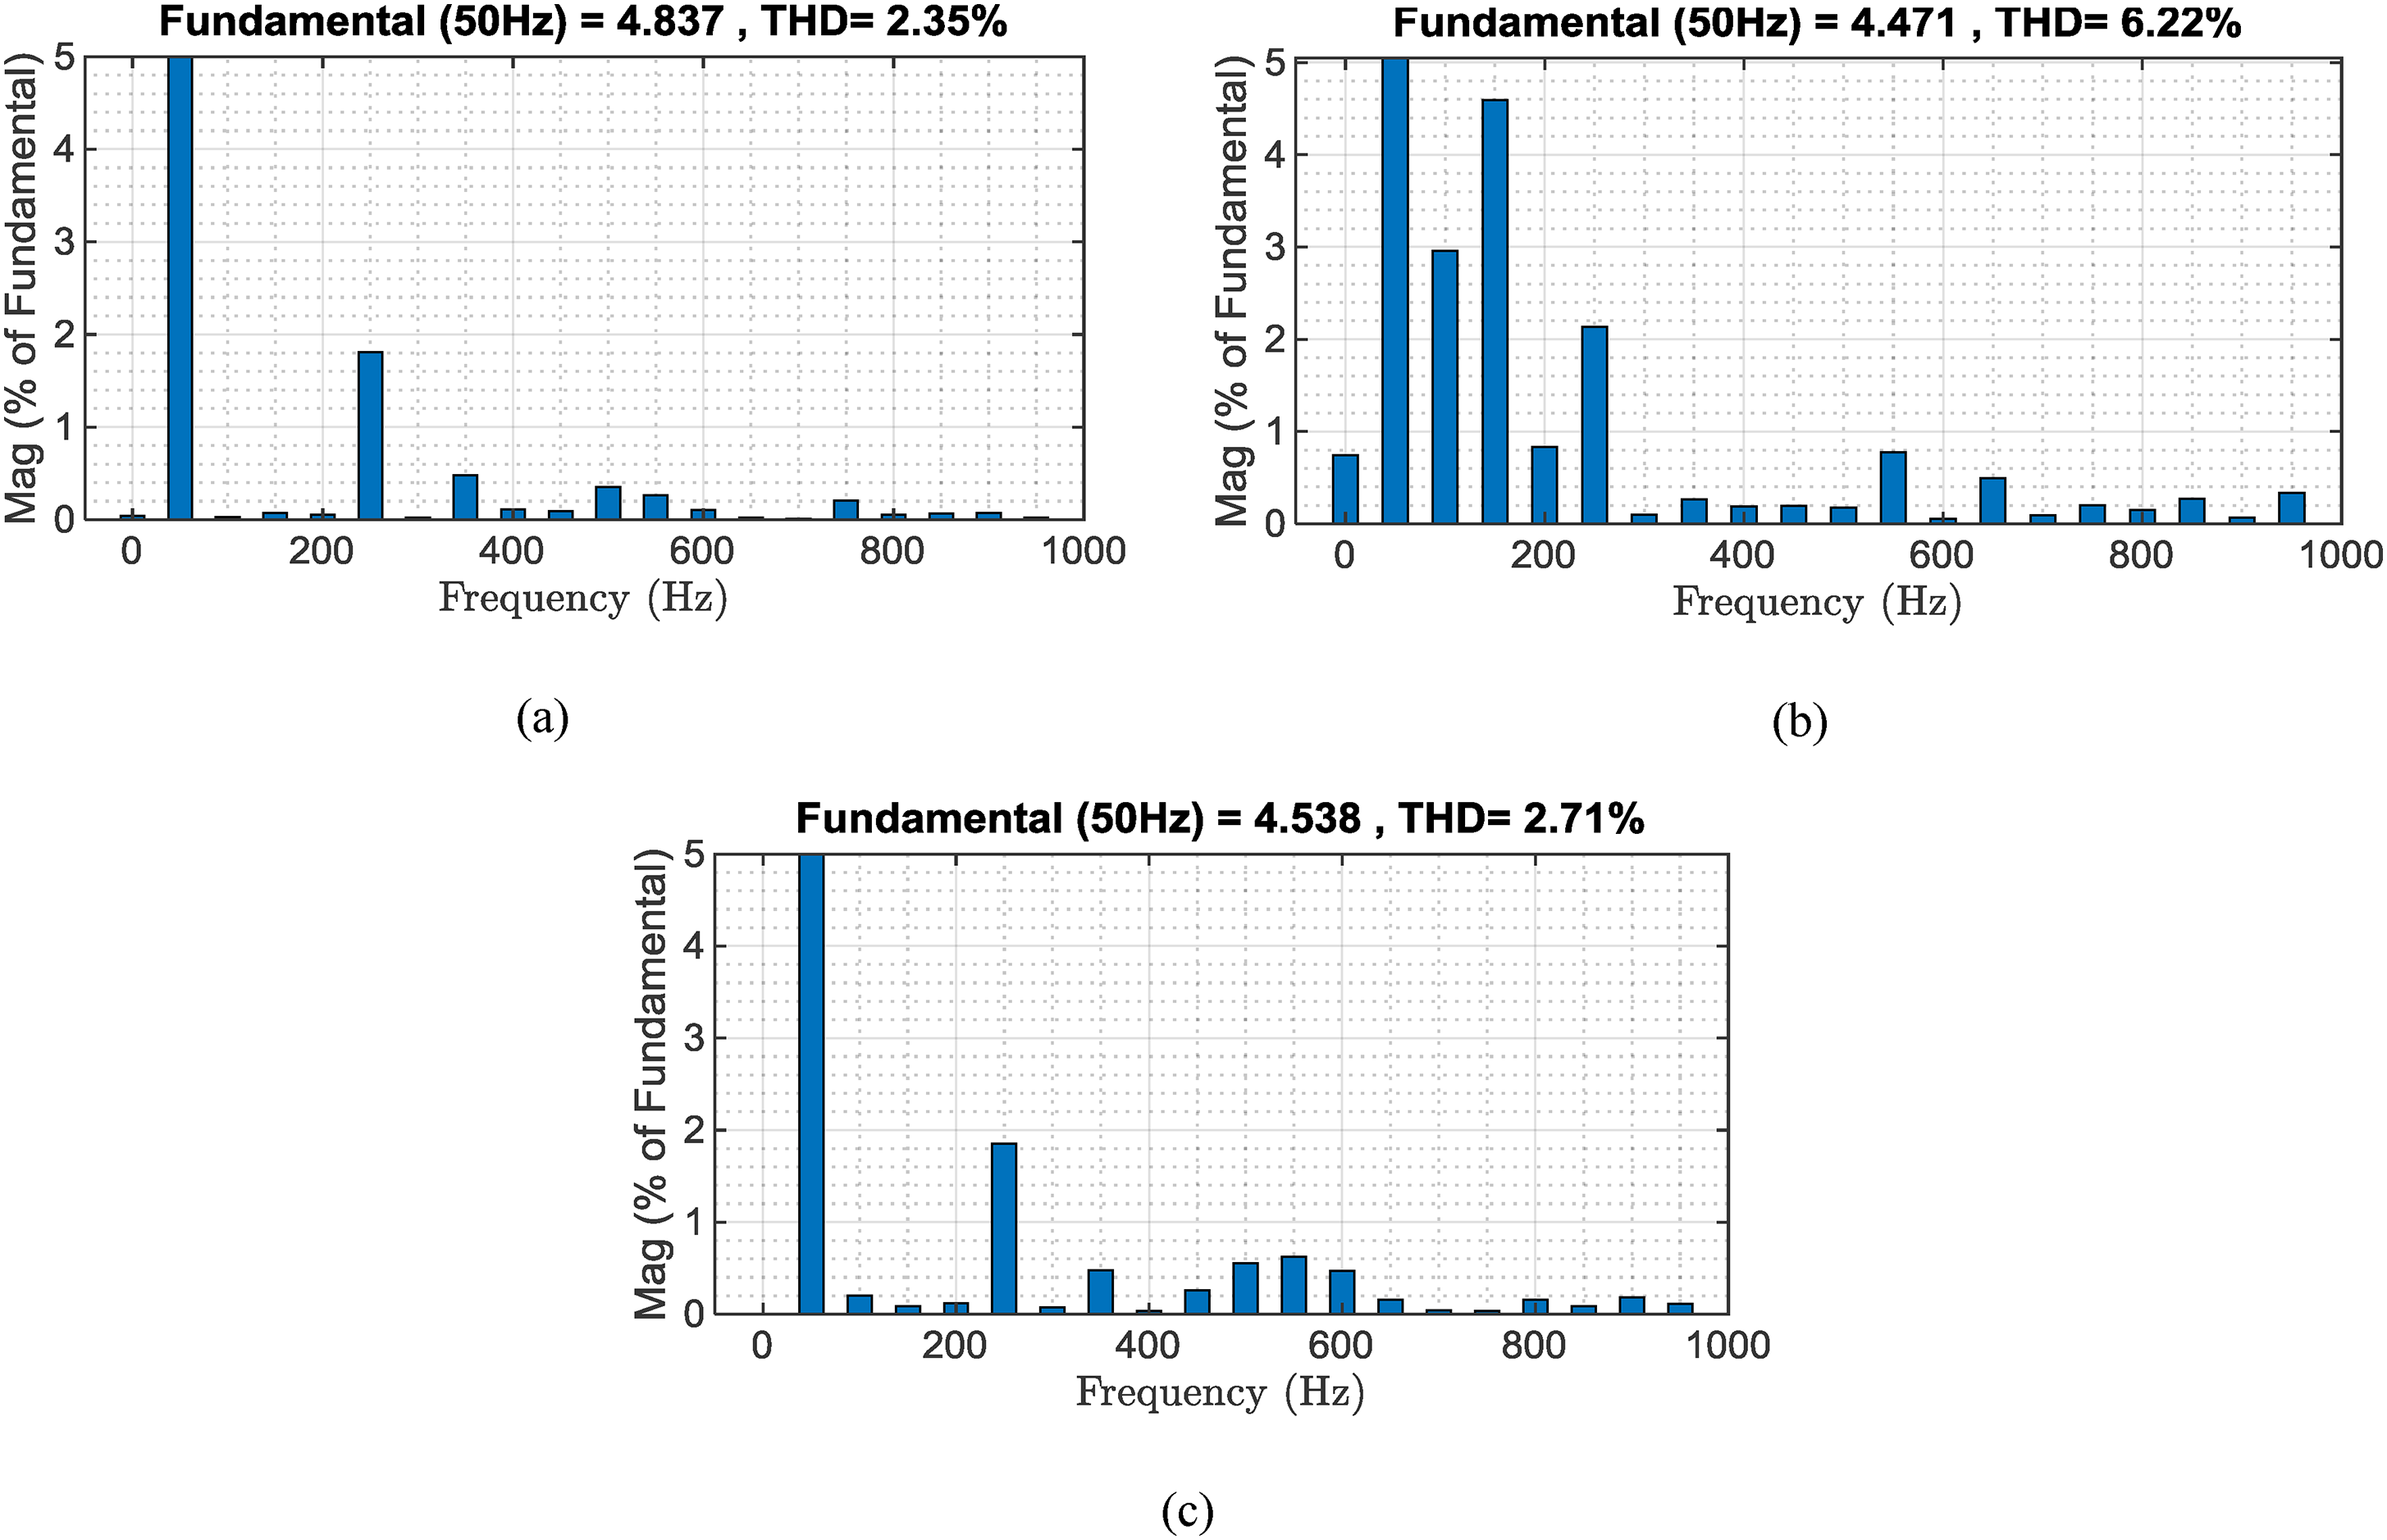
Grid current harmonic for: (a) healthy machine; (b) open phase fault with VVV-PPC; (c) open phase fault with OPFT-SVM-PPC.
Under normal operating conditions, the conventional VVV-PPC effectively delivers high-quality energy to the grid, maintaining a Total Harmonic Distortion (THD) of just 2.35%. This low THD indicates that the energy supplied to the grid is relatively free from harmonic distortion, ensuring stable and efficient energy transmission.
However, following a system failure, the THD significantly increased to 6.22%. This rise in THD suggests a notable degradation in energy quality, likely due to the introduction of harmonics or distortions caused by the fault. Such an increase in THD can severely disrupt energy transmission, potentially leading to grid instability and interruptions in energy supply.
In response to this issue, the implementation of the proposed OPFT-SVM-PPC was evaluated. Post-application of this advanced control strategy, the THD decreased to 2.71%. This reduction demonstrates that the OPFT-SVM-PPC effectively mitigates the harmonic distortions and restores the energy quality closer to the levels observed under normal conditions.
The reduction in THD from 6.22% to 2.71% indicates that the OPFT-SVM-PPC is successful in improving the harmonic performance of the system, thereby enhancing the quality of energy transmitted to the grid. This improvement not only reflects the robustness of the proposed control strategy in managing system faults but also underscores its effectiveness in maintaining the integrity and stability of the energy supply.
The results suggest that the OPFT-SVM-PPC provides a significant advantage in fault conditions, making it a viable solution for ensuring high-quality energy transmission and minimizing disruptions in the grid.
This expanded discussion covers the impact of the system failure on energy quality, the effectiveness of the proposed control strategy, and its significance in maintaining energy stability.
Transient analysis
The simulation result of the reaction of the proposed control against an open-phase fault provoked at 0.04 s under a fixed wind speed of 9 m/s is presented and analyzed in this part. Figure 22 depicts the machine's actual rotation speed with the speed reference supplied by the MPPT block. We notice that after the open-phase fault, the speed control is restored after a setting time of 0.0005 s. This rapid restoration indicates that the control system effectively compensates for the fault with minimal delay
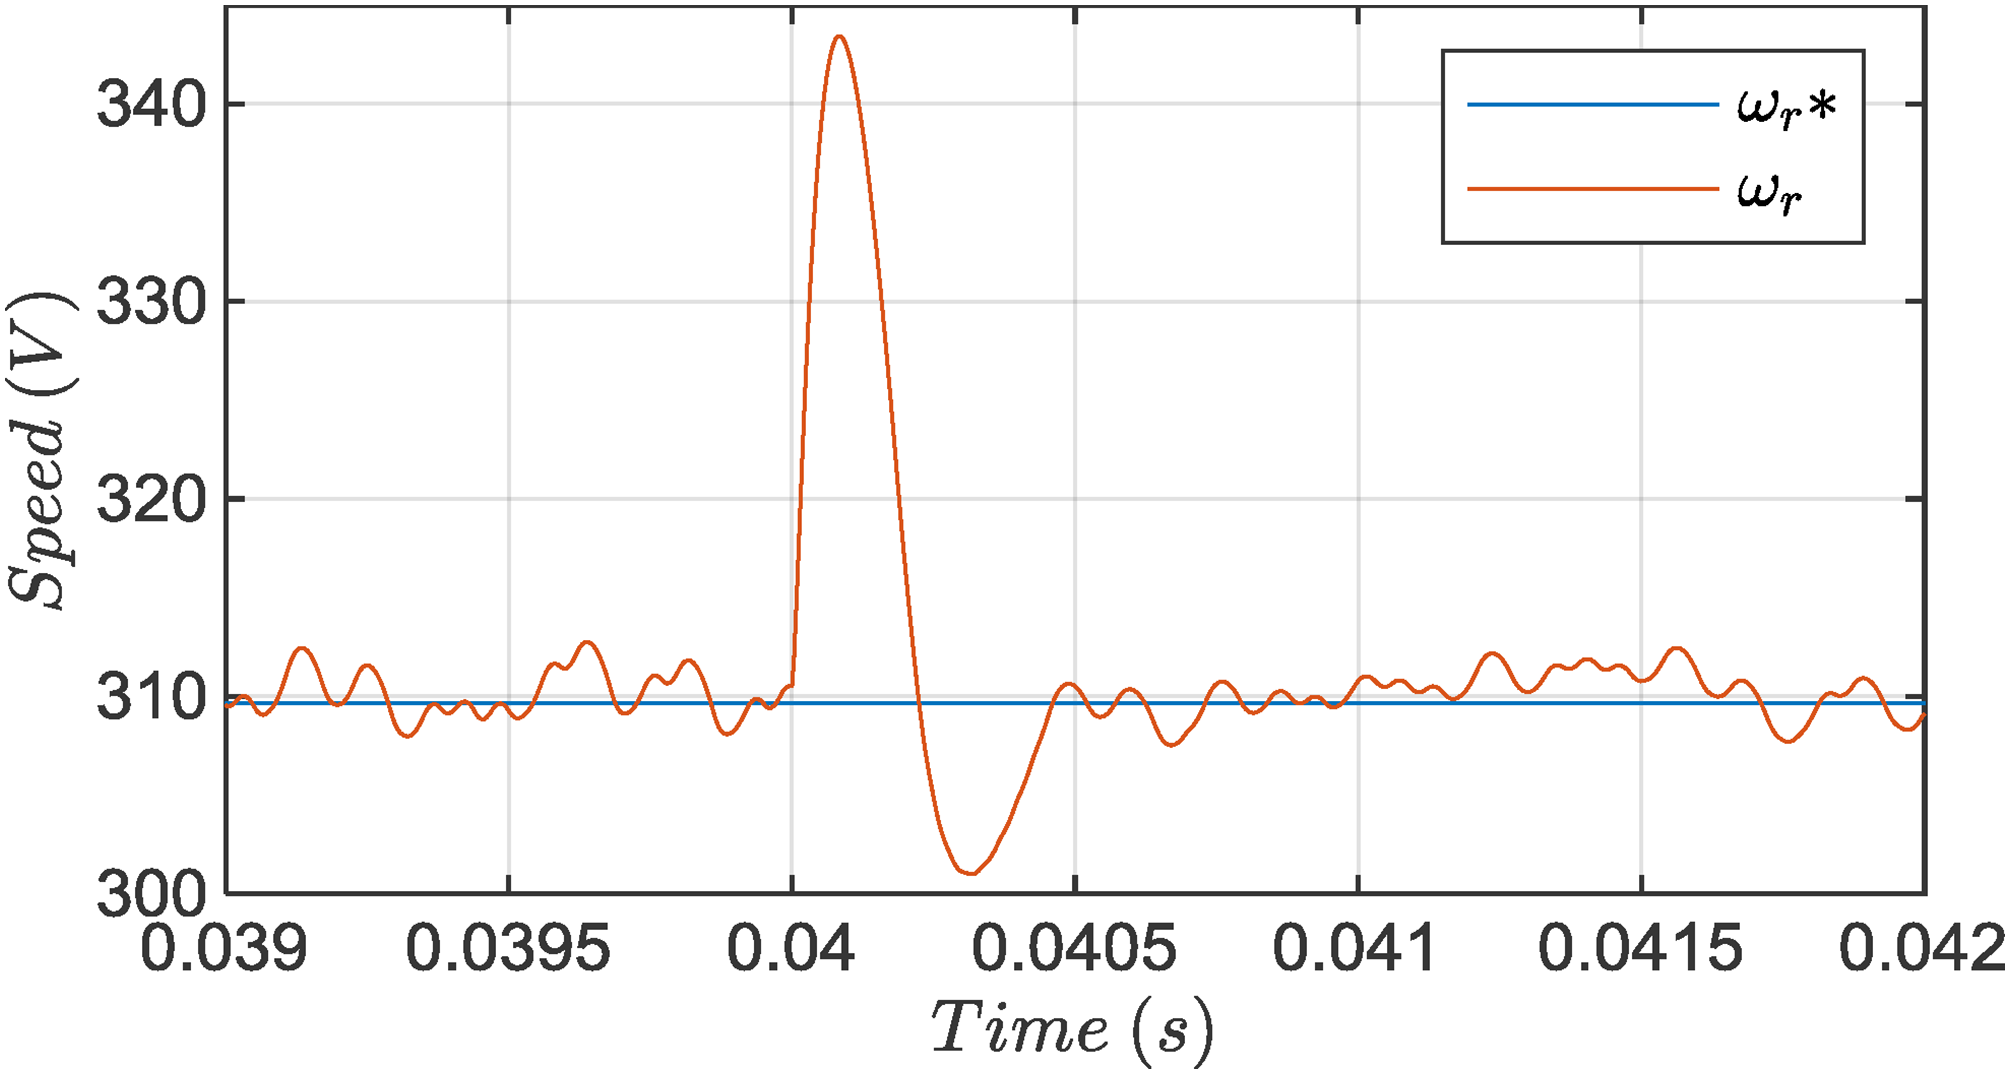
ASIG rotation speed.
The highest observed overshoot in speed is approximately 10%. While this overshoot is relatively moderate, it is still within an acceptable range for speed control applications, suggesting that the system responds quickly and effectively to transient disturbances.
Figure 23 illustrates the stator current in the natural frame, showing the system's response to the fault. The transient response exhibits a short setting time, indicating that the current control loop stabilizes quickly. Additionally, the maximum overshoot is negligible, demonstrating that the current control is precise and maintains stability with minimal deviations. This performance is considered suitable for maintaining effective current regulation in the system.
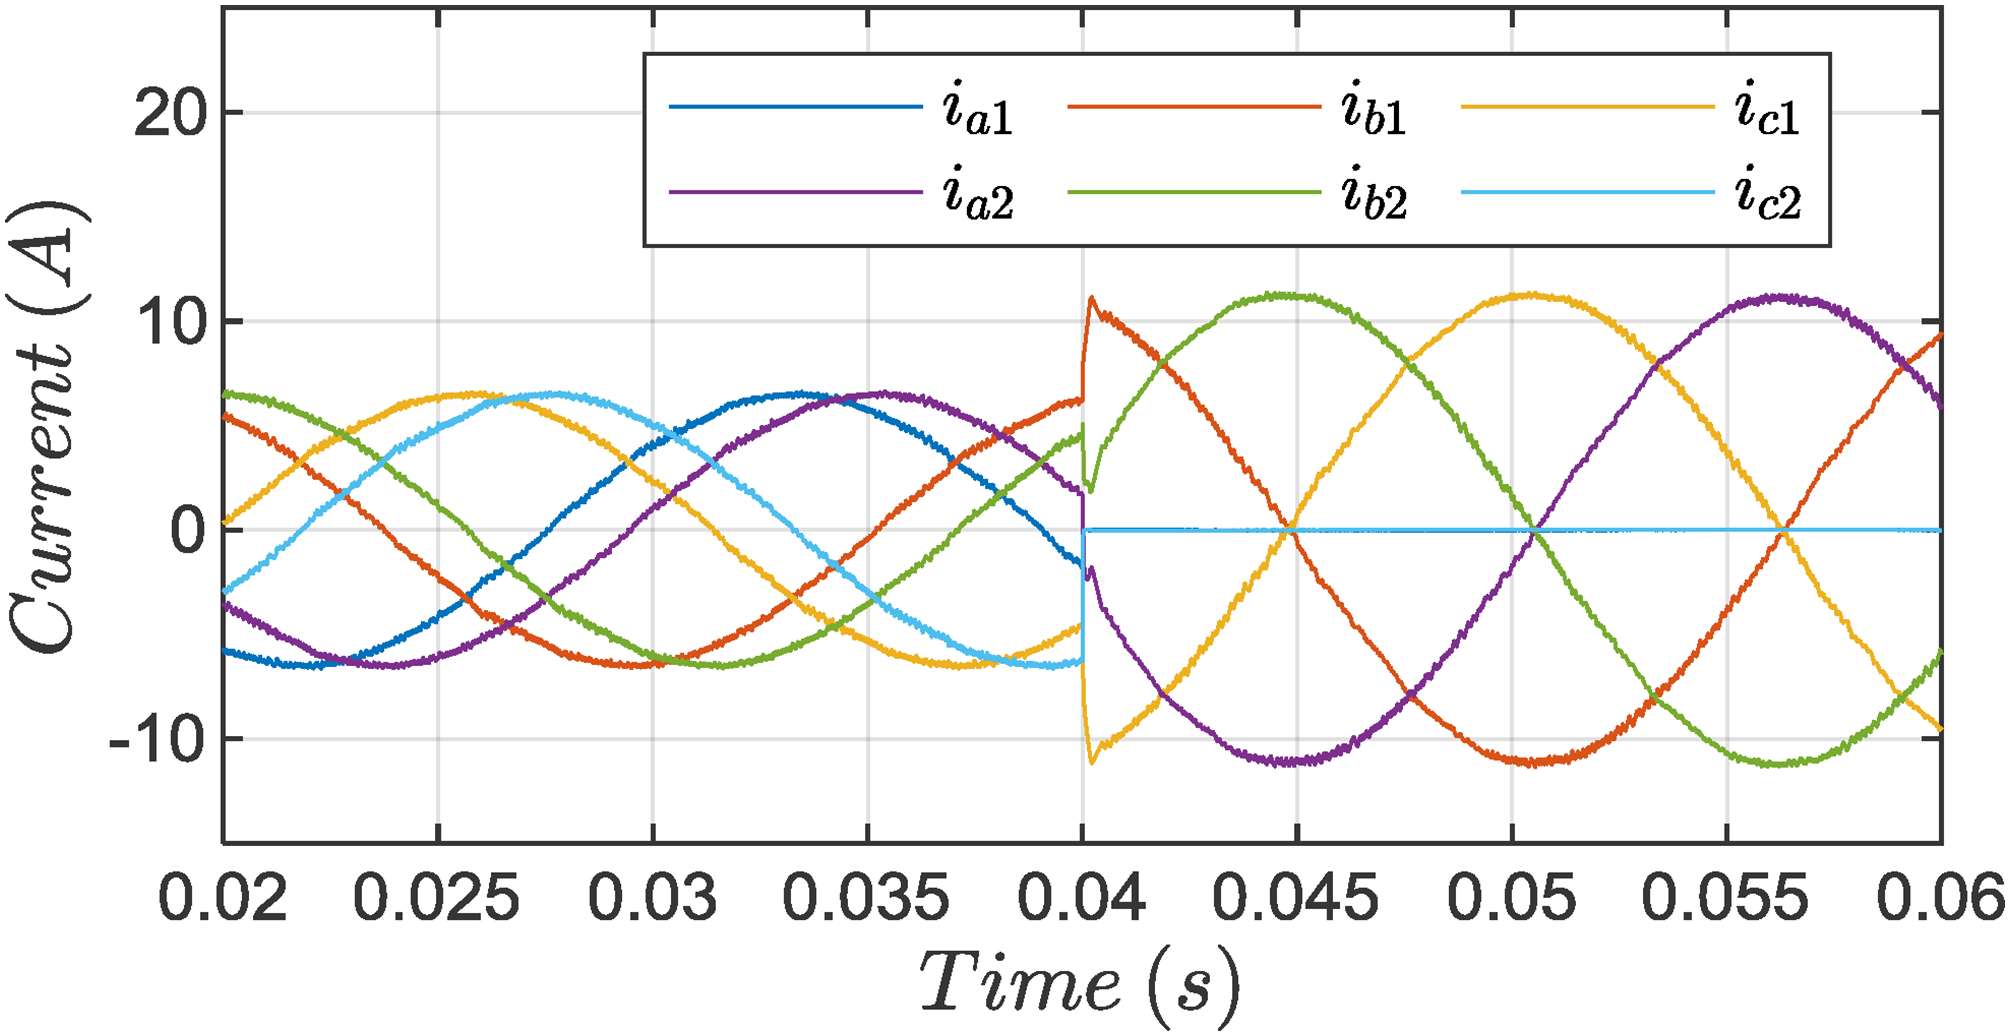
ASIG stator currents.
Figure 24 depicts the rotor flux of the ASIG. The control system demonstrates a swift response to the open-phase fault, with the rotor flux quickly adapting to the disturbance. However, the steady-state error in rotor flux rises to 2.5% after the initial disturbance. Despite this increase, the steady-state error remains relatively small, indicating that the control strategy effectively manages the rotor flux with only minor deviations in the steady state. This level of accuracy is generally deemed acceptable for most applications.
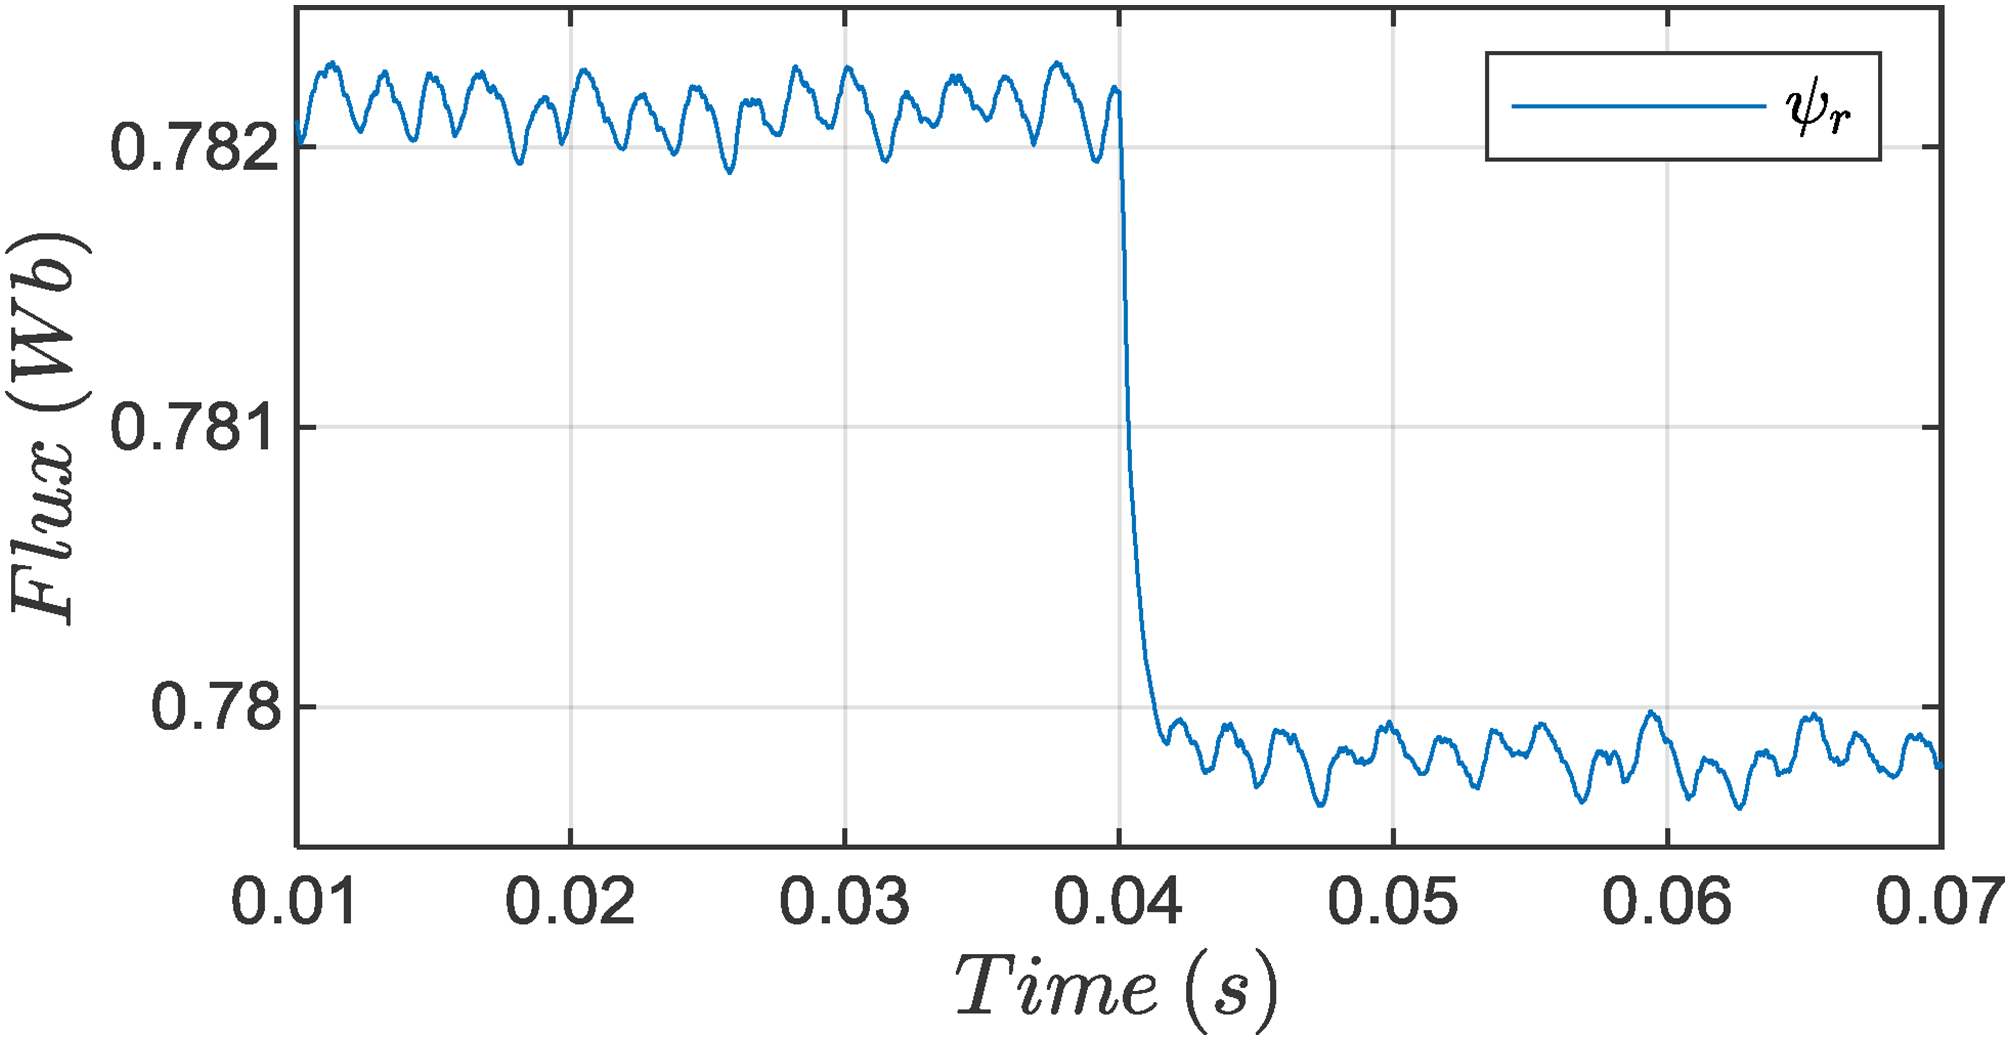
Rotor flux.
Figure 25 shows the behavior of the DC link voltage during the transient period. The DC voltage loop control successfully recovers to a steady state within 0.002 s. During this recovery period, there is a maximum undershoot of 0.083%, which is quite minor. The steady-state error for the DC link voltage rises to 0.017%, reflecting a small but measurable deviation from the desired voltage. Overall, these transient characteristics indicate that the DC voltage control loop performs adequately, maintaining stable operation with minimal fluctuations.
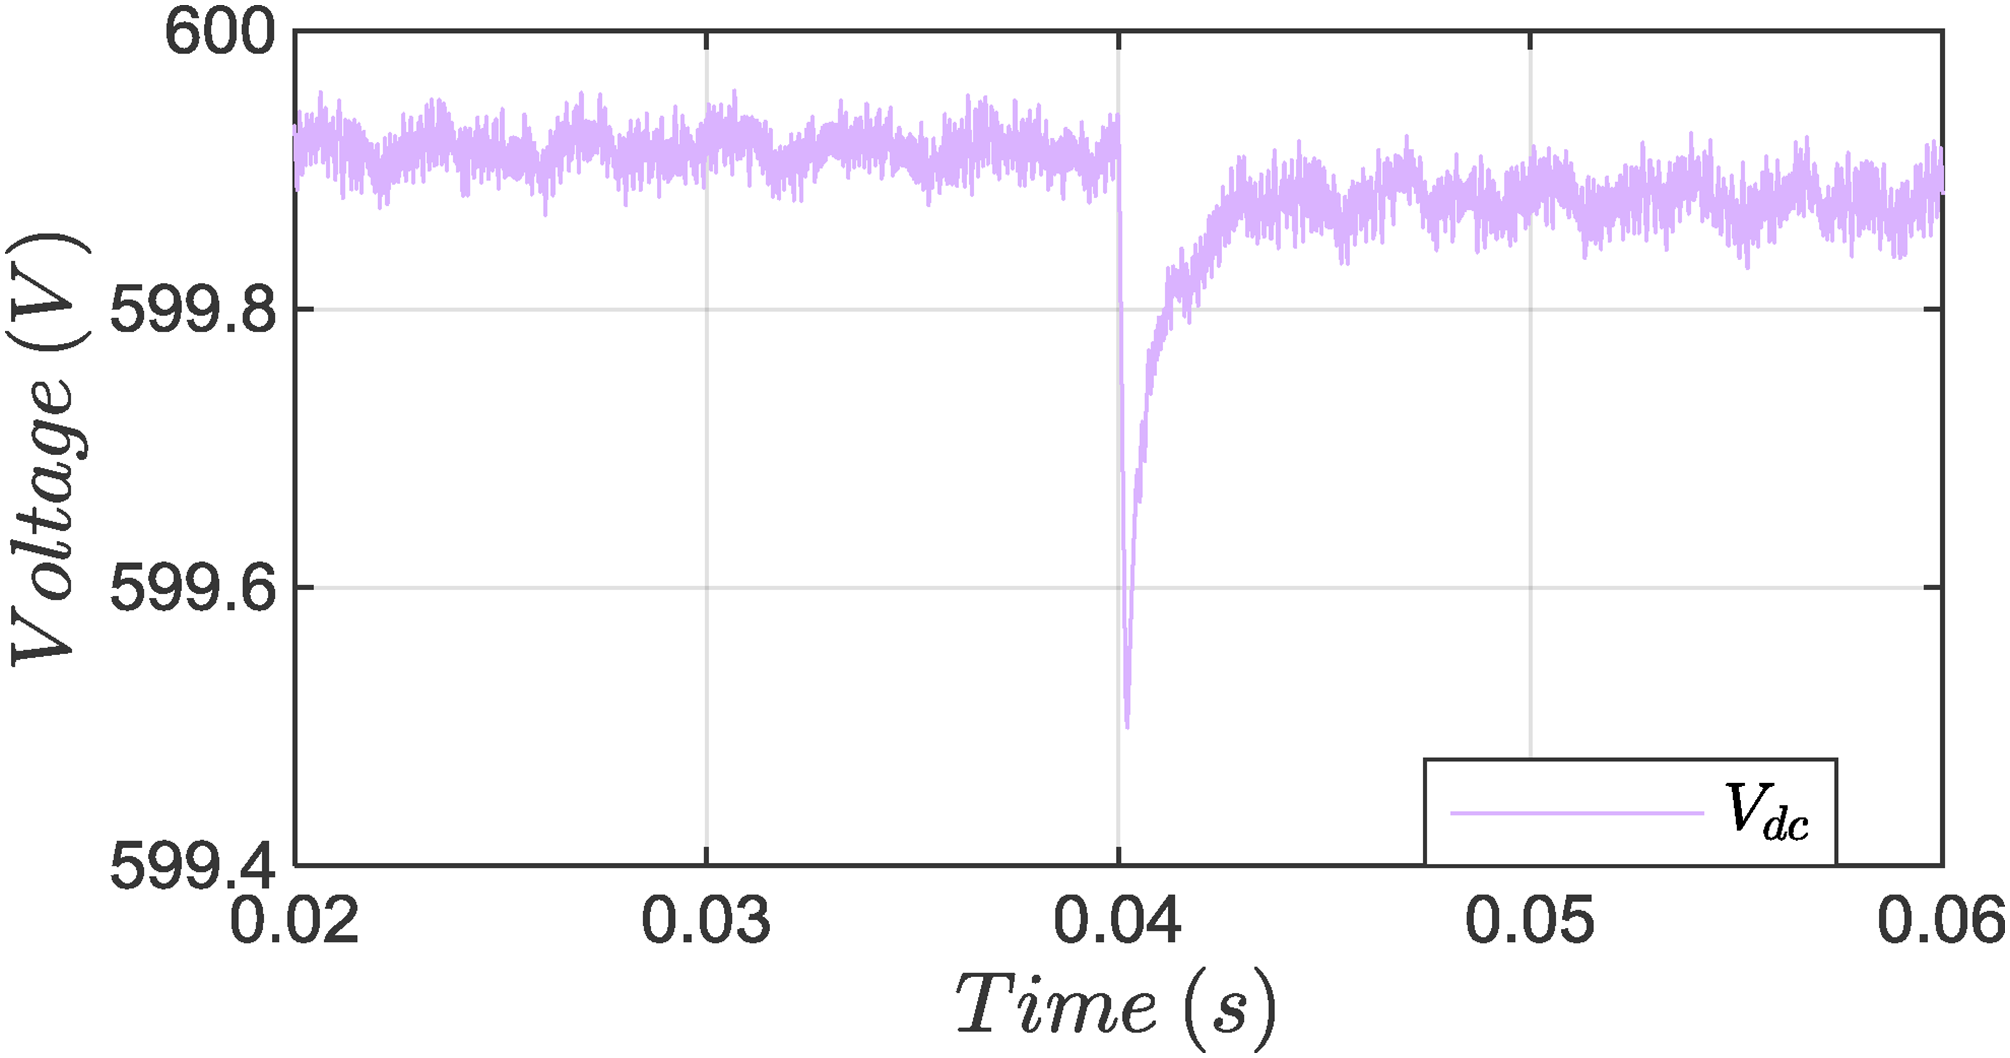
Dc link voltage.
Figure 26 represents the abc currents injected into the grid. The setting time of these currents is 0.002 s, with an undershoot of 55%. This response is sufficiently quick for this system. The quick response time of 0.002 s is a positive attribute, indicating that the system can quickly adjust the currents injected into the grid following a disturbance.
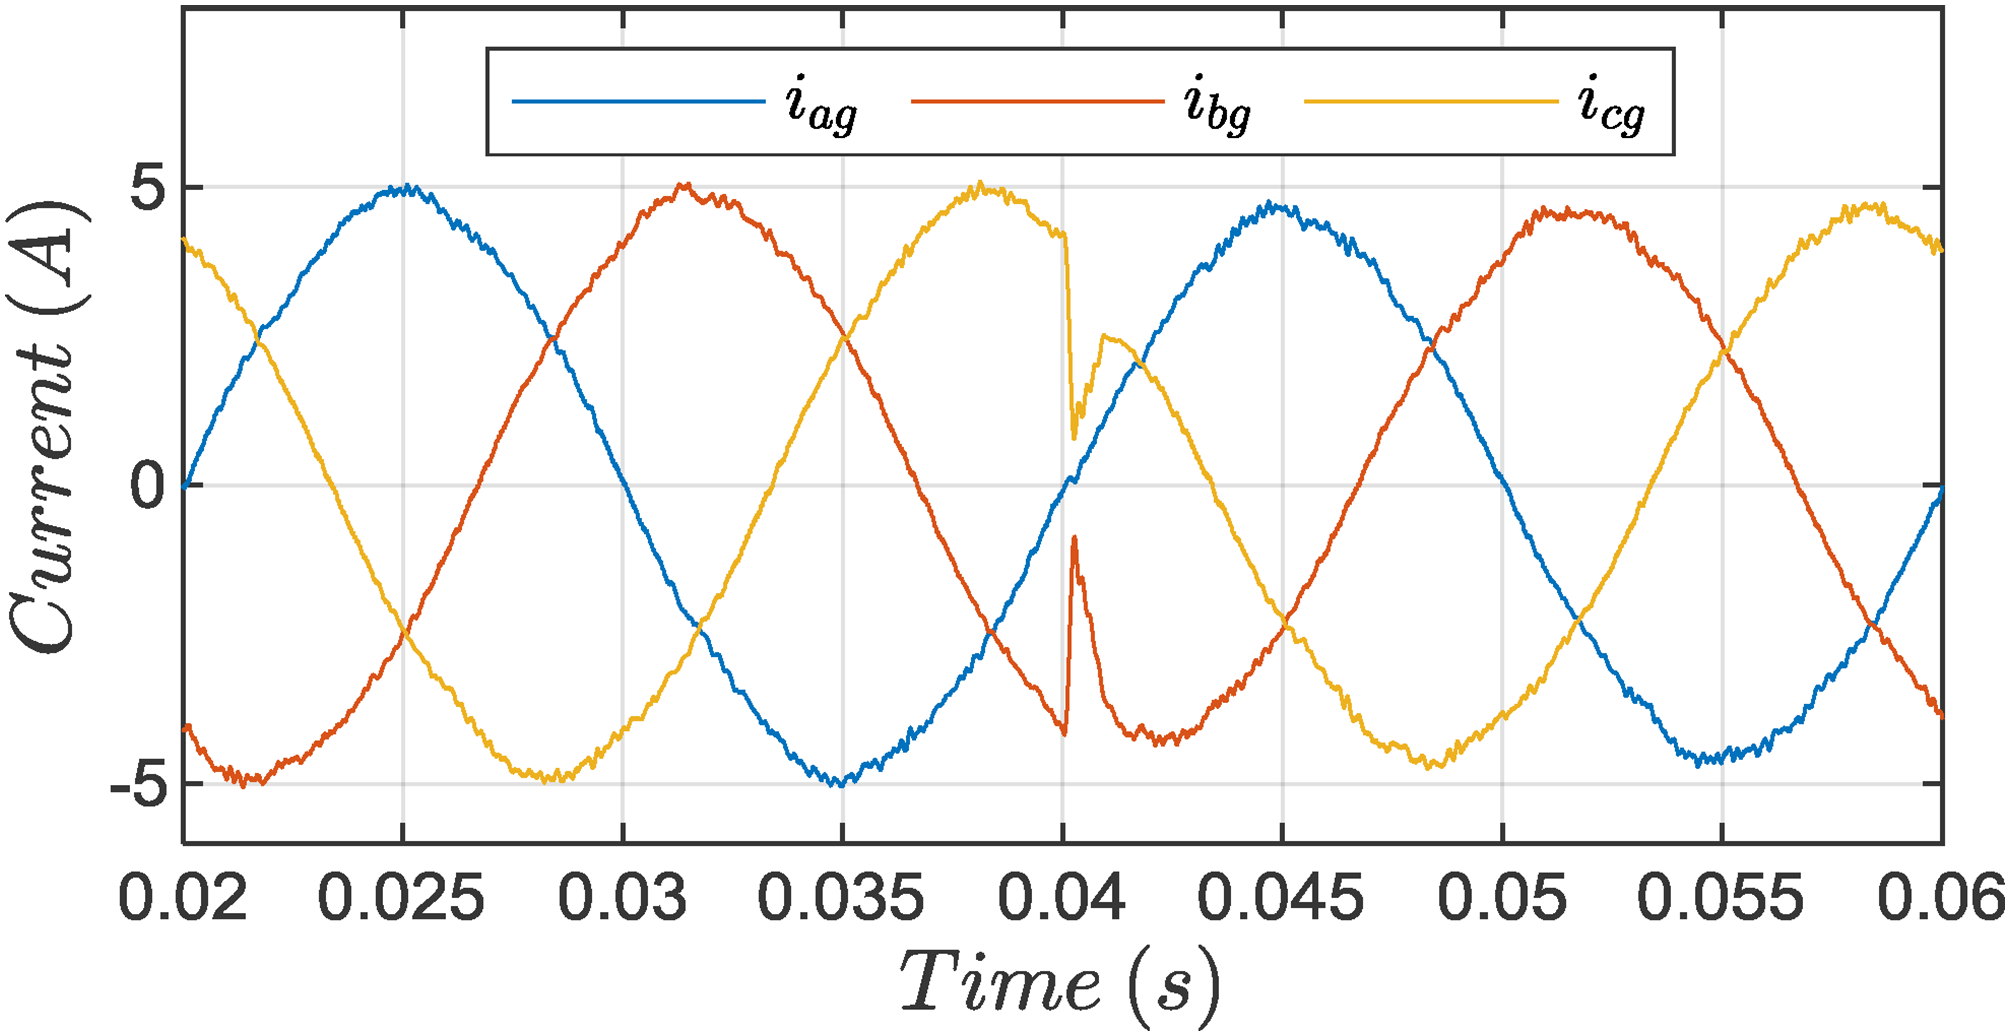
Currents injected into the grid.
Variable speed test
This part is dedicated to the performance evaluation of the proposed OPFT-SVM-PPC under post-fault conditions, specifically for a variable wind profile as depicted in Figure 27. To mitigate the adverse effects of increased current, we have implemented a current limitation strategy. This involves capping the maximum power output of the turbine to 2/3 of its nominal value. By limiting the power, we effectively control the current drawn by the machine, ensuring it remains within safe operational limits and minimizing potential damage to the windings.
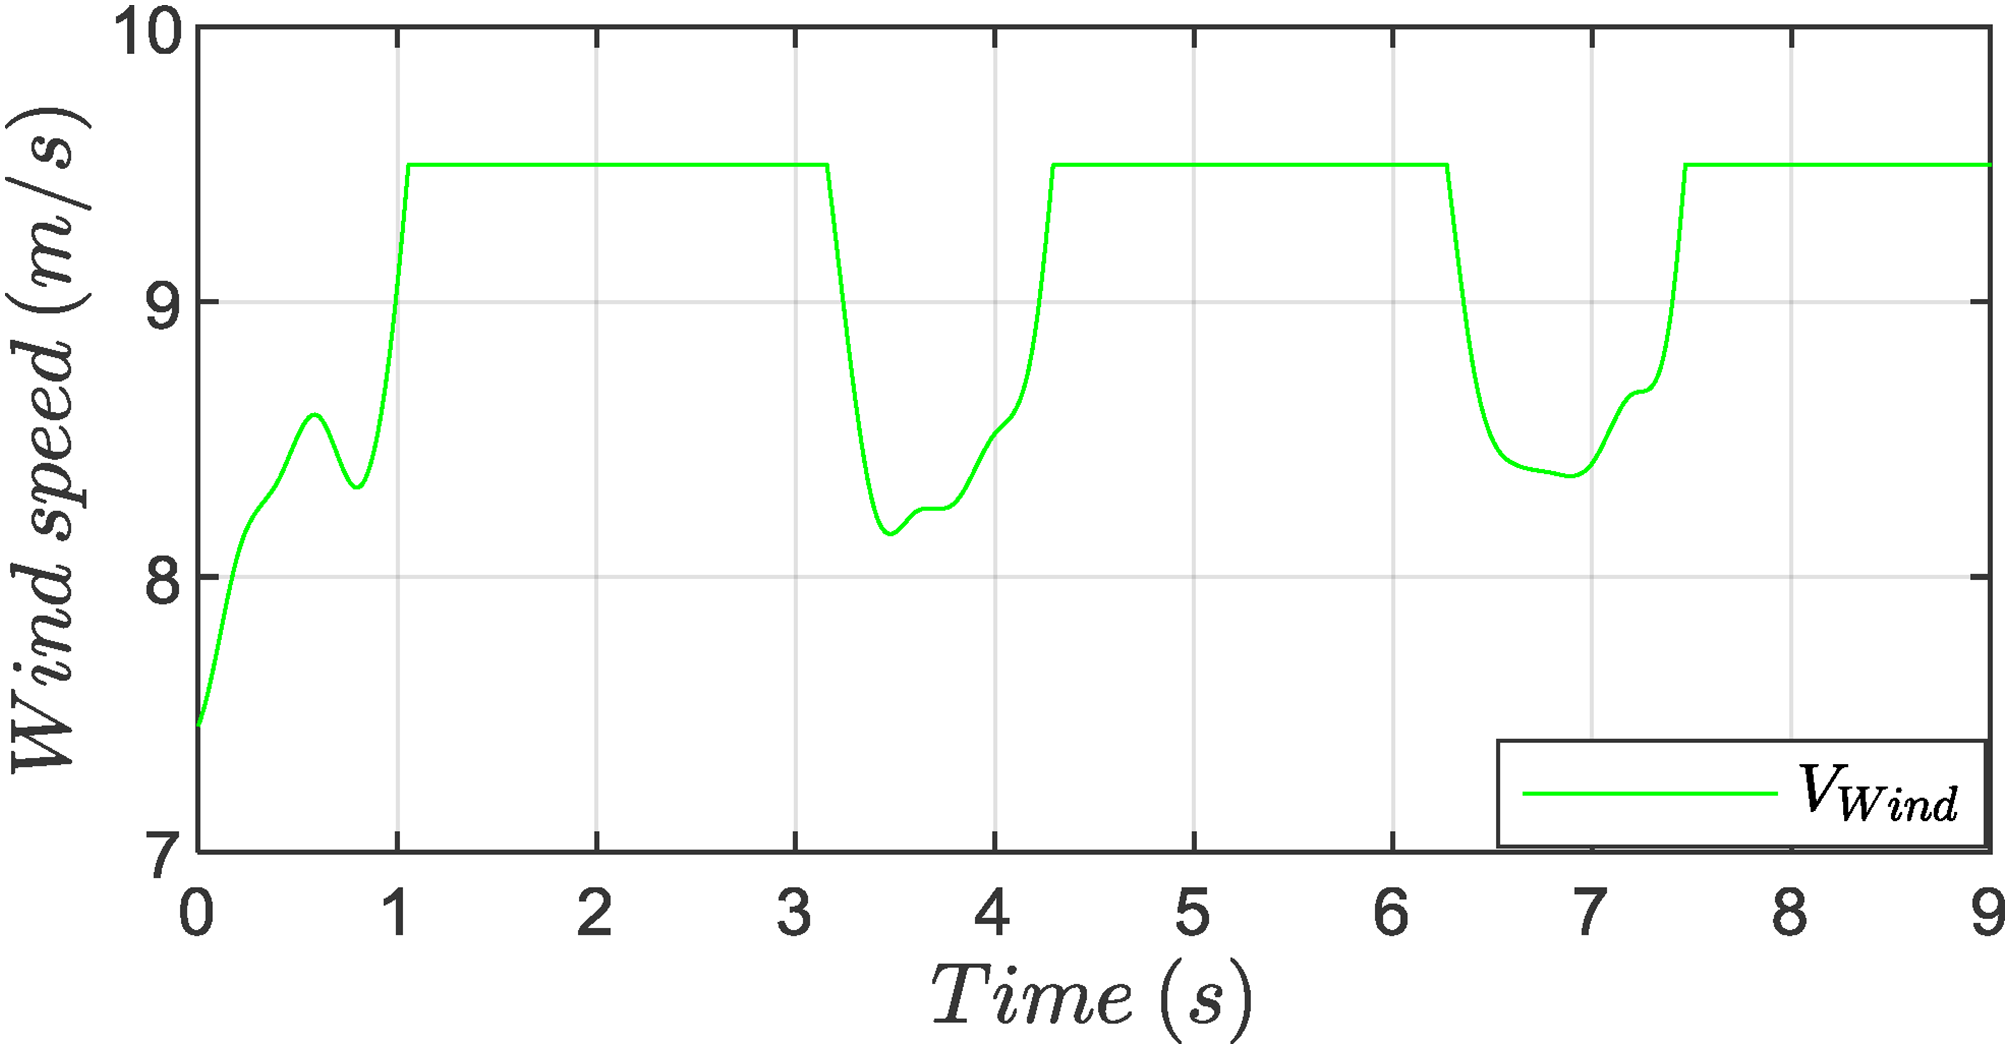
Wind speed profile.
The results are showcased in the following figures.
Figure 28 illustrates the rotation speed of the machine after experiencing an open-phase fault. It can be observed that despite the open phase fault and the varying wind speeds, the generator speed remains well-regulated and the mechanical speed is limited to 328/2 (rad/s), indicating that the control system effectively manages the machine's speed within desired limits, and ensuring stable operation even during fluctuations.
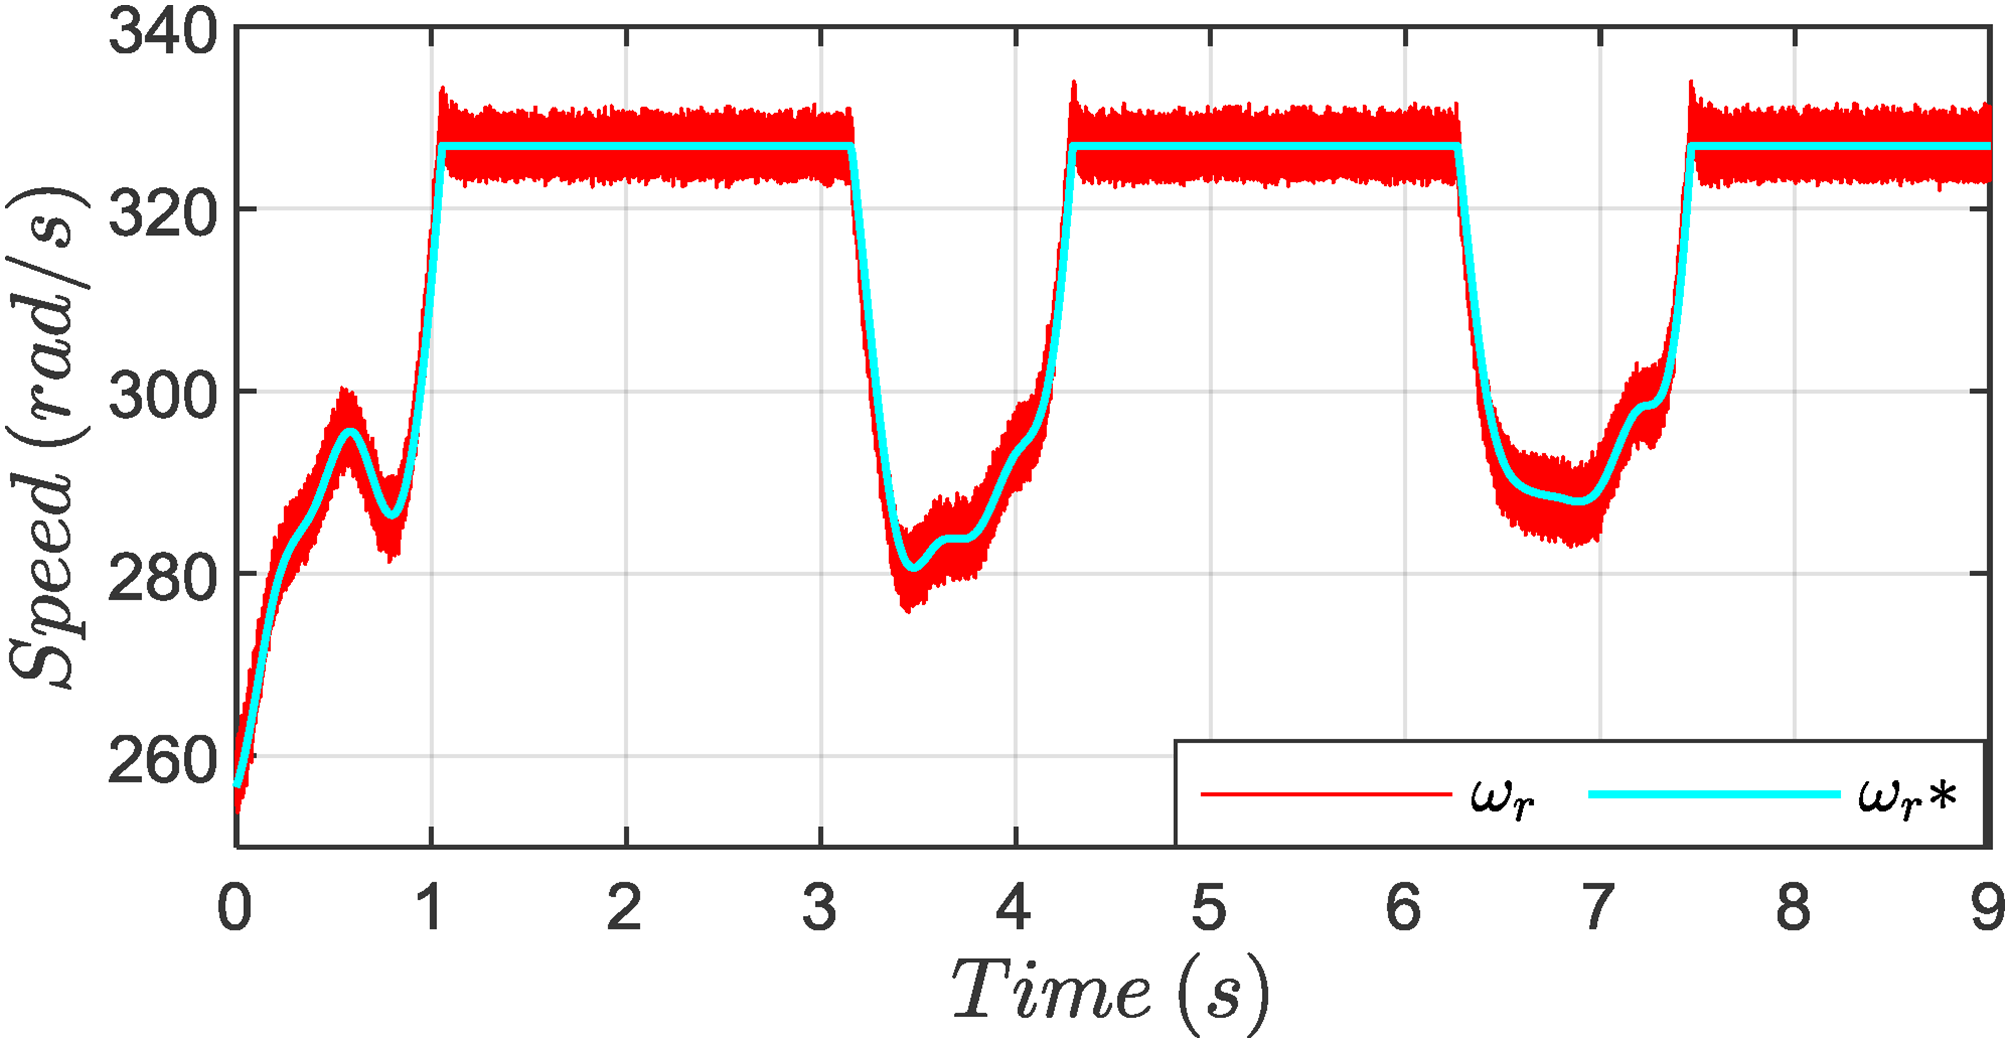
ASIG rotor speed.
Figures 29 and 30 show the stator currents, rotor currents, and the
Sator currents.
Figures 31 and 32 illustrate the electromagnetic torque and rotor flux, respectively. Both quantities are well-regulated during variable speed operation, and their behavior closely resembles that of the healthy condition. The maximum torque is set at 24 (N.m), which is equivalent to 2/3 of the nominal value in the normal condition. This reduction in torque is expected given the system's constraints and fault conditions but is still adequate for maintaining operational efficiency.
Electromagnetic torque.
Rotor flux.
On the other hand, the flux remains well-oriented on the d axis and follows the reference delivered by the same defluxing block as in the normal condition. This alignment is achieved without the need for flux position estimation as in the Field Oriented Control FOC.
Figure 33 displays the control of the DC link voltage, which is maintained at 600 V, with a maximum drop of only 0.05%, indicating excellent control performance and stability. This minimal drop signifies that the DC link voltage regulation is effective, contributing to overall system reliability. Moving on to Figure 34, we observe the active; reactive power supplied to the grid. The maximum active power transmitted is 2.5 kW, while ensuring that no exchange of reactive power. This outcome is advantageous, as it indicates efficient power transmission with no unnecessary reactive power, which can improve the overall stability and efficiency of the grid.
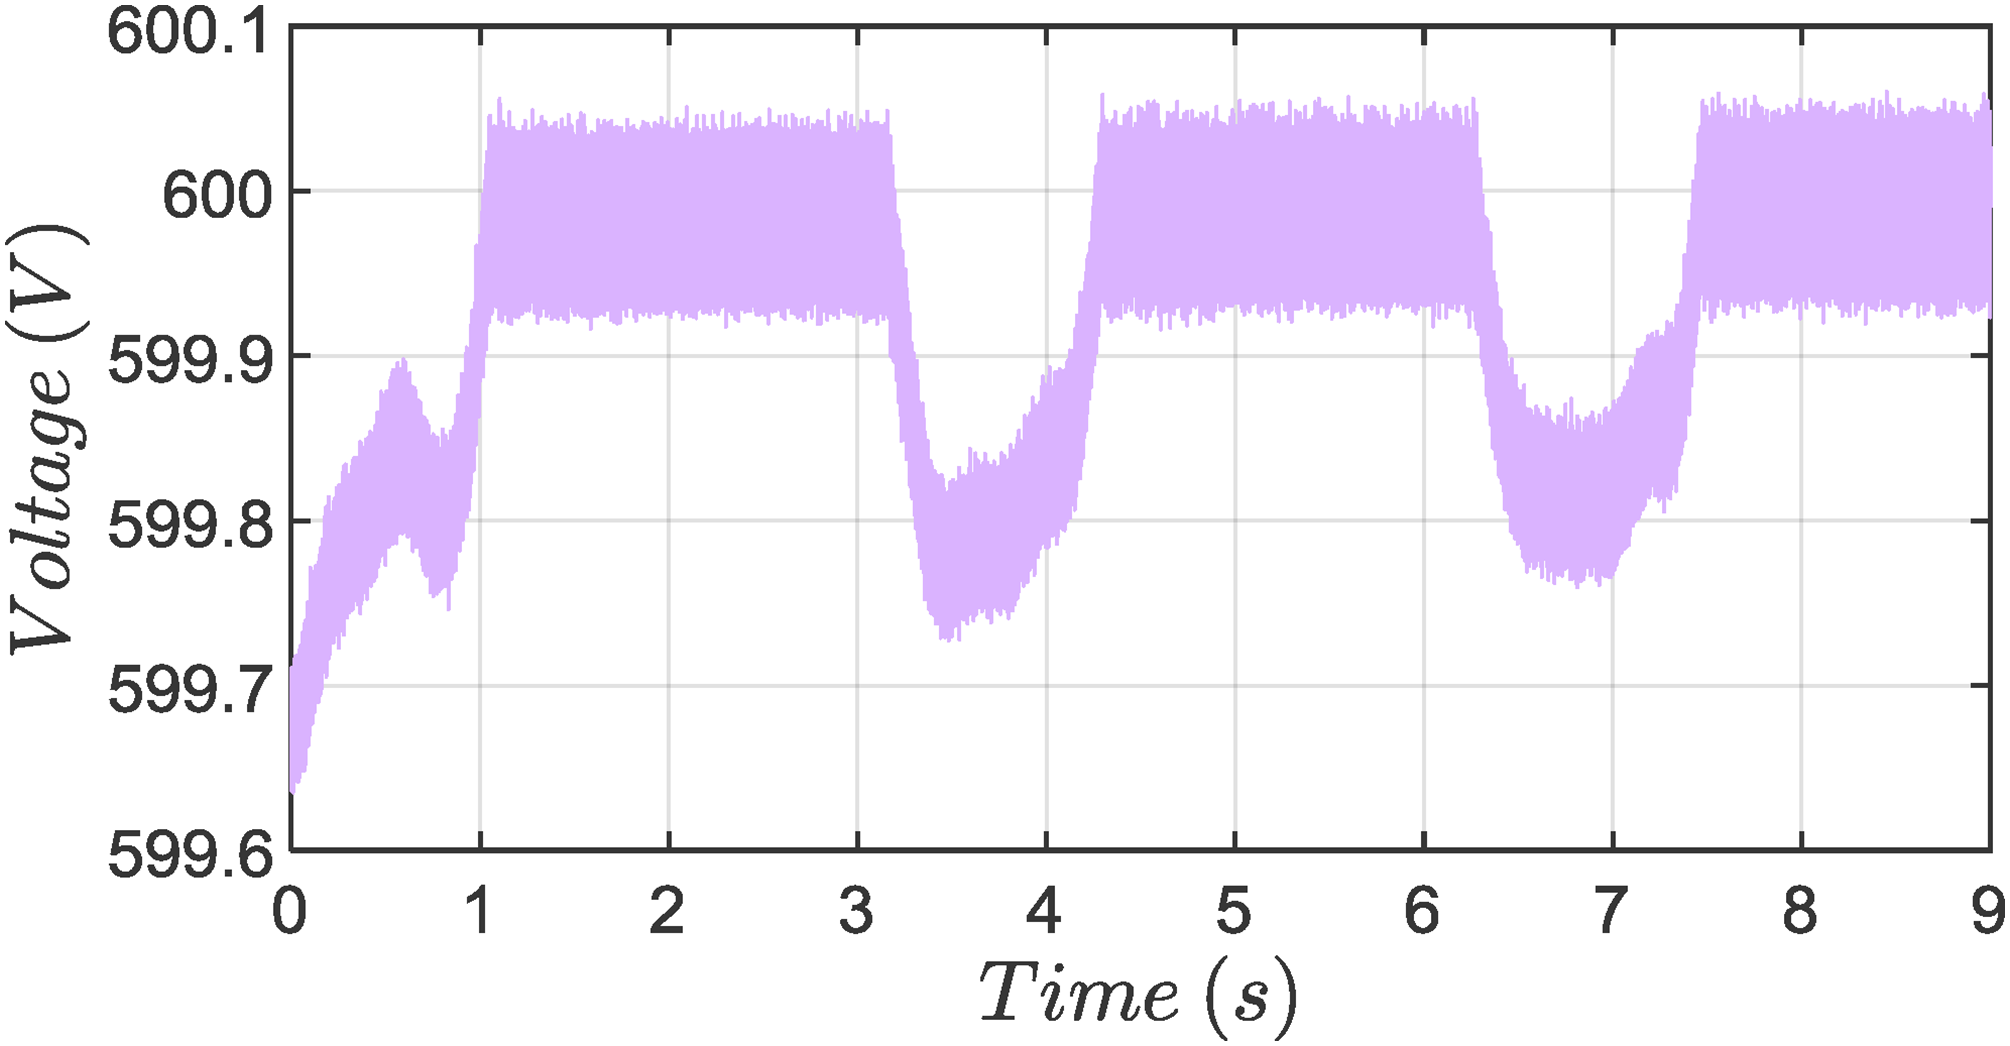
Dc link voltage.
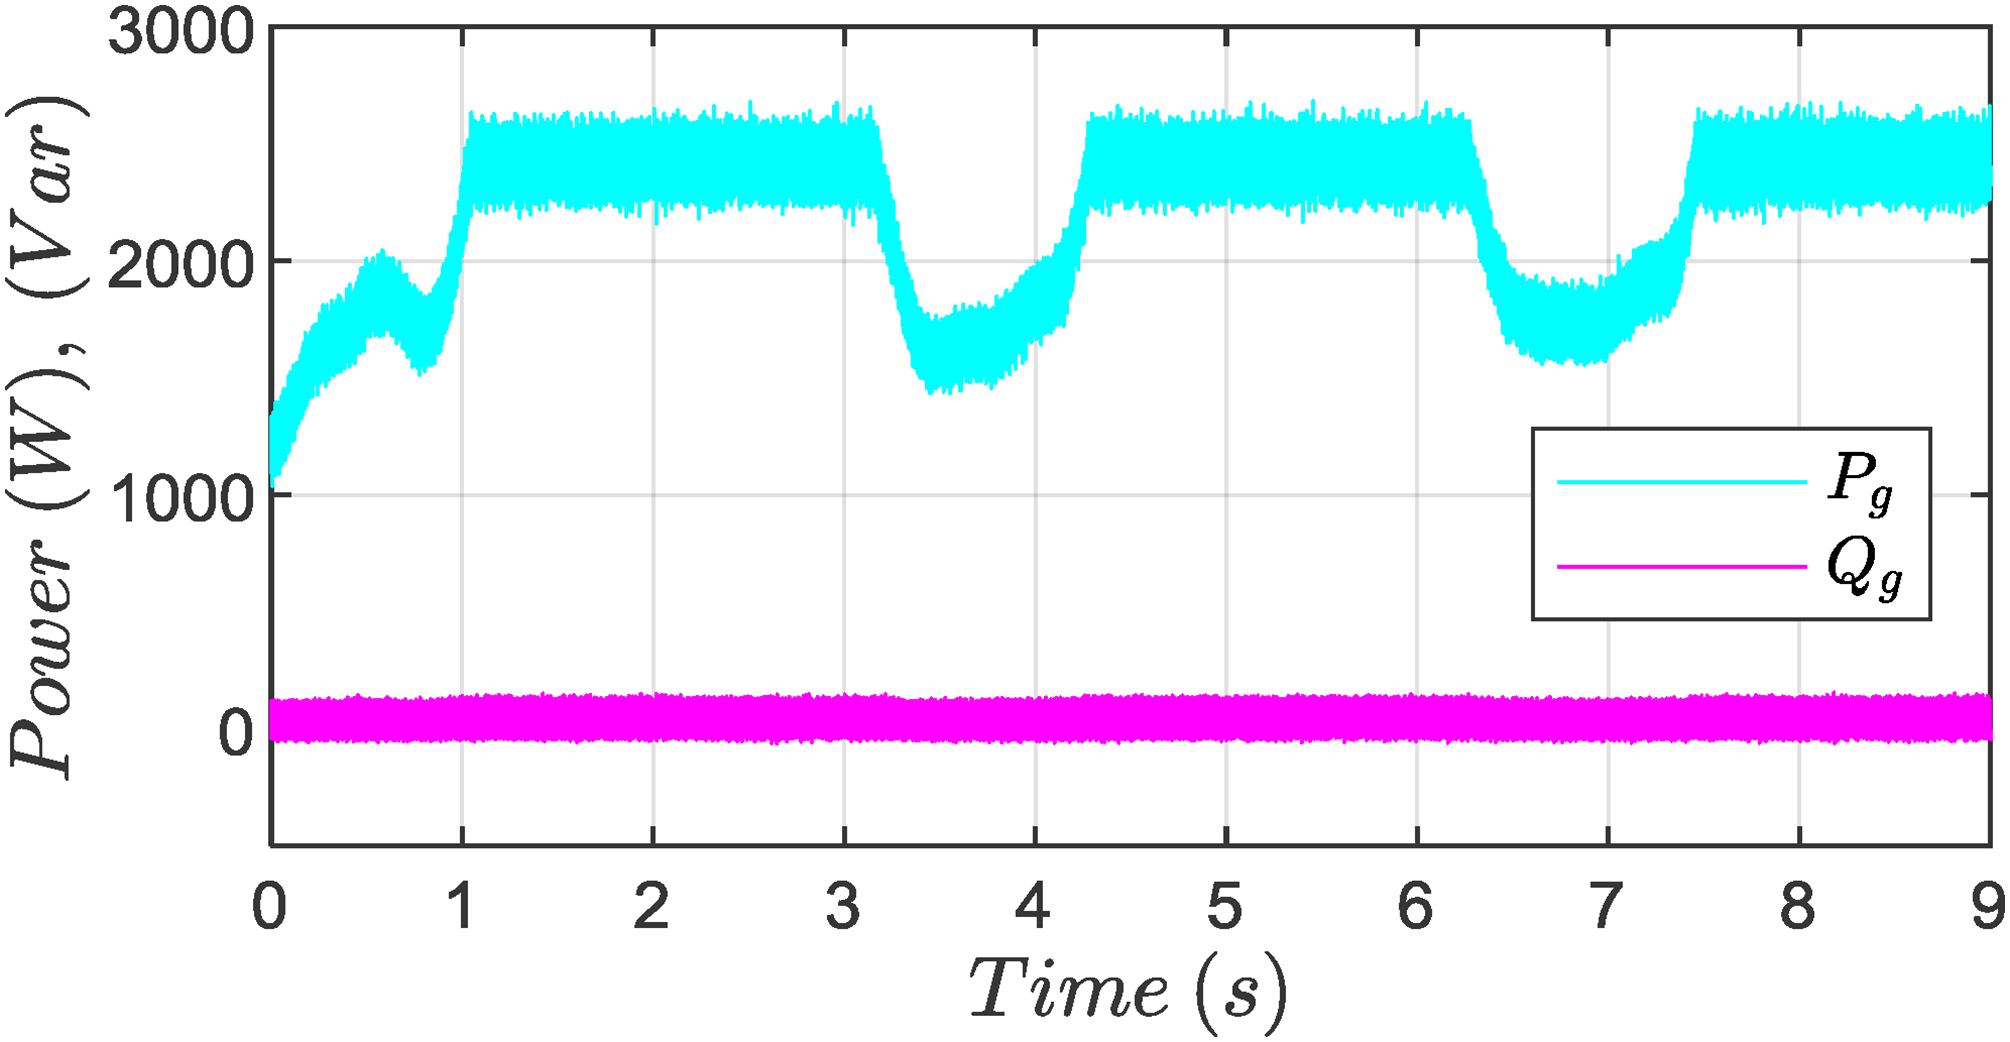
Active; reactive power supplied to the grid.
Figure 35 showcases the grid voltage and current. Thanks to the control and the implementation of an LCL filter, a high-quality signal is achieved, characterized by a 2.71% harmonic distortion rate in the grid current, which is relatively low, reflecting good power quality. The voltage is consistently maintained at 230 V, and the current and voltage signals have no phase shift. This result underscores the effectiveness of the control system with high-quality energy delivery to the grid.
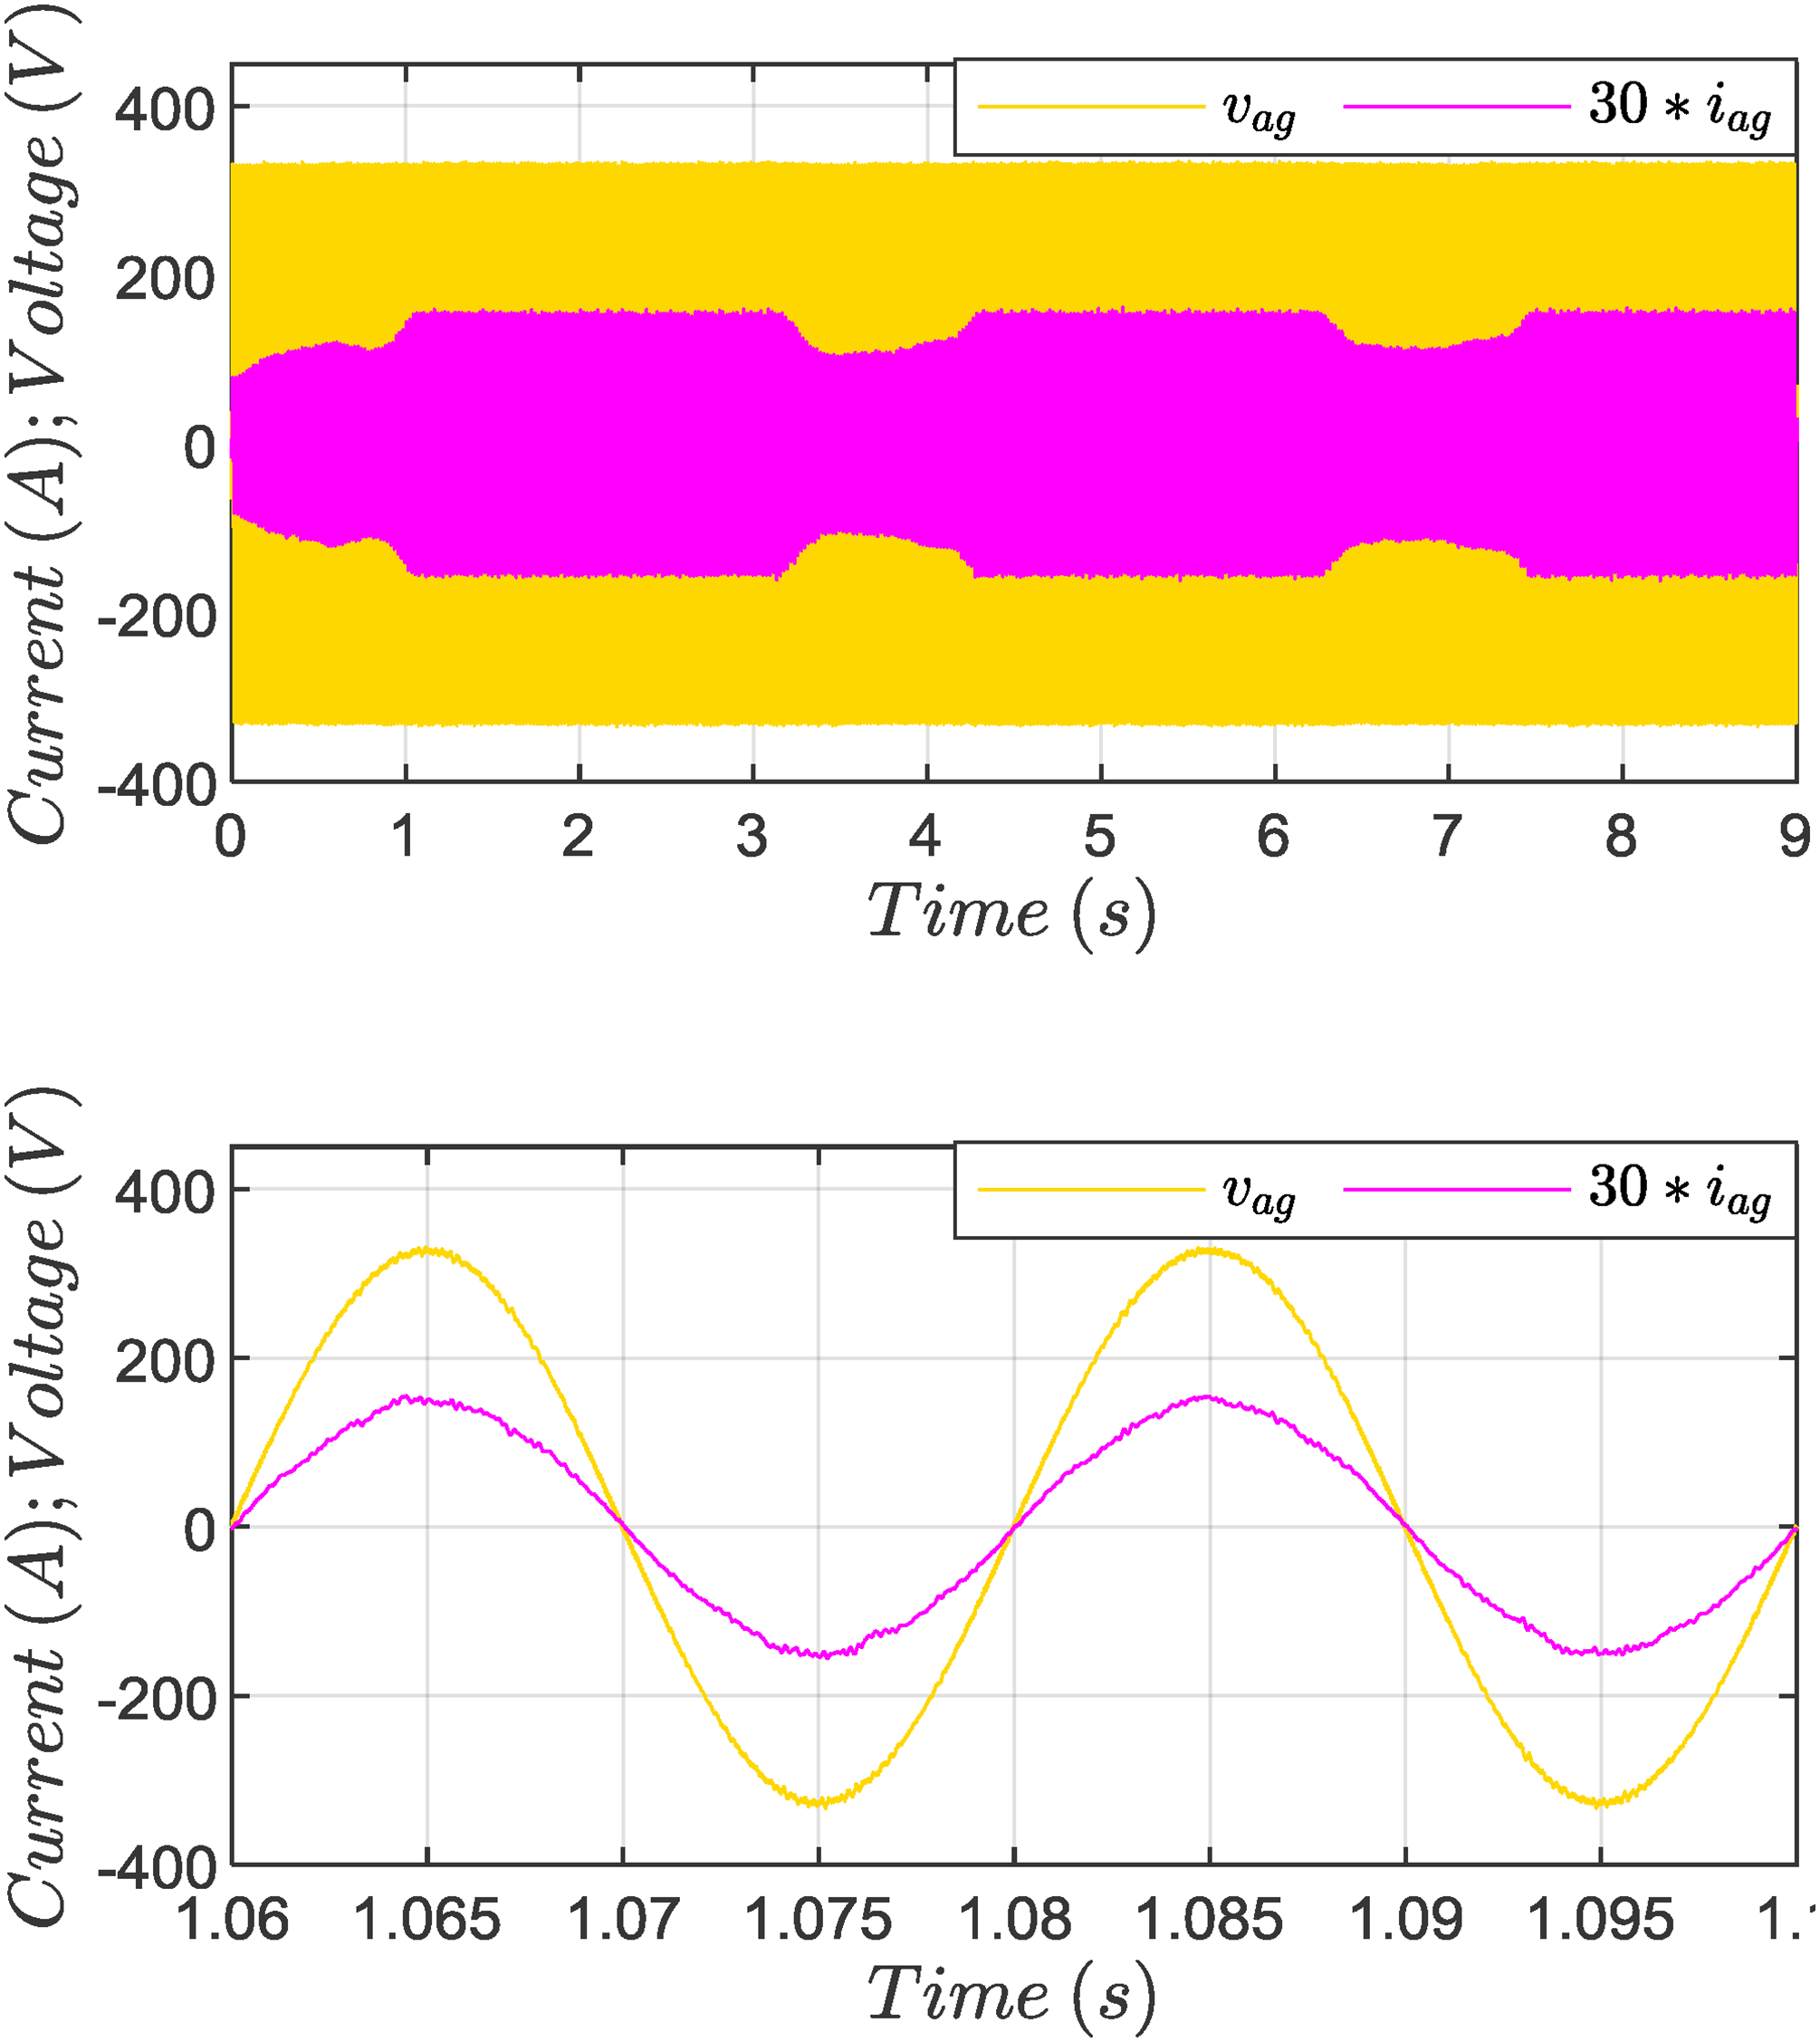
Voltage; current of the grid.
Conclusion
This research article offers an integrated approach to addressing open-phase fault tolerance control in wind power systems employing a six-phase induction generator, namely open-phase fault-tolerant support vector machine predictive power control, for ASIG-WECS. The objective was to achieve high reliability and excellent power quality injected into the grid under fault conditions for critical applications. The proposed control system employed FS-PPC and involved three main steps: fault detection based on current harmonic analysis; open-phase localization using SVM with hyperparameter BO; Finally, subsequent restoration of system stability is achieved by opening the phase that forms 90 degrees with the faulty phase. Importantly, this approach did not require reconfiguration of the control algorithm while preserving the system's effective performance. These results demonstrated the success of the OPFT-SVM-PPC strategy in maintaining control over the ASIG-WECS. The success of the proposed control is reposed on the construction of a classifier which determines at the same time if the fault is an open phase or not, and the localization of the faulty phase. For this, a comparison between some of the best machine learning algorithms is performed to discover the best algorithm suitable for this application. The result shows the superiority of the SVM over other MLs with an accuracy of 96.3%. Moreover, to extract the maximum properties from SVM, the hyperparameters are determined using the Bayesian optimization algorithm. Even in the presence of open-phase faults, the suggested control approach continues to provide 2/3 of the nominal power of the machine with high quality for the grid, with a THD of 2.71%.
The analysis of the obtained results and comparison with relevant works published recently validated the effectiveness of the proposed control strategy and highlighted its advantages over existing approaches. Our study is currently limited to open-phase fault tolerance. While it provides a solid foundation, it does not account for the effects of other fault types on system performance. To enhance the robustness and applicability of our control method, future research will aim to generalize the approach to accommodate a broader range of fault conditions. Specifically, we plan to extend the control strategy to address other types of faults, such as short circuits, phase-to-phase faults, and other anomalies that could impact system performance. On the other hand, the simulations were conducted under idealized conditions, which may not fully capture real-world complexities and variations. Experimental validation will be essential to confirm the effectiveness of the proposed control method in practical scenarios. By conducting these experimental validations, we aim to address the limitations of the simulation-based approach and enhance the reliability and applicability of the control strategy for practical deployment. Additionally, we will address key real-world constraints, particularly those related to SVM fault classification, data collection and preprocessing, and real-time implementation, which present significant challenges.
Footnotes
Author contribution
All authors contributed equally to this work.
Declaration of conflicting interests
The authors declared no potential conflicts of interest with respect to the research, authorship, and/or publication of this article.
Funding
The authors received no financial support for the research, authorship, and/or publication of this article.